the Creative Commons Attribution 4.0 License.
the Creative Commons Attribution 4.0 License.
 | 01 Mar 2023
The effects of Hurricane Harvey on Texas coastal-zone chemistry
Steven F. DiMarco
Anthony H. Knap
Antonietta Quigg
Nan D. Walker
Hurricane Harvey deposited over 90×109 m3 of rainwater over central Texas, USA, during late August/early September 2017. During four cruises (June, August, September and November 2017) we observed changes in hydrography and nutrient and oxygen concentrations in Texas coastal waters. Despite intense terrestrial runoff, nutrient supply to the coastal ocean was transient, with little phytoplankton growth observed and no hypoxia. Observations suggest this was probably related to the retention of nutrients in the coastal bays and rapid uptake by phytoplankton of nutrients washed out of the bays, as well as dilution by the sheer volume of rainwater and the lack of significant carbon reserves in the sediments, despite the imposition of a strong pycnocline. By the November cruise conditions had apparently returned to normal, and no long-term effects were observed.
- Article
(12378 KB) - Full-text XML
-
Supplement
(952 KB) - BibTeX
- EndNote


The Gulf of Mexico is renowned for its hurricanes and tropical storms, and 2017 was a very active year in the Atlantic, with 10 hurricanes and 8 tropical cyclones and depressions. Hurricane Harvey developed in the Bay of Campeche, in the extreme southwest of the Gulf of Mexico, on 23 August 2017, intensifying rapidly on 24 August over water with sea surface temperature (SST)>30 ∘C and an upper-ocean heat content anomaly (measured by three ARGOS floats) that extended to ∼45 m water depth (Trenberth et al., 2018). Harvey crossed the edge of the Texas shelf in the northwestern Gulf at 18:00 US Central Time having intensified to category 3 and reached category 4 strength by midnight of 25 August with sustained wind speeds of 60 m s−1 (115 kt) and a minimum central pressure of 937 mbar (Blake and Zelinsky, 2018). Rapid intensification of tropical cyclones over the shallow waters of the southern Texas shelf has been reported previously and is believed to be related to periods when warm water occupies the whole water column. This prevents mixing of colder bottom water that can reduce the energy flux feeding the hurricane (Potter et al., 2019). The storm came ashore near Corpus Christi, TX, on 26 August and stalled over the TX coast, moving slowly to the northeast until 31 August, after which it moved inland and dissipated over Kentucky (Fig. 1).

Figure 1Track of Hurricane Harvey and associated rainfall (in inches) over the southern United States, 24 August–4 September 2017 (from Blake and Zelinsky, 2018, with permission from the NOAA). The numbers 1, 2 and 3 denote the positions of Galveston Bay, Matagorda Bay and Lake Sabine respectively. The Mississippi Delta (in Louisiana) is shown as 4. The Nederland 1.5 SW rain gauge, which recorded the highest rainfall, is at 29.95∘ N, 94.01∘ W.
Harvey brought a storm surge of up to 3 m and widespread torrential rain to the Texas coast, with the heaviest rainfall, over 1500 mm (60 in), measured at Nederland and Groves, near Houston (Blake and Zelinsky, 2018). Heavy rain (<500 mm) also affected Louisiana (Fig. 1). This unprecedented rainfall, the highest ever recorded in the US for a tropical cyclone, resulted in widespread flooding in Texas and Louisiana (Emanuel, 2017; Balaguru et al., 2018). It is estimated that the total volume of rainfall over Texas and Louisiana during Harvey's passage was between 92.7×10⁹ m3 (Fritz and Samenow, 2017) and 133×109 m3 (Steven F. DiMarco, unpublished data), and over 200 mm of rain was recorded as far inland as Tennessee and Kentucky as the storm died down (Blake and Zelinsky, 2018; Fig. 1 herein). In addition to the rain that fell on land, Steven F. DiMarco (unpublished data) has estimated that about another 44×109 m3 fell over the ocean.
Galveston Bay collects the runoff from the Houston metropolitan region. Following the storm, the bay became a freshwater lake (Du et al., 2019; Steichen et al., 2020; Thyng et al., 2020) as it was flushed with about 3 to 5 times its volume of rainwater. US Geological Survey (USGS) data (downloaded from https://waterdata.usgs.gov, last access: 25 June 2020; all such records are collected in cubic feet per second (cfs) and have been converted to cubic meters per second) show very rapid increases in flow rates in Texas rivers and streams following the storm's landfall. For instance, flows in the Colorado and Brazos rivers south of Galveston Bay (USGS stations 08162000 and 08111500 respectively; Fig. S1a and b in the Supplement) increased from <2000 cfs (∼60 m3 s−1) during most of August to over 90 000 cfs (>2500 m3 s−1) by the beginning of September, while flow in the San Jacinto River (USGS station 08068090; Fig. S1c) and the Trinity River at Liberty (USGS station 08067000; Fig. S1d), which both flow into Galveston Bay, exceeded 100 000 cfs (3400 m3 s−1). The gauge at Liberty was unfortunately not operational immediately prior to 27 August or after 9 September, but during June flow rates were typically 10 000–14 000 cfs (∼300–420 m3 s−1). Such large changes in runoff are known to produce major changes in estuaries and coastal waters (e.g., Ahn et al., 2005; Paerl et al., 2001, 2006; Mallin and Corbett, 2006; De Carlo et al., 2007; Zhang et al., 2009; Du et al., 2019; Thyng et al., 2020). Liu et al. (2019) and Steichen et al. (2020) reported changes in the phytoplankton community within Galveston Bay as the salinity decreased and then increased again.
The massive runoff led to turbidity plumes visible well offshore (Fig. S2). D'Sa et al. (2018) monitored large increases in terrestrial carbon (25.22×10⁶ kg) and suspended sediments (314.7×10⁶ kg) entering Galveston Bay during the period 26 August–4 September. The plume off Galveston Bay on 31 August extended at least 55 km offshore (Du et al., 2019), and surface water with a salinity of 15 was measured on 1 September at the Texas Automated Buoy System (TABS) buoy F (28.84∘ N, 94.24∘ W; yellow diamond in Fig. S2), where it is typically 31–32 (data from https://tabs.gerg.tamu.edu, last access: 6 June 2018). Normal salinities did not return until 8 September. Similar sediment plumes at the mouths of the Brazos and Guadalupe estuaries can be seen in Fig. S2, and such plumes and lowered salinities have been reported from the Lavaca–Colorado and Nueces–Corpus Christi estuaries near Corpus Christi (Walker et al., 2021). It is likely that other bays and estuaries along the Texas coast were similarly affected, as they were all under the path of the hurricane.
We report here on data collected before and after the hurricane along the Texas coast between Galveston and Padre Island, south of Corpus Christi, Texas. Two cruises were completed prior to the hurricane as part of a separate project. Following the hurricane, we completed three more cruises, occupying the same stations in September (twice) and November 2017. This paper reports on the changes in the water column between the pre- and post-hurricane cruises as they relate to stratification, nutrient supply and oxygen concentrations.
Pre-hurricane cruises on the RV Manta took place from 12–16 June and 7–11 August 2017, while post-hurricane cruises were from 22–27 September, 29 September–1 October and 15–20 November on the RV Point Sur. The 27 September–1 October cruise only occupied the two inshore stations on each line; all other cruises covered a standard grid of five lines of five stations each (Fig. 2), together with supplemental ad hoc stations between lines and offshore in the east of the region towards the Flower Gardens Banks National Marine Sanctuary, a shallow reef system 120 km south of Galveston Bay near 27.92∘ N, 93.75∘ W. During the November cruise, stations were added at the outer ends of the southernmost lines to ensure sampling of offshore surface water with salinity >35. Depths at the outer ends of each line decreased from 95–110 m at stations 5 and 10 to 85 m at station 15 and 50 m at stations 20 and 25.
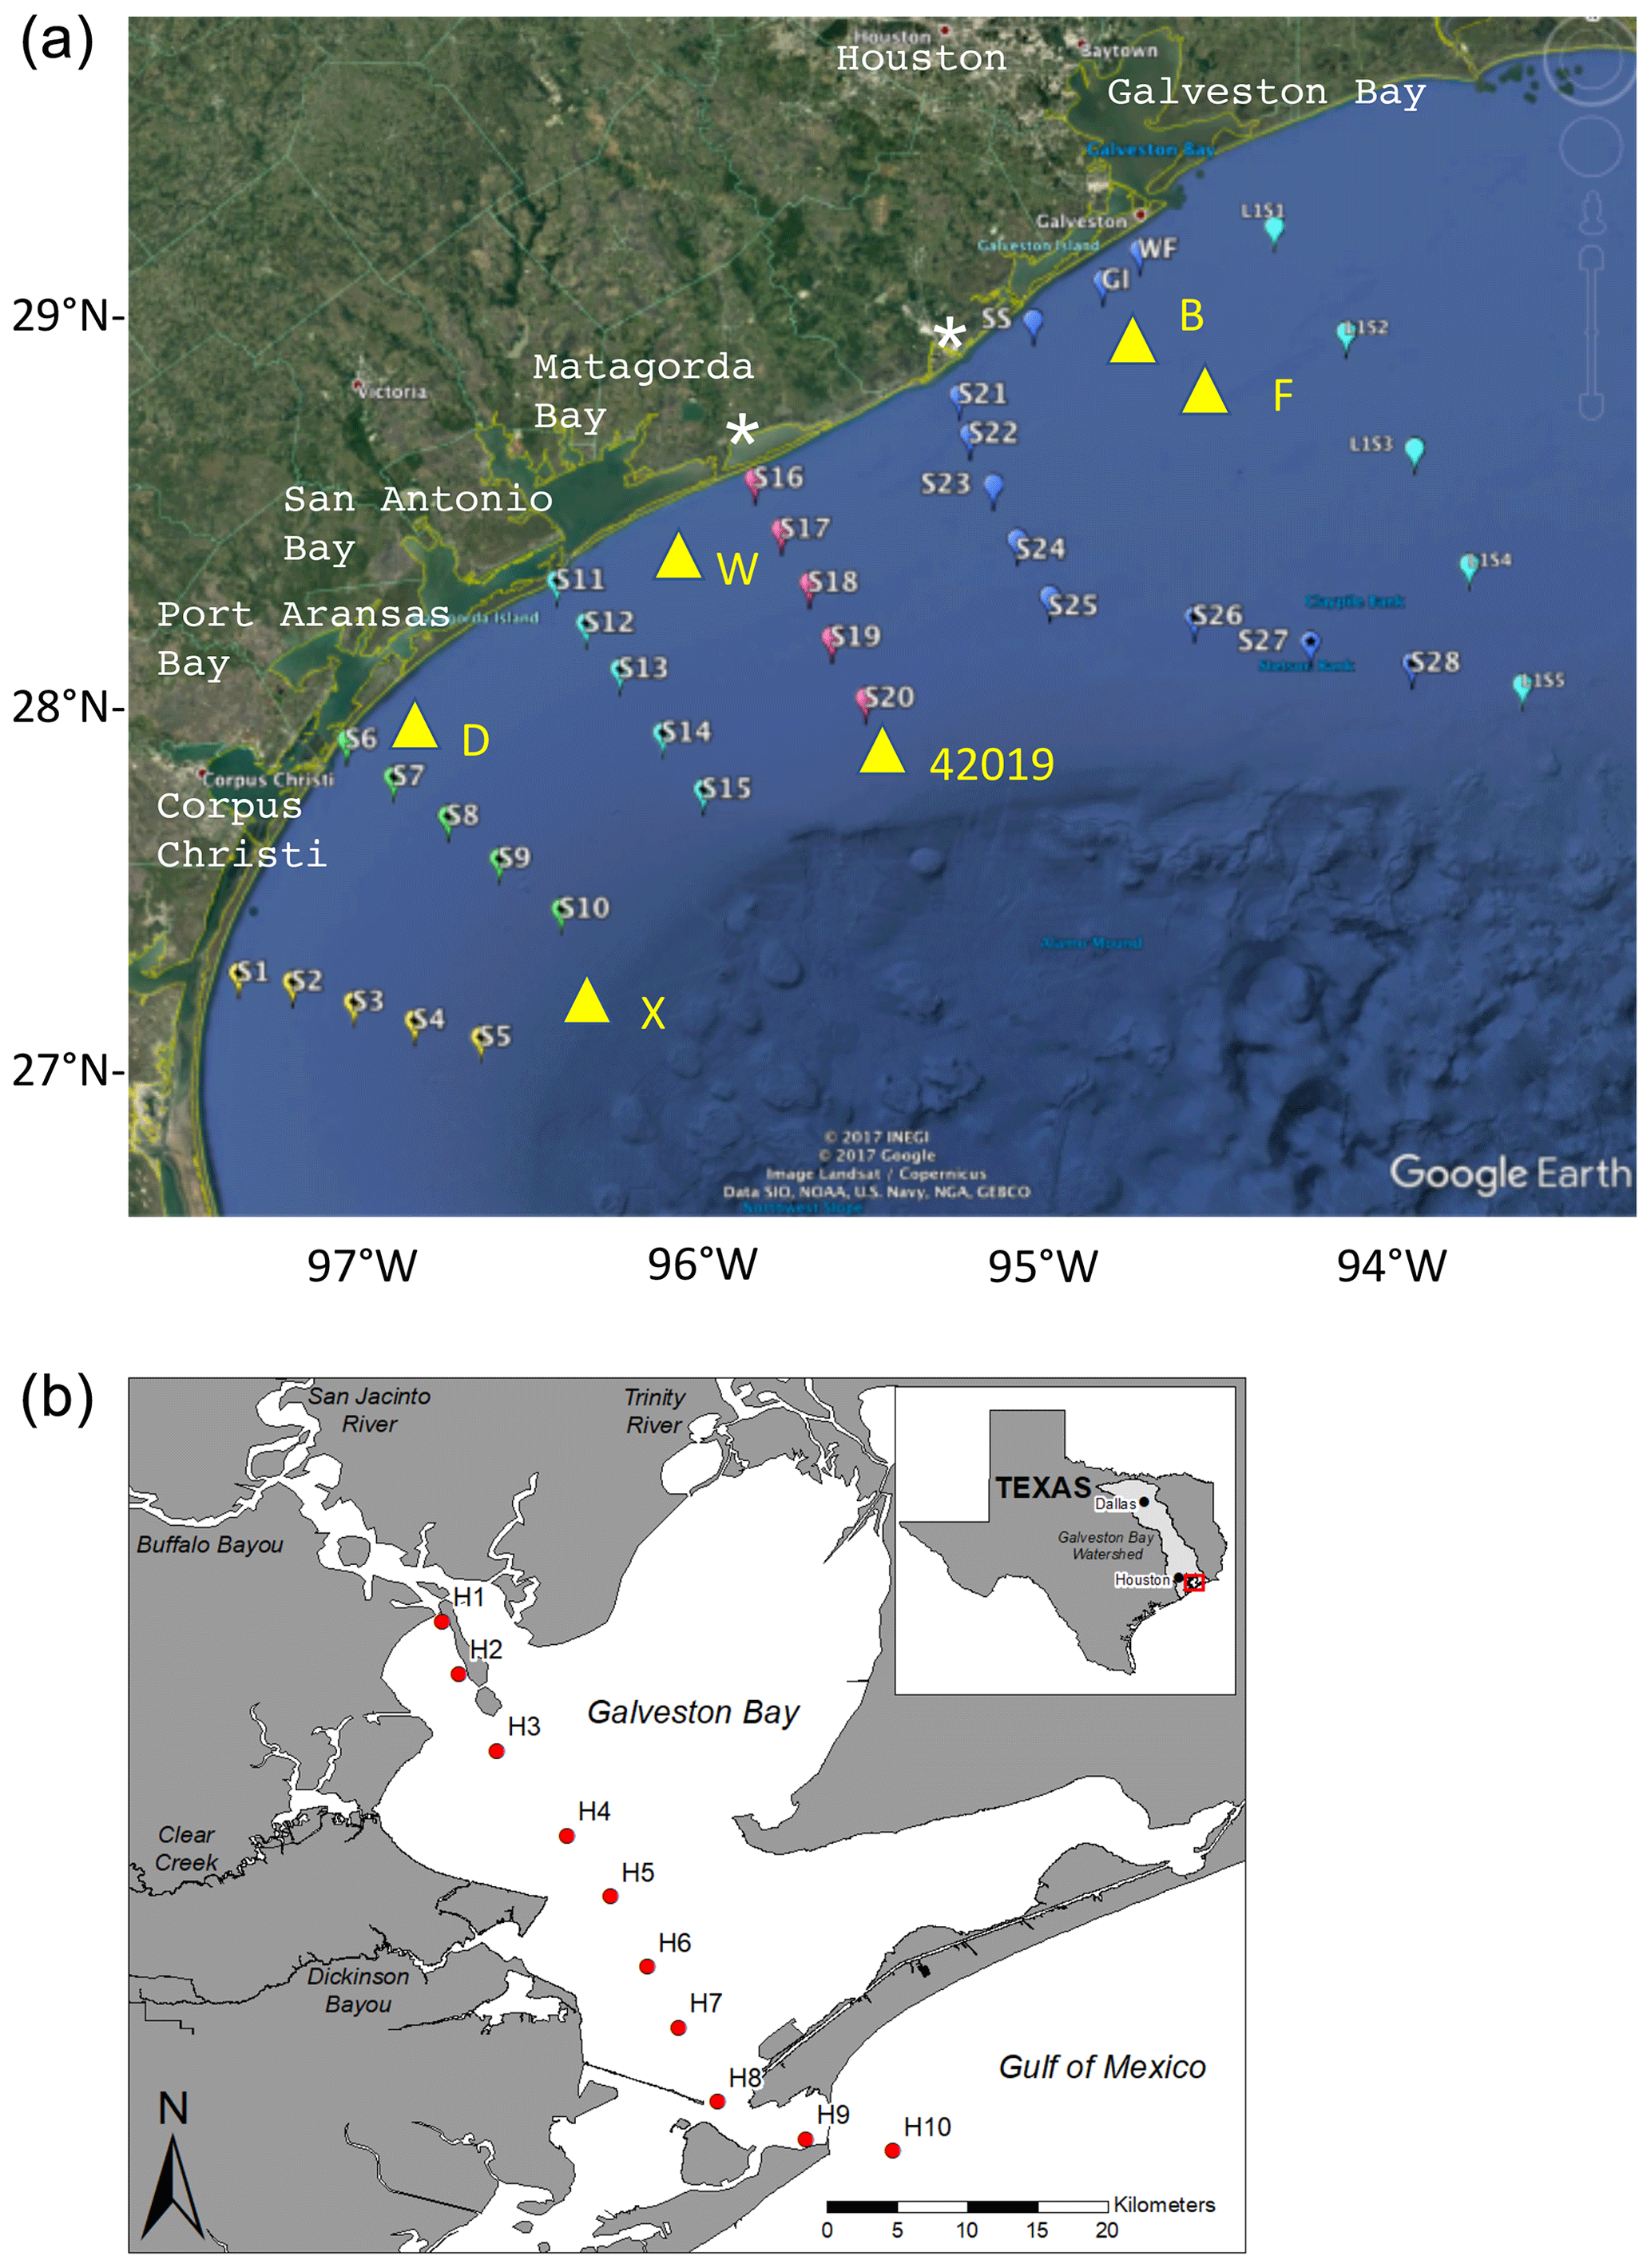
Figure 2(a) Stations occupied during the four cruises. Only stations S1–S25 and the inshore stations GI, SS and WF were occupied during June and August. All stations shown were occupied in the 22–27 September cruise and in November. Only the two inshore stations on each line were occupied during the second September cruise. Yellow triangles show positions of TABS moorings B, D, F, W and X and NOAA buoy 42019. White stars show the mouths of the Colorado River (near station 16) and Brazos River (near station 21). Data from stations 11–15 are shown in Figs. 5 and 6 and in the Supplement. (b) Galveston Bay and vicinity showing Trinity and San Jacinto rivers and stations discussed in Fig. 8.
At each station, a full-depth conductivity–temperature–depth (CTD) cast was made using a Sea-Bird 911 CTD fitted with a SBE-55 temperature sensor, SBE-3 conductivity sensor, SBE-45 pressure sensor and a SBE-43 oxygen probe. Additional sensors on the rosette package included a Chelsea Technologies AquaTracka III fluorometer and a Li-COR Biosperical PAR sensor. Discrete samples were collected from a six-bottle rosette for salinity determinations ashore (±0.002) and for oxygen calibration (±0.3 µmol L−1, by Winkler titration on board ship). Nutrient samples were collected, filtered, frozen on board and analyzed ashore for nitrate, nitrite, phosphate, silicate and ammonia by standard autoanalyzer methods (WHPO, 1994). Limits of detection (and precision) are about 0.1 µmol L−1 for nitrate (2 %), silicate (1 %) and ammonia (3 %) and 0.02 µmol L−1 for nitrite (1 %) and phosphate (2 %). Local meteorological data were collected by the ship's system, while surface water temperature and salinity data came from the ship's flow-through system.
Wind and current data are available from the TABS moorings along the Texas coast (see Fig. 2 for positions, and for the data archive see http://tabs.gerg.tamu.edu, last access: 15 May 2020). Buoy B (off Galveston) provided both wind and current data from before Harvey's landfall with a gap in the first half of August); buoys W (off Matagorda Bay) and D (off Corpus Christi) provided current data only. We have used additional wind data from TABS buoy X, which provided data until it failed on the morning of 25 September, and NOAA buoy 42019 (29.91∘ N, 95.34∘ W; obtained from the National Data Buoy Center at https://www.ndbc.noaa.gov, last access: 7 July 2020).
Fluorometer data were obtained at each station sampled using a Chelsea Technologies AquaTracka III instrument on the rosette. This instrument was calibrated prior to and after the cruises, but not immediately. Satellite imagery (Aqua-1 MODIS sensor, Level 2 ocean color files) downloaded from the NASA Goddard ocean color website (https://oceancolor.gsfc.nasa.gov, last access: 25 May 2019) was processed using the NASA SeaDAS software. In reality, the satellite-derived values may be too high, due to the presence of colored dissolved organic matter (CDOM) after the storm (D'Sa et al., 2018), as the OC3 algorithm provided by the SeaDAS software cannot discriminate between chlorophyll a and CDOM.
3.1 Wind fields
Wind data from all moorings (not shown) were typical of summer conditions in this part of the Gulf of Mexico, being predominantly from the south with occasional reversals (Nowlin et al., 1998). At TABS buoy B, wind velocities during June and July were generally 5–8 m s−1 and varied between south-southeast and south-southwest. Following a gap in data from 31 July until 22 August, they remained in this quadrant until the passage of the hurricane, although wind speeds increased from 3–4 m s−1 on 22 August to 12 m s−1 on 29 August when they were from the north. After the hurricane, September winds again were predominantly from the southeast/south-southeast, with the exception of two short-lived reversals on 5 and 10–12 September, with wind speeds around 4–7 m s−1.
Further south and offshore, at TABS mooring X and NOAA mooring 42019, weak northerly winds (generally <4 m s−1) occurred from 6–8 June, with a second northerly spell from 20–22 June, when speeds reached 10 m s−1 at mooring X and 15 m s−1 at 42019. After this second frontal system, winds reverted to southeast/south-southeast at both moorings until the passage of Hurricane Harvey at the end of August. During September, at mooring 42019, winds were primarily from the north-northeast/east-northeast at 4–10 m s−1 until 12 September, and again from 27 September, with southeastern or easterly winds of 3–7 m s−1 from 14–26 September. Maximum sustained wind speeds recorded during the hurricane at this mooring were 17 m s−1, with gusts to 22.6 m s−1. During October, there were two northerly/westerly wind events, on 16 October, when winds reached speeds of 15 m s−1, and a sustained event from 25–28 October, again with speeds <15 m s−1. Northerly winds continued during November, with sustained winds of 12–14 m s−1 during the periods 8–11, 18–20 and 22–24 November.
3.2 Water movement
Water movement over the Texas shelf is typically downcoast (towards the southwest) in non-summer months and upcoast (towards the northeast) in summer, with currents following the wind (Cochrane and Kelly, 1986; Walker, 2005). Upcoast winds and currents promote upwelling and act to retain water from the Mississippi–Atchafalaya system on the eastern Texas–Louisiana shelf (Hetland and DiMarco, 2008), while downcoast flow is downwelling-favorable and can reduce local stratification. During June 2017, currents at buoy D (27.96∘ N, 96.84∘ W) were essentially downcoast from prior to the cruise until 15 June, when they switched to upcoast until 20 June, after which they flowed downcoast again (Fig. 3a). The current reversal took place slightly later (17 June) at buoys B (28.98∘ N, 94.90∘ W) and W (28.35∘ N, 96.02∘ W), but the return to downcoast flow again occurred on 20 June at both sites (Fig. 3a). These three moorings are all situated close to the coast in water depths of 20 ± 2 m.
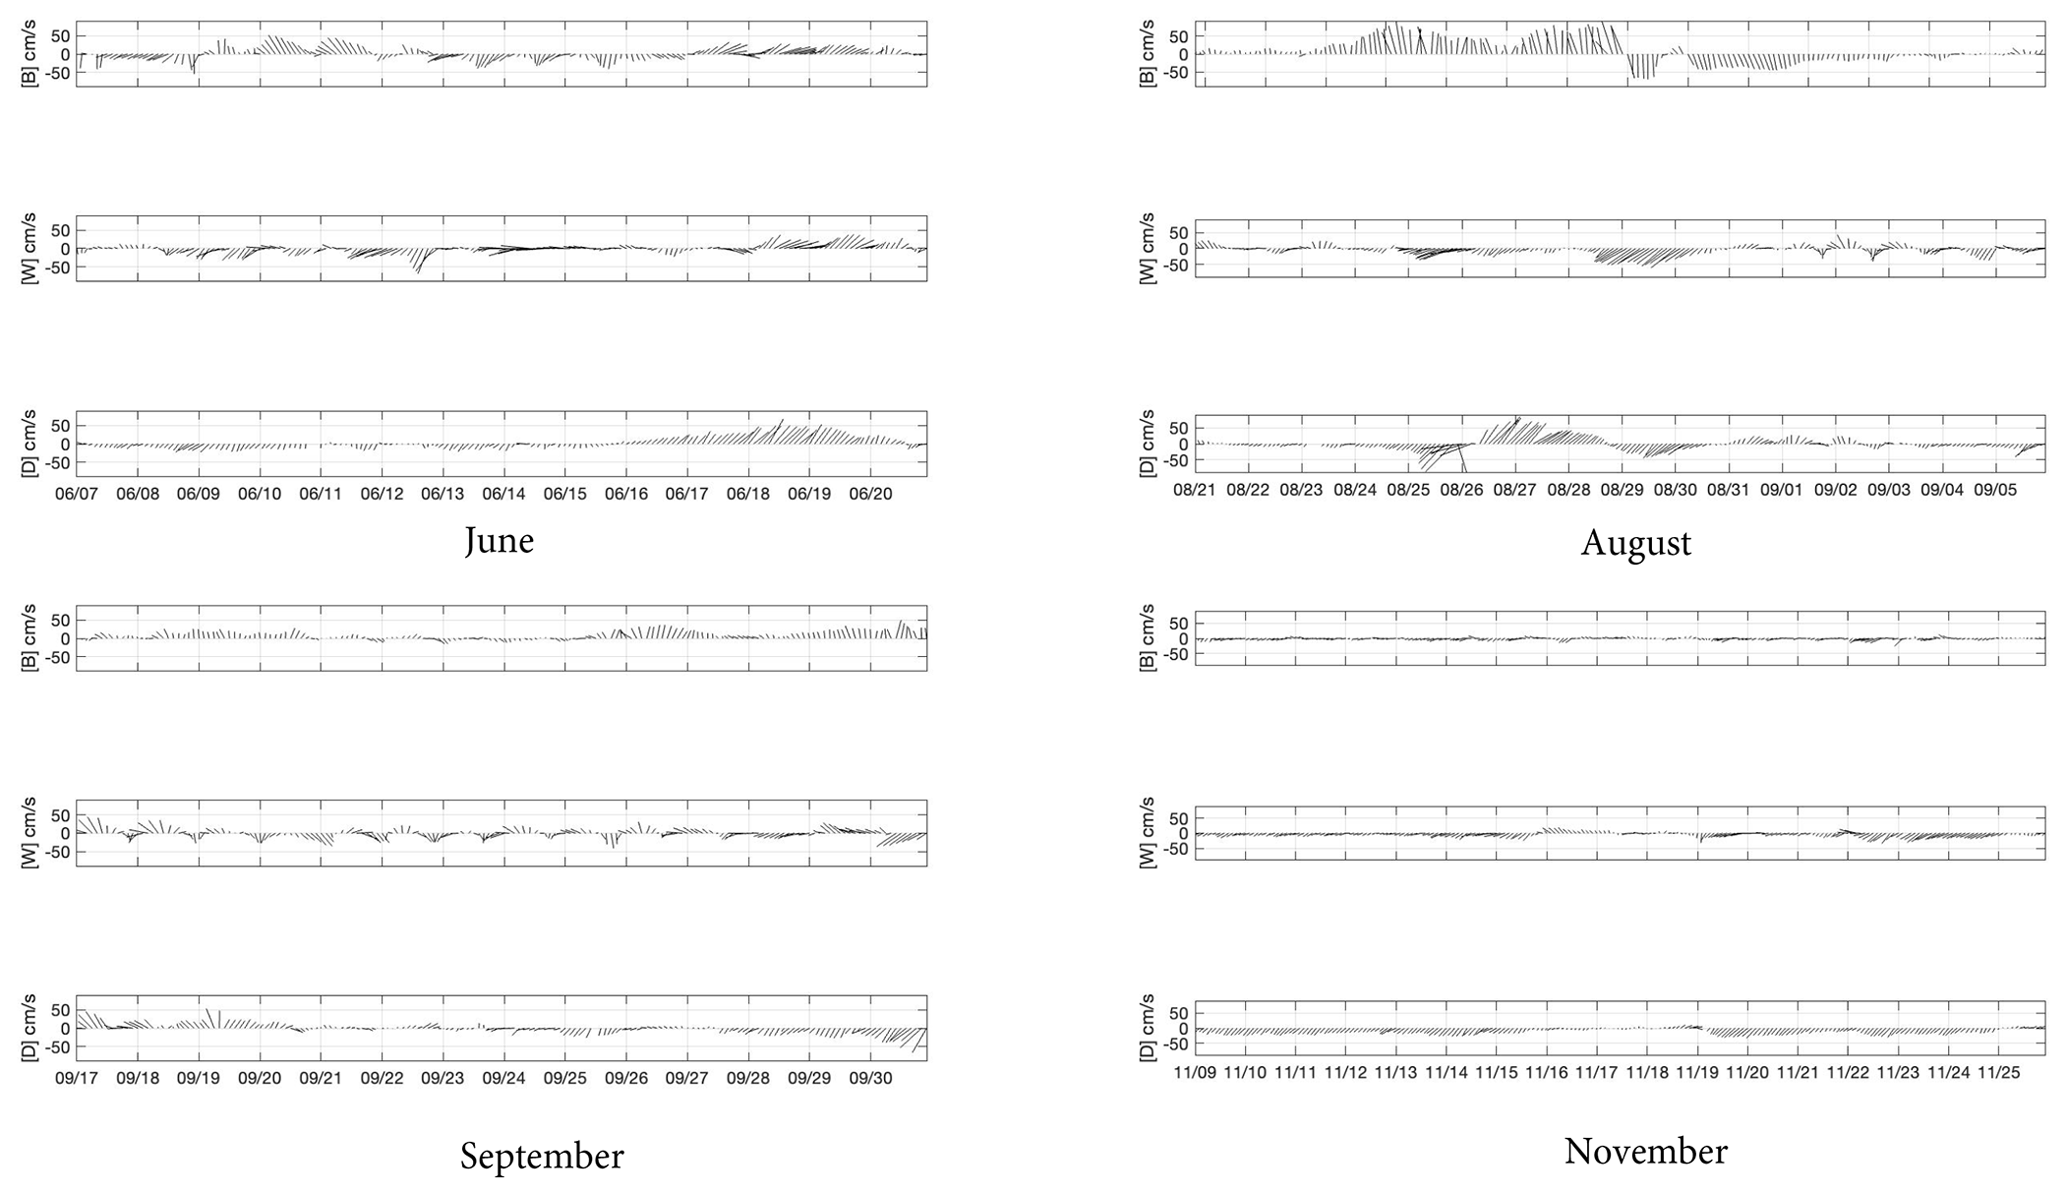
Figure 3Current vectors at TABS buoys B, D and W during the cruise in June, the period of the hurricane (August), and the cruises in September and November.
Upcoast currents prevailed at sites W and D during the August cruise (Fig. 3), although currents were downcoast from about 8–10 August at site W and 9–11 August at site D (not shown). Buoy B did not record current speeds during this period but was back in service immediately before the hurricane arrived. During the passage of the hurricane, the southernmost mooring (buoy D) recorded strong currents of >1 m s−1, which changed from downcoast to upcoast and back to downcoast again as the storm moved towards the northeast (Fig. 3b). Buoy W recorded continuous downcoast currents during the period of the hurricane, while buoy B showed strong onshore currents (<1.0 m s−1) until 30 August, when currents reversed to offshore at <80 cm s−1. Following the hurricane, coastal currents were considerably weaker at all three sites in September and November. During the September cruise there were a number of current reversals, especially at buoy W, although velocities were generally <30 cm s−1 (Fig. 3c). By November, current velocities decreased still further, and the expected flow towards the west was reinstated (Fig. 3d).
3.3 Temperature, precipitation and salinity
Temperatures (not shown) showed well-mixed or weakly stratified water inshore in June and August with surface-bottom differences of less than 2 ∘C at the two inshore stations on each line. Further offshore, bottom temperatures decreased with depth, but there remained a well-mixed surface layer of 15–25 m thickness. Following the hurricane, however, the mixed layer extended offshore to the third station on each line in September and almost all stations in November, when isothermal water was found as deep as 80 m in some instances, and bottom temperatures were often warmer than at the surface.
Surface temperatures increased from about 28.5 ∘C in June to over 30 ∘C in August (Trenberth et al., 2018). As the hurricane passed, temperatures at the buoys, including at National Buoy Database Center (NBDC) buoy 42019 (27.91∘ N, 95.34∘ W), decreased to a minimum of about 27.5 ∘C but recovered to 28.5–29 ∘C by the September cruises. By November, temperatures had decreased to 21–22, 22–23 and 23–23.5 ∘C at buoys B, W and D respectively. NBDC buoy 42019, which is further offshore in 82 m of water, registered temperatures between 25.4 and 26.0 ∘C during this period.
Precipitation measurements for a number of stations in central Texas are shown in Table 1. With the exception of the August data, all stations reported lower-than-average rainfall during these months apart from George Bush Intercontinental Airport (Houston) in June and July and Austin–Bergstrom International Airport in September (respectively north and northwest of Galveston Bay). Despite this, low salinities were found in June at the surface inshore and pushing southwards (Fig. 4a), with a strong, sloping salinity front between the surface layer and the deeper water. Salinity (S) values across the front changed by ∼12 along stations 18–20 and 21–23 just south of Galveston Bay. The salinity gradient decreased towards the south, with an inshore–offshore change of only 4 south of 28∘ N. The lowest surface salinity (station 21) was <22 at this time and was still <32 along the southernmost line except at the outermost station. Bottom water salinities (not shown) were higher because of density stratification, with salinities of >35 found in water deeper than about 20 m at stations in the eastern half of the grid and 35 m on the southern lines. The low surface salinities resulted from westward flow from the Mississippi–Atchafalaya river system (MARS), together with local outflow from Galveston Bay. MARS peak flow during the 2017 spring flood was 34 500 m3 s−1, almost double the long-term mean from 1935–2017 (data from http://rivergages.mvr.usace.army.mil/, last access: 7 July 2021).
Table 1Precipitation (cm) for sites in central Texas from May–September 2017 compared with the long-term mean (italics). Data downloaded from https://www.srcc.tamu.edu/climate_data_portal/?product=precip_summary (last access: 7 July 2021).
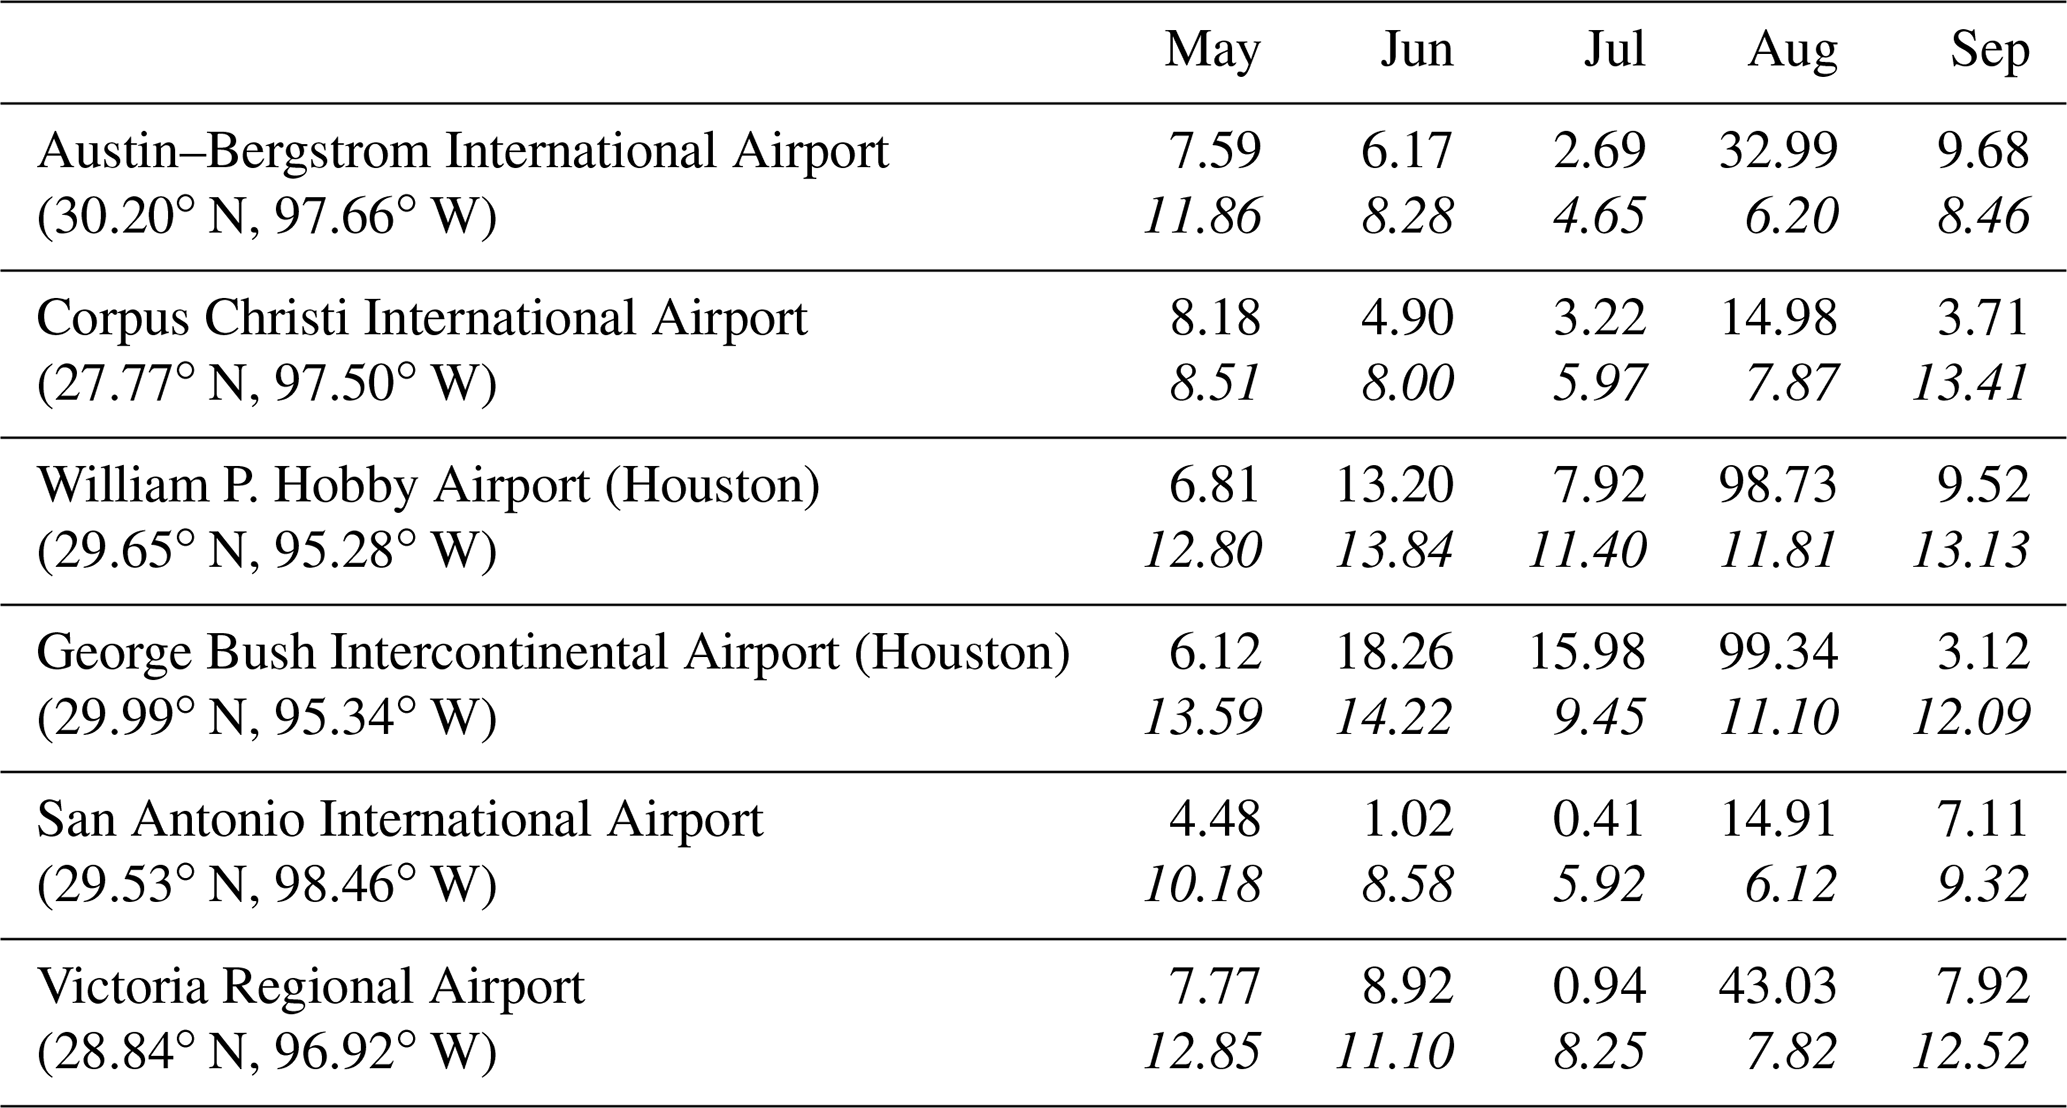
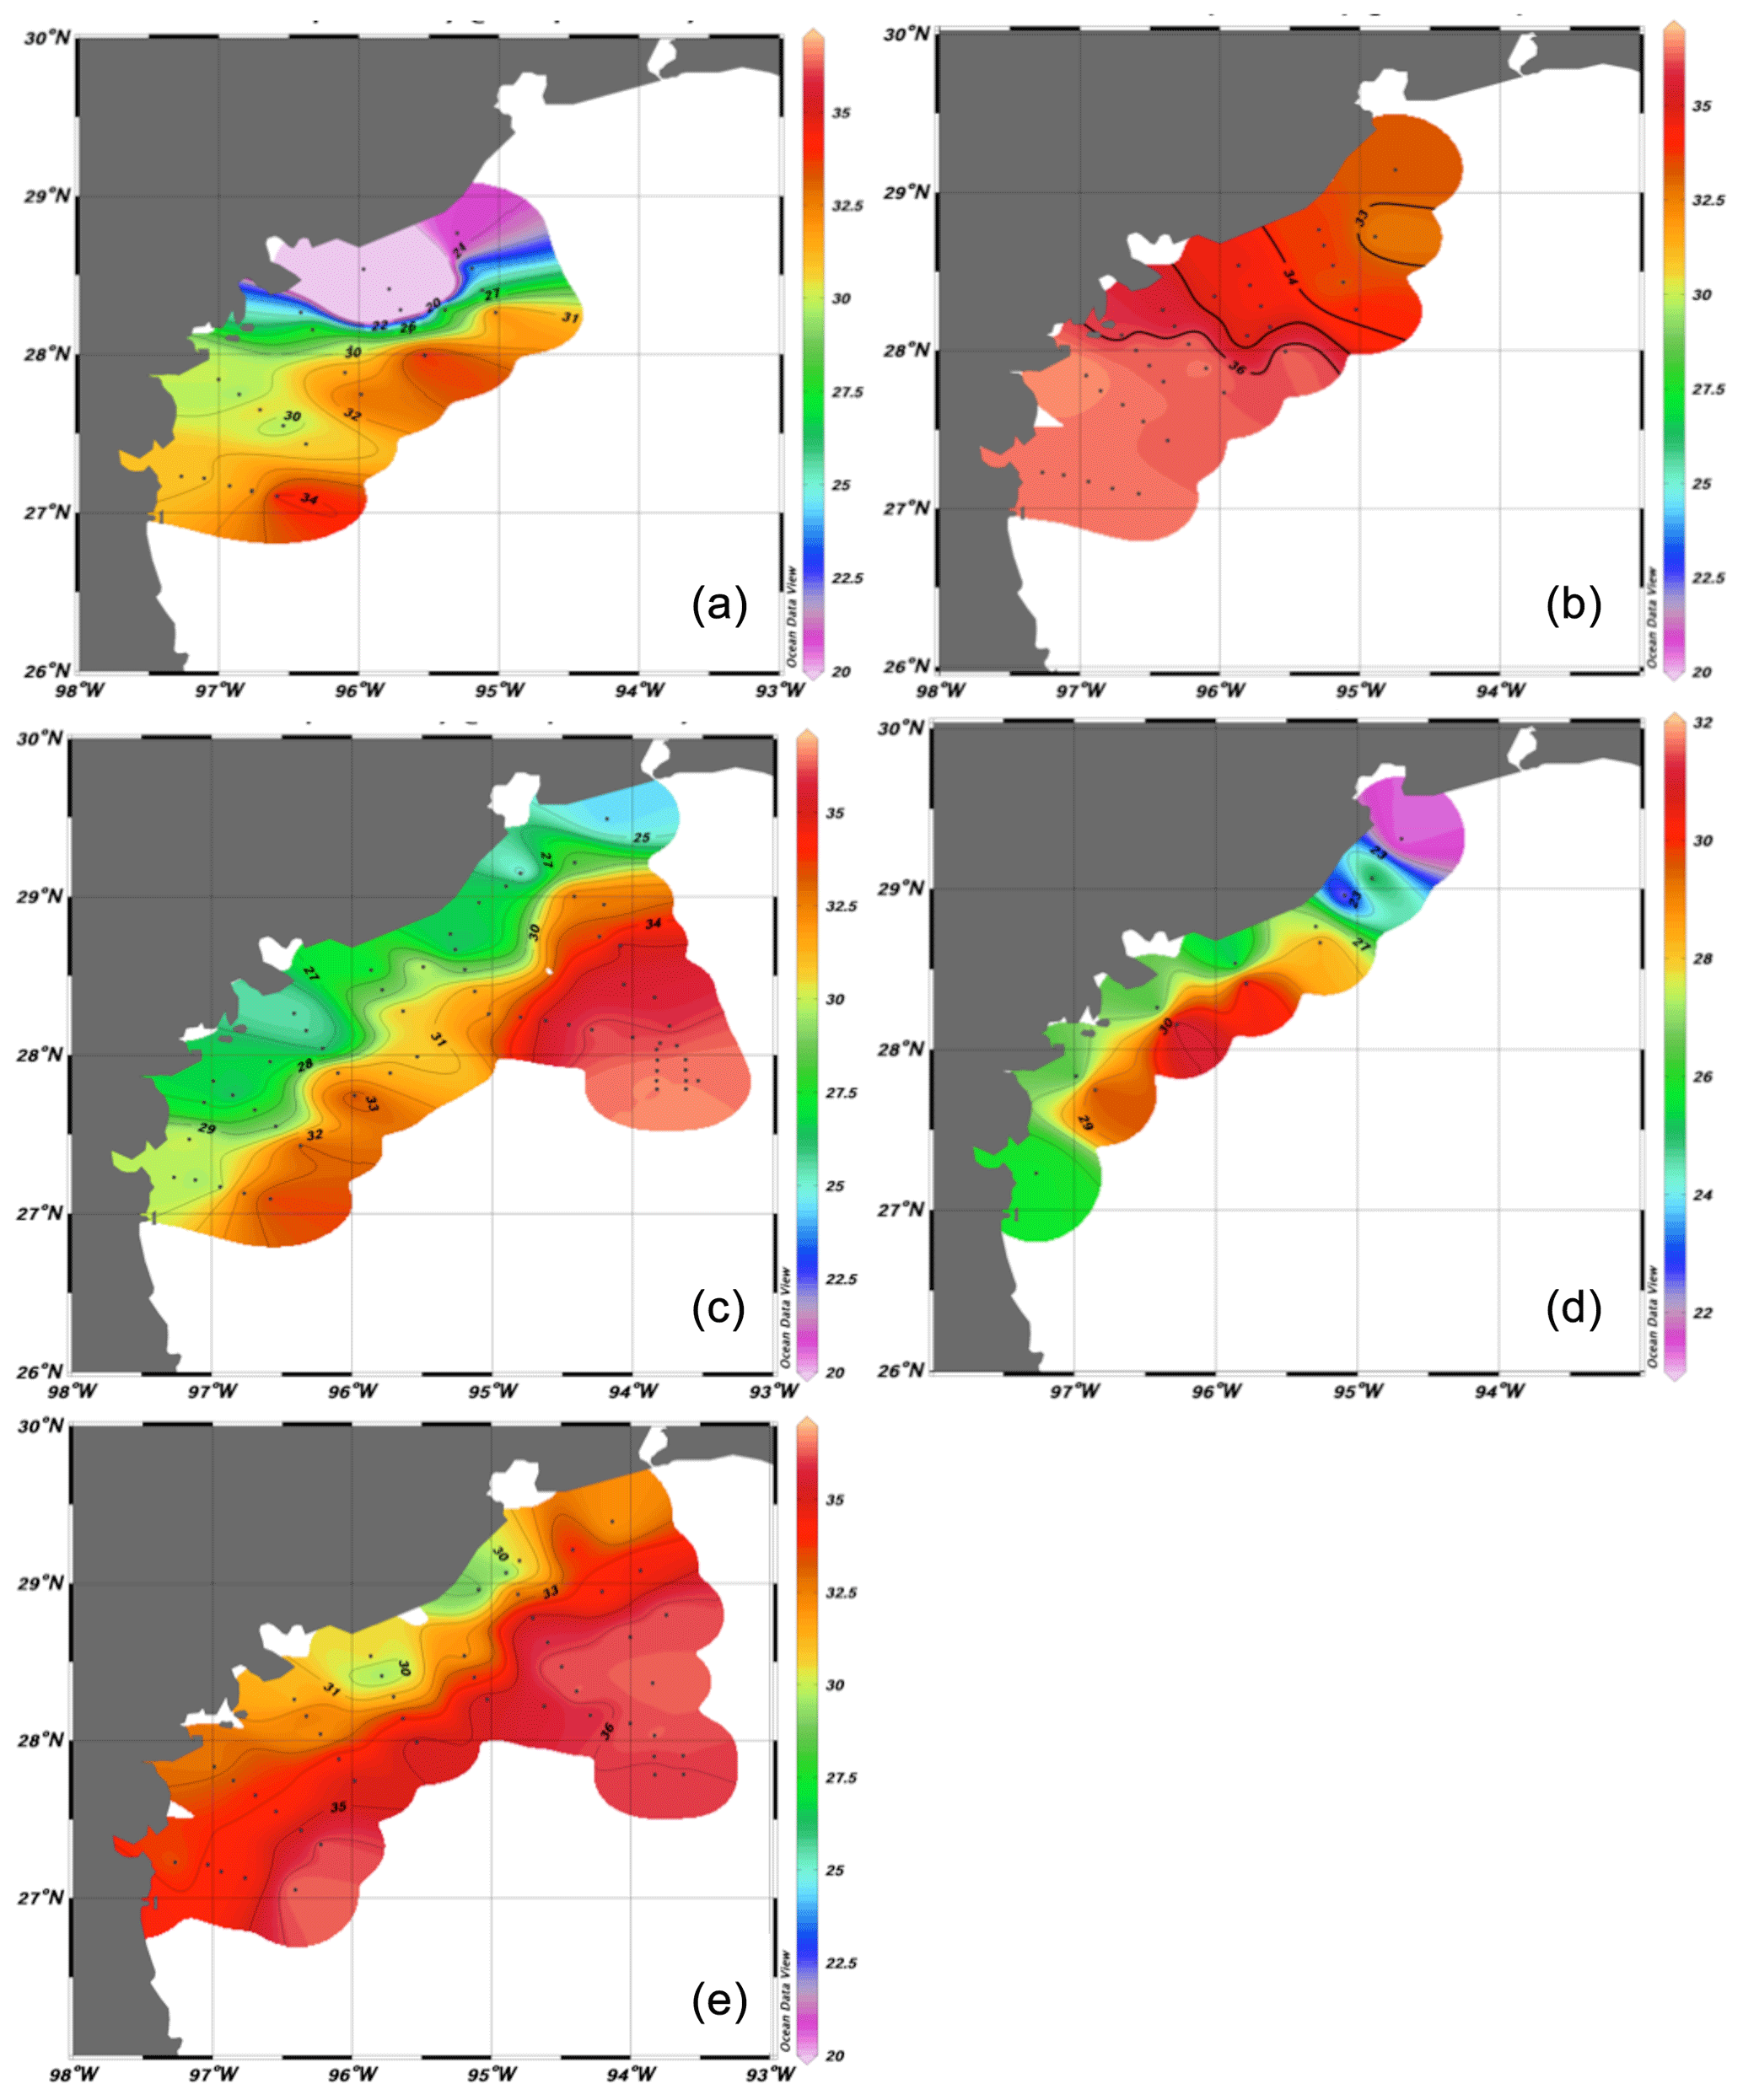
Figure 4Surface salinities during 2017 cruises: (a) June, (b) August, (c) 22–27 September, (d) 29 September–1 October, (e) November.
By August (Fig. 4b), surface salinities had increased across the region as a result of the southerly winds, with a minimum of 32.15 just south of Galveston Bay, while the 35 surface isohaline was situated off Matagorda Bay between stations 16–20 and 11–15. Bottom water was still stratified at stations on the two northern lines, with salinities <35 only found at stations 16, 17, 21 and 22 and at the wind farm (29.14∘ N, 94.75∘ W). Further south, stations 1–10 and 13–15 all contained almost isohaline water with S>36.
The fresh water from the hurricane caused a major change in the surface salinity by the time of the first September cruise (22–27), resulting once again in a strong cross-shelf gradient (Fig. 4c). Surface salinities were <33 throughout the region, apart from two stations at the extreme south of the grid, and in the area more than 100 km offshore between Galveston Bay and the Flower Gardens Banks, where there was a strong salinity front. A similar situation was found a week later at the inshore stations (Fig. 4d), although the surface layer of low-salinity water had thinned and was confined to the innermost stations on each line. Vertical sections in September showed very strong stratification of up to 10 in salinity within a 10 m depth interval along all lines (e.g., Fig. 5; this section across stations 11–15, adjacent to Matagorda Bay, is taken as representative of all five lines). The halocline was not flat but deepened towards the coast, giving a wedge of lower-salinity water onshore, and the depth at which it intersected the bottom decreased from ∼30 m in the north to less than 20 m in the south. Water with salinity >36 was found at the bottom on all lines. By November (Figs. 4e and 5), however, a more typical salinity field was found, with well-mixed water throughout the coastal zone and a general onshore–offshore gradient at all depths. This is normal for the region in the fall, when atmospheric frontal systems tend to move across the Texas shelf and break down the summer pycnocline (Cochrane and Kelly, 1986; Nowlin et al., 1998).
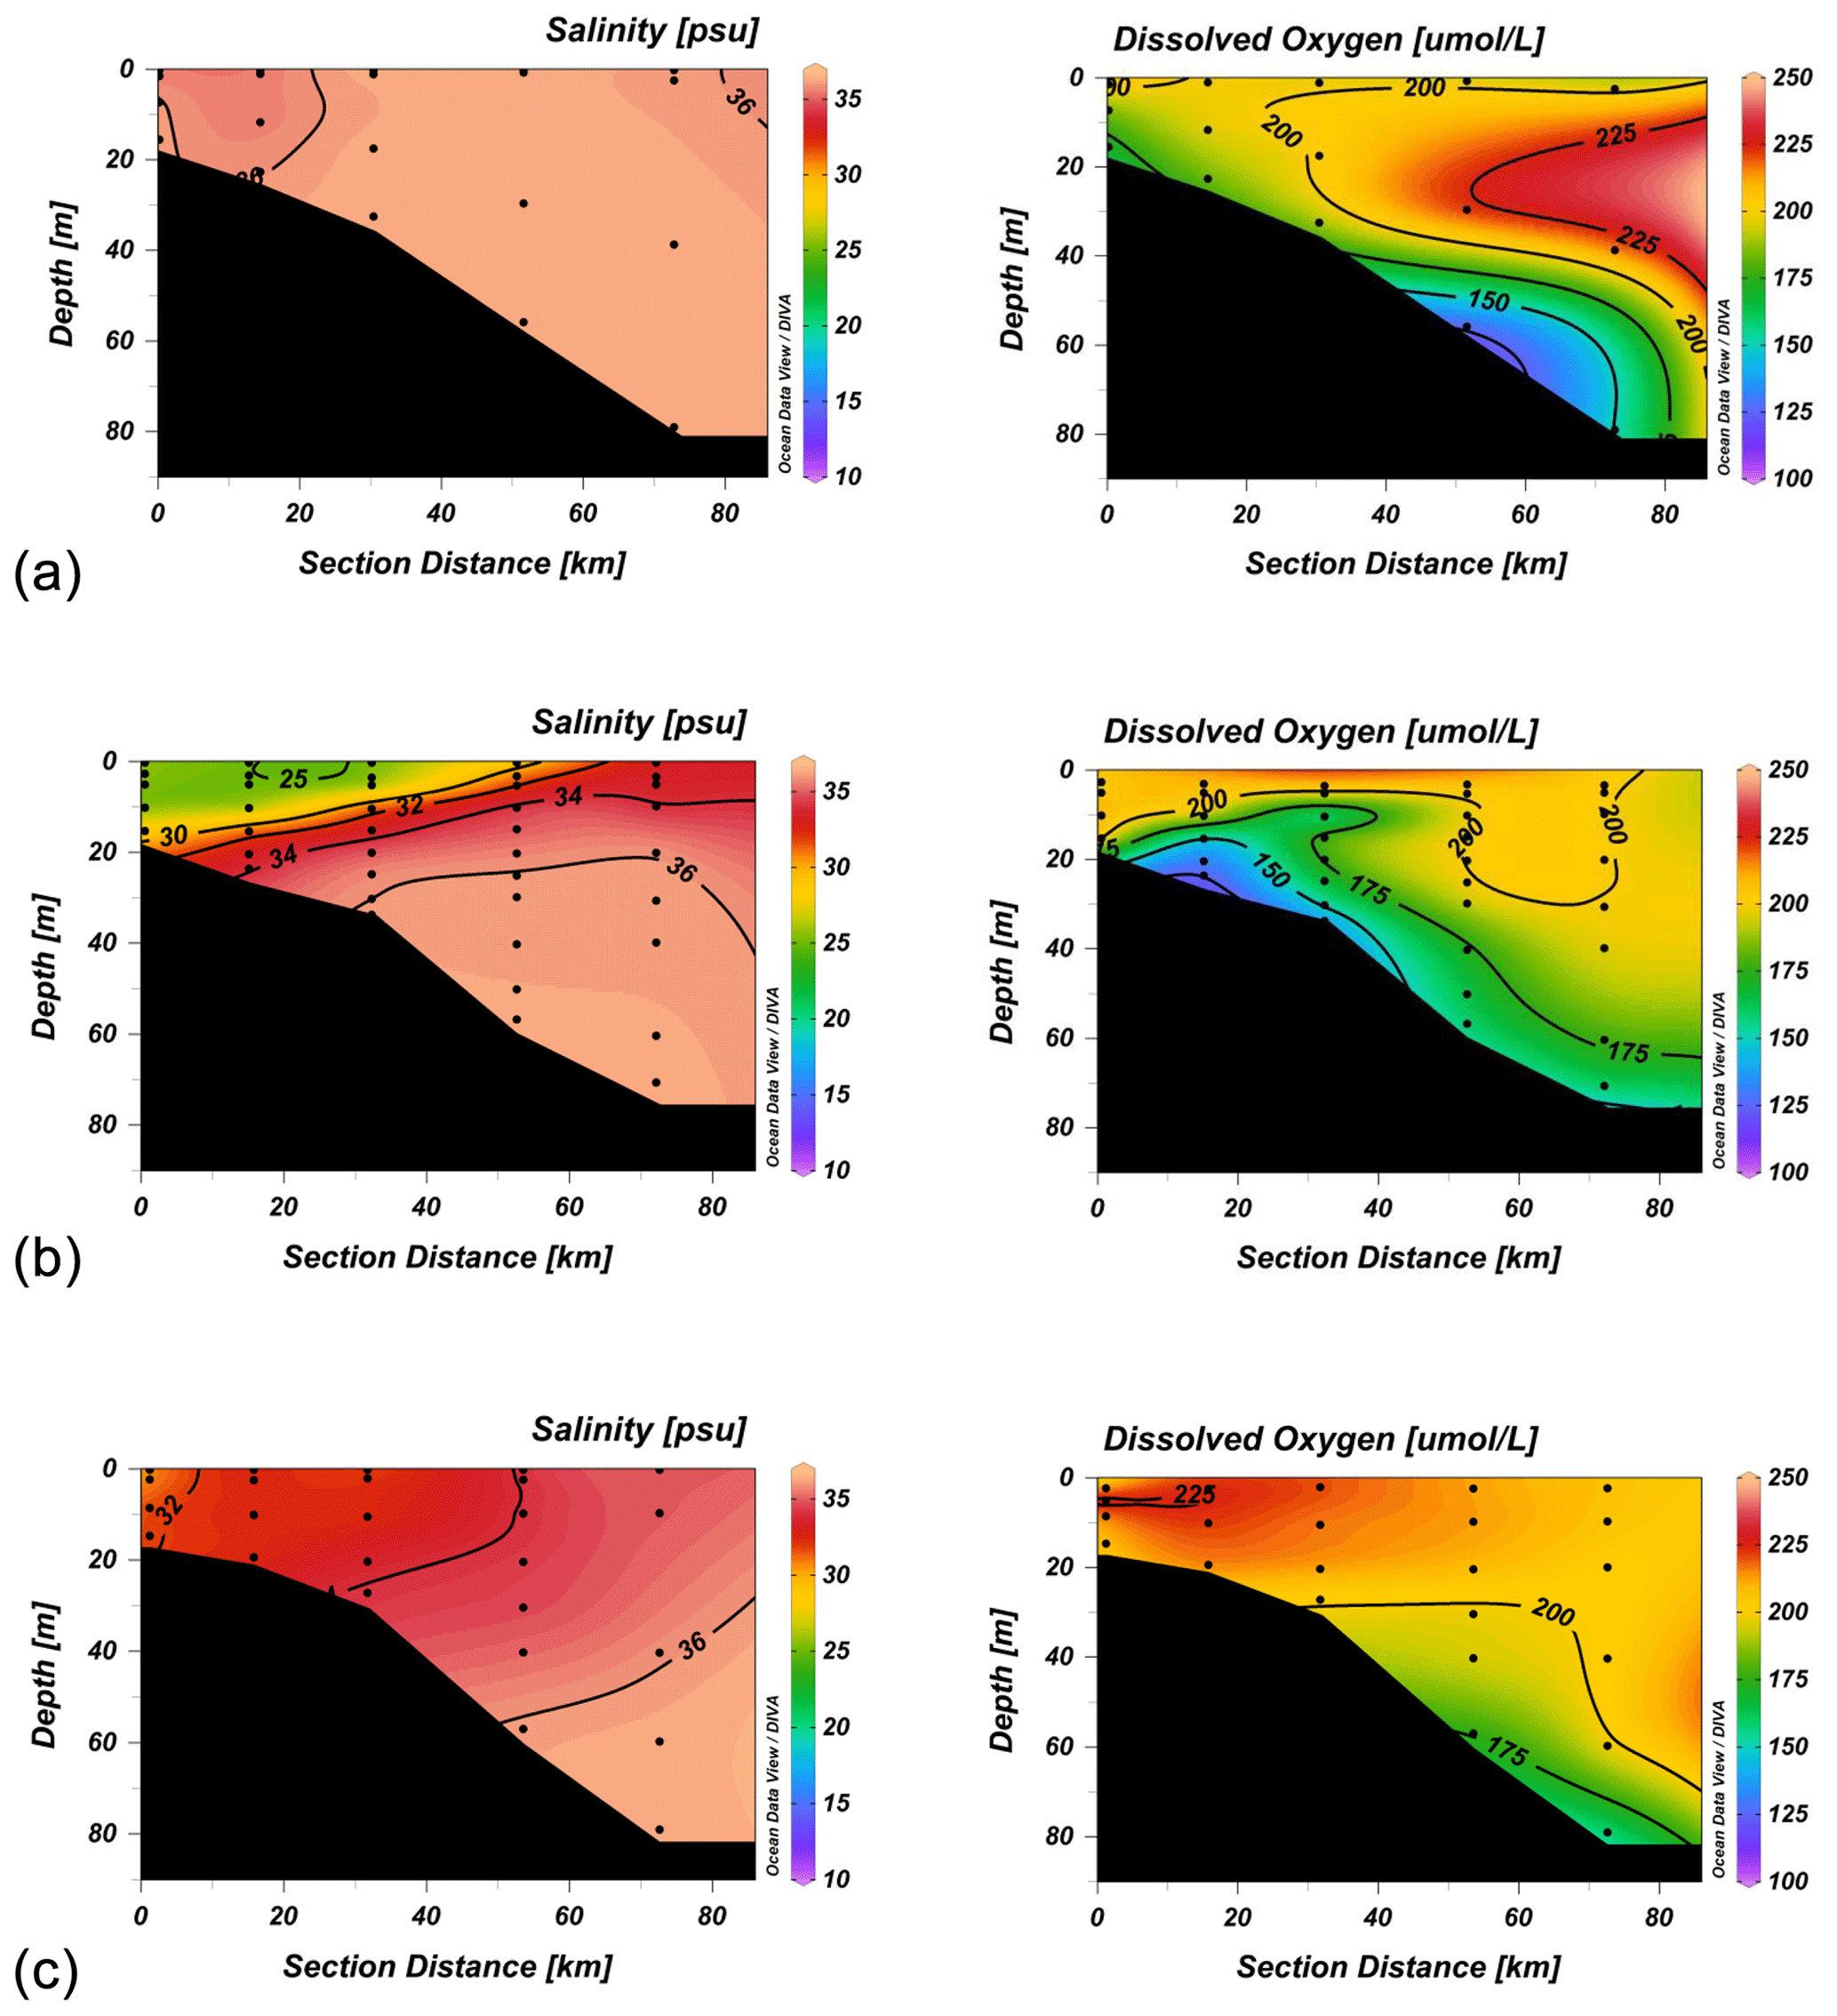
Figure 5Salinity (psu) and oxygen (µmol L−1) sections across line 3 (stations 11–15) for the August cruse (a), the first September cruse (b) and the November cruise (c).
3.4 Oxygen concentrations
Oxygen concentrations in this region of the Gulf of Mexico are typically saturated above the pycnocline, as found during all four cruises. Concentrations varied between 210–220 µmol L−1 in June (not shown), when the SST was about 25 ∘C, and 190–215 µmol L−1 during August and September, when it was closer to 30 ∘C (Fig. 5). Oxygen saturation in seawater of salinity 35 is 206 µmol L−1 at 25 ∘C and 190 at 30 ∘C. By November, with declining surface temperatures, the saturation concentration increased to between 210–230 µmol L−1. Below the pycnocline, oxygen concentrations declined in the higher-salinity water. This effect was most pronounced offshore in June and August, when subtropical underwater, with typical oxygen concentrations of 160–170 µmol L−1, intruded onto the outer shelf (Fig. 5). Isolated patches with concentrations <150 µmol L−1 were seen over the mid-shelf and across the eastern part of the grid at this time. By September, bottom concentrations of 150 µmol L−1 or less were found over large parts of the inner and middle shelf and at the outermost stations of the grid. Vertical sections showed the lowest oxygen concentrations at the base of the pycnocline where it intersected the seafloor (Fig. 5), but hypoxia (oxygen concentrations <62 µmol L−1) was not observed at any station. There was little change in either the pattern of oxygen distribution or concentrations at the innermost stations between the two cruises in September (not shown). By November, however, after the passage of a number of frontal systems with wind speeds up to 14 m s−1, the oxygen concentrations showed little vertical structure, and the system could be said to have returned to normal for that month.
3.5 Nutrients
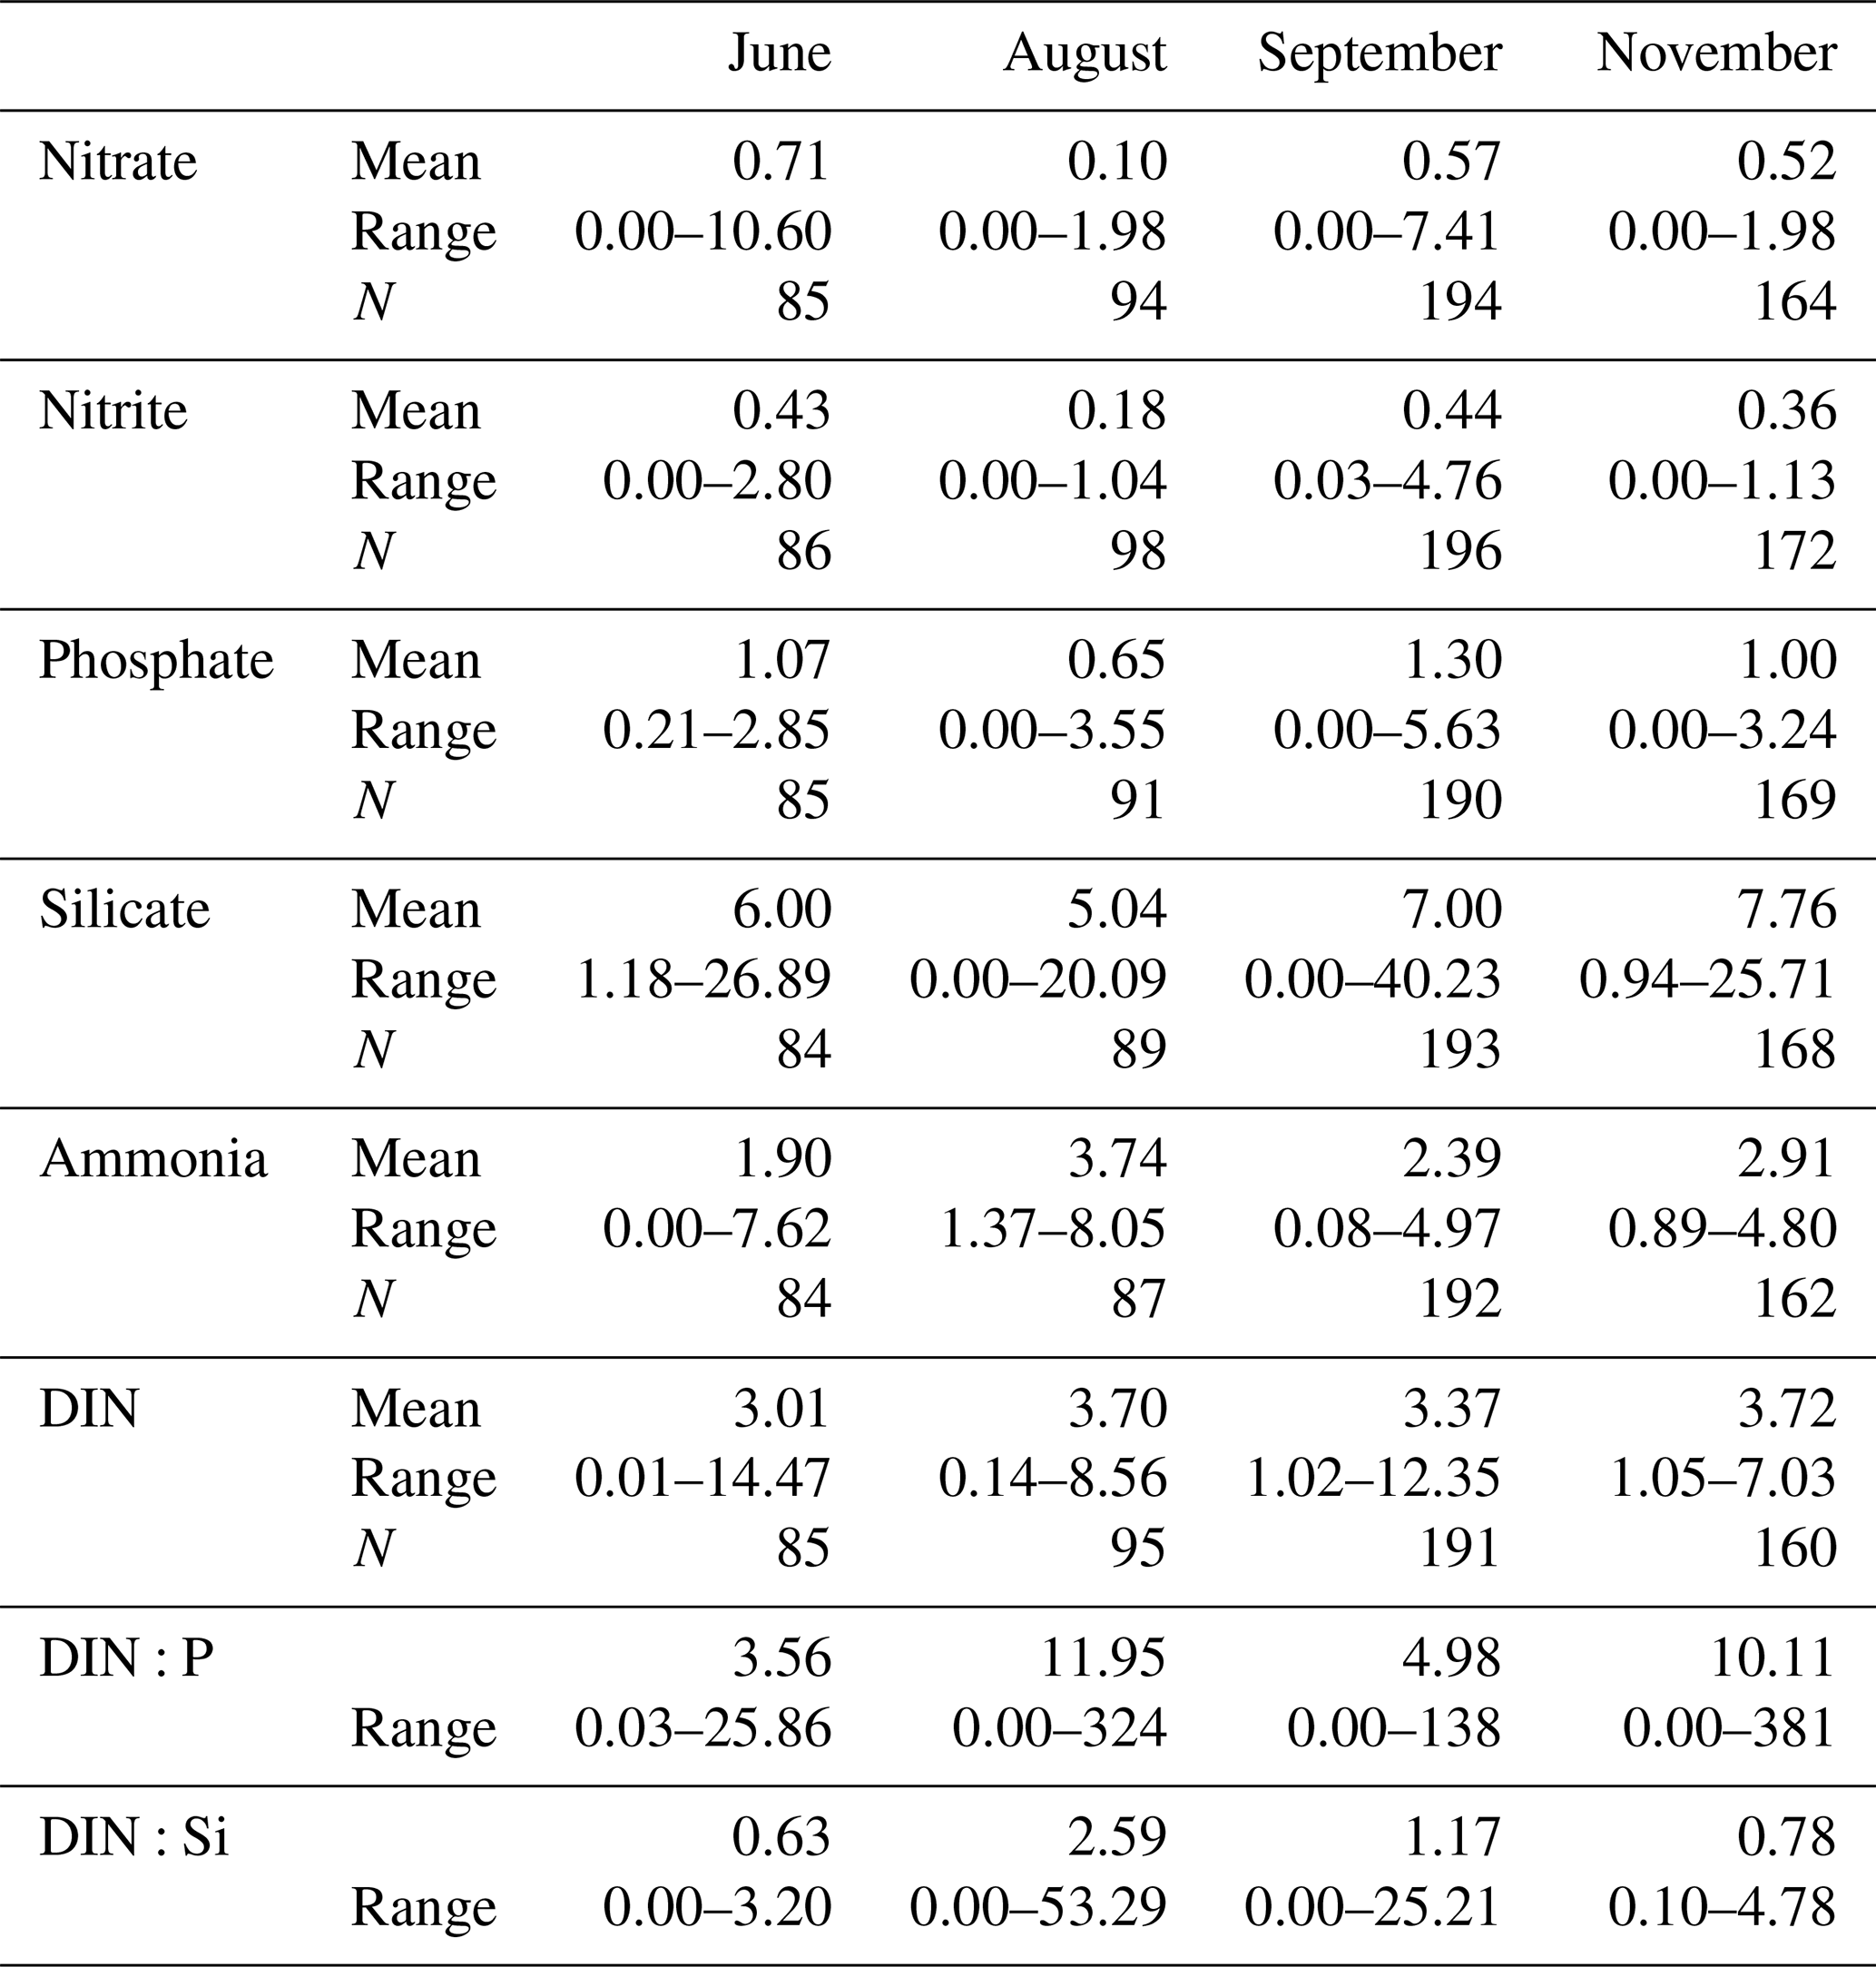
Nutrient concentrations in the coastal waters and bays along the Texas coast in summer are typically very low at the surface, increasing with depth even on the shallow shelf as nutrient regeneration takes place near the bottom. This is especially the case when hypoxic events occur (Nowlin et al., 1998; DiMarco and Zimmerle, 2017; Bianchi et al., 2010). Mean concentrations in the upper 30 m of the water column for all nutrients at stations within the grid as well as at additional stations having water depths shallower than 50 m are given in Table 2. Data from the second September cruise, which covered only the two inshore stations on each line, are not included in the table. These data showed similar patterns to the cruise a week earlier, although mean concentrations were higher because of the proximity of the coast and the many freshwater discharges from bays and rivers.
Table 2Mean and range (µmol L−1) and number of samples (N) for nitrate, nitrite, ammonia, phosphate and silicate in the upper 30 m of the water column for all four cruises. DIN is calculated as the sum of the three nitrogen species. DIN:P and DIN:Si ratios use the values for all individual samples.
In higher-salinity (>35) water and offshore, nutrient concentrations increase only slowly with depth, and nitrate and silicate concentrations >5 µmol L−1 are generally found in midwater only below depths of about 50 and 100 m respectively (Figs. 6 and S3). Only one nitrate sample (in September) containing more than 8 µmol L−1 came from below 60 m depth. Nitrite concentrations were almost all low, with mean concentrations in the upper 30 m below 0.5 µmol L−1 on all four cruises, although individual surface concentrations were considerably higher.
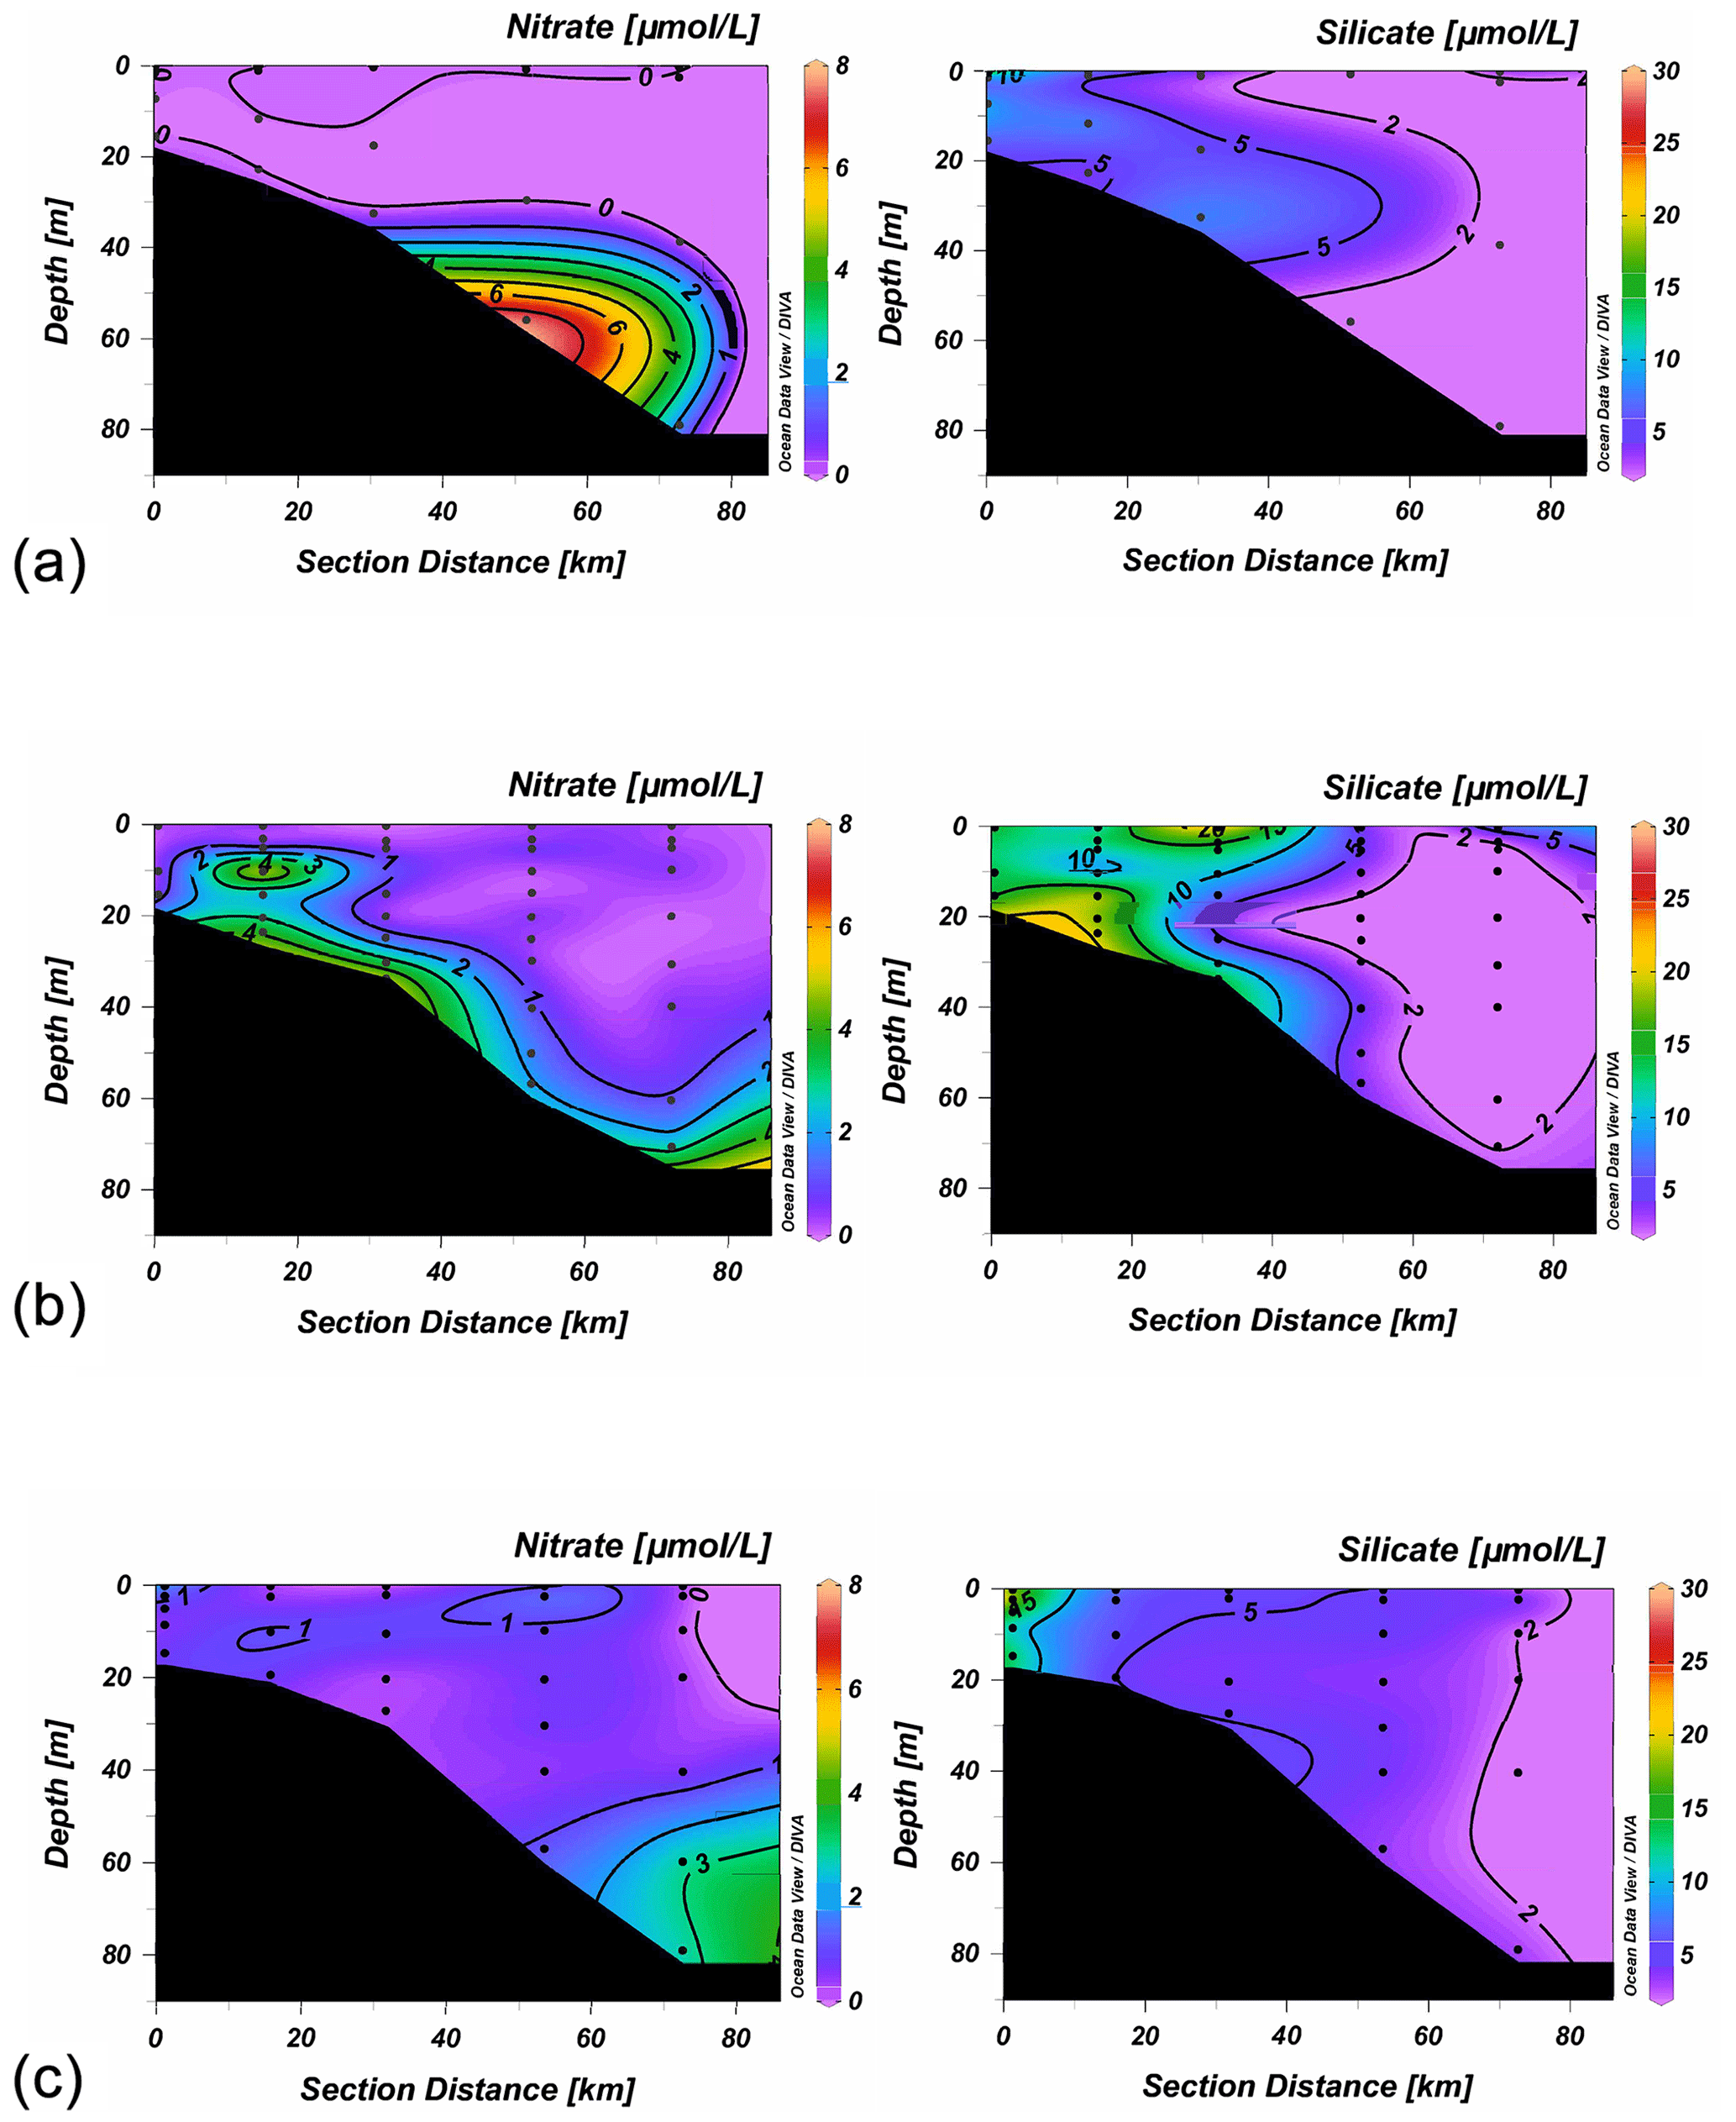
Figure 6Nitrate and silicate (µmol L−1) sections along line 3 (stations 11–15) during the August cruise (a), the first September cruise (b) and the November cruise (c).
Ammonia concentrations were variable, particularly inshore, but generally provided a background concentration of about 2–4 µmol L−1. As a result, dissolved inorganic nitrogen (DIN) distribution resembled that for nitrate but with the added background contribution from ammonia (Fig. S4). Phosphate concentrations (not shown) were similarly lower at the surface than at depth, except in September, when surface runoff increased concentrations above 3 µmol L−1 in the upper 10 m of the water column and to a background concentration between 1.5–3 µmol L−1 in the rest of the water column up to 50 km offshore (between stations 13 and 14). Phosphate is almost always non-limiting for phytoplankton in this region so that residual phosphate concentrations can be found even though nitrate is depleted (Bianchi et al., 2010), although Sylvan et al. (2006, 2007) and Quigg et al. (2011) have suggested phosphate limitation can occur further east in the Mississippi plume. Silicate, however, showed an opposite trend to the general pattern of the other elements, with almost all samples >15 µmol L−1 coming from the upper 25 m of the water column, and concentrations decreased with depth to <5 µmol L−1 below 100 m (Figs. 6 and S3). Silicate also showed a cross-shelf gradient, particularly along the two southernmost lines (not shown).
This general distribution shown in Figs. 5 and 6 was seen during early summer along all the lines occupied during June and August. In June, high concentrations of both nitrate and silicate were seen at stations 21 and 22, immediately south of Galveston Bay, where bottom water oxygen concentrations were <90 µmol L−1; elsewhere midwater levels of both elements were low, with very low nitrate concentrations (<0.5 µmol L−1) being found even at the bottom at some stations. While silicate concentrations were more variable, highest concentrations were typically again seen at the bottom, and midwater concentrations were generally <5 µmol L−1. The situation was similar in August (Fig. 6), when nitrate was very low throughout the region, and even bottom nitrate values were below detection at many stations.
In September, despite the extreme freshwater runoff, nitrate concentrations were still low except near the bottom at shallow stations, and there was little sign of any surface or midwater increase in concentration (Fig. 6). A comparison of nitrate concentration with depth gave essentially the same distribution as during earlier cruises, although there were more samples above 2 µmol L−1 within the 10–30 m depth range (Fig. S3). These were bottom samples at shallow stations with lower oxygen concentrations. The cross-shelf gradient in silicate concentrations was more pronounced on this cruise, and concentrations were >10 µmol L−1 throughout the water column at all the inshore stations. However, by November, concentrations of both nutrients had decreased considerably, although the offshore silicate gradient was still present, and concentrations >10 µmol L−1 were found inshore (Fig. 6). Phosphate concentrations higher than 2 µmol L−1 were seen only in September (Table 2), suggesting, along with the increased silicate, the presence of terrestrial runoff following the hurricane.
Oxygen–nitrate and oxygen–silicate covariance plots are shown in Fig. S5. High nitrate values at oxygen concentrations greater than 200 µmol L−1 in August and September (22–27 September) are from samples taken in low-salinity surface water; where oxygen concentrations were below 150 µmol L−1 the increase in nitrate concentration is caused by either regeneration over the shelf or the intrusion of deeper Subtropical Underwater. During these two cruises, higher nitrate and silicate concentrations were associated generally with lower oxygen concentrations (Fig. S5), although some surface samples on both cruises showed relatively high values, associated with salinities <35.
Quigg et al. (2011) state that DIN concentrations <1 µmol L−1 and a DIN:P ratio <10 indicate nitrogen limitation, with P<0.2 µmol L−1 and indicating P limitation and Si<2 µmol L−1, and showing Si limitation. As shown in Table 2, DIN:P and DIN:Si ratios for individual samples in the upper 30 m of the water column were low during all four cruises, with mean DIN:P being less than the 16:1 Redfield ratio throughout, while the mean DIN:Si ratio was >1 only on the August and September cruises. This suggests both nitrogen limitation throughout the period and possible silicate limitation of diatom growth during August and September despite the background levels of ammonia that contributed to the DIN concentration. While individual samples had higher ratios, these all occurred when either phosphate or silicate concentrations were measurable but very low in comparison with DIN concentrations (<0.1 µmol L−1 for P and <0.5 µmol L−1 for Si). The ratios of the mean concentrations of DIN across the region to the mean concentrations of P and Si (e.g., 3.01:1.07 for DIN:P in June) were 2.81 and 0.50, 5.69 and 0.73, 2.59 and 0.48, and 3.72 and 0.48 for the June, August, September and November cruises respectively, again suggesting nitrogen limitation.
3.6 Chlorophyll
Chlorophyll concentrations were examined using both in situ fluorescence data obtained during the cruises and satellite imagery from the MODIS sensor on the Aqua satellite (Fig. 7). The Texas coast and northwestern Gulf of Mexico were covered with clouds during the pre-Harvey and post-Harvey cruises; however a time history of four high-quality chlorophyll a images on 18 August (pre-Harvey), 2 September (6 d post-Harvey), and 11 and 16 September 2017 revealed shelf events between the two cruises closest to Harvey's landfall.
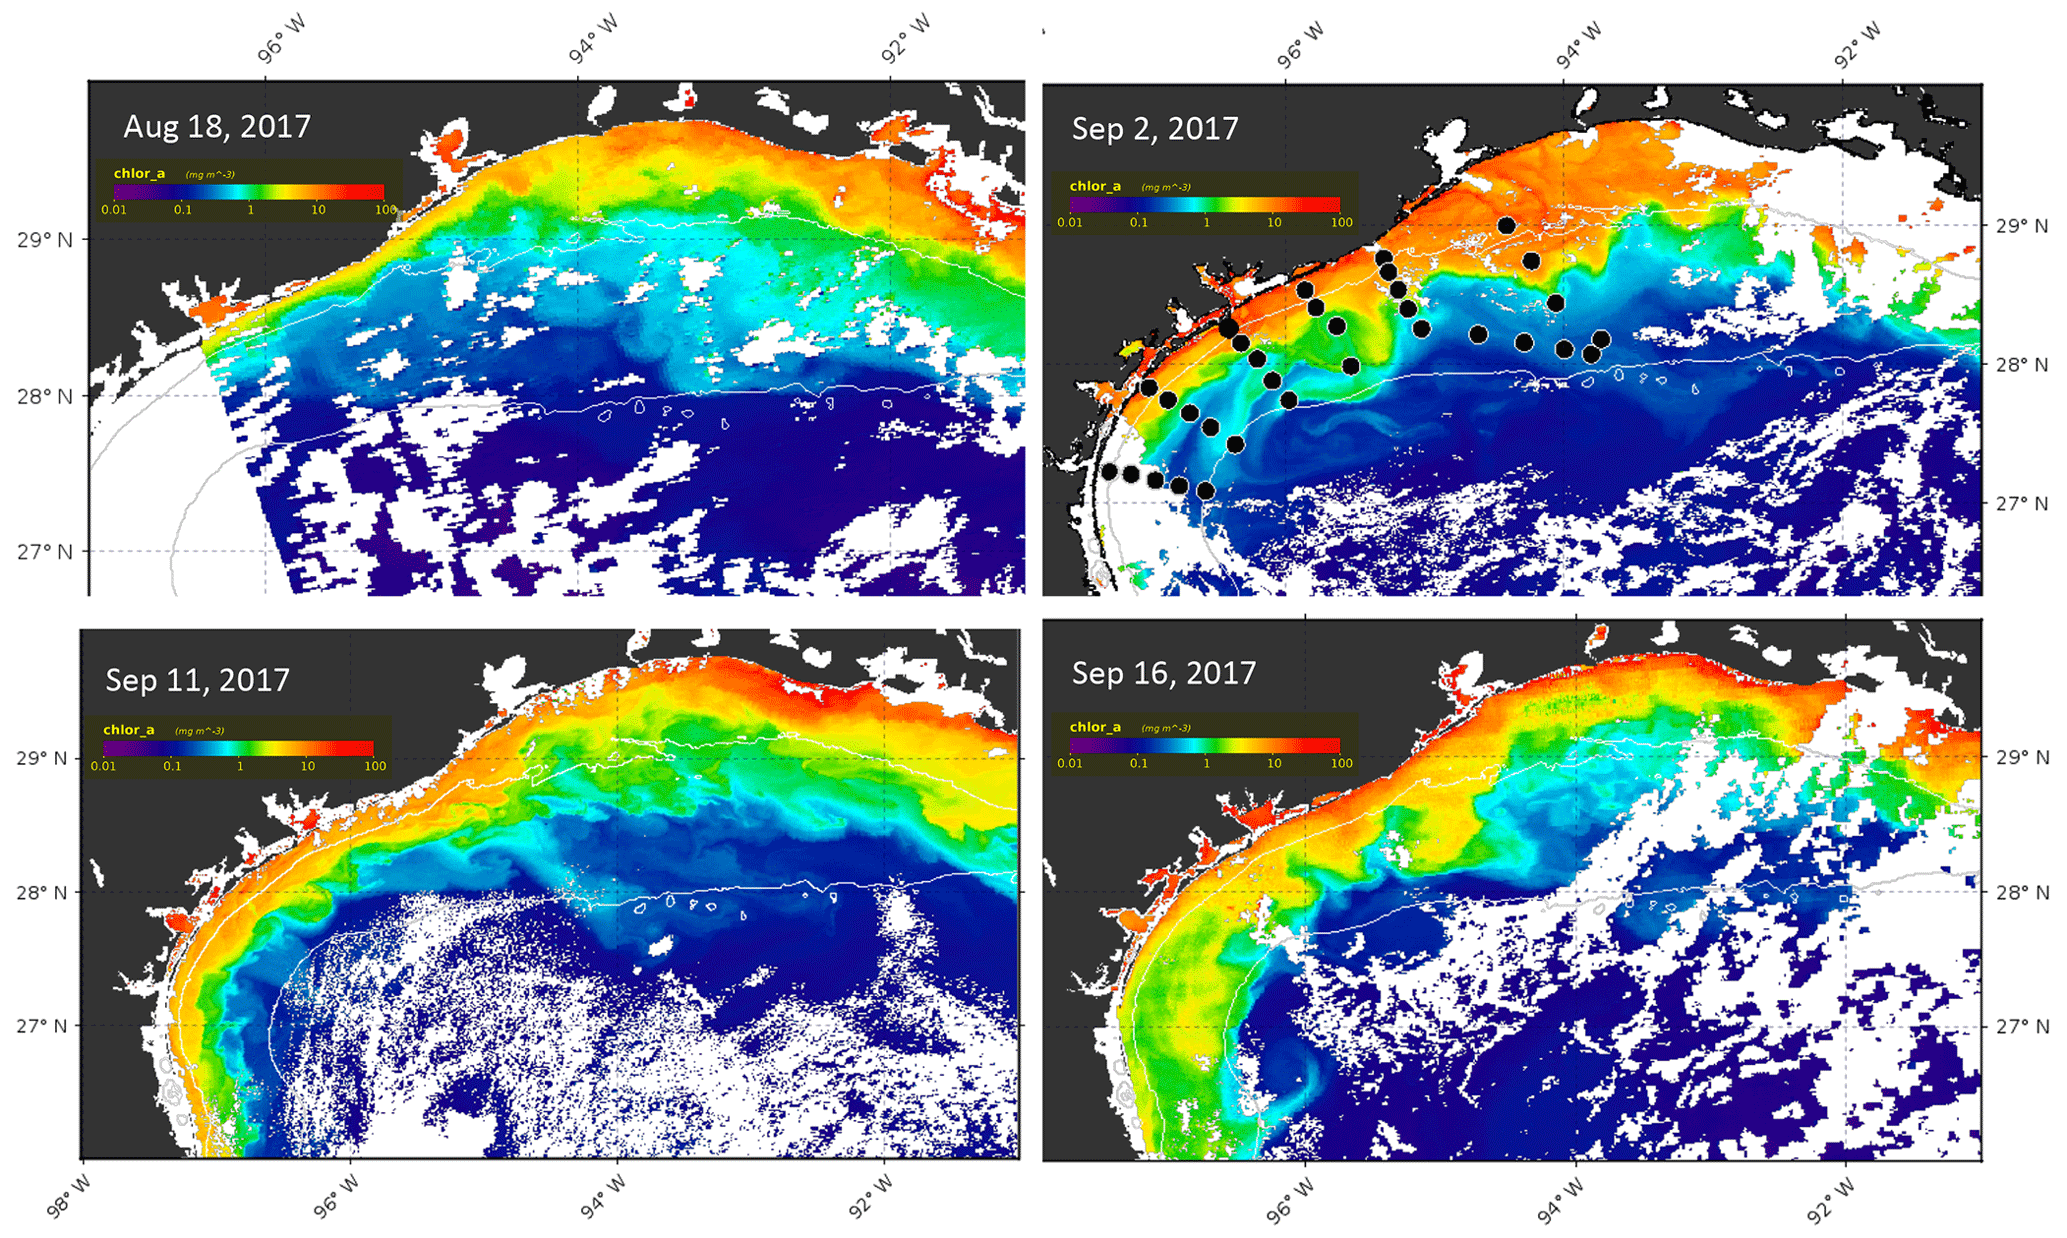
Figure 7Aqua-1 MODIS imagery depicting chlorophyll a estimates for 18 August and 2, 11 and 16 September 2017. White areas along the Louisiana shelf and offshore are clouds. Thin white lines denote 20 and 100 m isobaths. Station positions are indicated by the black dots in the 2 September image.
Fluorescence data (not shown) from the CTD casts taken during all cruises were almost invariably <1 mg m−3, especially in the upper mixed layer, suggesting little productivity immediately before or during the cruises. During the 22–27 September cruise only 4 of 37 stations had concentrations >1.0 mg m−3, while at 29 stations they were 0.5 mg m−3 or less. The highest surface concentration (1.7 mg m−3) was found inshore just south of Galveston Bay. Midwater maxima only exceeded 2 mg m−3 below 40 m depth at offshore stations 27 and 28. This is similar to summer conditions reported by Nowlin et al. (1998) and to previous data we have collected during summer cruises in the northern Gulf of Mexico; 3 d later, however, when the inshore stations were reoccupied, mean fluorescence values showed 1–2 mg m−3 at all inshore stations, with concentrations up to 4.8 mg m−3 immediately offshore of Galveston in the plume.
Satellite data, in contrast, showed considerably higher pigment values (Fig. 7). During mid-August, the highest concentrations and the maximum offshore extent of potential blooms were found off central Louisiana, within the 20 m isobath. The zone of pigmented water narrowed significantly from Sabine Lake (93.83∘ W) to Port Aransas Bay (97∘ W). This distribution likely resulted from the pre-storm advection of nutrients from the Atchafalaya and Mississippi rivers coupled with generally low summer flows from Texas rivers. By 2 September, the highest concentrations were detectable along the Texas coast from Sabine Lake to Corpus Christi Bay. The widest zone of pigmented water extended well beyond the 20 m isobath east, southeast and south of Galveston Bay. Maximum satellite-derived coastal chlorophyll a values near Galveston Bay were 16 mg m−3, decreasing offshore to 10 mg m−3 at the 20 m isobath and below 1 mg m−3 on the 100 m isobath (Fig. 8). During September, the zone of pigmented water on the shelf near Galveston initially retreated shoreward but moved offshore and southward later, with several lobes reaching the 100 m isobath, although concentrations were only about of those seen immediately after the storm.
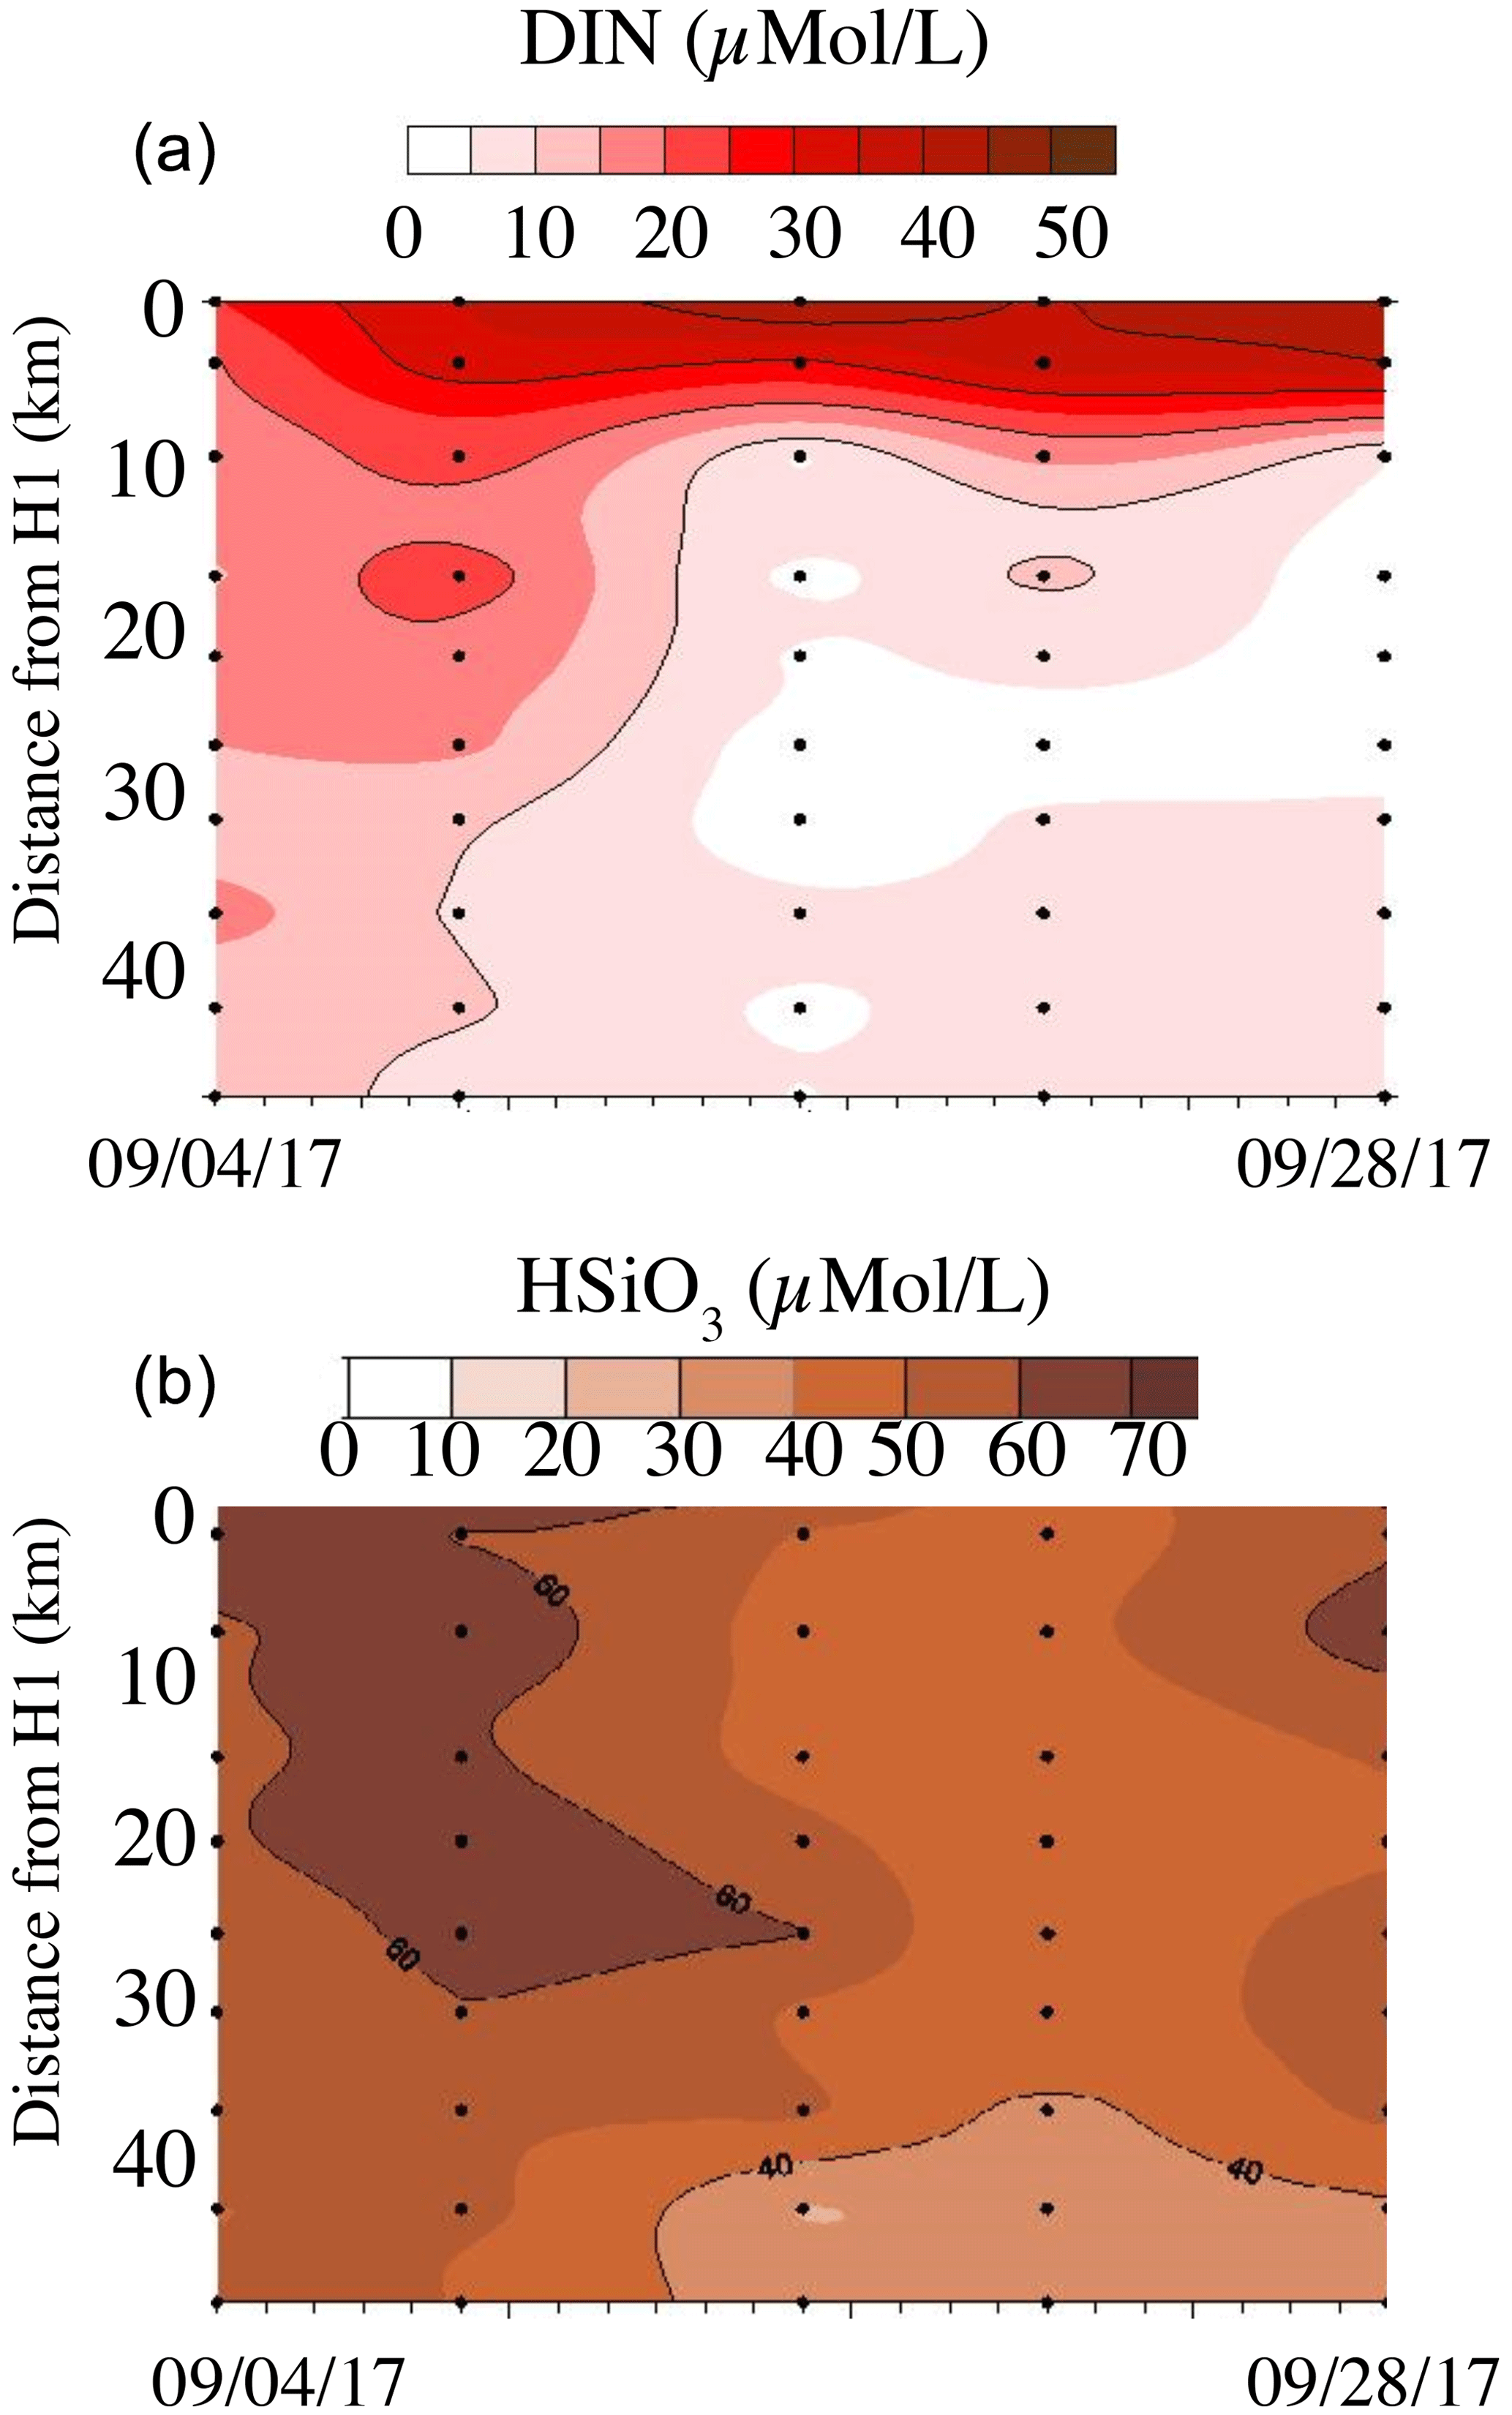
Figure 8Surface nitrate plus nitrite (a) and silicate (b) concentrations (µmol L−1) measured along a transect through Galveston Bay along the Houston Ship Channel (see Fig. 2b). Sampling dates were 4, 9, 16, 21 and 28 September 2017. Station H1 (0 km) was the innermost station in the bay; H10 was just outside the breakwater in the Gulf (see Steichen et al., 2020, for details).
Previous studies of the impacts of hurricanes on the coastal zone suggest that the extreme rainfall associated with such storms often leads to flushing of nutrients into the coastal bays and the offshore coastal zone, as found in Biscayne Bay, Florida, following Hurricane Katrina in 2005 (Zhang et al., 2009); in the Neuse River–Pamlico Sound system in North Carolina (Paerl et al., 2001, 2018; Peierls et al., 2003); in Chesapeake Bay (Roman et al., 2005); and in the Caribbean in 1998 following Hurricane Georges (Gilbes et al., 2001). In all these cases, short-lived phytoplankton blooms (2–3 weeks) resulted. It is also possible for offshore waters containing low oxygen concentrations and raised nutrient concentrations to be injected onto the shelf from offshore through upwelling. Chen et al. (2003), for example, while agreeing with Shiah et al. (2000) that terrestrial runoff was a factor in increased local coastal productivity following such storms in the East China Sea, suggested that the upwelling of subsurface Kuroshio water, thought to result from “a larger buoyancy effect caused by the rains as well as the shoreward movement of the Kuroshio caused by the typhoons”, was equally important and that the “cross-shelf upwelling of nutrient-rich Kuroshio water after the passage of typhoon Herb in a normally downwelling region” could even induce local hypoxia.
A third potential impact is local acidification resulting from the excessive rainfall in the coastal region, as reported by Manzello et al. (2013) and Gray et al. (2012). Hicks et al. (2022) showed that this occurred in Galveston Bay following Harvey, with the acidification lasting for 3 weeks and causing undersaturation of calcium carbonate that may have affected the recovery of local oyster reefs.
4.1 Oxygen and nutrient variability
Our data show very little sign of increased nutrient concentrations offshore, other than excess phosphate seen during the first September cruise. Since Texas bays are oligotrophic during the summer, the influx of fresh water resulted in higher concentrations of nutrients, particularly nitrate and silicate, as well as blooms of phytoplankton and cyanobacteria within the bays (Liu et al., 2019; Steichen et al., 2020). DIN concentrations, in particular, were greatly reduced 2 weeks after the hurricane had passed through the region and were back to normal conditions by November (Steichen et al., 2020; Fig. 8 herein; Jessica Fitzsimmons, personal communication, 2018), with concentrations above 5 µmol L−1 only found in the uppermost parts of the system after about 15 September. Silicate concentrations similarly dropped quickly within the first 2 weeks, although they remained above 40 µmol L−1 throughout Galveston Bay during the sampling period.
Following Hurricane Harvey, low-oxygen water containing <160 µmol L−1 and nitrate concentrations of >2 µmol L−1 penetrated further onto the shelf during September than during either August or November (Figs. 5 and S3). The high salinity of this water mass (>36; Fig. 5) suggests that it was Subtropical Underwater, which is found above 250 m in the northern Gulf of Mexico with typical core salinity of about 36.4–36.5 near 100 m depth in this region and oxygen and nitrate concentrations of about 110–150 and 6–15 µmol L−1 respectively (Nowlin et al., 1998). However, given the strong pycnocline shown by the salinity section (Fig. 5), there was little opportunity for these additional nutrients to reach the surface layer and affect phytoplankton production, and there is no evidence that such upwelling has resulted in hypoxia in the past in this region.
Further south, the Matagorda–San Antonio–Aransas–Corpus Christi Bay system also showed rapid short-term nutrient increases, followed in this case by hypoxia (Montagna et al., 2017; Walker et al., 2021), but nutrient concentrations here were back to pre-storm concentrations by early October (Walker et al., 2021). The levels in Guadeloupe Bay, an offshoot of San Antonio Bay, were followed at fortnightly intervals from mid-August to mid-October and showed a rapid increase in nitrate but slower increases in phosphate and silicate. This is not unexpected, given that nitrate does not bind readily to sediment particles or organo-iron complexes like phosphate and silicate (Lewin, 1961; Suess, 1981). Thus, it appears that the increases in nutrient concentrations affected mainly the coastal bays and estuaries rather than the offshore coastal zone. This backs up conclusions of Sahl et al. (1993) following a cruise along the Louisiana–Texas shelf in March 1989 when river discharges were at their highest levels during that year. They found that nutrients derived from bay systems dissipated within about 20 km of the bay mouths and that higher nutrient concentrations below 80 m depth resulted from upwelling along the shelf edge, in agreement with the work of Chen et al. (2003) and Walker et al. (2005).
Although nutrient fluxes were undoubtedly greatly increased immediately following the hurricane, nutrient concentrations in Texas rivers are only sampled infrequently, and data do not exist to allow us to calculate the overall fluxes during this period. However, the available data suggest that absolute concentrations did not change very much following the hurricane in most instances (Table 3). Coupled with the rapid decrease in river flow by about 7 September (Fig. S1), this suggests that excess nutrients in the bays and the coastal ocean were likely either taken up by phytoplankton (within the bays) or diluted (offshore) by the time of our survey in late September. Du et al. (2019) point out that while the salinity at the mouth of Galveston Bay was back to normal about 2 weeks after the storm, it took almost 2 months to recover at stations further inside the bay and the same time period at offshore buoys. Similar effects are likely at other bay sites along the Texas coast.
Table 3Nutrient concentrations in Texas rivers around the time of the hurricane (µmol L−1). Data taken from the USGS and the Texas Commission on Environmental Quality (TCEQ) Clean Rivers Program for individual river basins.

4.2 Salinity variability in the coastal zone
Salinity changes were recorded at offshore moorings during and following the storms. During the passage of the hurricane, the TABS moorings showed rapid decreases in salinity with a slow increase thereafter (data not shown). Buoy X (offshore) showed the least variability, with salinities remaining near 36.4 until 4 September 2017, dropping briefly to 35.3 but recovering to above 36 again by 6 September. Buoy D, inshore near Corpus Christi, also recorded salinities of about 36.6 until 23 August, dropping to 34.7 on 26 August, but were >36 a day later. Salinities dropped again on 29 August, remaining in the range of 32–34 until 6 September, after which they dropped again to below 30, where they remained until 24 October 2017, with a minimum salinity of 20.51 on 13 September. Further up the coast buoys B and F both experienced decreased salinities (buoy W did not record salinities during the passage of the hurricane). Before the hurricane, salinities in this region were in the range of 32.5–34.5, with the higher salinities offshore. Following the passage of the storm, buoy F recorded a minimum salinity of 15.25 on 1 September and salinities <20 until 6 September. A salinity of 30 was only recorded again here on 8 September. The inshore buoy B recorded minimum salinities in the range of 19–21 on 30 August. These remained <23 until 9 September and below 30 for the remainder of the month, after which they increased again to around 32. The fact that the minimum salinity was recorded at the offshore mooring is presumably related to the strength of the plume emanating from Galveston Bay with enough momentum to overcome the Coriolis force that would tend to push it to the southwest close to the coast (Du et al., 2019).
These data suggest a slow southward movement of low-salinity water along the coast (see Fig. 4c and d) after the hurricane as the coastal current was re-established. The easterly winds during almost the whole of September assisted this downcoast movement, as described by Cochrane and Kelly (1986). Mixing during the infrequent northerly wind bursts caused salinities to increase again, although even in November salinities below 30 were still seen between Galveston Bay and Matagorda–Corpus Christi bays (Fig. 4e).
4.3 Chlorophyll variability
Assuming that chlorophyll a can be used as a proxy for phytoplankton productivity along the Texas shelf and slope, we can use the MODIS satellite data to show how the phytoplankton biomass varied following the hurricane. The prevailing currents during the latter half of September (Fig. 3) would have moved the pigment concentrations further south and offshore, where they decreased. Since our first post-storm cruise occurred between 22–27 September, we would have missed the maximum extent of any offshore nutrient maximum and its associated bloom. Given the potential discrepancy between satellite-derived and in situ values from CDOM interference in the satellite estimates, however, we believe the higher concentrations in early September shown in Fig. 7 result largely from the hurricane stirring up bottom sediments in the shallow coastal zone, and there was no evidence for upwelled nutrients resulting in blooms at the shelf edge, as reported off Louisiana following Hurricane Ivan in 2004 (Walker et al., 2005) or in the East China Sea by Chen et al. (2003). The accumulation of highly pigmented water between Galveston Bay and Calcasieu Lake (93.45∘ W) in the 2 September image likely resulted from convergence of the downcoast Louisiana river waters (Quigg et al., 2011) with upcoast hurricane-related discharges from Texas, as surface currents at TABS buoy B were offshore and decreased from ∼75 to 20 cm s−1 during the period from 30 August to 3 September (Fig. 3).
4.4 Why was there no hypoxia following Harvey?
Although September is normally the month when the passage of the storm front causes seasonal hypoxia (oxygen concentrations <62 µmol L−1) in the northern Gulf of Mexico to end, the strong stratification resulting from the freshwater input might have been expected to reduce oxygen concentrations below the pycnocline. Rabalais et al. (1999) state that hypoxia can in fact occur in almost any month if conditions, particularly stratification, are right. Hypoxia in the northern Gulf of Mexico has three requirements: a high supply of nutrients, especially nitrogen, from rivers or other terrestrial runoff; stable stratification with a midwater pycnocline; and relatively low-wind conditions (Bianchi et al., 2010; Rabalais et al., 2007; Wiseman et al., 1997). While the most intense hypoxia occurs over the Louisiana shelf (Rabalais et al., 1999), dissolved oxygen levels below 30 µmol L−1 have been detected during NOAA Southeast Area Monitoring and Assessment Program (SEAMAP) cruises as far west as 96∘ W, with occasional samples between 30–60 µmol L−1 identified near Corpus Christi (see https://www.ncei.noaa.gov/maps/gulf-data-atlas/atlas.htm, last access: 16 July 2020), as well as following local flood events (DiMarco et al., 2012; Kealoha et al., 2020), and bacteria from terrestrial sources have been found in sponges at the Flower Gardens Banks National Marine Sanctuary near 28∘ N, 29.5∘ W (Shore et al., 2021).
While Texas hypoxia is typically linked to southwestward advection from the Mississippi and Atchafalaya rivers, high flow rates from local rivers have also been implicated (Harper et al., 1981; Pokryfki and Randall, 1987; DiMarco et al., 2012). During the passage of Hurricane Harvey, the torrential rainfall led to runoff that created a stable pycnocline, and calm conditions after the storm meant that phytoplankton growth was possible. On the Louisiana shelf, stratification is re-established within a few days of the passage of storm fronts or hurricanes, and bottom water oxygen depletion can begin rapidly once the storm has passed (e.g., Bianchi et al., 2010; Jarvis et al., 2021). However, despite the strong stratification after Harvey, we found no obvious signs of hypoxia over the Texas shelf, nor any increased nutrient concentrations, other than phosphate, in coastal water. Plotting the difference in salinity between surface and bottom samples, a measure of water column stability (DiMarco et al., 2012), against bottom oxygen concentrations during the September cruise gave only a low correlation, with R2=0.15 (n=38), as opposed to the 0.79 (n=14) reported in 2007 by DiMarco et al. (2012). This suggests that stratification by itself was not responsible for the observed bottom oxygen concentrations over the shelf following Harvey.
The lack of hypoxia following Hurricane Harvey can therefore perhaps be explained by four factors. First, only a limited flux of nutrients made it out of the bays and into the coastal zone, where they were likely taken up rapidly by phytoplankton in the oligotrophic coastal waters, as seen elsewhere. Additionally, southward and offshore advection of low-salinity runoff increased the rate of dilution through mixing with pre-existing low-nutrient surface shelf water. The largest bay systems have relatively narrow entrances, which reduce the rate at which the fresh water can escape; the main entrance to Galveston Bay, which includes the deep, dredged Houston Ship Channel, is only 2.3 km wide, and the turnover time for water is 15–60 d under normal conditions, with shorter periods coinciding with flood conditions (Solis and Powell, 1999; Rayson et al., 2016). Thyng et al. (2020) have estimated that the flushing of Galveston Bay during Hurricane Harvey took only 2–3 d following the initial heavy rainfall. For the Corpus Christi Bay–Aransas Bay system the turnover time under normal conditions is estimated to be more than 300 d (Solis and Powell, 1999), similar to Pamlico Sound (Paerl et al., 2001).
Second, the sheer volume of water rapidly removed available soluble nutrients within the first few hours so that runoff later during the storm was essentially pure rainwater. It is known that large percentages of available nutrients are removed in stormwater runoff in the first minutes or hours following a downpour, and concentrations then drop (e.g., Cordery, 1977; Horner et al., 2007; Fellman et al., 2008). Similar effects have been reported for trace metals in the floodplain of the Pearl River in Mississippi (Shim et al., 2017), where maximum downstream concentrations were not found following peak flows. These authors suggested that the rapid flushing overwhelmed the rate at which soluble metal–organic complexes could be regenerated. As the hurricane occurred in late summer, any nutrients applied to cropland along the Texas coastline in spring would largely have been taken up by the vegetation and so be unavailable for washout. While Corpus Christi (population ∼325 000) and Houston (∼4 million) are large-population centers with multiple sewage treatment plants that flooded following the hurricane, both are sited upstream of large bay systems that would have attenuated the speed at which stormwater runoff dissipated. The rate of change in nutrient concentrations in Galveston Bay (Fig. 8) shows that uptake within the bay system was likely considerably more important than flushing, even with the apparently short flushing time calculated by Thyng et al. (2020).
While nutrient flushing was reduced following the hurricane, the same is unlikely to be true for sediment. As shown in Fig. S2 and as discussed by D'Sa et al. (2018), Du et al. (2019) and Steichen et al. (2020), large sediment plumes occurred off the mouths of major bays and rivers. The heavy sediment loads would have both increased the turbidity of the water column and thereby reduced light intensity in the euphotic zone and led to reduced phosphate concentrations as phosphate is known to bind to sediment particles (e.g., Suess, 1981). Both factors would have contributed to reduced phytoplankton production, a major factor in hypoxia formation (Bianchi et al., 2010). While phosphate concentrations in the coastal zone were highest during the first September cruise, suggesting at least some terrestrial runoff immediately following the hurricane and possibly desorption from suspended sediment, the low nitrate concentrations seen during this cruise and the low chlorophyll fluorescence suggest only a short-term phytoplankton bloom at most, again similar to previous observations (e.g., Roman et al., 2005).
The final potential control is sediment composition along the Texas shelf. Most sediments in this region are coarse and sandy and contain little organic matter (Hedges and Parker, 1974). This is in contrast to the Louisiana shelf, where muddy, organic sediments are quite common and act as a reservoir of material that can continue to reduce oxygen concentrations once stratification is established (Bianchi et al., 2010; Corbett et al., 2006; Eldridge and Morse, 2008; Turner et al., 2008). This is especially true within coastal embayments, such as Terrebonne Bay, LA, where the organic carbon content can exceed 5 % thanks to organic matter input from the surrounding marshes and swamps (Hedges and Parker, 1974; Bianchi et al., 2009, 2010). Even near the Mississippi and Atchafalaya rivers, however, typical organic carbon sediment content on the shelf is generally <2 % (Gordon and Goni, 2004; Gearing et al., 1977), while further west off the Texas coast it is typically <1 % (Hedges and Parker, 1974; Bianchi et al., 1997). This suggests that organic matter along the Texas shelf is refractory and less likely to add to any oxygen demand and that hypoxia on the Texas shelf is generally driven by water column respiration as discussed by Hetland and DiMarco (2008). In this region stratification alone is not sufficient to bring about hypoxic conditions in the absence of high nutrient concentrations and phytoplankton blooms.
Although Hurricane Harvey led to pronounced flooding and exceptional freshwater runoff along the Texas coast, it did not lead to lasting high nutrient concentrations offshore, largely because of dilution by the rainfall, the likely rapid uptake by phytoplankton of nutrients within the bays and mixing with oligotrophic coastal water. While the most pronounced changes in nutrient concentrations were seen in the coastal bays, changes from background levels were short-lived, and conditions were essentially back to normal by November, some 8 weeks after the hurricane, following northerly wind bursts that caused mixing within the water column. There was also no evidence of low-oxygen water upwelled by the hurricane reaching the inner shelf from offshore, as suggested following hurricanes elsewhere. While an apparent transient bloom of phytoplankton was observed in satellite imagery offshore following the hurricane, its short existence and the potential for contamination of satellite estimates by CDOM suggest that hypoxia could not develop despite the stratification because nutrient concentrations were too low to support continued phytoplankton productivity. Similarly, the lack of an organic matter reservoir in the shelf sediments means there is no additional oxygen demand in Texas bottom waters, and hypoxia here depends on water column decomposition.
Data are available at the Biological and Chemical Oceanography Data Management Office (BCO-DMO; https://doi.org/10.26008/1912/bco-dmo.809428.1, Campbell et al., 2021; https://doi.org/10.1575/1912/bco-dmo.784290.1, Campbell and Henrichs, 2020).
The supplement related to this article is available online at: https://doi.org/10.5194/os-19-209-2023-supplement.
The project was conceptualized by SFD and AHK; PC and SFD conducted investigations on all cruises and collected and analyzed the initial data; AQ provided data from Galveston Bay; NDW provided satellite imagery. PC wrote the initial draft; all authors provided comments and edits. The authors declare that they have no conflict of interest.
The contact author has declared that none of the authors has any competing interests.
Funding sources had no
involvement in study design, data collection and interpretation, or
manuscript preparation.
Publisher's note: Copernicus Publications remains neutral with regard to jurisdictional claims in published maps and institutional affiliations.
We are grateful to the captains and crews of the RV Manta and RV Point Sur for their excellent service during the cruises. We are also grateful for the enthusiasm of the students and technicians who helped with data collection. We thank Ysabel Wang and Jamie Steichen for help with the figures and Alaric Haag for assistance with SeaDAS image processing. Nan D. Walker and Alaric Haag thank the Gulf of Mexico Coastal Ocean Observing System (GCOOS) for funding LSU Earth Scan Laboratory activities. Bathymetry shown in satellite imagery was provided by the GEBCO Compilation Group (2020) GEBCO 2020 Grid (https://doi.org/10.5285/a29c5465-b138-234d-e053-6c86abc040b9).
This research has been supported by the Texas Governor's Fund through the Texas OneGulf Center of Excellence and an NSF RAPID award (OCE-1760381) to Anthony H. Knap, Piers Chapman and Steven F. DiMarco. Anthony H. Knap received financial support from the G. Unger Vetlesen Foundation (grant no. 500524-200000). The TABS system is funded by the Texas General Land Office and operated by the TAMU Geochemical and Environmental Research Group.
This paper was edited by Mario Hoppema and reviewed by Alan Shiller and one anonymous referee.
Ahn, J. H., Grant, S. B., Surbeck, C. Q., DiGiacomo, P. M., Nexlin, N., and Jiang, S.: Coastal water quality impact of stormwater runoff from an urban watershed in southern California, Environ. Sci. Technol., 39, 5940–5963, https://doi.org/10.1021/es0501464, 2005.
Balaguru, K., Foltz, G. R., and Leung, L. R.: Increasing magnitude of hurricane rapid intensification in the central and eastern tropical Atlantic, Geophys. Res. Lett., 45, 4238–4247, https://doi.org/10.1029/2018GL077597, 2018.
Bianchi, T. S., Lambert, C. D., Santschi, P. H., and Guo, L.: Sources and transport of land-derived particulate and dissolved organic matter in the Gulf of Mexico (Texas slope/shelf): The use of lignin-phenols and loliolides as biomarkers, Org. Geochem., 27, 65–78, https://doi.org/10.1016/S0146-6380(97)00040-5, 1997.
Bianchi, T. S., DiMarco, S. F., Smith, R. W., and Schreiner, K. M.: A gradient of dissolved organic carbon and lignin from Terrebonne-Timbalier Bay estuary to the Louisiana shelf (USA), Mar. Chem., 117, 32–41, https://doi.org/10.1016/j.marchem.2009.07.010, 2009.
Bianchi, T. S., DiMarco, S. F., Cowan, J. H., Hetland, R. D., Chapman, P., Day, J. W., and Allison, M. A.: The science of hypoxia in the northern Gulf of Mexico: A review, Sci. Total Environ., 408, 1471–1484, https://doi.org/10.1016/j.scitotenv.2009.11.047, 2010.
Blake, E. S. and Zelinsky, D. A.: Hurricane Harvey, NOAA National Hurricane Center Tropical Cyclone Report AL092017, 2018.
Campbell, L. and Henrichs, D. W.: Hydrographic, nutrient and oxygen data from CTD bottles and beam transmission and fluorescence data from CTD profiles during R/V Point Sur PS1809 (HRR legs 1, 2, 3) at the Gulf of Mexico, Louisiana and Texas coast, September–October 2017, WHOAS [data set], https://doi.org/10.1575/1912/bco-dmo.784290.1, 2020.
Campbell, L., Knap, A., DiMarco, S., and Henrichs, D. W.: Processed CTD profile data from all electronic sensors mounted on rosette from R/V Pt. Sur PS 18–09 Legs 01 and 03, Hurricane Harvey RAPID Response cruise (western Gulf of Mexico) September–October 2017, WHOAS [data set], https://doi.org/10.26008/1912/bco-dmo.809428.1, 2021.
Chen, C.-T. A., Liu, C.-T., Chuang, W. S., Yang, Y. J., Shiah, F.-K., Tang, T. Y., and Chung, S. W.: Enhanced buoyancy and hence upwelling of subsurface Kuroshio waters after a typhoon in the southern East China Sea, J. Marine Syst, 42, 65–79, https://doi.org/10.1016/S0924-7963(03)00065-4, 2003.
Cochrane, J. D. and Kelly, F. J.: Low-frequency circulation on the Texas-Louisiana continental shelf, J. Geophys. Res., 91, 10645–10659, https://doi.org/10.1029/JC091iC09p10645, 1986.
Corbett, D. R., McKee, R. A., and Allison, M. A.: Nature of decadal-scale sediment accumulation in the Mississippi River deltaic region, Cont. Shelf Res., 26, 2125–2140, https://doi.org/10.1016/j.csr.2006.07.012, 2006.
Cordery, I.: Quality characteristics of urban storm water in Sydney, Australia, Water Resour. Res., 13, 197–202, https://doi.org/10.1029/WR013i001p00197, 1977.
De Carlo, E., Hoover, D. J., Young, C. W., Hoover, R. S., and Mackenzie, F. T.: Impact of storm runoff from tropical watersheds on coastal water quality and productivity, Appl. Geochem., 22, 1777–1797, https://doi.org/10.1016/j.apgeochem.2007.03.034, 2007.
DiMarco, S. F. and Zimmerle, H. M.: MCH Atlas: Oceanographic Observations of the Mechanisms Controlling Hypoxia Project, Texas A&M University, Texas Sea Grant Publication TAMU-SG-17-601, 300 pp., ISBN 978-0-692-87961-0, plates also available online at: http://mchatlas.tamu.edu (last access: 23 February 2023), 2017.
DiMarco, S. F., Strauss, J., May, N., Mullins-Perry, R. L., Grossman, E., and Shormann, D.: Texas coastal hypoxia linked to Brazos River discharge as revealed by oxygen isotopes, Aquat. Geochem., 18, 159–181, https://doi.org/10.1007/s10498-011-9156-x, 2012.
D'Sa, E., Joshi, I., and Liu, B.: Galveston Bay and coastal ocean optical-geochemical response to Hurricane Harvey from VIIRS ocean color, Geophys. Res. Lett., 45, 10579–10589, https://doi.org/10.1029/2018GL079954, 2018.
Du, J., Park, K., Dellapenna, T. M., and Clay, J. C.: Dramatic hydrodynamic and sedimentary responses in Galveston Bay and adjacent inner shelf to Hurricane Harvey, Sci. Total Environ., 653, 554–564, https://doi.org/10.1016/j.scitotenv.2018.10.403, 2019.
Eldridge, P. M. and Morse, J. W.: Origins and temporal scales of hypoxia on the Louisiana shelf: importance of benthic and sub-pycnocline water column metabolism, Mar. Chem., 108, 159–171, https://doi.org/10.1016/j.marchem.2007.11.009, 2008.
Emanuel, K.: Assessing the present and future probability of Hurricane Harvey's rainfall, P. Natl. Acad. Sci. USA, 114, 12681–12684, https://doi.org/10.1073/pnas.1716222114, 2017.
Fellman, J. B., Hood, E., Edwards, R. T. and D'Amore, D. V.: Return of salmon-derived nutrients from the riparian zone to the stream during a storm in southeastern Alaska, Ecosystems, 11, 537–544, https://doi.org/10.1007/s10021-008-9139-y, 2008.
Fritz, A. and Samenow, J.: Harvey Unloaded 33 Trillion Gallons of Water in the U. S., The Washington Post, https://www.washingtonpost.com/news/capital-weather-gang/wp/2017/08/30/harvey-has-unloaded-24-5-trillion-gallons-of-water-on-texas-and-louisiana/ (last access: 11 December 2019), 2 September 2017.
Gearing, P., Plucker, F. T., and Parker, P. L.: Organic carbon stable isotope ratios of continental margin sediments, Mar. Chem., 5, 251–266, https://doi.org/10.1016/0304-4203(77)90020-2, 1977.
Gilbes, F., Armstrong, R. A., Webb, R. M. T., and Muller-Karger, F. E.: SeaWiFS helps assess hurricane impact on phytoplankton in Caribbean Sea, EOS T. Am. Geophys. Un., 82, 529, 533, https://doi.org/10.1029/01EO00314, 2001.
Gordon, E. S. and Goni, M. A.: Controls on the distribution and accumulation of terrigenous organic matter in sediments from the Mississippi and Atchafalaya river margin, Mar. Chem., 92, 331–352, https://doi.org/10.1016/j.marchem.2004.06.035, 2004.
Gray, S. E. C., DeGrandpre, M. D., Langsdon, C., and Corredor, J. E.: Short-term and seasonal pH, pCO2 and saturation state variability in a coral reef ecosystem, Global Biogeochem. Cy., 26, GB3012, https://doi.org/10.1029/2011GB004114, 2012.
Harper Jr., D. E., Salzer, R. R., and Case, R. J.: The occurrence of hypoxic bottom water off the upper Texas coast and its effect on the benthic biota, Contrib. Mar. Sci., 24, 53–79, 1981.
Hedges, J. I. and Parker, P. L.: Land-derived organic matter in surface sediments from the Gulf of Mexico, Geochim. Cosmochim. Ac., 40, 1019–1029, https://doi.org/10.1016/0016-7037(76)90044-2, 1974.
Hetland, R. D. and DiMarco, S. F.: How does the character of oxygen demand control the structure of hypoxia on the Texas-Louisiana continental shelf?, J. Marine Syst., 70, 49–62, https://doi.org/10.1016/j.jmarsys.2007.03.002, 2008.
Hicks, T. L., Shamberger, K. E. F., Fitzsimmons, J. N., Jensen, C. C., and DiMarco, S. F.: Tropical cyclone-induced coastal acidification in Galveston Bay, Texas, Commun. Earth Environ., 3, 297, https://doi.org/10.1038/s43247-022-00608-1, 2022.
Horner, R. R., Skupien, J. J., Livingston, E. H., and Shaver, H. E.: Fundamentals of urban runoff management: Technical and institutional issues, 2nd Edn., Terrene Institute, Washington, D.C., https://ilma-lakes.org/PDF/Fundamentals_full_manual_lowres.pdf (last access: 23 February 2023), 2007.
Jarvis, B. M., Greene, R. M., Wan, Y., Lehrter, J. C., Lowe, L. L., and Ko, D. S.: Contiguous low oxygen waters between the continental shelf hypoxia zone and nearshore coastal waters of Louisiana, USA: interpreting 30 years of profiling data and three-dimensional ecosystem modeling, Environ. Sci. Technol., 55, 4709–4719, https://doi.org/10.1021/acs.est.0c05973, 2021.
Kealoha, A. K., Doyle, S. M., Shamberger, K. E. F., Sylvan, J. B., Hetland, R. D., and DiMarco, S. F.: Localized hypoxia may have caused coral reef mortality at the Flower Garden Banks, Coral Reefs, 39, 119–132, https://doi.org/10.1007/s00338-019-01883-9, 2020.
Lewin, J. C.: The dissolution of silica from diatom walls, Geochim. Cosmochim. Ac., 21, 182–198, 1961.
Liu, B., D'Sa, E. J., and Joshi, I. D.: Floodwater impact on Galveston Bay phytoplankton taxonomy, pigment composition and photo-physiological state following Hurricane Harvey from field and ocean color (Sentinel-3A OLCI) observations, Biogeosciences, 16, 1975–2001, https://doi.org/10.5194/bg-16-1975-2019, 2019.
Mallin, M. A. and Corbett, C. A.: How hurricane attributes determine the extent of environmental effects: multiple hurricanes and different coastal systems, Estuar. Coast., 29, 1046–1061, https://doi.org/10.1007/BF02798667, 2006.
Manzello, D., Enochs, I., Musielewicz, S., Carlton, R., and Gledhill, D.: Tropical cyclones cause CaCO3 undersaturation of coral reef seawater in a high-CO2 world, J. Geophys. Res.-Oceans, 118, 5312–5321, https://doi.org/10.1002/jgrc.20378, 2013.
Montagna, P., Hu, X., Walker, L., and Wetz, M.: Biogeochemical impact of Hurricane Harvey on Texas coastal lagoons, AGU Fall Meeting, Abstract #NH23E-2797, 11–15 November 2017, New Orleans, 2017.
Nowlin Jr., W. D., Jochens, A. E., Reid, R. O., and DiMarco, S. F.: Texas-Louisiana Shelf Circulation and Transport Processes Study: Synthesis Report, PCS Study MMS 98-0035, U. S. Department of the Interior, Minerals Management Service, Gulf of Mexico OCS Region, New Orleans, LA, https://digital.library.unt.edu/ark:/67531/metadc955396/ (last access: 23 February 2023), 1998.
Paerl, H. W., Bales, J. D., Ausley, L. W., Buzzelli, C. P., Crowder, L. B., Eby, L. A., Fear, J. M., Go, M., Peierls, B. L., Richardson, T. L., and Ramus, J. S.: Ecosystem impacts of three sequential hurricanes (Dennis, Floyd, and Irene) on the United States' largest lagoonal estuary, PamlicoSound, NC, P. Natl. Acad. Sci. USA, 98, 5655–5660, https://doi.org/10.1073/pnas.101097398, 2001.
Paerl, H. W., Valdes, L. M., Joyner, A. R., Peierls, B. L., Piehler, M. F., Riggs, S. R., Christian, R. R., Eby, L. A., Crowder, L. B., Ramus, J. S., Clesceri, E. J., Buzzelli, C. P., and Luettich, R. A.: Ecological response to hurricane events in the Pamlico Sound system, North Carolina, and implications for assessment and management in a regime of increased frequency, Estuar. Coast., 29, 1033–1045, https://doi.org/10.1007/BF02798666, 2006.
Paerl, H. W., Crosswell, J. R., Van Dam, B., Hall, N. S., Rossignol, K. L., Osburn, C. L., Hounshell, A. G., Sloup, R. S., and Harding Jr., L. W.: Two decades of tropical cyclone impacts on North Carolina's estuarine carbon, nutrient and phytoplankton dynamics: implications for biogeochemical cycling and water quality in a stormier world, Biogeochemistry, 141, 307–332, https://doi.org/10.1007/s10533-018-0438-x, 2018.
Peierls, B. L., Christian, R. R., and Paerl, H. W.: Water quality and phytoplankton as indicators of hurricane impacts on a large estuarine system, Estuaries, 26, 1329–1343, https://doi.org/10.1007/BF02803635, 2003.
Pokryfki, L. and Randall, R. E.: Nearshore hypoxia in the bottom water of the northwestern Gulf of Mexico from 1981 to 1984, Mar. Environ. Res., 22, 75–90, https://doi.org/10.1016/0141-1136(87)90081-X, 1987.
Potter, H., DiMarco, S. F., and Knap, A. H.: Tropical cyclone heat potential and the rapid intensification of hurricane Harvey in the Texas Bight, J. Geophys. Res.-Oceans, 124, 2440–2451, https://doi.org/10.1029/2018JC014776, 2019.
Quigg, A., Sylvan, S. B., Gustafson, A. B., Fisher, T. R., Oliver, R. L., Tozzi, S., and Ammerman, J. W.: Going West: nutrient limitation of primary production in the northern Gulf of Mexico and the importance of the Atchafalaya River, Aquat. Geochem., 17, 519–544, https://doi.org/10.1007/s10498-011-9134-3, 2011.
Rabalais, N. N., Turner, R. E., Justic, D., Dortch, Q., and Wiseman Jr., W. J.: Characterization of Hypoxia: Topic 1 Report for the Integrated Assessment of Hypoxia in the Gulf of Mexico, NOAA Coastal Ocean Program Decision Analysis Series no. 15, NOAA Coastal Ocean Program, Silver Spring, Maryland, 1999.
Rabalais, N. N., Turner, R. E., Sen Gupta, B. K., Boesch, D. F., Chapman, P., and Murrell, M. C.: Hypoxia in the northern Gulf of Mexico: Does the science support the plan to reduce, mitigate and control hypoxia?, Estuar. Coast., 30, 753–772, https://doi.org/10.1007/BF02841332, 2007.
Rayson, M. D., Gross, E. S., Hetland, R. D., and Fringer, O. B.: Time scales in Galveston Bay: an unsteady estuary, J. Geophys. Res.-Oceans, 121, 2268–2285, https://doi.org/10.1002/2015JC011181, 2016.
Roman, M. R., Adolf, J. E., Bichy, J., Boicourt, W. C., Harding, L. W., Houde, E. D., Jung, S., Kimmel, D. G., Miller, W. D., and Zhang, X.: Chesapeake Bay plankton and fish abundance enhanced by Hurricane Isabel, EOS T. Am. Geophys. Un., 86, 261–265, https://doi.org/10.1029/2005EO280001, 2005.
Sahl, L. E., Merrell, W. J., and Biggs, D. C.: The influence of advection on the spatial variability of nutrient concentrations on the Texas-Louisiana continental shelf, Cont. Shelf Res., 13, 233–251, https://doi.org/10.1016/0278-4343(93)90108-A, 1993.
Shiah, F. K., Chang, S. W., Kao, S. J., Gong, G. C., and Liu, K. K.: Biological and hydrographical responses to tropical cyclones (typhoons) in the continental shelf of the Taiwan Strait, Cont. Shelf Res., 20, 2029–2044, https://doi.org/10.1016/S0278-4343(00)00055-8, 2000.
Shim, M. J., Cai, Y., Guo, L, and Shiller, A. M.: Floodplain effects on the transport of dissolved and colloidal trace elements in the East Pearl River, Mississippi, Hydrol. Process., 31, 1086–1099, https://doi.org/10.1002/hyp.11093, 2017.
Shore, A., Sims, J. A., Grimes, M., Howe-Kerr, L. I., Grupstra, C. G. B., Doyle, S. M., Stadler, L., Sylvan, J. B., Shamberger, K. E. F., Davies, S. W., Santiago-Vazquez, L. Z., and Correa, A. N. S.: On a reef far, far away: Anthropogenic impacts following extreme storms affect sponge health and bacterial communities, Front. Mar. Sci., 8, 608036, https://doi.org/10.3389/fmars.2021.608036, 2021.
Solis, G. S. and Powell, G. L.: Hydrography, mixing characteristics, and residence times of Gulf of Mexico estuaries, in: Biogeochemistry of Gulf of Mexico Estuaries, edited by: Bianchi, T. S., Pennock, J. R., and Twilley, R. R., John Wiley, NY, 29–61, ISBN 0-471-16174-8, 1999.
Steichen, J. L., Labonte, J. M., Windham, R., Hala, D., Kaiser, K., Setta, S., Faulkner, P. C., Bacosa, H., Yan, G., Kamalanathan, M., and Quigg, A.: Microbial, physical and chemical changes in Galveston Bay following an extreme flood event, Hurricane Harvey, Front. Mar. Sci., 7, 186, https://doi.org/10.3389/fmars.2020.00186, 2020.
Suess, E.: Phosphate regeneration from sediments of the Peru continental margin by dissolution of fish debris, Geochim. Cosmochim. Ac., 45, 577–588, https://doi.org/10.1016/0016-7037(81)90191-5, 1981.
Sylvan, J. B., Dortch, Q., Nelson, D. M., Brown, A. F. M., Morrison, W., and Ammerman, J. W.: Phosphorus limits phytoplankton growth on the Louisiana shelf during the period of hypoxia formation, Environ. Sci. Technol., 40, 7548–7553, https://doi.org/10.1021/es061417t, 2006.
Sylvan, J. B., Quigg, A., Tozzi, S., and Ammerman, J. W.: Eutrophication induced phosphorus limitation in the Mississippi River plume: evidence from fast repetition rate fluorometry, Limnol. Oceanogr., 52, 2679–2685, https://doi.org/10.4319/lo.2007.52.6.2679, 2007.
Thyng, K. M., Hetland, R. D., Socolofsky, S. A., Fernando, N., Turner, E. L., and Schoenbaechler, C.: Hurricane Harvey caused unprecedented freshwater inflow to Galveston Bay, Estuar. Coast., 43, 1836–1852, https://doi.org/10.1007/s12237-020-00800-6, 2020.
Trenberth, K. E., Chang, L., Jacobs, P., Zhang, Y., and Fasullo, J.: Hurricane Harvey links to ocean heat content and climate change adaptation, Earths Future, 6, 730–744, https://doi.org/10.1029/2018EF000825, 2018.
Turner, R. E., Rabalais, N. N., and Justic, D.: Gulf of Mexico hypoxia: Alternate states and a legacy, Environ. Sci. Technol., 42, 2323–2327, https://doi.org/10.1021/es071617k, 2008.
Walker, L. M., Montagna, P. A., Hu, X., and Wetz, M. S.: Timescales and magnitude of water quality change in three Texas estuaries induced by passage of Hurricane Harvey, Estuar. Coast., 44, 960–971, https://doi.org/10.1007/s12237-020-00846-6, 2021.
Walker, N. D.: Wind and eddy-related shelf/slope circulation processes and coastal upwelling in the Northwestern Gulf of Mexico, in: Circulation in the Gulf of Mexico: Observations and Models, edited by: Sturges, W. and Lugo-Fernandez, A., Geophys. Monographs 161, American Geophysical Union, 295–313, https://doi.org/10.1029/161GM21, 2005.
Walker, N. D., Leben, R. R., and Balasubramanian, S.: Hurricane-forced upwelling and chlorophyll a enhancement within cold-core cyclones in the Gulf of Mexico, Geophys. Res. Lett., 32, L18610, https://doi.org/10.1029/2005GL023716, 2005.
WHPO: WHP Operations and Methods, WOCE Hydrographic Office Report 91/1, as revised, WOCE Hydrographic Programme Office, Woods Hole, MA, https://books.google.com/books/about/WHP_Operations_and_Methods.html?id=IbQPAQAAIAAJ (last access: 23 February 2023), 1994.
Wiseman, W. J., Rabalais, N. N., Turner, R. E., Dinnel, S. P., and McNaughton, A.: Seasonal and interannual variability within the Louisiana coastal current: stratification and hypoxia, J. Marine Syst., 12, 237–248, https://doi.org/10.1016/S0924-7963(96)00100-5, 1997.
Zhang, J.-Z., Kelbie, C. R., Fischer, C. J., and Moore, L.: Hurricane Katrina induced nutrient runoff from an agricultural area to coastal waters in Biscayne Bay, Florida, Estuar. Coast. Shelf S., 84, 209–218, https://doi.org/10.1016/j.ecss.2009.06.026, 2009.