the Creative Commons Attribution 4.0 License.
the Creative Commons Attribution 4.0 License.
 | 20 Dec 2023
Observations of strong turbulence and mixing impacting water exchange between two basins in the Baltic Sea
Julia Muchowski
Martin Jakobsson
Lars Umlauf
Lars Arneborg
Bo Gustafsson
Peter Holtermann
Christoph Humborg
Christian Stranne
Turbulent diapycnal mixing is important for the estuarine circulation between basins of the Baltic Sea as well as for its local ecosystems, in particular with regard to eutrophication and anoxic conditions. While the interior of the basins is overall relatively calm, stratified flow over steep bathymetric features is known as a source of strong turbulent mixing. Yet, current in situ observations often cannot capture the spatio-temporal development of dynamic and intermittent turbulent mixing related to overflows over rough bathymetry. We present observational oceanographic data together with openly accessible high-resolution bathymetry from a prototypical sill and an adjacent deep channel in the sparsely sampled Southern Quark located in the Åland Sea, connecting the northern Baltic Proper with the Bothnian Sea. Our data were acquired during two 1-week cruises on R/V Electra in February–March 2019 and 2020. We collected high-resolution broadband acoustic observations of turbulent mixing together with in situ microstructure profiler measurements, and current velocities from acoustic Doppler current profilers. We found that a temporally reversing non-tidal stratified flow over the steep bathymetric sill created a dynamic and extremely energetic environment. The observed flow reversed during both cruises on timescales of a few days. Saltier, warmer, and less oxygenated deep water south of the sill was partly blocked, the reversing flow was at times hydraulically controlled with hydraulic jumps occurring on both sides of the sill, and high spatial variability occurred in the surface layer on small scales. Dissipation rates of turbulent kinetic energy, vertical turbulent diffusivities, and vertical salt flux rates were increased by 3–4 orders of magnitude in the entire water column in the vicinity of the sill compared to reference stations not directly influenced by the overflow with average dissipation rates near the sill between 10−7 and 10−6 W kg−1, average vertical diffusivities of 0.001 m2 s−1 in the halocline and up to 0.1 m2 s−1 below the halocline, and average vertical salt flux rates around 0.01 g m−2 s−1 in the halocline and between 0.1 and 1 g m−2 s−1 below the halocline.
We suggest, based on acoustic observations and in situ measurements, that the underlying mechanism for the highly increased mixing across the halocline is a combination of shear and topographic lee waves breaking at the halocline interface. We anticipate that the resulting deep- and surface-water modification in the Southern Quark directly impacts exchange processes between the Bothnian Sea and the northern Baltic Proper and that the observed mixing is likely important for oxygen and nutrient conditions in the Bothnian Sea.
- Article
(13447 KB) - Full-text XML
-
Supplement
(1360 KB) - BibTeX
- EndNote


The Southern Quark is the northern part of the Åland Sea, linking the northern Baltic Proper with the Bothnian Sea through the deepest connection between the two basins (Fig. 1). Water mass properties, including salinity and temperature, differ greatly between the northern Baltic Proper and the Bothnian Sea. While the deep water of the Baltic Proper has become increasingly anoxic due to eutrophication and poor ventilation (Carstensen et al., 2014), oxygen concentrations in the deep water in the Gulf of Bothnia, which includes the Bothnian Sea and the Bothnian Bay north of it, have been decreasing in the last decades but have not reached anoxic conditions (Raateoja, 2013; Polyakov et al., 2022).
Predictions of future oxygen conditions in the Bothnian Sea are contradictory. While overall oxygen conditions in the oceans may further exacerbate in response to climate warming (Keeling et al., 2010; Breitburg et al., 2018; Schmidtko et al., 2017), the situation in the Bothnian Sea is less clear. On the one hand, a study based on long-term monitoring data from 1960–2015 (Raateoja, 2013) and a comparison of six different Baltic Sea models (Meier et al., 2018) predict that the Bothnian Sea will likely remain well oxygenated; the latter study even suggests that its stratification will decrease despite increased warming. On the other hand, an analysis of long-term monitoring data from 1980–2015 (Kuosa et al., 2017) and a high-resolution model of the Baltic Sea combined with several downscaled global climate projections (Gröger et al., 2019) point to enhanced stratification from increased runoff and warming of surface waters, aligned with decreased oxygenation. The link between stratification and oxygen conditions in the Bothnian Sea has also been investigated in paleo-oceanographic studies. Jilbert et al. (2015) suggest that the isostatic uplift since the Last Glacial Maximum led to gradually shallower sill depths in the Åland Sea and consequently less salty water entering the Bothnian Sea. Their data show that the resulting weaker stratification led to well-ventilated bottom waters in the Bothnian Sea that prior to this suffered from anoxic episodes.
Although stratification often does play an important role for oxygenation, it has been shown that the amplification of anoxic conditions in the Baltic Sea during the last century is in fact mainly attributed to eutrophication (Kuliński et al., 2022; Meier et al., 2018). Despite anthropogenic, land-based sources of nutrients having declined significantly over the last decades, nutrient loads from previous decades have accumulated in the sediments and are released more efficiently into the water in anaerobic conditions (Gustafsson et al., 2012). This effect leads to a continuation of increased nutrient concentrations in the water despite the fact that anthropogenic, land-based sources have declined significantly. Potentially related to this long-term feedback mechanism, it has been shown that phosphorus concentrations in the Bothnian Sea have increased in the last decades and are posing a risk of further oxygen depletion. As a consequence of the increased phosphorous concentrations, cyanobacteria have started to bloom in the Bothnian Sea (Olofsson et al., 2021). Rolff and Elfwing (2015) suggest that the observed increase in phosphorus originates from the northern Baltic Proper and that it is being transported northward through the Åland Sea into the Bothnian Sea.
The underlying causes for observed trends in oxygen conditions in the Bothnian Sea are not fully understood, but it is well known that turbulent vertical mixing and water exchange processes in the Åland Sea affect the physical and chemical conditions in the Bothnian Sea and in fact the entire Gulf of Bothnia (Hela, 1958; Palosuo, 1964; Marmefelt and Omstedt, 1993; Westerlund et al., 2022). By altering the stratification in the basins, turbulent vertical mixing is also important for the larger-scale circulation. Yet, inflow and transformation of deep water from the northern Baltic Proper through the Åland Sea into the Bothnian Sea have rarely been studied and are still poorly understood. Hietala et al. (2007) state that “the paucity of observational data which could be used for direct comparisons is immediately striking”, referring to the Åland Sea. This is still true today, and the lack of in situ observational data from the Southern Quark (the northern part of the Åland Sea, Fig. 1b) hampers the development and verification of ocean models in the area. Knowledge about temporal and spatial variations in the vertical salt flux and the underlying turbulent mixing is needed to develop models and improve mixing parametrizations (Meier et al., 2006). Oceanographic processes in the area are highly influenced by the particularly variable bathymetry. Only recently, bathymetric data were made openly accessible through EMODnet (EMODnet Bathymetry Consortium, 2020), beginning with a resolution of 225×225 m in 2014 and with an increased resolution of 115×115 m since 2018. A sound understanding of mixing and water mass transformations in the topographically complex Åland Sea region is essential for predicting the evolution of physical and ecosystem parameters in the Bothnian Sea.
In this paper, we present observational data from the Southern Quark in the northern Åland Sea, including densely spaced observations of current velocities, water column stratification, microstructure shear, and temperature. Additionally, we present co-located acoustic observations from a broadband echosounding system that provide insights into the complex spatial structure of turbulent mixing at high resolution. We compare our measurements with previously published observational data as well as model output from a recently published high-resolution numerical model of the Åland Sea (Westerlund et al., 2022). We discuss the impact of the observed turbulent mixing on the temperature and salinity stratification of the Åland Sea deep water, which eventually propagates northward into the Bothnian Sea.
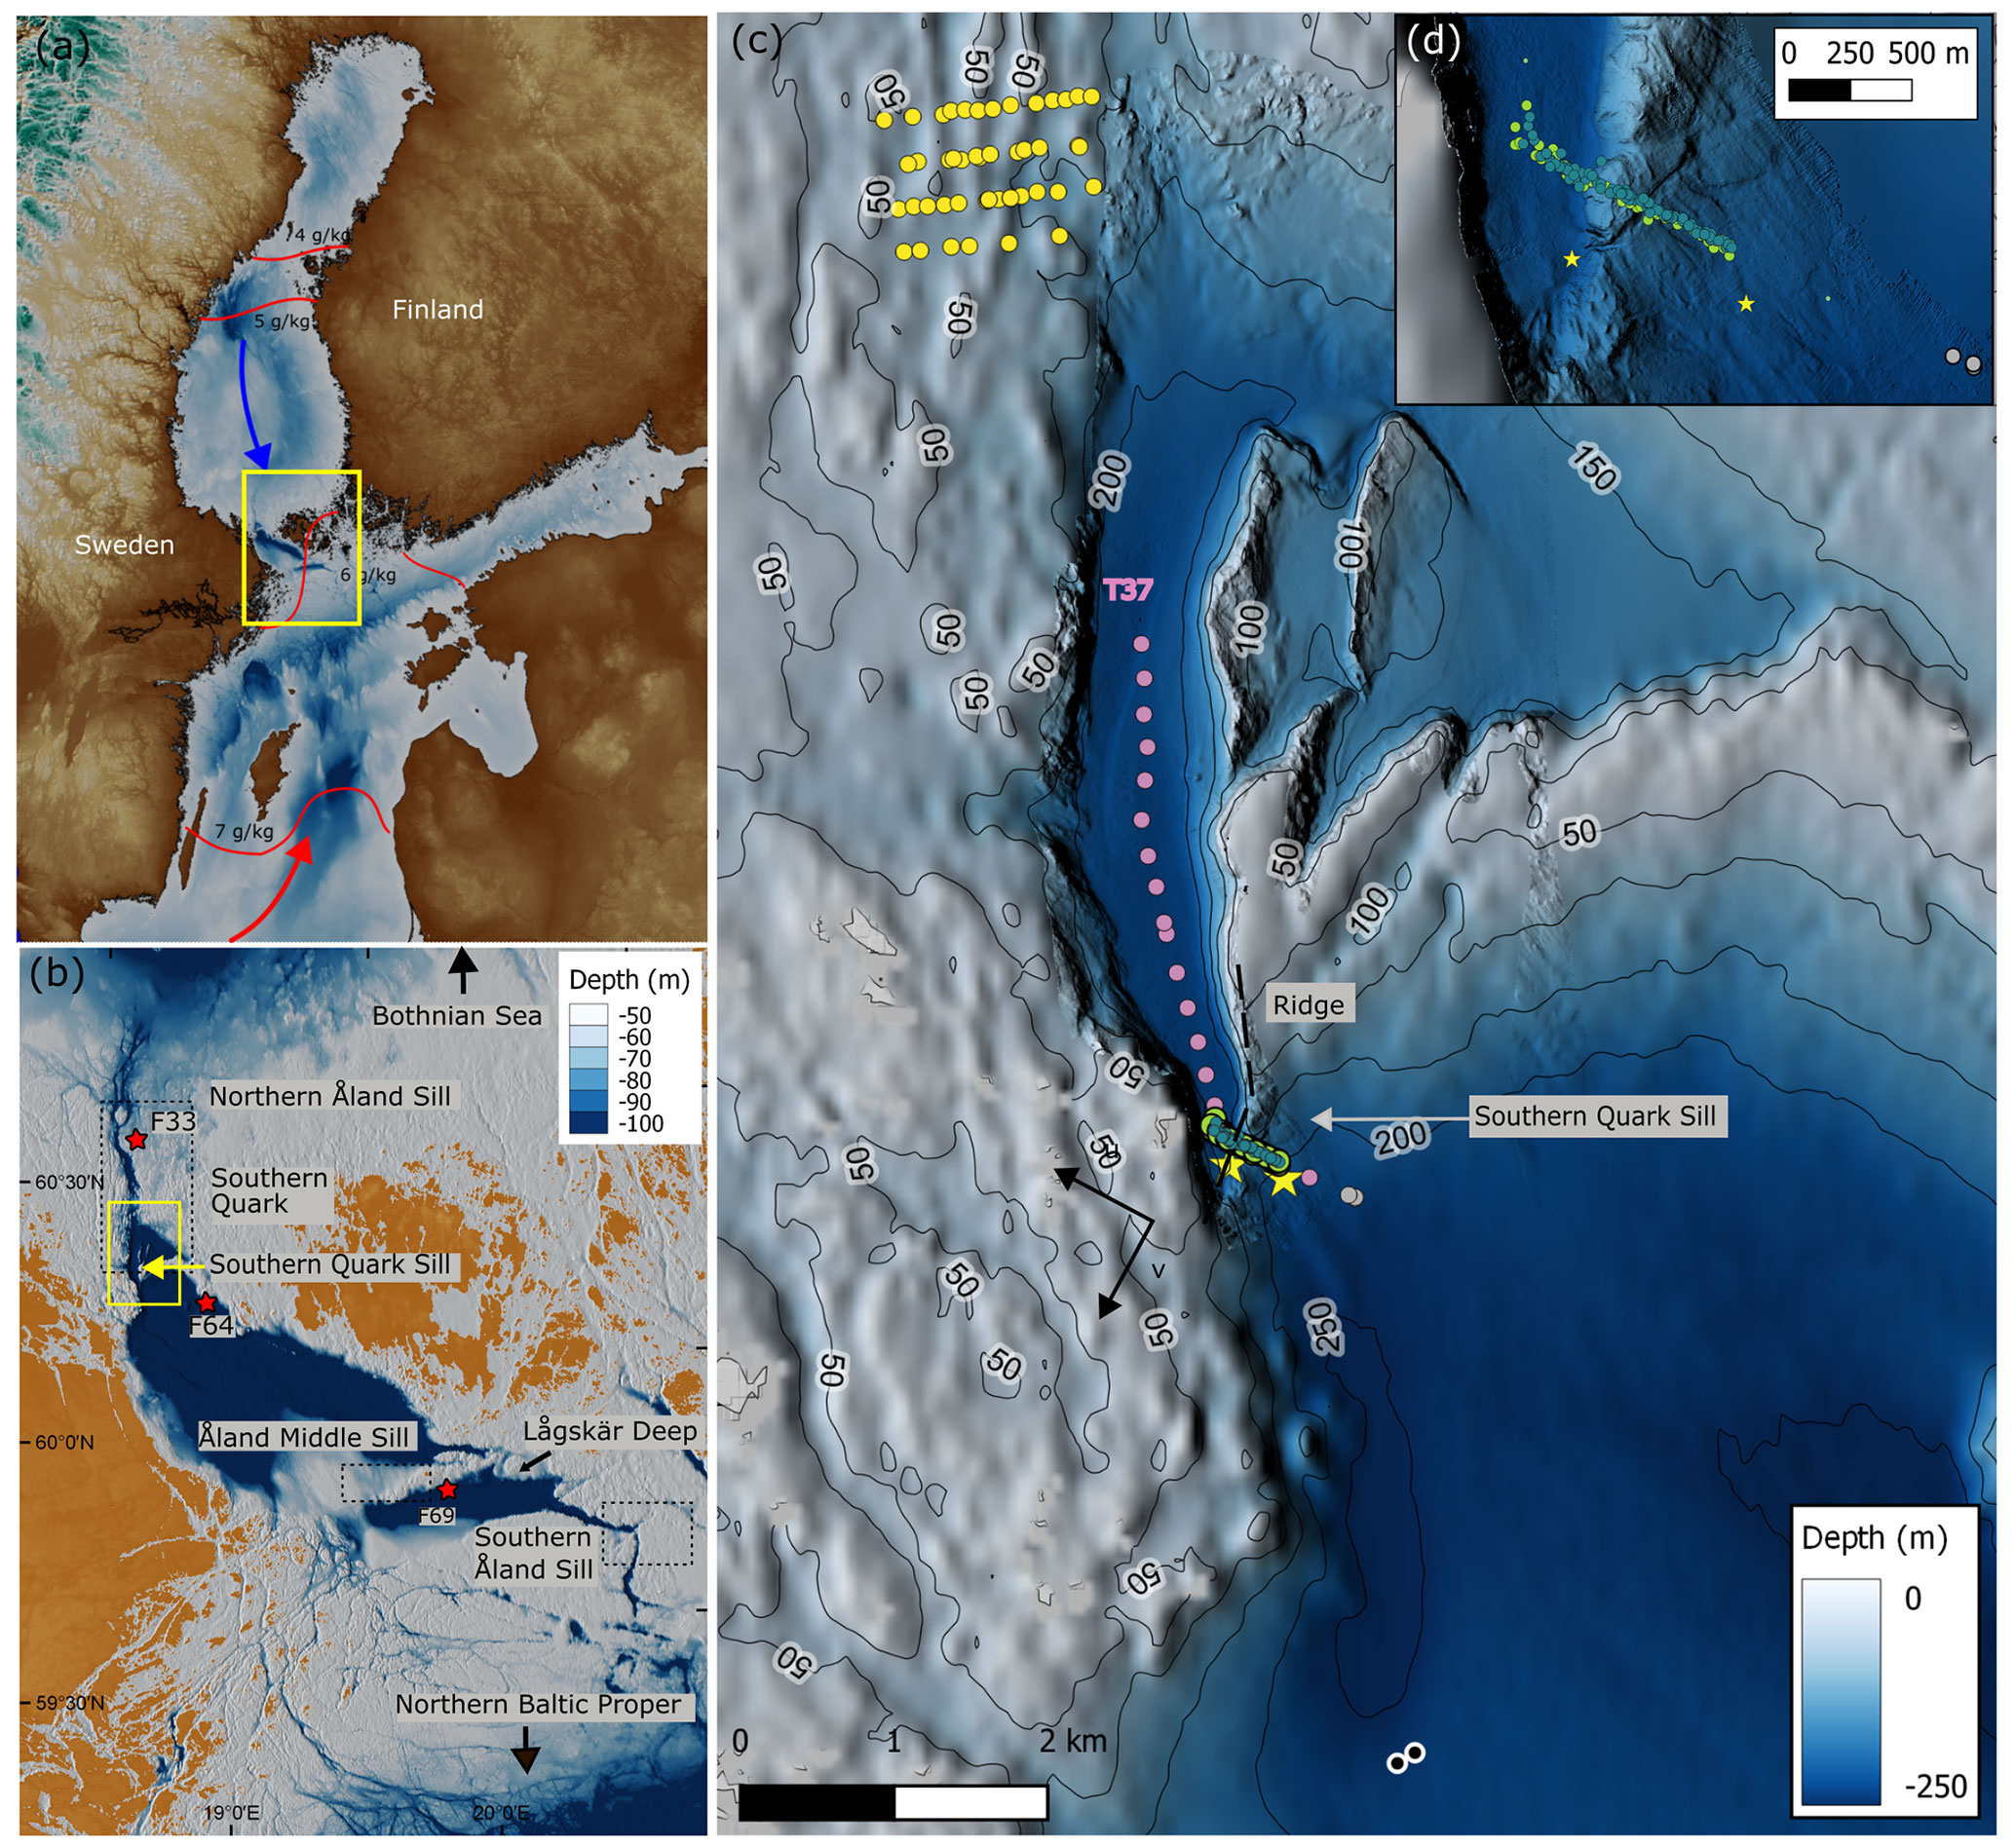
Figure 1(a) Northern Baltic Sea with approximate position of surface isohalines (red lines) from Snoeijs-Leijonmalm and Andrén (2017), main flow direction of saltier deep water entering the Baltic Sea from the North Sea (red arrow) and fresh surface water from the northern Baltic Sea (blue arrow). (b) Overview over study area as shown in Westerlund et al. (2022): three major sills that separate the northern Baltic Proper from the Bothnian Sea (black dashed rectangles) and positions of previous observations from monitoring stations (red stars). The yellow rectangle marks the region of data collection within this study shown in (c). Bathymetric data from EMODnet (EMODnet Bathymetry Consortium, 2020). (c) Positions of MSS casts and mooring ADCPs during cruises EL19-IGV01 Feb 2019 (EL19) and EL20-IGV01 February–March 2020 (EL20). MSS profiles near Southern Quark Sill during EL19 (turquoise) and EL20 (green), reference stations south of the sill during EL19 (black) and EL20 (gray), transect T37 during EL19 (pink), and parallel transects in northwestern part of the study region collected during EL20 (yellow). ADCP moorings (yellow stars) – EL19-IGV01 only north of the sill and EL20-IGV01 at both positions, south and north of the sill. (d) Southern Quark Sill bathymetry enlarged. Background bathymetry data from EMODnet (EMODnet Bathymetry Consortium, 2020), higher-resolution multibeam bathymetry data were acquired by R/V Electra and granted public release by the Swedish Maritime Administration (release-17-03187).
2.1 Bathymetry of the study area
The Åland Sea bathymetry is among the most complex in the Baltic Sea (Jakobsson et al., 2019) (Fig. 1b). While the western and southern parts host deep basins and steep ridges, the eastern and northern areas are characterized by shallow seafloors, with a few generally less than 30 m deep channels cutting through the Åland Archipelago. The Lågskär Deep is located south of Åland and has depths exceeding 150 m. The basin's deepest connection to the northern Baltic Proper is in the south through a bathymetric channel with a sill depth of about 60 m according to the gridded EMODnet digital bathymetric model (DBM) (EMODnet Bathymetry Consortium, 2020). Following Westerlund et al. (2022) and Leppäranta and Myrberg (2009), we adopt the name “Southern Åland Sill” for this sill and “Åland Middle Sill” for the passage at the western end of Lågskär Deep (Fig. 1b). The latter sill also has a depth of about 60 m and is the deepest connection northward to the Southern Åland Sea basin, which is the deepest part of the Åland Sea with a maximum depth of 295 m according to the EMODnet grid. The northern part of the Southern Åland Sea basin extends into the Bothnian Sea if the definitions by the Baltic Marine Environment Protection Commission (HELCOM) are applied (HELCOM, 2018). This area of the northwestern Åland Sea and southern Bothnian Sea forms a deep-water passage between Åland and the Swedish mainland commonly referred to as the Southern Quark (Fig. 1). There is a ∼ 88 m deep sill in the Southern Quark located in a bathymetric channel linking the Southern Åland Sea basin and the deeper Bothnian Sea (Fig. 1b). This sill is here referred to as the “Northern Åland Sill”, which is consistent with Westerlund et al. (2022).
The seafloor of our study area in the Southern Quark is highly dramatic with a major ridge running in an east–west direction nearly across the entire passage. This ridge has a crest that rises up to a depth of ∼ 25 m and which ends with a steep cliff towards the flat seafloor to the north where the water depths are generally deeper than 150 m. In contrast, the slope of the ridge facing southward is gentle. The deepest passage over the ridge is a ∼ 170 m deep sill at its southern edge with narrow channels that are up to 200 m deep. We established a transect across this sill, slightly northeast of this deepest passage (Fig. 1c), and will refer to it as the “Southern Quark Sill”. All sills described above are most likely crucial for the exchange flow between the sub-basins. It is therefore important to understand their role in the mixing of water masses. We consider the Southern Quark Sill as a prototypical example for the region, giving rise to the most relevant turbulent mixing processes.
The dramatic seafloor morphology of the Southern Quark is to a large extent inherited from the underlying bedrock geology. The Southern Åland Sea basin and Lågskär Deep were formed from a tectonic depression underlain by 1.0–1.6 Gyr old sandstone, while the rough seafloor areas surrounding Åland as well as the islands themselves are predominantly comprised of even older crystalline bedrock, i.e., to a large extent the famous rapakivi granite (EMODnet Geology; Beckholmen and Tiren, 2009). The steep ridge in the Southern Quark mentioned above is proposed to be composed of dolerite, which is a resistant magmatic rock (Beckholmen and Tiren, 2009). The Southern Quark is a typical example of how the underlying geology often serves as the foundation for the rough seafloor, implying that the general geology may provide valuable insights into identifying critical regions for turbulent mixing, in the Baltic Sea or elsewhere.
Jakobsson et al. (2019) showed that the EMODnet DBM (EMODnet Bathymetry Consortium, 2020) is capable of capturing the main characteristics of the dramatic Southern Quark seafloor morphology, while the older lower-resolution DBM IOWTOPO, compiled by the Leibniz-Institut für Ostseeforschung Warnemünde (IOW) (Seifert et al., 1995, 2001), smooths over critical details. Yet, many previous studies have made use of IOWTOPO (Tuomi et al., 2012, 2018; Lessin et al., 2014; Dargahi et al., 2017; Meier et al., 2003). The grid cell size of IOWTOPO2 covering the Southern Quark area is 2 × 1 arcmin (longitude × latitude), which is ∼ 1.9 × 1.9 km at 60∘ N. The EMODnet DBM has a resolution of × arcmin equating to ∼58 × 116 m at the same latitude. In addition, EMODnet has a considerably larger underlying source database. The above highlights the importance of considering the DBM when trying to understand processes that influence water circulation and water mass transformation, e.g., in ocean circulation models, and in particular for a region such as the Southern Quark with its extreme bathymetry on small scales.
2.2 Oceanography of the study area
Characteristic of the Baltic Sea is its pronounced large-scale horizontal north–south salinity and temperature gradient (Snoeijs-Leijonmalm and Andrén, 2017; Leppäranta and Myrberg, 2009; Kullenberg, 1982) (Fig. 1a). Saline deep waters from the North Sea enter the Baltic Sea through the Kattegat in the south and flow northward along the bottom topography of the Baltic Sea basins, while large volumes of fresh water enter the Baltic Sea at the surface in the form of river runoff, precipitation, and ice melt, especially in its northern parts (Kullenberg, 1982) (Fig. 1a). In most sufficiently deep regions of the Baltic Sea, the fresh surface water is separated from the saltier deep water by a pronounced halocline that persists throughout the year at a depth of around 60–80 m (Ahola, 2021). A general estuarine-type circulation occurs all the way to the northernmost parts of the Baltic Sea in the Gulf of Finland (Elken et al., 2003) and Gulf of Bothnia (Marmefelt and Omstedt, 1993; Green et al., 2006).
Our study area lies between the Baltic Proper and the Bothnian Sea in the southern part of the Gulf of Bothnia. Observations and numerical modeling results of the average bottom (surface) water salinity vary between 7.5–11 g kg−1 (6–7 g kg−1) in the Baltic Proper and between 5–7.5 g kg−1 (4–6 g kg−1) in the Bothnian Sea (Snoeijs-Leijonmalm and Andrén, 2017; Westerlund and Tuomi, 2016; Kullenberg, 1982; Raateoja, 2013). Overall, salinity decreases towards the north. The mean surface temperature lies between 7–9 ∘C in the Baltic Proper and between 5–7 ∘C in the Bothnian Sea, as estimated from numerical modeling (Kniebusch, 2019). In the northern Baltic Proper, the permanent strong halocline exists all year at varying depth of around 60–80 m (Väli et al., 2013) as in most parts of the Baltic Sea, while in the Bothnian Sea, a comparably weak halocline can be found at varying depths between 40–80 m (Håkansson et al., 1996; Westerlund and Tuomi, 2016; Kullenberg, 1982, p. 198). In some parts of the Bothnian Sea, the halocline may even be absent in winter, but stratification is stable throughout the year (Kullenberg, 1982).
Differences between water properties in the Baltic Proper and the Bothnian Sea are to a large part due to the sills and channels in the Åland Sea described above (Sect. 2.1, Fig. 1) that partly block the flow of saline deep water from the northern Baltic Proper into the Bothnian Sea. Previous studies describe inflow into the Bothnian Sea as one component of a larger-scale estuarine circulation. Saline waters from below the surface layer down to a depth of 50–70 m propagate northward, following the seafloor topography. The deep water flows from the northern Baltic Proper through small channels and canyons over the Southern Åland Sill and through the Åland Sea towards the Bothnian Sea (Hela, 1958; Håkansson et al., 1996; Leppäranta and Myrberg, 2009). At the same time, an approximately 15 m deep thermocline develops in the Bothnian Sea (Håkansson et al., 1996), and the fresher surface layer flows southward into the northern Baltic Proper (Hela, 1958; Marmefelt and Omstedt, 1993; Håkansson et al., 1996; Myrberg and Andrejev, 2006; Leppäranta and Myrberg, 2009). The southward surface layer flow along the Swedish coast is strong with velocities of up to 5–9 cm s−1 (Myrberg and Andrejev, 2006). During winter, oxygen-rich surface water in the northern Baltic Proper is at times forced by strong winds northward into the Åland Sea (Kullenberg, 1982; Palosuo, 1964). Strong southerly/southwesterly winds are known to temporarily reverse the general estuarine circulation in the northern Baltic Proper and Gulf of Finland, causing a compensating southward flow of the deep water (Elken et al., 2003).
Turbulent mixing is an essential component of any type of estuarine circulation as it is the main process for water mass transformation (Geyer and MacCready, 2014; Burchard et al., 2018). This is also true for estuarine circulation in the northern Baltic Sea, where mixing in the Åland Sea has been shown to dilute and modify northward-flowing water, which eventually becomes the deep water of the Bothnian Sea (Hela, 1958; Palosuo, 1964; Kullenberg, 1982; Neumann et al., 2020), as well as southward-flowing water, which becomes part of the surface water in the northern Baltic Proper (Hela, 1958; Eilola and Stigebrandt, 1998; Meier et al., 2006). The effect of turbulent mixing on the estuarine overturning circulation in this complex transition region, however, has not been studied in detail, mainly due to the lack of reliable turbulence observations and problems of numerical models to provide a precise and robust representation of turbulent mixing. The water renewal time in the Bothnian Sea has been estimated to be 1 year by Kullenberg (1982) and 4 to 5 years by Håkansson et al. (1996). In support of a great variation in renewal time, Meier (2005) found that the age of the bottom water in the Bothnian Sea varies largely with a median of 1.8 years and a maximum age of 4.2 years. These differences may be related to temporal changes, differences in the definitions, and uncertainties when modeling exchange processes along the transport pathways between the Baltic Proper and the Bothnian Sea.
Data presented in this study were collected during two cruises with R/V Electra: EL19-IGV01, 21–26 February 2019, and EL20-IGV01, 27 February–6 March 2020. These cruises are henceforth referred to as EL19 and EL20, respectively. During both cruises measurements were acquired repeatedly along a transect across the Southern Quark Sill in the southern part of the study region (Fig. 1c). During EL19, this transect was extended further north along the valley (Fig. 1c, rose dots). An area that was not visited during EL19 but extensively surveyed during EL20 was located in the northwestern corner of the study region, where we collected measurements along four parallel transects (Fig. 1c) to understand mixing in a region with extremely corrugated topography (Muchowski et al., 2022b).
Acoustic observations were collected continuously with the hull-mounted EK70-7C split beam transducer installed on RV Electra. This transducer has a 7∘ circular beam width and is connected to a Simrad EK80 wideband transceiver. A 4.1 ms long chirp pulse ranging from 45 to 90 kHz at a transmit power of 750 W and a ping rate of 1 s was used. Match filtering of the chirped pulse leads to a vertical resolution of about 1.5 cm. The horizontal resolution varies with the ship speed. The system was calibrated in the study area during both cruises. During the EL19 cruise, a 38.1 mm tungsten carbide sphere was used while a 32 mm copper sphere was used during EL20. We display acoustic backscatter strength per volume Sv in decibels relative to a reference of 1 µPa. Additional information about the acoustic system as well as a detailed analysis of how energy dissipation rates from turbulent diapycnal mixing can be inferred from the acoustic broadband observations can be found in Muchowski et al. (2022a).
The acoustic observations were combined with co-located in situ measurements from a free-falling Sea and Sun Technology MSS90-L microstructure profiler (MSS). Exact times and positions of all MSS casts collected during EL19 and EL20 are listed in Supplement Tables S1 and S2, respectively. The MSS profiler was equipped with two PNS06 airfoil shear probe sensors, an internal shear sensor to monitor noise due to instrument vibrations, an FP07 fast thermistors, and precision conductivity, temperature, and depth (CTD) sensors, including an oxygen sensor. The falling speed of the profiler was adjusted to approximately 0.7 m s−1. From shear sensor measurements, dissipation rates of turbulent kinetic energy ε were obtained. See Muchowski et al. (2022a) for detailed information on the MSS hardware components as well as processing steps. Based on the energy dissipation rates and the buoyancy frequency N, turbulent diffusivities kz were calculated using (Osborn, 1980)
thereby assuming a constant flux coefficient γ=0.2 (Gregg et al., 2018). Vertical salinity flux rates were calculated from the diffusivity kz using Fick's law
with water depth z defined positive upward, water density ρ, and salinity S.
Current velocities were measured with R/V Electra's hull-mounted Teledyne 600 kHz Workhorse acoustic Doppler current profiler (ADCP), providing reliable velocity data down to approximately 40 m depth. Additionally, we deployed moored upward-looking 300 kHz Workhorse ADCPs during both cruises. Data from the hull-mounted ship ADCP were averaged over 60 s. During EL19, one ADCP mooring was deployed at 215 m depth on 22 February 2019 and recovered on 27 February 2019 at 60∘16′20.21′′ N, 18∘55′48.25′′ E (Fig. 2a). During EL20-IGV01 two ADCP moorings were deployed. ADCP 1 was deployed on 28 February 2020 and recovered on 6 March 2020 at approximately the same position as the ADCP mooring deployed during EL19. ADCP 2 was deployed at 190 m depth on 27 February 2020 and recovered on 6 March 2020 at 60∘15′55.8′′ N, 18∘56′38.399′′ E (Fig. 1c). The moored ADCPs sampled the water column every second in 2 m bins, and during post-processing data were averaged to 1 min intervals for noise reduction. All data were processed with an IOW in-house software package that includes a quality control algorithm. Detailed information can be found in Muchowski et al. (2022a).
In the first part, we discuss a single transect, measured across the Southern Quark Sill from south to north and through the adjacent valley further north. Impacts of the seafloor topography and turbulent mixing on the properties of the water north of the sill are examined – in the surface water, across the halocline, and in the deep water. The Southern Quark Sill and the valley connected to it can be seen as one example out of a variety of bathymetric features in the Åland Sea that modify the water properties and therefore impact the exchange flow between the adjacent basins.
In the second part, we show temporal variations in the flow over the Southern Quark Sill and estimate the amount of mixing in the vicinity of the sill on timescales of days to weeks. In order to do so, all MSS casts collected near the sill during both cruises are included and compared to reference stations south of the sill as well as to previously published measurements in a shallower area northwest of the sill (Fig. 1c).
4.1 Water modification along one particular transect
4.1.1 Microstructure measurements
During transect T37 (Table S1), measured on 26 February 2019 between 14:50 and 17:40 across the Southern Quark Sill (Fig. 1c), we collected in total 19 MSS casts, of which 17 cover the full water depth and are included in the following analysis. Profiles of absolute salinity and conservative temperature show fresh, cold surface water above warmer, saltier bottom water separated by a halo- and thermocline at 20–50 m depth (Fig. 2c, d). The simultaneously collected ship ADCP data reveal that in the first half of the almost 3 h long transect, the surface layer flow in the vicinity of the sill was mostly southward, as expected for an estuarine-type circulation, while at the very beginning of the transect as well as north of the sill, during the second half of the transect (at a distance of about 4.5 km from the start of the transect), the flow direction changed towards the south (Fig. 2a, b, corresponding validation parameter shown in Supplement Fig. S3b). Corresponding wind data from the Swedish Meteorological and Hydrological Institute (SMHI) station Örskär (60.5256∘ N, 18.3729∘ E) in the vicinity of the study region reveal a shift in wind direction and drop in wind speed during the time of the measurement that coincides with the change in surface-water current direction in the second half, about 1.5 h into the transect (Supplement Fig. S1).
ADCP data (Fig. 3) from the mooring slightly north of the sill show that, during the time of the measurement, the main flow direction of the deep water below 140 m depth was northwest. The main flow direction of the intermediate water below the halocline but above 140 m depth (the near-surface layer was outside the range of this instrument) was northward, as expected for an estuarine-type circulation. Note that data collected along the transect are expected to show spatial as well as temporal variations, as the duration of the measurements was about 3 h. The deep water had a flow velocity of about 0.25 m s−1 near the sill and based on this, it would travel ∼ 2.7 km during the approximately 3 h duration of the 8 km long transect.
The deepest warm and salty water with lowest oxygen concentrations south of the sill is partly blocked from propagating northwards (Fig. 2c–e). Particularly striking are the strongly enhanced energy dissipation rates in the wake of the sill, reaching several kilometers, or O(101–102) sill heights, into the valley (Fig. 2f). In this region, deep-water isopycnals show regular undulations with a wavelength of approximately 1500 m (assuming stationarity) and vertical excursions of up to 50 m, which are also reflected in the structure of salinity and oxygen, e.g., between 2–3 and 4–5 km distance along the transect (Fig. 2c, d). We interpret this pattern as the signature of stationary lee waves generated at the sill, triggering deep-water turbulence and mixing in the wake of the sill. A direct consequence of the highly increased mixing north of the sill is the slight freshening and cooling of the bottom water from south to north that can be identified in Fig. 2c and d). The same trend is visible also in the oxygen data, where oxygen concentrations in the deep water increase from south to north.
Especially important for the estuarine circulation are the enhanced dissipation rates in the halocline region (30–50 m depth), where vertical temperature and salinity gradients are strong and turbulence will thus effectively mix inflowing and outflowing waters. We will see in the following that turbulence in this region is also clearly reflected in our acoustic turbulence measurements.
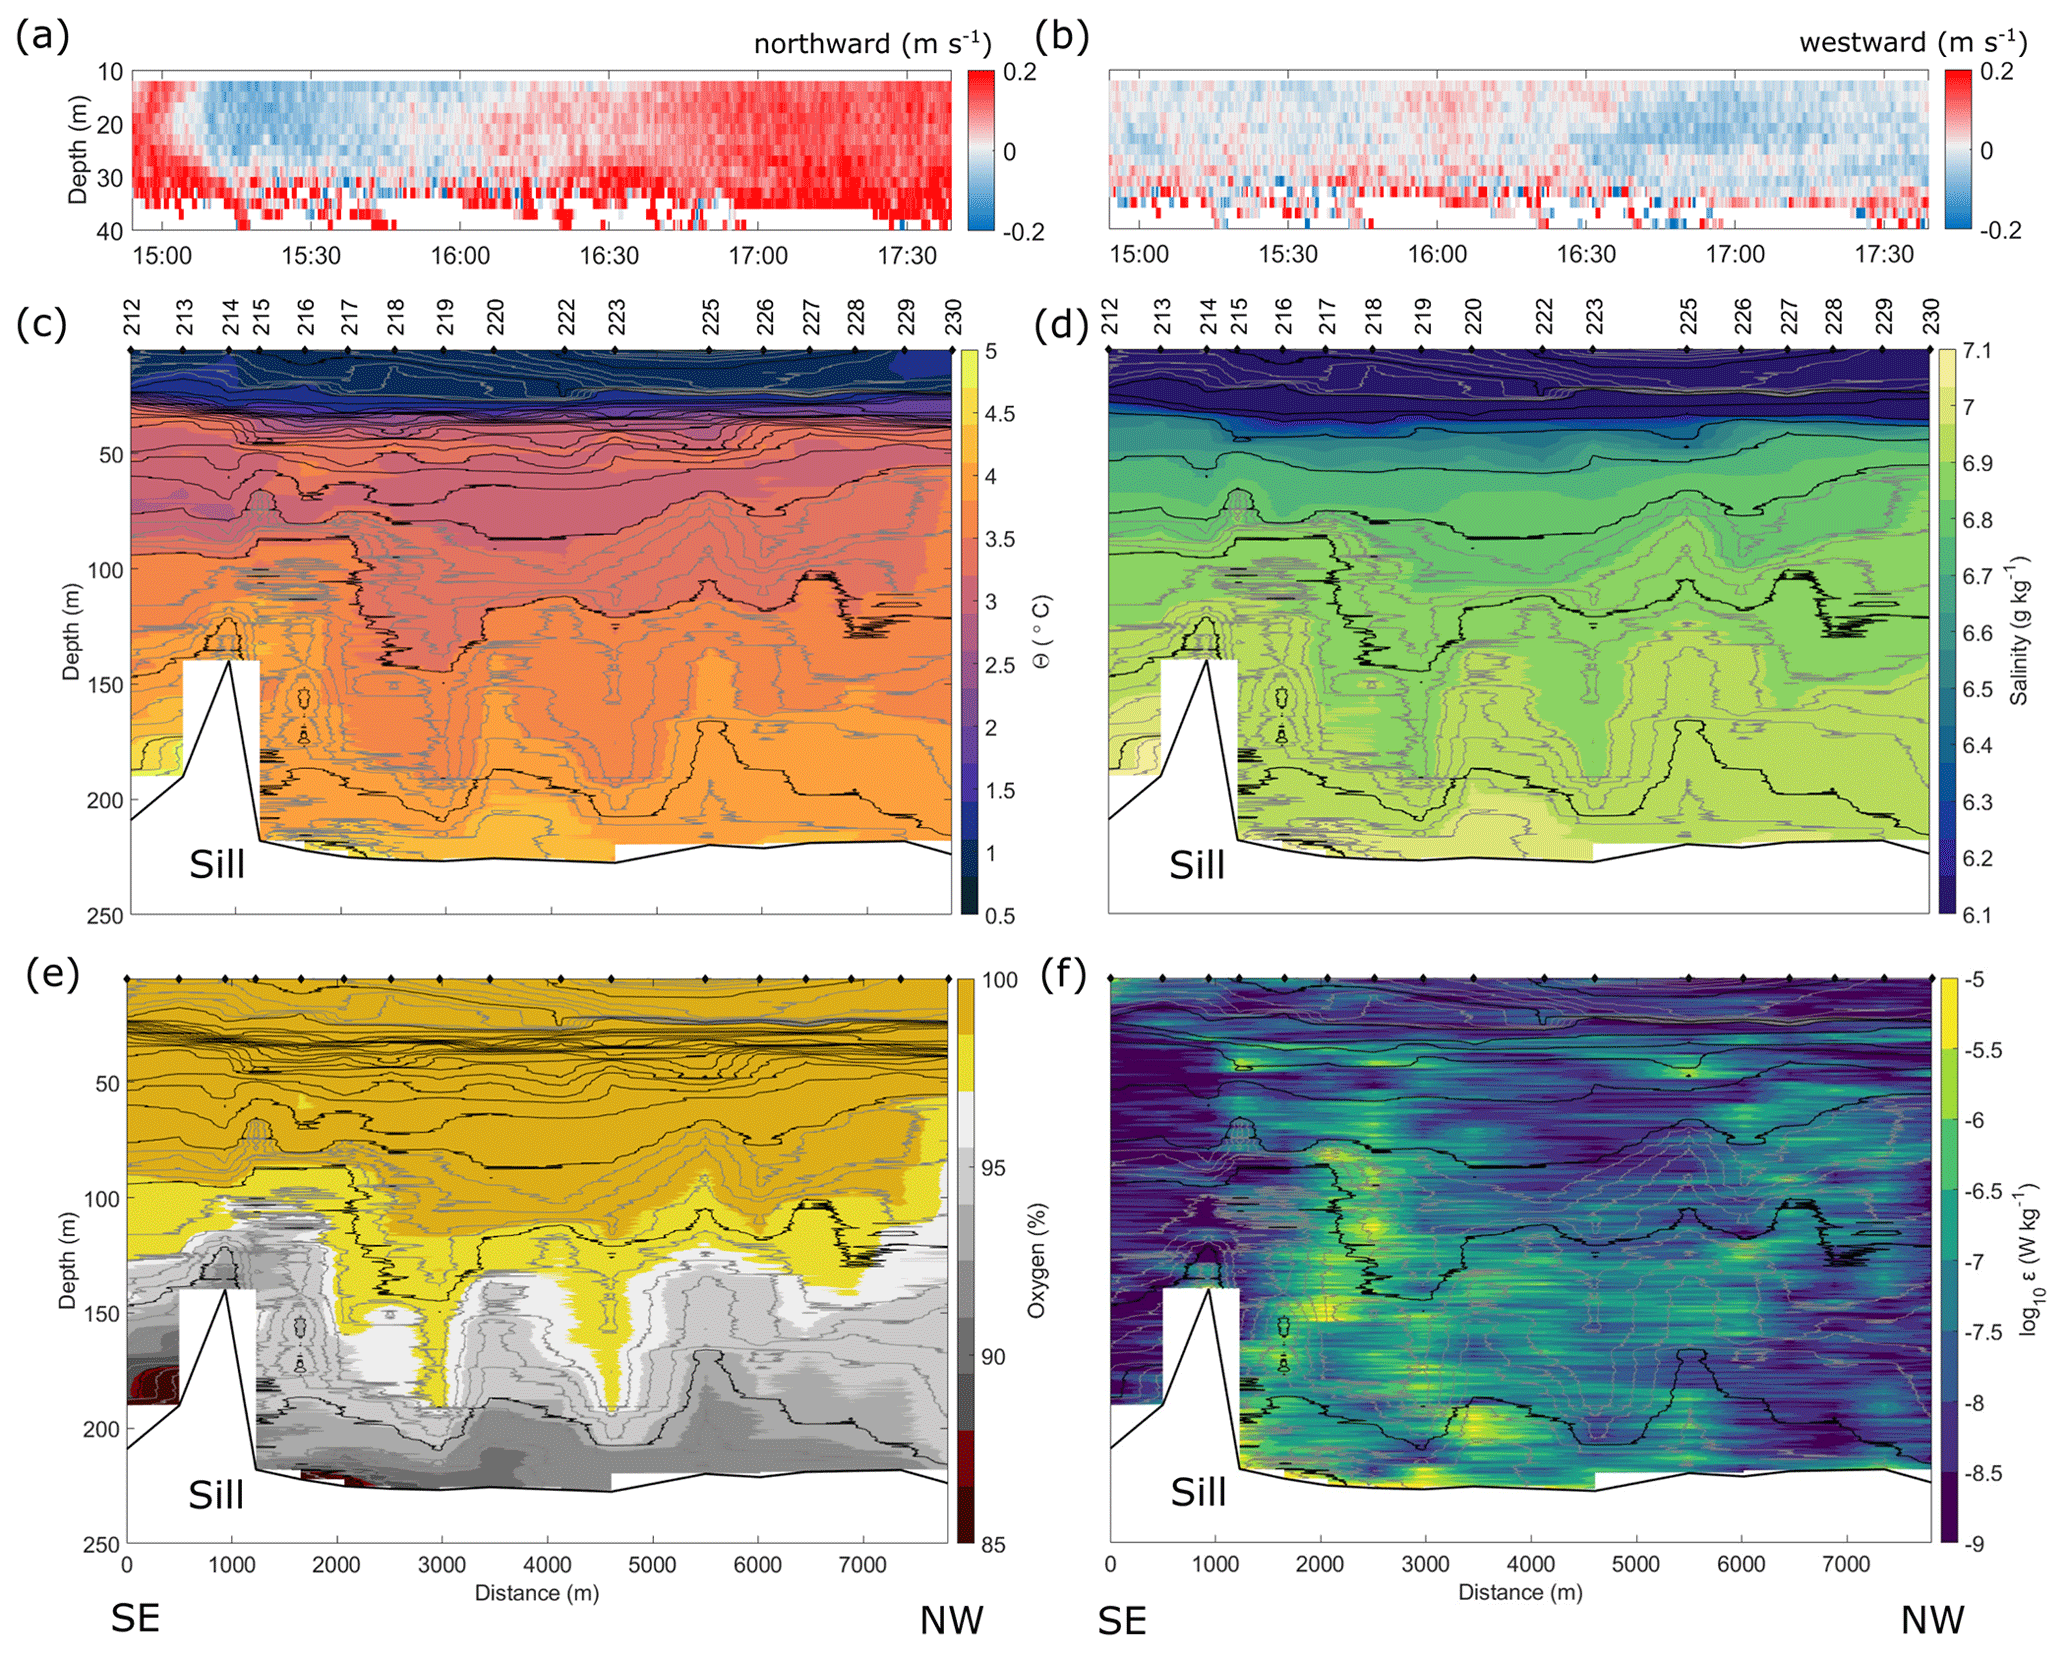
Figure 2Measurements collected along transect T37 shown in Fig. 1c. (a) Ship ADCP northward velocity and (b) ship ADCP westward velocity, both averaged over 60 s. (c–f) Linear interpolation of MSS 212-230, excluding casts 221 and 224 which were aborted. (c) Conservative temperature, (d) absolute salinity, (e) oxygen concentration, and (f) energy dissipation rate. Black isopycnals plotted with MATLAB function contour at intervals of 0.05 g kg−1 and gray isopycnals at 0.01 g kg−1. In panels (d) and (f) black isopycnals in the halocline are plotted at intervals of 0.2 g kg−1. The exact time and position of all MSS casts collected during EL19 are shown in Supplement Table S1.
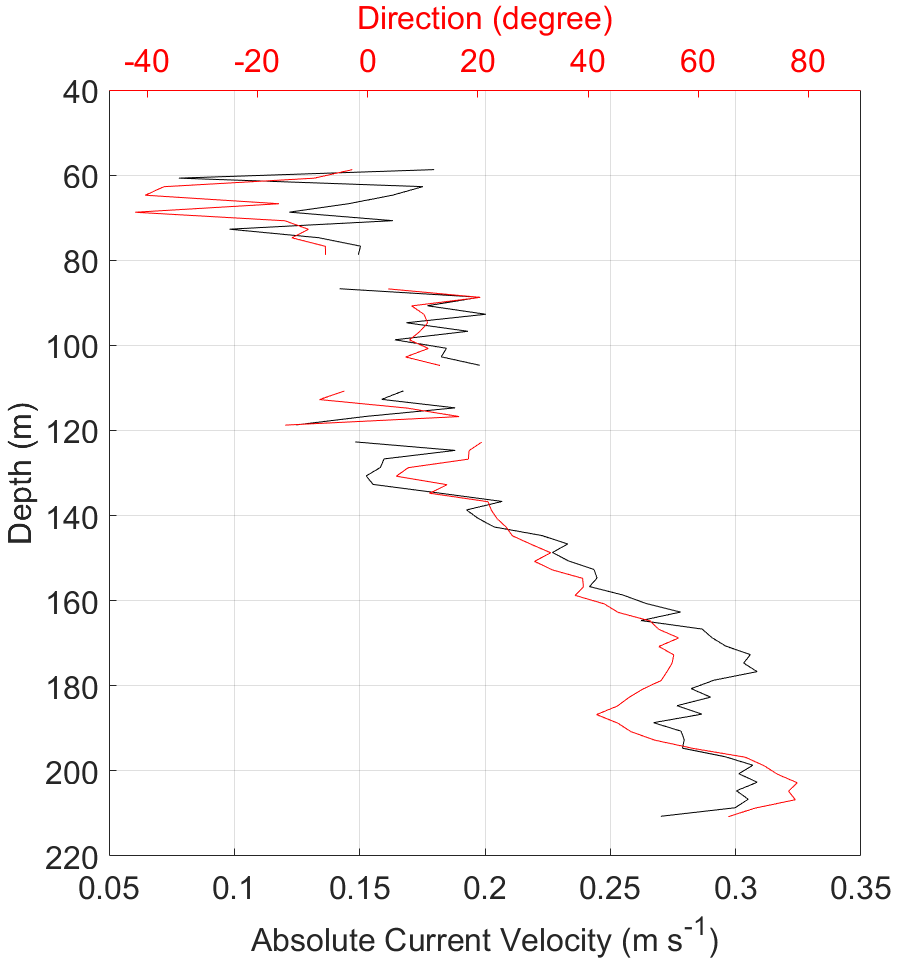
Figure 3Average velocity during the time of transect T37 as measured with moored upward-looking ADCP slightly north of the Southern Quark Sill. Data rotated by 90∘ as in Fig. 2a and b; 0∘ is equivalent to a northward direction. Validation parameter data can be found in the Supplement Fig. S3.
4.1.2 Acoustic observations
We collected broadband acoustic data (Fig. 4) co-located with the microstructure measurements. In Muchowski et al. (2022a), a clear correlation between increased acoustic backscatter and regions of increased mixing in this dataset was found, and it was shown that turbulent mixing rates can reliably be estimated from acoustic backscatter strength in combination with temperature and salinity profiles in regions where the acoustic backscatter is not dominated by biological scattering. The acoustic observations of turbulent mixing (Fig. 4) correspond excellently with in situ measurements of energy dissipation (Fig. 2f). While the microstructure profiler data only provide snapshots at a few positions with a vertical resolution of 0.5 m, the acoustic observations show the detailed structure of the turbulence in the sill region with a vertical resolution of about 2 cm and a horizontal resolution of about 1 m (Fig. 4). South of the sill, eroding and tilting density interfaces indicate that the deep water is lifted up (white arrow in Fig. 4). North of the sill, biological single target scatterers become thin stretched-out lines, indicating that they are transported passively with the current and hence that the denser deep water falls down on the lee side of the sill. The sill thus causes highly increased turbulent mixing as indicated in the echogram by blurry, cloudy backscatter without clearly defined edges. Remnants of a stagnant, wedge-shaped pool of water (e.g., Farmer and Armi, 1998; Cummins et al., 2006) are visible just north of the sill at a depth of around 50–100 m (V-shape in Fig. 4), pointing towards conditions in which hydraulic control is or was recently present. Acoustic backscatter from diapycnal turbulent mixing is visible in direct connection to the overflow north of the sill and extends for more than 4 km downstream in the entire water column below the surface mixed layer, perfectly consistent with the shear-microstructure data discussed above. In a layer between 40–100 m depth, distinct strong biological scattering masks acoustic observations of turbulent mixing, complicating the identification of turbulence microstructure in this region (Muchowski et al., 2022a). In the deeper regions below 100 m, however, turbulence microstructure related to large overturns, eddies, and internal-wave oscillations is ubiquitous in the echogram (Fig. 4, seen as more fuzzy scattering without clear edges) as well as in the microstructure data (Fig. 2c–e), causing increased mixing all the way down to the seafloor (Fig. 2f). Further away from the sill, increased mixing rates in the deep water are likely also influenced by the steep walls on both sides of the valley.
While the acoustic observations are insensitive to increased dissipation rates in the nearly well-mixed surface layer, where temperature and salinity gradients are small, their sensitivity is highest in stratified regions, such as in the halocline (Muchowski et al., 2022a). Indeed, strong scattering from turbulent diapycnal mixing is visible in the halocline region along the entire transect, again similar to the microstructure profiler data discussed above. Particularly strong turbulent diapycnal mixing can be seen below the surface mixed layer and above approximately 50 m depth as tilted bands with small-scale oscillations (Fig. 4) that may be signs of Kelvin–Helmholtz instabilities (Geyer et al., 2010). The observed strong diapycnal mixing across the halocline is particularly important for the exchange flow between the basins. It is likely crucial for the water mass properties of the outflowing surface layer, as it entrains salt, as well as for the outflowing deep water which becomes diluted and enriched with oxygen. Without high-resolution current measurements inside and below the halocline, we can only speculate that the enhanced mixing in the halocline region is due to (a) mean current shear across the halocline associated with the near-surface freshwater outflow and (b) breaking of lee waves generated at the sill in the strongly sheared and stratified halocline, thereby depositing energy from the overflowing deep water in the halocline (Figs. 2a, b and 3). The tilted overall pattern supports the lee wave breaking hypothesis.
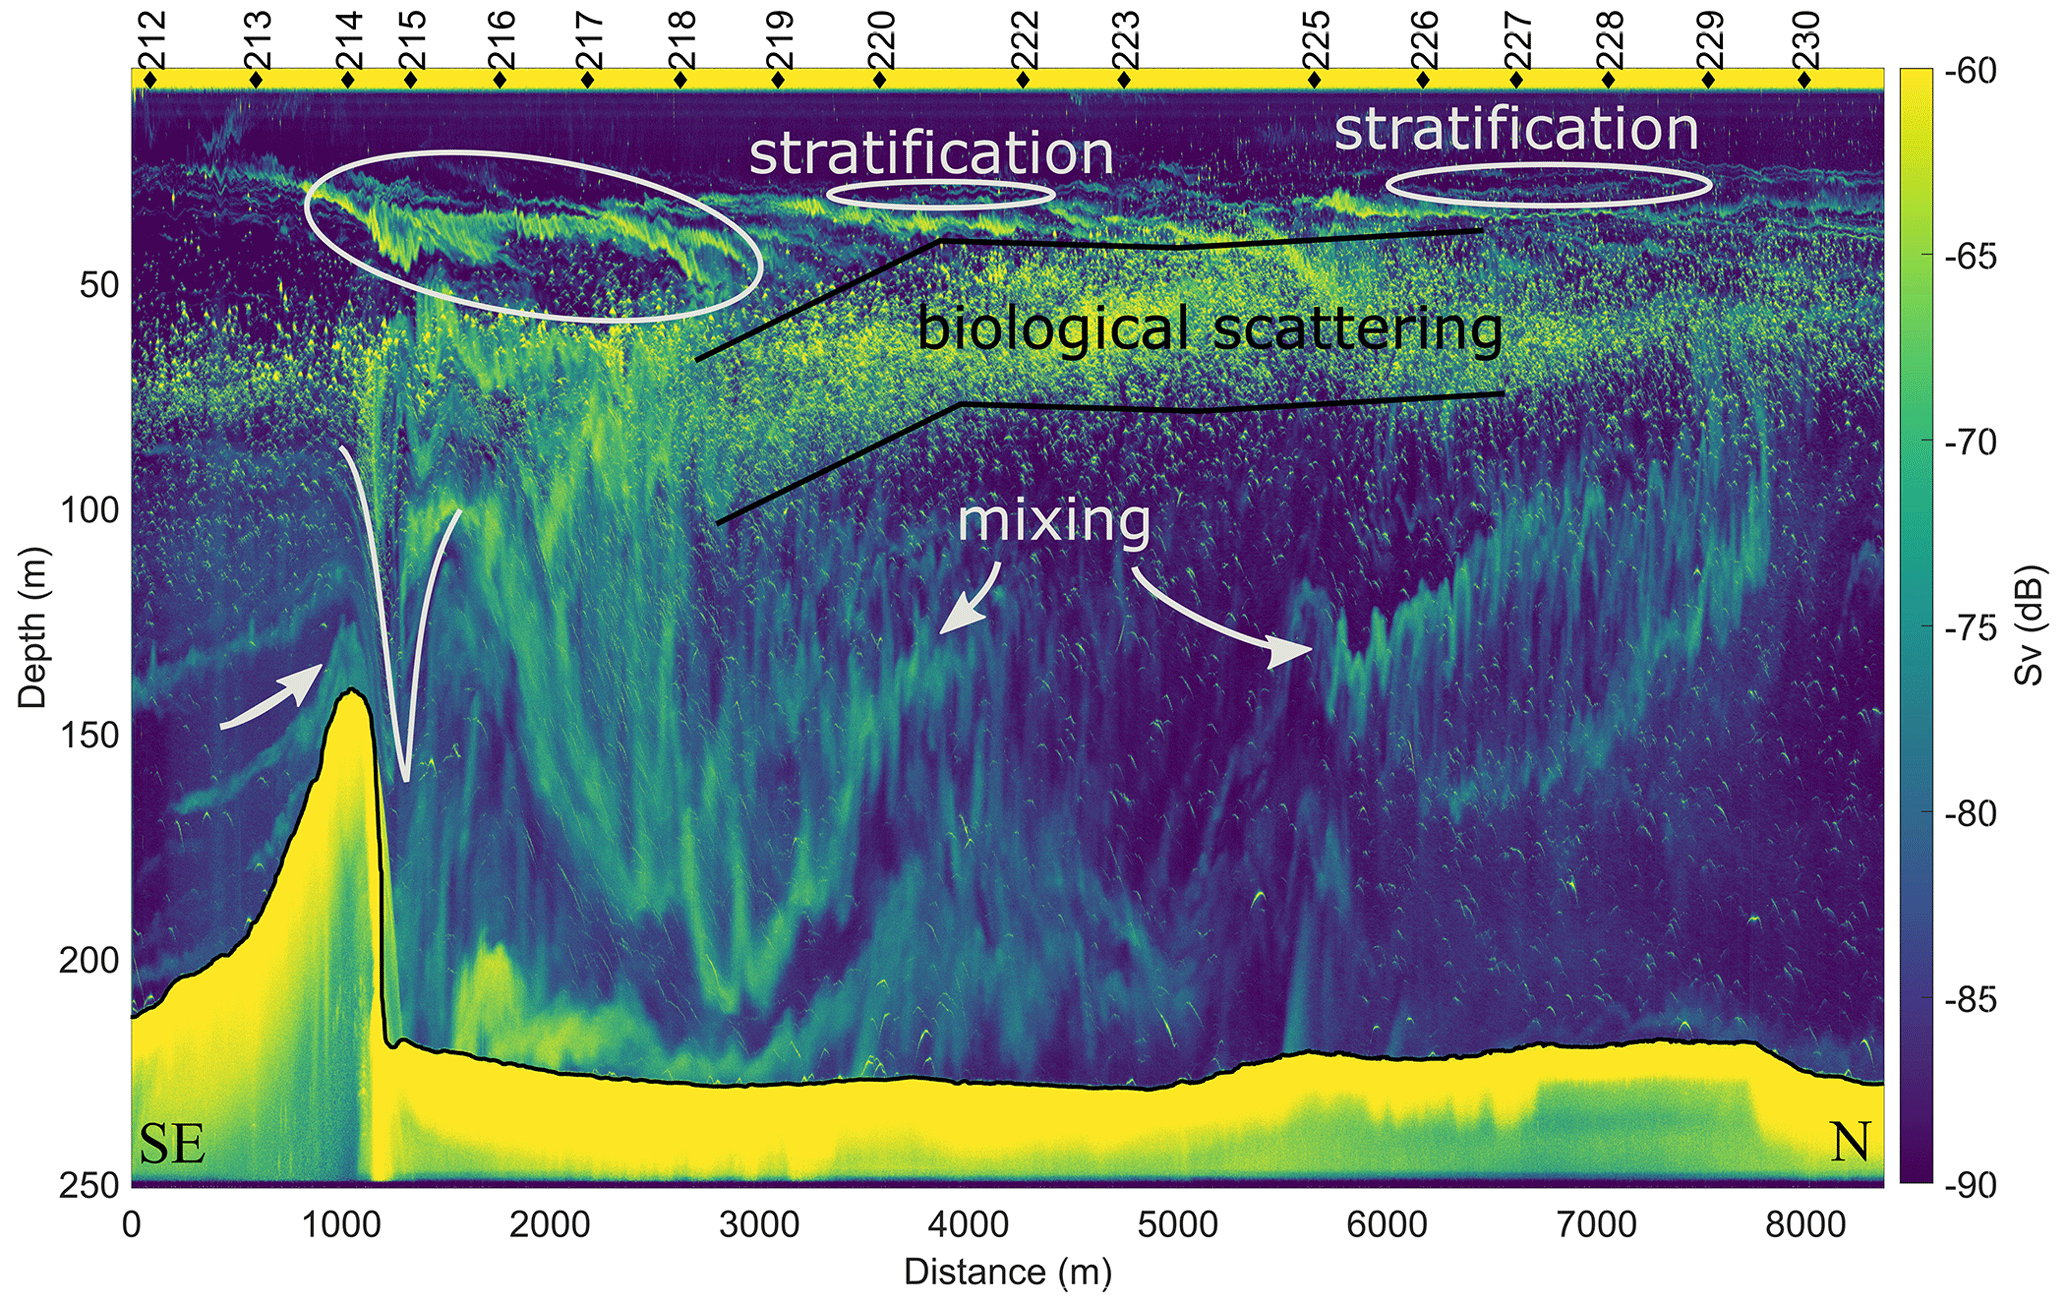
Figure 4Echogram collected on transect T37 during EL19 while crossing the Southern Quark Sill and passing the valley north of it. Acoustic observations are co-located with MSS casts 212–230 shown in Fig. 2 (black diamonds) and given as volume backscatter strength in decibels. The black line outlines the seafloor bathymetry. Water flows from left (southeast) to right (north) over the sill and further north through the valley (Fig. 1c). Highly increased vertical mixing in the halocline region is particularly strong just north of the sill, with small-scale oscillations (light gray ellipsoid starting above the sill crest) as well as large patches of increased turbulent mixing on the lee side of the sill below the halocline (white arrows). Signs of backscatter from stratification in the halocline (two narrow light gray ellipsoids) as well as bands of increased backscatter below the sill level that are tilted upwards just south of the sill (white arrow). Distinct scatterers are likely biological targets, such as fish or zooplankton (in the region between black lines).
In some parts of the echogram (Fig. 4), signs of additional backscatter from stratification (Lavery and Ross, 2007; Stranne et al., 2017, 2018) can be seen as thin distinct lines just above the strong fuzzy scattering bands from turbulent mixing. Backscatter from stratification is high for interfaces that are sharp compared to the wavelength of the acoustic wave and is expected to be relatively weak in the study environment as temperatures only increase by about 3 ∘C over a depth range of about 20 m, without many visible interfaces. For instance, scattering analyzed in Lavery and Ross (2007) was due to double diffusion and included changes of 6 ∘C over a depth of only 4 cm. Nevertheless, acoustic backscatter from stratification will likely contribute to the total backscatter signal in the halocline and is likely not negligible under calm conditions, especially in regions with large changes in temperature over small depth ranges.
4.1.3 Temperature and salinity profiles
Arranging temperature and salinity profiles by region shows that the deep water south of the sill (MSS 212–214) is about 1∘ warmer and almost 0.2 g kg−1 saltier than the water in the valley further north of the sill (MSS 229, 230). This could be caused by a combination of partial blocking of the saline and warm deep water south of the Southern Quark Sill and its dilution due to the entrainment and mixing when flowing over the sill. The observed tendencies of a freshening surface mixed layer and a sinking halocline depth towards the north (Fig. 5c, MSS casts 212–228) are in agreement with previous observations (e.g., Hela, 1958) and the concept of an estuarine-type circulation.
However, our data also suggest a strong small-scale intermittency of mixed layer depth and near-surface stratification: in agreement with tilted isopycnals in the surface layer (Fig. 2c, d), the two northernmost MSS profiles (MSS 229, 230) show a significantly different signal in the upper 50 m than all other profiles collected on the transect (Fig. 5a and c). MSS profiles 229 and 230 show a well-mixed surface layer extending down to nearly 20 m, while MSS profile 228 observed only 9 min earlier and only 470 m south shows no clear evidence for a surface mixed layer at all (Fig. 5c). Furthermore, MSS profiles 229 and 230 have two pronounced local temperature maxima just above and below 50 m depth. We hypothesize that those could be intrusions of intermediate waters. The measured change in ADCP surface currents described above (over time and in space) could explain the unexpected temperature and salinity signal in the upper 50 m of the two MSS measurements furthest north (Fig. 5f, dark blue dots). We can only speculate that for instance wind and/or shallow bathymetric structures east and west of the transect could have altered the surface current direction in the northernmost part of the transect. From a high-resolution modeling study, Chrysagi et al. (2021) recently argued that mixed-layer re-stratification due to sub-mesoscale frontal instability is ubiquitous in the central Baltic Sea, and it is likely that our data show evidence for this process also in more northern parts of the Baltic Sea.
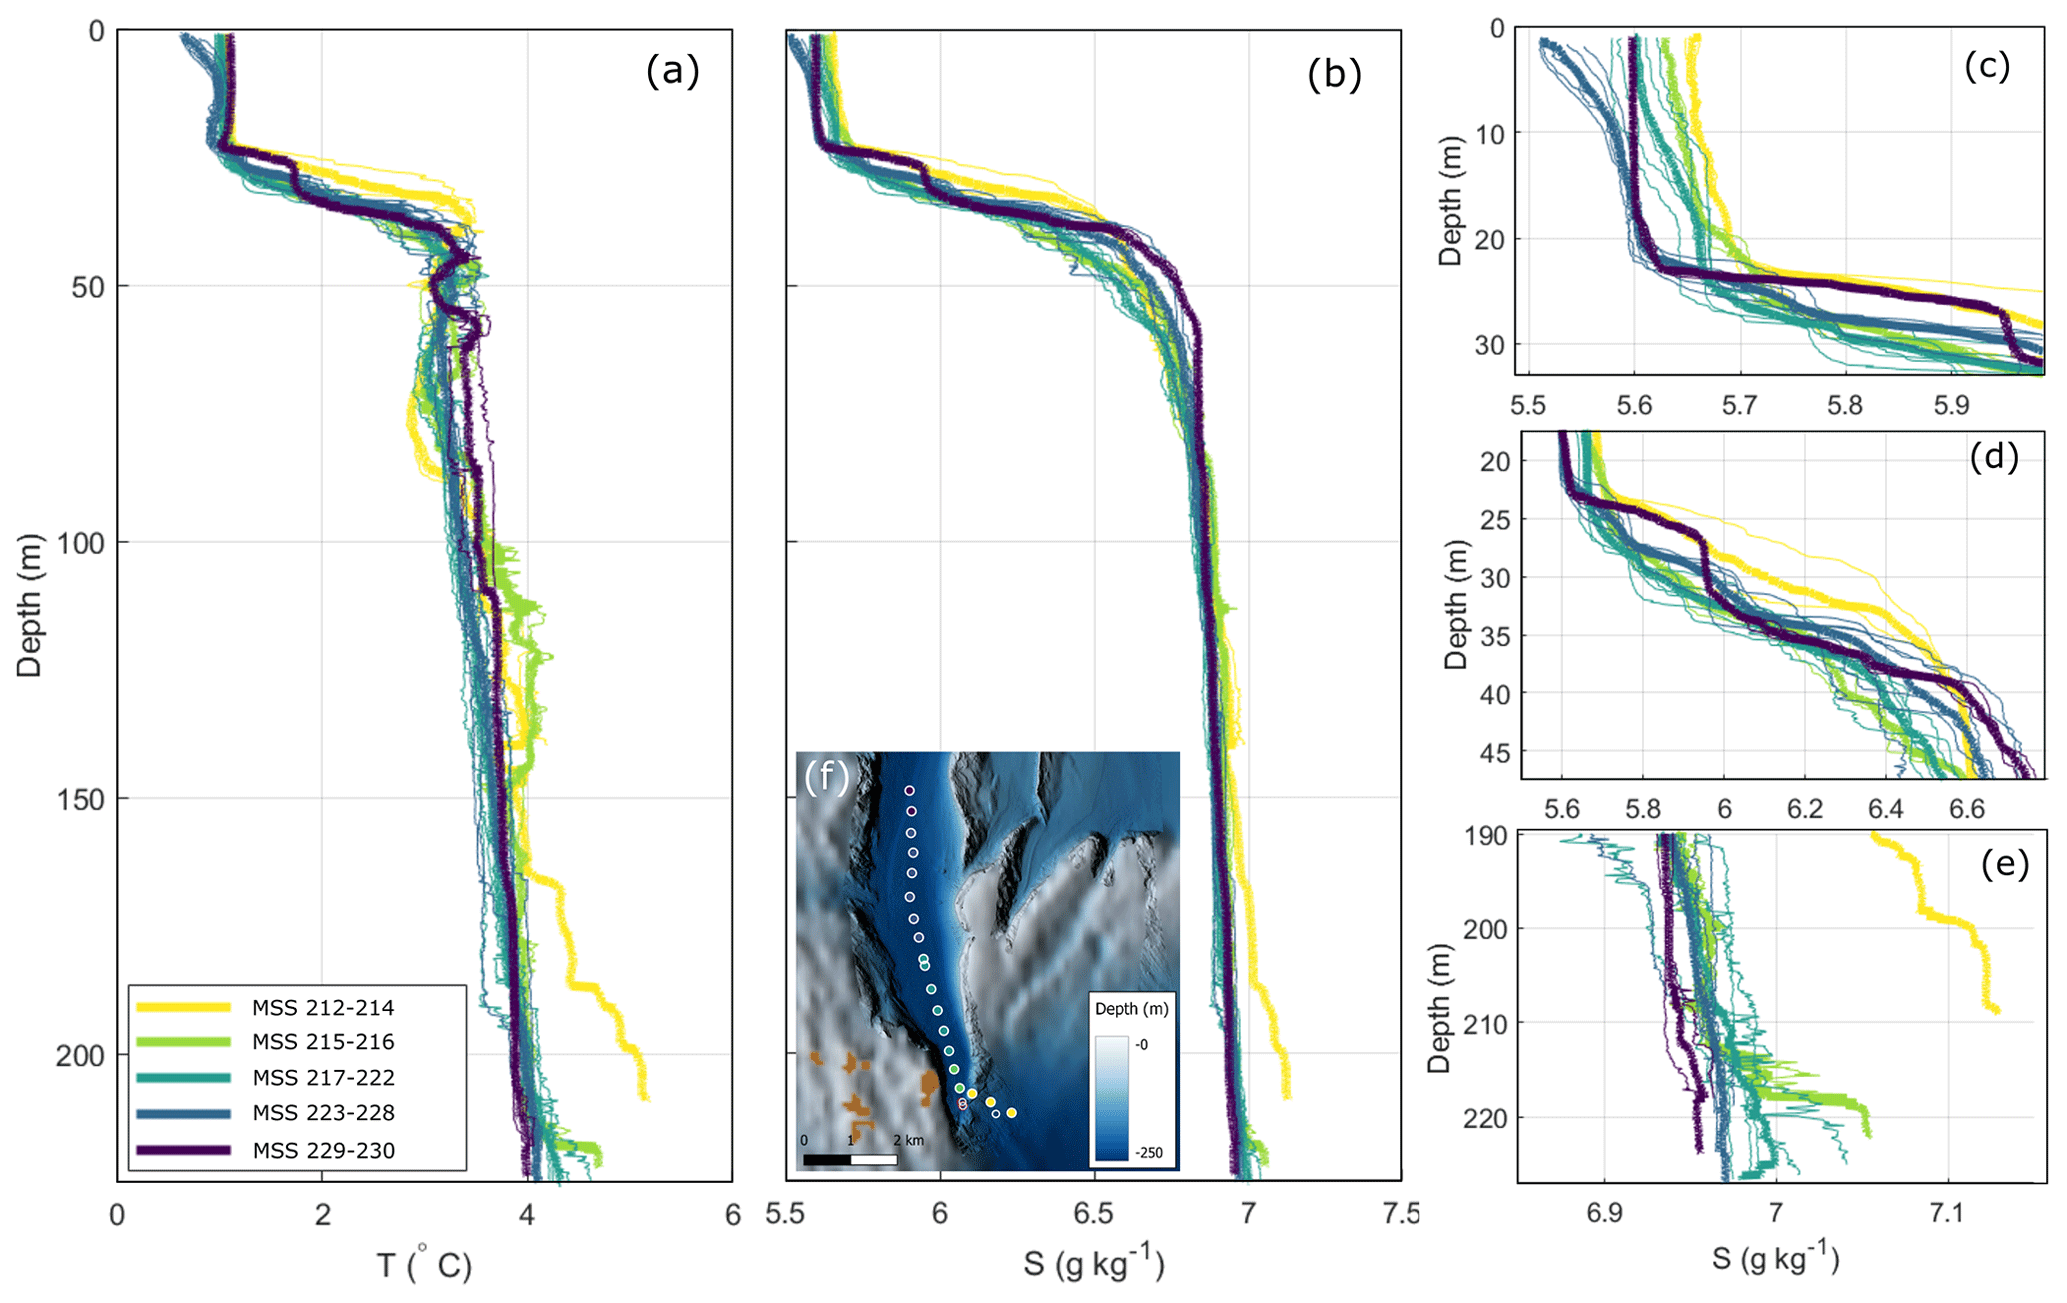
Figure 5MSS profiles of conservative temperature (a) and absolute salinity (b) at positions shown on the map (Fig. 2). Panels (c–e) show absolute salinity in the mixed layer, halocline, and bottom layer as in (b). (f) Map of collected data along the transect across the Southern Quark Sill. Dots represent MSS casts 212 to 230, collected during EL19, on 26 February 2019, 14:54–17:43 UTC, shown in (a)–(e). Circles show positions of moorings during EL19 (red) and EL20 (white). Deep-water salinity and temperature decrease from south to north. Halocline becomes deeper towards the north. The two profiles furthest north show a distinctly different signal than the others.
4.2 Time series of mixing in the vicinity of the Southern Quark Sill
In order to capture the temporal variability and average mixing rates related to the Southern Quark Sill, the southern part of the transect shown in Figs. 2–5 was sampled repeatedly during both cruises EL19 and EL20. Observational data were collected along a 2–3 km long transect across the Southern Quark Sill. Broadband acoustic observations of this sampling effort, backed up by microstructure measurements, reveal the temporal development of the flow at high spatial resolution. We interpolated acoustic data from subsequent transects across the sill and created in total three videos showing how flow direction and mixing rates change over time. Continuous sampling of the sill took place during EL19 between 25 February 2019, 18:30 UTC, and 26 February 2019, 16:00 UTC (Fig. 6, Video SV1, Table S1, Supplement), and during EL20 between 4 March 2020, 21:30 UTC, and 5 March 2020, 14:30 UTC, as well as between 5 March 2020, 17:20 UTC, and 6 March 2020; the latter sampling took place without collocated MSS measurements (Fig. 6, Video SV2, Table S2, and Video SV3, Supplement). During all continuous measurements of the transect, the upward-looking ADCP moorings were deployed, and the collected data are shown in Figs. 7 and 8. The ADCP time series show that the deep-water flow across the Southern Quark Sill was not always northwards, as in the case during the single transect shown in Figs. 2–5. In fact, flow reversals in the deep water occurred during both cruises, EL19 and EL20, on the timescales of days (Figs. 7 and 8), which is in good agreement with the acoustic observations (SV1–SV3) and MSS data (not shown here in the form of interpolated transects) that show increased turbulent mixing alternating south and north of the sill. During EL19, the acoustic observations show how hydraulic control is established, leading to trapped internal waves on the lee side of the sill that cannot propagate upstream anymore (Fig. 6a, Video SV1). At about 06:00 UTC on 26 February 2019, hydraulic control breaks down, causing increased mixing in the entire water column, and one can see how shear instabilities and internal waves move upstream again (Fig. 6b). After a short phase of calmer conditions (Fig. 6c), deep-water currents pick up again towards the end of the video and mixing is increased again (Fig. 6d). During EL20, acoustic backscatter from turbulent mixing was overall weaker, but one can clearly see how the flow direction changes repeatedly in both videos, causing increased backscatter from turbulent mixing on either side of the sill (Fig. 6e–l, SV2, and SV3).
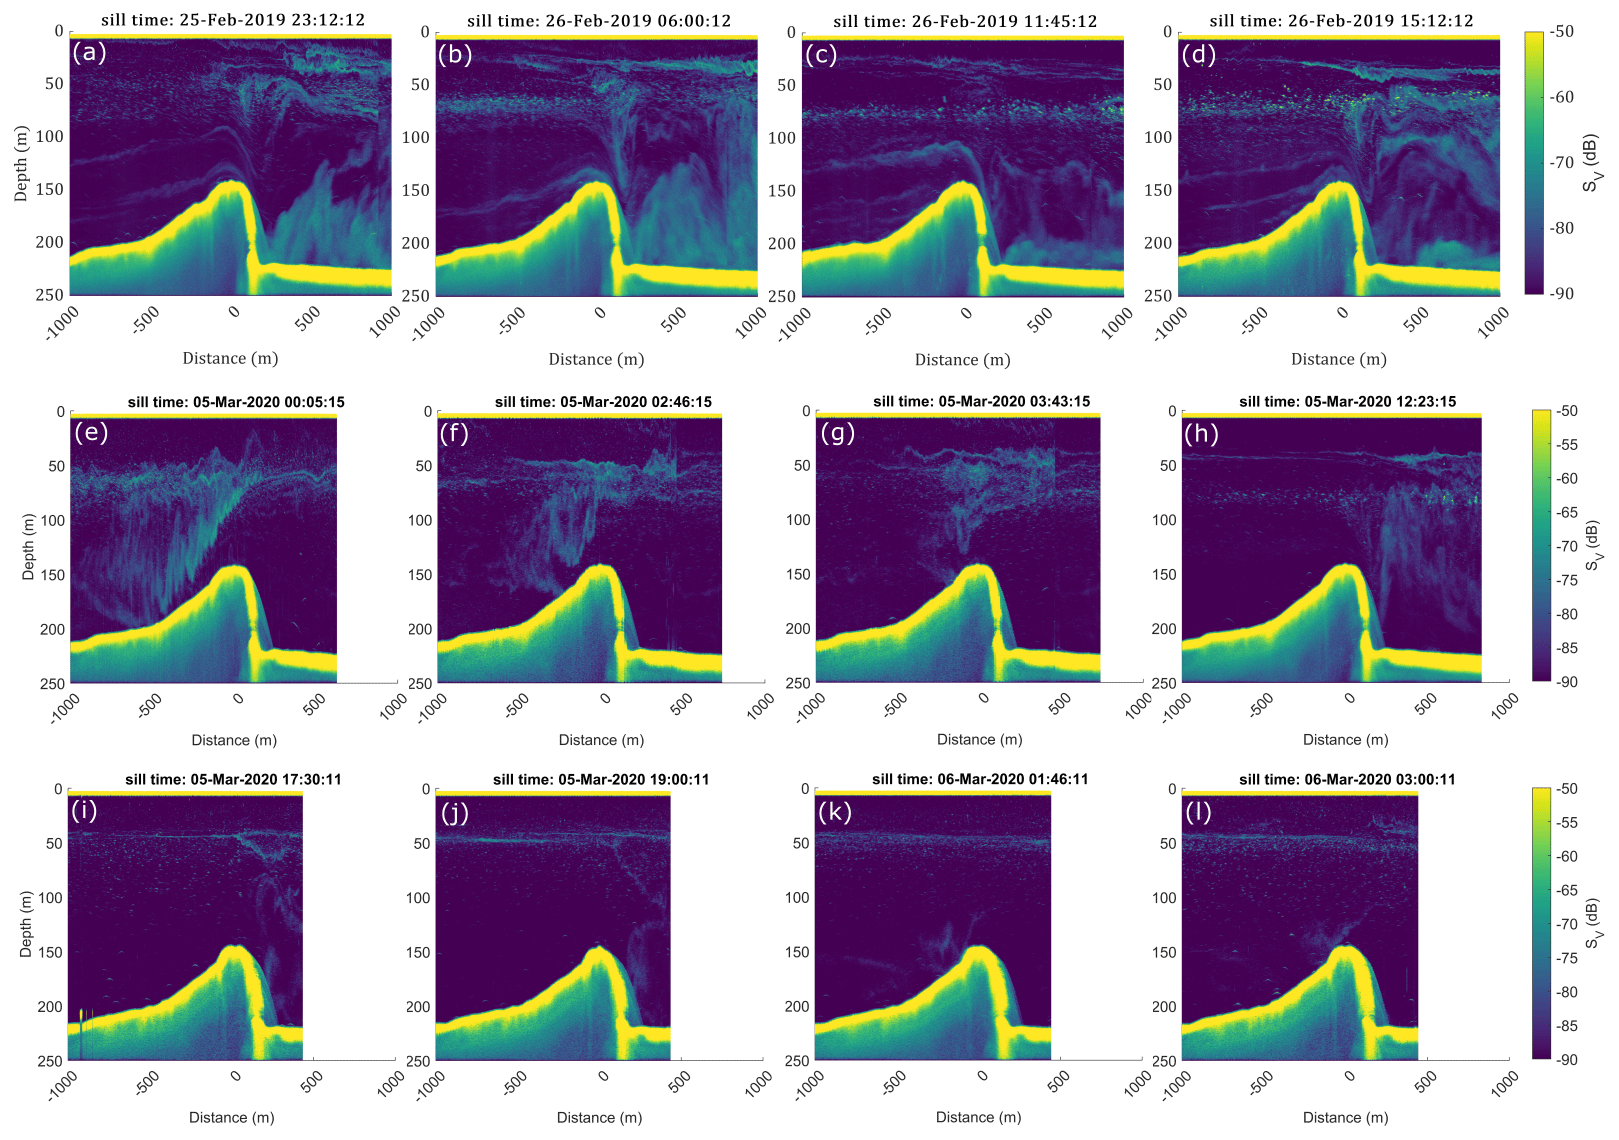
Figure 6Snapshots extracted from Supplement videos SV1 (a–d), SV2 (e–h), and SV3 (i–l), showing acoustic backscatter strength from turbulence microstructure for different regimes of the overflow. Flow velocities were overall higher during EL19 (a–d) compared to EL20 (e–l), where flow reversals occurred more frequently (see Figs. 7, 8).
Mooring ADCP data show that during EL19, a flow reversal occurred only once, from the dominant northward direction to southward-flowing currents on the second day of the cruise. In contrast, during EL20, flow reversals occurred more frequently and the direction of the deep-water flow was around 60 % of the time northward. While we only deployed one moored ADCP north of the sill in 2019, we deployed two moored ADCPs south and north of the sill in 2020. Assuming an average stratification in the water below the halocline of s−2 and a sill height of h=80 m, we calculated the topographic Froude number , using the absolute velocity as measured by the moored ADCPs, averaged from 150 m water depth to the bottom, for southward and northward flow. The estimate of N2 creates uncertainty in the following discussion, as it can easily vary and fluctuate by 1 order of magnitude over time and in space. Nevertheless, with the definition above, a Froude number of 1 indicates that there is likely a hydraulic jump at the position of the mooring; a Froude number above 1 (higher velocities than Fr=1) indicates that conditions for a hydraulic jump are likely met in the vicinity of the ADCP measurement. During EL19, Fr was above 1 for 38 % of the time for northward flow at the position of the ADCP mooring north of the sill. In EL20 the condition was never met for northward flow at the position of the mooring north of the sill, but it was met 32 % of the duration of the deployment for southward flow at the position of the mooring south of the sill. This might explain the energy dissipation and vertical flux rates in the region around the sill discussed below (Fig. 9), which were comparable during the two cruises although northward flow in the deep layer was much weaker during EL20 than it was during EL19. Overall currents north of the sill changed direction more frequently and were weaker and less barotropic during EL20 compared to EL19 (compare Fig. 7 with Fig. 8a).
The predominant non-tidal estuarine-type circulation with deep water flowing northward is often reversed in the presented ADCP observations. Periods with increased measured sea level at the SMHI station in Forsmark (slightly north of the study area: 60.4086∘ N, 18.2108∘ E) compared to the sea level at the SMHI station in Landsort Norra (south of the study area: 58.7689∘ N, 17.8589∘ E), are consistently followed by reversing, southward flow in the deep water (Figs. 7 and 8). Wind velocity and direction as measured at SMHI station Örskär in the vicinity of the study region during cruise EL19 (Supplement Fig. S1) and cruise EL20 (Supplement Fig. S2) change on timescales that are comparable to those at which current directions in the deep water change and vary more frequently during EL20 compared to EL19. Based on changes in sea level and wind data, reversing flow conditions are likely caused by pressure gradients set up by atmospheric forcing. The observed flow reversals occur on timescales of days, and our data suggest that the deep water flushes back and forth between the basins in the Åland Sea. Flow reversals occurred more frequently during EL20 than during EL19. Yet, deep-water flow reversals occurred during both cruises on timescales of several days, in contrast to previously estimated flow reversals on timescales of several months (Kullenberg, 1981).
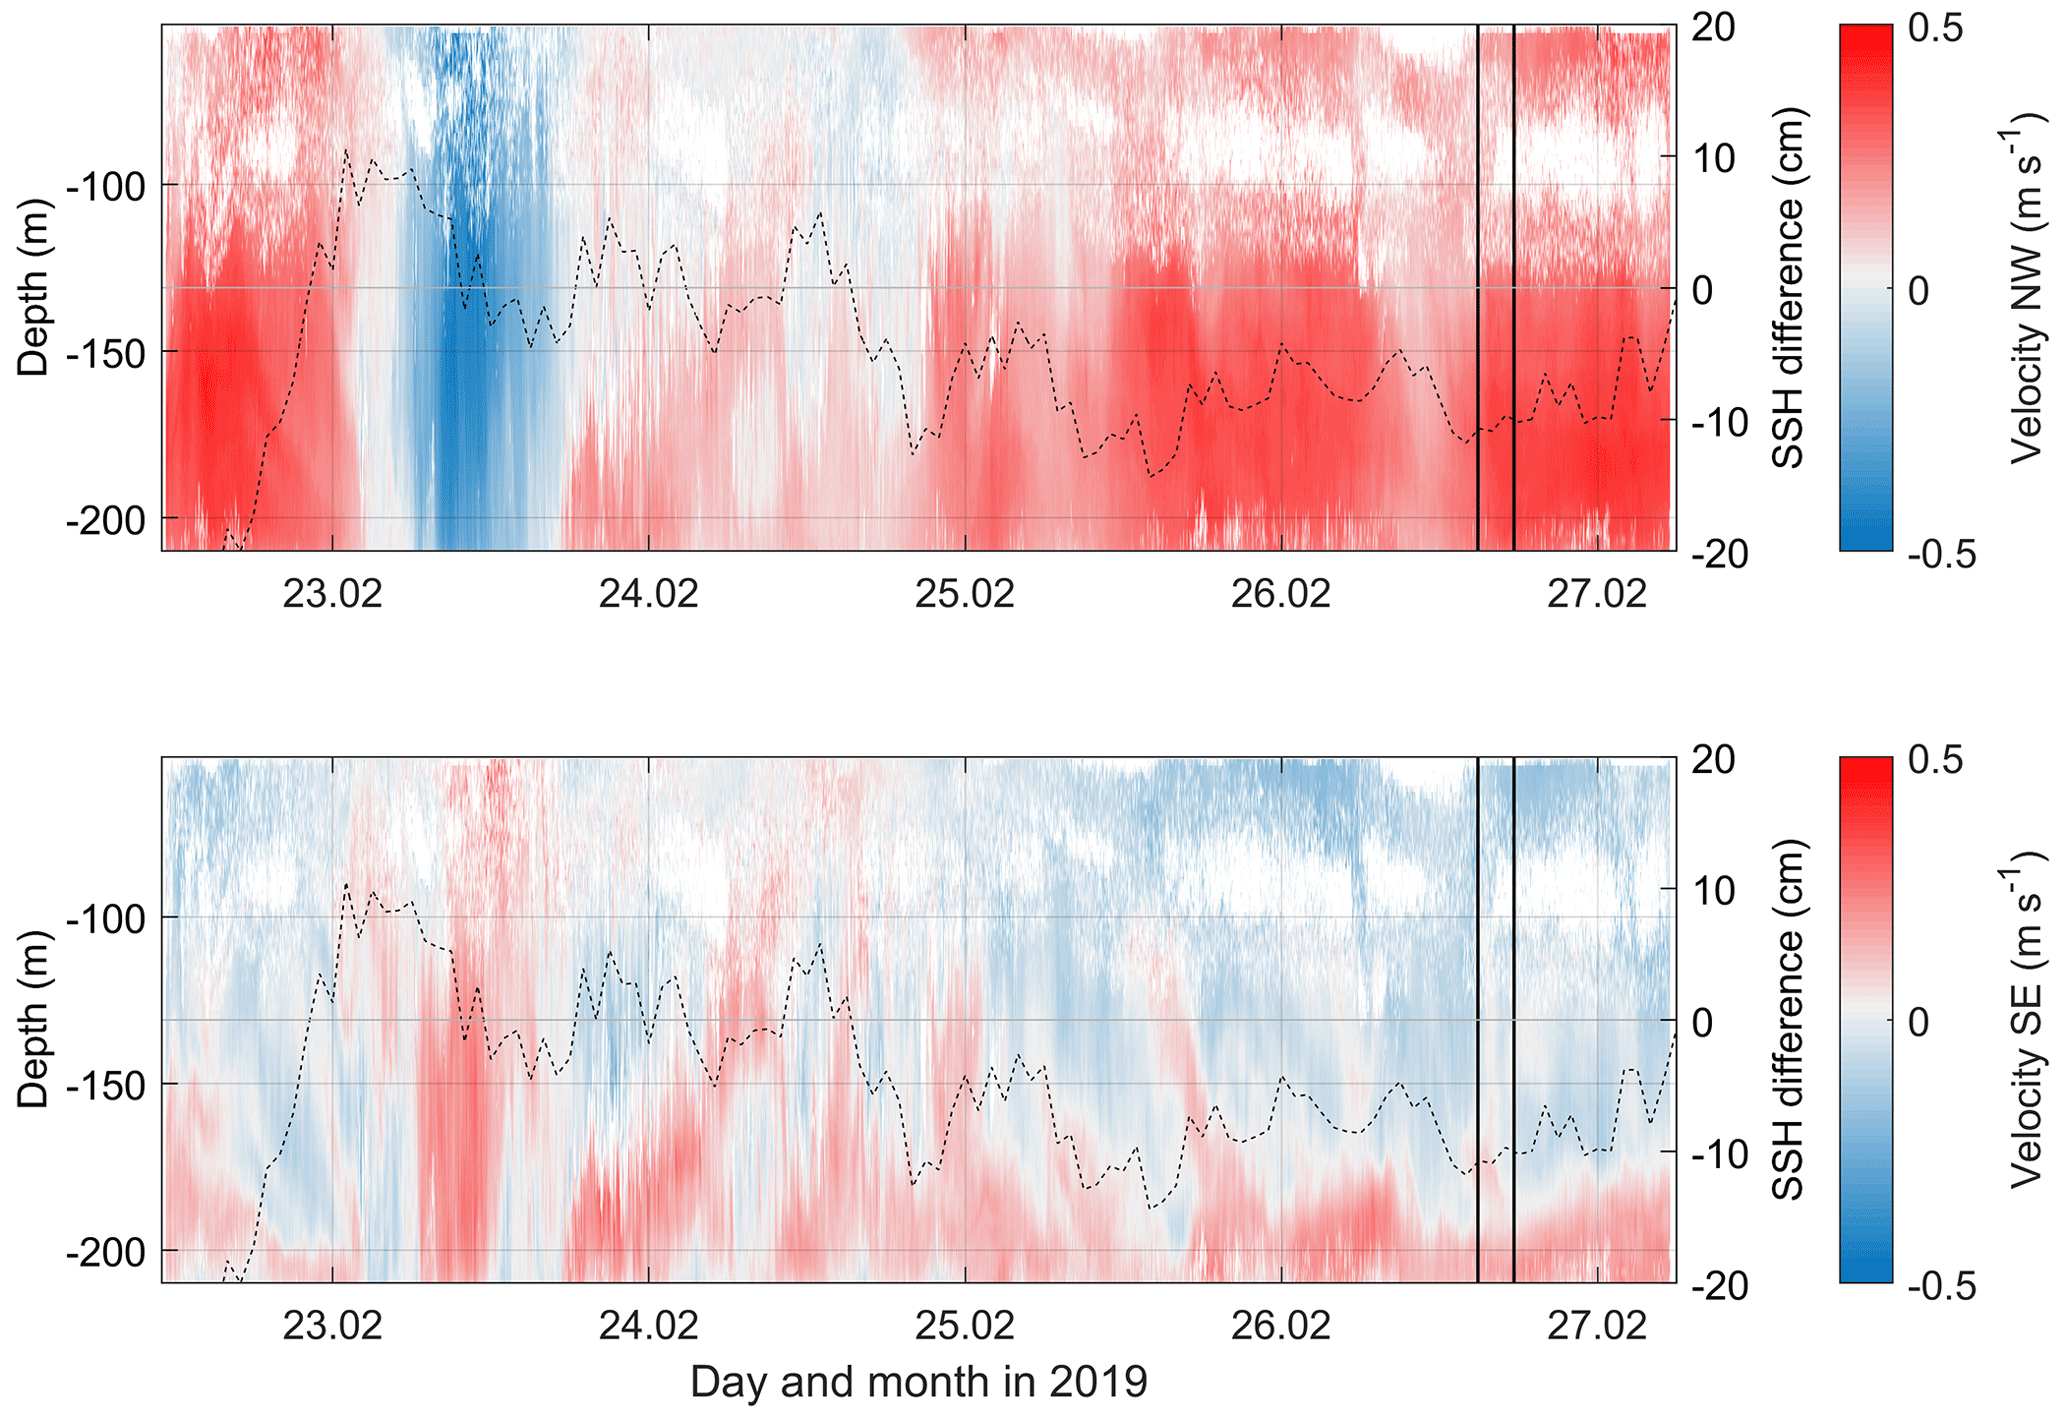
Figure 7ADCP mooring data collected during EL19 north of the sill. Vertical black lines mark the start and end times of the transect shown in Figs. 2 and 3. The position of the mooring and flow directions is shown in Fig. 1c; directions are aligned with the repeatedly sampled transect across the Southern Quark Sill. Dotted lines show the difference in sea surface height between Forsmark (slightly north of the study region) and Landsort (south of the study region) from SMHI.
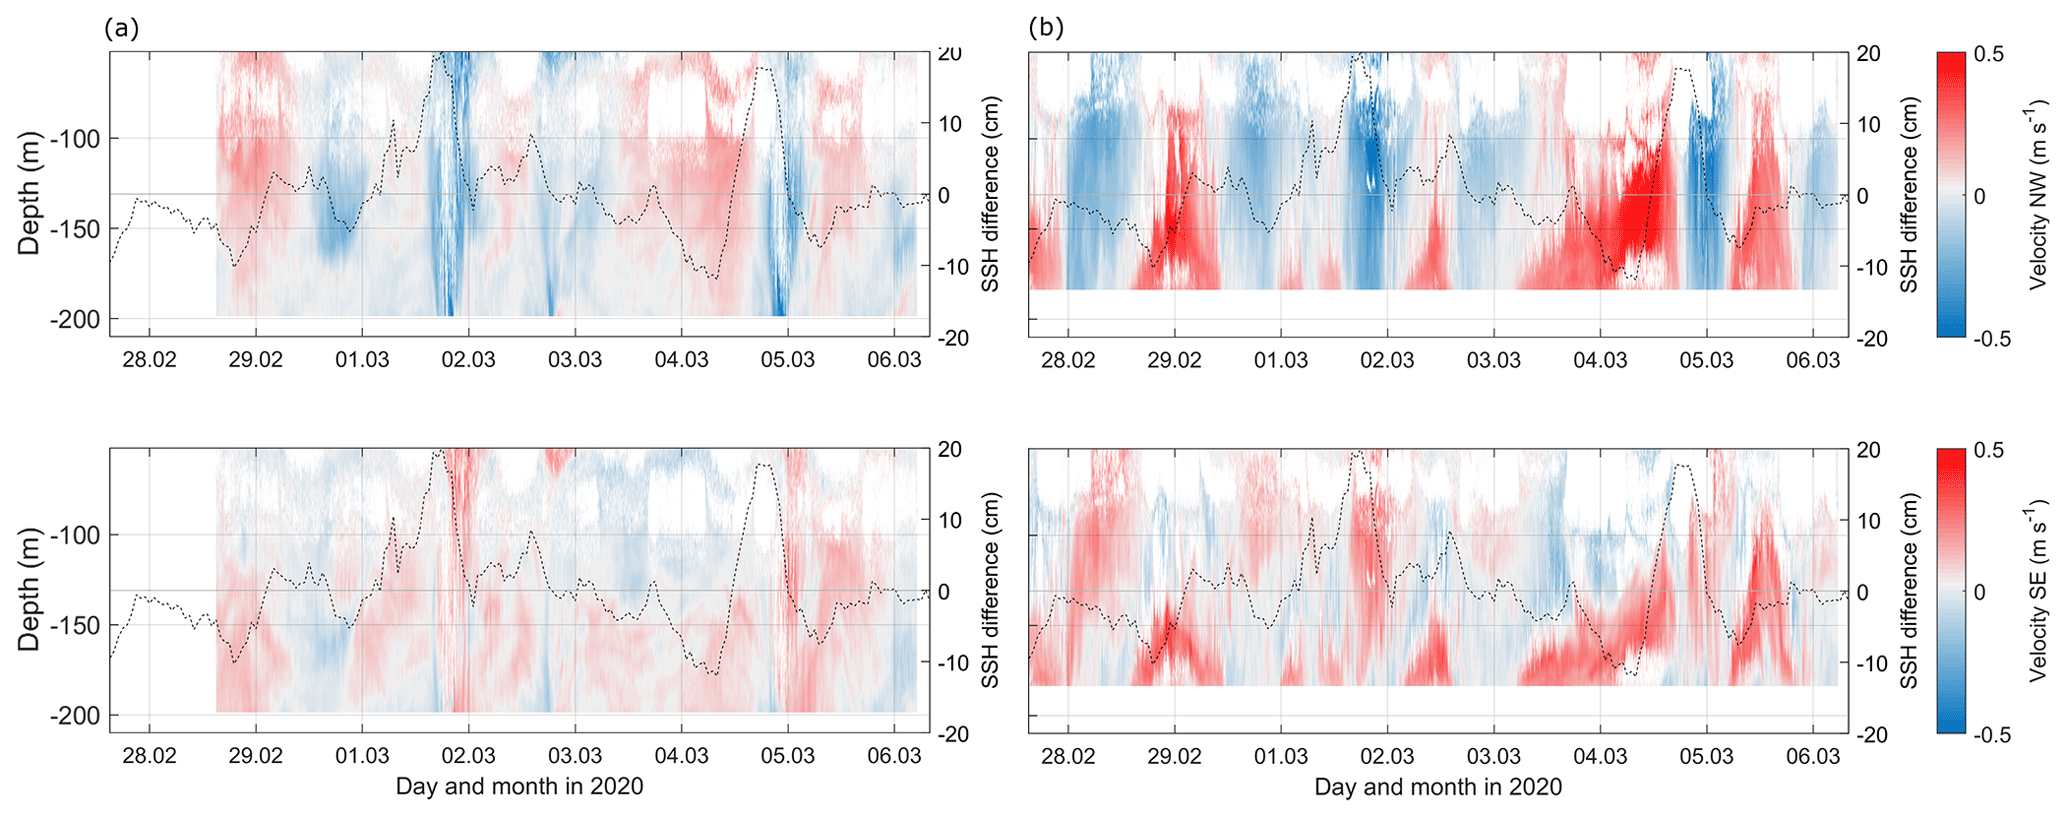
Figure 8ADCP mooring data collected during EL20 (a) north of the sill and (b) EL20 south of the sill (positions of moorings and directions along and across the transect are shown in Fig. 1c). Dotted lines show the difference in sea surface height between Forsmark (slightly north of the study region) and Landsort (south of the study region) from SMHI.
To quantify the amount of mixing related to the reversing overflow of deep water over the Southern Quark Sill during the entire time of both cruises, we compare all MSS profiles collected in the vicinity of the sill with reference stations south of the sill (Fig. 9). During EL19, MSS casts were obtained several kilometers south of the sill and are here used as a reference station which is far enough away to be unaffected by the overflow over the Southern Quark Sill (Fig. 1c, black dots). During EL20 such full-depth MSS casts were unfortunately not collected. With the lack of a better option we therefore use MSS casts obtained about 500 m south of the southernmost MSS casts that are on the transect chosen for the analysis (Fig. 1c, d, gray dots). For the calculation of dissipation rates, vertical turbulent diffusivities and salt fluxes, we removed the lowest 10 m of data close to the seafloor. The increase in vertical diffusivities below 200 m depth in the EL19 reference measurements (Fig. 9e, black lines) is likely related to the decrease in buoyancy frequency (Fig. 9c, black lines), as the measured dissipation rates are close to the noise level of the profiler.
We find that energy dissipation (10−7–10−6 W kg−1), turbulent vertical mixing (0.001–0.1 m2 s−1), and vertical salt flux rates (0.01–1 g m−2 s−1) are increased by 2 to 4 orders of magnitude near the Southern Quark Sill compared to reference stations south of the sill, during both cruises EL19 and EL20 (Fig. 9d–f). Additionally, as shown in Muchowski et al. (2022b), diapycnal mixing across the halocline was increased by up to 2 orders of magnitude in a northwestern part of the study region during EL20 (Fig. 9, yellow lines). To maintain the general estuarine-type circulation in the Baltic Sea, an estimated mean diapycnal salt transport (from the deeper water across the pycnocline into the surface water) of 30 kg m−2 a−1 is needed (Reissmann et al., 2009). This equals a vertical salt flux of approximately 0.001 g m−2 s−1. The vertical salt transport in the halocline in this study measured in both regions, i.e., near the sill as well as in the northwestern shallow part of the study region, is an order of magnitude larger than this at around 0.01 g m−2 s−1. It is important to note that Reissmann's estimate includes vertical transport during Major Baltic Inflows as well as all other sources of mixing.
A high-resolution (500 m) modeling study of the Åland Sea was recently published by Westerlund et al. (2022), using the 3D hydrodynamic model NEMO 4.0.3. They show that previous CTD measurements of the deep water at the entrance of the Bothnian Sea are on average about 0.5 g kg−1 fresher and about 1 ∘C colder than modeled by NEMO (their Fig. 3). While NEMO overestimates the deep-water salinity, it underestimates the surface-water salinity on average by 0.5 g kg−1 compared to CTD measurements in both the Åland and the Bothnian seas. Furthermore, the deep water in the Lågskär Deep, south of the Åland Sea Proper but north of the southern Åland Sill (station F69 in their figure 1b), is observed to be on average saltier than predicted by NEMO. While observations show a change in average deep-water salinity from above 8 g kg−1 (station F69) to 7 g kg−1 in the Southern Quark (F64) to 6.5 g kg−1 in the Bothnian Sea (F33), the deep-water salinity in NEMO only changes from just below 8 g kg−1 south of Southern Quark to just above 7 g kg−1 in the Southern Quark and remains fairly constant all the way to the Bothnian Sea. Westerlund et al. (2022) point out that boundary conditions are a major contributor to uncertainties in their model. Our study suggests that, in addition, turbulent mixing in the Southern Quark might not be accurately captured by NEMO. We hypothesize that our observations of mixing related to the overflow over the Southern Quark Sill as well as mixing across the halocline in a shallower region northwest of the sill (Muchowski et al., 2022b) could partly explain mismatches. While Westerlund et al. (2022) compare CTD profiles from the Åland (station F64 in their Fig. 1b) and the Bothnian seas (station F33 in their Fig. 1b) with model output, we show additional data between those two stations, in the Southern Quark.
Oxygen measurements show a direct consequence of the observed mixing during the EL19 cruise, where we have a reference station sufficiently far away from the sill (Fig. 1c). Due to entrainment of oxygen-rich waters from the north, oxygen rates in the vicinity of the sill were higher along isohalines than those at the reference station south of the sill (Fig. 10).
The average halocline depth near the sill (averaged over all profiles collected near the sill in each cruise) varies by more than 20 m between EL19 and EL20 (Fig. 9c) and by approximately 30 m between single profiles collected in different regions during EL20 (Fig. 9a, b). During EL19 we measured a drop in the halocline depth of 15 m within approximately 2 km distance in the vicinity of a stagnation wedge slightly north of the sill (MSS 263–264). The mixed layer depth south and north of the sill during this transect changes by 10 m (MSS 262 ca. 15 m, MSS 264 ca. 25 m).
The following studies show a large variability and partial mismatch with observational data as well as when compared with other model results but lack an explanation. A study by Meier (2007), using the 3D eddy-permitting Rossby Center Ocean model estimated the halocline depth in the Southern Quark to be around 25 m (their Fig. 7), while Ahola (2021), Westerlund and Tuomi (2016), and Håkansson et al. (1996) estimated the halocline depth to be between 50–80 m depth. Our observations show that the halocline depth in the Southern Quark has a high spatio-temporal variability of about 30 m depth within days and several kilometers, which may explain the mismatch mentioned above. Along the same lines as our observations, Elken et al. (2006) found that temporal counter-estuarine transport causes large changes in halocline depth (> 20 m) and greatly increases turbulent mixing in the northern Baltic Proper, in particular near bathymetric features.
Changes in halocline depth in the northern Baltic Proper alter the amount of deep water and thereby the amount of salt, phosphorus, and other dissolved substances that can enter the Åland Sea and eventually the Bothnian Sea. Additionally, the amount of saltier deep water entering the Åland Sea from the northern Baltic Proper depends on water properties in the northern Baltic Proper. The described changes in halocline and surface mixed layer depth in space as well as over time, together with the large bathymetric variability in the Southern Quark, will likely lead to mixing hotspots in different regions at different times and due to varying underlying mixing mechanisms. The fact that all above-described processes occur on small scales of several hundreds of meters to several kilometers, makes in situ observations as well as numerical simulations of the region cost and time intensive. In fact, microstructure turbulence observations often cannot resolve the highly dynamic spatio-temporal developments in this region with drastically varying bathymetry due to their one-dimensional nature.
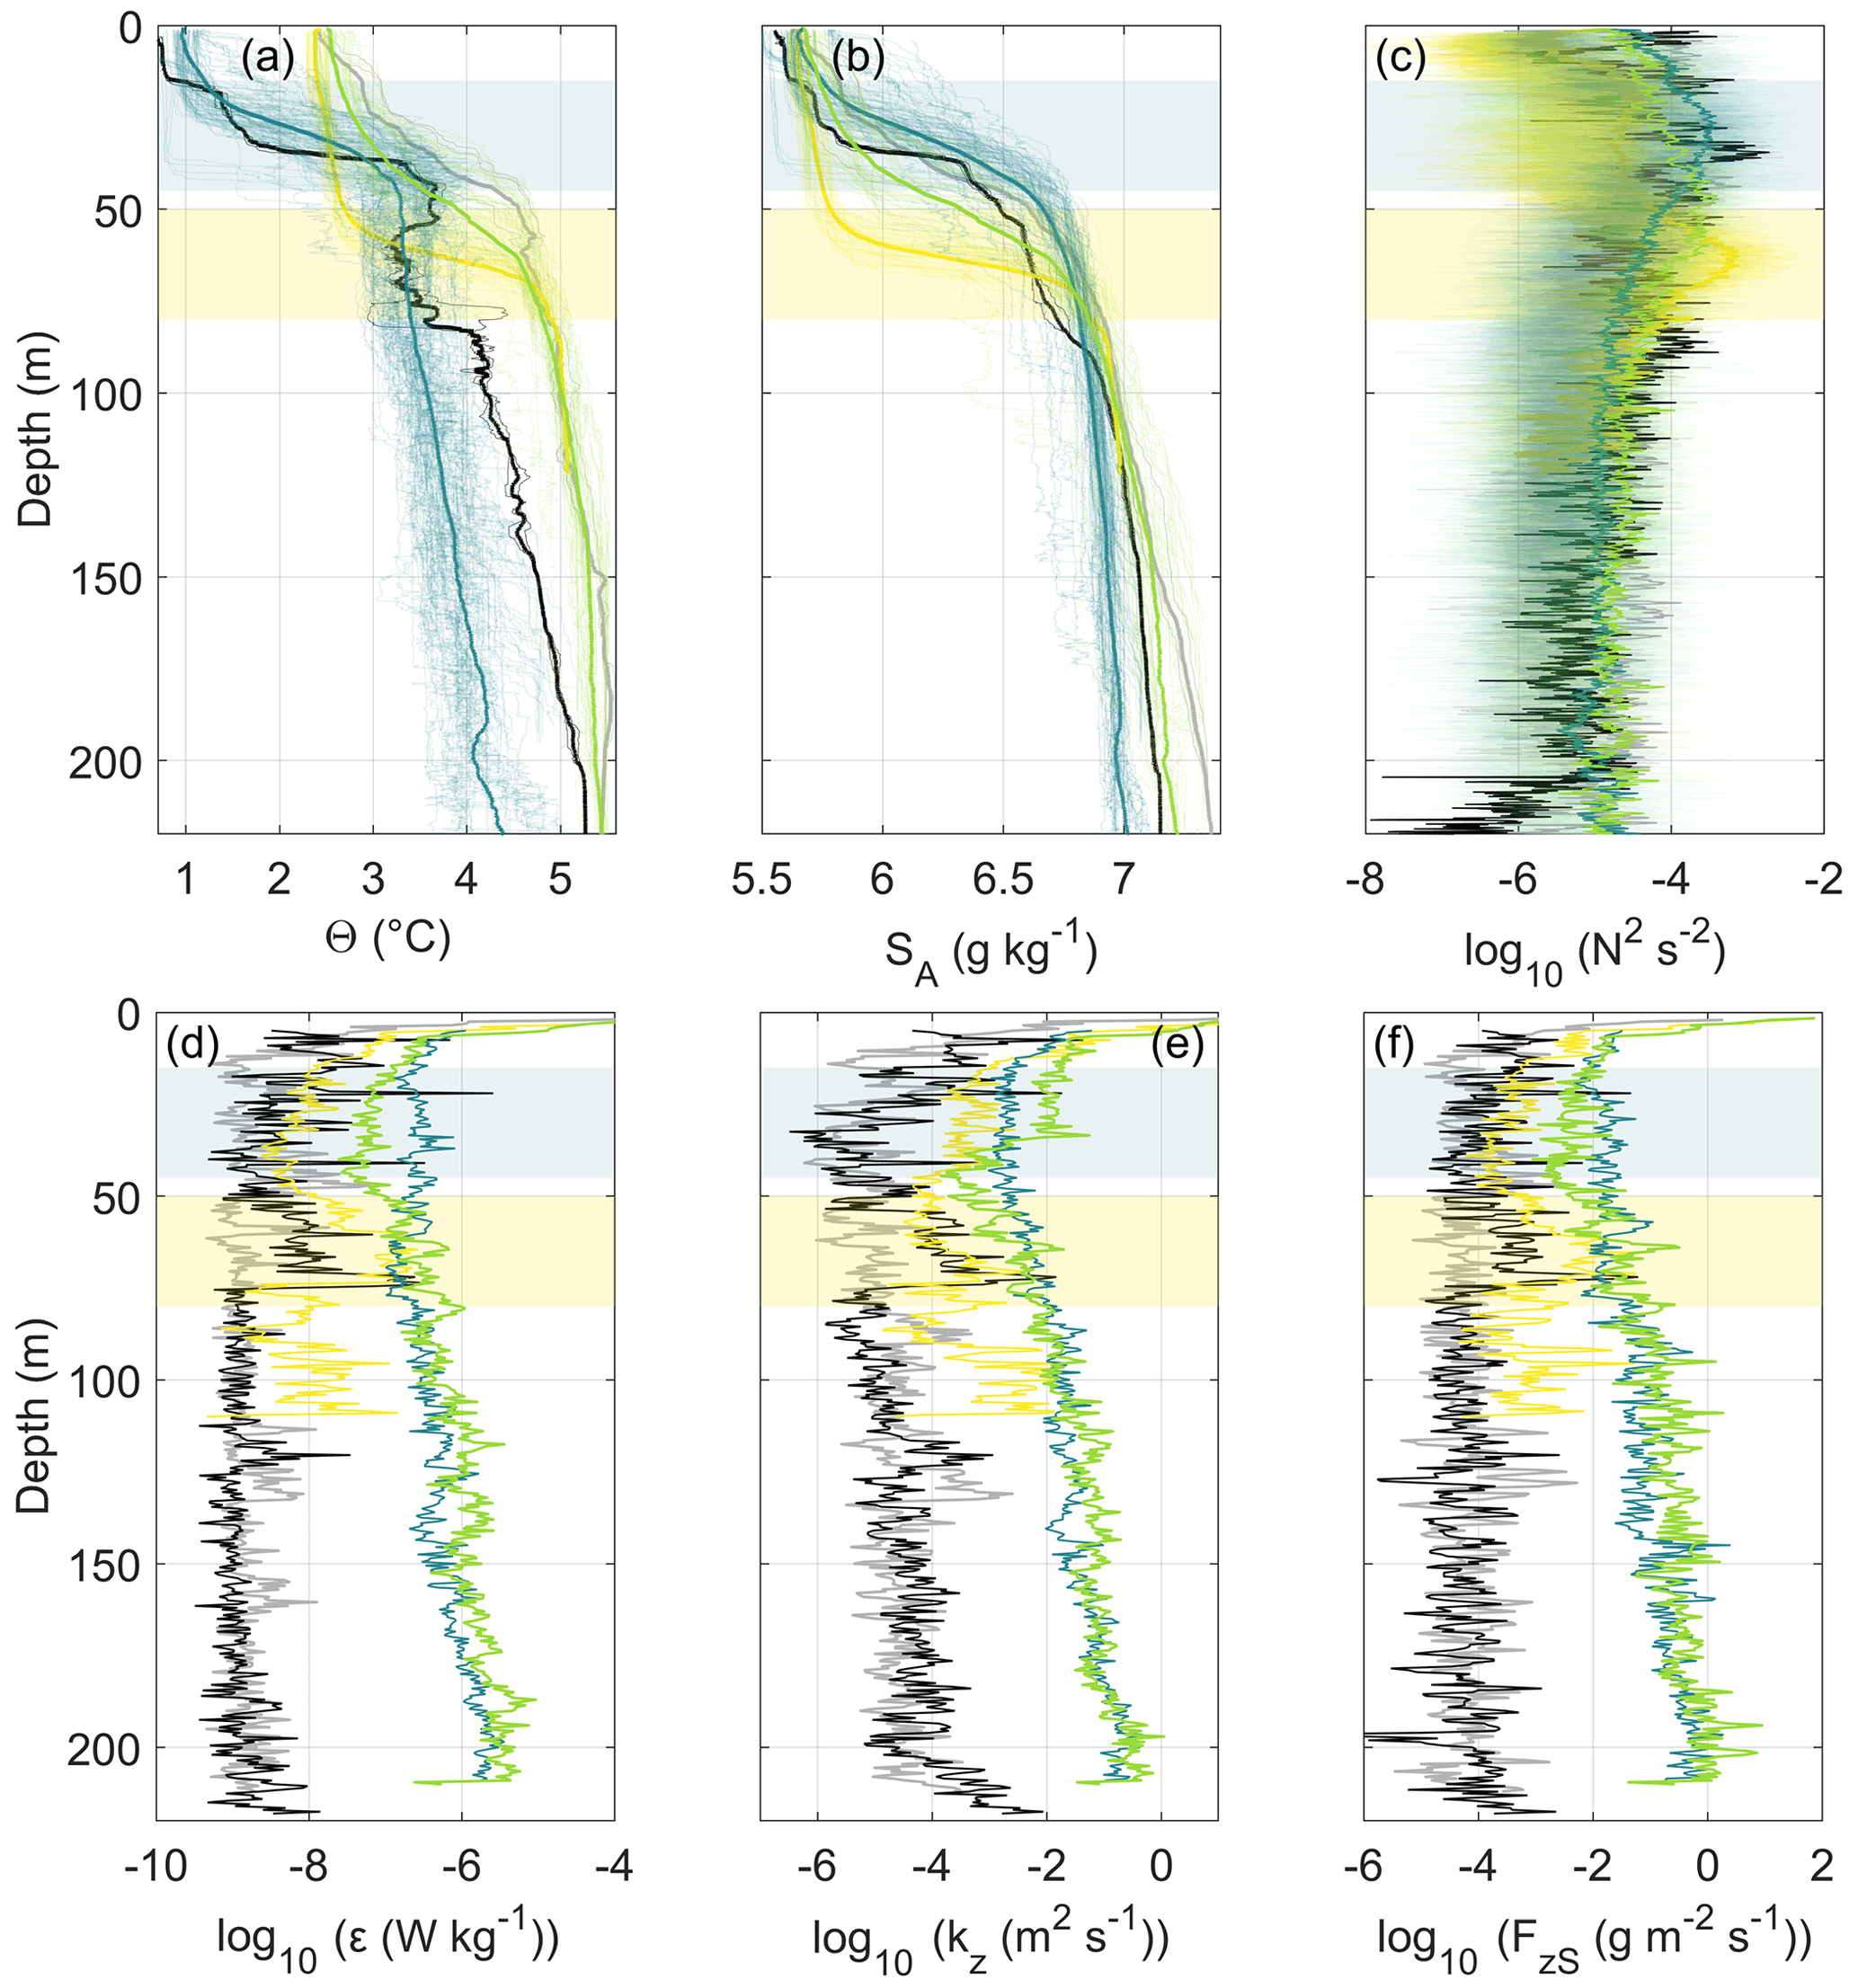
Figure 9Reference stations south of the sill in EL19 (MSS 3, 5) and EL20 (MSS 18, 19, 152) (black and gray, respectively), 98 MSS profiles near the sill in EL19 (turquoise), 63 MSS profiles near the sill in EL20 (green), stations in the northwest shallow area (yellow) and their average (thick lines). Dates and exact position of MSS casts used are listed in Tables S3 (casts during EL19) and S4 (casts during EL20), Supplement. The halocline region is marked as shaded background with corresponding colors.
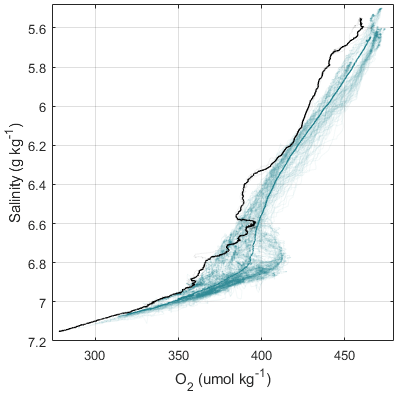
Figure 10Oxygen as a function of salinity, comparing 99 MSS casts collected near the Southern Quark Sill during EL19 (turquoise), with those from a reference station south of the sill (black) and their average (thick lines). Data from same MSS casts as shown in Fig. 9 (turquoise and black, respectively).
Average energy dissipation rates (10−7–10−6 W kg−1), vertical diffusivities (0.001–0.1 m2 s−1), and salt flux rates (0.01–1 g m−2 s−1) were increased by 3–4 orders of magnitude in a reversing stratified overflow over a prototypical sill and through a connected deep valley compared to a reference station not directly impacted by the overflow. Our results highlight the importance of the Southern Quark for water exchange processes between the northern Baltic Proper and the Bothnian Sea. High-resolution acoustic broadband midwater and multibeam bathymetry data were central in this study to observe and visualize the particularly dynamic and localized turbulent mixing as well as to study its underlying mechanisms. Based on the latest EMODNET bathymetry of the Åland Sea, which shows a large variability in bathymetric features in the entire region, and our observational data, we conclude that the deep water (below the halocline) is likely modified in several locations along its way through the Åland Sea.
Muchowski et al. (2022b) investigated diapycnal mixing in the shallower, northwestern part of the study region (yellow dots in Fig. 1c), including the amount of turbulent mixing across the halocline observed in this region, and discussed potential underlying mixing mechanisms. Based on the observational data presented here and the findings in Muchowski et al. (2022b), we suggest that enhanced mixing in the Southern Quark is caused mainly by two mechanisms: (1) stratified flow over rough seafloor bathymetry on the order of several hundreds of meters, which causes topographic wake eddies and to a smaller extent also breaking internal waves – this mechanism alone can modify the deep-water salinity by ∼ 0.1 g kg−1 (Muchowski et al., 2022b); (2) potential blocking of the deep water by the Southern Quark Sill and the development of internal lee waves related to the overflow which travel upwards and break when encountering the halocline, shear instabilities due to opposing flow directions of the surface layer with the water below, and hydraulic jumps. Hydraulic jumps are known to locally increase turbulent mixing by orders of magnitude (e.g., Farmer and Armi, 1998; Arneborg et al., 2017). Data presented in this study show that a hydraulic jump in the vicinity of a sill in the Southern Quark was present in > 30 % of our field measurements in 2019 and 2020 and that this is associated with strong vertical mixing at these time intervals.
The observed mixing related to the steep bathymetric features depends greatly on the flow conditions, the stratification, halocline depth, and mixed layer depth. All these factors make a general description as well as accurate numerical modeling of the exchange and water modification processes in the Åland Sea extremely challenging. Yet, mixing in the Southern Quark is likely not only important for the local conditions in the area but also broadly affects exchange processes between the northern Baltic Proper and Bothnian Sea. The observed strong mixing will likely impact the ventilation and residence time of the deep water, as well as oxygen and nutrient concentrations in the Bothnian Sea, the surface water in the northern Baltic Proper, and the larger-scale circulation in the entire Baltic Sea. For example, the observed mixing in the Southern Quark could impact cyanobacteria blooms in the Bothnian Sea as it affects the transport of phosphorous that originates in the northern Baltic Proper and propagates northward through the Åland Sea (Rolff and Elfwing, 2015). An improved parametrization of mixing and basin exchange processes in the northern Baltic Sea could be used together with the Åland Sea to create long-term estimates of the water exchange volume between the northern Baltic Proper and the Bothnian Bay, similar to the analysis of Major Baltic Inflows by Matthäus and Franck (1992).
Datasets are published openly accessible on the Bolin Centre Database (https://doi.org/10.17043/muchowski-2023-aland-sea-2019-2020-1, Muchowski et al., 2023).
Video supplements are published together with the datasets on the Bolin Centre Database (https://doi.org/10.17043/muchowski-2023-aland-sea-2019-2020-1, Muchowski et al., 2023).
The supplement related to this article is available online at: https://doi.org/10.5194/os-19-1809-2023-supplement.
JM led the work and wrote most of the paper. MJ wrote parts of the introduction as well as the background on bathymetry section and contributed to all other parts with feedback and editing. LU, LA, and PH led discussions on the interpretation of turbulence data and contributed with writing, editing, and comments. BG and CH provided input on impacts and consequences for the Baltic Sea and contributed with feedback and comments. BG contributed to the section on sea surface height analysis. CS contributed with fruitful discussions, support, and with writing and editing. All authors provided critical feedback and commented on the paper.
The contact author has declared that none of the authors has any competing interests.
Publisher’s note: Copernicus Publications remains neutral with regard to jurisdictional claims made in the text, published maps, institutional affiliations, or any other geographical representation in this paper. While Copernicus Publications makes every effort to include appropriate place names, the final responsibility lies with the authors.
We thank Martin Sass and Toralf Heene (IOW, Germany) for technical support with the MSS and moorings. We thank Florian Roth, Ole Pinner, Emelie Ståhl, and Jen-Ping Peng for helping with data collection. We thank captain Thomas Strömsnäs and the crew of the R/V Electra for their strong support.
This research has been supported by the Vetenskapsrådet (grant no. 2018-04350 and 2022-04081), the Deutsche Forschungsgemeinschaft (grant no. HO5891/1-1), the Leibniz-Gemeinschaft (grant no. K227/2019), the Östersjöcentrum, Stockholms Universitet (strategic funds for Baltic Sea research), and Havs och Vattenmyndigheten (grant no. 1:11 – Measures for marine and water environment).
The article processing charges for this open-access publication were covered by Stockholm University.
This paper was edited by Mehmet Ilicak and reviewed by two anonymous referees.
Ahola, M.: Climate Change in the Baltic Sea2021 Fact Sheet: Baltic Sea Environment Proceedings no. 180, HELCOM/Baltic Earth 2021, Swedish Museum of Natural History, Department of Environmental research and monitoring, ISSN: 0357-2994, 2021.
Arneborg, L., Jansson, P., Staalstrøm, A., and Broström, G.: Tidal energy loss, internal tide radiation, and local dissipation for two-layer tidal flow over a sill, J. Phys. Oceanogr., 47, 1521–1538, 2017.
Beckholmen, M. and Tiren, S. A.: The geological history of the Baltic Sea, A review of the literature and investigation tools, Swedish Radiation Safety Authority, ISSN: 2000-0456, 2009.
Breitburg, D., Levin, L. A., Oschlies, A., Grégoire, M., Chavez, F. P., Conley, D. J., Garçon, V., Gilbert, D., Gutiérrez, D., Isensee, K., Jacinto, G. S., Limburg, K. E., Montes, I., Naqvi, S. W. A., Pitcher, G. C., Rabalais, N. N., Roman, M. R., Rose, K. A., Seibel, B. A., Telszewski, M., Yasuhara, M., and Zhang, J.: Declining oxygen in the global ocean and coastal waters, Science, 359, eaam7240, https://doi.org/10.1126/science.aam7240, 2018.
Burchard, H., Bolding, K., Feistel, R., Gräwe, U., Klingbeil, K., MacCready, P., Mohrholz, V., Umlauf, L., and van der Lee, E. M.: The Knudsen theorem and the Total Exchange Flow analysis framework applied to the Baltic Sea, Prog. Oceanogr., 165, 268–286, https://doi.org/10.1016/j.pocean.2018.04.004, 2018.
Carstensen, J., Andersen, J. H., Gustafsson, B. G., and Conley, D. J.: Deoxygenation of the Baltic Sea during the last century, P. Natl. Acad. Sci. USA, 111, 5628–5633, 2014.
Chrysagi, E., Umlauf, L., Holtermann, P., Klingbeil, K., and Burchard, H.: High-Resolution Simulations of Submesoscale Processes in the Baltic Sea: The Role of Storm Events, J. Geophys. Res.-Ocean., 126, e2020JC016411, https://doi.org/10.1029/2020JC016411, 2021.
Cummins, P. F., Armi, L., and Vagle, S.: Upstream Internal Hydraulic Jumps, J. Phys. Oceanogr., 36, 753–769, https://doi.org/10.1175/JPO2894.1, 2006.
Dargahi, B., Kolluru, V., and Cvetkovic, V.: Multi-layered stratification in the Baltic Sea: Insight from a modeling study with reference to environmental conditions, J. Mar. Sci. Eng., 5, 2, https://doi.org/10.3390/jmse5010002, 2017.
Eilola, K. and Stigebrandt, A.: Spreading of juvenile freshwater in the Baltic proper, J. Geophys. Res.-Ocean., 103, 27795–27807, https://doi.org/10.1029/98JC02369, 1998.
Elken, J., Raudsepp, U., and Lips, U.: On the estuarine transport reversal in deep layers of the Gulf of Finland, J. Sea Res., 49, 267–274, https://doi.org/10.1016/S1385-1101(03)00018-2, 2003.
Elken, J., Malkki, P., Alenius, P., and Stipa, T.: Large halocline variations in the Northern Baltic Proper and associated meso- and basin-scale processes, Oceanologia, 48, 91–117, 2006.
EMODnet Bathymetry Consortium: EMODnet Digital Bathymetry (DTM 2020), https://doi.org/10.12770/BB6A87DD-E579-4036-ABE1-E649CEA9881A, 2020.
Farmer, D. and Armi, L.: Stratified flow over topography: the role of small-scale entrainment and mixing in flow establishment, Proc. R. Soc. Lond. A, 455, 1989, https://doi.org/10.1098/rspa.1999.0448, 1998.
Geyer, W. R. and MacCready, P.: The estuarine circulation, Annu. Rev. Fluid Mech., 46, 175–197, 2014.
Geyer, W. R., Lavery, A. C., Scully, M. E., and Trowbridge, J. H.: Mixing by shear instability at high Reynolds number, Geophys. Res. Lett., 37, 22, https://doi.org/10.1029/2010GL045272, 2010.
Green, J. M., Liljebladh, B., and Omstedt, A.: Physical oceanography and water exchange in the Northern Kvark Strait, Cont. Shelf Res., 26, 721–732, 2006.
Gregg, M. C., D'Asaro, E. A., Riley, J. J., and Kunze, E.: Mixing Efficiency in the Ocean, Annu. Rev. Mar. Sci., 10, 443–473, https://doi.org/10.1146/annurev-marine-121916-063643, 2018.
Gröger, M., Arneborg, L., Dieterich, C., Höglund, A., and Meier, H. E. M.: Summer hydrographic changes in the Baltic Sea, Kattegat and Skagerrak projected in an ensemble of climate scenarios downscaled with a coupled regional ocean–sea ice–atmosphere model, Clim. Dynam., 53, 5945–5966, 2019.
Gustafsson, B. G., Schenk, F., Blenckner, T., Eilola, K., Meier, H. E. M., Müller-Karulis, B., Neumann, T., Ruoho-Airola, T., Savchuk, O. P., and Zorita, E.: Reconstructing the Development of Baltic Sea Eutrophication 1850–2006, AMBIO, 41, 534–548, https://doi.org/10.1007/s13280-012-0318-x, 2012.
Håkansson, B., Alenius, P., and Brydsten, L.: Physical environment in the Gulf of Bothnia, Ambio, 5–12, 1996.
Hela, I.: A hydrographical survey of the waters in the Åland Sea, Geophysica, 6, 219–242, 1958.
HELCOM: State of the Baltic Sea – SecondHELCOM holistic assessment 2011–2016, Baltic Sea Environment, Proceedings 155, ISSN 0357-2994, https://helcom.fi/baltic-sea-trends/holistic-assessments/state-of-the-baltic-sea-2018/reports-and-materials/ (last access: 1 September 2023), 2018.
Hietala, R., Lundberg, P., and Nilsson, J. A. U.: A note on the deep-water inflow to the Bothnian Sea, J. Mar. Syst., 68, 255–264, https://doi.org/10.1016/j.jmarsys.2006.12.004, 2007.
Jakobsson, M., Stranne, C., O'Regan, M., Greenwood, S. L., Gustafsson, B., Humborg, C., and Weidner, E.: Bathymetric properties of the Baltic Sea, Ocean Sci., 15, 905–924, https://doi.org/10.5194/os-15-905-2019, 2019.
Jilbert, T., Conley, D. J., Gustafsson, B. G., Funkey, C. P., and Slomp, C. P.: Glacio-isostatic control on hypoxia in a high-latitude shelf basin, Geology, 43, 427–430, https://doi.org/10.1130/G36454.1, 2015.
Keeling, R. F., Körtzinger, A., and Gruber, N.: Ocean Deoxygenation in a Warming World, Annu. Rev. Mar. Sci., 2, 199–229, https://doi.org/10.1146/annurev.marine.010908.163855, 2010.
Kniebusch, M.: Detection and attribution studies of climate related changes in the Baltic Sea since 1850, University Rostock, https://doi.org/10.18453/ROSDOK_ID00002664, 2019.
Knudsen, M.: Ein hydrographischer Lehrsatz, Ann. Hydrograph. Marit. Meteorol., 28, 316–320, 1900.
Kuliński, K., Rehder, G., Asmala, E., Bartosova, A., Carstensen, J., Gustafsson, B., Hall, P. O. J., Humborg, C., Jilbert, T., Jürgens, K., Meier, H. E. M., Müller-Karulis, B., Naumann, M., Olesen, J. E., Savchuk, O., Schramm, A., Slomp, C. P., Sofiev, M., Sobek, A., Szymczycha, B., and Undeman, E.: Biogeochemical functioning of the Baltic Sea, Earth Syst. Dynam., 13, 633–685, https://doi.org/10.5194/esd-13-633-2022, 2022.
Kullenberg, G.: Mixing in the Baltic Sea and Implications for the Environmental Conditions, in: Elsevier Oceanography Series, Vol. 34, Elsevier, 399–418, https://doi.org/10.1016/S0422-9894(08)71252-2, 1982.
Kuosa, H., Fleming-Lehtinen, V., Lehtinen, S., Lehtiniemi, M., Nygård, H., Raateoja, M., Raitaniemi, J., Tuimala, J., Uusitalo, L., and Suikkanen, S.: A retrospective view of the development of the Gulf of Bothnia ecosystem, J. Mar. Syst., 167, 78–92, https://doi.org/10.1016/j.jmarsys.2016.11.020, 2017.
Lavery, A. C. and Ross, T.: Acoustic scattering from double-diffusive microstructure, J. Acoust. Soc. Am., 122, 1449–1462, https://doi.org/10.1121/1.2764475, 2007.
Leppäranta, M. and Myrberg, K.: Physical Oceanography of the Baltic Sea, Springer Science and Business Media, 423 pp., Springer, ISBN: 3540797033, 2009.
Lessin, G., Raudsepp, U., and Stips, A.: Modelling the influence of major baltic inflows on near-bottom conditions at the entrance of the Gulf of Finland, PLoS One, 9, e112881, https://doi.org/10.1371/journal.pone.0112881, 2014.
Markus Meier, H. E., Feistel, R., Piechura, J., Arneborg, L., Burchard, H., Fiekas, V., Golenko, N., Kuzmina, N., Mohrholz, V., Nohr, C., Paka, V. T., Sellschopp, J., Stips, A., and Zhurbas, V.: Ventilation of the Baltic Sea deep water: A brief review of present knowledge from observations and models, Oceanologia, 48, 133–164, 2006.
Marmefelt, E. and Omstedt, A.: Deep water properties in the Gulf of Bothnia, Cont. Shelf Res., 13, 169–187, https://doi.org/10.1016/0278-4343(93)90104-6, 1993.
Matthäus, W. and Franck, H.: Characteristics of major Baltic inflows – a statistical analysis, Cont. Shelf Res., 12, 1375–1400, 1992.
Meier, H. E. M.: Modeling the age of Baltic Seawater masses: Quantification and steady state sensitivity experiments, J. Geophys. Res.-Ocean., 110, 1–14, https://doi.org/10.1029/2004JC002607, 2005.
Meier, H. M.: Modeling the pathways and ages of inflowing salt-and freshwater in the Baltic Sea, Estuar. Coast. Shelf Sci., 74, 610–627, 2007.
Meier, H. M., Döscher, R., and Faxén, T.: A multiprocessor coupled ice-ocean model for the Baltic Sea: Application to salt inflow, J. Geophys. Res.-Ocean., 108, 3278, https://doi.org/10.1029/2000JC000521, 2003.
Meier, H. M., Edman, M. K., Eilola, K. J., Placke, M., Neumann, T., Andersson, H. C., Brunnabend, S.-E., Dieterich, C., Frauen, C., and Friedland, R.: Assessment of eutrophication abatement scenarios for the Baltic Sea by multi-model ensemble simulations, Front. Mar. Sci., 5, 440, https://doi.org/10.3389/fmars.2018.00440, 2018.
Muchowski, J., Umlauf, L., Arneborg, L., Holtermann, P., Weidner, E., Humborg, C., and Stranne, C.: Potential and Limitations of a Commercial Broadband Echosounder for Remote Observations of Turbulent Mixing, J. Atmos. Ocean. Technol., 39, 1985–2003, https://doi.org/10.1175/JTECH-D-21-0169.1, 2022a.
Muchowski, J. C., Arneborg, L., Umlauf, L., Holtermann, P. L., Eisbrenner, E., Humborg, C., Jakobsson, M., and Stranne, C.: Diapycnal Mixing Induced by Rough Small-Scale Bathymetry, Geophys. Res. Lett., 50, https://doi.org/10.1029/2023GL103514, 2022b.
Muchowski, J. C., Stranne, C., Jakobsson, M., Arneborg, L., Umlauf, L., and Holtermann, P.: Acoustic and in-situ observations of stratified turbulent mixing near rough bathymetry in the Baltic Sea, Feb–Mar 2019 and 2020, Dataset version 1, Bolin Centre Database [data sets and video supplement], https://doi.org/10.17043/muchowski-2023-aland-sea-2019-2020-1, 2023.
Myrberg, K. and Andrejev, O.: Modelling of the circulation, water exchange and water age properties of the Gulf of Bothnia, Oceanologia, 48, 55–74, 2006.
Neumann, T., Siegel, H., Moros, M., Gerth, M., Kniebusch, M., and Heydebreck, D.: Ventilation of the northern Baltic Sea, Ocean Sci., 16, 767–780, https://doi.org/10.5194/os-16-767-2020, 2020.
Olofsson, M., Klawonn, I., and Karlson, B.: Nitrogen fixation estimates for the Baltic Sea indicate high rates for the previously overlooked Bothnian Sea, Ambio, 50, 203–214, 2021.
Osborn, T. R.: Estimates of the Local Rate of Vertical Diffusion from Dissipation Measurements, J. Phys. Oceanogr., 10, 83–89, https://doi.org/10.1175/1520-0485(1980)010<0083:EOTLRO>2.0.CO;2, 1980.
Palosuo, E.: A description of the seasonal variations of water exchange between the Baltic Proper and the Gulf of Bothnia, 1964.
Polyakov, I. V., Tikka, K., Haapala, J., Alkire, M. B., Alenius, P., and Kuosa, H.: Depletion of Oxygen in the Bothnian Sea Since the Mid-1950s, Front. Mar. Sci., 9, 2022, https://doi.org/10.3389/fmars.2022.917879, 2022.
Raateoja, M.: Deep-water oxygen conditions in the Bothnian Sea, Boreal Environ. Res., 18, 235–249, 2013.
Reissmann, J. H., Burchard, H., Feistel, R., Hagen, E., Lass, H. U., Mohrholz, V., Nausch, G., Umlauf, L., and Wieczorek, G.: Vertical Mixing in the Baltic Sea and Consequences for Eutrophication – A Review, Prog. Oceanogr., 2009.
Rolff, C. and Elfwing, T.: Increasing nitrogen limitation in the Bothnian Sea, potentially caused by inflow of phosphate-rich water from the Baltic Proper, Ambio, 44, 601–611, 2015.
Schmidtko, S., Stramma, L., and Visbeck, M.: Decline in global oceanic oxygen content during the past five decades, Nature, 542, 335–339, https://doi.org/10.1038/nature21399, 2017.
Seifert, T. and Kayser, B.: A high resolution sperical grid topography of the Baltic Sea”, Meeresw. Berichte, Marine Science Reports, No. 9, 72–88, 1995.
Seifert, T., Tauber, F., and Kayser, B.: A high resolution spherical grid topography of the Baltic Sea, 2nd Edn., Baltic Sea Science Congress, Stockholm, 25–29 November, Poster no. 147, https://www.io-warnemuende.de/topography-of-the-baltic-sea.html (last access: 15 December 2023), 2001.
Snoeijs-Leijonmalm, P. and Andrén, E.: Why is the Baltic Sea so special to live in?, in: Biological Oceanography of the Baltic Sea, edited by: Snoeijs-Leijonmalm, P., Schubert, H., and Radziejewska, T., Springer Netherlands, Dordrecht, 23–84, https://doi.org/10.1007/978-94-007-0668-2_2, 2017.
Stranne, C., Mayer, L., Weber, T. C., Ruddick, B. R., Jakobsson, M., Jerram, K., Weidner, E., Nilsson, J., and Gårdfeldt, K.: Acoustic Mapping of Thermohaline Staircases in the Arctic Ocean, Sci. Rep., 7, 15192, https://doi.org/10.1038/s41598-017-15486-3, 2017.
Stranne, C., Mayer, L., Jakobsson, M., Weidner, E., Jerram, K., Weber, T. C., Anderson, L. G., Nilsson, J., Björk, G., and Gårdfeldt, K.: Acoustic mapping of mixed layer depth, Ocean Sci., 14, 503–514, https://doi.org/10.5194/os-14-503-2018, 2018.
Tuomi, L., Myrberg, K., and Lehmann, A.: The performance of the parameterisations of vertical turbulence in the 3D modelling of hydrodynamics in the Baltic Sea, Cont. Shelf Res., 50/51, 64–79, https://doi.org/10.1016/j.csr.2012.08.007, 2012.
Tuomi, L., Miettunen, E., Alenius, P., and Myrberg, K.: Evaluating hydrography, circulation and transport in a coastal archipelago using a high-resolution 3D hydrodynamic model, J. Mar. Syst., 180, 24–36, 2018.
Väli, G., Meier, H. E. M., and Elken, J.: Simulated halocline variability in the Baltic Sea and its impact on hypoxia during 1961–2007, J. Geophys. Res.-Ocean., 118, 6982–7000, https://doi.org/10.1002/2013JC009192, 2013.
Westerlund, A. and Tuomi, L.: Vertical temperature dynamics in the Northern Baltic Sea based on 3D modelling and data from shallow-water Argo floats, J. Mar. Syst., 158, 34–44, 2016.
Westerlund, A., Miettunen, E., Tuomi, L., and Alenius, P.: Refined estimates of water transport through the Åland Sea in the Baltic Sea, Ocean Sci., 18, 89–108, https://doi.org/10.5194/os-18-89-2022, 2022.