the Creative Commons Attribution 4.0 License.
the Creative Commons Attribution 4.0 License.
 | 12 Jul 2023
Coupled hydrological and hydrodynamic modelling application for climate change impact assessment in the Nemunas river watershed–Curonian Lagoon–southeastern Baltic Sea continuum
Rasa Idzelytė
Natalja Čerkasova
Jovita Mėžinė
Toma Dabulevičienė
Artūras Razinkovas-Baziukas
Ali Ertürk
Georg Umgiesser
We analyse the cumulative impacts of climate change in a complex basin–lagoon–sea system continuum, which covers the Nemunas river basin, Curonian Lagoon, and the southeastern part of the Baltic Sea. A unique, state-of-the-art coupled modelling system was developed using hydrological and hydrodynamic models. The results of four regional downscaled models from the Rossby Centre high-resolution regional atmospheric climate model have been bias-corrected using in situ measurements and were used as forcing to assess the changes that the continuum will undergo until the end of this century.
Results show that the Curonian Lagoon will be subjected to higher river discharges that in turn increase the outgoing fluxes into the Baltic Sea. Through these higher fluxes, both the water residence time and saltwater intrusion into the lagoon event frequency will decrease. Most of these changes will be more pronounced in the northern part of the lagoon, which is more likely to be influenced by the variations in the Nemunas river discharge. Its delta area may be susceptible to flooding as a result of the elevated discharge during winter. The southern part of the lagoon will experience lesser changes. While water temperatures in the entire lagoon and the southeastern Baltic Sea will steadily increase and salinity will decrease, the foreseen changes in the physical characteristics will not cause significant shifts in the ecosystem functioning but may affect the nutrient retention capacity. However, some ecosystem services such as ice fishing are expected to vanish completely due to the loss of ice cover.
- Article
(3010 KB) - Full-text XML
- BibTeX
- EndNote


Climate change and increasing anthropogenic pressure are expected to cause drastic changes in the global environment in the near future and thus may affect the discharge and hydrological regime of rivers (Middelkoop et al., 2001), lagoons (Jakimavičius and Kriaučiūnienė, 2020; Anthony et al., 2009), and regional seas (Holt et al., 2016). Coastal lagoons and estuaries, forming a continuum between continental and marine aquatic ecosystems (Pérez-Ruzafa et al., 2011) play an important ecological and socioeconomic role (Newton et al., 2018; Camacho-Ibar and Rivera-Monroy, 2014). They support important habitats and rich biodiversity (Newton et al., 2018), are nursery grounds and nutrient sources for nearshore fish communities (Meynecke et al., 2007), and are important areas for various biogeochemical processes (Watson et al., 2020; Maher et al., 2019). Coastal lagoons also provide a set of ecosystem services ranging from the physical use of land- and/or seascape to cultural or aesthetic value (Inácio et al., 2018).
In general, lagoon systems comprise 5.3 % of the European coastlines, with the southeastern coast of the Baltic being one of the major lagoon regions in Europe (de Wit et al., 2012). Due to their geographic location, lagoons become very vulnerable to the climate-change-related key drivers and, arising therefrom, the physical, ecological, and associated societal disturbances, such as changes in flushing regime, freshwater inputs, water chemistry, or loss in communities (Anthony et al., 2009).
The Baltic Sea, together with its largest lagoon, the Curonian Lagoon, and the Nemunas river watershed are at the forefront of the climate change impact, which is already evident here through the changes in ice conditions in the sea (Merkouriadi and Leppäranta, 2014) and the lagoon (Idzelytė et al., 2019), increase in sea surface temperature (Kniebusch et al., 2019; Belkin, 2009), or redistribution of river runoff over the year (Meier et al., 2022a).
Additional climate change impacts might manifest themselves slowly over decades (Lillebø, 2015), making the management of freshwater and transitional water a challenge for policymakers, decision-makers, and scientists. For example, the climate-change-induced increase in precipitation will result in increased nutrient leaching from agricultural soils, forests, and other land uses (Pihlainen et al., 2020), making it even more difficult to combat eutrophication – a prevalent and serious environmental problem in the Baltic Sea that affects both the coastal waters and the open sea (McCrackin et al., 2018; Vigouroux et al., 2021). Hence, modelling becomes increasingly important for understanding and projecting climate change impacts, in addition to supporting the formulation of management measures (Anthony et al., 2009; Vohland et al., 2014).
The first climate change scenario simulations for the Baltic Sea were carried out more than 20 years ago (Meier, 2002a, b; Omstedt et al., 2000). In 2008, the first assessment of the climate change in the Baltic Sea region was prepared, with the main conclusions being that by the end of 2100 the annual mean sea surface temperature will be 2–4 ∘C higher, while the ice cover and salinity values will decrease (BACC Author Team, 2008). One of the new key findings of the second climate change assessment (BACC II Author Team, 2015) was that, due to the large bias in the water balance projections, the projected changes in the Baltic Sea salinity remained uncertain; i.e. it is unclear if the Baltic Sea becomes more or less saline (von Storch et al., 2015). Nevertheless, climate change is consequently going to affect the marine ecosystem and may reduce its resilience.
The magnitude and severity of climate change impacts will vary considerably within the Baltic Sea region (Graham, 2004), making basin-specific studies highly important for understanding climate-change-induced impacts on a local scale. Likewise, with increasing computational capacity, the multidisciplinary modelling studies were progressively evolving during the past few decades (Rodrigues et al., 2015). Thus, the need for a combination of different aquatic processes became essential.
The coupling of different numerical models allows researchers to replicate the environmental processes for a better assessment of the physical parameters' response to changing climate. Regarding climate applications, the inclusion of different models, e.g. hydrological and hydrodynamic, is particularly important, since it provides necessary feedback between the atmosphere, land, and ocean, reducing the biases of such estimations. Notably, the coupling of a hydrological model into the large modelling systems provides connectivity between the hydrology of the land surface and ocean or sea, making it a crucial component of the coupled system (Hagemann et al., 2020). The choice of climate scenarios is an important consideration in climate research as well. The Representative Concentration Pathway (RCP) 4.5 and 8.5 scenarios represent two different pathways of future greenhouse gas emissions and are commonly used in climate modelling (Thomson et al., 2011; Riahi et al., 2011). Comparing these scenarios allows researchers to assess the potential effects of moderate climate mitigation efforts. It is important to note that neither scenario is necessarily more “realistic” than the other, as both represent possible pathways of future emissions, depending on societal choices and actions.
In this article, we present a framework of coupled hydrological and hydrodynamic models that are able to simulate the contribution of the entire Nemunas river watershed to the Curonian Lagoon. Moreover, the Curonian Lagoon and the southeastern Baltic Sea are covered by a finite element grid that resolves its hydrodynamic and physical parameters. A seamless integration of two models represents the watershed–lagoon–sea continuum for the simulations of the present state and future scenarios, based on the ensemble of meteorological datasets produced by climate models.
2.1 Study area
The study site covers three domains – part of the southeastern Baltic Sea region, together with the Curonian Lagoon and the Nemunas river watershed (Fig. 1). The drainage basin is shared by five countries, namely Belarus (48 %) and Lithuania (46 %), and the other 6 % is shared by Kaliningrad region of the Russian Federation, Poland, and Latvia (Gailiušis et al., 2001). The river enters the Curonian Lagoon at its central eastern part and divides the system into two subbasins; its southern part belongs to the Russian Federation (Kaliningrad region; 76 %) and its northern part to Lithuania (24 %).
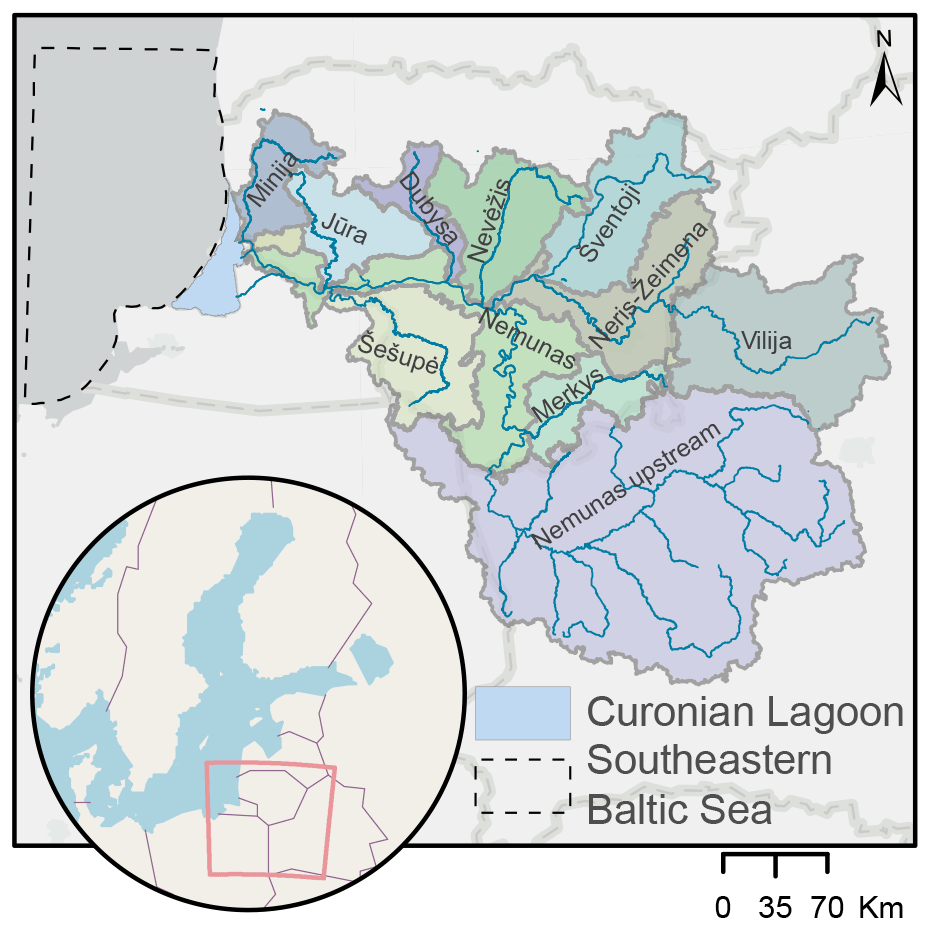
Figure 1The Nemunas river watershed (coloured polygons in the mainland are major subbasins), Curonian Lagoon, and southeastern Baltic Sea, with respect to the entire sea area. Basemap source: Esri.
The Nemunas river is the fourth-largest river draining into the Baltic Sea and the largest tributary entering the Curonian Lagoon, accounting for ∼ 96 % of the total freshwater input into it (Jakimavičius and Kovalenkovienė, 2010). The annual average discharge is 16.4 km3 yr−1 (518.3 m3 s−1), calculated for the period 2012–2016 (Vybernaite-Lubiene et al., 2018), and the long-term average is 21.847 km3 yr−1 (692 m3 s−1) for the period 1960–2007 (Jakimavičius and Kovalenkovienė, 2010).
The Curonian Lagoon is a shallow waterbody with an average depth of 3.8 m (Gasiūnaitė et al., 2008) that is located on the southeastern coast of the Baltic Sea. With a total area of ∼ 1584 km2 (Žaromskis, 1996), it is considered to be the largest lagoon in Europe. It is a transnational lagoon, whose northern part is influenced by the Nemunas river flow and brackish water intrusions from the Baltic Sea, while the southern part is more stagnant, where hydrodynamics are influenced by the wind (Vybernaite-Lubiene et al., 2022; Ferrarin et al., 2008). The intrusions of the seawater through the narrow (0.4–1.1 km) Klaipėda Strait occur in the northern part of the lagoon and reach up to 20 km southward of the strait (Zemlys et al., 2013).
The coastal area of the southeastern Baltic Sea is relatively shallow, with up to 20 m depth. The lowest water temperatures here are observed in winter months (in January and February the average water temperature is ∼ 2 ∘C), while in summer months, e.g. July and August, the average water temperature is ∼ 18–19 ∘C (Kozlov et al., 2014). The salinity in the coastal zone varies between 6–7 g kg−1, although in the plume-affected waters from the Curonian Lagoon it can drop drastically to near-freshwater levels (0–3 g kg−1) (Olenin and Daunys, 2004).
2.2 Data
2.2.1 Climate projection data
To feed our developed modelling system, we used meteorological forcing data acquired from CORDEX (Coordinated Regional Downscaling Experiment) scenarios for Europe from the Rossby Centre high-resolution regional atmospheric climate model (RCA4), which consisted of four sets of simulations (downscaling) driven by four global climate models (specified in Table 1). The datasets consist of cloud cover, solar radiation, precipitation, surface air pressure, relative humidity, air temperature, and wind speed and direction and cover the historical period of 1970–2005 and projection period of 2006–2100. The projections are derived according to two Representative Concentration Pathway (RCP) scenarios, namely RCP4.5 and RCP8.5 of the Coupled Model Intercomparison Project Phase 5 (CMIP5).

The applied modelling system uses standard Gregorian calendar; however, the MOHC (Met Office Hadley Centre) uses a 360 d calendar and IPSL (The Institute Pierre-Simon Laplace) a 365 d calendar. Therefore, correction was applied to harmonize the input data. The MOHC calendar was adjusted by deleting 30 and 29 February (if not a leap year) and interpolating the 31st day of the respective months. IPSL was corrected by interpolating 29 February during the leap years.
The bias correction of air temperature and precipitation datasets was done separately for the hydrological and hydrodynamic models by applying the climate data bias correction tool (Gupta et al., 2019), which uses the quantile mapping approach by fitting the daily values to normal distribution function for air temperature and gamma distribution function for precipitation. Due to the availability of measurement data, which are provided by Lithuanian Hydrometeorological Service, the correction period was from 1993 to 2005.
The data from 18 meteorological stations, which are scattered throughout the Republic of Lithuania, were used for the bias correction of the climate data and used as input for the hydrological model. For the Belarus region, the meteorological grid was constructed according to the methodology presented in the “Renewal of a River Basin Districts Management Plans and Programmes of Measures” project report (PAIC, 2015) and was split in three groups corresponding to the closest meteorological stations in Lithuania for which measured data were used for bias correction. The bias correction of climate input data for the hydrodynamic model was performed from the averaged data of three meteorological stations closest to the northern part of the lagoon that describe the coastal climate conditions.
2.2.2 Boundary data
Water level, temperature, and salinity data for the sea boundary of the hydrodynamic model were acquired from a high-resolution regional coupled ocean–sea ice–atmosphere model, RCA4–NEMO (Dieterich et al., 2019; Gröger et al., 2019; Wang et al., 2015), developed by the Rossby Centre and the oceanographic research group at the Swedish Meteorological and Hydrological Institute (SMHI). This model was run by the aforementioned global climate projections (Table 1).
The bias correction for the data of the RCA4-NEMO model was done by using Copernicus Marine Environment Monitoring Service (CMEMS) Baltic Sea Physics Reanalysis product data for the period of 1993–2005. The correction was done by simply adding the difference between the average values of CMEMS, CO, and RCA4–NEMO data, Cm (Lenderink et al., 2007), as follows:
Bathymetry data of a high-resolution spherical grid topography of the Baltic Sea were used as a bottom boundary (Seifert et al., 2001). Data of ice thickness from ice thermodynamic model ESIM2, run using the meteorological data specified in Table 1, were used as a top boundary during the ice cover season (Idzelytė and Umgiesser, 2021; Tedesco et al., 2009).
2.2.3 Watershed-scale data
For the development of the hydrological model, many basin-scale datasets are required, such as the digital elevation model (DEM), land use and management data, hydrologic grid, soil maps, etc. We obtained the data from several governmental sources in different countries and public open-access databases. For a full list of the datasets and their sources, we refer the reader to Čerkasova et al. (2021), where the acquired datasets are described in depth. Observed discharge data with varying time steps (daily, weekly, biweekly, and monthly) for the majority of the Nemunas river tributaries and the main branch were obtained from the Lithuanian Hydrometeorological Service. Observed nutrient (total nitrogen, TN, and total phosphorus, TP) concentration values for the overlapping periods were provided by the Lithuanian Environmental Protection Agency. The same meteorological forcing data, as described in Table 1, were used for the hydrological and for the hydrodynamic models.
Large parts of the watershed are outside of Lithuania; hence, open-access data for those regions were identified and used (Čerkasova et al., 2021). Some data had to be manually digitized, e.g. the stream network of the Nemunas watershed outside of the territory of Lithuania. Unfortunately, due to political reasons, we could not acquire any observational data from the Republic of Belarus and the Kaliningrad region. We resolved the issue by calibrating the model against observed data at the nearest border locations within the territory of Lithuania, as provided by the above-mentioned governmental institutions.
2.3 Models
2.3.1 Hydrological model
A high-resolution basin-scale model has been developed for the entire Nemunas watershed (Fig. 1) and implemented using Soil and Water Assessment Tool (SWAT) using a set of custom tools and scripts. SWAT is a hydrological model that simulates the water balance and quality of watersheds at various spatial scales (Neitsch et al., 2009). It is designed to help land managers and decision-makers evaluate the impact of land use, climate change, and other management practices on water resources. SWAT is widely used around the world for a variety of applications, including water management, erosion control, flood prediction, and water quality management; it has been applied in a range of settings, from small rural watersheds to large river basins (Gassman et al., 2007). The model can simulate a variety of hydrological processes, including surface runoff, infiltration, and evapotranspiration, as well as water quality parameters like sediments and nutrients.
SWAT subdivides the modelled area into subregions, called subbasins, which are further subdivided into Hydrological Response Units (HRUs). HRUs are the basic spatial units used in SWAT to represent a homogeneous area of land with respect to soil type, land use, slope, and administrative unit. Each HRU is characterized by a unique combination of these factors, which influences the hydrological and water quality processes within that unit. Moreover, each HRU has a unique set of hydrologic response parameters that governs the water balance within that unit. This approach allows for the simulation of spatially distributed hydrologic processes and water quality, making the model more effective in predicting watershed responses to different land use and management scenarios.
To set up a comprehensive model, we incorporated the topographic information of the area (digital elevation model), land use, land cover data, soil properties, information on waterbodies, land management, water use, crop growth, livestock production, administrative units, etc. The model is subdivided into 11 submodels, which each represent one of the tributaries of the Nemunas river, connected to the main branch (Fig. 2). In total, the model consists of 9012 subbasins and 148 212 HRUs. These submodels are linked from upstream to downstream, where the outputs of two downstream models are directly used as river boundaries for the hydrodynamic model. The hydrologic model was calibrated and validated and proved to reliably represent the water balance components, such as discharge at major gauge stations, in addition to nutrient (TP and TN) and sediment load estimates (Čerkasova et al., 2021, 2019, 2018) within the major tributaries of the basin and the main outlet.
Discharge and temperature outputs were extracted for this study; however, water quality variables can be used for a further assessment of the water quality in the area. The reader is referred to the study by Čerkasova et al. (2021), which details the watershed-scale model for the Nemunas river basin and its predictive capabilities.

Figure 2SWAT models for the Nemunas river watershed and their linkage with SHYFEM through river boundaries.
2.3.2 Hydrodynamic model
Hydrodynamics of the Curonian Lagoon and the southeastern Baltic Sea were modelled with an open-source shallow water hydrodynamic finite element model, SHYFEM (https://github.com/SHYFEM-model/, last access: 29 June 2023, Umgiesser et al., 2004), which consists of a finite element 3-D hydrodynamic model, a transport and diffusion model, and a radiation transfer model of heat at the water surface. The model resolves the 3-D primitive equations, which are vertically integrated over each layer, in their formulations with water levels and transport. Horizontal spatial discretization of the model is based on an unstructured triangular grid and carried out using a finite element method, which makes it suitable for applications to coastal systems with complicated geometry and bathymetry.
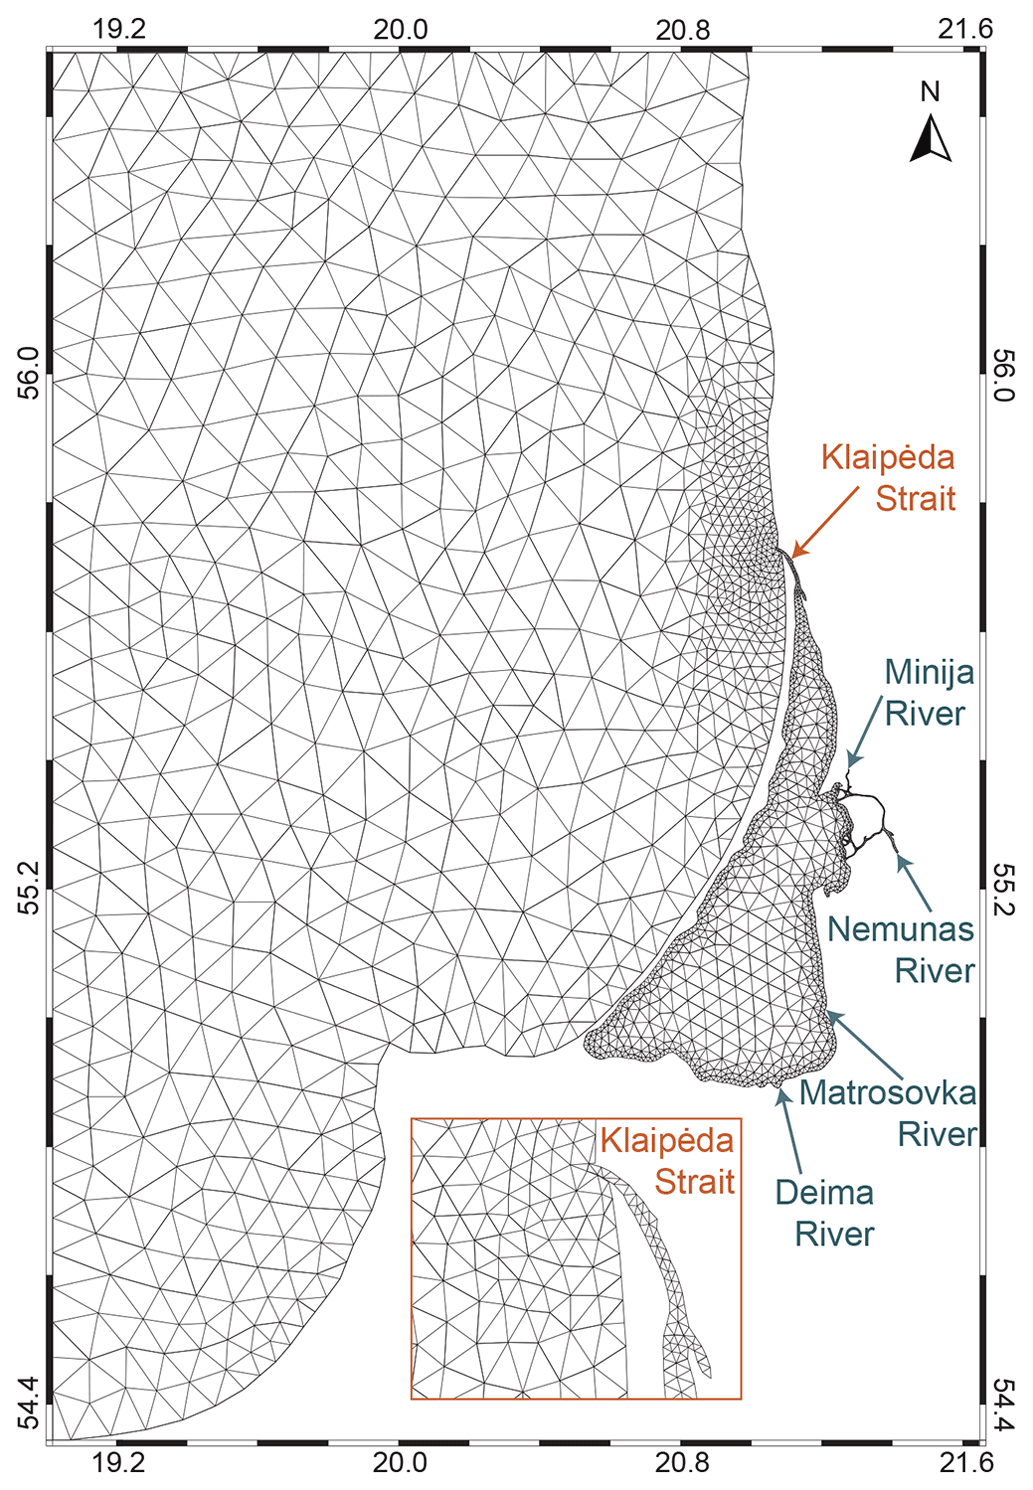
Figure 3Computational grid of the hydrodynamic model SHYFEM. Dark blue arrows denote the location of the river boundaries (modelling system connectivity points), where the hydrological model outputs (water temperature and discharge) are used as inputs to the hydrodynamic model.
This model has already been successfully applied to many coastal environments (Umgiesser et al., 2014; De Pascalis et al., 2011; Ferrarin et al., 2013, 2010; Bellafiore and Umgiesser, 2010; Ferrarin and Umgiesser, 2005) and validated for the Curonian Lagoon case study in previous works (Mėžinė et al., 2019; Umgiesser et al., 2016; Zemlys et al., 2013; Ferrarin et al., 2008). For this study, SHYFEM was applied in its 2-D version, which is sufficient, considering the shallow nature of this lagoon. The computational grid consists of 3292 triangular elements with 1986 nodes and has a much finer resolution in the Klaipėda Strait area (Fig. 3). The model produced output data of the hydrodynamic properties every 6 h.
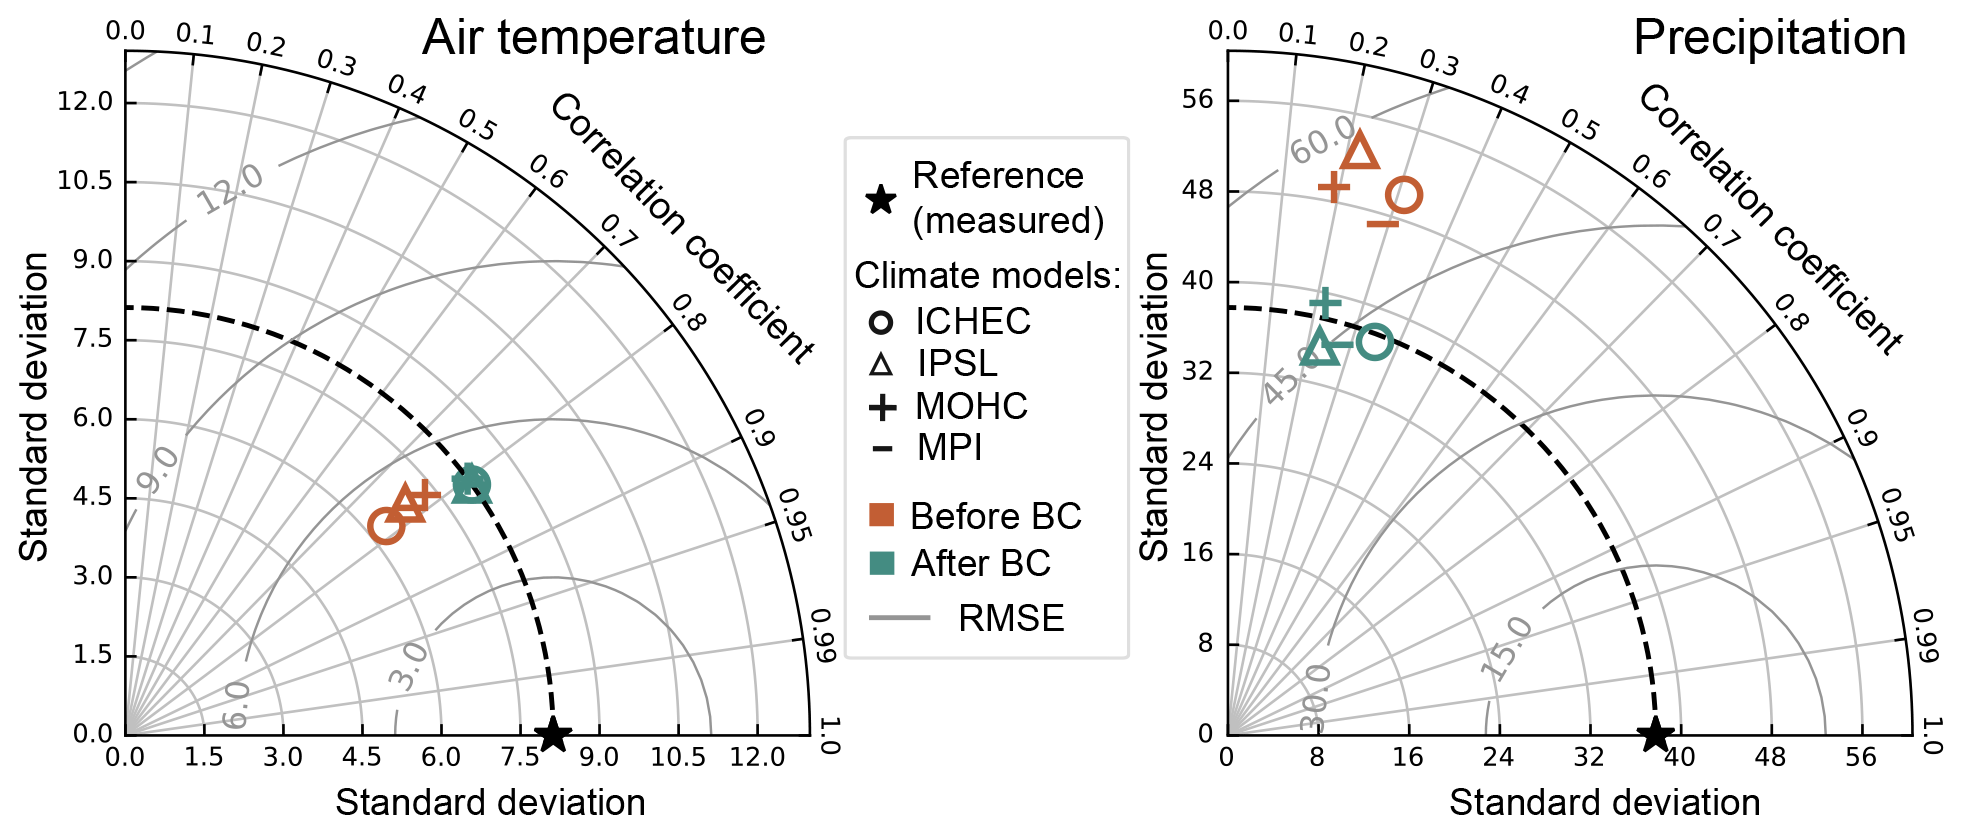
Figure 4Taylor diagram showing a statistical comparison of air temperature (daily mean) and precipitation (monthly sum) before and after the bias correction (BC) with respect to the reference measurement data. Statistics were computed for the period of 1990–2005.
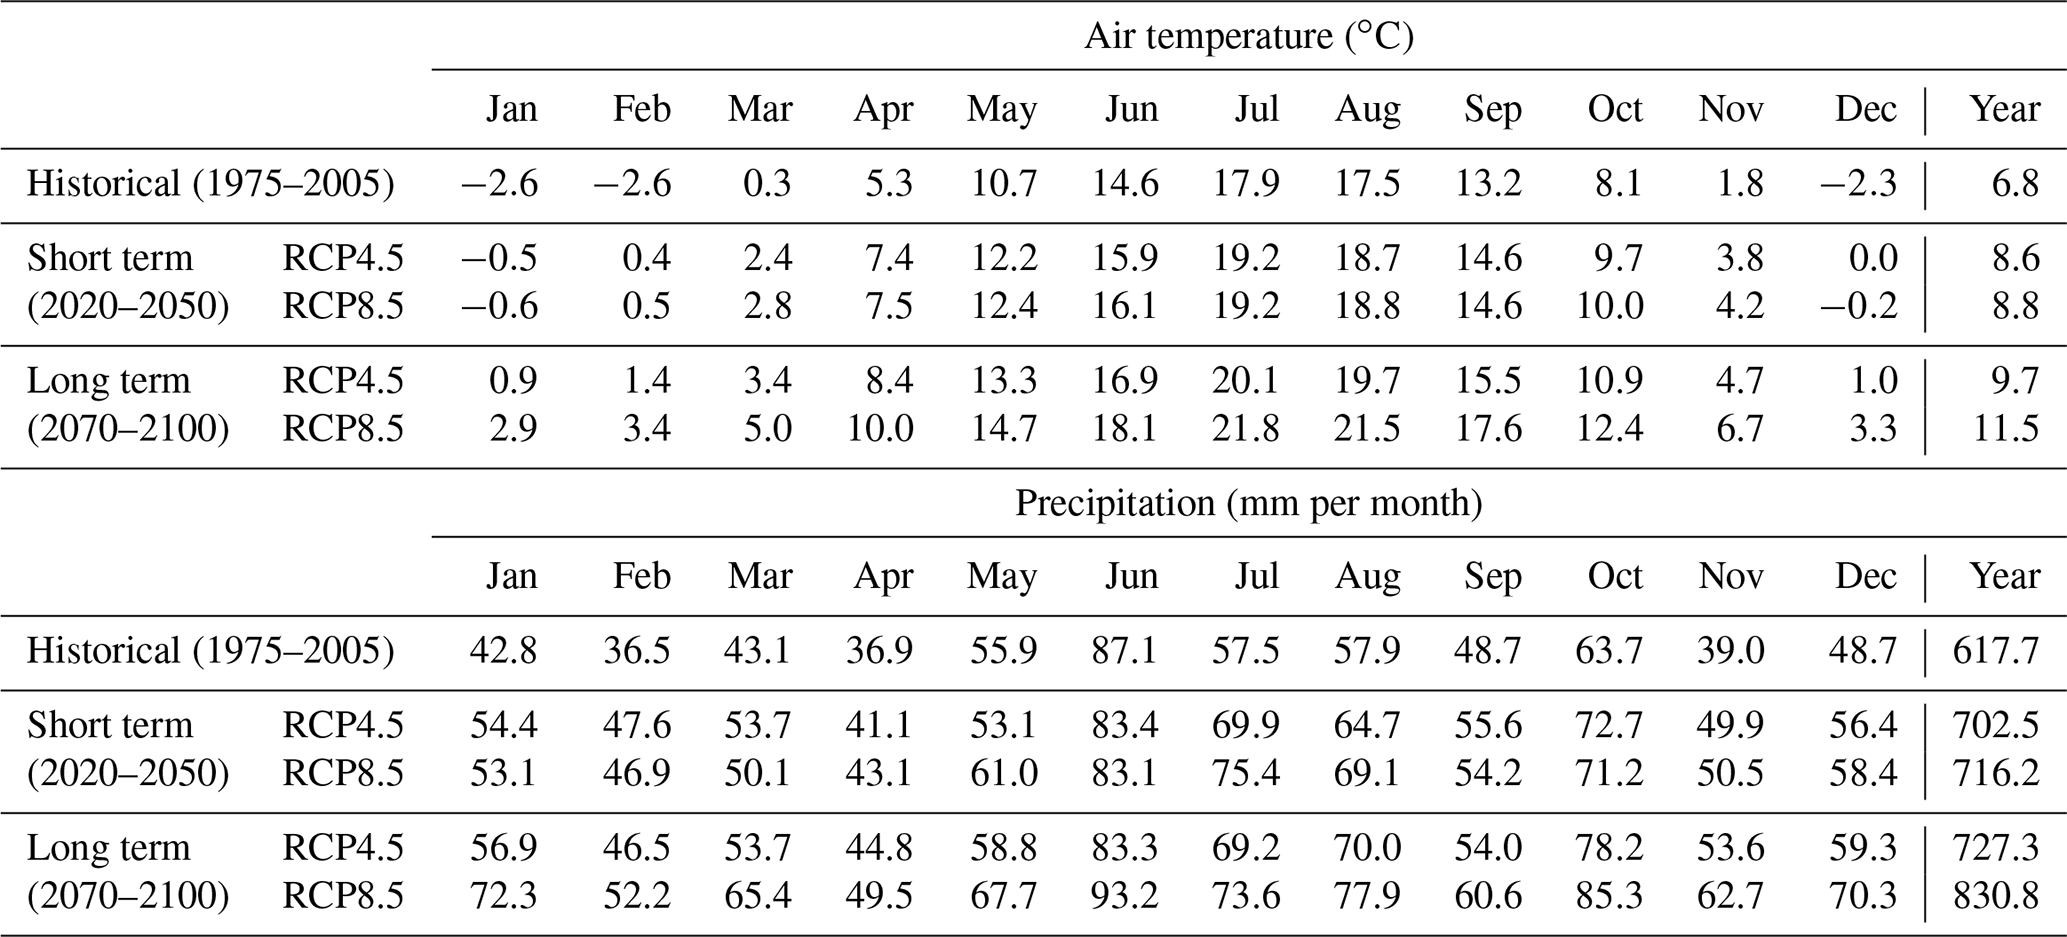
Table 2Monthly and yearly mean of the air temperature and precipitation over the study region derived by averaging four bias-corrected climate models' datasets.
2.3.3 Coupling of models
The hydrological (SWAT) and hydrodynamic (SHYFEM) models were coupled by taking the daily water temperature and discharge output data from the SWAT model and directly using the data as input for the Minija and Nemunas river boundaries in SHYFEM (Fig. 3). However, two other main rivers discharging in the southern part of the lagoon (Matrosovka, a branch of the Nemunas, and Deima) are not part of the Nemunas river watershed model; thus, the SWAT output data of the Nemunas river were scaled by the ratio between Matrosovka–Nemunas and Deima–Šešupė, as calculated from the data presented in Jakimavičius (2012). A better representation of the hydrodynamic conditions in the Nemunas delta area is achieved with a hydrodynamic model that simulates the river branches in the delta.
2.4 Methods of data analysis
The model results based on four global climate model forcings (Table 1) were averaged; therefore, the final analysis was done for three aggregated outputs referring to the historical and projection (RCP4.5 and RCP8.5) scenarios. The analysis periods were divided into historical (1975–2005), short term (2020–2050), and long term (2070–2100), and the results were compared by averaging over these time spans. The period of 1970–1975 was discarded from the analysis, as it was used for the model spin-up.
The main air temperature and precipitation patterns were determined. The parameters of the hydrological model (water discharge) and parameters of the hydrodynamic model (water temperature, salinity, level, residence time, and fluxes through predefined cross sections), in addition to ice thickness, were assessed. The analysis was done using standard statistical methods and computing the percentage of change from the historical period.
3.1 Bias correction
Even though the meteorological data from the global climate models were already downscaled by the regional climate model, there was still some bias remaining in comparison with the local measurement data, namely the underestimation of air temperature and overestimation of precipitation. Therefore, an additional correction was applied (Fig. 4). The correlation between the modelled and measured air temperature datasets was strong (∼ 0.8); however, after bias correction, there was an evident improvement in the standard deviation. A similar change is also equivalent to the monthly precipitation.
3.2 Meteorological changes
The bias-corrected statistics of both RCP scenarios show a distinct increase in the projected monthly and annual average precipitation and air temperature (Table 2). The differences between the scenarios in the short term are smaller than in the long term by a monthly average of 49 % under RCP4.5 and ∼ 123 % under RCP8.5. Considering precipitation, the monthly wetness or dryness pattern is similar between the analysis periods and scenarios. The average air temperature in the long term has the highest increase, especially in the months from November to April. The highest changes in these parameters are projected under the RCP8.5 scenario.
The difference between land and sea regulates the local climate (temperature) and precipitation patterns. Considering the differences between the marine and terrestrial parts of the study area, there is a clear pattern of lower air temperatures (on average by ∼ 1–1.5 ∘C) over the Baltic Sea and the Curonian Lagoon during March through June, while during the rest of the year it is warmer (on average by ∼ 2.2 ∘C), compared with that of the Nemunas river watershed. During February through August and the month of December, less precipitation over the marine part (on average by 10 mm per month) is observed, while during the rest of the months it is higher by the same amount when compared with the terrestrial area. Therefore, annual precipitation is similar in both areas.
3.3 Interactions between domains
The historical discharges of the Nemunas river watershed to the Curonian Lagoon were compared to the projected averaged discharges under the RCP4.5 and RCP8.5 climate change scenarios for all seasons (Fig. 5). The most noticeable change is the projected drastic increase in runoff during winter, which will almost double in the long-term period under both RCPs. This result is a combination of increased projected average precipitation and temperatures, which will likely result in warmer winters, with reduced snow cover throughout the basin. The increased liquid precipitation in winter will likely lead to an increased soil erosion and nutrient wash-off when the soil is bare and exposed to the elements, such as rain and wind.

Figure 5The percentage of change in the seasonal average discharge from the Nemunas river for the RCP4.5 and RCP8.5 scenario runs during the short-term (2020–2050) and long-term periods (2070–2100), compared with the historical period (1975–2005).
In contrast, a decrease in the average summer outflow is projected under both RCP scenarios, despite an increase in precipitation across the region. The increased average temperatures in summer months will impact the evapotranspiration (ET) over the basin, where an increase in both the potential ET and ET is projected, which will lead to lower discharges at the stream gauges during this period. Stable and mostly unchanged Nemunas river discharge will continue to supply the lagoon over the rest of the seasons, particularly in spring and autumn.
The differences between the RCP scenarios are noteworthy. We see a stronger shift in the increased winter discharges in the RCP8.5 scenario in the short-term period and a stronger shift towards lesser summer flows in the RCP4.5 scenario (Fig. 5). The RCP8.5 in the short term can be considered to be the “wetter” scenario, whereas RCP4.5 is “drier”. In the long term, however, both RCPs simulate similar outcomes, with slightly different magnitudes.
The interactions between the study domains can be defined by the water fluxes from the main discharging rivers into the Curonian Lagoon and eventually into the Baltic Sea (water outflow), and vice versa (water inflow). The volume of inflowing water is much lower than that of the outflowing (Fig. 6), especially in the northern part of the Curonian Lagoon, meaning that the outflow is already dominating, and this study shows that it will prevail and even increase in the analysed continuum system.

Figure 6Average outflowing and inflowing water volume (hatched pattern), including its percentage of the absolute flux (solid pattern) of each analysis period, namely historical (1975–2005), short term (2020–2050), and long term (2070–2100), under the RCP4.5 and RCP8.5 scenarios. The locations of the cross sections are shown in Fig. 7.
Comparing the simulation results of the scenario runs (short term and long term) with the historical period, it is evident that the water inflow in the northern part of the lagoon (cross sections 1 and 2 in Fig. 7) is projected to decrease. The change in the water inflow in the centre of the lagoon (cross sections 3 and 4 in Fig. 7) is very small and can be considered negligible. The outflowing water flux is projected to increase and is related to the growing outflow from the Nemunas river and will increase along the pathway towards the Baltic Sea (cross sections 1, 2, and 3 in Fig. 7). In the southern part of the lagoon, near the Lithuanian–Russian border, the changes in water fluxes are less evident, due to the fact that water circulation in this area is mostly determined by the wind-induced currents.
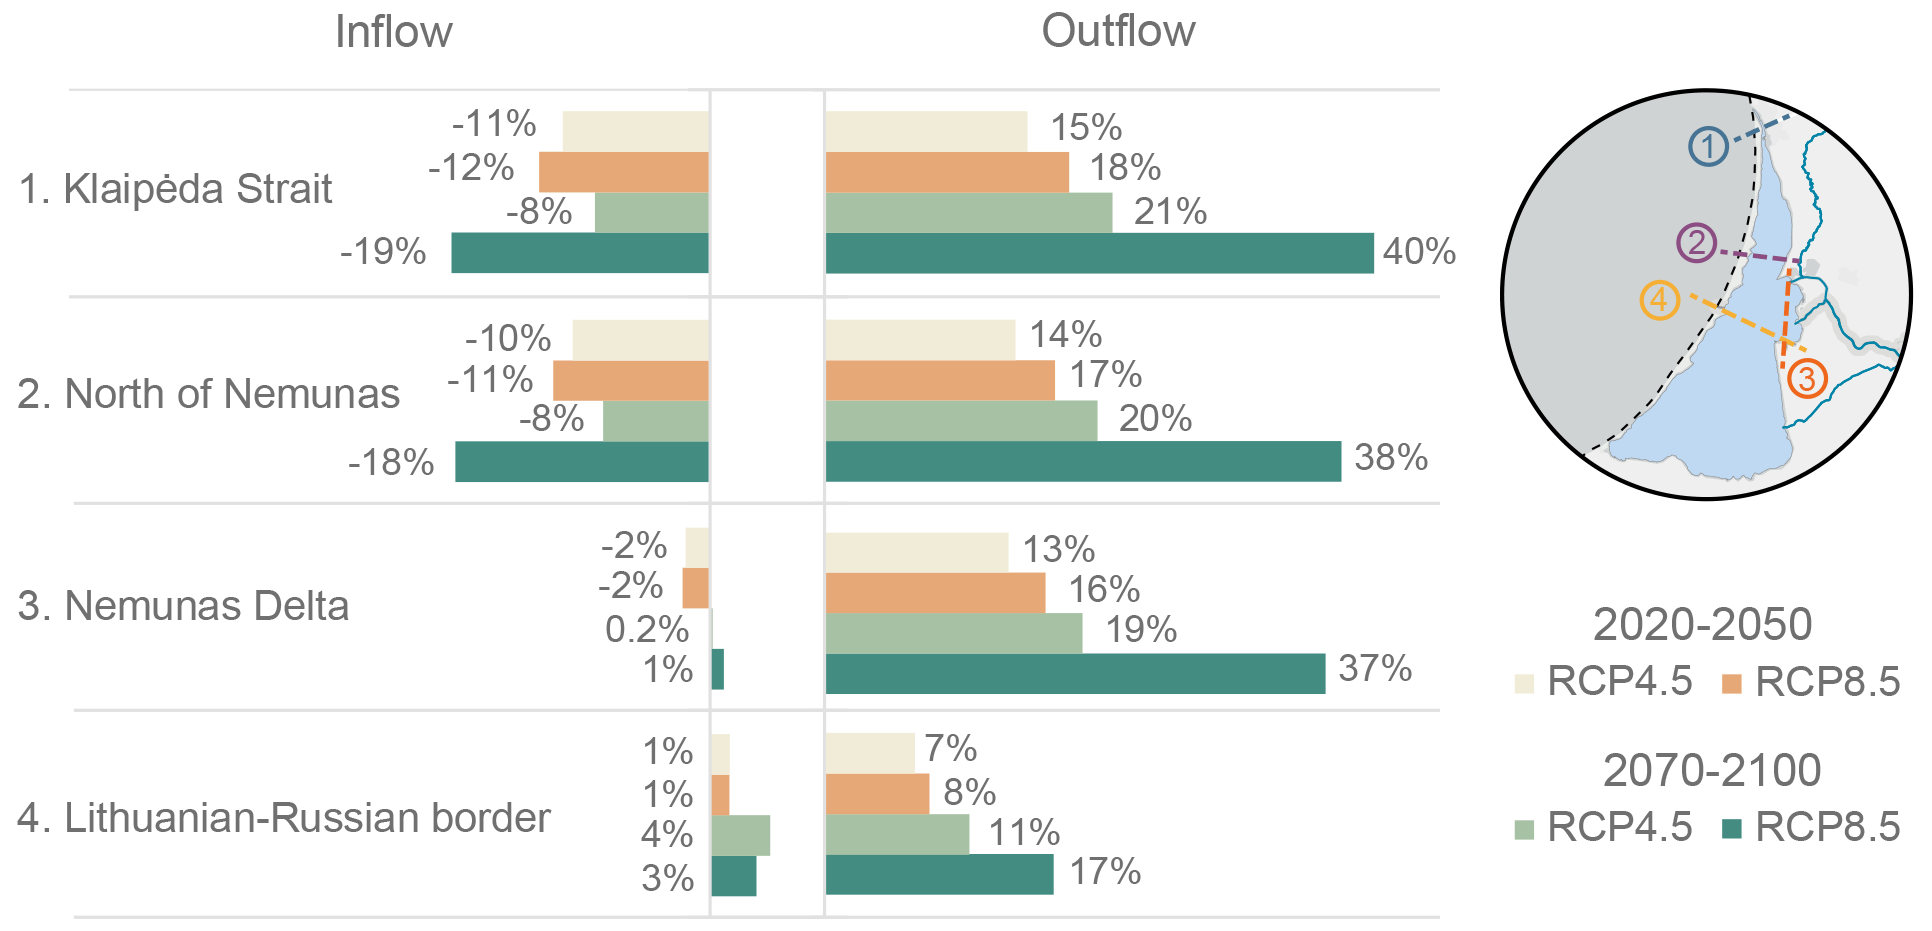
Figure 7The percentage of change in the projected (under the RCP4.5 and RCP8.5 scenarios) inflowing and outflowing water flux from the historical period (1975–2005). The map insert shows the locations of the predefined cross sections, which include the following 1 – Klaipėda Strait; 2 – north of Nemunas; 3 – Nemunas delta; 4 – Lithuanian–Russian border. Outflow is from south to north (sections 1, 2, and 4) and from east to west (section 3), and vice versa for inflow.
The change in the water flow through all cross sections displays a similar pattern in all scenarios, and the water flux changes from the historical period are very similar in each analysed cross section and for each flow type. For both the outflow and inflow, the highest change from the historical period is observed in the long term under the RCP8.5 scenario.
Looking at the water exchange seasonal dynamics, we can see that the highest inflowing water deviations from the historical period are predicted during winter and spring, with the values being lower by 10 %–28 % (Table 3). The water exchange is expected to increase in summer by 12 %–22 %, while in the autumn the changes are very small and similar throughout the analysis periods and scenarios.
Table 3Average seasonal water flux (in m3 s−1) over the historical (1975–2005), short-term (2020–2050), and long-term (2070–2100) periods under the RCP4.5 and RCP8.5 scenarios. The percentage in parentheses shows the change compared with the historical period. The values are averaged over four cross sections in the Curonian Lagoon, namely the Klaipėda Strait, north of Nemunas, Nemunas delta, and Lithuanian–Russian border (see map insert in Fig. 7).
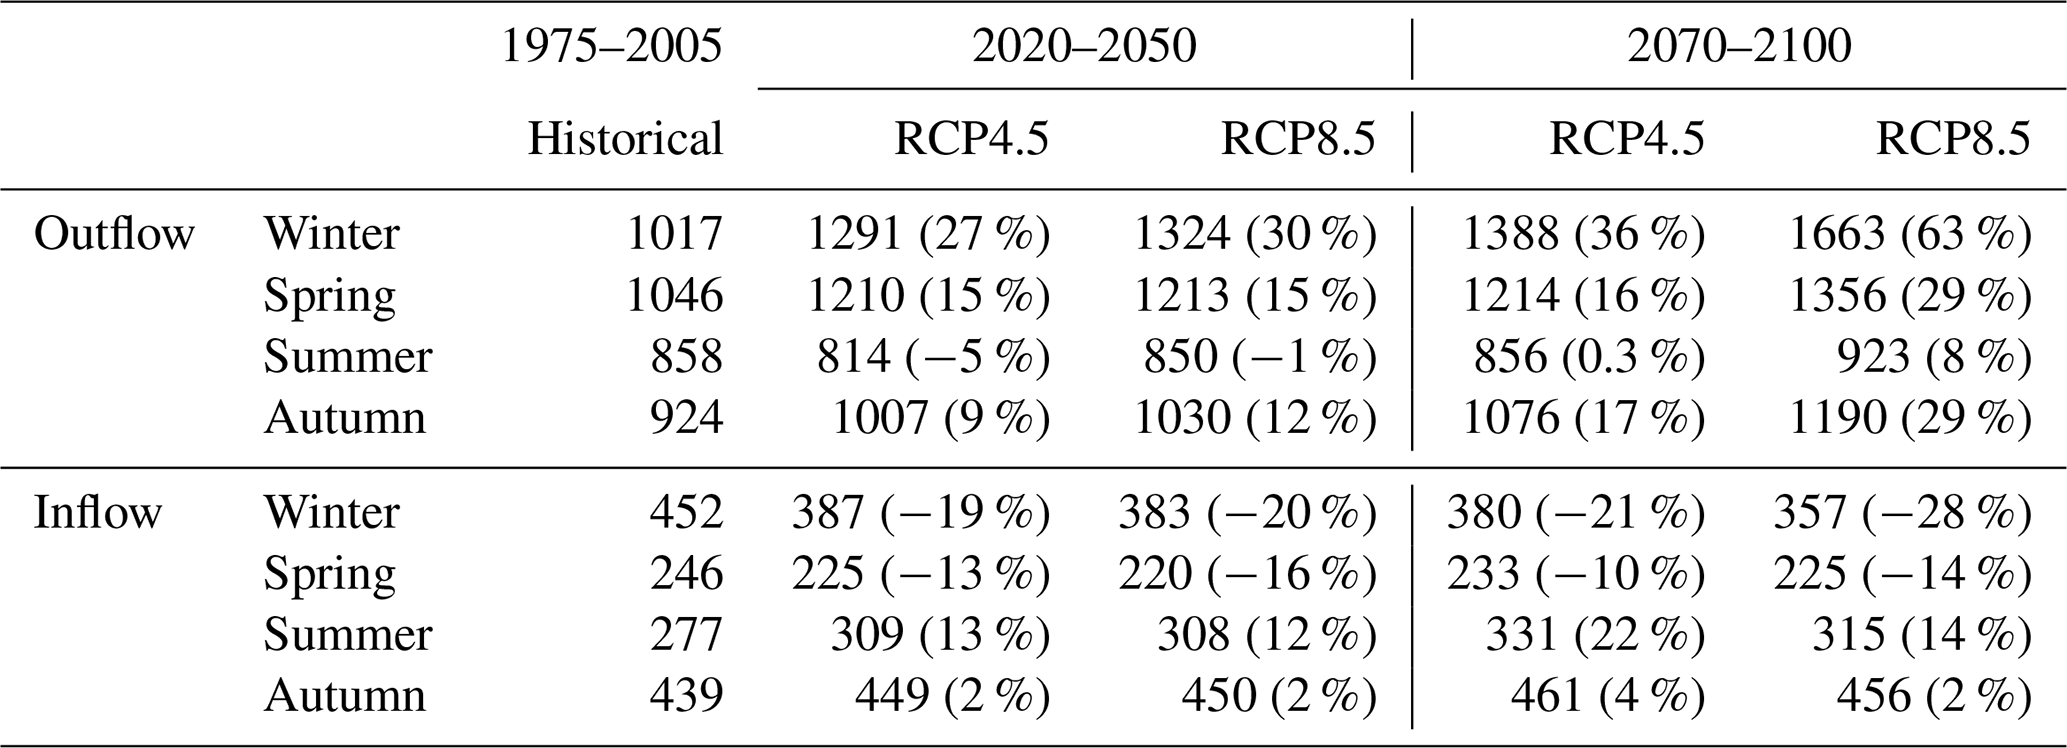
The changes in the outflow during winter, spring, and autumn are expected to increase (Table 3). In the short term, the changes between the scenarios are similar, while in the long term, the change increases nearly twice under RCP8.5, compared with RCP4.5. During summer, the outflow changes are negligible, apart from the long-term scenario under RCP8.5 (−8 %).
3.4 Water residence time
The water residence time (WRT) in the Curonian Lagoon generally is likely to have a decreasing tendency, apart from in the summer season, when it slightly increases (Table 4). In the northern part of the lagoon, the WRT is always shorter, while the southern part has higher values because the water movement in this area is more driven by wind than by the outflowing rivers (e.g. Nemunas). There is no apparent difference between the climate scenarios in the short term. The highest decrease, compared with the historical period, is observed in the long term under the RCP8.5 scenario.
Table 4Seasonal water residence time (in days) in the northern, southern, and total lagoon area under the RCP4.5 and RCP8.5 scenarios, averaged over historical (1975–2005), short-term (2020–2050), and long-term (2070–2100) periods. The percentage in parentheses shows the change compared with the historical period.
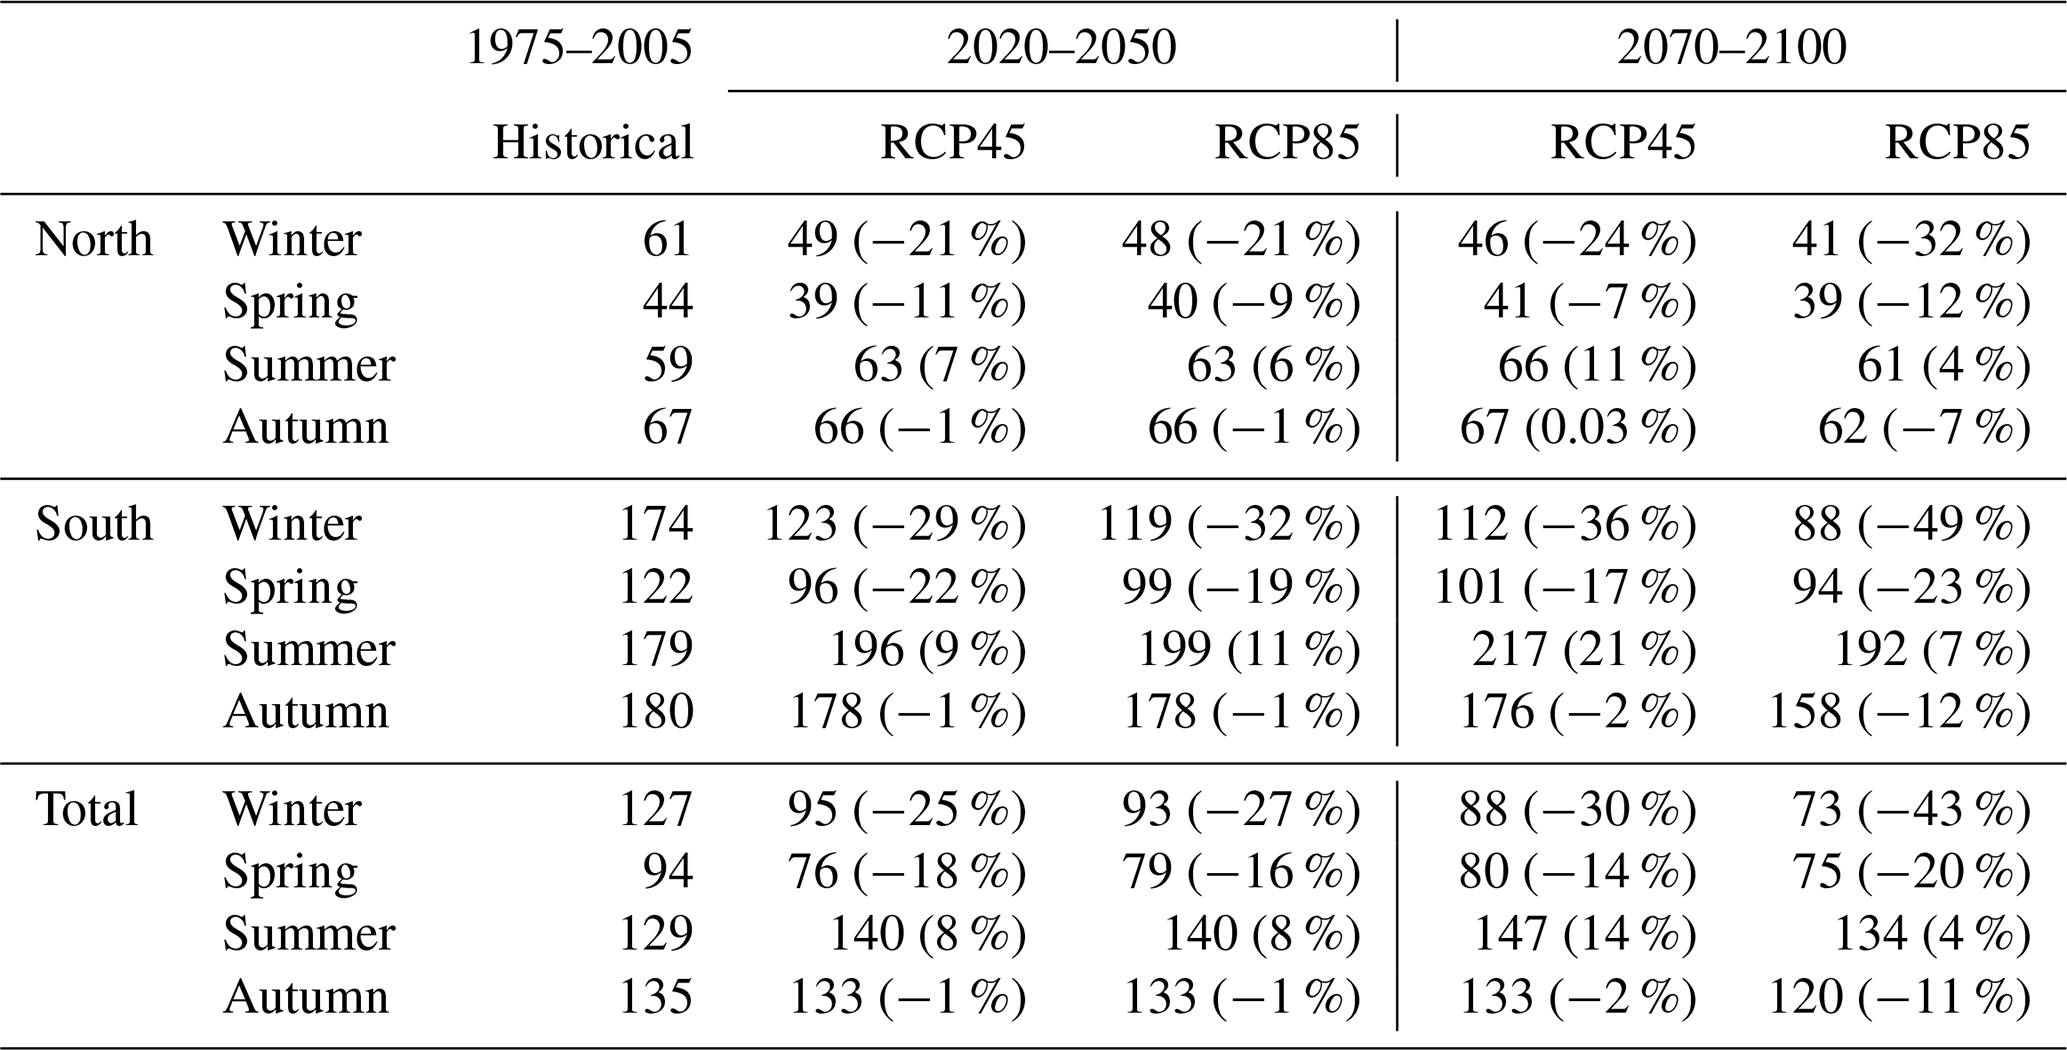
The highest WRT in the Curonian Lagoon is during summer and autumn when the discharge from the surrounding rivers decreases. Seasonal changes compared with the WRT during the historical period revealed that the highest decrease is observed during winter, followed by spring. During summer, the WRT slightly increases under both RCP scenarios and both analysis periods, while in autumn the changes are negligible, apart from the RCP8.5 scenario in the long term, when the WRT decreases by ∼ 10 %, compared to the historical period.
3.5 Salinity
The modelling results show that the Baltic Sea saltwater intrusions into the Curonian Lagoon will likely decrease in the future. During the historical period, 48 d yr−1 of saltwater intrusions were observed (i.e. the average yearly number of days when salinity exceeds the 2 g kg−1 threshold near Juodkrantė, which is approximately 20 km below the lagoon–sea connection). In the short term, this number will decrease by 60 % under the RCP4.5 scenario (19 d yr−1) and 65 % under the RCP8.5 scenario (17 d yr−1), compared with the historical period. In the long term, it will decrease by ∼ 67 % under RCP4.5 (16 d yr−1) and 83 % under the RCP8.5 scenario (8 d yr−1).
Seasonally, the highest change in the saltwater intrusion days is observed during winter and especially spring, when the outflow of the lagoon is dominating and the salinity values in Juodkrantė do not exceed 2 g kg−1 (right-hand side of Fig. 8). Saltwater intrusions during the summer season have a larger decrease under the RCP8.5 scenario than RCP4.5, which does not have a distinct pattern in the future. In autumn, the changes in the short term are similar under both scenarios, with a ∼ 27 % decrease compared with the historical period, and it continues to decline in the long term as well.

Figure 8The percentage of change in the seasonal average salinity of saltwater intrusions (solid pattern; left) and number of days on which the salinity exceeded the 2 g kg−1 threshold (hatched pattern; right) in Juodkrantė, which is approximately 20 km below the strait connecting the Baltic Sea and the Curonian Lagoon. Values denote the percentage of difference in the scenario runs compared with the historical period (1975–2005).
The severity of the saltwater intrusions is also predicted to decrease (left-hand side of Fig. 8). The pattern is similar to that of the number of days of the saltwater intrusions. Due to the increased outflow from the lagoon during spring, the changes are the highest in the same period.
Salinity in the southeastern Baltic Sea shows a decreasing pattern throughout the analysis periods. Under the RCP4.5 scenario, there is a small salt content decrease projected; this is 5 %–6 % less in the short term and 11 %–18 % in the long term (Table 5), compared with the historical period. The differences between the RCP scenarios are only apparent in the long term, where the change is projected to be higher under the RCP8.5 scenario. In the Baltic Sea, there is no difference in the average salinity throughout the seasons.
Table 5Average seasonal salinity in the Baltic Sea and along the southeastern Baltic coast. The percentage in parentheses shows the change in the scenario runs compared with the historical period (1975–2005).
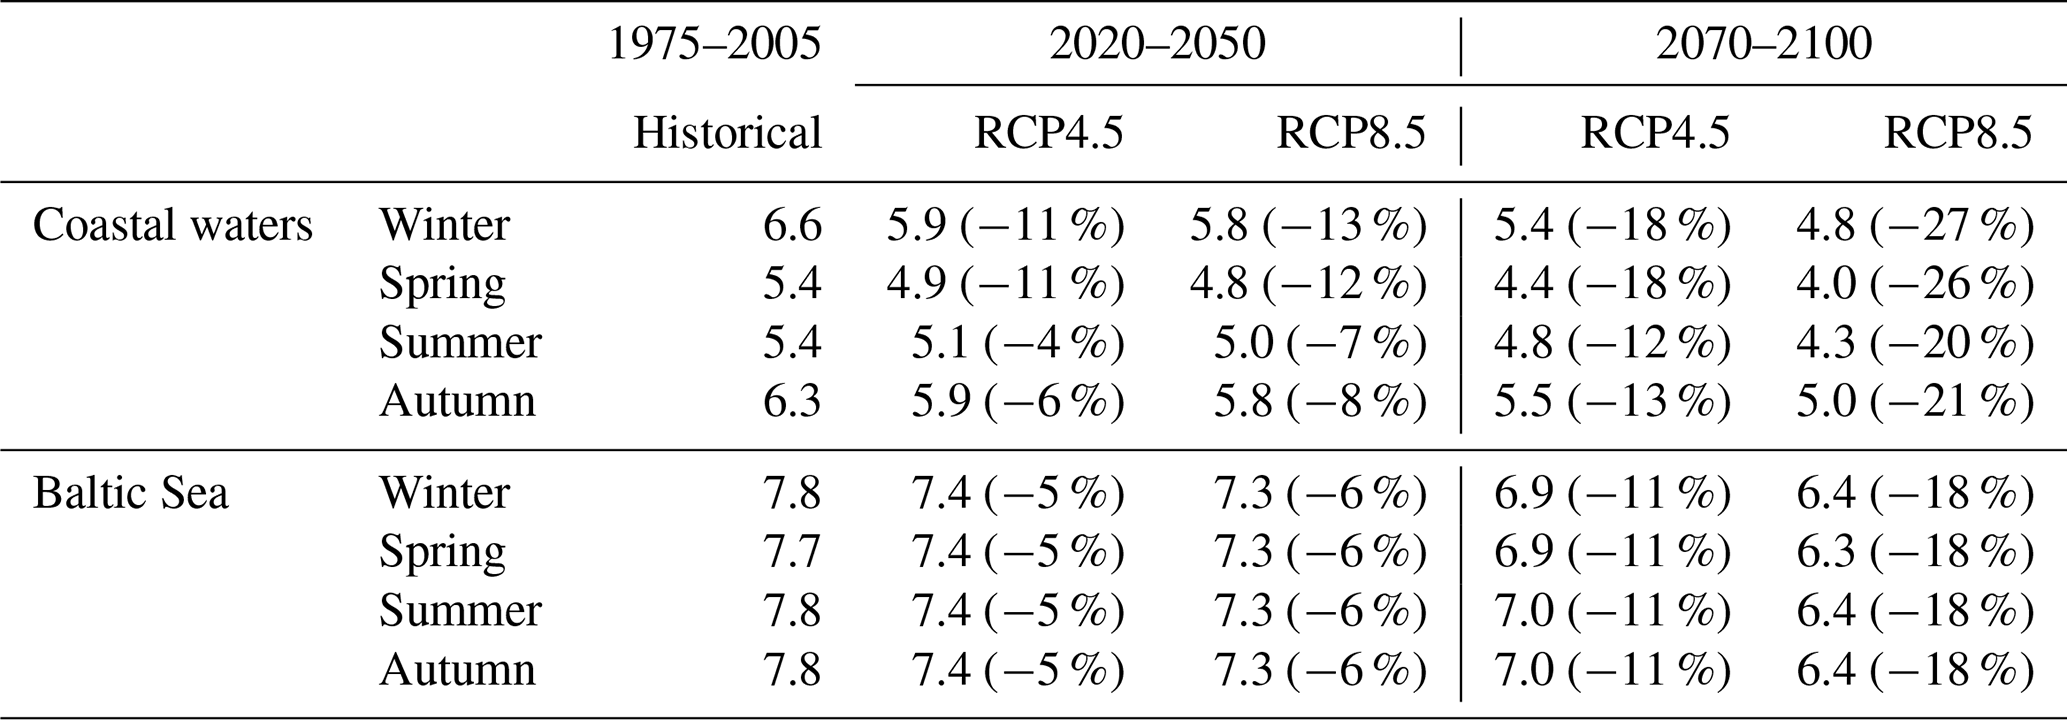
Salinity in the coastal area is slightly lower compared to that of the Baltic Sea. However, here the difference between the seasons is more apparent, with a higher decrease in the salinity values during winter and spring when the discharge of freshwater from the Curonian Lagoon increases. In the coastal waters, the highest change, compared with the historical period, is also projected to be under the RCP8.5 scenario. Notably, the highest decrease is projected northward of the Klaipėda Strait (lagoon outlet), while towards the south the change is lower, and salinity values are similar to that of the southeastern Baltic Sea.
3.6 Water temperature
The water temperature in the Curonian Lagoon is relatively homogeneous throughout its area, with slightly warmer water (by on average 0.4 ∘C) in the northern part of the lagoon. Considering the seasonal dynamics, the water temperature is projected to increase the most during winter (by ∼ 60 % in the short term and more than twice in the long term; Table 6). During spring and autumn, the increase is lower, with ∼ 17 % in the short term and 19 %–27 % in the long term. The lowest increase is projected during the summer season, with 5 %–6 % in the short-term and 9 %–13 % in the long-term. However, considering the water temperature increase in degrees Celsius, we can see that, in the short term, it is similar between the seasons, ranging from on average 0.9 ∘C (in winter) to 1.4 ∘C (in spring), while in the long term the change is higher, with 1.9 ∘C in winter and spring, 2.2 ∘C in summer, and 3 ∘C in autumn. The more apparent difference between the RCP scenarios is observed during the long term, where RCP8.5 displays a higher temperature increase.
Table 6Average seasonal water temperature (in ∘C) in the Curonian Lagoon and Baltic Sea. The percentage in parentheses shows the change in the scenario runs compared with the historical period (1975–2005).
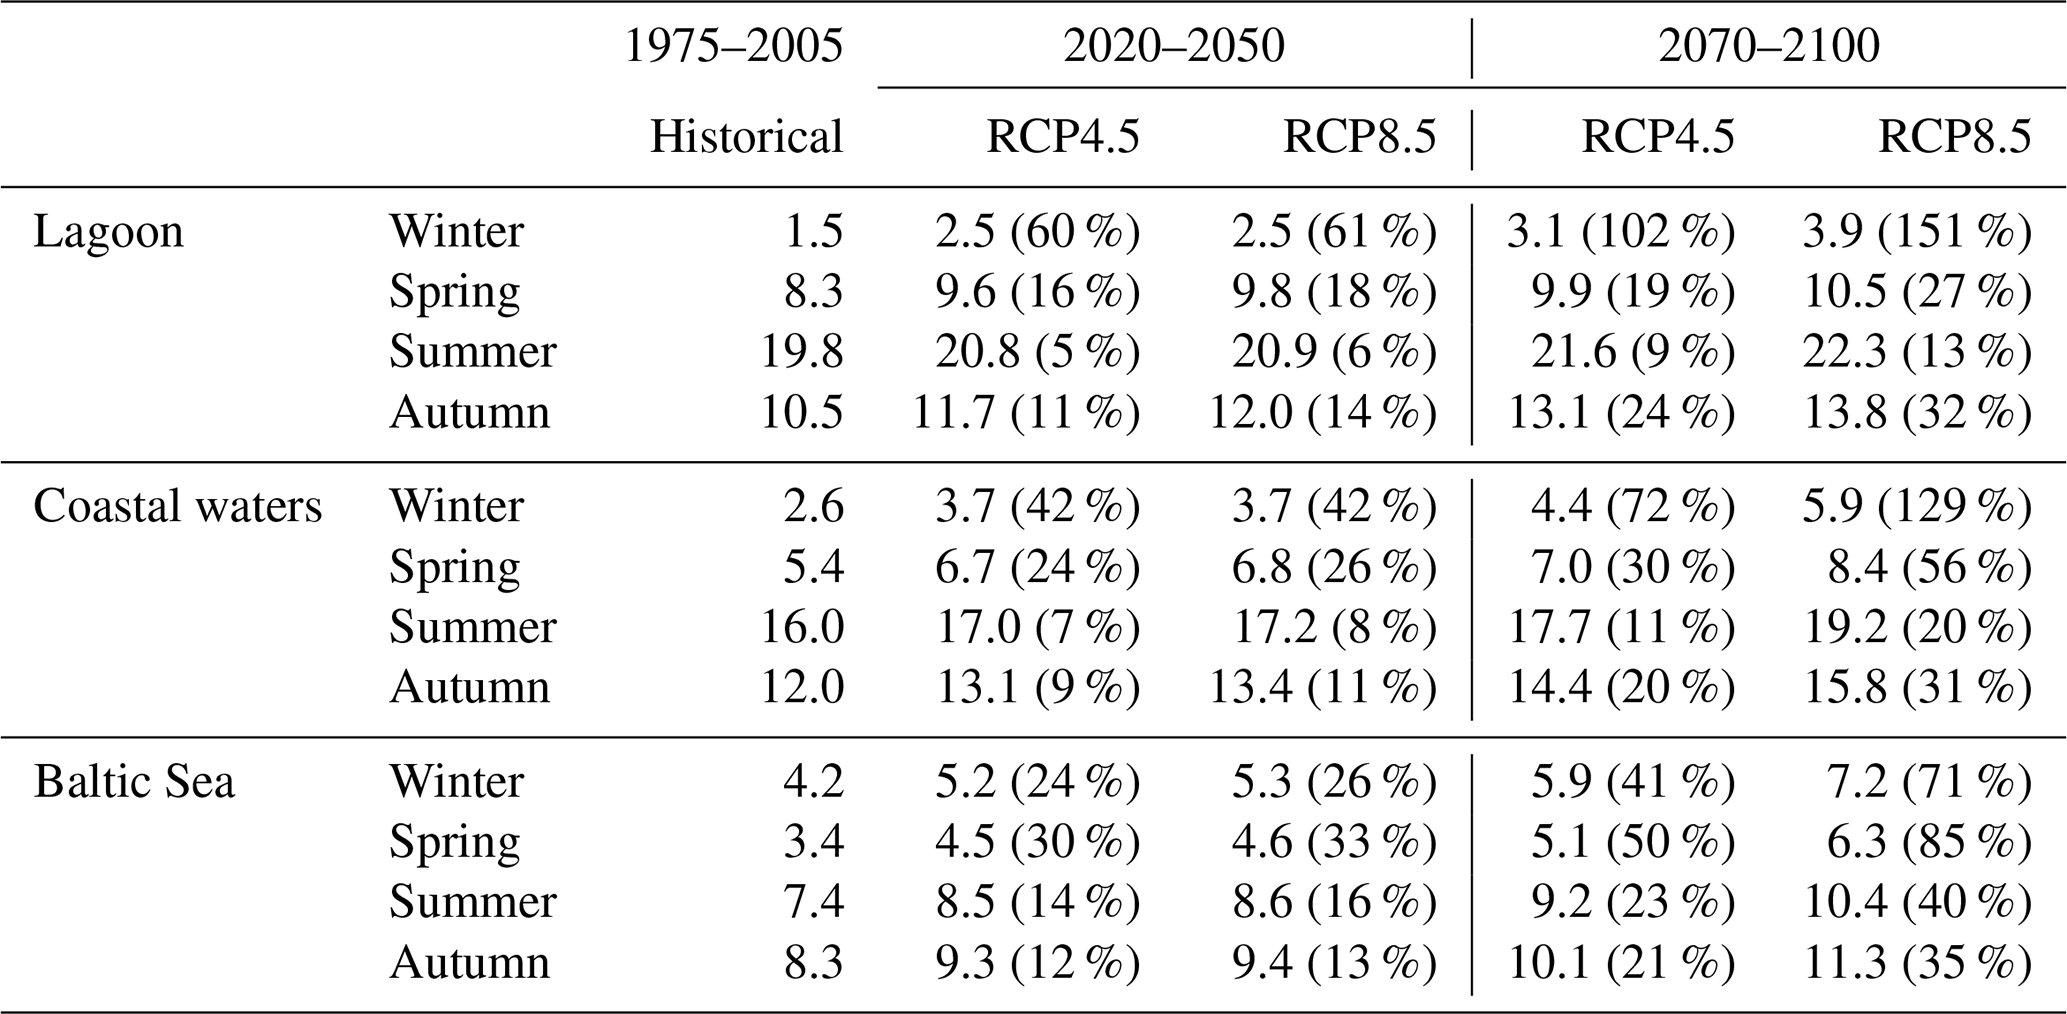
In general, in the Baltic Sea the highest change in the water temperature is projected in the long term than in the short term (Table 6). Seasonally, the highest increase is estimated in winter and spring during both analysis periods, of which the highest change is under the RCP8.5 scenario, compared with the historical period. The smallest change throughout the analysis periods is projected in summer and autumn. There is no apparent difference between the RCP scenarios in the short term, which is contrary to the long term, for which the RCP8.5 scenario displays a higher water temperature increase.
The seasonal dynamics in the coastal area (nearshore temperature) are very similar to the whole southeastern Baltic Sea, although the water temperature is slightly lower during the winter season, on average by 1.5 ∘C, and higher during other seasons, on average by 4.9 ∘C. The changes between the analysis periods and RCP scenarios, compared with the historical period, are higher than that of the southeastern Baltic Sea.
3.7 Water level
The water level in the Curonian Lagoon usually varies between −0.2 and 0 m during the historical period. In the short-term projections, the model estimates a water level increase by 17–20 cm compared with the historical period (Table 7). The highest increase can be estimated in the long term, when the water level in the lagoon increases by 32 cm under RCP4.5 and 41 cm under the RCP8.5 scenario, compared with the historical period. For the latter, the highest increase is observed in the Nemunas delta and the northern part of the lagoon.
Table 7The average water level (m) during the historical (1975–2005) and the short- (2020–2050) and long-term (2070–2100) periods under the RCP4.5 and RCP8.5 scenarios. Data were averaged over the southeastern Baltic Sea, Klaipėda Strait, and the Curonian Lagoon.
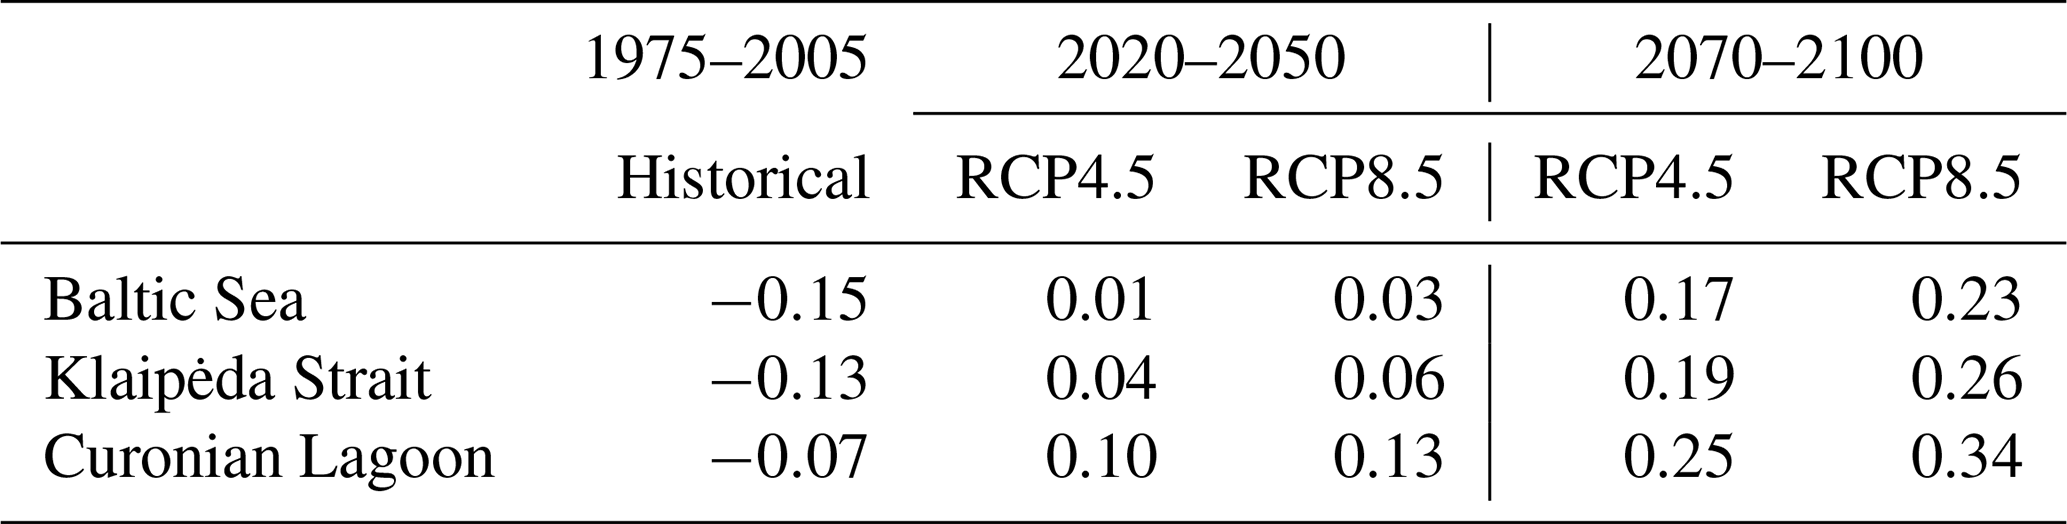
The water level in the Baltic Sea, in addition to the coastal area, is homogeneous and, most of the time, stays below the sea level during the historical period. The water level in the sea is expected to rise by 16–19 cm in the short term and by 32–39 cm in the long term, compared with the historical period (Table 7). This change is one-half of that in the Curonian Lagoon. At the domains' connective area, namely the Klaipėda Strait, the water level corresponds mostly to the dynamics of it in the sea.
3.8 Ice thickness
Ice thickness in the Curonian Lagoon is projected to decrease steadily. The average maximum ice thickness and ice season duration during the short-term period can decrease by 25 % compared with the historical period. Additionally, there is no apparent difference between the RCP scenarios (Fig. 9). An adverse case is with long-term projections, for which the average maximum ice thickness under the RCP4.5 scenario is estimated to decrease by half and by 70 % under the RCP8.5 scenario, compared with the historical period. The ice duration is also projected to continue becoming shorter by 35 % under RCP4.5 and 67 % under the RCP8.5 scenario, compared with its duration during the historical period. These changes indicate a possible severe modification of the ice regime in the lagoon, leading to winter seasons with a more likely unstable thin ice cover.
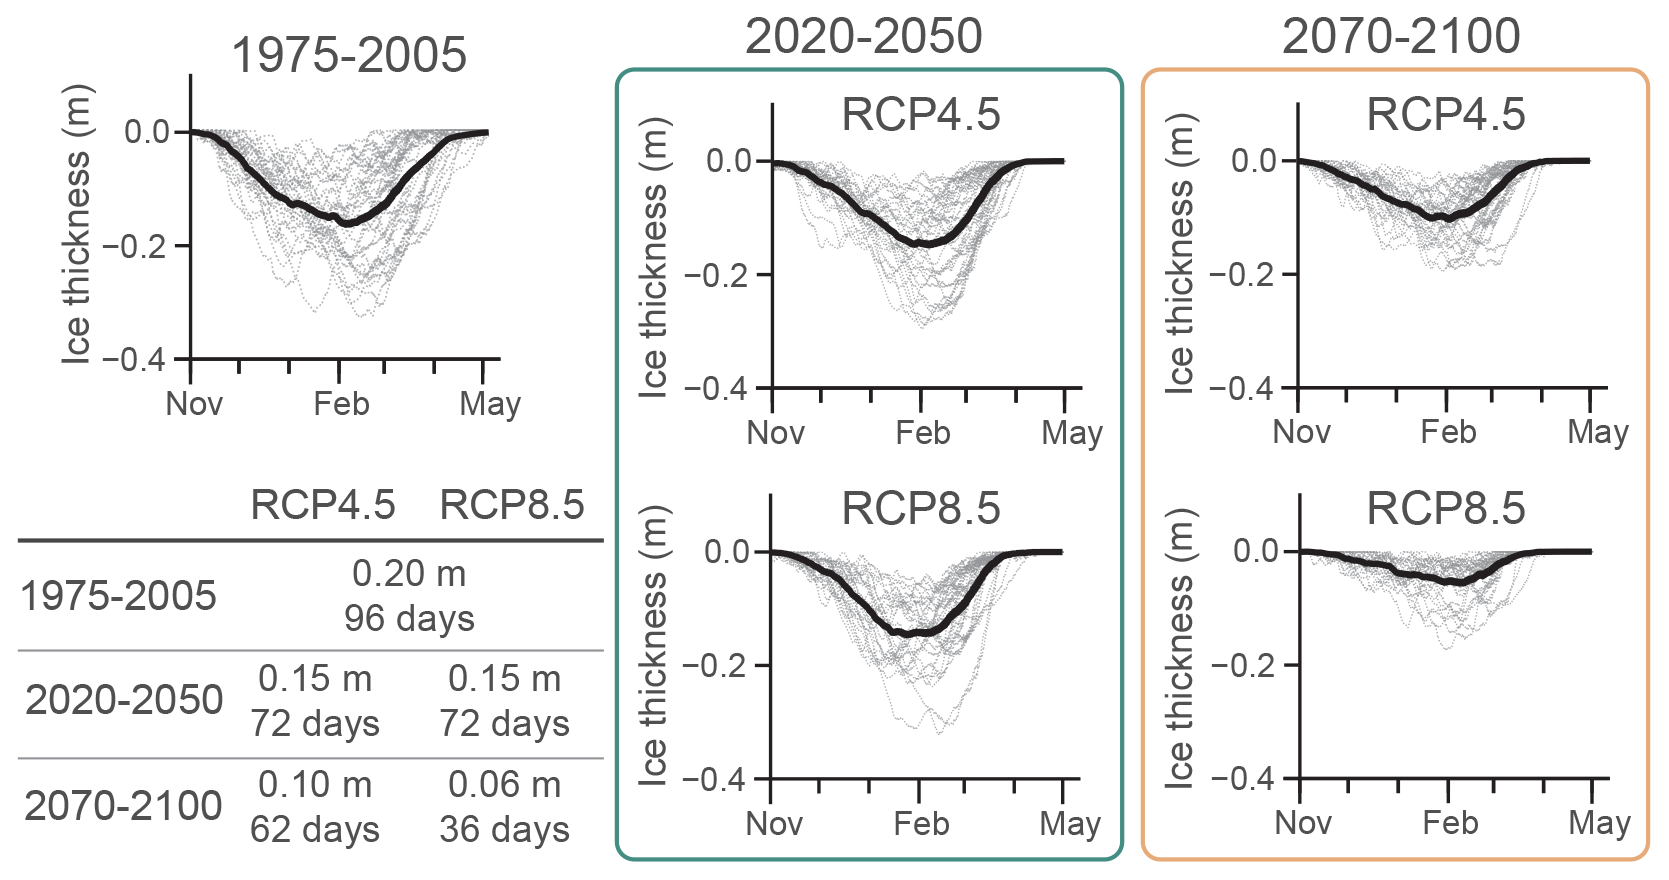
Figure 9The average ice thickness in the Curonian Lagoon. The black line indicates the average ice thickness of each analysis period, namely historical (1975–2005), short term (2020–2050), and long term (2070–2100) under the RCP4.5 and RCP8.5 scenarios. The table shows the average maximum ice thickness (m) and ice season duration (days) of the scenario runs compared with the historical period.
The results above give an indication of the variation in the physical parameters that the Nemunas river watershed, Curonian Lagoon, and southeastern part of the Baltic Sea will be subjected to. All parameters indicate a change, that is more or less strong, until the end of this century. These changes will be discussed hereafter.
4.1 Local climate insights
The results of this study have been achieved by applying a coupled hydrological–hydrodynamic modelling system, which was run with input data from regional climate models that have been downscaled from global models. The quality of the regional climate model output was generally good, but a comparison with local observed data showed the need to ultimately correct the downscaled data by applying a bias correction. This was needed because some variables (precipitation suffices as one example) were far from being well produced by the regional climate models (Tapiador et al., 2019).
As summarized in the assessments of climate change for the Baltic Sea region, it is evident that the region is warming, and it will continue to warm throughout the 21st century (Meier et al., 2022a). The European Environment Agency (EEA) has reported that climate models project a future increase in average temperature across Europe, with the largest warming expected in the eastern part of the continent. Accordingly, our study results show a considerable increase in the projected air temperatures as well (Table 8). These changes will likely result in warmer conditions during winters and less snow and ice cover, in addition to higher river discharge, while the increase in the air temperature during other seasons might have a severe impact on the crop production, increase the occurrence of hydrological and/or agricultural droughts, and impact changes in the crop calendar of the region. During summer months, rising temperatures could exacerbate water scarcity and increase the demand for irrigation (Christensen et al., 2022). This could have significant implications for agriculture and for water management and infrastructure planning in the region.
Table 8Summary of the percentage change in the projected average annual changes (under the RCP4.5 and RCP8.5 scenarios) during short-term (2020–2050) and long-term (2070–2100) periods, compared with the historical period (1975–2005).

The EEA also notes that changes in precipitation patterns, including a tendency towards drier summers and wetter winters, are projected in many regions of Europe (EEA, 2021). Climate models project an increase in the annual precipitation in many areas of eastern Europe but with a strong seasonal shift towards more winter precipitation and less summer precipitation (Jacob et al., 2014). Our results show that by the end of the century an increase in the total annual precipitation by 18 % to 34 % (∼ 100–200 mm), according to the RCP4.5 and RCP 8.5 scenarios, respectively, is projected. In comparison with a neighbouring country, this is considerably higher than the projected precipitation for the Latvian case, where the total annual increase was estimated to be 13 % to 16 % (∼ 80–100 mm) under the same scenarios (Avotniece et al., 2017). This can lead to increased runoff and river discharge, especially during the winter months, potentially increasing the risk of flooding, while the summer months could become drier and more prone to drought.
4.2 Water flow
The driving forces of changes in the lagoon are the boundaries, namely the Nemunas river inputs and the influence of the Baltic Sea through the Klaipėda Strait. Historically, for every year on average, the Nemunas river supplies 3 times the volume of water to the lagoon (Žilinskas et al., 2012), which is subject to change in the future. The projections indicate a 13 %–16 % (in the short term) and 19 %–37 % (in the long term) increase in the water discharge from the river, which coincides with the projected precipitation increase (Table 8). This projected change alone will strongly influence the hydrodynamic conditions of the lagoon.
Due to the enhanced Nemunas discharge, the fluxes from the Curonian Lagoon into the Baltic Sea will also increase. The outflow to the sea is already dominating, especially in the northern part of the lagoon, and it will remain so in the future. The water flow will increase on its path towards the Baltic Sea by 13 %–18 % in the short term and by ∼ 20 % under the RCP4.5 scenario in the long-term, while the changes under the RCP8.5 scenario can be expected to increase by up to 40 % by the end of the century, compared with the historical period (Table 8).
The volume of discharging river water into the Baltic Sea is projected to be dependent on the season and the region (Graham, 2004; Meier et al., 2022a). Together with this, the increase in the riverine nutrient loads is also anticipated (Pihlainen et al., 2020), likewise suggesting that “land-based nutrient management will have greater effect on nutrient loads than greenhouse gas emissions” (Climate Change in the Baltic Sea: 2021 Fact Sheet).
The seasonal river discharge changes in the Baltic Sea correspond with our study, noting that a more likely increase in winter and decrease in summer can be expected by the end of this century (Donnelly et al., 2014). The magnitude of the changes in the freshwater inflow within different subregions of the Baltic Sea has a considerable variation (i.e. an increased outflow in the northern part of the Baltic Sea and a decreased in the southern part; Graham, 2004), although the combined uncertainties from the climate models, their bias correction, and applied models make it difficult to draw conclusions about the magnitude of change (Donnelly et al., 2014).
Most alarming is the projected hydrologic changes in the Nemunas river watershed during the winter season in the long-term period. As supported by other studies (Čerkasova et al., 2021; Stonevičius et al., 2017), both RCPs point toward a drastic increase in winter discharges, which might lead to severe flooding of the delta region, which suffers from annual floods of different magnitudes (Valiuškevičius et al., 2018). Currently, these flood events occur in spring but will likely occur in winter in the future, and with increased severity, which will pose a serious concern to the local population and stakeholders. The currently functioning polder system in the Nemunas river delta (Lesutienė et al., 2022) region might not withstand such changes.
4.3 Water residence time in the lagoon
Water residence time (WRT) is generally decreasing with climate change (Table 8), although the decline is small in the short term and in the long term under the RCP4.5 scenario (5 %–10 % less). A general decrease can be found in the whole area of the lagoon in the long term under RCP8.5 (17 %). As in the case with saltwater intrusions, this is due to the increased discharge from the Nemunas river into the lagoon and further outflowing to the sea, where the WRT varies less in the north, whereas it decreases sensibly in the south.
When looking at seasonal changes, the WRT becomes lower in summer due to the decreasing river discharge. Comparing the changes from the historical period revealed that the highest decrease is observed during winter and spring, presumably due to the increased outflowing water fluxes and change in the ice cover regime.
4.4 Water level dynamics
Water levels are the main drivers, together with the Nemunas discharge, of the exchanges through the Klaipėda Strait. In the strait, and particularly in the Curonian Lagoon, water levels are higher than in the Baltic Sea, which lead to an increase in outflow periods through the strait. From 1960 until 2008, the average measured water level in the Curonian Lagoon has been rising at a rate of approximately 3.0 mm yr−1, leading to an increase by 18 cm during this period (Čepienė et al., 2022, and references therein). Our modelling results showed that, in the future, the water level is projected to increase by 16–20 cm in the short term and by 32–41 cm in the long term, compared with the historical period.
Since the projected water level will be above the mean sea level, it could affect the infrastructure and residents living in the coastal area, leading to significant social and economic damages (Vousdoukas et al., 2020). The low-elevation wetland areas covering the southern and eastern part of the lagoon (especially in Nemunas delta area) are more likely to be flooded. However, Klaipėda city and the Curonian Spit are located higher, and the mean water level rise should not permanently affect these areas. It is worth mentioning that the hydrodynamic model has a fixed boundary; thus, the increase could be overestimated, especially when considering the role of coastal wetlands in the mediation of global-change-induced water level changes.
4.5 Salinity dynamics
When looking at the saltwater intrusion events, it can be clearly seen that the intrusion periods are decreasing, and the outflow from the lagoon becomes dominant, simply because the outflowing water fluxes will stop the salty seawater from entering the Curonian Lagoon. This is clearly evident for both climate change scenarios, namely periods where values higher than the threshold of 2 g kg−1 in Juodkrantė drop by 30 %–50 % compared with the historical period (Table 8). This will lead to some alteration of the ecosystem in the northern part of the Curonian Lagoon, which is now considered to be oligohaline.
As seen and suggested in other Baltic Sea salinity projection studies, the salinity in the Baltic does not have a distinct pattern of changing in the future, and the projections have a lot of uncertainties (Lehmann et al., 2022; Meier et al., 2022b). Our study of the salinity changes in the southeastern Baltic Sea demonstrates a decreasing tendency, especially in the coastal area northward of the lagoon outlet, where the seawater is diluted by discharging freshwater from the lagoon (Table 8). However, the scenarios that we used to run the hydrodynamic model did not consider the global sea level rise, which, according to Meier et al. (2021), could more or less outweigh the projected increase in the river runoff into the Baltic Sea due to the higher volume of inflow from the adjacent North Sea.
4.6 Water temperature dynamics
The mean temperature of the water column in the Klaipėda Strait is less sensitive to changes, while the lagoon is expected to see an increase in temperature under both RCP scenarios (Table 8). Long-term projections under RCP8.5 show the highest increases. The southeastern Baltic Sea also shows increasing temperature patterns, with the highest changes occurring during the winter and spring. Coastal areas have similar dynamics but with higher changes compared with the historical period. The coastal average water temperature is lower by 1.5 ∘C in winter and higher by 4.9 ∘C during the rest of the year compared to the southeastern Baltic Sea.
Our study supports the findings of the projected increasing water temperature in the Baltic Sea (Meier et al., 2022b). In this article, we focused only on the average water temperature of the water column; however, there are many studies revealing the warming patterns of the sea surface temperature in the Baltic (Dutheil et al., 2022; Zhu et al., 2022).
4.7 Ice in the lagoon
Ice thickness in the lagoon will become thinner for a longer period during the ice season compared to the historical period. The projected changes of 25 % for the decreased maximum ice thickness and duration in the short term and 50 %–70 % maximum thickness and 35 %–63 % for the ice duration decrease in the long term (Table 8) could possibly lead to a severe alteration of the ice season regime in the future. This pattern corresponds to the trends in the southern Baltic lagoons (Girjatowicz and Świątek, 2021) and Gulf of Riga (Siitam et al., 2017; Kļaviņš et al., 2016), in addition to the Baltic Sea itself (Luomaranta et al., 2014).
Ice in the Curonian Lagoon has become a trending topic in the recent years, due to the already evident changes seen from the historical observations (Jakimavičius et al., 2019), remote sensing (Kozlov et al., 2020; Idzelytė et al., 2019), and modelling studies of future projections (Idzelytė and Umgiesser, 2021; Jakimavičius et al., 2019). The decreasing ice parameters' impact on the hydrodynamics of the lagoon suggests a possible increase in the water flow and saltwater intrusions, in addition to a shorter WRT during the ice cover season (Idzelytė et al., 2020; Umgiesser et al., 2016), although the role of ice for controlling the WRT is far less than the increased fluxes from the discharging rivers.
4.8 Impacts on the ecosystem structure and functions
Despite clear trends for physical indicators, the actual consequences of climate change for the functioning of the Curonian Lagoon ecosystem are much more complicated to predict. The foreseen minor salinity changes in the mostly freshwater ecosystem are unlikely to cause significant shifts in the ecosystem functioning, even in the northern part of the lagoon. However, some level of decrease in the distribution areas of some estuarine species (mysids and barnacles) could be foreseen. According to the latest combined genetic and hydraulic modelling study (Fernández-Alías et al., 2022), the connectivity between the Curonian Lagoon and coastal Baltic Sea fish population could be altered due to the decrease in marine intrusions during the spring spawning period that is common for most of the cyprinid species found in the Curonian Lagoon.
A recent analysis (Ivanauskas et al., 2022) indicated a statistical relationship between the WRT and salinity and both the catches and populations of the main commercial fish populations; the analysis also stated that a predicted decrease in salinity and increase in temperatures are favourable for the main commercial fish species. This is in stark contrast to the predictions for the Baltic Sea fishery, where catches are expected to be decreasing in quantity and especially in quality (Climate Change in the Baltic Sea, 2021). This could be explained by the fact that commercial catches in the Curonian Lagoon are already dominated by eutrophication-tolerant species like bream and pikeperch, which are also known to prefer higher water temperatures. However, the projected ice cover decrease will inevitably negatively affect the winter ice fishing practices in the lagoon.
The latest studies, revealing the mechanisms of nutrient cycling and eutrophication processes (Bartoli et al., 2018), point toward the expected reduction in the role of the Curonian Lagoon as a coastal filter. The shortening of the ice cover period will reduce the system denitrification capacity, while the decrease in the WRT will lead to a substantial reduction in the nutrient and organic matter retention due to the decreased burial and absorption rates. So far, the only difference is the more favourable conditions for the cage aquaculture in the lagoon, where the decreased WRT and increased flushing, in combination with modern practices of multi-trophic aquaculture (e.g. floating vegetable gardens), could remove some of the constraints preventing the development of cage aquaculture at present.
4.9 Study limitations and uncertainty
One potential limitation of the study is that the future scenarios only account for changes in climatic conditions, without taking into consideration the evolution of the drainage basin or the changes in the lagoon and the port area due to socioeconomic development. These factors are expected to impact land use, water requirements, surface runoff, and aquifer functioning, as well as hydrodynamic conditions in the lagoon–sea interface. Considering the political situation of the neighbouring countries, socioeconomic changes in this region are extremely difficult to predict. While this means that the predictions may not precisely reflect what will happen, the study still provides a valuable reference point for understanding the projected changes in the region. It can also serve as a necessary starting point for the development of more comprehensive socioeconomic predictive models.
It is worth mentioning that the analysed physical changes in the presented continuum system were assessed in the scope of climate change under the RCP4.5 and RCP8.5 scenarios; the RCP2.6 mitigation scenario (van Vuuren et al., 2011) was not covered in this study. Whereas tendencies could be identified in our analysis, it was yet not possible to discuss the uncertainty in the results achieved. This can be done only through extensive sensitivity analysis, although it was not part of the scope of this research article.
The developed modelling framework can be utilized to explore and quantify the proportion of the climate signal to internal system variability. The presence of transients (short term) and climatic trends (long term) in the modelled system can contribute to the observed variability in a variety of ways. For example, decreased salinity in the lagoon can result from increased river inflow, precipitation, and periodic saltwater intrusions from the Baltic Sea, which can be identified as an amplification of the processes and/or the superimposition of short-term and long-term gradual changes at various spatial scales over time. Depending on the driving process, different mitigation and/or adaptation strategies can be employed.
To properly identify and quantify such variability, we need to analyse the climatic projections and model responses individually, considering the temporal and spatial disaggregation. A follow-up study to this will explore this topic fully, where we will utilize statistical techniques, such as the Mann–Kendall test, wavelet analysis, time series decomposition, etc., to identify and quantify trends in the model responses. We will further identify which regional climate model and RCP scenario predicts the most significant changes in the coupled basin–lagoon–sea system. By distinguishing the short-term fluctuations from long-term trends, we will be able to evaluate the significance of each factor driving the observed variability. This will help us to identify the driving processes behind the changes and, if possible, suggest appropriate mitigation measures.
The set-up of the complex Nemunas river–Curonian Lagoon–Baltic Sea model has been successfully used in the climate change studies presented in this paper. The high-resolution hydrological model for the Nemunas river and hydrodynamic model for the Curonian Lagoon and the Baltic Sea were used. The finite element approach has allowed us to achieve a good compromise of the necessary resolution and computer efficiency to carry out all needed hydrodynamic simulations. With the help of downscaled climate models, which have ultimately been bias-corrected with observations, the tendency of the changes was inferred.
The study results showed that the Curonian Lagoon will be subject to higher Nemunas discharges that will in turn increase the outgoing fluxes into the Baltic Sea. Through these higher fluxes, both water residence times and saltwater intrusion events will decrease. Most of these changes will, however, only be noticeable in the northern part of the lagoon, which is more likely to be influenced by the Nemunas discharge. The southern part of the lagoon will experience fewer changes.
The foreseen changes in the physical characteristics are not of the scale that suggests significant shifts in the ecosystem structure (dominating species) and functioning (food webs) but are rather expected to manifest in some quantitative alterations in the nutrient and organic matter retention capacity. However, some ecosystem services, such as ice fishing, are expected to completely vanish due to the physical constraints.
The study has a limitation as it only considers climatic changes and overlooks the socioeconomic and basin evolution impacts. However, it still provides a valuable reference point for understanding the projected changes in the region. An uncertainty analysis was not within the study's scope but can be addressed through a sensitivity analysis. The developed modelling framework allows the exploration and quantification of the climate signal and internal system variability. Analysing the climatic projections and model responses individually, considering temporal and spatial disaggregation, will help us to identify driving factors for the observed variability. A follow-up study will employ statistical techniques to identify trends and assess the significant regional climate models and RCP scenarios. This will guide the identification of the driving processes and suggest appropriate mitigation measures.
All numerical modelling results created during this study are openly available in the Zenodo open-data repository (https://doi.org/10.5281/zenodo.7500744), as cited in Idzelytė et al. (2023).
GU and NC initiated the conceptualization and funding acquisition of the research project. RI, NC, and JM performed the analysis and drafted the paper. RI curated the visualization of the results. RI, NC, JM, TD, ARB, and AE prepared the original draft, with the assistance of GU. All co-authors reviewed the paper and contributed to the scientific interpretation and discussion.
The contact author has declared that none of the authors has any competing interests.
Publisher’s note: Copernicus Publications remains neutral with regard to jurisdictional claims in published maps and institutional affiliations.
This article is part of the special issue “Oceanography at coastal scales: modelling, coupling, observations, and applications”. It is not associated with a conference.
This project has been funded by the Research Council of Lithuania (LMTLT), grant no. S-MIP-21-24.
This paper was edited by Agustín Sánchez-Arcilla and reviewed by two anonymous referees.
Anthony, A., Atwood, J., August, P., Byron, C., Cobb, S., Foster, C., Fry, C., Gold, A., Hagos, K., Heffner, L., Kellogg, D. Q., Lellis-Dibble, K., Opaluch, J. J., Oviatt, C., Pfeiffer-Herbert, A., Rohr, N., Smith, L., Smythe, T., Swift, J., and Vinhateiro, N.: Coastal Lagoons and Climate Change: Ecological and Social Ramifications in U.S. Atlantic and Gulf Coast Ecosystems, Ecol. Soc., 14, 8, https://doi.org/10.5751/ES-02719-140108, 2009.
Avotniece, Z., Aniskevich, S., and Malinovskis, E.: Climate Change Scenarios for Latvia, Report summary, Riga, 2017.
BACC Author Team: Assessment of Climate Change for the Baltic Sea Basin, Springer Berlin Heidelberg, Berlin, Heidelberg, edited by: The BACC Author Team, https://doi.org/10.1007/978-3-540-72786-6, 2008.
BACC II Author Team: Second Assessment of Climate Change for the Baltic Sea Basin, edited by: The BACC II Author Team, Springer International Publishing, Cham, https://doi.org/10.1007/978-3-319-16006-1, 2015.
Bartoli, M., Zilius, M., Bresciani, M., Vaiciute, D., Vybernaite-Lubiene, I., Petkuviene, J., Giordani, G., Daunys, D., Ruginis, T., Benelli, S., Giardino, C., Bukaveckas, P. A., Zemlys, P., Griniene, E., Gasiunaite, Z. R., Lesutiene, J., Pilkaitytė, R., and Baziukas-Razinkovas, A.: Drivers of Cyanobacterial Blooms in a Hypertrophic Lagoon, Front. Mar. Sci., 5, 434, https://doi.org/10.3389/fmars.2018.00434, 2018.
Belkin, I. M.: Rapid warming of Large Marine Ecosystems, Prog. Oceanogr., 81, 207–213, https://doi.org/10.1016/j.pocean.2009.04.011, 2009.
Bellafiore, D. and Umgiesser, G.: Hydrodynamic coastal processes in the North Adriatic investigated with a 3D finite element model, Ocean Dynam., 60, 255–273, https://doi.org/10.1007/s10236-009-0254-x, 2010.
Camacho-Ibar, V. F. and Rivera-Monroy, V. H.: Coastal Lagoons and Estuaries in Mexico: Processes and Vulnerability, Estuar. Coasts, 37, 1313–1318, https://doi.org/10.1007/s12237-014-9896-0, 2014.
Čepienė, E., Dailidytė, L., Stonevičius, E., and Dailidienė, I.: Sea Level Rise Impact on Compound Coastal River Flood Risk in Klaipėda City (Baltic Coast, Lithuania), Water, 14, 414, https://doi.org/10.3390/w14030414, 2022.
Čerkasova, N., Umgiesser, G., and Ertürk, A.: Development of a hydrology and water quality model for a large transboundary river watershed to investigate the impacts of climate change – A SWAT application, Ecol. Eng., 124, 99–115, https://doi.org/10.1016/j.ecoleng.2018.09.025, 2018.
Čerkasova, N., Umgiesser, G., and Ertürk, A.: Assessing Climate Change Impacts on Streamflow, Sediment and Nutrient Loadings of the Minija River (Lithuania): A Hillslope Watershed Discretization Application with High-Resolution Spatial Inputs, Water, 11, 676, https://doi.org/10.3390/w11040676, 2019.
Čerkasova, N., Umgiesser, G., and Ertürk, A.: Modelling framework for flow, sediments and nutrient loads in a large transboundary river watershed: A climate change impact assessment of the Nemunas River watershed, J. Hydrol., 598, 126422, https://doi.org/10.1016/j.jhydrol.2021.126422, 2021.
Christensen, O. B., Kjellström, E., Dieterich, C., Gröger, M., and Meier, H. E. M.: Atmospheric regional climate projections for the Baltic Sea region until 2100, Earth Syst. Dynam., 13, 133–157, https://doi.org/10.5194/esd-13-133-2022, 2022.
Climate Change in the Baltic Sea: 2021 Fact Sheet. Baltic Sea Environment Proceedings no. 180, HELCOM/Baltic Earth, ISSN 0357-2994, 2021.
De Pascalis, F., Pérez-Ruzafa, A., Gilabert, J., Marcos, C., and Umgiesser, G.: Climate change response of the Mar Menor coastal lagoon (Spain) using a hydrodynamic finite element model, Estuar. Coast. Shelf S., 114, 118–129, https://doi.org/10.1016/j.ecss.2011.12.002, 2011.
de Wit, R., Mazouni, N., and Viaroli, P.: Preface: Research and Management for the Conservation of Coastal Lagoon Ecosystems, South–North Comparisons, Hydrobiologia, 699, 1–4, https://doi.org/10.1007/s10750-012-1158-1, 2012.
Dieterich, C., Wang, S., Schimanke, S., Gröger, M., Klein, B., Hordoir, R., Samuelsson, P., Liu, Y., Axell, L., Höglund, A., and Meier, H. E. M.: Surface Heat Budget over the North Sea in Climate Change Simulations, Atmosphere, 10, 272, https://doi.org/10.3390/atmos10050272, 2019.
Donnelly, C., Yang, W., and Dahné, J.: River discharge to the Baltic Sea in a future climate, Climatic Change, 122, 157–170, https://doi.org/10.1007/s10584-013-0941-y, 2014.
Dutheil, C., Meier, H. E. M., Gröger, M., and Börgel, F.: Understanding past and future sea surface temperature trends in the Baltic Sea, Clim. Dynam., 58, 3021–3039, https://doi.org/10.1007/s00382-021-06084-1, 2022.
EEA (European Environment Agency): Climate change in Europe: key facts and figures, https://www.eea.europa.eu/en/about/contact-us/faqs/what-are-the-climate-change-impacts-in-europe (last access: 15 March 2023), 2021.
Fernández-Alías, A., Razinkovas-Baziukas, A., Morkūnė, R., Ibáñez-Martínez, H., Bacevičius, E., Muñoz, I., Marcos, C., and Pérez-Ruzafa, A.: Recolonization origin and reproductive locations, but not isolation from the sea, lead to genetic structure in migratory lagoonal fishes, Mar. Environ. Res., 181, 105732, https://doi.org/10.1016/j.marenvres.2022.105732, 2022.
Ferrarin, C. and Umgiesser, G.: Hydrodynamic modeling of a coastal lagoon: The Cabras lagoon in Sardinia, Italy, Ecol. Model., 188, 340–357, https://doi.org/10.1016/j.ecolmodel.2005.01.061, 2005.
Ferrarin, C., Razinkovas, A., Gulbinskas, S., Umgiesser, G., and Bliudžiute, L.: Hydraulic regime-based zonation scheme of the Curonian Lagoon, Hydrobiologia, 611, 133–146, https://doi.org/10.1007/s10750-008-9454-5, 2008.
Ferrarin, C., Umgiesser, G., Bajo, M., Bellafiore, D., De Pascalis, F., Ghezzo, M., Mattassi, G., and Scroccaro, I.: Hydraulic zonation of the lagoons of Marano and Grado, Italy. A modelling approach, Estuar. Coast. Shelf S., 87, 561–572, https://doi.org/10.1016/j.ecss.2010.02.012, 2010.
Ferrarin, C., Bergamasco, A., Umgiesser, G., and Cucco, A.: Hydrodynamics and spatial zonation of the Capo Peloro coastal system (Sicily) through 3-D numerical modeling, J. Marine Syst., 117–118, 96–107, https://doi.org/10.1016/j.jmarsys.2013.02.005, 2013.
Gailiušis, B., Jablonskis, J., and Kovalenkovienė, M.: The Lithuanian rivers, in: Hydrography and Runoff, Lithuanian Energy Institute, Kaunas, Lithuania, ISBN 9986492645, 792 pp., 2001.
Gasiūnaitė, Z. R., Daunys, D., Olenin, S., and Razinkovas, A.: The Curonian Lagoon, in: Ecology of Baltic Coastal Waters, edited by: Schiewer, U., Springer, Berlin/Heidelberg, Germany, 197–215, https://doi.org/10.1007/978-3-540-73524-3_9, 2008.
Gassman, P. W., Reyes, M. R., Green, C. H., and Arnold, J. G.: The Soil and Water Assessment Tool: Historical Development, Applications, and Future Research Directions, T. ASABE, 50, 1211–1250, https://doi.org/10.13031/2013.23637, 2007.
Girjatowicz, J. P. and Świątek, M.: Relationship between Air Temperature Change and Southern Baltic Coastal Lagoons Ice Conditions, Atmosphere, 12, 931, https://doi.org/10.3390/atmos12080931, 2021.
Graham, L. P.: Climate Change Effects on River Flow to the Baltic Sea, Ambio, 33, 235–241, 2004.
Gröger, M., Arneborg, L., Dieterich, C., Höglund, A., and Meier, H. E. M.: Summer hydrographic changes in the Baltic Sea, Kattegat and Skagerrak projected in an ensemble of climate scenarios downscaled with a coupled regional ocean–sea ice–atmosphere model, Clim. Dynam., 53, 5945–5966, https://doi.org/10.1007/s00382-019-04908-9, 2019.
Gupta, R., Bhattarai, R., and Mishra, A.: Development of Climate Data Bias Corrector (CDBC) Tool and Its Application over the Agro-Ecological Zones of India, Water, 11, 1102, https://doi.org/10.3390/w11051102, 2019.
Hagemann, S., Stacke, T., and Ho-Hagemann, H. T. M.: High Resolution Discharge Simulations Over Europe and the Baltic Sea Catchment, Front. Earth Sci., 8, 12, https://doi.org/10.3389/feart.2020.00012, 2020.
Holt, J., Schrum, C., Cannaby, H., Daewel, U., Allen, I., Artioli, Y., Bopp, L., Butenschon, M., Fach, B. A., Harle, J., Pushpadas, D., Salihoglu, B., and Wakelin, S.: Potential impacts of climate change on the primary production of regional seas: A comparative analysis of five European seas, Prog. Oceanogr., 140, 91–115, https://doi.org/10.1016/j.pocean.2015.11.004, 2016.
Idzelytė, R. and Umgiesser, G.: Application of an ice thermodynamic model to a shallow freshwater lagoon, Boreal Environ. Res., 26, 61–77, 2021.
Idzelytė, R., Kozlov, I. E., and Umgiesser, G.: Remote Sensing of Ice Phenology and Dynamics of Europe's Largest Coastal Lagoon (The Curonian Lagoon), Remote Sens., 11, 2059, https://doi.org/10.3390/rs11172059, 2019.
Idzelytė, R., Mėžinė, J., Zemlys, P., and Umgiesser, G.: Study of ice cover impact on hydrodynamic processes in the Curonian Lagoon through numerical modeling, Oceanologia, 62, 428–442, https://doi.org/10.1016/j.oceano.2020.04.006, 2020.
Idzelytė, R., Čerkasova, N., Mėžinė, J., Dabulevičienė, T., Razinkovas-Baziukas, A., Ertürk, A., and Umgiesser, G.: The computation results of coupled hydrological and hydrodynamic modelling application for the Nemunas River watershed – Curonian Lagoon – South-Eastern Baltic Sea continuum, Zenodo [data set], https://doi.org/10.5281/zenodo.7500744, 2023.
Inácio, M., Schernewski, G., Nazemtseva, Y., Baltranaitė, E., Friedland, R., and Benz, J.: Ecosystem services provision today and in the past: a comparative study in two Baltic lagoons, Ecol. Res., 33, 1255–1274, https://doi.org/10.1007/s11284-018-1643-8, 2018.
Ivanauskas, E., Skersonas, A., Andrašūnas, V., Elyaagoubi, S., and Razinkovas-Baziukas, A.: Mapping and Assessing Commercial Fisheries Services in the Lithuanian Part of the Curonian Lagoon, Fishes, 7, 19, https://doi.org/10.3390/fishes7010019, 2022.
Jacob, D., Petersen, J., Eggert, B., Alias, A., Christensen, O. B., Bouwer, L. M., Braun, A., Colette, A., Déqué, M., Georgievski, G., Georgopoulou, E., Gobiet, A., Menut, L., Nikulin, G., Haensler, A., Hempelmann, N., Jones, C., Keuler, K., Kovats, S., Kröner, N., Kotlarski, S., Kriegsmann, A., Martin, E., van Meijgaard, E., Moseley, C., Pfeifer, S., Preuschmann, S., Radermacher, C., Radtke, K., Rechid, D., Rounsevell, M., Samuelsson, P., Somot, S., Soussana, J.-F., Teichmann, C., Valentini, R., Vautard, R., Weber, B., and Yiou, P.: EURO-CORDEX: new high-resolution climate change projections for European impact research, Reg. Environ. Change, 14, 563–578, https://doi.org/10.1007/s10113-013-0499-2, 2014.
Jakimavičius, D.: Changes of water balance elements of the Curonian Lagoon and their forecast due to anthropogenic and natural factors, Kaunas University of Technology, 2012.
Jakimavičius, D. and Kovalenkovienė, M.: Long-term water balance of the Curonian Lagoon in the context of anthropogenic factors and climate change, Baltica, 23, 33–46, 2010.
Jakimavičius, D. and Kriaučiūnienė, J.: The Hydrological Changes of the Curonian Lagoon in the Context of Climate Change, Vilnius Univ. Proc., 10, 36, https://doi.org/10.15388/Klimatokaita.2020.28, 2020.
Jakimavičius, D., Šarauskienė, D., and Kriaučiūnienė, J.: Influence of climate change on the ice conditions of the Curonian Lagoon, Oceanologia, 62, 164–172, https://doi.org/10.1016/j.oceano.2019.10.003, 2019.
Kļaviņš, M., Avotniece, Z., and Rodinovs, V.: Dynamics and Impacting Factors of Ice Regimes in Latvia Inland and Coastal Waters, Proc. Latv. Acad. Sci. Sect. B. Nat. Exact, Appl. Sci., 70, 400–408, https://doi.org/10.1515/prolas-2016-0059, 2016.
Kniebusch, M., Meier, H. E. M., Neumann, T., and Börgel, F.: Temperature Variability of the Baltic Sea Since 1850 and Attribution to Atmospheric Forcing Variables, J. Geophys. Res.-Ocean., 124, 4168–4187, https://doi.org/10.1029/2018JC013948, 2019.
Kozlov, I., Dailidienė, I., Korosov, A., Klemas, V., and Mingėlaitė, T.: MODIS-based sea surface temperature of the Baltic Sea Curonian Lagoon, J. Marine Syst., 129, 157–165, https://doi.org/10.1016/j.jmarsys.2012.05.011, 2014.
Kozlov, I. E., Krek, E. V., Kostianoy, A. G., and Dailidienė, I.: Remote Sensing of Ice Conditions in the Southeastern Baltic Sea and in the Curonian Lagoon and Validation of SAR-Based Ice Thickness Products, Remote Sens., 12, 3754, https://doi.org/10.3390/rs12223754, 2020.
Lehmann, A., Myrberg, K., Post, P., Chubarenko, I., Dailidiene, I., Hinrichsen, H.-H., Hüssy, K., Liblik, T., Meier, H. E. M., Lips, U., and Bukanova, T.: Salinity dynamics of the Baltic Sea, Earth Syst. Dynam., 13, 373–392, https://doi.org/10.5194/esd-13-373-2022, 2022.
Lenderink, G., Buishand, A., and van Deursen, W.: Estimates of future discharges of the river Rhine using two scenario methodologies: direct versus delta approach, Hydrol. Earth Syst. Sci., 11, 1145–1159, https://doi.org/10.5194/hess-11-1145-2007, 2007.
Lesutienė, J., Andrašūnas, V., Čerkasova, N., Gasiūnaitė, Z. R., Idzelytė, R., Ivanauskas, E., Kaziukonytė, K., Mėžinė, J., and Vilkevičiūtė, J.: EcoServe Guidelines (version 2), Zenodo, https://doi.org/10.5281/zenodo.6546247, 2022.
Lillebø, A. I.: Coastal Lagoons in Europe: Integrated Water Resource Strategies, Water Intell. Online, 14, 9781780406299, https://doi.org/10.2166/9781780406299, 2015.
Luomaranta, A., Ruosteenoja, K., Jylhä, K., Gregow, H., Haapala, J., and Laaksonen, A.: Multimodel estimates of the changes in the Baltic Sea ice cover during the present century, Tellus A, 66, 22617, https://doi.org/10.3402/tellusa.v66.22617, 2014.
Maher, D. T., Call, M., Macklin, P., Webb, J. R., and Santos, I. R.: Hydrological Versus Biological Drivers of Nutrient and Carbon Dioxide Dynamics in a Coastal Lagoon, Estuar. Coasts, 42, 1015–1031, https://doi.org/10.1007/s12237-019-00532-2, 2019.
McCrackin, M. L., Gustafsson, B. G., Hong, B., Howarth, R. W., Humborg, C., Savchuk, O. P., Svanbäck, A., and Swaney, D. P.: Opportunities to reduce nutrient inputs to the Baltic Sea by improving manure use efficiency in agriculture, Reg. Environ. Change, 18, 1843–1854, https://doi.org/10.1007/s10113-018-1308-8, 2018.
Meier, H. E. M.: Regional ocean climate simulations with a 3D ice-ocean model for the Baltic Sea. Part 1: model experiments and results for temperature and salinity, Clim. Dynam., 19, 237–253, https://doi.org/10.1007/s00382-001-0224-6, 2002a.
Meier, H. E. M.: Regional ocean climate simulations with a 3D ice–ocean model for the Baltic Sea. Part 2: results for sea ice, Clim. Dynam., 19, 255–266, https://doi.org/10.1007/s00382-001-0225-5, 2002b.
Meier, H. E. M., Dieterich, C., and Gröger, M.: Natural variability is a large source of uncertainty in future projections of hypoxia in the Baltic Sea, Commun. Earth Environ., 2, 50, https://doi.org/10.1038/s43247-021-00115-9, 2021.
Meier, H. E. M., Kniebusch, M., Dieterich, C., Gröger, M., Zorita, E., Elmgren, R., Myrberg, K., Ahola, M. P., Bartosova, A., Bonsdorff, E., Börgel, F., Capell, R., Carlén, I., Carlund, T., Carstensen, J., Christensen, O. B., Dierschke, V., Frauen, C., Frederiksen, M., Gaget, E., Galatius, A., Haapala, J. J., Halkka, A., Hugelius, G., Hünicke, B., Jaagus, J., Jüssi, M., Käyhkö, J., Kirchner, N., Kjellström, E., Kulinski, K., Lehmann, A., Lindström, G., May, W., Miller, P. A., Mohrholz, V., Müller-Karulis, B., Pavón-Jordán, D., Quante, M., Reckermann, M., Rutgersson, A., Savchuk, O. P., Stendel, M., Tuomi, L., Viitasalo, M., Weisse, R., and Zhang, W.: Climate change in the Baltic Sea region: a summary, Earth Syst. Dynam., 13, 457–593, https://doi.org/10.5194/esd-13-457-2022, 2022a.
Meier, H. E. M., Dieterich, C., Gröger, M., Dutheil, C., Börgel, F., Safonova, K., Christensen, O. B., and Kjellström, E.: Oceanographic regional climate projections for the Baltic Sea until 2100, Earth Syst. Dynam., 13, 159–199, https://doi.org/10.5194/esd-13-159-2022, 2022b.
Meynecke, J.-O., Lee, S. Y., Duke, N. C., and Warnken, J.: Relationships between estuarine habitats and coastal fisheries in Queensland, Australia, B. Mar. Sci., 80, 773–793, 2007.
Merkouriadi, I. and Leppäranta, M.: Long-term analysis of hydrography and sea-ice data in Tvärminne, Gulf of Finland, Baltic Sea, Climatic Change, 124, 849–859, https://doi.org/10.1007/s10584-014-1130-3, 2014.
Mėžinė, J., Ferrarin, C., Vaičiutė, D., Idzelytė, R., Zemlys, P., and Umgiesser, G.: Sediment transport mechanisms in a lagoon with high river discharge and sediment loading, Water, 11, 1970, https://doi.org/10.3390/w11101970, 2019.
Middelkoop, H., Daamen, K., Gellens, D., Grabs, W., Kwadijk, J. C., Lang, H., Parmet, B. W. A., Schädler, B., Schulla, J., and Wilke, K.: Impact of Climate Change on Hydrological Regimes and Water Resources Management in the Rhine Basin, Climatic Change, 49, 105–128, https://doi.org/10.1023/A:1010784727448, 2001.
Neitsch, S. L., Arnold, J. G., Kiniry, J. R., and Williams, J. R.: Soil and Water Assessment Tool Theoretical Documentation Version 2009, Texas Water Resources Institute, College Station, Texas, 2009.
Newton, A., Brito, A. C., Icely, J. D., Derolez, V., Clara, I., Angus, S., Schernewski, G., Inácio, M., Lillebø, A. I., Sousa, A. I., Béjaoui, B., Solidoro, C., Tosic, M., Cañedo-Argüelles, M., Yamamuro, M., Reizopoulou, S., Tseng, H.-C., Canu, D., Roselli, L., Maanan, M., Cristina, S., Ruiz-Fernández, A. C., Lima, R. F. de, Kjerfve, B., Rubio-Cisneros, N., Pérez-Ruzafa, A., Marcos, C., Pastres, R., Pranovi, F., Snoussi, M., Turpie, J., Tuchkovenko, Y., Dyack, B., Brookes, J., Povilanskas, R., and Khokhlov, V.: Assessing, quantifying and valuing the ecosystem services of coastal lagoons, J. Nat. Conserv., 44, 50–65, https://doi.org/10.1016/j.jnc.2018.02.009, 2018.
Olenin, S. and Daunys, D.: Coastal Typology Based on Benthic Biotope and Community Data: The Lithuanian Case Study, Coastline Reports, 4, 65–83, 2004.
Omstedt, A., Gustafsson, B., Rodhe, J., and Walin, G.: Use of Baltic Sea modelling to investigate the water cycle and the heat balance in GCM and regional climate models, Clim. Res., 15, 95–108, https://doi.org/10.3354/cr015095, 2000.
PAIC: Enhancement of SWAT model. Supplement of 3rd Interim report, SIA “Procesu analīzes un izpētes centrs”, Latvia, 42 pp., 2015.
Pérez-Ruzafa, A., Marcos, C., Pérez-Ruzafa, I. M., and Pérez-Marcos, M.: Coastal lagoons: “transitional ecosystems” between transitional and coastal waters, J. Coast. Conserv., 15, 369–392, https://doi.org/10.1007/s11852-010-0095-2, 2011.
Pihlainen, S., Zandersen, M., Hyytiäinen, K., Andersen, H. E., Bartosova, A., Gustafsson, B., Jabloun, M., McCrackin, M., Meier, H. E. M., Olesen, J. E., Saraiva, S., Swaney, D., and Thodsen, H.: Impacts of changing society and climate on nutrient loading to the Baltic Sea, Sci. Total Environ., 731, 138935, https://doi.org/10.1016/j.scitotenv.2020.138935, 2020.
Riahi, K., Rao, S., Krey, V., Cho, C., Chirkov, V., Fischer, G., Kindermann, G., Nakicenovic, N., and Rafaj, P.: RCP 8.5 – A scenario of comparatively high greenhouse gas emissions, Climatic Change, 109, 33–57, https://doi.org/10.1007/s10584-011-0149-y, 2011.
Rodrigues, M., Oliveira, A., Queiroga, H., Brotas, V., and Fortunato, A. B.: Modelling the effects of climate change in estuarine ecosystems with coupled hydrodynamic and biogeochemical models, Dev. Environ. Model., 27, 271–288, https://doi.org/10.1016/B978-0-444-63536-5.00012-0, 2015.
Seifert, T., Tauber, F., and Kayser, B.: A high resolution spherical grid topography of the Baltic Sea – 2nd Edn., [data set], https://www.io-warnemuende.de/topography-of-the-baltic-sea.html, 2001.
Siitam, L., Sipelgas, L., Pärn, O., and Uiboupin, R.: Statistical characterization of the sea ice extent during different winter scenarios in the Gulf of Riga (Baltic Sea) using optical remote-sensing imagery, Int. J. Remote Sens., 38, 617–638, https://doi.org/10.1080/01431161.2016.1268734, 2017.
Stonevičius, E., Rimkus, E., Štaras, A., Kažys, J., and Valiuškevičius, G.: Climate change impact on the Nemunas River basinhydrology in the 21st century, Boreal Environ. Res., 22, 49–65, 2017.
Tapiador, F. J., Roca, R., Del Genio, A., Dewitte, B., Petersen, W., and Zhang, F.: Is Precipitation a Good Metric for Model Performance?, B. Am. Meteorol. Soc., 100, 223–233, https://doi.org/10.1175/BAMS-D-17-0218.1, 2019.
Tedesco, L., Vichi, M., Haapala, J., and Stipa, T.: An enhanced sea-ice thermodynamic model applied to the Baltic Sea, Boreal Environ. Res., 14, 68–80, 2009.
Thomson, A. M., Calvin, K. V., Smith, S. J., Kyle, G. P., Volke, A., Patel, P., Delgado-Arias, S., Bond-Lamberty, B., Wise, M. A., Clarke, L. E., and Edmonds, J. A.: RCP4.5: a pathway for stabilization of radiative forcing by 2100, Climatic Change, 109, 77–94, https://doi.org/10.1007/s10584-011-0151-4, 2011.
Umgiesser, G., Canu, D. M., Cucco, A., and Solidoro, C.: A finite element model for the Venice Lagoon. Development, set up, calibration and validation, J. Marine Syst., 51, 123–145, https://doi.org/10.1016/j.jmarsys.2004.05.009, 2004.
Umgiesser, G., Ferrarin, C., Cucco, A., De Pascalis, F., Bellafiore, D., Ghezzo, M., and Bajo, M.: Comparative hydrodynamics of 10 Mediterranean lagoons by means of numerical modeling, J. Geophys. Res.-Ocean., 119, 2212–2226, https://doi.org/10.1002/2013JC009512, 2014.
Umgiesser, G., Zemlys, P., Erturk, A., Razinkovas-Baziukas, A., Mezine, J., and Ferrarin, C.: Seasonal renewal time variability in the Curonian Lagoon caused by atmospheric and hydrographical forcing, Ocean Sci., 12, 391–402, https://doi.org/10.5194/os-12-391-2016, 2016.
Valiuškevičius, G., Stonevičius, E., Stankūnavičius, G., and Brastovickytė-Stankevič, J.: Severe floods in Nemunas River Delta, Baltica, 31, 89–99, https://doi.org/10.5200/baltica.2018.31.09, 2018.
van Vuuren, D. P., Stehfest, E., den Elzen, M. G. J., Kram, T., van Vliet, J., Deetman, S., Isaac, M., Klein Goldewijk, K., Hof, A., Mendoza Beltran, A., Oostenrijk, R., and van Ruijven, B.: RCP2.6: exploring the possibility to keep global mean temperature increase below 2 ∘C, Climatic Change, 109, 95–116, https://doi.org/10.1007/s10584-011-0152-3, 2011.
Vigouroux, G., Kari, E., Beltrán-Abaunza, J. M., Uotila, P., Yuan, D., and Destouni, G.: Trend correlations for coastal eutrophication and its main local and whole-sea drivers – Application to the Baltic Sea, Sci. Total Environ., 779, 146367, https://doi.org/10.1016/j.scitotenv.2021.146367, 2021.
Vohland, K., Rannow, S., and Stagl, J.: Climate Change Impact Modelling Cascade – Benefits and Limitations for Conservation Management, 63–76, https://doi.org/10.1007/978-94-007-7960-0_5, 2014.
von Storch, H., Omstedt, A., Pawlak, J., and Reckermann, M.: Introduction and Summary, 1–22, https://doi.org/10.1007/978-3-319-16006-1_1, 2015.
Vousdoukas, M. I., Mentaschi, L., Hinkel, J., Ward, P. J., Mongelli, I., Ciscar, J.-C., and Feyen, L.: Economic motivation for raising coastal flood defenses in Europe, Nat. Commun., 11, 2119, https://doi.org/10.1038/s41467-020-15665-3, 2020.
Vybernaite-Lubiene, I., Zilius, M., Saltyte-Vaisiauske, L., and Bartoli, M.: Recent Trends (2012–2016) of N, Si, and P Export from the Nemunas River Watershed: Loads, Unbalanced Stoichiometry, and Threats for Downstream Aquatic Ecosystems, Water, 10, 1178, https://doi.org/10.3390/w10091178, 2018.
Vybernaite-Lubiene, I., Zilius, M., Bartoli, M., Petkuviene, J., Zemlys, P., Magri, M., and Giordani, G.: Biogeochemical Budgets of Nutrients and Metabolism in the Curonian Lagoon (South East Baltic Sea): Spatial and Temporal Variations, Water, 14, 164, https://doi.org/10.3390/w14020164, 2022.
Wang, S., Dieterich, C., Döscher, R., Höglund, A., Hordoir, R., Meier, H. E. M., Samuelsson, P., and Schimanke, S.: Development and evaluation of a new regional coupled atmosphere–ocean model in the North Sea and Baltic Sea, Tellus A, 67, 24284, https://doi.org/10.3402/tellusa.v67.24284, 2015.
Watson, E. B., Hinojosa-Corona, A., Krause, J. R., Herguera, J. C., McDonnell, J., Villegas Manríquez, K. R. V., Gannon, M. E., and Gray, A. B.: Lagoon Biogeochemical Processing is Reflected in Spatial Patterns of Sediment Stable Isotopic Ratios, J. Mar. Sci. Eng., 8, 874, https://doi.org/10.3390/jmse8110874, 2020.
Žaromskis, R.: Oceans, Seas, Estuaries, Debesija, Vilnius, edited by: Pruskuvienė, G., ISBN 9986-652-02-2, 1996.
Zemlys, P., Ferrarin, C., Umgiesser, G., Gulbinskas, S., and Bellafiore, D.: Investigation of saline water intrusions into the Curonian Lagoon (Lithuania) and two-layer flow in the Klaipėda Strait using finite element hydrodynamic model, Ocean Sci., 9, 573–584, https://doi.org/10.5194/os-9-573-2013, 2013.
Zhu, S., Luo, Y., Ptak, M., Sojka, M., Ji, Q., Choiński, A., and Kuang, M.: A hybrid model for the forecasting of sea surface water temperature using the information of air temperature: a case study of the Baltic Sea, All Earth, 34, 27–38, https://doi.org/10.1080/27669645.2022.2058689, 2022.
Žilinskas, G., Jarmalavičius, D., Pupienis, D., Gulbinas, G., Korotkich, P., Palčiauskaitė, R., Pileckas, M., and Raščius, G.: Curonian Lagoon coastal management study, Tech. Rep., Nature Heritage Fund, 2012.