the Creative Commons Attribution 4.0 License.
the Creative Commons Attribution 4.0 License.
 | 05 Jul 2022
The Levantine Intermediate Water in the western Mediterranean and its interactions with the Algerian Gyres: insights from 60 years of observation
Katia Mallil
Pierre Testor
Anthony Bosse
Félix Margirier
Loic Houpert
Hervé Le Goff
Laurent Mortier
Ferial Louanchi
The presence of two large-scale cyclonic gyres in the Algerian Basin influences the general and eddy circulation, but their effects on water mass transfer remain poorly characterized. Our study has confirmed the presence of these gyres using the first direct current measurements of the whole water column collected during the SOMBA-GE2014 cruise, specifically designed to investigate these gyres. Using cruise sections and a climatology from 60 years of in situ measurements, we have also shown the effect of these gyres on the distribution at intermediate depth of Levantine Intermediate Water (LIW) with warmer (∼ 0.15 ∘C) and saltier (∼ 0.02) characteristics in the Algerian Basin than in the Provençal Basin. The Algerian Gyres, combined with the effect of anticyclonic Algerian Eddies, also impact horizontal density gradients with sinking of the isopycnals at the gyres' centers. Temporal cross-correlation of LIW potential temperature referenced to a signal observed southwest of Sardinia reveals a timescale of transit of 4 months to get to the center of the Algerian Basin.
The LIW potential temperature and salinity trends, on average in the basin interior, are estimated to be +0.0022 ± 0.0002 and +0.0022 ± 0.0001 yr−1, respectively, over the 1968–2017 period and accelerating to +0.048 ± 0.003 and +0.0076 ± 0.0009 yr−1 over the 2013–2017 period.
- Article
(14309 KB) - Full-text XML
- BibTeX
- EndNote


The Mediterranean Sea is a semi-enclosed evaporation basin with water and heat deficits (Béthoux, 1979; Bryden and Kinder, 1991). The Mediterranean Sea is characterized by a dynamic thermohaline circulation resulting from a strong air–sea coupling and preconditioning to deep vertical mixing (Robinson et al., 2001). The difference in water density and sea level at Gibraltar Strait forces a surface inflow of relatively warm and fresh Atlantic Waters (AW), flowing then cyclonically along the continental slope of the different sub-basins (Millot, 1999; The MerMex Group: Durrieu de Madron et al., 2011). At the northern coast of Africa the Algerian Current flows. Its high velocities up to 1 m s−1 (Benzohra and Millot, 1995) and important baroclinic instabilities generate mesoscale meanders and Algerian Eddies, denoted as AEs here (Millot et al., 1990). At depth, saltier and colder (on average over the year) waters exit through the same strait and form the Mediterranean Outflow Water (MOW) through cascading and mixing in the Atlantic. This exchange between the Atlantic Ocean and the Mediterranean Sea occurring in the southwestern Mediterranean is a major driver of the water mass dynamics of this basin but also of the whole Mediterranean Sea (Robinson et al., 2001). MOW signature can be identified in the whole North Atlantic and impacts the global thermohaline circulation (Johnson, 1997; Lozier and Stewart, 2008). The Levantine Intermediate Water (LIW) represents about half of the MOW, the other half being made of Western Mediterranean Deep Water (WMDW) (Gascard and Richez, 1985; Bryden et al., 1994). LIW is formed during winter in the eastern Mediterranean Sea by the mixing of salty surface water down to 500 and up to 1000 m and then spreads throughout the Mediterranean following a cyclonic along-slope circulation scheme, similarly to the surface water. To enter the Algéro-Provençal Basin, a fraction of the LIW passes through the Corsica Channel and flows along the French coast (Northern Current), and the larger part goes around Sardinia then joins the Northern Current. LIW lays between ∼ 300 and ∼ 700 m depth in the western basin and is identified by an absolute salinity maximum and a relative potential temperature maximum. It appears in θ–S diagrams as the so-called “scorpion tail” shape (Tchernia, 1958). However, compared to the northwestern Mediterranean where important ventilation and deep convection processes occur (MEDOC GROUP, 1970; Houpert et al., 2016; Testor et al., 2018), relatively few studies about ocean circulation have focused on the southwestern Mediterranean so far, particularly regarding the LIW.
During the Mass Transfer and Ecosystem Response (MATER) program, isobaric floats drifting at 600 m depth (from July 1997 to June 1998), moorings, and profiling floats with nominal parking depths of 1200 and 2000 m depth (1997 to 2002) were used to assess the circulation of LIW, Tyrrhenian Deep Water (TDW) and WMDW. The dominant pattern revealed by the float trajectories are two large-scale cyclonic gyres, so-called western and eastern Algerian Gyres, centered around 37∘30′ N, 2∘3′ E and 38∘30′ N, 6∘ E, respectively (Testor et al., 2005a). These two gyres affect the whole water column, and their location is strongly related to the closed contours (f is the planetary vorticity and H, the water depth). The barotropic orbital velocities of the gyres are about 5 cm s−1.
It has been shown through the ELISA (Eddies and Leddies Interdisciplinary Study in the Algerian Basin) experiment that AEs transport LIW from the vein flowing northward along the continental slope of Sardinia toward the interior of the basin by entrapping or dispatching pieces of it (Taupier-Letage et al., 2003; Millot and Taupier-Letage, 2005a). The LIW vein south and west of Sardinia can become unstable and generate anticyclonic eddies that can also transport LIW toward the interior of the basin (Millot, 1999; Testor and Gascard, 2005). The possibility of the presence of a permanent westward LIW vein across the Algerian Basin as described by Wüst (1961) has been largely rejected by the scientific community in favor of eddy transport. Puillat et al. (2002) have used satellite images, mainly from NOAA/AVHRR thermal infrared channels (February 1996 to December 1998), to track AEs over the long term and have evidenced their cyclonic circuit in the eastern part of the Algerian Basin that could help in transporting LIW westward. This was further documented by Escudier et al. (2016a) showing a cyclonic mean path around both Algerian Gyres of the anticyclonic eddies tracked with their surface signature during 20 years (1993–2014) using satellite altimetry. Testor and Gascard (2005) have also observed the formation of Sardinian Eddies (SEs) transporting LIW in their cores in the center of the basin and linked them to the detachment of the LIW vein further at the southwestern tip of Sardinia and the presence of a large-scale cyclonic motion in the Algerian Basin (the Eastern Algerian Gyre). Testor et al. (2005b) have further investigated the formation of these eddies and assessed their impact on eddy transport using numerical modeling; the presence of a LIW core in the SEs confirmed their transport efficiency. In addition to AEs and SEs, Bosse et al. (2015) have shown the important contribution to the spreading of LIW in the western Mediterranean by smaller structures (∼ 5 km radius), so-called submesoscale coherent vortices (SCVs), likely formed along the western coast of Sardinia by the influence of bathymetry on the northward LIW flow. These observations have revealed the efficiency of these circulation features to transport warm and salty LIW from the boundary circulation toward the basin interior, and in particular across the Algerian Basin.
Regarding the evolution of the hydrology, the deep water properties were thought for a long time to have constant temperature and salinity, before oceanographers discovered that deep convection was renewing them and abruptly modifying their temperature and salinity properties. In that context, Béthoux et al. (1990) have shown an increase in potential temperature of 0.12 ∘C between 1959 to 1989 in the deep water (> 2000) using historical observations. Then from volume and heat conservation calculations, an increasing trend of 0.005 in the intermediate layer has been deduced. Béthoux and Gentili (1996) have compared in situ temperature and salinity measurements of the intermediate layer from historical data covering the 1950–1973 period with measurements acquired in 1991 and 1992 and have shown an increase in temperature of 0.0068 and an increase in salinity of 0.0018 yr−1. Sparnocchia et al. (1994) have also reported a significant increase in LIW core temperature in almost all the areas of the western Mediterranean, based on data from 1950 to 1987 (e.g., 0.0091 in Ligurian Sea and 0.0065 in the Sicily Channel). Among the more recent studies Schroeder et al. (2017) reported stronger trends of LIW potential temperature and salinity of 0.024 and 0.006 yr−1 (1993–2016), respectively, using a mooring in the Sicily Channel. Margirier et al. (2020) have reported even larger increasing trends of 0.06 ± 0.01 and 0.012 ± 0.02 yr−1, respectively, during the 2007–2017 period in the Ligurian Sea. The discrepancies of the trend values among those studies are likely due to the difference in the chosen periods and locations.
In this study, we present new observations of the Algerian Gyres, highlighting their effect on the LIW distribution and propagation of thermohaline signals across the basin in a broad time period, using current measurements from the research cruise SOMBA-GE 2014 along with potential temperature and salinity in situ data. We provide estimates of the trends over the last 60 years during three main periods and eight regional boxes. The time series are then used to infer circulation timescale and pattern of LIW in the Algerian Basin. We first present data and methods in Sect. 2 and then the results in Sect. 3, which we discuss in Sect. 4. We finally conclude briefly in Sect. 5.
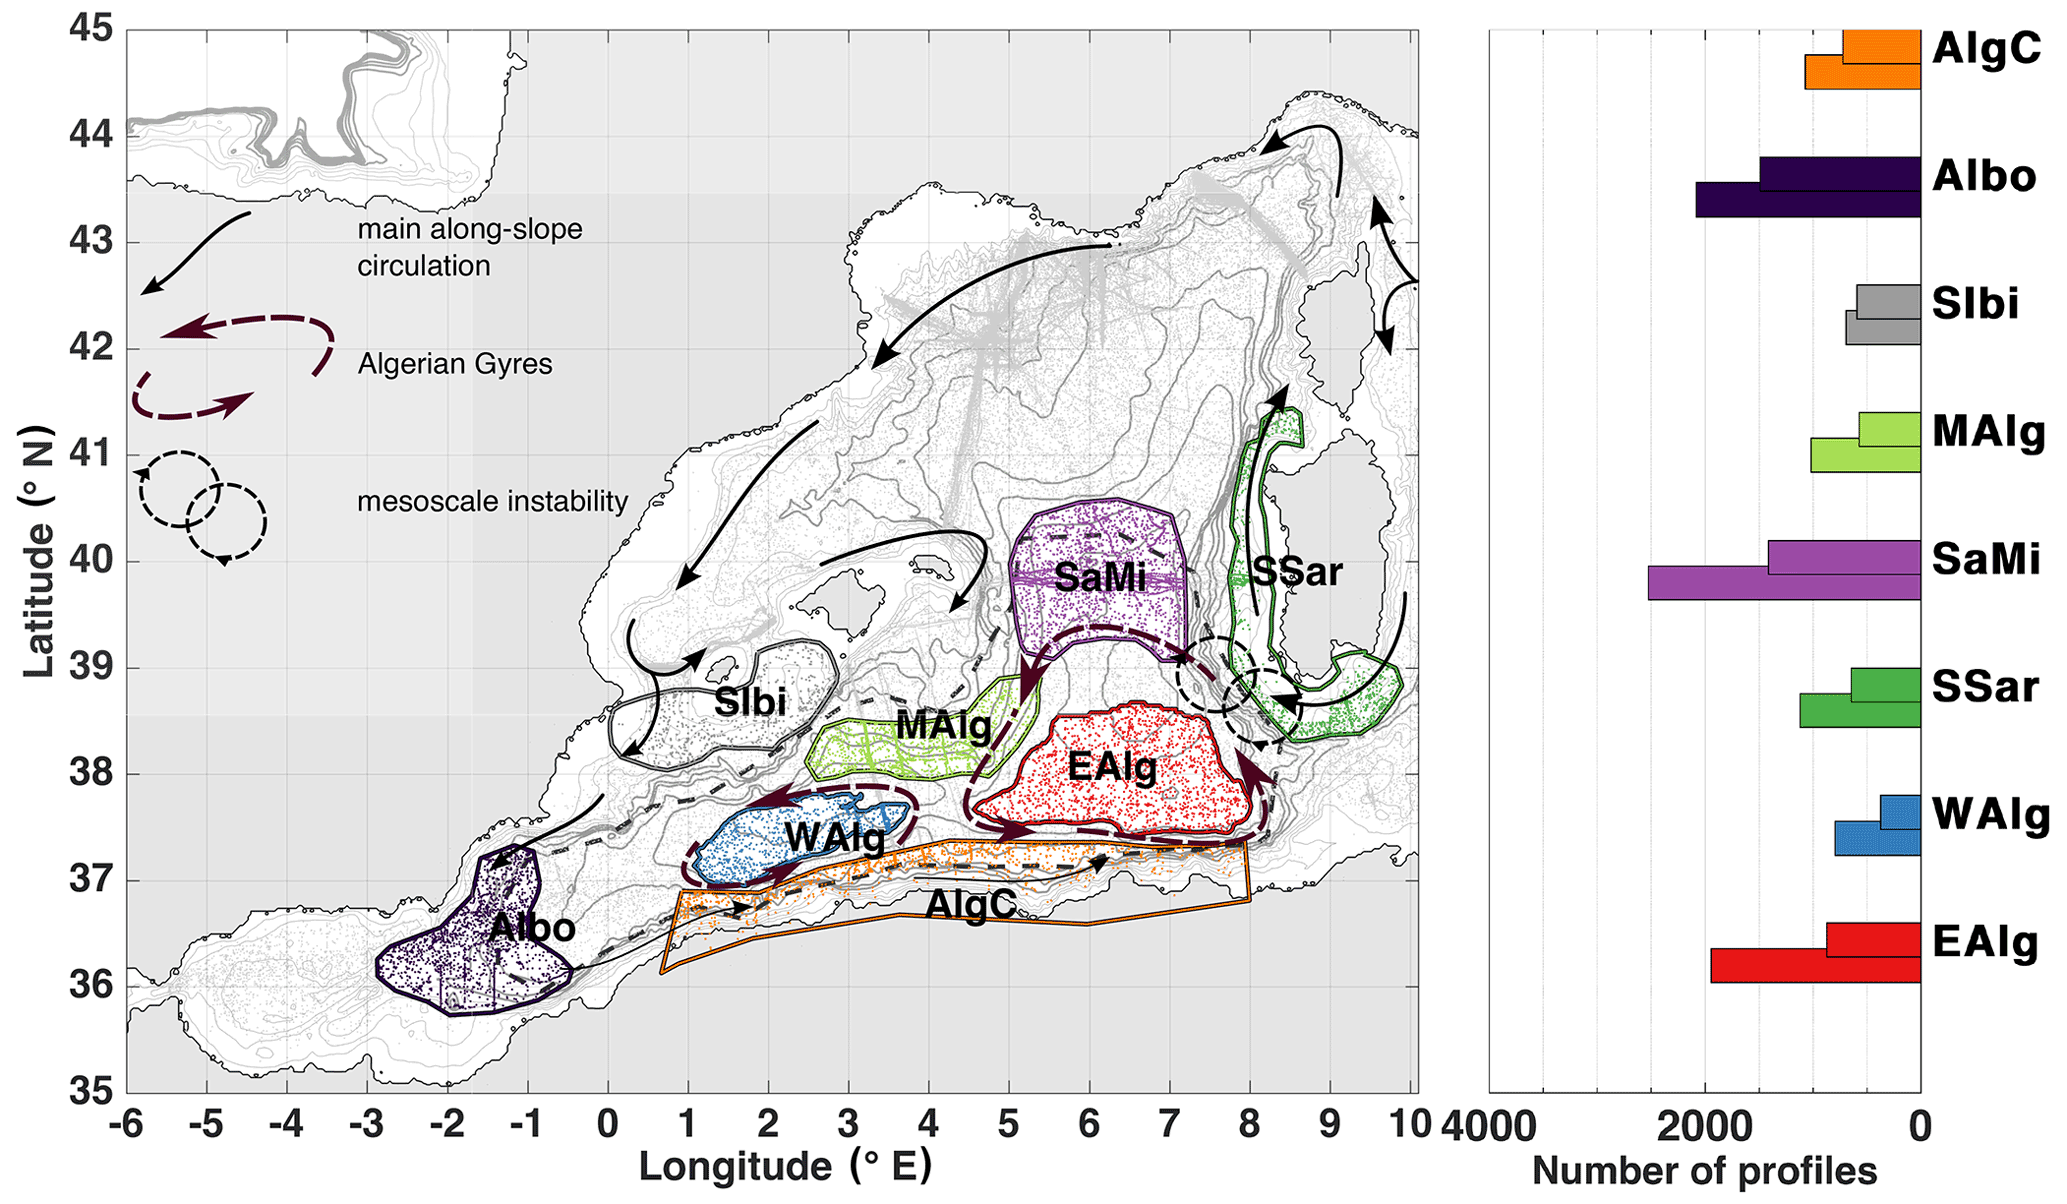
Figure 1Maps of the western Mediterranean Sea, showing the general circulation pattern of LIW. The colored polygons define the areas used to select data for our comparative study. The dark gray dashed contour line define the area used to compute the basin-averaged trends. The background contour lines represent the bathymetry of the region. The gray dots (and colored ones inside the polygons) represent a scatter of LIW temperature data between 1960 and 2017. The bar plot on the right panel shows the total number of profiles containing a LIW core characteristic in each polygon (bottom bar for θ, top one for salinity). The labels of the corresponding polygons are written in the y axis.
2.1 In situ data
All available potential temperature and salinity profiles (from 1960 up to and including 2017) in the Mediterranean Sea coming from multiple platforms (conductivity temperature depth, CTD, sensors; profiling floats; gliders; expendable bathythermographs, XBTs; and mechanical bathythermographs, MBTs) have been gathered from different sources in order to track the changes in the water mass properties, and make up-to-date climatologies of LIW in the Algéro-Provençal Basin. Figure 1 shows the distribution of these data in the Algéro-Provençal Basin.
The hydrographical data used in this study were gathered from the Coriolis project (see http://www.coriolis.eu.org/, last access: 20 January 2018), MEDAR/MEDATLAS (Fichaut et al., 2003), World Ocean Database (Conkright et al., 2002), MMD (Mediterranean Marine Data), collaboration between CNR (Consiglio Nazionale delle Ricerche) and ENEA (Italian National Agency for New Technologies, Energy and Sustainable Economic Development) (Borghini et al., 2019; Durante et al., 2019; Ribotti and Borghini, 2008; Ribotti et al., 2022), “EGO” (Everyone's Gliding Observatories http://www.ego-network.org/, last access: 28 January 2018), and SOCIB websites (http://www.socib.eu/, last access: 16 October 2018). A significant part of data is coming from MOOSE and SOMBA networks (Testor et al., 2010, 2017; Coppola et al., 2019; Mortier et al., 2014; Iudicone et al., 2014), which aim at addressing scientific and environmental issues relevant for climate change in the northwestern Mediterranean Sea and in the Algerian Basin.
We applied rigorous and systematic quality controls and corrections on potential temperature and salinity data, in particular for XBTs, as described by Houpert et al. (2015), allowing us to detect interannual variations at the basin scale with enough confidence.
Based on climatological analysis previously published (Manca et al., 2004), and profile visualizations carried out with our data set, some profiles were considered as outliers and thus discarded if one of the following criteria applies to them:
-
salinity larger than 39 or smaller than 36 below 100 m;
-
potential temperature (θ) larger than 17 ∘C below 200 m, larger than 14 ∘C below 1000 m or smaller than 10∘C;
-
potential densities larger than 29.2 kg m−3 between 0 and 2000 m, smaller than 28.5 kg m−3 between 400 to 1000 m or smaller than 29.02 kg m−3 below 1000 m.
These quality controls and corrections result from many iterations and represent a trade-off between measurements accuracy and spatiotemporal coverage.
Three east–west basin-scale transects acquired during research cruises in the Algerian Basin were available in our data set: MEDCO08 in November 2008 (Ribotti and Borghini, 2008; Ribotti et al., 2022), Venus1 in August 2010 (Borghini et al., 2019) and SOMBA-GE2014 in August–September 2014 (Mortier et al., 2014). The comparable position and synoptic character of the cruise sampling allow for a direct comparison of this east–west section across the Algerian Basin at these different dates over a period of 6 years.
In addition to the potential temperature and salinity data, current measurements from the SOMBA-GE 2014 research cruise (Mortier et al., 2014) were used to check for a signature of the Algerian Gyres reaching the deep layers. SOMBA-GE 2014 was the only research cruise specifically dedicated to investigating the oceanic circulation in the Algerian Basin. To this end, a network of 70 hydrological casts have been carried out including direct measurements from surface to bottom of ocean currents (maximum depth in the Algerian Basin ∼ 2850 m). Two 300 kHz acoustic Doppler current profilers (ADCPs) were attached to the Rosette used to perform the CTD casts: namely LADCPs (lowered acoustic Doppler current profilers). The measured currents were processed using the velocity inversion method of Visbeck (2002) implemented in the LDEO software version IX-12 (Thurnherr, 2010) with typical horizontal velocity uncertainty of 2–3 cm s−1.
2.2 Objective analysis of the LIW properties
To identify LIW, a density range between 28.95–29.115 kg m−3 was considered (red shaded area in Fig. 2), and reference data, such as quality-checked cruise and glider data, were used to determine this broad range of density that encompass the layer of LIW. The potential temperature and salinity maximum values, within the selected range, were chosen to be representative of the LIW core characteristics for each profile.

Figure 2θ–S diagram of CTD casts performed within the polygons shown in Fig. 1, color-coded according to their dates. The black contours show isopycnals. The red shaded area (between 28.95–29.115 kg m−3) is the zone considered to determine LIW characteristics.
To confirm that the water masses detected correspond to the LIW and not the base of the thermocline, we controlled the potential temperature maxima to make sure they actually correspond to an inflection point in the potential temperature profile.
One of the objectives of this study is to describe a basin-scale mean repartition of LIW. To this end, we objectively analyzed the LIW salinity and potential temperature over the Algero-Provençal Basin. We first computed the monthly means of the LIW characteristics within 15 km × 15 km boxes, then averaged these means in each box and finally analyzed this mean field using the method of Boehme and Send (2005) with a covariance function conditional to the topography and the planetary vorticity. We chose Φ = 0.5 as the scaling parameter representing the influence of the topography, and a spatial correlation scale of 100 km which is consistent with the basin-scale variability we want to emphasize similarly to Bosse et al. (2015).
2.3 Regions of interest
We chose eight polygons within the Algéro-Provençal Basin at key locations to characterize LIW along its pathway across the Algerian Basin (see Fig. 1). The potential temperature and salinity profiles are in groups that characterize the typical different circulation features of the basin.
-
Box EAlg: closed contour (f = 8.9287 × 10⁻⁵ s−1, H = 2797 m) in the eastern part of the basin, typical to indicate the center of the eastern Algerian Gyre away from the boundary circulation.
-
Box WAlg: closed contour (f = 8.9287 × 10⁻⁵ s−1, H = 2797 m) in the western part of the basin, typical to indicate the center of the western Algerian Gyre away from the boundary circulation.
-
Box SSar: polygon south and west of Sardinia. Inflow of warm/salty LIW into the Algéro-Provençal Basin. This is where the warmest/saltiest LIW can be found in this basin.
-
Box SaMi: polygon between Sardinia and Menorca. Northern edge of the eastern Algerian Gyre, where eddies detach from the Sardinian along-slope LIW vein and are advected by the Algerian Gyres.
-
Box MAlg: polygon in the Algerian Basin center at the northern periphery of the Algerian Gyres.
-
Box SIbi: polygon south Ibiza. Along-slope LIW circulation, almost at the end of its pathway toward the Gibraltar strait.
-
Box Albo: polygon in the Alboran Sea area. The LIW close to Gibraltar Strait about to exit the Mediterranean to form MOW in the North Atlantic or to recirculate along the continental slope of Algeria.
-
Box AlgC: polygon going along the Algerian coast. LIW entrained by Algerian Current that did not exit at Gibraltar Strait.
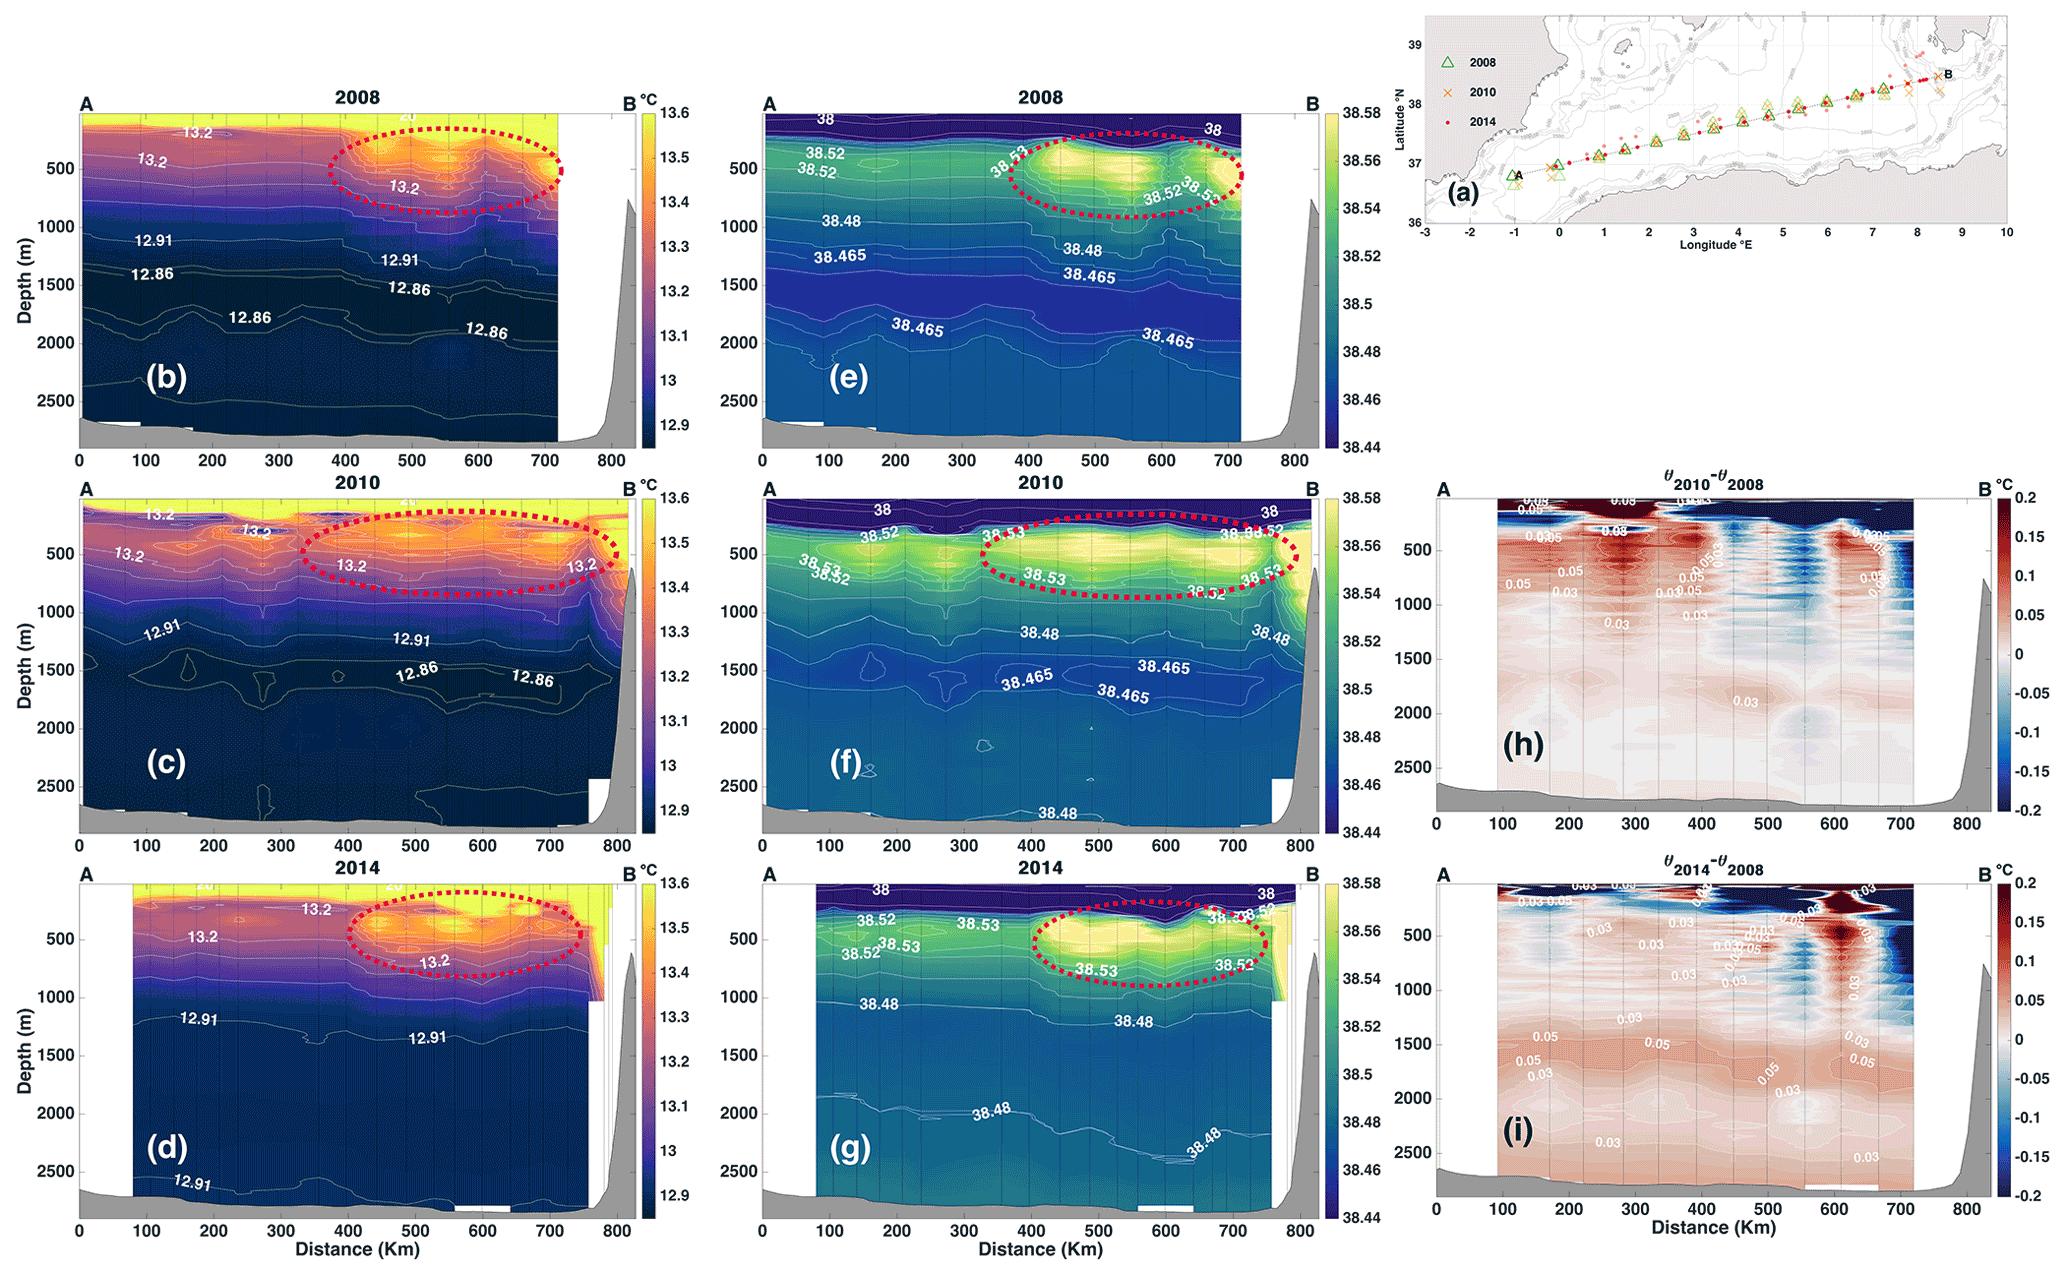
Figure 3(a) Map of the locations of the CTD casts carried out during MEDCO08 in 2008 (green triangles, Ribotti and Borghini, 2008; Ribotti et al., 2022), during Venus1 in 2010 (orange crosses, Borghini et al., 2019) and during SOMBA-GE2014 in 2014 (red dots, Mortier et al., 2014). For comparison, all stations were perpendicularly projected on the A–B strait line. The faded colors are the actual locations of the casts; the bright ones represent their projections on A–B. East–west sections of (b–d) potential temperature and (e–g) salinity. Differences in potential temperature section (h, i): θ2010−θ2008 (h), θ2014−θ2008 (i).
3.1 Comparison of basin-scale CTD transects
Figure 3 represents a potential temperature and salinity comparison of the three east–west basin-scale transects across the Algerian Basin. Relatively warm and salty LIW extending far into the Algerian Basin and away from the Sardinian LIW vein can be observed. The signature of LIW fades away to the west as the distance from the source location, the Sardinia channel, increases, but one can identify a patch of higher temperature and salinity within the LIW layer, starting at about 400 km from point A, during each cruise.
In addition to the information concerning water mass distribution across the basin, an increase in salinity (and potential temperature), illustrating the general salinification (and warming) of the basin, can be observed from one section to another. In the deeper layers, the isotherm at 12.86 ∘C, which surrounds a thick layer of cooler waters (between ∼ 1300 and ∼ 1800 m) in 2008, shrinks to a relatively small patch in the eastern Algerian Basin in 2010 centered at 1500 m depth and then completely disappears in 2014. On the salinity panel, the isohaline 38.465 evolves similarly.
This evolution is illustrated in Fig. 3h and i, where the difference of potential temperature, respectively, between 2008 and 2010 and between 2008 and 2014 is shown. We can clearly observe on Fig. 3i an increase in potential temperature reaching 0.05 around 1500 m depth in the span of 6 years, and a warming > 0.03 at the bottom.
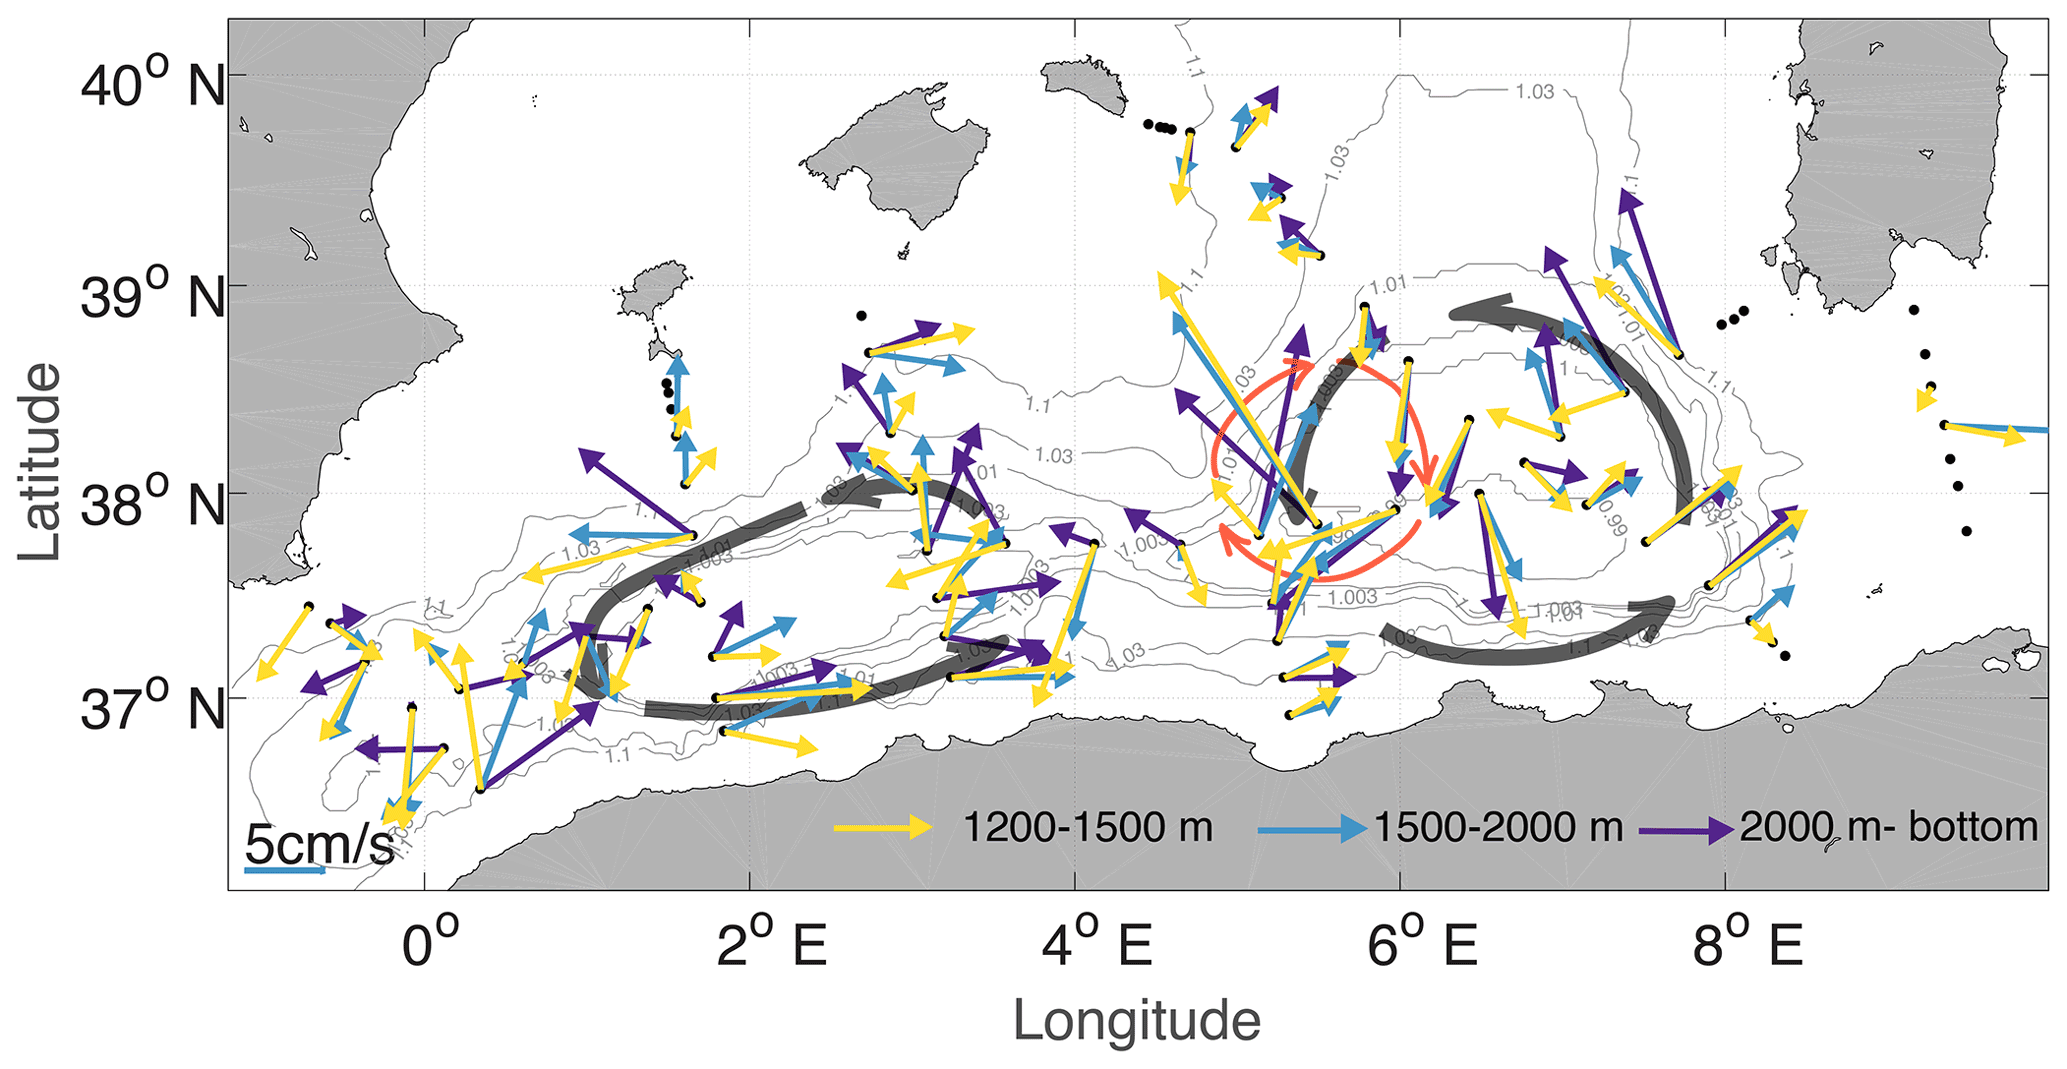
Figure 4Map of all the CTD casts carried out during the SOMBA-GE2014 cruise in 2014. LADCP measurements are indicated with arrows. They have been averaged within three layers: 1200–1500 m (yellow), 1500–2000 m (blue) and 2200 m (bottom; purple). The black dots are the cast locations. The gray contours represent contours, normalized by (f0 being calculated at a latitude of 37∘45′N, and H0 = 2797 m). The transparent black arrows represent the approximate position and the direction of the Algerian Gyres. The red arrows indicate the position of a strong barotropic anticyclonic Algerian Eddy during the campaign.
The current measurements from SOMBA-GE 2014 are presented in Fig. 4. Velocities averaged within different layers between 1200 m and the bottom, where the influence of stronger surface mesoscale features is attenuated, are represented with the yellow, blue and purple arrows and are observed to follow remarkably the contours with a magnitude of about 5 cm s−1.
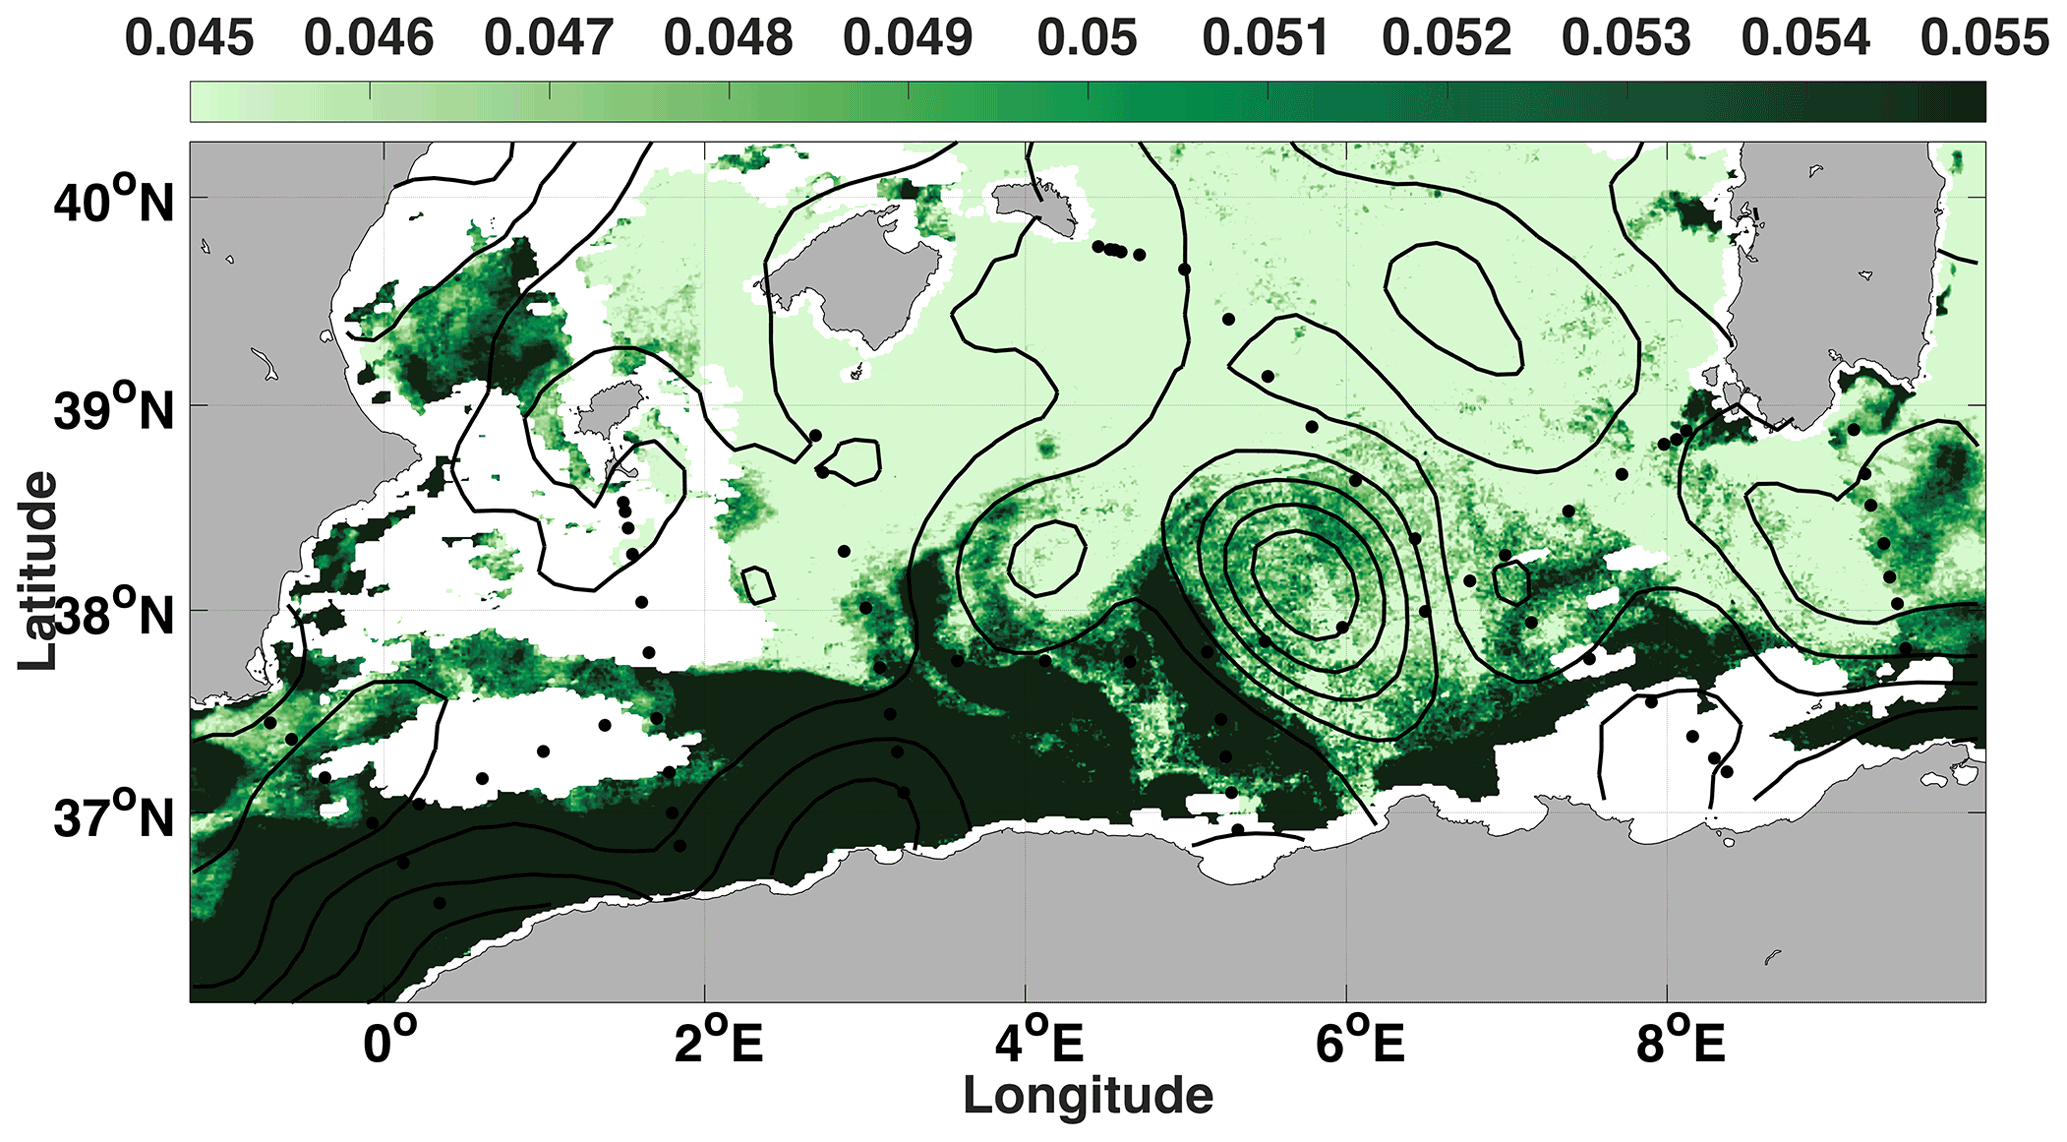
Figure 5Level 3 Ocean Color image, expressed in concentration of chlorophyll-a (mg m−3), on 25 August 2014. The black contours represent ADT (absolute dynamic topography) on the same date. Data from CMEMS (Copernicus Marine Environment Monitoring Service).
Between 5 and 6∘ E, velocities are larger than 10 cm s−1 with a direction not matching the cyclonic circulation of the eastern Algerian Gyre (red circular arrows in Fig. 4). This is due to the presence of a strong anticyclonic eddy at this location with a clear surface signature visible on satellite images as shown in Fig. 5 by the chlorophyll-a concentration and the sea surface height contours.
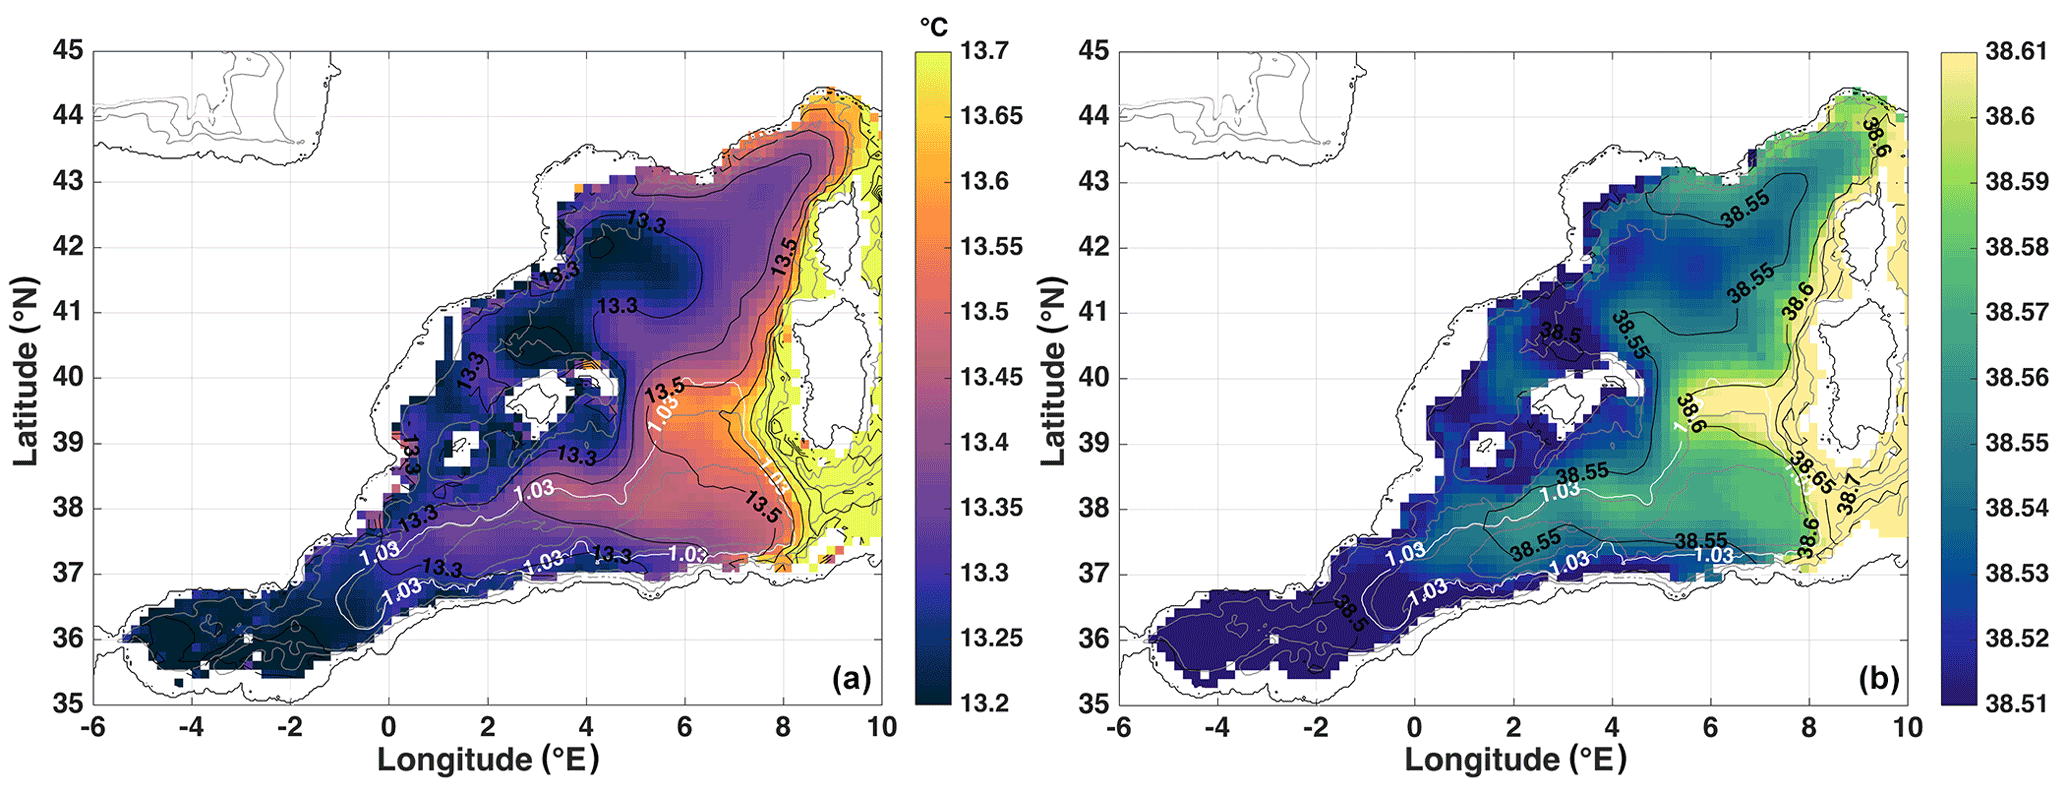
Figure 6Climatologies of LIW potential temperature in ∘C (a) and salinity (b) obtained from an optimal interpolation of all the available data from 1960 to 2017, on a 15 km × 15 km grid. The white contour denotes the normalized contour 1.03, which roughly encircles the Algerian Gyres.
3.2 A climatological view from multi-platform in situ data
Figure 6 shows a map of LIW climatology in the whole western Mediterranean. The climatology was obtained by first computing the monthly means in 15 km by 15 km boxes, then averaging these means in each box and objectively analyzing the result. To this end, 106 780 potential temperature and 97 513 salinity LIW core values from 1960 to 2017 were used.
The warm and salty LIW vein can be observed along Sardinia and Corsica that further extends with the Northern Current in the Provençal Basin. By looking at the 38.55 isohaline and the 13.3 ∘C isotherm in Fig. 6, climatological warm and salty LIW can also be observed offshore and in particular north of the eastern Algerian Gyre, extending from the LIW vein further offshore towards Menorca, then penetrating the interior of the Algerian Basin roughly following the normalized contour 1.03 that is represented by the white contour in Fig. 6.
Accordingly, the Algerian Basin is warmer (∼ 0.15 ∘C) and saltier (∼ 0.02) than in the Provençal Basin.

Figure 7Same as Fig. 6 for the potential density anomaly at 350 m, in kg m−3. The dashed black contour 29.04 kg m−3 is here to enhance the particularly remarkable sinking of isopycnals in the eastern Algerian Gyre.
In Fig. 7, a climatology of density in the western Mediterranean at 350 m (mean depth of the detected LIW in the western Mediterranean) shows the doming of the isopycnals in the northwestern basin, with a maximum around the Gulf of Lion. This reveals the cyclonic circulation of the Northern Gyre, characterized by a doming of isopycnals toward the surface allowing deep convection to occur (MEDOC GROUP, 1970; Testor et al., 2018). At the same depth, lighter waters are found in the Algerian Gyres, particularly in the center of the eastern Algerian Gyre (see contour 29.04 kg m−3 in Fig. 7).
3.3 Temporal evolution of LIW characteristics
The evolution of potential temperature of the LIW as seen in Fig. 8 is showing an overall increase over the 1960–2017 period. However, this increase does not appear monotonous. The general shape of the time series suggests a roughly stable warming from the 1960s to the 1980s, followed by a decrease until the late 1980s, then a significant increase after 2012. This would indicate 4 different phases in the basin regime (hereafter, period 1, 2, 3 and 4) during the full period of our study.
To estimate the trends in every phase, the non-averaged θ is linearly fitted over time using least squares with a 95 % confidence interval, allowing estimates of and its uncertainty. We also indicated the correlation coefficient R2 for every regression. The data in the early 1960s were discarded because of their extreme scarcity. P values were computed for each trend estimation, to assess their statistical significance, and trends with a P value > 0.05 were considered nonsignificant.
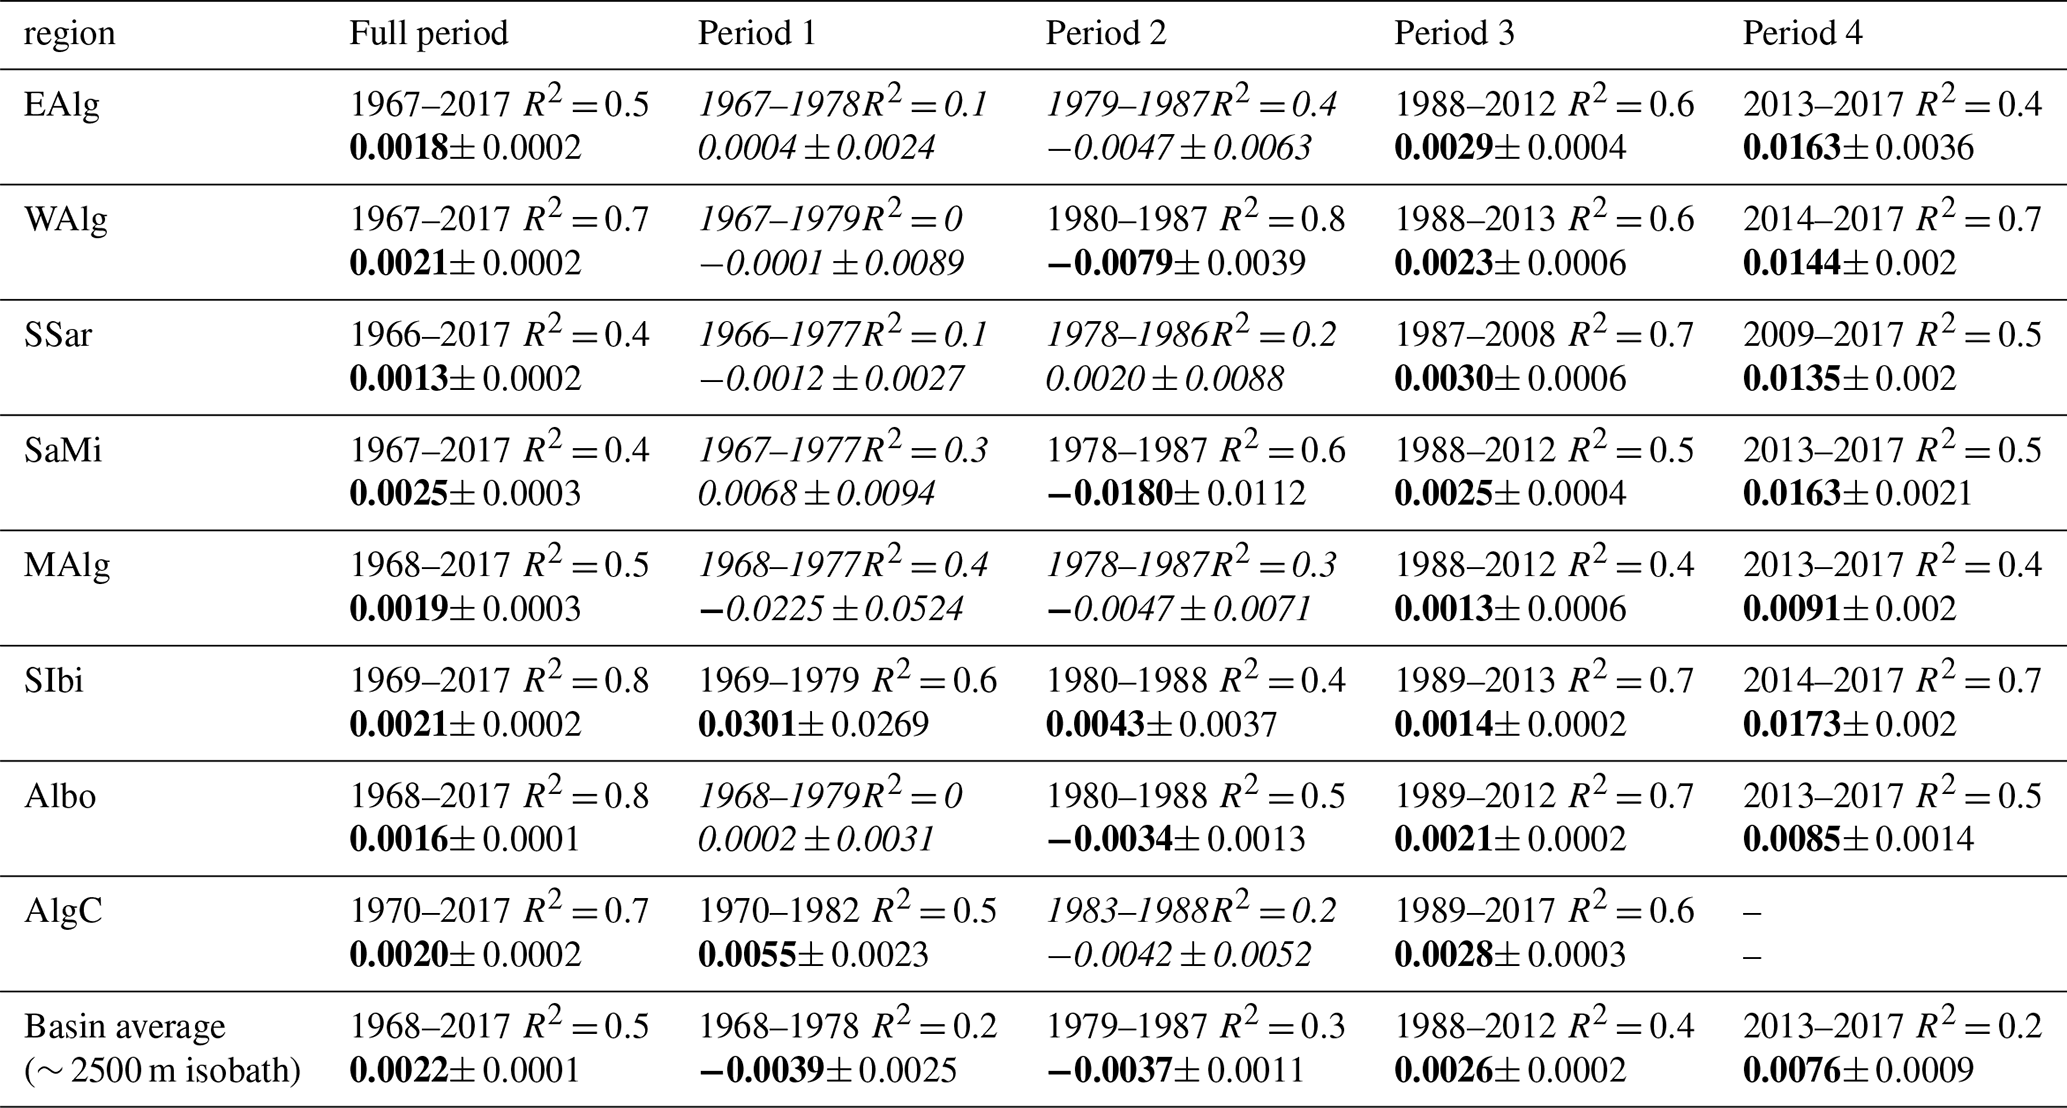
In Table 1, these potential temperature trends were documented for each area, during the different phases, with dates of the start and end of each phase best fitted for each area to account for the delays resulting from the travel of the different signals.
To describe the salinity trends, the same method was used, the results are shown in Table 2.
Here we will describe the evolution of the LIW potential temperature and salinity in the different areas of the basin. A basin-averaged value is also provided to describe the general trend in the interior of the Algerian Basin, for which a polygon roughly following the 2500 m isobath (dark gray dashed contour in Fig. 1) is used as the basin interior proxy to select data and compute a basin-averaged trend.
-
1968–1978. During this ∼ 10 year period, an increase in potential temperature is observed in three of the areas. θ values have increased in SaMi by 0.025 ± 0.007 , in Albo by 0.0059 ± 0.0043 and in AlgC by 0.014 ± 0.0056 . The regression coefficients remain small during this period, and there is no significant trend for the basin-averaged estimate. The salinity values have increased in SIbi by 0.03 ± 0.026 yr−1 and in AlgC by 0.005 ± 0.002 yr−1. The basin-averaged estimate shows a decrease in salinity of −0.0039 ± 0.002 yr−1.
-
1979–1987. A prominent decrease in potential temperature is observed in all the areas, with a relatively strong regression coefficient (R2 ≥ 0.5 in most of the areas). The salinity data also show a decrease in three of the areas (WAlg, SaMi and Albo), but in SIbi the increase on salinity is not disrupted during this period. This cooling signal is on average of −0.033 ± 0.003 and the freshening signal is of −0.0037 ± 0.0011 yr−1 in the basin interior.
One can identify the cooling event in Fig. 8 as it appears first on the green curve (southwest Sardinia polygon) with an amplitude of about 0.3 ∘C, then the signal propagates to the other areas.
-
1988–2012. During these ∼ 25 years, the potential temperature time series shows an irregular pattern. Although the regressions present very low regression coefficients, the trends significantly tend towards increase for most of the areas (6 regions over 8), the basin average trend is of 0.0027 ± 0.0007 . Whereas the salinity time series has a clear increasing trend in all the areas, with strong regression coefficients, this increase is of 0.0026 ± 0.0002 yr−1 on average in the basin interior. We can also observe, in some of the polygons, a drop in potential temperature right before the period of warming acceleration: SSar between 2005 and 2009 and EAlg between 2008 and 2012.
-
2012–2017. Starting in 2012, the warming and salinification trends show a clear increase never reached before (see Fig. 8). The mean potential temperature trend in the Algerian Basin interior during the full period is of 0.0022 ± 0.0002 , compared to a trend of 0.048 ± 0.003 during these 5 years. In the same way, the salinity tripled during the last period, from 0.0022 ± 0.0001 yr−1 (1968–2017) to 0.0076 ± 0.0009 yr−1 (2012–2017).
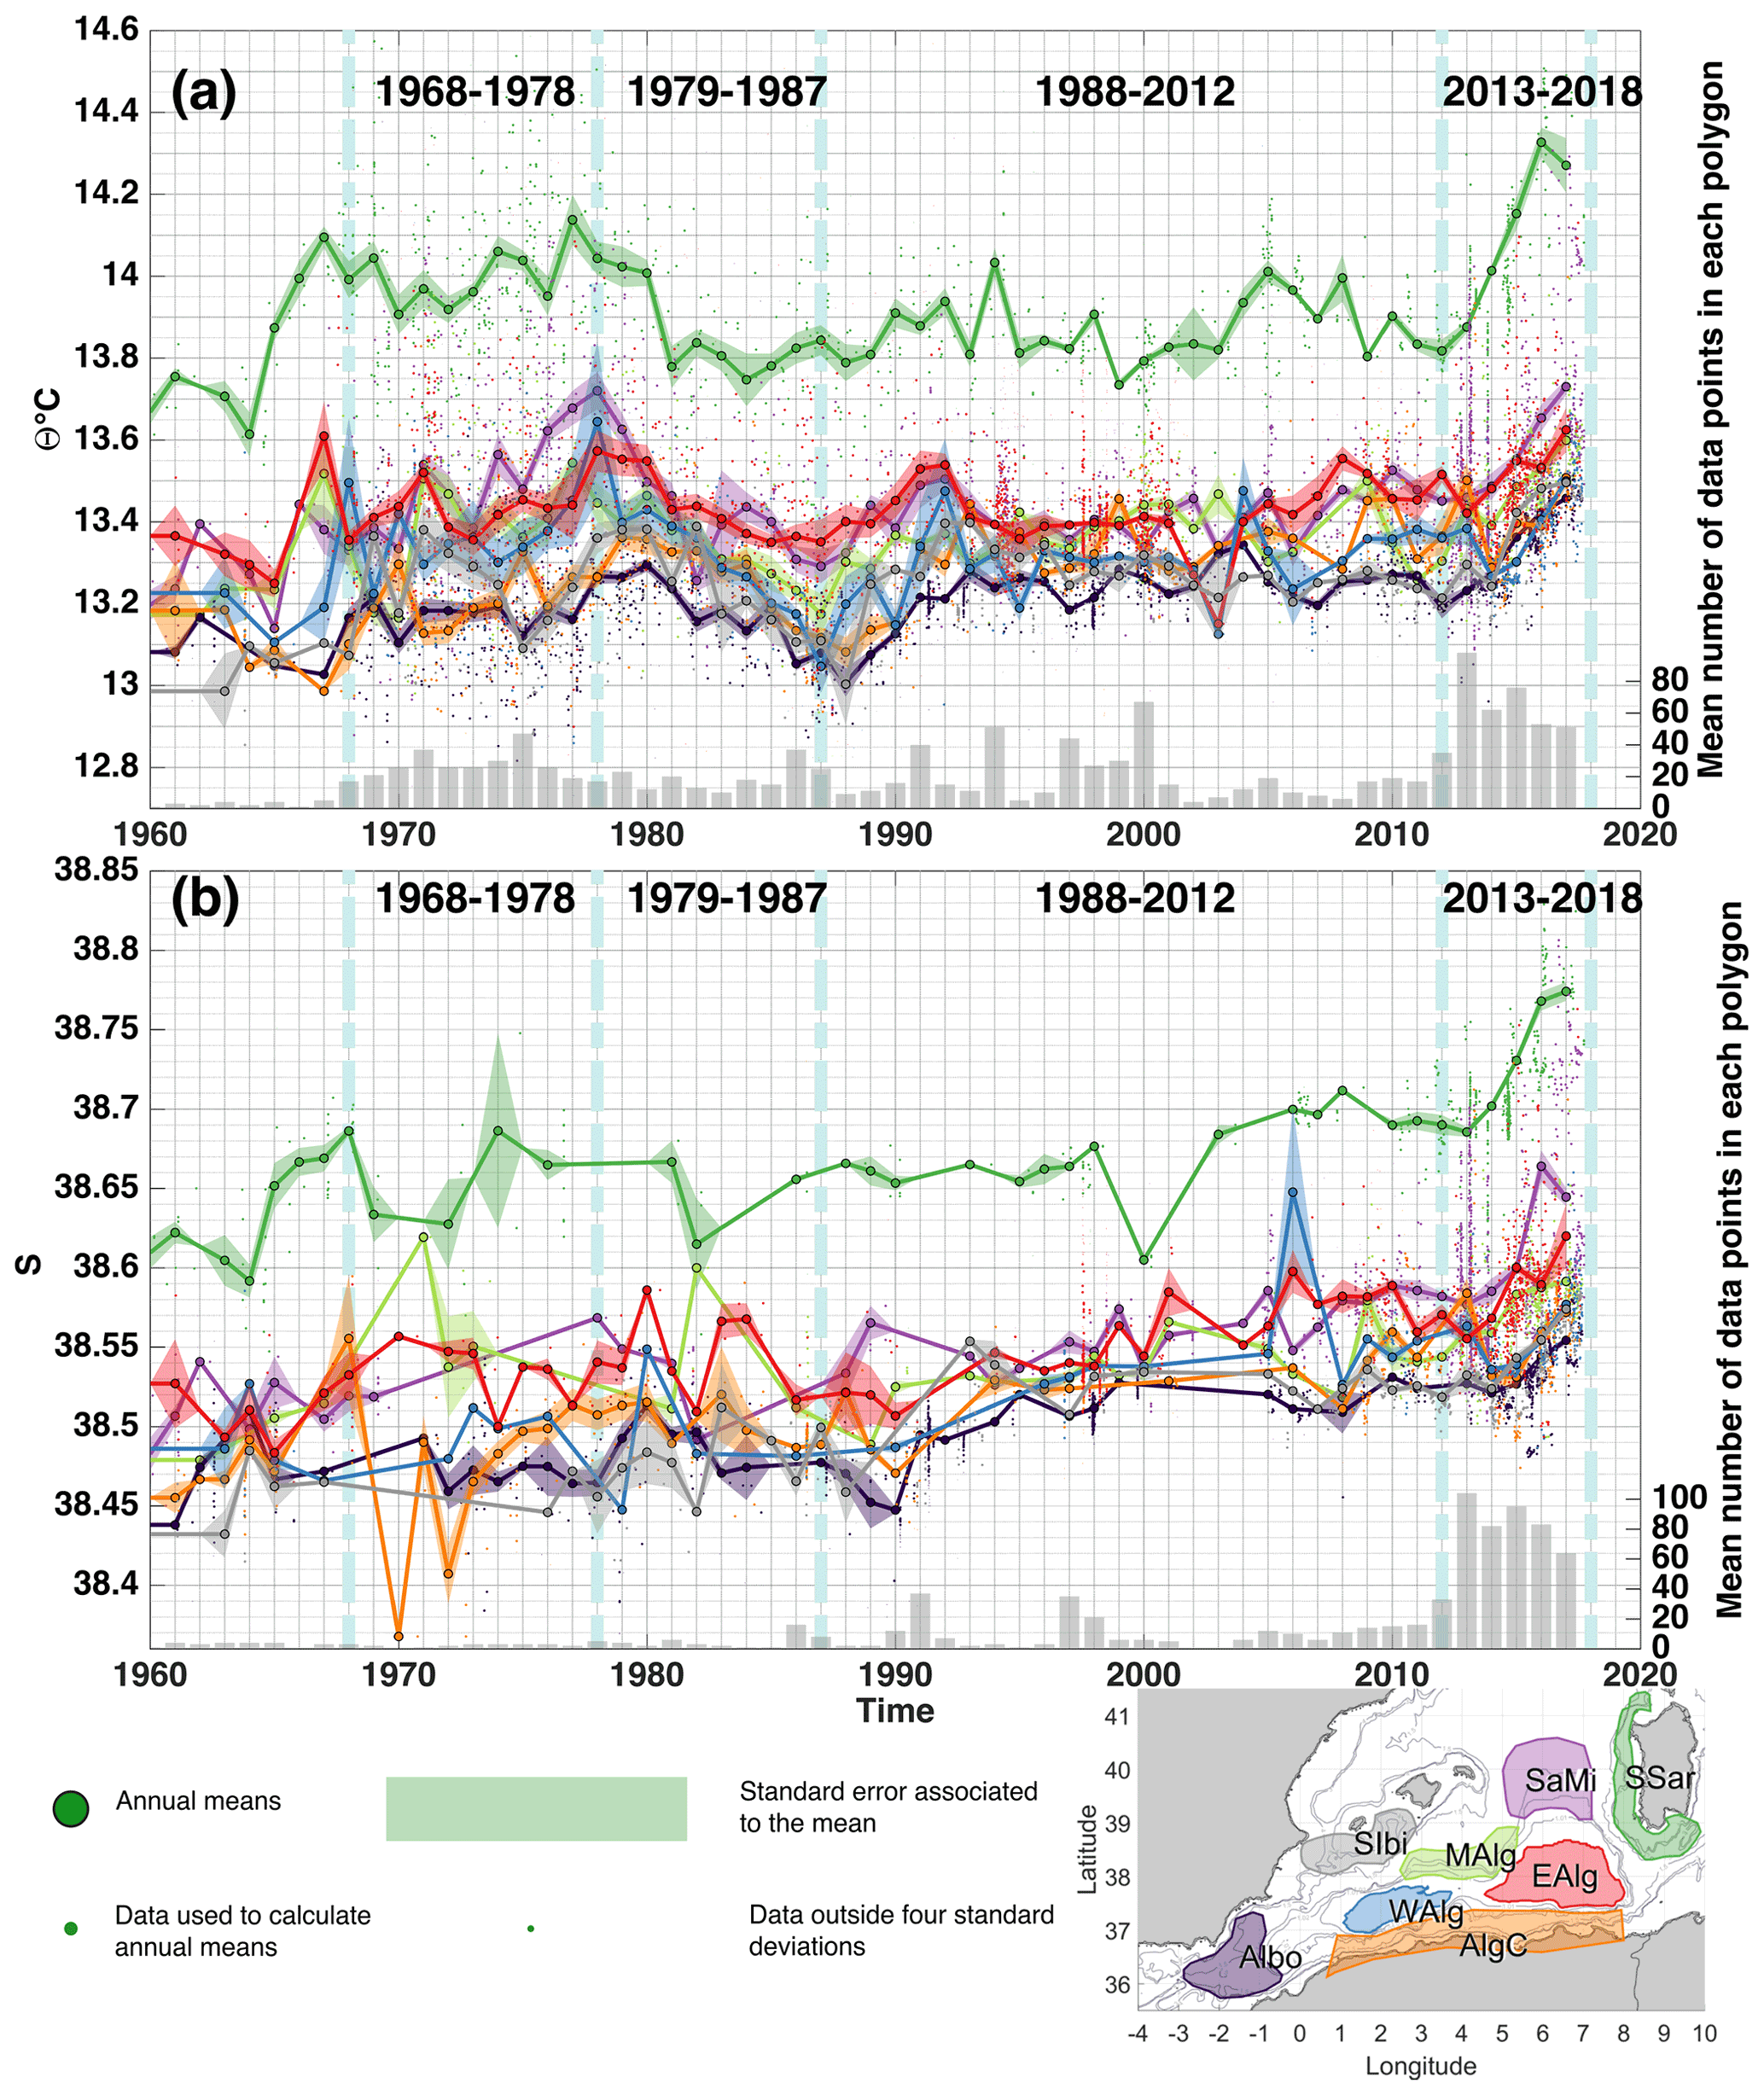
Figure 8Annual mean (a) potential temperature and (b) salinity of LIW core in the different areas in the southwestern Mediterranean Sea. The bar plots represent the mean number of data points per polygon each year. The color code used in this figure is the same as in Fig. 1 (standard error = standard deviation, of θ or S in 1 year, , N being the number of θ or S data within the year). The vertical blue-green dashed lines in background are indicators of the four periods chosen to compute the trends.
Table 1Evolution of LIW potential temperature during different periods of time from 1960 to 2017 (expressed in mean trend ± the half width of the 95 % confidence interval ∘C yr−1). The period slightly differs from one area to another, to best track the identified patterns. The coefficient of determination (R2) is indicated; the statistically significant regressions (P value < 0.05) are indicated in bold; the nonstatistically significant regressions (P value > 0.05) are indicated in italic.

3.4 Transit time of LIW thermohaline signals
This section will be dedicated to quantifying more thoroughly the transit time of the cooling signal observed in the 1980s, using a cross-correlation with a maximum lag considered of 4 years, of the signal between 1974 and 1992. In order to isolate this event on the time series, monthly averaged data smoothed over 4 years were used.
In Fig. 9, the cooling signal across the Algerian Basin is tracked in time. The map shows in solid gray arrows the along-slope circulation, as shown in Millot and Taupier-Letage (2005b), the transparent red polygons with the numbers showing the time in months needed for the signal to travel from south Sardinia (SSar polygon) to the other areas in the Algerian Basin.
In about 2.5 years, the LIW travels from its source all the way to the Alboran Sea region. It appears that the fastest way goes from the Sardinia–Menorca polygon, SaMi (2 months), to the area between the Algerian Gyres, MAlg (4), then to the Alboran Sea, Albo (29 months). Red arrows on the map represent a scheme of eddy-driven transport that could explain the transit times obtained from our analysis.
The signals arrive to the eastern Algerian Gyre, EAlg, after 23 months; to the western Algerian Gyre, WAlg, after 19 months; and to the Algerian Current polygon, AlgC, after 37 months. The area that has the largest transit time is the one south of Ibiza (SIbi), with 47 months.
The dashed circular gray arrows inside the Algerian Gyres represent the recirculation process in the core of the gyres.
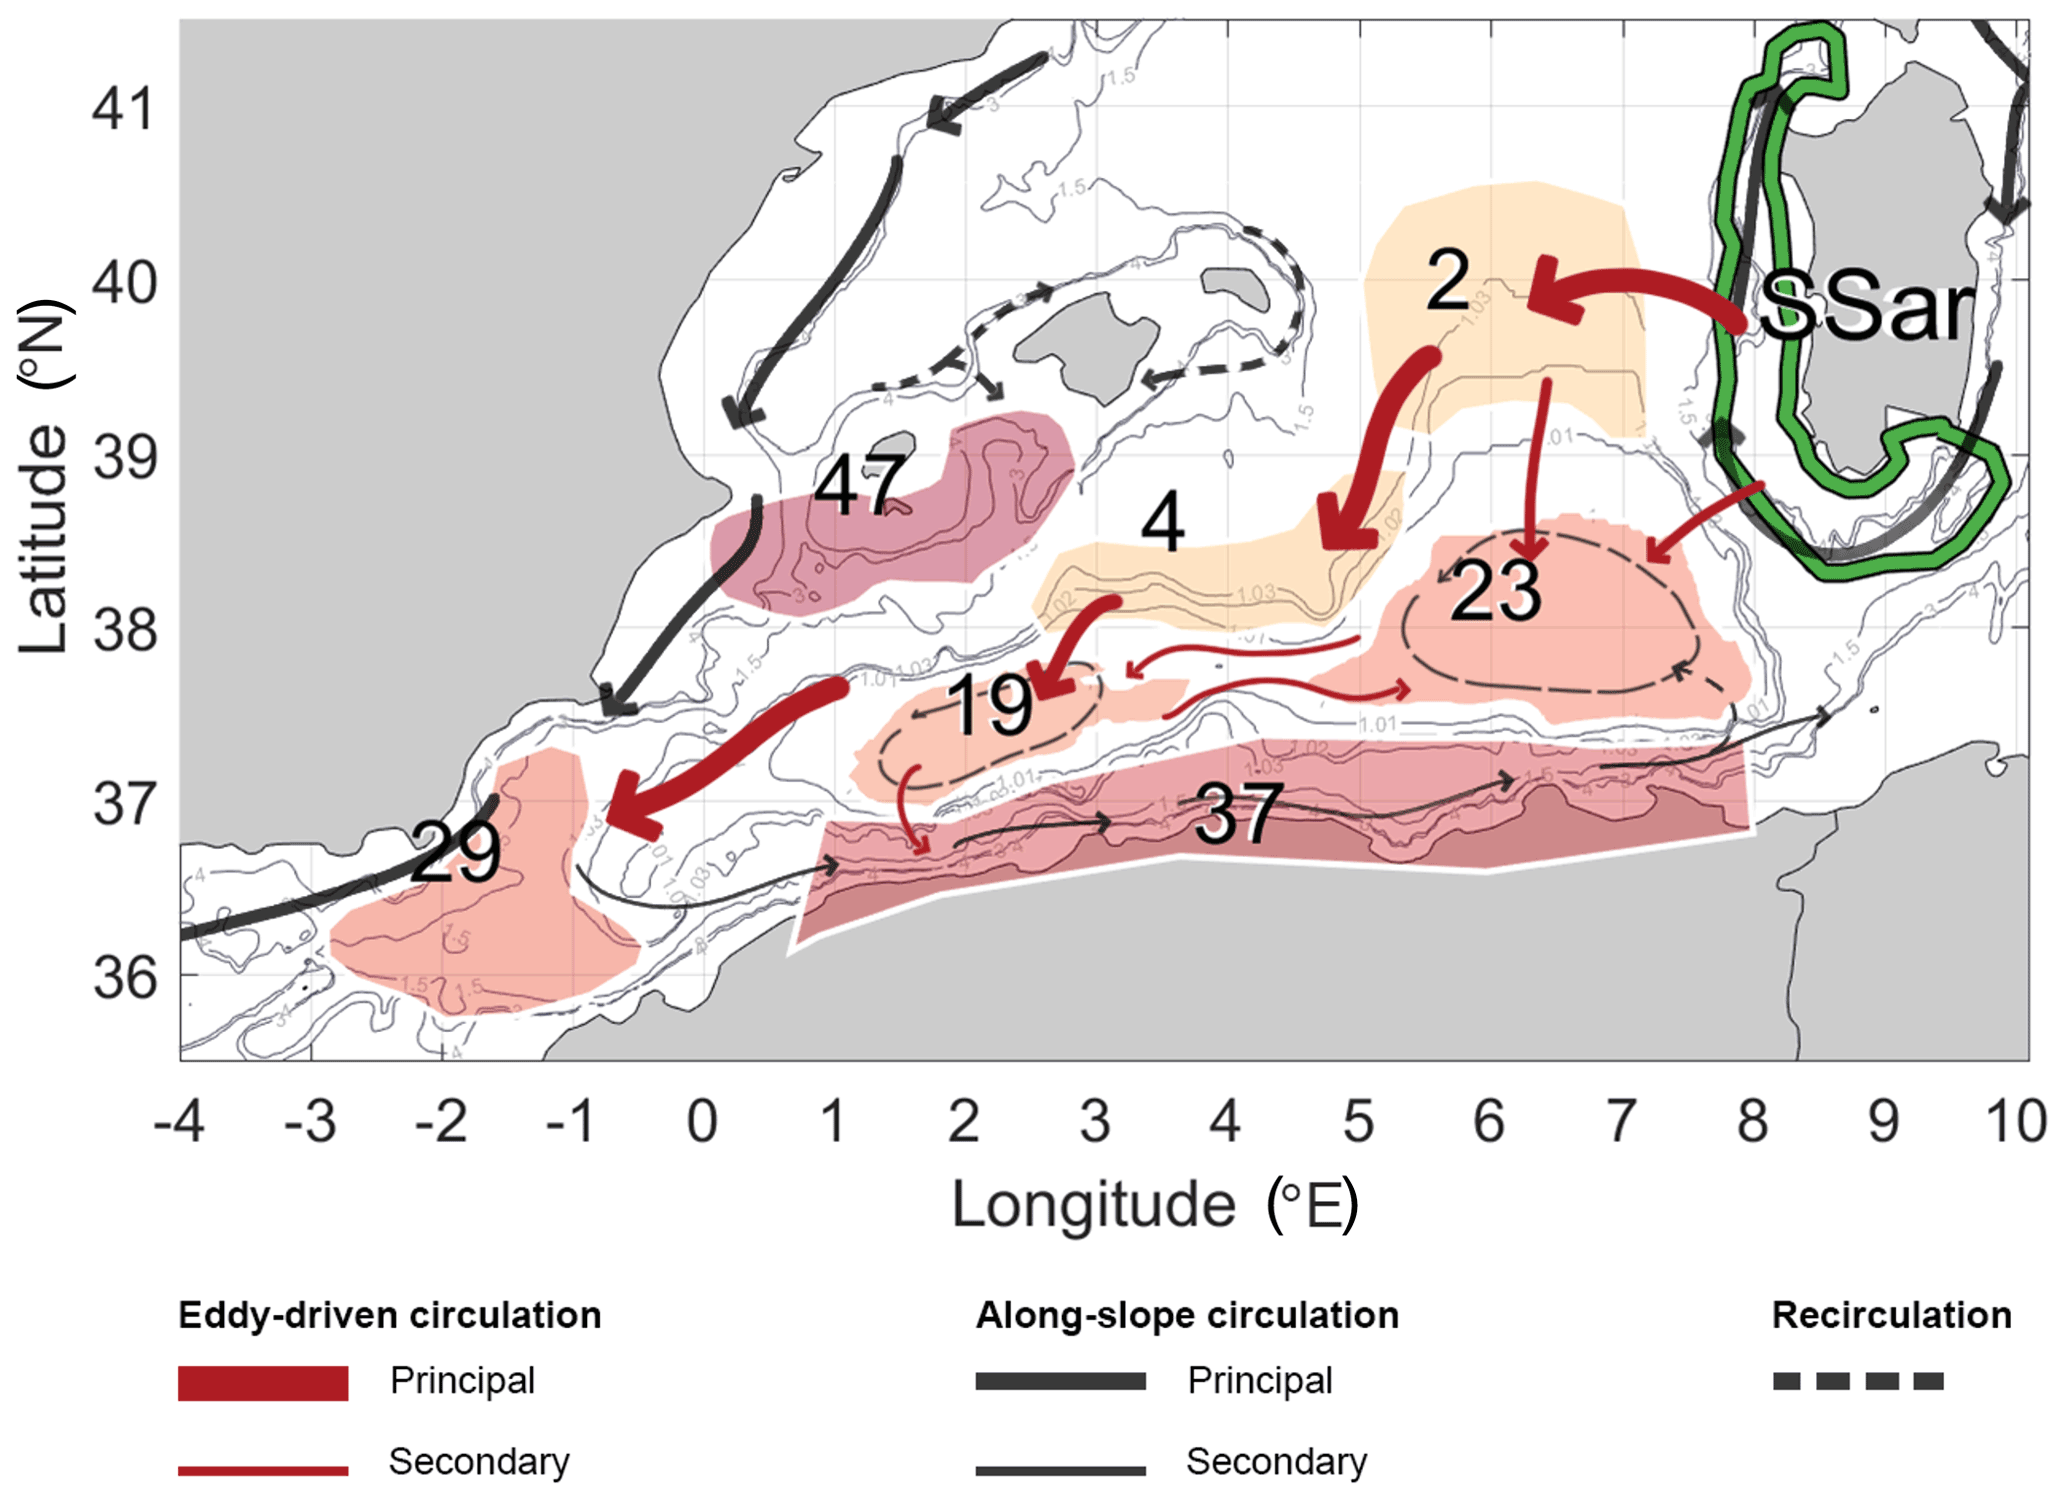
Figure 9Circulation scheme of LIW in the Algerian Basin inferred from the cross-correlation analysis. The transit time (indicated in months on top of each polygon) was obtained from the propagation of the cooling signal in the 1974–1992 period traveling from the south Sardinia area (green polygon). The color of the polygons here is to provide a visual aspect of the transit time result: the redder the color, the larger the transit time. The solid gray arrows represent the mean along-slope intermediate circulation redrawn from Millot and Taupier-Letage (2005b). The solid red arrows represent the eddy-driven transport inferred from the result of the time transit analysis. The dashed gray arrows represent recirculation from the along-slope track.
Figure 10 illustrates the aforementioned cross-correlation analysis. We can see how the cooling signal in the dashed curves (time series with lags) aligns remarkably with the cooling signal of the SSar time series.
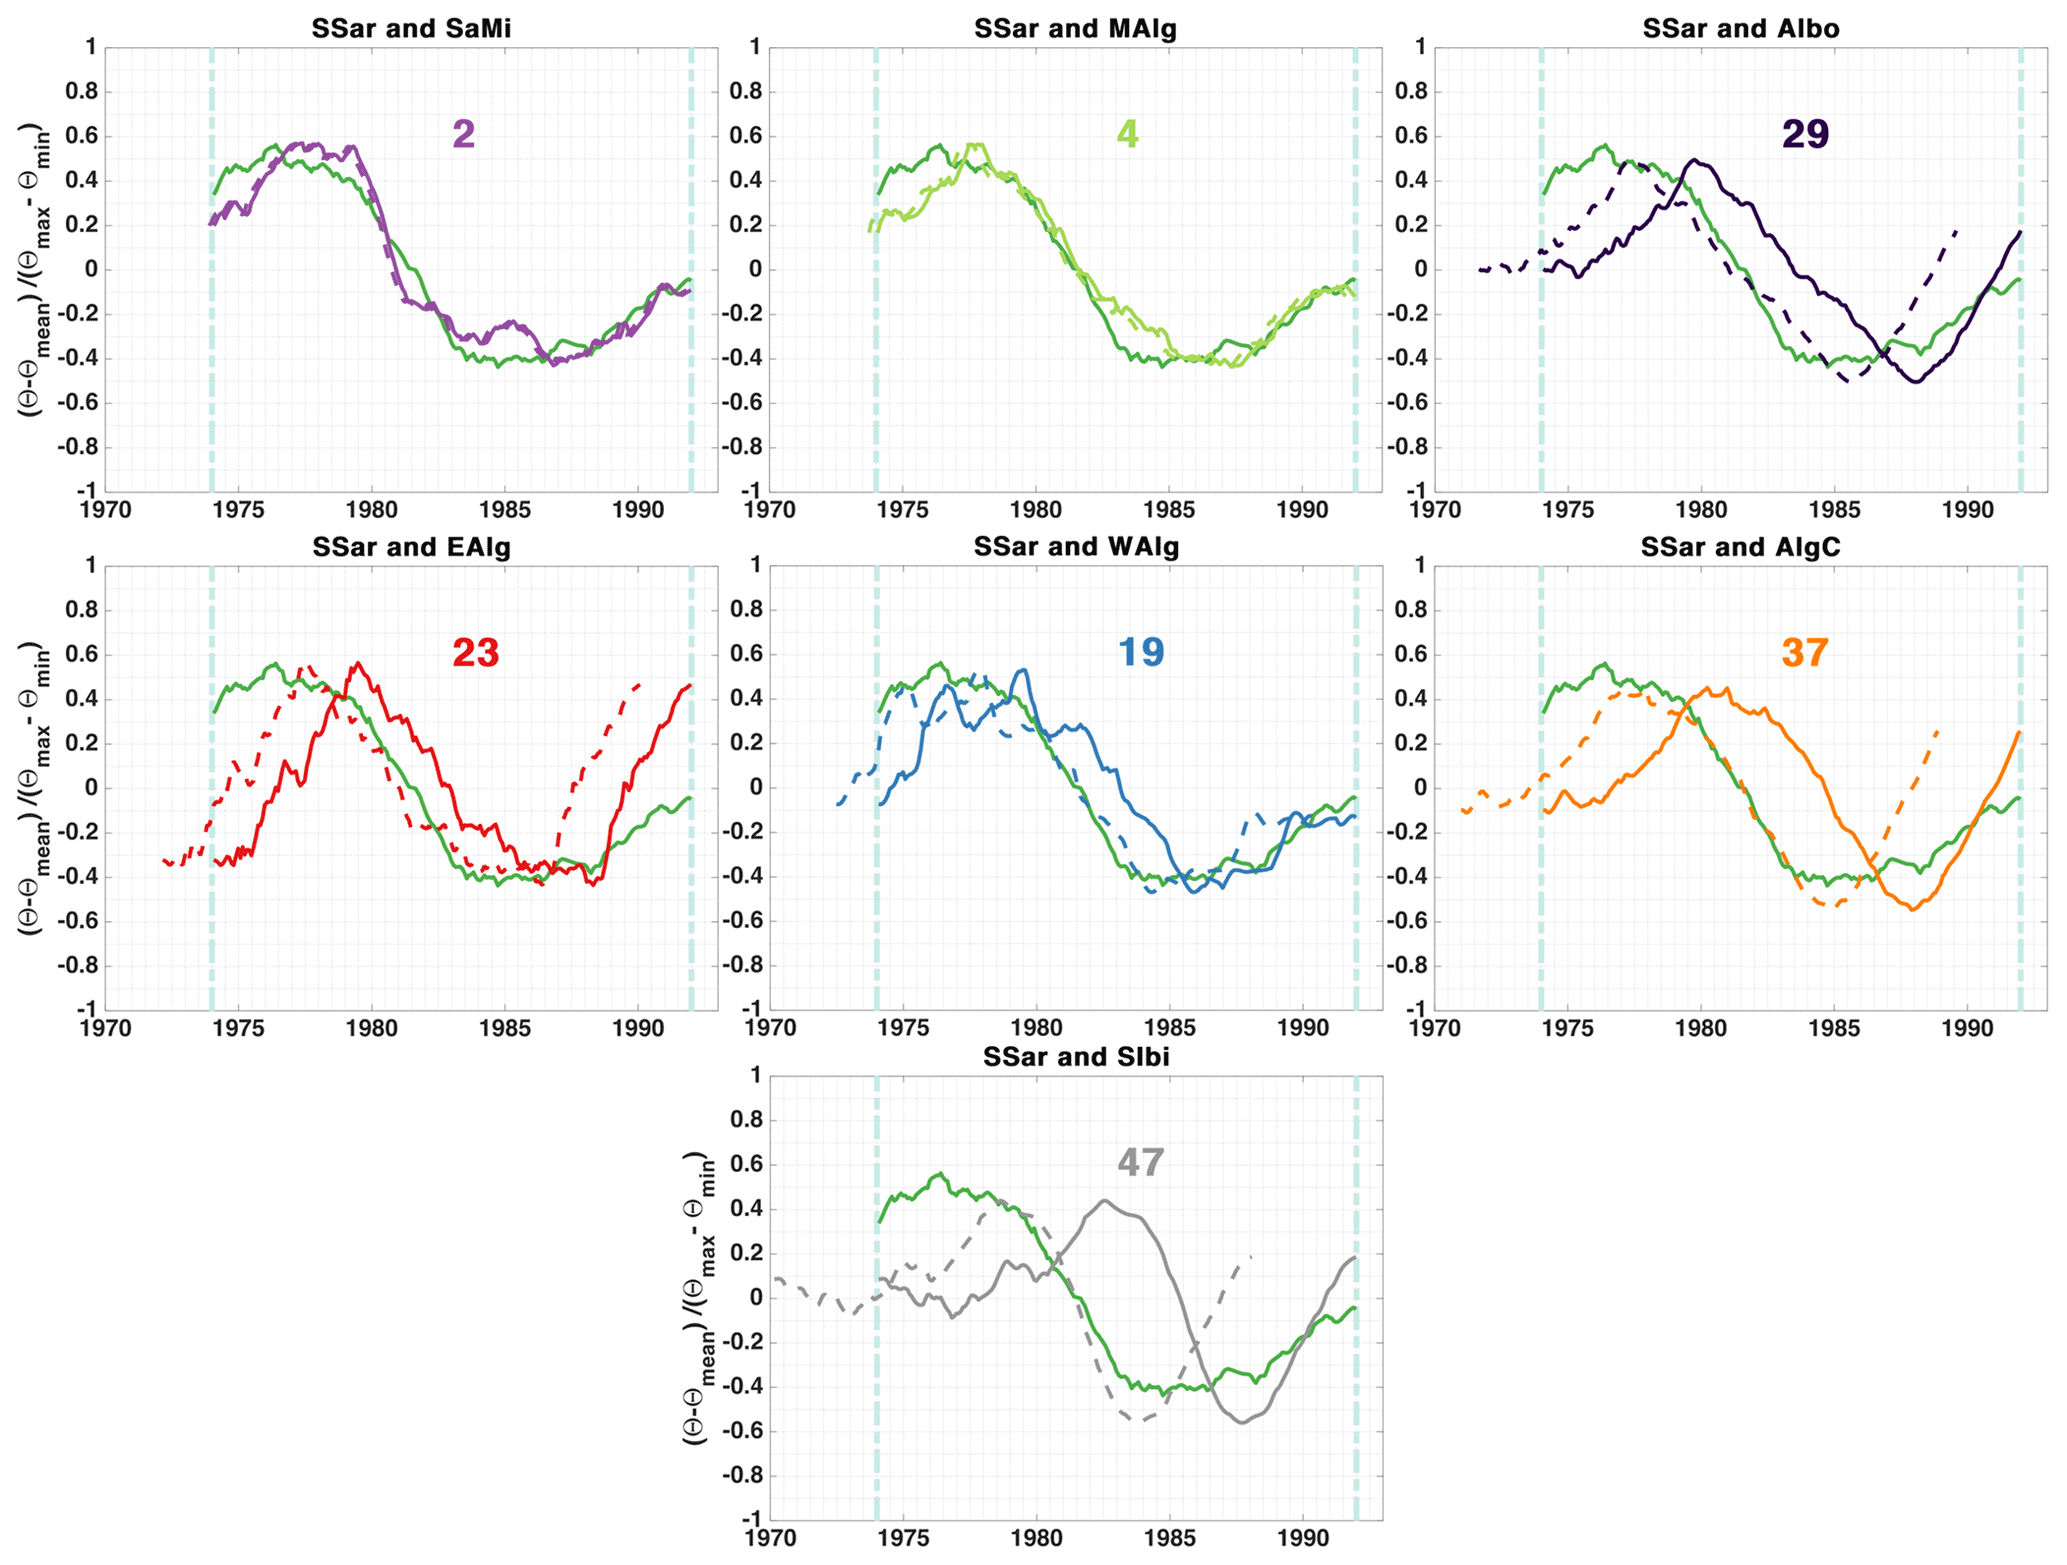
Figure 10Cross-correlation of the cooling signal (1974–1992) between SSar and all the other regions. The solid lines represent the original position of the time series. The dashed line represent the time series with a lag that give the maximum correlation. The lag, in months, is written above the curves.
In order to validate the results of the cross-correlation analysis, a few pairs of time series segments have undergone the same analysis but for another time slot. Figure 11 shows the results obtained.
LIW potential temperature values in south Sardinia have been cross-correlated with the one in the Sardinia–Menorca region between 1990 and 2000, and the results show that the signal needed 1 month to travel from SSar to SaMi, instead of 2 months in Fig. 9. Another cross-correlation between MAlg and WAlg LIW potential temperature during the 1998–2010 period have shown that 13 months are needed for the signal to travel from MAlg to the interior of the western Algerian Gyre, instead of 15 months in Fig. 9. These results are in good agreement and suggest that similar processes are at play in the transit of the LIW independently of the period considered.
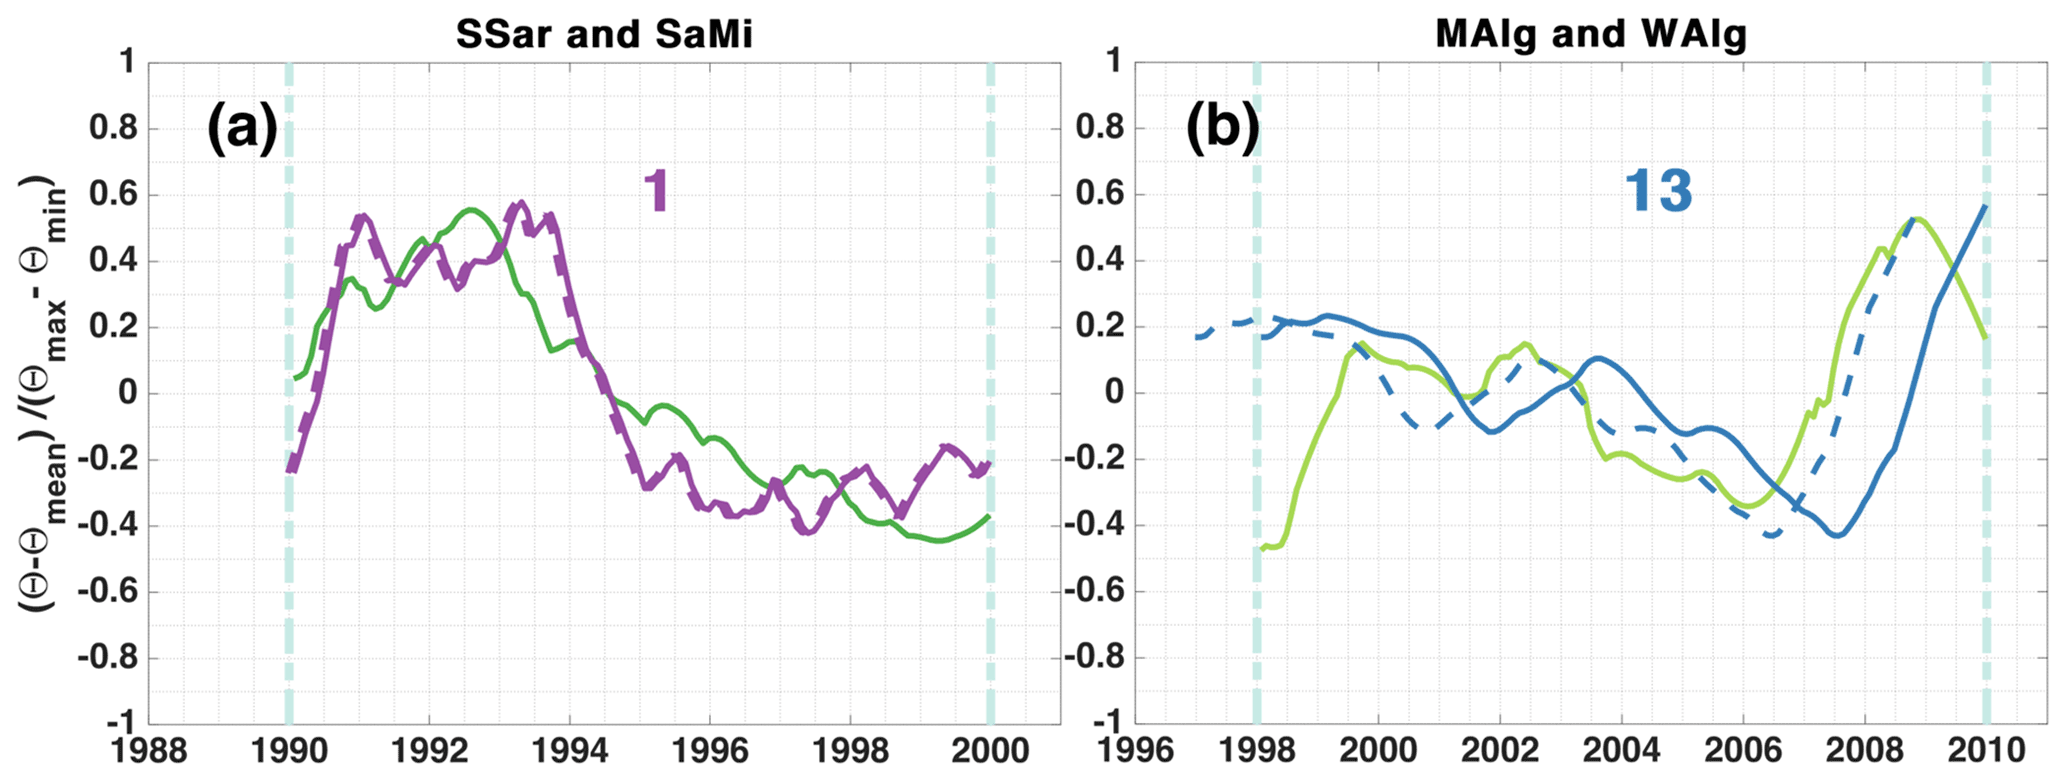
Figure 11Cross-correlation of normalized potential temperature signals. (a) SSar (green) and SaMi (purple) between 1990 and 2000, (b) MAlg (light green) and WAlg (blue) between 1998 and 2010. The solid lines represent the original position of the time series. The dashed line represent the time series with a lag that give the maximum correlation. The lag, in months, is written above the curves.
4.1 General circulation and LIW pathway
The results of the LADCP measurements presented in Sect. 3.1 show a current pattern that matches with the description of the Algerian Gyres done by Testor et al. (2005a) in terms of location and speed; however, the magnitude of the currents appear to be larger on the southern edge of both gyres (along the Algerian coast) and on the easternmost edge of the eastern Algerian Gyre than on the remaining sides of the loops, suggesting that a forcing of these gyres is the general along-boundary cyclonic circulation of the western Mediterranean as discussed by Testor et al. (2005a). This result confirms the existence of the Algerian Gyres in 2014 as mean barotropic circulations that have signatures in the deep currents and consolidates the idea of the Algerian Gyres being permanent circulation features.
The cruise sections from west to east in the Algerian Basin (Fig. 3) revealed changes in the hydrological distribution of LIW properties in the basin. Warm and salty LIW appeared to invade all the eastern Algerian Basin. The potential temperature and salinity climatologies of the LIW in the western Mediterranean (Fig. 6) have also shown an influence of the Algerian Gyres on the LIW distribution. We can observe a good correspondence between the location of the 1.03 potential vorticity contour (a proxy of the Algerian Gyres) and the distribution of that warm and salty water extending further off-shore from the Sardinia LIW vein. This hydrological repartition has previously been observed by Millot (1999), and they said that it could be mistaken for a LIW branch detaching from the south Sardinia vein and crossing the Algerian Basin as described by Wüst (1961), and that has been largely rejected by the scientific community. However, our study suggests that a direct route of LIW crossing the Algerian Basin, linked to the presence of the Algerian Gyres, is instead likely to produce this effect.
From the climatological map of potential density at 350 m (Fig. 7), we can see a sinking of the isopycnals in the Algerian Gyres region. This may be the signature of numerous anticyclonic AEs, characterized by a deepening of isopycnals in their cores, circulating and accumulating in the basin.
In fact, in their study of coherent vortices in the western Mediterranean using satellite altimetry, Escudier et al. (2016b, a) (1993–2012) and Isern-Fontanet et al. (2006) (1992–1999) observed intense anticyclonic eddies being particularly aggregated in the Algerian Gyres area and appearing to follow the gyres' cyclonic circulation. This was also confirmed by Pessini et al. (2018), which used 1993 to 2016 altimetry data. Anticyclonic eddies were described by Puillat et al. (2002) to be the most energetic ones, capable of lasting several months to years, looping around the Algerian Gyres, some for at least 3 years. Provenzale (1999) evidenced that these vortices induce regular Lagrangian motion inside their cores and are highly impermeable to inward and outward particle fluxes. Passive tracers can be trapped inside vortex cores for long times and are transported over large distances.
In the potential temperature time series (Fig. 8), one particularly strong cooling signal from 14.1 to 13.7 ∘C, starting in 1978 and lasting until 1986, could be identified southwest of Sardinia. It was then tracked across the basin as it progressed from east to west, using a cross-correlation analysis.
The transit time analysis has shown a preferential path to get to the Alboran Sea region by entering the Algerian Basin, from the northern edge of the eastern Gyre, which then flows further southwestward at the periphery of the Algerian Gyres, as illustrated by the thick red arrows on Fig. 9, and as seen in the climatologies on Fig. 6. The cooling signal was chosen to perform this analysis because it represents a particularly strong signal that appeared in all the time series, but the conclusions on the circulation features are independent of this particular signal as they are governed by the internal dynamic of the basin. In fact, it corresponds to the eddy track that was observed in the multiple studies referred to here above (Testor et al., 2005a; Isern-Fontanet et al., 2006; Escudier et al., 2016a, b; Pessini et al., 2018). The anticyclonic eddies in the Algerian Basin cross from east to west with the Algerian Gyres's flow. There is also a resemblance with the Sardinian Eddies' track observed once by Testor and Gascard (2005) and modeled by Testor et al. (2005b): these eddies were observed to detach from the southwestern corner of Sardinia and accumulate in the region here referred to as the Sardinia–Menorca polygon before being advected southward.
The zonal velocities of large anticyclonic eddies detected and tracked from altimetry maps for the 20 year as estimated by Escudier et al. (2016a) are of about 3 to 6 cm s−1, (or ∼ 2.5 to 5 km d−1). If this number is used to estimate the propagation time of the signal, a transit time of 1.5 to 3 months to cross 2∘ of latitude is obtained, which is consistent with the result for the SaMi region and the MAlg one. Testor et al. (2005b) have estimated an average translation velocity of the Sardinian Eddies to be of about 2 to 3 cm s−1 (or 1.7 to 2.5 km d−1) which implies 3 to 4 months to cross 2∘ of latitude, this is slightly larger than the result obtained for SaMi and MAlg, but the order of magnitude is consistent. The interior of the Algerian gyres, however, presents much larger transit times, and that is because of the wiggly motion that most of the eddies have following eddy–eddy interaction and the cyclonic barotropic circulation close to the gyres centers.
In the transit time analysis, the last area to get the signal was the south Balearic one, likely because in this region the LIW comes mainly from the along-slope advection by currents at intermediate depth circling the whole western Mediterranean Sea and is not much influenced by the less efficient eddy-driven transport across the Sardinian shelf. The intermediate water that gets to the south Balearic area has also been affected by the convection occurring in the Gulf of Lions area; thus, the thermohaline signals have been largely diluted. The transit time of 23 and 19 months obtained in the eastern and western Algerian Gyres, respectively, remain smaller than the transit time of the south Ibiza region but are relatively large considering their closeness to the LIW vein. This could be explained by the recirculation dynamics of the Algerian Gyres themselves adding to the input from the AlgC region that alters the signal coming from the east.
4.2 LIW trends
The overall aspect of the potential temperature time series is very similar to the western Mediterranean intermediate-layer potential temperature evolution from Rixen et al. (2005) documented from 1950 to 2000. An increase from the 1960s to 1980s, followed by a drop lasting until the 1990s, then a slower increase until 2000. The regression of the full LIW potential temperature data set presents mainly positive trends that are significant despite the large variability (shown by the low R2) (basin average trend of 0.0022 ± 0.0002 with R2 = 0.2). Krahmann et al. (1998) and Rixen et al. (2005) reported the absence of a long-term trend. However, positive trends in the intermediate water potential temperature from the 1960s to the 1990s have been shown by Béthoux et al. (1990) (0.005 ) and Béthoux and Gentili (1996, 1999) (0.0068 ). The salinity trends for the full period are also toward an increase, 0.0022 ± 0.0001 yr−1, with stronger regression coefficients than for potential temperature (R2 ≥ 0.5). This result is similar to previous studies: an increase of 0.0024 yr−1 during the 1955–1990 period (Rohling and Bryden, 1992) and 0.0018 yr−1 (Béthoux and Gentili, 1996, 1999) during the 1960–1992 and 1959–1996 periods, respectively. The potential temperature and salinity trends between 1943 and 2015 in the Balearic Sea sector of 0.002 and 0.001 yr−1 reported in Vargas-Yáñez et al. (2017) are similar to the trends obtained in the area between the Algerian Gyres (MAlg polygon) 0.0028 and 0.0019 yr−1, respectively. They are, however, a little different from the results of our south Ibiza (SIbi) area (0.004 and 0.0021 yr−1).
The cooling signal observed during the late 1970s, and start of the 1980s in our study was reported by Brankart and Pinardi (2001). They showed that the phenomenon originated in the Cretan Arc region and have linked it to the heat flux anomaly evidenced by COADS time series. Krahmann et al. (1998) studied the potential temperature properties of the intermediate layer (275–475 m depth) during the 1955 to 1994 period, and a similar drop in potential temperature can be identified. This drop can also be observed in the intermediate-layer potential temperature time series in the studies by Vargas-Yáñez et al. (2010a, b) and Rixen et al. (2005). In the latter paper, we see a similarity between the evolution of the time series of the western Mediterranean at intermediate level, and the surface eastern Mediterranean.
The third period (from 1988 to 2012) for which we have computed trends has an irregular pattern, and the data coverage is less regular than the other chosen periods. However, in some areas, we could identify a potential temperature drop after 2007. Zunino et al. (2012) have reported this event from the DYFAMED measurements in the Ligurian subbasin. They have linked this drop with the Western Mediterranean Transition, corresponding to changes resulting from the intense deep convection event that occurred in the Gulf of Lions and Ligurian subbasin in winter 2004–2005 (Schroeder et al., 2008, 2016).
The great acceleration of warming and salinification observed from 2012 to 2017 +0.048 ± 0.003 and +0.0076 ± 0.0009 yr−1, respectively, have also been reported by Schroeder et al. (2017) in the Sicily Channel between 2010 and 2016. They have recorded a potential temperature trend of +0.064 and a salinity trend of +0.014 yr−1. Barceló-Llull et al. (2019) documented similar trends in the Balearic Sea between 2011 and 2018 (+0.044 ± 0.002 and +0.010 yr−1). In Margirier et al. (2020) trends of +0.06 ± 0.01 and +0.012 ± 0.02 yr−1 between 2007 and 2017 were reported in the Ligurian Sea.
Overall, the long-term evolution of the potential temperature time series has allowed a slow increasing trend from the 1960s to 2017 to be identified and helped confirm the rapidly increasing trend after 2010.
Our study provides additional evidence that the Algerian Gyres represent an important circulation feature in the basin. It appeared on the current measurements that those gyres have an impact on the circulation over the whole water column. The study of the hydrological characteristics of LIW, using in situ data, showed that its distribution across the basin is linked to the presence of the gyres. A westward, cross-shelf, eddy-driven transport of LIW from the south Sardinia vein toward the interior of the Algerian Basin following the periphery of the Algerian Gyres is evidenced by the climatology of potential temperature and confirmed with the cross-correlation of a particular signal.
The LIW potential temperature and salinity trend estimates over various periods contribute to documenting LIW evolution in the Algerian Basin and confirm the results of previous studies. More importantly, the warming acceleration that is observed all over the basin from 2010 is alarming. A closer monitoring of water mass properties needs to be sustained. It is crucial to maintain and reinforce existing surveillance systems as they can assess the direct impacts of climate change in the Mediterranean hot-spot. In the future, we can expect important modification of the water mass properties with major consequences: increase in temperature, stratification and collapse of deep convection in the NW Mediterranean Sea (Parras-Berrocal et al., 2022), thus affecting its profound functioning and the rich but fragile ecosystems that it hosts. It is reported in Lacoue-Labarthe et al. (2016) that an increased warming is likely to result in mass mortality of seagrass Posidonia oceanica (which is a very important habitat in the Mediterranean and constitutes an important carbon sink), invertebrates, sponges and corrals, etc. Invasive warm water species of algae, invertebrates and fish are increasing their geographical ranges. In addition to that, the proliferation of pathogens are expected, increasing the spreading of diseases.
The code that allows the detection of the Levantine Intermediate Water's core characteristics on a salinity and/or temperature profile has been elaborated during this research and has been published on GitHub (https://github.com/KatiaMallil/LIW-detection, Mallil, 2022).
All the original potential temperature and salinity profiles used in this research are available freely online and have been referenced on the section data and methods. The dataset of LIW potential temperature and salinity that could be detected among those profiles have been compiled in one MATLAB file and made freely available on SEANOE (https://doi.org/10.17882/89189, Mallil et al., 2018).
KM carried out the analyses, prepared the figures and wrote the main paper. HLG performed the processing of the current measurements. LH compiled the multisource in situ temperature and salinity data in one homogeneous product. KM and FM updated and improved the quality of the product. AB helped with optimal interpolation analysis. PT and AB provided guidance and supervision. LM and FL provided funding and administrative coordination. All authors have contributed to providing ideas, discussing the results and reviewing the paper.
The contact author has declared that neither they nor their co-authors have any competing interests.
Publisher's note: Copernicus Publications remains neutral with regard to jurisdictional claims in published maps and institutional affiliations.
This article is part of the special issue “Advances in interdisciplinary studies at multiple scales in the Mediterranean Sea”. It is a result of the 8th MONGOOS Meeting & Workshop, Trieste, Italy, 3–5 December 2019.
We would like to particularly thank all crew members that have contributed to collecting the precious in situ data. Thanks go to all scientists and technicians involved in the field campaign and data processing. We also thank Katrin Schroeder and her crew for providing the MEDCO08 and Venus1 CTD data.
This research has been supported by the Campus France (PHC Tassili (grant no. 35163NA) and the Campus France (PROFAS B+ (grant no. 907058C).
This paper was edited by Alejandro Orfila and reviewed by two anonymous referees.
Barceló-Llull, B., Pascual, A., Ruiz, S., Escudier, R., Torner, M., and Tintoré, J.: Temporal and Spatial Hydrodynamic Variability in the Mallorca Channel (Western Mediterranean Sea) From 8 Years of Underwater Glider Data, J. Geophys. Res.-Oceans, 124, 2769–2786, https://doi.org/10.1029/2018JC014636, 2019. a
Benzohra, M. and Millot, C.: Characteristics and circulation of the surface and intermediate water masses off Algeria, Deep-Sea Res. Pt. I, 42, 1803–1830, https://doi.org/10.1016/0967-0637(95)00043-6, 1995. a
Béthoux, J. P.: Budgets of the Mediterranean Sea. Their dependance on the local climate and on the characteristics of the Atlantic waters, Oceanol. Acta, 2, 157–163, 1979. a
Béthoux, J. P. and Gentili, B.: The Mediterranean Sea, coastal and deep-sea signatures of climatic and environmental changes, J. Marine Syst., 7, 383–394, https://doi.org/10.1016/0924-7963(95)00008-9, 1996. a, b, c
Béthoux, J. P. and Gentili, B.: Functioning of the Mediterranean sea: past and present changes related to freshwater input and climate changes, J. Marine Syst., 20, 33–47, https://doi.org/10.1016/S0924-7963(98)00069-4, 1999. a, b
Béthoux, J. P., Gentili, B., Raunet, J., and Tailliez, D.: Warming trend in the western Mediterranean Deep Water, Nature, 347, 660–662, https://doi.org/10.1038/347660a0, 1990. a, b
Boehme, L. and Send, U.: Objective analyses of hydrographic data for referencing profiling float salinities in highly variable environments, Deep-Sea Res. Pt. II, 52, 651–664, https://doi.org/10.1016/j.dsr2.2004.12.014, 2005. a
Borghini, M., Durante, S., Ribotti, A., Schroeder, K., and Sparnocchia, S.: Thermohaline Staircases in the Tyrrhenian Sea. Experimental data-set (2003–2016), SEANOE, https://doi.org/10.17882/58697, 2019. a, b, c
Bosse, A., Testor, P., Mortier, L., Prieur, L., Taillandier, V., d'Ortenzio, F., and Coppola, L.: Spreading of Levantine Intermediate Waters by submesoscale coherent vortices in the northwestern Mediterranean Sea as observed with gliders, J. Geophys. Res.-Oceans, 120, 1599–1622, https://doi.org/10.1002/2014JC010263, 2015. a, b
Brankart, J.-M. and Pinardi, N.: Abrupt Cooling of the Mediterranean Levantine Intermediate Water at the Beginning of the 1980s: Observational Evidence and Model Simulation, J. Phys. Oceanogr., 31, 2307–2320, https://doi.org/10.1175/1520-0485(2001)031<2307:acotml>2.0.co;2, 2001. a
Bryden, H. and Kinder, T. H.: Steady two-layer exchange through the Strait of Gibraltar, Deep-Sea Res., 38, S445– S463, https://doi.org/10.1016/s0198-0149(12)80020-3, 1991. a
Bryden, H., Candela, J., and Kinder, T. H.: Exchange through the Strait of Gibraltar, Prog. Oceanogr., 33, 201–248, https://doi.org/10.1016/0079-6611(94)90028-0, 1994. a
Conkright, M. E., Antonov, J. I., Baranova, O., Boyer, T. P., Garcia, H. E., Gelfeld, R., Johnson, D., Locarnini, R. A., Murphy, P. P., O'Brien, T. D., Smolyar, I., and Stephens, C.: World Ocean Database 2001. Volume 1: Introduction, in: NOAA Atlas NESDIS 42, edited by: Levitus, S., U. S. Gov. Printing Office, Washington, DC, 167 pp, 2002. a
Coppola, L., Raimbault, P., Mortier, L., and Testor, P.: Monitoring the Environment in the Northwestern Mediterranean Sea, EOS T. Am. Geophys. Un., 100, https://doi.org/10.1029/2019EO125951, 2019. a
Durante, S., Schroeder, K., Mazzei, L., Pierini, S., Borghini, M., and Sparnocchia, S.: Permanent Thermohaline Staircases in the Tyrrhenian Sea, Geophys. Res. Lett., 46, 1562–1570, https://doi.org/10.1029/2018GL081747, 2019. a
Escudier, R., Mourre, B., Juza, M., and Tintore, J.: Subsurface circulation and mesoscale variability in the Algerian subbasin from altimeter-derived eddy trajectories, J. Geophys. Res.-Oceans, 121, 6310–6322, https://doi.org/10.1002/2016JC011760, 2016a. a, b, c, d
Escudier, R., Renault, L., Pascual, A., Brasseur, P., Chelton, D., and Beuvier, J.: Eddy properties in the Western Mediterranean Sea from satellite altimetry and a numerical simulation, J. Geophys. Res.-Oceans, 121, 3990–4006, https://doi.org/10.1002/2015JC011371, 2016b. a, b
Fichaut, M., Garcia, M.-J., Giorgetti, A., Iona, A., Kuznetsov, A., Rixen, M., and MEDAR, G.: MEDAR/MEDATLAS 2002: A Mediterranean and Black Sea database for operational oceanography, Elsev. Oceanogr. Serie., 69, 645–648, https://doi.org/10.1016/s0422-9894(03)80107-1, 2003. a
Gascard, J.-C. and Richez, C.: Water masses and circulation in the western Alboran Sea and in the strait of Gibraltar, Prog. Oceanogr., 15, 157–216, https://doi.org/10.1016/0079-6611(85)90031-X, 1985. a
Houpert, L., Testor, P., Durrieu de Madron, X., Somot, S., D'Ortenzio, F., Estournel, C., and Lavigne, H.: Seasonal cycle of the mixed layer, the seasonal thermocline and the upper-ocean heat storage rate in the Mediterranean Sea derived from observations, Prog. Oceanogr., 132, 333–352, https://doi.org/10.1016/j.pocean.2014.11.004, 2015. a
Houpert, L., Madron, X. D. D., Testor, P., Bosse, A., Bouin, F. D. M. N., Goff, D. D. H. L., Kunesch, S., Labaste, M., Mortier, L. C. L., and Raimbault, P.: Observations of open-ocean deep convection in the northwestern Mediterranean Sea: Seasonal and interannual variability of mixing and deep water masses for the 2007–2013 Period, J. Geophys. Res.-Oceans, 121, 8139–8171, https://doi.org/10.1002/2016JC011857, 2016. a
Isern-Fontanet, J., Garcia-Ladona, E., and Font, J.: Vortices of the Mediterranean Sea: An Altimetric Perspective, J. Phys. Oceanogr., 36, 87–103, https://doi.org/10.1175/JPO2826.1, 2006. a, b
Iudicone, D., Louanchi, F., Mallil, K., Testor, P., and Mortier, L.: somba deployment (EGO glider: theque) (Mediterranean Sea – Western basin), SEANOE, https://doi.org/10.17882/51460, 2014. a
Johnson, R. G.: Climate control requires a Dam at the strait of Gibraltar, EOS T. Am. Geophys. Un., 78, 277–281, https://doi.org/10.1029/97EO00180, 1997. a
Krahmann, G. and Schott, F.: Longterm increases in Western and Mediterranean salinities and temperatures: anthropogenic and climatic sources, Geophys. Res. Lett., 25, 4209–4212, https://doi.org/10.1029/1998gl900143, 1998. a, b
Lacoue-Labarthe, T., Nunes, P. A., Ziveri, P., Cinar, M., Gazeau, F., Hall-Spencer, J. M., Hilmi, N., Moschella, P., Safa, A., Sauzade, D., and Turley, C.: Impacts of ocean acidification in a warming Mediterranean Sea: An overview, Regional Studies in Marine Science, 5, 1–11, https://doi.org/10.1016/j.rsma.2015.12.005, 2016. a
Lozier, M. and Stewart, N. M.: NOTES AND CORRESPONDANCE On The Temporally Varying Northward Penetration of Mediterranean Overflow Water and Eastward Penetration on Labrador Sea Water, J. Phys. Oceanogr., 38, 2097–2103, https://doi.org/10.1175/2008JPO3908.1, 2008. a
Mallil, K.: LIW-detection, GitHub [code], https://github.com/KatiaMallil/LIW-detection, last access: 4 July 2022. a
Mallil, K., Bosse, A., Testor, P., and Margirier, F.: Levantine Intermediate Water in the Western Mediterranean Sea, SEANOE [data set], https://doi.org/10.17882/89189, 2018. a
Manca, B., Burca, M., Giorgetti, A., Coatanoan, C., Garcia, M.-J., and Iona, A.: Physical and biochemical averaged vertical profiles in the Mediterranean regions: an important tool to trace the climatology of water masses and to validate incoming data from operational oceanography, J. Marine Syst., 48, 83–116, https://doi.org/10.1016/j.jmarsys.2003.11.025, 2004. a
Margirier, F., Testor, P., Heslop, E., Mallil, K., Bosse, A., Houpert, L., Mortier, L., Bouin, M.-N., Coppola, L., D'Ortenzio, F., de Madron, X. D., Mourre, B., Prieur, L., Raimbault, P., and Taillandier, V.: Abrupt warming and salinification of intermediate waters interplays with decline of deep convection in the Northwestern Mediterranean Sea, Sci. Rep.-UK, 10, 20923, https://doi.org/10.1038/s41598-020-77859-5, 2020. a, b
MEDOC GROUP: Observation of Formation of Deep Water in the Mediterranean Sea, 1969, Nature, 227, 1037–1040, https://doi.org/10.1038/2271037a0, 1970. a, b
Millot, C.: Circulation in the Western Mediterranean Sea, J. Marine Syst., 20, 423–442, https://doi.org/10.1016/s0924-7963(98)00078-5, 1999. a, b, c
Millot, C. and Taupier-Letage, I.: Additional evidence of LIW entrainment across the Algerian subbasin by mesoscale eddies and not by a permanent westward flow, Prog. Oceanogr., 66, 231–250, https://doi.org/10.1016/j.pocean.2004.03.002, 2005a. a
Millot, C. and Taupier-Letage, I.: chap. Circulation in the Mediterranean Sea, in: The Mediterranean Sea, vol. 5K of Handbook of Environmental Chemistry, edited by: Saliot, A., Springer Berlin Heidelberg, Berlin, Heidelberg, https://doi.org/10.1007/b107143, 29–66, 2005b. a, b
Millot, C., Taupier-Letage, I., and Benzohra, M.: The Algerian eddies, Earth-Sci. Rev., 27, 203–219, https://doi.org/10.1016/0012-8252(90)90003-E, 1990. a
Mortier, L., Ameur, N. A., and Taillandier, V.: SOMBA GE 2014 CRUISE, RV Téthys II, https://doi.org/10.17600/14007500, 2014. a, b, c, d
Parras-Berrocal, I. M., Vázquez, R., Cabos, W., Sein, D. V., Álvarez, O., Bruno, M., and Izquierdo, A.: Surface and Intermediate Water Changes Triggering the Future Collapse of Deep Water Formation in the North Western Mediterranean, Geophys. Res. Lett., 49, e2021GL095404, https://doi.org/10.1029/2021GL095404, 2022. a
Pessini, F., Olita, A., Cotroneo, Y., and Perilli, A.: Mesoscale eddies in the Algerian Basin: do they differ as a function of their formation site?, Ocean Sci., 14, 669–688, https://doi.org/10.5194/os-14-669-2018, 2018. a, b
Provenzale, A.: Transport by coherent barotropic vortices, Annu. Rev. Fluid Mech., 31, 55–93, https://doi.org/10.1146/annurev.fluid.31.1.55, 1999. a
Puillat, I., I.Taupier-Letage, and Millot, C.: Algerian Eddies lifetime can near 3 years, J. Marine Syst., 31, 245–259, https://doi.org/10.1016/S0924-7963(01)00056-2, 2002. a, b
Ribotti, A. and Borghini, M.: Cruise Report: MEDCO08, Tech. rep., CNR IAMC (Istituto per l'Ambiente Marino e Costiero) and CNR ISMAR (Instituto di Scienze Marine), https://www.researchgate.net/publication/279480010_Cruise_Report_MedCO08 (last access: 1 July 2022), 2008. a, b, c
Ribotti, A., Sorgente, R., Perilli, A., Cucco, A., Magni, P., and Borghini, M.: CTD profiles in the western and central Mediterranean between 2007 and 2020 from Italian cruises, SEANOE [data set], https://doi.org/10.17882/87567, 2022. a, b, c
Rixen, M., Beckers, J.-M., Levitus, S., Antonov, J., Boyer, T., Maillard, C., Fichaut, M., Balopoulos, E., Iona, S., Dooley, H., Garcia, M.-J., Manca, B., Giorgetti, A., Manzella, G., Mikhailov, N., Pinardi, N., and Zavatarelli., M.: The Western Mediterranean Deep Water: A proxy for climate change, Geophys. Res. Lett., 32, L12608, https://doi.org/10.1029/2005gl022702, 2005. a, b, c
Robinson, A., Wayne, G., Theocharis, A., and Lescaratos, A.: chap. Mediterranean Sea Circulation, Ocean Currents, in: Encyclopedia of Ocean Sciences, edited by: Steele, J. H., https://doi.org/10.1006/rwos.2001.0376, 1689–1705, 2001. a, b
Rohling, E. and Bryden, H.: Man-Induced Salinity and Temperature Increases in Western Mediterranean Deep Water, J. Geophys. Res., 97, 11191–11198, https://doi.org/10.1029/92JC00767, 1992. a
Schroeder, K., Ribotti, A., Borghini, M., Sorgente, R., Perilli, A., and Gasparini, G. P.: An extensive Western Mediterranean Deep Water renewal between 2004 and 2006, Geophys. Res. Lett., 35, L18605, https://doi.org/10.1029/2008GL035146, 2008. a
Schroeder, K., Chiggiato, J., Bryden, H., Borghini, M., and Ismail, S. B.: Abrupt climate shift in the Western Mediterranean Sea, Sci. Rep.-UK, 6, 23009, https://doi.org/10.1038/srep23009, 2016. a
Schroeder, K., Chiggiato, J., Josey, S. A., Borghini, M., Aracri, S., and Sparnocchia, S.: Rapid response to climate change in a marginal sea, Sci. Rep.-UK, 7, 4065, https://doi.org/10.1038/s41598-017-04455-5, 2017. a, b
Sparnocchia, S., Manzella, G., and Violette, P. L.: The interanual and seasonal variability of MAW and LIW core properties in the Western Mediterranean sea, in: Seasonal and interanual variability of the Western Mediterranean sea, Coastal and Estuarine Studies, edited by: La Violette, P. E., 177–194, https://agupubs.onlinelibrary.wiley.com/doi/abs/10.1029/CE046p0117 (last access: 4 July 2022), 1994. a
Taupier-Letage, I., Puillat, I., and Millot, C.: Biological response to mesoscale eddies in the Algerian Basin, J. Geophys. Res., 108, 3245, https://doi.org/10.1029/1999JC000117, 2003. a
Tchernia, P.: L'eau intermédiaire dans le bassin Algéro-Provençal, Bull. Inf. COEC, 10, 19–22, 1958. a
Testor, P. and Gascard, J.-C.: Large scale flow separation and mesoscale eddy formation in the Algerian Basin, Prog. Oceanogr., 66, 211–230, https://doi.org/10.1016/j.pocean.2004.07.018, 2005. a, b, c
Testor, P., Send, U., Gascard, J., Millot, C., Taupier-Letage, I., and Béranger, K.: The mean circulation of the southwestern Mediterranean Sea: Algerian Gyres, J. Geophys. Res., 110, C11017, https://doi.org/10.1029/2004jc002861, 2005a. a, b, c, d
Testor, P., Béranger, K., and Mortier, L.: Modeling the deep eddy field in the southwestern Mediterranean: The life cycle of Sardinian eddies, Geophys. Res. Lett., 32, L13602, https://doi.org/10.1029/2004GL022283, 2005b. a, b, c
Testor, P., Goff, H. L., Labaste, M., Coppola, L., Mortier, L., Taillandier, V., Dausse, D., Kunesch, S., Diamond-Riquier, E., Garcia, N., de Madron, X. D., and Raimbault, P.: MOOSE GE, SEANOE, https://doi.org/10.18142/235, 2010. a
Testor, P., Mortier, L., Coppola, L., Claustre, H., D'ortenzio, F., Bourrin, F., de Madron, X. D., and Raimbault, P.: Glider MOOSE sections, SEANOE, https://doi.org/10.17882/52027, 2017. a
Testor, P., Bosse, A., Houpert, L., Margirier, F., Mortier, L., Legoff, H., Dausse, D., Labaste, M., Karstensen, J., Hayes, D., Olita, A., Ribotti, A., Schroeder, K., Chiggiato, J., Onken, R., Heslop, E., Mourre, B., D'ortenzio, F., Mayot, N., Lavigne, H., de Fommervault, O., Coppola, L., Prieur, L., Taillandier, V., de Madron, X. D., Bourrin, F., Many, G., Damien, P., Estournel, C., Marsaleix, P., Taupier-Letage, I., Raimbault, P., Waldman, R., Bouin, M.-N., Giordani, H., Caniaux, G., Somot, S., Ducrocq, V., and Conan, P.: Multiscale Observations of Deep Convection in the Northwestern Mediterranean Sea During Winter 2012–2013 Using Multiple Platforms, J. Geophys. Res.-Oceans, 123, 1745–1776, https://doi.org/10.1002/2016JC012671, 2018. a, b
The MerMex Group: Durrieu de Madron, X., Guieu, C., Sempéré, R., Conan, P., Cossa, D., D'ortenzion, F., Estournel, C., Gaseau, F., Rabouille, C., Stemmann, L., Bonnet, S., Diaz, F., Koubbi, P., Radakovitch, O., Babin, M., Baklouti, M., Bancon-Montigny, C., Belviso, S., Bensoussan, N., Bonsang, B., Bouloubassi, I., Brunet, C., Cadiou, J.-F., Carlotti, F., Chami, M., Charmasson, S., Charrière, B., Dachs, J., Doxaran, D., Dutay, J.-C., Elbaz-Poulichet, F., Eléaume, M., Eyrolles, F., Fernandez, C., Fowler, S., Francour, P., Gaertner, J. C., Galzin, R., Gasparini, S., Ghiglione, J.-F., Gonzalez, J. L., Goyet, C., Guidi, L., Guizien, K., Heimbürger, L. E., Jacquet, S. H. M., Jeffrey, W. H., Joux, F., Le Hir, P., Leblanc, K., Lefèvre, D., Lejeusne, C., Lemé, R., Loÿe-Pilot, M. D., Mallet, M., Méjanelle, L., Mélin, F., Mellon, C., Mérigot, B., Merle, P. L., Migon, C., Miller, W. L., Mortier, L., Mostajir, B., Mousseau, L., Moutin, T., Para, J., Pérez, T., Petrenko, A. A., Poggiale, J. C., Prieur, L., Pujol, M. I., Pulido-Villena, Raimbault, P., Rees, A. P., Ridame, C., Rontani, J. F., Ruiz Pino, D., Sicre, M. A., Taillandier, V., Tamburini, C., Tanaka, T., Taupier-Letage, I., Tedetti, M., Testor, P., Thébault, H., Thouvenin, B., Touratier, F., Tronczynski, J., Ulses, C., Van Wambeke, F., Vantrepotte, V., Vaz, S., and Verney, R.: Marine ecosystems' response to climatic and anthropogenic forcings in the Mediterranean, Prog. Oceanogr., 91, 97–166, https://doi.org/10.1016/j.pocean.2011.02.003, 2011. a
Thurnherr, A.: A Practical Assessment of the Errors Associated with Full-Depth LADCP Profiles Obtained Using Teledyne RDI Workhorse Acoustic Doppler Current Profilers, J. Atmos. Ocean. Tech., 27, 1215–1227, https://doi.org/10.1175/2010JTECHO708.1, 2010. a
Vargas-Yáñez, M., Moya, F., García-Martínez, M., Tel, E., P.Zunino, Plaza, F., Salat, J., J.Pascual, López-Jurado, J., and M.Serra: Climate change in the western Mediterranean Sea 1900-2008, J. Marine Syst., 82, 171–176, https://doi.org/10.1016/j.jmarsys.2010.04.013, 2010a. a
Vargas-Yáñez, M., Zunino, P., Benali, A., Delpy, M., Moya, F. P. F., del Carmen García-Martínez, M., and Tel, E.: How much is the western Mediterranean really warming and salting, J. Geophys. Res., 115, C04001, https://doi.org/10.1029/2009JC005816, 2010b. a
Vargas-Yáñez, M., García-Martínez, M., Moya, F., Balbín, R., López-Jurado, J., Serra, M., Zunino, P., Pascual, J., and Salat, J.: Updating temperature and salinity mean values and trends in the Western Mediterranean: The RADMED project, Prog. Oceanogr., 157, 27–46, https://doi.org/10.1016/j.pocean.2017.09.004, 2017. a
Visbeck, M.: Deep Velocity Profiling Using Lowered Acoustic Doppler Current Profilers: Bottom Track and Inverse Solutions, J. Atmos. Ocean. Tech., 19, 794–807, https://doi.org/10.1175/1520-0426(2002)019<0794:DVPULA>2.0.CO;2, 2002. a
Wüst, G.: On the vertical circulation of the Mediterranean sea, J. Geophys. Res., 66, 3261–3271, https://doi.org/10.1029/JZ066i010p03261, 1961. a, b
Zunino, P., Schroeder, K., Vargas-Yáñez, M., Gasparini, G., Coppola, L., García-Martínez, M., and Moya-Ruiz, F.: Effects of the Western Mediterranean Transition on the resident water masses: Pure warming, pure freshening and pure heaving, J. Marine Syst., 96–97, 15–23, https://doi.org/10.1016/j.jmarsys.2012.01.011, 2012. a