the Creative Commons Attribution 4.0 License.
the Creative Commons Attribution 4.0 License.
 | 04 Jul 2022
Clustering analysis of the Sargassum transport process: application to beaching prediction in the Lesser Antilles
Didier Bernard
Emmanuel Biabiany
Raphaël Cécé
Romual Chery
Naoufal Sekkat
The massive Sargassum algae beachings observed over the past decade are a new natural hazard currently impacting the island states of the Caribbean region (human health, environmental damages, and economic losses). This study aims to improve the prediction of the surface current dynamic leading to beachings in the Lesser Antilles using clustering analysis methods. The input surface currents were derived from the Mercator model and the Hybrid Coordinate Ocean Model (HYCOM) outputs in which we integrated the windage effect. Past daily observations of Sargassum beaching on Guadeloupe coasts and satellite-based Sargassum offshore abundance were also integrated. Four representative current regimes were identified for both Mercator and HYCOM data. The analysis of the current sequences leading to beachings showed that the recurrence of two current regimes is related to the beaching peaks respectively observed in March and August. The performance score of the predictive model showed that the HYCOM data seem more suitable to assess coastal Sargassum hazard in the Lesser Antilles. For 1 year of tests (i.e., 2021), the decision tree accuracy respectively reached 70.1 % and 58.2 % for HYCOM and Mercator with a temporal uncertainty range ±3 d around the forecast date. The present clustering analysis predictive system, requiring lower computational resources compared to conventional forecast models, would help improve this risk management in the islands of the region.
- Article
(11871 KB) - Full-text XML
- BibTeX
- EndNote


During the periods 2011–2012 and then 2014–2019, massive Sargassum beachings impacted most coasts of the Lesser Antilles (LA), mainly those facing east and southeast (Franks et al., 2012; Gower et al., 2013; Johnson et al., 2014; Hu et al., 2016; Wang and Hu, 2016). The LA received large amounts of algae on the windward Atlantic coastline, while leeward Caribbean coastal areas remained slightly affected (Maréchal et al., 2017). These beachings in terms of frequency and intensity can now be considered a new natural hazard for the Caribbean islands and American coasts.
Indeed, while it has been demonstrated that Sargassum algae provide ecosystem services, habitats, and shelter for various organisms in a structurally sterile ocean ecosystem (Witherington et al., 2012; Bertola et al., 2020), the beachings over the past decade have induced health risks for the population and have had considerable socioeconomic impacts (Franks et al., 2012). For example, when looking at the French West Indies, the Guadeloupe archipelago, and Martinique, the findings are as follows.
-
Apart from 2013, the recent inflow of Sargassum rafts on the coasts of Guadeloupe and Martinique, although irregular, has not ceased since 2011, reaching a paroxysm in 2015 (Florenne et al., 2016; Berline et al., 2020). State services estimated that the volumes stranded on the shores were of the order of 1.5 million m3 from October 2014 to October 2015 in Guadeloupe (Florenne et al., 2016). Only a third of these could be collected by the authorities and priority was given to areas at risk, such as inhabited areas, shores with economic or tourist activities, and ecosystems or other environmental niches. The particularity and the difficulty lay in the fact that 60 % of this coastline and/or of the volume stranded remained inaccessible to currently proven techniques and/or at costs that are currently bearable.
-
There was an impact on human health and ecosystems because in shallow and small bays, accumulated algae degrade by fermentation and emit chemical compounds such as hydrogen sulfide (H2S) and ammonia (NH3) (Anses, 2017; Van Tussenbroek et al., 2017; Resiere et al., 2018).
-
A survey conducted by the organizations responsible for socioeconomic development estimated that the decline in tourism resulted in an economic loss of USD 5.5 million for the first half of 2015 (https://eos.org/features/Sargassum-watch-warns-of-incoming-seaweed, last access: 15 January 2022).
The volumes to be collected were considerable compared to the size of these islands (< 1200 km2 each) and the vulnerability of these territories. This new phenomenon has raised several scientific questions relating to Sargassum rafts, such as their transports, origins, and the sources of nutrients promoting their growth, especially the physical factors that led to their occurrence and their development in the tropical and equatorial Atlantic.
Using large-scale observations with ocean color satellite remote sensing, historical hydrographic observations, time series of Sargassum volume collected on ships, multiyear reanalysis of wind and current, and numerical models, the roles of both subsurface nutrient supply and surface current transport were estimated. Several authors have contributed to the understanding of the mechanisms and physicochemical processes governing the phenomenon (Gower et al., 2006; Gower and King, 2011; Gower et al., 2013; Maréchal et al., 2017; Johns et al., 2020). Operational systems have been developed such as the satellite-based Sargassum Watch System SaWS (SargassumWatch System, 2021; Hu, 2009; Hu et al., 2015) and the Sargassum Early Advisory System (SEAS) (Webster and Linton, 2013). They provide a temporal and spatial assessment of annual seasonal increases and decreases in Sargassum algae amount over wide areas of the tropical Atlantic and Caribbean (Wang and Hu, 2016, 2017; Wang et al., 2019). Time series from remote sensing were coupled with spatial distribution models to determine the mechanisms that aggregate Sargassum algae along a zonal band in the tropical Atlantic considering possible nutrient sources promoting the observed annual blooms (Wang et al., 2018, 2019; Johns et al., 2020; Jouanno et al., 2021).
Tropical Atlantic currents and winds seasonally aggregate and carry these algae towards the Caribbean (Franks et al., 2016; Brooks et al., 2018; Cuevas et al., 2018). Modeling studies mainly focused on the transport properties of Sargassum rafts by offshore currents (Wang and Hu, 2017; Brooks et al., 2018; Maréchal et al., 2017; Putman et al., 2018, 2020; Wang et al., 2019; Berline et al., 2020).
Johns et al. (2020) extended this analysis to highlight anomalous transport due to the 2009–2010 North Atlantic Oscillation (NAO) anomaly and seasonal aggregation by the Intertropical Convergence Zone (ITCZ).
A combination of satellite-based alternative floating algae index (AFAI, Wang and Hu, 2016) fields with Hybrid Coordinate Ocean Model (HYCOM) surface current forecast data was used by Maréchal et al. (2017) to short-term predict Sargassum beachings for Guadeloupe and the French Antilles islands. Maréchal et al. (2017) showed that this short-term prediction system (i.e., detection starting within 50–100 km of the coasts) worked efficiently during the year 2015 with a performance percentage of 62 % and a beaching forecast date uncertainty below 1 d.
Trinanes et al. (2021) presented the Sargassum inundation reports (SIRs), a product based on satellite observations to predict Sargassum coastal inundation potential weekly throughout the Caribbean Sea region, the Gulf of Mexico, and extending to the east coast of Florida and the Bahamas. As described by Trinanes et al. (2021), the SIR algorithm uses the floating algae density values within 50 km of each coastal pixel to predict three inundation potential levels (low, medium, and high). This algorithm does not include ocean currents, winds, and waves, which may modify the movement of Sargassum.
In the above works, the implementation of methods based on several independent datasets has led to the production of scientific knowledge and even to the development of large-scale forecasting systems. None of them used predictive modeling (Geisser, 1993; Kuhn and Johnson, 2013) including classifiers (Friedl and Brodley, 1997) to determine the probability of repeatable patterns in a dataset so as to produce a decision for risk prevention managers. Predictive modeling refers to mathematical and computational methods of predicting future events based on the analysis of the repeatable patterns in the input dataset (Geisser, 1993; Friedl and Brodley, 1997; Kuhn and Johnson, 2013). Compared to other conventional forecasts, predictive modeling methods require low computational costs and are characterized by their flexibility and their intuitive simplicity (Friedl and Brodley, 1997).
In this paper, we propose using clustering and decision tree classifier methods, combining ocean surface current, wind reanalysis, and satellite-based Sargassum offshore abundance with past observed beachings to obtain a first predictive model of Sargassum beaching on the Caribbean coasts. This model will be used with forecast data as input to produce an operational decision support system.
As ocean data are spatiotemporal fields, machine learning methods such as K-means (KMS) may be used to obtain a finite number of possible k-cluster partitions of the surface currents. These methods have been widely used in weather forecasting (Michelangeli et al., 1995; Cassou et al., 2004; Boé and Terray, 2008) but are much less common in physical oceanography (Harms and Winant, 1998; Hisaki, 2013; Arnault, 2021).
We focused on the offshore region covering either side of the Lesser Antilles between 55–66∘ W and 8–17∘ N (Fig. 1a). Visual analysis of the monthly SaWS maps indicates that this region remains the primary pathway for Sargassum rafts from the Atlantic Ocean to the Caribbean Sea. The North Equatorial Current (NEC), the Guiana Current (GC), the eddies, and the retroflection front of the North Brazil Current (NBC) are the main contributors of this transport. Putman et al. (2018) modeled the percentage of Sargassum which follows these routes. Figure 1b describes the focused area divided into a first subset called LA1 for the Caribbean Sea, a second one called LA2 between 18 and 14.5∘ N (Guadeloupe, Dominica, Martinique, Saint Lucia), and a third one called LA3 south of 14.5∘ N (Saint Vincent, Barbados, and Trinidad and Tobago).
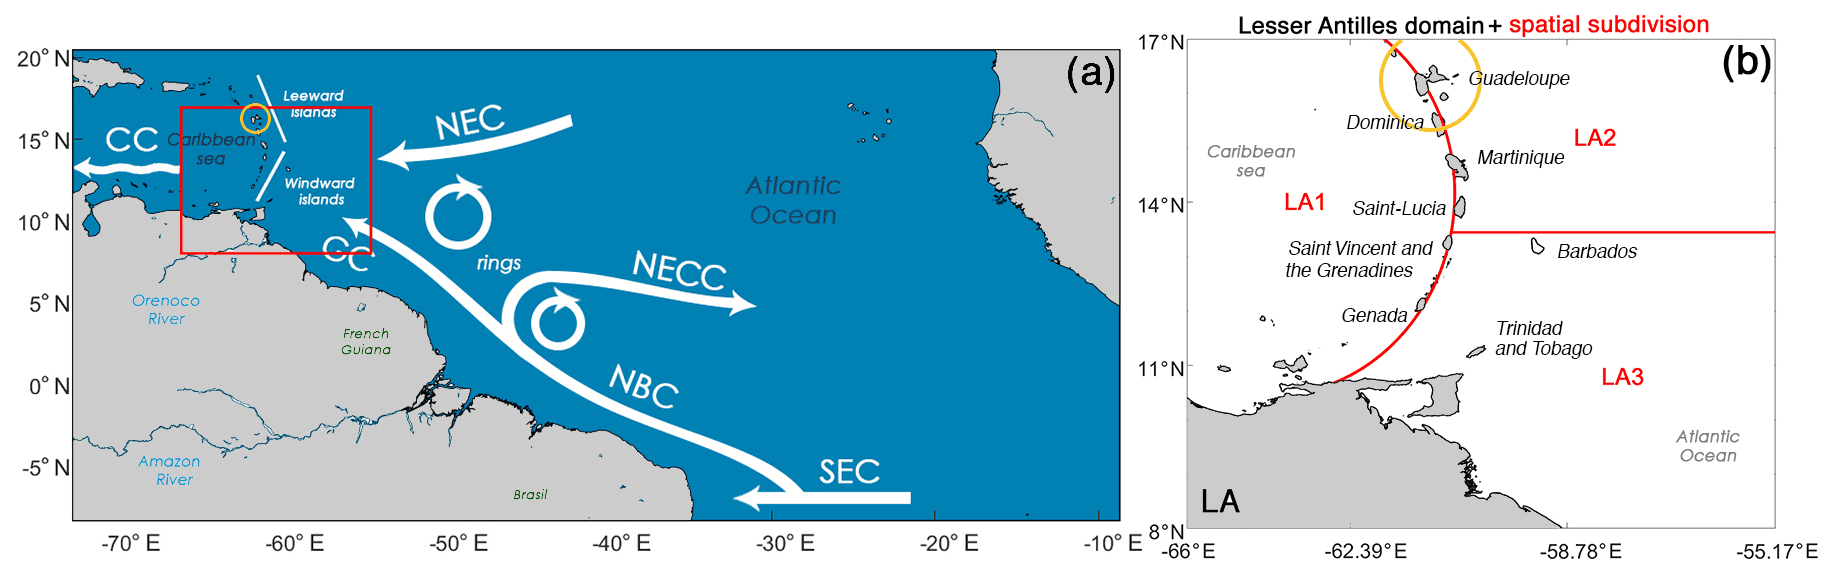
Figure 1(a) Main oceanic currents occurring and interacting in the central Atlantic and the Lesser Antilles regions: Caribbean Current (CC), North Equatorial current (NEC), North Brazil Current (NBC), North Equatorial Counter Current (NECC), South Equatorial Current (SEC). Lesser Antilles domain (LA): the red rectangle corresponds to the study area (55–66∘ W, 8–17∘ N). (b) Spatial subdivision of the study area into three subareas: LA1 (i.e., Caribbean Sea), LA2 (i.e., northern tropical Atlantic above Barbados, 13.2∘ N), and LA3 (i.e. northern tropical Atlantic below 13.2∘ N). The yellow circle corresponds to the 100 km offshore Guadeloupe area in which the satellite-based Sargassum abundance is analyzed.
The questions are as follows. Can dynamic patterns of surface currents in the Lesser Antilles be summarized as a discrete set of cases? What is their temporal recurrence? What combinations of currents enhance Sargassum raft arrival and beachings on the Lesser Antilles coasts? What is the contribution of this type of predictive modeling to the prevention of this new natural hazard?
The overall methodology, database, clustering methods, and decision tree used in this study are described in Sect. 2. The obtained current regimes, their relationship to Sargassum hazard, and the decision support system performances are presented in Sect. 3. These results are discussed in Sect. 4.
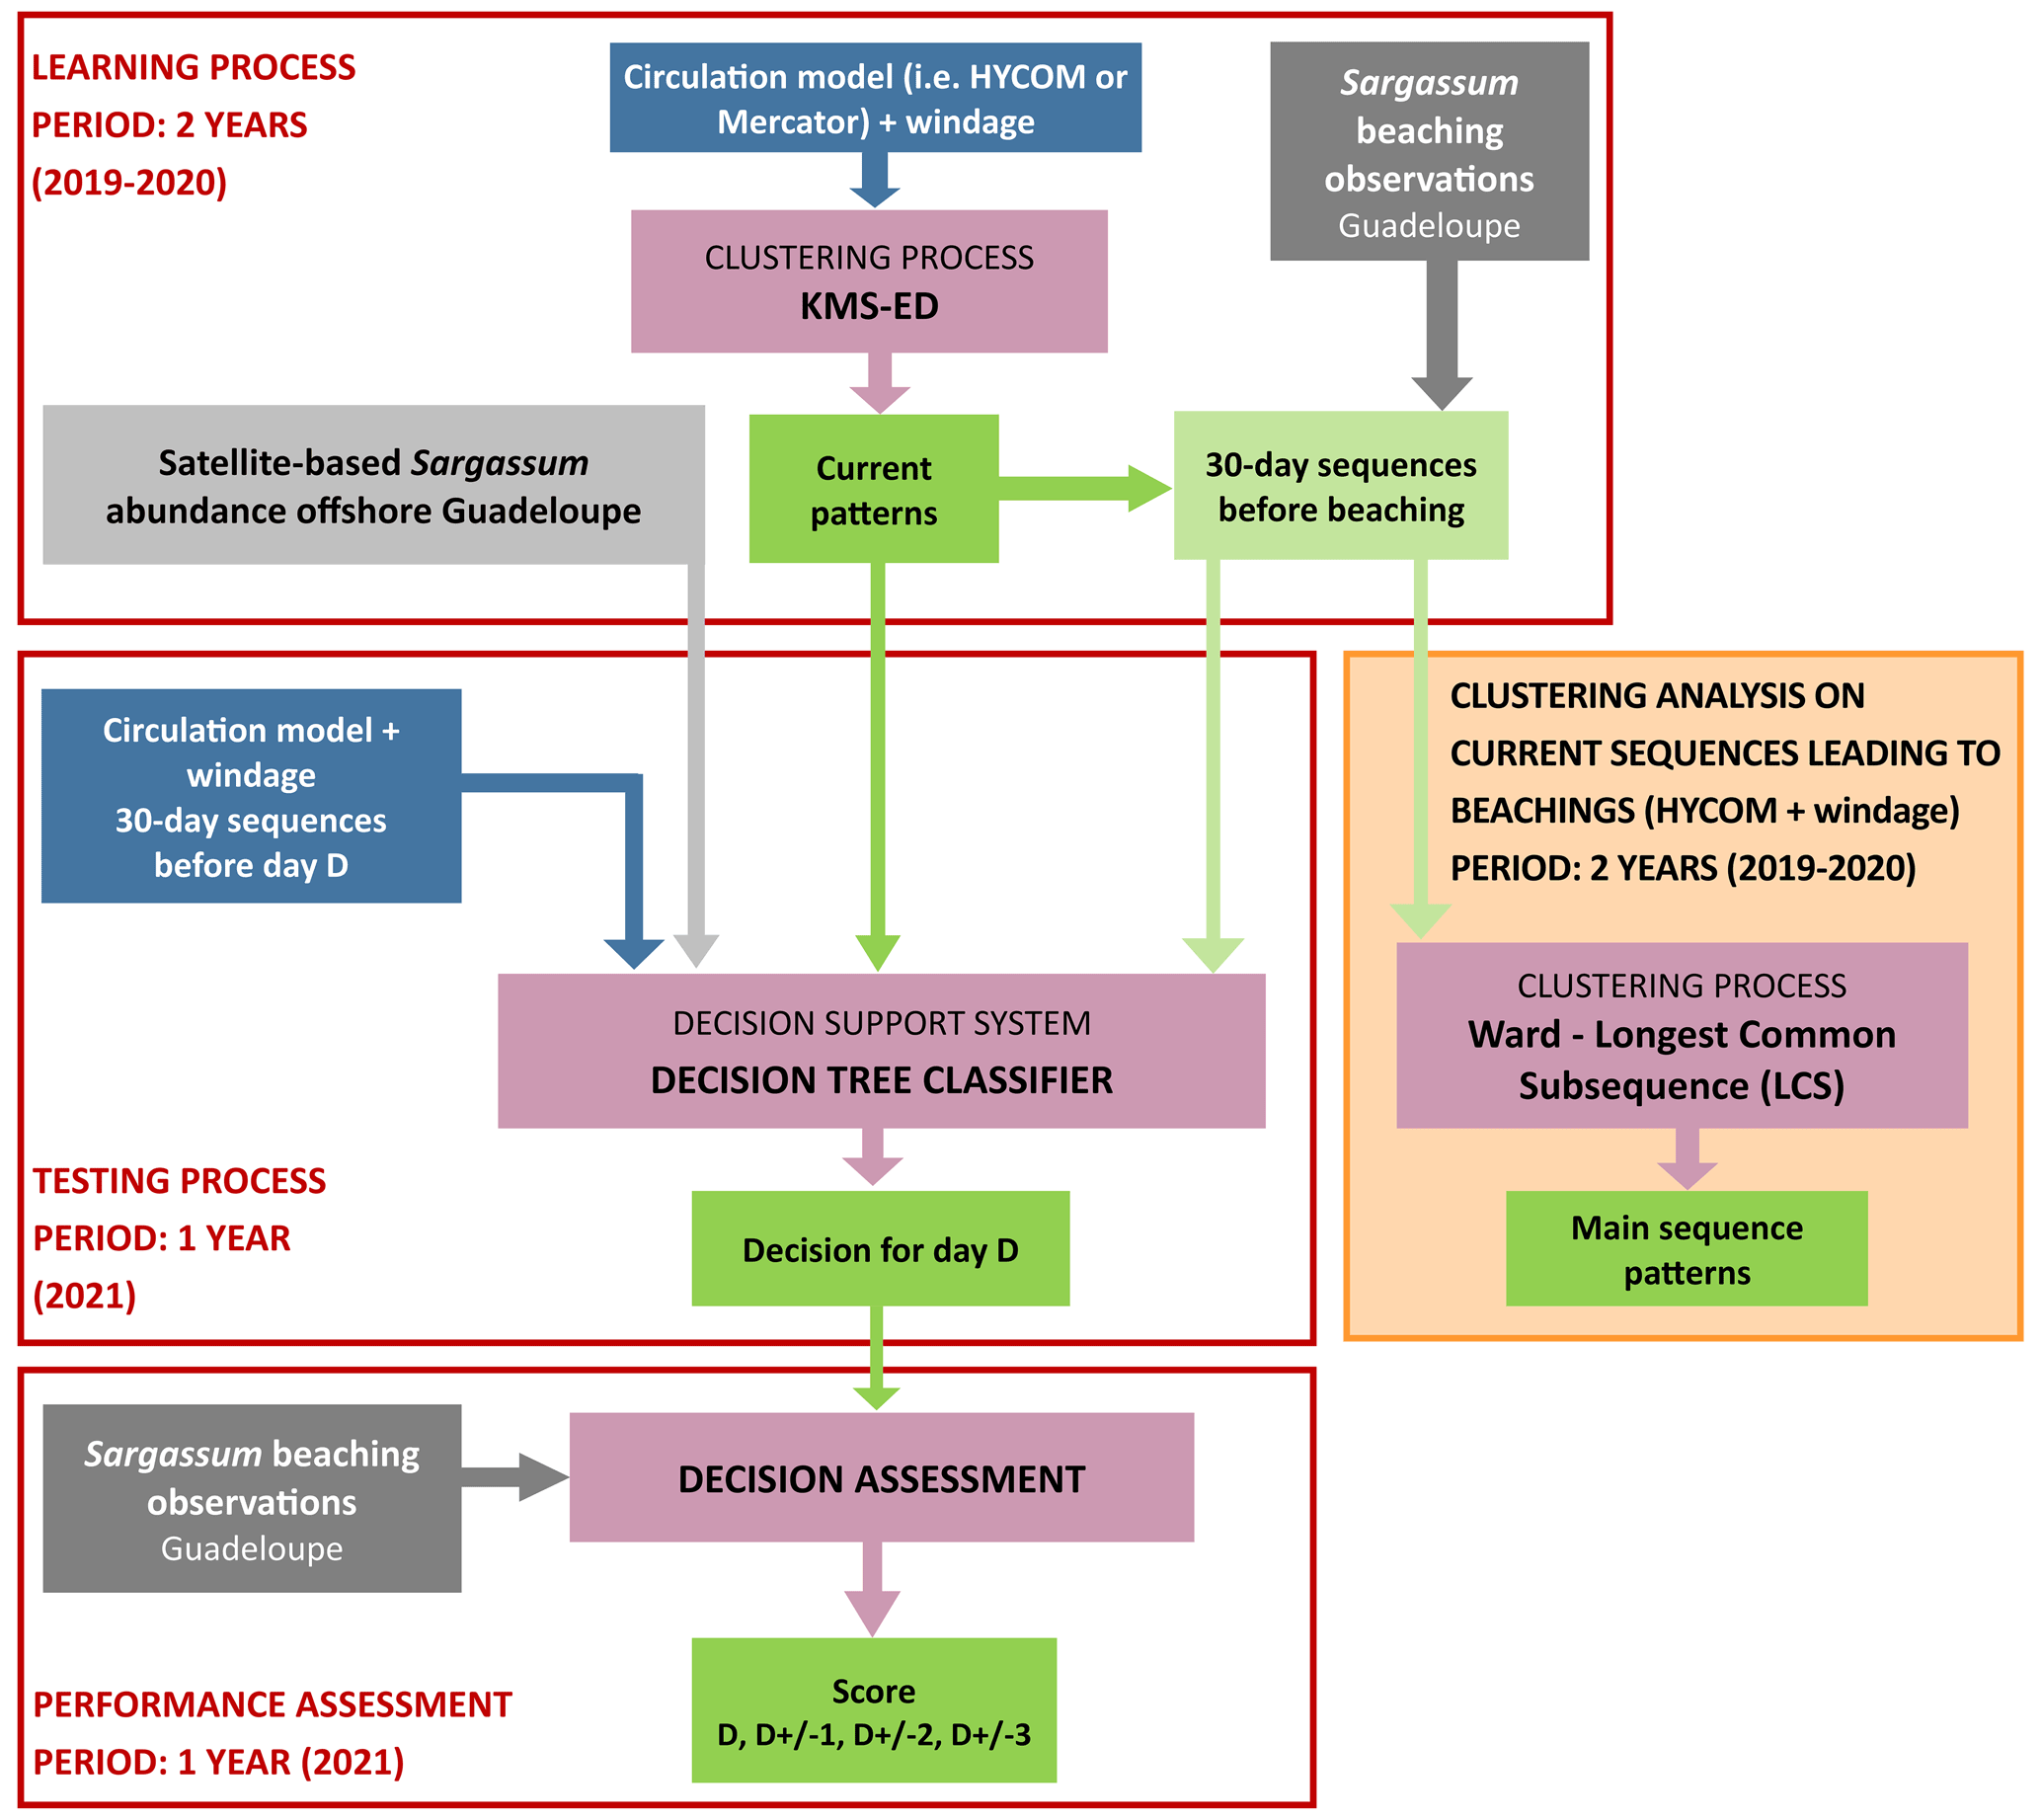
The overall methodology is presented in Fig. 2. The main goal of the first step was to use clustering analysis to identify the main current patterns in the Lesser Antilles during the period 2019–2020. The 30 d current pattern sequences leading to beachings were deduced based on beaching observations in Guadeloupe. An additional clustering analysis was conducted on these sequences to study the main patterns (orange box in Fig. 2). A decision tree classifier was built with the following input data: current patterns, 30 d sequences before beaching, satellite-based Sargassum abundance offshore of Guadeloupe, and surface currents from HYCOM (HYCOM GLBy0.08 version) and Mercator (PSY4V3R1 Mercator ∘ 3D analysis). This decision support system was tested for the year 2021. The performance scores were assessed for each decision day and three temporal uncertainty ranges around this day: ± 1, ± 2, ± 3 d.
2.1 HYCOM surface current dataset
Daily (12:00 UTC, i.e., Coordinated Universal Time) surface current components from the 41-layer Hybrid Coordinate Ocean Model (HYCOM), at ∘ resolution, global analysis (HYCOM GLBy0.08 version, available at: https://www.hycom.org/data/glby0pt08/expt-93pt0, last access: 17 January 2022), were examined. The HYCOM surface forcing including 10 m wind velocities is extracted from Climate Forecast System Version 2 (CFSv2). The Navy Coupled Ocean Data Assimilation (NCODA) system is used to assimilate available observational data: satellite altimeter sea surface height, satellite and in situ sea surface temperature, temperature vertical profiles, and salinity vertical profiles (Cummings, 2005; Cummings and Smedstad, 2013; Helber et al., 2013). The bathymetry used is the GEBCO8 (Becker et al., 2009) with 30 arcsec of resolution. The HYCOM GLBy0.08 grid resolution is 0.08 degree in longitude and 0.04∘ in latitude. To perform the present study, the native HYCOM fields were first interpolated on the Mercator uniform long–lat 0.08∘ grid with a bilinear method. Putman et al. (2018) and Johns et al. (2020) used a previous version of HYCOM including uniform long–lat 0.08∘ scale grid to successfully simulate Sargassum trajectories.
2.2 Mercator surface current dataset
The daily (12:00 UTC) surface current components from the 50-layer PSY4V3R1 Mercator ∘ 3D analysis system (Lellouche et al., 2018; Gasparin et al., 2019) were also analyzed (PSY4V3R1 Mercator ∘ 3D analysis. The atmospheric surface forcing is extracted from the 3-hourly ECMWF (European Centre for Medium-Range Weather Forecasts) IFS (Integrated Forecast System). This version of the Mercator model includes assimilation of observational data quite similarly to the HYCOM NCODA system (i.e., satellite altimeter sea surface height, satellite and in situ sea surface temperature, temperature vertical profiles, and salinity vertical profiles). Unlike the HYCOM GLBy0.08 native grid including higher resolution in latitude (i.e., 0.04∘), the Mercator native grid is uniform in longitude and latitude with 0.08∘ horizontal grid resolution. This would suggest that HYCOM may better reproduce small-scale patterns than Mercator. Moreover, as described by Lellouche et al. (2018), the Mercator bathymetry includes GEBCO8 data in regions shallower than 200 m and the coarse 1 arcmin ETOPO1 data (Amante and Eakins, 2009) in regions deeper than 300 m. The complex bathymetry of the Lesser Antilles arc studied here could be less realistic in the Mercator than in the HYCOM fields.
2.3 ERA-5 dataset: surface winds
Surface wind influences the transport of floating seaweed rafts, and a drag or windage coefficient must be added to the surface currents. Daily 12:00 UTC fields from the hourly 31 km horizontal resolution ERA-5 reanalysis dataset (Hersbach et al., 2020) were used (ERA-5 reanalysis, 2022, available at: https://cds.climate.copernicus.eu/cdsapp#!/dataset/reanalysis-era5-pressure-levels?tab=overview, last access: 17 January 2022). The wind data were integrated with Mercator and HYCOM ocean current data following this formula:
where us represents the oceanic surface currents with windage, um the oceanic surface current velocity, Cw the windage, and uw the surface wind velocity. This approach is consistent with Putman et al. (2018) and Johns et al. (2020). The value of Cw = 0.01 was used, following Putman et al. (2018), Johns et al. (2020), and Berline et al. (2020). The use of other windage values should be investigated in a further study.
2.4 Beaching observational data (Guadeloupe)
A referencing database including observed beachings on Guadeloupe coasts was used in the present study. The selected time period is the same as the one for surface current data: from 1 January 2019 to 31 December 2020. During this period of 730 d, only 110 d of Sargassum beaching were recorded (i.e., 30 d in 2019 and 80 d in 2020). During the year 2021, 78 d of beaching were observed in Guadeloupe. These observational data based on remote sensing and in situ data are archived online by the Regional Directorate for Environment, Development and Housing in Guadeloupe (http://www.guadeloupe.developpement-durable.gouv.fr/sargasses-r999.html, last access: 15 February 2022).
2.5 Satellite-based offshore abundance of Sargassum
Sargassum satellite observations were included in the present decision support system. To quantify the abundance of Sargassum in an area of 100 km radius offshore of Guadeloupe, the 7 d floating algae (FA) density fields derived from the alternative floating algae index (Wang and Hu, 2016) were analyzed. As described by Trinanes et al. (2021), the 7 d FA density fields are accumulated for 7 d and have a 0.1∘ resolution. Due to optical complexity in nearshore waters, the FA density fields are masked with missing values within 30 km from the shoreline (Trinanes et al., 2021). The cumulative FA density values were added up in the area 30–100 km offshore of Guadeloupe (Fig. 1), then averaged over the 2 years 2019 and 2020 for each day.
2.6 Clustering analysis with expert distance
Unsupervised learning methods such as hierarchical agglomerative clustering (HAC) and K-means algorithms were used in the present study. The Ward method allows identifying homogeneous subsets of data (Ward, 1963). Besides the measures and the classes of distance between objects such as the Euclidean distance for K-means and the Ward method, a new metric was also added. The expert distance (ED), which integrates image analysis within unsupervised learning methods (clustering), was used. This method allowed significant improvement in clustering analysis dealing with climate data characterized by high spatiotemporal variability, such as precipitation (Biabiany et al., 2020). Clustering methods using Euclidean distance (L2) can lead to group different physical situations within the same cluster (Biabiany et al., 2020). The ED metric integrates a set of knowledge about the dynamics of the data to be partitioned as well as their spatiotemporal properties.
This ED is based on an empirical spatial subdivision and the use of Kullback–Leibler divergence in order to quantify the similarity between two fields (Kullback and Leibler, 1951). Figure 3 shows the schematic of the expert distance process adopted here.
The LA study area was separated into three parts (Figs. 1b, 3) based on the Sargassum rafts transport centers of action reported in the literature (Franks et al., 2016; Berline et al., 2020). To the west of LA, the first zone, LA1, is centered on the Caribbean Sea. To the east, the Atlantic zone was split into two areas towards 13.5∘ N, just above the island of Barbados. To the southeast is the LA3 zone under the influence of the North Equatorial Recirculation Region (NERR) and its retroflection rings, while to the northeast is the LA2 zone, more representative of the North Equatorial Current. The analyzed daily fields include a total of 14 279 grid points (4282 grid points in LA1, 3407 grid points in LA2, and 4536 grid points in LA3). The remainder corresponds to areas over land (e.g., islands).
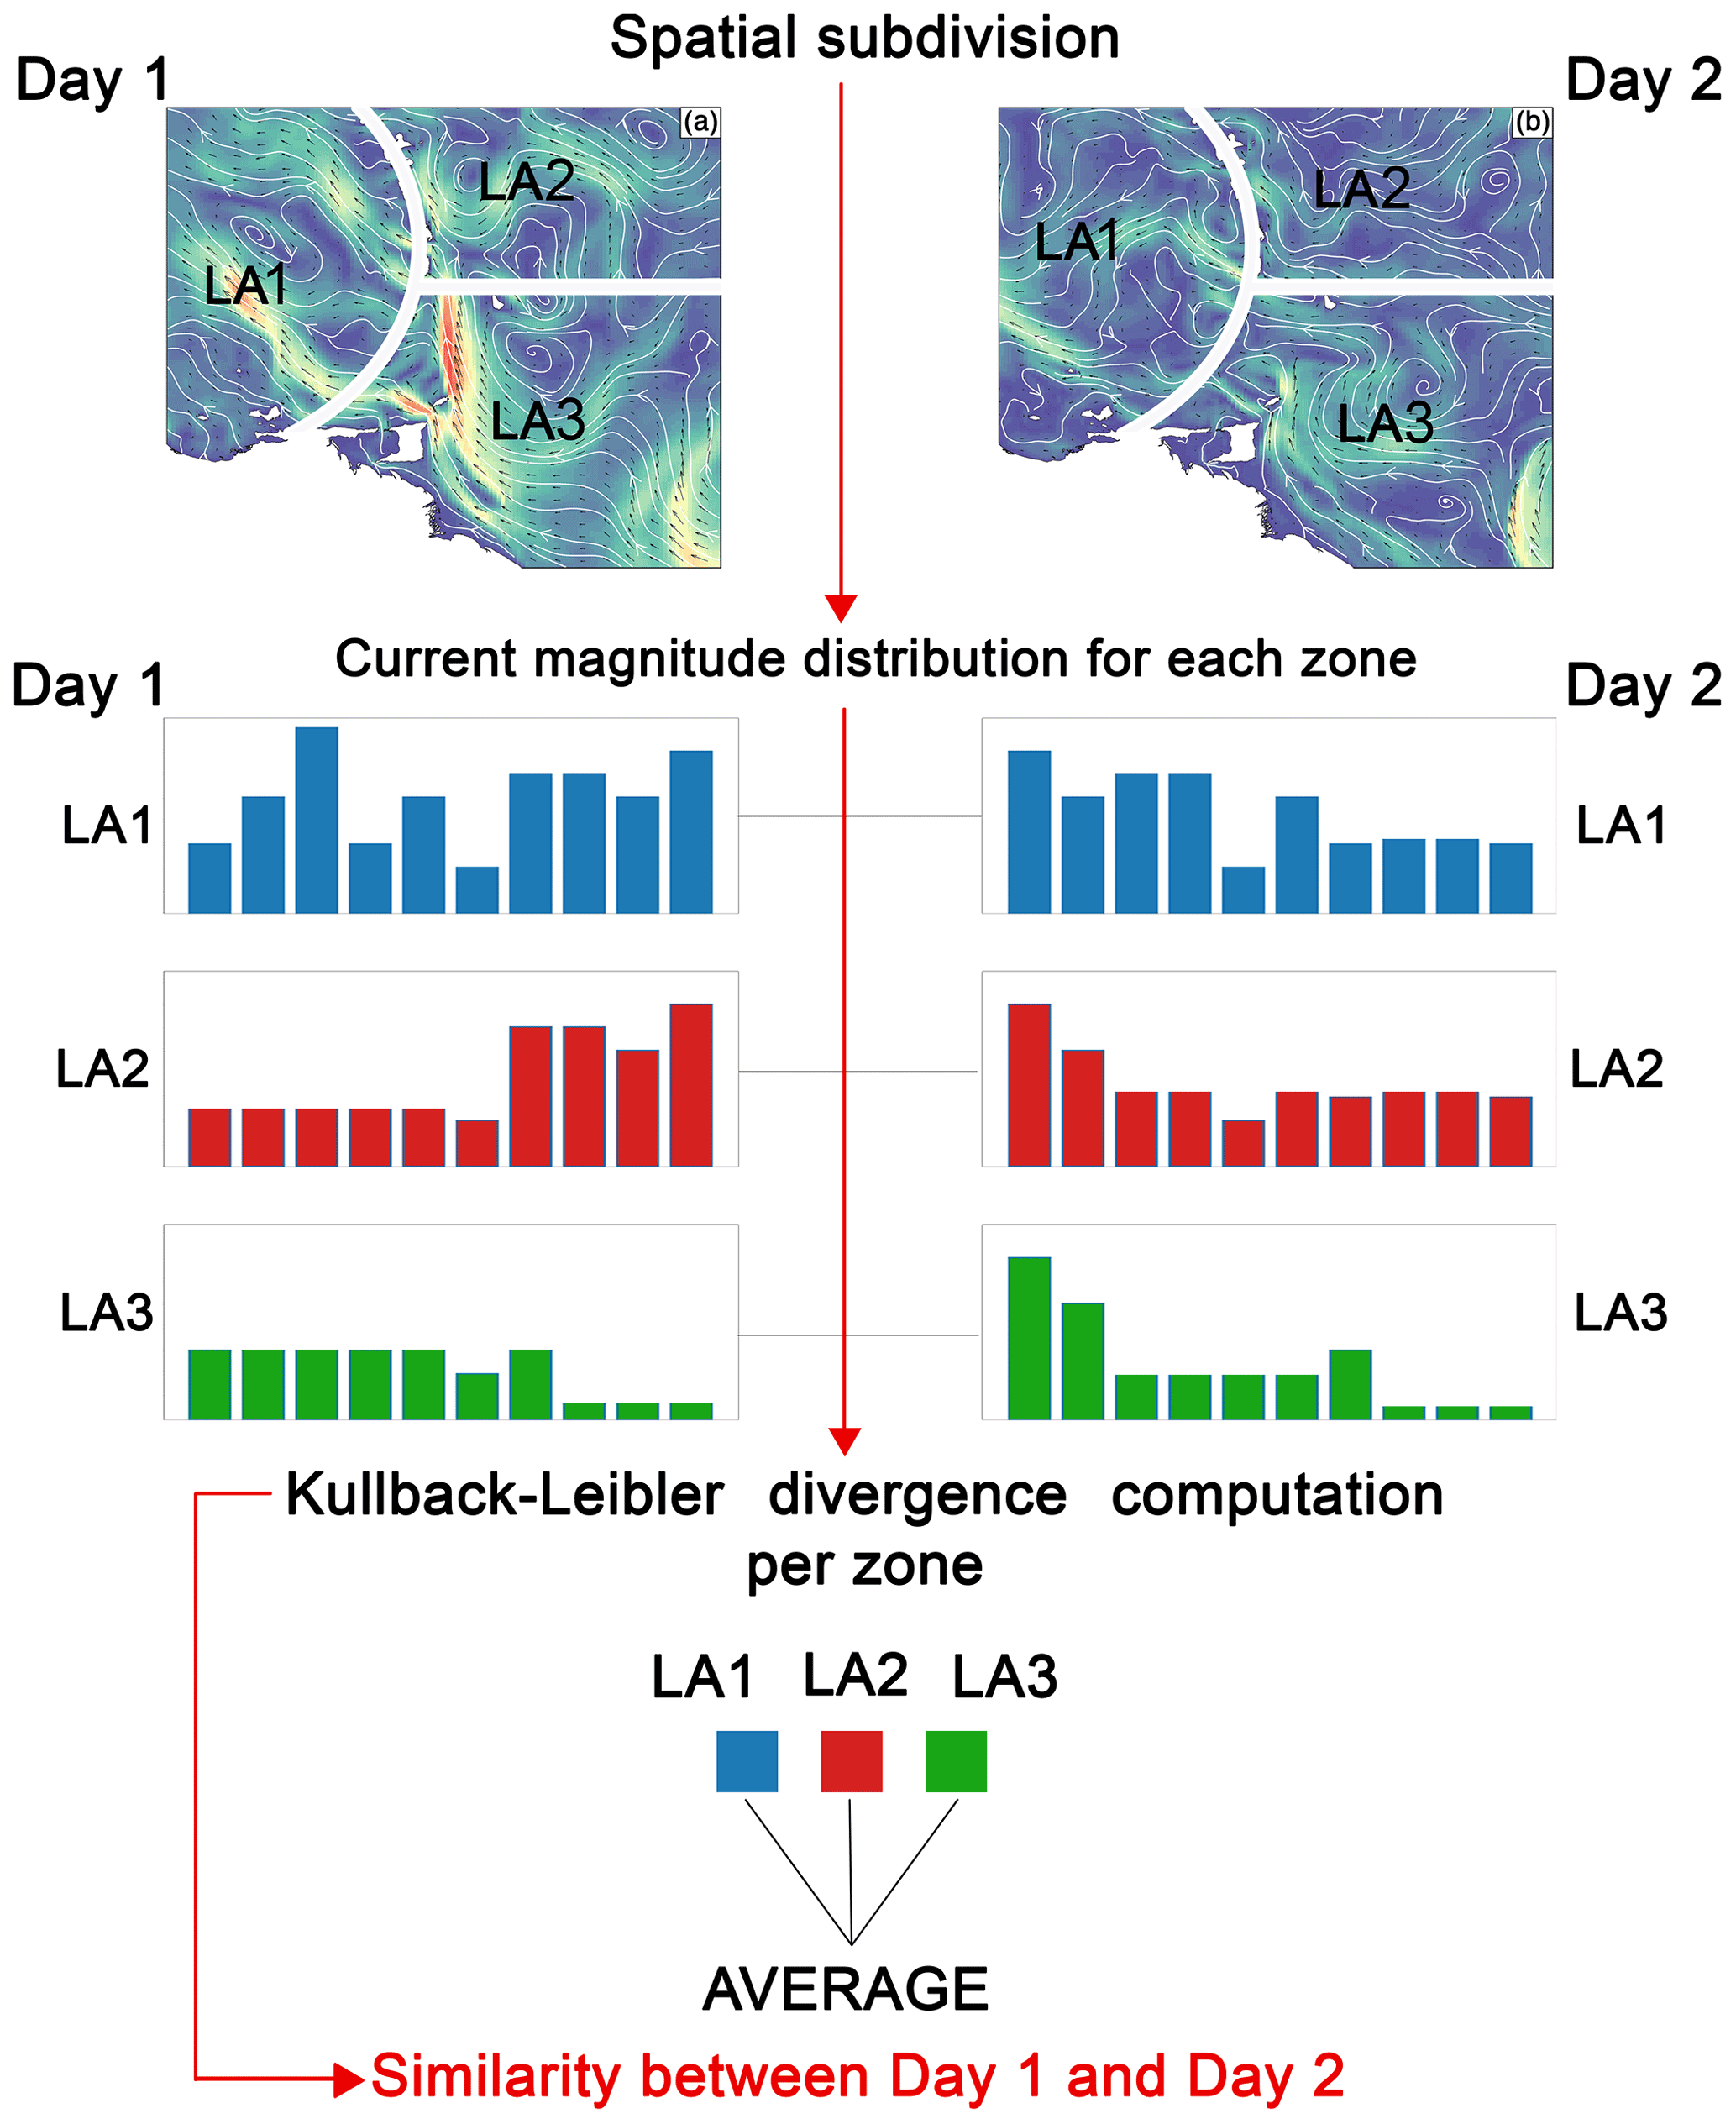
Figure 3The schematic of the expert distance process.
The clustering results were evaluated using the silhouette index (Rousseeuw, 1987). The silhouette (SaMk) index defined in Biabiany et al. (2020) was used. This allows expressing the quality of a clustering by the average of the quality of each cluster, which is itself the average of the silhouette indices s(i) over the cluster elements. This index is defined as follows:
where k is the number of clusters, Cj the set of days from the cluster j, i a day from Cj, and s(i) the silhouette index (Rousseeuw, 1987) value of day i.
The current pattern clusters obtained are related by a set of days in common. Match percentages were calculated using the following formula:
where p(m,h) is the percentage of correspondence between cluster Cm and cluster Ch derived from Mercator and HYCOM datasets, respectively. N(m, h) is the number of days shared by these two clusters.
2.7 Clustering analysis on current sequences leading to beachings
To better understand current dynamics which may lead to Sargassum beaching in Guadeloupe, we analyzed the 30 d current sequences before beaching. The 30 d duration corresponds to the empirical transport time of a passive particle moving from the main entrance location of Sargassum rafts in the Lesser Antilles area (i.e., in LA3 zone; 8∘ N, −55∘ E) to Guadeloupe (i.e. LA2 zone). Based on the mean current magnitude of 0.2 m s−1 (average value over the LA zone in HYCOM and in Mercator data) and the distance of 500 km between the main entrance location and the Guadeloupe coasts, 29 d are obtained for the transport. For simplicity, the duration of 30 d was selected instead of 29 d. While 110 observed beaching days were registered between January 2019 and December 2020, only 107 sequences were studied here. This is explained by the fact that beaching days registered in January 2019 were removed to avoid the sequences missing data in the December 2018 period. These 107 beaching sequences were examined with HYCOM fields. Dissimilarities between these sequences were calculated before dividing the sequence dataset into several groups using a hierarchical classification (Larmarange et al., 2015). The longest common subsequence (LCS) method was used to compute the distances between the sequences (Elzinga and Struder, 2015; Studer and Ritschard, 2016). A dendrogram was calculated using Ward's algorithm (Ward, 1963). The highest relative inertia loss criterion allowed determining the optimal number of partitions (TraMiner package; Gabadinho et al., 2011). The stages of this clustering process are summarized in Fig. 4.
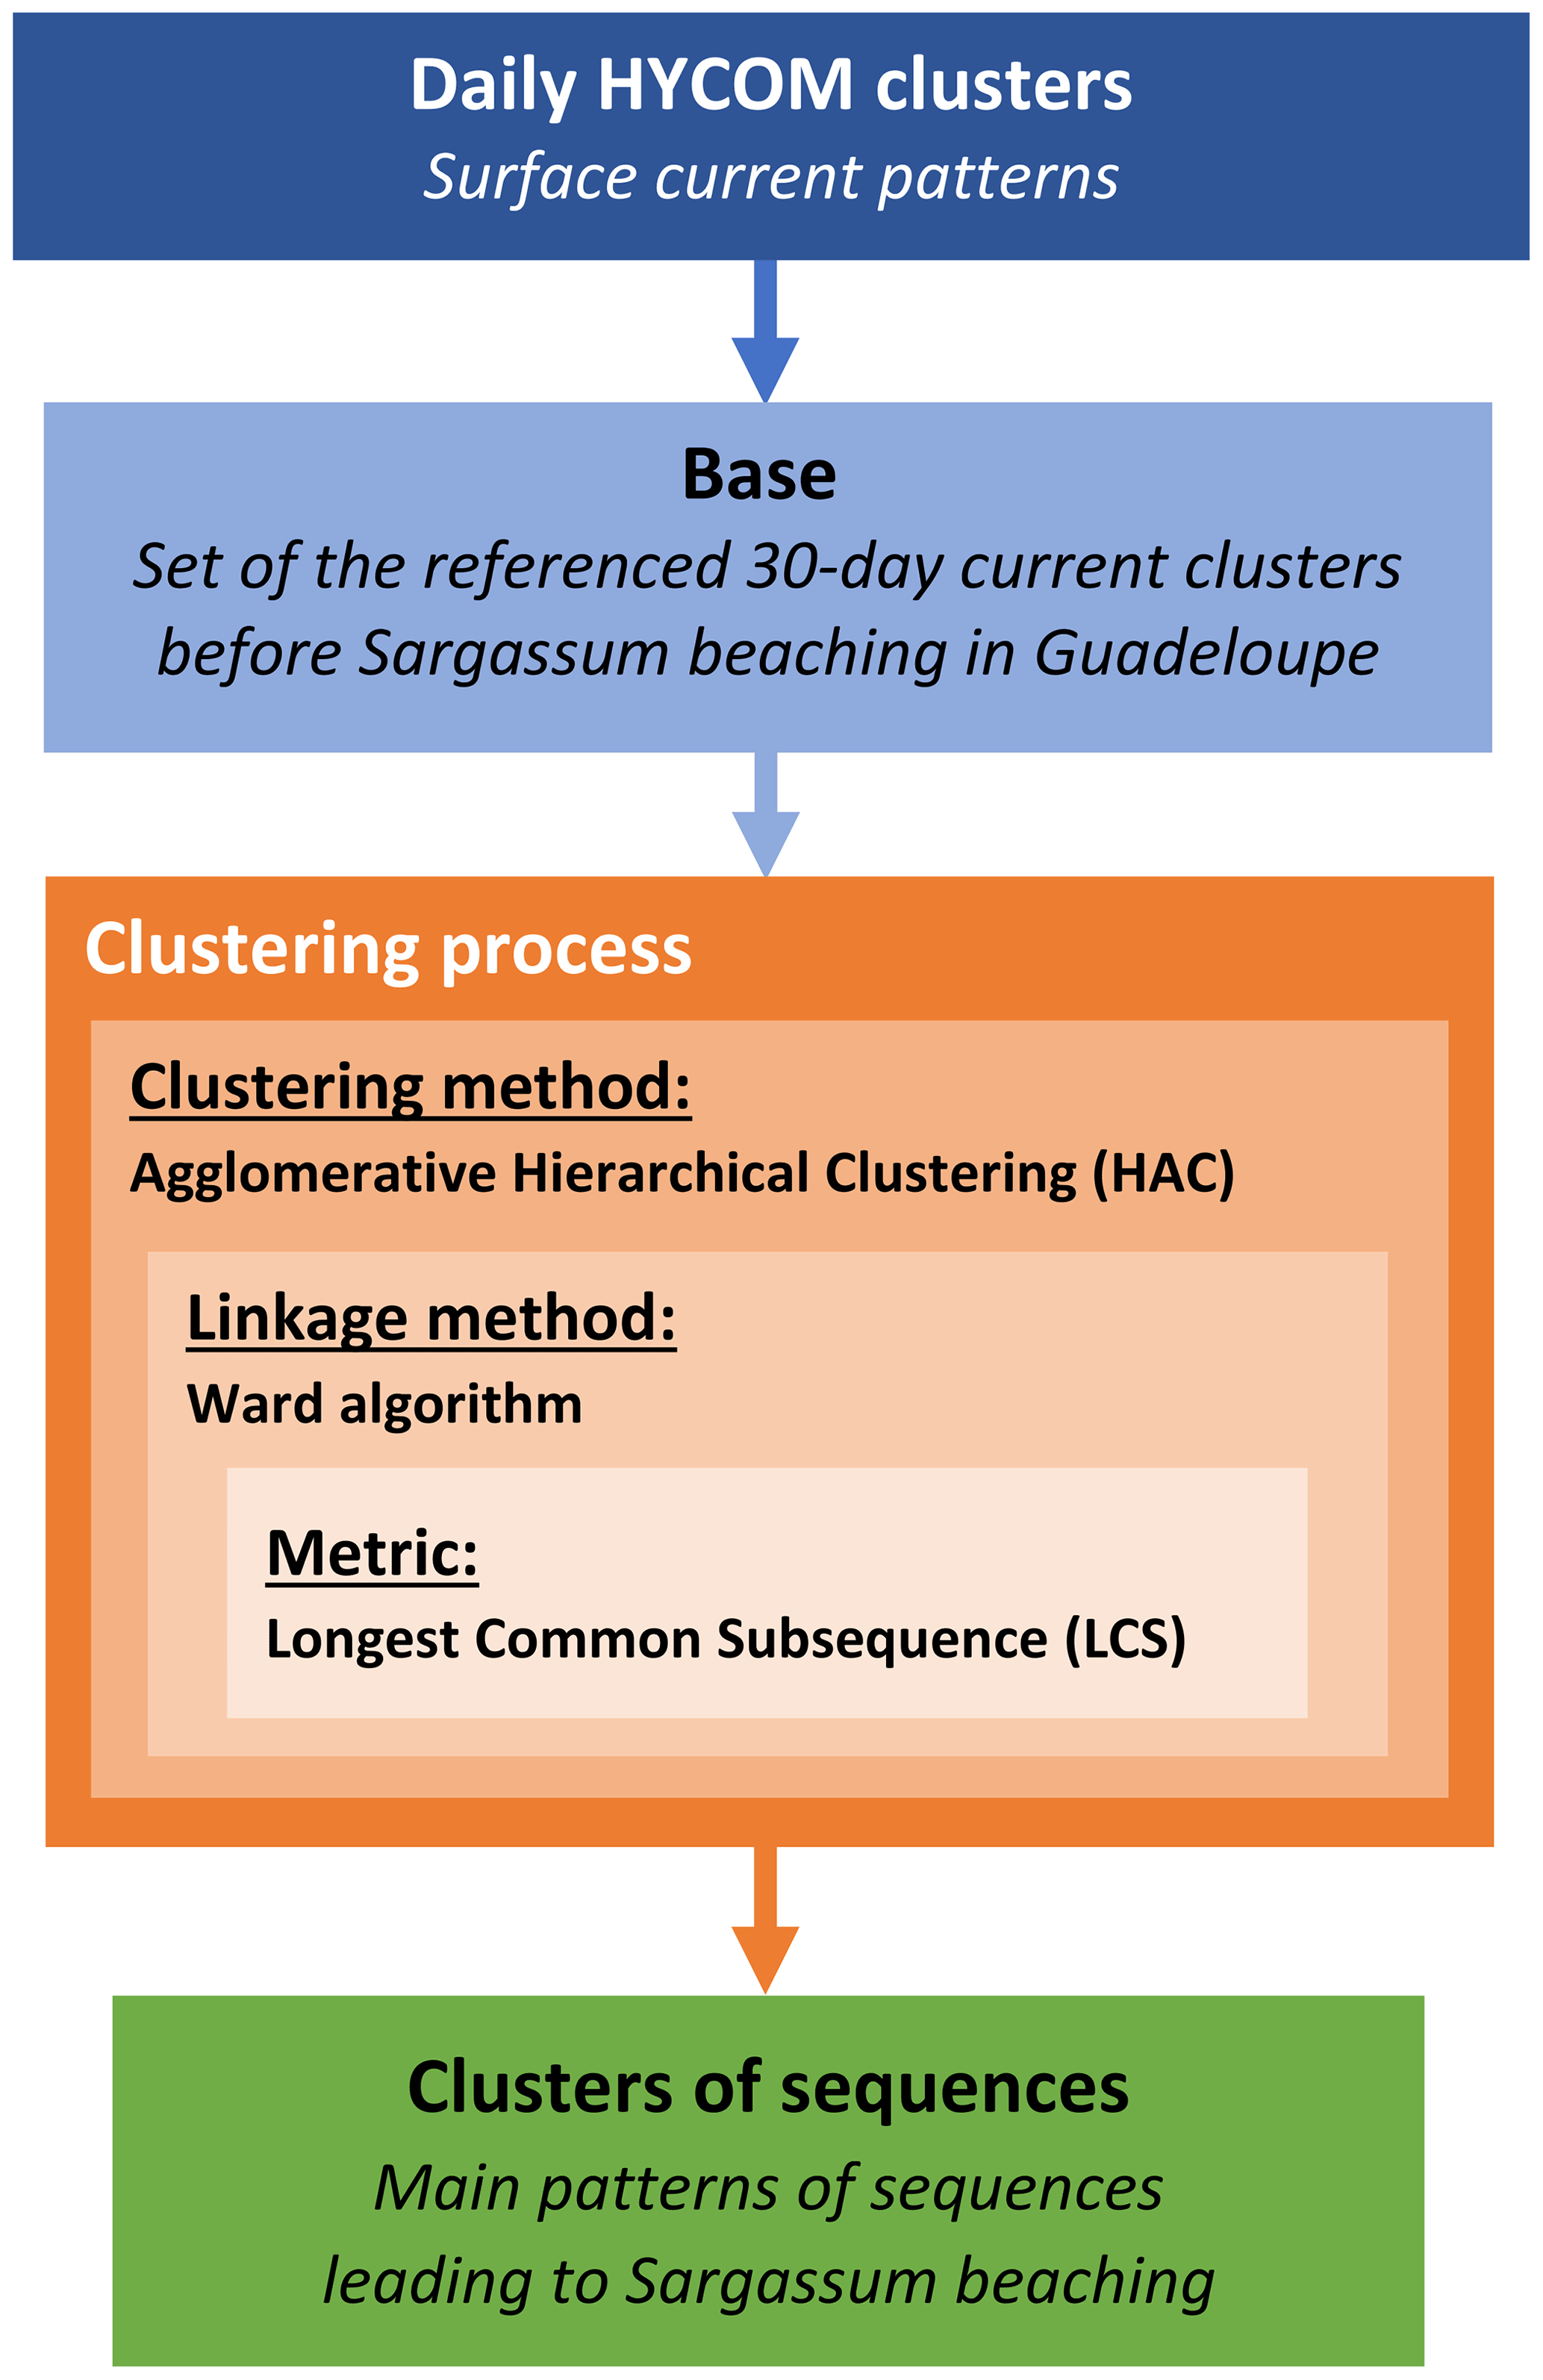
Figure 4The schematic of the clustering process used on the ocean current sequences leading to beachings.
2.8 Decision support system
To determine the probability of Sargassum beaching, a decision tree was built using complementary elements called “modules” (Fig. 5). Each module generates information based on input data including surface currents (Mercator and HYCOM) with windage effects (ERA-5) and past observations of beachings in Guadeloupe. Thus, for a given day, the proposed system works as follows.
-
Module A takes as input the week number of the selected day and returns the associated daily probability to reach the maximum offshore abundance of Sargassum (based on observational FA density values during the 2 years 2019 and 2020).
-
Module B assigns a cluster number to the focused day after the ED clustering of the daily surface currents. Then, from this day, it builds empirical sequences of numbers between 1 and 4 (type of cluster) over a period of the past 30 d.
-
Module C takes as input the daily cluster number produced by module B and returns the probability (frequency) of beaching associated with the type of cluster. This probability is calculated, by cluster type, from the beachings observed on the coasts of the Guadeloupe archipelago. The system has 107 30 d current sequences before beaching. These sequences start on the day of beaching on the coasts of Guadeloupe. This set of referenced 30 d current sequences before beaching is called BASE (Fig. 5b).
-
Module D compares the sequence of the given day to the referenced current sequences before beaching with Jaccard distance. Module D is interconnected to BASE and module B. It returns the percentage of correspondence between them.
In the literature, the average of the different modules is often used as the decision operator (Bo et al., 2020; Swain and Hauska, 1977). In the present work, the percentage of beaching for a given day was determined using the percentages provided by modules A, C, and D, according to the following formula:
where P(i) is the quantity used in the design of the decision rule. This rule is simply the linear combination of the percentages from modules A, C, and D, calculated according to
where j∈R. The set of past days (2019–2020) and DECISION(i) is a (logical) response of the decision tree for a given day, i.e., expressed in binary form.
The proposed tree in Fig. 5 was tested for the full year of 2021 except 31 December 2021, which was not included because of missing data, giving a total of 364 tests. The performance assessment of the decision support system was conducted for each decision day and three temporal uncertainty ranges around this day: ± 1, ± 2, ± 3 d.
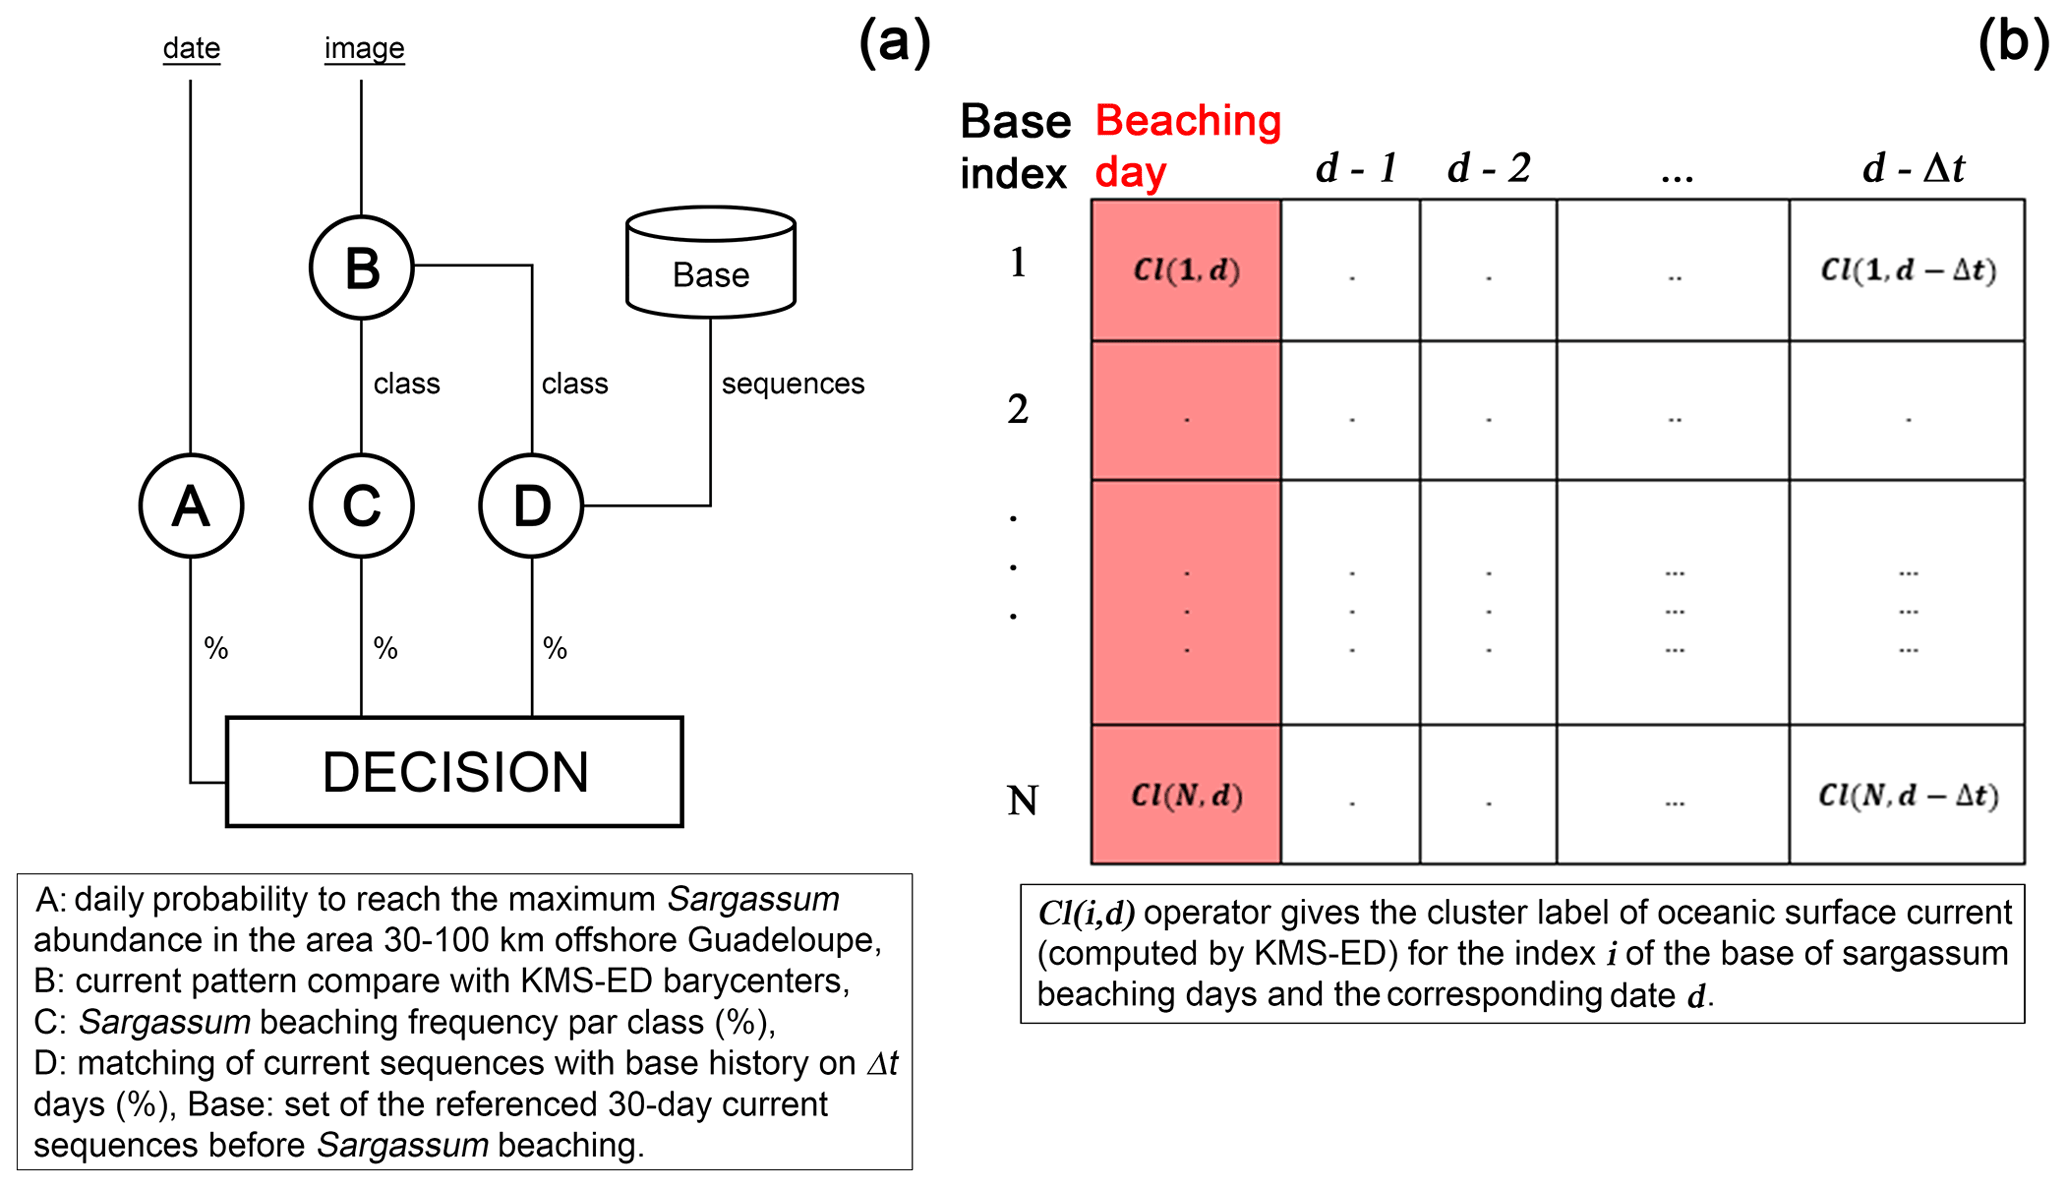
Figure 5(a) Scheme of the decision tree classifier to predict Sargassum beaching probability. (b) Combination base of oceanic current cluster labels obtained by KMS–ED from each beaching day to Δt days before.
3.1 Surface current patterns in the focused area
In view of the lack of studies dealing with surface current patterns in the Lesser Antilles area, a preliminary analysis is presented here. The deciles of surface current velocities including windage are presented in Table 1. The maximum surface velocity reaches 2.49 and 2.57 m s−1, respectively, for HYCOM and Mercator. For both models 90 % of the velocity values remain below 0.65 m s−1 (the respective 90th centile values are respectively 0.6515 and 0.6458 m s−1 for HYCOM and Mercator). The Mercator data have a median of 0.28 m s−1 and a mean of 0.33 m s−1, while for HYCOM these values are respectively equal to 0.32 and 0.36 m s−1. The ratio between the first and the last decile is close to 6. Figure 6 shows skewed distributions with skewness equal to 1.31 and 1.21 for HYCOM and Mercator, respectively. A Gaussian kernel was applied to obtain these distributions. The distribution mass is concentrated on the left.
Table 1Boundaries of the histogram classes used to quantify surface current velocity data with sigma as the standard deviation.
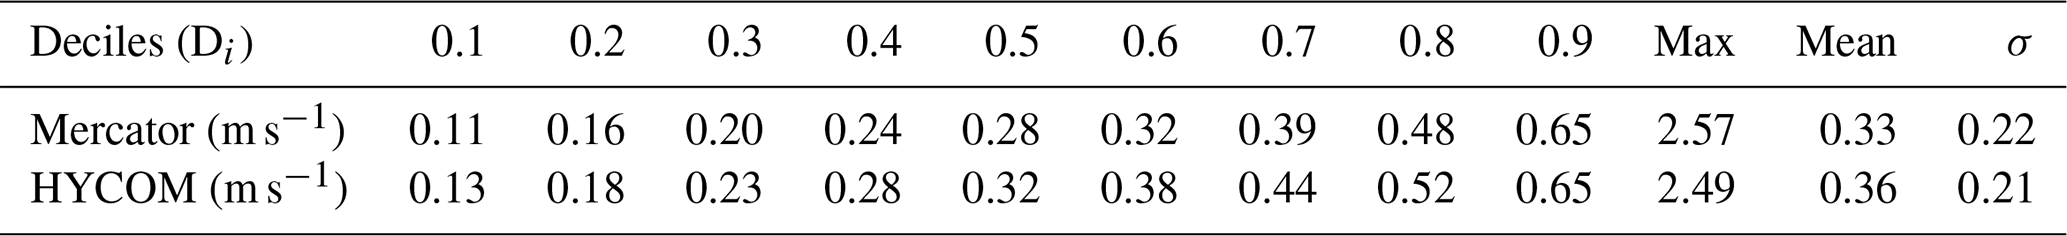
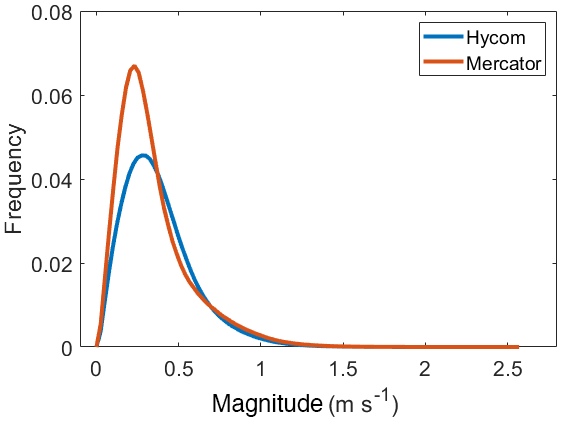
Figure 6Distributions of oceanic surface current magnitudes including windage for both models: HYCOM (blue) and Mercator (red) datasets.
To assess the contribution of each of the three regions (i.e., LA1, LA2, LA3) to the deciles, the relative frequency against the decile thresholds given in Table 1 is shown in Fig. 7. Three different shapes can be seen. In the Caribbean Sea, the LA1 relative frequency distributions from HYCOM and Mercator are almost horizontal, indicating a quite constant contribution (∼ 3 %) over all velocity classes. In the Atlantic Ocean (i.e., in the area including LA2 and LA3), HYCOM and Mercator current speed distributions are quite similar. The frequency distributions show two opposite behaviors for LA2 and LA3. In the Atlantic northern LA part, the LA2 area, the frequency decreases with current speed. Current speeds above 0.65 m s−1 are very uncommon. On the contrary, in the Atlantic southern LA part, the LA3 area, a frequency increase is observed with maximum frequency linked to current speeds above 0.65 m s−1. These three significant specific current speed distributions associated with LA1, LA2, and LA3 confirm the need to separate these three areas in the ED metric clustering process.
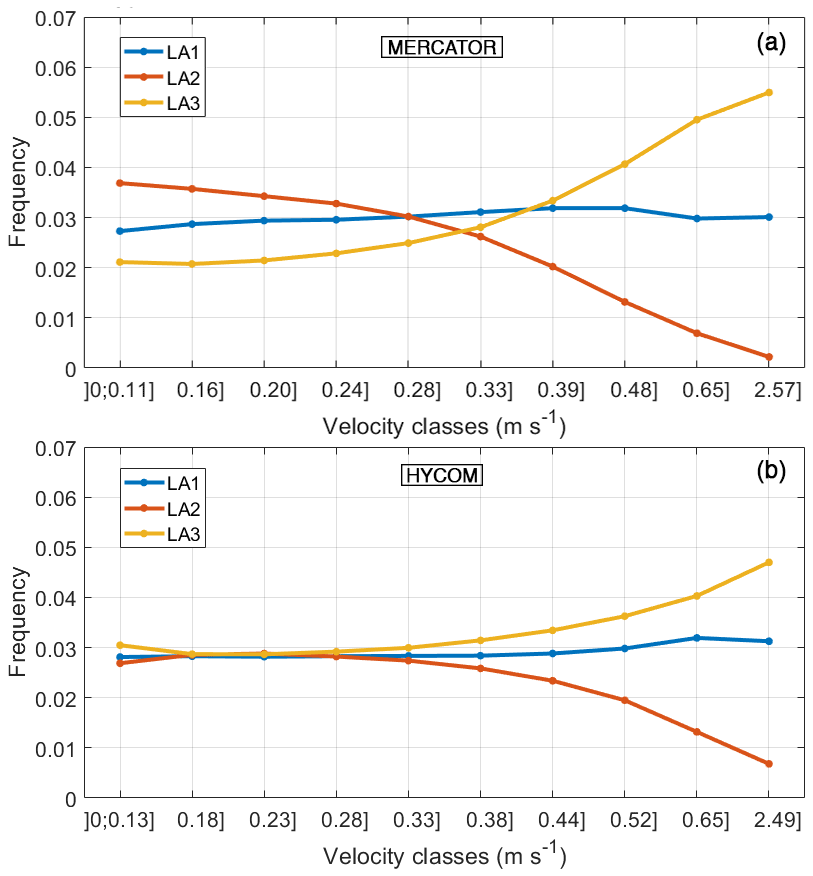
Figure 7Relative frequency distribution of current speeds for the three offshore subregions around the Lesser Antilles (2019–2020): LA1 (blue), LA2 (red), LA3 (yellow). (a) Mercator with ERA-5 windage and (b) HYCOM with ERA-5 windage.
The differences between HYCOM and Mercator current vectors were also examined for each grid point (Fig. 8). Globally, at open sea, the current speed differences are relatively small and remain below 0.15 m s−1. These differences between HYCOM and Mercator increase close to the islands with an average value of 0.3 m s−1. In the southern part of the LA arc, around Trinidad and Tobago, Mercator current magnitudes are globally higher than HYCOM current magnitudes. Thus, Mercator surface currents might induce higher Sargassum influx from the western central Atlantic to the Caribbean Sea in this area.
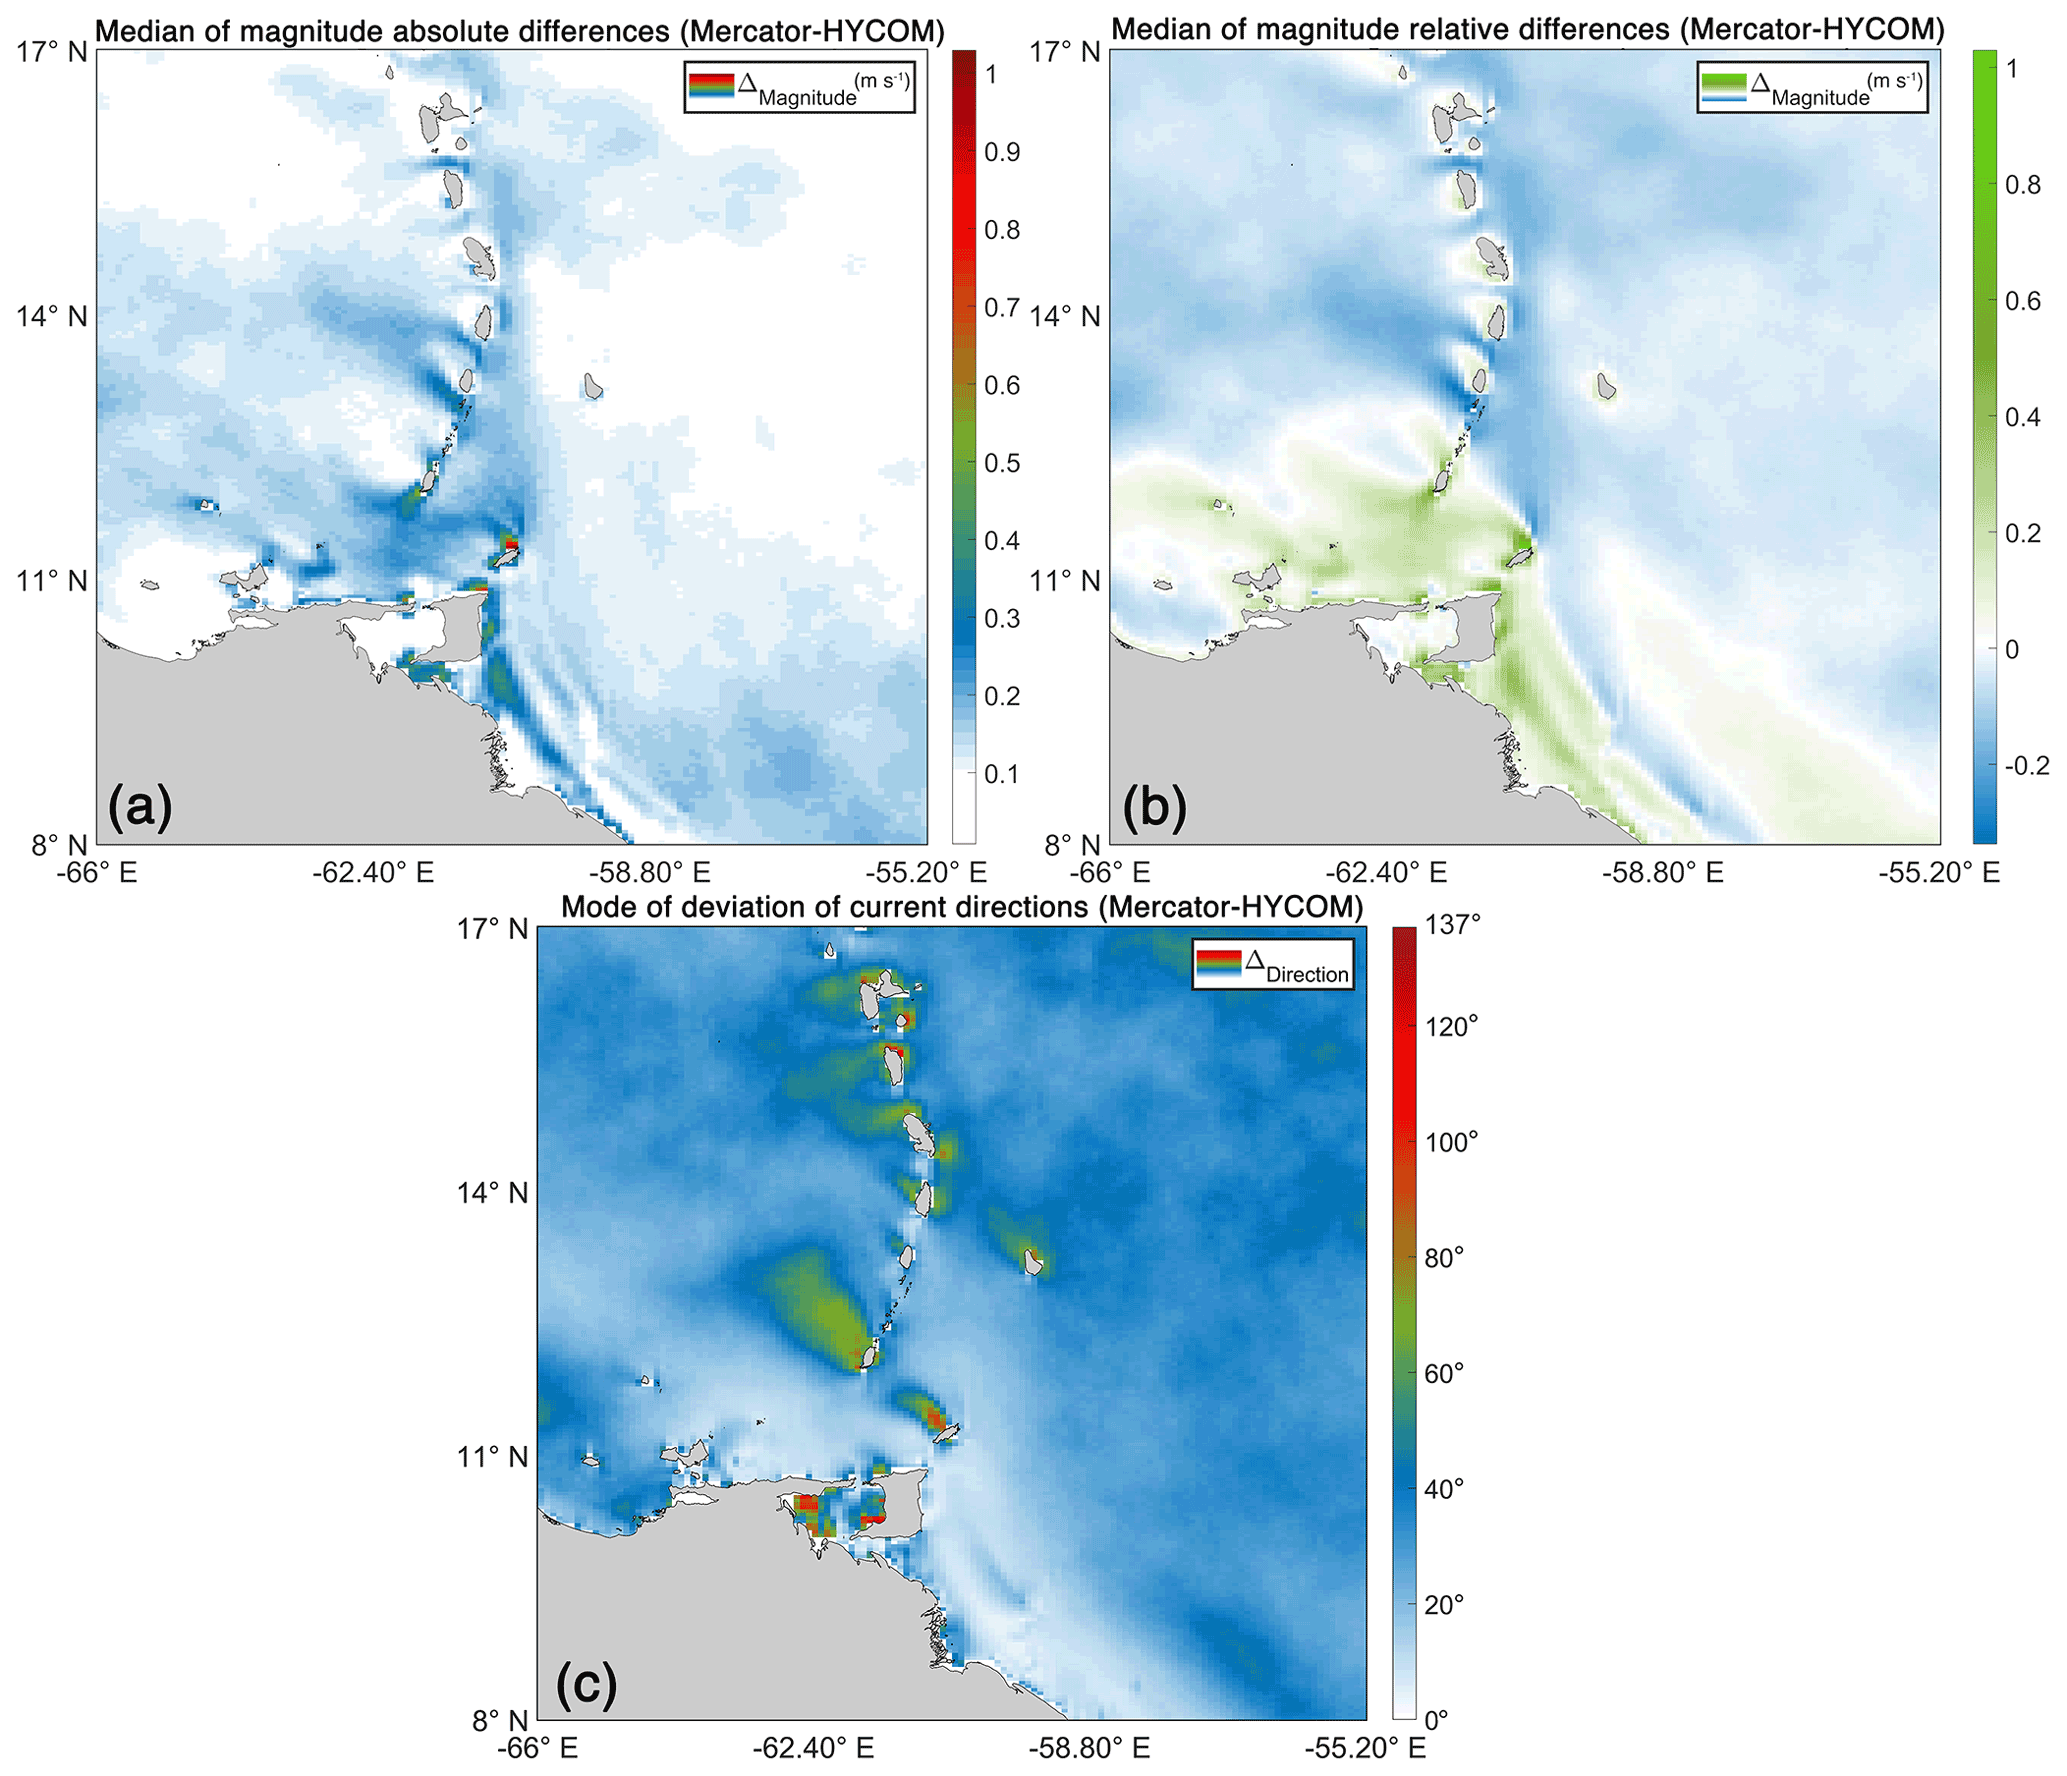
Figure 8Comparison between Mercator and HYCOM surface currents from 2019 to 2020 on the same 0.08∘ grid: (a) median of magnitude absolute differences (Mercator–HYCOM) (m s−1), (b) median of magnitude relative differences (Mercator–HYCOM) (m s−1), and (c) mode of current direction differences (Mercator–HYCOM) (degrees).
At each grid point, the angular deviations found between the medians of the surface current velocity vector directions can be divided into three magnitude groups of 45∘ intervals. The current direction differences between 0 and 45∘ are the most frequent group in the region, while those between 45 and 90∘ remain localized downstream of the islands. Finally, those above 90∘ occur exclusively around Trinidad.
3.2 Clustering analysis
To identify surface current patterns in the region and then those that lead the transport of Sargassum rafts to the LA islands coasts, clustering of the gridded data according to Eq. (1) was performed.
3.2.1 Clustering assessment
One of the known uncertainties in the K-means method is induced by the selected number of clusters. To find an optimal number of clusters and identify the best partition (Biabiany et al., 2020), the silhouette index (SaMk) evolution against the number of clusters, k, is shown in Fig. 9. The silhouette indices obtained by the KMS–ED method are in general above 0.2 for any k < 15 and remain higher than those obtained by the KMS–L2, HAC–L2, and HAC–ED methods. These values indicate that the quality of the clusters is much better with the KMS–ED method. The inflection point of the KMS–ED curve occurs for the same number of clusters, k=4, for both Mercator and HYCOM data. This highlights four representative current regimes in the studied region, respectively named MC1, MC2, MC3, and MC4 for Mercator and HC1, HC2, HC3, and HC4 for HYCOM.
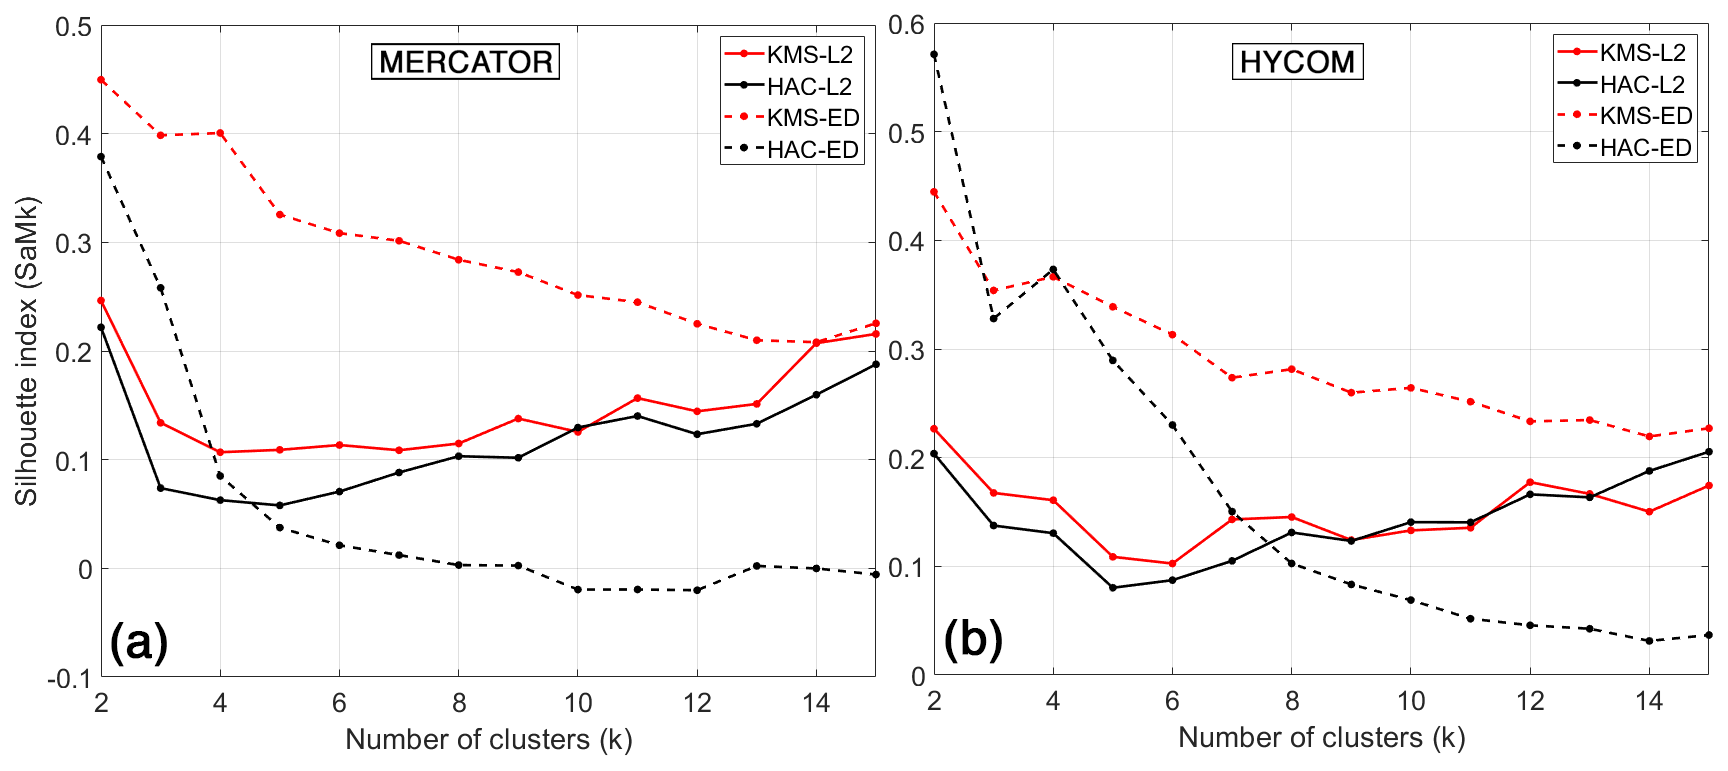
Figure 9Evolution of the SaMk silhouette index (by method) as a function of the number of clusters k for Mercator (a) and HYCOM (b): HAC method (black), KMS method (red), L2 metric (solid line), and ED metric (dashed line).
3.2.2 Visual analysis of current regimes
The four types of surface current circulation, obtained in intensity and direction, are shown in Figs. 10 and 11, respectively, for the Mercator and HYCOM analysis. The paragon which is the closest day to the centroid was chosen to represent each type of cluster. The four clusters may be distinguished by the NBC expansion and by the induced retroflection ring locations. The surface current velocities and their associated streamlines are driven by the following structures:
-
those which enter through the Caribbean Sea from the south, remaining almost parallel to the continental shelf (they occur in the LA3 and LA1 regions);
-
those due to the propagation of the eddy dynamic characteristics related to the retroflection rings of the NBC (they come from the south of the LA3 region, along the Atlantic side of the Lesser Antilles arc, before passing through the Caribbean Sea towards 12–14∘ N); and
-
those generally coming from the northeast of the LA1 and LA2 regions, representing the southern limit of the subtropical gyre, which cuts the Lesser Antilles at about 15∘ N (they keep their initial direction and are sheared by the southeast currents).
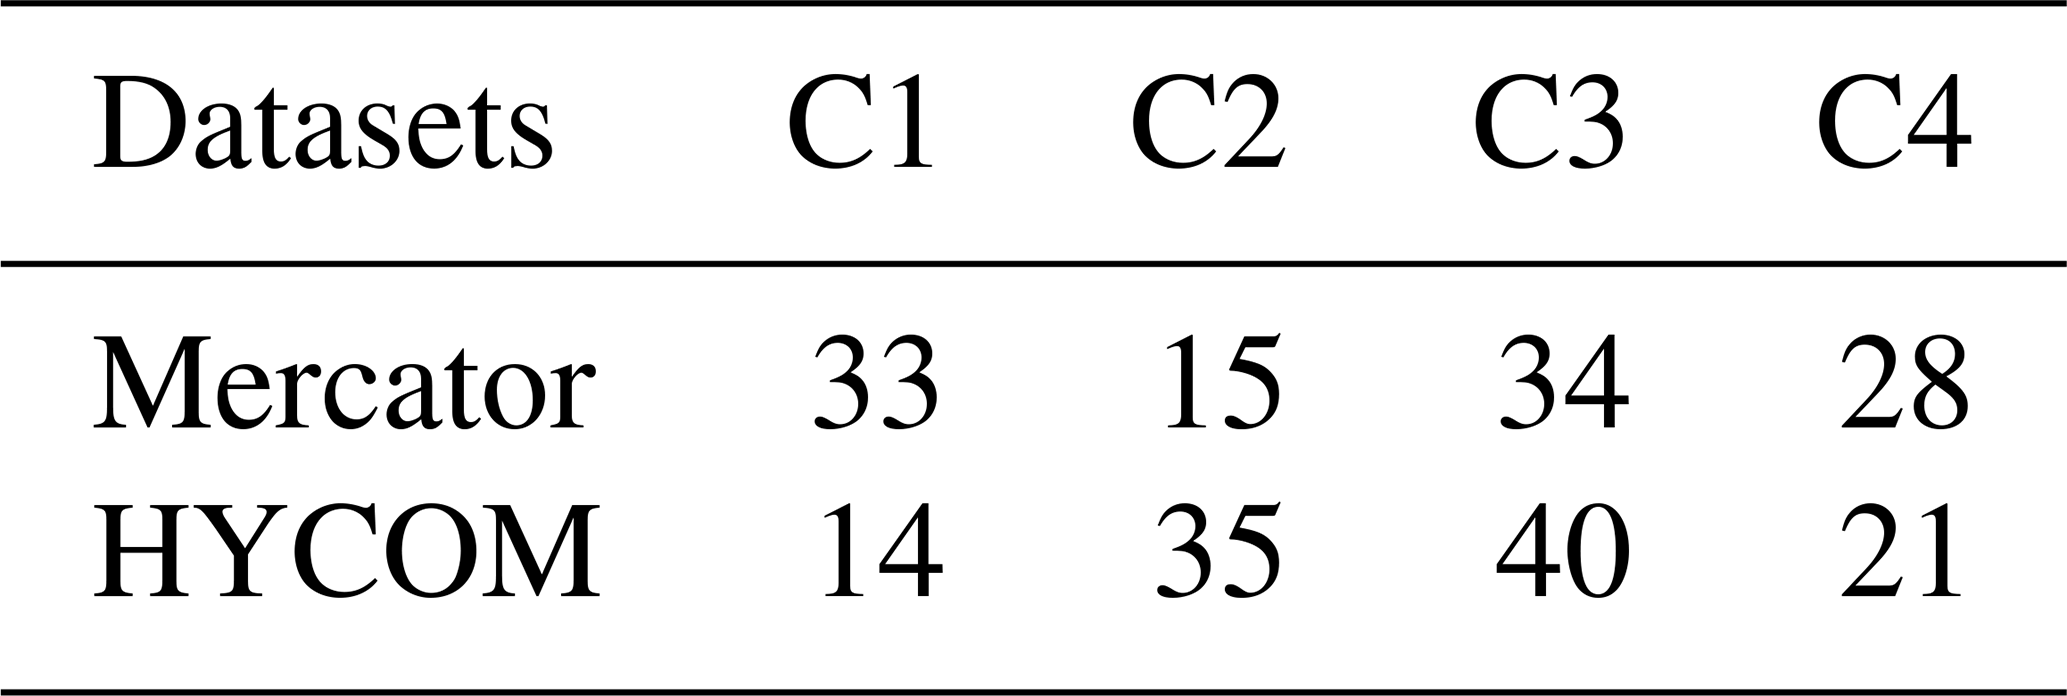
The number of days corresponding to each cluster is given in Table 2. MC1, HC2, and HC3 are the most common along the studied period. Each of them represents almost 30 % of the daily output. However, none of the four clusters really stand out. For both analyses, the differences between cluster occurrences stay lower than 10 %.
Table 2Number of days corresponding to each cluster for MERCATOR and HYCOM datasets.
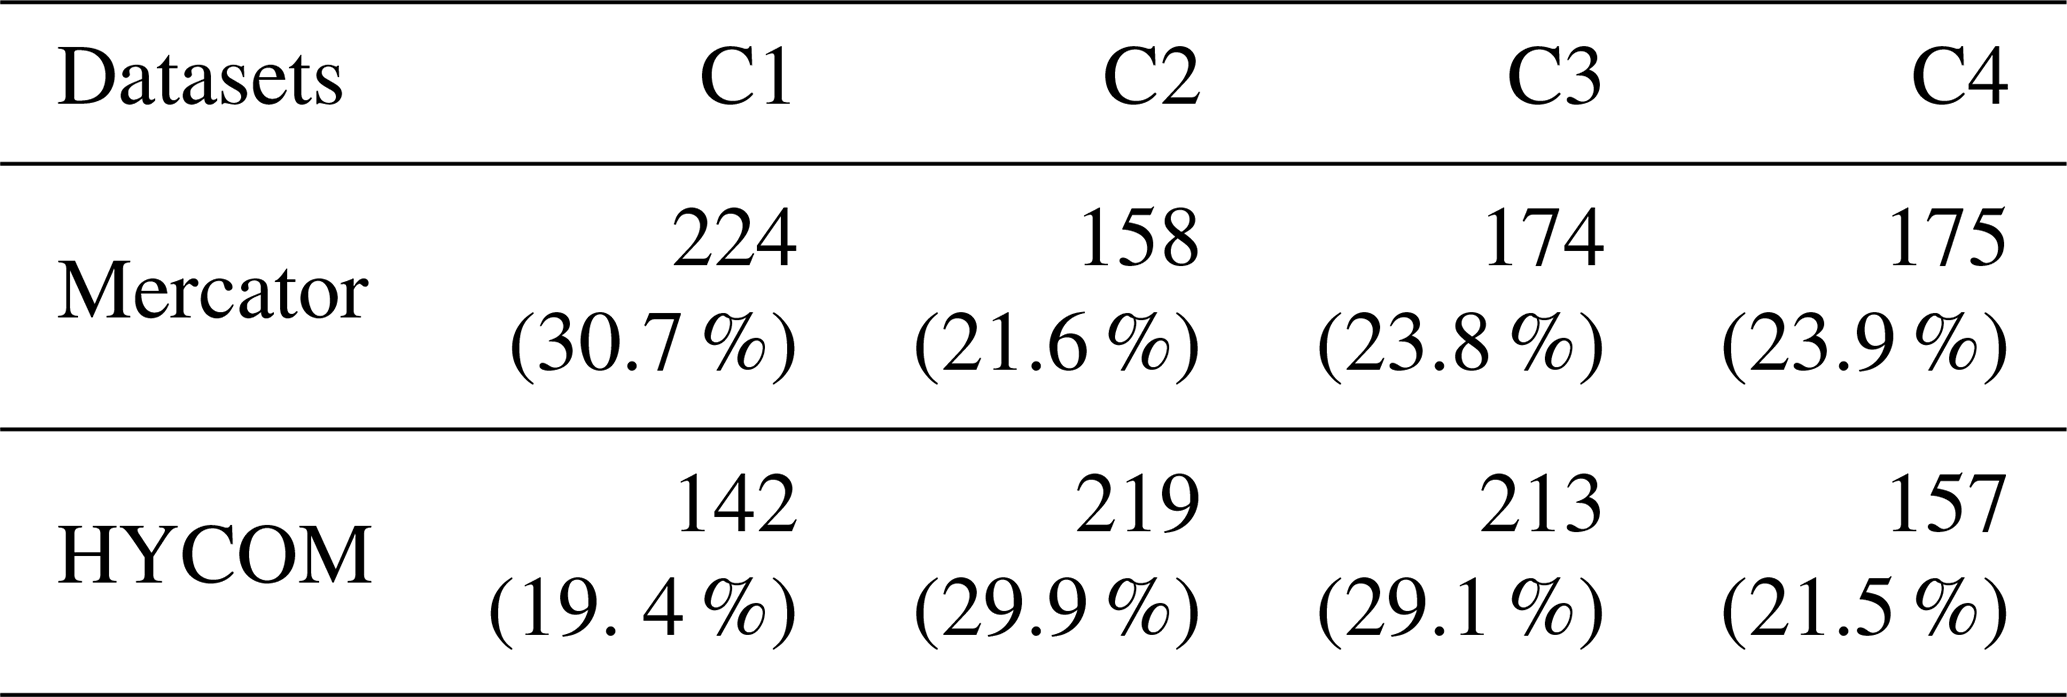
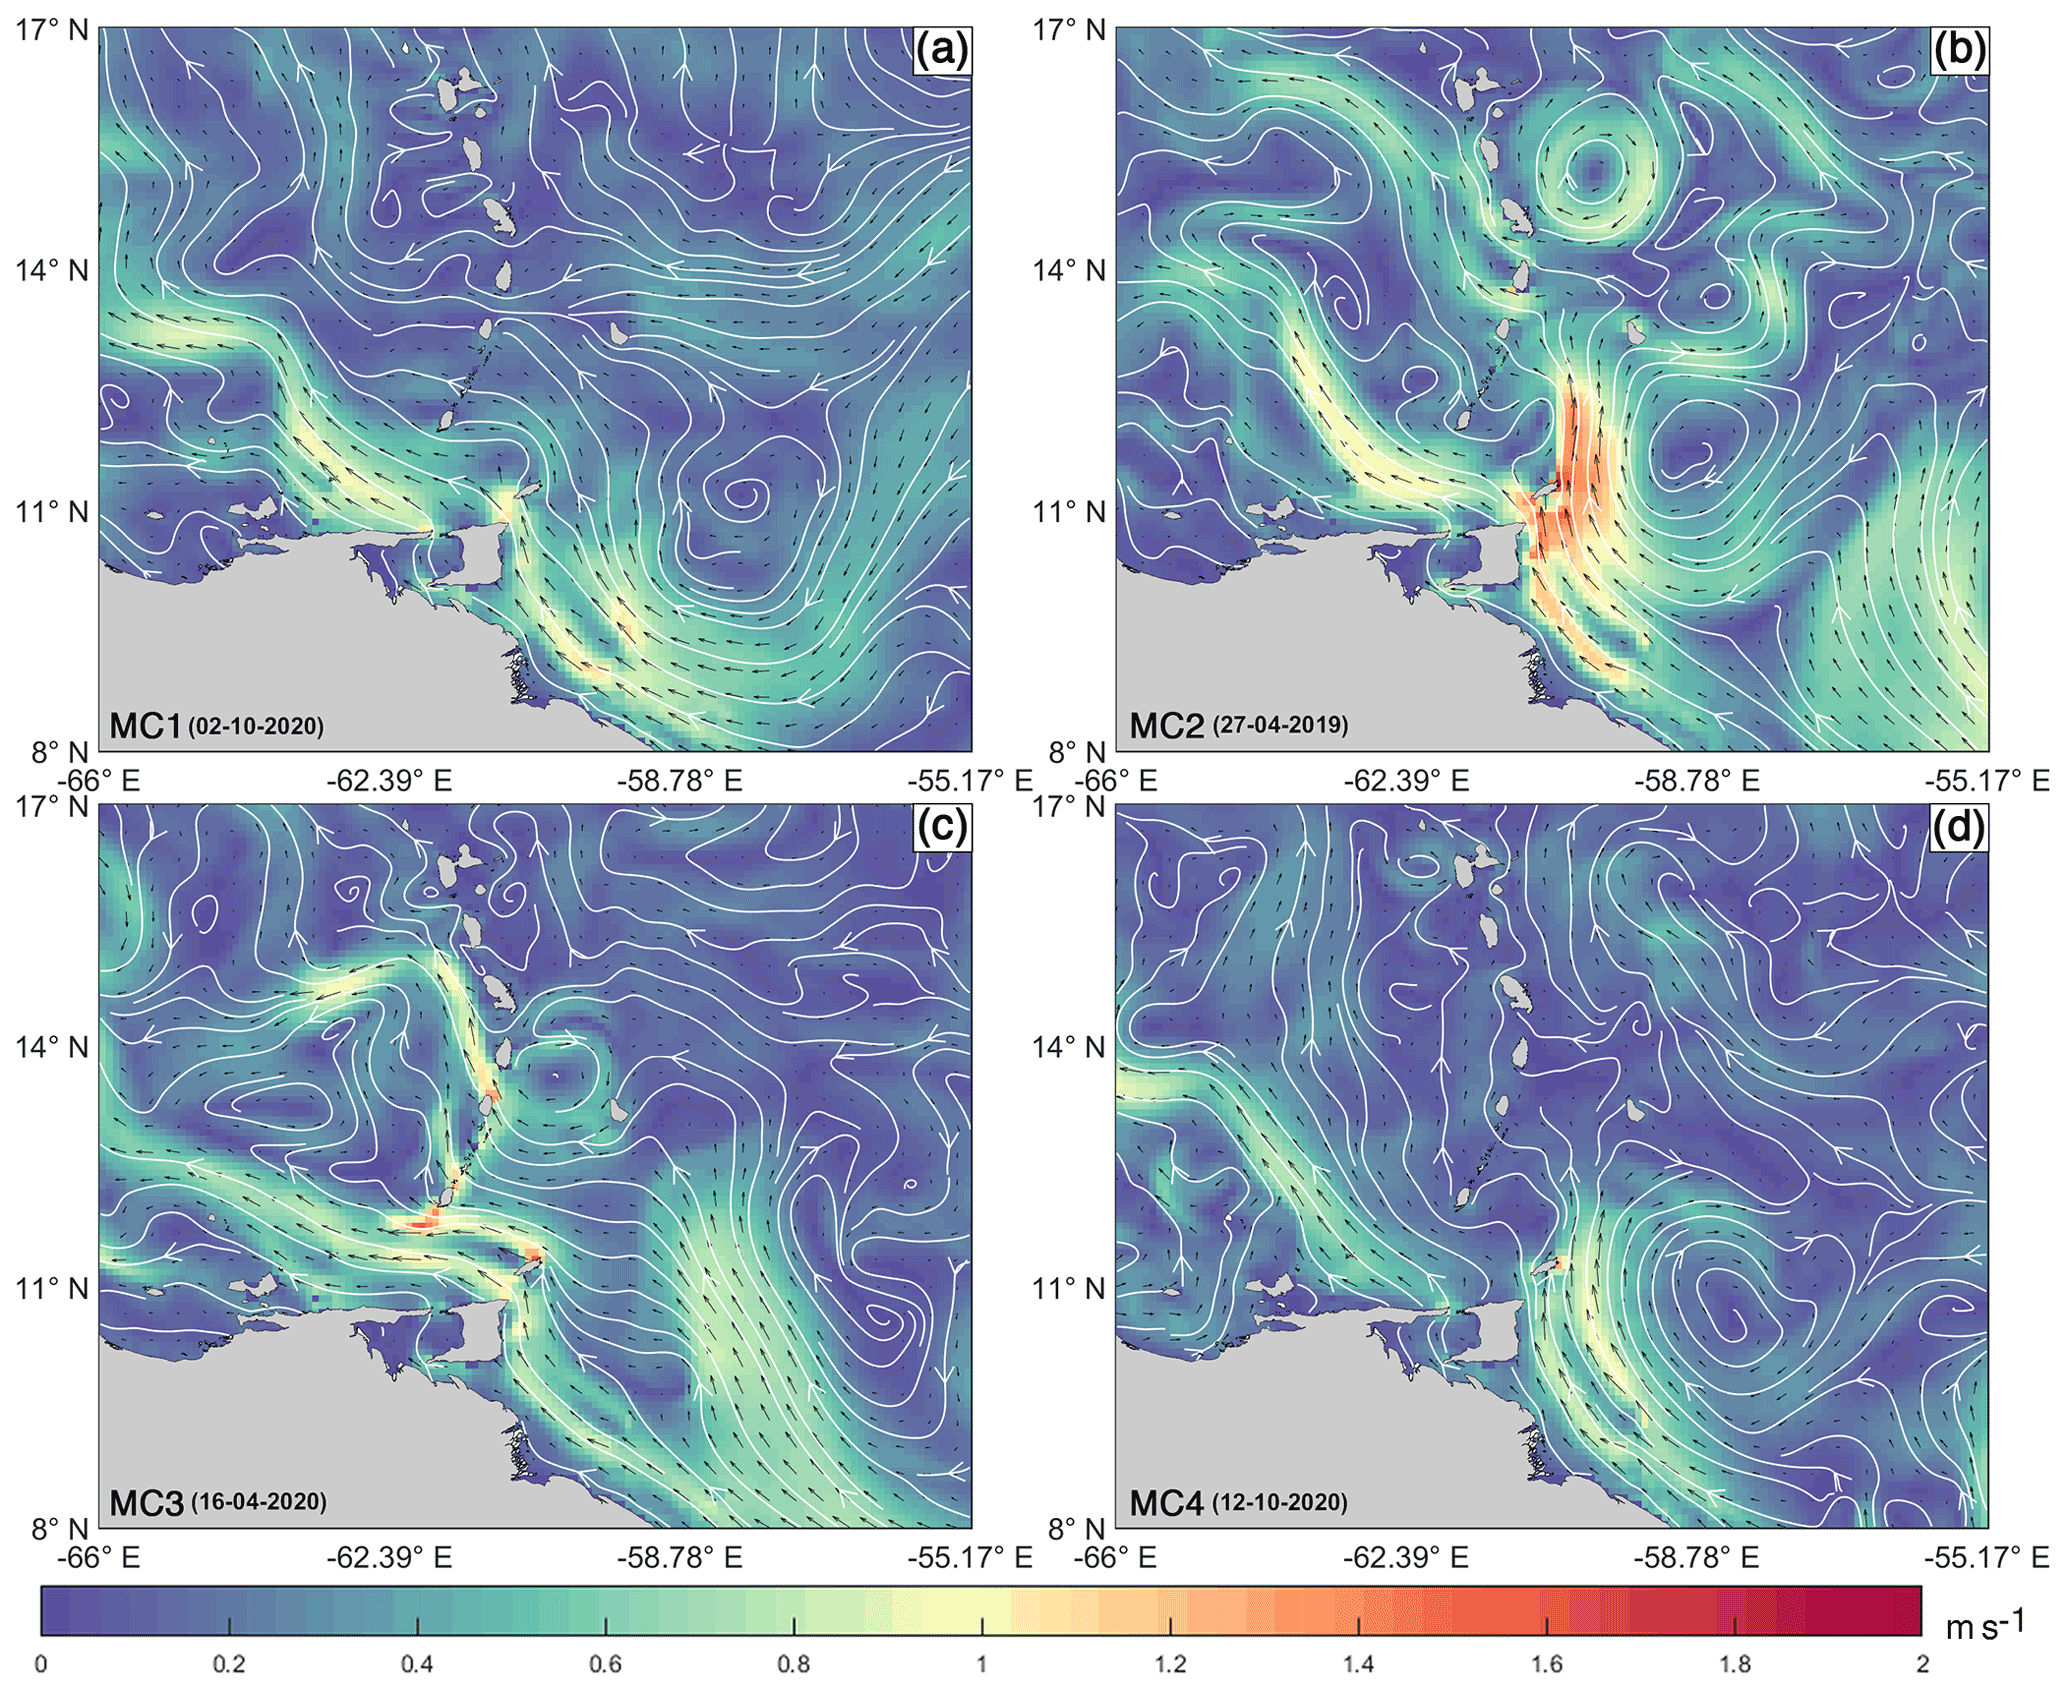
Figure 10Representative elements of the clusters from Mercator current data combined with ERA-5 windage (KMS–ED method with k=4): MC1 (day 2 October 2020) (a), MC2 (day 27 April 2019) (b), MC3 (day 16 April 2020) (c), MC4 (day 12 October 2020) (d).
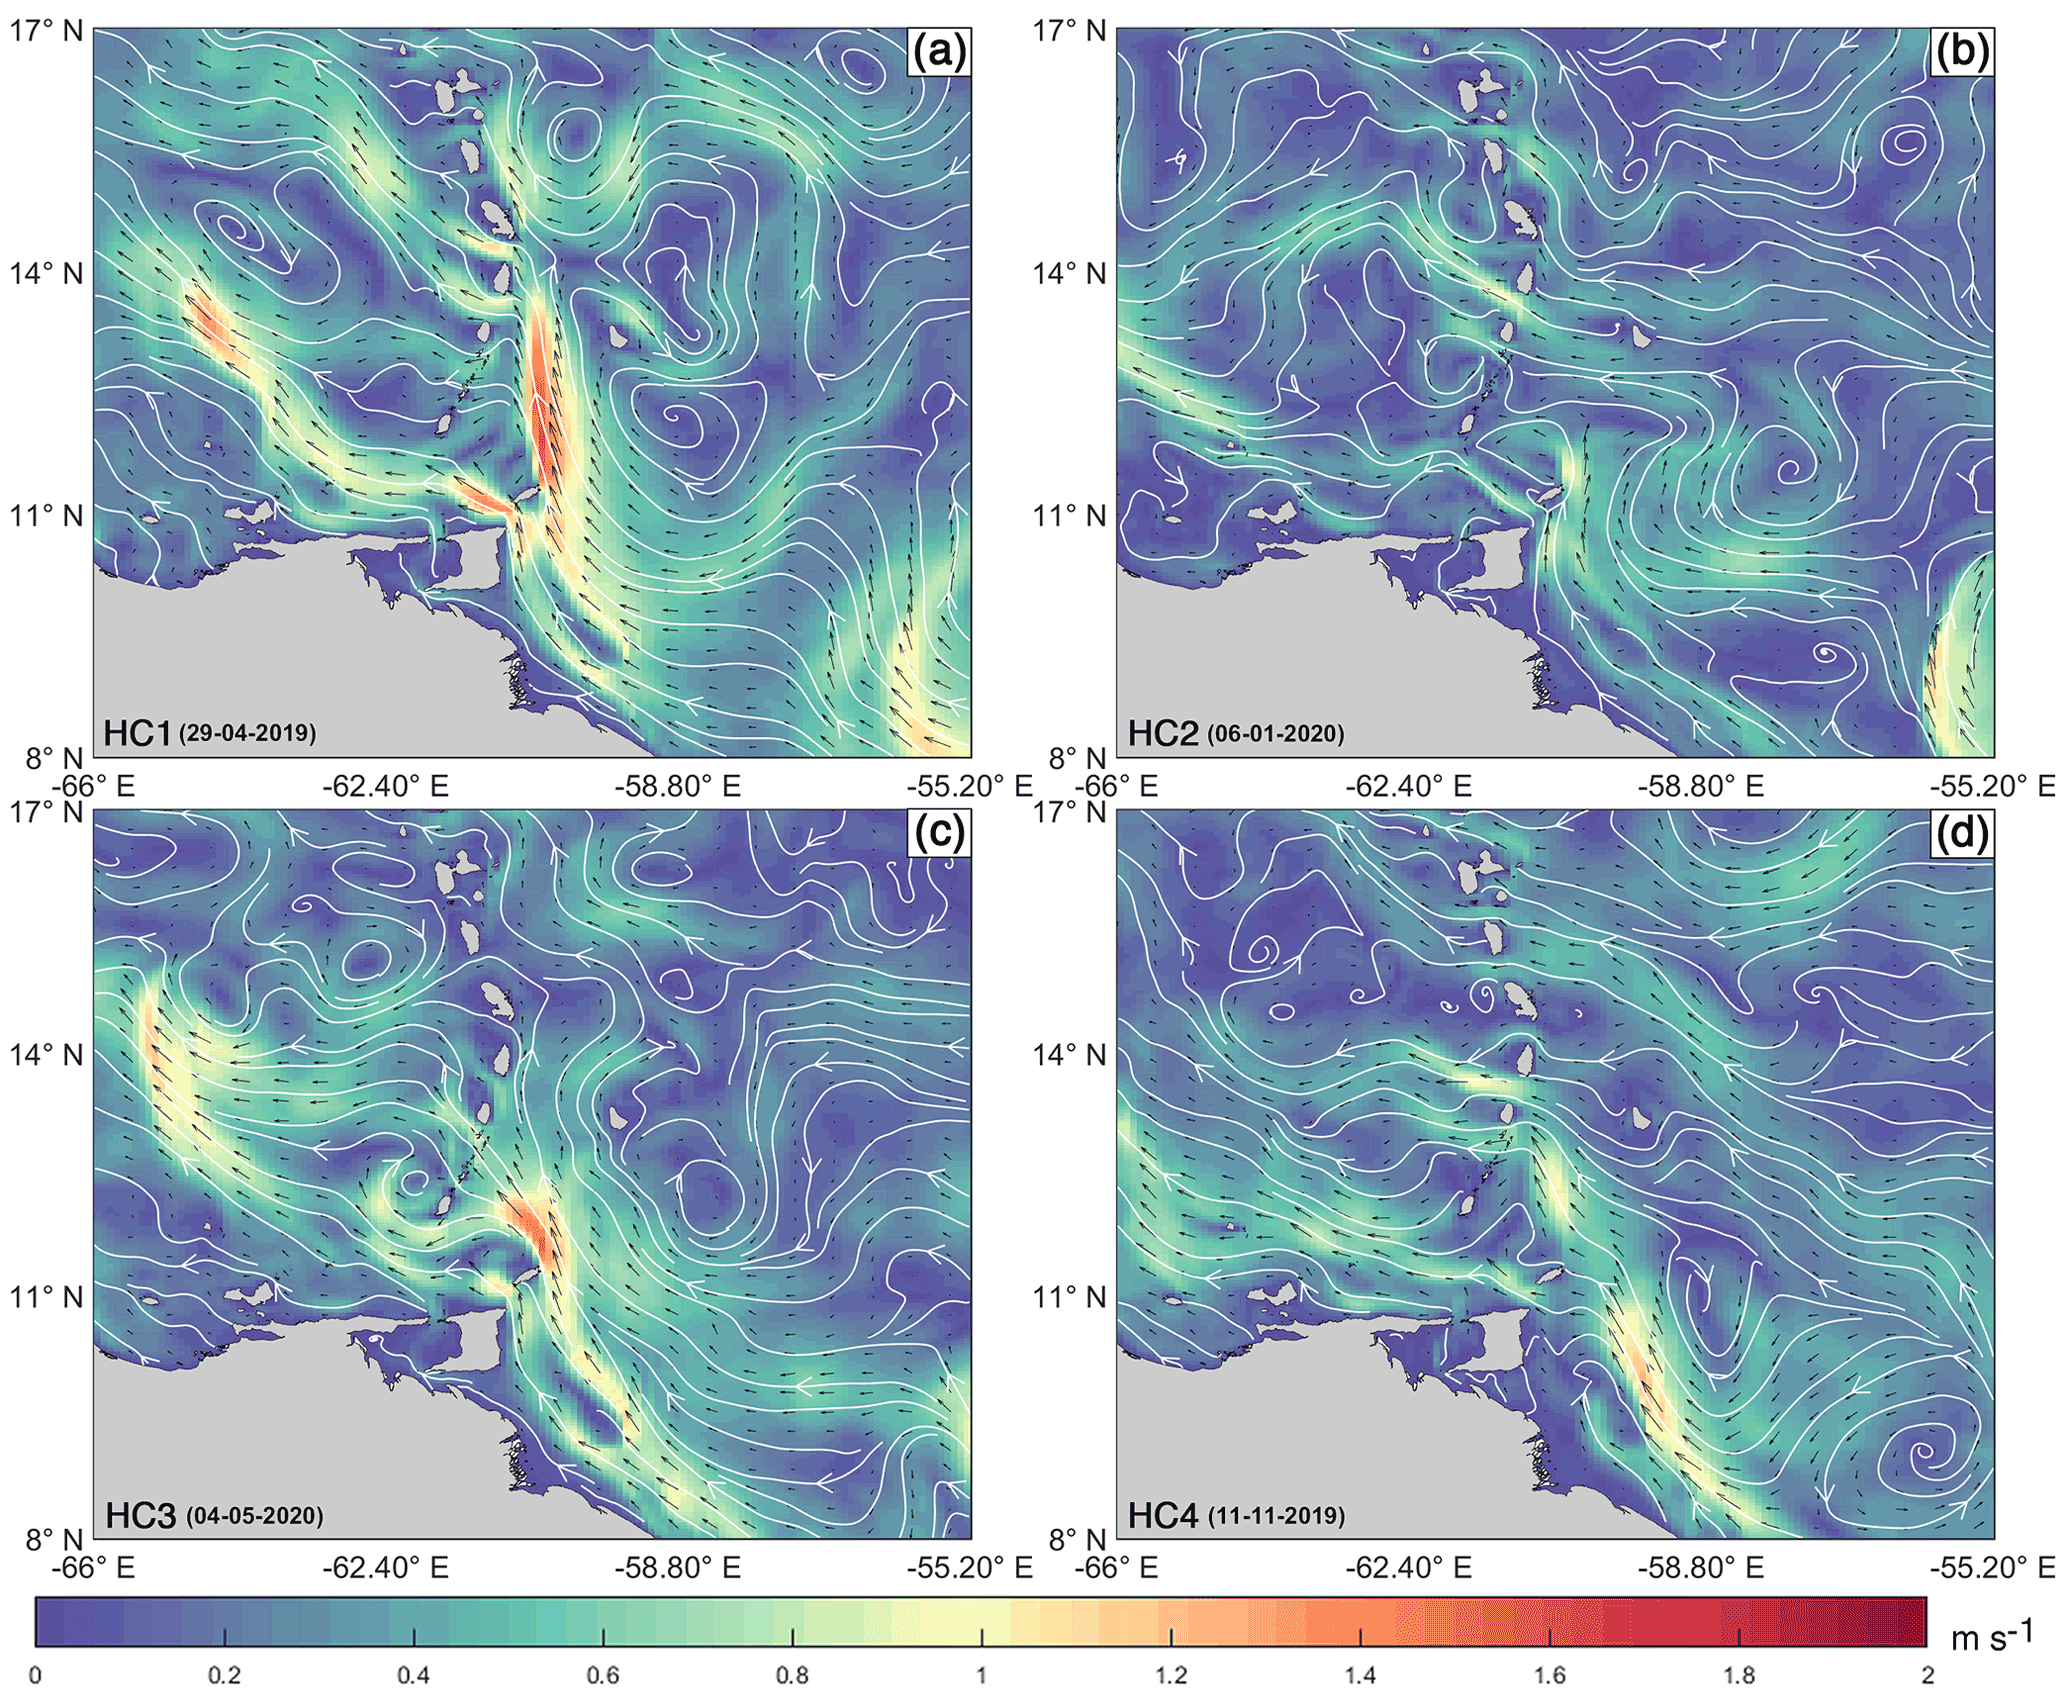
Figure 11Representative elements of the clusters from HYCOM current data combined with ERA-5 windage (KMS–ED method with k=4): HC1 (day 29 April 2019) (a), HC2 (day 6 January 2020) (b), HC3 (day 4 May 2020) (c), HC4 (day 11 November 2019) (d). The HYCOM cluster numbering differs from the Mercator cluster numbering.
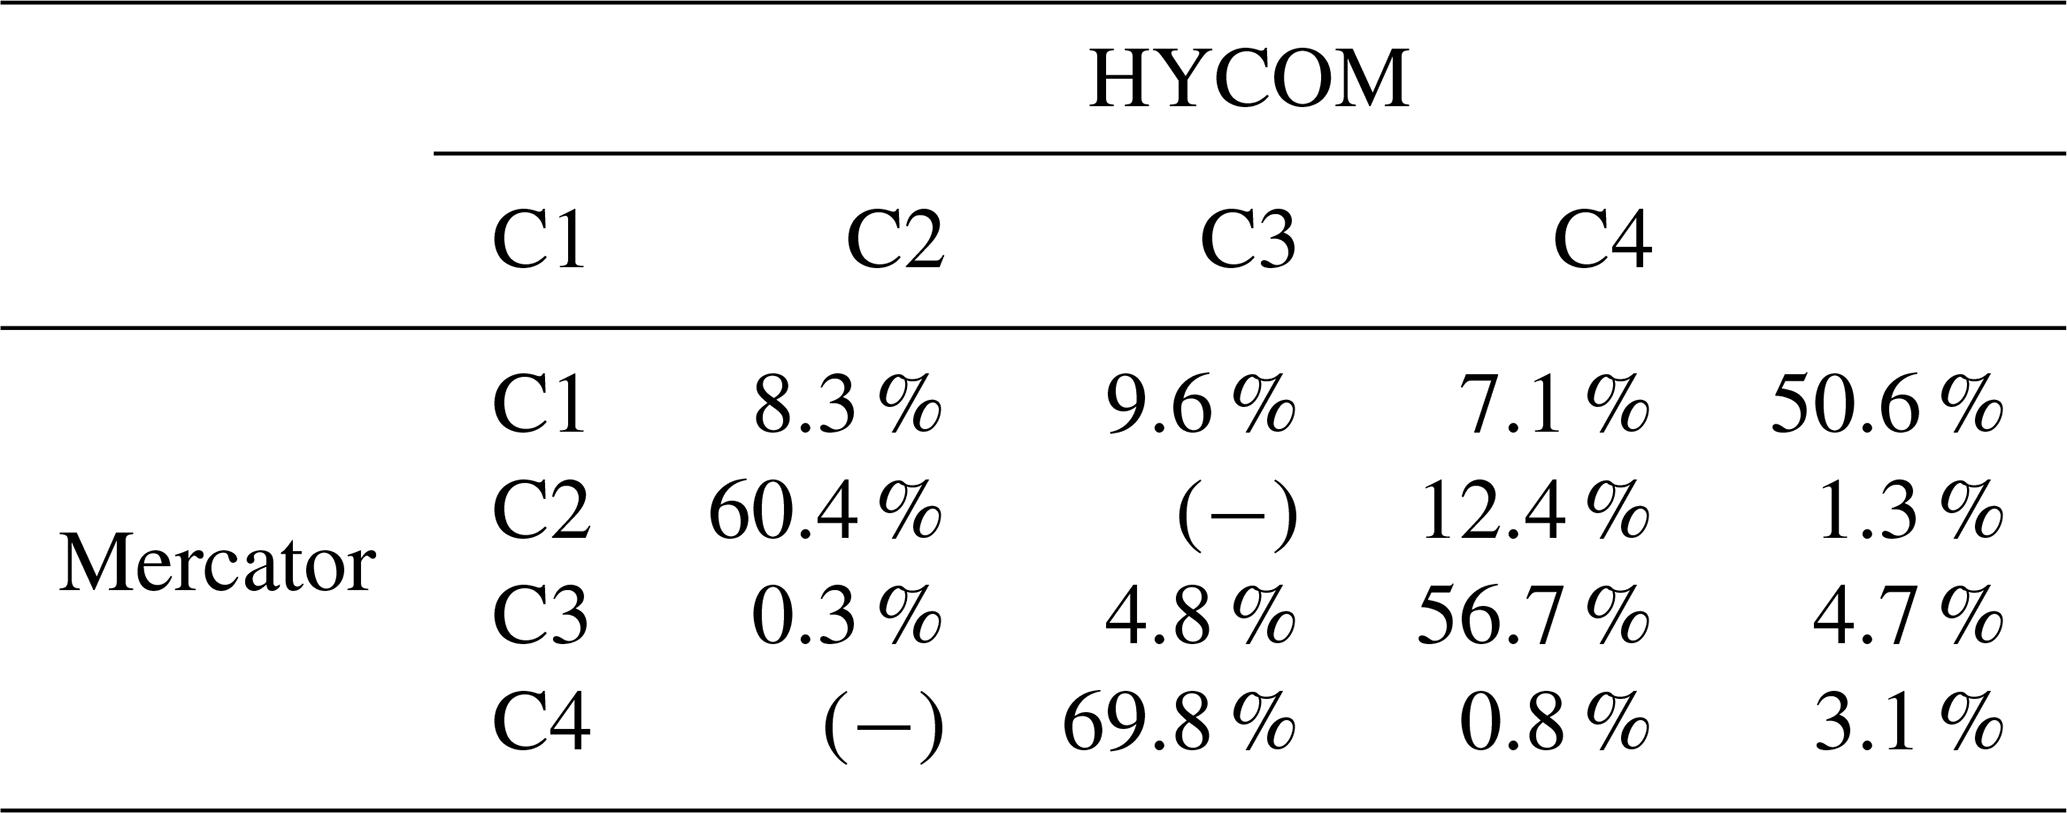
3.2.3 Matching days between clusters
The clusters found are also related by a set of days in common. Match percentages were calculated using Eq. (3). Table 3 shows the results of the match percentages (Eq. 3). MC4–HC2 is the cluster pair with the highest match score (69.8 %). It is followed by the pair MC2–HC1 (60.4 %), then MC3–HC3 (56.7 %) and MC1–HC4 (50,6 %). The cluster numbering does not take into account these match percentages (e.g., MC1 and MC2 main patterns respectively differ from HC1 and HC2 patterns).
Table 3Correspondence table between the four clusters generated with MERCATOR and HYCOM datasets. The percentage expresses the proportion of common days between two clusters; (−) indicates 0 %.
3.2.4 Distribution and comparison of intensities
Deciles were used to study and analyze the velocity distributions characterizing each cluster. Evolutions of the relative frequency of as a function of the deciles (Table 1) are shown in Figs. 12 and 13. For the entire analysis, the values of the deciles remain fixed and constant, and the curves are plotted for the three regions described in Fig. 1.
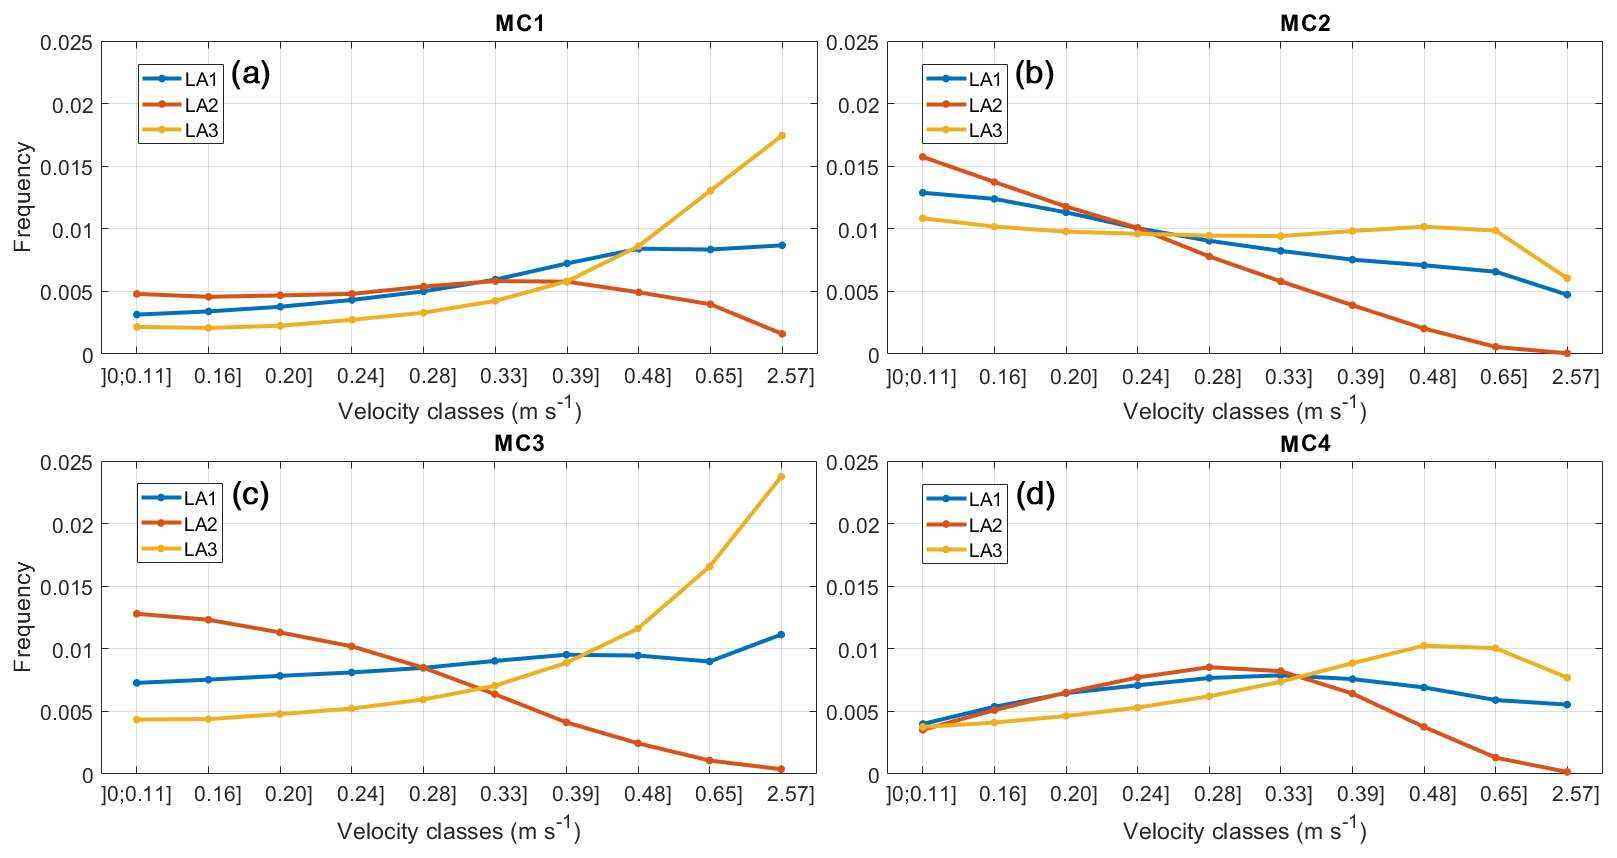
Figure 12Relative frequency distribution of current speeds for the three offshore subregions: MC1 (a), MC2 (b), MC3 (c), and MC4 (d). The representative elements were obtained after KMS–ED clustering for Mercator.
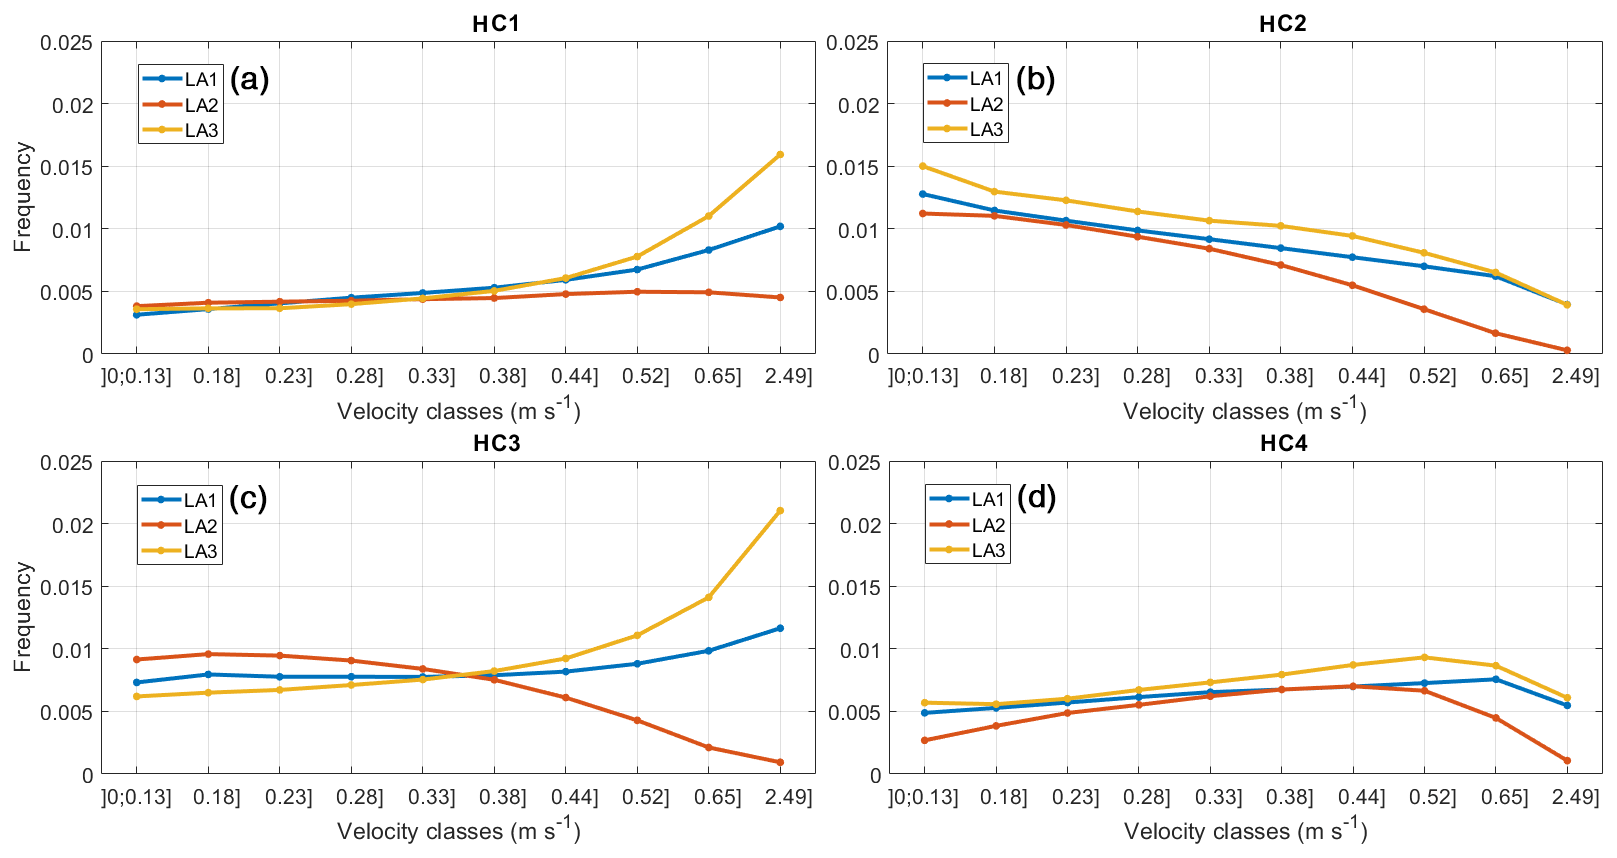
Figure 13Relative frequency distribution of current speeds for the three offshore subregions: HC1 (a), HC2 (b), HC3 (c), and HC4 (d). The representative elements were obtained after KMS–ED clustering for HYCOM.
For both models, globally, three main patterns are identified. The first pattern includes the following clusters: MC1, MC3, HC1, and HC3. This pattern is characterized by an increase in the relative frequency curve in the LA1 and LA3 regions and its decrease in the LA2 region. The elements of these clusters include strong current velocities above the median of 0.28 m s−1. The second pattern includes MC2 and HC2 clusters, which are characterized by a decrease in the relative frequency for the three regions (i.e., LA1, LA2, LA3). The last pattern includes MC4 and HC4 clusters and corresponds to three concave curves with maximums located at different velocity thresholds depending on the region under study.
To examine possible relationships for a given region between the two variables, decile speed thresholds, and identified clusters, contingency tables were constructed (not shown) and the chi-squared test was performed. For the three areas, the p value was much lower than 0.01. The chi-squared test results indicated that for the LA1, LA2, and LA3 regions, the speed distribution depends on the identified cluster.
3.2.5 Seasonality
The monthly distribution of each cluster is plotted (Figs. 14 and 15). Differences are relatively clear for both model analyses with a marked seasonal variation. The MC3 and HC3 regimes are observed during the first half of the year with a maximum in March, followed by MC2 and HC1 from April to July. The last two regimes are observed from August to December. The pair MC4–HC2 reaches a maximum in September, while MC1 and HC4 persist until February of the following year.
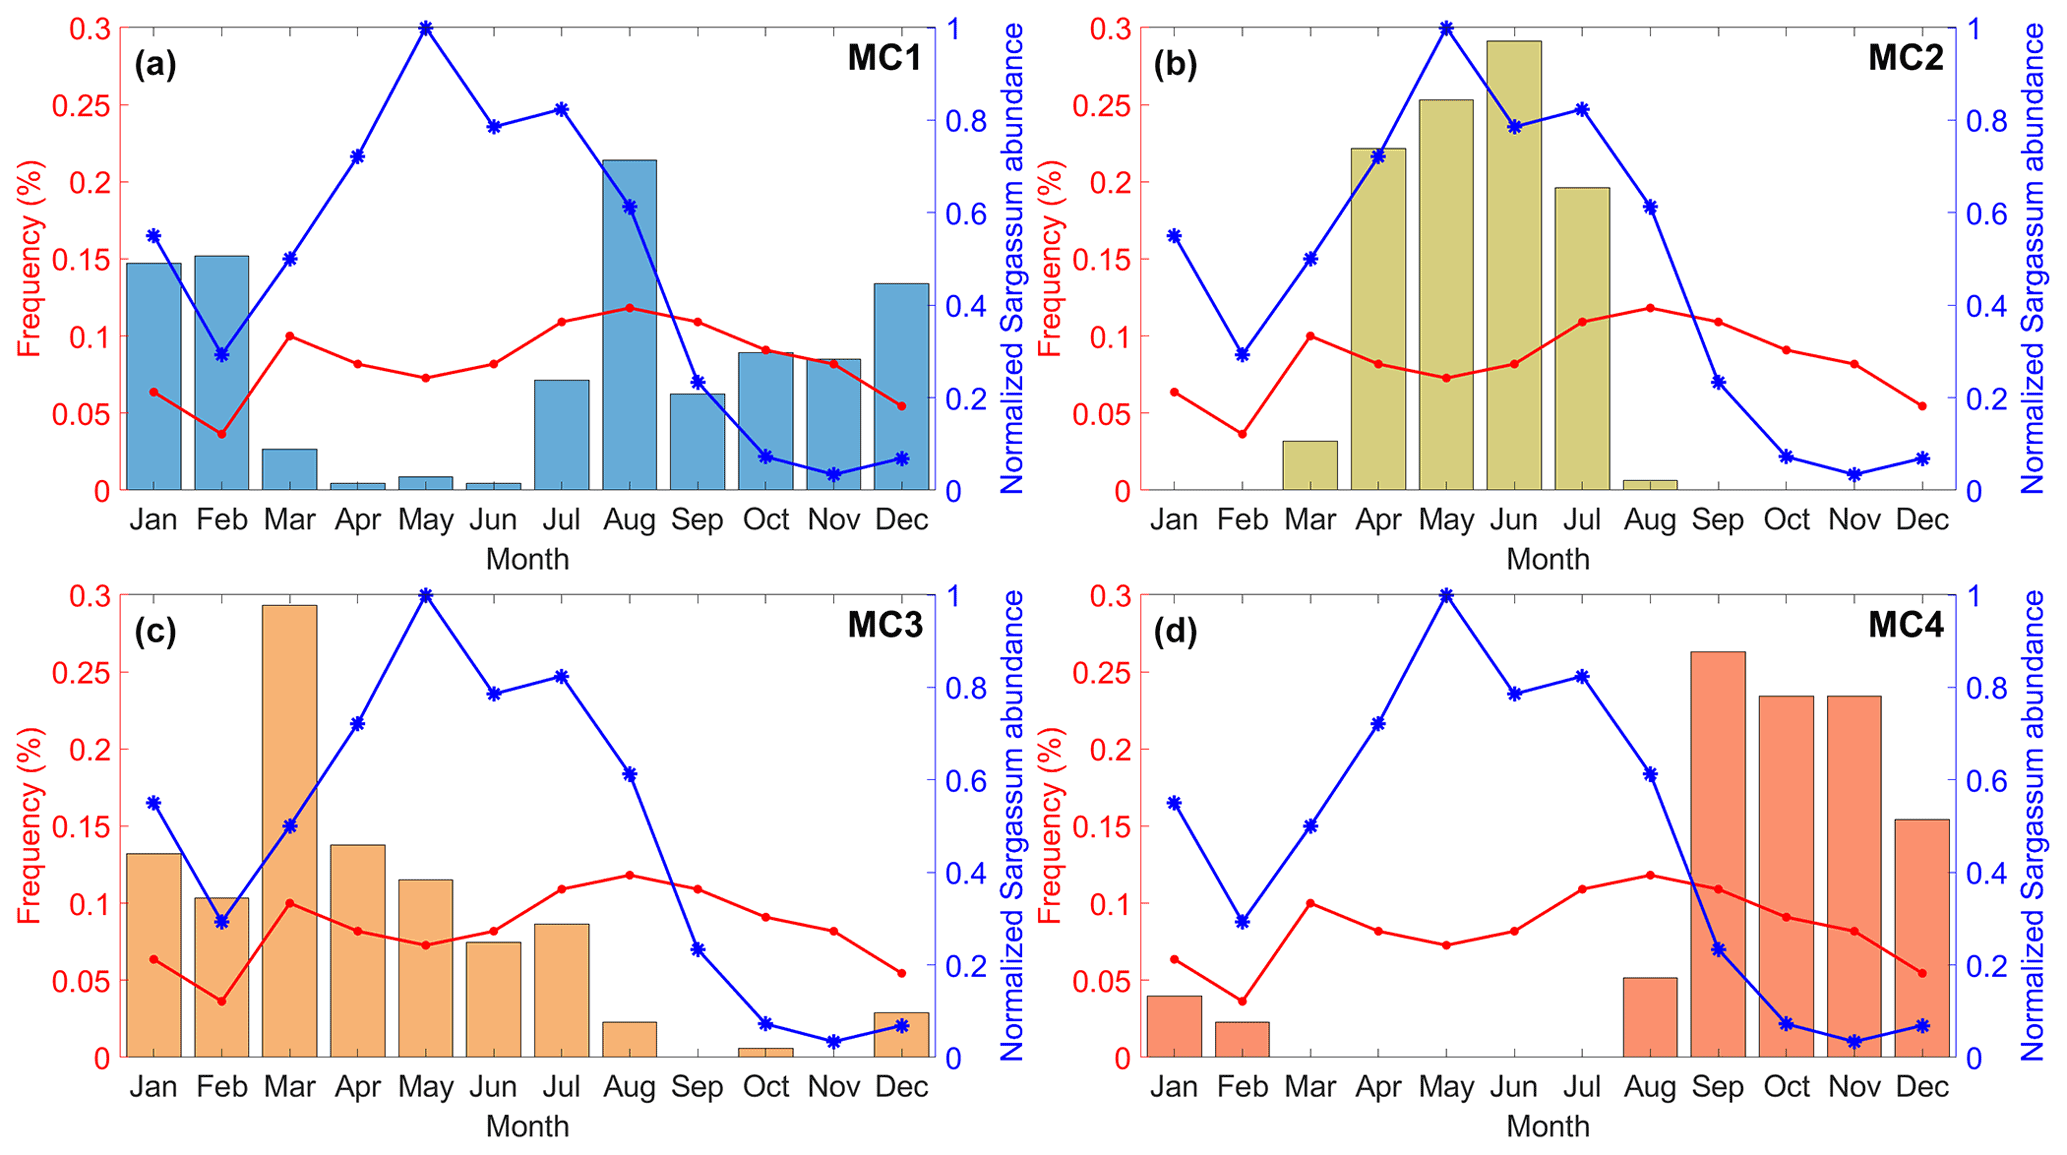
Figure 14Monthly distribution of cluster occurrence from Mercator outputs from 2019 to 2020 in the Lesser Antilles (55–66∘ W, 8–17∘ N): MC1 (a), MC2 (b), MC3 (c), and MC4 (d). The red line shows the monthly distribution of Sargassum beachings on the coasts of Guadeloupe during the same period. The blue line indicates the monthly evolution of Sargassum abundance in the area 30–100 km offshore of Guadeloupe normalized on the maximum value.
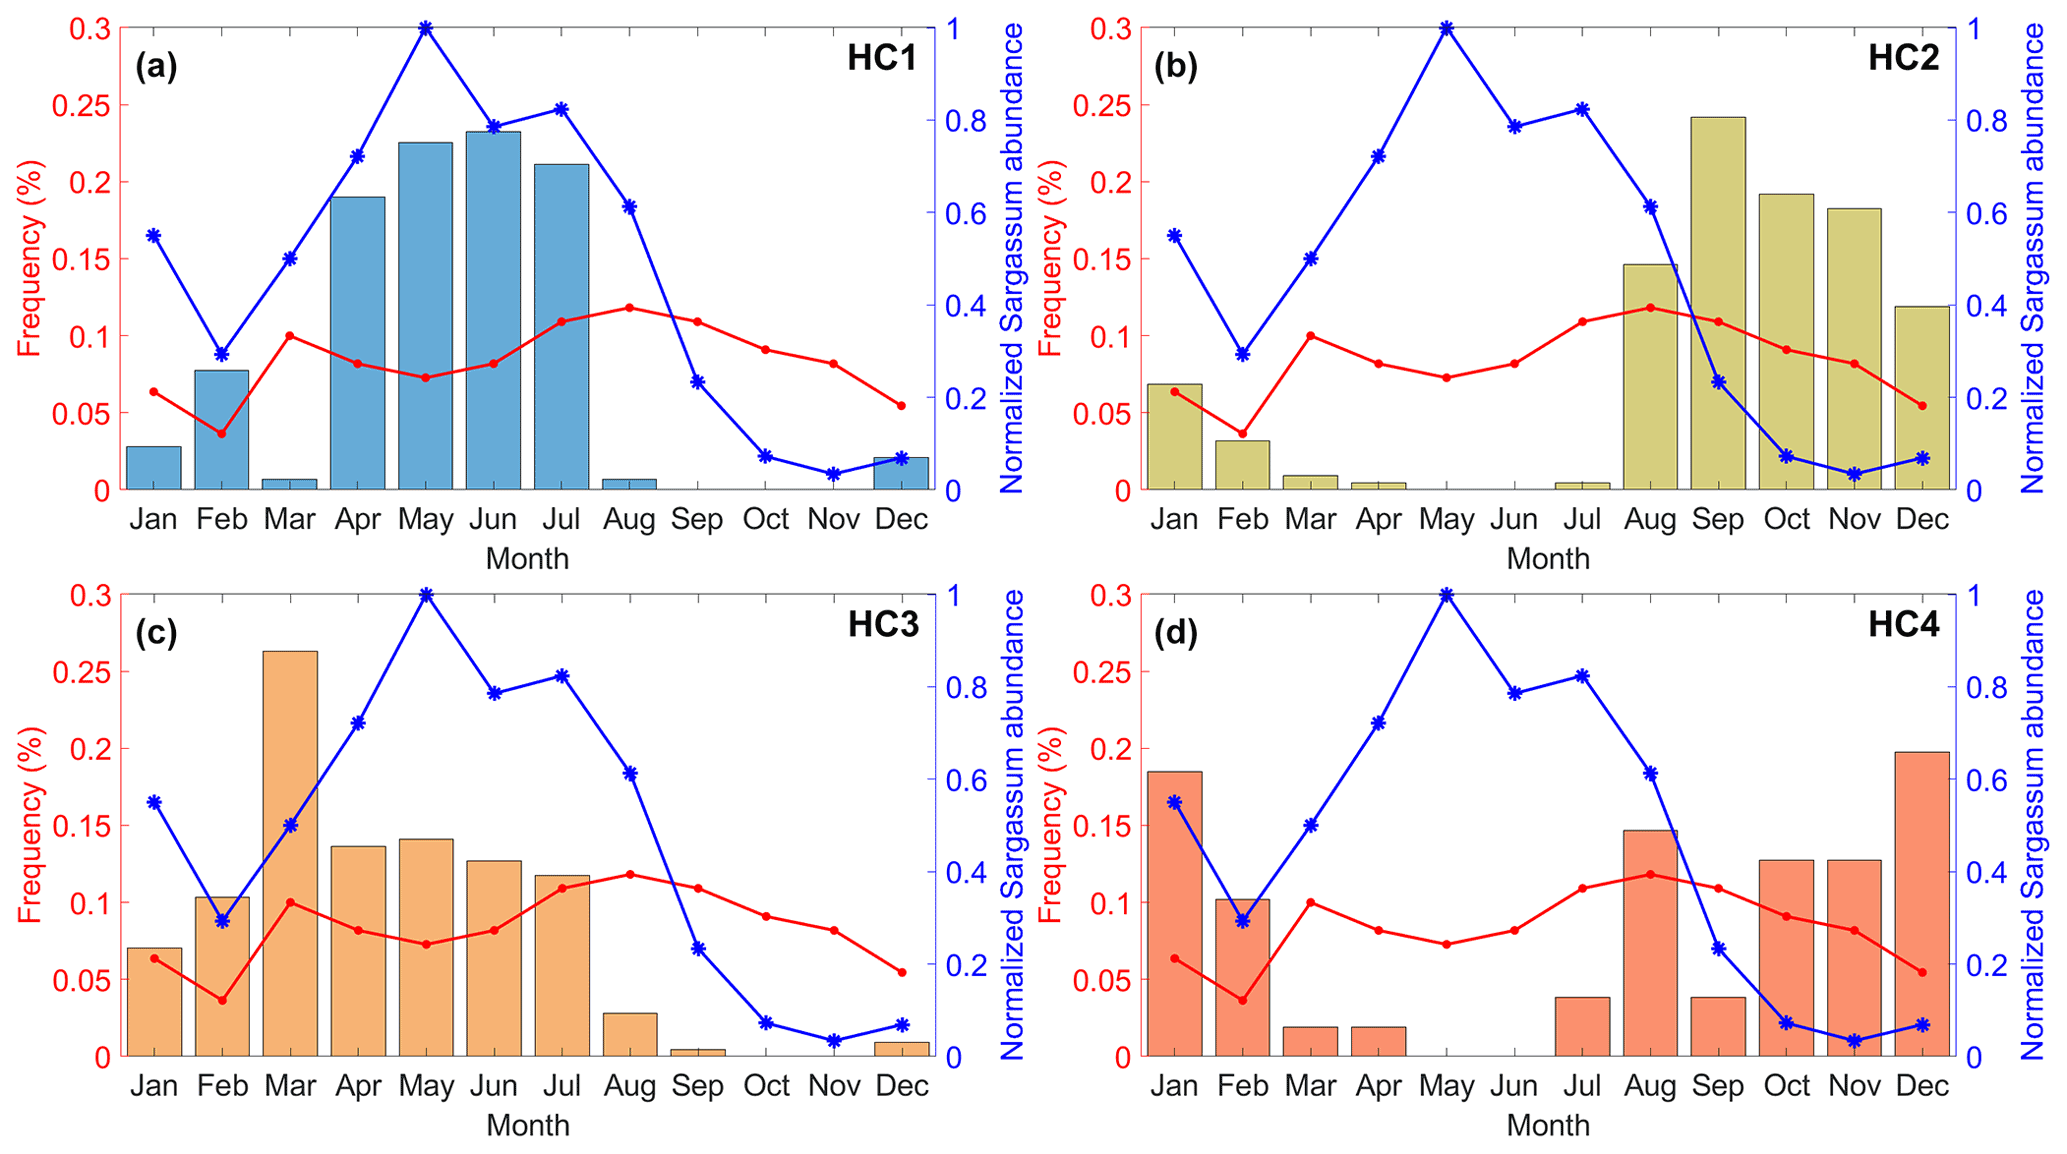
Figure 15Monthly distribution of cluster occurrence from HYCOM outputs from 2019 to 2020 in the Lesser Antilles (55–66∘ W, 8–17∘ N): HC1 (a), HC2 (b), HC3 (c), and HC4 (d). The red line shows the monthly distribution of Sargassum beachings on the coasts of Guadeloupe during the same period. The blue line indicates the monthly evolution of Sargassum abundance in the area 30–100 km offshore of Guadeloupe normalized on the maximum value.
3.3 Links with Sargassum beachings
As with many floating objects, before coming ashore on the coasts of the LA, Sargassum algae accumulate on the ocean surface in large amounts and form slicks, or filamentary structures, interspersed with void areas, under the influence of currents. These dynamic structures regularly observed from satellites, aircraft, and ships have a certain inertia (Maximenko et al., 2012; Miron et al., 2020).
Beyond biological production, it is therefore the specific dynamic conditions of the surface currents and the surface winds which may lead to massive Sargassum beachings on Caribbean coastal areas.
The monthly evolution of observed stranding days on the Guadeloupe coasts and the monthly evolution of Sargassum abundance in the area 30–100 km offshore of Guadeloupe were also analyzed for the focused period 2019–2020 (Figs. 14 and 15). During these 2 years, the amount of Sargassum likely to enhance the beaching risk in Guadeloupe increased significantly from February to May, then decreased from May to November.
Two beaching peak values are found: one in March and the second in August. The beaching dates and the cluster occurrence dates are also compared in Table 4. The MC3–HC3 pair gather the greatest number of similarities, followed by the MC1 and HC2 clusters.
Table 4Distribution of observed Sargassum beaching days (Guadeloupe coasts) in Mercator and HYCOM clusters.
These pairs of clusters would be favorable to the transport of these algae toward the coasts of the Lesser Antilles islands. MC2 and HC1 are the two clusters with the smallest number of beaching days.
3.4 Current sequences leading to beachings
The HAC analysis on the current regime sequences leading to observed beaching days allowed distributing the 107 sequences into four classes, respectively called Seq1, Seq2, Seq3, and Seq4. This analysis integrated only the HYCOM surface current data, which have a greater resolution than Mercator. During the focused period (i.e., 2019–2020), Seq4 (39.3 %) and Seq2 (37.4 %) have the greatest occurrence (Table 5). Seq1 and Seq3 have a respective occurrence of 16.8 % and 6.5 %. Figure 16 shows that Seq2, Seq3, and Seq4 are characterized by the respective modal current regimes HC3, HC1, and HC2. For the Seq1 sequences, there is no clear prevalent current regime. The monthly distribution of the main sequence classes, Seq2 and Seq4, highlights a significant seasonal splitting (Fig. 17). The Seq2 sequences occurred from December to June, while the Seq4 ones occurred from July to November. These two distributions also seem to be significantly correlated with the monthly occurrences of observed beachings. While the first beaching peak occurring in March is linked to the Seq2 maximum occurrences, the second beaching peak occurring in August is linked to the Seq4 maximum occurrences.
Table 5Distribution of sequence clusters, with n corresponding to the number of sequences in each cluster and % corresponding to the ratio of the number of sequences to the total.
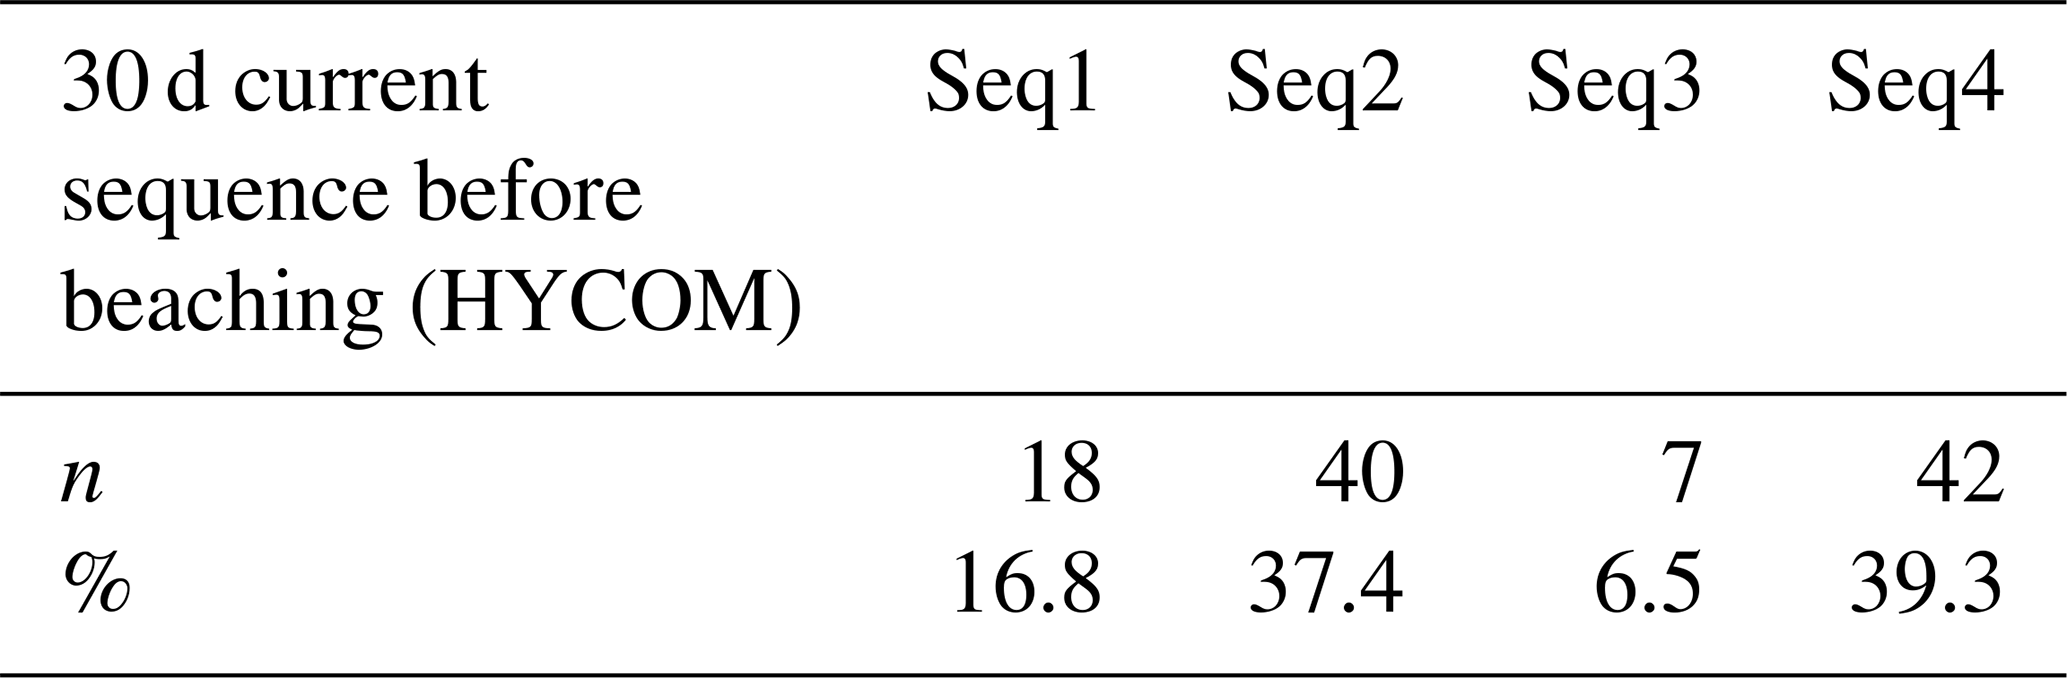
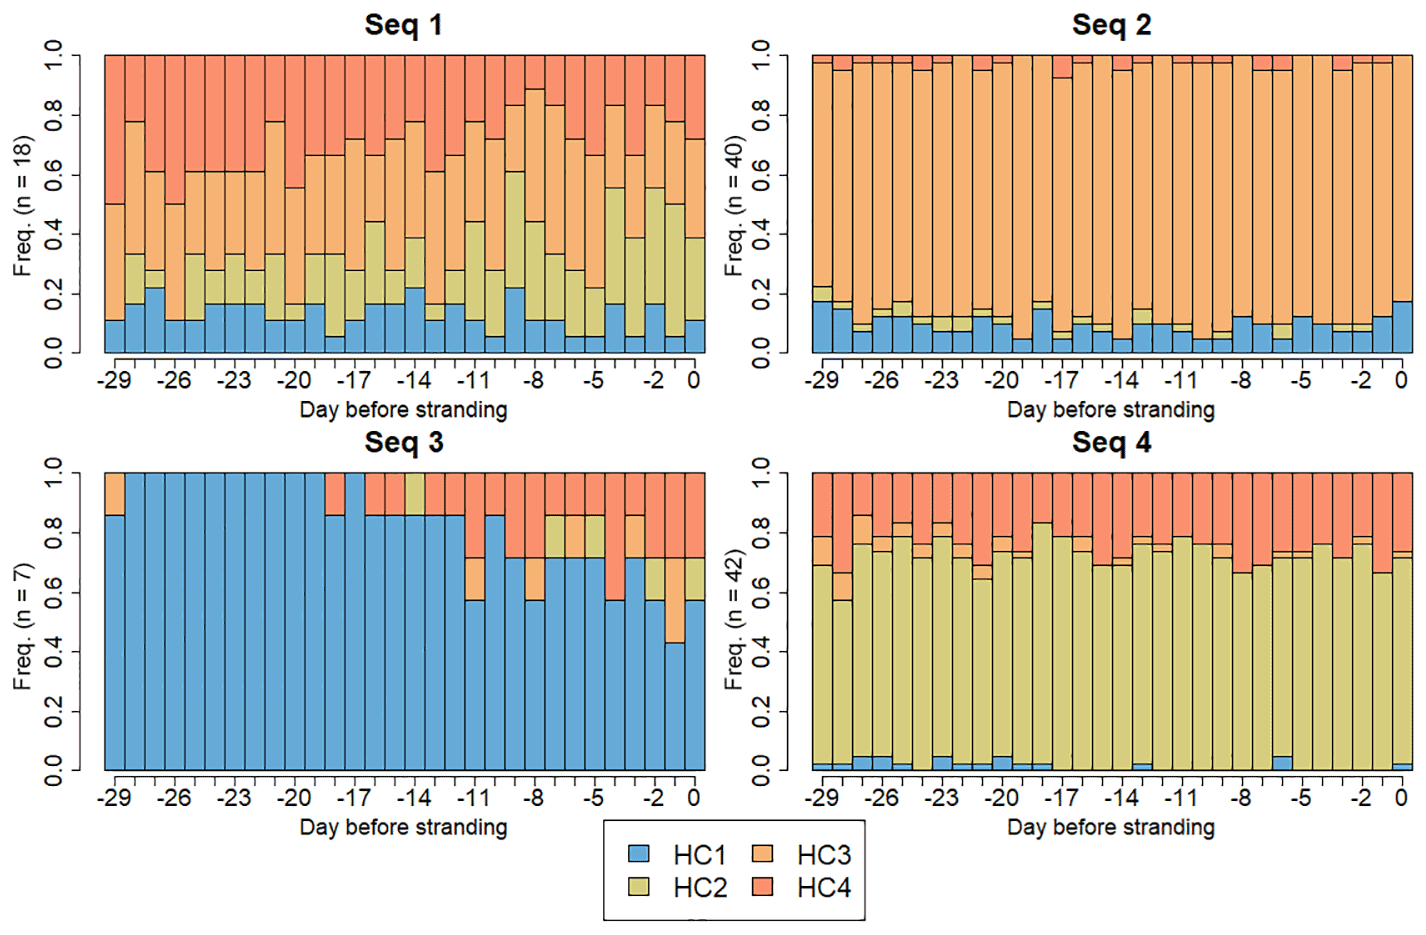
Figure 16Distribution of HYCOM current regime clusters (i.e., HC1 in blue, HC2 in green, HC3 in orange, HC4 in red) in the 30 d sequence types (i.e., Seq1, Seq2, Seq3, Seq4).
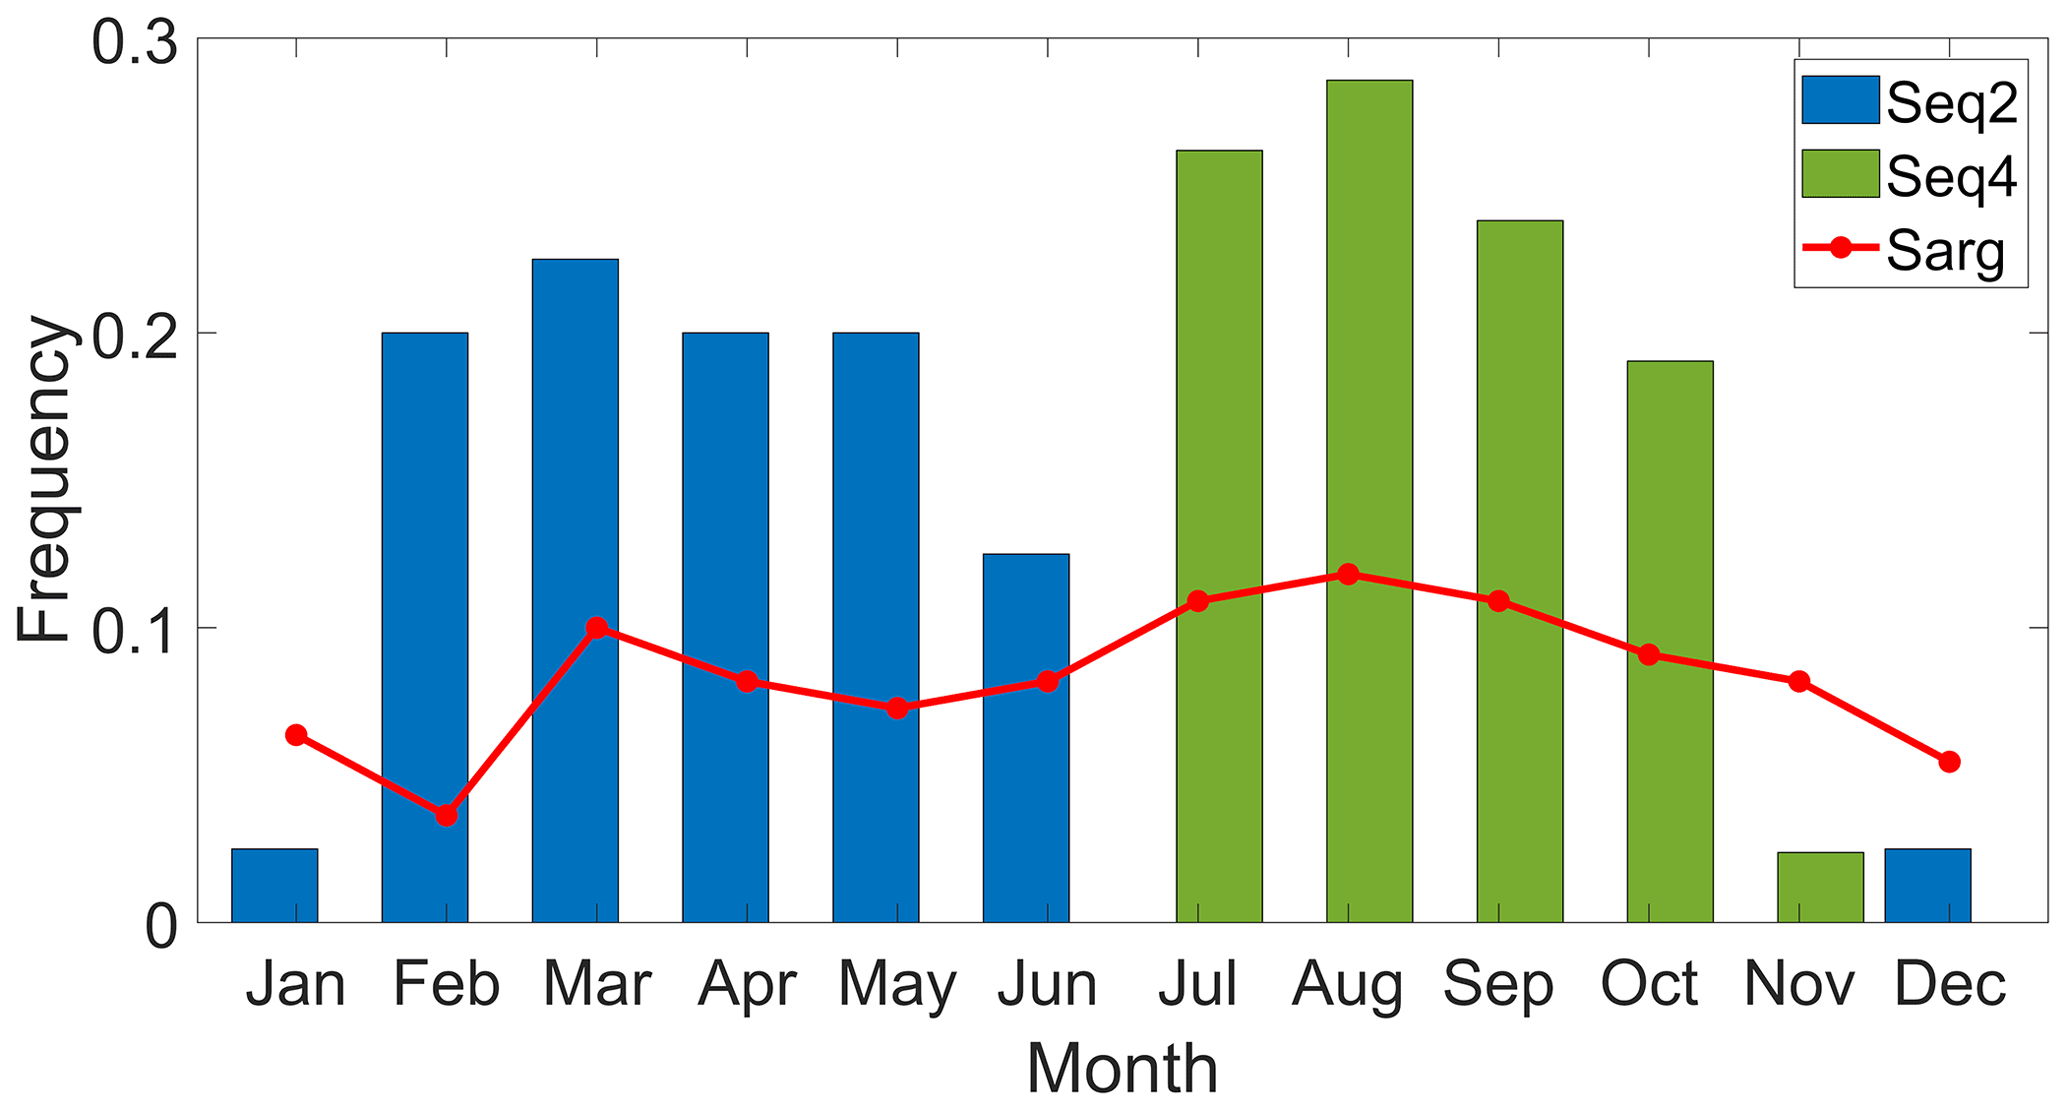
Figure 17Monthly distribution of the main observed current sequences leading to beaching: Seq2 (blue) and Seq4 (green). The red line represents the distribution of the observed beaching days.
3.5 Decision support system results
The behavior of each module is presented in Fig. 18. Globally, module A probabilities based on Sargassum offshore abundance probability seem to be the most correlated with the DSS decision. However, during the months with low Sargassum offshore abundance (i.e., from September to December) modules C and D, related to current patterns, are the main contributors to the decision. Module D, based on the comparison between past observed sequences and the sequence corresponding to the forecast day, remains with high probabilities above 0.5. These probabilities can reach 0.95, indicating strong similarities between the sequences. Module C, associated with the percentages of beaching per cluster, shows empirical probabilities close to 0.3, indicating that one-third of the days in the concerned clusters are beaching days.

Figure 18Decision support system (DSS) results: probability of beaching obtained per module. Daily probability to reach the maximum Sargassum abundance in the area 30–100 km offshore of Guadeloupe for module A (blue line), beaching frequency per cluster for module C (orange line), match percentage for module D (yellow line), and DSS decision (black line). Days of observed beaching on Guadeloupe coasts (red dots): HYCOM (a) and Mercator (b).
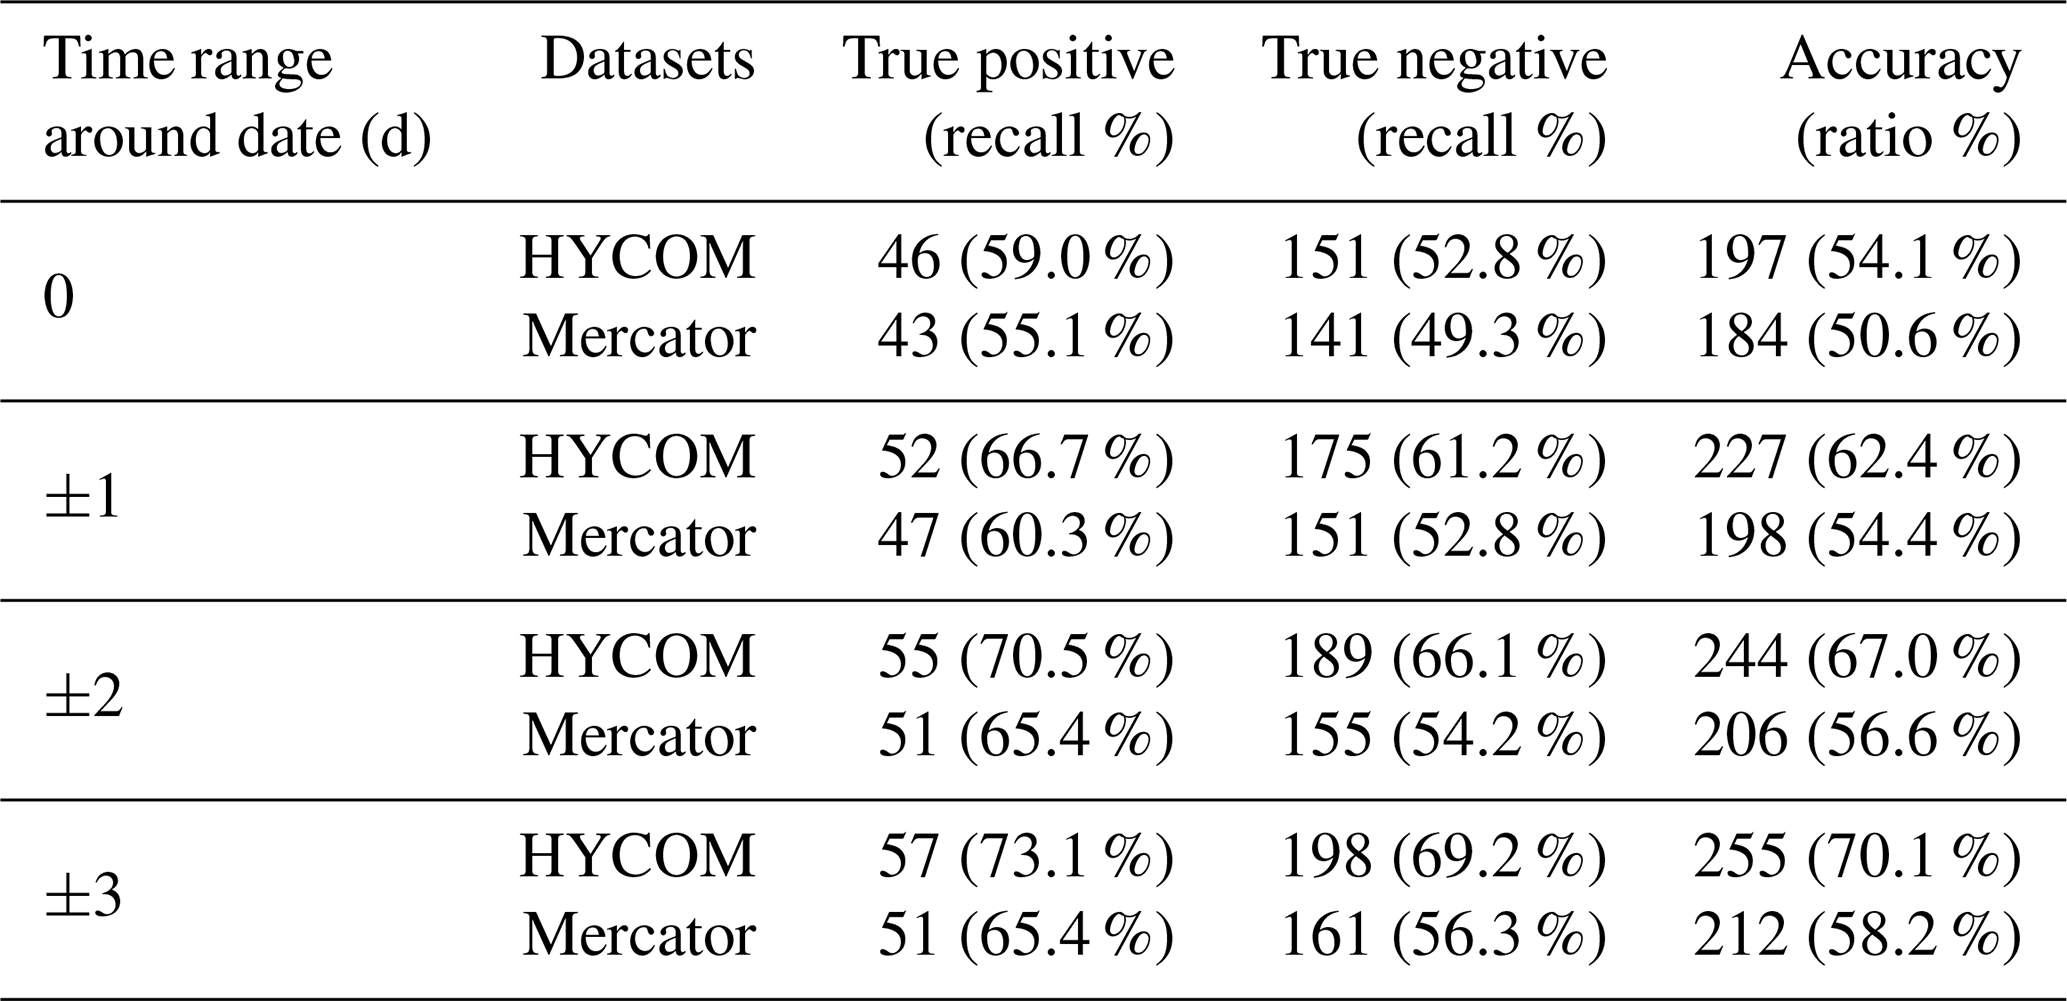
Table 6 presents the performance results of the predictive model (i.e., clustering + decision tree) for Mercator and HYCOM. “True positive and negative” respectively refer to the number of observed beaching and non-beaching days predicted by the decision system. “Recall” refers to the ratio in percentage between these respective numbers of days and the total number of tests (i.e., 364 d). “Accuracy” corresponds to the number of days with a true prediction, and its ratio in percentage was computed over the total number of tested days. Overall, the use of HYCOM data allows improving the prediction of beaching and non-beaching days (Table 6). With forecast date uncertainty below 1 d, the HYCOM DSS has an accuracy of 54.1 % (i.e., beaching and non-beaching days) and predicts 59.0 % of the observed beachings (i.e., true positive) in the year 2021. At the same date precision, the Mercator DSS has an accuracy of 50.6 % and predicts 55.1 % of the observed beaching days. The performance differences between the two datasets tend to increase with the temporal uncertainty ranges around the forecast date. With a temporal uncertainty range ± 3 d, the HYCOM DSS reaches an accuracy of 70.1 % and predicts 73.1 % of the observed beachings in the year 2021. At the same date precision, the Mercator DSS presents an accuracy of 58.2 % and predicts 65.4 % of the observed beachings.
Table 6Decision tree performance scores: “true positive and negative” respectively refer to the number of observed beaching and non-beaching days predicted by the decision system, “recall” refers to the ratio in percentage between these respective numbers of days and the total number of tests (i.e., 364 d), and “accuracy” corresponds to the number of days with a true prediction and its ratio in percentage over the total number of tested days.
4.1 Performance indices and clustering quality
The performance of the clustering and the quality of the clusters were assessed using the silhouette coefficient. The evolution of this coefficient (Fig. 9) clearly shows that, on the one hand, the methods based on the HAC algorithm produce lower values than those obtained by the KMS algorithms. On the other hand, for ED, silhouette indices are largely above those found by the L2 distance as written by Biabiany et al. (2020). This silhouette coefficient evolution allows us to keep four representative types of current regimes in this part of the Caribbean region. However, due to the lack of works for this region, comparisons between the present results and other studies were very limited. In other studies, authors have proposed a similar number of dominant regimes on a large scale in the tropical Pacific (Fereday et al., 2008), for the determination of robust modes of Northern Hemisphere sea ice variability (Fučkar et al., 2016), and for ocean mapping from environmental data (Zhao et al., 2020).
In our case, the velocity distributions show four singular profiles, confirming the good performance of the clustering. Each cluster also had distinct monthly distributions. This analysis allowed better understanding the variability of the surface current circulations in this region.
4.2 Surface current analysis
In terms of spatial distribution, clusters show notable differences for both types of model analysis, and three variability factors can be identified.
The first one is the seasonal evolution of the NBC retroflection front (Lumpkin and Garzoli, 2005; Baklouti et al., 2007). The NBC feeds the Guiana Current (GC) but also separates sharply, near 6–8∘ N, from the South American coastline and retroflects to feed, this time, the eastward NECC. Isolated large rings move northwestward toward the Caribbean Sea on a course parallel to the South American coastline, then interact with the Lesser Antilles (Fratantoni et al., 2002, 2006). These two dynamic structures, GC and NBC rings, significantly contribute to the transfer of South Atlantic surface water to the Caribbean. These dynamic structures were found in the four identified clusters and seem to work year-round with intensity variations.
Another part of this variability is caused by the rings of the NBC that move northwestward from the equatorial Atlantic and interact with the steep topography of the Lesser Antilles arc. MC2 and HC1 are two typical cases. Interactions with the island chain cause significant disturbances of the inflow through the southern passages with a blocking. This provides a meridional transport of surface water northward along the LA arc (Fratantoni and Richardson, 2006; Huang et al., 2021). The Lesser Antilles arc clearly diverting the initially northwestward drift of the NBC rings to a more northward course parallel to the island arc. Johns et al. (2002) have shown that the crossing of the Atlantic inflow to the Caribbean Sea through the passages of the Windward Islands (i.e., Lesser Antilles south islands from Trinidad to Martinique) has a highly asymmetric seasonal cycle, with a maximum in June and a minimum in September–October. The annual distribution of MC2 and HC3 clusters is close to that found by Johns et al. (2002).
The last identified factor is related to the North Atlantic gyre and the associated North Equatorial Current. As the seasons change from winter to summer, the gyre shifts south by a few degrees in latitude. In this part of the study area, several clusters show lower current speeds, and areas with large angular deviations in direction have also been identified. In the LA2 area, under the influence of the northeast trade winds (i.e., Atlantic area between 14.5 and 18∘ N), the relative frequencies of above-average speeds are the lowest. The wind current shear zones are also the most extensive. The wind-driven flow occurs from the subtropical gyre location to 15∘ N near the island of Martinique (Johns et al., 2002). Passages through the leeward islands have a maximum inflow in September and a minimum one in June.
The comparison between the large-scale meteorological situations corresponding to the paragons showed that the main differences between the current regime clusters are related to the location and the extension of the high-pressure centers, the positioning of the ITCZ, and the intensity of the Caribbean low-level jet.
4.3 Sargassum beachings
All clusters contain beaching days in relative abundance: 12 % to 36 % of beaching days for the 2 years 2019 and 2020. The first peak of beachings, in March, seems to be linked to the maximum frequency of MC3 and HC3 clusters. The second peak of observed beachings occurs in August and seems to be associated with the MC1, HC2, and HC4 clusters. Johns et al. (2020) found that windage forcing induced by the wind convergence accumulates Sargassum rafts within the ITCZ between April and September. This accumulation would contribute to the observed beaching peak in August. The clustering analysis of the beaching current sequences confirmed that the recurrence of HC3 (between December and June) and HC2 (between July and November) would induce large beachings on the Guadeloupe coasts during these respective periods. The HC2 current regime is characterized by the prevalence of the North Atlantic gyre with weak velocities in the western central Atlantic and zonal streamlines. As for the HC3 current regime, it is characterized by a strong Guiana Current with high velocities in the LA3 region and meridional streamlines almost parallel to the Lesser Antilles arc.
4.4 Predictive model performance
A machine-learning-based method for predicting Sargassum beaching was proposed and was built from a decision tree. This method has already been used for other parameters and it allows improving both the prediction accuracy and the fully black-box effect of the neural network. Compared to usual parametric statistical methods, it can effectively overcome the multicollinearity of explanatory variables (e.g., ocean current and surface wind). Depending on the temporal uncertainty ranges, the accuracy of the present decision tree is between 54.1 % and 70.1 % for HYCOM against 50.6 % and 58.2 % for Mercator (Table 6). The best performance scores are reached with the largest temporal uncertainty range ± 3 d. Similar performance scores were found for decision trees predicting summer rainfall in Chongqing (China) (Bo et al., 2020) and the landslide hazard in the Yen Bai Province (Vietnam) (Pham et al., 2020).
During the year of testing (i.e., 2021) only 78 beaching days were observed. Despite this large difference between beaching and non-beaching occurrences, the predictive model produces quite symmetric performances for both true positives and true negatives (Table 6). This fact highlights the good ability of the model to handle the different chosen datasets. This stability of the decision support system tends to increase with the temporal uncertainty range. For HYCOM, this asymmetric performance difference drops below 4 % at ± 3 d precision.
Several ways to improve the predictive model were identified. The lack of observational data in time (i.e., only 2 years) may weaken the final decision and induce overfitting. The tree could also be improved by weighting and prioritizing the different modules so as to increase their relevance. Improvement of the results can be found by optimizing the proposed decision calculation rule (Eq. 4) to better integrate the characteristics of the observed phenomenon. The daily probability of Sargassum offshore abundance produced by module A would also be improved with better-quality Sargassum remote sensing observations, particularly the FA density data gap within 30 km of the coasts. The present study does not take into account the effects of other factors (e.g., presence of nutrients, sinking of algae, and waves) which would allow a more realistic understanding of the Sargassum beachings.
For a decade, the Caribbean countries, particularly the LA, have suffered from the impacts induced by the massive and regular arrival of Sargassum on their coastal areas. This study presents the application of a clustering approach to determine the types of surface current circulations integrating the additional wind drift and their possible links to the Sargassum beachings observed on the LA coasts. The Guadeloupe archipelago was chosen as a beaching observational site for the period 2019–2020. This analysis was performed using the most recent versions of ocean current analysis, Mercator and HYCOM. The surface wind speed data from the ERA-5 model were also used. The clustering of the spatiotemporal surface current fields including windage was produced using the K-means algorithm combined with the expert distance metric. The silhouette index was used to determine the optimal number of clusters.
For this region (8–17∘ N, 66–55∘ W) divided into three subregions, we identify four coherent patterns from datasets. They contain the current structures related to the Guiana currents, the branches of the subtropical Atlantic gyre, and the front and the retroflection rings related to the NBC.
The finer resolution of HYCOM analysis provided more detailed information on surface current velocities near the islands than Mercator fields (i.e., mean local velocity difference of 0.3 m s−1). Offshore, these differences remain very small.
Links between clusters and observed beachings in Guadeloupe were studied considering windage, paragon velocity distributions, and monthly abundance maps. The surface current circulations characterizing the MC3–HC3 and MC4–HC2 cluster pairs seemed the most favorable for the transport and the beaching of Sargassum on the Lesser Antilles coasts.
The clustering analysis of the beaching current sequences based on HYCOM fields confirmed that the recurrence of HC3 (Seq2, between December and June) and HC2 (Seq4, between July and November) would induce large beachings on the Guadeloupe coasts during these respective periods. While the HC2 current regime is characterized by the prevalence of the North Atlantic gyre with weak zonal velocities, the HC3 current regime is marked by the influence of the NBC, the induced retroflection rings, and a strong Guiana Current, leading to higher meridional velocities in the LA3 region.
Machine learning algorithms (KMS, ED, decision tree classifier) were applied to estimate the probability of Sargassum beachings in Guadeloupe based on surface current forecasts, current regime sequences, and several combinations of probabilities. The performance score of this predictive model showed that HYCOM seems more suitable to reproduce small-scale current patterns inducing (or not) beachings in the Lesser Antilles. For 1 year of tests (i.e., 2021), the decision tree accuracy respectively reached 70.1 % and 58.2 % for HYCOM and Mercator with a temporal uncertainty range ± 3 d around the forecast date. This accuracy could be improved by weighting and prioritizing the different modules. The daily probability of Sargassum offshore abundance used in the decision tree would also be improved with better-quality Sargassum remote sensing observations, particularly the FA density data gap within 30 km of the coasts.
Due to the very recent availability of the selected HYCOM new-generation version, the present study was conducted only for 2 years (i.e., 2019–2020). The studied period could be extended to more years to integrate the interannual variability of the surface currents.
Nevertheless, the obtained results are very encouraging and open new possibilities for the forecasting of this natural hazard type. Machine learning methods developed in this analysis proved to be useful in the prevention of a natural risk depending on physical multifactorial combinations.
The present clustering analysis predictive system could be applied to other islands of the Lesser Antilles, changing the observational beaching site. The association of clustering methods and decision trees requiring low computational costs may enhance existing operational systems to help decision makers in Sargassum risk management. Maréchal et al. (2017) restrained the starting point of their operational short-term forecast system within 50–100 km of the LA coasts in order to reduce prediction errors. This geographical limit would correspond to a forecast period of 1 d before beaching. The present regional information on current dynamics leading to the arrival of Sargassum near the islands would be useful to extend this limit. In this way, it could be easier to anticipate the implementation of the resources needed to collect the Sargassum algae on the shorelines. Like the Sargassum inundation reports (Trinanes et al., 2021), the present small-scale Sargassum beaching predictive model may contribute to region-wide efforts to help coastal communities manage this hazard.
Data from this research are not publicly available. Interested researchers can contact the corresponding author of this article.
The study was mainly conceptualized and written by DB and EB. RaC, RoC, and NS provided comments for the results and reviewed the paper. RoC and NS helped with beaching observational data processing.
The contact author has declared that neither they nor their co-authors have any competing interests.
Publisher's note: Copernicus Publications remains neutral with regard to jurisdictional claims in published maps and institutional affiliations.
The authors wish to thank Danièle Frison, who helped with the translation.
This research has been supported by the ERDF/C3AF project (grant no. CR/16-115).
This paper was edited by Ismael Hernández-Carrasco and reviewed by Leo Berline and Laura Gomez-Navarro.
Amante, C. and Eakins, B. W.: ETOPO1 1 Arc-minute global relief model: procedures, data sources and analysis, NOAA Technical Memorandum NESDIS NGDC-24, Marine Geology and Geophysics Division, Boulder, Colorado, 25 pp., https://doi.org/10.1594/PANGAEA.769615, 2009.
Anses: Expositions aux émanations d'algues sargasses en décomposition aux Antilles et en Guyane, Technical report, ANSES, Maisons-Alfort, France, 162 pp., available at: https://www.anses.fr/en/system/files/AIR2015SA0225Ra.pdf (last access: 20 October 2021), 2017.
Arnault, S., Thiria, S., Crépon, M., and Kaly, F.: A tropical Atlantic dynamics analysis by combining machine learning and satellite data, Adv. Space Res., 68, 467–486, https://doi.org/10.1016/j.asr.2020.09.044 2021.
Baklouti, M., Devenon, J.-L., Bourret, A., Froidefond, J.-M., Ternon, J.-F., and Fuda, J.-L.: New insights in the French Guiana continental shelf circulation and its relation to the North Brazil Current retroflection, J. Geophys. Res., 112, C02023, https://doi.org/10.1029/2006JC003520, 2007.
Becker, J. J., Sandwell, D. T., Smith, W. H. F., Braud, J., Binder, B., Depner, J., Fabre, D., Factor, J., Ingalls, S., Kim, S. H., Ladner, R., Marks, K., Nelson, S., Pharaoh, A., Trimmer, R., Von Rosenberg, J., Wallace, G., and Weatherall, P.: Global Bathymetry and Elevation Data at 30 Arc Seconds Resolution: SRTM30_PLUS, Mar. Geod., 32, 355–371, 2009.
Berline, L., Ody, A., Jouanno, J., Chevalier, C., André, J.-M., Thibaut, T., and Ménard, F.: Hindcasting the 2017 dispersal of Sargassum algae in the Tropical North Atlantic, Mar. Pollut. Bull., 158, 111431, https://doi.org/10.1016/j.marpolbul.2020.111431, 2020.
Bertola, L. D., Boehm, J. T., Putman, N. F., Xue, A. T., Robinson, J. D., Harris, S., Baldwin, C. C., Overcast, I., and Hickerson, M. J.: Asymmetrical gene flow in five co-distributed syngnathids explained by ocean currents and rafting propensity, Proc. R. Soc. B., 287, 20200657, https://doi.org/10.1098/rspb.2020.0657, 2020.
Biabiany, E., Bernard, D., Page, V., and Paugam-Moisy, H.: Design of an expert distance metric for climate clustering: The case of rainfall in the Lesser Antilles, Comput. Geosci., 145, 104612, https://doi.org/10.1016/j.cageo.2020.104612, 2020.
Bo, X., Chunfen, Z., Xinning, D., and Jiayue, W.: The Application of a Decision Tree and Stochastic Forest Model in Summer Precipitation Prediction in Chongqing, Atmosphere, 11, 5, https://doi.org/10.3390/atmos11050508, 2020.
Boé, J. and Terray, L.: Weather regimes and downscaling, La Houille Blanche, 94, 45–51, https://doi.org/10.1051/lhb:2008016, 2008.
Brooks, M. T., Coles, V. J., Hood, R. R., and Gower, J. F.: Factors controlling the seasonal distribution of pelagic Sargassum, Mar. Ecol. Prog. Ser., 599, 1–18, https://doi.org/10.3354/meps12646, 2018.
Cassou, C., Terray L., Hurrell, J. W., and Deser, C.: North Atlantic winter climate regimes: spatial asymmetry, stationarity with time and oceanic forcing, J. Clim., 17, 1055–1068, https://doi.org/10.1175/1520-0442(2004)017<1055:NAWCRS>2.0.CO;2, 2004.
Cuevas, E., Uribe-Martínez, A., and Liceaga-Correa, M.: A satellite remote-sensing multi-index approach to discriminate pelagic Sargassum in the waters of the Yucatan Peninsula, Mexico, Int. J. Remote Sens., 39, 3608–3627, https://doi.org/10.1080/01431161.2018.1447162, 2018.
Cummings, J. A.: Operational multivariate ocean data assimilation, Q. J. Roy. Meteorol. Soc. Pt. C, 131, 3583–3604, https://doi.org/10.1256/qj.05.105, 2005.
Cummings, J. A. and Smedstad O. M.: Variational Data Assimilation for the Global Ocean, in: Data Assimilation for Atmospheric, Oceanic and Hydrologic Applications, Vol. II, edited by: Park, S. and Xu, L., Springer, Berlin, Heidelberg, https://doi.org/10.1007/978-3-642-35088-7_13, 2013.
Elzinga, C. H. and Studer, M.: Spell Sequences, State Proximities, and Distance Metrics, Sociol. Method. Res., 44, 3–47, https://doi.org/10.1177/0049124114540707, 2015.
ERA-5 reanalysis: ERA5 hourly data on pressure levels from 1959 to present, https://cds.climate.copernicus.eu/cdsapp#!/dataset/reanalysis-era5-pressure-levels?tab=overview, last access: 17 January 2022.
Fereday, D. R., Knight, J. R., Scaife, A. A., Folland, C. K., and Philipp, A.: Cluster Analysis of North Atlantic–European Circulation Types and Links with Tropical Pacific Sea Surface Temperatures, J. Clim., 21, 3687–3703, https://doi.org/10.1175/2007JCLI1875.1, 2008.
Florenne, T., Guerber, F., and Colas-Belcour, F.: Le phénomène d'échouages des sargasses dans les Antilles et en Guyane, Ministry of Overseas, Ministry of the Environment, Energy and the Sea, Ministry of Agriculture, Agri-Food and Forestry, Paris, France, 406 pp., https://agriculture.gouv.fr/sites/minagri/files/cgaaer_15113_2016_rapport.pdf, (last access: 10 April 2021), 2016.
Franks, J. S., Johnson, D. R., Ko, D. S., Sanchez-Rubio, G., Hendon, J. R., and Lay, M.: Unprecedented Influx of Pelagic Sargassum along Caribbean Island Coastlines during Summer 2011, in: Proceedings of the Gulf and Caribbean Fisheries Institute, 64, 6–8, http://aquaticcommons.org/21307/ (last access: 10 Ocotber 2021), 2012.
Franks, J. S., Johnson D. R., and Ko D. S.: Pelagic Sargassum in the Tropical North Atlantic, Gulf Caribbean Res., 27, 6–11, https://doi.org/10.18785/gcr.2701.08, 2016.
Fratantoni, D. M. and Glickson, D. A.: North Brazil Current Ring Generation and Evolution Observed with SeaWiFS, J. Phys. Oceanogr., 32, 1058–1074, https://doi.org/10.1175/1520-0485(2002)032<1058:NBCRGA>2.0.CO;2, 2002.
Fratantoni, D. M. and Richardson, P. L.: The Evolution and Demise of North Brazil Current Rings, J. Phys. Oceanogr., 36, 1241–1264, https://doi.org/10.1175/JPO2907.1, 2006.
Friedl, M. A. and Brodley, C. E.: Decision tree classification of land cover from remotely sensed data, Remote Sens. Environ., 61, 399–409, https://doi.org/10.1016/S0034-4257(97)00049-7, 1997.
Fučkar, N. S., Guemas, V., Johnson, N. C., Massonet, F., and Doblas-Reyes, F. J.: Clusters of interannual sea ice variability in the northern hemisphere, Clim. Dynam., 47, 1527–1543, https://doi.org/10.1007/s00382-015-2917-2, 2016.
Gabadinho, A., Ritschard, G., Müller, N., and Studer, M.: Analyzing and Visualizing State Sequences in R with TraMineR, J. Stat. Softw., 40, 1–37, https://doi.org/10.18637/jss.v040.i04, 2011.
Gasparin, F., Guinehut, S., Mao, C., Mirouze, I., Rémy, E., King, R. R., Hamon, M., Reid, R., Storto, A., Le Traon, P.-Y., Martin, M. J., and Masina, S.: Requirements for an Integrated in situ Atlantic Ocean Observing System From Coordinated Observing System Simulation Experiments, Front. Mar. Sci., 83, 14 pp., https://doi.org/10.3389/fmars.2019.00083, 2019.
Geisser, S.: Predictive Inference: An Introduction, Chapman & Hall, ISBN 978-0-412-03471-8, 1993.
Gower, J. and King, S.: Distribution of floating Sargassum in the Gulf of Mexico and the Atlantic Ocean mapped using MERIS, Int. J. Remote Sens., 32, 1917–1929, https://doi.org/10.1080/01431161003639660, 2011.
Gower, J., Hu, C., Borstad, G., and King, S.: Ocean Color Satellites Show Extensive Lines of Floating Sargassum in the Gulf of Mexico, IEEE T. Geosci. Remote Sens., 44, 3619–3625, https://doi.org/10.1109/TGRS.2006.882258, 2006.
Gower, J., Young, E., and King, S.: Satellite images suggest a new Sargassum source region in 2011, Remote Sens. Lett., 4, 764–773, https://doi.org/10.1080/2150704X.2013.796433, 2013.
Harms, S. and Winant, C. D.: Characteristic patterns of the circulation in the Santa Barbara Channel, J. Geophys. Res., 103, 3041–3065, https://doi.org/10.1029/97JC02393, 1998.
Helber, R. W., Townsend, T. L., Barron, C. N., Dastugue, J. M., and Carnes, M. R.: Validation Test Report for the Improved Synthetic Ocean Profile (ISOP) System, Part I: Synthetic Profile Methods and Algorithm, Report, Naval Research Laboratory, Mississippi, 127 pp., https://www7320.nrlssc.navy.mil/pubs/2013/helber1-2013.pdf (last access: 20 November 2021), 2013.
Hersbach, H., Bell, B., Berrisford, P., Hirahara, S., Horányi, A., Muñoz-Sabater, J., Nicolas, J., Peubey, C., Radu, R., Schepers, D., Simmons, A., Soci, C., Abdalla, S., Abellan, X., Balsamo, G., Bechtold, P., Biavati, G., Bidlot, J., Bonavita,M., De Chiara, G., Dahlgren, P., Dee, D., Diamantakis, M., Dragani, R., Flemming, J., Forbes, R., Fuentes, M., Geer, A., Haimberger, L., Healy, S., Hogan, R. J., Hólm, E., Janisková, M., Keeley, S., Laloyaux, P., Lopez, P., Lupu, C., Radnoti, G., de Rosnay, P., Rozum, I., Vamborg, F., Villaume, S., and Thépaut, J.-N.: The ERA5 global reanalysis, Q. J. R. Meteorol. Soc., 146, 1999–2049, https://doi.org/10.1002/qj.3803, 2020.
Hisaki, Y.: Classification of surface current maps, Deep-Sea Res. Pt. I, 73, 117–126, https://doi.org/10.1016/j.dsr.2012.12.001, 2013.
Hu, C.: A novel ocean color index to detect floating algae in the global oceans, Remote Sens. Environ., 113, 2118–2129, https://doi.org/10.1016/j.rse.2009.05.012, 2009.
Hu, C., Feng, L., Hardy, R. F., and Hochberg, E. J.: Spectral and spatial requirements of remote measurements of pelagic Sargassum macroalgae, Remote Sens. Environ., 167, 229–246, https://doi.org/10.1016/j.rse.2015.05.022, 2015.
Hu, C., Murch, B., Barnes, B., Wang, M., Maréchal, J., Franks, J., Johnson, D., Lapointe, B., Goodwin, D., Schell J., and Siuda, A.: Sargassum Watch Warns of Incoming Seaweed, Eos, 97, 58355, https://doi.org/10.1029/2016EO058355, 2016.
Huang, M., Liang, X., Zhu, Y., Liu, Y., and Weisberg, R. H.: Eddies connect the tropical Atlantic Ocean and the Gulf of Mexico, Geophys. Res. Lett., 48, e2020GL091277, https://doi.org/10.1029/2020GL091277, 2021.
HYCOM GLBy0.08 version: Global Ocean Forecasting System (GOFS) 3.1 output on the GLBy0.08 grid, https://www.hycom.org/data/glby0pt08/expt-93pt0, last access: 17 January 2022.
Johns, W. E., Townsend, T. L., Fratantoni, D. M., and Douglas Wilson, D. W.: On the Atlantic inflow to the Caribbean Sea, Deep-Sea Res. Pt. I, 49, 211–243, https://doi.org/10.1016/S0967-0637(01)00041-3, 2002.
Johns, E. M., Lumpkin, R., Putman, N. F., Smith, R. H., Muller-Karger, F. E., Rueda, D., Hu, C., Wang, M., Brooks, M. T., Gramer, L. J., and Werner F. E.: The Establishment of a Pelagic Sargassum Population in the Tropical Atlantic: Biological Consequences of a Basin-Scale Long Distance Dispersal Event, Prog. Oceanogr., 182, 25 pp., https://doi.org/10.1016/j.pocean.2020.102269, 2020.
Johnson, D., Ko, D. S., Franks, J. S., Moreno, P., and Sanchez-Rubio, G.: The Sargassum invasion of the eastern Caribbean and dynamics of the equatorial North Atlantic, Gulf Caribbean Fish. Inst. Proceed., 65, 102–103, 2014.
Jouanno, J., Moquet, J.-S., Berline, L., Radenac, M.-H., Santini, W., Changeux, T., Thibaut, T., Podlejski W., Ménard, F., Martinez, J.-M., Aumont, O., Sheinbaum, J., Filizola N., and Moukandi N'Kaya G. D.: Evolution of the riverine nutrient export to the Tropical Atlantic over the last 15 years: is there a link with Sargassum proliferation?, Environ. Res. Lett., 16, 8 pp., https://doi.org/10.1088/1748-9326/abe11a, 2021.
Kuhn, M. and Johnson, K.: Applied predictive modeling, New York, Springer, ISBN 978-1-4614-6848-6, https://doi.org/10.1007/978-1-4614-6849-3, 2013.
Kullback, S. and Leibler, R.: On information and sufficiency, Ann. Mathemat. Stat., 22, 79–86, https://doi.org/10.1214/aoms/1177729694, 1951.
Larmarange, J., Mossong, J., Bärnighausen T., and Newell M. L.: Participation Dynamics in Population-Based Longitudinal HIV Surveillance in Rural South Africa, PLOS ONE, 10, 16 pp., https://doi.org/10.1371/journal.pone.0123345, 2015.
Lellouche, J.-M., Greiner, E., Le Galloudec, O., Garric, G., Regnier, C., Drevillon, M., Benkiran, M., Testut, C.-E., Bourdalle-Badie, R., Gasparin, F., Hernandez, O., Levier, B., Drillet, Y., Remy, E., and Le Traon, P.-Y.: Recent updates to the Copernicus Marine Service global ocean monitoring and forecasting real-time high-resolution system, Ocean Sci., 14, 1093–1126, https://doi.org/10.5194/os-14-1093-2018, 2018.
Lumpkin, R. and Garzoli S. L.: Near-surface circulation in the tropical Atlantic Ocean, Deep-Sea Res. Pt. I, 52, 495–518, https://doi.org/10.1016/j.dsr.2004.09.001, 2005.
Maréchal, J.-P., Hellio, C., and Hu, C.: A simple, fast, and reliable method to predict Sargassum washing ashore in the Lesser Antilles, Remote Sens. Appl. Soc. Environ., 5, 54–63, https://doi.org/10.1016/j.rsase.2017.01.001, 2017.
Maximenko, N., Hafner, J., and Niiler, P. : Pathways of marine debris derived from trajectories of Lagrangian drifters, Mar. Pollut. Bull., 65, 51–62, https://doi.org/10.1016/j.marpolbul.2011.04.016, 2012.
Michelangeli, P., Vautard, R., and Legras, B.: Weather regime occurrence and quasi stationarity, J. Atmos. Sci., 52, 1237–1256, 1995.
Miron, P., Olascoaga, M. J., Beron-Vera, F. J., Putman, N. F., Triñanes, J., Lumpkin, R., and Goni, G. J.: Clustering of marine-debris- and Sargassum-like drifters explained by inertial particle dynamics, Geophys. Res. Lett., 47, e2020GL089874, https://doi.org/10.1029/2020GL089874, 2020.
Pham, B. T., Phong, T. V., Nguyen-Thoi, T., Parial, K., Singh S. K., Ly, H.-B., Nguyen, K. T., Ho, L. S., Van Le, H., and Prakash, I.: Ensemble modeling of landslide susceptibility using random subspace learner and different decision tree classifiers, Geocarto Int., 37, 735–757, https://doi.org/10.1080/10106049.2020.1737972, 2020.
PSY4V3R1 Mercator ∘ 3D analysis: Global Ocean ∘ Physics Analysis and Forecast updated Daily, https://resources.marine.copernicus.eu/product-detail/GLOBAL_ANALYSIS_FORECAST_PHY_001_024/DATA-ACCESS, last access: 17 January 2022.
Putman, N. F., Goni, G. J., Gramer, L. J., Hu, C., Johns, E. M., Trinanes, J., and Wang, M.: Simulating transport pathways of pelagic Sargassum from the equatorial Atlantic into the Caribbean Sea, Prog. Oceanogr., 165, 205–214, https://doi.org/10.1016/j.pocean.2018.06.009, 2018.
Putman, N. F., Lumpkin, R., Olascoaga, M. J., Trinanes, J., and Goni, G. J.: Improving transport predictions of pelagic Sargassum, J. Exp. Mar. Biol. Ecol., 529, 151398, https://doi.org/10.1016/j.jembe.2020.151398, 2020.
Resiere, D., Valentino, R., Nevière R., Banydeen, R., Gueye, P., Florentin, J., Cabié, A., Lebrun, T., Mégarbane B., Guerrier G., and Mehdaoui, H.: Sargassum seaweed on Caribbean islands: an international public health concern, Lancet, 392, 2691, https://doi.org/10.1016/S0140-6736(18)32777-6, 2018.
Rousseeuw, P. J.: Silhouettes: A graphical aid to the interpretation and validation of cluster analysis, J. Comput. Appl. Mathemat., 20, 53–65, https://doi.org/10.1016/0377-0427(87)90125-7, 1987.
SargassumWatch System (SAWS): Sargassum Outlook Bulletin, University of South Florida, https://optics.marine.usf.edu/projects/SaWS.html, last access: 15 June 2021
Studer, M. and Ritschard, G.: What matters in differences between life trajectories: a comparative review of sequence dissimilarity measures, J. Roy. Stat. Soc. Ser. A, 179, 481–511, https://doi.org/10.1111/rssa.12125, 2016.
Swain, P. H. and Hauska, H.: The decision tree classifier: Design and potential, IEEE Trans. Geosci. Elect., 15, 142–147, https://doi.org/10.1109/TGE.1977.6498972, 1977.
Trinanes, J., Putman, N. F., Goni, G., Hu, C., and Wang, M.: Monitoring pelagic Sargassum inundation potential for coastal communities, J. Operat. Oceanogr., 14, 1–12, https://doi.org/10.1080/1755876X.2021.1902682, 2021.
Van Tussenbroek, B. I., Hernández Arana, H. A., Rodríguez-Martínez, R. E., Espinoza-Avalos, J., Canizales-Flores, H. M., González-Godoy, C. E., Barba-Santos, M. G., Vega-Zepeda, A., and Collado-Vides, L.: Severe impacts of brown tides caused by Sargassum spp. on near-shore Caribbean seagrass communities, Mar. Pollut. Bull., 122, 272–281. https://https://doi.org/10.1016/j.marpolbul.2017.06.057, 2017.
Wang, M. and Hu, C.: Mapping and quantifying Sargassum distribution and coverage in the central West Atlantic using MODIS observations, Remote Sens. Environ., 183, 350–367, https://doi.org/10.1016/j.rse.2016.04.019, 2016.
Wang, M. and Hu, C.: Predicting Sargassum blooms in the Caribbean Sea from MODIS observations, Geophys. Res. Lett., 44, 3265–3273, https://doi.org/10.1002/2017GL072932, 2017.
Wang, M., Hu, C., Cannizzaro, J., English, D., Han, X., Naar, D., Lapointe, B., Brewton, R., and Hernandez, F.: Remote sensing of Sargassum biomass, nutrients, and pigments, Geophys. Res. Lett., 45, 12359–12367, https://doi.org/10.1029/2018GL078858, 2018.
Wang, M., Hu, C., Barnes, B. B., Mitchum, G., Lapointe, B., and Montoya, J. P.: The great Atlantic Sargassum belt, Science, 365, 83–87, https://doi.org/10.1126/science.aaw7912, 2019.
Ward Jr., J. H.: Hierarchical Grouping to Optimize an Objective Function, J. Am. Stat. Assoc., 58, 236–244, https://doi.org/10.1080/01621459.1963.10500845, 1963.
Webster, R. K. and Linton, T.: Development and implementation of Sargassum Early Advisory System (SEAS), Shore & Beach, 81, 1–6, http://www.sargassoseacommission.org/storage/Webster_et_linon_2013_1.pdf (last access: 15 February 2022), 2013.
Witherington, B., Hirama S., and Hardy, R.: Youngsea turtles of the pelagic Sargassum-dominated drift community: habitat use, population density, and threats, Mar. Ecol. Prog. Ser., 463, 1–22, https://doi.org/10.3354/meps09970, 2012.
Zhao, Q., Basher, Z., and Costello, M. J.: Mapping near surface global marine ecosystems through cluster analysis of environmental data, Ecol. Res., 35, 327–342, https://doi.org/10.1111/1440-1703.12060, 2020.