the Creative Commons Attribution 4.0 License.
the Creative Commons Attribution 4.0 License.
 | 13 Sep 2022
Multi-platform study of the extreme bloom of the barrel jellyfish Rhizostoma pulmo (Cnidaria: Scyphozoa) in the northernmost gulf of the Mediterranean Sea (Gulf of Trieste) in April 2021
Nydia Catalina Reyes Suárez
Laura Ursella
Matjaž Ličer
Massimo Celio
Vanessa Cardin
On 7 April 2021, an exceptional bloom of the scyphomedusa Rhizostoma pulmo was observed in the Gulf of Trieste (Italy). Blooms of this species in the northern Adriatic Sea have been reported since the late 1800s: the density of jellyfish observed in 2021 reached more than 10 specimens per square metre. We analyse the bloom from a multi-platform approach using observations and model data at different timescales. We attempt to explain the intensity of the bloom as a consequence of thermohaline and hydrodynamical conditions in the gulf. Meteo-oceanographic conditions that may have contributed to the exceptional aggregation of jellyfish observed along the northernmost coast of the Adriatic Sea are discussed in detail. Specifically, our results indicate that this bloom was enabled by (1) the presence of a high number of jellyfish in the gulf, probably linked to the anomalously warm sea conditions in spring 2020 and winter 2021, which may have favoured a longer reproductive period and enhanced survival of adult R. pulmo, respectively; and (2) strong wind events, such as the bora wind for the Gulf of Trieste, which enhanced upwelling and mixing processes in the gulf, bringing the jellyfish from the deeper waters to the surface and clustering them along the coast.
- Article
(10645 KB) - Full-text XML
- BibTeX
- EndNote


Due to a reported increase in jellyfish populations in many areas of the world (Mills, 2001; Purcell, 2005; Richardson et al., 2009; Brotz and Pauly, 2012; Fuentes et al., 2011; Pestorić et al., 2021) and the significant economic and recreational damage that can be caused, particularly by large aggregations of Scyphozoan medusae (Richardson et al., 2009; Brotz et al., 2012; Condon et al., 2014; Nastav et al., 2013; Palmieri et al., 2014), jellyfish blooms have gained interest in the scientific community (e.g. Hamner and Dawson, 2009; Pitt et al., 2018; Baliarsingh et al., 2020; Fernández-Alías et al., 2021) and the general public.
Rhizostoma pulmo (Macri, 1778) (Fig. 1) is one of the most abundant and largest jellyfish in the Mediterranean Sea (Fuentes et al., 2011); it is common in coastal areas and semi-enclosed lagoons. In recent decades, an increase in the abundance and frequency of blooms of this jellyfish has been reported in southern European seas (Leoni et al., 2021a), especially in the northern Adriatic Sea (Kogovšek et al., 2018; Leoni et al., 2021a; Pestorić et al., 2021). In the Gulf of Trieste (GOT hereafter), R. pulmo was first reported in 1875 and has been observed since then, with the exception of the period 1930 to 1960 (Kogovšek et al., 2010): blooms were reported in 5 years between 1899 and 1914, in 10 years from 1980 to 2010 and again in the period 2015–2017 (Pestorić et al., 2021).
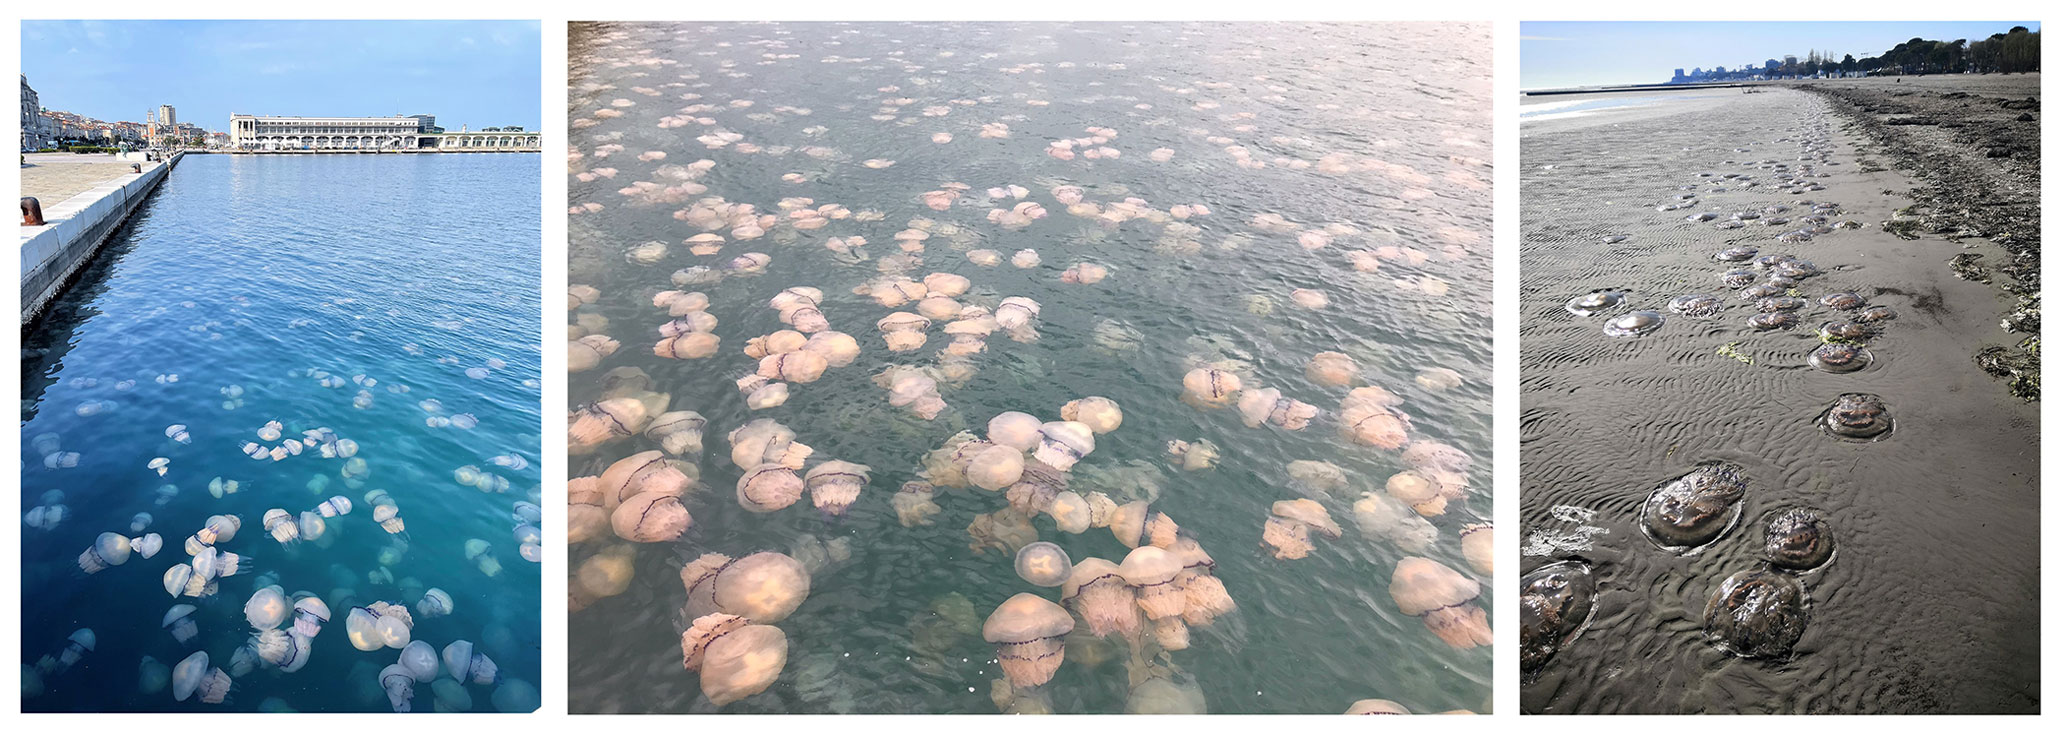
Figure 1R. pulmo clustering in the Gulf of Trieste. Photos were taken on 8 April 2021 in the city of Trieste (left-hand and centre panels) and in the city of Grado (right-hand panel) in Italy. These pictures were kindly provided by AvvistAPP users (Tirelli et al., 2021).
The life cycle of R. pulmo begins with a pelagic, free-swimming stage (medusae) that sexually reproduces and releases planulae, which in turn develop into polyps (benthic stage). The polyps of R. pulmo have never been observed in nature. However, studies on laboratory cultures have shown that polyps reproduce asexually and multiply themselves by buds and podocysts, as well as, under favourable conditions, strobilate forming several ephyrae (polydisc strobilation with up to eight per polyp; Fuentes et al., 2011), which develop into new jellyfish. While R. pulmo is typically observed from summer to autumn in the central and southern Adriatic, this species is present in the GOT throughout the year (Pierson et al., 2020; Pestorić et al., 2021) also often being very abundant in the coldest months (Pierson et al., 2020). In early spring 2021, an extraordinary bloom (for the impressive density of jellyfish and the large size of many of them) was observed on the coast of Trieste (Italy), where R. pulmo were seen and photographed by citizens (Fig. 1), and reporters were attracted by this “anomalous event”.
Jellyfish blooms are complex phenomena to study, and to date, knowledge about the location, size and dynamics of R. pulmo, especially its polyp stage, in the Adriatic is sparse or nonexistent (Pestorić et al., 2021). The lack of this information in the Gulf of Trieste makes it difficult to understand how the jellyfish might respond to various environmental factors. Nevertheless, this study aims to uncover the role of hydrodynamics in the perception of jellyfish blooms in coastal areas and provide a possible explanation for the magnitude of the April 2021 outbreak of R. pulmo. The main objective of this study is to show how hydrological properties of the water column and atmospheric forcing might have affected jellyfish aggregation in the GOT, highlighting the importance of a multidisciplinary and multi-platform approach to the study of jellyfish bloom dynamics.
This article is organised as follows: Sect. 2 presents the oceanographic characteristics of the study area. Section 3 describes the data used for this study. The data consist of observational and model data selected for their availability as well as temporal and spatial resolution. Section 4 is devoted to data analysis. Here we describe the sea conditions before, during and shortly after the R. pulmo highest aggregation by comparing the above model and observational data. In Sect. 5 the discussion of results and conclusions are given.
The Gulf of Trieste, the northernmost part of the Mediterranean Sea, is a mid-latitude semi-enclosed marginal basin situated in the Adriatic Sea (Fig. 2). Despite its relatively small size ( km; average depth: ∼19 m, maximum depth: ∼25 m), the GOT together with the northernmost part of the Adriatic shelf are of great oceanographic importance as hotspots of North Adriatic Dense Water (NAdDW) formation due to shelf convection (Pullen et al., 2007; Jeffries and Lee, 2007). The role of dense shelf water formation in deep-basin processes has recently been perceived as important, changing the concept that only the open ocean plays a substantial role in driving thermohaline circulation in the global ocean and deep basins (Allen and Durrieu de Madron, 2009). The generated NAdDW flows as a dense current along the western Adriatic shelf, replacing the old waters in the middle and southern Adriatic pits (Jabuka and southern Adriatic, respectively; Vilibić et al., 2004; Bensi et al., 2013; Vilibić and Mihanović, 2013). The NAdDW partly transforms into Adriatic Dense Water (AdDW) during deep convection processes in the southern Adriatic, and the AdDW subsequently flows out of the Adriatic through the Strait of Otranto, sinking to the Ionian deep layers and affecting the whole deep eastern Mediterranean (Robinson et al., 2001).
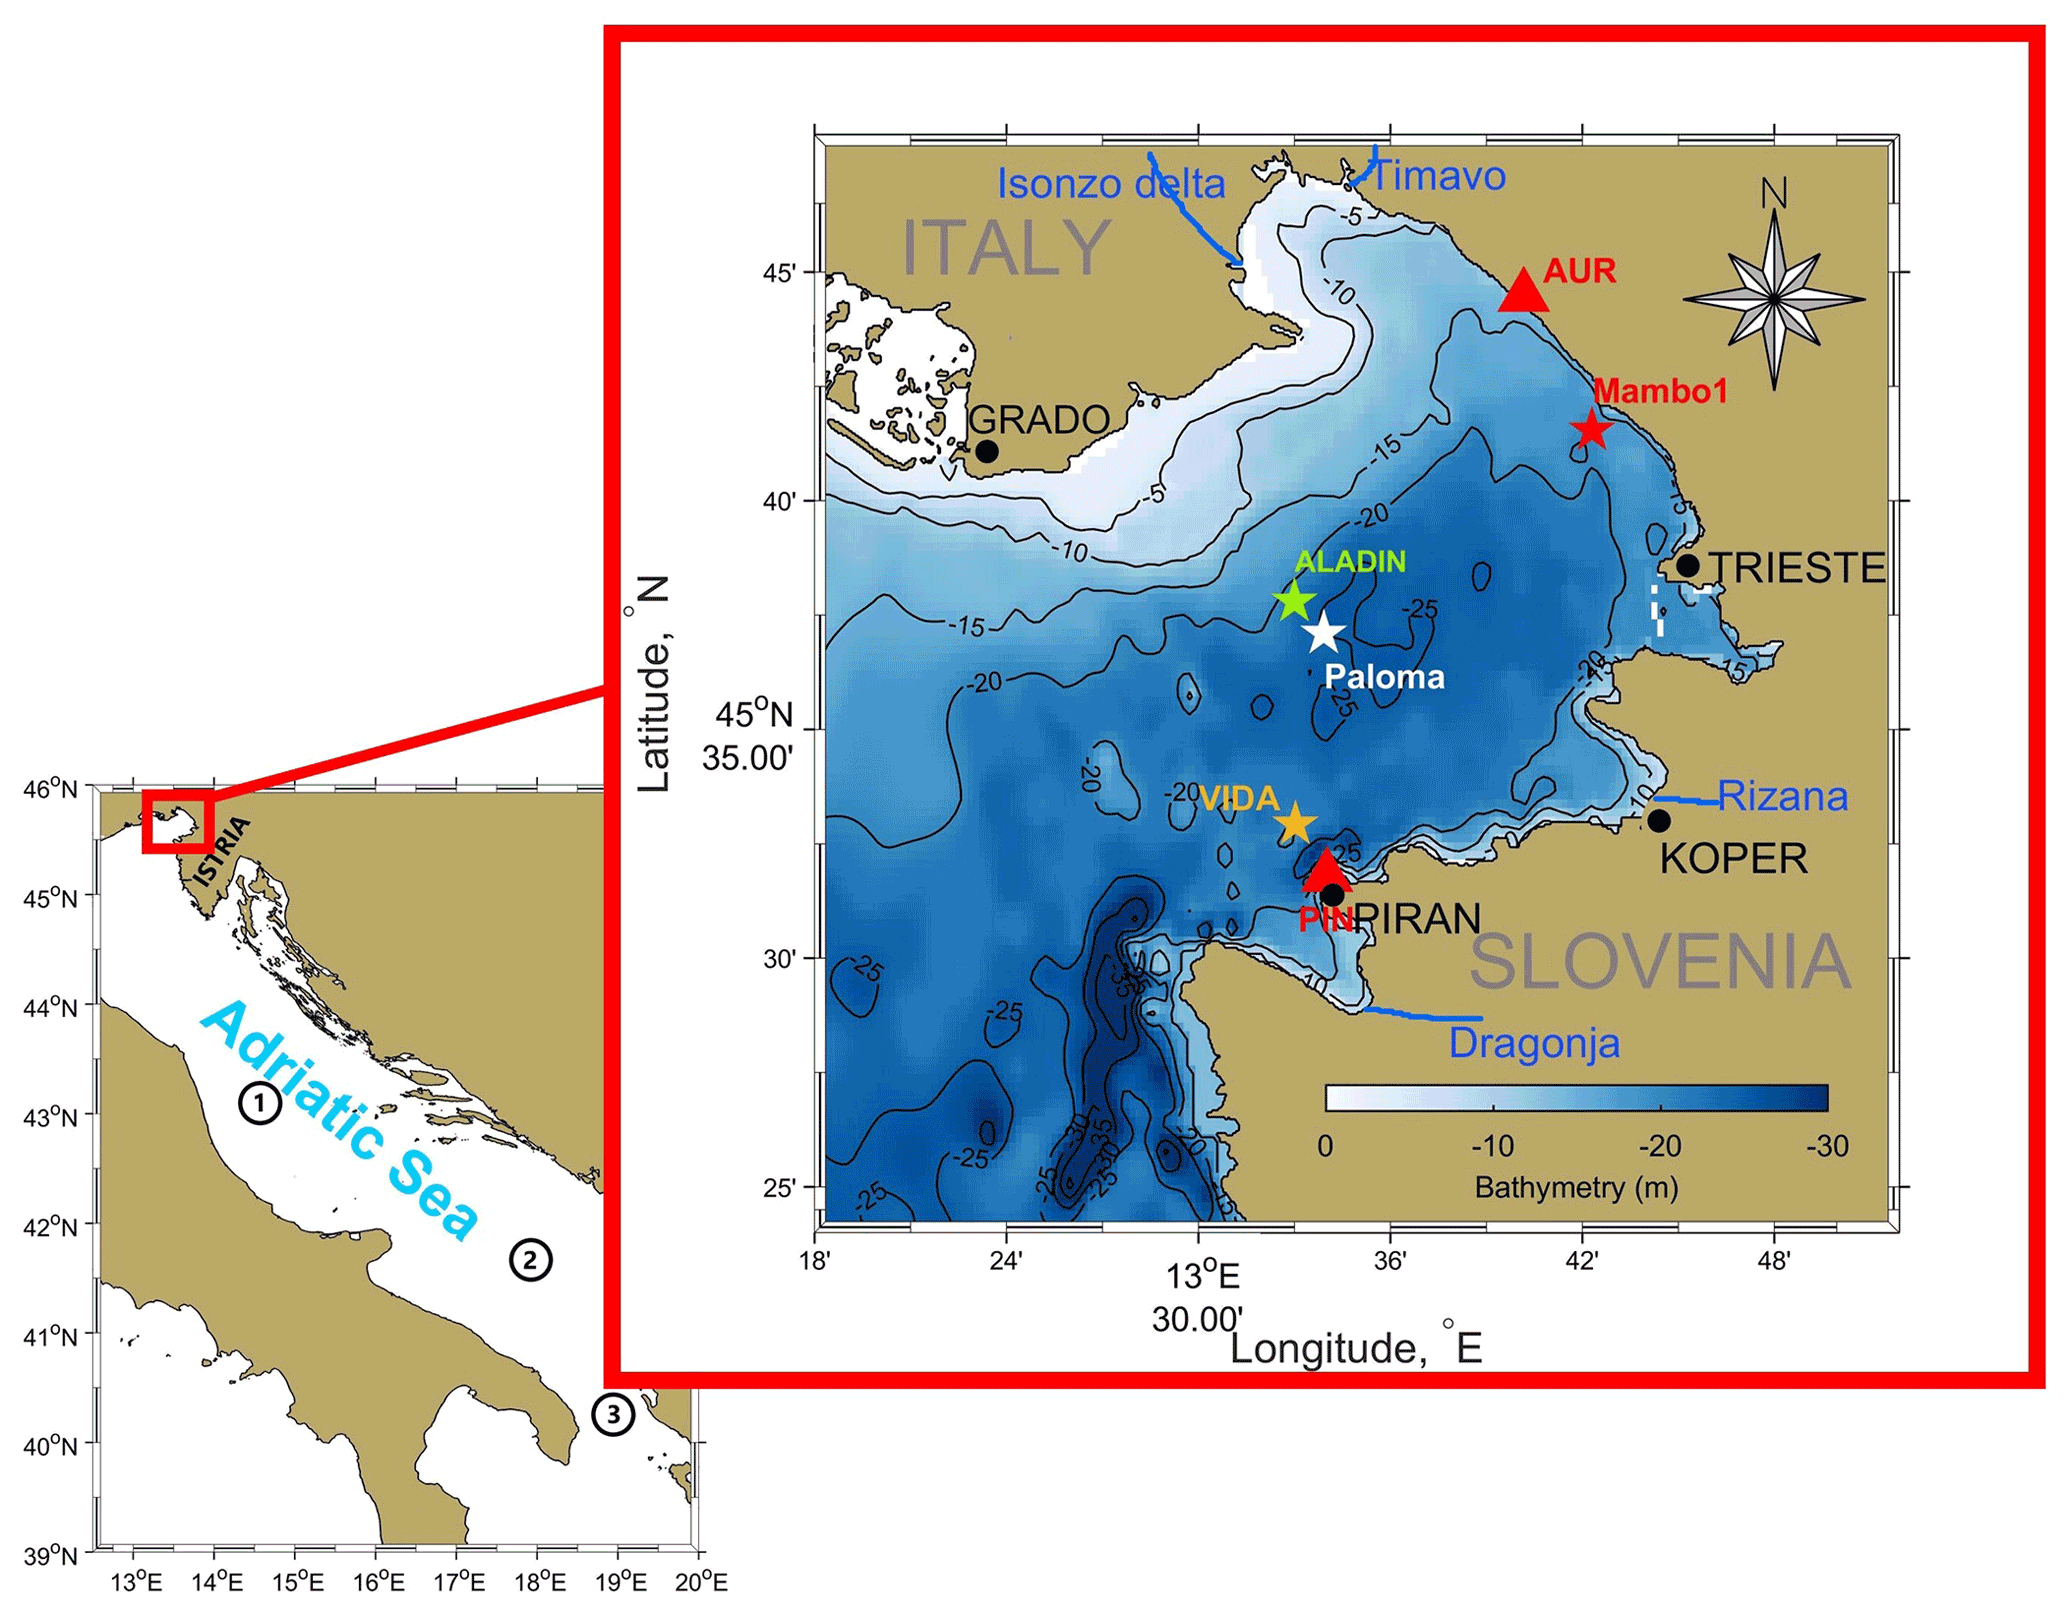
Figure 2R. pulmo Adriatic Sea coastline map and Gulf of Trieste bathymetry (GOT, red box) with locations where the multi-platform data were extracted. The colour bar represents the GOT bathymetry, as do the contour lines. Blue lines represent the main rivers influencing the area. The green star indicates the locations where ALADIN model wind data were extracted, while the orange star shows the VIDA buoy position. The white star represents the location of the Paloma site where CTD ship measurements were taken. Red triangles represent the location of high-frequency radar stations, and the red star indicates the position of the MAMBO1 buoy. Numbers represent the following: 1, Jabuka or middle Adriatic pit; 2, southern Adriatic pit; 3, Strait of Otranto.
The main winds influencing the atmospheric and oceanographic circulation dynamics in the GOT are the cold–dry bora with an ENE direction and the warmer Scirocco with a SE to SSW direction (Stravisi, 1977; Poulain and Raicich, 2001). Bora episodes are gusty and intense, blowing intermittently from land over the GOT, predominantly in autumn–winter. The bora jet is responsible for most of the mean net heat loss of the Adriatic Sea (Dorman et al., 2006; Cosoli et al., 2013; Raicich et al., 2013), as well as for the vertical mixing of the water column, dense water formation, and the renewal of intermediate and bottom water masses (Querin et al., 2021). Although spring–summer bora episodes are weaker, it remains the main meteorological forcing in the GOT (Querin et al., 2006).
The GOT circulation is mostly cyclonic (counterclockwise) due to currents flowing northwards along the Istrian coast, entering the gulf at its southern part. The circulation is modulated daily by the local atmospheric conditions (Querin et al., 2006) and by the inertial confinement of the Isonzo river plume to the northern coast of the GOT. From time to time, the circulation pattern changes anticyclonically (Cosoli et al., 2012; Querin et al., 2021) due to an increase in the freshwater input from the Isonzo river (yearly average flow rate varying from 100 to 200 m3 s−1, Covelli et al., 2004). Indeed, river discharge from the Isonzo, as well as from the Dragonja, Rižana and Timavo rivers (Fig. 2), plays an active role in the dynamics of the gulf, collecting part of the precipitation from the land (Celio et al., 2002). During strong bora events the water in the surface layer is removed offshore (westward), inducing a westward pressure gradient which generates a compensating eastward bottom countercurrent, in turn inducing upwelling and mixing along the eastern coastal area of the GOT to keep the mass balance (Querin et al., 2006; Ličer et al., 2016). At the open boundary, there is an intense water mass exchange between the GOT and the Adriatic Sea (Ličer et al., 2016; Francé et al., 2021).
The gulf is also characterised by a shallow water column with large salinity and temperature variations (winter to summer: 10–38.5 and 4–29.2 ∘C, respectively, as described in Cardin and Celio, 1997, and Cozzi et al., 2020). When the water column is stratified, the surface layer is mostly wind-driven, while the lower layers exhibit the general compensating cyclonic circulation as described above. During winter the water column is completely mixed, while in spring intensified freshwater input and warming of the surface layer together contribute to the stratification, which increases even more in summer (Malačič et al., 2001; Cozzi et al., 2020).
In this study, we have analysed available data from different observational platforms in the GOT such as high-frequency radar and oceanographic buoys, conductivity–temperature–depth (CTD) data from survey campaigns, and satellite, model and reanalysis data as summarised in Table 1. All types of data (except CTD profiles, hydrometric levels and satellite SST) characterise the period from 20 March to 20 April 2021, which spans a period before and after the highest jellyfish aggregation, allowing the assessment of the stability conditions of the water column and its disposition for mixing. Satellite data were downloaded for the period between 1 January and 31 May 2021 and used to showcase the sea surface temperature trend in the GOT, while historical CTD ship measurements from January 2008 to July 2021 were used to determine the climatological characteristics of the study area. Hydrometric levels were used to assess the river run-off input in the GOT.
Table 1Main characteristics of the multi-platform physical dataset. Abbreviations stand for the following. HFR: high-frequency radar; CMEMS MFS: Mediterranean forecasting system by the Copernicus Marine Environment Monitoring Service; ECMWF: European Centre for Medium-Range Weather Forecasts; CTD ARPA FVG: conductivity, temperature and depth multi-parametric sonde data provided by the Regional Environmental Protection Agency of Friuli Venezia Giulia; SSC: sea surface currents; SST: sea surface temperature; T: temperature, S: salinity; θ: potential temperature; a.s.l.: above sea level, b.s.l.: below sea level.
3.1 Observational data
Half-hourly high-frequency radar (HFR) combined current data (u-zonal east–west and v-meridional north–south) from two beamforming WERA (Gurgel et al., 1999) stations (Fig. 2, red triangles) working at 24.5 MHz and operating in the GOT at a spatial resolution of 1.5 km were considered for the period shown in Table 1. The WERA system intrinsic estimates of zonal and meridional current errors amount to 1–3 m s−1 (Ličer et al., 2020). The data were analysed by applying the quality control standards from the EU high-frequency node and averaged on an hourly basis to standardise with the temporal resolution of CMEMS dataset. For the purpose of this study, the tidal component in HFR currents was not removed, as tidal forcing in the GOT is weak compared to the wind contribution, and, in any case, the astronomical tide contributes negligibly to transport through small residual currents (Cosoli et al., 2012; Querin et al., 2021). The datasets are publicly available at http://150.145.136.27:8080/thredds/HF_RADAR/HFR_NAdr/HFR_NAdr_catalog.html (last access: 24 November 2021).
Hourly surface (2 m) and bottom (15 m) temperature data from the MAMBO1 buoy were analysed for the period described in Table 1. The buoy is anchored at 45.692∘ N–13.705∘ E, 1.5 km away from the Italian coast in front of the Miramare Marine protected area (Fig. 2, red star), and belongs to a network of oceanographic buoys in the northern Adriatic Sea. Sea temperature at 2 m was acquired by a Sea-Bird SBE37-SM with an accuracy of ±0.005 ∘C, while the temperature at 15 m was acquired by a SeaCAT SBE16 v2 with an accuracy of ±0.002 ∘C. Detailed information on the buoy and data can be visualised at http://nettuno.ogs.it/ilter/GoTTs/ (last access: 23 March 2022).
Wind speed and direction data at 10 m a.s.l. along with surface and bottom temperature (3 and 22 m, respectively) were downloaded for the period in Table 1 from the VIDA buoy (Fig. 2, orange star), a coastal observation platform offshore of the city of Piran (Slovenia), moored in national waters at 45.548∘ N, 13.555∘ E. Wind speed and direction were acquired with a WindMaster Pro with an accuracy (12 m s−1) of 1.5 % RMSE and 2∘. The sea temperature at 3 m and 22 m beneath the surface was measured using a Sea-Bird 16plus SeaCAT with an accuracy of ±0.002 ∘C. Data were averaged in time from half-hourly to hourly to fit the other datasets, and they are available for download at the CMEMS in situ TAC website (http://www.marineinsitu.eu/dashboard/, last access: 25 November 2021). For a complete description of the system see Malačič (2019) and Ličer et al. (2020).
Daily gap-free satellite L4 sea surface temperature (SST) datasets with a spatial resolution of ∘ and accuracy of ±0.006 ∘C were extracted from the Copernicus Marine Service (CMEMS, Buongiorno Nardelli et al., 2013) over the area 45.396–45.896∘ N, 12.996–13.896∘ E for the study period in Table 1. Data were then spatially averaged over the extracted area to depict the SST trend in the GOT. This product is based on nighttime images collected by the infrared sensors mounted on different satellite platforms and can be accessed and downloaded at https://resources.marine.copernicus.eu/, last access: 27 August 2021, https://doi.org/10.48670/moi-00172 (product identifier, hereafter PI: SST_MED_sST_L4_NRT_OBSERVATIONS_010_004_c).
Further temperature measurements, collected on a prevalent monthly basis from multi-parametric sonde CTD at the Paloma site (∼45.613∘ N, ∼13.578∘ E, Fig. 2, white star), were provided (upon request) by ARPA FVG and analysed for the whole available period in Table 1. The 13-year dataset consists of a time series of CTD data measurements acquired with a Idronaut mod 316 plus from the surface to 25 dbar of depth at intervals of ∼1 dbar and with an accuracy of ±0.002 ∘C.
Isonzo river hydrometric levels were measured every 30 min by the Servizio Idrografico FVG with an ultrasonic water level CAE sensor. The data were provided upon request from a station positioned 14 km upstream of the Isonzo river mouth.
Data about the abundance of Rhizostoma pulmo in the Gulf of Trieste were obtained from the AvvistAPP dataset (https://doi.org/10.13120/h127-9v54; Tirelli et al., 2021) available from EMODnet Biology (https://www.emodnet-biology.eu/data-catalog?module=dataset&dasid=7972, last access: 9 August 2021) and in the reports that have been provided in the course of this study. All sightings were validated by scientists and grouped in three intervals of abundance, and values of abundance were attributed as follows: 1 corresponds to one individual per m−2 (hereafter ind m−2), 2 corresponds to 2–10 ind m−2, and 3 corresponds to more than 10 ind m−2. The daily R. pulmo abundance was obtained by averaging the abundance of data collected on the same day.
3.2 Models and reanalysis
Hourly model outputs of current (PI: med-cmcc-currents-an-fc-h), salinity (S, PI: med-cmcc-sal-an-fc-hts) and potential temperature (θ, PI: med-cmcc-tem-an-fc-hts) with a horizontal spatial resolution of ∘ were extracted over the domain 45.45–45.81∘ N and 13.4–13.9∘ E from the Mediterranean Forecasting System (MFS, http://marine.copernicus.eu, last access: 24 March 2022). The downloaded six (unequally spaced) vertical levels of the S and θ products (hts) cover depths from ∼1 to ∼20 m, while the eight (unequally spaced) vertical levels of the current product (h) cover depths ranging ∼1 to ∼20 m. Surface currents (level 1, L1 ≈1 m), S and θ were spatially averaged over the extracted grid, and potential density (σθ) was calculated using a MATLAB toolbox: ocean (http://mooring.ucsd.edu/software/matlab/doc/ocean/mindex_ocean.html, last access: 24 August 2021). Model data were used to estimate the structure of the water column and its thermohaline properties, as well as the circulation in the gulf, mainly to complete the temporal and spatial coverage of various parameters when observations were not available or their spatial and temporal resolution was not suitable. Data are publicly available at https://doi.org/10.25423/CMCC/MEDSEA_ANALYSISFORECAST_PHY_006_013_EAS6 (last access: 24 March 2022, Clementi et al., 2021).
Hourly wind fields from the operational atmospheric model ALADIN, run by the Slovenian Weather Service (ARSO) with a spatial resolution of 4.4 km extracted at 45.5488∘ N–13.5505∘ E (Fig. 2, green star), were analysed over the period indicated in Table 1 to assess whether the measurements from the coastal buoy VIDA are representative of the wind forcing in the centre of the GOT. For a complete description of the model see Termonia et al. (2018) and Strajnar et al. (2019).
Net surface heat flux was obtained from hourly atmospheric data from the European Centre for Medium-Range Weather Forecasts (ECMWF) ERA5 (Hersbach et al., 2018) for the period in Table 1 with a spatial resolution of and averaged at daily time steps. Due to this resolution, only one point was available in the study area (45.5∘ N, 13.5∘ E) to calculate the surface net heat flux QNET W m−2, which is defined as the sum of the following components (Eq. 1): surface net longwave backscatter radiation (QLWR), surface net shortwave solar radiation (QSWR), surface sensible heat flux (QH) and surface latent heat flux (QL).
where QSWR and QLWR represent the radiative terms, and QH and QL represent the turbulent terms. Here, the positive value in each flux indicates that heat is transferred from the atmosphere to the ocean (Tomita and Kubota, 2004; Tomita et al., 2021; Marullo et al., 2021).
Citizen science data collected with AvvistAPP show that R. pulmo was seen in the GOT during the whole period of the time series in Fig. 3. In the period 1 January–7 August we collected a similar number of sightings (117 and 114 in 2020 and 2021, respectively), but the highest abundance (more than 10 ind m−2) was recorded for most sightings in April 2021. High abundances of R. pulmo were occasionally reported in 2020, but the highest observed abundances during that year (Fig. 4) were always lower than those observed in April 2021 and represented jellyfish aggregations in a limited area, which is smaller than the large aggregation of R. pulmo observed in April 2021.

Figure 3Rhizostoma pulmo abundance in the Gulf of Trieste as reported by citizen sightings – in AvvistAPP – from July 2019 to August 2021.
To understand the causes behind the exceptional R. pulmo jellyfish aggregation observed in April 2021, we analysed the spatial and temporal variability of oceanographic and meteorological conditions in the GOT in the period prior to, during and after the peak of jellyfish aggregation. Moreover, considering the important role played by the temperature in jellyfish physiology, sea temperature seasonality in the Gulf of Trieste over the last decade was also analysed.
4.1 Meteo-oceanographic variability
We analysed the available observed and modelled wind data (VIDA and ALADIN, in Table 1), along with the sea surface current (HFR and CMEMS) time series, from 20 March to 20 April 2021, a period encompassing the bora and jellyfish bloom events. As radar data only covered the surface layer and no current data were available along the water column, it was therefore necessary to use model data. To comply with the data and to understand the sea conditions before, during and shortly after the jellyfish bloom, spatially averaged sea surface currents (SSCs) from the CMEMS model and HFR observations were used to calculate SSC speed as shown in Fig. 5. To assess the goodness of the modelled data, RMSE (root mean squared error) was normalised by the difference between maximum and minimum measurements (HFR and VIDA observations). NRMSE (normalised RMSE) and Pearson correlations between the modelled and the observed dataset were calculated (Table 2). Qualitatively, the comparison between the model and observations for the SSC and wind time series shows good agreement (Fig. 5a, b, respectively). Indeed, the NRMSE value for the SSC is low (Table 2), meaning that on average the difference between the two time series is small, while the correlations are particularly good along the longitudinal direction, showing that CMEMS currents fit the observed HFR ones well. This result indicates that model data could be confidently used whenever observations are missing. Therefore, the currents below the surface were represented by CMEMS model outputs, while the surface ones are represented by HFR measurements henceforth.
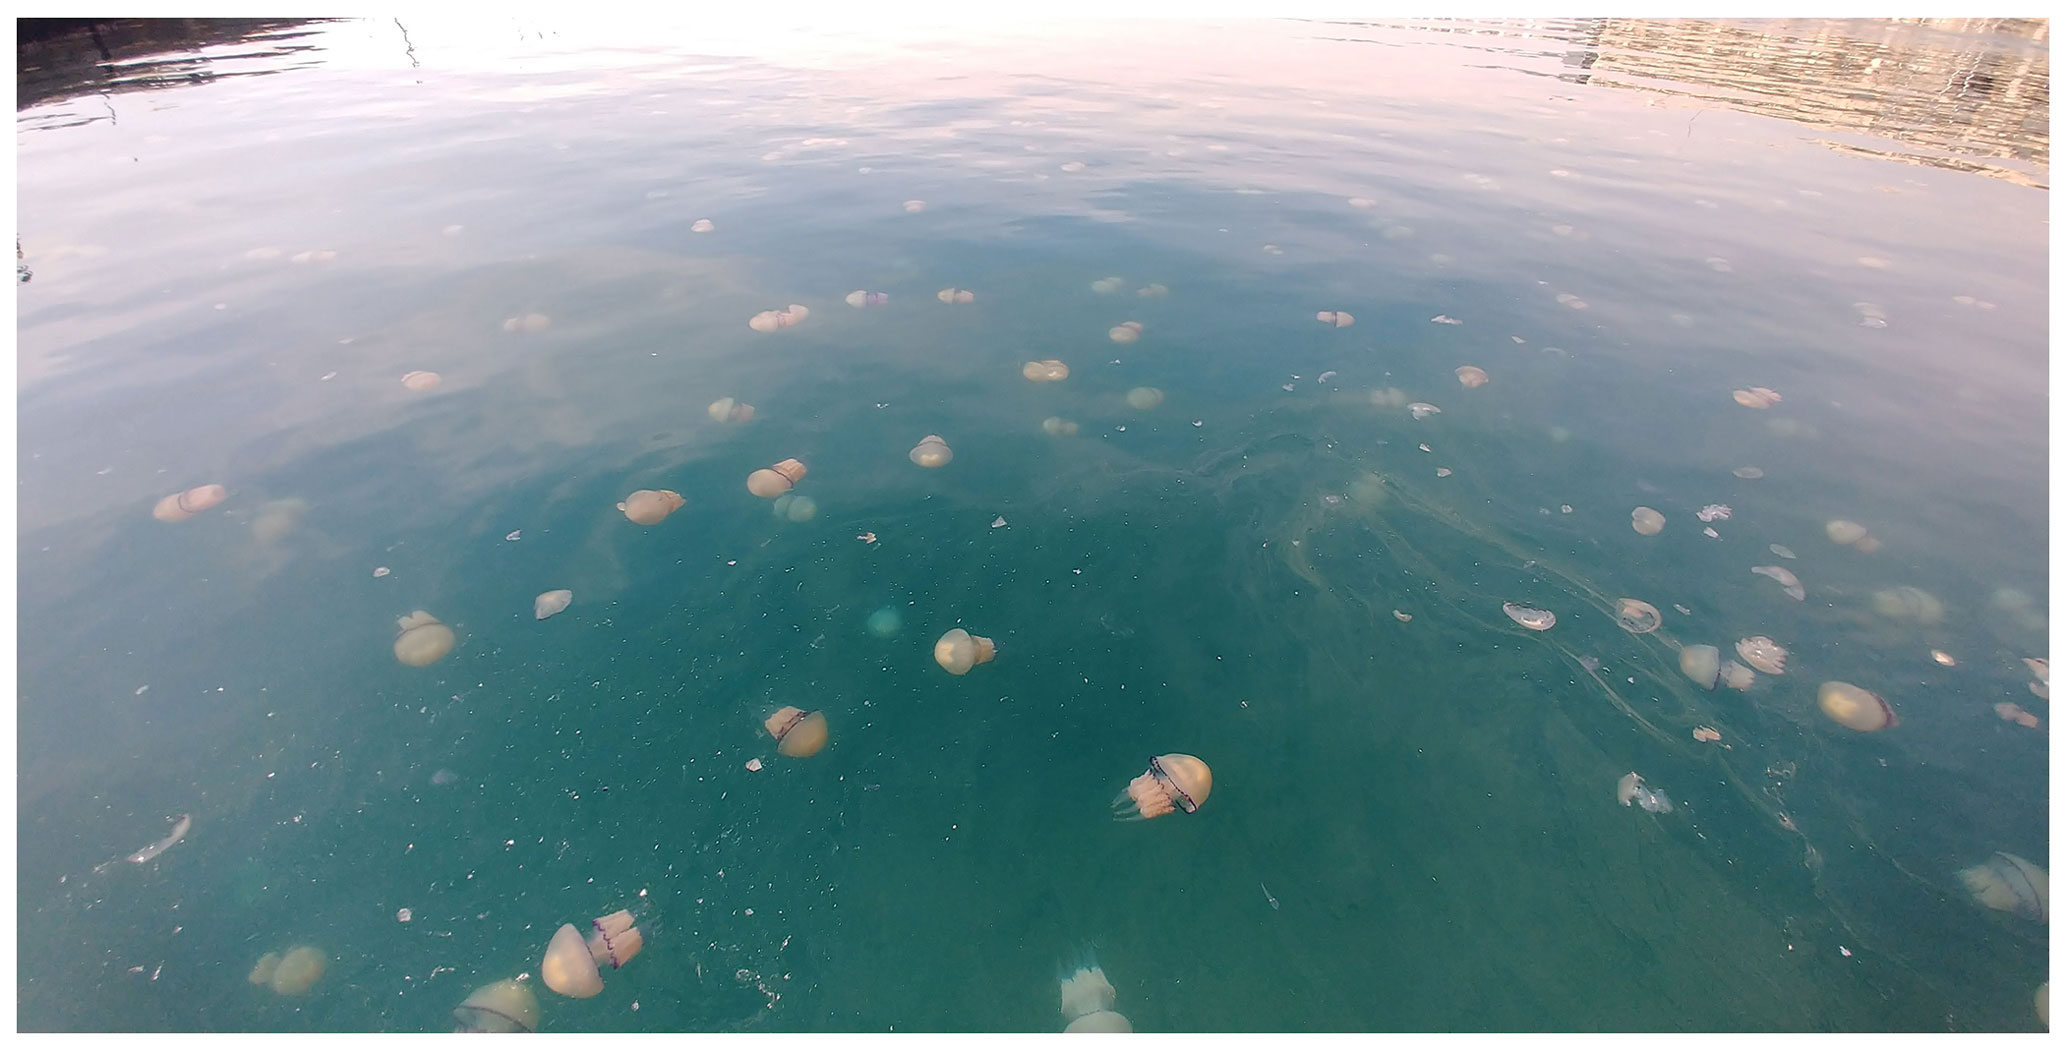
Figure 4Picture sent to AvvistAPP for the sighting of Rhizostoma pulmo (abundance of >10 ind m−2) in the GOT in April 2020.
Table 2Comparison statistics (NRMSE and correlation coefficients) between observed and model time series (768 samples considered). Abbreviations correspond as follows. NRMSE, normalised root mean squared error; corr-u, correlation in the zonal velocity component; corr-v, correlation in the meridional velocity component; corr-sp, speed correlation. RL and RU correspond to lower and upper limits for the correlation coefficients with a 95 % confidence interval.
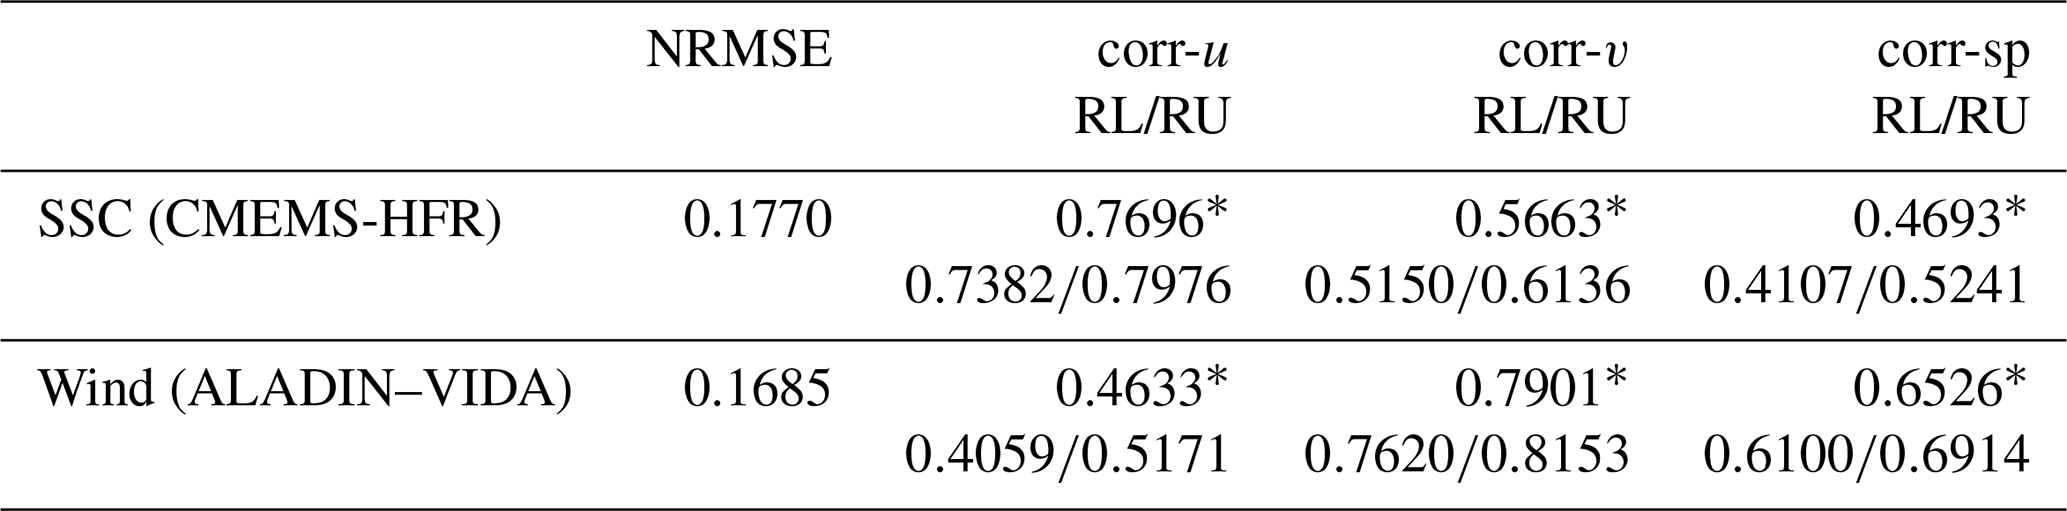
∗ Statistically significant correlation (p value <0.05).
Since wind observations were not available at the centre of the GOT where most of the other datasets were measured, and in order to understand if VIDA wind data (subcoastal) could be considered representative of the central part of the GOT, a comparison between VIDA and ALADIN wind time series was performed. Although Fig. 5b shows good qualitative agreement between the time series, the model outputs underestimated the observed ones, especially on the days when the wind was stronger. Moreover, the NRMSE presents a value close to zero and the correlation coefficients are fairly good, as shown in Table 2. VIDA wind measurements are consequently considered a good representation of the wind in the GOT and will be used henceforth in this study. Finally, a pronounced influence of the wind on the circulation of the GOT was supported by the significant correlation between SSC and wind, mainly along the u component, as expected. The correlation for the u component attains the value of 0.5656 (lower limit 0.5142, upper limit 0.6131 at 95 % confidence level) for the entire period, which greatly increases to 0.7384 (lower limit 0.6320, upper limit 0.8174 at 95 % confidence level) during the strong bora wind event (3–6 April, shaded area in Fig. 5). The correlation for the v component is very small (0.1802) and not significant.
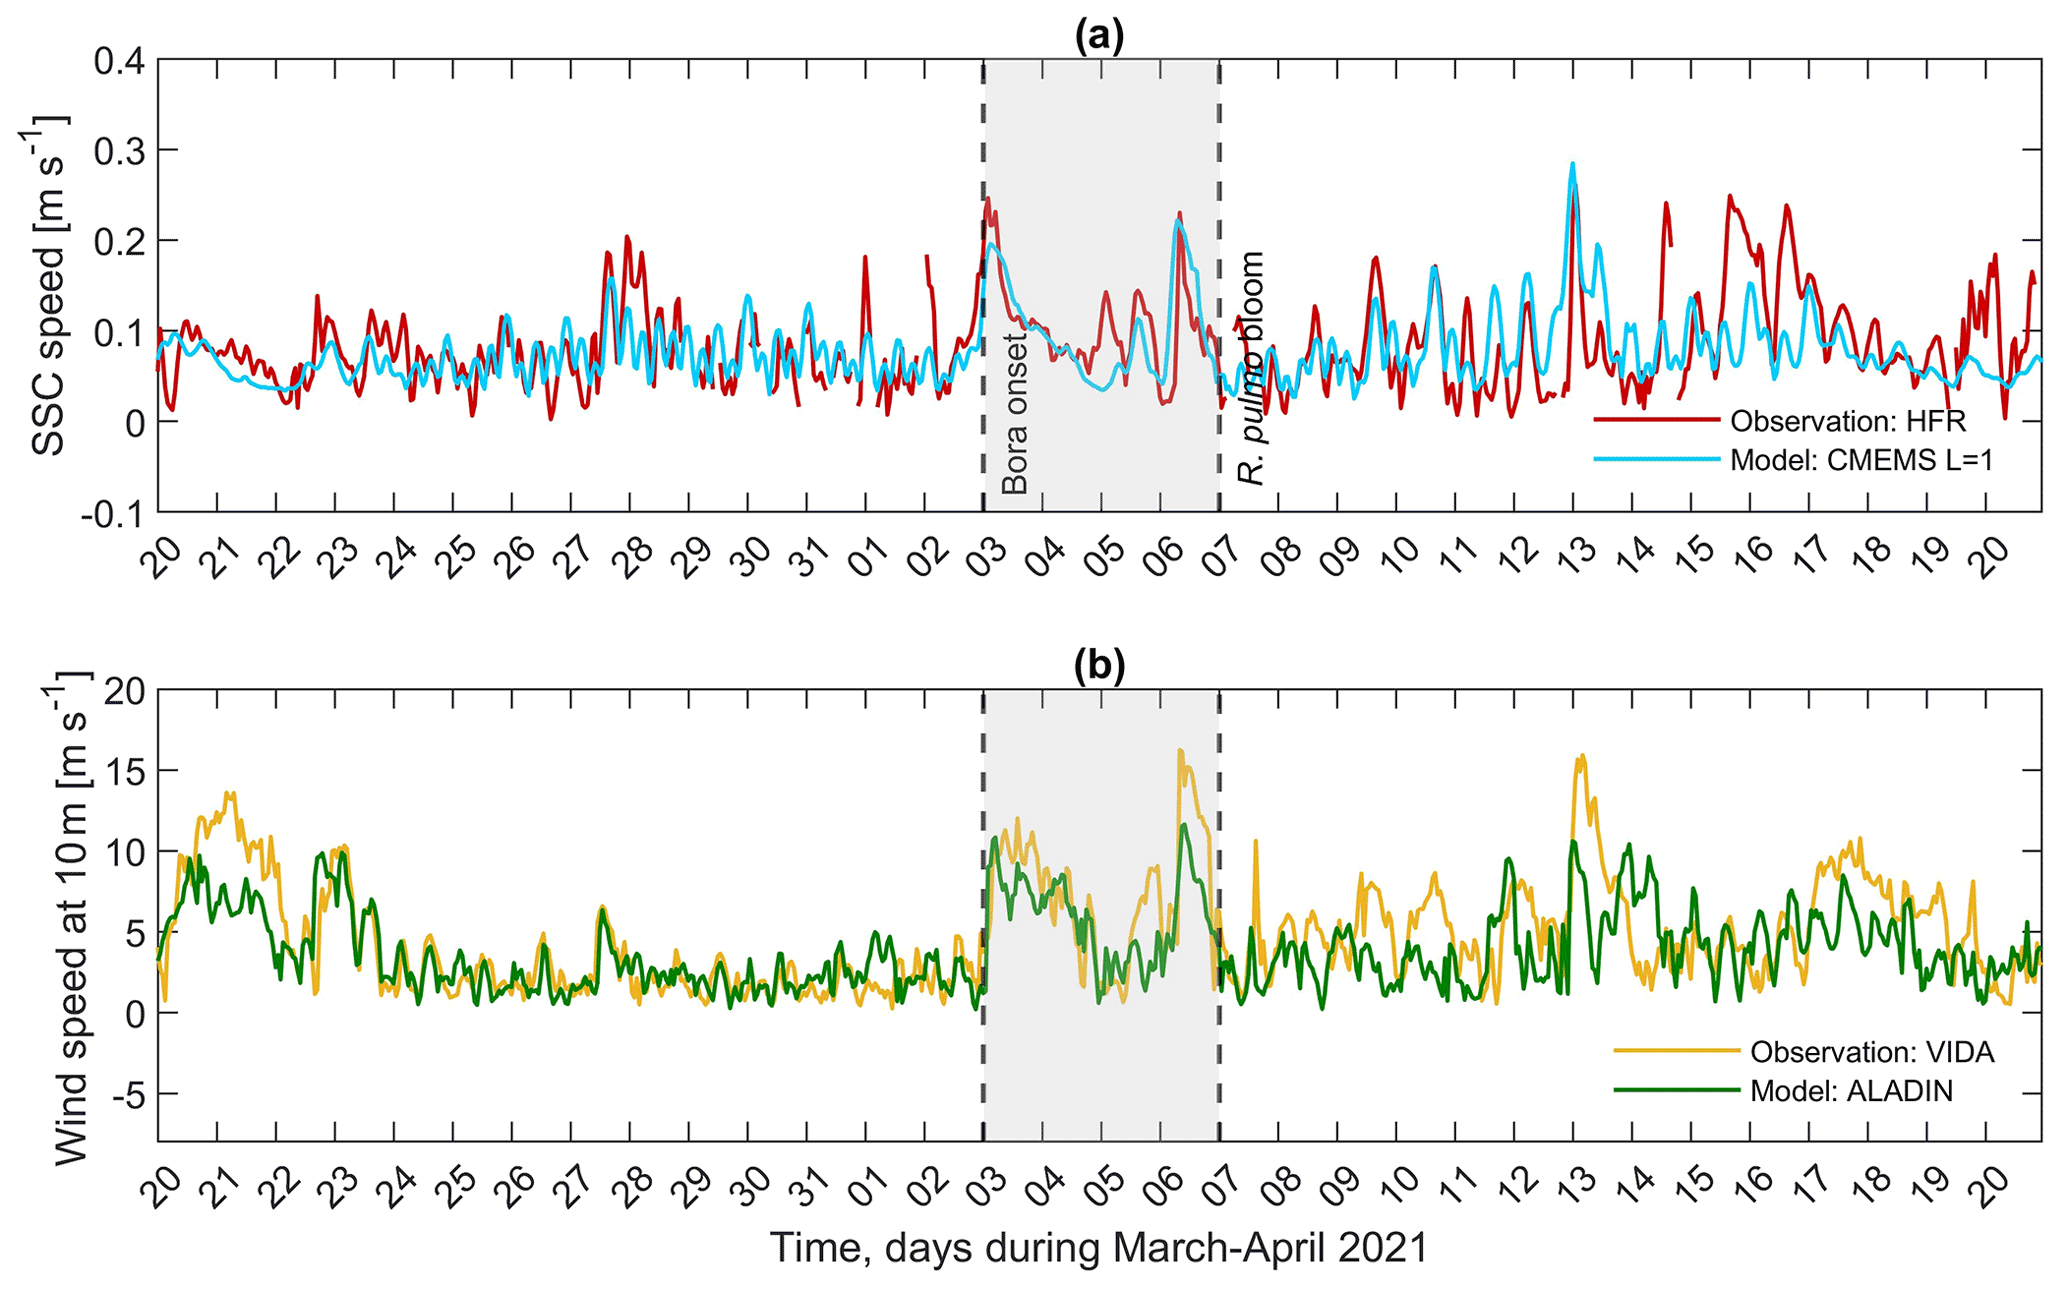
Figure 5Times series of hourly (a) sea surface current (SSC) speed from the CMEMS physical model (blue line) and HF radar (red line) spatially averaged over the extracted area. (b) Wind speed from the ALADIN atmospheric model (green line) and VIDA buoy (orange line) extracted at 13.55∘ E, 45.55∘ N and 13.55∘ E, 45.63∘ N, respectively, from 20 March to 20 April 2021. The shaded area represents the bora–bloom period, with the left dashed black line delimiting the start of the bora episode and the right dashed black line representing the day when the jellyfish bloom was reported by the media and citizens.
The wind speed time series depicted in Fig. 5b shows how a strong bora episode started to build up in the late evening of 2 April 2021, reaching a wind speed of 10.49 m s−1 (∼38 km h−1) at around 03:30 UTC and a maximum of 12.69 m s−1 (∼46 km h−1) at 13:30 UTC on the same day. During 3 April, wind gusts oscillated between 10 and 17 m s−1 (36–61 km h−1), with the maximum recorded at 13:30 UTC. SSC data also showed the effect of the strong bora event, as SSC speeds increased and reached their maximums around the same time as the wind (Fig. 5a, shaded area). Maximum values of SSC speeds were measured from HFR at 02:00 UTC on 3 April with a peak value of 0.26 m s−1. The aforementioned bora episode lasted approximately 3 d, followed by a calm wind on the morning of 5 April (∼1 m s−1) and by two peaks: the first took place on the evening of the same day with a wind speed of ∼8.37 m s−1 (∼30 km h−1), and the second took place in the early morning of 6 April, reaching 16.24 m s−1 (∼58 km h−1). The response of the SSC to this wind maximum is observed by the peak recorded on the morning of 6 April (∼0.23 m s−1).
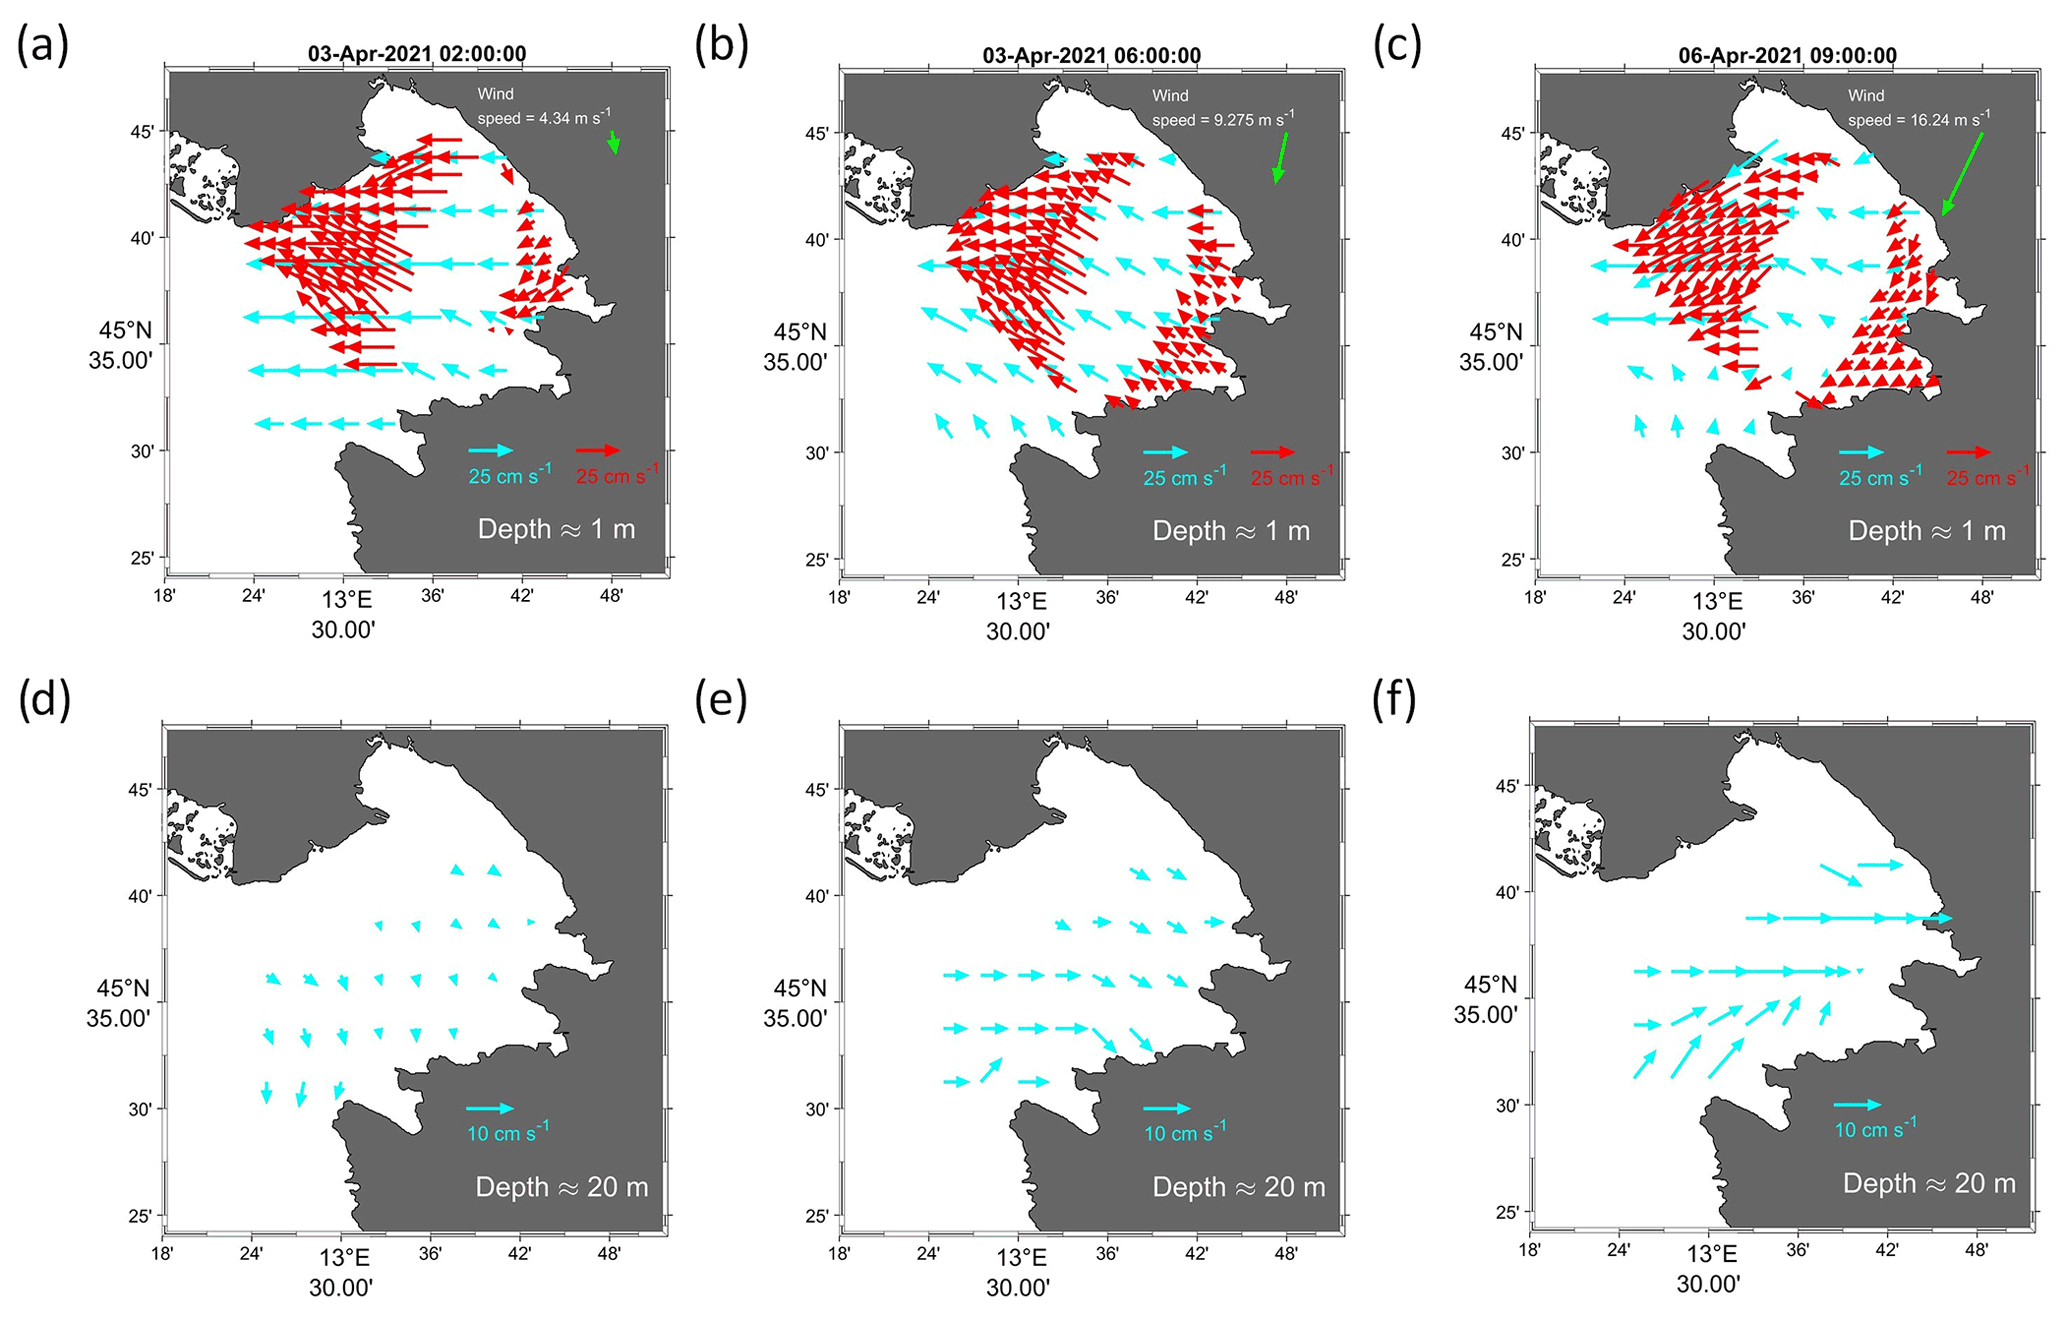
Figure 6Maps of surface currents at ∼1 m from the CMEMS model (blue arrows) and HFR (red arrows) on 3 April 2021 at 02:00 UTC (a) and 06:00 UTC (b), as well as on 6 April 2021 at 09:00 UTC (c). Maps of bottom currents at ∼20 m from the CMEMS model (blue arrows) on 3 April 2021 at 02:00 UTC (d) and 06:00 UTC (e), as well as on 6 April 2021 at 09:00 UTC (f). Green arrows represent wind speed in metres per second (m s−1).
Figure 6 shows the output of CMEMS model (blue vectors) and HFR measurements (red vectors) on 3 April at t1=02:00 UTC and t2=06:00 UTC, as well as on 6 April 2021 at 09:00 UTC at two different levels representing surface (a, b, c, upper panels) and bottom currents (d, e, f, lower panels). It can be seen that after the action of the wind, in the surface layer the water was pushed westwards, leading to offshore water removal (Fig. 6a, b, c). Consequently, in the bottom layer the compensating eastward countercurrent started to build up (Fig. 6d, e, f). It is known that the bora wind pushes water out of the GOT at the surface, particularly in conditions of low Isonzo river run-off (Querin et al., 2006), as occurred during March and early April 2021 (Fig. 7). To satisfy the mass balance, water from the bottom layer is pumped up vertically, enhancing the upwelling on the eastern side of the gulf, thus replacing the water that was pushed away. During this process, the water masses below the surface are pulled inshore and the countercurrent is set up (Malačič and Petelin, 2009; Querin et al., 2006, 2021). Querin et al. (2006) showed that after 3 h of the bora wind onset the bottom layer separated from the surface layer and the direction of the horizontal bottom current was opposite to the wind forcing. The same process was observed in spring 2021 when on 3 and 6 April, after a couple of hours, the wind had set up the bottom countercurrent (Fig. 6b, e, c, f). The bora displaced the surface water from the gulf, stranding many jellyfish on the coast of Grado (right-hand panel in Fig. 1), and at the same time, thanks to the countercurrent, it pushed up the deeper waters, transporting them towards the coast and carrying the jellyfish that subsequently accumulated on the shores of the city of Trieste (left and central panels of Fig. 1).
4.2 Thermohaline variability
As pointed out in the previous section, the effect of mixing, currents and coastal upwelling induced the bottom dense water of the GOT to reach the eastern flank. During this process, cooler subsurface water was brought up to the surface, as can be seen from the daily satellite surface temperature (SST) maps in Fig. 8a. Before the bora event, the surface layer was warming, as shown by SST maps from 31 March 2021, with values of ∼13 to 14.5 ∘C by 3 April 2021. During the bora onset, the water column got thoroughly mixed, as shown by the SST map on 5 April in Fig. 8a, occupying the eastern flank of the GOT with values ∼11 ∘C. As expected, the response of the sea to the wind forcing was detected ∼2 d later. After the generated upwelling and the mixing of the water column, a cold layer occupied the surface of the gulf for several days (5 to 13 April in Fig. 8a).
Satellite SST times series obtained by spatially averaging over the extracted area (Fig. 8b) confirmed the spring-type positive trend, i.e. warming up of the surface layer, with the maximum SST reached just before the bora event. Indeed, the surface layer shows the maximum on 3 April of ∼14.56 ∘C, in agreement with the average value of 14.45±1.12 ∘C reported by ARPA FVG in its monthly sea-state bulletin for the period 2014–2019 (http://cmsarpa.regione.fvg.it/export/sites/default/tema/acqu a/acque-marino- costiere-e-lagunari/approfondimenti/bollett ino_web/2021/2021-04-Stato-oceanografico -ed-ecologico-del-Golfo-di-Trieste.pdf, last access: 8 August 2022). The effect of the bora is evidenced by a ∼3.5 ∘C drop in the SST (dashed black line labelled “bora onset” in Fig. 8d), which lasted for several days, as confirmed by data from the ARPA FVG CTD surveys on 14–16 April 2021 (not shown). Around 20 April, the surface layer started to warm up again, following a positive trend (Fig. 8b).
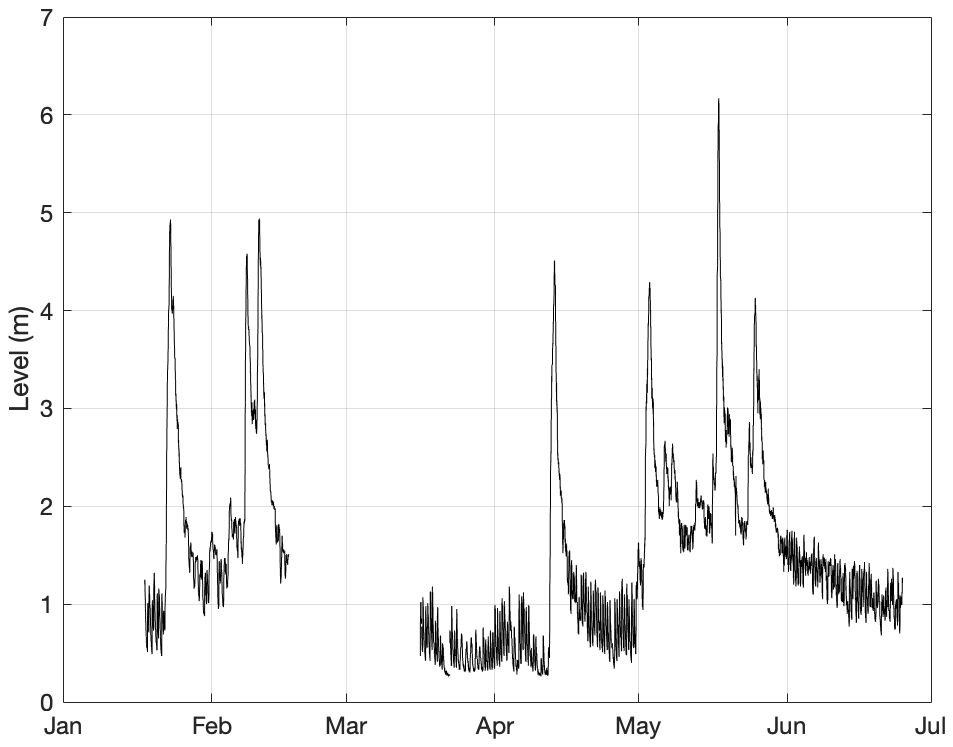
Figure 9a–c depict the mean water column structure from the model for the period 20 March to 20 April 2021. At the beginning of the considered period, the warming of the surface layer and stratification started, and the water column structure can be divided into three layers: surface (s, 1–4 m depth), intermediate (i, 4–10 m depth) and bottom (b, 10–20 m). The thickness of the surface and intermediate layers increases with time as part of the stratification process. Before the bora episode struck the GOT, the thermohaline characteristics of the surface layer were Ss≈36.50 g kg−1, θs≈13.60 ∘C and σθs≈27.50 kg m−3. At the intermediate layer they were Si≈37.50 g kg−1, θi≈11.85 ∘C and σθi≈28.80 kg m−3 and at the bottom layer Sb≈38.38 g kg−1, θb≈11.10 ∘C and σθb≈29.5 kg m−3. The onset of the stratification after 28 March is also evident in the temperature time series collected at MAMBO1 and VIDA buoys (Fig. 9d).
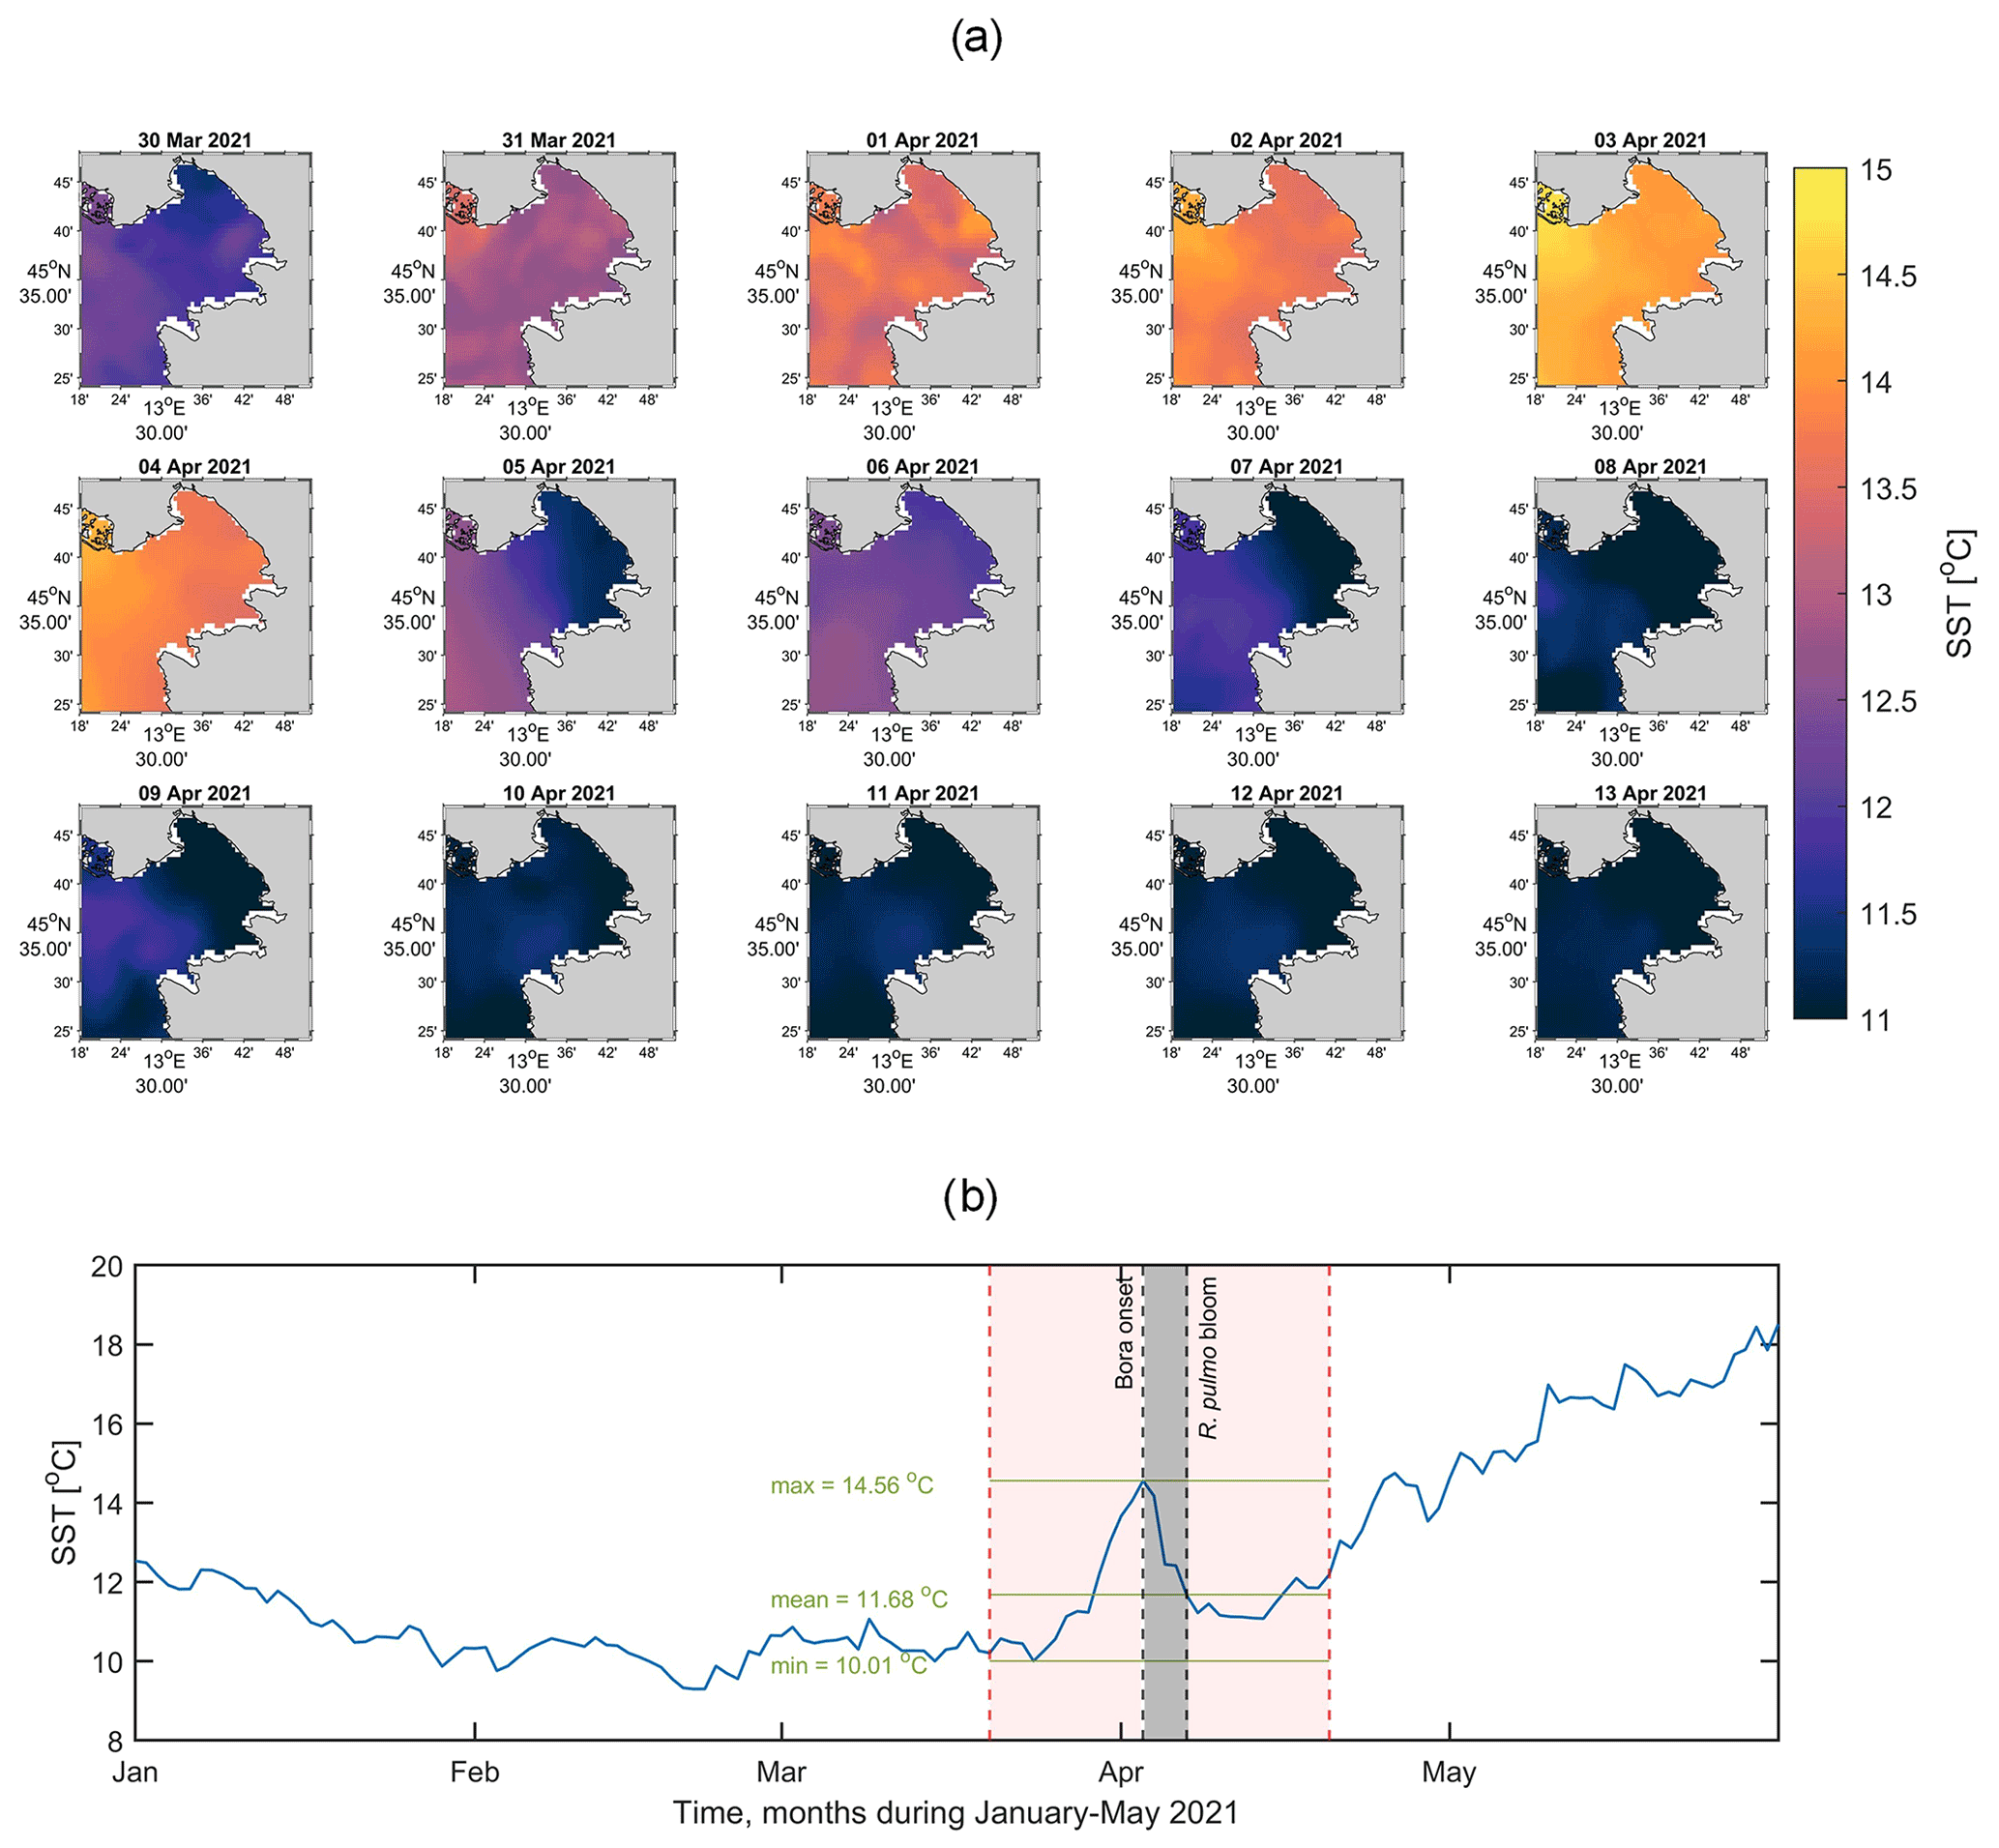
Figure 8(a) Maps of daily SST showing the evolution of the surface temperature field and the effect of the bora wind in the GOT from 30 March to 13 April 2021. Here the colour bar represents the SST field in degrees Celsius (∘C). (b) Time series of the aforementioned dataset spatially averaged over the extracted area for the period 1 January to 30 May 2021. The shaded grey area represents the bora–bloom period, with the left black dashed line delimiting the start of the bora episode and the right black dashed line representing the day when the jellyfish bloom was reported by the media and citizens. The shaded red are between the dashed vertical red lines delimits the interval 20 March–20 April 2021, and the green lines represent the max, mean and min values during this interval.
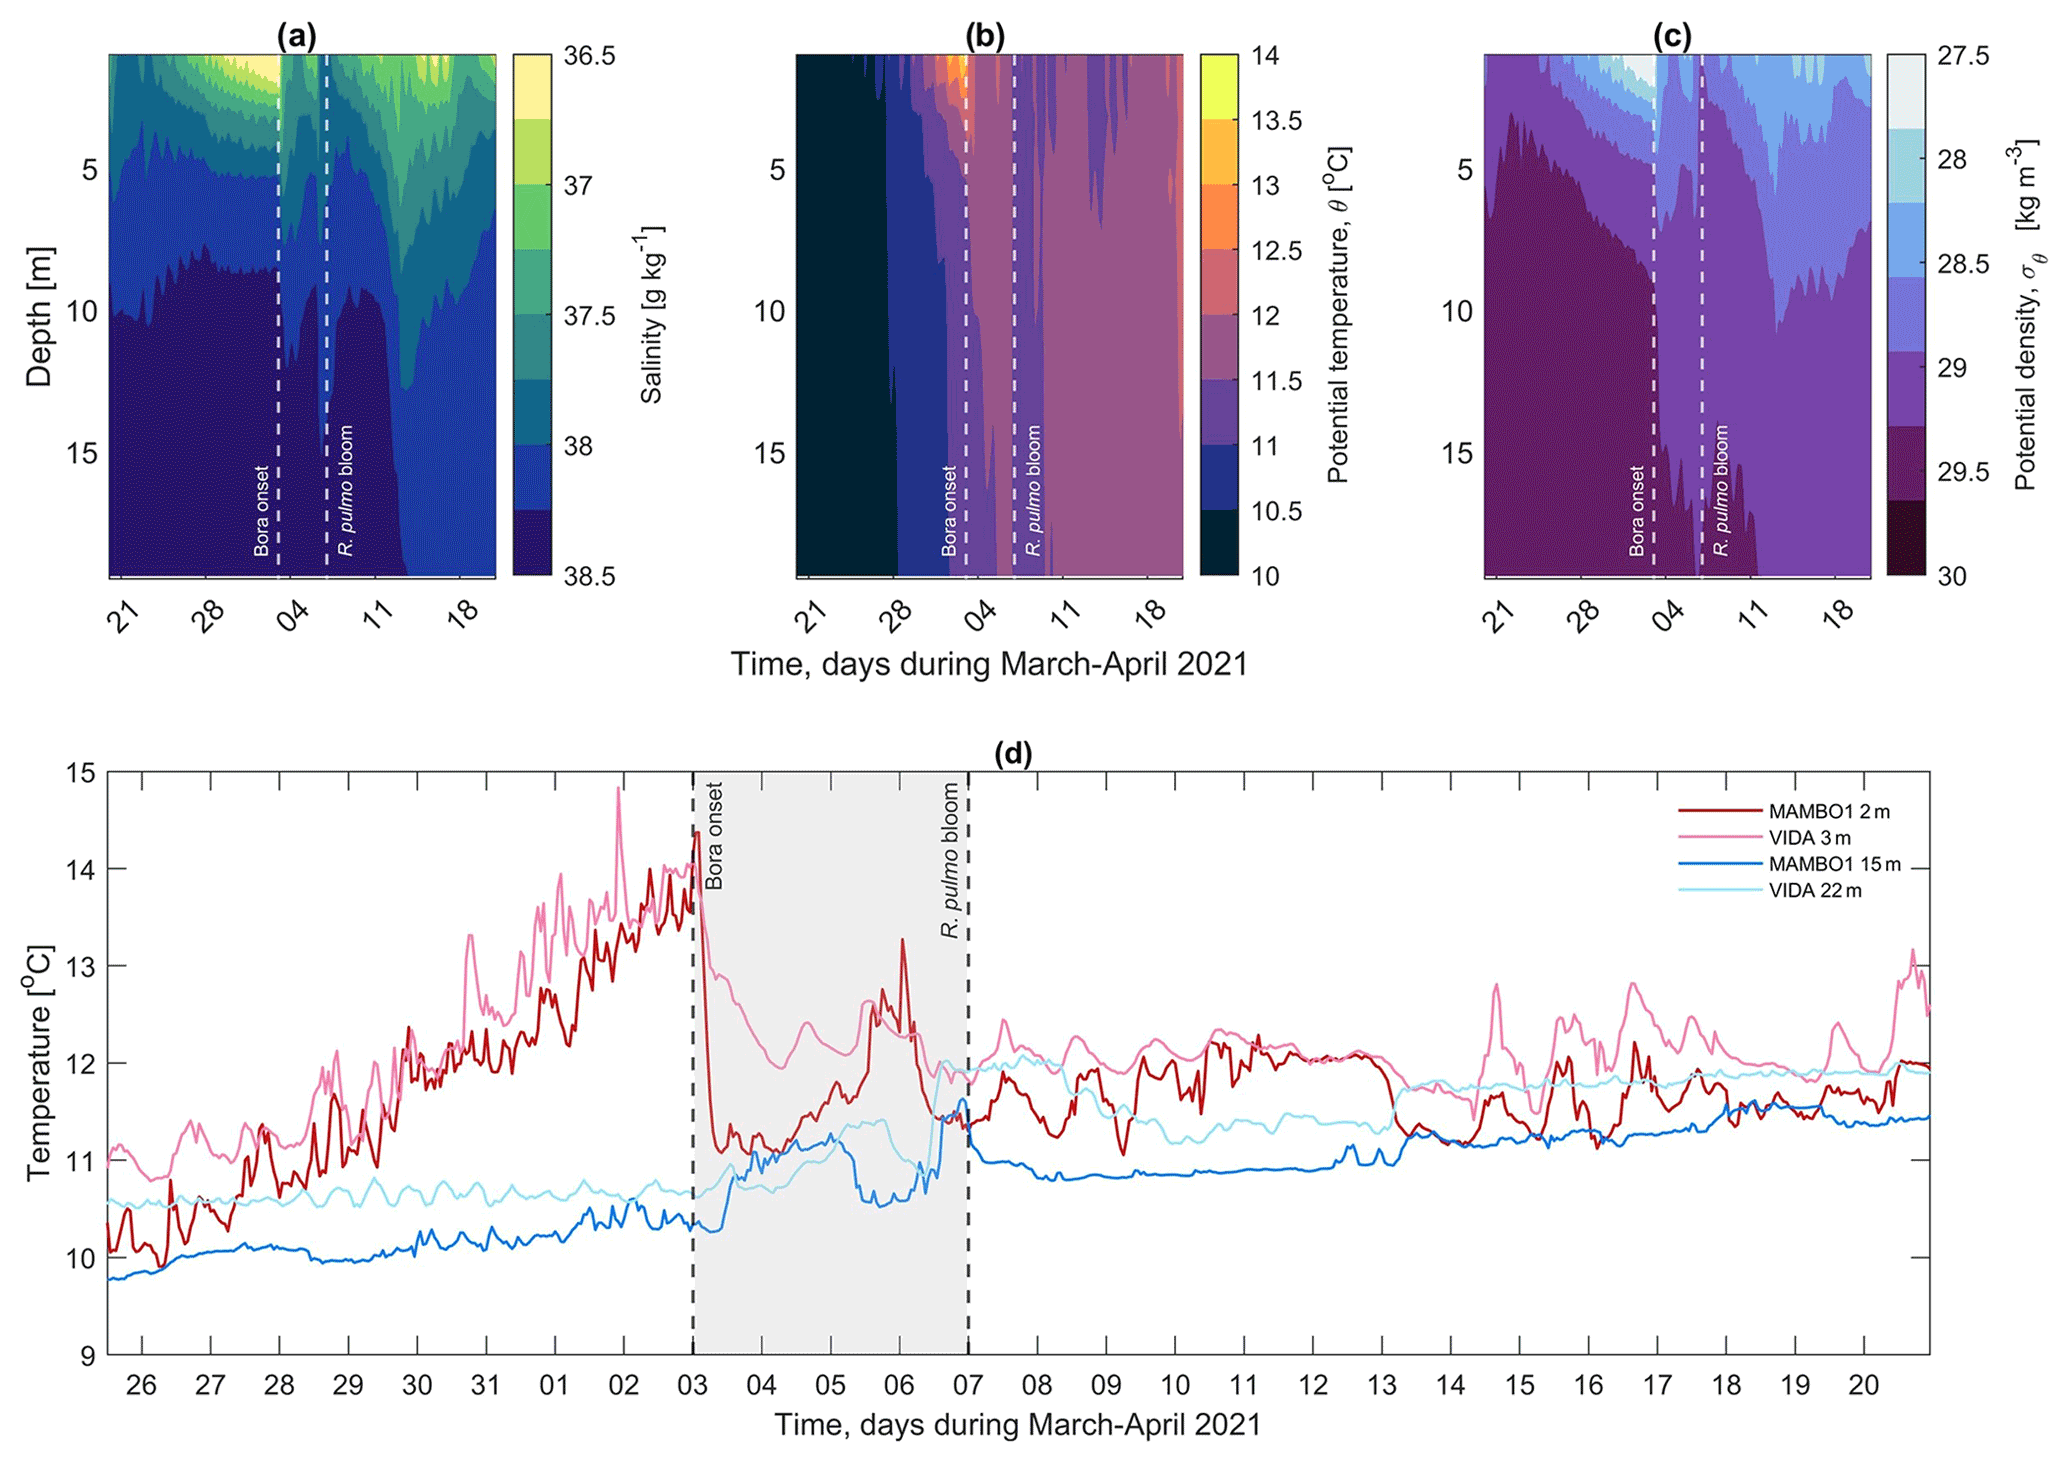
Figure 9Hovmöller diagram of (a) salinity, (b) potential temperature and (c) potential density extracted from the CMEMS physical model for the period 20 March–20 April 2021. (d) Temperature time series recorded by the MAMBO1 buoy at 2 m (red line) and 15 m (blue line) and by the VIDA buoy at 3 m (pink line) and 22 m (light blue line).
During the whole bora–bloom interval, the water column stratification disappeared (Fig. 9) as an effect of the mixing triggered by the heat loss and subsurface water masses being pumped vertically. While S and σθ followed a similar pattern, θ showed two cores, one of ∼12 ∘C affecting the surface to ∼9 m and the second one of ∼11 ∘C from ∼9 m to the bottom. Full mixing of the water column was reached in the late evening of 6 April, and it lasted until the early hours of 7 April for the whole basin (Fig. 9b). The temperature plots depicted in Figs. 8b, 9b and d show that a relatively cold layer (θ≈11.5 ∘C) occupied the whole basin for several days after the bora onset.
4.3 Temporal variability of net surface heat flux
The total heat exchange between the atmosphere and the sea, which was the main triggering process for the mixing of the water column, was obtained by calculating the daily net surface heat flux (QNET) for the northern Adriatic Sea from 20 March to 20 April 2021. The net surface heat flux ranges from −200 to 200 W m−2, whereas for the Gulf of Trieste the maximum value was QNET≤120 W m−2 (Fig. 10). This positive QNET was seen from 30 March to 2 April, indicating that the heat was being transferred from the atmosphere to the sea, in agreement with the warming up of the surface layer and the stratification process during this time interval shown in Sect. 4.2. During the bora–bloom period, the net surface heat flux ranged from −200 to approximately +50 W m−2 in the GOT. QNET can be seen decreasing to less than 50 W m−2 as the bora strikes the GOT on 3 April, losing heat to the atmosphere. On 4 April the surface net heat flux was negative at W m−2, and the sea lost heat to the atmosphere. On 5 April, a little increment in QNET was observed, in agreement with the calm wind reported earlier in Sect. 4.1 on the same day. As the bora began to strengthen, QNET reached its minimum in the studied period ( W m−2), transferring heat from the sea to the atmosphere, an effect seen not only in the GOT but also extending to the whole northern Adriatic Sea (6 April 2021 in Fig. 10). A similar pattern was reported by Dorman et al. (2006), Raicich et al. (2013) and Cosoli et al. (2013) for other cases. This heat loss also contributed to the mixing of the water column, which by 6 April was fully mixed (Fig. 9c). Afterwards, from 7 to 12 April, QNET increased as the bora wind died down with values ranging from to <50 W m−2, respectively. However, another negative peak on 13 April was observed, reaching values W m−2, corresponding to the wind and SSC peak on 13 April in Fig. 5.

Figure 10Spatial distribution of daily averaged net surface heat fluxes (W m−2) over the northern Adriatic Sea from 30 March to 13 April 2021.
4.4 Seasonal temperature variability in the Gulf of Trieste
We analysed the seasonal temperature averages over the last 13 years of the available CTD casts described in Sect. 3.1. The data were grouped in seasons as follows: winter – JFM (January, February, March), spring – AMJ (April, May, June), summer – JAS (July, August, September) and autumn – OND (October, November, December). Data were averaged for each season, giving each month the same weight (Fig. 11).
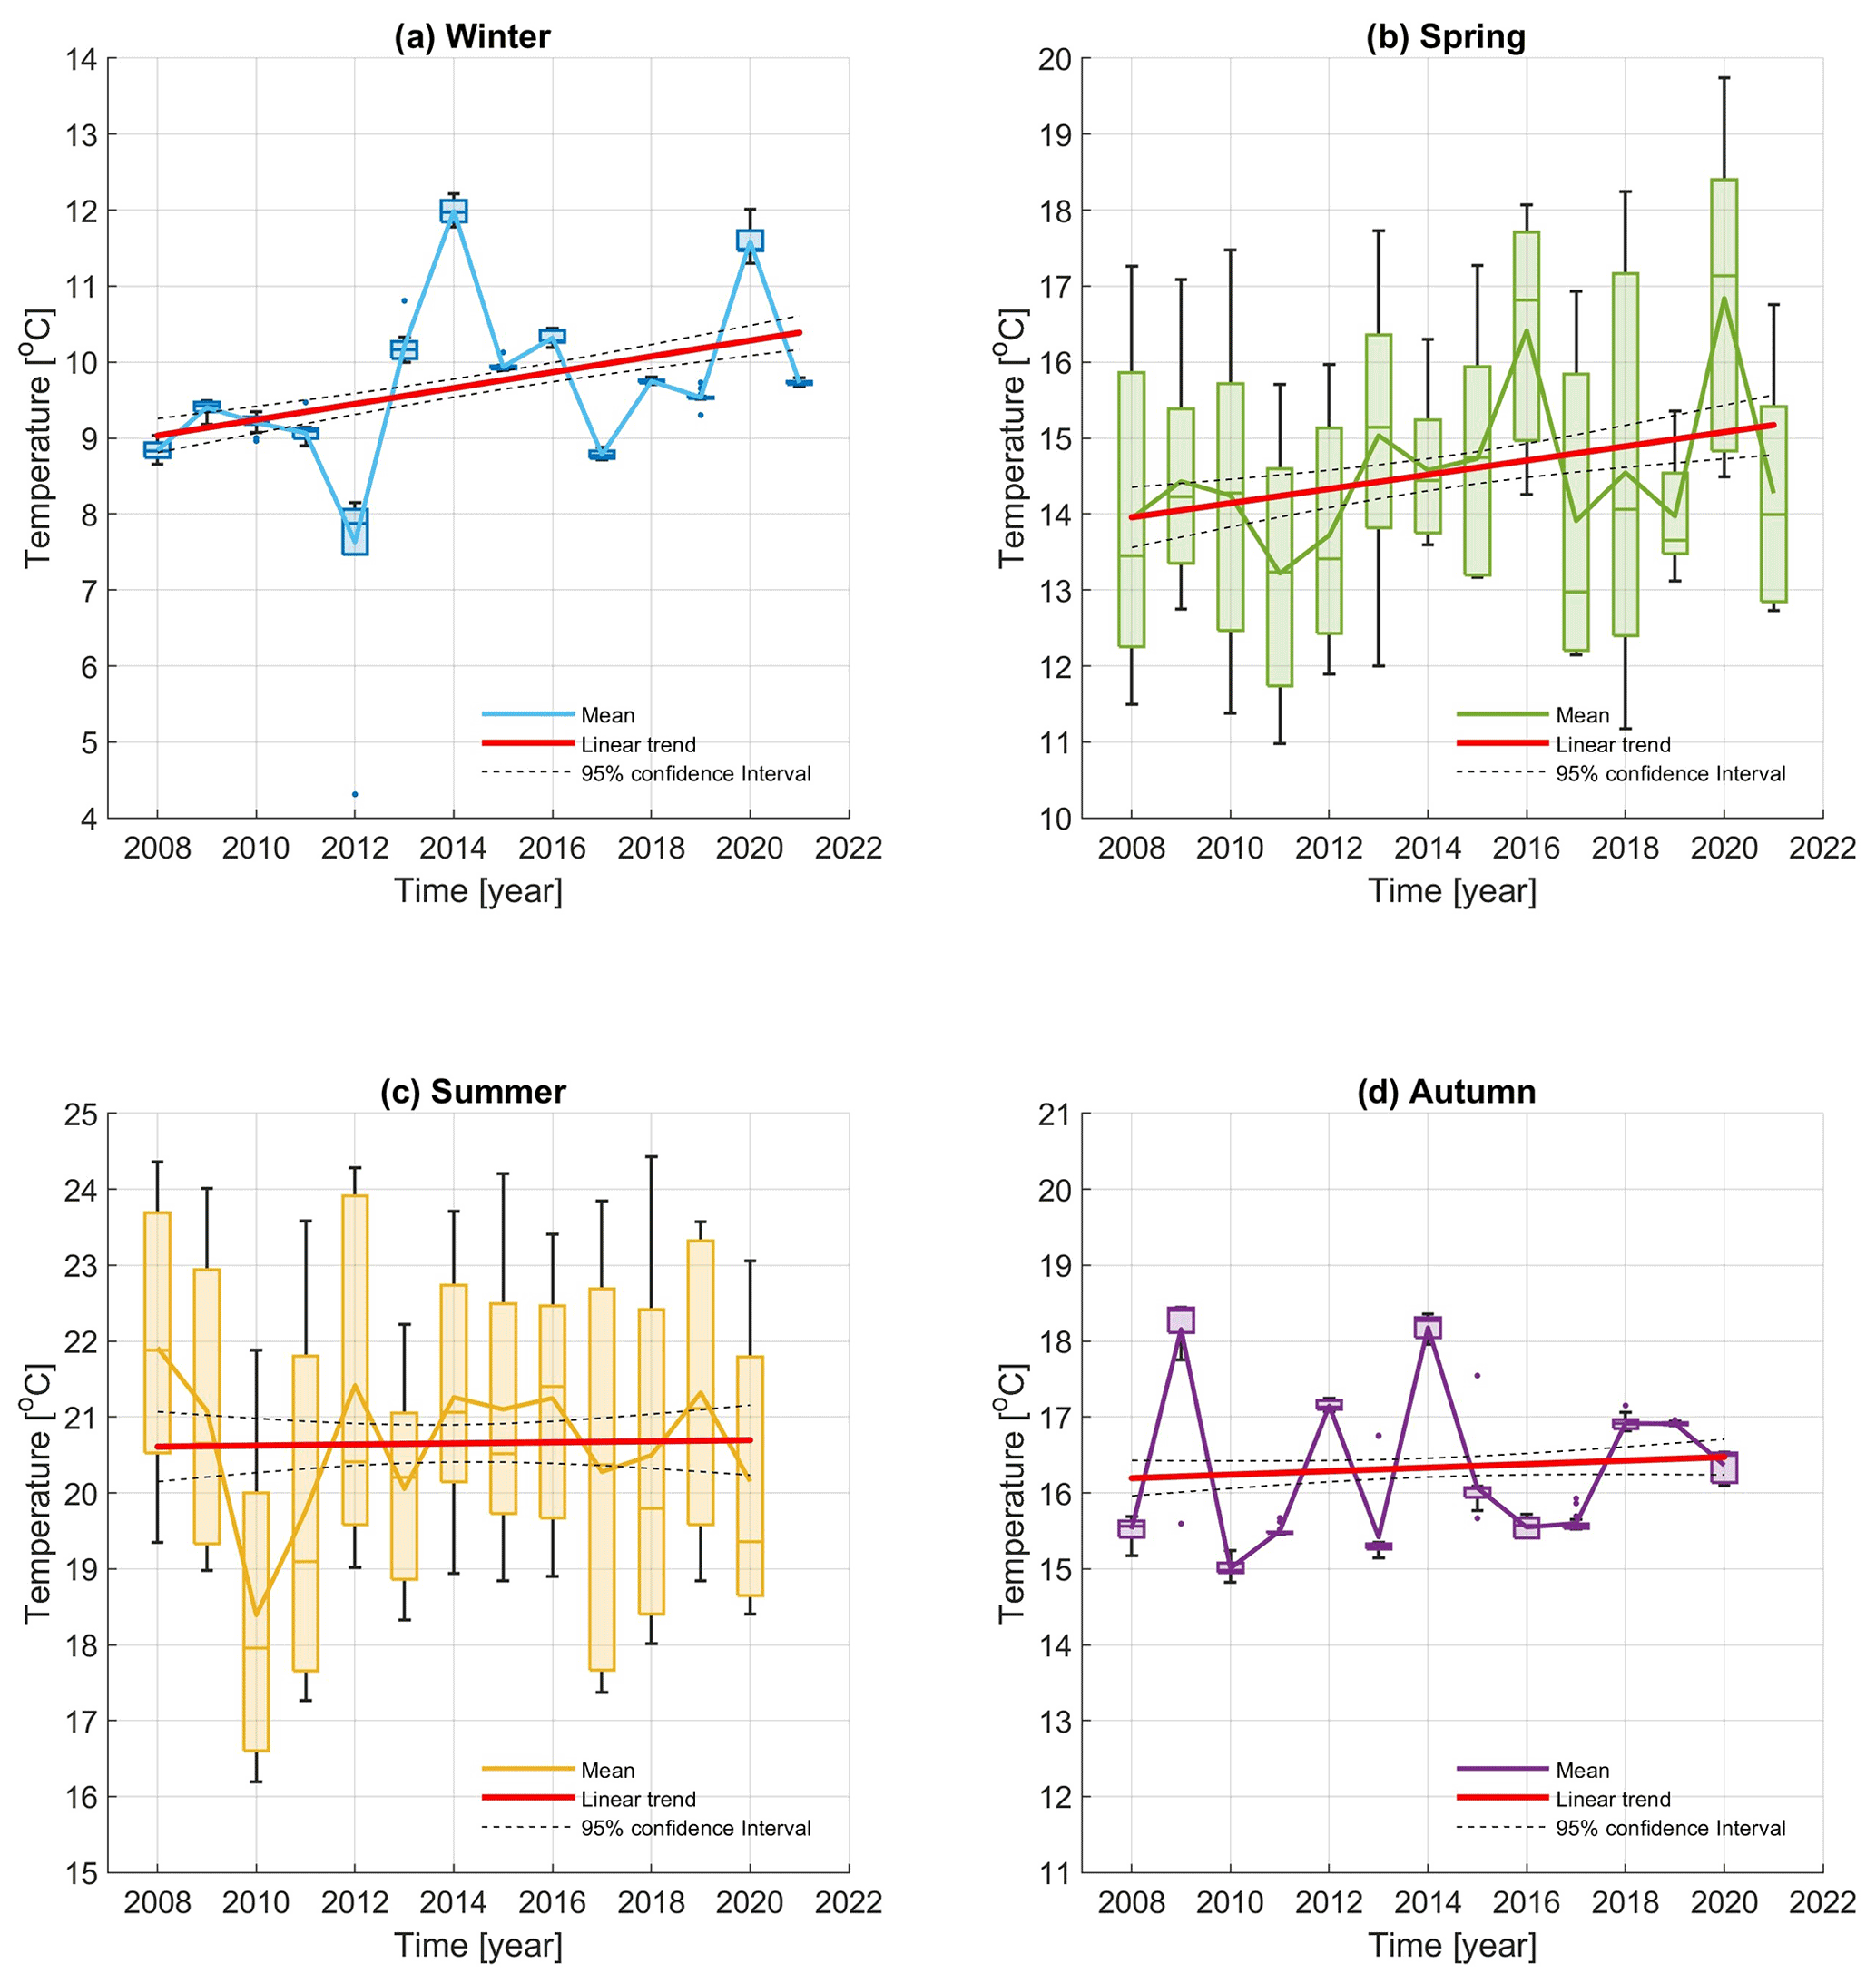
Figure 11Box plot of seasonal temperature time series from CTD casts performed at the Paloma site in the centre of the Gulf of Trieste. The figure is colour-coded, with blue representing winter (a), green representing spring (b), yellow representing summer (c) and purple representing the autumn season (c). The horizontal lines inside the boxes represent the median for each year and season, whiskers represent max and min values, and dots represent outliers. Solid blue, green, yellow and purple lines represent the average values of each seasonal time series. Red lines depict the linear trend for each season. Dashed black lines represent the 95 % confidence interval.
The temperature time series for the 2008–2020 winter period average between 8.8 ∘C and 9.73 ∘C, showing two maxima in 2014 (11.98 ∘C) and 2020 (11.58 ∘C, Fig. 11a) and a minimum in 2012 (7.5 ∘C), coinciding with the harshest winter in recent decades in the area (Bensi et al., 2013; Raicich et al., 2013). The spring period (Fig. 11b) shows the trend of slightly increasing temperatures between 2008 and 2020, showing two maxima in 2016 and 2020 with average temperatures of 16.41 and 16.84 ∘C, respectively. The average temperature during the summer period (Fig. 11c) shows little variation, ranging between 21.91 ∘C in 2008 and 20.15 ∘C in 2020 with a minimum in 2010. Finally, the time series for the autumn period shows high variability, even up to 4–5 ∘C between years, until 2014 and then shows a fairly similar and constant pattern. As expected, the greatest within-season variability was found in the spring and summer seasons.
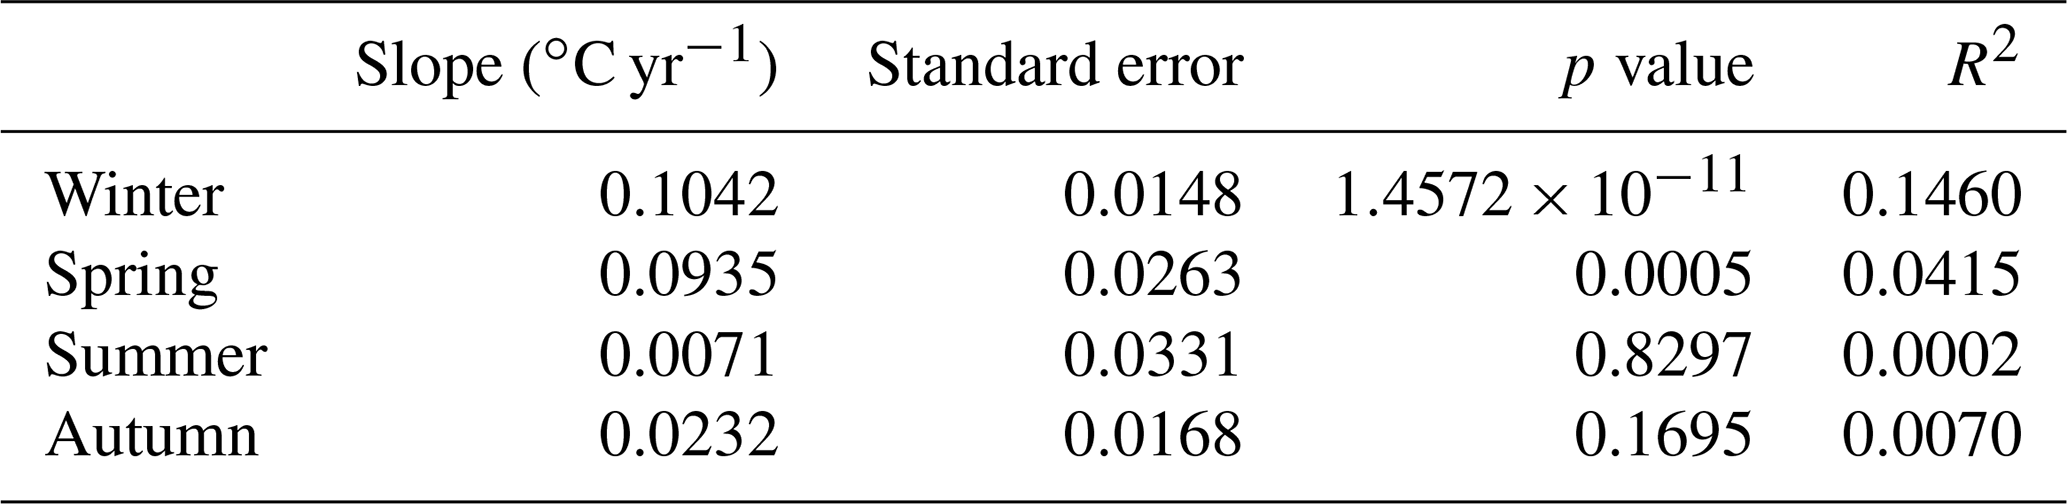
In order to investigate whether an interannual seasonal trend was present, the best linear fit in the least square sense was calculated for different seasonal time series. The results are reported in Table 3. The positive linear trends found in winter and spring (slopes equal to 0.1042 and 0.0935 ∘C yr−1, respectively) are statistically significant (p values <0.05), but just 15 % and 4 % of the variance in the temperature (for winter and spring, respectively) are explained by the linear trend. In contrast, the linear regression calculated for summer and autumn is not statistically significant.
The life cycle of many gelatinous zooplankton, with alternating sexual and asexual reproduction, implies the natural formation of large aggregations due to their rapid population growth, which typically occurs seasonally. Therefore, a bloom of medusae like R. pulmo, which has a metagenic life cycle, should not be considered an anomalous phenomenon in itself. Nevertheless, the aggregation of jellyfish observed in the GOT in April 2021 was particularly impressive for the quantity of medusae observed (>10 ind m−2 in some areas, Fig. 3) and for the presence of many large specimens (Fig. 1).
Rhizostoma pulmo is generally present in the GOT all around the year (Pierson et al., 2020), and this was also documented by the citizen sightings of this species received via AvvistAPP from July 2019 to August 2021 (Fig. 3). The smallest individuals of R. pulmo are often observed in summer (V. Tirelli, personal communication, 2022), but the lack of information about polyps at sea has prevented a complete description of the reproductive cycle of this species. Based on medusae semi-quantitative data and satellite temperature data, Leoni et al. (2021a) identified the thermal window of R. pulmo in the Mediterranean sea between 15 and 22 ∘C, while experimental observations pointed out a potential thermal niche at local scales of 13 to 29 ∘C (Leoni et al., 2021b). This study confirms the reported range but also shows that the thermal niche of this species is actually larger in the Adriatic Sea, where R. pulmo medusae occurred in winter at temperatures often lower than 10 ∘C (Fig. 11a).
A recent study of long-term records of R. pulmo in southern European seas (Mediterranean and Black Sea) (Leoni et al., 2021a) pointed out an “increase greater than expected” by the upward phase of the jellyfish population oscillation pattern assumed at the global scale (Condon et al., 2014). Specifically, the authors noted that the long-term intensity of the bloom and the biogeographic pattern of the species were determined by a latitudinal temperature gradient, but not by productivity: northern sites (low temperatures) showed less intense bloom events, while southern sites (high temperatures) showed the most intense bloom events. In this context, the observations of R. pulmo in the GOT confirm the trend of increasing blooms in the last decades (Kogovšek et al., 2010; Pierson et al., 2020; Pestorić et al., 2021) and at the same time represent an exception to the latitudinal temperature gradient, as it is one of the coldest areas of the Mediterranean Sea and simultaneously one of the areas where the blooms of R. pulmo were most intense, as in the period (early spring 2021) documented by this study. Based on molecular data, the northern Adriatic Sea harbours one of the three distinct populations of R. pulmo identified in the Mediterranean Sea (Faleh et al., 2017), whose adaptation to this environment remains to be investigated.
During 2008–2018, spring temperatures in the Mediterranean Sea were significantly correlated with the onset and duration of the R. pulmo season (defined, respectively, as the first and last observations of the species in a given area) (Leoni et al., 2021a). In the Adriatic Sea, R. pulmo showed an early occurrence during the warm spring, and bloom duration was also positively correlated with winter SST (Leoni et al., 2021a). These results support the possibility that increasing abundance of this jellyfish is related to increasing temperatures in this region: warmer springs could cause R. pulmo to appear earlier and begin strobilation activity earlier, more intensely and for a longer period of time (Purcell et al., 2012); additionally, warmer winters could favour polyp survival and lead to adult stages lasting longer (Boero et al., 2016). This scenario seems to apply to what happened in the GOT, where, according to the observed CTD data, the spring and winter preceding the April 2021 bloom were warmer than the same seasons in the 4 years before the jellyfish outbreak (Fig. 11). Furthermore, most of the jellyfish that formed the bloom were very large medusae, likely overwintering specimens born in 2020.
In their review of the physical relationships involved in the aggregation of gelatinous zooplankton, Graham et al. (2001) distinguish between rapid changes in jellyfish concentration due to rapid population growth (termed a “true bloom” by the authors) and those due to redistribution or re-dispersion of a stable population (“apparent bloom”). The numerous reports (from fishermen, citizens and scientists) of increasing occurrences of R. pulmo throughout the GOT in the weeks leading up to the April 2021 bloom support the conclusion that the observed bloom of R. pulmo was a “true bloom” and not merely a concentration of specimens from a stable population. At the same time, our study indicates that the perception of the extent of this bloom was influenced by the role played by the bora wind in jellyfish aggregation along the coast near Trieste. After the onset of the bora wind, we observed how the sea temperature at the surface decreased as a result of the generated upwelling and the subsequent mixing of the water column. This process is consistent with the results of Querin et al. (2006, 2021). At the surface, the water was pushed westward into the gulf towards Grado, where the jellyfish present at the surface were stranded on the beach (right panel in Fig. 1).
In the deeper layers, we observed the formation of a compensating countercurrent; after a few hours the surface and deep currents were completely opposing each other. Due to the effect of the bora-enhanced mechanism (bora – countercurrent – upwelling), multi-platform temperature data, together with the net surface heat flux, showed that the entire gulf was filled with a cold-temperature layer for several days with the maximum heat loss as well as full vertical mixing found on 6 April, just before the jellyfish bloom was reported by the media and citizens. Although Rhizostoma medusae cannot be considered drifting because they actively swim and R. octopus has been shown to even swim against the current (Fossette et al., 2015), it is very likely that the current generated by the bora wind (>0.25 m s−1 at the surface and >0.15 m s−1 at the bottom) was too strong for R. pulmo to overcome. Therefore, we suggest that the upwelling generated on the eastern flank of the GOT by the countercurrent caused the numerous jellyfish hidden in this layer to gather on the coast of the city of Trieste (Fig. 1, left and middle panels). The quantity of jellyfish present in the area in front of the city of Trieste was absolutely impressive (>10 ind m−2) and persisted in some areas for a couple of weeks: the bora wind made the R. pulmo medusae, otherwise distributed in water column, visible directly from the wharves surrounding the city of Trieste.
Although bora events and their dynamics have been well documented for the GOT (Cosoli et al., 2012; Querin et al., 2006; Ličer et al., 2016), to our knowledge this is the first study that contextualises jellyfish aggregation and meteo-oceanographic conditions in this area. This study demonstrates the necessity of a multidisciplinary and multi-platform approach to understand jellyfish bloom dynamics.
HFR data are publicly available at http://150.145.136.27:8080/thredds/HF_RADAR/HFR_NAdr/HFR_NAdr_catalog.html (last access: 24 November 2021, Cardin et al., 2021). MAMBO1 and VIDA buoy data can be downloaded from the Copernicus Marine Service In Situ Thematic Assembly Centre (CMEMS in situ TAC) at http://www.marineinsitu.eu/dashboard/; the two datasets can be found under the names ADN-MAMBO1 (last access: 23 March 2022, National Institute of Oceanography and Applied Geophysics, 2022) and VIDA-BUOY (last access: 25 November 2021, Slovenia National Institute of Biology, 2021). Satellite SST and MFS model outputs can be extracted from the Copernicus Marine Service at https://resources.marine.copernicus.eu/product-detail/SST_MED_SST_L4_NRT_OBSERVATIONS_010_004/INFORMATION (last access: 27 August 2021, Buongiorno Nardelli et al., 2021) and https://resources.marine.copernicus.eu/product-detail/MEDSEA_ANALYSISFORECAST_PHY_006_013/INFORMATION (last access: 24 March 2022, Clementi et al., 2022). ERA5 heat fluxes can be downloaded from the Copernicus Climate Change Service and Climate Data Store at https://cds.climate.copernicus.eu/#!/home (last access: 15 March 2022, Hersbach et al., 2018). R. pulmo abundance data are available at https://www.emodnet-biology.eu/ (last access: 9 August 2021, Tirelli and Goruppi, 2021).
NCRS, VT, LU and VC were responsible for writing the original draft. Review and editing were conducted by MC and ML. Conceptualisation was handled by NCRS and VC. NCRS, LU, MC, VC and VT were responsible for data curation. VC acquired funding.
The contact author has declared that none of the authors has any competing interests.
Publisher's note: Copernicus Publications remains neutral with regard to jurisdictional claims in published maps and institutional affiliations.
The authors would like to thank all the people whose contributions made this research possible. In particular, we would like to express our gratitude to Stefano Querin for the fruitful discussions and the GOT bathymetry, to Felipe De Luca Lopes De Amorin for the gulf heat flux data, and to the Direzioni centrali dell'amministrazione regionale – Direzione centrale difesa dell'ambiente, energia e sviluppo sostenibile – Servizio gestione risorse idriche (Unità Operativa Idrografica di Udine) of Regione Friuli Venezia Giulia for the Isonzo river hydrometric level data. We greatly appreciate the technical support of the OGS Technological Development Group (Fabio Brunetti, Fabio Arena, Alessandro Bubbi, Andrea Corbo, Stefano Kuchler, Paolo Mansutti, Davide Deponte) for the running of the MAMBO1 and HF research infrastructures that provided valuable data. We thank ARPA FVG technicians for marine monitoring in the GOT. Finally, the authors also thank the citizens who used AvvistAPP, which provided important data on jellyfish sightings. We acknowledge Neva Pristov and the Slovenian Environment Agency (Agencija Republike Slovenije za okolje, ARSO) for the meteorological data of the ALADIN model. This study has been partially developed in the framework of the Interreg MED Strategic Project SHAREMED, co-financed by the European Regional Development Fund under the funding programme Interreg MED 2014–2020. Website: https://sharemed.interreg-med.eu/ (last access: 21 June 2022).
This research has been supported by the INTERREG MED Programme Managing Authority (grant no. 61184, grant agreement no. 6MED19_4.1_SP_00).
This paper was edited by Mario Hoppema and reviewed by two anonymous referees.
Allen, S. E. and Durrieu de Madron, X.: A review of the role of submarine canyons in deep-ocean exchange with the shelf, Ocean Sci., 5, 607–620, https://doi.org/10.5194/os-5-607-2009, 2009. a
Baliarsingh, S. K., Lotliker, A. A., Srichandan, S., Samanta, A., Kumar, N., and Nair, T. M. B.: A review of jellyfish aggregations, focusing on India’s coastal waters, Ecol. Proc., 9, 58, https://doi.org/10.1186/s13717-020-00268-z, 2020. a
Bensi, M., Cardin, V., Rubino, A., Notarstefano, G., and Poulain, P. M.: Effects of winter convection on the deep layer of the Southern Adriatic Sea in 2012, J. Geophys. Res.-Oceans, 118, 6064–6075, https://doi.org/10.1002/2013JC009432, 2013. a, b, c
Buongiorno Nardelli, B., Tronconi, C., Pisano, A., and Santoleri, R.: Mediterranean Sea High Resolution and Ultra High Resolution Sea Surface Temperature Analysis, Copernicus Marine Service, [data set], https://resources.marine.copernicus.eu/product-detail/SST_MED_SST_L4_NRT_OBSERVATIONS_010_004/INFORMATION, last access: 27 August 2021. a
Boero, F., Brotz, L., Gibbons, M. J., Piraino, S., and Zampardi, S.: 3.10 Impacts and effects of ocean warming on jellyfish, Explaining ocean warming: Causes, scale, effects and consequences, IUCN Gland, Switzerland, 213–237, 2016. a
Brotz, L. and Pauly, D.: Jellyfish populations in the Mediterranean Sea, Acta Adriat., 53, 213–232, 2012. a
Brotz, L., Cheung, W. W. L., Kleisner, K., Pakhomov, E., and Pauly, D.: Increasing jellyfish populations: trends in Large Marine Ecosystems, Springer Netherlands, Dordrecht, 3–20, https://doi.org/10.1007/978-94-007-5316-7_2, 2012. a
Buongiorno Nardelli, B., Tronconi, C., Pisano, A., and Santoleri, R.: High and Ultra-High resolution processing of satellite Sea Surface Temperature data over Southern European Seas in the framework of MyOcean project, Remote Sens. Environ., 129, 1–16, https://doi.org/10.1016/j.rse.2012.10.012, 2013. a, b
Cardin, V. and Celio, M.: Cluster analysis as a statistical method for identification of the water bodies present in the Gulf of Trieste (Northern Adriatic Sea), Boll. Geofis. Teor. Appl, 38, 119–135, 1997. a, b
Cardin, V., Čermelj, B., Ličer, M., Reyes-Suárez, N. C., Ursella, L., Malačič, V., and Deponte, D.: Near Real Time Surface Radial Velocities by HFR-NorthAdriatic, EuroGOOS – European HFR Node, [data set], http://150.145.136.27:8080/thredds/HF_RADAR/HFR_NAdr/HFR_NAdr_catalog.html, last access: 24 November 2021. a
Celio, M., Comici, C., and Bussani, A.: Thermohaline Anomalies in the Spring and Early Summer of 2000 in the Gulf of Trieste, Mar. Ecol., 23, 101–110, 2002. a
Clementi, E., Pistoia, J., Escudier, R., Delrosso, D., Drudi, M., Grandi, A., Lecci, R., Cretí, S., Ciliberti, S., Coppini, G., Masina, S., and Pinardi, N.: Mediterranean Sea Physical Analysis and Forecast (CMEMS MED-Currents, EAS6 system) (Version 1) [MEDSEA_ANALYSISFORECAST_PHY_006_013_EAS6], Copernicus Monitoring Environment Marine Service (CMEMS), 10, https://www.cmcc.it/mediterranean-sea-physical-analysis-and-forecast-cmems-med-currents-2016-2019 (last access: 24 March 2022), 2021. a
Clementi, E., Aydogdu, A., Goglio, A. C., Pistoia, J., Escudier, R., Drudi, M., Grandi, A., Mariani, A., Lyubartsev, V., Lecci, R., Cretí, S., Coppini, G., Masina, S., and Pinardi, N.: Mediterranean Sea Physical Analysis and Forecast. Copernicus Monitoring Environment Marine Service (CMEMS), [data set], https://resources.marine.copernicus.eu/product-detail/MEDSEA_ANALYSISFORECAST_PHY_006_013/INFORMATION, last access: 24 March 2022. a
Condon, R., Lucas, C., Pitt, K., and Uye, S.: Jellyfish blooms and ecological interactions, Mar. Ecol. Prog. Ser., 510, 109–110, https://www.int-res.com/abstracts/meps/v510/p109-110/ (last access: 6 April 2022), 2014. a, b
Cosoli, S., Gačić, M., and Mazzoldi, A.: Surface current variability and wind influence in the northeastern Adriatic Sea as observed from high-frequency (HF) radar measurements, Cont. Shelf Res., 33, 1–13, https://doi.org/10.1016/j.csr.2011.11.008, 2012. a, b, c
Cosoli, S., Ličer, M., Vodopivec, M., and Malačič, V.: Surface circulation in the Gulf of Trieste (northern Adriatic Sea) from radar, model, and ADCP comparisons, J. Geophys. Res.-Oceans, 118, 6183–6200, https://doi.org/10.1002/2013JC009261, 2013. a, b
Covelli, S., Piani, R., Faganeli, J., and Brambati, A.: Circulation and suspended matter distribution in a microtidal deltaic system: the Isonzo river mouth (northern Adriatic Sea), J. Coast. Res., 41, 130–140, 2004. a, b
Cozzi, S., Cabrini, M., Kralj, M., De Vittor, C., Celio, M., and Giani, M.: Climatic and Anthropogenic Impacts on Environmental Conditions and Phytoplankton Community in the Gulf of Trieste (Northern Adriatic Sea), Water, 12, 2652, https://doi.org/10.3390/w12092652, 2020. a, b, c
Dorman, C. E., Carniel, S., Cavaleri, L., Sclavo, M., Chiggiato, J., Doyle, J., Haack, T., Pullen, J., Grbec, B., Vilibić, I., Janeković, I., Lee, C., Malačič, V., Orlić, M., Paschini, E., Russo, A., and Signell, R. P.: February 2003 marine atmospheric conditions and the bora over the northern Adriatic, J. Geophys. Res.-Oceans, 111, C03S03, https://doi.org/10.1029/2005JC003134, 2006. a, b
Faleh, A. B., Allaya, H., Armani, A., and Shahin, A.: Significant genetic differentiation among meroplanktonic barrel jellyfish Rhizostoma pulmo (Cnidaria: Scyphozoa) in the Mediterranean Sea, Afr. J. Mar. Sci., 39, 1–8, https://doi.org/10.2989/1814232X.2017.1303395, 2017. a
Fernández-Alías, A., Marcos, C., and Pérez-Ruzafa, A.: Larger scyphozoan species dwelling in temperate, shallow waters show higher blooming potential, Mar. Pollut. Bull., 173, 113100, https://doi.org/10.1016/j.marpolbul.2021.113100, 2021. a
Fossette, S., Gleiss, A., Chalumeau, J., Bastian, T., Armstrong, C., Vandenabeele, S., Karpytchev, M., and Hays, G.: Current-Oriented Swimming by Jellyfish and Its Role in Bloom Maintenance, Curr. Biol., 25, 342–347, https://doi.org/10.1016/j.cub.2014.11.050, 2015. a
Francé, J., Varkitzi, I., Stanca, E., Cozzoli, F., Skejić, S., Ungaro, N., Vascotto, I., Mozetič, P., Živana Ninčević Gladan, Assimakopoulou, G., Pavlidou, A., Zervoudaki, S., Pagou, K., and Basset, A.: Large-scale testing of phytoplankton diversity indices for environmental assessment in Mediterranean sub-regions (Adriatic, Ionian and Aegean Seas), Ecol. Ind., 126, 107630, https://doi.org/10.1016/j.ecolind.2021.107630, 2021. a
Fuentes, V., Straehler-Pohl, I., Atienza, D., Franco, I., Tilves, U., Gentile, M., Acevedo, M., Olariaga, A., and Gili, J.-M.: Life cycle of the jellyfish Rhizostoma pulmo (Scyphozoa: Rhizostomeae) and its distribution, seasonality and inter-annual variability along the Catalan coast and the Mar Menor (Spain, NW Mediterranean), Mar. Biol., 158, 2247–2266, https://doi.org/10.1007/s00227-011-1730-7, 2011. a, b, c, d
Graham, W. M., Pagès, F., and Hamner, W. M.: A physical context for gelatinous zooplankton aggregations: a review, in: Jellyfish Blooms: Ecological and Societal Importance, edited by: Purcell, J. E., Graham, W. M., and Dumont, H. J., Springer Netherlands, Dordrecht, 199–212, 2001. a
Gurgel, K.-W., Antonischki, G., Essen, H.-H., and Schlick, T.: Wellen Radar (WERA): a new ground-wave HF radar for ocean remote sensing, Coast. Eng., 37, 219–234, https://doi.org/10.1016/S0378-3839(99)00027-7, 1999. a
Hamner, W. M. and Dawson, M. N.: A review and synthesis on the systematics and evolution of jellyfish blooms: advantageous aggregations and adaptive assemblages, Hydrobiologia, 616, 161–191, https://doi.org/10.1007/s10750-008-9620-9, 2009. a
Hersbach, H., Bell, B., Berrisford, P., Biavati, G., Horányi, A., Muñoz Sabater, J., Nicolas, J., Peubey, C., Radu, R., Rozum, I., Schepers, D., Simmons, A., Soci, C., Dee, D., and Thépaut, J.-N.: ERA5 hourly data on single levels from 1979 to present, Copernicus Climate Change Service (C3S) Climate Data Store (CDS), ECMWF, [data set], https://doi.org/10.24381/cds.adbb2d47, 2018. a, b
Jeffries, M. A. and Lee, C. M.: A climatology of the northern Adriatic Sea's response to bora and river forcing, J. Geophys. Res.-Oceans, 112, C03S02, https://doi.org/10.1029/2006JC003664, 2007. a
Kogovšek, T., Bogunović, B., and Malej, A.: Recurrence of bloom-forming scyphomedusae: wavelet analysis of a 200-year time series, Springer Netherlands, Dordrecht, 81–96, https://doi.org/10.1007/978-90-481-9541-1_7, 2010. a, b
Kogovšek, T., Vodopivec, M., Raicich, F., ichi Uye, S., and Malej, A.: Comparative analysis of the ecosystems in the northern Adriatic Sea and the Inland Sea of Japan: Can anthropogenic pressures disclose jellyfish outbreaks?, Sci. Total Environ., 626, 982–994, https://doi.org/10.1016/j.scitotenv.2018.01.011, 2018. a
Leoni, V., Bonnet, D., Ramírez-Romero, E., and Molinero, J. C.: Biogeography and phenology of the jellyfish Rhizostoma pulmo (Cnidaria: Scyphozoa) in southern European seas, Global Ecol. Biogeogr., 30, 622–639, https://doi.org/10.1111/geb.13241, 2021a. a, b, c, d, e, f
Leoni, V., Molinero, J. C., Meffre, M., and Bonnet, D.: Variability of growth rates and thermohaline niches of Rhizostoma pulmo’s pelagic stages (Cnidaria: Scyphozoa), Mar. Biol., 168, 107, https://doi.org/10.1007/s00227-021-03914-y, 2021b. a
Ličer, M., Smerkol, P., Fettich, A., Ravdas, M., Papapostolou, A., Mantziafou, A., Strajnar, B., Cedilnik, J., Jeromel, M., Jerman, J., Petan, S., Malačič, V., and Sofianos, S.: Modeling the ocean and atmosphere during an extreme bora event in northern Adriatic using one-way and two-way atmosphere–ocean coupling, Ocean Sci., 12, 71–86, https://doi.org/10.5194/os-12-71-2016, 2016. a, b, c
Ličer, M., Estival, S., Reyes-Suarez, C., Deponte, D., and Fettich, A.: Lagrangian modelling of a person lost at sea during the Adriatic scirocco storm of 29 October 2018, Nat. Hazards Earth Syst. Sci., 20, 2335–2349, https://doi.org/10.5194/nhess-20-2335-2020, 2020. a, b
Malačič, V., Petelin, B., Gačić, M., Artegiani, A., and Orlić, M.: Regional Studies, Springer Netherlands, Dordrecht, 167–216, https://doi.org/10.1007/978-94-015-9819-4_6, 2001. a
Malačič, V.: Wind Direction Measurements on Moored Coastal Buoys, J. Atmos. Ocean. Tech., 36, 1401–1418, https://doi.org/10.1175/JTECH-D-18-0171.1, 2019. a
Malačič, V. and Petelin, B.: Climatic circulation in the Gulf of Trieste (northern Adriatic), J. Geophys. Res.-Oceans, 114, C07002, https://doi.org/10.1029/2008JC004904, 2009. a
Marullo, S., Pitarch, J., Bellacicco, M., Sarra, A. G. D., Meloni, D., Monteleone, F., Sferlazzo, D., Artale, V., and Santoleri, R.: Air–Sea Interaction in the Central Mediterranean Sea: Assessment of Reanalysis and Satellite Observations, Remote Sens., 13, 2188, https://doi.org/10.3390/rs13112188, 2021. a
Mills, C. E.: Jellyfish blooms: are populations increasing globally in response to changing ocean conditions?, Hydrobiologia, 451, 55–68, https://doi.org/10.1023/A:1011888006302, 2001. a
Nastav, B., Malej, M., Malej Jr., A., and Malej, A.: Is it possible to determine the economic impact of jellyfish outbreaks on fisheries? A Case Study – Slovenia, Mediterr. Mar. Sci., 14, 214–223, https://doi.org/10.12681/mms.382, 2013. a
National Institute of Oceanography and Applied Geophysics: ADN-MAMBO1, CMEMS-In Situ TAC, [data set], http://www.marineinsitu.eu/dashboard/, last access: 23 March 2022. a
Palmieri, M. G., Barausse, A., Luisetti, T., and Turner, K.: Jellyfish blooms in the Northern Adriatic Sea: Fishermen's perceptions and economic impacts on fisheries, Fish. Res., 155, 51–58, https://doi.org/10.1016/j.fishres.2014.02.021, 2014. a
Pestorić, B., Lučić, D., Bojanić, N., Vodopivec, M., Kogovšek, T., Violić, I., Paliaga, P., and Malej, A.: Scyphomedusae and Ctenophora of the Eastern Adriatic: Historical Overview and New Data, Diversity, 13, 186, https://doi.org/10.3390/d13050186, 2021. a, b, c, d, e, f
Pierson, J., Camatti, E., Hood, R., Kogovšek, T., Lučić, D., Tirelli, V., and Malej, A.: Mesozooplankton and Gelatinous Zooplankton in the Face of Environmental Stressors in: Coastal Ecosystems in Transition: A Comparative Analysis of the Northern Adriatic and Chesapeake Bay, edited by: Malone, T., Malej, A., and Faganeli, J., Chap. 6, American Geophysical Union (AGU), Wiley & Sons Ltd, Geophys. Monogr., 105–127, https://doi.org/10.1002/9781119543626.ch6, 2020. a, b, c, d
Pitt, K. A., Lucas, C. H., Condon, R. H., Duarte, C. M., and Stewart-Koster, B.: Claims That Anthropogenic Stressors Facilitate Jellyfish Blooms Have Been Amplified Beyond the Available Evidence: A Systematic Review, Front. Mar. Sci., 5, 451, https://doi.org/10.3389/fmars.2018.00451, 2018. a
Poulain, P.-M. and Raicich, F.: Forcings in: Physical Oceanography of the Adriatic Sea: Past, Present and Future, edited by: Cushman-Roisin, B., Gačić, M., Poulain, P.-M., and Artegiani, A., Kluwer Academic Publishers, Dordrecht, 45–65, https://doi.org/10.1007/978-94-015-9819-4_2, 2001. a
Pullen, J., Doyle, J. D., Haack, T., Dorman, C., Signell, R. P., and Lee, C. M.: Bora event variability and the role of air-sea feedback, J. Geophys. Res.-Oceans, 112, C03S18, https://doi.org/10.1029/2006JC003726, 2007. a
Purcell, J. E.: Climate effects on formation of jellyfish and ctenophore blooms: a review, J. Mar. Biol. Assoc., 85, 461–476, https://doi.org/10.1017/S0025315405011409, 2005. a
Purcell, J. E., Atienza, D., Fuentes, V., Olariaga, A., Tilves, U., Colahan, C., and Gili, J.-M.: Temperature effects on asexual reproduction rates of scyphozoan species from the northwest Mediterranean Sea, in: Jellyfish Blooms IV: Interactions with humans and fisheries, edited by: Purcell, J., Mianzan, H., and Frost, J. R., Springer Netherlands, Dordrecht, 169–180, https://doi.org/10.1007/978-94-007-5316-7_13, 2012. a
Querin, S., Crise, A., Deponte, D., and Solidoro, C.: Numerical study of the role of wind forcing and freshwater buoyancy input on the circulation in a shallow embayment (Gulf of Trieste, Northern Adriatic Sea), J. Geophys. Res.-Oceans, 111, C03S16, https://doi.org/10.1029/2006JC003611, 2006. a, b, c, d, e, f, g
Querin, S., Cosoli, S., Gerin, R., Laurent, C., Malačič, V., Pristov, N., and Poulain, P.-M.: Multi-Platform, High-Resolution Study of a Complex Coastal System: The TOSCA Experiment in the Gulf of Trieste, J. Mar. Sci. Eng., 9, 469, https://doi.org/10.3390/jmse9050469, 2021. a, b, c, d, e
Raicich, F., Malačič, V., Celio, M., Giaiotti, D., Cantoni, C., Colucci, R. R., Čermelj, B., and Pucillo, A.: Extreme air-sea interactions in the Gulf of Trieste (North Adriatic) during the strong Bora event in winter 2012, J. Geophys. Res.-Oceans, 118, 5238–5250, https://doi.org/10.1002/jgrc.20398, 2013. a, b, c
Richardson, A. J., Bakun, A., Hays, G. C., and Gibbons, M. J.: The jellyfish joyride: causes, consequences and management responses to a more gelatinous future, Trends Ecol. Evol., 24, 312–322, https://doi.org/10.1016/j.tree.2009.01.010, 2009. a, b
Robinson, A., Leslie, W., Theocharis, A., and Lascaratos, A.: Mediterranean Sea Circulation, in: Encyclopedia of Ocean Sciences (Second Edition), edited by: Steele, J. H., Academic Press, Oxford, 2 Edn., 710–725, https://doi.org/10.1016/B978-012374473-9.00376-3, 2001. a
Slovenia National Institute of Biology: VIDA-BUOY, CMEMS-In Situ TAC, [data set], http://www.marineinsitu.eu/dashboard/, last access: 25 November 2021. a
Strajnar, B., Cedilnik, J., Fettich, A., Ličer, M., Pristov, N., Smerkol, P., and Jerman, J.: Impact of two-way coupling and sea-surface temperature on precipitation forecasts in regional atmosphere and ocean models, Q. J. Roy. Meteor. Soc., 145, 228–242, https://doi.org/10.1002/qj.3425, 2019. a
Stravisi, F.: Il regime dei venti a Trieste (1951–1975), The wind regime in Trieste (1951–1975), 61, 87–104, 1977. a
Termonia, P., Fischer, C., Bazile, E., Bouyssel, F., Brožková, R., Bénard, P., Bochenek, B., Degrauwe, D., Derková, M., El Khatib, R., Hamdi, R., Mašek, J., Pottier, P., Pristov, N., Seity, Y., Smolíková, P., Španiel, O., Tudor, M., Wang, Y., Wittmann, C., and Joly, A.: The ALADIN System and its canonical model configurations AROME CY41T1 and ALARO CY40T1, Geosci. Model Dev., 11, 257–281, https://doi.org/10.5194/gmd-11-257-2018, 2018. a
Tirelli, V. and Goruppi, A.: Gelatinous zooplankton validated sightings reported in the Mediterranean Sea from 2019 onwards by avvistAPP users. National Institute of Oceanography and Applied Geophysics – OGS, Division of Oceanography, Italy, Dataset/Occurrence https://doi.org/10.13120/3382-at05, [data set], last access: 9 August 2021. a
Tirelli, V., Goruppi, A., Riccamboni, R., and Tempesta, M.: Citizens’ Eyes on Mnemiopsis: How to Multiply Sightings with a Click!, Diversity, 13, 224, https://doi.org/10.3390/d13060224, 2021. a, b, c, d
Tomita, H. and Kubota, M.: Variability of surface heat flux over the Indian Ocean, Atmos.-Ocean, 42, 183–199, https://doi.org/10.3137/ao.420303, 2004. a
Tomita, H., Kutsuwada, K., Kubota, M., and Hihara, T.: Advances in the Estimation of Global Surface Net Heat Flux Based on Satellite Observation: J-OFURO3 V1.1, Front. Mar. Sci., 8, 612361, https://doi.org/10.3389/fmars.2021.612361, 2021. a
Vilibić, I. and Mihanović, H.: Observing the bottom density current over a shelf using an Argo profiling float, Geophys. Res. Lett., 40, 910–915, https://doi.org/10.1002/grl.50215, 2013. a, b
Vilibić, I., Grbec, B., and Supić, N.: Dense water generation in the north Adriatic in 1999 and its recirculation along the Jabuka Pit, Deep Sea Res. Pt. I, 51, 1457–1474, https://doi.org/10.1016/j.dsr.2004.07.012, 2004. a, b