the Creative Commons Attribution 4.0 License.
the Creative Commons Attribution 4.0 License.
 | 11 Nov 2021
Mean sea level and tidal change in Ireland since 1842: a case study of Cork
David T. Pugh
Edmund Bridge
Robin Edwards
Peter Hogarth
Guy Westbrook
Philip L. Woodworth
Gerard D. McCarthy
Knowledge of regional changes in mean sea level and local changes in tides are crucial to inform effective climate adaptation. An essential element is the availability of accurate observations of sea level. Sea level data in the Republic of Ireland, prior to the establishment of the National Tide Gauge Network in the mid-2000s, are limited but belie a wealth of historical data available in archival form. In this study, we digitize records located in Cork Harbour, Ireland, from 1842 and show how short-duration (6–8 weeks), high-quality data with a large interval to the present can accurately inform tidal and mean sea level changes. We consider error sources in detail. We estimate for the main M2 tidal constituent that the accuracy of these historical measurements is 1 % and 2 min for amplitude and phase, respectively, once adjustments for seasonal and nodal effects are made. Our mean sea level estimates are accurate to the 2 cm level, once adjustments for atmospheric and seasonal effects are made. Our results show tidal stability with a 2 % change in the amplitude of the M2 component, 4 min change in the phase over a period of 177 years, and mean sea level rise of 40 cm in the Cork Harbour area from 1842 to 2019, approximately in line with global mean sea level trends plus local glacial isostatic adjustment. More broadly, we show that with careful seasonal, nodal, and atmospheric corrections, together with knowledge of benchmark provenance, these historic, survey-oriented data can accurately inform of sea level changes.
- Article
(1719 KB) - Full-text XML
- BibTeX
- EndNote


Sea level is a combination of mean sea level (MSL), tide, and a non-tidal residual due to weather and other causes (Pugh and Woodworth, 2014). Mean sea levels are rising globally as a consequence of anthropogenic climate change (IPCC, 2021), and tides are also changing in some local areas (Haigh et al., 2020; Jänicke et al., 2021) due to coastal changes and potentially due to rising sea levels (Idier et al., 2017). Knowledge of regional changes in mean sea level from global trends and changes in tides are crucial to inform effective local climate adaptation (Talke et al., 2018). An essential element of planned adaptation is the availability of accurate observations of sea level.
In the Republic of Ireland, a National Tide Gauge Network is maintained by the Office of Public Works and the Marine Institute with over 40 tidal gauges in total (Cámaro García et al., 2021). This extensive network of sea level observations was established during the 2000s. Long-period mean sea level data prior to the establishment of the National Tide Gauge Network in the mid-2000s in the Republic of Ireland are limited to observations in Dublin (1938–2009) and Malin Head (1958–2002) (Holgate et al., 2013). No high-frequency (e.g. hourly) tidal data are available prior to 2003. Most Irish sea level data are not openly accessible through global databases, meaning that Irish sea levels are not included in global studies of MSL, such as Frederikse et al. (2020), or of tides, such as Mawdsley et al. (2015) or Woodworth (2010).
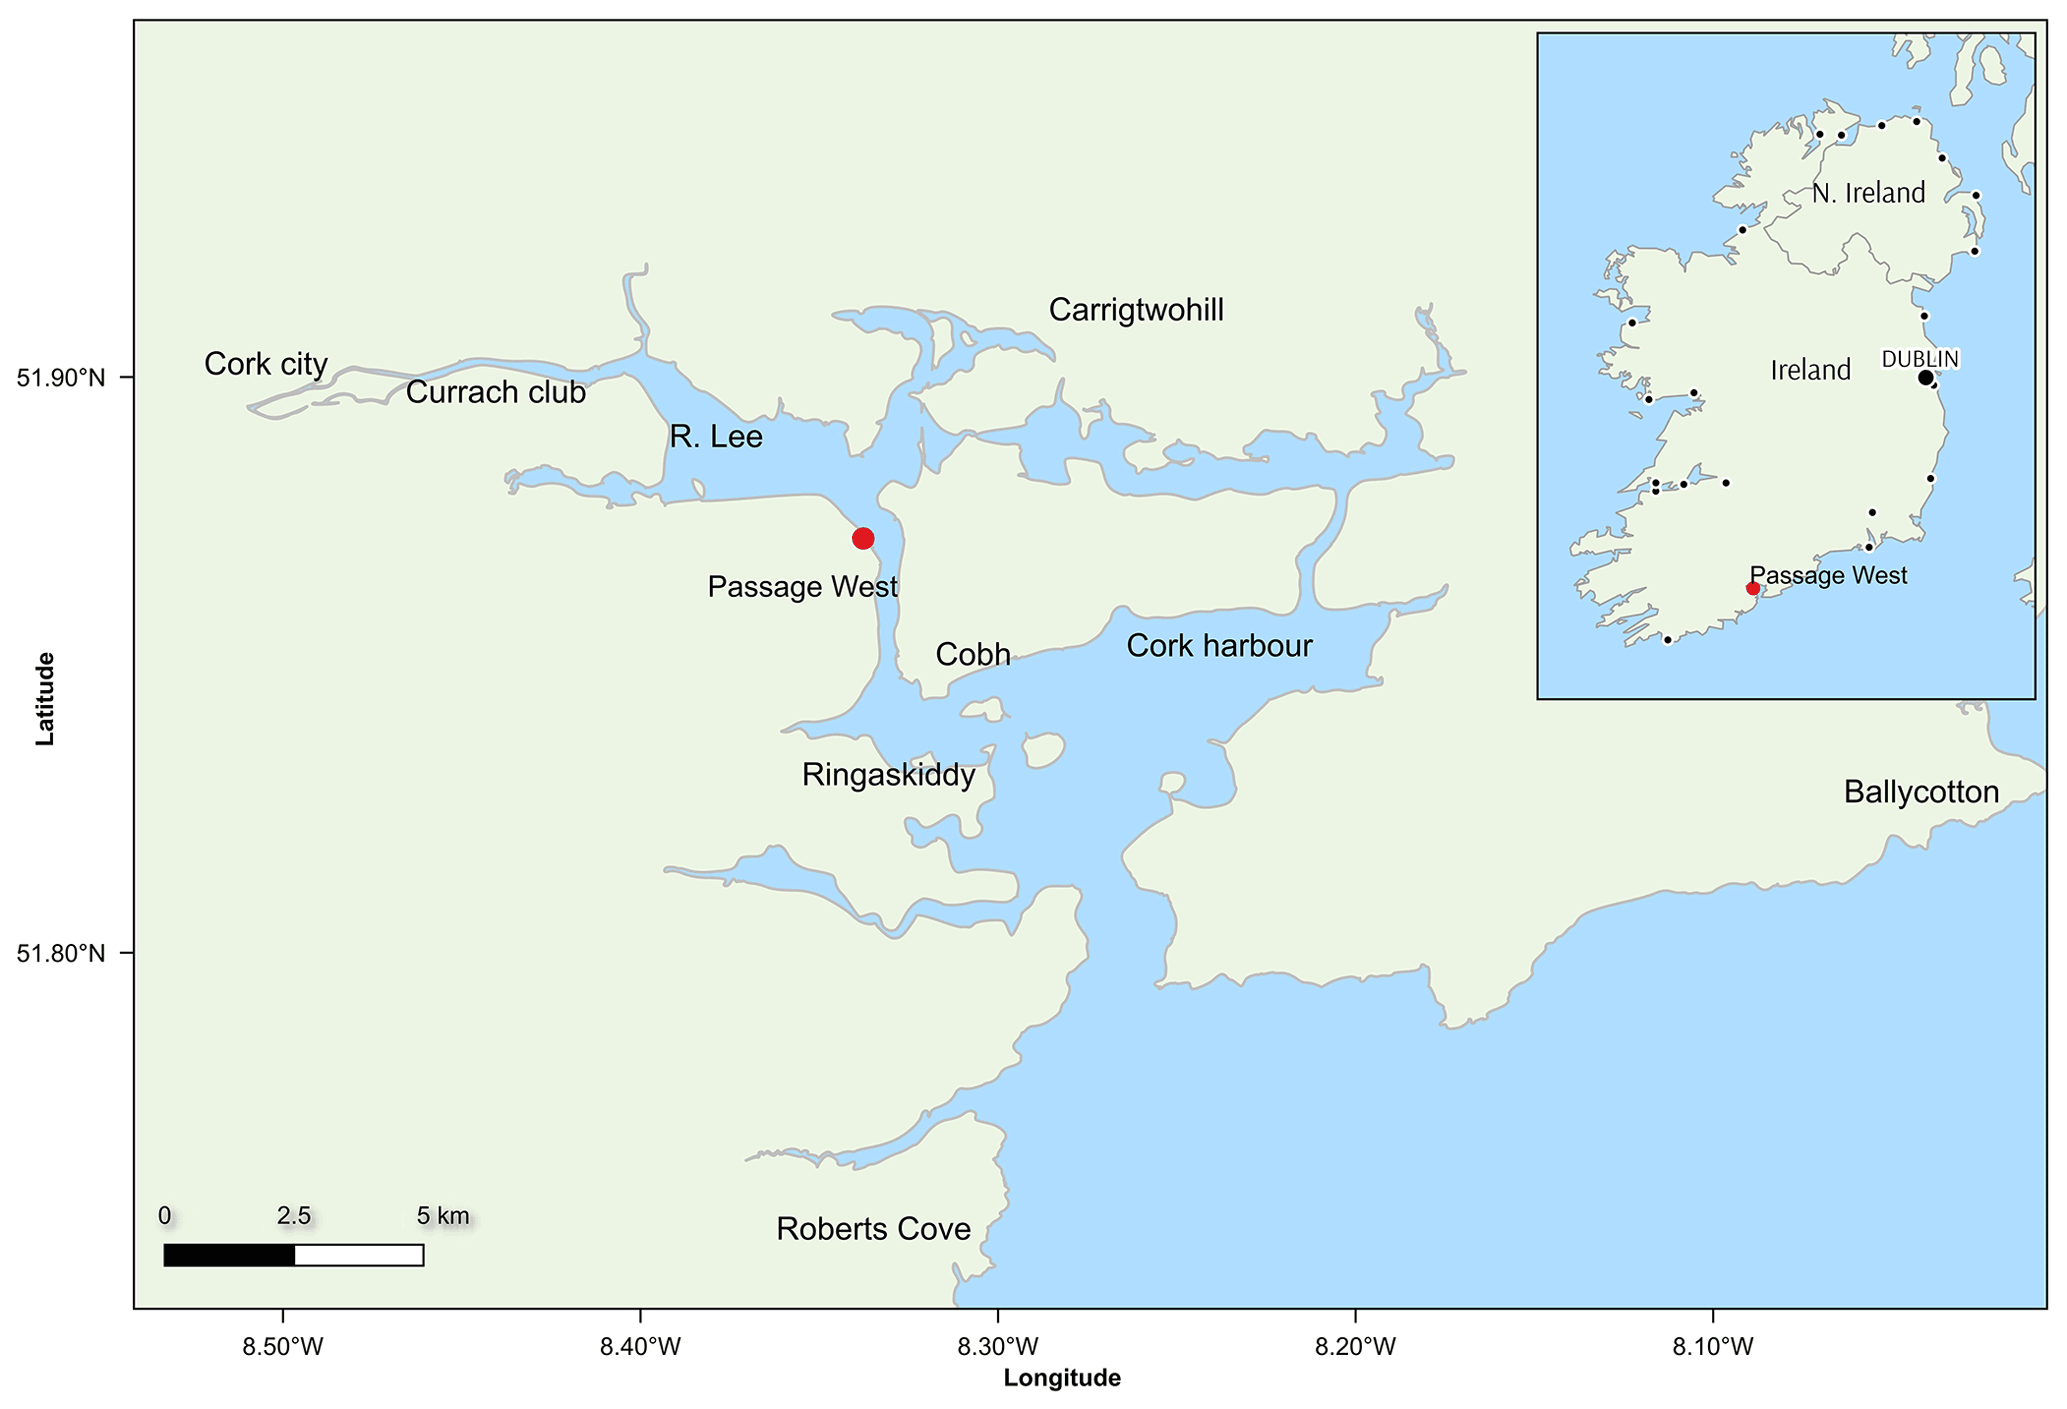
Figure 1Location of this study. The main map shows Cork Harbour, with the locations referred to in the text. The inset shows the locations of all Airy sites on the island of Ireland, indicated with small black circles. Passage West, as the focus of this study, is highlighted with a red circle. R. Lee shows the location of the River Lee. Data are available from Passage West (June–August 1842, June–July 2019), Roberts Cove (January–June 1973), Ballycotton (October 2010–present), Cobh (1906), Currach Club (June 2019–present), Ringaskiddy (January 2012–present).
Nevertheless, this lack of publicly available sea level data for Ireland belies a wealth of historical data that exists in various archival formats. Paper and digital images of marigraphs (traces recorded from automated tide gauges) exist for Dublin (1923–2003), Dún Laoghaire (formerly Kingstown, 1925–1933, Simon Coate, Dún Laoghaire Harbourmaster, personal communication, 2019), Cork (from 1930, Kieran Hickey, UCC, personal communication, 2021) and Belfast (from 1901–2010, Murdy et al., 2015). The 1839–1843 National mapping and levelling survey of Ireland undertook a detailed sea level measurement exercise at 22 sites in the summer of 1842 (Fig. 1; Airy, 1851) – hereafter referred to as the Airy sites. These sites were connected by levelling during the survey (Cameron, 1855), and potentially provide estimates of MSL at the 22 locations (Fig. 1). Haughton (1856) made a nationwide survey of high and low waters for a period of a year in 1850–1851 at 12 sites, 6 of which coincide with the Airy sites.
Although surveys such as those of Airy and Haughton are limited in time – 8 weeks of continuous measurements in 1842 and upwards of 1 year of high and low waters in 1850–1851, respectively – the long interval of over 150 years between these measurements and modern measurements indicates that long-term MSL and tidal changes may be detected against natural year-on-year sea level variations. To this end we have initiated a full study of these historical data, especially at the 22 Airy sites and the 12 Haughton sites. This study will include making new measurements at many sites and requires a thorough assessment of MSL and tidal change based on these historical and recent data. As a first stage, we have developed a multi-institute pilot study of changes in Cork Harbour, as shown by comparing the Airy 1842 and our 2019 measurements.
Previous studies of long-term MSL change in Ireland have generally focused on the northeast of the country, from Dublin to Malin Head (the northernmost point in Ireland), due to the relative availability of data in this region. Relatively low rates of MSL rise (<1 mm yr−1) were reported for Dublin (Carter, 1982; Woodworth et al., 1999), Belfast, and Malin Head (Orford and Murdy, 2015) up to the year 2000. Estimates of MSL rise outside the northeast of Ireland are rare (e.g. Pugh, 1982), resulting in a systematic bias in the overall estimate of relative sea level change in Ireland. Such biases are expected, given the pattern of Glacial Isostatic Adjustment (GIA): relative rise in the northeast of Ireland and relative fall in the southwest of Ireland (Bradley et al., 2011). Therefore, estimates of relative sea level rise in the south of the country are vital for understanding relative sea level rise for Ireland as a whole. Some limits to tidal constituent changes around Ireland have been estimated previously using the 1842 Airy data and new measurements at Castletownsend, Courtown, and Ballycastle (Pugh, 1982).
In this paper, we focus our pilot study on Cork Harbour (Fig. 1), with the following joint aims:
-
developing a multi-institute approach to sea level studies in Ireland,
-
proving the utility of historical data to inform long-term change in sea level and tidal constituents,
-
assessing evidence for changes in MSL and tidal constituent changes,
-
contextualizing our results in terms of the impact on one of Ireland's most vulnerable coastal regions.
Measurements in 1842 were taken at Passage West, 10 km southeast of Cork City (Fig. 1), as part of the Airy survey (Airy, 1851). We have digitized these records and analysed them for tidal constituents and for MSL. These MSL results are then compared with modern measurements from the nearby National Tide Gauge Network sites at Ringaskiddy, Cork Currach Club, and Ballycotton, together with measurements at Cobh from the early 1900s and observations at Robert's Cove in the 1970s. In order to determine the tidal constituent changes, we obtained a 6-week record of sea level at Airy's exact location in Passage West in June–July 2019.
Cork City is located in the south of Ireland, where the River Lee meets Cork Harbour. Cork Harbour is one of the world's finest natural harbours. The Port of Cork has long been Ireland's largest southern port (Horgan, 1955). Admiralty Charts from 1773 entitled Upper Harbour, and from 1777 entitled Lower Harbour and Approaches, show a channel from Cork City to the Celtic Sea, some 24 km in overall length, 11 km from Cork to Passage West, and 13 km from Passage West to the open sea. The channel passes the current major deep-water port of Ringaskiddy and then the former passenger port at Cobh and the present naval base at Haulbowline Island. Passage West was also formerly a passenger port and an outport for the city, prior to the deepening of the city quays commencing in 1894 (Rynne, 2005). The channel depth upstream of Passage West is artificially maintained by dredging at 6.5 m below chart datum (CD) and to 5.2 m upstream of the Tivoli Industrial Estate to Cork City. From Passage West towards the open ocean, the channel depth continues steady at about 15–20 m depth, maintained by natural processes, including the 2 m s−1 tidal currents. Some limited land reclamation has occurred, for example at the chemical works of Marino Point, and some harbour deepening to 11 m CD has been performed at Ringaskiddy.
The tides in Cork Harbour are driven by the tides in the Celtic Sea, which travel from west to east, as a progressive Kelvin wave from the Atlantic Ocean towards the Irish Sea and Bristol Channel; the system is complicated by a weaker reflected Kelvin wave. Semidiurnal tides predominate, as elsewhere on the northwestern European shelf, with diurnal tides being very small. Around the entrance to Cork Harbour, the diurnal tides are only about 2 cm, as there is a local diurnal amphidrome. We will not refer to diurnal tides further in this study. As the semidiurnal tide spreads into Cork Harbour, there is a constraint on the flow due to the width and depth of the channels. The Admiralty Tide Tables (ATTs) show time and height differences related to Cobh, which is an ATT Standard Port for a large part of the southern Irish coast, for historical Admiralty charting reasons. The ATT indicates slightly later tides as the wave moves up the harbour, with small increases in amplitude.
Cork City has a long history of flooding, due to a combination of fluvial flooding from the River Lee and tidal flooding. Tidal flooding became more common through the 20th century (Tyrrell and Hickey, 1991). In 2009, the city suffered flooding losses of up to EUR 100 million (Hickey, 2010). Cork City was part of an OPW Pilot Catchment Flood Risk Assessment and Management (CFRAM) study that was substantially complete in November 2009, which identified the flood risk in Cork City and the basic structure of the preferred solution for the city. Substantive consultation and planning for flood alleviation resulted in the proposed Lower Lee Flood Relief Scheme. The scheme allows for improved management and control of the River Lee via upstream dams at Inniscarra and Carrigadrohid, provision of quayside defences, flood defence embankments between Inniscarra and the city, and a system of pumps to remove additional water (Office of Public Works, 2017a). The preferred solution was selected following consideration of a range of options in both the Lower Lee Project and the CFRAM pilot project. The inflow from the ocean is uncontrolled in this plan. A tidal barrier was among the options considered in both the CFRAM and Lower Lee project, but it was not found to be feasible for a variety of reasons. Following proposal of the project, a tidal barrier was again suggested during consultation by members of the public. Further consideration was given to the tidal barrier option, but it remained unfeasible, again for a variety of reasons. (Office of Public Works, 2017b). Understanding the currently anticipated changes in future sea levels and tides in the context of historical changes is important in preparing a project to defend Cork City against the current level of flood risk and for considering how adaptation can be built into such a project.
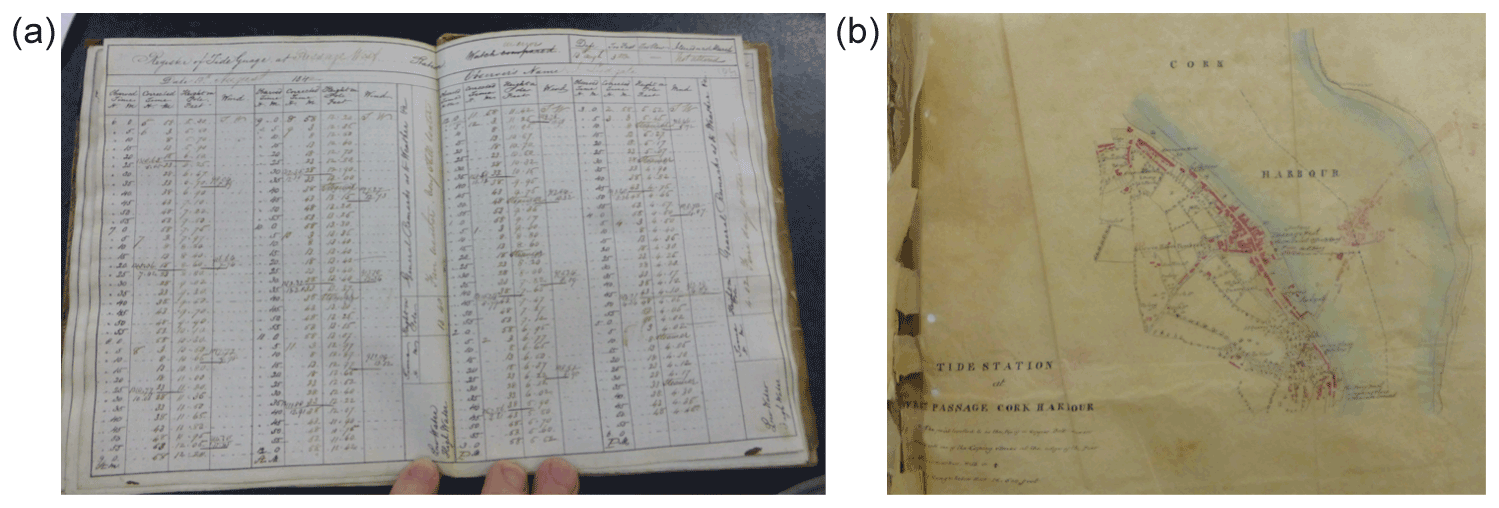
Figure 2(a) An extract from the original Passage West ledger. There are two double page spreads each day. Held in the Cambridge University Library archives. RGO : 254. (b) The original Ordnance map of the tide gauge site at Passage West, held in the Cambridge University Library archives. RGO : 254.
Our primary purpose has been to compare 1842 and recent sea levels at Passage West. The 1842 levels were measured as part of the 1839–1843 Ordnance Survey of Ireland (Cameron, 1855). The work included simultaneous sea level measurements at 22 Irish coastal locations from late June to late August 1842 (Fig. 1). The results of Airy's analyses are published in Airy (1851), while the original observations are available in hand-written ledgers at the Cambridge University Library, Royal Greenwich Observatory archives (Fig. 2). More details can be found in Andrews (1975, Appendix 3) and Dixon (1949). The 1842 survey consisted of readings every 5 min throughout the day and over a few hours through the night-time high water or low water.
Two observers, usually military people, were assigned to each site: at Passage West they were J. Ludgate and W. M. Dawson, on whose detailed work this study depends. A tide gauge (i.e. a graduated board) was nailed to the face of the steamboat wharf. Measurements relative to the gauge zero could in turn be related to the height of a copper bolt driven vertically into one of the coping stones of the pier. This bolt could not be located in 2019, but the level of this bolt to Ordnance Datum Dublin (ODD) from the 1839–1843 levelling is given in Cameron (1855) as 14.276 feet (4.351 m). We have digitized the hand-written ledgers, taking only values on the hour, which is adequate resolution for tidal work, and then made an analysis using software which can work with 19th-century data.
The Ordnance Survey had earlier made sea level measurements in the Cork region in 1840 at both Roberts Cove and Ballycotton, when the levels of low water on spring tides were determined. These were linked to the 1839–1843 survey (Cameron, 1855), but the original data have not been found.
For direct comparison with today's tides, sea level measurements were made at a reoccupation of the 1842 Passage West site, which is now a quiet residential waterfront, for a period of 44 d in June–July 2019. The data were measured and recorded on an RBR pressure (strain) gauge and converted to water levels using an appropriate seasonal seawater density from maps of temperature and salinity (Hartnett and Nash, 2015). Laboratory calibration was undertaken post-deployment to validate the accuracy of the measurements. These 2019 levels were not connected to the National Datum and are used for comparison of tidal constituents alone.
In addition, the International Hydrographic Bureau lists of tidal constituents has results from 1904 and 1906 for Haubowline Island, Cobh (International Hydrographic Bureau, 1930), data, which is also in the UK Hydrographic Office archives, Taunton. Measurements at Roberts Cove are from a 1973 Celtic Sea survey by the UK Institute of Oceanographic Sciences (now NOC, Liverpool) over 176 d using a bubbler system. Roberts Cove 1973 levels were connected to Ordnance Datum Dublin through a local benchmark, which could not be found in 2019. In the absence of better information, conversion to Ordnance Datum Malin (ODM) uses the same adjustment as at Passage West of 2.752 m: the separation is about 14 km.
For direct comparison of MSL change, the present-day National Tide Gauge Network was used. This network of sea level stations is maintained by the Office of Public Works (OPW) and by the Irish Marine Institute (MI). The data are of high quality, referred to Ordnance Datum Malin by GNSS (Global Navigation Satellite System) equipment, and freely available on the web. We have used data from Ringaskiddy, Ballycotton, and the Currach Club, the latter being in the city of Cork at the head of the harbour system (Fig. 1).
The data at Passage West in both 1842 and in 2019 are of good quality. Figure 3 shows a sample of the 1842 data superimposed on the continuous curve of predicted tides using the 2019 tidal constituents with good agreement, supporting an initial data quality check on the tide information. Consequently, because we are looking at potentially small differences, it is necessary to make adjustments for seasonal and nodal changes for tides and for seasonal and weather adjustments for mean sea level.
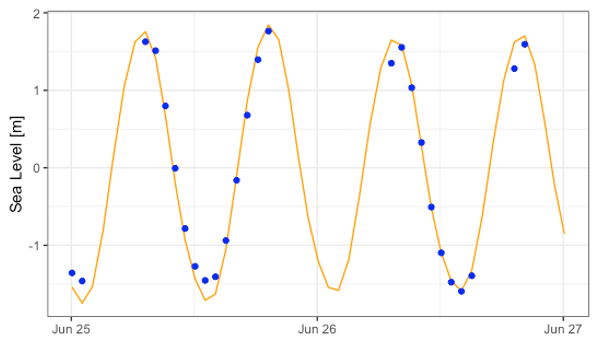
Figure 3A comparison of 1842 observed sea levels (blue dots) with tides computed from the 2019 analysis (orange line). Observations include meteorological effects.
4.1 Adjustments to tides
4.1.1 Seasonal variations
Seasonal variations can have a significant influence on the non-astronomical variation in tides. We consider a number of factors, in order of magnitude, that impact tidal constituents. In shallow-water areas there is a big seasonal effect due to hydrodynamics, which can be up to 2 % of M2 amplitude in extreme cases. There is also a seasonal effect on the tidal times of 1 or 2 min. Lower amplitudes in the stormy winter months have been ascribed to non-linear removal of tidal energy because of tide–surge interaction. However, seasonal differences in stratification are also thought to play an important role (Gräwe et al., 2014). There is also a small annual modulation of M2 represented in annual analyses by two sidebands of M2 corresponding to MA2 of 28.9430∘ per hour and MB2 of 29.0252∘ h−1. This yearly modulation is partially caused by a small astronomical modulation of about 0.3 % for each term, due to solar parallax influencing the moon's orbit very slightly. This is identical year on year. Seasonal effects are also influenced by weather. Altogether, these seasonal modulations are typically about 1 % in amplitude (but perhaps more in shallow water and confined seas and harbours), but near the open ocean they are less than 0.5 %, close to the basic astronomical modulations (Müller et al., 2014; Woodworth et al., 1991; Pugh and Vassie, 1992).
For general comparisons for the Cork area, we have used the seasonal modulations observed at Ringaskiddy from 2012 to 2019, as plotted in Fig. 4. If we were to compare M2 amplitudes and phases from the same months (e.g. July–August) in different years, then we would not have to worry about their seasonal variations. However, in the present case we do indeed have to consider this. Figure 4 shows that the observed tides are 2 min later than usual in June and 2 min earlier in December because of seasonal effects. To adjust to an annual mean, we therefore add 2 min in June and subtract 2 min in December. Similarly, M2 amplitudes are 8 mm higher in July and 8 mm lower in January. We adjust by subtracting 8 mm in July and adding 8 mm in January.
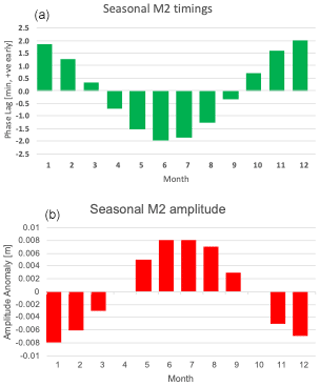
Figure 4Seasonal modulations for M2 at Ringaskiddy 2012–2019 for (a) timing and (b) amplitude. Differences are computed between a year of predictions based on M2 and then on M2 plus MA2 and MB2. Timing differences are in minutes, and amplitude differences are in metres.
4.1.2 Nodal adjustments
Amplitudes and phases of M2 and other lunar constituents are affected by nodal variations which modulate the astronomical tidal forcing over an 18.61-year cycle. These cannot be calculated from observations using only a few years of data or less. Tidal analyses usually allow for this by assuming that nodal variations occur in real observations in the same way as in the equilibrium tide (Pugh and Woodworth, 2014). The nodal effects are represented by two modulations factors:
where N is the nodal phase angle with a period of 18.61 years. It will return to zero phase in January 2025. In the equilibrium tide, the value of α is 0.037 (3.7 %) and that of β is −2.1∘ for the phase of the M2 constituent. Although at deep-ocean sites the full 3.7 % amplitude modulation is approached, locally in shallower water the non-linear loss of tidal energy means that the nodal amplitude modulations of α observed in practice are less than the full 3.7 % based on analyses of data over 18.6 years (Woodworth et al., 1991; de Araújo, 2005; Woodworth, 2010).
As regards the June–August 1842 observations, the astronomical nodal effects in the tidal forcing are identical at the Airy sites. However, there are local differences due to the scaling of the local nodal factor being less than the full 3.7 %. This is explained in more detail below.
We have used the Tidal Analysis Software Kit (TASK, Bell et al., 1996) for our tidal analyses. Nodal adjustments are performed within TASK assuming the full 3.7 % nodal modulation for M2 amplitude. This must subsequently be adjusted to a chosen local factor. In the absence of many years (in principle a full 18.6 years) of sea level data at Cork by means of which the factor could be determined directly, we have estimated its magnitude by consideration of the factors obtained at other UK and Ireland sites (Woodworth et al., 1991; de Araújo, 2005). As a result, we have applied an estimated local factor of 2.8 %. As a sensitivity test of this choice, we also applied factors of 2.4 % and 3.2 % and found the M2 amplitude variations to be modified by 0.004 m. A similar exercise determined M2 phase lag to be modified by 0.4∘. These unavoidable uncertainties must be factored into interpretation of any subsequent differences between historical and modern findings on M2.
We have also adjusted the local nodal amplitude modulation to 2.8 % for the Cobh 1904 and 1906 IHB and ATT values, as nodal 3.7 % adjustments were generally included in analyses at that time.
4.1.3 Uncertainties
In applying these adjustments for the whole Cork Harbour region, there must be local uncertainties about basing the seasonal modulations on Ringaskiddy information, where seasonal modulation may well be less than at Roberts Cove and Ballycotton, where there are more open oceanic conditions, and seasonal modulations may be greater in the upper harbour reaches of Cork City. Therefore, within our study area the nodal 2.8 % factor may vary slightly, but we have no better approach to follow.
In assessing the tidal uncertainties, any tidal value measured over a short period may differ from the longer-term average because of real variations, such as natural interannual variability and measurement errors. To consider interannual variability, we look at Ringaskiddy 2012–2019, but only for the months of July and August. After nodal corrections, the M2 constituents based only on summer data had an amplitude of m and phase lag of ∘, which is a statistical variability of 0.5 % and 3.3 min, respectively. These results compare favourably with year-on-year M2 variability at Newlyn, UK, over 81 years, which had annual variations of 0.5 % and 0.6∘, equivalent to 1.2 min (de Araújo, 2005). Therefore, our observations at Passage West in 1842 and 2019 both being in June–August will minimize the background variability due to natural “noise”. For determining tidal amplitude and phase lag changes in future campaigns, the best estimate of confidence may be to look at the variability of constituents over several years from a site with a long record, year-on-year, for individual months of data.
There is one final consideration, the timing accuracy of the clocks in 1842. Airy reports the following information:
The watches were for the most part chronometers or level watches. An officer visited each station at least three times, and the greater number of stations, four times, carrying a good pocket chronometer whose error on Greenwich Time was known. Two itinerant chronometers were thus employed. The error of each of the observer's watches was afterwards computed every day of observations from these comparisons, and this error was applied to form the correct Greenwich time of every observation.
From the original manuscripts it appears that only two visits were made to Passage West, on 1 July and 29 July 1842. On these days the local watch time was reset. From 1 to 29 July the local watch had drifted slower by 6 min, a daily loss of 13 s a day. This rate was then extrapolated backwards to 25 June, and forwards to 23 August, assuming a constant drift. Until reset on 1 July, and thus before correction to GMT was available, the local time was approximated to local (solar) time, 34 min behind Greenwich. The assumption of linear drift was checked to see if non-tidal residuals showed variations at tidal periods, an indication of a timing error, but nothing significant appeared.
The quality of data, and in particular the quality of the timing information, at other individual stations may be better or worse than at Passage West: one indication will be the number of days of tidal residuals removed in the data quality editing process. Passage West had only 28 hourly values removed from 707 observation hours in total. Elsewhere, we know that more problems were encountered. For example, Airy reports timing difficulties at Glenarm and Ballycastle, where the town clock had to be used and then corrected for longitude.
Conversion to GMT was done by Airy at the Royal Greenwich Observatory. Airy (1851) gives no information on the source of the calibrations of the itinerant chronometers, but we may suppose that the Observatory at Dunsink, Dublin, was used. Dunsink times would be adjusted for the annual Equation of Time (an addition of up to 5 min in June–August) and the longitude difference from Greenwich (6.3490∘, equivalent to adding 25 min and 24 s). Even though accurate telegraph time transfer to Dublin was not possible until a submarine cable was laid to Ireland, between Holyhead and Howth in 1852, chronometer transfers would have reduced uncertainties in both adjustments to GMT to less than 1 min. Using direct measurements of solar time for 18:42 GMT and its equivalent, Coordinated Universal Time (UTC), for modern measurements, bypasses the issues of variable Earth rotation and Terrestrial Time discussed by Cartwright (1985).
Overall, tidally for M2, considering the above discussions, we might reasonably assume an amplitude accuracy that is perhaps slightly better than 1 % and a timing accuracy of better than 2 min.
4.2 Adjustments to mean sea level
Airy and most 19th-century sea level analysts computed mean tide levels (MTLs), the average of paired high and low water levels, whereas TASK analyses provide an estimate of Z0, which is the mean sea level (MSL), the arithmetic average of all data.
At Passage West, Airy calculated a MTL of −7.787 ft (2.373 m) below the copper bolt benchmark. A modern TASK analysis of the Airy data gave MSL at ft (2.380 m), so MTL is 0.023 ft (0.007 m) higher than MSL. There are real MTL to MSL differences due to tidal dynamics, usually of a few centimetres (see Pugh and Woodworth, 2014; Woodworth, 2017).
4.2.1 Seasonal variations
The seasonal cycle of MSL for British and Irish ports is largely driven by winds and air pressure and by regional steric effects, salinity, and temperature differences in the northern Atlantic Ocean, which are very coherent both regionally and from year to year. MSL in November is on average about 120 mm higher than in April–May. Using PSMSL data for Ireland we find a very small increase in the adjustment with increasing latitude of 0.8 mm per degree of latitude.
For the period of the Airy measurements, late June to late August, the MSL is below the long-term annual average, as the ocean warms and expands later through the summer and the autumn. This means that the measured levels must be increased slightly to give an adjusted annual mean. Based on the approach in Hogarth et al. (2021), a regional European shelf model was used to calculate the necessary seasonal adjustment. At the latitude of Passage West, we need to add 26 mm. This value compares well with seasonal adjustments averaged over the months July to August of 24 mm independently derived from the PSMSL MSL data for Dublin and 24 mm for Milford Haven in Wales, which is at a similar latitude to Passage West (Hogarth et al., 2021).
4.2.2 Weather effects
Even after removing seasonal effects, irregular air pressures and winds affect sea levels, and thus contribute to an MSL estimate. Air pressure, acting through the inverse barometer effect, is the main factor, especially in the summer months. We can adjust levels for the average observed air pressures over the observation period of 62 d in 1842 using version 3 of the 20th Century Reanalysis Project air pressure data set (Slivinksky et al., 2019), assuming an inverted barometer response of a 10 mm increase of sea level for every millibar of fall in atmospheric pressure.
The air pressure adjustment for Passage West requires 49.2 mm to be subtracted because the air pressures in June–August 1842 were lower than the long-term seasonal average, resulting in higher sea levels.
4.2.3 Uncertainties
In addition to adjustments to the observed MSL values, the other unknown factor that will limit the interpretation of differences from one epoch to another is the natural background of interannual variability. Where there is a nearby long-term gauge, an estimate of the magnitude of this variability can be obtained from recent measurements, with an assumption that interannual variability was the same in the historical period as it is today. This is not possible here for discussion of Cork sea levels in 1842.
To estimate how representative a short period of data is of a long-term average, we need a long series of observations, not available from Irish gauges. On the western European Shelf with exposure to the Atlantic the inverse barometer adjustment is a viable first approximation, though it would certainly not apply for the North Sea (Woodworth, 2018). In the absence of good-quality long-term records from western Ireland and with Dublin influenced disproportionally by shallow water Irish Sea effects, we choose to look at the Newlyn UK gauge data as representative of the northwestern European shelf. The Newlyn data are from 1915 to 2018. The standard deviation of monthly anomalies from the long-term trend in sea level is shown in Fig. 5.
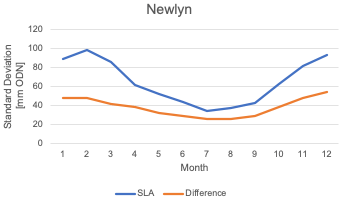
Figure 5The standard deviation of monthly MSL anomalies at Newlyn (1916 to 2018) before (upper line) and after correcting for air pressures (lower line) and with the long-term trend in sea level removed in each case.
The air pressure adjustments make a very significant reduction in the month-on-month variability. Interannual variability is lowest in July and August, which is why measurements for comparisons are best made in mid-summer – a fact that thankfully Airy was aware of. The indicative Newlyn data are summarized in Table 1.
Table 1The standard deviation of interannual variability for yearly averages, monthly average, and for specific months (July–August) for Newlyn 1915–2018, before and after making inverted barometer adjustments. This is an irreducible limit on the representativeness of short-period data for the long-term mean. See also Fig. 9 of Hogarth et al. (2021).
Uncertainties in mean sea level may be summarized as follows.
-
Where a year or more of sea level data is available and analysed, the standard deviation, after removing a trend due to interannual variability and after allowing for air pressure anomalies, can be lower than 25 mm.
-
For the two summer months of July and August, the Airy period, the standard deviation of MSL without air pressure correction is about 40 mm. Making air pressure corrections reduces this to about 20 mm. Other uncertainties are significantly less than this. The MSL differences from 1842 to 2019–2020 are much bigger than these uncertainties, as we shall see in the next section.
In principle, one should also adjust short records such as those in 1842 and 2019 for the nodal long-period tide (not to be confused with the nodal adjustments to the M2 constituent discussed above). This tide has a period of 18.6 years and an amplitude of approximately 0.5 cm at the latitude of Ireland (Woodworth, 2012) and has its largest (positive) values approximately in the years 1839.0 and 2025.0. It can be seen, therefore, that our 1842 and 2019 measurements took place when the magnitude of the nodal signal would have been only a few millimetres, and for this reason we have not adjusted our MSL values accordingly. Any local modification of the anticipated nodal variation in MSL (e.g. due to possible shallow-water processes) cannot be identified from our limited data.
For comparison with 21st-century Irish sea level observations, historical sea levels need to be converted to the Irish National Datum, Ordnance Datum Malin. This requires a close understanding of the various datum levels used by the Ordnance Survey since 1839–1843.
At the original 22 Airy sites in 1842, measurements were all linked to a local benchmark, often a copper bolt in the jetty, as at Passage West. Some of the original marks still exist, although unfortunately not the one at Passage West. Subsequently, benchmark levels have been adjusted over time, to a succession of national datums, notably Ordnance Datum Dublin (ODD), now Ordnance Datum Malin (ODM). Originally levels were transferred by theodolite levelling, but modern transfers are made using GNSS. All GNSS measurements used here are related to ODM using the OSGM15 geoid model (Greaves et al., 2016). At its simplest, if the 1842 benchmark still exists and is stable, it and the 1842 MSL can be directly connected by GNSS to ODM. Therefore, even when the original benchmark has disappeared, as at Passage West, there are indirect ways of recovering the datums and of making a transfer.
Airy (1851) does not give the levels to ODD of the copper bolt benchmarks. These levels are published separately, and we have recovered them from the ledgers archived by the Irish Ordnance Survey, Phoenix Park, Dublin, and in Cameron (1855, Passage West is on p. 42, Mark 222). The Passage West benchmark was at 14.726 ft (4.488 m) relative to ODD. Some National re-levelling was done 1888–1895, which resulted in all the 1842 benchmark levels to ODD being slightly revised.
Fortunately, the differences between these 19th-century revisions have been investigated and tabulated. Andrews (1975) (Appendix 3) gives the Airy Mean Tide Levels for all 22 sites, including Passage West, to ODD (1839–1843) and to ODD (1888–1895). Throughout Ireland there are differences of up to ±0.7 ft (0.213 m), though usually much less than this; at Passage West the MTL level was increased from 6.934 ft (2.113 m) (1839–1843) to 7.402 ft (2.256 m) (1888–1895) by the revision. The sources of Andrews' values are traceable: Dixon (1949) revisits the Airy data with a narrative of the various levelling campaigns. Dixon (1949) includes (Table 1 in his paper) the Airy MTL at the 22 sites, for Airy (1851), for Cameron (1855), and for Pery (1911). Pery (1911) is an elusive source cited in Dixon (1949) that may be an internal OSI document. The values attributed to Pery (1911) are the same as in Andrews (1975) for the 1888–1895 levelling.
The digitized 1842 data were edited as described earlier and analysed for 27 tidal constituents and MSL, also termed Z0, using TASK. These Z0 values are referred to Tide Pole Zero. Tide Pole Zero is not given to any datum by Airy (1851), but it is handwritten on the 22 local maps in the Royal Greenwich Observatory archives, alongside the ledgers of observations, relative to the local benchmark. At Passage West the tide gauge zero was 16.5 ft (5.029 m) below the copper bolt benchmark. Thus, from the original data MSL we can convert to the benchmark, and then to the local ODD (1839–1843). No benchmarks from 1839–1843 have been found around Passage West, and thus we rely on the adjustment in Andrews, Dixon, or Pery to convert to the 1888–1895 local ODD.
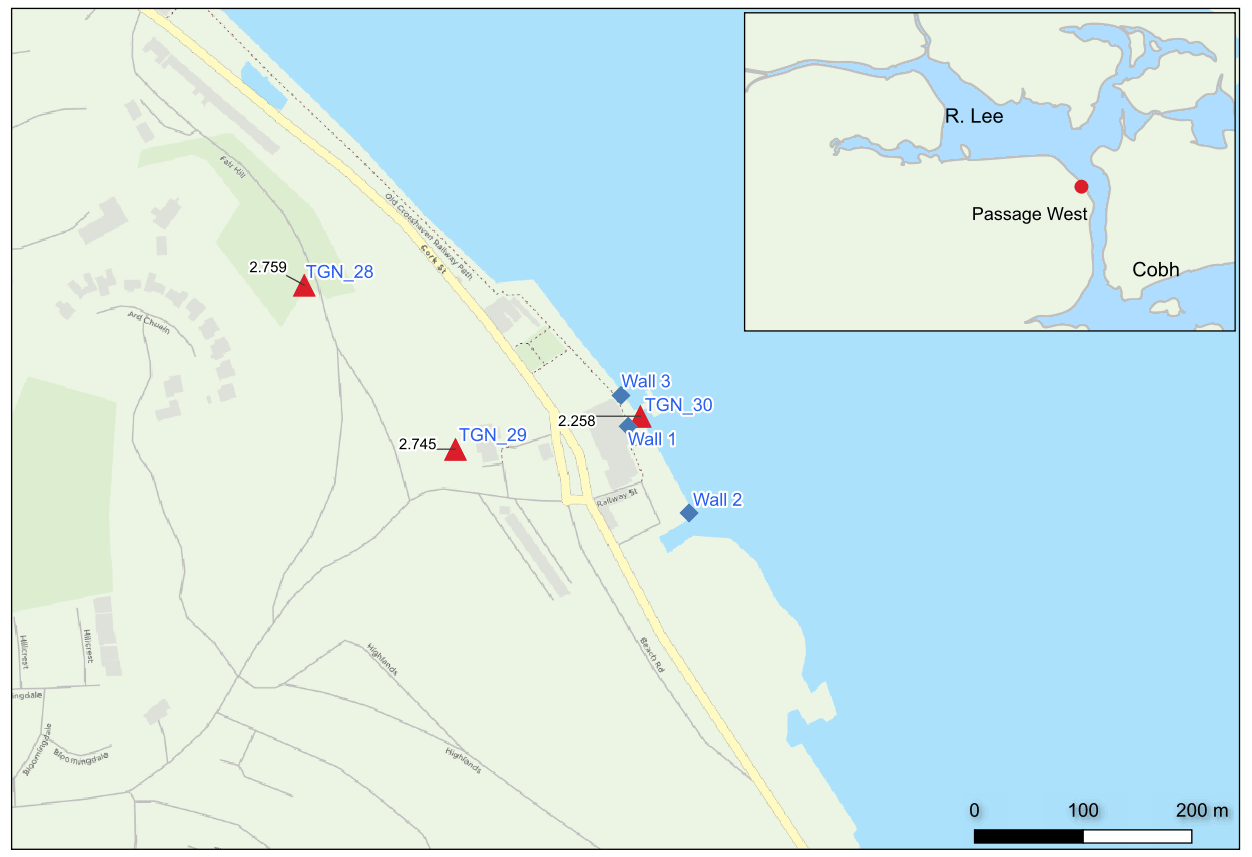
Figure 6Map of Passage West, showing the two 1888–1895 marks, TGN_28 and TGN_29. The Airy site and our 2019 observations were at the newly established site TGN_30. Levels at Wall 1 to 3 were failed attempts to recover the 1842 mark.
Table 2Conversion of ODD to ODM. This close agreement confirms the high quality of the 19th-century levelling. TGN_29 was located on the north-facing wall of the Anglican Church. TGN_28 was located on the south-facing estate wall on the Back Road. See Fig. 6 for exact locations.
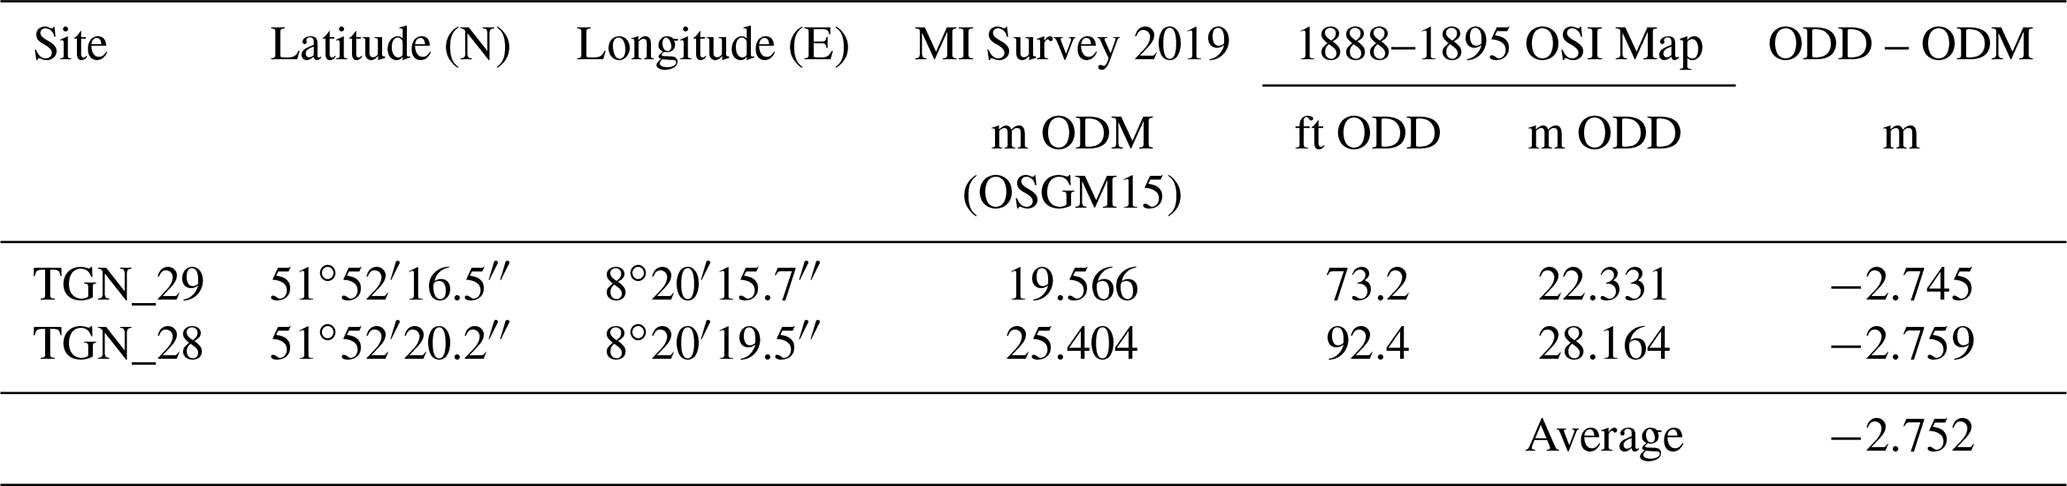
Two extant local benchmarks from the 1888–1895 levelling were located (TGN_28, TGN_29) and together with a newly established benchmark (TGN_30) were connected to ODM using a Precise Point Positioning GNSS and total station survey and the OSGM15 geoid model. Using the two benchmarks on the 1888–1895 levelling (TGN_28 and TGN_29), sea levels at Passage West, measured to ODD (1888–1895), can be converted to ODM by subtracting 2.752 m (Fig. 6 and Table 2).
6.1 Tides
Table 3 summarizes the principal tidal harmonics for the region. From west to east, in the approaches to Cork Harbour in the Celtic Sea, between Roberts Cove and Ballycotton, the M2 amplitude increases by 0.045 m, and the timing advances by 4.4∘ or 9.1 min; this is the west to east progression of the Kelvin tidal wave from the Atlantic Ocean. From south to north, between Roberts Cove and the Currach Club, at the head of the harbour system, the M2 amplitudes are increased by 0.127 m, consistent with a standing wave, and the times are 9.0∘ or 19 min later. Locations within the harbour have intermediate amplitude and phase values. There are also small increases in the amplitudes of the shallow water tide M4 due to local influences. In Table 3, the right-hand column gives the age of the tide, the average time interval between maximum tidal forcing at new and full moon, and maximum local tidal amplitudes (spring tides); this is calculated from the phase difference between M2 and S2 (Lamb, 1932; Pugh and Woodworth, 2014). The agreement is additional assurance of good data.
Table 3Table 3 shows the harmonic tidal constituents calculated at the specified locations around Cork Harbour (see Fig. 1 for locations). Constituent amplitudes (H) and Greenwich phase lags (G) are in metres and degrees, respectively, and have been adjusted for seasonal and nodal effects.
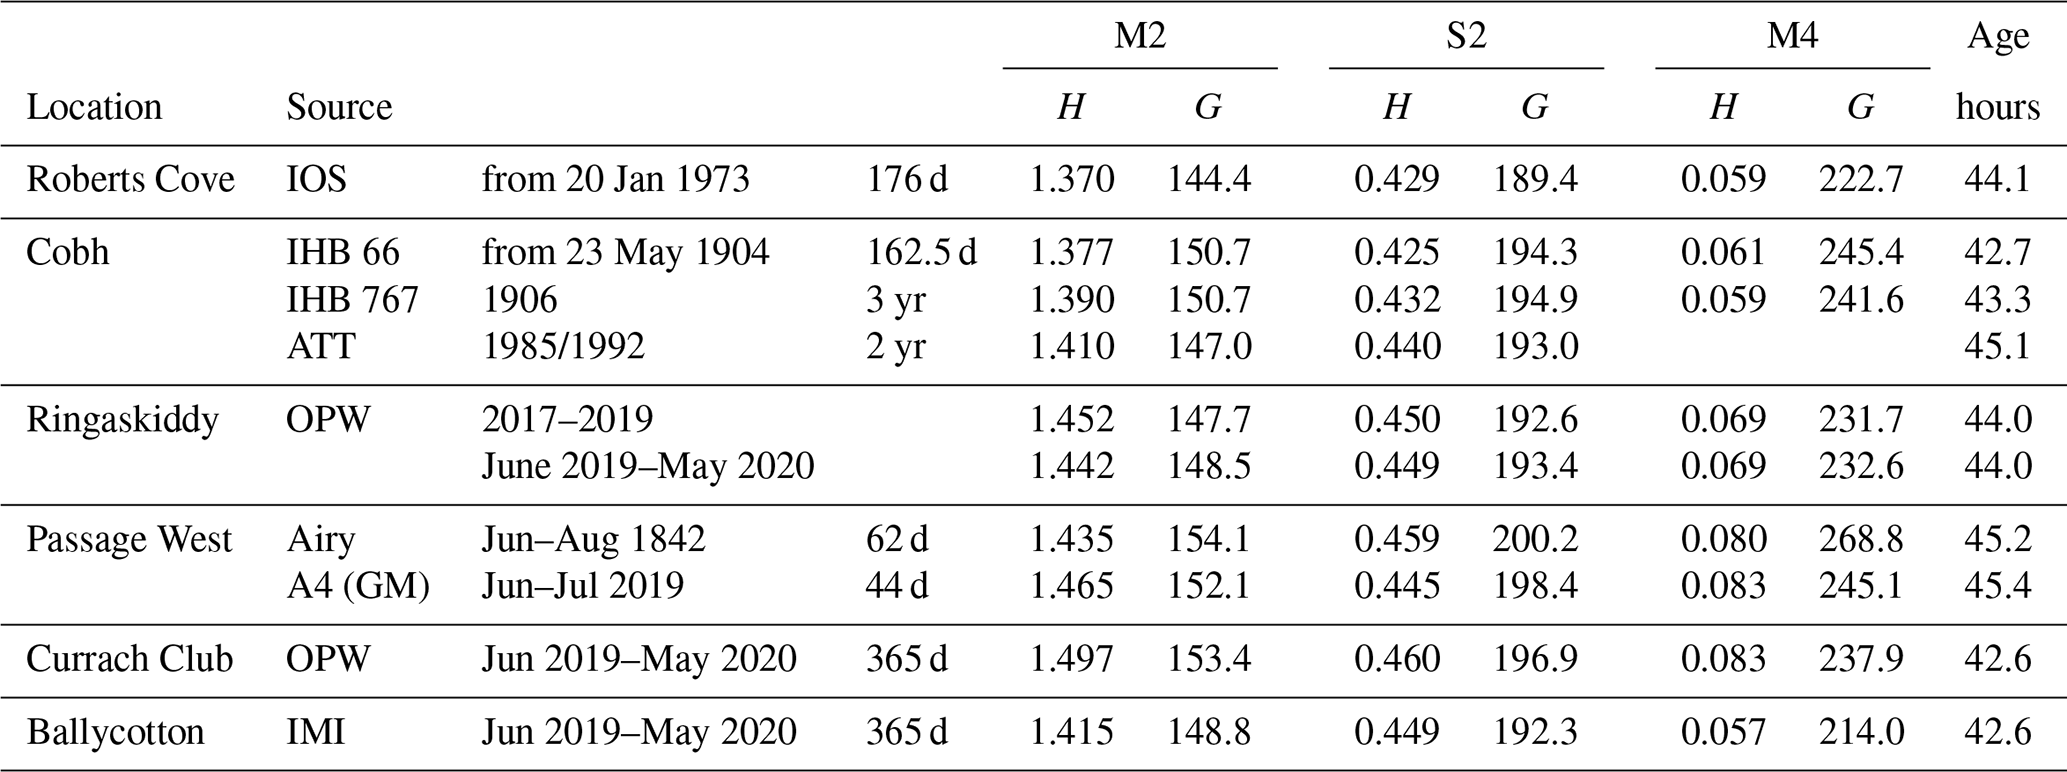

Figure 7A summary of the datum and sea level changes 1842 to 2019–2020. Note the value of ±0.02 m uncertainty is based on irreducible interannual variability.
The semidiurnal tidal change, as represented by M2, between 1842 and 2019 is assessed at Passage West, where the intervening period of 177 years and reoccupation of the exact measurement location allows comparison of tidal constituent change. The amplitude of the M2 component increased by 3.0±0.5 cm or 2±0.5 % from 1.435 to 1.465 m. The phase lag of the M2 component decreased by from 154.1 to 152.1∘, equivalent to the tide being 4 min earlier. Given the complicated processing and harbour developments, an agreement of 4 min over 177 years seems remarkable.
6.2 Mean sea level
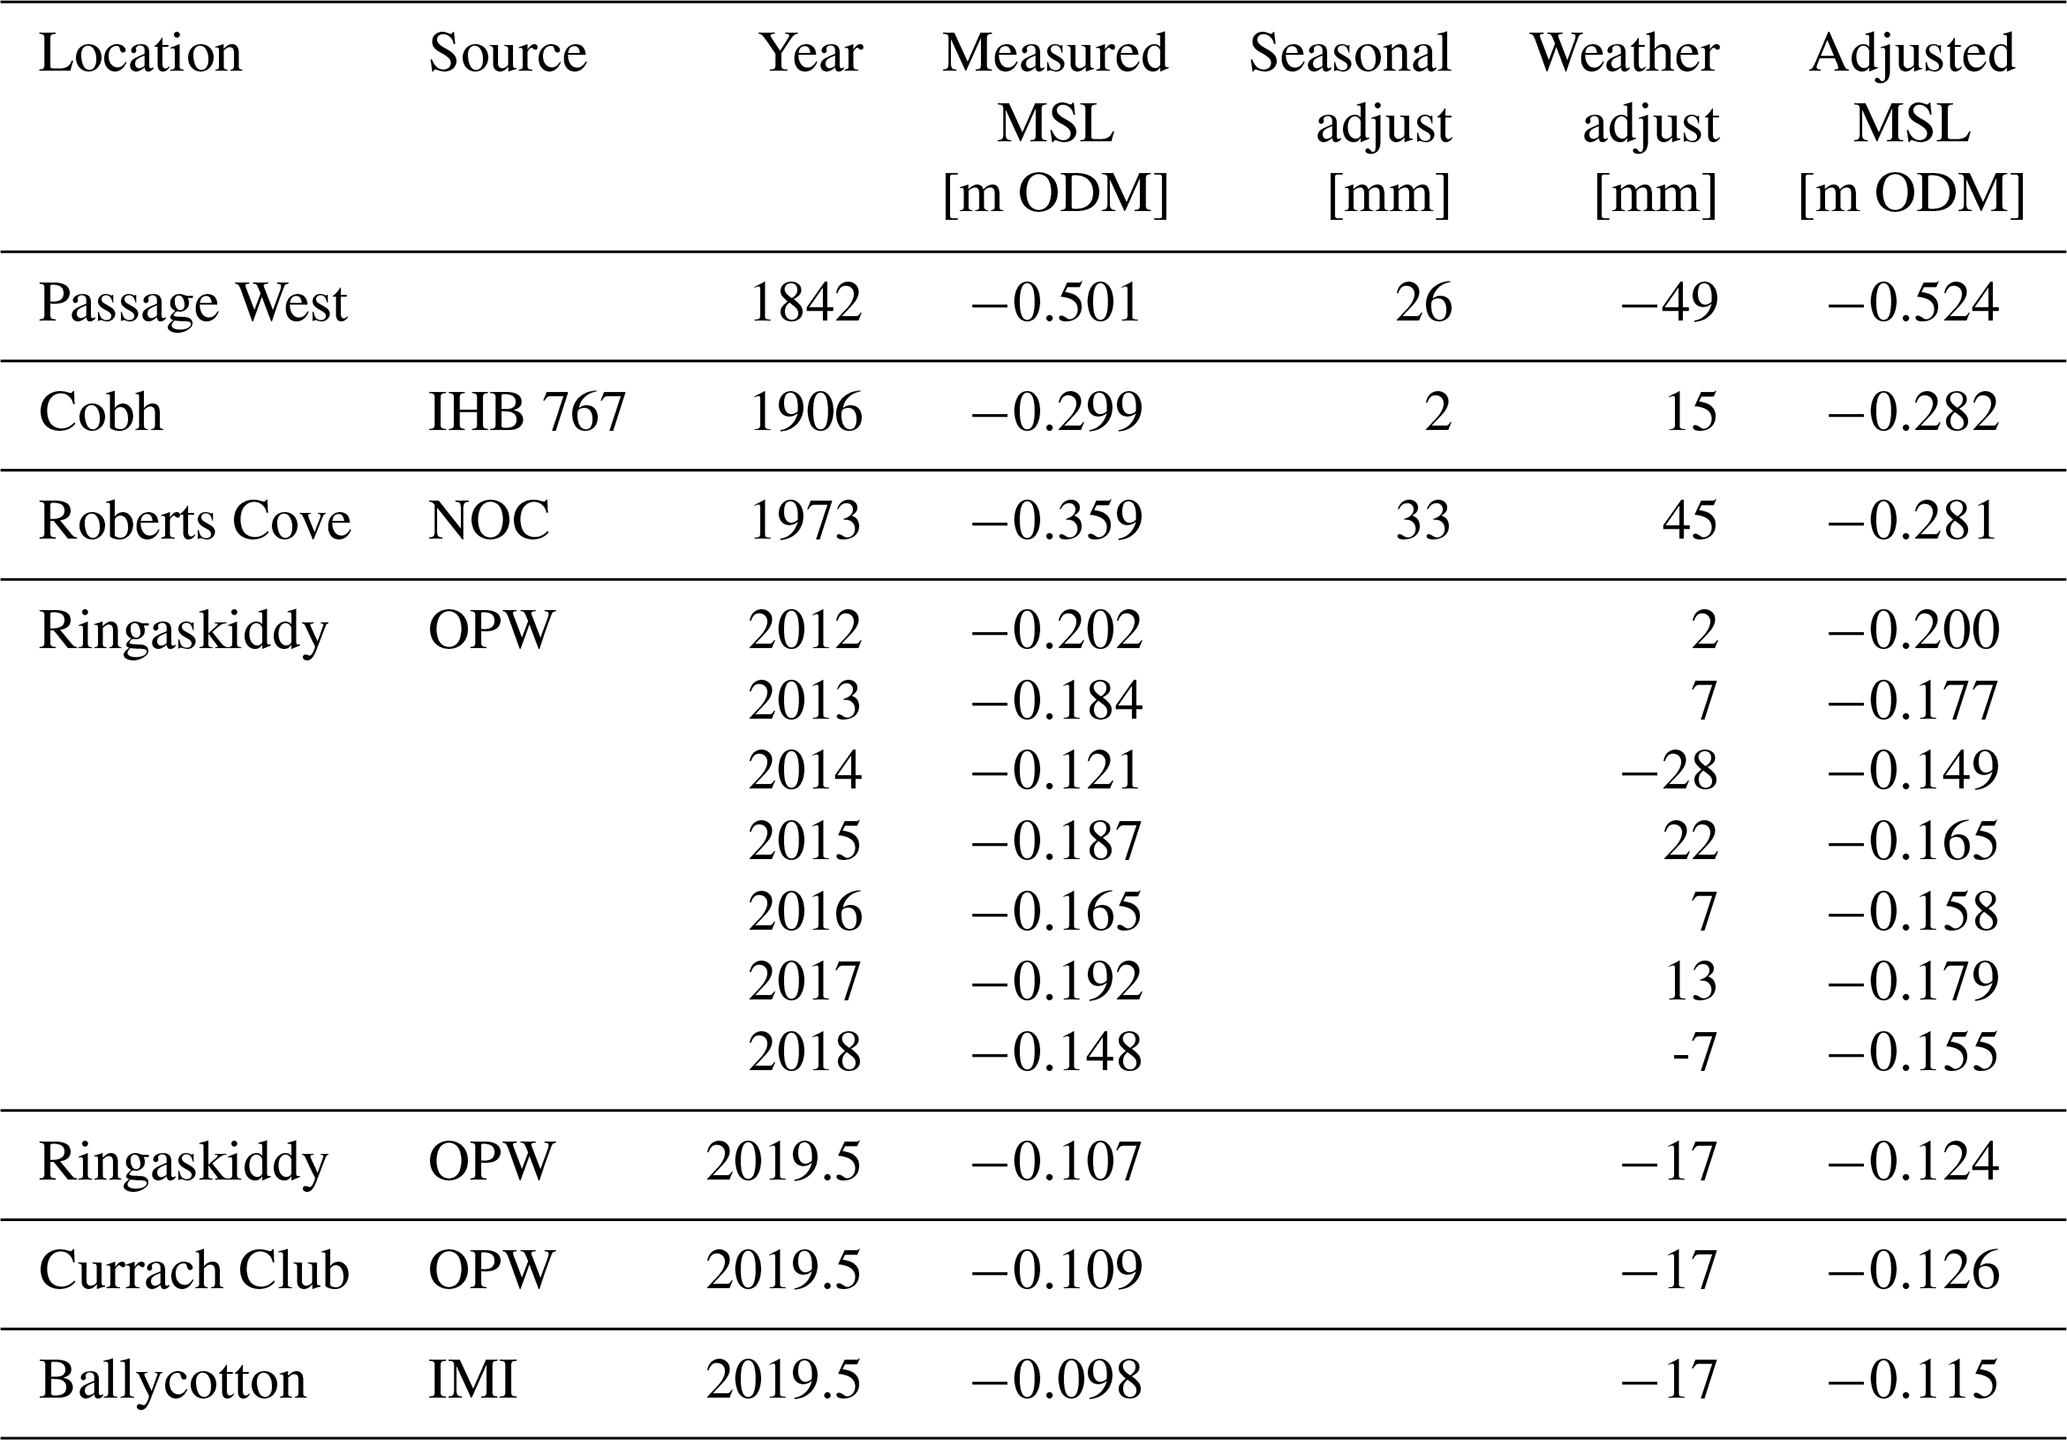
Reconciled datum and sea level changes for the historical Airy observations, relative to modern measurements, are shown in Fig. 7, with the mean sea level values for each location in the Cork Harbour region shown in Table 4. The three National Network sites (Currach Club, Ringaskiddy, and Ballycotton) show close agreement, within 1 cm for simultaneous 2019–2020 MSL data. This suggests that geoid errors are low and that the sites, which are maintained by two different organizations (OPW at Currach Club and Ringaskiddy and MI at Ballycotton), show robust interoperability.
Table 4Observed and adjusted MSL values since 1842 at the sites around Cork Harbour relative to ODM. Seasonal and weather adjustments are also listed. Simultaneous comparison of three National Network sites (Ringaskiddy, Currach Club, and Ballycotton) is calculated from June 2019–May 2020 (referred to as 2019.5 in the table).
The series of levels from 2012 to 2018 for Ringaskiddy shows the interannual variability. This 7-year time series has a range of 8 cm and a standard deviation of 0.029 m. The standard deviation is much smaller than our reported change in MSL from 1842. After correcting for annual weather effects, the standard deviation falls to 0.018 m and falls further to 0.010 m if a trend is removed. These values are comparable with the Newlyn figures.
Plotting these MSL values against time, the Cobh and Roberts Cove values are a good fit to the overall pattern. The seasonal and weather adjustments for Roberts Cove together move the value in 1973 much closer to the trend line, confirming the importance and validity of our adjustments. Although the IHB publishes two sheets of tidal analyses, IHB 66 and IHB 767, we use only the MSL from IHB 66 as the mean levels used in the analyses are not independent in the two analyses, which also fit well to the overall pattern. A least-squares fit to all of the data in Table 4 results in an overall trend of 2.2 mm yr−1, which matches the trend obtained using just the 1842 Airy level, and using the 20th-century levels we also obtain a trend of 2.2 mm yr−1. It is important to emphasize that the clustering of recent levels in the top-right corner is an indication of the background interannual variability and strong confirmation of the OSGM15 geoid used in GNSS datum transfers to Ordnance Datum Malin.
In summary, but now using just 1842 and the group of 20th-century levels, the Cork area sea level has risen by 0.402 m from 1842 to 2019–2020, a rate of 2.2±0.02 mm yr−1 (Fig. 8). The uncertainty in this rate is difficult to estimate, but at the two extremes irreducible uncertainty is probably around ±0.020 m, based on interannual (Newlyn) MSL variability, and the 2012–2018 Ringaskiddy variability, leading to a trend of 2.2±0.15 mm yr−1.
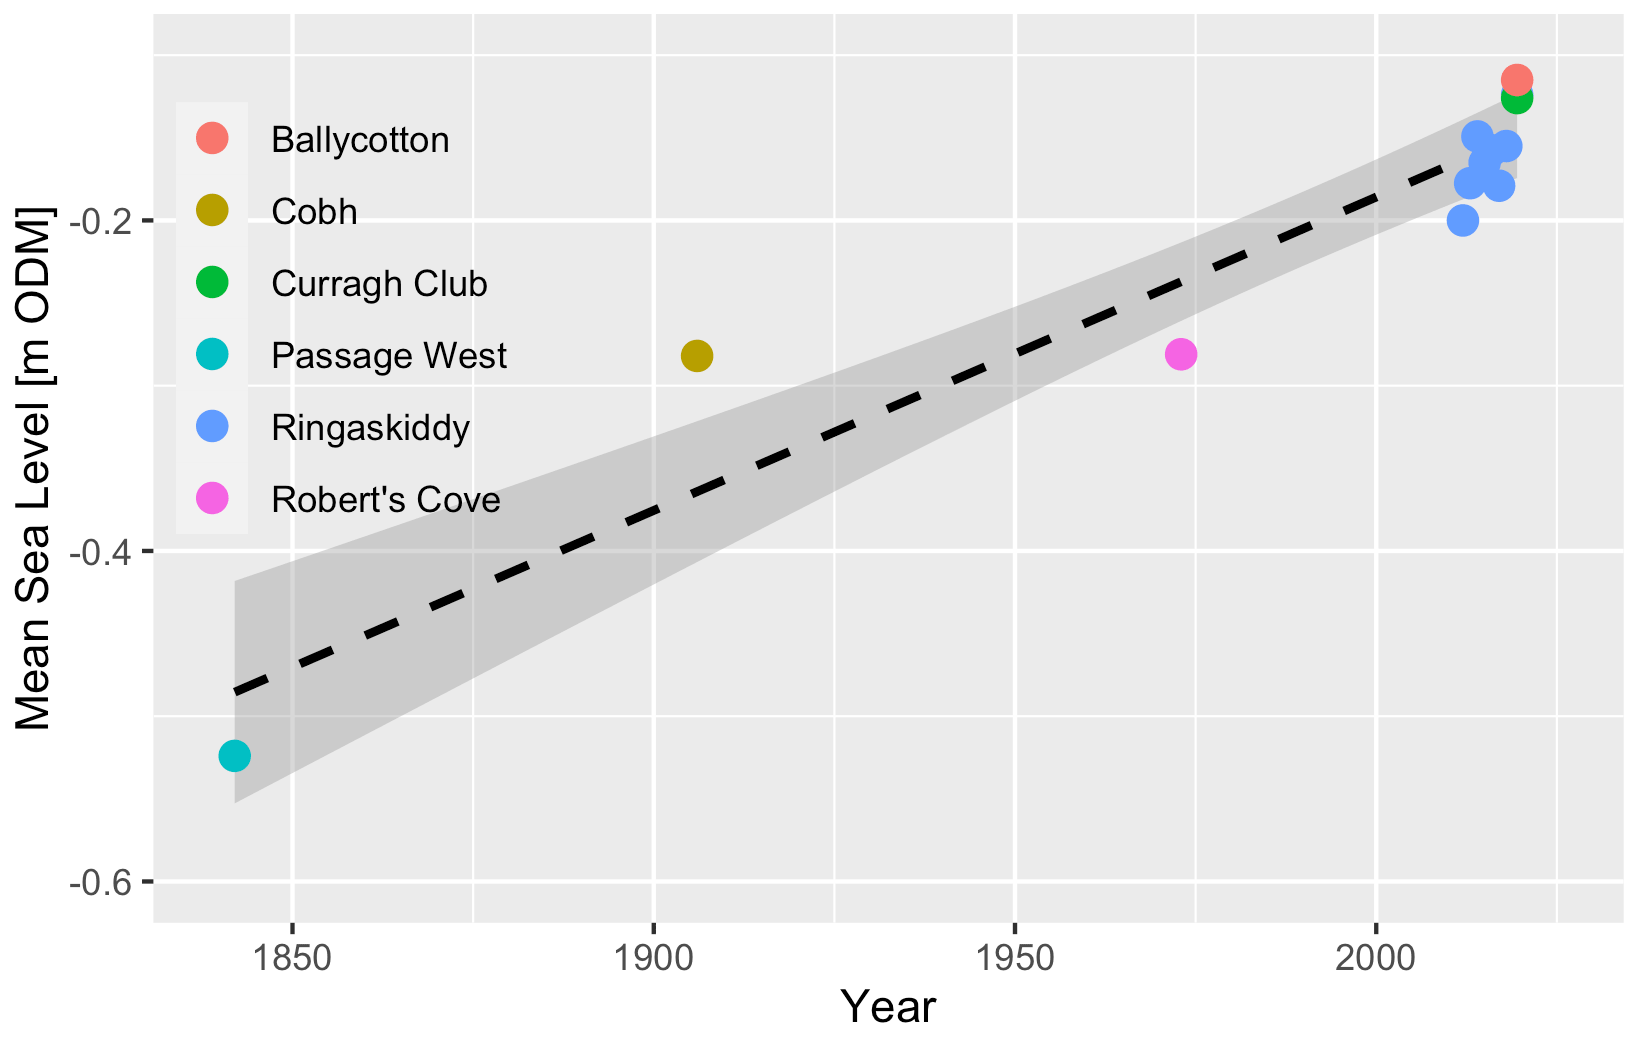
Figure 8MSL relative to ODM, in metres, adjusted for atmospheric effects, for all sites in the Cork Harbour region, with a linear trend fitted (dashed line). The 95 % confidence interval derived from fitting of the linear model is shaded.
The Passage West changes of tides can be considered in a regional and wider context. The tides are an ocean basin response to gravitational forces, which change only over very long geological periods. Cartwright (1971) found that at St Helena, between 1761 and 1961, semi-diurnal amplitudes were unchanged to within 2 % and that at Brest, between 1711 and 1936, there was similar stability (Cartwright, 1972). Woodworth (2010) found little evidence for extensive regional changes in Europe or the Far East including Australia and Asia, although spatially coherent regional changes were particularly evident in North America. He concluded that tidal changes in smaller regions may be commonplace around the world. Locally tides could change, for example, after harbour developments such as dredging and more widely because of substantial MSL increases. Woodworth (2010) showed mixed trends in M2 amplitude around Great Britain, with decreasing phase of M2 to the south along the western coast of Great Britain. The global presence of small, usually local, changes of tides is comprehensively reviewed in Haigh et al. (2020), and for a recent discussion for the North Sea area, see Jänicke et al. (2021). The stability of Cork Harbour tides is not uncommon, despite some local dredging and land recovery. This is notable, not least to inform estimates of local flooding risks and trends. In future, tidal trends in the region can be monitored using the local network of sea level gauges.
Global increases in MSL are well known and documented. Rates of global mean sea level (GMSL) for much of the 20th century range from 1.1 mm yr−1 (Dangendorf et al., 2017), to 1.5 mm yr−1 (Frederikse et al., 2020), and to 1.9 mm yr−1 (Jevrejeva et al., 2014), accelerating to over 3 mm yr−1 since the 1990s (Nerem et al., 2018; IPCC, 2019; Woodworth, 2021). Using these numbers and adding the GIA contribution, we would expect relative MSL rise in Cork to be in the range of 1.7–2.4 mm yr−1. Our estimate falls within this range.
This averaged linear MSL rise belies possible decadal variation. Hogarth et al. (2021) have shown that for Great Britain there has been acceleration between the 19th and 20th centuries, consistent with both tide gauge and salt marsh information from around the world (Woodworth, 2021). For the UK, Hogarth et al. (2021) found the weighted linear trend when adjusted for GIA to be 1.6±0.2 mm yr−1. There is a significant acceleration of 0.0119 mm yr−2, with a standard error of 0.0033 mm yr−2 in the rate of rise over the period 1813 to 2018. It is not possible to usefully consider accelerations in the limited Cork Harbour data.
Local MSL changes relative to fixed marks are affected by vertical land movement and adjustment of the geoid associated with the growth and decay of terrestrial ice sheets (GIA). For over 20 years, quantitative models of GIA have been developed for Great Britain and Ireland in an iterative process that continues today (Shennan et al., 2018). These models reveal significant spatial variability in sea level change linked to the evolution and demise of the Celtic Ice Sheet (Patton et al., 2017). GIA modelling suggests negative vertical land movement (VLM) at Cork of between around 0.5 and 0.8 mm yr−1 that, when combined with a rate of change in the geoid on the of order 0.5 mm yr−1, produces a predicted rate of relative sea level rise of between 0.08 and 0.32 mm yr−1 (Bradley et al., 2011; Palmer et al., 2018) or a maximum contribution of 6 cm to relative sea level rise over the 1842–2020 period. Considering this GIA effect and our measured 40 cm increase at Passage West with the 27 cm of sea level rise reported for Great Britain over the same period (Hogarth et al., 2021) results in an additional 8 cm of sea level rise that is unaccounted for by combining regional mean sea level and local GIA trends. Other GIA models such as the global model of Peltier and Tushingham (1991) result in an even lower contribution from GIA as would be expected for a model not tuned for the region. This residual is equivalent to an additional 0.8 mm yr−1 of relative sea level rise that could be due to local factors such as land subsidence. However, given the uncertainties associated with the GIA models, further interpretation needs more data and spatial coverage, which will become available when we have processed the full set of 19th-century Airy and Haughton observations from around Ireland.
Irish coastal vulnerability has recently been reassessed within the Irish Coastal Wave and Water Level Modelling Study (ICWWS). Phase 4 of the report investigates the relationship between mean sea level and OD Malin OSGM15 and finds similar results showing that modern mean sea level in the Cork Harbour region sits approximately 10 cm below OD Malin (OPW and RPS, 2020). The report also recommends further tide gauge locations around the coast, including the southern coast, in areas where there is lower confidence in the relationship between mean sea level and OD Malin due to lack of data. This further highlights the importance of direct observational records of sea level to allow estimation of extreme water levels and accurate determination of mean sea level. Our study here shows the long-term perspective of significant MSL rise in the Cork region. In the future, the rise in MSL is predicted to accelerate globally (IPCC, 2021) and will a play larger role in local vulnerability and coastal adaptation (e.g. Palmer et al., 2018).
A goal of this study was to investigate the utility of historical sea level data for identifying MSL and tidal change. Ideally, to identify change and trends we need continuous high-quality data over as long a period as possible. Specifically, in this instance we have only short-duration data (8 weeks in 1842, 6 weeks in 2019), but our advantages were a large time interval (177 years) to the present and the exceptional quality of the 1842 data. An essential ingredient in historical MSL studies is the traceability of the benchmark lineage. In Passage West, where the original mark could not be found, secondary benchmarks allowed the transfer of Airy's levels to ODM. Seasonal adjustments are needed to reconcile short-period measurements to annual estimates. Nodal corrections are essential for tidal amplitudes and phases, and in making them it is vital to consider that locally the full 3.7 % astronomical modulation will usually be attenuated by local dynamics. Failure to do this can introduce errors in amplitude and phase values derived from very short records. MSL values must also be adjusted for meteorological effects, i.e. both atmospheric pressure and winds. After making all the identified corrections and adjustments, there remains a seasonal variability. This is an irreducible minimum confidence level in computed values. The uncertainty is seasonal and lowest in mid-summer, which means the Airy measurements from June to August 1842 are made at the best period of the year.
In this pilot study, the results for Cork Harbour show remarkable tidal stability with a 2.0±0.5 % increase in the amplitude of the M2 component; the phase of the M2 component decreased by from 154.1 to 152.1∘ equivalent to the tide being 4±2 min earlier, which is barely significant statistically. This is evidence of the high quality of the historical data. The potential sources of error have been discussed extensively and we conclude here that, for tides, once consideration has been made for the nodal phase and seasonality, these data are suitable for studies of long-term change. Similarly, our results for MSL rise show a significant rise of 41 cm in the Cork Harbour area since 1842; this is a rate of 2.2±0.2 mm yr−1.
Cork is vulnerable to flooding, and any assessment of trends in the risk factors can now use our data to eliminate tidal changes and quantify MSL rise as contributing factors, as in Tyrrell and Hickey (1991). Another useful scientific application of the results is to contribute information to GIA modelling syntheses for Ireland and thereby the history of ice loading. This GIA application will benefit from a full Irish sea level study, for which this has been a successful pilot.
In summary, this work provides proof of concept for a larger study of Irish sea level, where our multi-agency team will consider all 22 Airy sites, 12 Haughton sites, and, where applicable, IHB and other tidal and MSL information to bridge the gap to the modern National Tide Gauge Network of observations around Ireland. Prospects are encouraging. Initial surveys of some of these sites have unearthed 19th-century benchmarks and so far the original Airy benchmarks for at least two locations, thus reducing benchmark transfer uncertainties. Some sites are being reoccupied for modern short-term observations, while at others there are gauges already. The final goal is to complete a full synthesis of sea level and tidal change around the island of Ireland, coherently addressing the gap of sea level observations on the northwestern corner of the European shelf.
Processing of tide gauge data was performed using a version of TASK (Bell et al., 1996) modified for data from the 19th century. Other code is available upon request from the corresponding authors.
Historical data digitized as part of this study are available at https://doi.org/10.5281/zenodo.5666437 (Pugh and McCarthy, 2021). Data from modern tide gauge stations maintained by the OPW and Marine Institute are available from https://waterlevel.ie/ (OPW, 2021) and http://www.marine.ie/Home/site-area/data-services/real-time-observations/tidal-observations (Marine Institute, 2021).
DP originated the study. DP and GM wrote the manuscript. PW, PH, and RE provided data analysis. EB and GW provided support for fieldwork. All authors commented on and contributed to draft revisions.
The contact author has declared that neither they nor their co-authors have any competing interests.
Publisher's note: Copernicus Publications remains neutral with regard to jurisdictional claims in published maps and institutional affiliations.
Sea level data archaeology is an interesting and scientifically rewarding pursuit, but it is neither simple nor usually direct. It demands inputs of sea level and supporting data from a wide range of sources and institutions, whom we would like to acknowledge here. The GNSS benchmark levelling survey was commissioned by the Marine Institute. The National Tide Gauge Network is maintained by both the Marine Institute and the Office of Public Works. Our findings were also informed by discussions with Ordnance Survey Ireland. Additional information on tidal and datum definitions was accessed at the UK Hydrographic Office, Taunton, and the British Oceanographic Data Centre. The organizations approached and involved invariably offered excellent cooperation and as a result many archives were available and accessible. We would like to thank Eoin O'Mahony for producing the maps. This research was supported by the A4 project (grant aid agreement PBA/CC/18/01) funded by the Irish Marine Institute under the Marine Research Programme financed by the Irish Government.
Supplementary data from Roberts Cove and Cobh are available upon request to the authors. The NOAA-CIRES Twentieth Century Reanalysis Project version 2c used resources of the National Energy Research Scientific Computing Center managed by Lawrence Berkeley National Laboratory, which is supported by the Office of Science of the US Department of Energy under contract no. DE-AC02-05CH11231.
This paper was edited by Anne Marie Tréguier and reviewed by Marta Marcos and one anonymous referee.
Airy, G. B.: On the laws of the tides on the coast of Ireland, as inferred from an extensive series of observations made in connexion with the Ordnance survey of Ireland, Abstr. Pap. Commun. R. Soc. Lond., 5, 539–540, https://doi.org/10.1098/rspl.1843.0033, 1851.
Andrews, J. H.: The Ordnance Survey in Nineteenth-Century Ireland, Four Courts History Classics, Dublin, 1975.
Bell, C., Vassie, J. M., and Woodworth, P. L.: The Tidal Analysis Software Kit (TASK Package), TASK-2000 Version Dated December 1998, Permanent Service for Mean Sea Level, CCMS Proudman Oceanographic Laboratory, Bidston Observatory, Birkenhead, UK, available at: https://www.psmsl.org/train_and_info/software/task2k.php (last access: 10 November 2021), 1996.
Bradley, S. L., Milne, G. A., Shennan, I., and Edwards, R.: An improved glacial isostatic adjustment model for the British Isles, J. Quaternary Sci., 26, 541–552, https://doi.org/10.1002/jqs.1481, 2011.
Cámaro García, W., Dwyer, N., Barrett, F., Berry, A., Cronin, M., Cusack, C., Gallagher, S., Gault, J., Gill, M., Gleeson, E., Hanley, J., Kane, P., Lambkin, K., Lawlor, R., Lydon, K., Lyons, K., Martin, D., McCarthy, G. D., McGovern, E., Murphy, C., Nolan, G., Nugent, C., O'Dwyer, B., Ovadnevaite, J., Quinlan, C., Saunders, M., Silke, J., Smith, G., Thomas, R., Walsh, S., Westbrook, G., Whelan, E., and Wilkes, R.: Climate Status Report for Ireland 2020, 234 pp., Environmental Protection Agency, available at: https://www.epa.ie/publications/research/climate-change/Research_Report_386.pdf last access: 15 July 2021.
Cameron, J.: Abstract of principal lines of spirit levelling in Ireland, Longman, Brown, Green & Longmans, London, 1855.
Carter, R. W. G.: Sea-level changes in Northern Ireland, Proc. Geol. Assoc., 93, 7–23, https://doi.org/10.1016/S0016-7878(82)80029-1, 1982.
Cartwright, D. E.: Tides and waves in the vicinity of Saint Helena, Philos. T. Roy. Soc. Lond. A, 30, 603–646, https://doi.org/10.1098/rsta.1971.0091, 1971.
Cartwright, D. E.: Secular Changes in the Oceanic Tides at Brest, 1711–1936, Geophys. J. R. Astron. Soc., 30, 433–449, https://doi.org/10.1111/j.1365-246X.1972.tb05826.x, 1972.
Cartwright, D. E.: Tidal Prediction and Modern Time Scales, Int. Hydrogr. Rev., LXII, 1, 1985.
Dangendorf, S., Marcos, M., Wöppelmann, G., Conrad, C. P., Frederikse, T., and Riva, R.: Reassessment of 20th century global mean sea level rise, P. Natl. Acad. Sci. USA, 114, 5946–5951, https://doi.org/10.1073/pnas.1616007114, 2017.
de Araújo, I. G. B.: Sea level variability: examples from the Atlantic coast of Europe, University of Southampton, Southampton, 216 pp., 2005.
Dixon, F. E.: Irish Mean Sea Level, Sci. Proc. R. Dublin Soc., 25, 3–8, 1949.
Frederikse, T., Landerer, F., Caron, L., Adhikari, S., Parkes, D., Humphrey, V.W., Dangendorf, S., Hogarth, P., Zanna, L., Cheng, L., and Wu, Y. H.: The causes of sea-level rise since 1900, Nature, 584, 393–397, https://doi.org/10.1038/s41586-020-2591-3, 2020.
Gräwe, U., Burchard, H., Müller, M., and Schuttelaars, H. M.: Seasonal variability in M2 and M4 tidal constituents and its implications for the coastal residual sediment transport, Geophys. Res. Lett., 41, 5563–5570, https://doi.org/10.1002/2014GL060517, 2014.
Greaves, M., Downie, P., and Fitzpatrick, K.: OSGM15 and OSTN15, Geomat. World, 32/33, 1–5, 2016.
Haigh, I. D., Pickering, M. D., Green, J. M., Arbic, B. K., Arns, A., Dangendorf, S., Hill, D. F., Horsburgh, K., Howard, T., Idier, D., and Jay, D. A.: The Tides They Are A-Changin': A Comprehensive Review of Past and Future Nonastronomical Changes in Tides, Their Driving Mechanisms, and Future Implications, Rev. Geophys., 58, e2018RG000636, https://doi.org/10.1029/2018RG000636, 2020.
Hartnett, M. and Nash, S.: An integrated measurement and modeling methodology for estuarine water quality management, Water Sci. Eng., 8, 9–19, https://doi.org/10.1016/j.wse.2014.10.001, 2015.
Haughton, S.: On the solar and lunar diurnal tides of the coasts of Ireland, Dublin Philos. Mag. J. Sci. London Edinburgh, 11, 47–64, https://doi.org/10.1080/14786445608642033, 1856.
Hickey, K.: Deluge: Ireland's weather disasters 2009–2010, Four Courts Press, Dublin, 2010.
Hogarth, P., Pugh, D., Hughes, C. W., and Williams, S. D. P.: Changes in Mean Sea level around the British Isles over the past 200 years, based on data from 1813 to 2018, Prog. Oceanogr., 192, 102521, https://doi.org/10.1016/j.pocean.2021.102521, 2021.
Holgate, S. J., Matthews, A., Woodworth, P. L., Rickards, L. J., Tamisiea, M. E., Bradshaw, E., Foden, P. R., Gordon, K. M., Jevrejeva, S., and Pugh, J.: New data systems and products at the permanent service for mean sea level, J. Coast. Res., 29, 493–504, https://doi.org/10.2112/JCOASTRES-D-12-00175.1, 2013.
Horgan, J. J.: The Port of Cork, Dublin J. Stat. Soc. Inq. Soc. Irel., 19, 42–57, 1955.
Idier, D., Paris, F., Le Cozannet, G., Boulahya, F., and Dumas, F.: Sea-level rise impacts on the tides of the European Shelf, Cont. Shelf Res., 137, 56–71, https://doi.org/10.1016/j.csr.2017.01.007, 2017.
International Hydrographic Bureau: Tides, Harmonic Constants, Special publication no. 26 and addenda, International Hydrographic Bureau, Monaco, 1930.
IPCC: Summary for Policymakers, in: IPCC Special Report on the Ocean and Cryosphere in a Changing Climate, edited by: Pörtner, H.-O., Roberts, D. C., Masson-Delmotte, V., Zhai, P., Tignor, M., Poloczanska, E., Mintenbeck, K., Nicolai, M., Okem, A., Petzold, J., Rama, B., and Weyer, N., Cambridge University Press, Cambridge, 2019.
IPCC: Summary for Policymakers, in: Climate Change 2021: The Physical Science Basis, Contribution of Working Group I to the Sixth Assessment Report of the Intergovernmental Panel on Climate Change, edited by: Masson-Delmotte, V., Zhai, P., Pirani, A., Connors, S. L., Péan, C., Berger, S., Caud, N., Chen, Y., Goldfarb, L., Gomis, M. I., Huang, M., Leitzell, K., Lonnoy, E., Matthews, J. B. R., Maycock, T. K., Waterfield, T., Yelekçi, O., Yu, R., and Zhou, B., Cambridge University Press, Cambridge, 2021.
Jänicke, L., Ebener, A., Dangendorf, S., Arns, A., Schindelegger, M., Niehüser, S., Haigh, I. D., Woodworth, P., and Jensen, J.: Assessment of Tidal Range Changes in the North Sea From 1958 to 2014, J. Geophys. Res.-Oceans, 126, e2020JC016456, https://doi.org/10.1029/2020JC016456, 2021.
Jevrejeva, S., Moore, J. C., Grinsted, A., Matthews, A. P., and Spada, G.: Trends and acceleration in global and regional sea levels since 1807, Global Planet. Change, 113, 11–22, https://doi.org/10.1016/j.gloplacha.2013.12.004, 2014.
Lamb, H.: Hydrodynamics, Cambridge University Press, Cambridge, 738 pp., 1932.
Marine Institute: Tidal Observations, available at: http://www.marine.ie/Home/site-area/data-services/real-time-observations/tidal-observations, last access: 10 November 2021.
Mawdsley, R. J., Haigh, I. D., and Wells, N. C.: Global secular changes in different tidal high water, low water and range levels, Earth's Future, 3, 66–81, https://doi.org/10.1002/2014EF000282, 2015.
Müller, M., Cherniawsky, J. Y., Foreman, G. G., and von Storch, J.-S.: Season variations of the M2 tide, Ocean Dynam., 64, 159–177, 2014.
Murdy, J., Orford, J., and Bell, J.: Maintaining legacy data: Saving Belfast harbour (UK) tide-gauge data (1901–2010), Geo. Res. J., 6, 65–73, https://doi.org/10.1016/j.grj.2015.02.002, 2015.
Nerem, R. S., Beckley, B. D., Fasullo, J. T., Hamlington, B. D., Masters, D., and Mitchum, G. T.: Climate change-driven accelerated sea-level rise detected in the altimeter era, P. Natl. Acad. Sci. USA, 115, 2022–2025, https://doi.org/10.1073/pnas.1717312115, 2018.
Office Of Public Works: Lower Lee (Cork City) Flood Relief Scheme (Drainage Scheme) Supplementary Report Option of Tidal Barrier, available at: https://www.floodinfo.ie/frs/media/filer_public/7b/7b/7b7b7ce5-0f54-4b3b-9235-a26176af8f4e/llfrs_supplementaryreportonoptionoftidalbarrier.pdf (last access: 5 December 2017), 2017a.
Office Of Public Works: Lower Lee (Cork City) Flood Relief Scheme (Drainage Scheme), available at: https://www.floodinfo.ie/frs/media/filer_public/36/0d/360d4b27-660e-4ccd-b4f9-5809164755aa/lowerleefrs_exhibitionreport.pdf (last access: 5 December 2017), 2017b.
OPW: GPRS Stations, avaiable at: https://waterlevel.ie/, last access: 10 November 2021.
OPW and RPS: Irish Coastal Wave and Water Level Modelling Study 2018: Phase 1 –Extreme Water Levels, 52 pp., available at: https://s3-eu-west-1.amazonaws.com/docs.floodinfo.opw/floodinfo_docs/ICWWS-2018/Phase-1/IBE1505_ICWWS_Ph1_Rp01_F02.pdf (last access: 18 January 2021), 2020.
Orford, J. and Murdy, J.: Presence and possible cause of periodicities in 20th-century extreme coastal surge: Belfast Harbour, Northern Ireland, Global Planet. Change, 99, 254–262, https://doi.org/10.1016/j.gloplacha.2015.09.002, 2015.
Palmer, M., Howard, T., Tinker, J., Lowe, J., Bricheno, L., Calvert, D., Edwards, T., Gregory, J., Harris, G., Krijnen, J., and Pickering, M.: UKCP18 Marine Report, 133 pp., available at: https://www.metoffice.gov.uk/pub/data/weather/uk/ukcp18/science-reports/UKCP18-Marine-report.pdf, last access: 3 December 2018.
Patton, H., Hubbard, A., Andreassen, K., Auriac, A., Whitehouse, P. L., Stroeven, A. P., Shackleton, C., Winsborrow, M., Heyman, J., and Hall, A. M.: Deglaciation of the Eurasian ice sheet complex, Quaternary Sci. Rev., 169, 148–172, https://doi.org/10.1016/j.quascirev.2017.05.019, 2017.
Peltier, W. R. and Tushingham, A. M.: Influence of glacial isostatic adjustment on tide gauge measurements of secular sea level change, J. Geophys. Res., 96, 6779, https://doi.org/10.1029/90JB02067, 1991.
Pugh, D. T. and McCarthy, G. D.: Sea Level observations from Passage West, Cork, Ireland in 1842, Zenodo [data set], https://doi.org/10.5281/zenodo.5666437, 2021.
Pugh, D. and Woodworth, P.: Sea-Level Science, 1st Edn., Cambridge University Press, Cambridge, UK, 2014.
Pugh, D. T.: A comparison of recent and historical tides and mean sea-levels off Ireland, Geophys. J. R. Astron. Soc., 71, 809–815, https://doi.org/10.1111/j.1365-246X.1982.tb02799.x, 1982.
Pugh, D. T. and Vassie, J. M.: Seasonal modulations of the principal semidiurnal lunar tide, in: Mixing and Transport in the Environment, 1st Edn., edited by: Beven, K. J., Chatwin, P. C., and Milbank, J. H., Wiley, New Jersey, USA, 247–267, 1992.
Rynne, C.: Connecting Cork, in: Atlas of Cork City, edited by: Crowley, J. S., Devoy, R. J. N., Linehan, D., and O'Flanagan, P., Cork University Press, Cork, Ireland, 2005.
Shennan, I., Bradley, S. L., and Edwards, R.: Relative sea-level changes and crustal movements in Britain and Ireland since the Last Glacial Maximum, Quaternary Sci. Rev., 188, 143–159, https://doi.org/10.1016/j.quascirev.2018.03.031, 2018.
Slivinski, L. C., Compo, G. P., Whitaker, J. S., Sardeshmukh, P. D., Giese, B. S., McColl, C., Allan, R., Yin, X., Vose, R., Titchner, H., and Kennedy, J.: Towards a more reliable historical reanalysis: Improvements for version 3 of the Twentieth Century Reanalysis system, Q. J. Roy. Meteorol. Soc., 115, 2876–2908, https://doi.org/10.1002/qj.3598, 2019.
Talke, S. A., Kemp, A. C., and Woodruff, J.: Relative Sea Level, Tides, and Extreme Water Levels in Boston Harbor From 1825 to 2018, J. Geophys. Res.-Oceans, 123, 3895–3914, https://doi.org/10.1029/2017JC013645, 2018.
Tyrrell, J. G. and Hickey, K.: A Flood Chronology for Cork City and its Climatological Background, Irish Geogr., 24, 81–90, https://doi.org/10.1080/00750779109555764, 1991.
Woodworth, P. L.: A survey of recent changes in the main components of the ocean tide, Cont. Shelf Res., 30, 1680–1691, https://doi.org/10.1016/j.csr.2010.07.002, 2010.
Woodworth, P. L.: A note on the nodal tide in sea level records, J. Coast. Res., 28, 316–323, https://doi.org/10.2112/JCOASTRES-D-11A-00023.1, 2012.
Woodworth, P. L.: Differences between mean tide level and mean sea level, J. Geod., 91, 69–90, 2017.
Woodworth, P. L.: Sea level change in Great Britain between 1859 and the present, Geophys. J. Int., 213, 222–236, https://doi.org/10.1093/gji/ggx538, 2018.
Woodworth, P. L.: Advances in the Observation and Understanding of Changes in Sea Level and Tides, in: Earth's Clim. Weather Domin. Var. Disastrous Extrem. Am. Geophys. Monogr. Ser., Wiley, New Jersey, USA, 2021.
Woodworth, P. L., Shaw, S. M., and Blackman, D. L.: Secular trends in mean tidal range around the British Isles and along the adjacent European coastline, Geophys. J. Int., 104, 593–609, https://doi.org/10.1111/j.1365-246X.1991.tb05704.x, 1991.
Woodworth, P. L., Tsimplis, M. N., Flather, R. A., and Shennan, I.: A review of the trends observed in British Isles mean sea level data measured by tide gauges, Geophys. J. Int., 136, 651–670, https://doi.org/10.1046/j.1365-246X.1999.00751.x, 1999.