the Creative Commons Attribution 4.0 License.
the Creative Commons Attribution 4.0 License.
 | 21 Jul 2020
Current estimates of K1* and K2* appear inconsistent with measured CO2 system parameters in cold oceanic regions
Olivier Sulpis
Siv K. Lauvset
Mathilde Hagens
Seawater absorption of anthropogenic atmospheric carbon dioxide (CO2) has led to a range of changes in carbonate chemistry, collectively referred to as ocean acidification. Stoichiometric dissociation constants used to convert measured carbonate system variables (pH, pCO2, dissolved inorganic carbon, total alkalinity) into globally comparable parameters are crucial for accurately quantifying these changes. The temperature and salinity coefficients of these constants have generally been experimentally derived under controlled laboratory conditions. Here, we use field measurements of carbonate system variables taken from the Global Ocean Data Analysis Project version 2 and the Surface Ocean CO2 Atlas data products to evaluate the temperature dependence of the carbonic acid stoichiometric dissociation constants. By applying a novel iterative procedure to a large dataset of 948 surface-water, quality-controlled samples where four carbonate system variables were independently measured, we show that the set of equations published by Lueker et al. (2000), currently preferred by the ocean acidification community, overestimates the stoichiometric dissociation constants at temperatures below about 8 ∘C. We apply these newly derived temperature coefficients to high-latitude Argo float and cruise data to quantify the effects on surface-water pCO2 and calcite saturation states. These findings highlight the critical implications of uncertainty in stoichiometric dissociation constants for future projections of ocean acidification in polar regions and the need to improve knowledge of what causes the CO2 system inconsistencies in cold waters.
- Article
(5435 KB) - Full-text XML
-
Supplement
(783 KB) - BibTeX
- EndNote


In the last decades, oceans have absorbed over a quarter of the anthropogenic carbon dioxide (CO2) emitted to the atmosphere (Le Quéré et al., 2018; Gruber et al., 2019). Upon dissolution in seawater, this CO2 triggers a suite of reactions that lead to a range of chemical changes jointly termed ocean acidification (Zeebe and Wolf-Gladrow, 2001; Gattuso and Hansson, 2011). To accurately calculate the magnitude of these changes, it is crucial to understand the chemical behaviour of CO2 in seawater.
Upon dissolution, CO2 takes the form of solvated CO2 (, CO2•H2O) or carbonic acid (H2CO3), which are here both represented by , since they can only be readily distinguished by infra-red spectrometry (Zeebe and Wolf-Gladrow, 2001), and the following series of reactions occurs:
Together, these three reactions and their species constitute the marine CO2−H2O system, which is responsible for about 95 % of the acid–base buffering capacity of seawater and maintains the pH of the ocean within a narrow range (Bates, 2019; Zeebe and Wolf-Gladrow, 2001).
Each of these reversible reactions is associated with a thermodynamic equilibrium constant, a number that expresses the relationship between the activities of products and reactants present at equilibrium at a given temperature and pressure. Reactions (R2) and (R3) describe the first and second step in the dissociation of carbonic acid. Their equilibrium constants are therefore termed the first and second dissociation constants, K1 and K2, respectively. To avoid the use of activity coefficients, which are not straightforward to derive in seawater, marine scientists have developed a set of stoichiometric (or apparent) equilibrium constants to represent the state of the system at a given pressure (P), temperature (T), and salinity (S). To describe the carbonate system, two stoichiometric constants ( and , conventionally denoted by a star) are defined in terms of the concentrations of the different species:
Using these stoichiometric equilibrium constants, we can calculate the relative quantities of the dissolved inorganic carbon () species. With improved analytical techniques, measurement accuracy of carbonate system variables has substantially increased over the past decades. As a result, uncertainty in carbonate system calculations is currently dominated by the uncertainty of and values (Orr et al., 2018), justifying the need to investigate whether these uncertainties can be reduced.
Using popular software for carbonate system calculations, e.g. CO2SYS (Lewis and Wallace, 1998; Pierrot et al., 2006; van Heuven et al., 2011) or seacarb (Gattuso et al., 2019), and recently published literature as references, roughly 15 different expressions for and are currently in use, some of which are (partly) based on refitting data from earlier experiments (e.g. Dickson and Millero, 1987; Lueker et al., 2000); see Table S1 in the Supplement for an overview. Some expressions are based on measurements in artificial seawater of various compositions, while others were carried out in natural seawater. The vast majority of expressions were obtained in the laboratory under controlled conditions, using electrochemical cells either with (e.g. Millero et al., 2006; Millero, 2010) or without (e.g. Roy et al., 1993; Tishchenko et al., 2013) liquid junction. Within these cells, electromotive force readings of equilibrated seawater are used to compute equilibrium constants. Each expression is valid over its own range of T and S.
The various expressions for and obtained this way generally agree well, but discrepancies at low salinities have been highlighted (Cai and Wang, 1998; Millero, 2010; Dinauer and Mucci, 2017; Orr et al., 2018). In addition, the temperature range covered by various and expressions, although generally broad, only extends below 0 ∘C in a few studies (Millero et al., 2002; Goyet and Poisson, 1989; Papadimitriou et al., 2018). In fact, Mehrbach et al. (1973), who provided experimental data used by several authors to derive expressions for and (e.g. Dickson and Millero, 1987; Lueker et al., 2000), used data obtained at only four different temperatures (2, 13, 25, and 35 ∘C), which brings into question the accuracy of the temperature dependency of these constants. Bailey et al. (2018) recently suggested that the same bias exists for the dissolution of CO2 in seawater and showed that previous expressions of Henry's Law constant for CO2 underestimate the CO2 solubility below 0 ∘C due to a lack of samples in cold waters. As explained by Raimondi et al. (2019), because the only carbonate system variables currently measured by in situ sensor technologies are pH and the partial pressure of CO2 in seawater (pCO2), relating laboratory or on-board measurements that are usually performed at temperatures ∼25 ∘C to these in situ measurements requires an accurate knowledge of the and temperature dependency. About 40 % of the ocean volume is at an average temperature lower than 2 ∘C, outside of the temperature range for which the Mehrbach et al. (1973) and derived constants are valid (from the data of Lauvset et al., 2016). An example of this are high-latitude cold waters, which are a critical component of the current global oceanic carbon cycle, as the Southern Ocean surface waters account for ∼40 % of the annual anthropogenic CO2 uptake by the ocean (Landschützer et al., 2015). Given past difficulties to obtain direct pCO2 measurements from ships in the Southern Ocean (Bakker et al., 2016), a number of autonomous floats have been deployed in recent years (see, e.g., Williams et al., 2017; Takeshita et al., 2018). Since these floats estimate pCO2 from a pH measurement and a calculated total alkalinity (TA), our knowledge of surface pCO2 in the Southern Ocean strongly relies on the accuracy of dissociation constants in these cold waters.
Best practices for oceanic carbonate system measurements generally recommend the Lueker et al. (2000) constants (Dickson et al., 2007), but the choice for a set of constants may depend on the environment and/or measured carbonate system variables. Only two of the measurable variables are required to characterize the whole carbonate system, except under conditions where substantial impact of dissolved organic carbon on TA is expected (i.e. significant organic alkalinity). Overdetermination of the carbonate system, i.e. the concomitant measurement of at least three of the carbonate system variables (1) pCO2, (2) DIC, (3) TA, and (4) pH, is often used as a tool to identify the best pair of input variables for carbonate system calculations under specific environmental conditions, e.g. in sea-ice brines (Brown et al., 2014) or in systems with substantial organic alkalinity (Koeve and Oschlies, 2012). We refer the reader to Raimondi et al. (2019) for an overview of internal consistency studies, i.e. the agreement between measured and calculated variables. Disagreement between measured and computed values may arise from uncertainties in measurements and, more importantly, equilibrium constants (Orr et al., 2018) but can also result from the choice of relationship between total boron and salinity, as well as organic alkalinity (Fong and Dickson, 2019).
Field measurements are rarely used to derive stoichiometric equilibrium constants because of their interdependence. For example, ship-based measurements of pH are normally conducted at fixed temperature (commonly 25 ∘C) and converted to in situ temperature using a second input parameter as well as a set of stoichiometric equilibrium constants (Hunter, 1998). Similarly, using measured TA to calculate the contribution of the carbonate system to total alkalinity (carbonate alkalinity, CA) requires that the proton concentration and thus pH be known (Dickson et al., 2007). To the best of our knowledge, only two studies have so far used overdeterminations of the carbonate system to derive expressions for and (Millero et al., 2002; Papadimitriou et al., 2018). Both studies used concurrent measurements of pCO2, TA, DIC, and pH over a range of temperatures and salinities to calculate and . Millero et al. (2002) used over 6000 sets of pressure-corrected field measurements. They argued that determinations of stoichiometric dissociation constants measured in natural seawater are preferable over those determined in artificial seawater and concluded that the value of depends on pCO2, possibly linked to organic alkalinity, which is not accounted for in carbonate system calculations. Papadimitriou et al. (2018), who focussed especially on highly saline brines down to their freezing points, used the same methods as Millero et al. (2002) for their calculations. However, instead of using field measurements, they overdetermined their system under controlled laboratory temperatures and salinities, thus avoiding temperature corrections of the pH measurements. Their work, like Orr et al. (2018), confirmed the high uncertainties associated with extrapolating expressions for and beyond the investigated salinity and temperature ranges.
In the present study, we use the Global Ocean Data Analysis Project version 2 (GLODAPv2; Key et al., 2015; Olsen et al., 2016) and the Surface Ocean CO2 Atlas (SOCAT; Bakker et al., 2016) global data products to constrain stoichiometric equilibrium constants based on surface-water field measurements. Using an iterative procedure that takes into account the lack of independence of CA and pH, we quantify the temperature dependence of the stoichiometric equilibrium constants. We then use these constants to recommend input pairs for pCO2 and CaCO3 saturation state determinations over various temperature ranges and apply them onto a high-latitude dataset.
2.1 Expressions for and as a function of carbonate system variables
Aside from recent advances that allow spectrophotometric determinations of concentrations (Byrne and Yao, 2008; Easley et al., 2013; Sharp and Byrne, 2019), the concentrations of , , and are normally not directly measured in seawater. Instead, at least two of the four parameters pCO2, pH, DIC, and TA are measured and the concentrations of the individual species inferred from them. In practical terms, TA is the sum of all bases that are titratable with a strong acid to an equivalence point corresponding to the conversion of to . Here it is defined as
with and where BA is the borate alkalinity (), PA is the phosphate alkalinity (), SiA is the silicate alkalinity (), [OH−] is the hydroxide ion concentration, and [H+] is the hydrogen ion concentration. Equation (3) approximates the definition of TA provided by Dickson (1981) but does not take into account the hydrogen sulfide and ammonia acid–base systems. The terms BA, PA, and SiA can all be expressed in terms of stoichiometric equilibrium constants, total concentrations, and [H+]. Hence, knowing TA, the total concentrations of dissolved silicate ([DSi]), soluble reactive phosphate ([SRP]), and boron, as well as [OH−] and [H+], CA can be calculated.
To estimate and as a function of salinity and temperature based solely on independent measurements, we first need to define expressions that define both constants as functions of CA, DIC, pCO2, and [H+]. Both and are normally defined in terms of proton concentration, [H+], and the acid–base species they describe; see Eqs. (1) and (2). In this work, we replace , , and by expressions that only contain the four variables present in the dataset and Henry's constant, K0, taken from Weiss (1974). This leads to the following set of equations, which are equivalent to those presented in Millero et al. (2002) and Papadimitriou et al. (2018):
Note that similar expressions can also be derived when only three independently measured variables are available in the dataset. In this case, either or remains in the expression, in addition to any three variables of the set CA, DIC, pCO2, and [H+]. Derivations of all these expressions can be found in the Supplement.
2.2 Data
Data for T, P, practical salinity (SP), DIC, TA, pH, [SRP], and [DSi] were taken from GLODAPv2 (Key et al., 2015; Olsen et al., 2016). Only data associated with a WOCE (World Ocean Circulation Experiment) flag of 2 were retained for this analysis. WOCE flags are associated with each GLODAPv2 variable during quality control. Data associated with a flag of 2 were assessed as “acceptable” by quality controllers of the original dataset. Recalculated or estimated variables and samples with missing T or SP were always discarded. In total, we obtained 98326 samples for which TA, DIC, and pH are available from independent, high-quality measurements.
pCO2 values were obtained from SOCAT version 3 (Bakker et al., 2016). Only data associated with a WOCE flag of 2 are used. When available, a pCO2 value was selected and added to corresponding surface GLODAPv2 samples. To select the most accurate pCO2 value, we only merged GLODAPv2 and SOCAT samples from the same cruise and taken within the same hour; in most cases within the same 20 min. As a result, we assembled 1024 samples for which TA, DIC, pH, and pCO2 are all available from independent high-quality measurements. As underway pCO2 measurements available in the SOCAT database are all from the surface ocean, it was not possible to assign measured pCO2 values to samples at depth. Note that we discarded data from two cruises (EXPOCODES 33AT20120419 and 49NZ20010828) for reasons explained in the Supplement, ultimately using data from 948 samples for this analysis. Samples within this dataset were taken between 1993 and 2012 over 26 different research cruises. These samples were taken at the ocean surface, always in the top 5 m. They cover a range of practical salinities from 30.73 to 37.57 and temperatures from −1.67 to 31.80 ∘C at locations shown in Fig. 1.
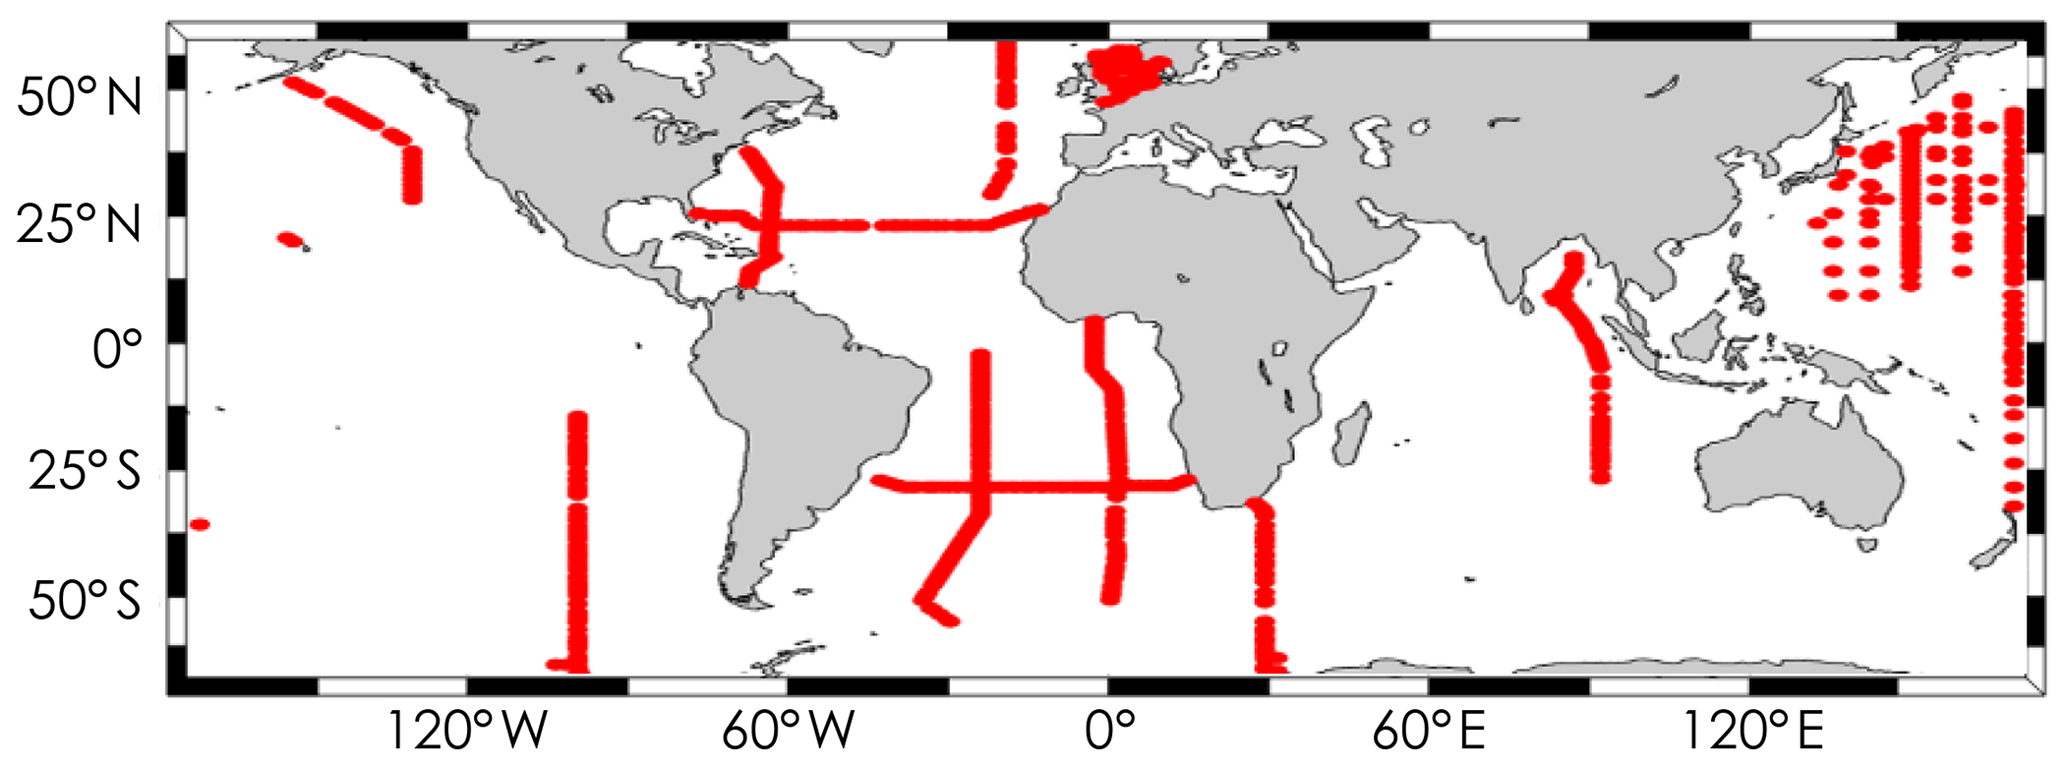
Figure 1Spatial coverage of the dataset containing GLODAPv2 and SOCAT samples for which DIC, TA, pH, and pCO2 are available from independent, high-quality measurements.
2.3 Iterative methods and underlying assumptions
To the 948 samples for which independent, high-quality measurements of pH, DIC, TA, [DSi], [SRP], and pCO2 are available, we would preferably directly apply Eqs. (4) and (5). This was, however, not possible given the interdependence of pH and CA, both of which are necessary to compute and and, in turn, other carbonate system parameters. Rather than estimating the temperature dependence of pH from ΔpH∕ΔT as done by Millero et al. (2002), we used a novel iterative fitting procedure. This procedure is based on an initial estimate of both pH and CA using the Lueker et al. (2000) constants, followed by a recomputation at each iteration using the values of and from the previous iteration. The calculations were executed in R (R Core Team, 2019) and detailed below. The code and data files can be downloaded from an online repository (https://doi.org/10.5281/zenodo.3725889, Sulpis et al., 2020).
Since the objective of the present study is to obtain independent measurements of and , we could not directly use GLODAPv2 in situ pH data because the majority of these data were obtained on board by potentiometric or spectrophotometric methods at an equilibrium temperature often higher than the surface seawater (usually 25 ∘C, occasionally 20 or 13 ∘C). In addition, pH data were not always delivered to GLODAPv2 on the total pH scale. Consequently, the in situ pH measurements available in GLODAPv2 are all recalculated using measured TA and the Lueker et al. (2000) stoichiometric dissociation constants and converted to the total pH scale if necessary (Olsen et al., 2016). To obtain the pH values delivered to GLODAPv2, which should be independent of and , we converted the GLODAPv2 pH values back to their measurement temperatures (labT) and pH scales, as recorded in the cruise reports. For this reconversion, we used the bias-corrected TA value from GLODAPv2 rather than the measured TA values that were used in the GLODAPv2 conversion process. Bias correction of TA was done through crossover and inversion analysis of the data (Olsen et al., 2016); for the 26 research cruises we selected, bias correction resulted in TA adjustments of −1 to 10 µmol kg−1. These adjustments however affected the recalculated pH values by less than 0.0001. We then converted all recalculated pH values to the free pH scale (pH) using the default settings of the pHconv function in the seacarb R package (Gattuso et al., 2019). The free pH scale was used during the fitting procedure to avoid further complications with the sulfate and fluoride acid–base systems. Nevertheless, final results are presented on the total pH scale.
Carbonate alkalinity was not directly measured but is instead a pH-dependent quantity computed from TA; see Eq. (3). As a first approximation, we calculated CA from the measured TA by subtracting the contributions of the borate, silicate, and phosphate acid–base systems, as well as the auto-dissociation of water, using [SRP], [DSi], and the in situ pH from GLODAPv2. We estimated the total boron concentration from salinity using the Uppström (1974) relationship and calculated its acid–base speciation using the equilibrium constants of Dickson (1990). For the silicate and phosphate acid–base speciation, the equilibrium constants of Yao and Millero (1995) were used. All of these expressions are only valid for temperatures above 0 ∘C; thus, extrapolation to lower temperatures yields an additional uncertainty to the method. All equilibrium constants were corrected for pressure following Millero (1995), but given that all samples were taken at depth shallower than 5 m depth, this correction is negligible. Using , the proton concentration computed from pH, we also calculated carbonate alkalinity at the temperature of pH measurements (CAlabT). This variable was used during the iteration procedure.
Since there are two pH-independent parameters (DIC, pCO2), we can use these two parameters and one pH-dependent parameter (either pH itself, or CA) to initialize the iterative procedure. This implies that either or must be assigned an initial value before starting the iterations. Here, we initially set the in situ to the value calculated from the Lueker et al. (2000) expressions. The alternative case in which in situ was initially set to the Lueker et al. (2000) value is described in the Supplement and would have no appreciable impact on the results presented here; i.e. whether the first or the second dissociation constant is assigned an initial value does not affect the results. Each iteration consisted of four different steps:
- 1.
First, was computed from in situ DIC, CA, pCO2, and from Lueker et al. (2000) using Eq. (4) and a Newton–Raphson technique (function uniroot.all from package rootSolve; Soetaert and Herman, 2009). These calculated values were subsequently fitted to a general expression as a function of temperature and salinity of the form:
where corresponds to −log 10(Ki) and ai are fitting coefficients determined using the Levenberg–Marquardt algorithm for non-linear least-squares estimates (function nlsLM from the minpack.lm package; Elzhov et al., 2016). This expression is of a similar form as Lueker et al. (2000), to facilitate the comparison. Because the salinity range in the sub-dataset where four carbonate system variables are available is narrow (30.73 to 37.57), it was not possible to obtain converging iterations where all the coefficients in Eq. (6) were resolved. Thus, we kept a2 and a3 fixed to the Lueker et al. (2000) values, assuming that the salinity dependence of and is correct for the salinity range of our dataset, and only solved for a1, a4, and a5.
- 2.
Second, this new expression for , as well as CA and the expression for used in step 1, were used to compute pH at in situ temperature. For this, both and were calculated at the temperature of pH measurement ( and ). These were used together with the free proton concentration at lab temperature () and the calculated carbonate alkalinity (CAlabT), both of which do not change during the iterative procedure, to calculate [H+], the free proton concentration at in situ temperature. We expressed DIC as a function of CA, [H+], and , and assumed that the value of DIC is independent of temperature. Thus,
This equation was rewritten into a quadratic equation, solved analytically for [H+], and converted to pH.
- 3.
Third, CA – which is dependent on pH – was updated based on the new [H+], as per Eq. (3) and the method outlined for the initial calculation of CA.
- 4.
Fourth, we used Eq. (5) to calculate as a function of pCO2, DIC, the new pH, and CA and fit these in situ computed constants to an equation of the form of Eq. (6).
These four steps were repeated, and at each iteration, , CA, and pH from the previous iteration, were used as initial values. Note that this method assumes that the uncertainty in K0 is minor compared to that in and . We also assumed that no acid–base systems other than the carbonate, borate, silicate, and phosphate acid–base systems contributed to TA – this point will be elucidated later – and that uncertainties in the calculated contributions of the latter three acid–base systems to TA were also minor compared to the uncertainties in and .
2.4 Uncertainty propagation
The overall uncertainty on the final and values is a combination of the uncertainties associated with measurement errors (hereafter termed “analytical uncertainty”) and the uncertainties resulting from the fitting procedures (hereafter termed “fitting uncertainty”) that are propagated throughout the iterations. The analytical uncertainty (σKana.) was computed using the predefined accuracy limits (here, for simplicity, denoted σ) used for the GLODAPv2 secondary quality control procedures. This accuracy limit reflects the minimum bias that can be detected with reasonable certainty (Tanhua et al., 2010) and is based on an objective analysis of systematic biases in ship-based data. Within the GLODAP context the accuracy limit should be interpreted as “the range within which we can realistically expect measurements from the deep ocean to be reproducible”. For each variable the corresponding value is taken from Table 2 in Olsen et al. (2016); i.e. σSP=0.005, σ[DSi]=2 %, σ[SRP]=2 %, σDIC=4 µmol kg−1, σTA=6 µmol kg−1. σpH is set to 0.01 following Table 3 in Olsen et al. (2019) and σpCO2 is set to 2 µ atm, corresponding to the minimum accuracy of SOCAT quality control flags A or B. While referred to as accuracy, this number is actually a measure of overall measurement uncertainty and includes uncertainties due to environmental factors (Pierrot et al., 2009). σCA was computed as the square root of the sum of the squares of and . In turn, these were computed using TA, pH, [SRP], [DSi], P, T, and SP as input variables, as well as their respective aforementioned uncertainties, using the error propagation code of Orr et al. (2018). The analytical uncertainty on both and was then estimated following the standard rules of error propagation, as per the following equations:
The fitting uncertainty (σKfit.) was obtained using a Monte Carlo simulation technique that propagates errors in the fitting coefficients to the predicted K values. At the end of the iterations, the non-linear least-square model fits obtained with the nlsLM function were used as an input in the predictNLS function, from the propagate R package (Spiess, 2018), to calculate σKfit., neglecting any error in the temperature measurements. The overall uncertainty on and was then assumed to be the square root of the sum of the squares of the analytical and fitting uncertainties. The 95 % confidence intervals for each of the fitting coefficients, i.e. ai in Eq. (6), shown in Table 1, were extracted from the result of the non-linear least-squares model fits in R using the summary function. Note that, because we did not solve for the salinity coefficients in Eq. (6) due to the limited salinity range of the four carbonate system variable datasets, a2 and a3 are set to the Lueker et al. (2000) values and no confidence interval is computed for these coefficients.
Table 1Comparison of the coefficients for and between this study and Lueker et al. (2000), using an equation of the form of Eq. (6). Coefficients are given as value ±95 % confidence interval. In bold are the coefficients (a1, a4 and a5) that were solved for, while the two salinity coefficients (a2 and a3) were fixed to the Lueker et al. (2000) values.
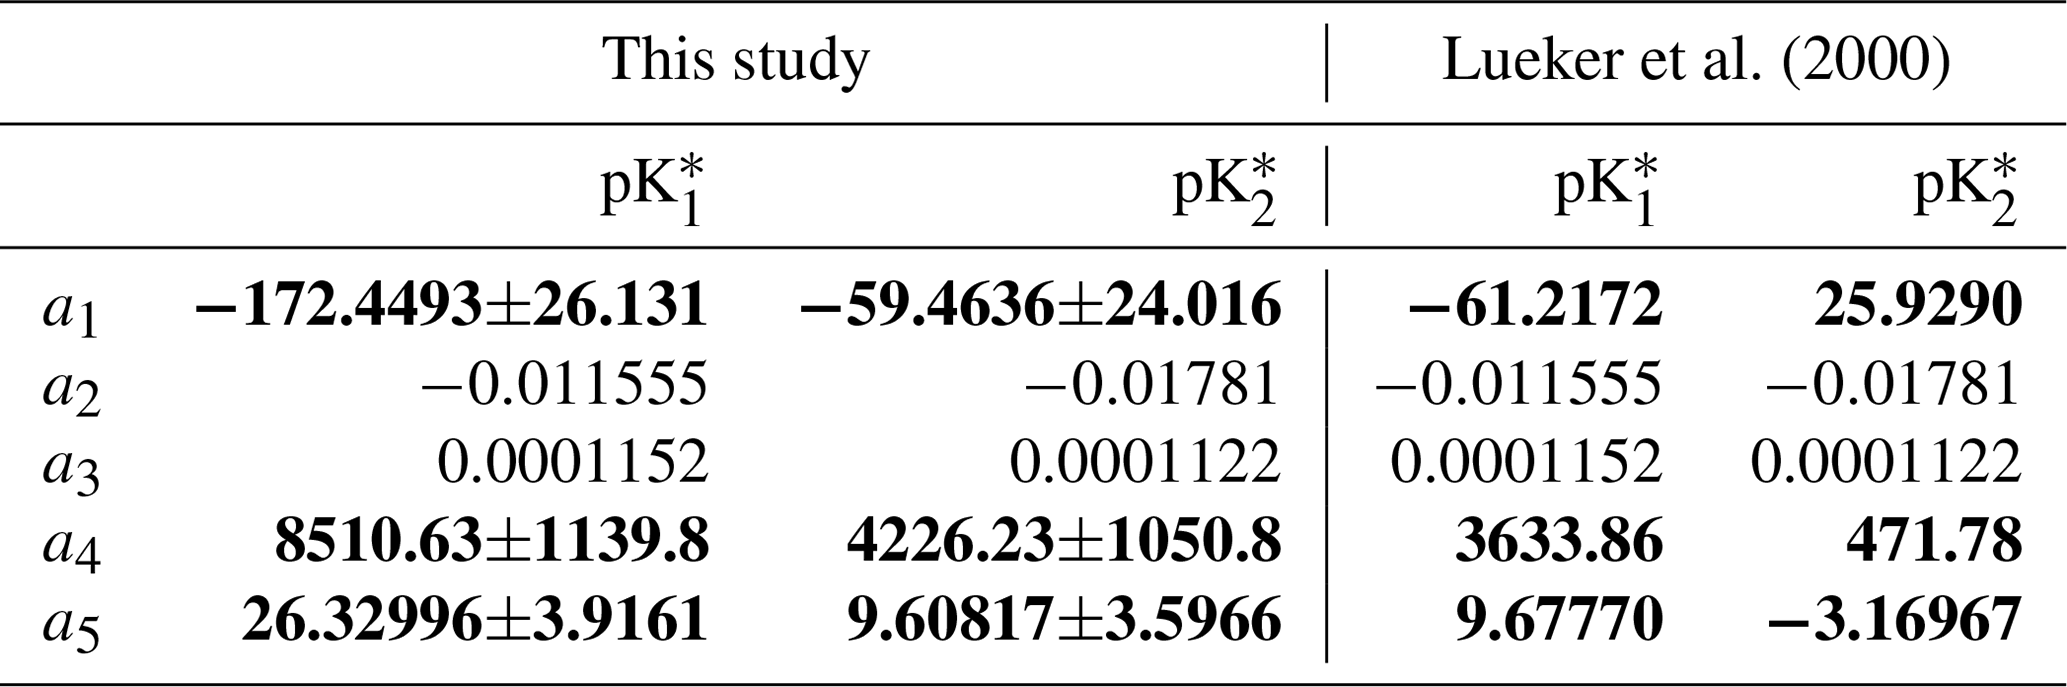
Using all the data from which T, SP, DIC, pH, CA, and pCO2 are available as high-quality, independent measurements, we were able to derive expressions for and with a new temperature dependence. The coefficients ai for and , in an equation of the form of Eq. (6), and after 30 iterations, are reported in Table 1, along with their respective 95 % confidence intervals. In both expressions, all coefficients are significantly different from zero (p values <0.001). As CA and pH are being updated throughout the iterations, CA, pH, , and all evolved until the 10th iteration, before converging to a final value (Fig. 2). Thus, we stopped the iterative process after 30 iterations. Between the initial GLODAPv2 value and the 30th iteration, [H+] values vary by up to 6.6 %. CA values are only weakly affected by these in situ pH updates as they change by a maximum of 0.2 % throughout the first 30 iterations. Largest pH and CA changes occur at the colder end of the temperature range. and values both shift upward throughout the iterations, the increase being higher than that of , especially in cold waters (Fig. 2).
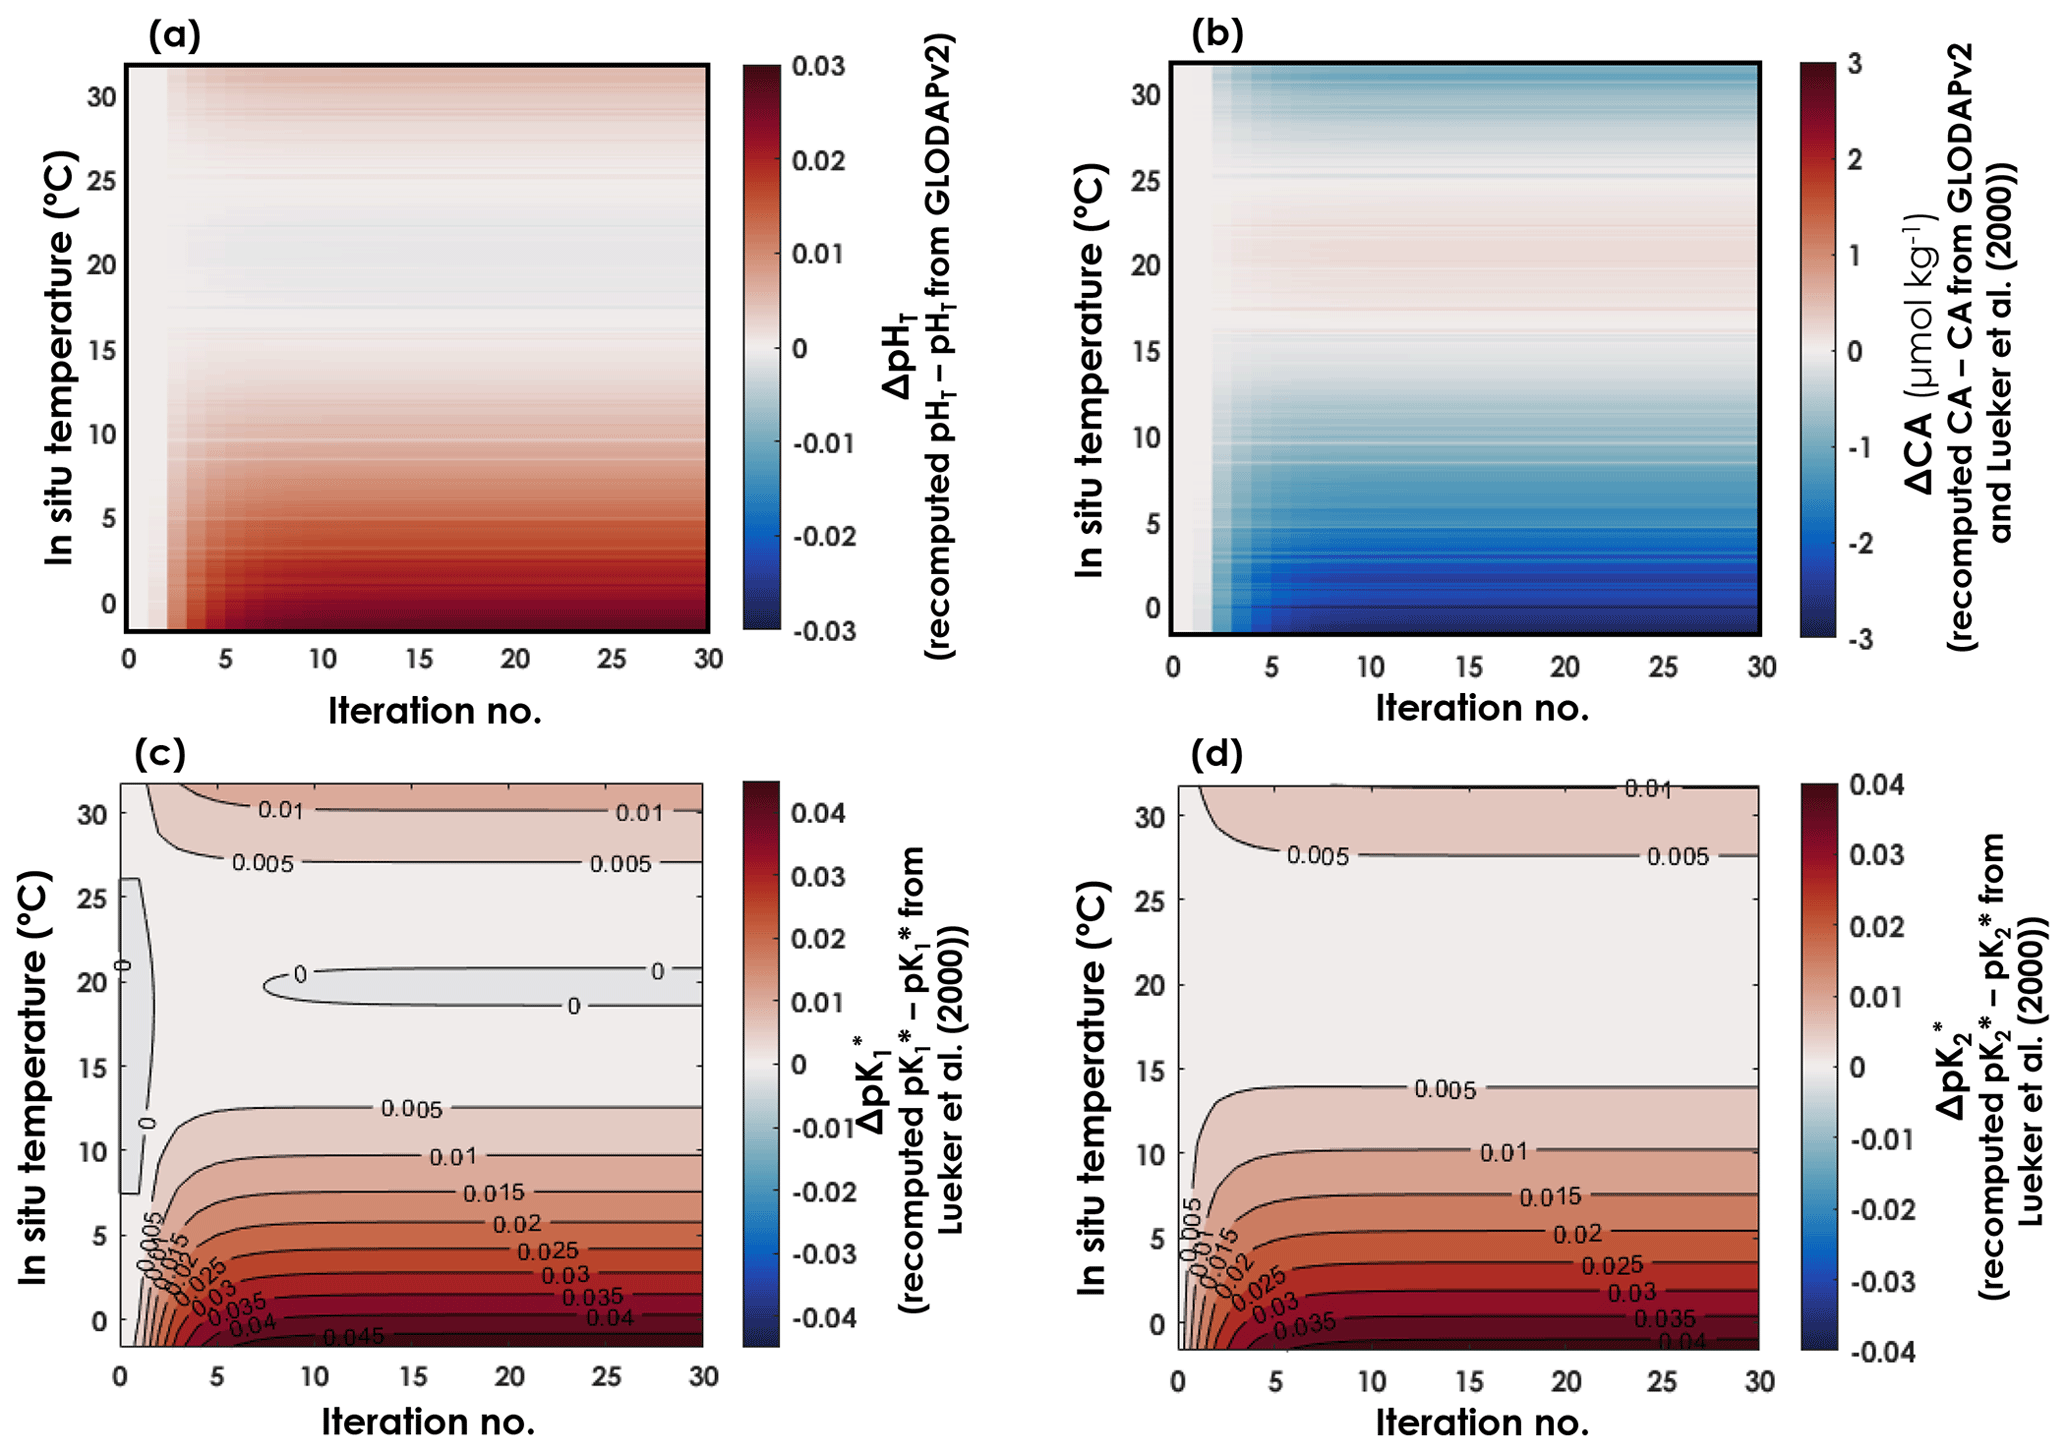
Figure 2Evolution of pHT, CA, , and as a function of in situ temperature and iterations. (a) Differences between recomputed pHT and pHT from GLODAPv2. (b) Differences between recomputed CA and CA estimated from GLODAPv2 data and the Lueker et al. (2000) constants. Differences between recomputed (c) and (d) and the Lueker et al. (2000) values at in situ temperature and at a practical salinity of 35.
As shown in Fig. 3, the pK* values obtained with the iterative procedure are statistically indistinguishable from the pK* values of Lueker et al. (2000) (i.e. ) over most of the temperature range. Nevertheless, in cold waters, below temperatures 8.1 and 9.2 ∘C respectively, and are significantly higher than the values reported by Lueker et al. (2000). In Fig. 3, we also provide a comparison of the pK* values of this study with those of Papadimitriou et al. (2018), as the latter study focuses on low-temperature waters. As shown in Fig. 3c and d, both and from Papadimitriou et al. (2018) are slightly lower than the fitted values from this study, for a similar salinity, and are also lower than the Lueker et al. (2000) pK* values except for temperatures below 4.0 and 1.2 ∘C, respectively. Thus, the fact that the Lueker et al. (2000) study underestimates both and in waters near freezing point seems to be a consistent feature across studies.

Figure 3(a) and (b) as a function of temperature where the colour represents practical salinity (SP) and the fits are fixed for a SP of 35. Comparison of (c) and (d) as a function of temperature from this study (red lines), Lueker et al. (2000, blue line) and Papadimitriou et al. (2018, black line). The solid blue line represents the pK* fits from Lueker et al. (2000), the solid red line the pK* from this study computed with the coefficients presented in Table 1. Dashed red lines are overall uncertainties as defined in Sect. 2.4.
Using underestimated and values implies that, for a given state, computed or pCO2 would be underestimated and overestimated. This potentially has strong implications for our representation of seawater carbonate chemistry in low-temperature marine environments, such as polar regions. Hence, we highlight the implications of this work for the estimation of two carbonate system variables in polar regions, i.e. pCO2 and the saturation state of seawater with respect to calcite (ΩCa). But, first, we examine error propagation and the dependence of and to salinity and discuss the influence of organic alkalinity and the quality of pH measurements on the results presented here.
4.1 Influence of pH and TA measurement quality
The pH of samples that are used to derive the K* fits presented here was measured using electrodes or spectrophotometrically, between 1993 and 2012. During this period, it was shown that impurities present in commercially available dyes could generate a systematic bias in the measured pH (Yao et al., 2007). Recently, Carter et al. (2018) pointed to systematic discrepancies resulting from differing approaches to pH measurements. Yao et al. (2007) noted that these impurities can contribute to pH offsets as large as 0.01 pH units, which corresponds to the analytical uncertainty in pH (σpH) that we use here, taken from Olsen et al. (2019). We must therefore investigate whether the fact that most pH measurements in the pH dataset are not from spectrophotometric measurements with purified dyes could alter the conclusion of underestimated pK* values in cold waters. To answer this question, we gathered a sub-dataset of the more recent GLODAPv2.2019 data product (Olsen et al., 2019), composed of samples from nine different cruises (EXPOCODES 320620140320, 06AQ20150817, 33AT20120324, 33AT20120419, 33HQ20150809, 33RO20150410, 33RO20150525, 33RO20161119, and 33RR20160208) for which T, P, SP, DIC, TA, [SRP], and [DSi] are available and associated with a WOCE flag of 2, for which pH was measured spectrophotometrically using purified dyes only, and for which an associated SOCAT pCO2 value is available. Although this independent dataset is too small to apply the iterative procedure and obtain acceptable pK* fits, we can use it to compare the values obtained with Eqs. (4) and (5) and this purified-dye independent dataset to the values obtained with Eqs. (4) and (5) and the regular dataset.
For both the purified-dye independent dataset and the regular dataset, samples were sorted according to in situ temperature and grouped into bins of 0.5 ∘C. Temperature bins containing a single sample were not used. For each temperature bin, the mean pK* values, obtained with Eqs. (4) and (5), along with the associated uncertainties, were computed. Plotting the difference between the pK* values computed using the regular dataset and those computed using the purified-dye independent dataset as a function of seawater in situ temperature (Fig. 4), we do not see any clear systematic bias caused by the use of purified dyes. This means that pK* values computed from a dataset with purified-dye pH measurements only are not higher or lower than pK* values computed from a dataset with pH measured using primarily impure dye. More importantly, in colder waters ( ∘C), the differences between the pK* values from this study and those from Lueker et al. (2000) (black line in Fig. 4) are larger than what can be explained by the choice of dye for spectrophotometric pH measurements. Thus, the use of impure vs. purified dye in pH measurements should not affect the conclusions presented here.
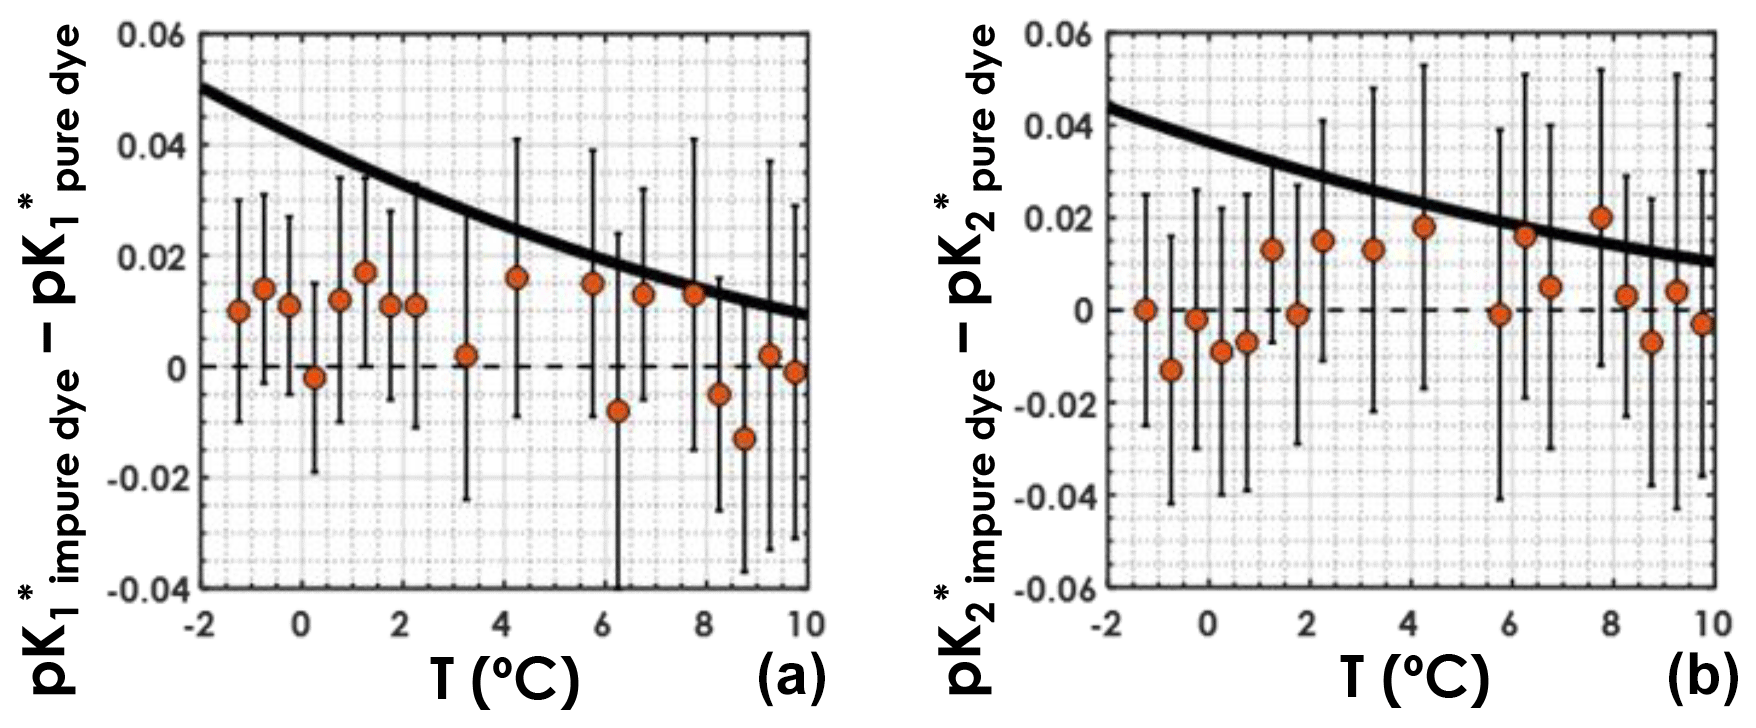
Figure 4(a) and (b) differences between those obtained with the regular dataset and those obtained with the purified-dye independent dataset, as a function of in situ seawater temperature. Orange circles represent the mean computed pK* values within a temperature bin, and the vertical black bars stand for the associated uncertainties deviations. The solid black line is the difference between the pK* fit from this study and that from Lueker et al. (2000).
Another issue in GLODAPv2 carbonate system measurements may be the fact that some seawater samples contain measurable amounts of organic bases (Fong and Dickson, 2019; Patsavas et al., 2015; Yang et al., 2015). This organic alkalinity is unaccounted for in the definition of total alkalinity of Eq. (3), thus causing biased, overestimated, computed carbonate alkalinity values. This does not only concern coastal waters but also open-ocean waters, where the total concentration of these organic bases could be in the order of a few micromols per kilogram (Fong and Dickson, 2019). This, however, should not substantially alter the results presented here, due to the small amount of these organic bases and consequently small impact on computed pK* values. If anything, subtracting the contributions of these unaccounted bases to the total alkalinity measurements would have a unidirectional effect on the dissociation constant estimates, shifting the pK* values upwards – see Eqs. (4) and (5) – further away from the Lueker et al. (2000) values in cold waters.
4.2 Uncertainties in carbonate system calculations
The relative overall uncertainties () were ∼2.5 % for both and . In both cases, the analytical uncertainty (σKana.) was more than twice as high as the fitting uncertainty (σKfit). The overall pH measurement uncertainty of the GLODAP dataset (σpH =0.01) is relatively high, causing the pH term in Eqs. (8) and (9) to be the dominant factor in σKana.. Thus, what dominates the overall uncertainties for K* estimates from this study is the uncertainty in pH, which explains the fact that the relative uncertainties of and are similar. Converting from σK* to σpK*, we find =0.011. The overall uncertainty for is higher than that reported by Orr et al. (2018), but the overall uncertainty for is smaller. These values are quite high relative to the uncertainties of previous expressions for and as reported in Table 2 of Millero (2007), which we attribute to the fact that they reflect both the uncertainty from the fits and from the measurements that we use.
Using the pK* values from Table 1, setting the analytical uncertainties for each variable to the values reported in Sect. 2.4, and using =0.011, we use the Excel version of CO2SYS from Orr et al. (2018) and analyse the propagation of uncertainties on two computed variables, pCO2 and the saturation state of seawater with respect to calcite, ΩCa (Mucci, 1983; see discussion in Sect. 4.4). For this purpose, we use all data points from GLODAPv2 that contain T, P, SP, DIC, TA, pH, [SRP], and [DSi], in the top 10 m of the water column. The quality criterion remains unchanged; i.e. we use only data associated with a WOCE flag of 2. The obtained dataset contains 3392 samples, including the 948 samples of the regular dataset, and covers a salinity range from 3.46 to 37.57 and a temperature range from −1.91 to 31.80 ∘C. Depending on which carbonate system pair of variables is used, both the magnitude and the uncertainties of computed variables can differ (Orr et al., 2018; Ribas-Ribas et al., 2014). Here, we use three different pairs of variables, i.e. TA–DIC, TA–pH, and DIC–pH, to compute pCO2 and ΩCa and their associated propagated uncertainties, σpCO2 and σΩCa, respectively.
Relative uncertainties generated with the TA–DIC pair appear to be particularly sensitive to salinity (Fig. 5), increasing from ∼5 % to ∼15 % for both pCO2 and ΩCa as the salinity decreases from 35 to 5. The overall relative uncertainty for both pCO2 and ΩCa is less dependent on salinity when pH is used as an input variable with either DIC or TA. For both the TA–pH and the DIC–pH pairs, the overall relative uncertainty on pCO2 increases with an increasing temperature, while the overall relative uncertainty on ΩCa decreases with an increasing temperature (Fig. 5).
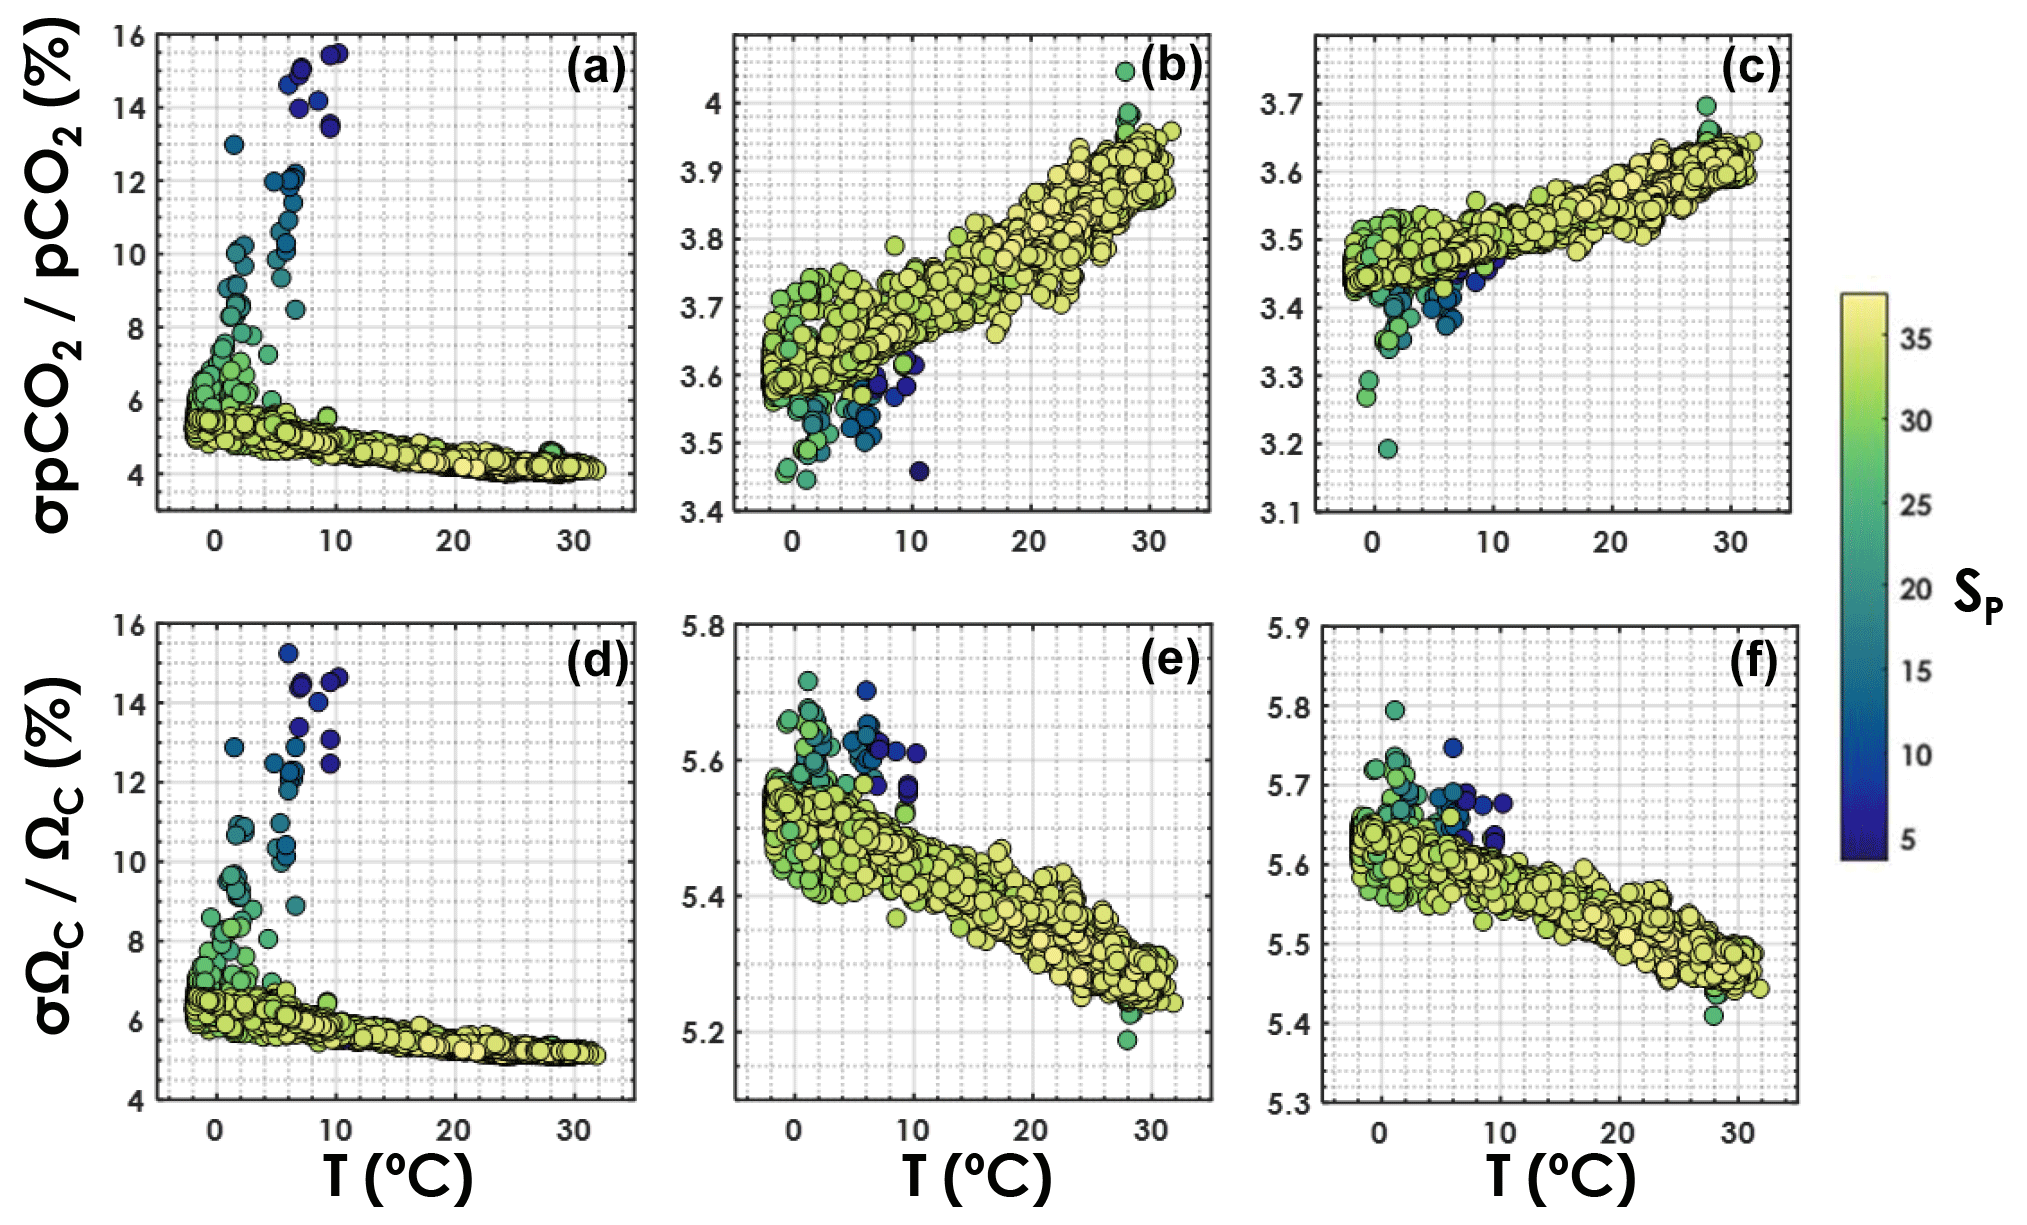
Figure 5Overall relative uncertainty for (a, b, c) pCO2 and (d, e, f) ΩCa as a function of in situ temperature (horizontal axis) and salinity (colour bar). Panels (a, d) are for the TA–DIC pair, panels (b, e) are for the TA–pH pair, and panels (c, f) are for the DIC–pH pair. This is computed using all data points from GLODAPv2 that contain T, P, SP, DIC, TA, pH, [SRP], and [DSi], in the top 10 m of the water column (3392 samples).
As depicted in Fig. 6, in agreement with Raimondi et al. (2019), we conclude that the DIC–pH pair offers the lowest overall relative uncertainty for computed pCO2 over the range of salinities and temperatures investigated. Using the DIC–pH pair also has the important benefit of not having to make any assumption regarding organic alkalinity or the boron-to-salinity ratio (Fong and Dickson, 2019). Conversely, the TA–pH pair is the one generating the highest overall relative uncertainties on computed pCO2. As for ΩCa, the TA–pH pair provides the lowest overall relative uncertainty below a temperature of ∼20 ∘C, whereas the TA–DIC pair should be preferred in warmer waters (Fig. 6).
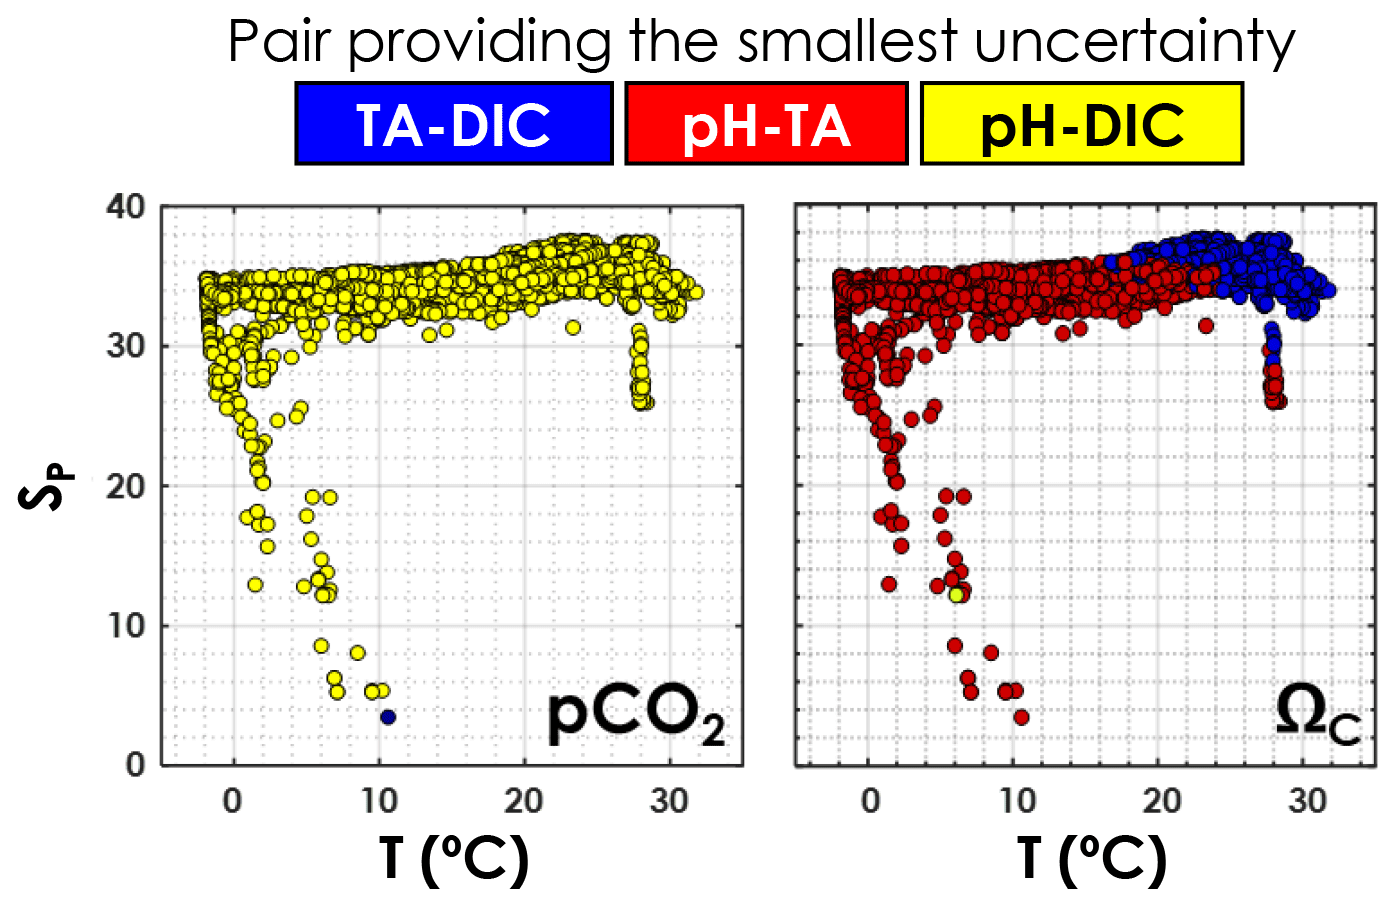
Figure 6Pair of carbonate system variables (TA–DIC, TA–pH, or DIC–pH) providing the lowest overall relative uncertainty, as a function of in situ temperature and practical salinity, for pCO2 and ΩCa. This is computed using all data points from GLODAPv2 that contain T, P, SP, DIC, TA, pH, [SRP], and [DSi] in the top 10 m of the water column (3392 samples).
4.3 Implications for surface ocean pCO2
To evaluate the implications of the revised temperature dependence of the carbonic acid dissociation constants, we compare ocean carbonate chemistry as calculated with the constants from this study, those of Lueker et al. (2000), and those of Millero et al. (2002). Whereas the constants from Lueker et al. (2000) are the most commonly used by the oceanographic community, as recommended by Dickson et al. (2007), the constants from Millero et al. (2002) were derived in an approach similar to that presented here, using a large dataset of in situ measurements. Thus, it appears relevant to include a comparison with Millero et al. (2002) in the present discussion. The major differences between our approach and the approach of Millero et al. (2002) are the calculation of CA from measured TA and pH (iteratively versus direct) and the conversion of pH measurements (iteratively versus estimating ΔpH∕ΔT from the constants of Mehrbach et al., 1973).
For this comparison, we use data from the Southern Ocean Carbon and Climate Observations and Modelling (SOCCOM) project (https://soccom.princeton.edu/, last access: 5 March 2020). The SOCCOM project has deployed more than 100 Argo floats equipped with biogeochemical sensors in the Southern Ocean. These sensors include pH, and SOCCOM routinely calculates the full carbon chemistry (including pCO2 and ΩCa) using a combination of measured T, SP, pH, O2, and empirical algorithms for TA (Carter et al., 2018). The SOCCOM data used here, both measured and calculated, were downloaded as a Matlab file from https://library.ucsd.edu/dc/object/bb0515927k (last access: 5 March 2020).
The method used to calculate pCO2 is detailed in the data file (within the FloatViz structure). Briefly, the SOCCOM project uses the Lueker et al. (2000) and , Perez and Fraga (1987) for KF, Dickson (1990) for KSO4, and Lee et al. (2010) for total boron estimates. Both [DSi] and [SRP] are estimated from the measured nitrate concentration using stoichiometric ratios of 2.5 and 1∕16, respectively. We applied the same method but substituted the Lueker et al. (2000) and constants with either the constants from this study or the Millero et al. (2002) constants. We were then able to compare surface ocean (defined as the upper 10 m of the water column) pCO2 obtained using Lueker et al. (2000) or Millero et al. (2002) with pCO2 obtained using the constants from this study. The analytical uncertainties were set to σSP=0.005 and σT=0.005 ∘C (Olsen et al., 2016), σ[DSi]=0.9 µmol kg−1 and σ[SRP]=0.5 µmol kg−1 (combination of uncertainty in nitrate concentration from Argo data, i.e. 0.5 µmol kg−1 as given in Johnson et al. (2017) and a 30 % uncertainty in stoichiometric ratios), σTA=5.6 µmol kg−1 (Carter et al., 2018), and σpH=0.005 (Johnson et al., 2017). and were set to 0.011, respectively, when the constants from this study were used. For both Lueker et al. (2000) or Millero et al. (2002), they were set to the default values given by Orr et al. (2018), i.e. and . Uncertainties on the computed pCO2 were propagated using the Matlab version of the Orr et al. (2018) CO2SYS software with error propagation.
pCO2 values obtained with the constants derived from this study are clearly higher than the Lueker et al. (2000)-based values in the southernmost regions, where temperatures are lowest (Fig. 7a, b), with a maximum difference (–) of µatm when the surface ocean is near the freezing point. The uncertainty on ΔpCO2 (σΔpCO2, grey lines in Fig. 7) is computed as the square root of the sum of the squares of and . Given the large uncertainties, the pCO2 difference between values based on constants derived from this study and values based on Lueker et al. (2000) is only statistically significant (i.e. ) for temperatures below ∼8 ∘C (Fig. 7a). pCO2 values obtained using Millero et al. (2002) constants appear to be midway between pCO2 values obtained using Lueker et al. (2000) constants and pCO2 values based on the constants from this study (Fig. 7c, d).
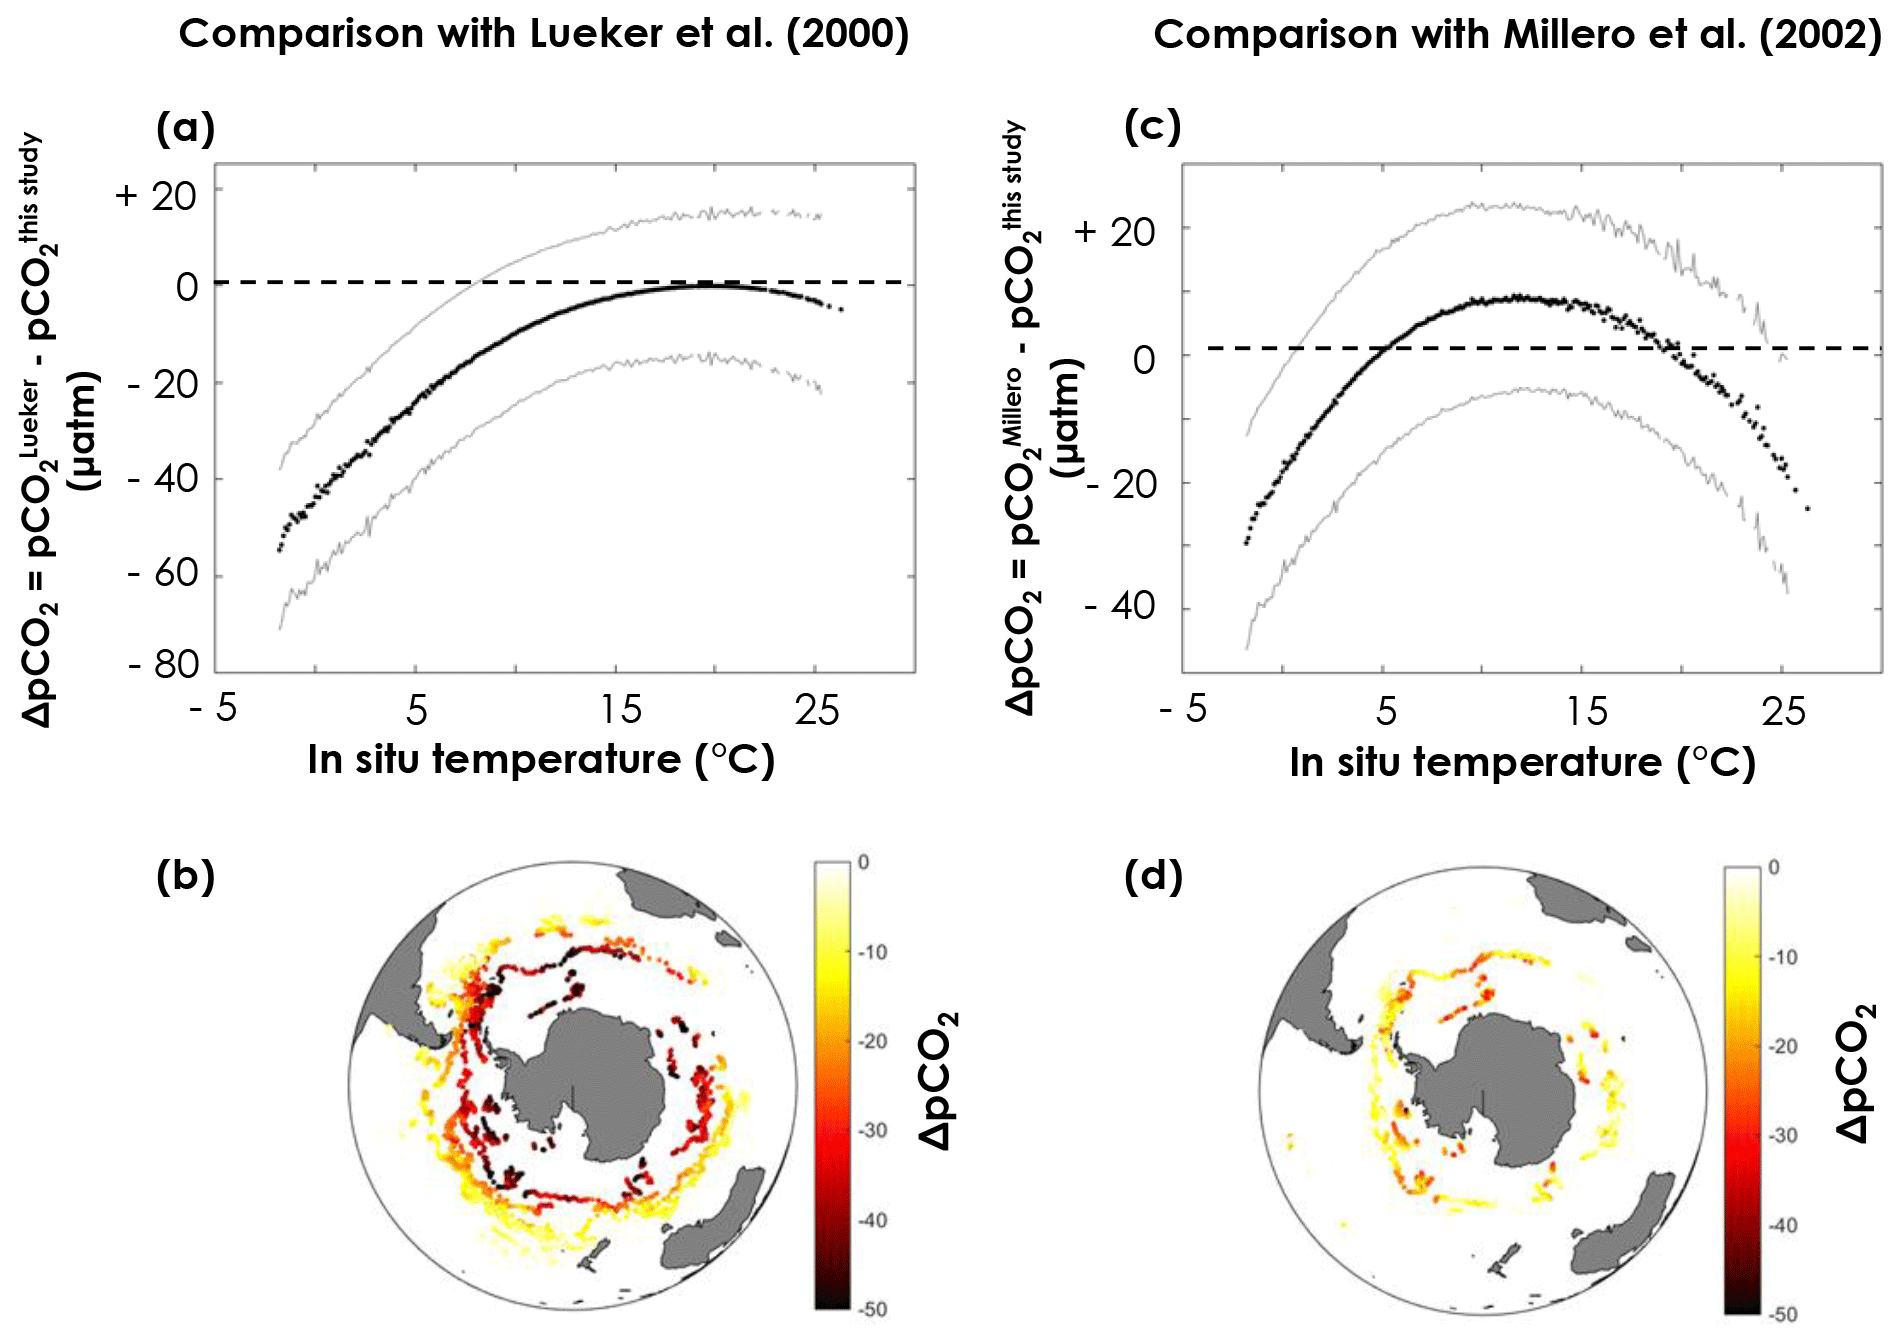
Figure 7Difference in surface pCO2 obtained from pH, temperature, practical salinity, and dissolved oxygen measured by the SOCCOM Argo array using (a, b) the Lueker et al. (2000) constants and the constants in Table 1 or (c, d) the Millero et al. (2002) constants and the constants in Table 1. Plots (a, c) represents the pCO2 difference (ΔpCO2) as a function of in situ temperature. Solid black lines are the mean ΔpCO2, while solid grey lines are plus or minus σΔpCO2 (square root of the sum of the squares of and ). Maps (b, d) depict the spatial distribution of ΔpCO2 in the Southern Ocean, where each point corresponds to an Argo float measurement.
Recently the SOCCOM Argo array was used to re-evaluate the Southern Ocean carbon sink (Gray et al., 2018). Traditional ship-based observations indicate a strong CO2 uptake in the entire Southern Ocean, but these observations are known to have a strong seasonal bias (Bakker et al., 2016), as well as a smaller spatial bias due to many areas being severely undersampled (Takahashi et al., 2012). Using pCO2 calculated by the above method, Gray et al. (2018) showed that the Southern Ocean CO2 uptake is considerably smaller than previously estimated. In parallel, Bailey et al. (2018) showed that the CO2 solubility constant from Weiss (1974) used in the majority of studies, including this one, was underestimated in waters below 0 ∘C, which implies that surface pCO2 is underestimated. In this study, using the new constants in Table 1, the computed Southern Ocean pCO2 is also higher than when computed using the constants of Lueker et al. (2000) or the constants of Millero et al. (2002), as shown in Fig. 7. The Southern Ocean is a net CO2 sink because the pCO2 in surface waters is on average lower than the atmospheric pCO2. If the surface-water pCO2 is revised upward, the resulting flux of CO2 from the atmosphere to the surface waters becomes smaller. Thus, results from Gray et al. (2018), Bailey et al. (2018), and the present study all advocate for a weaker CO2 sink in the Southern Ocean. The ocean CO2 sink is immensely important and currently estimated to remove ∼25 % of anthropogenic CO2 emissions (Le Quéré et al., 2018). If the CO2 uptake by the Southern Ocean is much smaller than previously estimated, there must be missing sinks elsewhere in the Earth system, be it in the oceanic or terrestrial realm. This highlights the need for a better understanding of the dynamics of the ocean carbon sink, including its regional and temporal variability. To validate our results, the high uncertainties associated with stoichiometric constants (Orr et al., 2018), coupled to the low spatial and temporal resolution of measurements in high latitudes, need to be addressed. Whether in the laboratory or in the field, future work should focus on a better understanding of seawater carbonate chemistry in cold waters.
4.4 Implications for calcium carbonate chemistry
In seawater undersaturated with respect to calcite or aragonite, (ΩCa or ΩAr<1), the CaCO3 phase of interest should dissolve if present. ΩCa depends on the Ca2+ concentration in seawater (a function of salinity and therefore nearly invariant at depth), the solubility product of calcite (Mucci, 1983), and the concentration in seawater. Because of the latter, computed ΩCa values are impacted by the choice of carbonic acid dissociation constants. Note that, as reported in Orr et al. (2018), the relative uncertainty on the solubility product of calcite is about 5 %. Below, we test the implications of the and values from this study on predictions of calcite saturation state in seawater.
Naviaux et al. (2019) recently observed discrepancies between ΩCa computed with the TA–DIC pair and ΩCa computed with the TA–pH pair, which they attributed to the internal inconsistency of the carbonate system, i.e. the fact that measured pH does not correspond to calculated pH. Instead, or in addition, the calcite saturation depth calculated by Naviaux et al. (2019) could be erroneously too shallow due to an overestimated and, consequently, overestimated seawater and ΩCa.
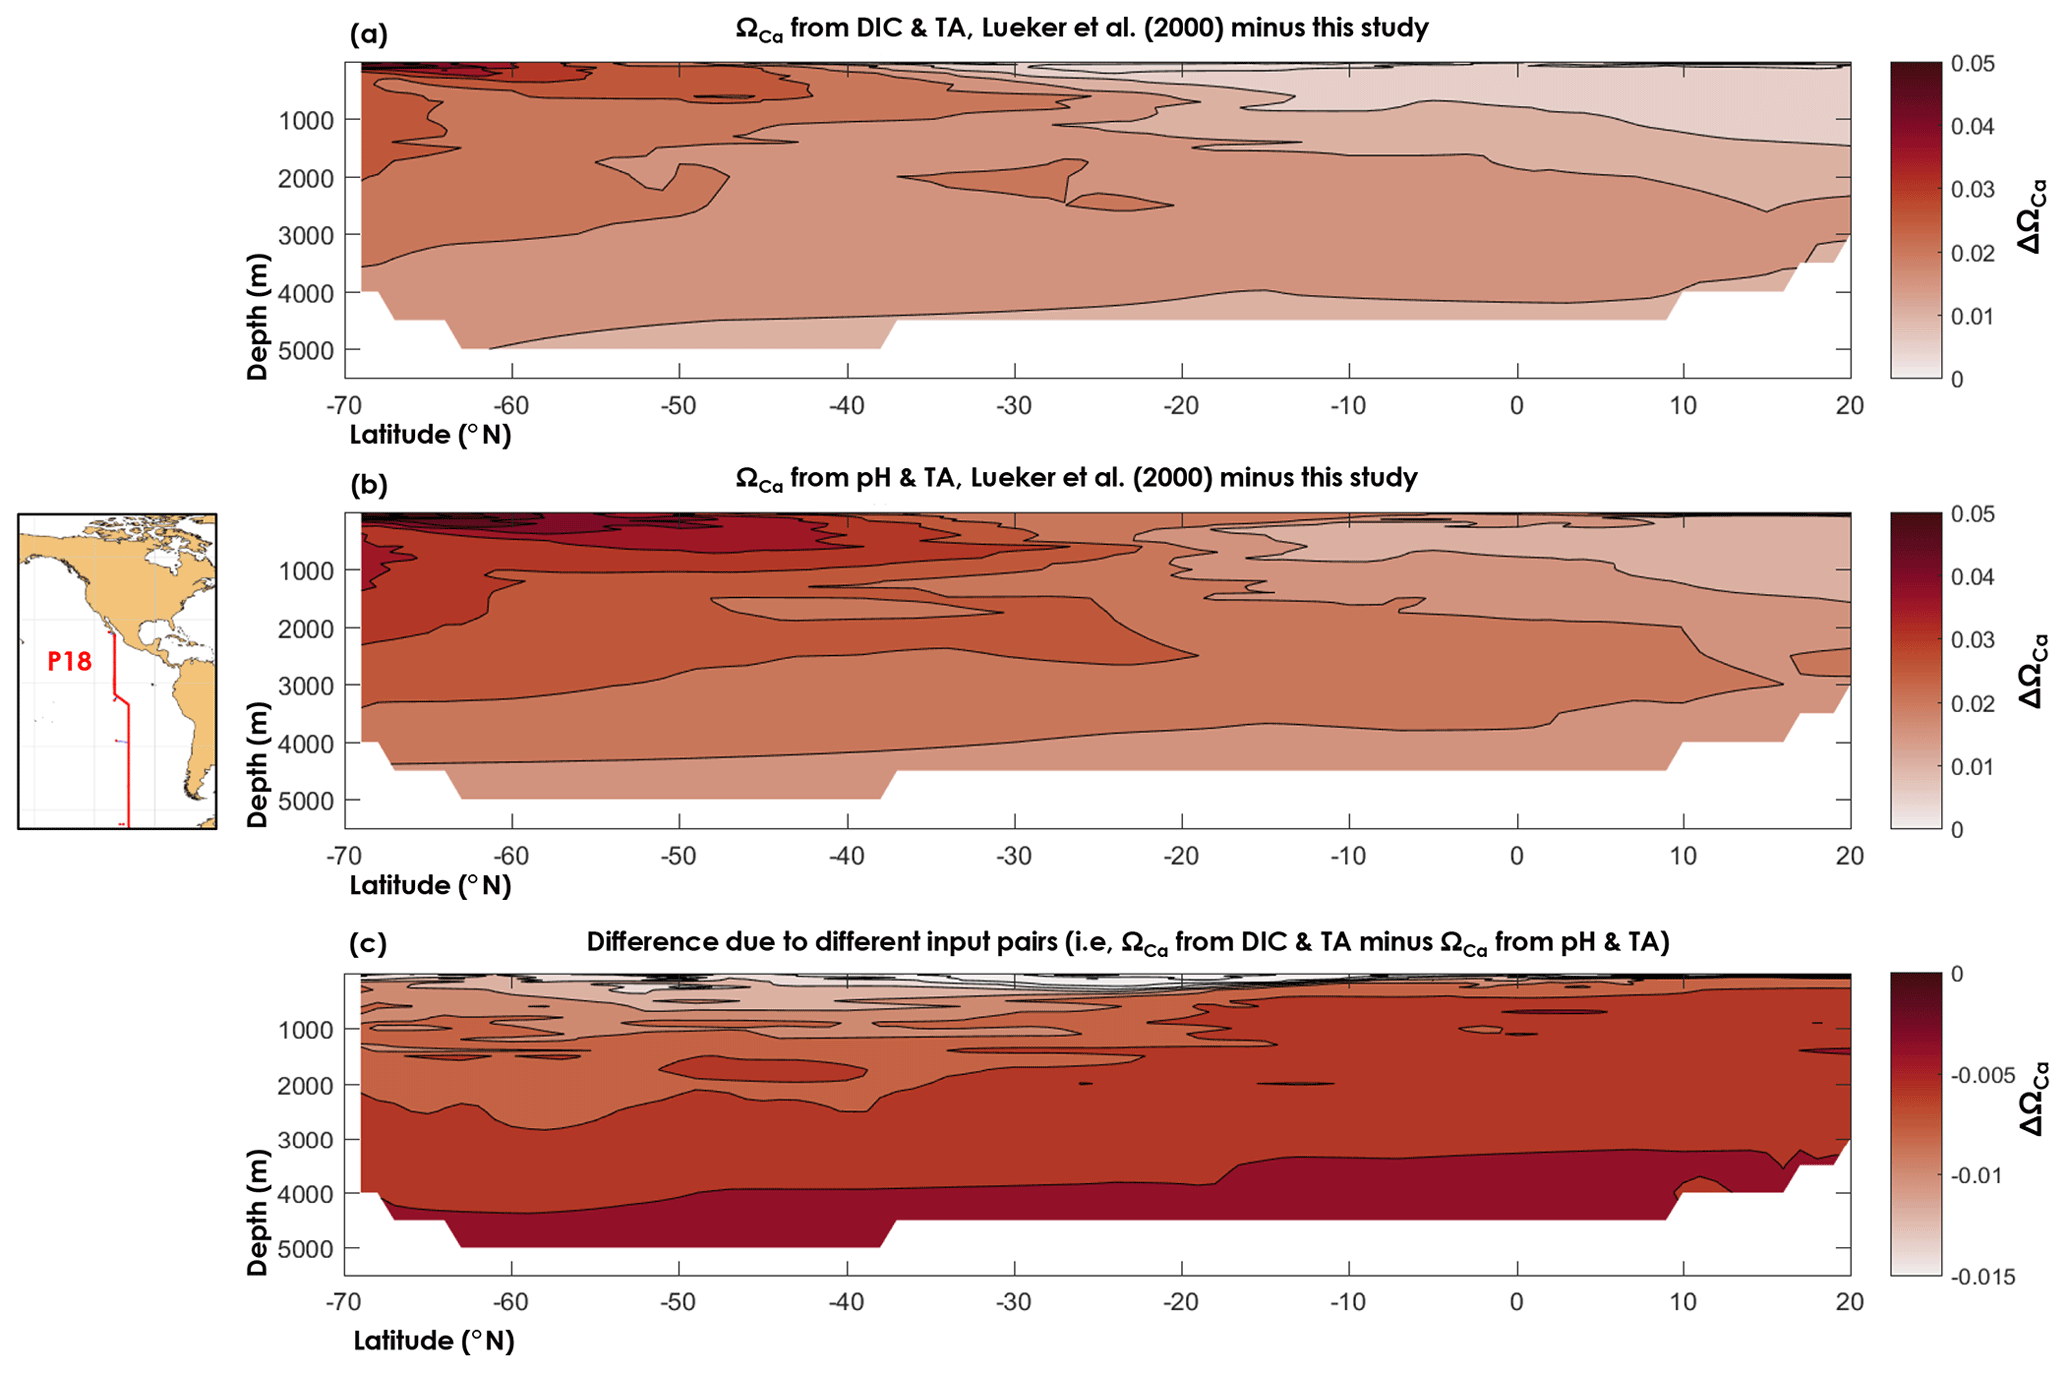
Figure 8Difference between (a) the calcite saturation state (ΩCa) computed from TA and DIC using the dissociation constants of Lueker et al. (2000) and the constants derived from this study, (b) ΩCa computed from pH and TA using the dissociation constants of Lueker et al. (2000) and the constants derived from this study, and (c) ΩCa computed from the DIC and TA pair and the pH and TA pair and the dissociation constants derived from this study.
Here, we used data from a cruise (33RO20071215, GLODAPv2 cruise no. 345) along the CLIVAR repeat section P18 that took place in 2007, following a latitudinal transect in the south-eastern Pacific Ocean, in which the carbonate chemistry variables DIC, TA, and pH were measured (see Olsen et al., 2016, for details about the data). All calculations were carried out using the discrete data, but for purposes of visualization (Fig. 8) we used a nearest-neighbour interpolation (function griddata in Matlab). In Fig. 8, we compare ΩCa as computed using and from this study, with ΩCa based on Lueker et al. (2000) constants. We also compare ΩCa computed from TA–DIC with ΩCa computed from TA–pH. From Fig. 8, it can be seen that the ΩCa difference between two different carbonate system pairs (TA–DIC, TA–pH) is ∼5 times smaller than the ΩCa difference that is due to the set of dissociation constants. Thus, the apparent dissolution observed by Naviaux et al. (2019) may be explained by overestimated dissociation constants atop inconsistencies arising from the choice of carbonate variables used in the calculations. We also note, based on Fig. 8, that ΩCa overestimation is largest in the southernmost part of the Pacific surface waters, where the temperature is the lowest. Nevertheless, the maximum calculated ΩCa differences, i.e. ΔΩCa=0.06 with TA–DIC and ΔΩCa=0.07 with TA–pH, are 2–3 times lower than the average combined uncertainty, i.e. ( and 0.17, respectively. These high uncertainties are attributed to the high measurement uncertainties that we use (those from Olsen et al., 2016, see Sect. 2.4), the overall uncertainty on the dissociation constants from this study, the uncertainty on Lueker et al. (2000) constants, and especially to the uncertainty in the calcite solubility product. As noted by Orr et al. (2018), the uncertainty on the calcite solubility product (∼5 %) causes the total uncertainty on ΩCa to be considerably larger than the uncertainty in seawater . In this study, only the and constants have been re-evaluated, but the large overall uncertainties on calculated saturation states clearly indicate that more work is necessary to define the solubility products of calcium carbonate minerals in the ocean. While beyond the scope of the present study, the results presented here show that proper assessments of present and future ocean acidification are highly sensitive to the present knowledge gaps regarding the thermodynamics of ocean carbon chemistry.
An iterative procedure allowed us to estimate the temperature dependence of the first and second carbonic acid stoichiometric dissociation constants ( and , respectively) from a large dataset of high-quality oceanographic measurements. Both and were similar to the constants of Lueker et al. (2000) that are currently used by most of the oceanographic community, as recommended by Dickson (2007), but the and values were lower in cold seawater, below a temperature of ∼8–9 ∘C. Consequently, at these temperatures, pCO2 computed using the constants of Lueker et al. (2000) may be underestimated and [] overestimated, meaning that the cold oceans are more undersaturated with respect to CaCO3 minerals than expected. We also used a GLODAP sub-dataset to study the internal consistency of the carbonate system and found that the DIC–pH carbonate system pair provides the smallest overall uncertainty when computing seawater pCO2. When calculating the saturation state of seawater with respect to calcite, the TA–DIC pair should be used to minimize the overall uncertainty when seawater is warmer than ∼20 ∘C, whereas the TA–pH pair should be preferred below ∼20 ∘C. These results are of critical importance for scientists contemplating studies of high-latitude marine carbonate chemistry and underline that improved knowledge of what causes the CO2 system inconsistencies in cold waters is key to improve our understanding of the marine carbon budget.
The R code and data files are available on Zenodo (https://doi.org/10.5281/zenodo.3725889, Sulpis et al., 2020).
The supplement related to this article is available online at: https://doi.org/10.5194/os-16-847-2020-supplement.
OS conceived the original idea, OS and MH designed the research, MH wrote the R code, and SKL advised on the use of the GLODAPv2, SOCAT, and Argo datasets. All authors contributed to paper writing, with OS taking the lead.
The authors declare that they have no conflict of interest.
We thank Dorothee C. E. Bakker and Mariana Ribas-Ribas for fruitful discussions, Alfonso Mucci and Andrew Dickson for helpful comments and suggestions on an earlier version of the paper, the journal editor Mario Hoppema for handling the paper, and two anonymous reviewers for their comments. We also thank Anna de Kluijver for her help in setting up the Monte Carlo simulation. We thank all who contributed to the creation of GLODAPv2 and SOCAT. Olivier Sulpis acknowledges the Department of Earth and Planetary Sciences at McGill University for financial support during his residency in the graduate programme and acknowledges funding from the Dutch Ministry of Education via the Netherlands Earth System Science Centre (NESSC). Siv K. Lauvset acknowledges funding from the Research Council of Norway.
This research has been supported by Dutch Ministry of Education via the Netherlands Earth System Science Centre (NESSC (grant no. 024.002.001)) and the Research Council of Norway (ICOS-Norway (grant no. 245927) and NorArgo2 (grant no. 269753)).
This paper was edited by Mario Hoppema and reviewed by two anonymous referees.
Bailey, N., Papakyriakou, T. N., Bartels, C., and Feiyue, W.: Henry's Law constant for CO2 in aqueous sodium chloride solutions at 1 atm and sub-zero (Celsius) temperatures, Mar. Chem., 207, 26–32, https://doi.org/10.1016/j.marchem.2018.10.003, 2018.
Bakker, D. C. E., Pfeil, B., Landa, C. S., Metzl, N., O'Brien, K. M., Olsen, A., Smith, K., Cosca, C., Harasawa, S., Jones, S. D., Nakaoka, S., Nojiri, Y., Schuster, U., Steinhoff, T., Sweeney, C., Takahashi, T., Tilbrook, B., Wada, C., Wanninkhof, R., Alin, S. R., Balestrini, C. F., Barbero, L., Bates, N. R., Bianchi, A. A., Bonou, F., Boutin, J., Bozec, Y., Burger, E. F., Cai, W.-J., Castle, R. D., Chen, L., Chierici, M., Currie, K., Evans, W., Featherstone, C., Feely, R. A., Fransson, A., Goyet, C., Greenwood, N., Gregor, L., Hankin, S., Hardman-Mountford, N. J., Harlay, J., Hauck, J., Hoppema, M., Humphreys, M. P., Hunt, C. W., Huss, B., Ibánhez, J. S. P., Johannessen, T., Keeling, R., Kitidis, V., Körtzinger, A., Kozyr, A., Krasakopoulou, E., Kuwata, A., Landschützer, P., Lauvset, S. K., Lefèvre, N., Lo Monaco, C., Manke, A., Mathis, J. T., Merlivat, L., Millero, F. J., Monteiro, P. M. S., Munro, D. R., Murata, A., Newberger, T., Omar, A. M., Ono, T., Paterson, K., Pearce, D., Pierrot, D., Robbins, L. L., Saito, S., Salisbury, J., Schlitzer, R., Schneider, B., Schweitzer, R., Sieger, R., Skjelvan, I., Sullivan, K. F., Sutherland, S. C., Sutton, A. J., Tadokoro, K., Telszewski, M., Tuma, M., van Heuven, S. M. A. C., Vandemark, D., Ward, B., Watson, A. J., and Xu, S.: A multi-decade record of high-quality fCO2 data in version 3 of the Surface Ocean CO2 Atlas (SOCAT), Earth Syst. Sci. Data, 8, 383–413, https://doi.org/10.5194/essd-8-383-2016, 2016.
Bates, N. R.: Ocean Carbon Cycle, in: Encyclopedia of Ocean Sciences, 3rd edn., edited by: Cochran, J. K., Bokuniewicz, H. J., and Yager, P. L., Elsevier, 1, 418–428, 2019.
Brown, K. A., Miller, L. A., Davelaar, M., Francois, R., and Tortell, P. D.: Over-determination of the carbonate system in natural sea-ice brine and assessment of carbonic acid dissociation constants under low temperature, high salinity conditions, Mar. Chem., 165, 36–45, https://doi.org/10.1016/j.marchem.2014.07.005, 2014.
Byrne, R. H. and Yao, W.: Procedures for measurement of carbonate ion concentrations in seawater by direct spectrophotometric observations of Pb(II) complexation, Mar. Chem., 112, 128–135, 2008.
Cai, W.-J. and Wang, Y.: The chemistry, fluxes, and sources of carbon dioxide in the estuarine waters of the Satilla and Altamaha Rivers, Georgia, Limnol. Oceanogr., 43, 657–668, 1998.
Carter, B. R., Feely, R. A., Williams, N. L., Dickson, A. G., Fong, M. B., and Takeshita, Y.: Updated methods for global locally interpolated estimation of alkalinity, pH, and nitrate, Limnol. Oceanogr.-Meth, 16, 119–131, 2018.
Dickson, A. G.: An exact definition of total alkalinity and a procedure for the estimation of alkalinity and total inorganic carbon from titration data, Deep-Sea Res., 28A, 609–623, 1981.
Dickson, A. G.: Thermodynamics of the dissociation of boric acid in synthetic seawater from 273.15 to 318.15 K, Deep-Sea Res., 37, 755–766, 1990.
Dickson, A. G. and Millero, F. J.: A comparison of the equilibrium constants for the dissociation of carbonic acid in seawater media, Deep-Sea Res., 34, 1733–1743, 1987.
Dickson, A. G., Sabine, C. L., and Christian, J. R.: Guide to best practices for ocean CO2 measurement, Sidney, British Columbia, North Pacific Marine Science Organization, PICES Special Publication 3, 191 pp., http://hdl.handle.net/11329/249, 2007.
Dinauer, A. and Mucci, A.: Spatial variability in surface-water pCO2 and gas exchange in the world's largest semi-enclosed estuarine system: St. Lawrence Estuary (Canada), Biogeosciences, 14, 3221–3237, https://doi.org/10.5194/bg-14-3221-2017, 2017.
Easley, R. A., Patsavas, M. C., Byrne, R. H., Liu, X., Feely, R. A., and Mathis, J. T.: Spectrophotometric measurement of calcium carbonate saturation states in seawater, Environ. Sci. Technol., 47, 1468–1477, 2013.
Elzhov, T. V., Mullen, K. M., Spiess, A.-N., and Bolker, B.: minpack.lm: R Interface to the Levenberg-Marquardt Nonlinear Least-Squares Algorithm Found in MINPACK, Plus Support for Bounds, R package version 1.2-1, available at: https://CRAN.R-project.org/package=minpack.lm (last access: 5 March 2020), 2016.
Fong, M. B. and Dickson, A. G.: Insights from GO-SHIP hydrography data into the thermodynamic consistency of CO2 system measurements in seawater, Mar. Chem., 211, 52–63, https://doi.org/10.1016/j.marchem.2019.03.006, 2019.
Gattuso, J.-P. and Hansson, L.: Ocean Acidification, Oxford University Press, Oxford, 2011.
Gattuso, J.-P., Epitalon, J.-M., Lavigne, H., and Orr, J.: seacarb: Seawater Carbonate Chemistry. R package version 3.2.12, available at: https://CRAN.R-project.org/package=seacarb (last access: 5 March 2020), 2019.
Goyet, C. and Poisson, A.: New determination of carbonic acid dissociation constants in seawater as a function of temperature and salinity, Deep-Sea Res., 36, 1635–1654, https://doi.org/10.1016/0198-0149(89)90064-2, 1989.
Gray, A. R., Johnson, K. S., Bushinsky, S. M., Riser, S. C., Russell, J. L., Talley, L. D., Wanninkhof, R., Williams, N. L., and Sarmiento, J. L.: Autonomous Biogeochemical Floats Detect Significant Carbon Dioxide Outgassing in the High-Latitude Southern Ocean, Geophys. Res. Lett., 45, 9049–9057, 2018.
Gruber, N., Clement, D., Carter, B. R., Feely, R. A., van Heuven, S., Hoppema, M., Ishii, M., Key, R. M., Kozyr, A., Lauvset, S. K., Lo Monaco, C., Mathis, J. T., Murat, A., Olsen, A., Perez, F., Sabine, C. L., Tanhua, T., and Wanninkhof, R.: The oceanic sink for anthropogenic CO2 from 1994 to 2007, Science, 363, 1193–1199, 2019.
Hunter, K. A.: The temperature dependence of pH in surface seawater, Deep-Sea Res. Pt. I, 45, 1919–1930, 1998.
Johnson, K. S., Plant, J. N., Coletti, L. J., Jannasch, H. W., Sakamoto, C. M., Riser, S. C., Swift, D. D., Williams, N. L., Boss, E., Haentjens, N., Talley, L. D., and Sarmiento, J. L.: Biogeochemical sensor performance in the SOCCOM profiling float array, J. Geophys. Res.-Oceans, 122, 6416–6436, 2017.
Key, R. M., Olsen, A., van Heuven, S., Lauvset, S. K., Velo, A., Lin, X., Schirnick, C., Kozyr, A., Tanhua, T., Hoppema, M., Jutterström, S., Steinfeldt, R., Jeansson, E., Ishi, M., Perez, F. F., and Suzuki, T.: Global Ocean Data Analysis Project, Version 2 (GLODAPv2), ORNL/CDIAC-162, NDP-P093, Carbon Dioxide Information Analysis Center, Oak Ridge National Laboratory, US Department of Energy, Oak Ridge, Tennessee, 2015.
Koeve, W. and Oschlies, A.: Potential impact of DOM accumulation on fCO2 and carbonate ion computations in ocean acidification experiments, Biogeosciences, 9, 3787–3798, https://doi.org/10.5194/bg-9-3787-2012, 2012.
Landschützer, P., Gruber, N., Haumann, F. A., Rödenbeck, C., Bakker, D. C. E., van Heuven, S., Hoppema, M., Metzl, N., Sweeney, C., Takahashi, T., Tilbrook, B., and Wanninkhof, R.: The reinvigoration of the Southern Ocean carbon sink, Science, 349, 1221–1224, 2015.
Lauvset, S. K., Key, R. M., Olsen, A., van Heuven, S., Velo, A., Lin, X., Schirnick, C., Kozyr, A., Tanhua, T., Hoppema, M., Jutterström, S., Steinfeldt, R., Jeansson, E., Ishii, M., Perez, F. F., Suzuki, T., and Watelet, S.: A new global interior ocean mapped climatology: the GLODAP version 2, Earth Syst. Sci. Data, 8, 325–340, https://doi.org/10.5194/essd-8-325-2016, 2016.
Lee, K., Kim, T. W., Byrne, R. H., Millero, F. J., Feely, R. A., and Liu, Y. M.: The universal ratio of boron to chlorinity for the North Pacific and North Atlantic oceans, Geochim. Cosmochim. Ac., 74, 1801–1811, 2010.
Le Quéré, C., Andrew, R. M., Friedlingstein, P., Sitch, S., Pongratz, J., Manning, A. C., Korsbakken, J. I., Peters, G. P., Canadell, J. G., Jackson, R. B., Boden, T. A., Tans, P. P., Andrews, O. D., Arora, V. K., Bakker, D. C. E., Barbero, L., Becker, M., Betts, R. A., Bopp, L., Chevallier, F., Chini, L. P., Ciais, P., Cosca, C. E., Cross, J., Currie, K., Gasser, T., Harris, I., Hauck, J., Haverd, V., Houghton, R. A., Hunt, C. W., Hurtt, G., Ilyina, T., Jain, A. K., Kato, E., Kautz, M., Keeling, R. F., Klein Goldewijk, K., Körtzinger, A., Landschützer, P., Lefèvre, N., Lenton, A., Lienert, S., Lima, I., Lombardozzi, D., Metzl, N., Millero, F., Monteiro, P. M. S., Munro, D. R., Nabel, J. E. M. S., Nakaoka, S., Nojiri, Y., Padin, X. A., Peregon, A., Pfeil, B., Pierrot, D., Poulter, B., Rehder, G., Reimer, J., Rödenbeck, C., Schwinger, J., Séférian, R., Skjelvan, I., Stocker, B. D., Tian, H., Tilbrook, B., Tubiello, F. N., van der Laan-Luijkx, I. T., van der Werf, G. R., van Heuven, S., Viovy, N., Vuichard, N., Walker, A. P., Watson, A. J., Wiltshire, A. J., Zaehle, S., and Zhu, D.: Global Carbon Budget 2017, Earth Syst. Sci. Data, 10, 405–448, https://doi.org/10.5194/essd-10-405-2018, 2018.
Lewis, E. and Wallace, D. W. R.: Program Developed for CO2 System Calculations, ORNL/CDIAC-105, Carbon Dioxide Information Analysis Center, Oak Ridge National Laboratory, U.S. Department of Energy, Oak Ridge, Tennessee, 38 pp., 1998.
Lueker, T. J., Dickson, A. G., and Keeling, C. D.: Ocean pCO2 calculated from dissolved inorganic carbon, alkalinity, and equations for K1 and K2: validation based on laboratory measurements of CO2 in gas and seawater at equilibrium, Mar. Chem., 70, 105–119, 2000.
Mehrbach, C., Culberson, C. H., Hawley, J. E., and Pytkowicz, R. M.: Measurement of the apparent dissociation constants of carbonic acid in seawater at atmospheric pressure, Limnol. Oceanogr., 18, 897–907, 1973.
Millero, F. J.: Thermodynamics of the carbon dioxide system in the oceans, Geochim. Cosmochim. Ac., 59, 661–677, 1995.
Millero, F. J.: The Marine Inorganic Carbon Cycle, Chem. Rev., 107, 308–341, 2007.
Millero, F. J.: Carbonate constants for estuarine waters, Mar. Freshwater Res., 61, 139–142, 2010.
Millero, F. J., Pierrot, D., Lee, K., Wanninkhof, R., Feely, R., Sabine, C. L., Key, R. M., and Takahashi, T.: Dissociation constants for carbonic acid determined from field measurements, Deep-Sea Res. Pt. I, 49, 1705–1723, 2002.
Millero, F. J., Graham, T. B., Huang, F., Bustos-Serrano, H., and Pierrot, D.: Dissociation constants of carbonic acid in seawater as a function of salinity and temperature, Mar. Chem., 100, 80–94, https://doi.org/10.1016/j.marchem.2005.12.001, 2006.
Mucci, A.: The solubility of calcite and aragonite in seawater at various salinities, temperatures and one atmosphere total pressure, Am. J. Sci., 283, 780–799, https://doi.org/10.2475/ajs.283.7.780, 1983.
Naviaux, J. D., Subhas, A. V., Dong, S., Rollins, N. E., Liu, X., Byrne, R. H., Berelson, W. M., and Adkins, J. F.: Calcite dissolution rates in seawater: lab vs. in situ measurements and inhibition by organic matter, Mar. Chem., 215, 103684, https://doi.org/10.1016/j.marchem.2019.103684, 2019.
Olsen, A., Key, R. M., van Heuven, S., Lauvset, S. K., Velo, A., Lin, X., Schirnick, C., Kozyr, A., Tanhua, T., Hoppema, M., Jutterström, S., Steinfeldt, R., Jeansson, E., Ishii, M., Pérez, F. F., and Suzuki, T.: The Global Ocean Data Analysis Project version 2 (GLODAPv2) – an internally consistent data product for the world ocean, Earth Syst. Sci. Data, 8, 297–323, https://doi.org/10.5194/essd-8-297-2016, 2016.
Olsen, A., Lange, N., Key, R. M., Tanhua, T., Álvarez, M., Becker, S., Bittig, H. C., Carter, B. R., Cotrim da Cunha, L., Feely, R. A., van Heuven, S., Hoppema, M., Ishii, M., Jeansson, E., Jones, S. D., Jutterström, S., Karlsen, M. K., Kozyr, A., Lauvset, S. K., Lo Monaco, C., Murata, A., Pérez, F. F., Pfeil, B., Schirnick, C., Steinfeldt, R., Suzuki, T., Telszewski, M., Tilbrook, B., Velo, A., and Wanninkhof, R.: GLODAPv2.2019 – an update of GLODAPv2, Earth Syst. Sci. Data, 11, 1437–1461, https://doi.org/10.5194/essd-11-1437-2019, 2019.
Orr, J. C., Epitalon, J.-M., Dickson, A. G., and Gattuso, J.-P.: Routine uncertainty propagation for the marine carbon dioxide system, Mar. Chem., 207, 84–107, https://doi.org/10.1016/j.marchem.2018.10.006, 2018.
Papadimitriou, S., Loucaides, S., Rérolle, V. M. C., Kennedy, P., Achterberg, E. P., Dickson, A. G., Mowlem, M., and Kennedy, H.: The stoichiometric dissociation constants of carbonic acid in seawater brines from 298 to 267 K, Geochim. Cosmochim. Ac., 220, 55–70, https://doi.org/10.1016/j.gca.2017.09.037, 2018.
Patsavas, M. C., Byrne, R. H., Wanninkhof, R., Feely, R. A., and Cai, W.-J.: Internal consistency of marine carbonate system measurements and assessments of aragonite saturation state: Insights from two U.S. coastal cruises, Mar. Chem., 176, 9–20, 2015.
Perez, F. F. and Fraga, F.: Association constant of fluoride and hydrogen ions in seawater, Mar. Chem., 21, 161–168, 1987.
Pierrot, D., Lewis, E., and Wallace, D. W. R.: MS Excel Program Developed for CO2 System Calculations, Tech. rep., ORNL/CDIAC-105a, Carbon Dioxide Information Analysis Center, Oak Ridge National Laboratory, U.S. Department of Energy, Oak Ridge, Tennessee, 2006.
Pierrot, D., Neill, C., Sullivan, K., Castle, R., Wanninkhof, R., Lüger, H., Johannessen, T., Olsen, A., Feely, R. A., and Cosca, C. E.: Recommendations for autonomous underway pCO2 measuring systems and data-reduction routines, Deep-Sea Res. Pt. II, 56, 512–522, https://doi.org/10.1016/j.dsr2.2008.12.005, 2009.
R Core Team: R: A language and environment for statistical computing. R Foundation for Statistical Computing, Vienna, Austria, available at: http://www.R-project.org/ (last access: 5 March 2020), 2019.
Raimondi, L., Matthews, J. B. R., Atamanchuck, D., Azetsu-Scott, K., and Wallace, D.: The internal consistency of the marine carbon dioxide system for high latitude shipboard and in situ monitoring, Mar. Chem., 213, 49–70, 2019.
Ribas-Ribas, M., Rérolle, V. M. C., Bakker, D. C. E., Kitidis, V., Lee, G. A., Brown, I., Achterberg, E. P., Hardman-Mountford, N. J., and Tyrrell, T.: Intercomparison of carbonate chemistry measurements on a cruise in northwestern European shelf seas, Biogeosciences, 11, 4339–4355, https://doi.org/10.5194/bg-11-4339-2014, 2014.
Roy, R. N., Roy, L. N., Vogel, K. M., Porter-Moore, C., Pearson, T., Good, C. E., Millero, F. J., and Campbell, D. M.: The dissociation constants of carbonic acid in seawater at salinities 5 to 45 and temperatures 0 to 45 ∘C, Mar. Chem., 44, 249–267, 1993.
Sharp, J. D. and Byrne, R. H.: Carbonate ion concentrations in seawater: Spectrophotometric determination at ambient temperatures and evaluation of propagated calculation uncertainties, Mar. Chem., 209, 70–80, 2019.
Spiess, A.-N.: propagate: Propagation of uncertainty using higher-order Taylor expansion and Monte Carlo simulation. R-package version 1.0-6, available at: https://CRAN.R-project.org/package=propagate (last access: 5 March 2020), 2018.
Soetaert, K. and Herman, P. M. J.: A Practical Guide to Ecological Modelling. Using R as a Simulation Platform, Springer, 372 pp., 2009.
Sulpis, O., Lauvset, S. K., and Hagens, M.: R script belonging to “Current estimates of K1* and K2* appear inconsistent with measured CO2 system parameters in cold oceanic regions”, Zenodo, https://doi.org/10.5281/zenodo.3725889, 2020.
Takahashi, T., Sweeney, C., Hales, B., Chipman, D., Newberger, T., Goddard, J., Iannuzzi R., and Sutherland, S.: The Changing Carbon Cycle in the Southern Ocean, Oceanography, 25, 26–37, 2012.
Takeshita, Y., Johnson, K. S., Martz, T. R., Plant, J. N., and Sarmiento, J. L.: Assessment of Autonomous pH Measurements for Determining Surface Seawater Partial Pressure of CO2, J. Geophys. Res.-Oceans, 123, 4003–4013, 2018.
Tanhua, T., van Heuven, S., Key, R. M., Velo, A., Olsen, A., and Schirnick, C.: Quality control procedures and methods of the CARINA database, Earth Syst. Sci. Data, 2, 35–49, https://doi.org/10.5194/essd-2-35-2010, 2010.
Tishchenko, P. Y., Wong, C. S., and Johnson, W. K.: Measurements of Dissociation Constants of Carbonic Acid in Synthetic Seawater by Means of a Cell Without Liquid Junction, J. Solution Chem., 42, 2168–2186, https://doi.org/10.1007/s10953-013-0094-7, 2013.
Uppström, L. R.: The boron/chlorinity ratio of deep-sea water from the Pacific Ocean, Deep-Sea Research and Oceanographic Abstracts, 21, 161–162, 1974.
van Heuven, S., Pierrot, D., Rae, J. W. B., Lewis, E., and Wallace, D. W. R.: MATLAB program developed for CO2 system calculations, ORNL/CDIAC-105b, Carbon Dioxide Information Analysis Center, Oak Ridge National Laboratory, U.S. Department of Energy, Oak Ridge, Tennessee, 2011.
Weiss, R.: Carbon dioxide in water and seawater: the solubility of a non-ideal gas, Mar. Chem., 2, 203–215, 1974.
Williams, N. L., Juranek, L. W., Feely, R. A., Johnson, K. S., Sarmiento, J. L., Talley, L. D., Dickson, A. G., Gray, A. R., Wanninkhof, R., Russell, J. L., Riser, S. C., and Takeshita, Y.: Calculating surface ocean pCO2 from biogeochemical Argo floats equipped with pH: An uncertainty analysis, Global Biogeochem. Cy., 31, 591-604, 2017.
Yang, B., Byrne, R. H., and Lindemuth, M.: Contributions of organic alkalinity to total alkalinity in coastal waters: A spectrophotometric approach, Mar. Chem., 176, 199–207, 2015.
Yao, W. and Millero, F. J.: The chemistry of the anoxic waters in the Framvaren Fjord, Norway, Aquat. Geochem., 1, 53–88, 1995.
Yao, W., Liu, X., and Byrne, R. H.: Impurities in indicators used for spectrophotometric seawater pH measurements: Assessment and remedies, Mar. Chem., 107, 167–172, 2007.
Zeebe, R. E. and Wolf-Gladrow, D.: CO2 in seawater: equilibrium, kinetics, isotopes, Elsevier Science, Amsterdam, 2001.