the Creative Commons Attribution 4.0 License.
the Creative Commons Attribution 4.0 License.
 | 17 Dec 2020
Marine climate change over the eastern Agulhas Bank of South Africa
Mark R. Jury
The rate of change in the marine environment over the eastern Agulhas Bank along the south coast of South Africa (32–37∘ S, 20–30∘ E) is studied using reanalysis observations for 1900–2015 and coupled ensemble model projections for 1980–2100. Outcomes are influenced by resolution and time span: ∼ 1∘ datasets covering the whole period capture large-scale changes, while ∼ 0.5∘ datasets in the satellite era better distinguish the cross-shelf gradients. Although sea surface temperatures offshore are warming rapidly (0.05 ∘C yr−1 since 1980), a trend toward easterly winds and a locally stronger Agulhas Current have intensified nearshore upwelling (−0.03 ∘C yr−1). The subtropical ridge is gradually moving poleward, leading to a drier climate.
- Article
(8800 KB) - Full-text XML
- BibTeX
- EndNote


The marine climate of the eastern Agulhas Bank along the south coast of South Africa is shaped by the continental plateau and subtropical latitude. Rainfall tends to be limited, and shelf waters are characterized by sharp gradients between inshore upwelling and an offshore current that advects warm water polewards at ∼ 1 m s−1 (Lutjeharms et al., 2000). Downstream widening of the shelf and cyclonic shear cause uplift at the shelf edge (Schumann et al., 1982; Lutjeharms, 2006; Goschen et al., 2015; Malan et al., 2018). Westerly and easterly wind regimes during winter to summer respectively induce alternating spells of downwelling and upwelling (Schumann and Martin, 1991; Schumann, 1999). Numerous small rivers discharge into the shelf zone (Schumann and Pearce, 1997; Scharler and Baird, 2005; van Bladeren et al., 2007). The inshore environment and large embayments (Fig. 1a) are characterized by weak circulations and seasonal warming, and they become stratified and productive during austral summer (Roberts, 2010; Pattrick et al., 2013). The Agulhas Current meanders a few times per year (Goschen and Schumann, 1990; Rouault and Penven, 2011), while the midlatitude jet stream meanders a few times per month, advecting coastal lows and continental shelf waves along the shelf (Jury et al., 1990; Schumann and Brink, 1990). Amidst these rapid changes are rising sea levels (Mather et al., 2009) and longer summers.
The eastern Agulhas Bank shows trends toward offshore warming and inshore cooling due to wind- and current-induced upwelling, as well as the retreat of the circumpolar westerlies (Rouault et al., 2009; Durgadoo et al., 2013; Hutchinson et al., 2018). Trends in air temperatures are near the global average of 0.02 ∘C yr−1 (Kruger and Shongwe, 2004; Morishima and Akasaka, 2010; Jury, 2013), but trends in other variables show multiyear fluctuations (Philippon et al., 2012) from regional atmosphere coupling with sea surface temperatures (SSTs) and the Pacific El Niño–Southern Oscillation (ENSO). The climate change analyses of Tadross et al. (2005), MacKeller et al. (2014), and Kruger and Nxumalo (2017) offer guidance on resource management, which this research seeks to extend.
The main objective of this study is to establish the rate and pattern of observed and projected marine climate (land, air, sea) trends along the south coast of South Africa from 1900 to 2100. Scientific questions include the following: (1) how has the wind field responded to a poleward shift of the subtropical ridge? (2) What are the consequences of intensified coastal upwelling? (3) How do record length and dataset resolution affect the result? (4) What is the impact of climate variability on trend attribution? While the spatial focus is on the south coast of South Africa using monthly datasets finer than 0.5∘ during the satellite era, context is provided at the large scale using coarser model products over the 20th and 21st centuries.
Modern data assimilation systems blend in situ and ancillary measurements by iterating between climatology, persistence, and theory, interpolating across gaps in time and space, and limiting the influence of outliers. By reducing uncertainties, scientists now have a reliable means to evaluate trends in marine climate. The monthly reanalysis products employed here include ECMWF v5 coupled (Dee et al., 2011), ECMWF-20C atmosphere (Poli et al., 2016), ECMWF-ORA4 ocean (Balmaseda et al., 2013), NASA MERRA-2 coupled (Gelaro et al., 2017), NCEP CFSR-2 coupled (Saha et al., 2010), SODA-3 ocean (Carton et al., 2018), NOAA sea surface temperature (SST; Reynolds et al., 2007), NOAA net outgoing longwave radiation (OLR; Lee et al., 2007), NESDIS vegetation temperature (Tucker et al., 2005), and CHIRP rainfall (Funk et al., 2014). Table 1 lists the acronyms, data source, horizontal resolution, and time span. Ocean–atmosphere fields with horizontal resolution finer than 0.5∘ are capable of representing cross-shelf gradients, and these are available in the satellite era from 1980–2016. SODA-3 provides subsurface ocean data on temperature, salinity, currents, and vertical motion driven by MERRA-2 winds, multi-satellite altimeter, and thermal measurements blended with in situ observations over the shelf. Land–atmosphere–ocean evolution is described by coupled reanalysis products underpinned by data assimilation (Hamrud et al., 2015).
In addition to the monthly datasets, daily ECMWF-5 sea-level air pressure (SLP) fields were analyzed using empirical orthogonal functions (EOFs). The leading mode was determined, and its spatial loading pattern and time score were analyzed for evolution at lags from −2 to +2 d and for trends and spectral cycling in the period 1900–2015. Ship data from the repository for marine data collected in South African waters, SADCO, were analyzed in 0.1∘ bins for SST and wind speed, averaged over 24.5–26.5∘ E for 1950–2015 (see Fig. A1 in the Appendix), and compared with 0.3∘ reanalysis products. Monthly river discharge records were obtained for the Gamtoos and Sundays River from the SA Department of Water Affairs hydrology service, SADW, and combined to understand the coastal hydrology.
Bias was examined via intercomparisons between SADCO SST and wind speed and the satellite-era reanalyses (CFSR-2, ECMWF-5, MERRA-2). These show coherent cross-shelf gradients (see Fig. A1), indicating they capture the inshore upwelling. The reanalyses diverge at the coast, depending on resolution and land–sea ratio.
The statistical method used to quantify marine climate change is linear regression of a trend line over a long record of temporal data using the Pearson product moment least squares technique. The resultant slope and r2 fit of the regression line provide a statistical way of determining the rate of change or trend (signal) within the interannual fluctuations (noise). The temporal data are filtered to annual and area averages according to the insights required.
Linear trends are spatially analyzed per grid point in three domains: large-scale map for 45–20∘ S, 10–50∘ E; regional-scale map for 32–37∘ S, 20–30∘ E; and depth sections over the shelf at 37–33∘ S averaged over 24.5–26.5∘ E. Local trends are calculated by regression onto time series averaged over the index area (35.5–33.5∘ S, 24.5–26.5∘ E; Fig. 1a) after reduction to annual and seasonal (December–February) averages. For example, a sea temperature warming of 3 ∘C over 100 years yields a 0.03 ∘C yr−1 slope, which is mapped in relation to adjacent regression-fitted slopes. If year-to-year fluctuations reduce the r2 fit below a certain statistical threshold, then it is inferred that the signal is swamped by noise. Trends for U, V, and W wind and current components are calculated separately and combined into “trend” vectors that represent the slope or rate of change as maps and sections. The r2 fit of the trend is evaluated for significance at 95 % confidence. For long-term records having >100 degrees of freedom, a meaningful outcome requires r2>4 % (). For satellite-era records having <40 degrees of freedom, thresholds are reached at r2 >9 % (). Trends are embedded in noisy marine environments and therefore depend on time span, local climate variability (Schlegel and Smit, 2016), and quality of the input data (Chaudhuri et al., 2013). The CFSR-2, ECMWF, and MERRA-2 reanalyses exhibit similar trends (Kennedy et al., 2011; Decker et al., 2012) and yield comparable turbulent fluxes around South Africa (Nkwinkwa et al., 2019).
The trends of SST and zonal winds are analyzed by correlating the slope against its time series for each month. For most variables the index area is 35.5–33.5∘ S, 24.5–26.5∘ E (Fig. 1a); for SST the coast (33.8∘ S) and shelf edge (35.0∘ S) are distinguished. The resultant correlation values per month are plotted over the annual cycle to detect the seasonality of trends in the period 1980–2015.
Using 18-month filtered values, Hovmöller plots were constructed across the shelf to identify how intra-decadal fluctuations mingle with climate change signals. After exploratory statistical tests, a modulating influence was attributed to the Pacific southern oscillation index (SOI) or east–west difference in SLP. Its time score is analyzed for trends and correlated with local SST and zonal winds in annual and seasonal intervals for 1980–2015. Similarly, a dipole mode is extracted by EOF analysis of filtered ECMWF ESM projected SLP fields in the tropical Pacific, and temporal characteristics are studied.
Projections of air temperature, precipitation, and zonal winds from the coupled ensemble ECMWF ESM v2.3 (Taylor et al., 2012; Doblas-Reyes et al., 2018) are analyzed over 1980–2100 as large-scale trend maps and index area time series. The simulation is forced by the RCP8.5 greenhouse scenario (van Vuuren et al., 2011; CO2 +5 ppm yr−1) and incorporates data assimilation in the first 35 years that overlap with observations. Like most long-term projections, intra-member dispersion is constrained by ensemble averaging, and trends therefore emerge. The coupled ensemble Hadley ESM (Collins et al., 2011) is analyzed for zonal currents in the 0–50 m layer. Prior research found that this model is one of the few to realistically represent ocean “dynamic topography” and sea-level pressure fields around southern Africa (Dieppois et al., 2015). Its mean annual cycle of zonal currents closely follows the reference AVISO–Copernicus product (see Fig. A2).
An intercomparison of in situ measurements, reanalysis fields, and model simulations is covered in the Appendices; the above references provide insight on global validations. SADC ship SST and wind speed data averaged in 0.1∘ intervals describe the cross-shelf gradient in Fig. A1 compared with reanalysis at native resolution. The coarser long-term model and reanalysis products (see Table 1) underrepresent inshore upwelling, so outcomes are restricted to large-scale winds and rainfall. Annual cycle intercomparisons of index area SST and zonal wind for 1980–2015 are given in Fig. A2 and suggest that model seasonality is ∼ 10 % greater than observed. In Fig. A3, context is provided on regional SOI influence.
Lastly, the sea surface slope across the shelf is analyzed using 0.1∘ GODAS reanalysis data (Jamstec, 2009) at 25.85∘ E longitude separated into pre- and post-1990 periods, with the latter incorporating satellite altimetry. The sea surface height (SSH) is analyzed for rising levels using Port Elizabeth harbor observations and Hadley ESM projections, and linear regression trends are calculated.
Table 1Datasets used in the analysis; web sources are listed in the Acknowledgements.

3.1 Study area and large-scale trend maps
The study area is illustrated in Fig. 1a and shows steep topographic and bathymetric gradients, with >1000 m mountains at latitudes <33∘ S, the coast at 34∘ S, shelf edge at 35∘ S, and deep ocean to the south. The coastline is convex and indented by two bays and associated capes; the continental slope steepens eastward. The vegetation trend map (Fig. 1b) reflects a warming rate of 0.1 ∘C yr−1 since 1980 that increases northwest inland in conjunction with potential evaporation losses (−0.005 mm d−1 yr−1). The coastal cities of Port Elizabeth and East London have slower rates of warming. The coarse-scale ECMWF-20C trend maps for SST and zonal wind (Fig. 1c, d) reveal a warming of 0.02 ∘C yr−1 in the Agulhas Current retroflection and reduced values in the subtropical zones where easterly winds accelerate over 1900–2010 ( m s−1 yr−1), consistent with Dlomo (2014). Easterly winds have accelerated in the South Atlantic and south Indian anticyclones as well as over the interior of southern Africa, but in the southern midlatitudes a westerly trend is noted over the 20th century.
The ECMWF-20C trend map for precipitation minus evaporation (Fig. 1e) indicates a growing deficit in the Mozambique Channel, the source region of the Agulhas Current (Fig. 1f). Weaker deficits are noted over the South Atlantic, while weak surplus trends are found over the eastern highlands of South Africa and at south Indian Ocean midlatitudes. The shelf-edge Agulhas Current converges and accelerates just east of the study area, then fans out and retroflects (Lutjeharms, 2006).
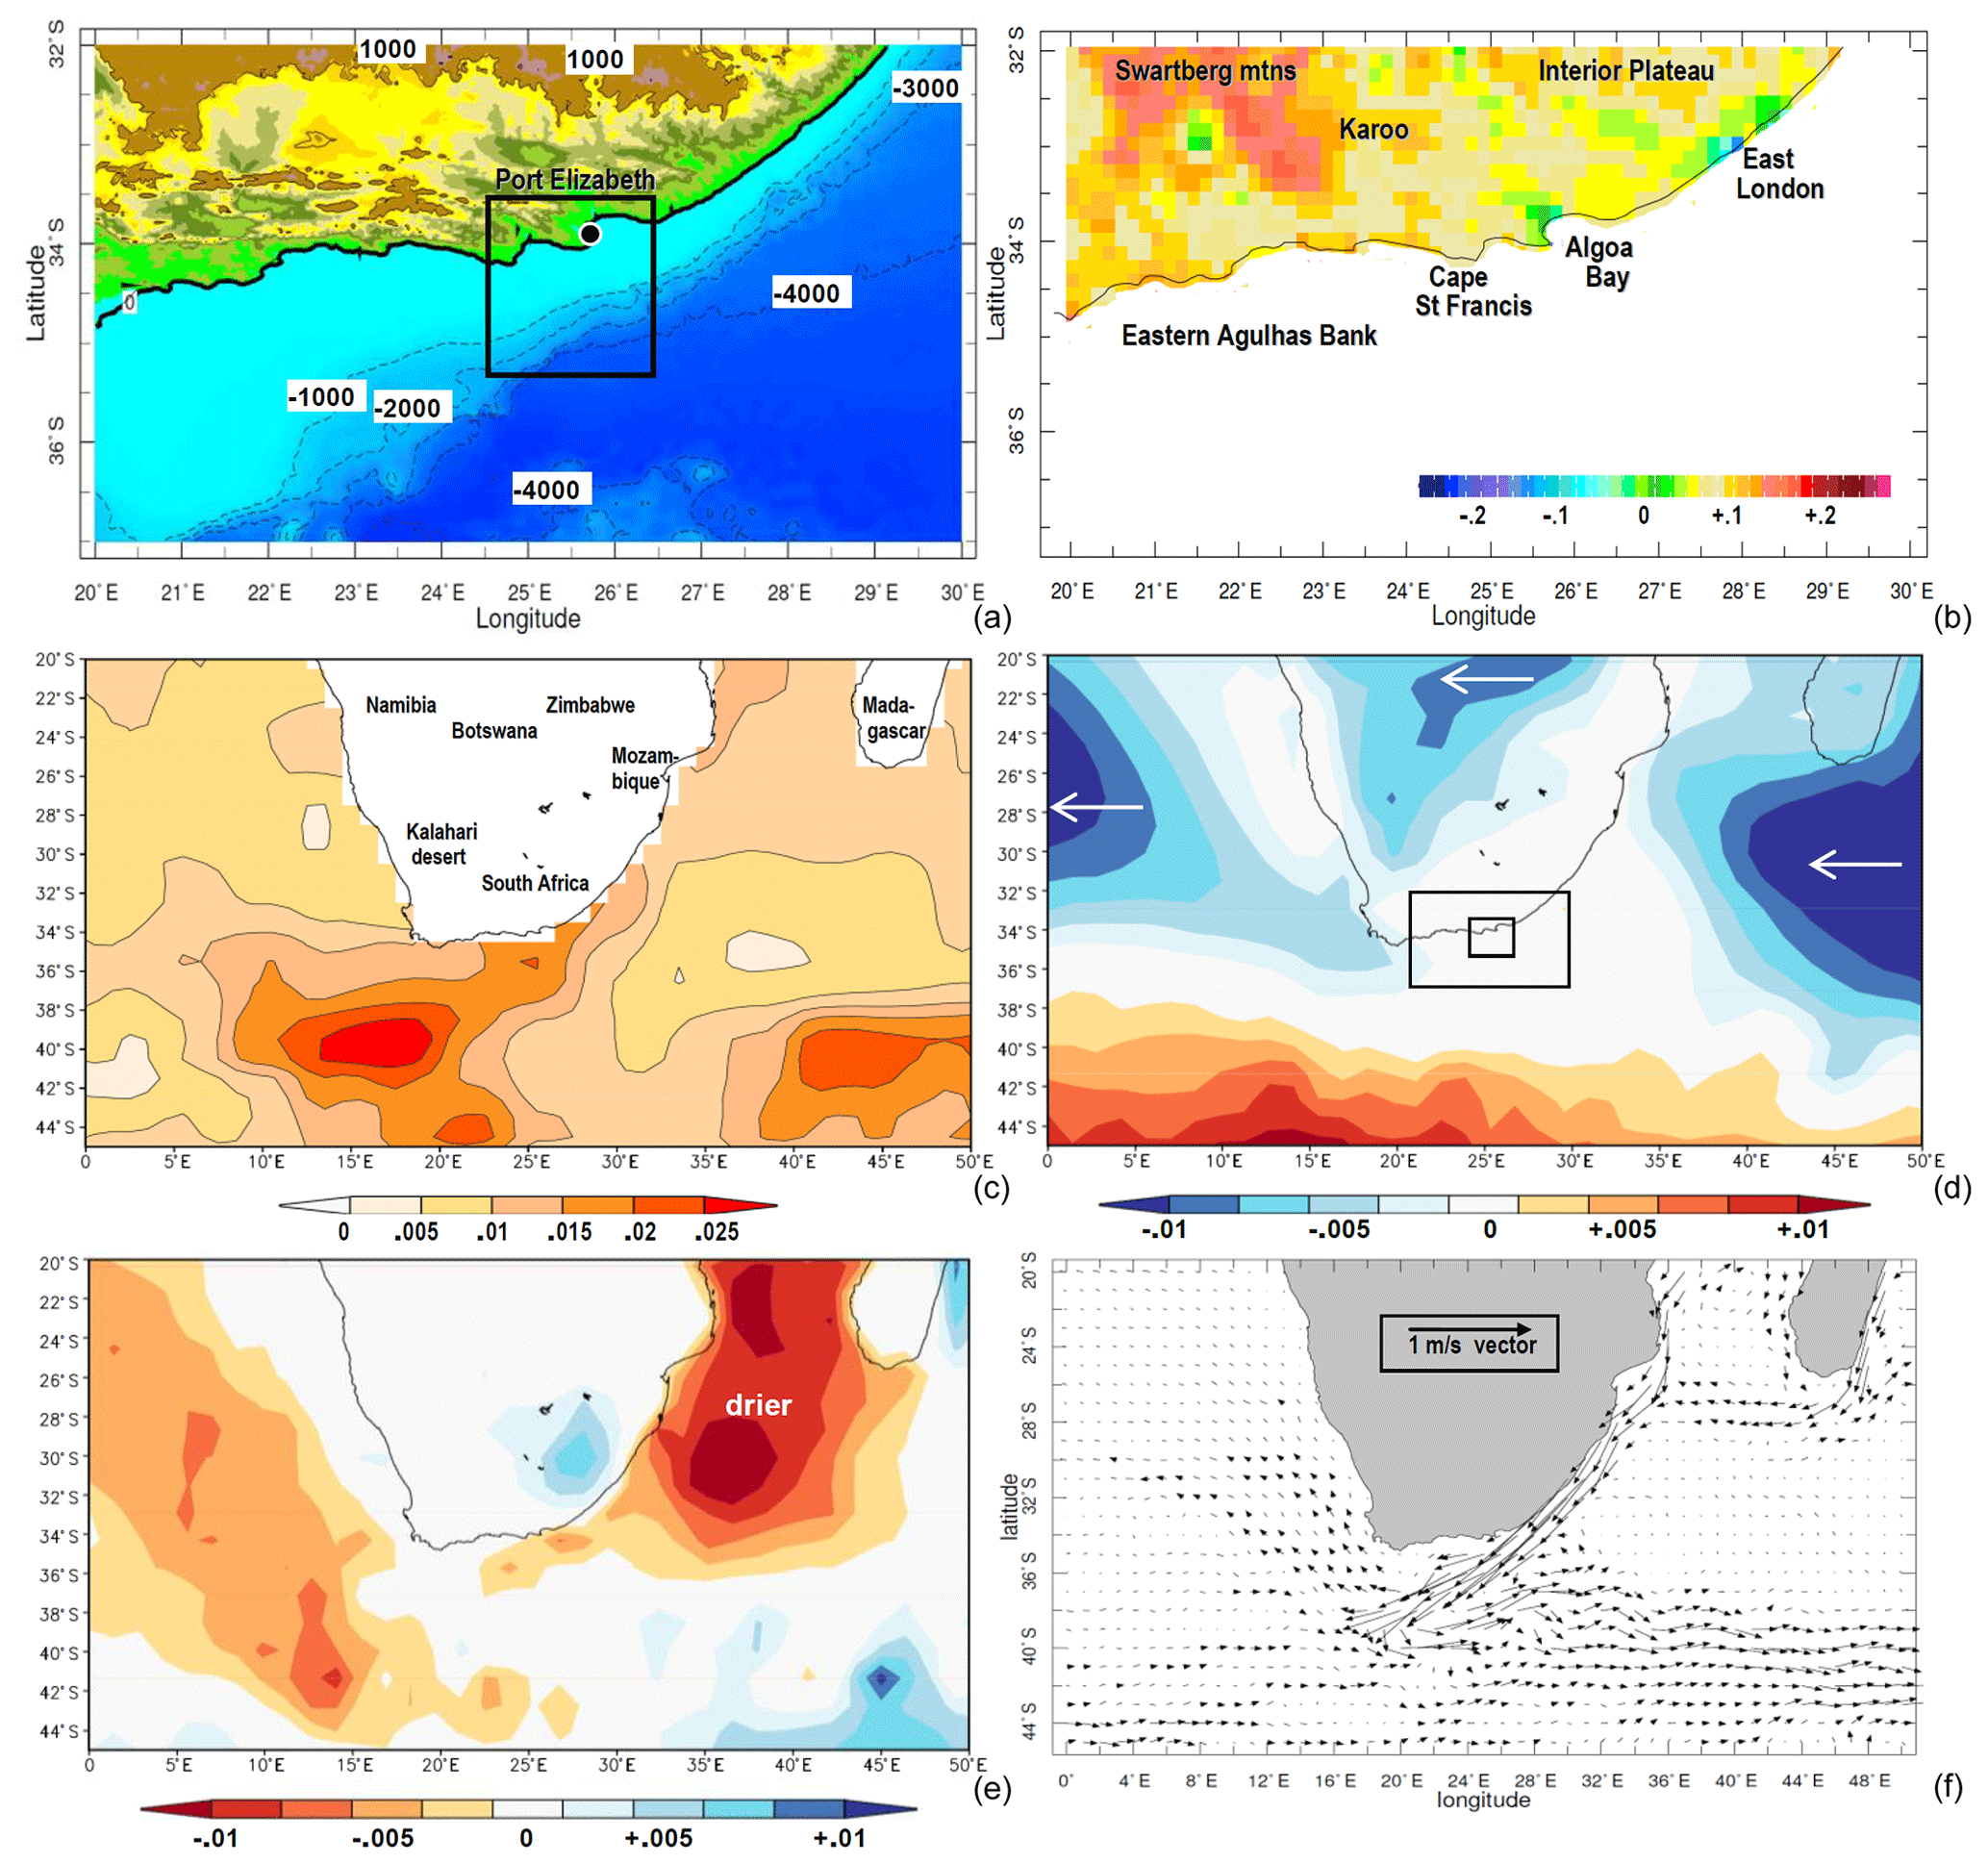
Figure 1(a) Topography and bathymetry of the study area with an index for temporal analyses (box) and Port Elizabeth (dot). (b) Linear trend in annual NOAA vegetation temperature (C yr−1, 1981–2016). Large-scale trends in annual (c) Hadley SST (C yr−1, 1900–2016), (d) ECMWF-20C zonal wind (m s−1 yr−1, 1900–2010) with inner study domains, and (e) ECMWF-20C precipitation minus evaporation trend (mm d−1 yr−1). (f) SODA3 mean 1–100 m currents (vector, with scale inset). Geographical labels are given in (b) and (c).
3.2 Regional ocean trend maps and sections
The NOAA SST trend map shows warming ∼ 0.05 ∘C yr−1 along the shelf edge for 1981–2016 (Fig. 2a), similar to Rouault et al. (2010), and cooling of −0.03 ∘C yr−1 inshore. Trends in SODA-3 salinity are weakly positive along the coast in the period 1980–2015, suggesting reduced river runoff and greater evaporation. Surface layer flow is accelerating in the shelf-edge Agulhas Current, particularly downstream of the study area (Fig. 2c). Outside the current, a pair of gyres (36∘ S, 25 and 29∘ E) directs flow toward the coast. This onshore pattern has little context and may be set aside until confirmed elsewhere.
SODA-3 depth section trends (Fig. 2d, e, f) show that the warming trend at the shelf edge is aligned with a locally accelerating Agulhas Current ( m s−1 yr−1 at 35.3∘ S; Backeberg et al., 2012). The cooling trend along the coast is confined to a shallow layer <40 m and would accentuate the gradient. Trends in the meridional circulation reveal upwelling at depth and offshore transport in the nearshore zone. There is a sharp transition to downwelling and onshore transport seaward of 35.6∘ S. Taken together the trend is for convergence onto the Agulhas Current and faster downstream advection at the shelf edge. Trends in the Agulhas Current are relatively uniform over depth (see Fig. 2e), suggesting that cyclonic-vorticity-induced uplift is locally concentrated by the shelf slope (see Fig. 2f).
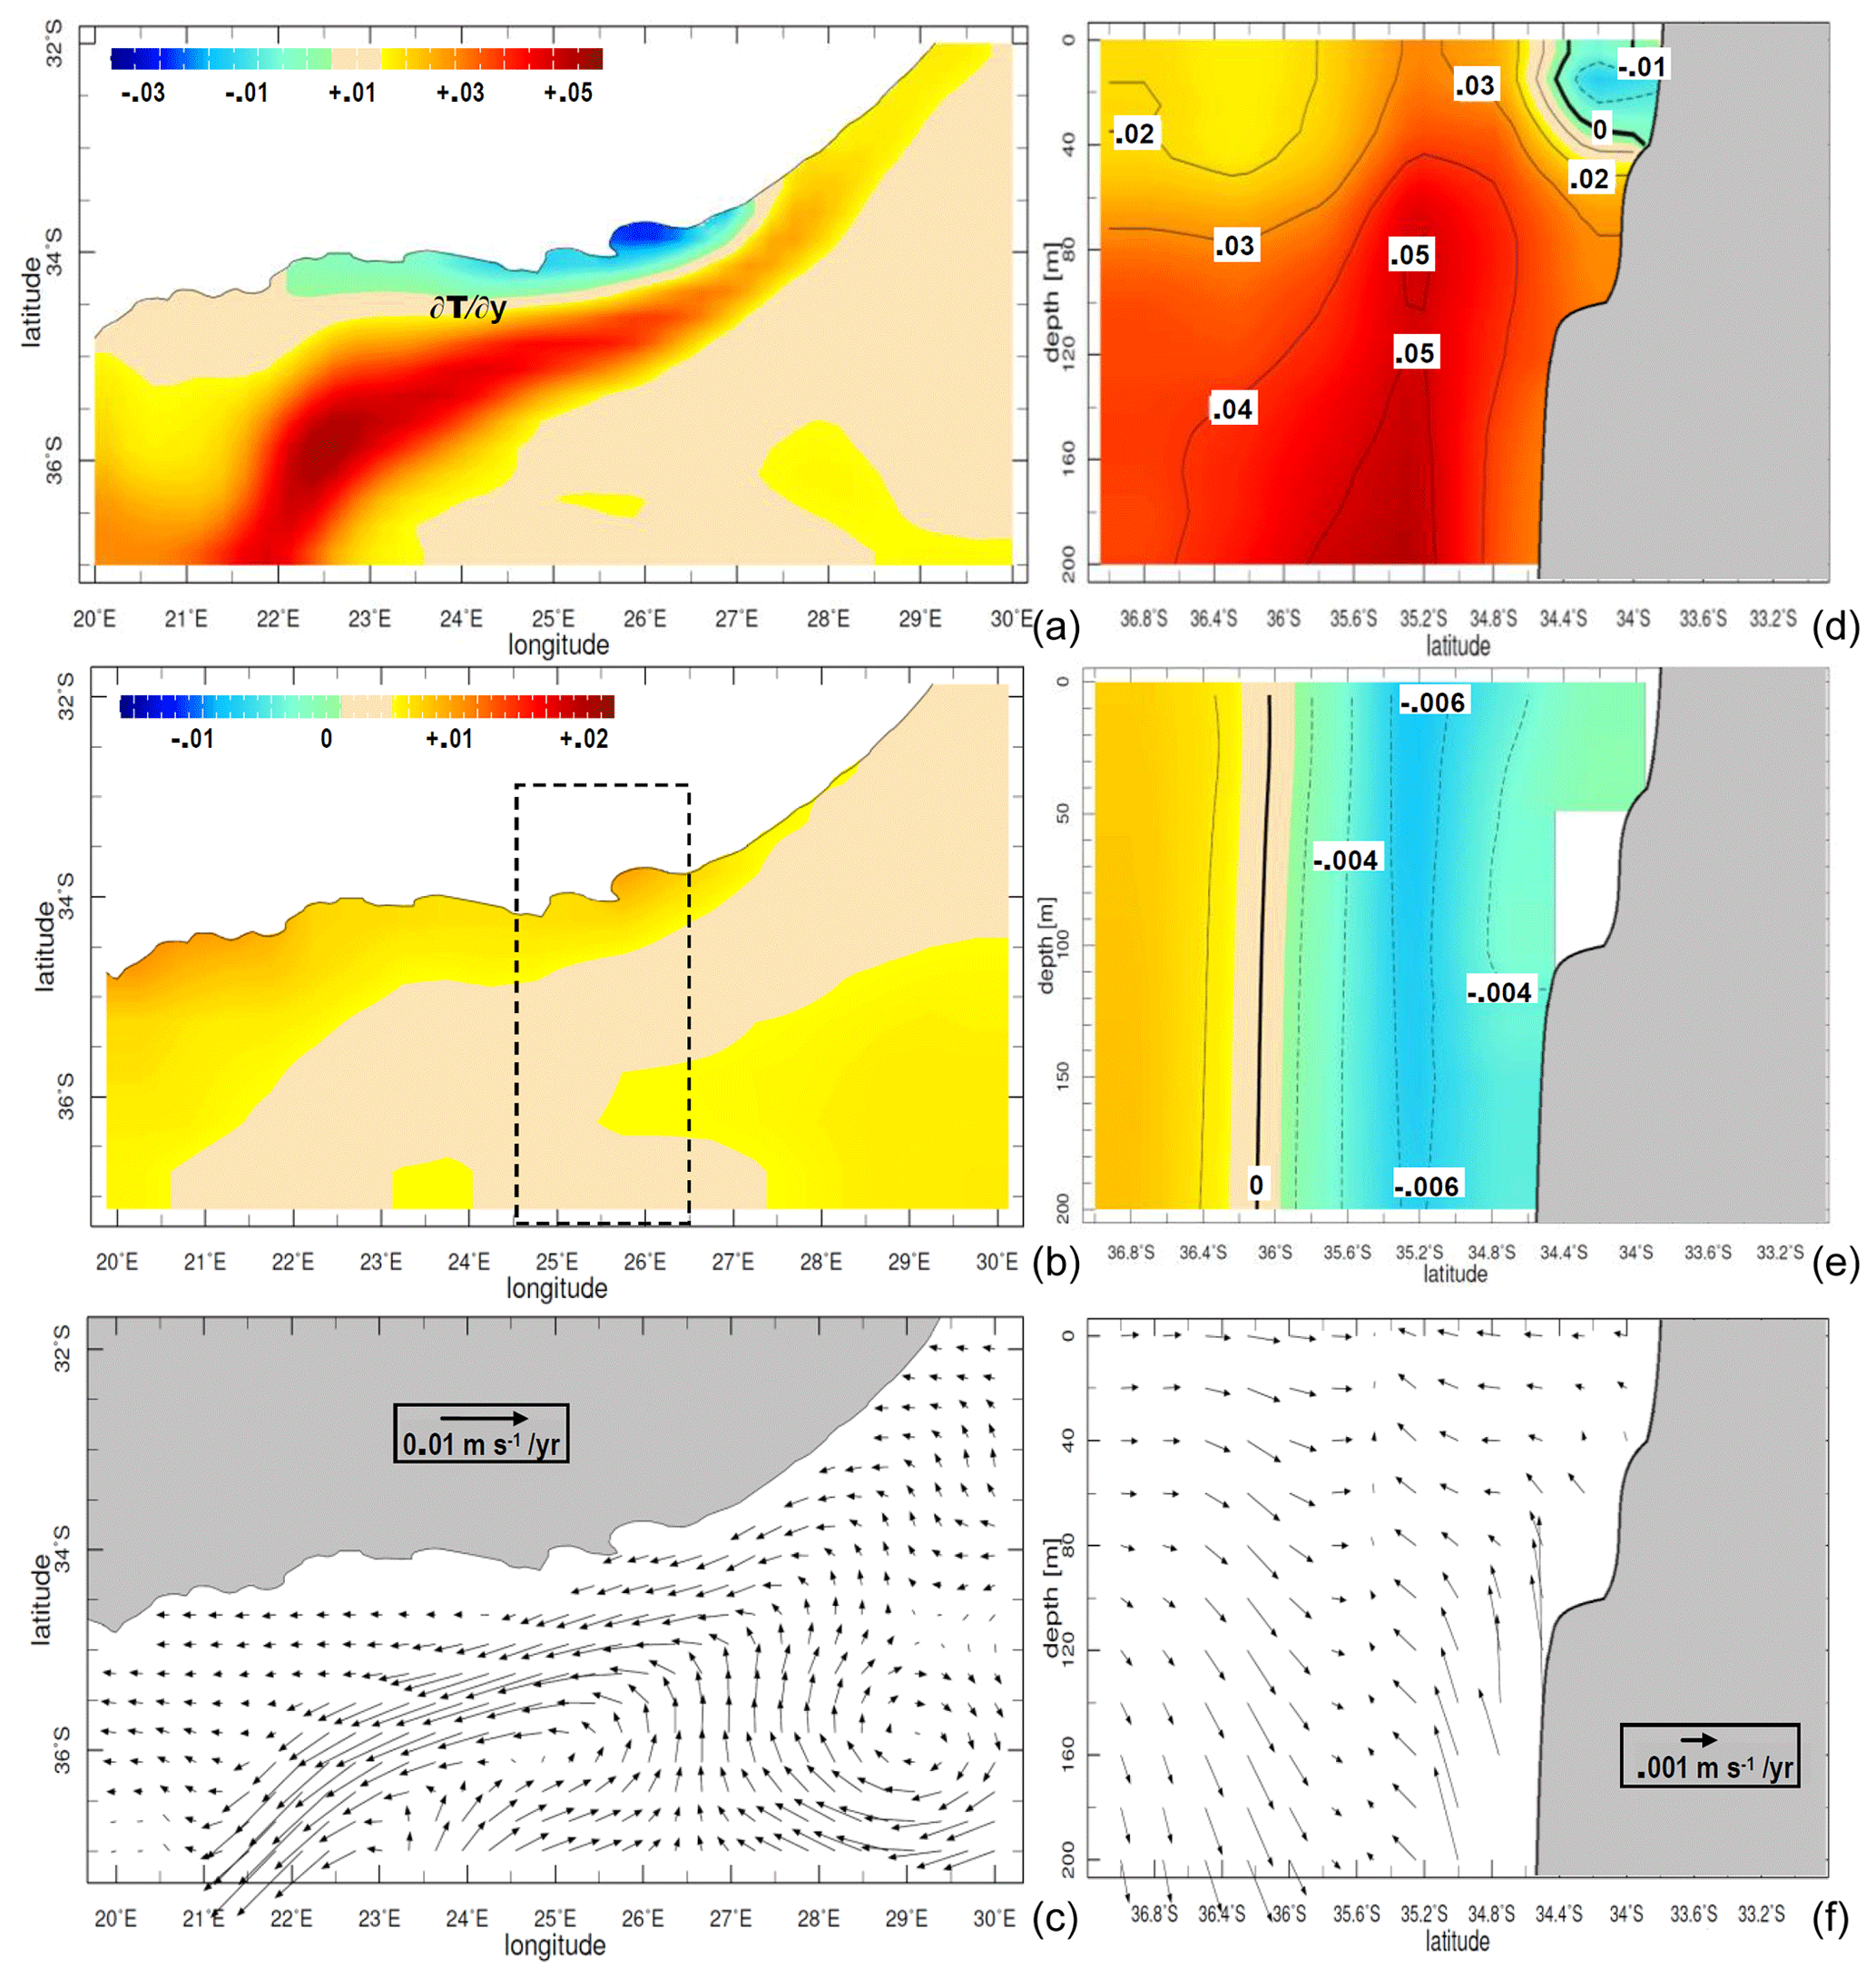
Figure 2Regional trends in annual (a) NOAA sea surface temperature (C yr−1, 1981–2016) and SODA-3 for 1980–2015: (b) 1–10 m salinity (ppt yr−1) with section denoted, (c) 1–50 m currents (m s−1 yr−1 vector) and depth section averaged over 24.5–26.5∘ E for (d) sea temperature (C yr−1), (e) zonal current (m s−1 yr−1), and (f) meridional circulation (m s−1 yr−1 vector, with W exaggerated). Vector scales are inset.
3.3 Regional wind and pressure trends
Trend maps are illustrated for reanalysis winds and latent heat flux in Fig. 3a and b. Winds show a distinct shift toward easterly winds for 1980–2015, linking the South Atlantic and south Indian anticyclones. The wind trends follow the convex coastline and divide zones of rising and falling latent heat flux, consistent with the SST trends (see Fig. 2a). A trend toward northeasterly winds and reduced moisture flux over land promotes a hydrological deficit.
Regional atmospheric circulation trends were studied via EOF analysis of December–February daily SLP data. This helps place the transient weather into long-term context. Mode 1 accounts for 38 % of the variance (Fig. 3c, d). Its loading pattern shows a midlatitude anticyclone passing eastward over a 5 d period, followed by a trough along the west coast that subsequently spawns a coastal low. The mode 1 time score shows fluctuations within an upward trend (slope 0.008 hPa yr−1, r2=11 %), indicating more frequent anticyclonic ridging. The gradual poleward shift of the subtropical wind belt is comprised of pulsed synoptic weather.
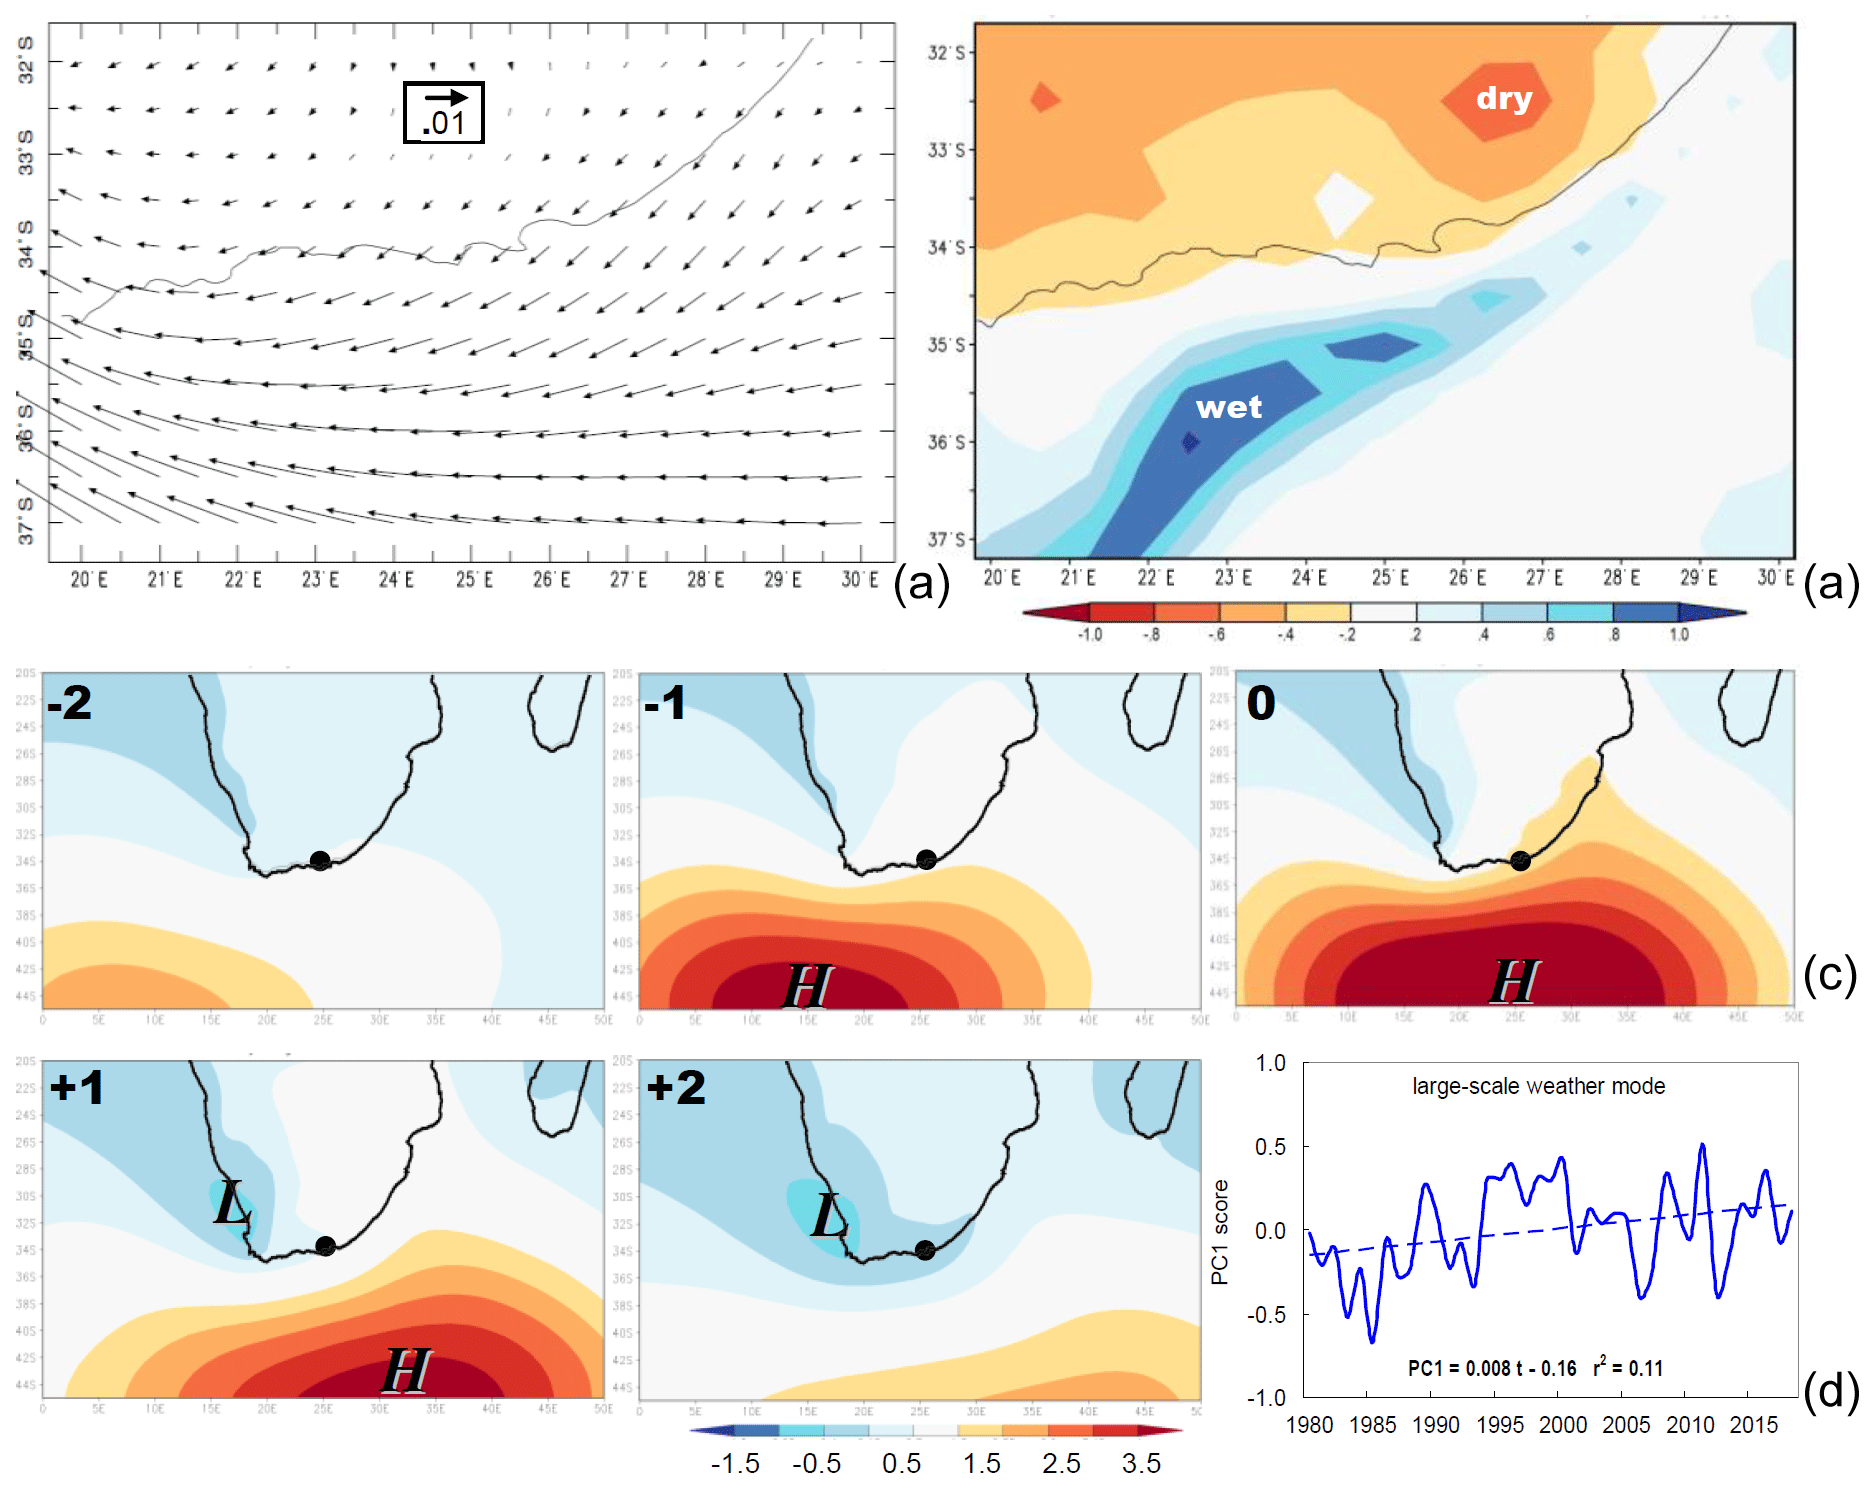
Figure 3(a) Regional trend in annual CFSR-2 surface wind (m s−1 yr−1 vector, 1980–2015) and (b) latent heat flux (W m−2 yr−1). (c) Large-scale summer weather mode 1 in daily ECMWF sea-level air pressure principal component loading pattern at lags −2, −1, 0, +1, and +2 d (hPa) along with the (d) time score. PC1 represents 38 % of the variance, and the dot in (c) is the study area; the inset in (d) is the slope and fit of the linear regression.
3.4 Shelf analysis and gradients
Hovmöller plots were constructed across the southern shelf (Fig. 4a–d) for 18-month filtered SST, zonal winds, currents, vertical motion, and rainfall. There is a multiyear alternation of warm and cool spells, modulated by local winds, the Pacific El Niño–La Niña (Jury, 2015, 2019), and the Southern Annular Mode (Malan et al., 2019). There is a background trend of inshore cooling and offshore warming that intensifies the coastal gradient (Fig. 4a). The SST pattern is supported by Ekman transport from inshore easterlies and offshore westerlies that pulse in 1992 and 2013 (Fig. 4b). Rainfall (Fig. 4c) displays a sharp boundary at 34.5∘ S between dry inshore and wet offshore climates. Coastal upwelling and atmospheric subsidence suppress moist convection, whereas the Agulhas Current enhances marine rainfall ∼ 3-fold. The sharp change in the CHIRP rainfall regime at 34.5∘ S coincides with accelerated longshore winds. The Hovmöller plot of SODA-3 near-surface zonal currents (Fig. 4d) reveals pulsed intensification and a coastward shift, contributing to nearshore uplift of >4 m d−1 (34.1–34.4∘ S). Current- and wind-induced upwelling appear additive much of the time. However, in 2013 currents prevailed over winds, suggesting occasional decoupling.
Index area time series of reanalysis and projected near-surface zonal currents (Fig. 4e) show a trend of local acceleration. Past and future linear regression slopes are −0.0076 m s−1 yr−1, with trend correlations rising from −0.81 to −0.90. Future (second-order) trends overlie those from past reanalysis, and year-to-year fluctuations are consistent despite technology artifacts of satellite altimetry and ensemble averaging. Appendix A2 compares the index area annual cycle of the model vs. observations. This index area covers much of the Agulhas Current at longitudes at which the shelf is convex (see Figs. 1a, 2e).
The trend of NOAA SST analyzed at coastal and shelf-edge latitudes show contrasting values but little change over the annual cycle in Fig. 5a. Shelf-edge waters are warming steadily (), while coastal waters are cooling (), more so from February to May (slope −0.04 ∘C yr−1). Together these indicate a tightening gradient () and a steepening sea slope (see Fig. A4a). The annual cycle of index area zonal wind trends (Fig. 5b), averaged over three reanalyses, reveals that easterly winds are intensifying during summer (November–February) when subtropical ridging is most likely.
Regression of SST and winds onto the southern oscillation index (Fig. 5c, d) reveals trend patterns similar to climate change: inshore cooling (mainly summer) and offshore warming (all year). Winds with respect to high-phase SOI are from the northeast and considerably stronger in summer; hence, wind-driven coastal upwelling is favored during La Niña. The southern oscillation index has shown an upward trend during the satellite era, and its regression onto regional sea-level air pressure patterns (see Fig. A3) matches the earlier mode 1 pattern of the midlatitude high and subtropical low (see Fig. 3c). Hence, long-term and multi-decadal trends tend to conspire.
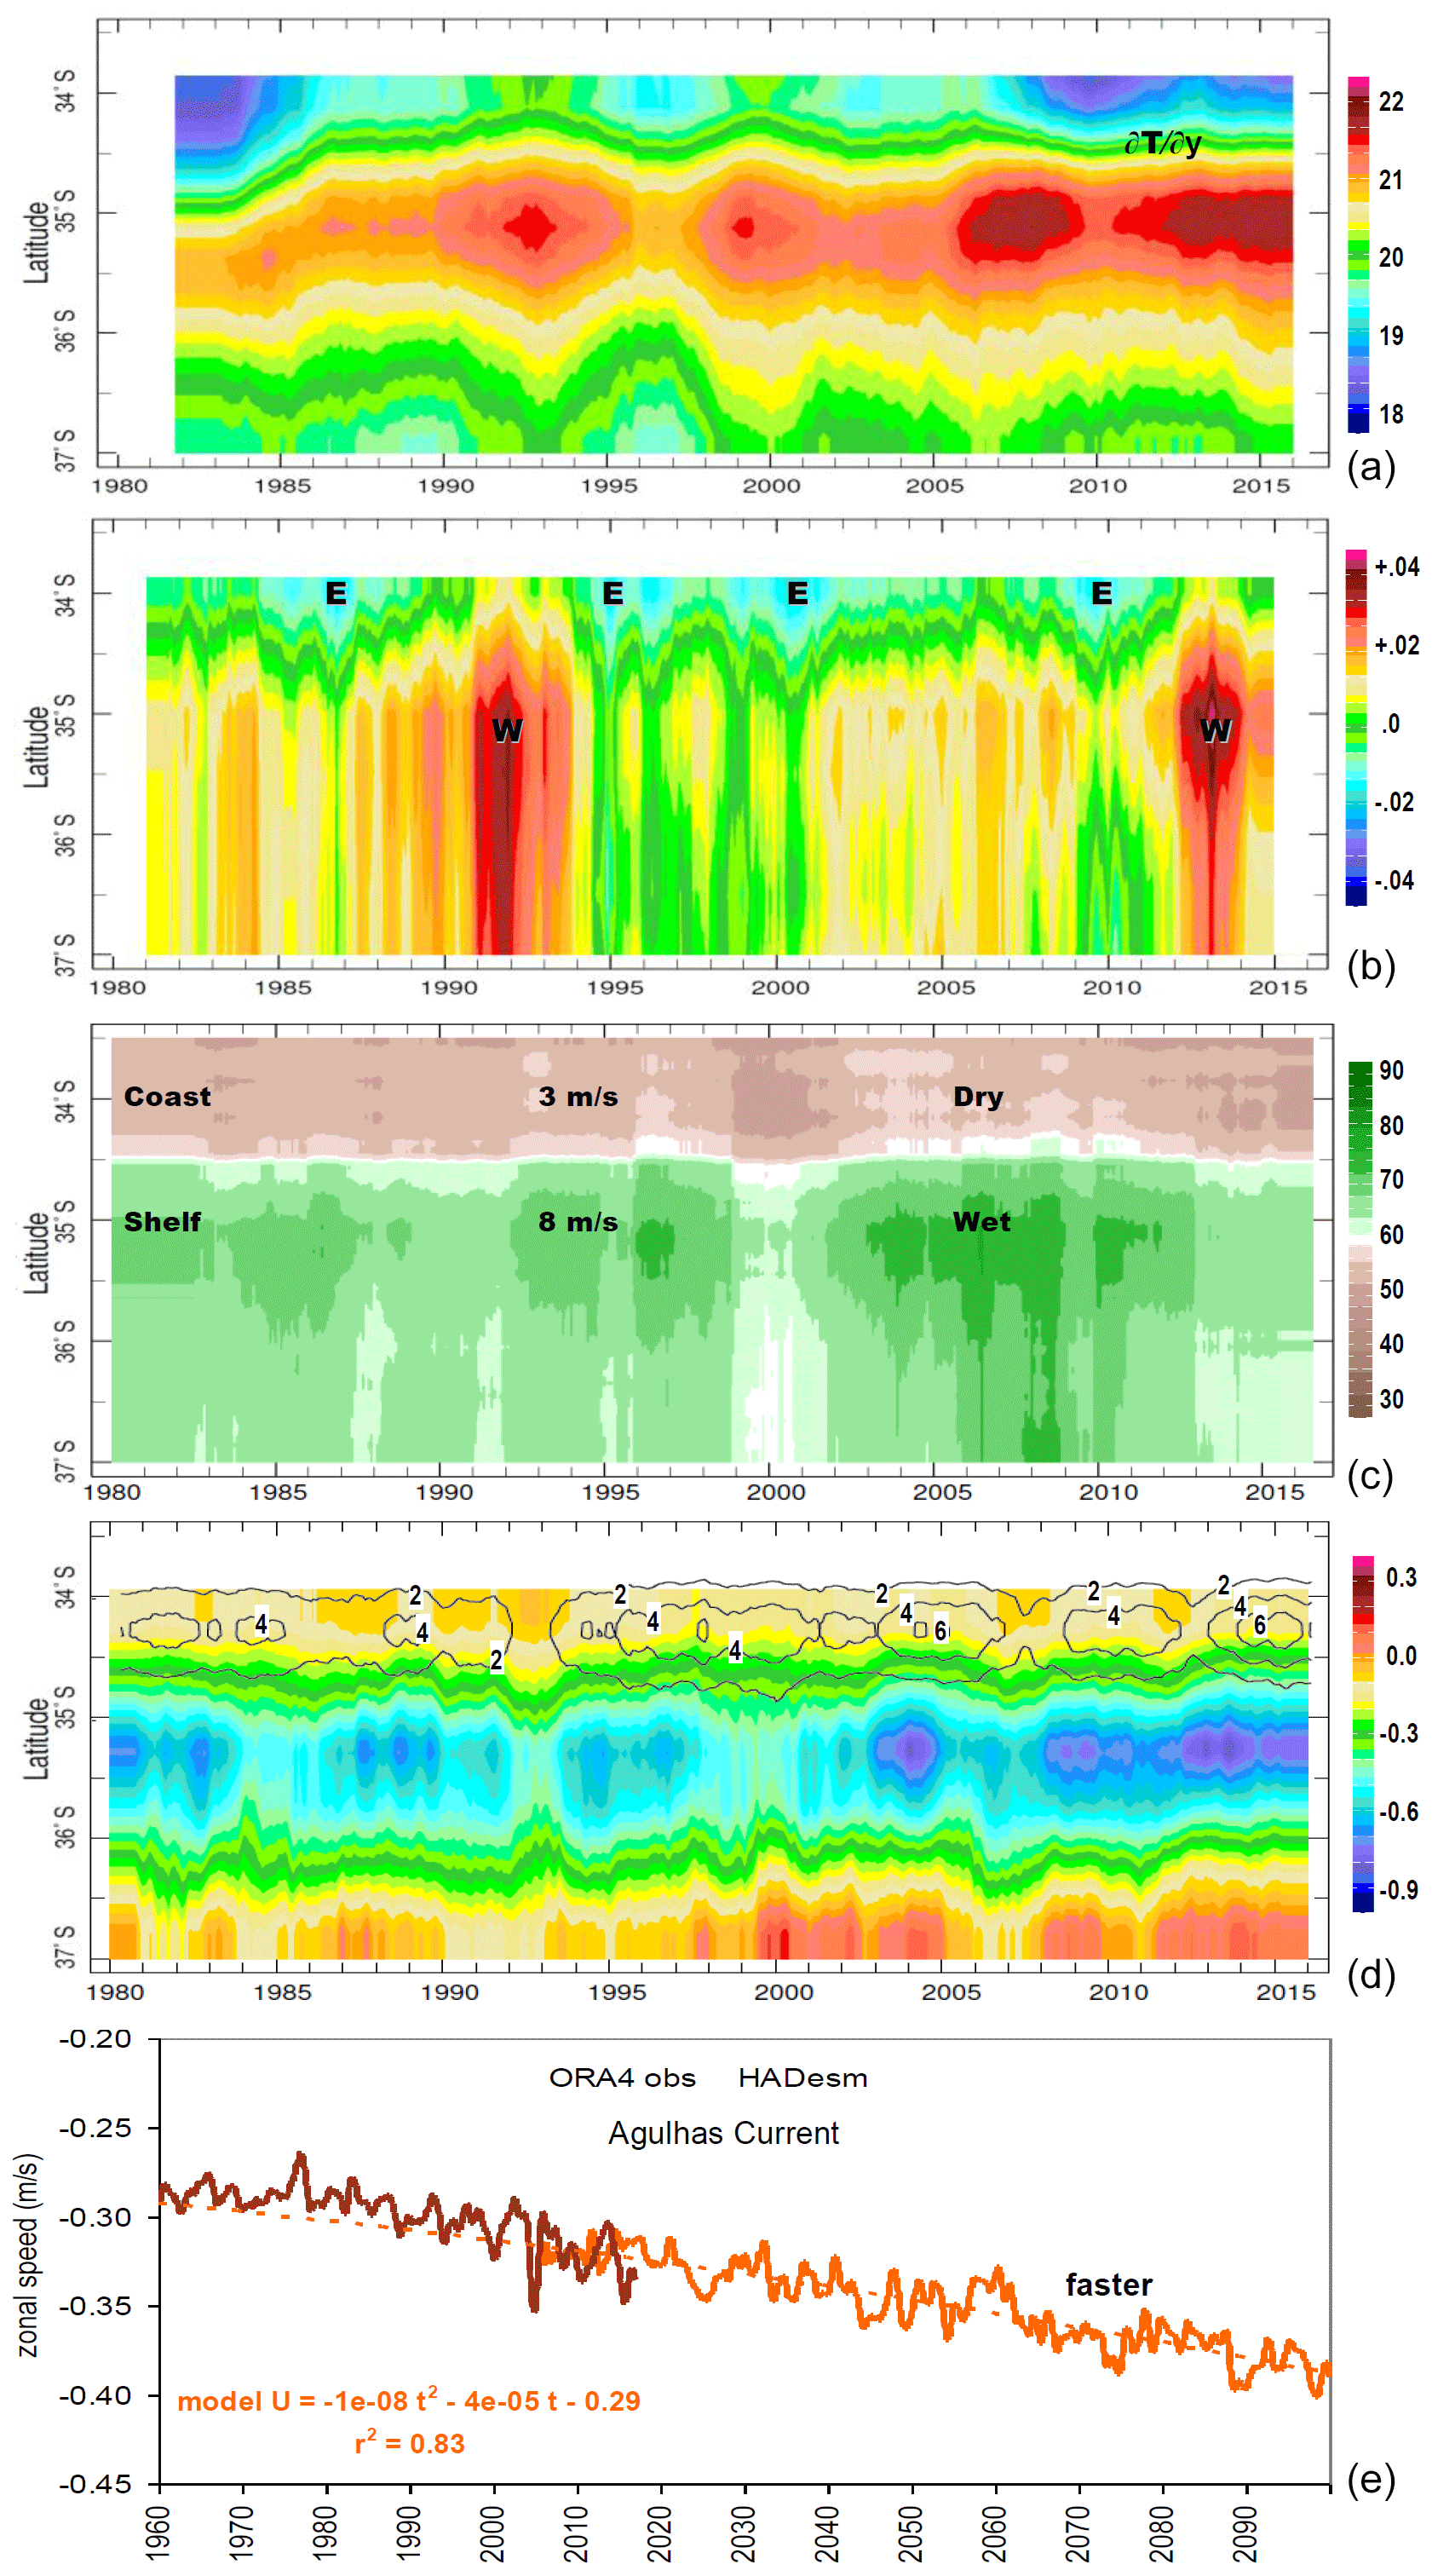
Figure 4Hovmöller plots of 18-month filtered variables averaged over 24.5–26.5∘ E: (a) NOAA SST (C), (b) zonal wind stress (N m−2), (c) CHIRP rainfall (mm per month), (d) SODA-3 1–50 m zonal current (shaded, m s−1), and 1–200 m upward motion (contour, m d−1). (e) Index area time series of observed and projected 1–50 m zonal current. Coastal and shelf climates as well as average wind speeds are labeled in (c).
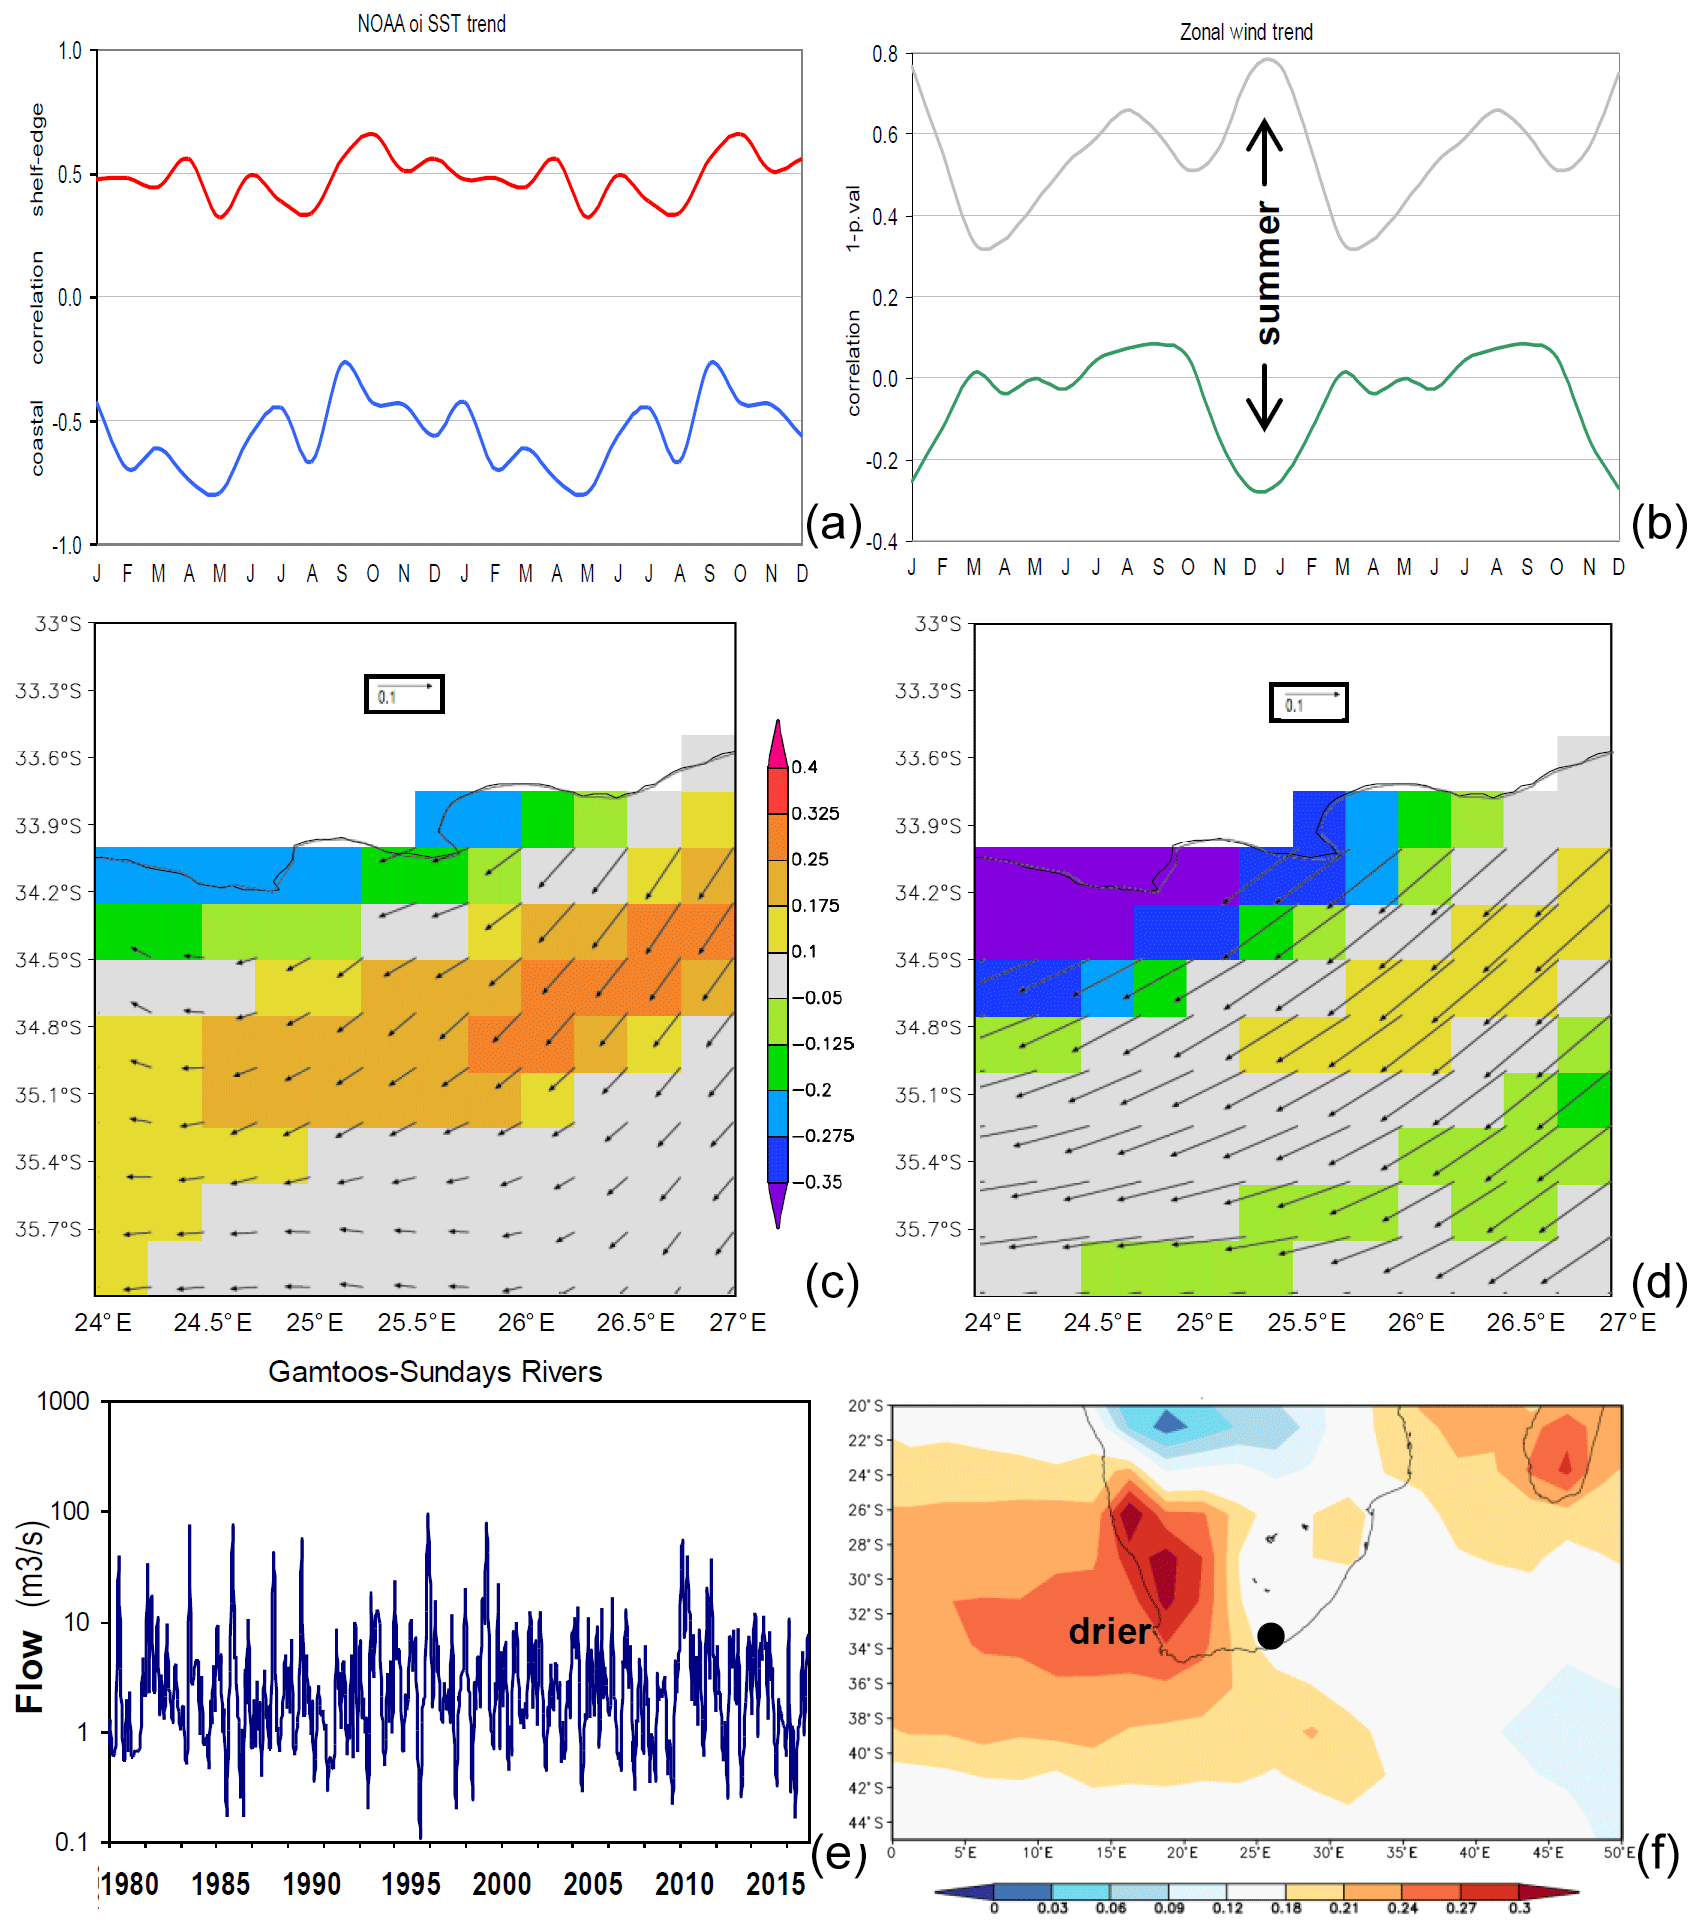
Figure 5Analysis of monthly index area trends for (a) coastal and shelf-edge SST, as well as (b) zonal wind and its significance (1-p value), with 35 degrees of freedom. Regression of (c) annual and (d) summer NOAA SST (shading ∘C) and SODA-3 surface wind (vector, scale inset, m s−1) with the SOI for 1981–2016 (units are per SOI fraction). (e) Observed discharge of the combined Gamtoos and Sundays rivers. (f) Trend of NOAA net outgoing longwave radiation as a proxy for cloudiness (W m−2 yr−1, 1979–2017), with a dot showing river gauges.
3.5 Hydrology trends
The increasing nearshore salinity (see Fig. 2b) could be related to drying trends in the adjacent terrestrial climate (see Fig. 3b). In Fig 5e the regional hydrology is studied using the combined Gamtoos and Sundays River discharge record. Although flood and drought events as well as 2–5-year cycles are evident, there is little trend. The study area lies between a zone of reduced cloudiness (Benguela – Namib) to the northwest and increased cloudiness to the southeast, as seen in the trend map for satellite net OLR (Fig. 5f). The rising salinity off the south coast (see Fig. 2b) may be attributed to advection from the Mozambique Channel, where evaporation exceeds precipitation (see Fig. 1e). Vertical motions over the shelf could also play a role (see Fig. 2f), whereby cyclonic shear lifts salty water.
The reported intensification of eddy variability (Backeberg et al., 2012; Elipot and Beal, 2015) suggests greater coast–deep-ocean exchanges over the eastern Agulhas Bank of South Africa. Those cross-shelf exchanges are orders of magnitude larger than the abovementioned river discharges and comparable to the along-shelf transports.
3.6 Model projections under greenhouse warming
Spatial maps of ECMWF ESM RCP8.5 trends for zonal wind and rainfall for 1980–2100 show a key feature southeast of the study area (Fig. 6a, b). Easterly winds are projected to increase and rainfall is expected to decrease. The warm moist air carried westward beneath a stable inversion layer generates less evaporation, so rain-bearing storms are projected to diminish in strength and be deflected poleward by the subtropical anticyclone.
Time series of index area values comparing ECMWF-20C reanalysis with ECMWF ESM and Hadley ESM projections are given in Fig. 6c–f. Coupled ensemble values overlie the observation-based product, indicating little bias but lower variance. Zonal winds that oscillate in a stationary manner through the 20th century tend toward easterly (−U) in conjunction with declining precipitation. Air temperatures show a gradual rise during the 20th century in both the reanalysis and overlapping simulations. Thereafter, the warming trend steepens due to the greenhouse scenario. There appears to be little moderating influence of cooler nearshore SST, which coarse-resolution products underrepresent (see Fig. 1c). The SOI time series is relatively stationary, but larger amplitude swings are noted in the early 20th and late 21st century. High-phase (Pacific La Niña) events seem steady but El Niño events appear to deepen after 2040. In summary, past zonal winds of 1 m s−1 (after cancellation of east–west components) are projected to reach −1 m s−1 by 2050. Past rainfall of 1.5 mm d−1 declines below 1 mm d−1, and air temperatures of 17 ∘C rise above 20 ∘C by 2050. The regression r2 fit of trends is in the range from 72 %–97 % and suggests sustained changes for temperature; however, wind and rain tend to oscillate in the ECMWF ESM projection until the RCP8.5 scenario prevails.
In addition to ENSO influence, the Southern Annular Mode (SAM) plays a role in the latitude and intensity of basin-scale anticyclonic gyres that support the Agulhas Current (Yang et al., 2016; Elipot and Beal, 2018). The long-term trend in the SAM is a contraction of circumpolar westerlies that enables poleward expansion of the tropical Hadley circulation and belt of easterly winds rounding the tip of Africa (see Figs. 3a, 6a). Yet SAM trends are flattening with recovery of the Antarctic ozone hole (Arblaster et al., 2011) and may exert less of an effect in the future.
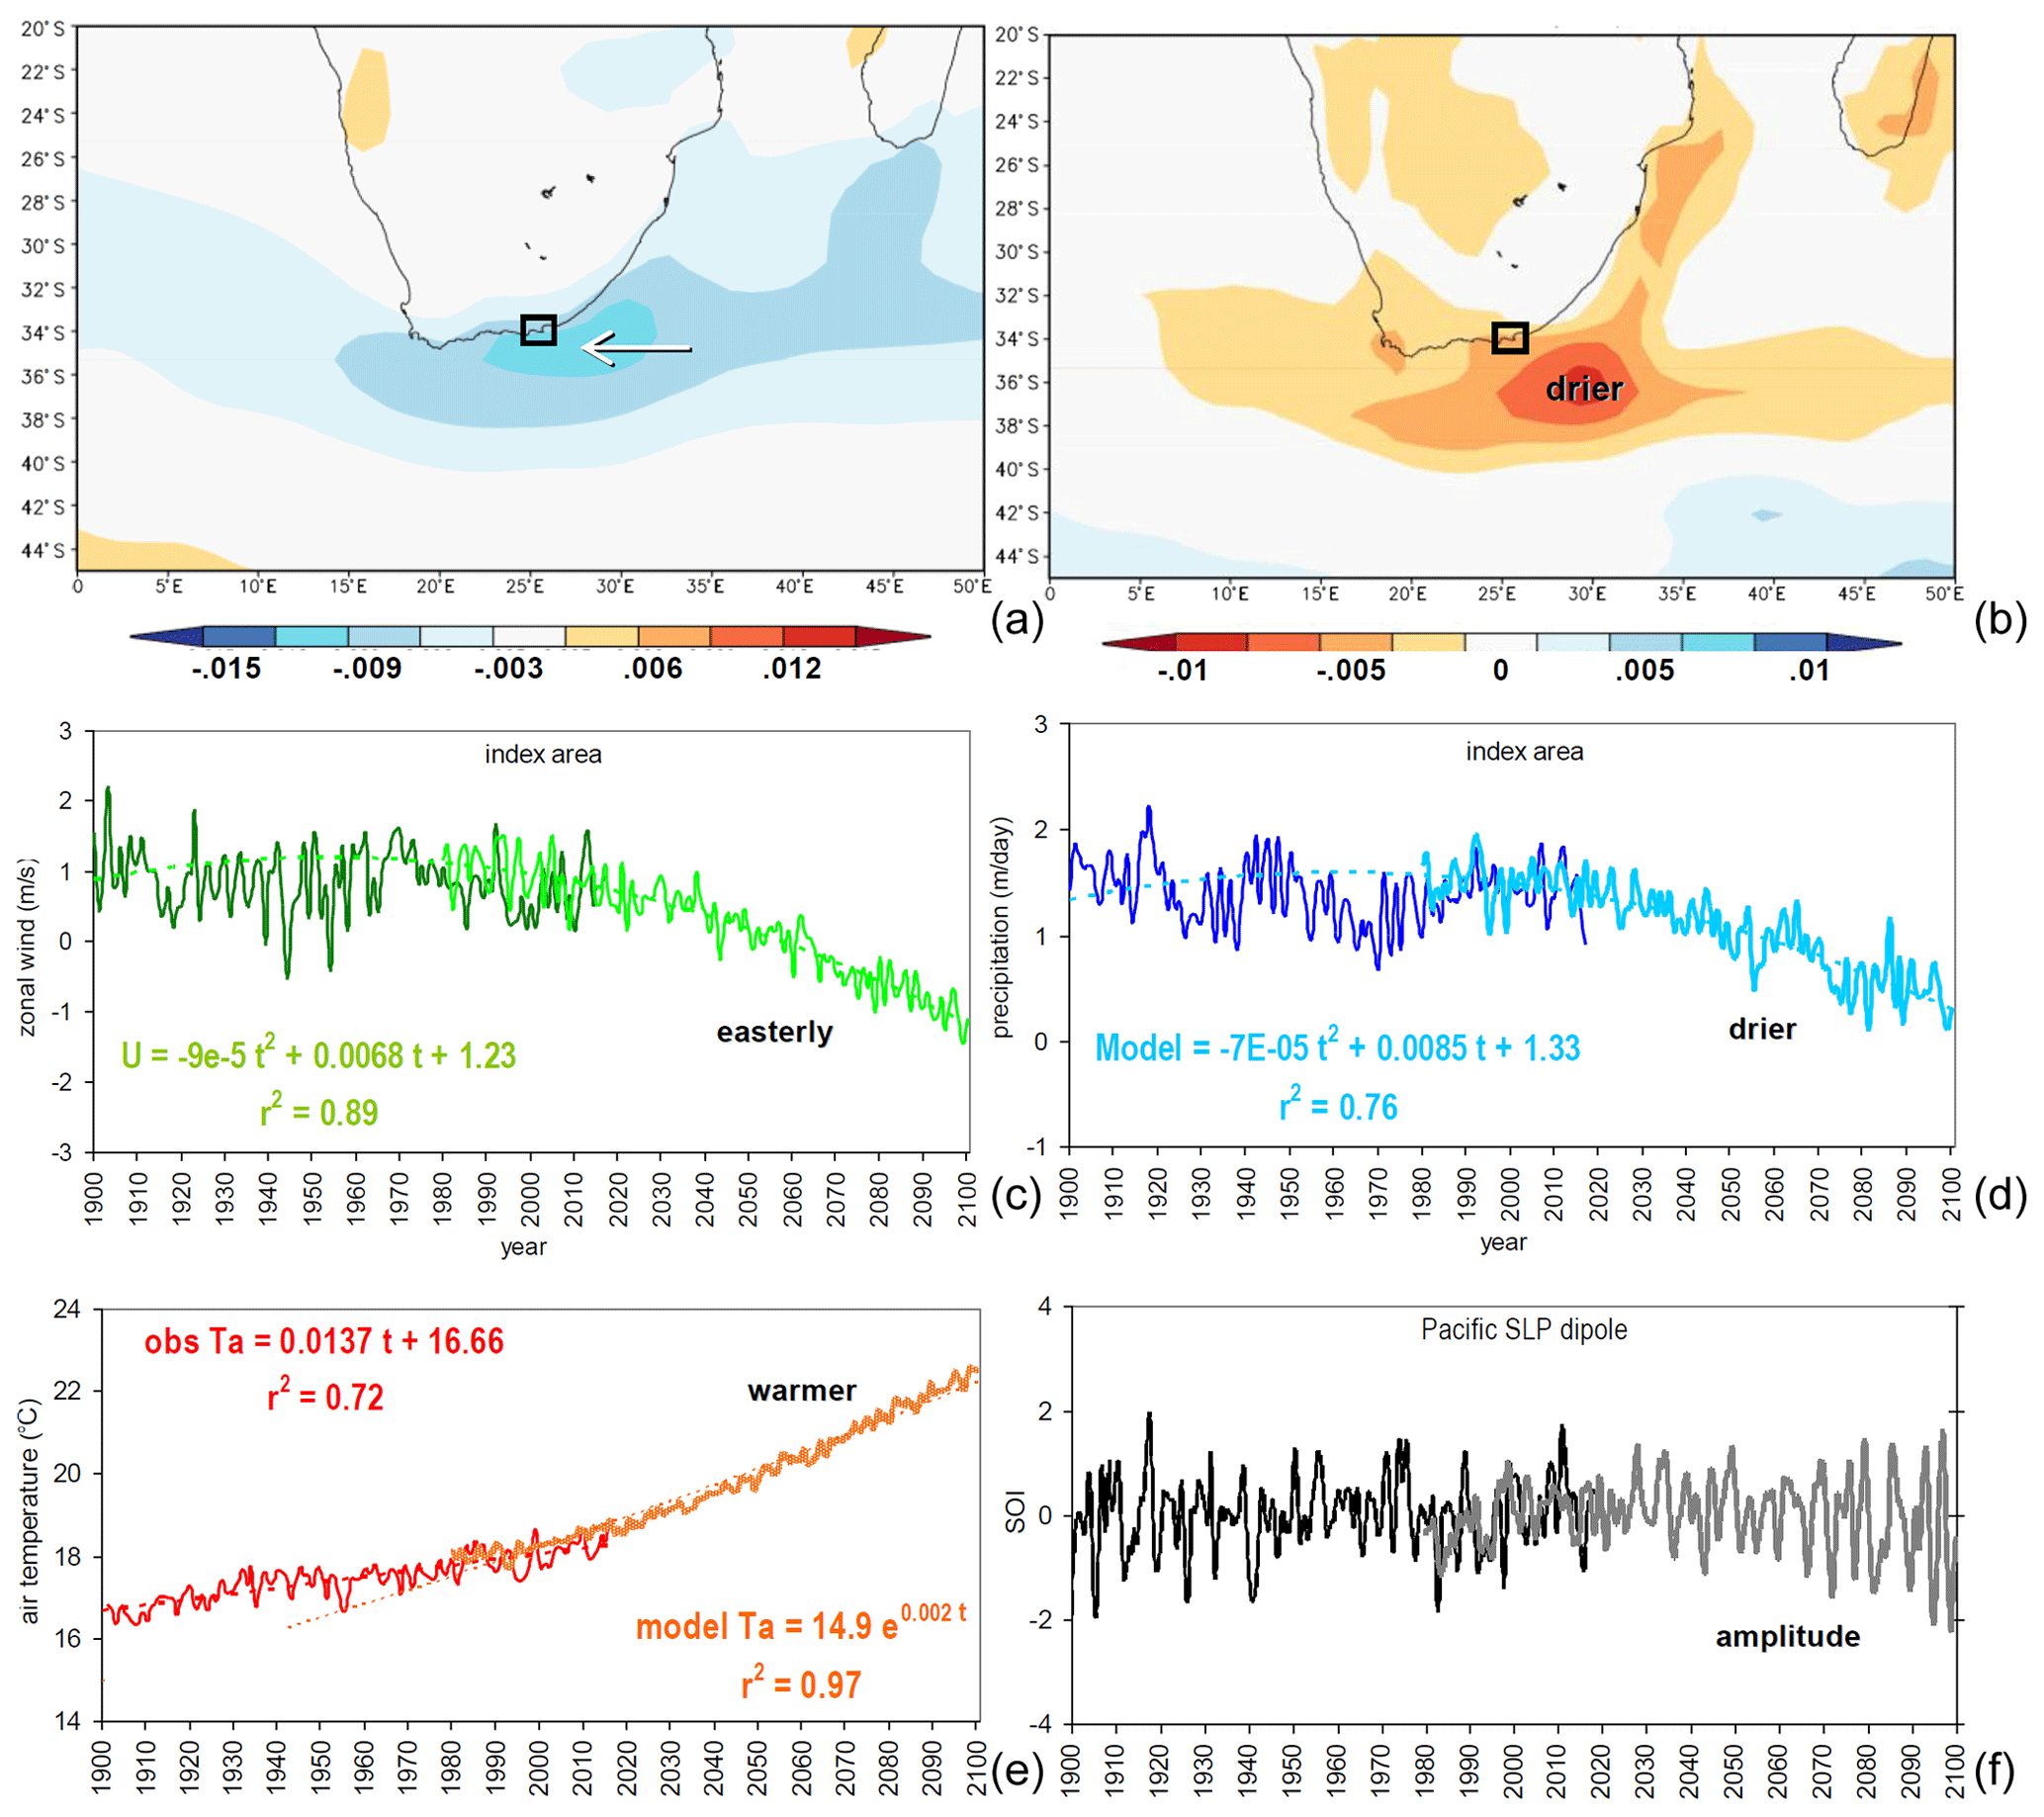
Figure 6EC ESM projected trend maps for 1980–2100: (a) zonal wind (m s−1 yr−1) and (b) precipitation (mm d−1 yr−1). Temporal record of index area ECMWF-20C reanalysis for 1900–2010 and EC ESM projected for 1980–2100: (c) zonal wind, (d) precipitation, and (e) air temperature. (f) Observed and model-projected Pacific southern oscillation index (east–west SLP EOF mode). Best-fit trends are given; time series are composed of annual averages.
This study addressed a range of questions regarding spatial patterns in trends and uncovered evidence of a pulsed poleward shift of the subtropical ridge (see Fig. 3c, d). Analysis of land–atmosphere–ocean conditions revealed intensified coastal upwelling from increased easterly winds. A steeper produces a locally faster shelf-edge current, with consequences for current-induced upwelling (Schumann and Beekman, 1984; Swart and Largier, 1987) and coastal desiccation. Employing coupled reanalysis and model projections to distinguish coastal and offshore features, a unifying pattern emerged: summertime wind-driven upwelling enhances geostrophic gradients and the Agulhas Current. Although ocean reanalysis outcomes are moving toward consensus based on a shared data assimilation system, interpretations need not favor one process over another: wind vs. current, fluxes vs. advection, multi-decadal vs. trend, or local vs. remote. Multivariate forcing is expected.
To place these results in context, trends in global SST were analyzed over the satellite era (not shown). Coastal upwelling zones show cooling ∘C yr−1 broadly off Peru at 5–25∘ S, California at 30–40∘ N, narrowly off Somalia at 10–15∘ N, Namibia at 35–20∘ S, and in the western Sahara at 15–30∘ N. Even shelf waters of the USA Carolinas at 30–40∘ N are cooling, and, like at the south coast of South Africa, there is a warm current offshore. Steeper gradients could produce faster shelf-edge flow, but the Gulf Stream is decelerating (Jury, 2020), unlike the Agulhas Current. Figures 2c and 4d give evidence of locally increasing westward currents off Cape St. Francis in ocean reanalyses and coupled model projections. Perhaps wind-driven eddies are broadening the Agulhas Current over multiyear periods, in addition to background trends (Elipot and Beal, 2018). International monitoring efforts such as the ASCA line (Morris et al., 2017) could resolve ambiguities arising from the extrapolation of short-term records. The analysis herein does not indicate that the whole Agulhas Current is strengthening, only along the shelf edge of the eastern Agulhas Bank.
Another way of placing these results in perspective is to compare trends in coastal SST with variance from the annual cycle (i), interannual variability (ii), and intra-seasonal fluctuations (iii). The index area standard deviations are 2.5 ∘C (i), 0.7 ∘C (ii), and 0.9 ∘C (iii), respectively, compared with a 35-year decline in coastal SST of −2.4 ∘C. Applying linear regression to coastal SST data with and without the annual cycle achieves vs. −0.76. Either way the trend is significant, not only statistically but also in terms of environmental impact.
In this study, modern reanalysis datasets have been used for mapping the marine climate trends over the southern shelf of South Africa. Cross-shelf gradients in sea temperatures, latent heat flux, currents, and upwelling are apparent in the satellite era. SST in the offshore zone has been warming (0.05 ∘C yr−1) since 1980 and there is a trend toward easterly winds, mainly in summer ( m s−1 yr−1). The shelf-edge Agulhas Current is accelerating ( m s−1 yr−1) at longitudes 21–28∘ E (see Fig. 2c), partly due to large-scale winds over the southwest Indian Ocean (Backeberg et al., 2012) that align with the local forcing seen there. The faster current and “following” wind induces coastal uplift (Leber et al., 2017) and cooling (−0.03 ∘C yr−1). As the subtropical ridge is drawn poleward, the cross-shore gradient steepens (see Fig. A1). Cooler nearshore sea temperatures correspond to atmospheric subsidence, drying trends (−0.005 mm d−1 yr−1), and vegetation warming (0.1 ∘C yr−1). Similar trends in local air–sea interactions are attributed to more frequent wind-driven coastal upwelling and easterly winds (see Fig. 3a) as in Malan et al. (2019). Coupled ensemble projections from the Hadley and European models indicate that the shift toward drier weather, easterly winds, coastal upwelling, and a locally faster Agulhas Current may be sustained through the 21st century (see Fig. 6c) as a local response to the poleward shift of the subtropical ridge. Cross-shelf exchange could mitigate some of these effects. Some of the environmental changes could create opportunities for resource adaptation (Jury, 2019) and spark interest in aquaculture and ecotourism.
Inshore cooling and offshore warming are said to have steepened the sea slope and promoted local acceleration of the shelf-edge current. This is confirmed by analysis of pre- and post-1990 data in the high-resolution GODAS product (Fig. A4a). The inshore and offshore edges are anchored, but over the shelf edge (34.7–35.7∘ S), SSH values are ∼ 5 cm higher in the recent period. Sea-level rise in past observations and future projections (Fig. A4b) both show an upward trend due to global warming. The linear regression r2 fit increases from 19 % to 86 %, suggesting a high degree of confidence, similar to trends for air temperature (see Fig. 6e).
While the shelf may benefit, terrestrial water resources could be headed towards greater stress. Although the hydrology is transitionally located between a drying west and moistening east, the Sundays River sees inter-basin transfers, while the Gamtoos River depends on agricultural “recycling”. In both cases reduced runoff linked to rainfall could inhibit freshwater fluxes to the coastal ocean (see Fig. 6b).
Parallel work on this geographic niche (Jury, 2019; Jury and Goschen, 2020) is ongoing, and further studies will (i) compare observation and reanalysis trends, (ii) consider how changing satellite technology represents shelf dynamics, (iii) quantify wind- vs. current-driven upwelling, and (iv) analyze coupled models capable of detecting sharp coastal gradients.
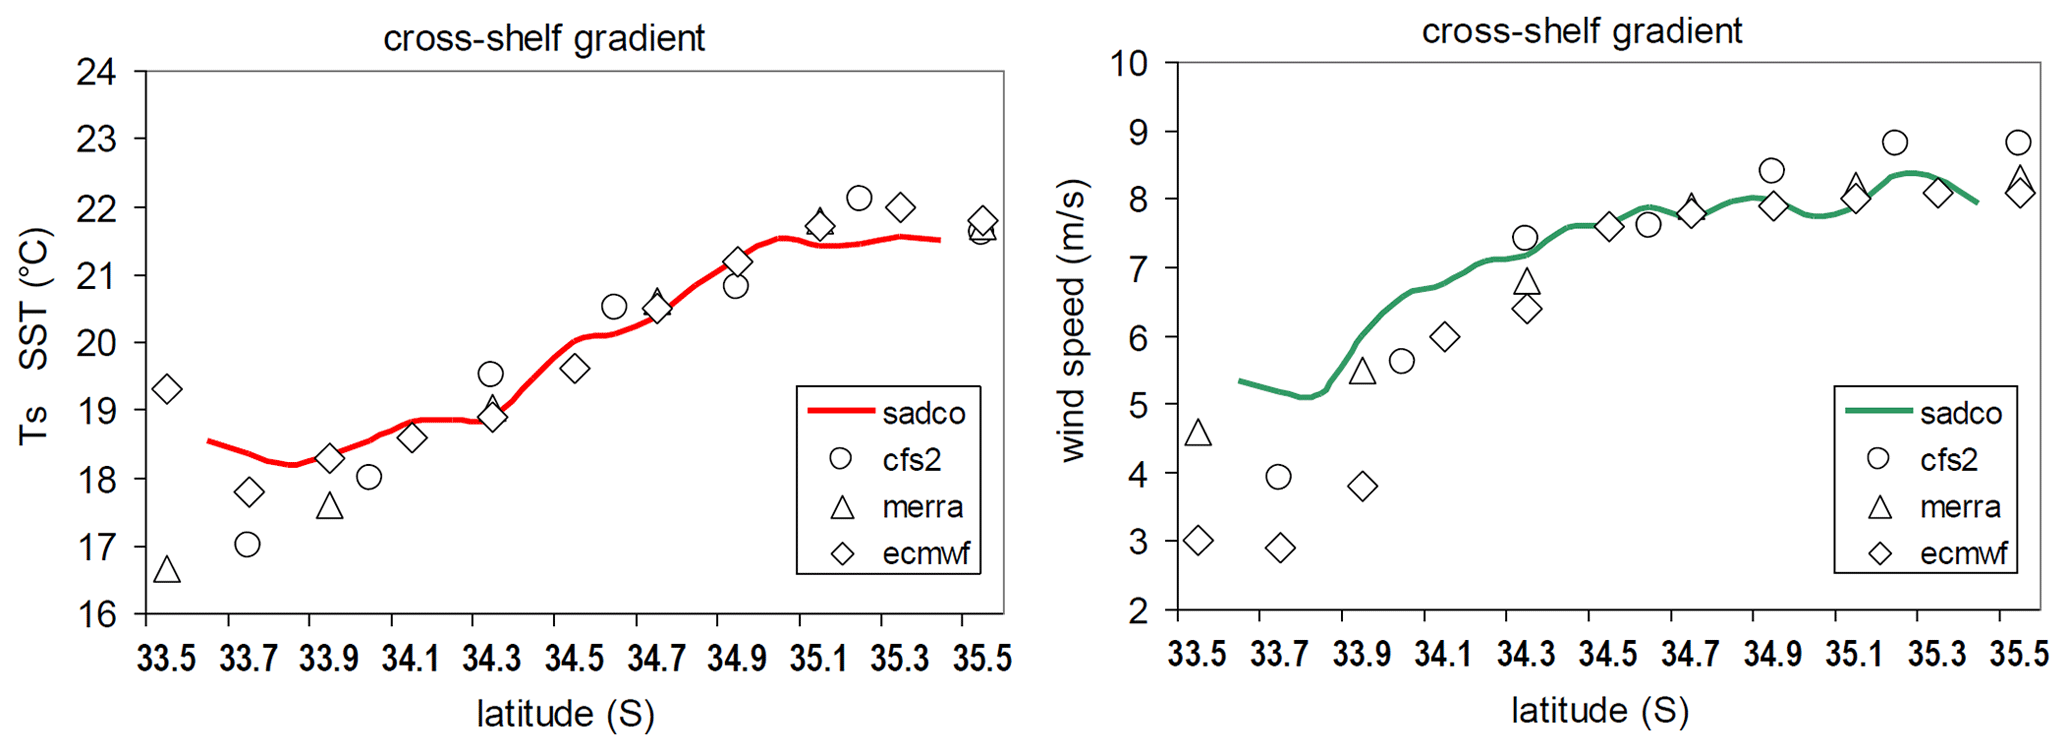
Figure A1SADCO ship data averaged per 0.1∘ latitude bin over 24.5–26.5∘ E longitude for 1950–2015 (line) and comparative satellite era reanalysis (dots).
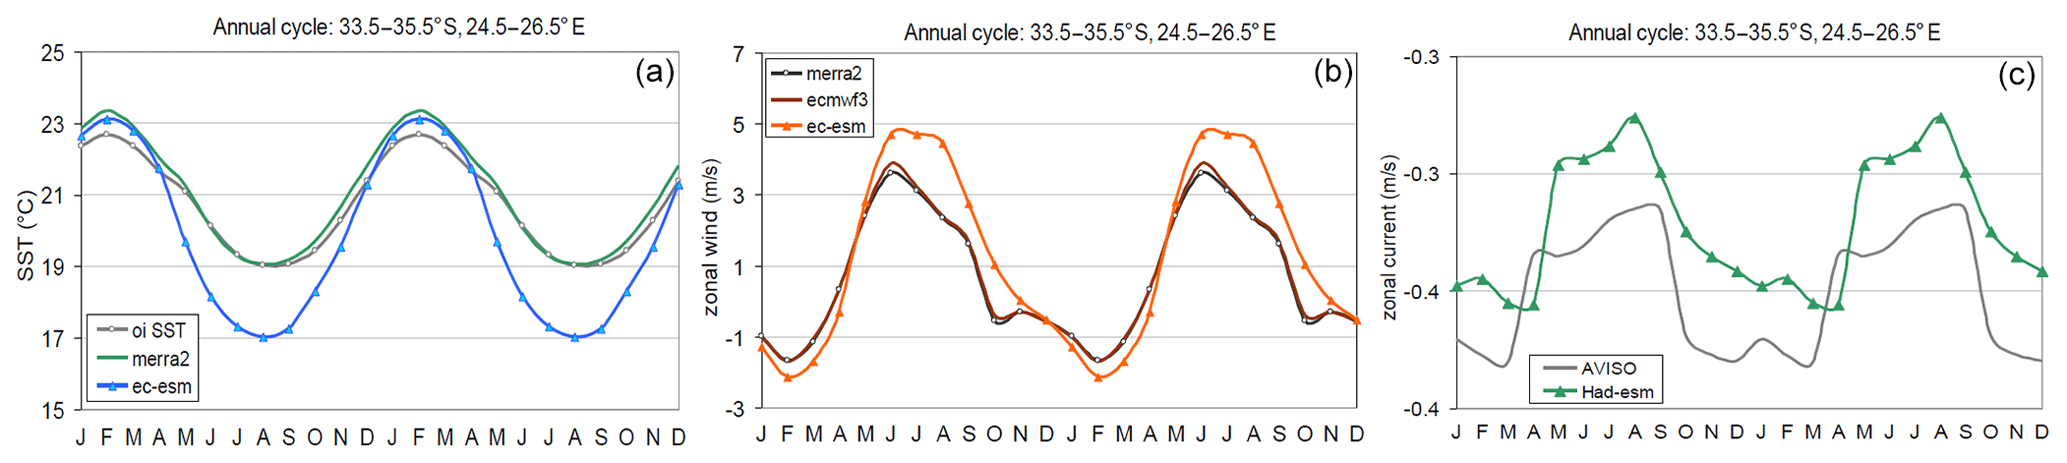
Figure A2Annual cycles averaged over the index area comparing model SST (a), surface zonal wind (b), and near-surface current with the reference product. The model has an amplified annual cycle that is cooler and more westerly in winter. Currents show summer and winter regimes with the model slightly weaker and delayed.
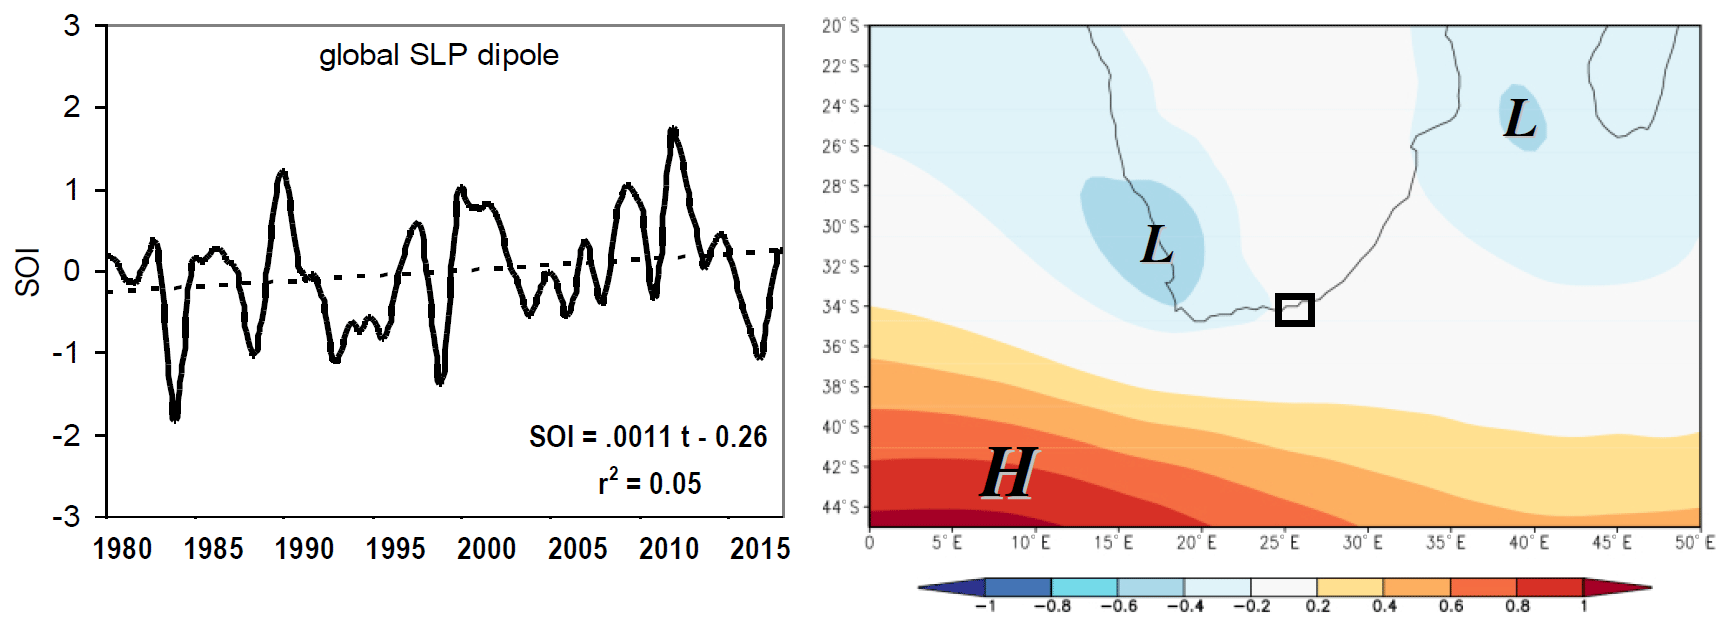
Figure A3Graph of 18-month filtered southern oscillation index and its trend in the satellite era, as well as a regression of December–February SOI onto regional sea-level air pressure (hPa), with boxed index area.
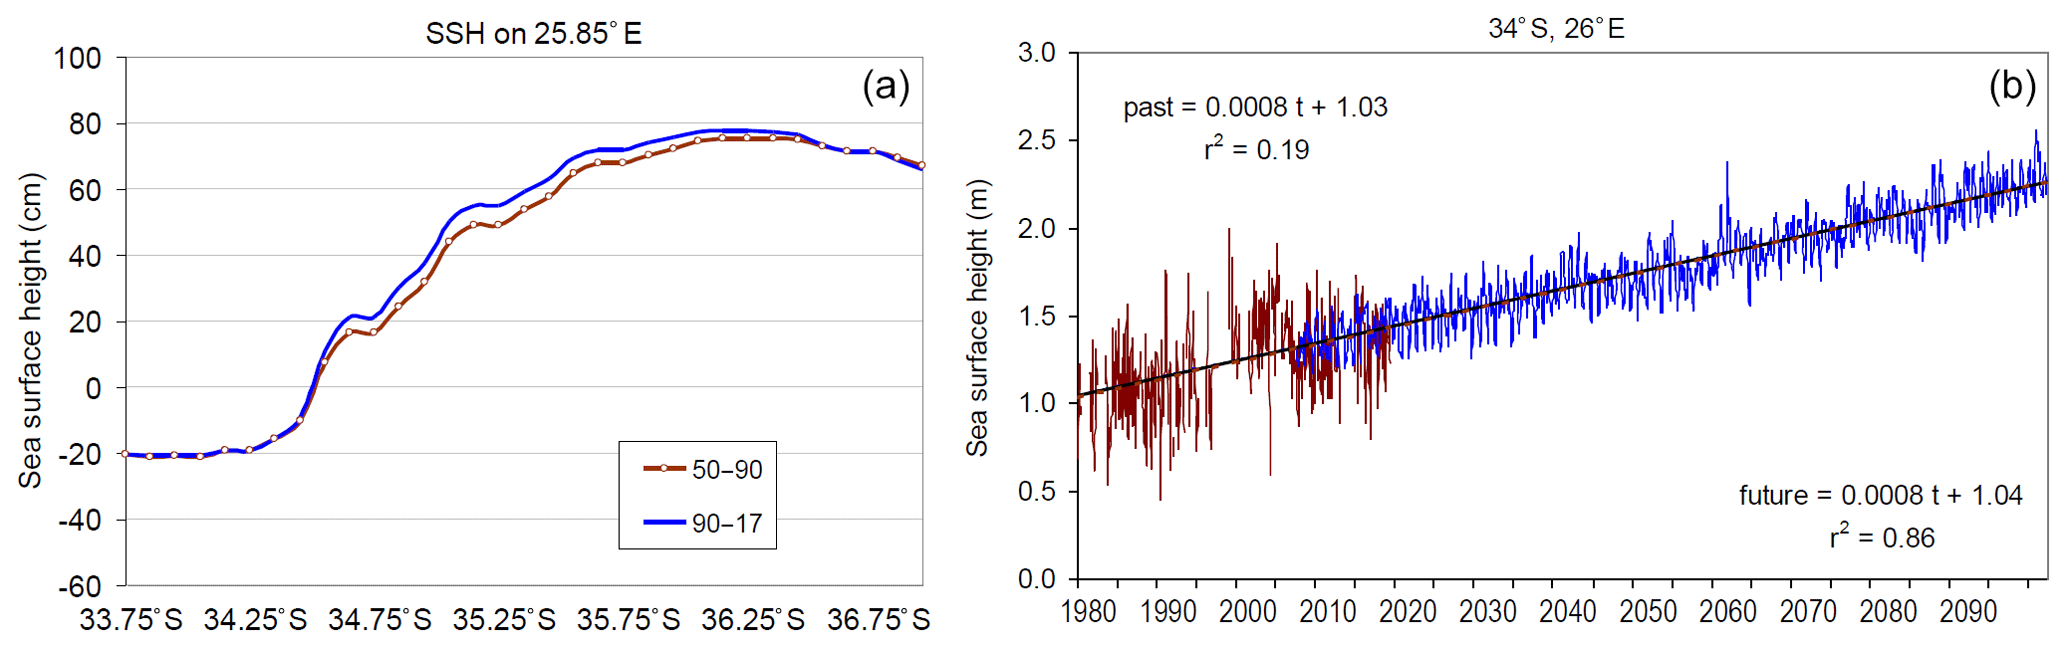
Figure A4(a) Graph of mean sea surface height on the meridional line at 25.85∘ E based on GODAS 0.1∘ reanalysis binned into pre- and post-1990 periods, with the latter incorporating satellite altimetry. There is a steepening slope consistent with . (b) Time series of monthly sea surface height measured at PE harbor and projected by the Hadley ESM, quantifying the global trend; r2 values are given.
A data spreadsheet is available by email request to the author.
The author declares that there is no conflict of interest.
An ongoing SAPSE incentive from the South African Department of Education is acknowledged. Data are derived from websites of the IRI Climate Library, KNMI Climate Explorer, and University of Hawaii APDRC.
This paper was edited by Piers Chapman and reviewed by Ricardo Matano and three anonymous referees.
Arblaster, J. M., Meehl, G., and Karoly, D.: Future climate change in the southern hemisphere: Competing effects of ozone and greenhouse gases, Geophys. Res. Lett., 38, L02701, https://doi.org/10.1029/2010GL045384, 2011.
Backeberg, B., Penven, P., and Rouault, M.: Impact of intensified Indian Ocean winds on mesoscale variability in the Agulhas system, Nature Clim. Change, 2, 608–612, 2012.
Balmaseda, M. A., Mogensena, K., and Weaver, A. T.: Evaluation of the ECMWF ocean reanalysis system ORAS4, Q. J. Roy. Meteor. Soc., 139, 1132–1161, 2013.
Carton, J. A., Chepurin, G. A., and Chen, L.: SODA-3: A new ocean climate reanalysis, J. Climate, 31, 6967–6983, 2018.
Chaudhuri, A. H., Ponte, R. M., Forget, G., and Heimbach, P.: A comparison of atmospheric reanalysis surface products over the ocean and implications for uncertainties in air–sea boundary forcing, J. Climate, 26, 153–170, 2013.
Collins, W. J., Bellouin, N., Doutriaux-Boucher, M., Gedney, N., Halloran, P., Hinton, T., Hughes, J., Jones, C. D., Joshi, M., Liddicoat, S., Martin, G., O'Connor, F., Rae, J., Senior, C., Sitch, S., Totterdell, I., Wiltshire, A., and Woodward, S.: Development and evaluation of an Earth-System model – HadGEM2, Geosci. Model Dev., 4, 1051–1075, https://doi.org/10.5194/gmd-4-1051-2011, 2011.
Decker, M., Brunke, M. A., Wang, Z., Sakaguchi, K., Zeng, X., and Bosilovich, M. G.: Evaluation of the reanalysis products from GSFC, NCEP, and ECMWF using flux tower observations, J. Climate, 25, 1916–1944, 2012.
Dee, D. P., Uppala, S. M., Simmons, A. J., Berrisford, P., Poli, P., Kobayashi, S., Andrae, U., Balmaseda, M. A., Balsamo, G., Bauer, P., Bechtold, P., Beljaars, A. C. M., van de Berg, L., Bidlot, J., Bormann, N., Delsol, C., Dragani, R., Fuentes, M., Geer, A. J., Haimberger, L., Healy, S. B., Hersbach, H., Hólm, E. V., Isaksen, L., Kållberg, P., Köhler, M., Matricardi, M., McNally, A. P., Monge-Sanz, B. M., Morcrette, J.-J., Park, B.-K., Peubey, C., de Rosnay, P., Tavolato, C., Thépaut, J.-N., and Vitart, F.: The ERA-interim reanalysis: configuration and performance of the data assimilation system, Q. J. Roy. Meteor. Soc., 137, 553–597, 2011.
Dieppois, B., Rouault, M., and New, M.: The impact of ENSO on Southern African rainfall in CMIP5 ocean atmosphere coupled climate models, Climate Dyn., 45, 2425–2442, 2015.
Dlomo, X.: Sea surface temperature trends around Southern Africa, MSc thesis, Univ. Cape Town, 61 pp., 2014.
Doblas-Reyes, F. J., Acosta-Navarro, J. C., Acosta, M., Bellprat, O., Bilbao, R., Castrillo, M., Fuckar, N., Guemas, V., Lledo, L., Menegoz, M., Prodhomme, C., Serradell, K., Tinto, O., Batte, L., Volpi, D., Ceglar, A., Haarsma, R., Massonnet, F.: Using EC-Earth for climate prediction research, ECMWF newsletter 154, available at: https://www.ecmwf.int/en/newsletter/154/meteorology/ (last access: 11 May 2020), 2018.
Durgadoo, J. V., Loveday, B. R., Reason, C. J., Penven, P., and Biastoch, A.: Agulhas leakage predominantly responds to the Southern Hemisphere westerlies, J. Phys. Oceanogr., 43, 2113–2131, 2013.
Elipot, S. and Beal, L. M.: Characteristics, energetics and origins of Agulhas Current meanders and their limited influence on ring shedding, J. Phys. Oceanogr, 45, 2294–2314, 2015.
Elipot, S. and Beal, L. M.: Observed Agulhas Current sensitivity to interannual and long-term trend atmospheric forcings, J. Climate, 31, 3077–3098, 2018.
Funk, C. C., Peterson, P. J., Landsfeld, M. F., Pedreros, D. H., Verdin, J. P., Rowland, J. D., Romero, B. E., Husak, G. J., Michaelsen, J. C., and Verdin, A. P.: A quasi-global precipitation time series for drought monitoring, US. Geol. Survey Data Series, 832, 1–4, https://doi.org/10.110.3133/ds832, 2014.
Gelaro, R., McCarty, W., Suárez, M. J., Todling, R., Molod, A., Takacs, L., Randles, C. A., Darmenov, A., Bosilovich, M. G., Reichle, R., Wargan, K., Coy, L., Cullather, R., Draper, C., Akella, S., Buchard, V., Conaty, A., da Silva, A. M., Gu, W., Kim, G.-K., Koster, R., Lucchesi, R., Merkova, D., Nielsen, J. E., Partyka, G., Pawson, S., Putman, W., Rienecker, M., Schubert, S. D., Sienkiewicz, M., and Zhao, B.: The Modern-Era Retrospective Analysis for Research and Applications, version 2 (MERRA-2), J. Climate, 30, 5419–5454, 2017.
Goschen, W. S. and Schumann, E. H.: Agulhas Current variability and inshore structures off the Cape Province, South Africa, J. Geophys. Res., 95, 667–678, 1990.
Goschen, W. S., Bornman, T. G., Deyzel, S. H. P., and Schumann, E. H.: Coastal upwelling on the far eastern Agulhas Bank associated with large meanders in the Agulhas Current, Cont. Shelf Res., 101, 34–46, 2015.
Hamrud, M., Bonavita, M., and Isaksen, L.: Kalman filter and hybrid-gain ensemble data assimilation. Part I: EnKF implementation, Mon. Weather Rev., 143, 4847–4864, 2015.
Hutchinson, K., Beal, L. M., Penven, P., Ansorge, I., and Hermes, J.: Seasonal phasing of Agulhas Current transport tied to a baroclinic adjustment of near-field winds, J. Geophys. Res.-Oceans, 123, 7067–7083, 2018.
Jamstec (Japan agency for marine - earth science and technology): Ocean general circulation model for the (University of Hawaii) earth simulator, GODAS MOMv3 basis, https://doi.org/10.17596/0002029, 2009.
Jury, M. R.: Climate trends in southern Africa, S. Afr. J. Science, 109, 53–63, 2013.
Jury, M. R.: Passive suppression of South African rainfall by the Agulhas Current, Earth Int., 19, 1–14, 2015.
Jury, M. R.: Environmental controls on marine productivity near Cape St. Francis, South Africa, Ocean Sci., 15, 1579–1592, https://doi.org/10.5194/os-15-1579-2019, 2019.
Jury, M. R.: Slowing of Caribbean through-flow, Deep Sea Res. Pt. 2, 180, 104682, https://doi.org/10.1016/j.dsr2.2019.104682, 2020.
Jury, M. R. and Goschen, W. S.: Physical ocean-atmosphere variability over the shelf of South Africa from reanalysis products, Cont. Shelf Res., 202, 104135, https://doi.org/10.1016/j.csr.2020.104135, 2020.
Jury, M. R., MacArthur, C., and Reason, C.: Observations of trapped waves in the atmosphere and ocean along the coast of southern Africa, S, Afr. Geogr. J., 72, 33–46, 1990.
Kennedy, A. D., Dong, X., Xi, B., Xie, S., Zhang, Y., and Chen, J.: A comparison of MERRA and NARR reanalyses with the DOE ARM SGP data, J. Climate, 24, 4541–4557, 2011.
Kruger, A. C. and Shongwe, S.: Temperature trends in South Africa: 1960–2003, Int. J. Climatol., 24, 1929–1945, 2004.
Kruger, A. C. and Nxumalo, M. P.: Historical rainfall trends in South Africa 1921–2015, Water SA, 43, 285–297, 2017.
Leber, G. M., Beal, L. M., and Elipot, S.: Wind and current forcing combine to drive strong upwelling in the Agulhas Current, J. Phys. Oceanogr., 47, 123–134, 2017.
Lee. H.-T., Gruber, A., Ellingson, R. G., and Laszlo, I.: Development of the HIRS outgoing longwave radiation climate dataset, J. Atmos. Ocean. Tech., 24, 2029–2047, 2007.
Lutjeharms, J. R. E.: The Agulhas Current, Springer, Berlin, 329 pp., 2006.
Lutjeharms, J. R. E., Cooper, J., and Roberts, M. J.: Upwelling at the inshore edge of the Agulhas Current, Cont. Shelf Res., 20, 737–761, 2000.
MacKeller, N., New, M., and Jack, C.: Observed and modelled trends in rainfall and temperature for South Africa 1960–2010, S. Afr. J. Science, 110, 1–13, 2014.
Malan, N., Backeberg, B., Biastoch, A., Durgadoo, J. V., Samuelsen, A., Reason, C., and Hermes, J.: Agulhas Current Meanders facilitate shelf-slope exchange on the Eastern Agulhas Bank, J. Geophys. Res.-Oceans, 123, 4762–4778, 2018.
Malan, N. C., Durgadoo, J. V., Biastoch, A., Reason, C. J., and Hermes, J. C.: Multidecadal wind variability drives temperature shifts on the Agulhas Bank, J. Geophys. Res.-Oceans, 124, 3021–3035, 2019.
Mather, A. A., Garland, G. G., and Stretch, D. D.: Southern African sea levels: corrections, influences and trends, Afr. J. Marine Sci., 31, 145–156, 2009.
Morishima, W. and Akasaka, I.: Seasonal trends of rainfall and surface temperature over Southern Africa, Afr. Study Monographs, 40, 67–76, 2010.
Morris, T., Hermes, J., Beal, L., du Plessis, M., Rae, C. D., Gulekana, M., Lamont, T., Speich, S., Roberts, M., and Ansorge, I. J.: The importance of monitoring the Greater Agulhas Current and its inter-ocean exchanges using large mooring arrays, S. Afr. J. Science, 113, 1–7, 2017.
Nkwinkwa, N., Rouault, M., and Johannessen, J. A.: Latent heat flux in the Agulhas Current, Remote Sens.-Basel, 11, 1576, https://doi.org/10.3390/rs11131576, 2019.
Pattrick, P., Strydom, N. A., and Goschen, W. S.: Shallow-water, nearshore current dynamics in Algoa Bay, South Africa, with notes on the implications for larval fish dispersal, Afr. J. Marine Sci., 35, 269–282, 2013.
Philippon, N., Rouault, M., Richard, Y., and Favre, A.: The influence of ENSO on winter rainfall in South Africa, Int. J. Climatol., 32, 2333–2347, 2012.
Poli, P., Hersbach, H., Dee, D. P., Berrisford, P., Simmons, A. J., Vitart, F., Laloyaux, P., Tan, D. G. H., Peubey, C., Thépaut, J.-N., Trémolet, Y., Hólm, E. V., Bonavita, M., Isaksen, L., and Fisher, M.: ERA-20C An atmospheric reanalysis of the Twentieth Century, J. Climate, 29, 4083–4097, 2016.
Reynolds, R. W., Smith, T. M., Liu, C., Chelton, D. B., Casey, K. S., and Schlax, M. G.: Daily high-resolution blended analyses for sea surface temperature, J. Climate, 20, 5473–5496, 2007.
Roberts, M. J.: Coastal currents and temperatures along the eastern region of Algoa Bay, South Africa, with implications for transport and shelf-bay water exchange, Afr. J. Marine Sci., 32, 145–161, 2010.
Rouault, M., Penven, P., and Pohl, B.: Warming in the Agulhas Current system since the 1980s, Geophys. Res. Lett., 36, L12602, https://doi.org/10.1029/2009GL037987, 2009.
Rouault, M., Pohl, B., and Penven, P.: Coastal oceanic climate change and variability from 1982 to 2009 around South Africa, Afr. J. Marine Sci., 32, 237–246, 2010.
Rouault, M. J. and Penven, P.: New perspectives on Natal Pulses from satellite observations, J. Geophys. Res.-Oceans, 116, 1–14, 2011.
Saha, S., Moorthi, S., Pan, H.-L., Wu, X., Wang, J., Nadiga, S., Tripp, P., Kistler, R., Woollen, J., Behringer, D., Liu, H., Stokes, D., Grumbine, R., Gayno, G., Wang, J., Hou, Y.-T., Chuang, H.-Y., Juang, H.-M., Sela, J., Iredell, M., Treadon, R., Kleist, D., van Delst, P., Keyser, D., Derber, J., Ek, M., Meng, J., Wei, H., Yang, R., Lord, S., van Den Dool, H., Kumar, A., Wang, W., Long, C., Chelliah, M., Xue, Y., Huang, B., Schemm, J.-K., Ebisuzaki, W., Lin, R., Xie, P.-P., Chen, M., Zhou, S., Higgins, W., Zou, C.-Z., Liu, Q., Chen, Y., Han, Y., Cucurull, L., Reynolds, R. W., Rutledge, G., and Goldberg, M.: The NCEP Coupled Forecast System reanalysis, B. Am. Meteorol. Soc., 91, 1015–1057, 2010.
Scharler, U. M. and Baird, D.: The filtering capacity of selected Eastern Cape estuaries, South Africa, Water SA, 31, 483–490, 2005.
Schlegel, R. W. and Smit, A. J.: Climate change in coastal waters: time series properties affecting trend estimation, J. Climate, 29, 9113–9124, 2016.
Schumann, E. H.: Wind-driven mixed layer, coastal upwelling processes off the south coast of South Africa, J. Marine Res., 57, 671–691, 1999.
Schumann, E. H. and Beekman, L. J.: Ocean temperature structures on the Agulhas Bank, T. Roy. Soc. S. Afr., 45, 191–203, 1984.
Schumann, E. H. and Brink, K. H.: Coastal trapped waves off the coast of South Africa: generation, propagation, current structures, J. Phys. Oceanogr., 20, 1206–1218, 1990.
Schumann, E. H. and Martin, J. A.: Climatological aspects of the coastal wind field at Cape Town, Port Elizxabeth, Durban, S. Afr. Geogr. J., 73, 48–51, 1991.
Schumann, E. H. and Pearce, M. W.: Freshwater inflow, estuarine variability in the Gamtoos Estuary South Africa, Estuaries, 20, 124–133, 1997.
Schumann, E. H., Perrins, L.-A., and Hunter, I. T.: Upwelling along the south coast of the Cape Province South Africa, S. Afr. J. Science, 78, 238–242, 1982.
Swart, V. P. and Largier, J. L.: Thermal structure of Agulhas Bank water, S. Afr. J. Marine Sc., 5, 243–252, 1987.
Tadross, M., Jack, C., and Hewitson, B.: On RCM-based projections of change in southern African summer climate, Geophys. Res. Lett., 32, L23713, https://doi.org/10.1029/2005GL024460, 2005.
Taylor, K. E., Stouffer, R. J., and Meehl, G. A.: An overview of CMIP5, the experiment design, B. Am. Meteorol. Soc., 93, 485–498, 2012.
Tucker, C. J., Pinzon, J. E., Brown, M. E., Slayback, D. A., Pak, E. W., Mahoney, R., Vermote, E. F., and el Saleous, N.: An extended AVHRR 8 km NDVI dataset compatible with MODIS, SPOT vegetation data, Int. J. Remote Sens., 26, 4485–4498, 2005.
van Bladeren, D., Zawada, P. K., and Mahlangu, D.: Statistical based regional flood frequency estimation study for South Africa using systematic, historical, paleo-flood data, Water Res. Comm. Rep., 1260/1/70, Pretoria, 2007.
van Vuuren, D. P., Edmonds, J., Kainuma, M., Riahi, K., Thomson, A., Hibbard, K., Hurtt, G. C., Kram, T., Krey, V., Lamarque, J.-F., Masui, T., Meinshausen, M., Nakicenovic, N., Smith, S. J., and Rose, S. K.: The representative concentration pathways: an overview, Climatic Change, 109, 5–31, 2011.
Yang, H., Lohmann, G., Wei, W., Dima, M., Ionita, M., and Liu, J.: Intensification, poleward shift of subtropical western boundary currents in a warming climate, J. Geophys. Res.-Oceans, 121, 4928–4945, 2016.