the Creative Commons Attribution 4.0 License.
the Creative Commons Attribution 4.0 License.
 | 01 Dec 2020
The winter stratification phenomenon and its consequences in the Gulf of Finland, Baltic Sea
Taavi Liblik
Germo Väli
Inga Lips
Madis-Jaak Lilover
Villu Kikas
Jaan Laanemets
Stratification plays an essential role in the marine ecosystem, with a shallow mixed layer being one of the preconditions for enhanced primary production in the ocean. In the Baltic Sea, the general understanding is that the upper mixed layer (UML) is well below the euphotic zone in winter. In this study, we demonstrate that wintertime shallow stratification is common in the Gulf of Finland and it forms at a depth comparable to the euphotic zone in January–February. The onset of restratification is likely associated with the annual cycle of westerly winds, which ease off in late January–early February. Stratification is first invoked along the northern coast by the westward advection of riverine water forced by easterly winds and is expanded to the south when the prevailing wind direction changes from an easterly to a westerly direction. Haline stratification emerges approximately 1 month later in the southern part of the gulf. Winter restratification can occur in the entire gulf and also in the absence of ice; thus, it is a regular seasonal feature in the area. Interannual variations in the wintertime UML correspond with variations in the North Atlantic Oscillation. Chlorophyll a concentrations in winter can be comparable to mid-summer; the limiting factor for phytoplankton bloom in winter is likely insufficient solar radiation.
- Article
(7989 KB) - Full-text XML
- BibTeX
- EndNote


Upper-layer stratification is an important characteristic in the dynamics of the pelagic ecosystem. However, to our knowledge, the formation of wintertime haline stratification in the upper layer of the entire Gulf of Finland has not been investigated; the present study focuses on the formation of wintertime haline stratification caused by freshwater inflow and wind-forced circulation, and the observed haline stratification explains early phytoplankton dynamics. The Baltic Sea is shallow and brackish, has limited water exchange with the North Sea and is characterized by strong seasonality and gradients of oceanographic parameters (e.g., Leppäranta and Myrberg, 2009). The upper mixed layer (UML), with a typical depth of 10–20 m, forms in spring and is separated from the rest of the water column by a seasonal thermocline. The mixed layer warms up to 15–24 ∘C (e.g., Stramska and Białogrodzka, 2015; Tronin, 2017), and thermal stratification strengthens until August. The thermocline is eroded by thermal convection, wind stirring, and current shear-induced mixing, and the mixed layer deepens down to the sea bottom or the halocline at 40–80 m depth in autumn–winter (e.g., Lass et al., 2003; Liblik and Lips, 2017; Väli et al., 2013). Characteristics of the seasonal pycnocline (e.g., strength) determine vertical physical (e.g., heat and salt), biogeochemical (e.g., oxygen, nutrients), biological (e.g., plankton), or pollution (e.g., microplastics) fluxes between the surface and sub-thermocline layer. Moreover, the current shear maximum is strongly linked to the vertical location of the seasonal pycnocline (Suhhova et al., 2018). The annual cycle in stratification, together with solar radiation, mainly determines seasonality in primary production and nutrient consumption. Vertical mixing from the deeper layers and low production in winter allow nutrients to accumulate in the upper layer (e.g., Lilover and Stips, 2008; Nehring and Matthäus, 1991). The water column becomes stable in spring and the mixed layer is shallower than the euphotic zone, so that the spring bloom is triggered when solar radiation is sufficiently strong (Fleming and Kaitala, 2006; Jaanus et al., 2006; Lips et al., 2014; Wasmund et al., 1998). Stratification in the northeastern Baltic Sea is particularly strong and variable. The largest river in the Baltic Sea catchment area, the Neva, discharges into the eastern end of the Gulf of Finland with a mean runoff of 3700 m3 s−1 (Johansson, 2016). Since river discharge is concentrated in the east and the gulf is connected to the Baltic Proper in the west, there is a mean longitudinal salinity gradient in the upper layer from approximately 0 g kg−1 at the easternmost end to 6 g kg−1 in the west (Alenius et al., 1998). Also, mean salinity in the upper layer is lower on the northern coast than the southern (e.g., Kikas and Lips, 2016) due to the mean cyclonic circulation in the upper layer and prevailing westward current along the northern coast (Palmen, 1930; Rasmus et al., 2015; Stipa, 2004). Free water exchange between the gulf and the Baltic Proper means that there is a quasi-permanent halocline and saltier deep layer in the gulf. This lateral and vertical structure can be strongly modified by wind forcing; westerly winds drive accumulation of saltier upper-layer water, deepen the UML (Liblik and Lips, 2017), and cause weakening of the halocline (Elken et al., 2003). This process can lead to the complete mixing of the water column in the gulf in the winter (Elken et al., 2014; Liblik et al., 2013; Lips et al., 2017). In contrast, easterly winds encourage westward transport of riverine water and strengthen haline stratification in the whole water column (Liblik and Lips, 2017). Wind-driven processes also generate considerable across-gulf inclination of the pycnoclines (Liblik and Lips, 2017) and upwelling and downwelling events along the southern and northern coasts (Kikas and Lips, 2016; Lehmann et al., 2012; Lips et al., 2009).
The northeastern part of the Baltic Sea is ice-covered every winter (e.g., Uotila et al., 2015), although ice extent has high interannual variability. The brackish nature of Baltic Sea water means that the maximum density temperature Tmd (2.2–3.3 ∘C) is higher than the freezing temperature (from −0.4 to −0.1 ∘C), unlike most of the world ocean. Thus, when the temperature of the surface layer is below Tmd warming increases water density and causes convection and vertical mixing, while cooling stabilizes the water column. Water temperature typically exceeds the Tmd in northern and eastern parts of the Baltic Sea during winter (Karlson et al., 2016; Liblik et al., 2013), but it is not always the case in offshore areas in the southern Baltic Sea (e.g., Stepanova et al., 2015). Lateral haline buoyancy flux can compensate for the thermal convection and stabilization of the shallow upper layer in spring and can occur at temperatures already below Tmd (Eilola, 1997; Eilola and Stigebrandt, 1998; Stipa et al., 1999). One reason for the latter is the relatively low thermal expansion at temperatures around Tmd; i.e., the impact of temperature on density is relatively small compared to the impact of salinity. Thus, the onset of the seasonal pycnocline is not necessarily initiated by thermal buoyancy but could be related to haline buoyancy. Temperature below Tmd in the cold intermediate layer after the establishment of the seasonal pycnocline provides direct evidence of the latter (Chubarenko et al., 2017; Eilola, 1997; Liblik and Lips, 2017). Haline stratification creates favorable conditions for spring phytoplankton bloom (Kahru and Nõmmann, 1990; Lips et al., 2014); without haline stratification, warming would cause mixing until Tmd is reached.
Haline stratification under ice has been observed in a number of locations including in the vicinity of the mouth of the River Siikajoki in the Bothnian Bay (Granskog et al., 2005), at Tvärminne in the northwestern Gulf of Finland (Merkouriadi and Leppäranta, 2015), and at Himmerfjärden Bay in the western Baltic Proper (Kari et al., 2018). Ice coverage prevents wind mixing so that even relatively low river runoff can form a plume of fresher water and stratification that can reach 10–20 km from the river mouth. A number of studies (Granskog et al., 2005; Kari et al., 2018; Merkouriadi and Leppäranta, 2015) have investigated winter and early spring haline stratification locally in nearshore regions and near relatively small freshwater sources. The Gulf of Finland has favorable preconditions for haline stratification in the upper layer in winter. The gulf receives large amounts of fresh water, and it is at least partly covered by ice during winter. The present study hypothesizes that haline stratification occurs at a depth comparable to the euphotic zone in the Gulf of Finland, and potentially in the northeastern Baltic Proper, during wintertime. This means that the general understanding that the water column is mixed down to the halocline in the open Baltic Sea in winter (Leppäranta and Myrberg, 2009) might not be valid in the northeastern Baltic Sea. To test this hypothesis, we analyzed data from research vessel measurement campaigns and autonomously acquired Ferrybox data and historical sources, along with model simulation data.
In situ and remote-sensing data
We arranged two measurement campaigns in the winters of 2011/12 and 2013/14 aboard RV Salme to investigate estuarine circulation reversals in the Gulf of Finland (Fig. 1); six along the gulf thalweg surveys were conducted in each winter, with full details of survey and data processing in Liblik et al. (2013) and Lips et al. (2017). In the present study, we utilized temperature, salinity, and chlorophyll a (Chl a) data from cruises in 2011 (21 December), 2012 (24–25 January, 7–8 February, 29 February, 15–16 March), and 2014 (9–10 January, 3–4 February, 4–5 March). Vertical profiles of temperature, salinity, and Chl a fluorescence were recorded using an Ocean Seven 320plus CTD (conductivity–temperature–depth) probe (Idronaut S.r.l.) equipped with a Seapoint Chl a fluorometer. The salinity data were calibrated against water sample analyses using a high-precision salinometer 8410A Portasal (Guildline). The mean difference and SD of salinity measured by CTD and salinometer was g kg−1 in 2011/2012 and in 2013/2014. Thus, after the removal of offsets, the accuracy of salinity data were 0.02 g kg−1. Temperature sensors were calibrated before and after surveys in the Idronaut factory, and the differences with the calibration device were smaller than the initial accuracy (0.001 ∘C) of the Ocean Seven 320plus temperature sensor. Chl a fluorescence data were compared and calibrated against water samples on the selected cruises. The linear regression between Chl a fluorescence sensor values and Chl a acquired from water samples was Chl a= Fl × 1.42 (r2=0.90, n=33), where Fl is the Chl a fluorescence recorded by the Seapoint Chl a fluorometer. The Chl a concentration in the water samples was determined using Whatman GF/F glass fiber filters following extraction at room temperature in the dark with 96 % ethanol for 24 h. The Chl a content from the extract was measured spectrophotometrically (Thermo Helios g) in the laboratory (HELCOM, 1988). Phytoplankton biomass was determined from water samples from a selection of stations in winter 2014 (Fig. 1). Subsamples (100 mL) were preserved and analyzed following HELCOM recommendations and the EVS-EN 15972:2011 standard. Phytoplankton carbon (C) content was calculated using the C : biovolume factors method of Menden-Deuer and Lessard (2000) and for photosynthetic naked ciliate Mesodinium rubrum according to the method of Putt and Stoecker (1989). Wind data were recorded at Tallinnamadal and Kalbådagrund lighthouses (Fig. 1) at heights of 36 and 32 m above sea level and 1 and 3 h intervals, respectively. A height correction coefficient of 0.91 (neutral atmospheric stratification) was applied to convert wind speed measurements to 10 m height equivalent (Launiainen and Saarinen, 1984). Wind measurements from Tallinnamadal for the winters of 2011/12, 2013/14, and 2015/16 were used in the oceanographic data analysis. The Kalbådagrund dataset for the period 1981–2015 was used to illustrate the annual cycle of the along-gulf component of wind stress.
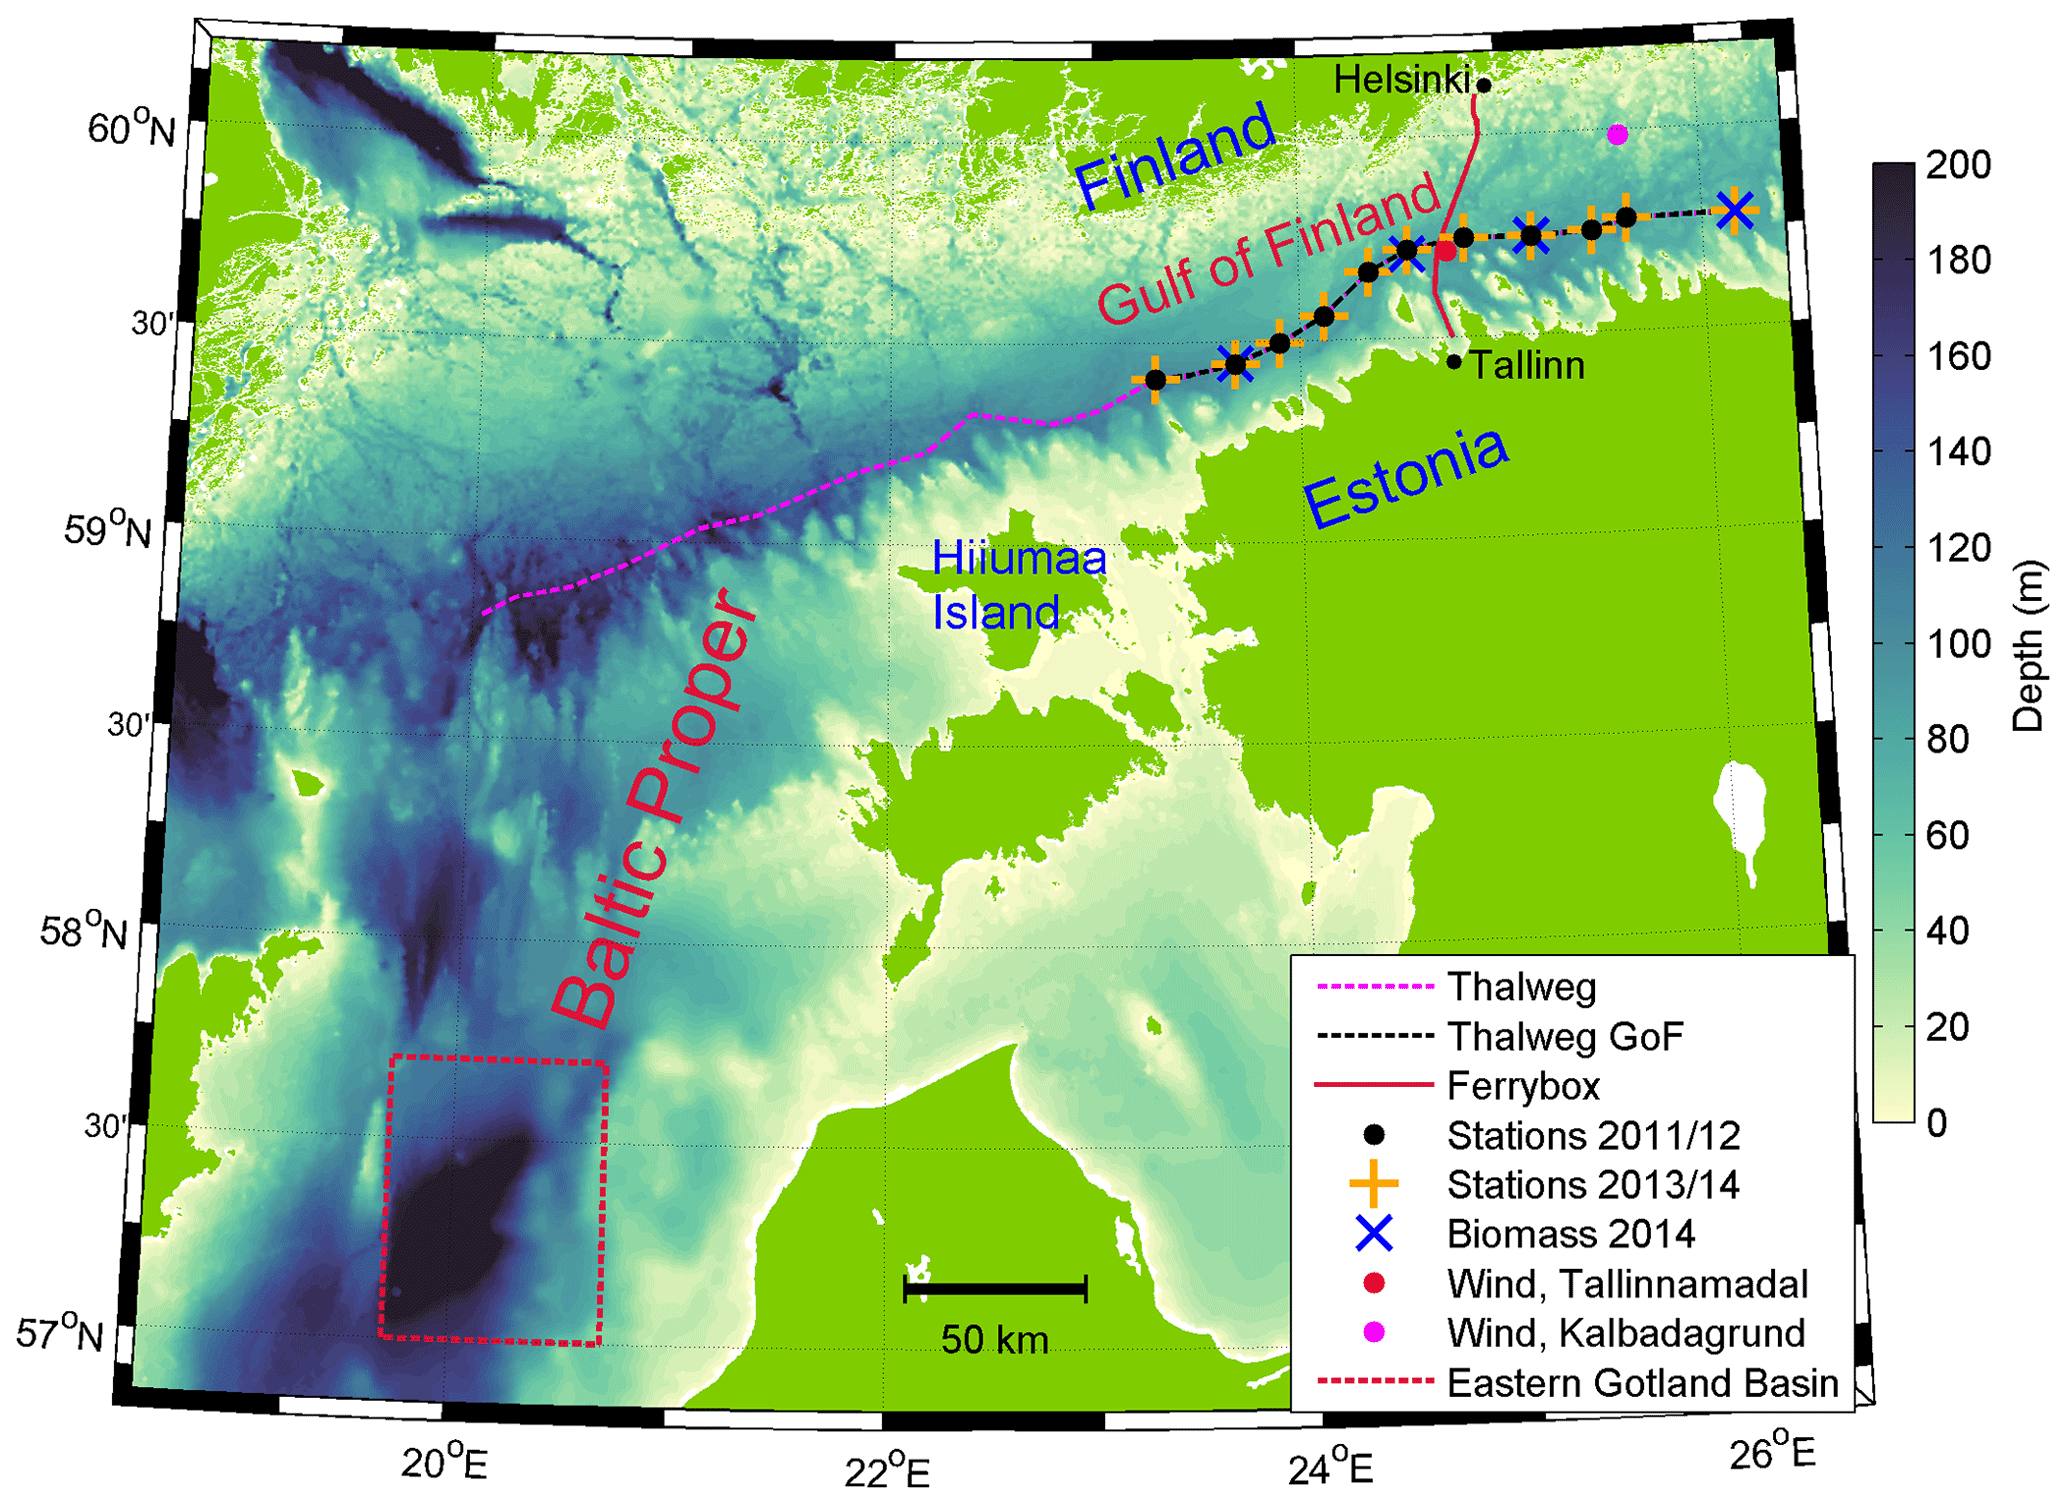
Figure 1Bathymetric map of the Baltic Proper and the Gulf of Finland. The locations of the CTD stations along the gulf (thalweg GoF) visited in 2011/12 and 2013/14, phytoplankton biomass sampling stations along the gulf in 2014, transect from the northern Baltic Proper to the central Gulf of Finland (thalweg + thalweg GoF), Tallinn–Helsinki Ferrybox line, Tallinnamadal and Kalbådagrund wind measurements locations, and Eastern Gotland Basin (box) area are shown.
Ferrybox measurements of temperature and salinity between Tallinn and Helsinki for January–March 2012, 2014, and 2016 were also used in the study. Details of the Ferrybox system and data processing methods are given in Kikas and Lips (2016). Analyses have shown that a correction of 0.08 g kg−1 (the value has been stable over the years) must be added to the recorded salinity (Kikas and Lips, 2016). The SD of the difference in salinity measured by Ferrybox and a high-precision Portasal salinometer was 0.01 g kg−1 after bias correction. The accuracy of the Ferrybox temperature sensor is 0.04 ∘C (Kikas and Lips, 2016). Historical data collected by the Department of Marine Systems at Tallinn University of Technology and the ICES HELCOM dataset (https://ocean.ices.dk/helcom/, last access: 15 April 2020) were used to determine past stratification conditions. Quality assurance and data processing were in accordance with the HELCOM Monitoring Manual (Anonymous, 2017).
OSTIA (The Operational Sea Surface Temperature and Ice Analysis; Donlon et al., 2012; Good et al., 2020) daily mean sea surface temperature (SST) data for the period 2010–2019 were obtained from the Copernicus Marine Environment Monitoring Service. Daily mean SST along the thalweg in the Gulf of Finland (thalweg GoF in Fig. 1) and in the Eastern Gotland Basin (box in Fig. 1) was calculated to determine if and when SST was above or below Tmd. Salinities of 6 and 7 g kg−1 were used in Tmd estimation for the Gulf of Finland and Eastern Gotland Basin, respectively.
A time series of the large-scale North Atlantic Oscillation (NAO) index was used to explain the interannual variability of wintertime upper-layer stratification in the Gulf of Finland. Long-term observations of the sea level pressure differences between Reykjavik (Iceland) and Gibraltar (Spain) constitute the NAO index, which is available from the Climatic Research Unit, University of East Anglia (Jones et al., 1997) (https://crudata.uea.ac.uk/cru/data/nao/nao.dat, last access: 15 April 2020).
Density is given as a potential density anomaly (σ0) to a reference pressure of 0 dbar (Association for the Physical Sciences of the Sea, 2010). The UML depth was defined as the minimum depth where 0.15 kg m−3 was satisfied. The density at 3 m depth is ρ3 and ρz is the density at depth z.
The study used the General Estuarine Transport Model (GETM; Burchard and Bolding, 2002) to obtain UML parameters in the Gulf of Finland and the Eastern Baltic Sea. GETM is a primitive-equation, three-dimensional, free-surface hydrostatic model with a built-in vertically adaptive coordinate scheme (Hofmeister et al., 2010). The latter has been shown to significantly reduce numerical mixing in the simulations (Gräwe et al., 2015).
Vertical mixing in the GETM is calculated using the General Ocean Turbulence Model (GOTM; Umlauf and Burchard, 2005). For the current study, the eddy diffusivity and eddy viscosity parameters were found using a two-equation k−ε model coupled with an algebraic second-moment closure (Burchard et al., 2001; Canuto et al., 2001).
A horizontal grid spacing of 0.5 nmi (approximately 926 m) was established for the setup domain of the whole Baltic Sea (Fig. 1), with 60 vertically adaptive layers. Parameters controlling the vertical resolution of the model during simulations were taken from Hofmeister et al. (2010) and Gräwe et al. (2015). The digital topography of the Baltic Sea was taken from the Baltic Sea Bathymetry Database (http://data.bshc.pro/, last access: 1 April 2020), with additional data for the Gulf of Finland from Andrejev et al. (2010). Surface boundary conditions (wind stress and surface heat flux components) were calculated using bulk formulae from data generated by the operational forecast model HIRLAM (High-Resolution Limited Area Model). HIRLAM is used and maintained by the Estonian Weather Service and has a spatial resolution of 11 km and a daily forecast interval of 1 h for a total forecast length of 54 h (Männik and Merilain, 2007). All meteorological parameters were interpolated to the model grid. Model simulation was performed from 1 April 2010 to 31 December 2019.
Open-boundary conditions were used in the Danish Straits. Inflow and outflow from the model is barotropically controlled using sea surface height measurements from Gothenburg station and, more specifically, Flather (1994) radiation. In terms of temperature and salinity, the model is relaxed towards climatological profiles along the open-boundary using sponge layer factors according to the method of Martinsen and Engedahl (1987). The simulation used freshwater input from the 54 largest Baltic Sea rivers, together with their interannual variability as reported in HELCOM (Johansson, 2016). The riverine input is treated as a rise in the sea surface height and each river has a prescribed constant salinity of 0.5 g kg−1 that is diluted in the corresponding grid cell. River water temperature is assumed to be the same as that in the target cell.
The initial thermohaline field was taken from the Copernicus reanalysis of the Baltic Sea for the period 1989–2014. As the product provides a horizontal resolution of 3 nmi (approximately 5.56 km) and a vertical resolution from 5 m at the surface up to 50 m in the near-bottom layers, it was interpolated to the target grid. Model simulations started from a motionless state, that is with initial sea surface height and current velocity set to zero. Previous studies (e.g., Lips et al., 2016) have shown that wind-driven circulation in the Baltic Sea adjusts to forcing within 5 d. Model validation used available Ferrybox data (2011–2016) along the Tallinn to Helsinki transect (see Fig. 1 for location). The model captures the observed variability of temperature and salinity reasonably well (Fig. 2). SDs of simulated temperature and salinity for the overall (1 November 2011–1 June 2016) and wintertime (December to March 2011–2016) periods are close to observations. The SD of simulated salinity is smaller than the observed values for winter 2016 (January–March) and larger for 2012, while for 2014 it is close to the observed values. The variability of temperature is captured well – SDs from the simulations are at least 0.8 of the observed for all time periods, although the model slightly overestimated temperature variability for the winter of 2012.
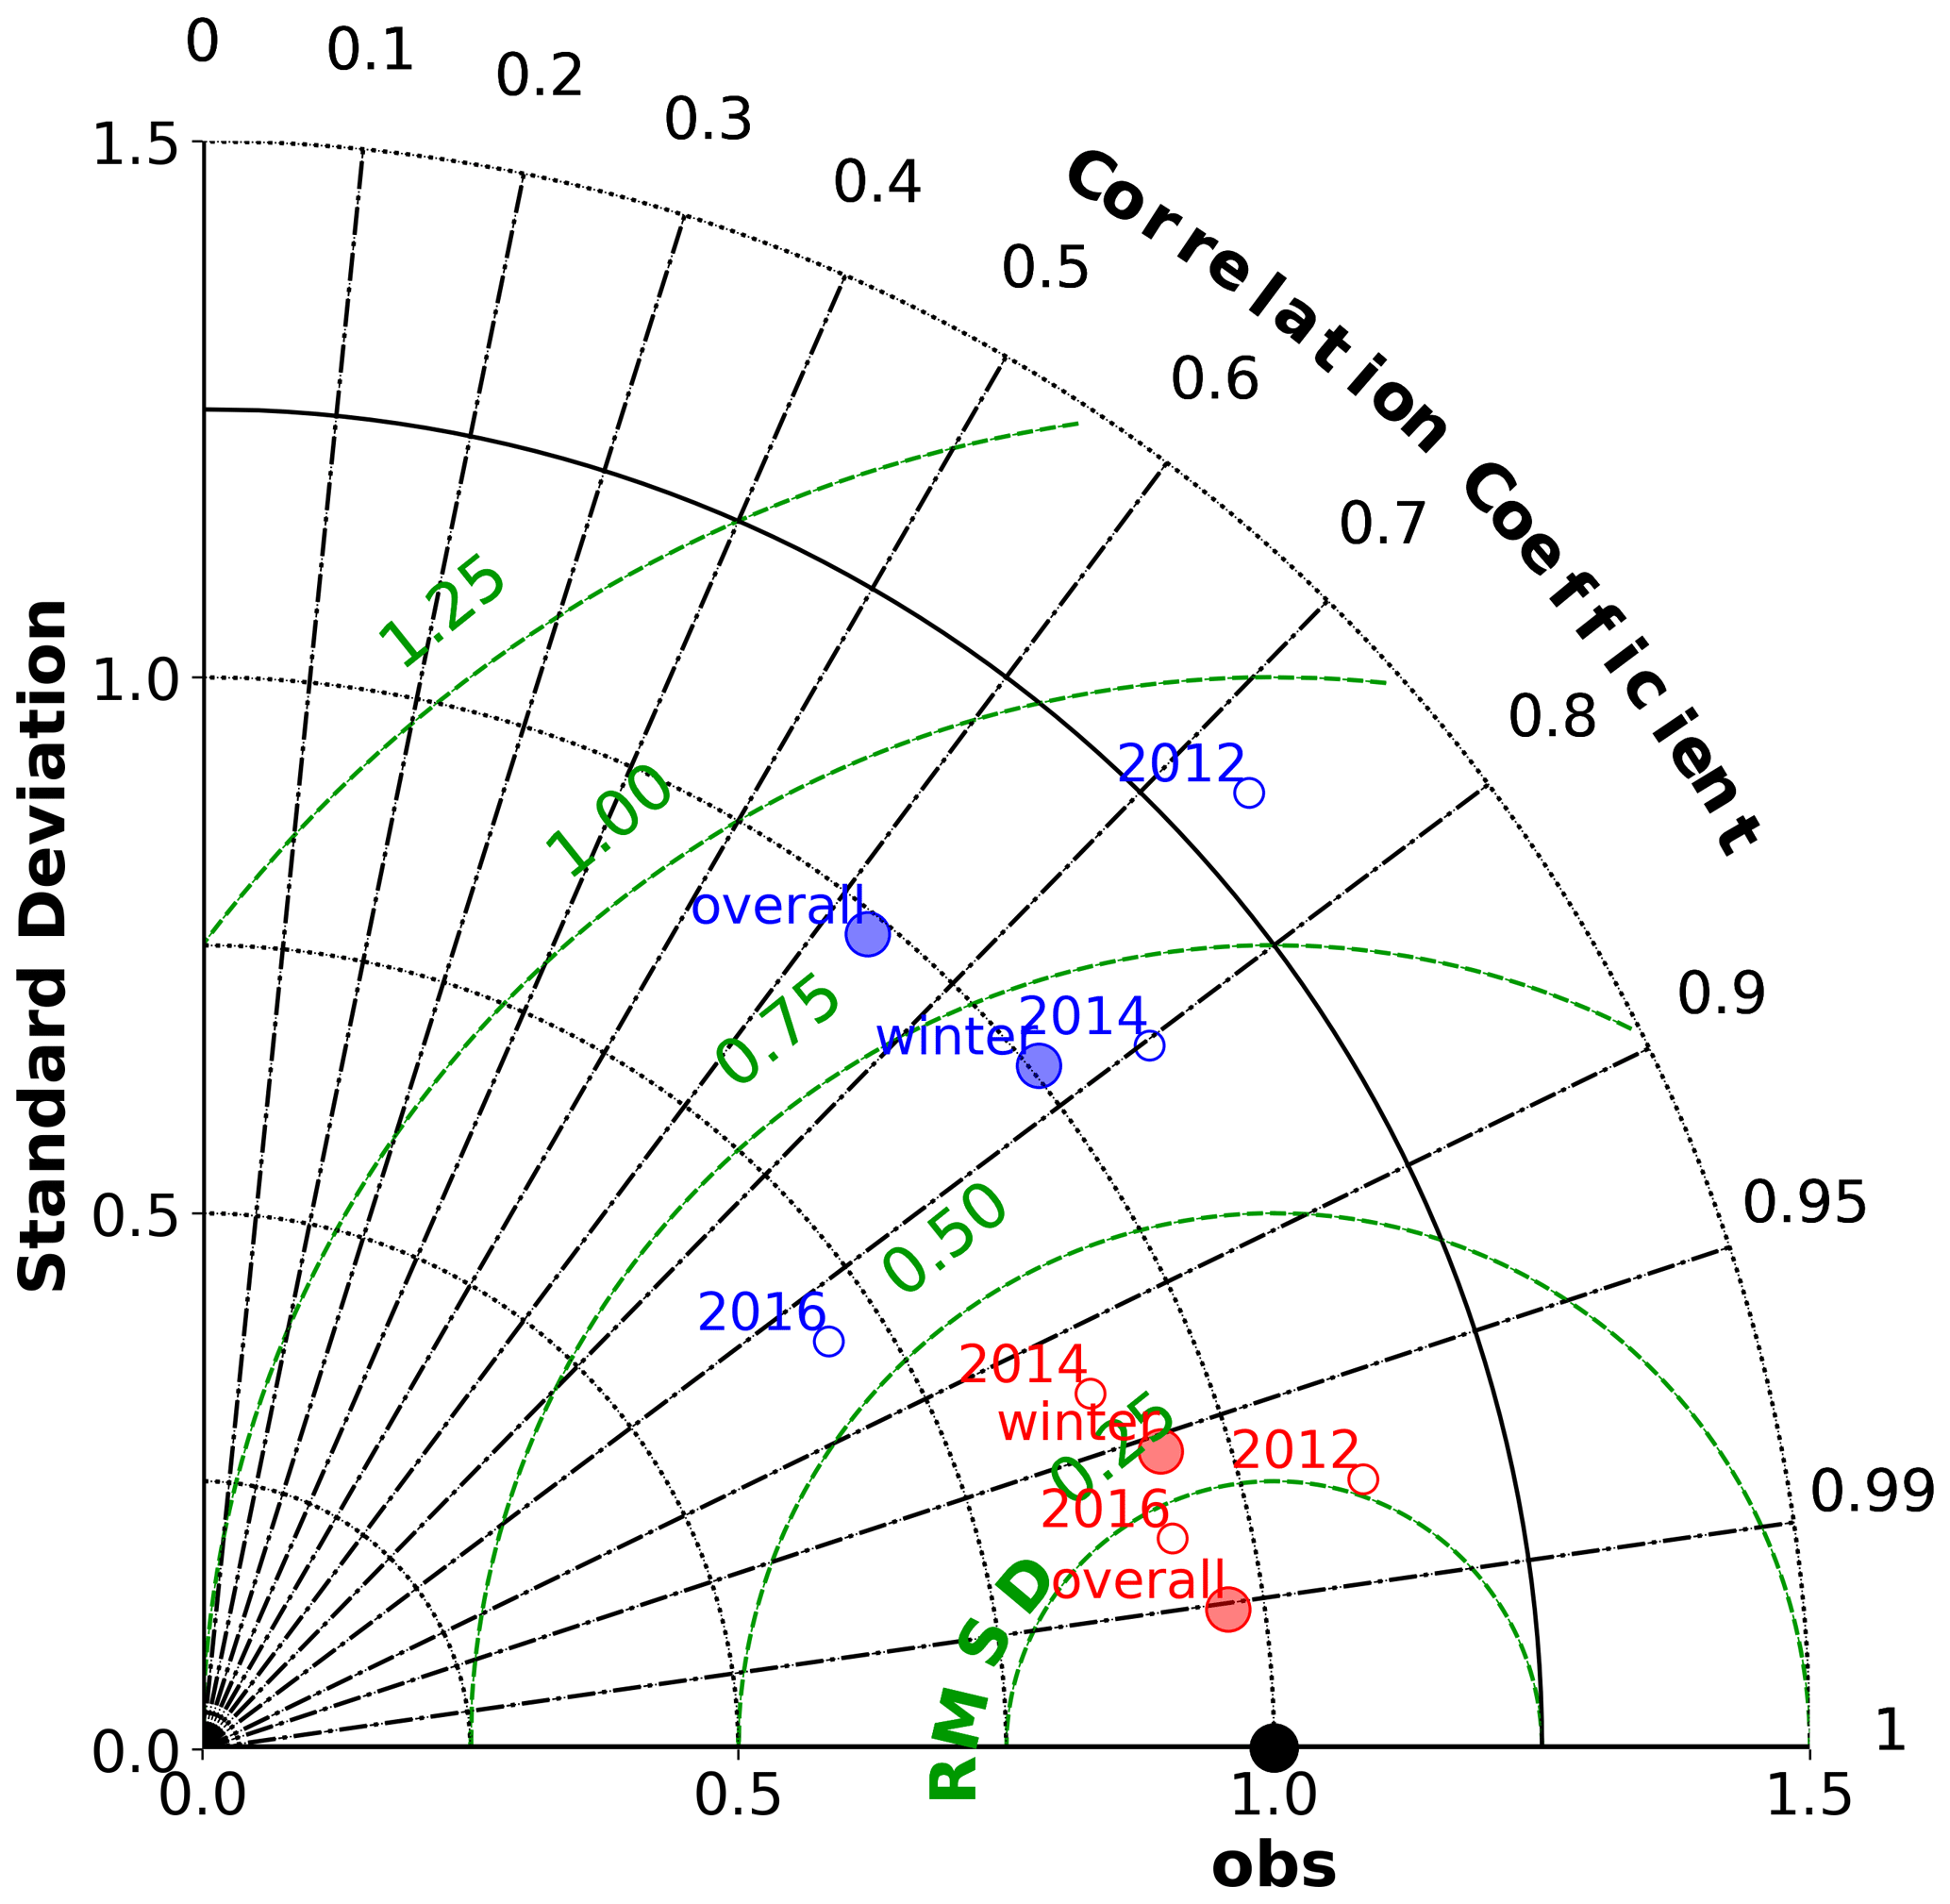
Figure 2Taylor diagram of simulated and measured temperature (red) and salinity (blue) along the Ferrybox transect from Tallinn to Helsinki. Overall – all available observations from 1 November 2011 to 1 June 2016 (filled circles); winter – all available observations from December to the end of March, 2011–2016 (filled circles) and winter observations from January–March in 2012, 2014, and 2016 (open circles).
The overall correlation coefficient for salinity is 0.62, while it is over 0.74 for both the whole wintertime period and single years as well. There is a higher correlation for temperature (as expected); overall correlation, which includes seasonal variability, is 0.99, and for wintertime, it is 0.95. Very high correlation (>0.94) for temperature is also shown for individual winters. Root mean squared differences between model and observed values are slightly larger for salinity but do not exceed the observed variability. In general, the model captures wintertime changes in the surface layers of the Gulf of Finland well. More details about model setup and validation in the Baltic Proper are given in Zhurbas et al. (2018).
4.1 Onset of stratification and its link to wind forcing
To demonstrate the link between wind forcing, the onset of stratification, and an increase in Chl a, we analyzed temperature, salinity, density, and Chl a distributions along the gulf thalweg together with wind data for the winters of 2011/12 and 2013/14. Prior to the survey of 21 December 2011, there was a strong westerly wind with a maximum along-gulf wind stress of 1.3 nm−2 (Fig. 3a). Cumulative wind stress increased by 6 nm−2 d from 1 November to 21 December, resulting in a warm (>5 ∘C, Fig. 4a), relatively salty (>6.3 g kg−1, Fig. 4b) and well-mixed water column in the gulf (Fig. 4c). Chl a concentrations were very low, below 1 mg m−3 (Fig. 4d). Prior to the survey on 24–25 January 2012, weaker easterly winds had prevailed since mid-January (Fig. 3a). Lower temperature (3–4 ∘C, Fig. 4e) in the upper 20 m coincided with slightly fresher water on 24–25 January 2012 (Fig. 4f). A salinity minimum (down to 5.8 g kg−1) caused stratification in the upper layer (Fig. 4g) at a distance of 80–110 km in the section; this location was also characterized by slightly higher Chl a concentration (up to 1.5 mg m−3) (Fig. 4h). Variable and relatively weak winds prevailed in late January and early February (Fig. 3a). On 7–8 February 2012, the temperature of the upper layer was below Tmd (2.7 ∘C) (Fig. 4i), salinity was low (4.8–6.0 g kg−1, Fig. 4j), and there was a marked stratification and shallow UML (Fig. 4k). Higher Chl a concentration, occasionally >2 mg m−3, was seen in the fresher and colder water along the section (Fig. 4l). Lateral Chl a extent was closely linked to the salinity (density) structure, with higher Chl a concentration associated with lower salinity and vice versa. Westerly winds prevailed in the period before the next survey at the end of February (Fig. 3a), resulting in well-mixed conditions and relatively high salinity (6.0–6.7 g kg−1) in the western part of the section on 29 February (Fig. 4m and n). Lower salinity, stronger stratification, and slightly higher Chl a in the upper layer were observed in the central part of the section (Fig. 4n–p). The eastern part of the section was not visited on 29 February due to ice conditions. In the middle of March (15–16 March) the water temperature was still well below Tmd and strong haline stratification was observed along the whole transect (Fig. 4r–t). Chl a concentrations in the upper layer were within the range of 2–4 mg m−3 (Fig. 4u).

Figure 3Time series of an along-gulf component of wind stress (black curve, positive eastward) and cumulative along-gulf wind stress (red curve), based on wind data measured at Tallinnamadal Lighthouse in the Gulf of Finland: (a) 1 November 2011 to 20 March 2012; (b) 1 November 2013 to 21 March 2014; (c) 1 November 2011 to 20 March 2016.
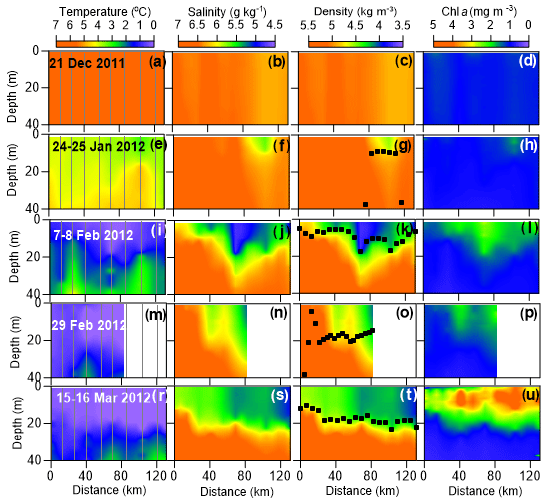
Figure 4Vertical sections of temperature, salinity, density anomaly, and Chl a along a west-to-east transect in the Gulf of Finland (black dots in Fig. 1) in winter 2011/12. Vertical gray lines mark the location of CTD casts. Black dots on density anomaly panels mark the depth of the upper mixed layer.
Similar trends in wind forcing and spatiotemporal patterns of temperature, salinity, density, and Chl a were observed in winter 2013/14. Strong westerly winds dominated until early January 2014, with an increase in cumulative wind stress of 10 nm−2 d from 1 November 2013 (Fig. 3b). The 9–10 January 2014 survey shows a well-mixed water column and low Chl a (Fig. 5a–d). Fresher and colder water was found in the upper layer on 3–4 February (Fig. 5e and f). Lower temperature and salinity caused stratification in the upper layer (Fig. 5g) and slightly higher Chl a concentration (Fig. 5h). By 4–5 March, the area of fresher (salinity <6 g kg−1) and colder water had expanded (Fig. 5i and j). The shallow UML extended over most of the section (Fig. 5k). The cold and fresher upper layer showed higher Chl a concentrations, up to 3 mg m−3 (Fig. 5l).
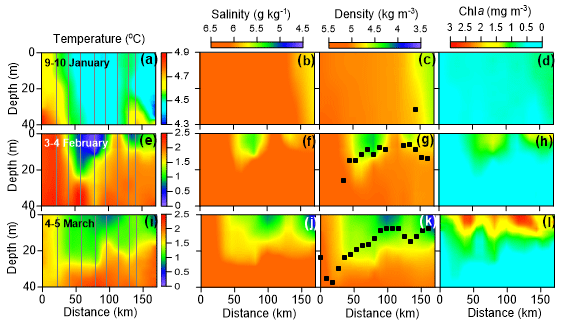
Figure 5Vertical sections of temperature, salinity, density anomaly, and Chl a along a west-to-east profile in the Gulf of Finland (orange crosses in Fig. 1) in winter 2013/14. Vertical gray lines mark the location of CTD casts. Black dots on density anomaly panels mark the depth of the upper mixed layer. Deviating color scale for temperature on 9–10 January was used.
Thus, haline stratification and elevated Chl a concentration was observed in both winters (2011/12 and 2013/14) from the beginning of February. A shallow UML (<20 m) was absent after prevailing westerly winds and when SST was >Tmd. Stratification formed as fresher water occupied the upper layer.
To examine temporal trends in haline stratification in more detail, we analyzed across the gulf changes in temperature and salinity using measurements acquired by the Ferrybox system along the Tallinn–Helsinki transect for January–March 2012, 2014, and 2016 (Fig. 6). Generally, temporal changes in salinity and temperature along the transect were quite similar for each of the study years, as was wind forcing (Fig. 3). Strong westerly winds dominated until early or mid-January, and after the relaxation of wind forcing, fresher water was recorded in the transect.
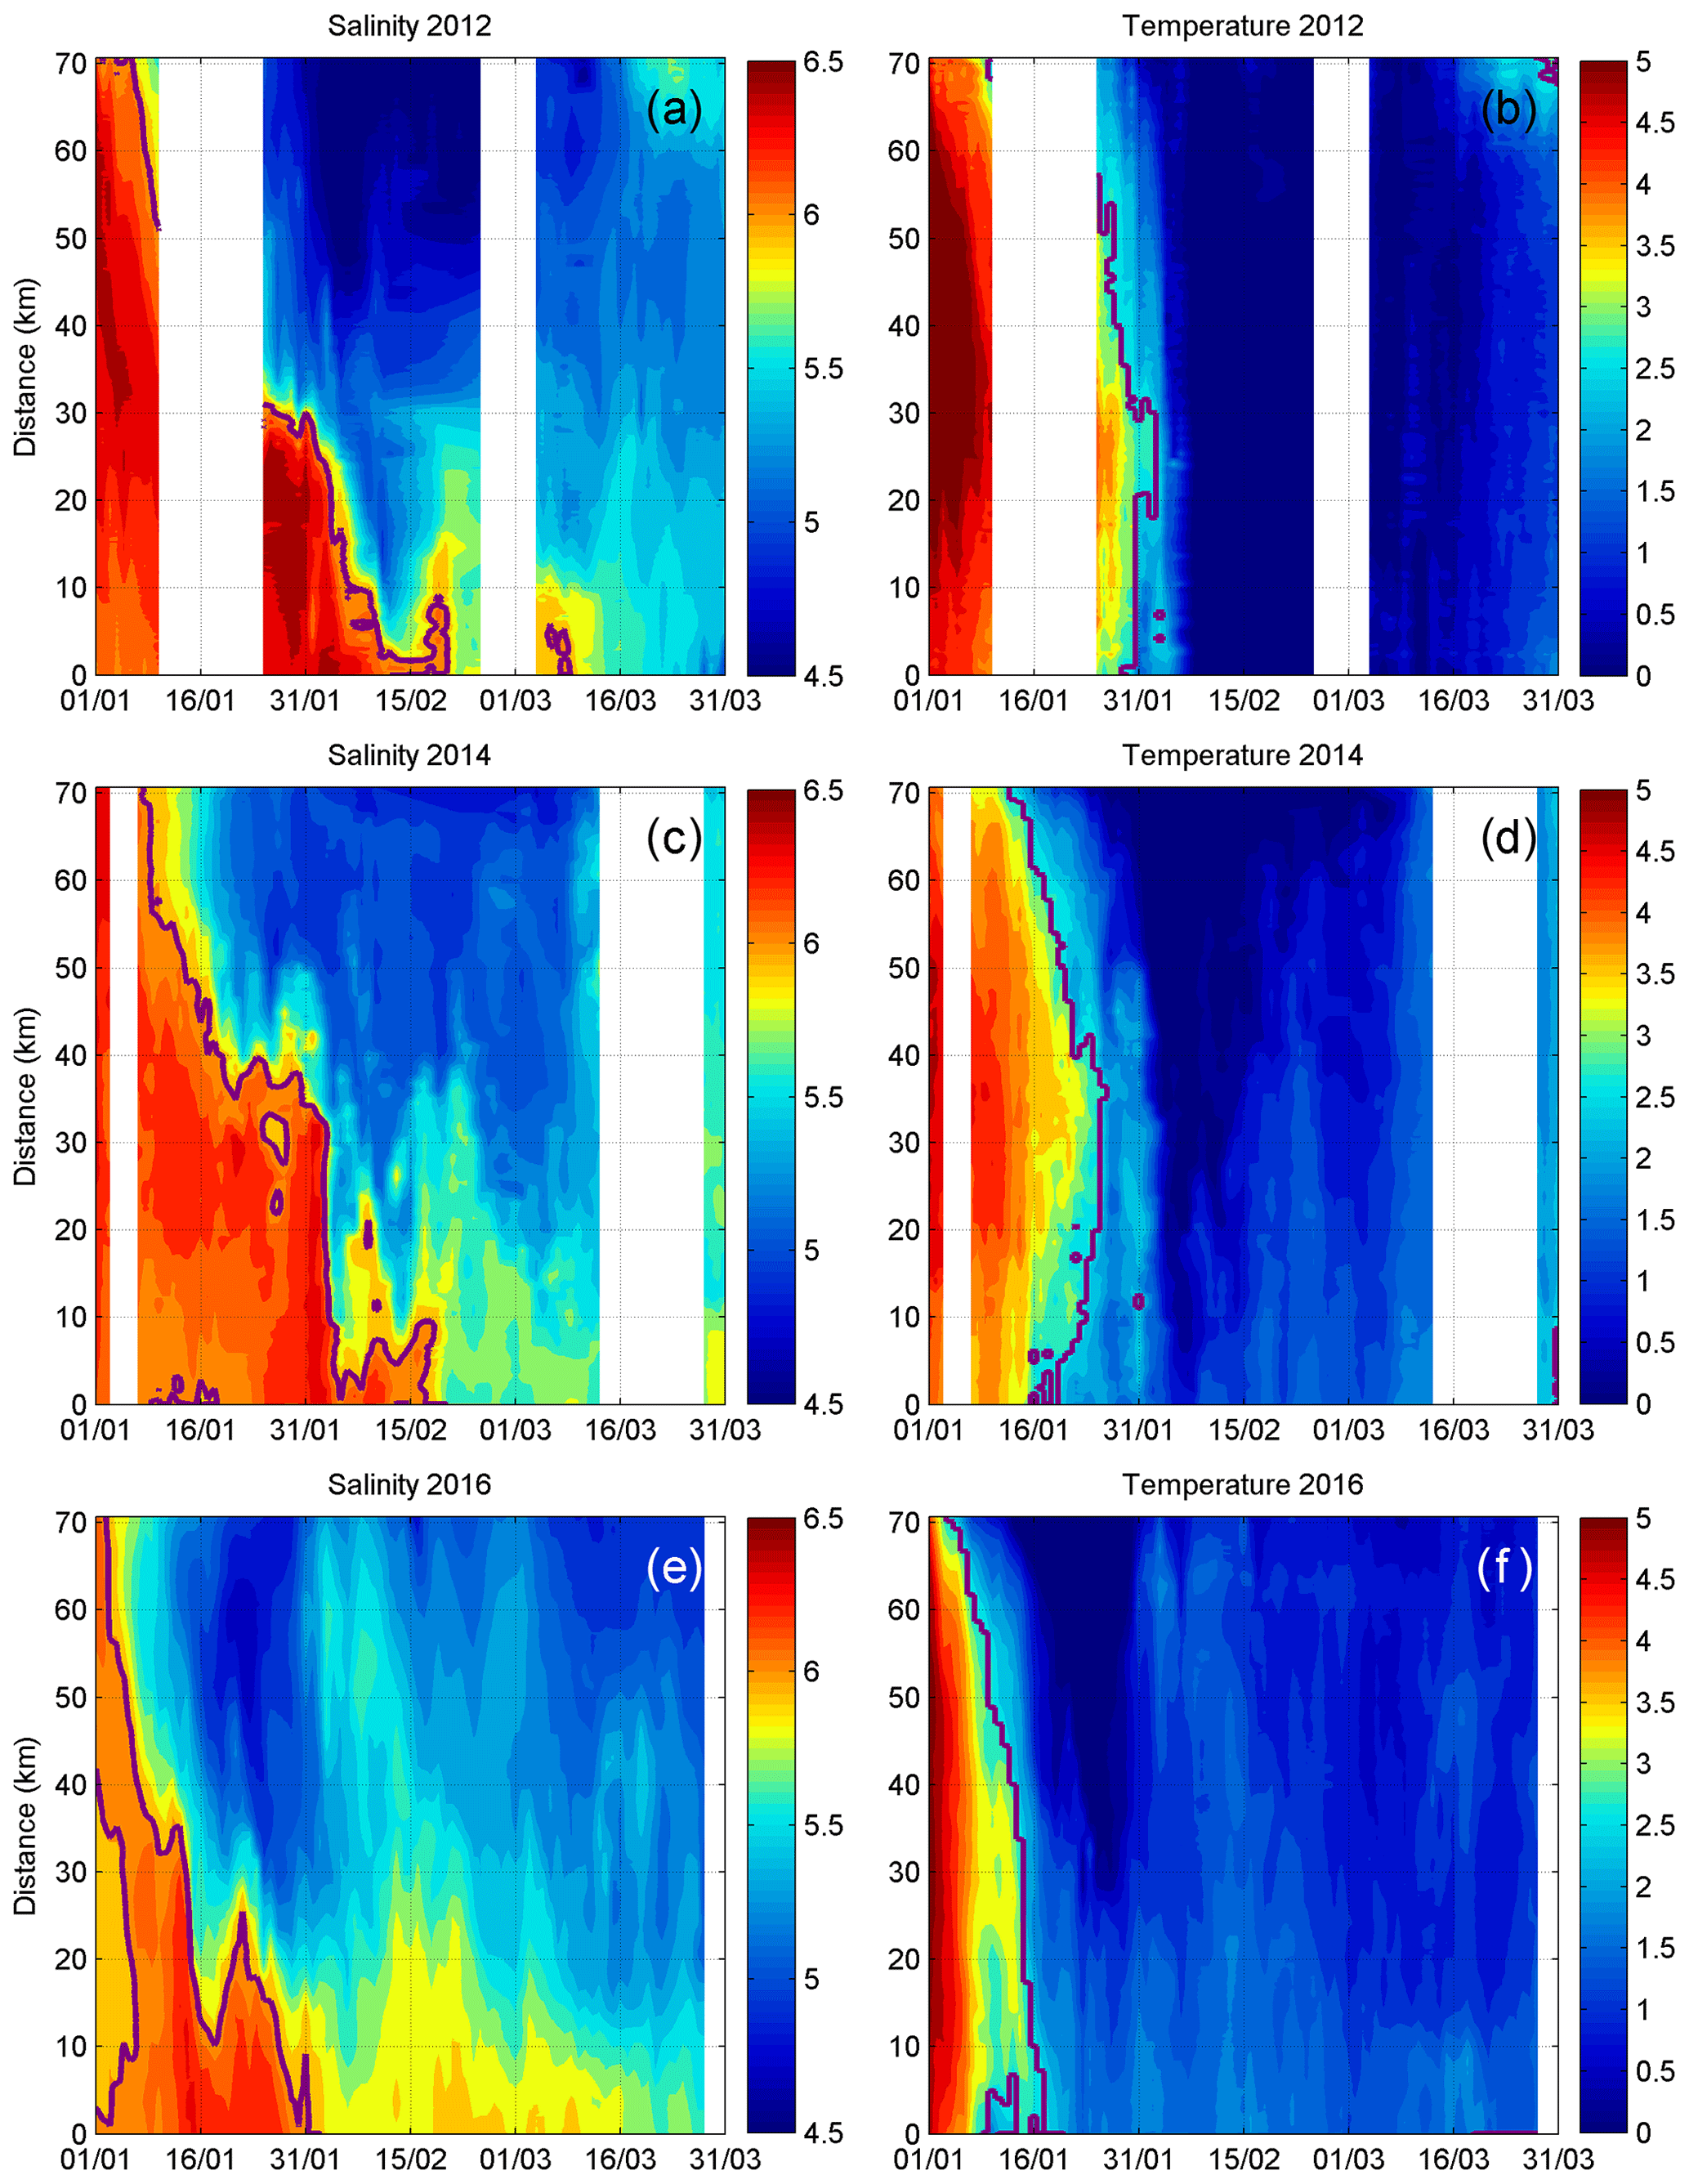
Figure 6Salinity g kg−1 (a, c, e) and temperature (∘C) (b, d, f) of the upper layer along a transect from Tallinn to Helsinki (red line in Fig. 1) in January–March 2012, 2014, and 2016. The isoline 6 g kg−1 is marked on the salinity plots and the maximum density temperature Tmd on the temperature plots. The starting point of the transect (x) = 0 km is in the Bay of Tallinn at 59 500∘ N and 24 752∘ E.
Based on observations at the longitudinal sections (Figs. 4 and 5), the highest sea surface salinity at which stratification and relatively shallow UML can form was assumed as 6 g kg−1. Similar to the along-gulf observations (Fig. 4a and b), salty and warm water occupied the transect at the beginning of January 2012 (Fig. 6a and b). The northern part of the transect was covered in fresher water (<6 g kg−1) by the end of January, although salinity slightly increased in the southern part of the section at this time. Since the main sources of freshwater are in the east, water must have flown westward along the northern coast. The area covered by fresher water widened to almost the entire section by mid-February. Water temperature declined below Tmd in the northern part in the first half of January, while in the central and southern part of the section temperature dropped below Tmd by the end of January. A similar spatiotemporal pattern in sea surface salinity was observed in 2014 and 2016 (Fig. 6c and g). Fresher water first appeared in the northern part in the first half of January in both 2014 and 2016 (Fig. 6c and g). The onset of haline stratification occurred slightly earlier in 2016 due to wind forcing – the westerlies had eased off by the end of December 2015 (Fig. 3c). The segment covered by fresher water widened during January and most of the transect was occupied by water with salinity <6 g kg−1 at the end of January 2016 and in mid-February 2014. Thus, stratification related to the spreading of fresher water forms about 1 month earlier in the northern part of the gulf than in the southern part.
4.2 Spatiotemporal patterns of restratification
Here, we examine the spatiotemporal pattern of the restratification process using model simulation data and statistics of historical observations. As noted from the in situ observations, haline stratification forms after the relaxation of westerly winds. The annual cycle of the along-gulf component of wind stress shows higher monthly mean values (>0.04 nm−2) and higher variability from October to January (Fig. 7); this means that strong westerly winds are more frequent and storminess is higher in these months. As a consequence, UML depth <20 m was infrequent and mean UML depth varied between 40 and 60 m in the western and central gulf in November, December, and January 2010–2019 (Fig. 8). As an exception, the probability of UML depth <20 m was 30 %–40 % in the northern part of the eastern area in January. Winds from the west are weaker and storms are less frequent in February and March (Fig. 8). In February, the occurrence of UML depth <20 m increased to 50 %–60 % (Fig. 8), although in the southern and western parts of the gulf, mean UML depth was 30–40 m. The statistics from model simulation data agree well with our observations of westward advection of fresher water from the northern coast (Fig. 6a, c and g). Mean UML depth was 20 m or lower in the central part of the gulf in March and thicker at the gulf entrance (Fig. 8); the occurrence of UML depth <20 m was >60 % in the central part, around 50 % at the gulf entrance, and much lower to the west of longitude 22∘ E (Fig. 8). A similar pattern is shown in the mean occurrence of the density difference between 40 m depth and the sea surface of >0.5 kg m−3, based on in situ measurements for the period 1904–2020 (Fig. 9): occurrence was 40 %–75 % in the central part of the gulf, 30 %–50 % in the entrance of the gulf, and <5 % further to the west. Thus, wintertime upper-layer stratification extends to 23∘ E in the western gulf.

Figure 7Annual cycle of an along-gulf component of wind stress. Mean (solid black curve, positive eastward) and 75 and 25 percentiles (dashed lines) are based on data from 1981 to 2015, measured at Kalbådagrund Lighthouse, Gulf of Finland.
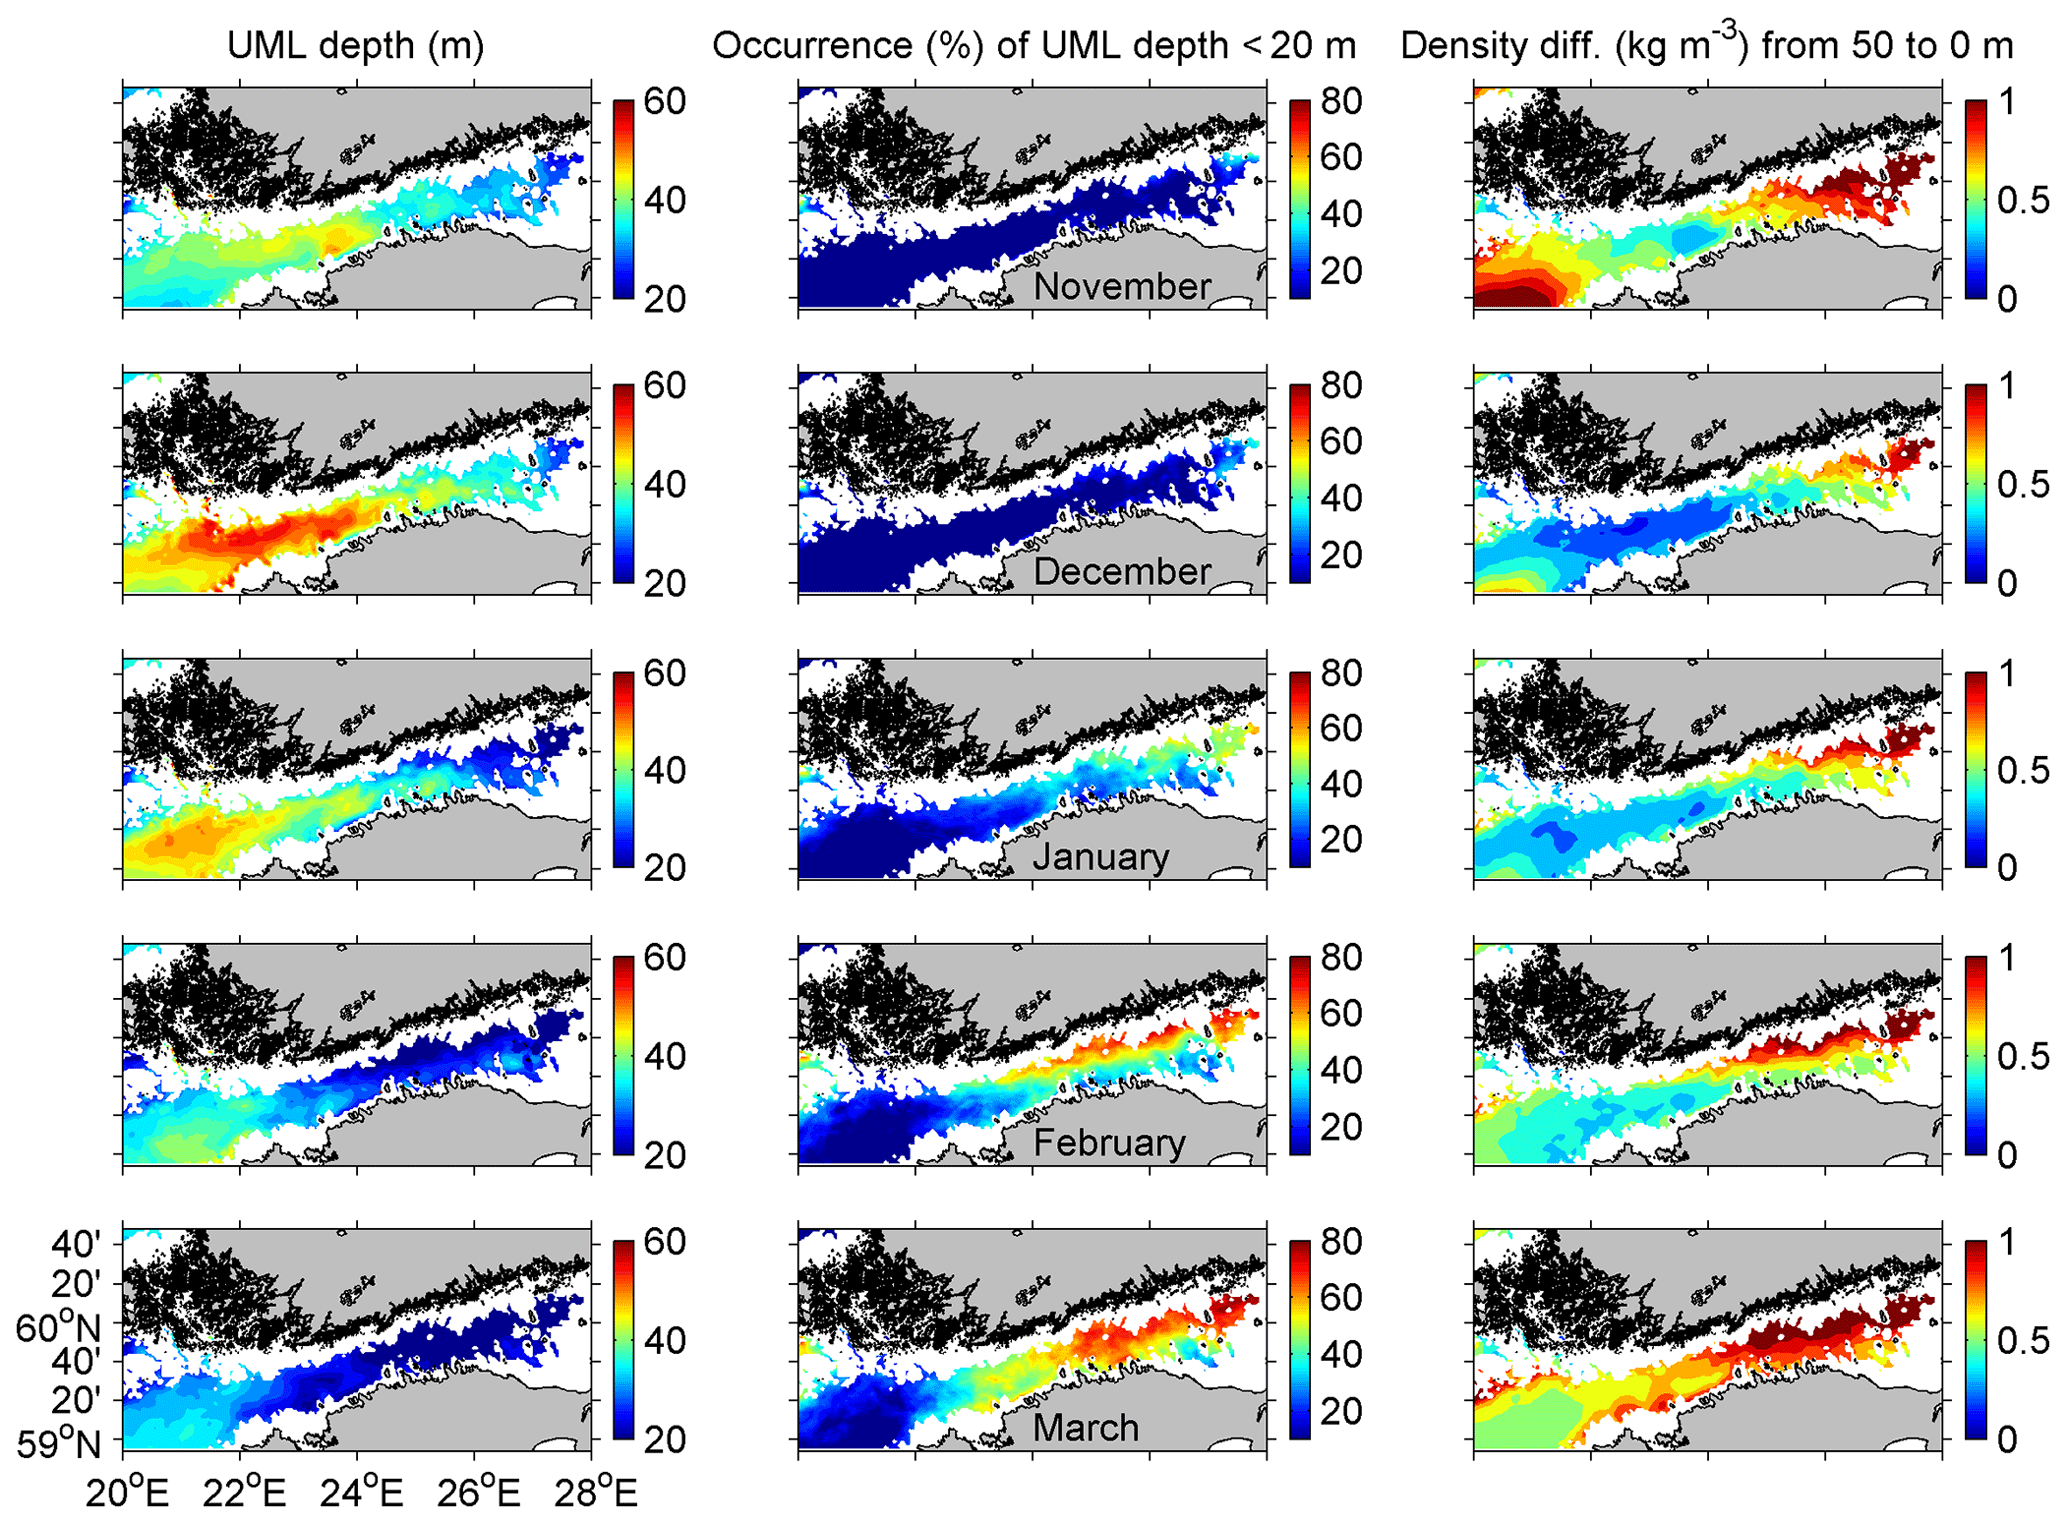
Figure 8Mean simulated upper mixed-layer (UML) depth, percent occurrence of UML depth <20 m, and density difference between 50 and 0 m depth from November to March, 2010 to 2019.
Figure 9The occurrence of >0.5 kg m−3 density difference between 40 m depth and the sea surface in the Gulf of Finland from January to March 1904–2020. A total of 2560 temperature–salinity data pairs for the surface layer and 40 m depth are included.
Model simulation data (2010–2019) were used to examine the development of UML depth from November to March in the Gulf of Finland, the Eastern Gotland Basin (Fig. 10a and b), and along a transect from the northern Baltic Proper to the central Gulf of Finland (Fig. 10c). The time series of mean UML depth for transects in the gulf (thalweg GoF, Fig. 1) and the Eastern Gotland Basin (box, Fig. 1) showed considerable synoptic and interannual variability, especially in the gulf (Fig. 10a–c). The maximum mean UML depth in the gulf mostly occurred in December and the beginning of January, mostly before SST decreased to Tmd (Fig. 10a and b). The onset of restratification occurred at temperatures below Tmd (Fig. 10b). The temperature dropped below Tmd later and rose above Tmd earlier in the Eastern Gotland Basin compared to the gulf. In 5 winters out of 10, SST did not fall below Tmd in the Eastern Gotland Basin (Fig. 10b). However, whether the temperature was below Tmd or not, restratification phenomenon was absent from the upper layer in the Eastern Gotland Basin in January–March; this means that buoyancy, created by slight thermal stratification at <Tmd, is overshadowed by vertical mixing in the Eastern Gotland Basin. Vertical mixing also dominated in the Gulf of Finland in November–December. Still, from late January or early February, the advection of fresher water (Fig. 6a, c and g) creates a shallow mixed layer (Fig. 10a and b).
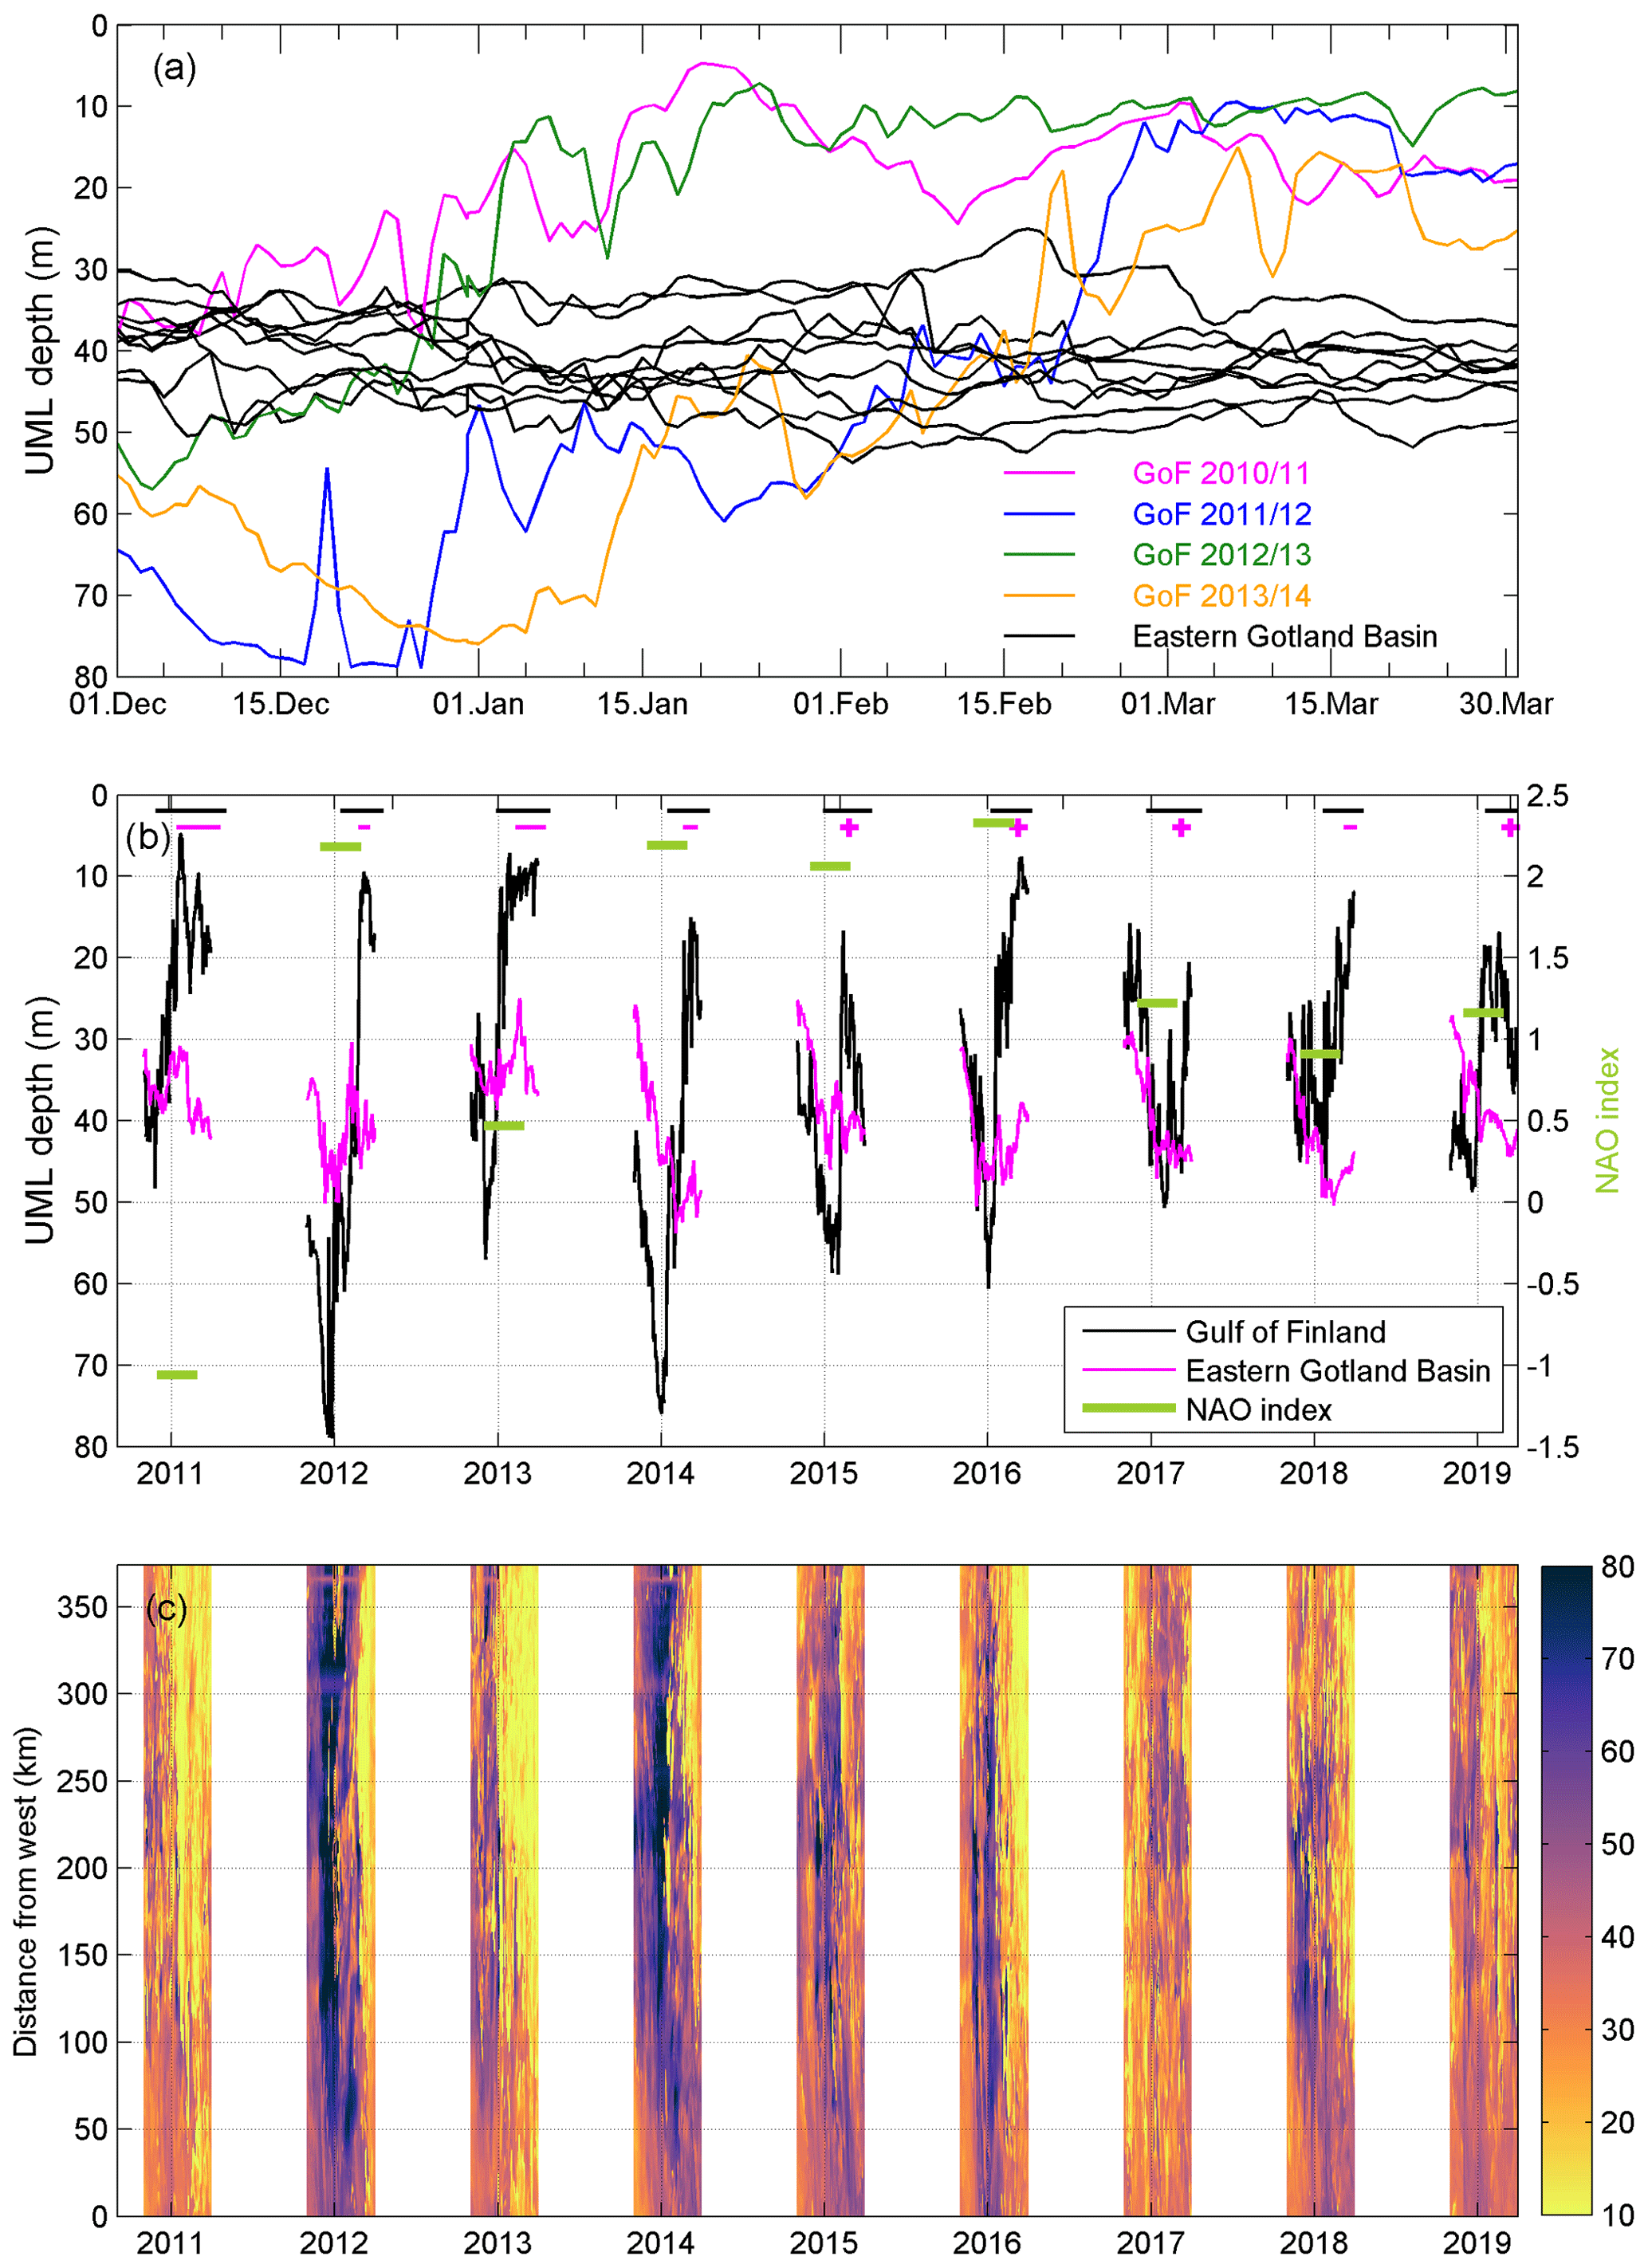
Figure 10(a, b) Time series of mean upper mixed-layer depth in the Gulf of Finland and Eastern Gotland Basin based on model simulation data from November to March 2010 to 2019. The areal mean in (a) is calculated for the selected transect in the Gulf of Finland (thalweg GoF, Fig. 1) and for the box in the Eastern Gotland Basin (Fig. 1). Only the selected four winters are shown for the Gulf of Finland to illustrate the difference between years with a high positive NAO index (2011/2012, 2013/2014) and low NAO index (2010/2011, 2012/2013), but all winters 2010–2019 are shown for the Eastern Gotland Basin in (a). In (b), green horizontal lines mark the mean December–February NAO index (from Jones et al., 1997); black and pink horizontal lines mark where the OSTIA SST is below Tmd, and pink crosses indicate where the minimum winter temperature did not fall below Tmd in the Eastern Gotland Basin. (c) The depth of the upper mixed layer along the transect from the northern Baltic Proper to the central Gulf of Finland (thalweg in Fig. 1) for November to March 2010 to 2019.
The deepest UML occurred in the gulf in the winters of 2011/12 and 2013/14 (Fig. 10a and b), i.e., precisely the years when measurements along the thalweg also showed deep UML in the gulf (Figs. 4 and 5). The deeper UML is associated with the estuarine circulation reversal caused by strong westerly winds, while restratification occurs after prevailing easterly winds (Figs. 3–5). The frequency of westerly (easterly) winds over the Gulf of Finland in winter is positively (negatively) correlated to the NAO index (Jaagus and Kull, 2011). The strong reversal event and deep UML in winter 2011/12 were accompanied by a high positive NAO index. The mean December to February NAO index in 2011/12 was 2.18. Likewise, the mean NAO index in the other three winters (2013/14, 2014/15, 2015/2016) when mean UML depth in the gulf reached 60 m or deeper was >2 (Fig. 10b). The winters of 2010/11 and 2012/13, which stand out in the time series with restratification (shallow UML) onset in early January, had the lowest December–February average NAO indices during the period 2010–2019: −1.06 and 0.47, respectively (Fig. 10a and b). Thus, large-scale atmospheric forcing provides conditions for the restratification process. A low NAO index and easterly winds support restratification, while a high NAO index and westerly winds have the opposite effect.
Positive net buoyancy flux is required for the onset of stratification in the upper layer. Processes causing negative buoyancy fluxes include vertical mixing caused by wind stirring, current shear, and convection. Positive buoyancy fluxes result from advection (arrival) of lighter water to the sea surface or of denser water to the subsurface. Likewise, warming of the surface layer at temperatures above Tmd or cooling below Tmd strengthens stratification. The magnitude of positive buoyancy imparted from the cooling of water below Tmd is rather small. If we consider salinity of 6 g kg−1, the density difference between waters at Tmd (2.8 ∘C) and freezing temperature (−0.3 ∘C) is 0.07 kg m−3. This is the maximum density change if the water temperature is below Tmd and salinity is 6 g kg−1. We get the same density difference if we keep temperature constant (1 ∘C) and vary salinity by 0.09 g kg−1. Our data show that changes in sea surface salinity in winter are of the order of 1–2 g kg−1 (Fig. 6a, c and g), so the effect of salinity change to the density and buoyancy flux is about 10–20-fold higher than the effect of temperature change in the gulf. We can conclude that fresher water advection from the east is the primary source of buoyancy for the development of the stratification.
Freshwater transport is controlled by wind forcing; easterly winds support advection of fresher water to the west, while westerly winds impede it (Liblik and Lips, 2012). However, if fresher water is already present along the north coast of the gulf, westerly winds spread it to the south due to Ekman transport and create stratification there (Figs. 3 and 6), as noted in summer also by Pavelson et al. (1997). To exemplify the processes, three snapshots from the Gulf of Finland in 2011/2012 are illustrated in Fig. 11. When strong westerly winds dominated in November until the beginning of January (Fig. 3a), estuarine circulation reversal led to the vanishing of stratification (Fig. 4c), the deep UML formed, and riverine water transport to the west was blocked (Fig. 11a). Easterly winds dominated from 14 January to 5 February, and as a result, westward advection of fresher water along the northern coast of the gulf and formation of shallow UML were observed (Fig. 11b). Westerly wind impulse on 5–8 February caused Ekman transport of surface layer fresher water to the south, thus expanding the area of shallow UML (Fig. 11c) and preconditioning the surface water for phytoplankton growth. Due to the instability of baroclinic jets at the density fronts, filaments formed which transport the saltier water to the north and fresher water to the south (Fig. 11c). The widening of shallow UML and elevated Chl a concentration was also observed from measurements along the gulf thalweg (Fig. 4k and l). The stratification and phytoplankton bloom initiated by eddy-driven stratification has also attracted attention in other areas in the recent decade (e.g., Mahadevan et al., 2012; Mikaelyan et al., 2020).
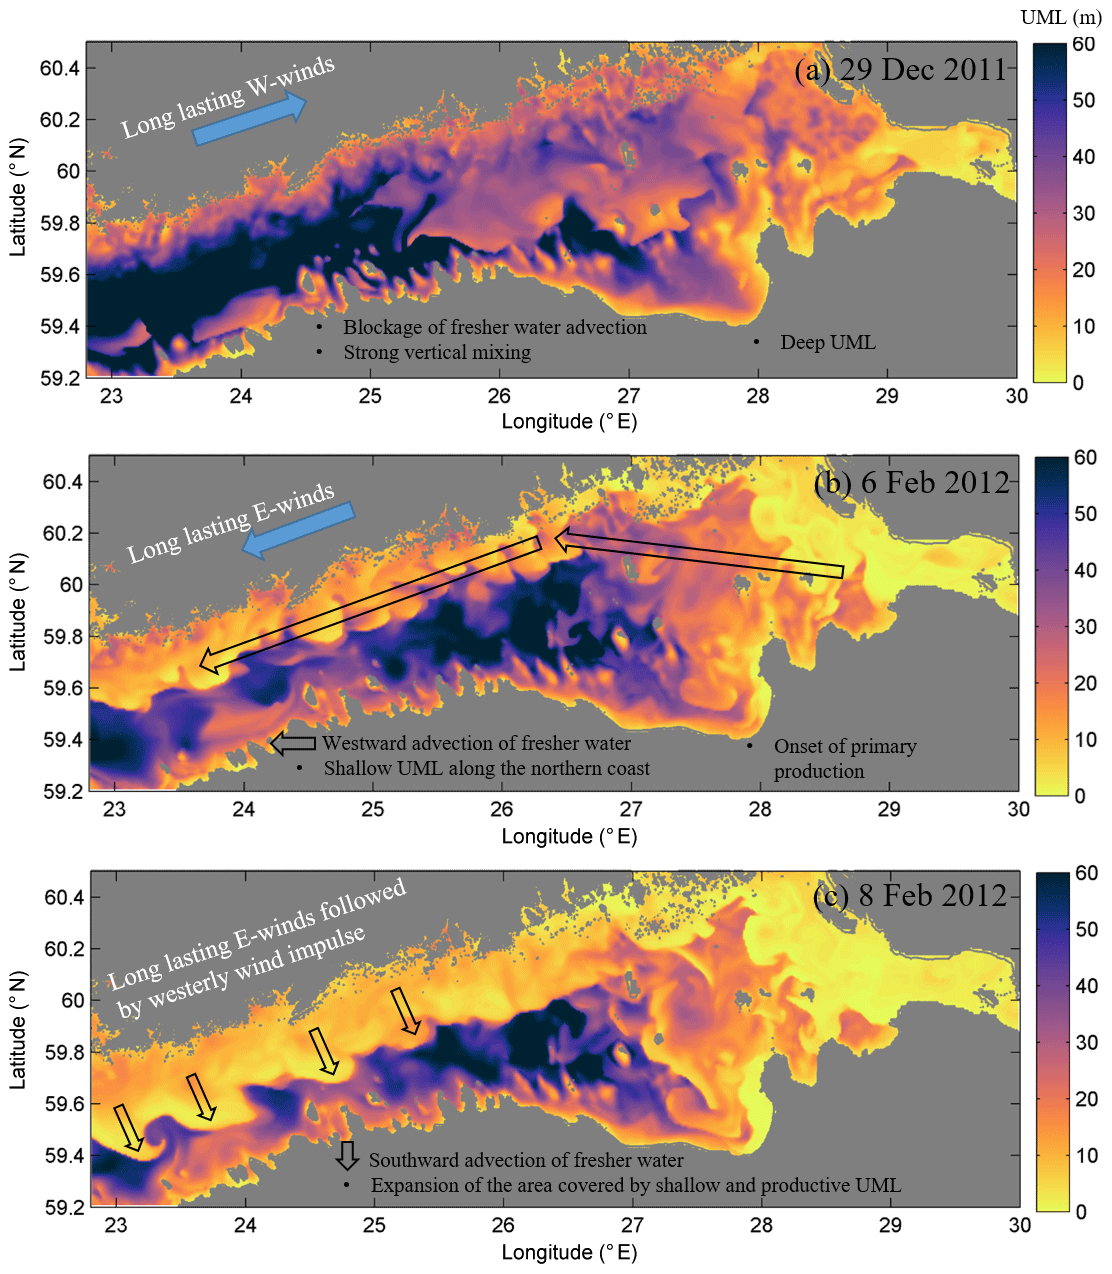
Figure 11Upper mixed-layer depth (m) based on model simulation data in the Gulf of Finland on (a) 29 December 2011, (b) 6 February 2012, and (c) 8 February 2012. Strong westerly winds dominated before 29 December 2011. Easterly winds prevailing before 6 February 2012 were followed by a westerly wind impulse (see Fig. 3a).
Wintertime stratification phenomena in nearshore regions, extending 10–20 km from the coast, have been reported in several locations in the Baltic Sea (Granskog et al., 2005; Kari et al., 2018; Merkouriadi and Leppäranta, 2015). However, these studies were concerned with stratification under the ice, whereas in our study of the Gulf of Finland, we have shown that wintertime stratification may also occur at the basin scale (along-gulf extent 400 km) and in the absence of considerable ice coverage. During the onset of restratification in late January 2012, the Gulf of Finland was virtually ice-free. In both winters (2011/12 and 2013/14), only the eastern part of the Gulf of Finland and the adjacent northern shore of the gulf were ice-covered at the end of January. It should be noted that, along with the frequency of easterly winds, a low NAO index is also associated with increased ice coverage (Jaagus, 2006). The landfast ice zone would be expected to prevent vertical mixing and therefore supports lateral advection of riverine fresher water (Granskog et al., 2005).
The western border of the observed stratification phenomenon is around 23∘ E, i.e., at the entrance area to the gulf between Hiiumaa Island and the Finnish coast (Fig. 1). The absence of the phenomenon in the Baltic Proper can be explained by the long distance from rivers, its larger size, and wide shape (Fig. 1). Riverine input per unit area in the Gulf of Finland is 7–8 times larger than in the Baltic Proper (Leppäranta and Myrberg, 2009). As the wintertime stratification phenomenon vanishes at the wider entrance area to the Gulf of Finland, it is likely that the elongated and narrow shape of the gulf also contributes to the formation of stratification in addition to high freshwater input. In the northern part of the Gulf of Finland, the occurrence of the shallow (<20 m) UML reached over 50 % in February, and in the southern part, it reached over 50 % in March. The interannual variability of UML depth can be related to the NAO index (Janssen et al., 2004). A high positive NAO index is associated with high wind stress, low ice cover, strong upwelling or downwelling (Janssen et al., 2004), and estuarine circulation reversal events (Liblik et al., 2013; Lilover et al., 2017; Lips et al., 2017; Suhhova et al., 2018). Enhanced vertical transport by upwelling or downwelling, wind stirring, and reversal events cause vertical mixing, deepening of the UML, and upward transport of nutrients from the deeper layers (Janssen et al., 2004; Lilover and Stips, 2008; Lips et al., 2017). Conversely, a low NAO index supports the restratification and consumption of nutrients in the Gulf of Finland, while the vertical mixing of nutrients from the deeper layer is modest.
We observed Chl a of up to 3.0 and 4.5 mg m−3 from February to the first half of March, respectively, in 2012 and 2014, i.e., comparable with the mean Chl a concentrations in summer in the Gulf of Finland (Kononen et al., 1998; Suikkanen et al., 2007). The higher Chl a concentration coincided with a cold and fresher upper layer and stronger stratification. The distribution of phytoplankton biomass concentration (Fig. 12) generally follows Chl a structure (Fig. 5) in winter 2014. The observed winter biomass concentrations were much lower compared to summer values in the Gulf of Finland (Kononen et al., 1998, 1999). This discrepancy is probably related to the biomass∕Chl a ratio being low in winter (about 20) and high in summer (about 60), as shown for instance in the southern Baltic (Jakobsen and Markager, 2016). They explained the seasonal course of the biomass∕Chl a ratio as follows: the acclimatization of pigments occurs in the cells at low light conditions and the accumulation of excess carbon at high light and low nutrient conditions. A high summer biomass∕Chl a ratio (64) was also estimated in the Gulf of Finland (Kononen et al., 1998). The dominant species in the phytoplankton community in more elevated biomass patches in February was the photosynthetic ciliate Mesodinium rubrum, which is often the dominant primary producer in the post-spring bloom period (Lips and Lips, 2017). In March, M. rubrum dominated in the western part of the study area, whereas at other stations the spring bloom dinoflagellates were as abundant as the photosynthetic ciliate.
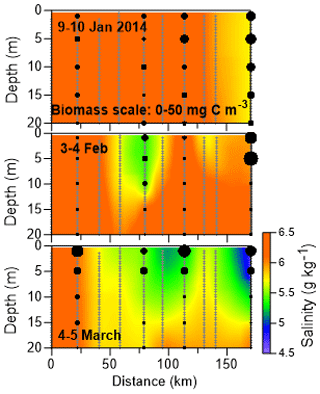
Figure 12Vertical distributions of salinity (color scale) and phytoplankton biomass (black dots) along the Gulf of Finland in winter 2014. Phytoplankton biomass (mg C m−3) scale is shown in the upper panel. Biomass sampling locations are shown in Fig. 1 (blue crosses). Vertical gray lines mark the location of CTD casts.
Spring bloom is instigated when phytoplankton growth exceeds losses in the upper layer due to grazing or vertical mixing downwards (Smetacek and Passow, 1990). Necessary conditions for spring bloom are a stabilized upper layer that is thinner than the depth of the euphotic zone, available nutrients, and strong enough solar radiation (Fennel, 1999). UML depth was 10–20 m in most of the Gulf of Finland in early March 2012 and 2014. Euphotic layer depth, estimated according to Luhtala and Tolvanen (2013) from our Secchi depth measurements, was 15–19 m in both winters, i.e., comparable with the UML depth. Also, there were sufficient nutrients available in the upper layer in February and March 2014 (Lips et al., 2017). We do not have a reference for the nutrient data in 2012. Thus, the limiting factor for phytoplankton growth is likely insufficient solar radiation. The mean downward shortwave radiation doubles in the area from February (40–50 W m−2) to March (90–100 W m−2) and quadruples in April (160–200 W m−2) (Rozwadowska and Isemer, 1998; Zapadka et al., 2020). The onset of spring bloom typically occurs in April in the Gulf of Finland (Groetsch et al., 2016; Lips et al., 2014; Lips and Lips, 2017).
Using in situ measurements and model simulation data, we have demonstrated the wintertime occurrence of haline stratification at a depth comparable to that of the euphotic zone in the Gulf of Finland, well before the onset of thermal stratification in spring. Stratification forms in late January–early February as a result of the westwards advection of riverine water. Stratification is maintained by the positive buoyancy flux created by the advection, which is stronger than the negative flux resulting from vertical mixing. The advection of riverine water occurs after the relaxation of westerly winds, which is a part of the annual cycle of the local wind regime. Thus, the mid-winter restratification is a regular seasonal feature in the area. Easterly winds support westward advection of fresher water and shallow stratification formation along the northern coast. Expansion of the area covered by the shallow UML occurred when the prevailing wind direction changed from an easterly to a westerly direction. Haline stratification occurred approximately 1 month later along the southern coast of the gulf.
Earlier observations of a local stratification phenomenon in the Baltic Sea nearshore regions in winter were under conditions of ice coverage. Our observations show that haline stratification can occur in the entire Gulf of Finland and in the absence of ice cover. Therefore, our results suggest that wintertime stratification is a common phenomenon in the Gulf of Finland, and its western boundary is at the entrance area to the gulf, between Hiiumaa Island and the Finnish coast.
Elevated Chl a and phytoplankton biomass were registered in the UML in the Gulf of Finland before the spring bloom. The limiting factor for phytoplankton growth in winter is likely insufficient light radiation. The exact role of wintertime stratification in the nutrient cycle and phytoplankton dynamics in the Gulf of Finland needs further investigation.
Scripts to analyze the results are available upon request. Please contact Taavi Liblik.
TL led the analyses of the data and writing of the paper with contributions from GV, JL, MJL, and IL. TL was responsible for the measurements and GV for the modeling activities. VK was responsible for gathering and processing the Ferrybox data. IL arranged phytoplankton biomass measurements.
The authors declare that they have no conflict of interest.
We thank our colleagues and the crew of RV Salme for the fieldwork. Likewise, we are thankful to Tallink (Estonia) for the possibility to acquire measurements on ferries. We thank Urmas Lips for the arrangement of RV Salme cruises and Ferrybox measurements, Tarmo Kõuts for providing Tallinnamadal wind data, and the Finnish Meteorological Institute for the Kalbådagrund wind data. The allocation of computing time at the high-performance computing cluster of Tallinn University of Technology and the University of Tartu is gratefully acknowledged. We thank the two reviewers and editor Mario Hoppema for the valuable comments and suggestions that helped to improve the paper.
This research has been supported by the Estonian Research Council (grant no. PRG602), the Estonian Research Council (grant no. IUT19-6), and the Estonian Science Foundation (grant no. 9382).
This paper was edited by Mario Hoppema and reviewed by Daniel Carlson and one anonymous referee.
Alenius, P., Myrberg, K., and Nekrasov, A.: The physical oceanography of the Gulf of Finland: a review, Boreal Environ. Res, 3, 97–125, 1998.
Andrejev, O., Sokolov, A., Soomere, T., Värv, R., and Viikmäe, B.: The use of high-resolution bathymetry for circulation modelling in the Gulf of Finland, Est. J. Eng., 16, 187–210, 2010.
Anonymous: Manual for Marine Monitoring in the COMBINE Programme of HELCOM, available at: https://helcom.fi/media/publications/Manual-for-Marine-Monitoring-in-the-COMBINE-Programme-of-HELCOM.pdf, last access: 19 December 2017.
Association for the Physical Sciences of the Sea, I.: The international thermodynamic equation of seawater-2010: Calculation and use of thermodynamic properties Intergovernmental Oceanographic Commission, 56, 196 pp., 2010.
Burchard, H. and Bolding, K.: GETM – a general estuarine transport model, Scientific Documentation, Technical report EUR 20253 en, Tech. Rep. European Commission, Ispra, Italy, 1–240, 2002.
Burchard, H., Bolding, K., Burchard, H., and Bolding, K.: Comparative Analysis of Four Second-Moment Turbulence Closure Models for the Oceanic Mixed Layer, J. Phys. Oceanogr., 31, 1943–1968, https://doi.org/10.1175/1520-0485(2001)031<1943:CAOFSM>2.0.CO;2, 2001.
Canuto, V. M., Howard, A., Cheng, Y., and Dubovikov, M. S.: Ocean turbulence, Part I: One-point closure model-momentum and heat vertical diffusivities, J. Phys. Oceanogr., 31, 1413–1426, https://doi.org/10.1175/1520-0485(2001)031<1413:OTPIOP>2.0.CO;2, 2001.
Chubarenko, I. P., Demchenko, N. Y., Esiukova, E. E., Lobchuk, O. I., Karmanov, K. V., Pilipchuk, V. A., Isachenko, I. A., Kuleshov, A. F., Chugaevich, V. Y., Stepanova, N. B., Krechik, V. A., and Bagaev, A. V.: Spring thermocline formation in the coastal zone of the southeastern Baltic Sea based on field data in 2010–2013, Oceanology, 57, 632–638, https://doi.org/10.1134/S000143701705006X, 2017.
Donlon, C. J., Martin, M., Stark, J., Roberts-Jones, J., Fiedler, E., and Wimmer, W.: The Operational Sea Surface Temperature and Sea Ice Analysis (OSTIA) system, Remote Sens. Environ., 116, 140–158, https://doi.org/10.1016/J.RSE.2010.10.017, 2012.
Eilola, K.: Development of a spring thermocline at temperatures below the temperature of maximum density with application to the Baltic Sea, J. Geophys. Res.-Oceans, 102, 8657–8662, https://doi.org/10.1029/97JC00295, 1997.
Eilola, K. and Stigebrandt, A.: Spreading of juvenile freshwater in the Baltic proper, J. Geophys. Res.-Oceans, 103, 27795–27807, https://doi.org/10.1029/98JC02369, 1998.
Elken, J., Raudsepp, U., and Lips, U.: On the estuarine transport reversal in deep layers of the Gulf of Finland, J. Sea Res., 49, 267–274, https://doi.org/10.1016/S1385-1101(03)00018-2, 2003.
Elken, J., Raudsepp, U., Laanemets, J., Passenko, J., Maljutenko, I., Pärn, O., and Keevallik, S.: Increased frequency of wintertime stratification collapse events in the Gulf of Finland since the 1990s, J. Marine Syst., 129, 47–55, https://doi.org/10.1016/j.jmarsys.2013.04.015, 2014.
Fennel, K.: Convection and the timing of phytoplankton spring blooms in the western Baltic sea, Estuar. Coast. Shelf Sci., 49, 113–128, https://doi.org/10.1006/ecss.1999.0487, 1999.
Flather, R. A.: A storm surge prediction model for the northern Bay of Bengal with application to the cyclone disaster in April 1991, J. Phys. Oceanogr., 24, 172–190, https://doi.org/10.1175/1520-0485(1994)024<0172:ASSPMF>2.0.CO;2, 1994.
Fleming, V. and Kaitala, S.: Phytoplankton spring bloom intensity index for the Baltic Sea estimated for the years 1992 to 2004, Hydrobiologia, 554, 57–65, 2006.
Good, S., Fiedler, E., Mao, C., Martin, M. J., Maycock, A., Reid, R., Roberts-Jones, J., Searle, T., Waters, J., While, J., and Worsfold, M.: The Current Configuration of the OSTIA System for Operational Production of Foundation Sea Surface Temperature and Ice Concentration Analyses, Remote Sens., 12, 720, https://doi.org/10.3390/rs12040720, 2020.
Granskog, M. A., Ehn, J., and Niemelä, M.: Characteristics and potential impacts of under-ice river plumes in the seasonally ice-covered Bothnian Bay (Baltic Sea), J. Marine Syst., 53, 187–196, https://doi.org/10.1016/j.jmarsys.2004.06.005, 2005.
Gräwe, U., Holtermann, P., Klingbeil, K., and Burchard, H.: Advantages of vertically adaptive coordinates in numerical models of stratified shelf seas, Ocean Model., 92, 56–68, https://doi.org/10.1016/j.ocemod.2015.05.008, 2015.
Groetsch, P. M. M., Simis, S. G. H., Eleveld, M. A., and Peters, S. W. M.: Spring blooms in the Baltic Sea have weakened but lengthened from 2000 to 2014, Biogeosciences, 13, 4959–4973, https://doi.org/10.5194/bg-13-4959-2016, 2016.
HELCOM: Guidelines for the Baltic monitoring programme for the third stage, Balt. Sea Environ. Proc., 27D, 1–161, 1988.
Hofmeister, R., Burchard, H., and Beckers, J.-M.: Non-uniform adaptive vertical grids for 3D numerical ocean models, Ocean Model., 33, 70–86, https://doi.org/10.1016/j.ocemod.2009.12.003, 2010.
Jaagus, J.: Trends in sea ice conditions in the Baltic Sea near the Estonian coast during the period 1949/1950–2003/2004 and their relationships to large-scale atmospheric circulation, Boreal Environ. Res., 11, 169–183, 2006.
Jaagus, J. and Kull, A.: Changes in surface wind directions in Estonia during 1966–2008 and their relationships with large-scale atmospheric circulation, Est. J. Earth Sci., 60, 220–231, https://doi.org/10.3176/earth.2011.4.03, 2011.
Jaanus, A., Hajdu, S., Kaitala, S., Andersson, A., Kaljurand, K., Ledaine, I., Lips, I., and Olenina, I.: Distribution patterns of isomorphic cold-water dinoflagellates (Scrippsiella/Woloszynskia complex) causing “red tides” in the Baltic Sea, Hydrobiologia, 554, 137–146, 2006.
Jakobsen, H. H. and Markager, S.: Carbon-to-chlorophyll ratio for phytoplankton in temperate coastal waters: Seasonal patterns and relationship to nutrients, Limnol. Oceanogr., 61, 1853–1868, https://doi.org/10.1002/lno.10338, 2016.
Janssen, F., Neumann, T., and Schmidt, M.: Inter-annual variability in cyanobacteria blooms in the Baltic Sea controlled by wintertime hydrographic conditions, Mar. Ecol. Prog. Ser., 275, 59–68, https://doi.org/10.3354/meps275059, 2004.
Johansson, J.: Total and regional runoff to the Baltic Sea, HELCOM Baltic Sea Environ., Fact Sheets, available at: https://helcom.fi/media/documents/BSEFS_Total-and-regional-runoff-to-the-Baltic-Sea-in-2015.pdf (last access: 3 January 2020), 2016.
Jones, P. D., Jonsson, T., and Wheeler, D.: Extension to the North Atlantic oscillation using early instrumental pressure observations from Gibraltar and south-west Iceland, Int. J. Climatol., 17, 1433–1450, https://doi.org/10.1002/(SICI)1097-0088(19971115)17:13<1433::AID-JOC203>3.0.CO;2-P, 1997.
Kahru, M. and Nõmmann, S.: The phytoplankton spring bloom in the Baltic Sea in 1985, 1986: multitude of spatio-temporal scales, Cont. Shelf Res., 10, 329–354, https://doi.org/10.1016/0278-4343(90)90055-Q, 1990.
Kari, E., Merkouriadi, I., Walve, J., Leppäranta, M., and Kratzer, S.: Development of under-ice stratification in Himmerfjärden bay, North-Western Baltic proper, and their effect on the phytoplankton spring bloom, J. Marine Syst., 186, 85–95, https://doi.org/10.1016/j.jmarsys.2018.06.004, 2018.
Karlson, B., Andersson, L. S., Kaitala, S., Kronsell, J., Mohlin, M., Seppälä, J., and Willstrand Wranne, A.: A comparison of FerryBox data vs. monitoring data from research vessels for near surface waters of the Baltic Sea and the Kattegat, J. Marine Syst., 162, 98–111, https://doi.org/10.1016/j.jmarsys.2016.05.002, 2016.
Kikas, V. and Lips, U.: Upwelling characteristics in the Gulf of Finland (Baltic Sea) as revealed by Ferrybox measurements in 2007–2013, Ocean Sci., 12, 843–859, https://doi.org/10.5194/os-12-843-2016, 2016.
Kononen, K., Hällfors, S., Kokkonen, M., Kuosa, H., Laanemets, J., Pavelson, J., and Autio, R.: Development of a subsurface chlorophyll maximum at the entrance to the Gulf of Finland, Baltic Sea, Limnol. Oceanogr., 43, 1089–1106, https://doi.org/10.4319/lo.1998.43.6.1089, 1998.
Kononen, K., Huttunen, M., Kanoshina, I., Laanemets, J., Moisander, P., and Pavelson, J.: Spatial and temporal variability of a dinoflagellate-cyanobacterium community under a complex hydrodynamical influence: a case study at the entrance to the Gulf of Finland, Mar. Ecol. Prog. Ser., 186, 43–57, https://doi.org/10.3354/meps186043, 1999.
Lass, H. U., Prandke, H., and Liljebladh, B.: Dissipation in the Baltic proper during winter stratification, J. Geophys. Res., 108, 3187, https://doi.org/10.1029/2002JC001401, 2003.
Launiainen, J. and Saarinen, J.: Marine wind characteristics in the northern Baltic Sea, Finnish, Mar. Res, 250, 52–86, 1984.
Lehmann, A., Myrberg, K., and Höflich, K.: A statistical approach to coastal upwelling in the Baltic Sea based on the analysis of satellite data for 1990–2009, Oceanologia, 54, 369–393, https://doi.org/10.5697/OC.54-3.369, 2012.
Leppäranta, M. and Myrberg, K.: Topography and hydrography of the Baltic Sea, in: Physical Oceanography of the Baltic Sea, edited by: Leppäranta, M. and Myrberg, K., 41–88, Springer Berlin Heidelberg, Berlin, Heidelberg, 2009.
Liblik, T. and Lips, U.: Variability of synoptic-scale quasi-stationary thermohaline stratification patterns in the Gulf of Finland in summer 2009, Ocean Sci., 8, 603–614, https://doi.org/10.5194/os-8-603-2012, 2012.
Liblik, T. and Lips, U.: Variability of pycnoclines in a three-layer, large estuary: the Gulf of Finland, Boreal Environ. Res., 22, 27–47, 2017.
Liblik, T., Laanemets, J., Raudsepp, U., Elken, J., and Suhhova, I.: Estuarine circulation reversals and related rapid changes in winter near-bottom oxygen conditions in the Gulf of Finland, Baltic Sea, Ocean Sci., 9, 917–930, https://doi.org/10.5194/os-9-917-2013, 2013.
Lilover, M. J. and Stips, A.: The variability of parameters controlling the cyanobacteria bloom biomass in the Baltic Sea, J. Marine Syst., 74, 108–115, https://doi.org/10.1016/j.jmarsys.2008.03.029, 2008.
Lilover, M.-J., Elken, J., Suhhova, I., and Liblik, T.: Observed flow variability along the thalweg, and on the coastal slopes of the Gulf of Finland, Baltic Sea, Estuar. Coast. Shelf Sci., 195, 23–33 https://doi.org/10.1016/j.ecss.2016.11.002, 2017.
Lips, I. and Lips, U.: The Importance of Mesodinium rubrum at Post-Spring Bloom Nutrient and Phytoplankton Dynamics in the Vertically Stratified Baltic Sea, Front. Mar. Sci., 4, 407, https://doi.org/10.3389/fmars.2017.00407, 2017.
Lips, I., Lips, U., and Liblik, T.: Consequences of coastal upwelling events on physical and chemical patterns in the central Gulf of Finland (Baltic Sea), Cont. Shelf Res., 29, 1836–1847, https://doi.org/10.1016/j.csr.2009.06.010, 2009.
Lips, I., Rünk, N., Kikas, V., Meerits, A., and Lips, U.: High-resolution dynamics of the spring bloom in the Gulf of Finland of the Baltic Sea, J. Marine Syst., 129, 135–149, https://doi.org/10.1016/J.JMARSYS.2013.06.002, 2014.
Lips, U., Zhurbas, V., Skudra, M., and Väli, G.: A numerical study of circulation in the Gulf of Riga, Baltic Sea, Part I: Whole-basin gyres and mean currents, Cont. Shelf Res., 112, 1–13, https://doi.org/10.1016/J.CSR.2015.11.008, 2016.
Lips, U., Laanemets, J., Lips, I., Liblik, T., Suhhova, I., and Suursaar, Ü.: Wind-driven residual circulation and related oxygen and nutrient dynamics in the Gulf of Finland (Baltic Sea) in winter, Estuar. Coast. Shelf Sci., 195, 4–15, https://doi.org/10.1016/J.ECSS.2016.10.006, 2017.
Luhtala, H. and Tolvanen, H.: Optimizing the Use of Secchi Depth as a Proxy for Euphotic Depth in Coastal Waters: An Empirical Study from the Baltic Sea, ISPRS Int. J. Geo-Inf., 2, 1153–1168, https://doi.org/10.3390/ijgi2041153, 2013.
Mahadevan, A., D'Asaro, E., Lee, C., and Perry, M. J.: Eddy-driven stratification initiates North Atlantic spring phytoplankton blooms, Science, 336, 54–58, https://doi.org/10.1126/science.1218740, 2012.
Männik, A. and Merilain, M.: Verification of different precipitation forecasts during extended winter-season in Estonia, HIRLAM Newsl., 65–70, Swedish Meteorol. Hydrol. Institute, 2007.
Martinsen, E. A. and Engedahl, H.: Implementation and testing of a lateral boundary scheme as an open boundary condition in a barotropic ocean model, Coast. Eng., 11, 603–627, https://doi.org/10.1016/0378-3839(87)90028-7, 1987.
Menden-Deuer, S. and Lessard, E. J.: Carbon to volume relationships for dinoflagellates, diatoms, and other protist plankton, Limnol. Oceanogr., 45, 569–579, https://doi.org/10.4319/lo.2000.45.3.0569, 2000.
Merkouriadi, I. and Leppäranta, M.: Influence of sea ice on the seasonal variability of hydrography and heat content in Tvärminne, Gulf of Finland, Ann. Glaciol., 56, 274–284, https://doi.org/10.3189/2015AoG69A003, 2015.
Mikaelyan, A. S., Mosharov, S. A., Kubryakov, A. A., Pautova, L. A., Fedorov, A., and Chasovnikov, V. K.: The impact of physical processes on taxonomic composition, distribution and growth of phytoplankton in the open Black Sea, J. Marine Syst., 208, 103368, https://doi.org/10.1016/j.jmarsys.2020.103368, 2020.
Nehring, D. and Matthäus, W.: Current Trends in Hydrographic and Chemical Parameters and Eutrophication in the Baltic Sea, Int. Rev. Ges. Hydrobio. Hydrogr., 76, 297–316, https://doi.org/10.1002/iroh.19910760303, 1991.
Palmen, E.: Untersuchungen über die Strömungen in den Finnland umgebenden Meeren, Meeren, Soc. Sci. Fenn., Comm. Phys.-Math., 5, 1–94, 1930.
Pavelson, J., Laanemets, J., Kononen, K., and Nõmmann, S.: Quasi-permanent density front at the entrance to the Gulf of Finland: response to wind forcing, Cont. Shelf Res., 17, 253–265, https://doi.org/10.1016/S0278-4343(96)00028-3, 1997.
Putt, M. and Stoecker, D. K.: An experimentally determined carbon: volume ratio for marine “oligotrichous” ciliates from estuarine and coastal waters, Limnol. Oceanogr., 34, 1097–1103, https://doi.org/10.4319/lo.1989.34.6.1097, 1989.
Rasmus, K., Kiirikki, M., and Lindfors, A.: Long-term field measurements of turbidity and current speed in the Gulf of Finland leading to an estimate of natural resuspension of bottom sediment, Boreal Environ. Res., 20, 735–747, available at: https://helda.helsinki.fi/handle/10138/228308, (last access: 11 June 2019), 2015.
Rozwadowska, A. and Isemer, H.-J.: Solar radiation fluxes at the surface of the Baltic Proper, Part 1, Mean annual cycle and influencing factors, Oceanologia, 40, 307–330, 1998.
Smetacek, V. and Passow, U.: Spring bloom initiation and Sverdrup's critical-depth model, Limnol. Oceanogr., 35, 228–234, https://doi.org/10.4319/lo.1990.35.1.0228, 1990.
Stepanova, N. B., Chubarenko, I. P., and Shchuka, S. A.: Structure and evolution of the cold intermediate layer in the southeastern part of the Baltic Sea by the field measurement data of 2004–2008, Oceanology, 55, 25–35, https://doi.org/10.1134/S0001437015010154, 2015.
Stipa, T.: Baroclinic adjustment in the Finnish coastal current, Tellus A, 56, 79–87, https://doi.org/10.1111/j.1600-0870.2004.00041.x, 2004.
Stipa, T., Tamminen, T., and Seppälä, J.: On the creation and maintenance of stratification in the Gulf of Riga, J. Marine Syst., 23, 27–49, https://doi.org/10.1016/S0924-7963(99)00049-4, 1999.
Stramska, M. and Białogrodzka, J.: Spatial and temporal variability of sea surface temperature in the Baltic Sea based on 32 years (1982–2013) of satellite data, Oceanologia, 57, 223–235, https://doi.org/10.1016/J.OCEANO.2015.04.004, 2015.
Suhhova, I., Liblik, T., Lilover, M.-J., and Lips, U.: A descriptive analysis of the linkage between the vertical stratification and current oscillations in the Gulf of Finland, Boreal Environ. Res., 23, 83–103, 2018.
Suikkanen, S., Laamanen, M., and Huttunen, M.: Long-term changes in summer phytoplankton communities of the open northern Baltic Sea, Estuar. Coast. Shelf Sci., 71, 580–592, https://doi.org/10.1016/j.ecss.2006.09.004, 2007.
Tronin, A.: The satellite-measured sea surface temperature change in the Gulf of Finland, Int. J. Remote Sens., 38, 1541–1550, https://doi.org/10.1080/01431161.2017.1286057, 2017.
Umlauf, L. and Burchard, H.: Second-order turbulence closure models for geophysical boundary layers, a review of recent work, Cont. Shelf Res., 25, 795–827, https://doi.org/10.1016/j.csr.2004.08.004, 2005.
Uotila, P., Vihma, T., and Haapala, J.: Atmospheric and oceanic conditions and the extremely low Bothnian Bay sea ice extent in 2014/2015, Geophys. Res. Lett., 42, 7740–7749, https://doi.org/10.1002/2015GL064901, 2015.
Väli, G., Meier, H. E. M., and Elken, J.: Simulated halocline variability in the Baltic Sea and its impact on hypoxia during 1961–2007, J. Geophys. Res.-Oceans., 118, 6982–7000, https://doi.org/10.1002/2013JC009192, 2013.
Wasmund, N., Nausch, G., and Matthäus, W.: Phytoplankton spring blooms in the southern Baltic Sea – spatio-temporal development and long-term trends, J. Plankton Res., 20, 1099–1117, https://doi.org/10.1093/plankt/20.6.1099, 1998.
Zapadka, T., Ostrowska, M., Stoltmann, D., and Krężel, A.: A satellite system for monitoring the radiation budget at the Baltic Sea surface, Remote Sens. Environ., 240, 111683, https://doi.org/10.1016/j.rse.2020.111683, 2020.
Zhurbas, V., Väli, G., Golenko, M., and Paka, V.: Variability of bottom friction velocity along the inflow water pathway in the Baltic Sea, J. Marine Syst., 184, 50–58, https://doi.org/10.1016/J.JMARSYS.2018.04.008, 2018.