the Creative Commons Attribution 4.0 License.
the Creative Commons Attribution 4.0 License.
 | 30 Oct 2020
Beaching patterns of plastic debris along the Indian Ocean rim
Mirjam van der Mheen
Erik van Sebille
Charitha Pattiaratchi
A large percentage of global ocean plastic waste enters the Northern Hemisphere Indian Ocean (NIO). Despite this, it is unclear what happens to buoyant plastics in the NIO. Because the subtropics in the NIO are blocked by landmass, there is no subtropical gyre and no associated subtropical garbage patch in this region. We therefore hypothesize that plastics “beach” and end up on coastlines along the Indian Ocean rim. In this paper, we determine the influence of beaching plastics by applying different beaching conditions to Lagrangian particle-tracking simulation results. Our results show that a large amount of plastic likely ends up on coastlines in the NIO, while some crosses the Equator into the Southern Hemisphere Indian Ocean (SIO). In the NIO, the transport of plastics is dominated by seasonally reversing monsoonal currents, which transport plastics back and forth between the Arabian Sea and the Bay of Bengal. All buoyant plastic material in this region beaches within a few years in our simulations. Countries bordering the Bay of Bengal are particularly heavily affected by plastics beaching on coastlines. This is a result of both the large sources of plastic waste in the region and the ocean dynamics that concentrate plastics in the Bay of Bengal. During the intermonsoon period following the southwest monsoon season (September, October, November), plastics can cross the Equator on the eastern side of the NIO basin into the SIO. Plastics that escape from the NIO into the SIO beach on eastern African coastlines and islands in the SIO or enter the subtropical SIO garbage patch.
- Article
(9956 KB) - Full-text XML
- BibTeX
- EndNote


Large amounts of plastic waste enter the ocean every year (Jambeck et al., 2015; Lebreton et al., 2017; Schmidt et al., 2017), potentially harming marine species and ecosystems (Law, 2017). A large percentage of global plastic waste is estimated to enter the Indian Ocean. Despite this, buoyant marine plastic debris (“plastics”) is relatively under-sampled and under-studied in the Indian Ocean (van Sebille et al., 2015). The Indian Ocean atmospheric and oceanic dynamics are unique (Schott et al., 2009), so the dynamics of plastics in the Indian Ocean differ from those in the other oceans (van der Mheen et al., 2019).
In the Pacific and Atlantic oceans, plastics accumulate in so-called “garbage patches” in the subtropical ocean gyres (e.g. Moore et al., 2001; Maximenko et al., 2012; van Sebille et al., 2012; Lebreton et al., 2012; Eriksen et al., 2013; van Sebille et al., 2015). Plastics also accumulate in a subtropical garbage patch in the Southern Hemisphere Indian Ocean, but this patch is much more dispersive and sensitive to different transport mechanisms (currents, wind, waves) than the garbage patches in the other oceans (van der Mheen et al., 2019). In contrast, the subtropical Northern Hemisphere Indian Ocean is blocked by landmass, so there is no subtropical gyre and associated garbage patch. In addition, it is unclear if plastics entering the Northern Hemisphere Indian Ocean cross the Equator into the subtropical garbage patch in the Southern Hemisphere, as we explain further in the following paragraphs.
Strong currents are known to act as transport barriers for buoyant objects (McAdam and van Sebille, 2018). For example, most fluid parcels in the Gulf Stream flow downstream; cross-stream transport only occurs at depth (Bower, 1991). As a result, there is almost no surface transport between the subtropics and the subpolar region in the North Atlantic Ocean: in 30 years only one ocean surface drifter crossed this boundary (Brambilla and Talley, 2006). In the equatorial region, the easterly trade winds drive strong equatorial currents and counter-currents (Dijkstra, 2008). As a result, ocean surface drifters do not tend to cross the Equator and ultimately return to their original hemisphere (Maximenko et al., 2012). It has therefore been suggested that plastics do not generally cross the Equator but remain in the hemisphere where they entered the ocean (Lebreton et al., 2012).
However, in contrast to the other oceans, the easterly trade winds in the Northern Hemisphere Indian Ocean are not steady. Instead, they generally only have an easterly component during December, January, and February and have a westerly component during the remainder of the year (Schott et al., 2009). As a result, the North Equatorial Current and the South Equatorial Countercurrent in the Indian Ocean are not steady either. In addition, although the surface connectivity is split into two hemispheres in both the Pacific and Atlantic oceans, the surface of the Indian Ocean appears connected between hemispheres (Froyland et al., 2014). Because of this, it is unclear if plastics tend to remain in their original hemisphere in the Indian Ocean. The question is therefore what happens to plastics entering the Northern Hemisphere Indian Ocean (NIO).
Measurements of open-ocean plastic concentrations in the Indian Ocean are scarce (Fig. 1; van Sebille et al., 2015) and insufficient to determine the fate of plastics entering the NIO. However, numerical modelling studies show a garbage patch forming in the Bay of Bengal (Lebreton et al., 2012; van der Mheen et al., 2019). Sampling studies confirm that there are high concentrations of plastics in the Bay of Bengal (Ryan, 2013), but it is not clear whether this is a result of plastics accumulating here or due to large nearby sources.
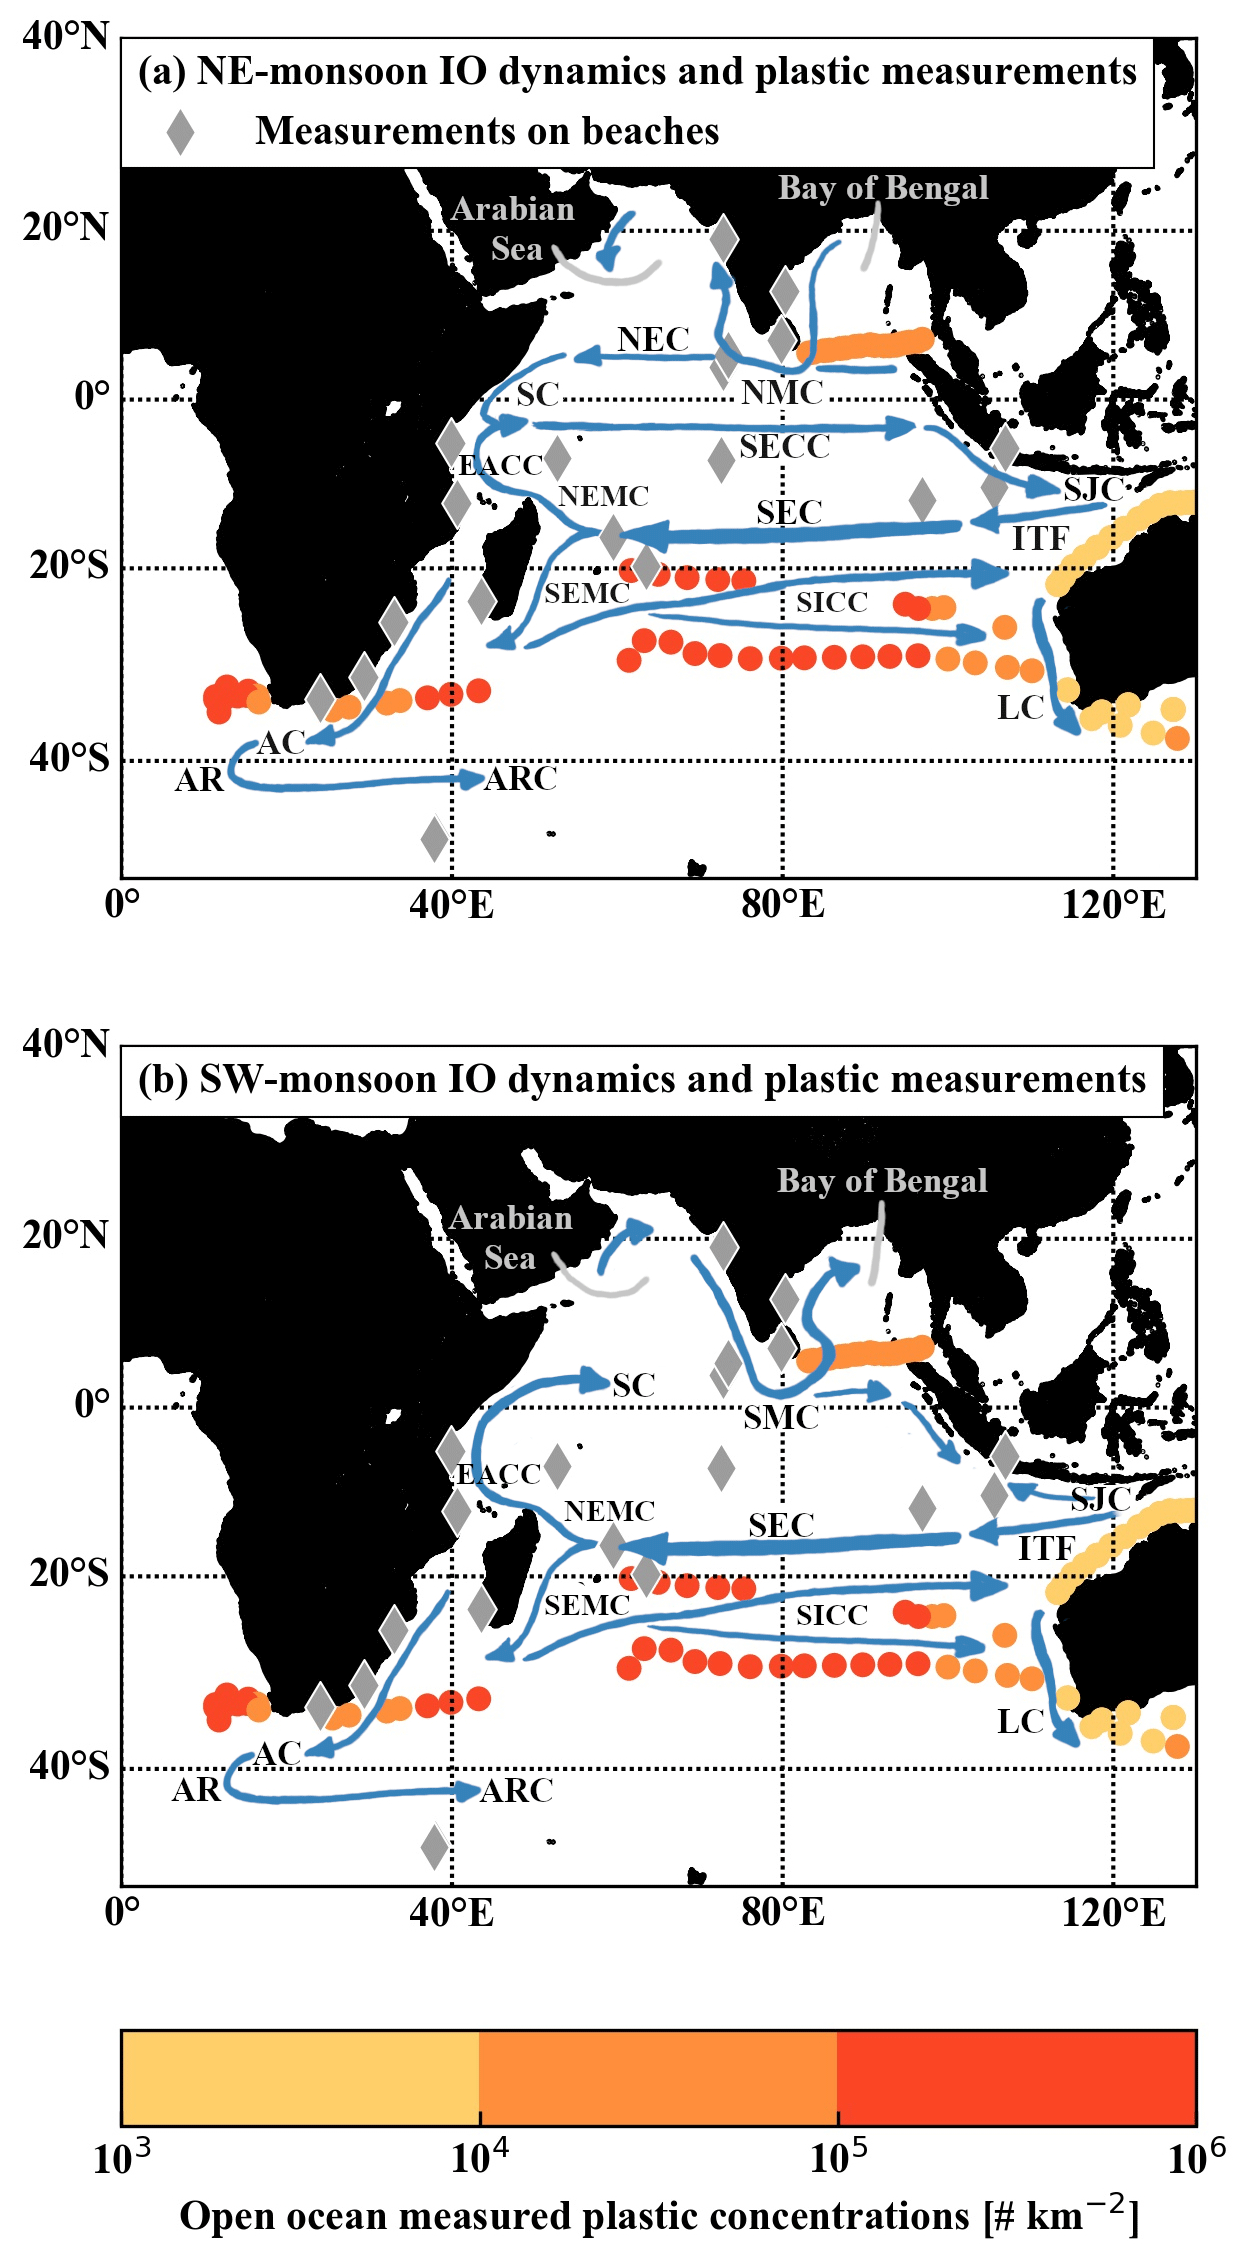
Figure 1Overview of standardized open-ocean plastic measurements in the Indian Ocean (filled circles), approximate locations of sampling studies of plastics on beaches (grey diamonds), and schematic dominant ocean surface currents (blue arrows) during the (a) northeast monsoon season and (b) southwest monsoon season. Open-ocean sampling studies were performed by Morris (1980), Reisser et al. (2013), Eriksen et al. (2014), and Cózar et al. (2014) and standardized by van Sebille et al. (2015). Sampling studies of plastics on beaches were performed by Ryan (1987), Slip and Burton (1991), Madzena and Lasiak (1997), Uneputty and Evans (1997), Barnes (2004), Jayasiri et al. (2013), Duhec et al. (2015), Nel and Froneman (2015), Bouwman et al. (2016), Kumar et al. (2016), Imhof et al. (2017), and Lavers et al. (2019). Schematic ocean surface currents are based on Schott et al. (2009). The following currents are shown and labelled with their abbreviations: Northeast Monsoon Current (NMC) and Southwest Monsoon Current (SMC), North Equatorial Current (NEC), Somali Current (SC), South Equatorial Countercurrent (SECC), South Java Current (SJC), East African Coastal Current (EACC), Indonesian Throughflow (ITF), Northeast Madagascar Current (NEMC), Southeast Madagascar Current (SEMC), Agulhas Current (AC), Agulhas Retroflection (AR), Agulhas Return Current (ARC), South Indian Countercurrent (SICC), Leeuwin Current (LC).
Another hypothesis is that plastics end up on coastlines in the NIO. Multiple studies sampled plastics on beaches in the Indian Ocean (Fig. 1; Ryan, 1987; Slip and Burton, 1991; Madzena and Lasiak, 1997; Uneputty and Evans, 1997; Barnes, 2004; Jayasiri et al., 2013; Duhec et al., 2015; Nel and Froneman, 2015; Bouwman et al., 2016; Kumar et al., 2016; Imhof et al., 2017; Lavers et al., 2019), but because they used very different sampling methods on different timescales (Table A1), their results are difficult to compare. However, they do provide qualitative evidence that plastic is found on coastlines throughout the Indian Ocean, both on populated beaches close to plastic sources (Uneputty and Evans, 1997; Jayasiri et al., 2013; Kumar et al., 2016) and on remote uninhabited coastlines and islands (Ryan, 1987; Slip and Burton, 1991; Madzena and Lasiak, 1997; Barnes, 2004; Duhec et al., 2015; Nel and Froneman, 2015; Bouwman et al., 2016; Imhof et al., 2017; Lavers et al., 2019). Which coastlines are most heavily affected by stranding plastics depends both on the location of plastic sources and the ocean dynamics in the region.
In the NIO, both the atmospheric and oceanic dynamics are dominated by the monsoon system, which is driven by differences in air temperature above the Asian continent and above the NIO (Schott et al., 2009). During the southwest monsoon season (boreal summer: June, July, August) the air above the Asian continent is warmer than above the ocean, leading to predominantly southwesterly winds. In contrast, during the northeast monsoon season (boreal winter: December, January, February) the air above the ocean is warmer than above the Asian continent, resulting in predominantly northeasterly winds. These monsoonal winds result in strong seasonal variations in ocean surface currents in the NIO and Indian Ocean equatorial region.
During the northeast monsoon season, the Northeast Monsoon Current (NMC) flows from the Bay of Bengal westwards past Sri Lanka and into the Arabian Sea (Fig. 1a; Schott et al., 2009; de Vos et al., 2014). The North Equatorial Current (NEC) also flows westwards during this season, feeding into the southwestward-flowing Somali Current (SC), which in turn feeds into the eastward-flowing South Equatorial Countercurrent (SECC). The South Java Current (SJC) flows southeastwards along Sumatra and Java, but is relatively weak during the northeast monsoon season (Sprintall et al., 2010).
During the southwest monsoon season the NMC dissolves, and instead the Southwest Monsoon Current (SMC) flows from the Arabian Sea eastwards past Sri Lanka and into the Bay of Bengal (Fig. 1b; Schott et al., 2009; de Vos et al., 2014). There is no NEC during this season, and as a result the SC reverses direction as it is supplied by the westward-flowing South Equatorial Current (SEC) and the East African Coastal Current (EACC). The SJC continues to flow southeastwards along Sumatra but flows northwestwards along Java (Sprintall et al., 2010), as it is supplied by the strengthening Indonesian Throughflow (ITF) during the southwest monsoon season (Sprintall et al., 2009). At the convergence of the two opposing flows, a current flows southwestwards and feeds into the SEC.
During the intermonsoon periods, strong eastward-flowing surface Wyrtki jets develop along the Equator (Wyrtki, 1973); these are unique to the Indian Ocean. The Wyrtki jets are strongest during the intermonsoon period following the southwest monsoon season (Qui and Yu, 2009). They strengthen the SJC, which flows southeastwards during the intermonsoon periods.
The aim of this paper is to determine how these seasonally reversing ocean surface currents transport plastics that enter the NIO. Specifically, we focus on which coastlines are most heavily affected by stranding plastics. For convenience, we refer to plastics that are stranded on coastlines as “beaching” or “beached plastics”, where beaching can occur on any type of coastline, not just beaches. In addition to surface currents, wind and waves have a significant impact on the dynamics of buoyant objects in the Southern Hemisphere Indian Ocean (SIO; van der Mheen et al., 2019). However, we only consider the influence of surface currents on the transport of plastics in this study; including dynamics due to wind and waves is beyond the scope of this paper. We discuss the reasons behind this, as well as the possible implications, in more detail in Sect. 4.
Our results show that plastics in the NIO move back and forth between the Bay of Bengal and the Arabian Sea, following monsoonal winds and currents. Plastics beach on coastlines throughout the NIO. Countries bordering the Bay of Bengal are most heavily and consistently affected. We also show that plastics from the NIO can cross the Equator into the SIO. In our simulations, this mainly occurs during the intermonsoon period following the southwest monsoon season (September, October, November), and we suggest a mechanism for the “escape” of plastics from the NIO into the SIO. Plastics that cross into the SIO beach along the entire eastern African coastline as well as on remote islands.
2.1 Plastic sources
Global plastic waste inputs from coastlines were estimated by Jambeck et al. (2015), and inputs from rivers were estimated by both Lebreton et al. (2017) and Schmidt et al. (2017). The estimate by Jambeck et al. (2015) is based on a fixed percentage of mismanaged plastic waste per country entering the ocean. In addition to mismanaged plastic waste, Lebreton et al. (2017) and Schmidt et al. (2017) included the influence of river catchment geography and river discharge to estimate how much plastic waste enters the ocean. They also calibrated their estimates based on available measurements of plastic concentrations in rivers around the globe. The total amount of plastic waste entering the ocean from rivers each year estimated by Lebreton et al. (2017) and Schmidt et al. (2017) agree relatively well with each other. In contrast, the estimate by Jambeck et al. (2015) is an order of magnitude larger. In this paper, we use plastic waste input from rivers estimated by Lebreton et al. (2017) as plastic source locations in our simulations (Sect. 2.2). These inputs are based on measurements of floating plastics in rivers with sizes ranging between 0.3 mm and 0.5 m and are the more conservative option compared to those of Jambeck et al. (2015).
The largest plastic source locations in the NIO are located around the Bay of Bengal and on the eastern side of the Arabian Sea (Fig. 2a). Lebreton et al. (2017) derived monthly plastic waste inputs, which mainly vary depending on river discharge. The wet season with the largest discharges is in boreal summer in the NIO, and plastic waste input in the region peaks in August (Fig. 2b).
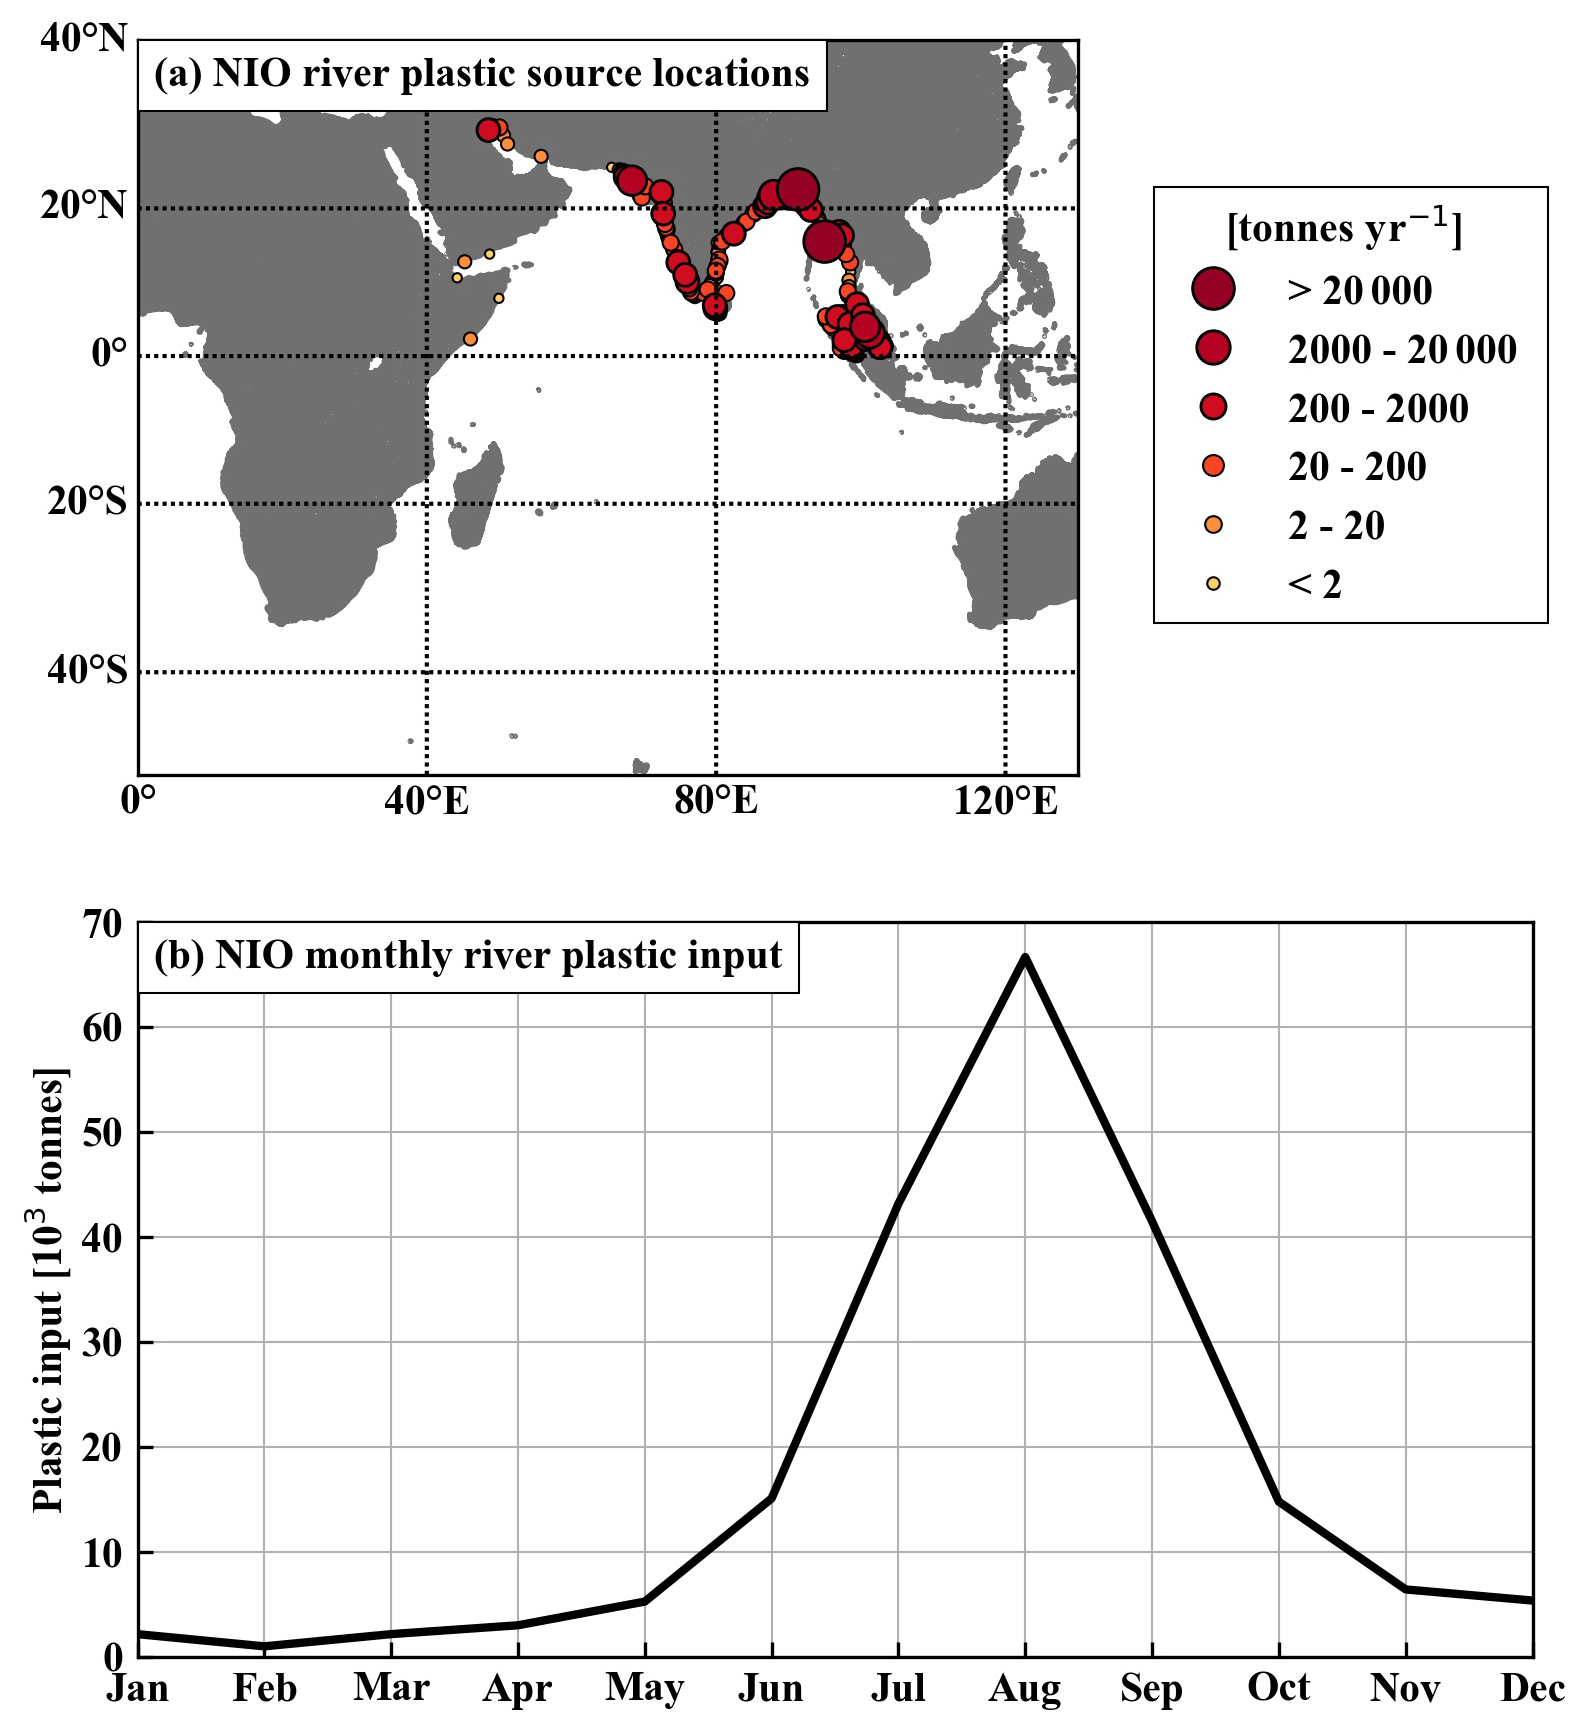
Figure 2(a) Locations of plastic waste input from rivers in the Northern Hemisphere Indian Ocean based on Lebreton et al. (2017). We release particles from these locations in our particle-tracking simulations (Sect. 2.2). (b) Total plastic waste input in the Northern Hemisphere Indian Ocean for each month. Lebreton et al. (2017) based the monthly variation of plastic input on seasonal variations in river discharges. We release particles following this monthly variation in our particle-tracking simulations, where 1 particle represents 1 t of plastic waste (Sect. 2.2).
2.2 Particle-tracking simulations
We use OceanParcels-v2 (Lange and van Sebille, 2017; Delandmeter and van Sebille, 2019) to run Lagrangian particle-tracking simulations of plastics released in the NIO, forced by ocean surface currents from HYCOM+NCODA Global 1∕12∘ Reanalysis data (HYCOM; Cummings, 2005; Cummings and Smedstad, 2013). Ocean surface currents from HYCOM are available at 3-hourly temporal resolution and 1∕12∘ horizontal resolution from 1 January 1995 to 31 December 2015. We use a time step of dt=1 h in the particle-tracking simulations and use 5 d outputs of particle locations for analysis. We include Brownian particle diffusion with a constant horizontal diffusion coefficient of Kh=10.0 m2 s−1. We determined the value of Kh following the definition of Peliz et al. (2007): , where m2 s−3 is the turbulent dissipation rate and dx=𝒪(10) km is the size of a grid cell in HYCOM.
We limit the domain of our particle-tracking simulations between 0 to 130∘ E, and 50∘ S to 40∘ N. Particles are removed from the simulation after passing through these boundaries. We choose this relatively large domain because we are interested in the amount of particles that cross from the NIO into the SIO, as well as any particles that escape from the SIO into the other ocean basins. The simulation domain extends relatively far east and south to include the Agulhas Retroflection (e.g. Gordon, 2003), and thus any particles caught in the retroflection can escape from the SIO into the South Atlantic Ocean but also potentially move back into the SIO with the Agulhas Return Current. The definitions of the NIO and SIO that we use are shown in Fig. A1.
2.2.1 Long-term simulation
We run 21-year particle-tracking simulations to determine the dynamics of plastics released in the NIO. During the first year of the simulation, we release particles into the NIO from river plastic source locations (Fig. 2a; Lebreton et al., 2017). Several of the source locations available from Lebreton et al. (2017) are located on land grid cells in HYCOM. We prevent particles from being released on or very close to land by increasing the HYCOM land mask with one grid cell and then moving any release locations on land to the nearest ocean grid cell (Fig. A2). We include the monthly variation of plastic waste input from rivers (Fig. 2b) in our simulation by releasing particles on the first day of every month. A single particle in our simulation represents 1 t of plastic waste; we release a total of 267710 particles. After inputting particles for the first year, we then run the simulation for an additional 20 years to determine the influence of the Indian Ocean dynamics on particle transport.
We release simulated particles in 1995 because HYCOM data is available from then onwards, and we want to run simulations for as long as possible using this dataset. This does not necessarily mean that the plastic waste input estimated by Lebreton et al. (2017) is representative for 1995. We are interested in the large-scale and long-term dynamics of plastics in the NIO rather than in the behaviour of plastics during a specific time period, so this is not an issue for this paper.
2.2.2 Monsoonal simulation
In addition to long-term dynamics, we are also interested in the influence of the monsoon system on the transport of plastics. One of the dominant climate modes that influences atmospheric and oceanic dynamics in the NIO is the Indian Ocean Dipole (IOD; Saji et al., 1999; Ashok and Guan, 2004; Schott et al., 2009). To determine the influence of the monsoon season on plastic transport in the NIO, we run an additional simulation during neutral IOD conditions. Both 2008 and 2009 were neutral IOD years, with relatively low values of the Dipole Mode Index (DMI; Fig. A3; Saji et al., 1999). We therefore release particles in 2008 using the same release method described in Sect. 2.2.1 and continue the simulation to the end of 2009. We use the simulation results of the second simulation year to illustrate the influence of the monsoon system on plastic transport in the NIO (Sect. 3.1).
2.3 Beaching
We do not implement any specific beaching behaviour during the particle-tracking simulation. Instead, particles remain adrift in the simulation and we apply beaching conditions to each particle afterwards, using 5 d outputs of particle locations. This way, we can easily implement different beaching conditions and determine the sensitivity of our results without running a large number of simulations.
Beaching of plastics is highly complex and strongly influenced by small-scale coastal ocean dynamics (Isobe et al., 2014), as well as the local morphology of the coastline (Zhang, 2017). In addition, beached plastics do not necessarily remain beached but can return to the ocean (Zhang, 2017; Lebreton et al., 2019). Plastics also fragment relatively easily while exposed to sunlight and high temperatures on beaches (Andrady, 2011), as well as breaking waves near coastlines (Zhang, 2017). As a result of changes in the material characteristics (shape, size, density) of plastics, their response to ocean dynamics may also change (e.g. Maximenko et al., 2012; van der Mheen et al., 2019). It is beyond the purpose and scope of this paper to account for these complex and small-scale beaching dynamics of plastics. Instead, our goal is to provide indicative large-scale spatial patterns of beaching plastics in the NIO.
We define that particles within a distance Δx of any coastline, and moving towards the coastline (defined as a decreasing distance to the coast), beach randomly with a specific probability p. The beaching probability can assume values between a minimum value of 0 (no particles beach) and a maximum value of 1 (all particles within a distance Δx of a coastline beach) per 5 d. If a particle beaches, it remains beached, and its location is fixed for the remainder of the simulation. Similar methods to account for beaching plastics in large-scale simulations have been used in other studies (Lebreton et al., 2019).
We use the distance to the nearest coastline from GSHHG-v2.3.7 data (Fig. A4; Wessel and Smith, 1996) to determine the distance of particles to a coastline. This dataset has a horizontal resolution of 1 arcmin. The high resolution allows us to include the coastlines of small islands in our beaching analysis.
Sensitivity to beaching distance Δx and probability p
We performed sensitivity analyses of our results for different values of both the beaching distance Δx and probability p. We used km with p=0.50 (5 d)−1 to determine the sensitivity of our results to beaching at different distances Δx from the nearest coastline. Our results are not very sensitive to these different values of Δx (Fig. A5). We therefore use a fixed value of Δx=8 km (which is approximately the size of one HYCOM grid cell) for the rest of our analyses.
In contrast, our results are sensitive to different values of beaching probability p. We discuss this further in Sect. 3.2 and present our results for different values of p.
3.1 Monsoonal influence and escape mechanism from NIO to SIO
Particle-tracking simulation results during neutral IOD conditions and without beaching illustrate the influence of the monsoon season on the transport of particles in the NIO. We do not include any beaching effects in these simulation results because our purpose with this simulation is to qualitatively illustrate the transport of particles by ocean surface currents. During the northeast monsoon season, particles are transported from the Bay of Bengal towards the Arabian Sea by the Northeast Monsoon Current (NMC, Fig. 3a). Particles are present throughout both the Arabian Sea and the Bay of Bengal during the following intermonsoon period (Fig. 3b). During the southwest monsoon season, particles are transported from the Arabian Sea towards the Bay of Bengal by the Southwest Monsoon Current (SMC, Fig. 3c). Most particles are in the Bay of Bengal during this season and remain there during the next intermonsoon period as eastward Wyrtki jets (WJ) develop around the Equator (Fig. 3d).
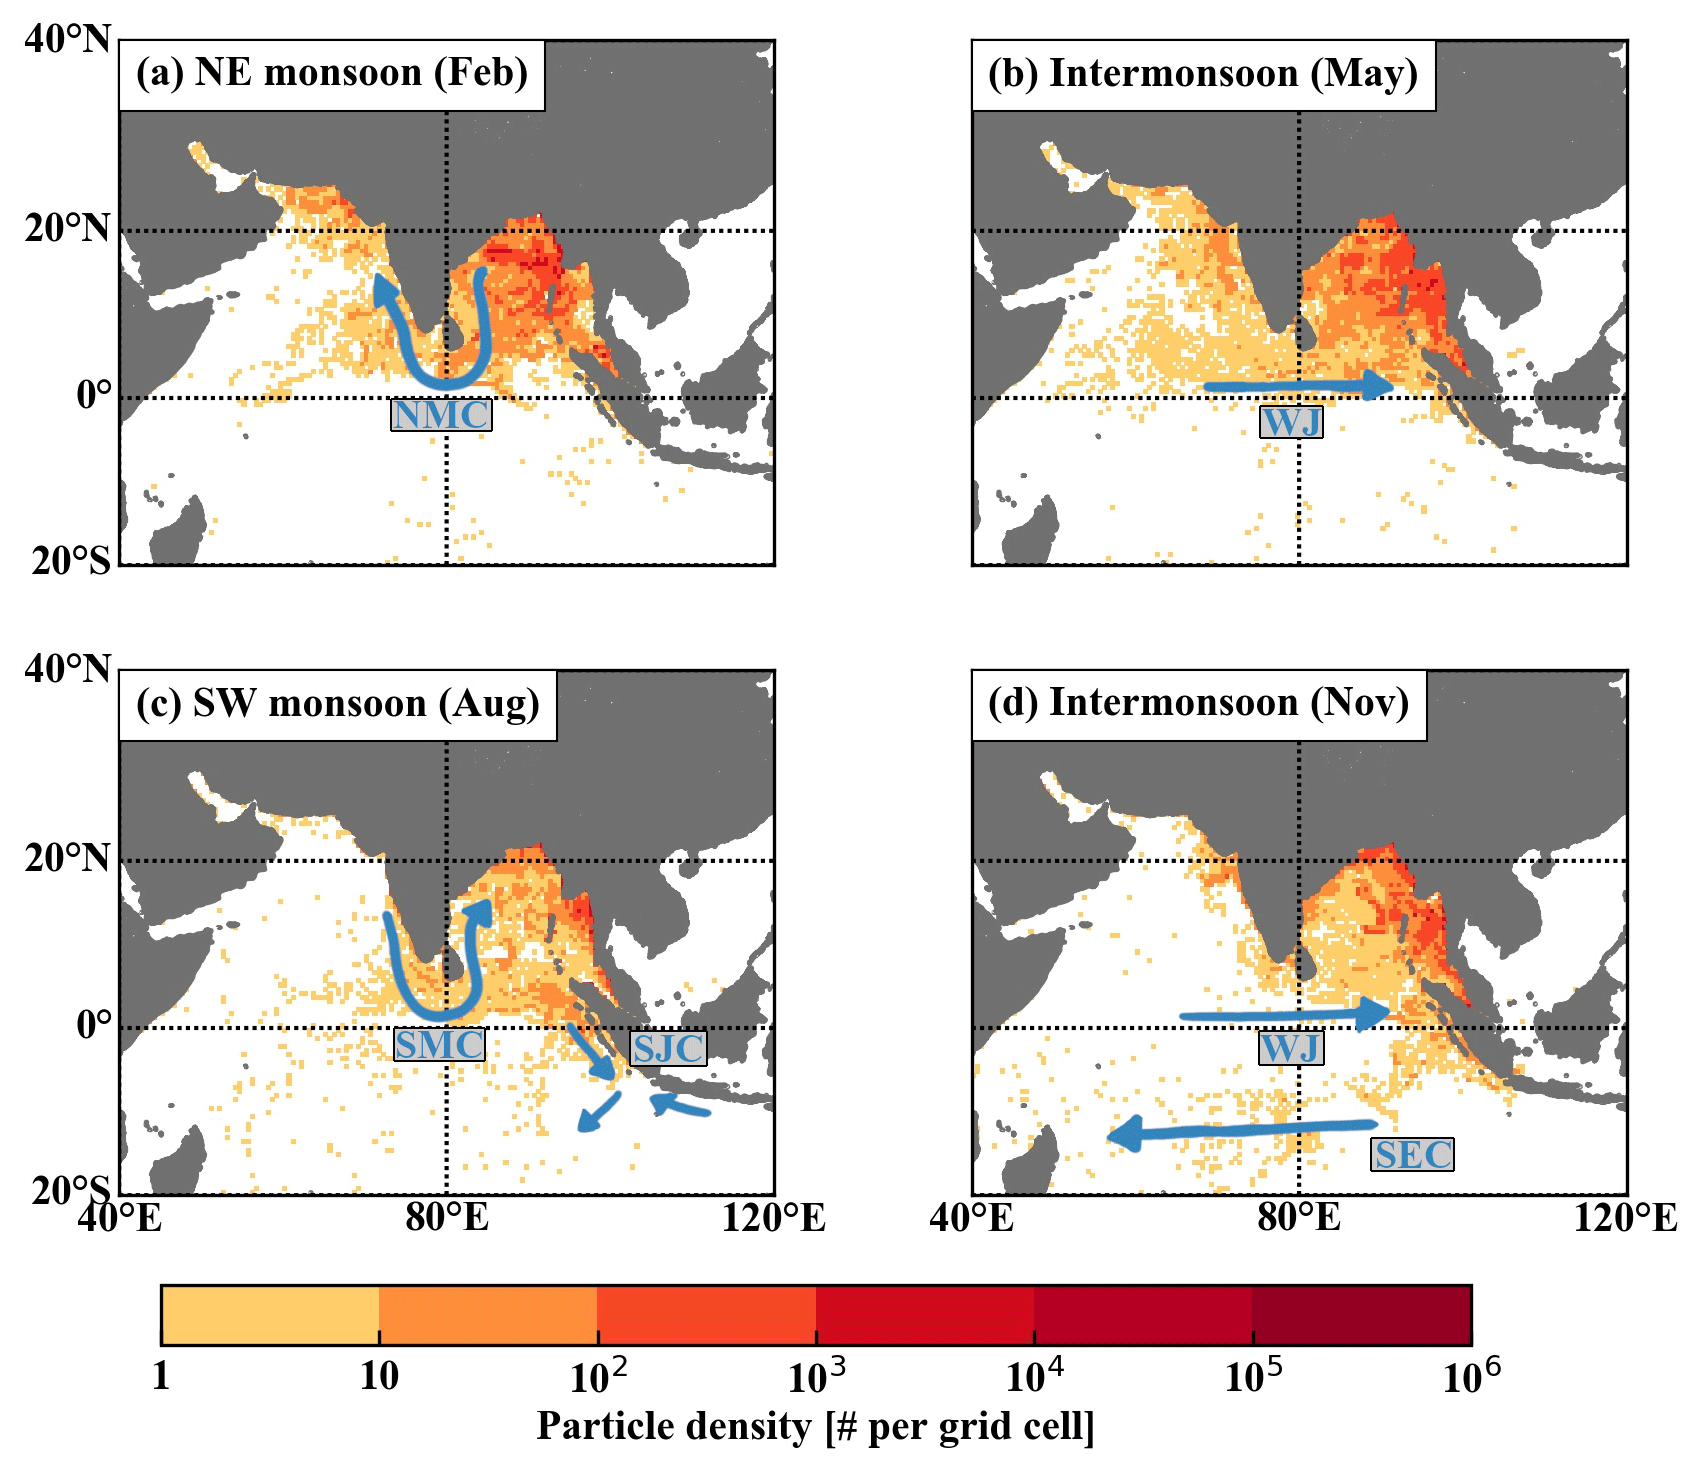
Figure 3Particle density of simulated particles released from river source locations in the Northern Hemisphere Indian Ocean during neutral Indian Ocean Dipole conditions and without beaching at the end of (a) the northeast monsoon season (February), (b) the intermonsoon period transitioning from the northeast to the southwest monsoon (May), (c) the southwest monsoon season (August), and (d) the intermonsoon period transitioning from the southwest to the northeast monsoon (November). Blue arrows indicate relevant ocean surface currents labelled with their abbreviations: Northeast Monsoon Current (NMC), Wyrtki jets (WJ), Southwest Monsoon Current (SMC), South Java Current (SJC), and South Equatorial Current (SEC).
These simulation results indicate that particles leave the Arabian Sea depending on the monsoon season. In contrast, there are relatively high particle concentrations in the Bay of Bengal throughout the year. Although there is no region of consistent downwelling in the Bay of Bengal (and therefore no persistent accumulation of plastics), anti-cyclonic and cyclonic gyres develop in the bay throughout the year (Paul et al., 2009), which may trap plastics. In addition, the annual mean flow along the Equator is eastwards, directed from the Arabian Sea towards the Bay of Bengal (Schott et al., 2009; de Vos et al., 2014).
These simulation results also indicate an escape mechanism for particles to cross the Equator from the NIO into the SIO. Particles mainly cross the Equator during the intermonsoon period following the southwest monsoon season (Fig. 3d). During this period, the WJ are at their strongest (Qui and Yu, 2009) and particles are transported eastwards along the Equator. Particles cross the Equator with the southeastward-flowing South Java Current (SJC) and connect with the westward-flowing South Equatorial Current (SEC).
3.2 Beaching
As described in Sect. 2.3, we allow simulated particles to randomly beach with a probability p if they are moving towards the coast within a distance Δx=8 km of a coastline. Realistic beaching probabilities of plastics are unknown and are beyond the scope of this paper to determine. We therefore consider particle-tracking simulation results for a beaching probability of p=0.50 (5 d)−1, as well as a “high” beaching probability of p=0.95 (5 d)−1 and a “low” beaching probability of p=0.05 (5 d)−1.
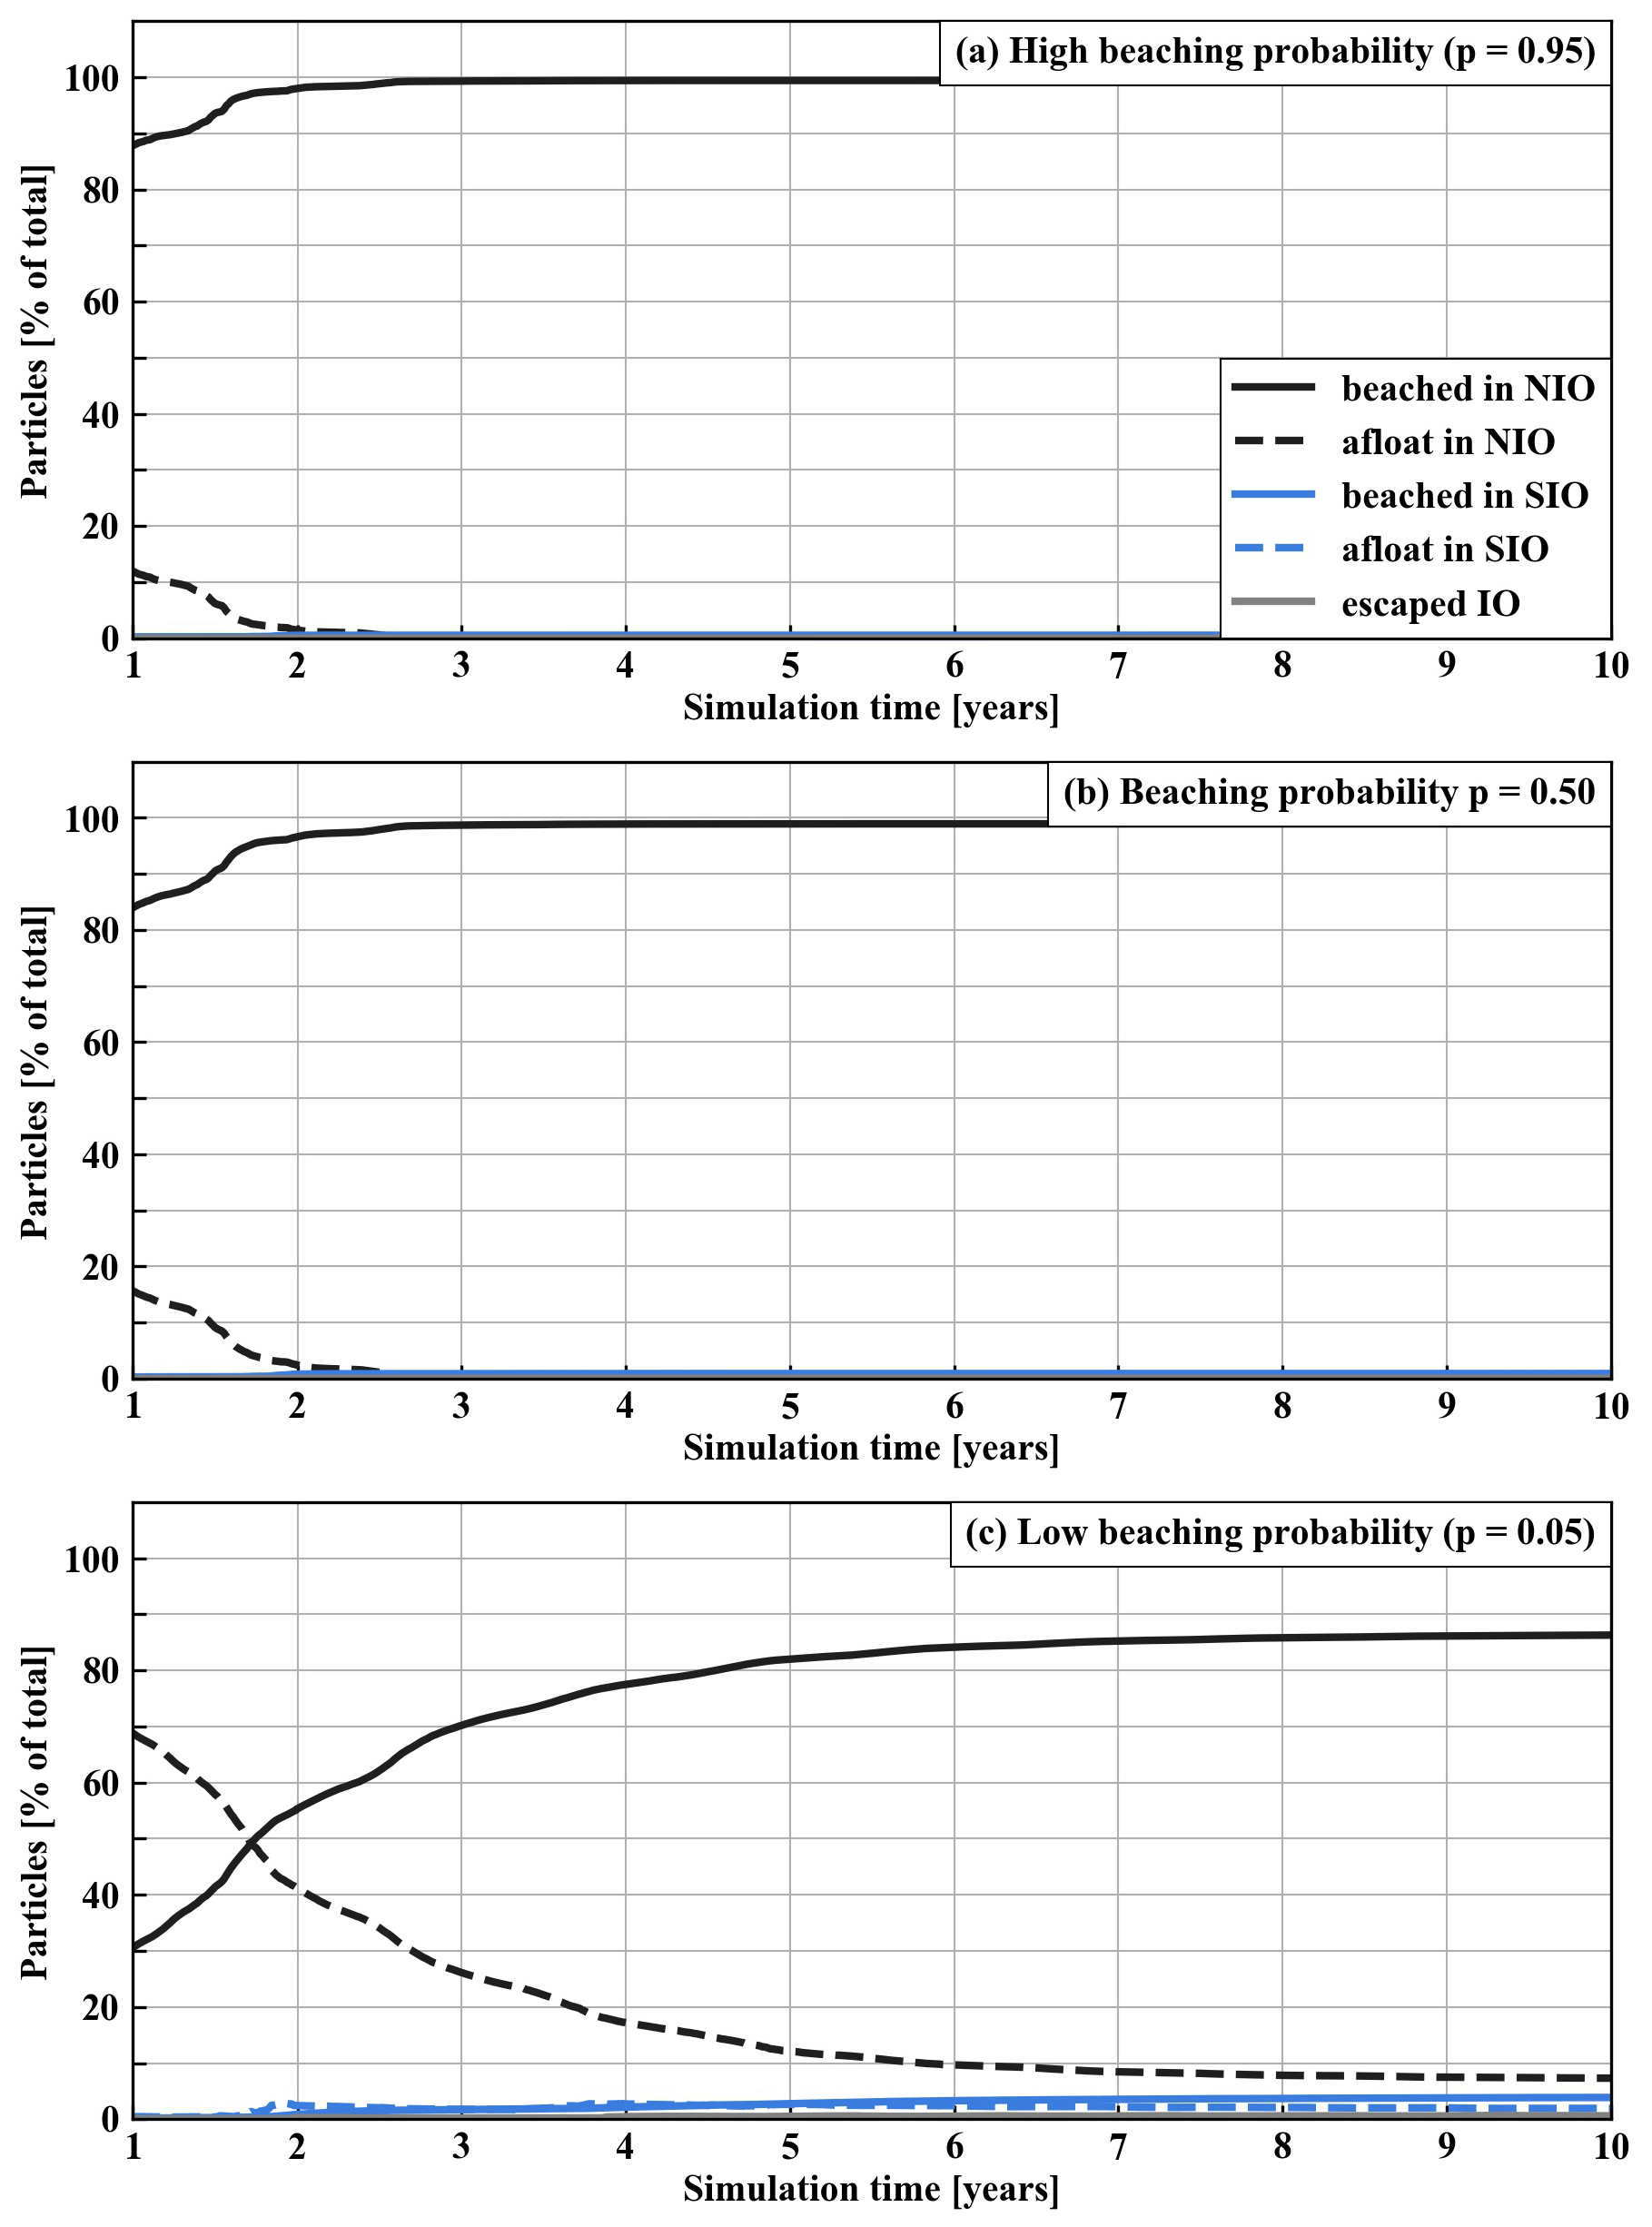
Figure 4Percentage of total simulated particles as a function of the simulation duration that have beached in the Northern Hemisphere (NIO) or Southern Hemisphere Indian Ocean (SIO), are afloat in the NIO or SIO, or have left the Indian Ocean entirely under (a) a high beaching probability of p=0.95 (5 d)−1, (b) a beaching probability of p=0.50 (5 d)−1, and (c) a low beaching probability of p=0.05 (5 d)−1. Percentages are shown after all particles have been released after 1 year of simulation, and up to 10 years of simulation, after which the simulation results have reached a steady state in all cases.
In both the simulation with high beaching probability and that with a beaching probability of p=0.50 (5 d)−1, almost all particles beach in the NIO within 3 years (Fig. 4a and b). Only approximately 0.6 % of all particles cross from the NIO into the SIO in the high beaching probability simulation, compared to about 1 % of all particles in the simulation with beaching probability of p=0.50 (5 d)−1. In the simulation with low beaching probability, around 86 % of all particles beach in the NIO after approximately 10 years (Fig. 4c). About 5.7 % of all particles cross the Equator into the SIO in this simulation, where they either beach (4.2 %) or end up in the subtropical SIO garbage patch (1.5 %).
Countries most affected
Which countries are most heavily affected by beaching particles released from the NIO depends on the beaching probability p. Nevertheless, there are some noteworthy general results and trends. Countries bordering the Bay of Bengal are consistently and heavily affected both for high and low beaching probability (Fig. 5a and c, respectively). For high beaching probability, this is most likely due to the large source locations of particles in the Bay of Bengal (Fig. 2a). For low beaching probability, however, this is more likely a result of ocean dynamics in the region. As shown in Sect. 3.1 (Fig. 3), there are particles in the Bay of Bengal throughout the year, which are therefore likely to beach in the region.
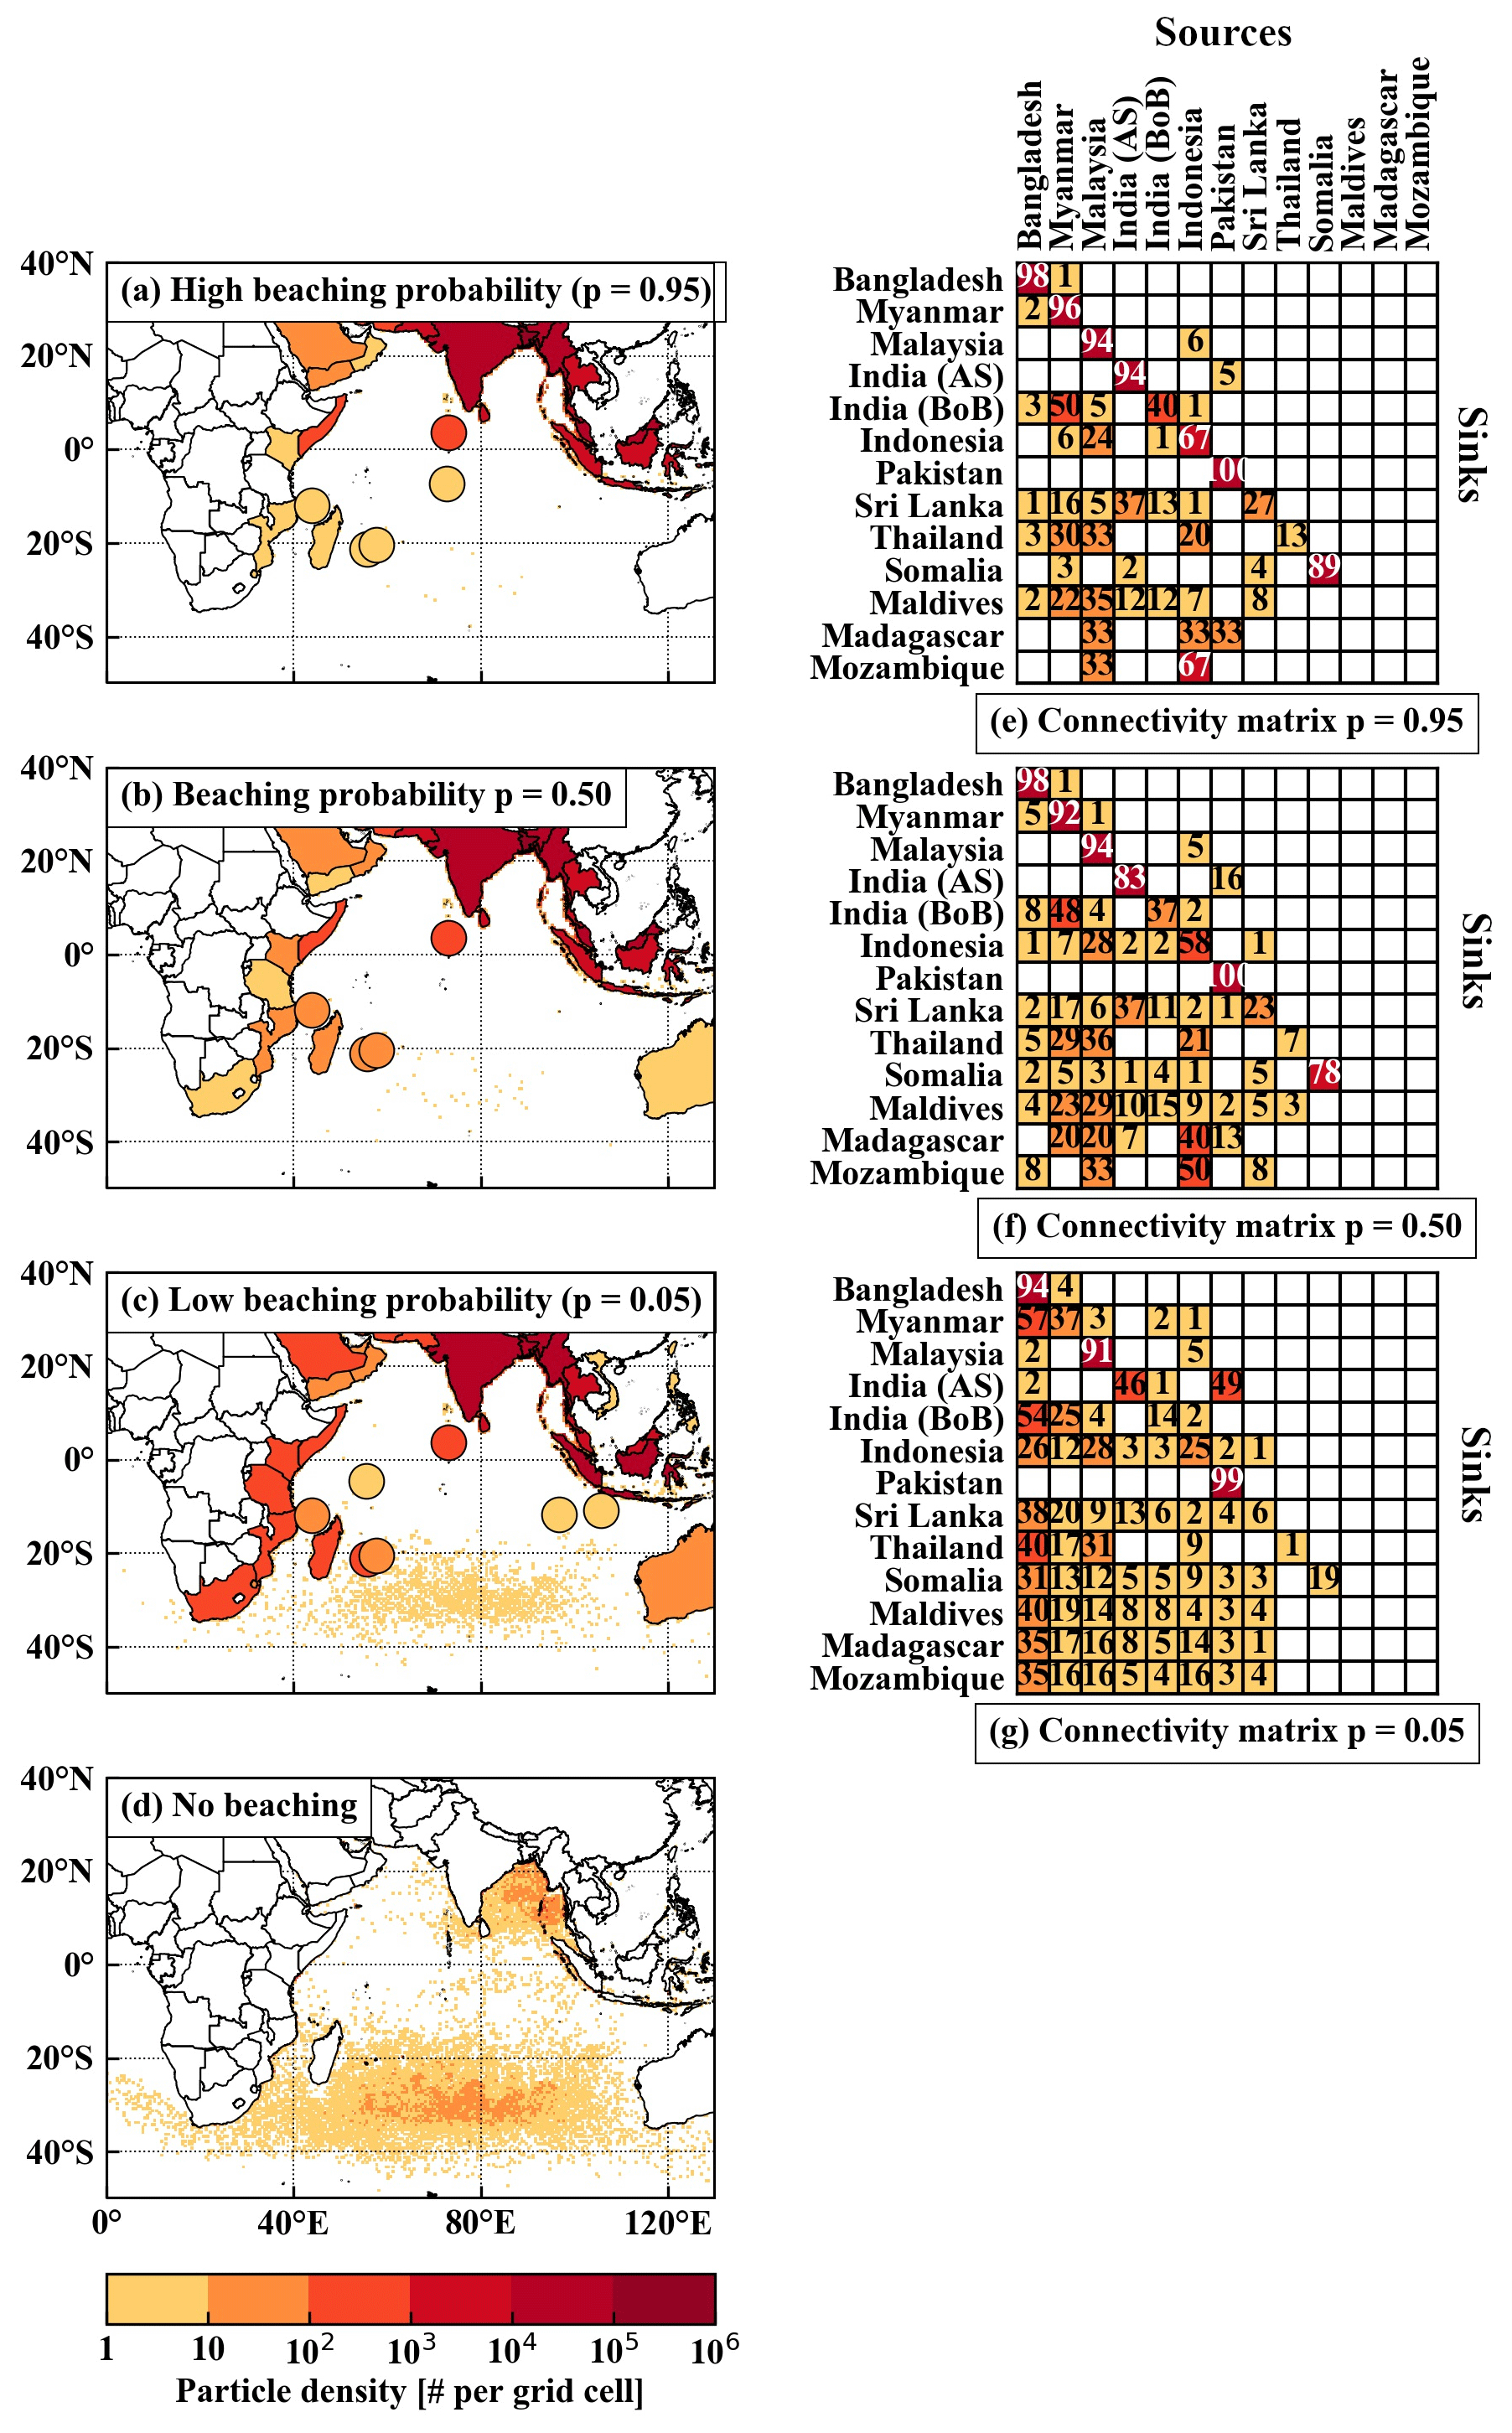
Figure 5Density of beached particles per country or island and density of particles in the ocean per 0.5∘ × 0.5∘ grid cell for particles released from river source locations in the Northern Hemisphere Indian Ocean after 21 years of simulation, with (a) a high beaching probability, i.e. p=0.95 (5 d)−1 (10-year animation of simulation results available at https://doi.org/10.5446/47058, van der Mheen et al., 2020c); (b) a beaching probability of p=0.50 (5 d)−1 (10-year animation of simulation results available at https://doi.org/10.5446/47057, van der Mheen et al., 2020b); (c) a low beaching probability, i.e. p=0.05 (5 d)−1 (10-year animation of simulation results available at https://doi.org/10.5446/47056, van der Mheen et al., 2020a); and (d) no beaching. Filled circles highlight islands that do not clearly show up on the map otherwise, from north to south these represent: the Maldives, Seychelles, the British Indian Ocean Territory, Christmas Island, Cocos (Keeling) Islands, Comoros, Mauritius, and Réunion. Connectivity matrices showing the percentage of particles that beach in selected countries (rows) against countries of origin (columns), for (e) a high beaching probability, i.e. p=0.95 (5 d)−1; (f) a beaching probability of p=0.50 (5 d)−1; and (g) a low beaching probability, i.e. p=0.05 (5 d)−1. In these matrices, India is split into a western side bordering the Arabian Sea, i.e. “India (AS)”, and an eastern side bordering the Bay of Bengal, i.e. “India (BoB)”. Note that the sum of each row does not always precisely equal 100 % because not all countries with river plastic sources are shown, percentages are rounded to integer numbers, and percentages below 1 % are omitted.
Connectivity matrices (such as those used by, e.g. Escalle et al., 2019) showing the percentage of beached particles originating from different countries confirm this. For high beaching probability, particles that beach in specific countries mainly originate from that same country (Fig. 5e, high percentages along the diagonal). In contrast, for low beaching probability, beached particles originate from multiple different countries (Fig. 5g). In the Bay of Bengal, notable exceptions to this are Bangladesh and Malaysia, for which > 90 % of beached plastics originate from their own country, even for low beaching probability.
The countries that are among the top 15 that receive the most beached particles for all beaching probability p values are: Bangladesh, Myanmar, India, Malaysia, Indonesia, Sri Lanka, Thailand, Pakistan, the Maldives, and Somalia (Table A2). Of these, only Somalia does not border the Bay of Bengal and does not have significant nearby inputs of plastic waste from rivers (Fig. 2a). For low beaching probabilities, most particles beaching in Somalia originate from countries bordering the Bay of Bengal (Fig. 5g). These particles most likely end up near Somalia as they are transported westward by the North Equatorial Current and the Somali Current during the northeast monsoon season.
The Maldives is also noteworthy as it receives a relatively large percentage of particles for almost all values of p, even though it has no river plastic sources of its own. Because both the Northeast Monsoon Current (NMC) and the Southwest Monsoon Current (SMC) flow past the Maldives in reversing directions, it is not unexpected that the Maldives are heavily affected by beaching particles. Similarly, Sri Lanka is also affected by beaching particles from multiple source countries as the NMC and SMC flow past.
For decreasing beaching probabilities p, a larger percentage of particles crosses from the NIO into the SIO, and several countries and islands in the SIO are increasingly affected by beaching particles (Table A2). Most notable among these are Madagascar and Mozambique, which are among the top 15 most affected countries for beaching probabilities p≤0.225 (5 d)−1.
The aim of this paper is to determine what happens to plastics entering the NIO from rivers and which countries and islands are most heavily affected by beaching plastics. Our particle-tracking simulation results illustrate that particles move between the Arabian Sea and the Bay of Bengal depending on the monsoon season. During the northeast monsoon season large amounts of particles are present in the Arabian Sea as they are transported from the Bay of Bengal by the Northeast Monsoon Current (NMC). In contrast, during the southwest monsoon season particles are largely depleted from the Arabian Sea by the Southwest Monsoon Current (SMC) and move into the Bay of Bengal. Despite the annual back-and-forth movement, particles remain present year-round in the Bay of Bengal. This is possibly a result of the annual mean eastward flow in the equatorial region (Schott et al., 2009), as well as anti-cyclonic and cyclonic gyres that develop in the Bay of Bengal throughout the year (Paul et al., 2009), which may trap plastics.
Countries bordering the Bay of Bengal are consistently and heavily affected by beaching plastics. Specifically, Bangladesh, Myanmar, India, Malaysia, Indonesia, Sri Lanka, Thailand, Pakistan, the Maldives, and Somalia are in the top 15 most affected countries in all our simulations. For high beaching probabilities, all particles beach in the NIO within 3 years. In this case, the locations where particles beach is mainly a result of large plastic sources in the region, and plastics mainly beach in their country of origin. However, for low beaching probabilities, this is more likely a result of ocean dynamics, and beached plastics originate from multiple different countries. Because the NIO dynamics concentrate plastics in the Bay of Bengal, bordering countries are affected by beaching even on long timescales of 𝒪(10) years.
Somalia and the Maldives are specifically noteworthy countries affected by beaching plastics from the NIO in our simulations. Somalia does not border the Bay of Bengal and does not have any large nearby sources of plastic coming from rivers. Nevertheless, large amounts of particles consistently beach here. For low beaching probabilities, beached river plastics in Somalia mainly originate from countries that border the Bay of Bengal. The westward-flowing North Equatorial Current and the southwestward-flowing Somalia Current likely transport plastics to Somalia during the northeast monsoon season. The Maldives is noteworthy because the NMC and the SMC transport particles back and forth past the islands twice a year, which increases the likelihood of plastics beaching here. The same is true for Sri Lanka in our simulations.
For low beaching probabilities, up to 5 % of particles escape from the NIO into the SIO. This mainly occurs on the eastern side of the NIO basin during the intermonsoon period following the southwest monsoon season (September, October, November). We propose the following mechanism for particles crossing from the NIO into the SIO: (1) particles are transported eastwards by equatorial Wyrtki jets during the intermonsoon period, (2) particles are transported southeastwards across the Equator by the South Java Current (SJC), (3) particles are transported southwestwards as the SJC feeds into the South Equatorial Current (SEC), and (4) particles are transported westwards by the SEC into the subtropical SIO.
Simulated particles that cross from the NIO into the SIO mainly beach on eastern African coastlines or accumulate in the subtropical SIO garbage patch. Madagascar and Mozambique are most notably increasingly affected as more particles cross into the SIO.
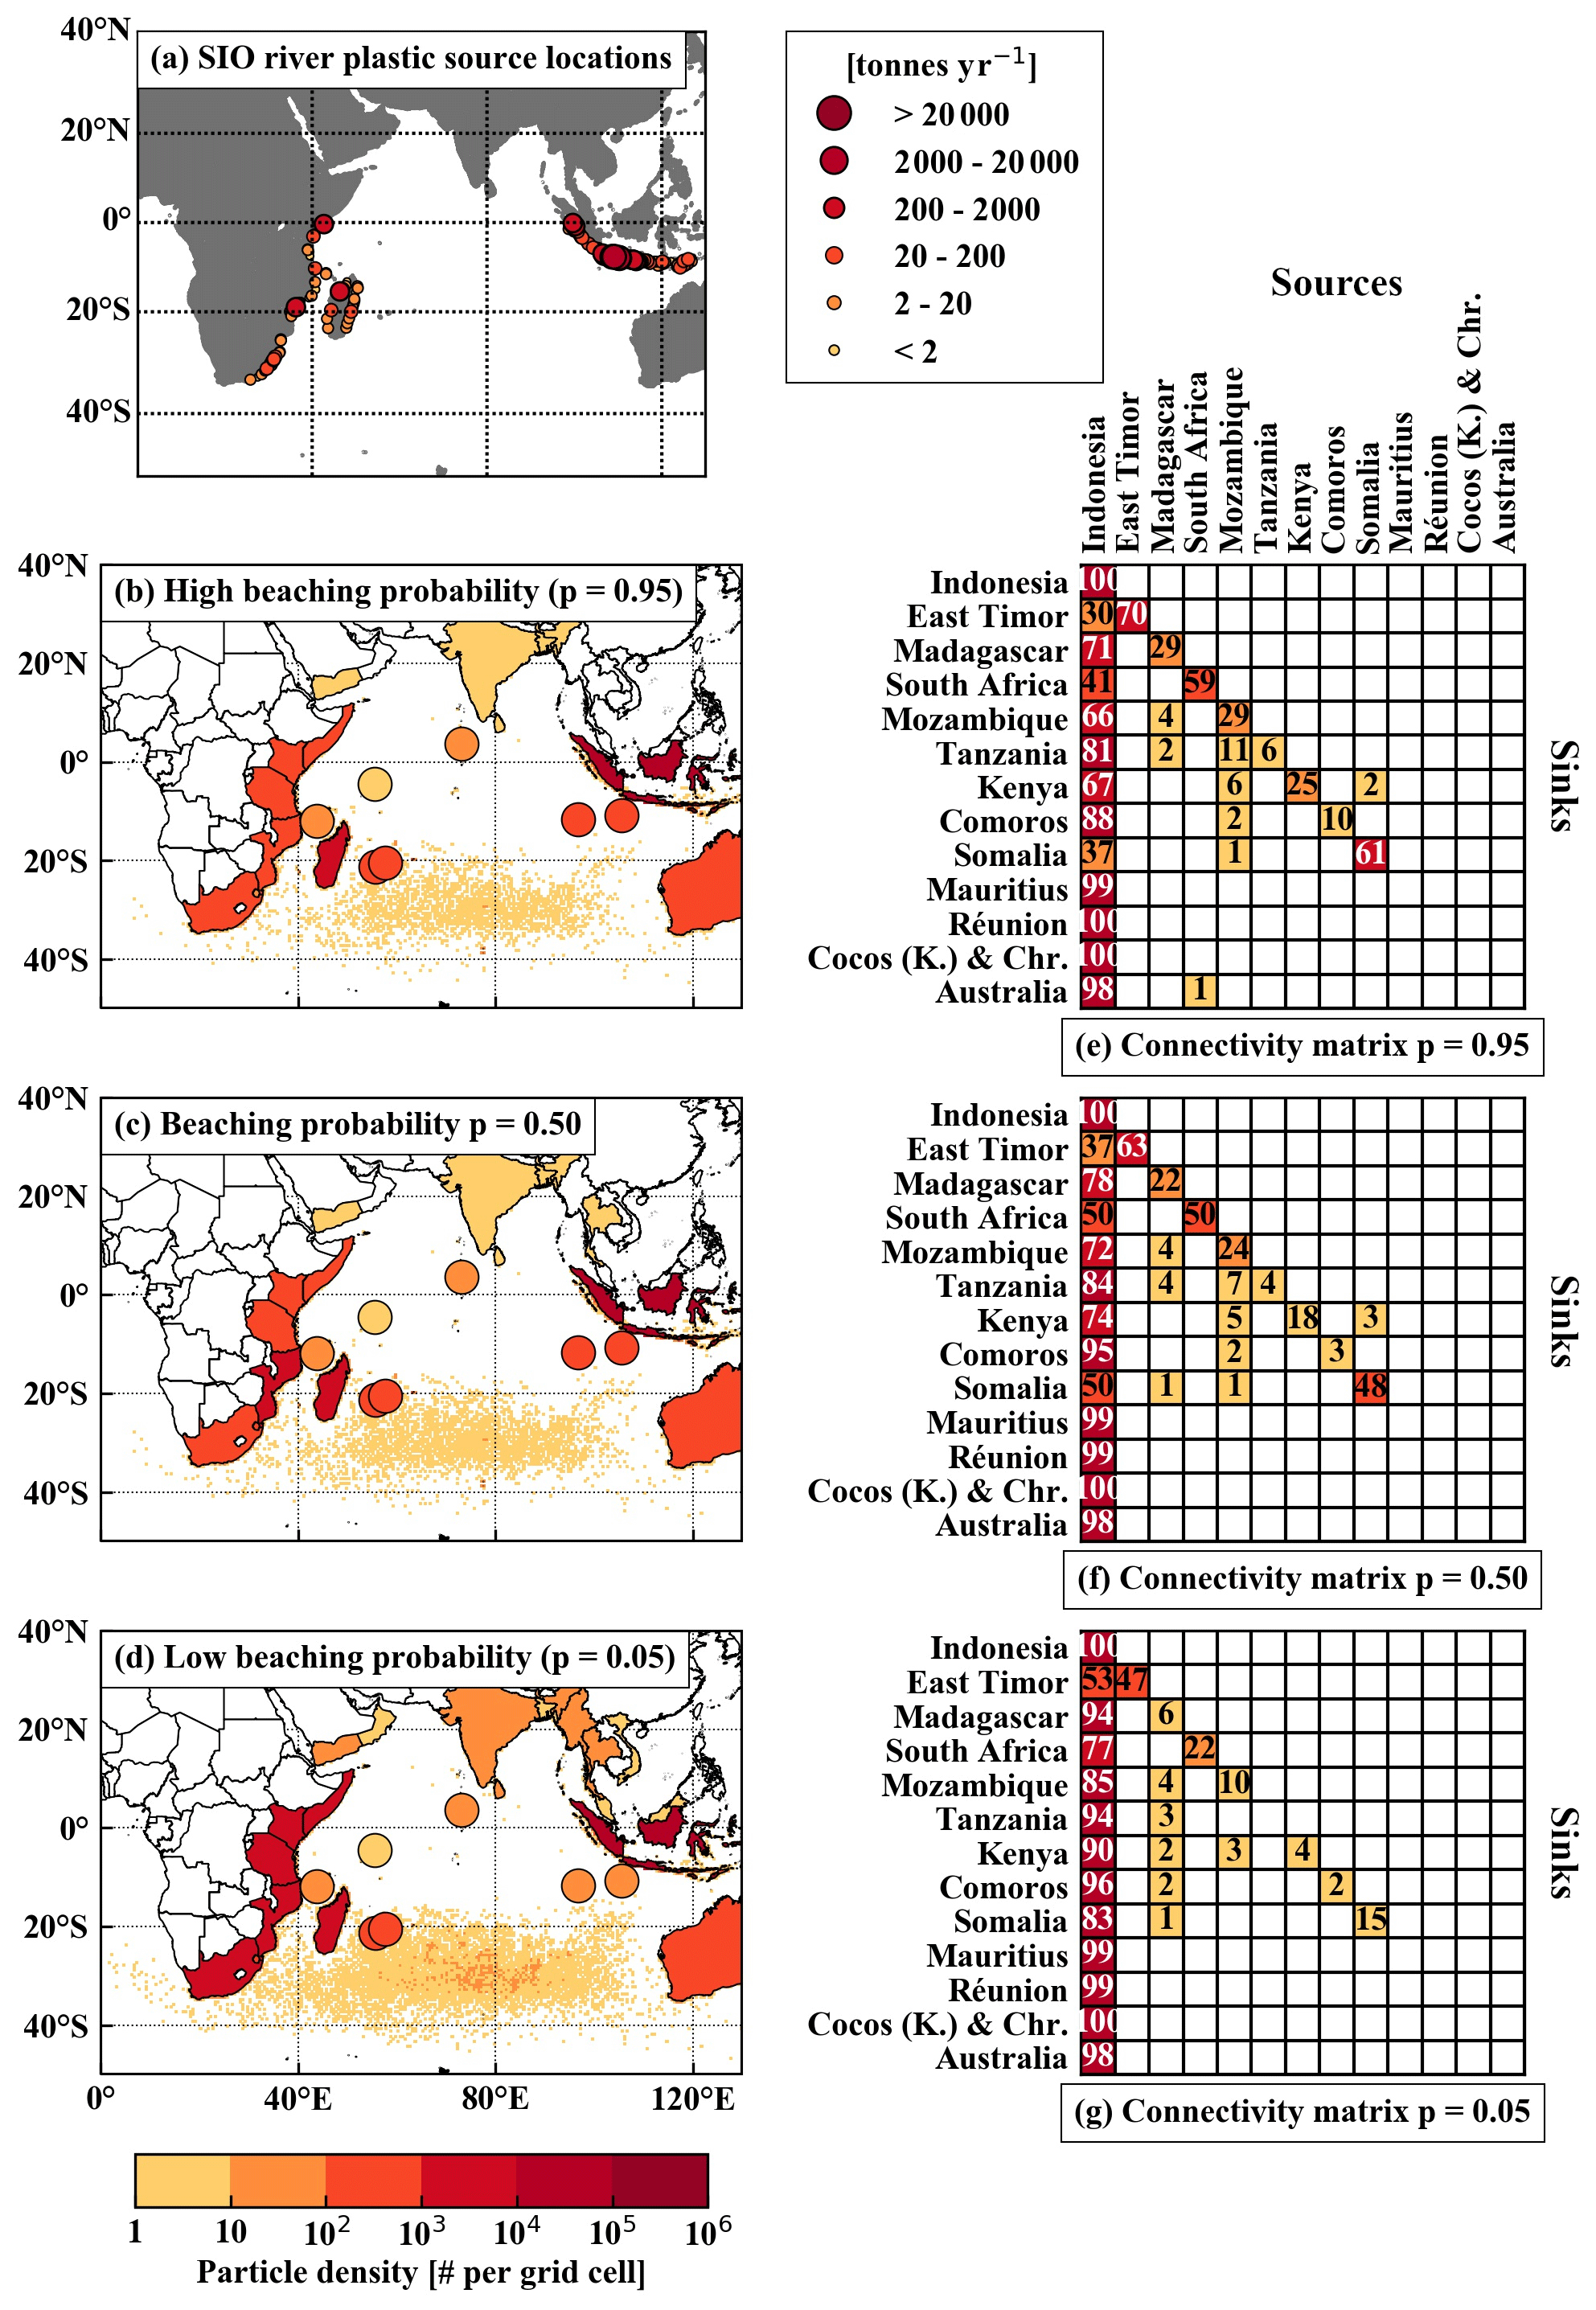
Figure 6(a) Locations of plastic waste input from rivers in the Southern Hemisphere Indian Ocean based on Lebreton et al. (2017). Density of beached particles per country or island and density of particles in the ocean per 0.5∘ × 0.5∘ grid cell for particles released from river source locations in the Southern Hemisphere Indian Ocean after 21 years of simulation, with (b) a high beaching probability, i.e. p=0.95 (5 d)−1 (10-year animation of simulation results available at https://doi.org/10.5446/47058, van der Mheen et al., 2020c); (c) a beaching probability of p=0.50 (5 d)−1 (10-year animation of simulation results available at https://doi.org/10.5446/47057, van der Mheen et al., 2020b); and (d) a low beaching probability, i.e. p=0.05 (5 d)−1 (10-year animation of simulation results available at https://doi.org/10.5446/47056, van der Mheen et al., 2020a). Filled circles highlight islands that do not clearly show up on the map otherwise, from north to south these represent: the Maldives, Seychelles, the British Indian Ocean Territory, Christmas Island, Cocos (Keeling) Islands, Comoros, Mauritius, and Réunion. Connectivity matrices showing the percentage of particles that beach in selected countries (rows) against countries of origin (columns) for (e) a high beaching probability, i.e. p=0.95 (5 d)−1; (f) a beaching probability of p=0.50 (5 d)−1; and (g) a low beaching probability, i.e. p=0.05 (5 d)−1. Note that the sum of each row does not always precisely equal 100 % because not all countries with river plastic sources are shown, percentages are rounded to integer numbers, and percentages below 1 % are omitted.
Countries and islands in the SIO will of course also be affected by beaching plastics entering the ocean from source locations in the SIO (Fig. 6a). In this case, simulation results show that the most affected countries in the SIO are similar to those affected by plastics escaping from the NIO into the SIO (Fig. 6b, c, and d). Notable exceptions to this are the Cocos (Keeling) Islands and Christmas Island, both of which are more severely affected by beaching particles originating from the SIO (especially with high beaching probability, Fig. 6b). Connectivity matrices indicate that particles mostly beach in their country of origin, or come from Indonesia (Fig. 6e, f, and g). Besides beaching in the SIO, plastics entering the SIO also accumulate in the subtropical garbage patch (up to 5 % for high beaching probability versus 36 % for low beaching probability). Particles can also cross the Equator and beach in NIO countries, although this occurs less frequently than plastics crossing from the NIO into the SIO (around 2 % crossing from the SIO into the NIO, compared to up to 5 % crossing from the NIO into the SIO for low beaching probabilities). Finally, particles entering the SIO also escape the Indian Ocean entirely: up to 2 % for high beaching probability and up to 7 % for low beaching probability.
Our results indicate that a large percentage of plastics end up on coastlines in the Indian Ocean. In our simulations with a high beaching probability, 100 % of particles beach in the NIO within 3 years. Up to 90 % of particles beach in either the NIO or SIO within 10 years in our simulations with a low beaching probability. These results are in good general agreement with those of Lebreton et al. (2019), who showed that roughly 67 % of all global plastic waste ended up on coastlines. Lebreton et al. (2019) therefore suggested that the large mismatch between the estimated amount of plastic entering the ocean globally and the total estimated amount of plastic floating on the ocean surface (the “missing plastic”, van Sebille et al., 2015) can be explained by plastics stored on coastlines. However, our simulations illustrate that results are sensitive to different beaching conditions, specifically the beaching probability. To determine if beached plastics can indeed explain the whereabouts of the missing plastic, it is therefore important to improve the simulation of beaching in numerical models and apply reliable beaching conditions.
The importance of coastal dynamics in the transport of plastics to the open ocean was recently demonstrated by Zhang et al. (2020), who found that as a result of tidal dynamics only roughly 20 % of simulated particles released around the East China Sea were transported to the open ocean. Pawlowicz et al. (2019) showed that ocean surface drifters in an estuary ran aground on timescales much shorter than the transport time to the open ocean. Both of these studies illustrate the importance of local dynamics in transporting plastics to the ocean. A better understanding of the overall effect of these dynamics, as well as a method to apply them on large scales (for example using a realistic beaching probability), is therefore needed to improve global- and basin-scale models of beaching plastics.
In addition, we applied a single beaching probability throughout the Indian Ocean to our simulation results. Because beaching mechanisms depend on local coastal dynamics and morphology, beaching probabilities likely vary from location to location. A better understanding of the spatial variation of beaching probabilities depending on local conditions will likely improve the numerical simulation of beaching plastics. Finally, we did not take into account that beached plastics can also return to the ocean. Including these dynamics may also improve the simulation of beaching plastics. Recent works by Hinata et al. (2020b, a) may contribute to this.
The work of van der Mheen et al. (2019) showed that different transport mechanisms, due to wind and waves, have a significant influence on the accumulation of buoyant debris in the subtropical SIO garbage patch. In this paper, we only considered the effect of ocean surface currents on the transport of river plastics entering the NIO. It is not straightforward to apply the same beaching methodology when simulations are forced not only by ocean surface currents but also by wind and wave effects. This is because, in contrast to ocean surface currents, the transport due to wind and Stokes drift can be directed perpendicular to coastlines. This means that including wind or wave effects adds a physical mechanism to the beaching of particles. However, in our methodology we assume that there are no physical beaching processes in the particle-tracking simulations, and beaching is included purely as a specified probability acting a certain distance from the coastline. This assumption is reasonable when particles are forced only by ocean surface currents, but it is no longer valid when wind or Stokes drift forcing is included as well. The best method to include wind and wave effects in these beaching simulations needs more careful consideration and extended analysis, which we will do in future work.
Because we have not included wind and wave effects in our simulations, our results are likely applicable only to plastics that are neutrally or slightly positively buoyant and are transported in the upper 2 m of the water column. Wind and waves can have a large influence on local beaching behaviour. However, on a large scale, we do not expect the influence of including either windage or Stokes drift to have such a significant effect as in the SIO. This is because both wind and ocean surface currents in the NIO are driven by the monsoon system. For example, although the timescales on which beaching occurs will likely change by including windage or Stokes drift, the main dynamics of particles moving between the Arabian Sea and the Bay of Bengal depending on the monsoon season should remain the same.
Finally, measurements of plastics on coastlines are needed to confirm and improve numerical modelling results. Although multiple studies sampled plastics on beaches throughout the Indian Ocean (Ryan, 1987; Slip and Burton, 1991; Madzena and Lasiak, 1997; Uneputty and Evans, 1997; Barnes, 2004; Jayasiri et al., 2013; Duhec et al., 2015; Nel and Froneman, 2015; Bouwman et al., 2016; Kumar et al., 2016; Imhof et al., 2017; Lavers et al., 2019), the different sampling methods and timescales mean that their results are difficult to compare quantitatively. In addition, standing stock measurements are of limited use because they provide no information about the time period over which plastics may have accumulated on beaches. Ideally, long-term measurements during different conditions and along different types of coastline are needed.
The aim of this paper is to determine what happens to plastics that enter the NIO from rivers. Our particle-tracking simulation results show that plastics move back and forth between the Bay of Bengal and the Arabian Sea depending on the monsoon season. During the southwest monsoon season, the Arabian Sea is almost completely depleted of particles as they are transported to the Bay of Bengal by the Southwest Monsoon Current. In contrast, there are relatively high concentrations of particles present in the Bay of Bengal year round. This may be due to the annual mean eastward flow in the equatorial region (Schott et al., 2009), as well as anti-cyclonic and cyclonic gyres in the Bay of Bengal (Paul et al., 2009) trapping plastics.
Particles move close to coastlines as they move between the Arabian Sea and the Bay of Bengal. When we allow simulated particles to beach with a high beaching probability (p=0.95 (5 d)−1), all particles beach in the NIO within 3 years, mostly in their country of origin. For low beaching probability (p=0.05 (5 d)−1), 86 % of particles beach in the NIO in 10 years. In most countries, beached river plastics originate from multiple different countries for low beaching probability. Countries bordering the Bay of Bengal are heavily affected by beaching particles in our simulations, likely because ocean dynamics concentrate particles in this region. Somalia and the Maldives are also consistently affected by beaching particles, even though they have no or few river sources of plastics of their own. In the case of the Maldives, this is a result of the Southwest Monsoon Current and the Northeast Monsoon Current transporting particles back and forth past the islands twice a year. In the case of Somalia, the North Equatorial Current and the Somalia Current likely transport particles originating from countries in the Bay of Bengal towards the Somalian coast.
In simulations with low beaching probability, up to 5 % of particles escape from the NIO into the SIO, where they predominantly beach along eastern African coastlines. Particles mostly pass the Equator along the eastern side of the Indian Ocean basin during the intermonsoon period following the southwest monsoon season (September, October, November). We suggest the following mechanism for their escape from the NIO into the SIO: (1) particles are transported eastwards by equatorial Wyrtki jets, (2) particles are transported southeastwards across the Equator by the South Java Current, (3) particles are transported southwestwards where the South Java Current feeds into the South Equatorial Current, and (4) particles are transported westwards into the subtropical SIO by the South Equatorial Current.
This details of this appendix are as follows.
-
Table A1 is an overview of studies that sampled plastics on beaches in the Indian Ocean. This table illustrates that a quantitative comparison between studies is difficult because of different methods and timescales of sampling.
-
Figure A1 shows the boundaries of the Northern Hemisphere and Southern Hemisphere Indian Ocean used in analyses discussed in the main article.
-
Figure A2 is an example of the method used to move original source locations of plastic waste a suitable distance away from land for release of particles in the particle-tracking simulations.
-
Figure A3 shows the Indian Ocean Dipole Mode Index used to determine neutral Indian Ocean Dipole years to run particle-tracking simulations to determine the influence of different monsoon seasons on particle transport.
-
Figure A4 shows the distance to the nearest coastline used to determine beaching of particles.
-
Figure A5 shows the sensitivity analysis results for beaching at different distances to the coast Δx. Results are not very sensitive to different values of Δx, so we use Δx=8 km for analyses in the main article.
-
Table A2 lists the top 15 countries most affected by beaching particles for beaching with different probabilities p.
Table A1Brief overview of studies that sampled plastics on beaches in the Indian Ocean, including methods and findings. Different studies use many different methods and units, and sampling was done on very different timescales.
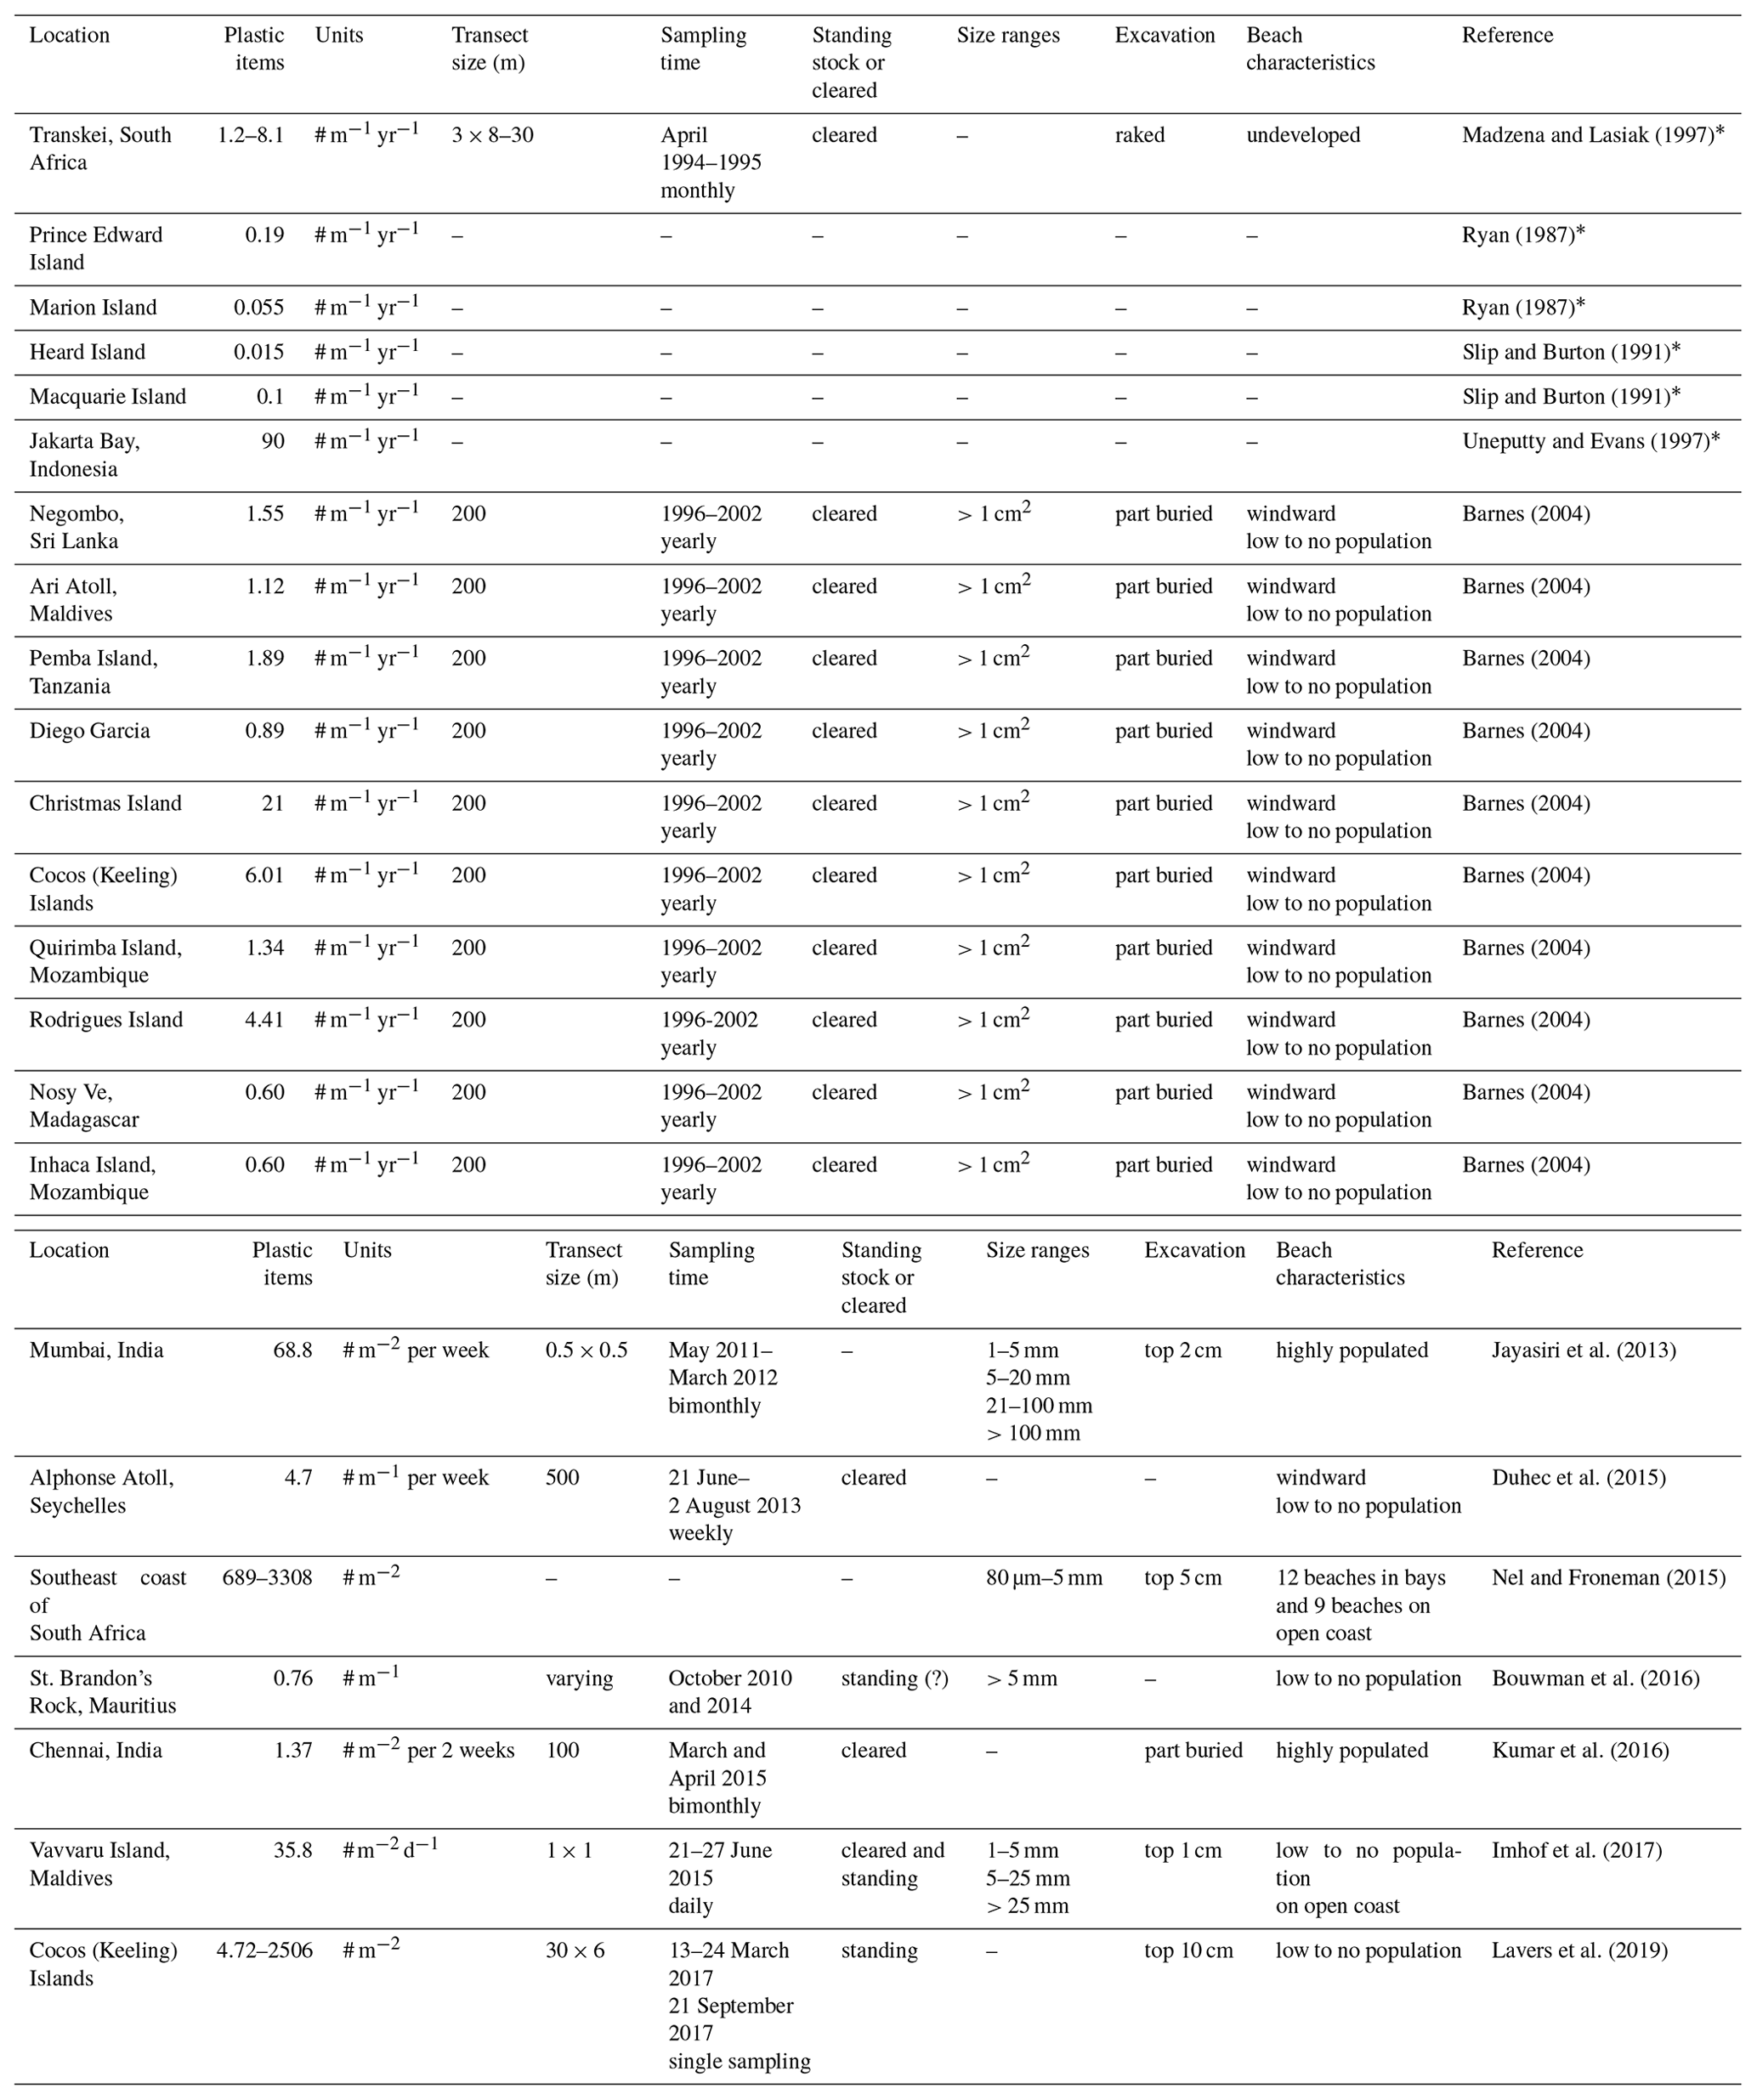
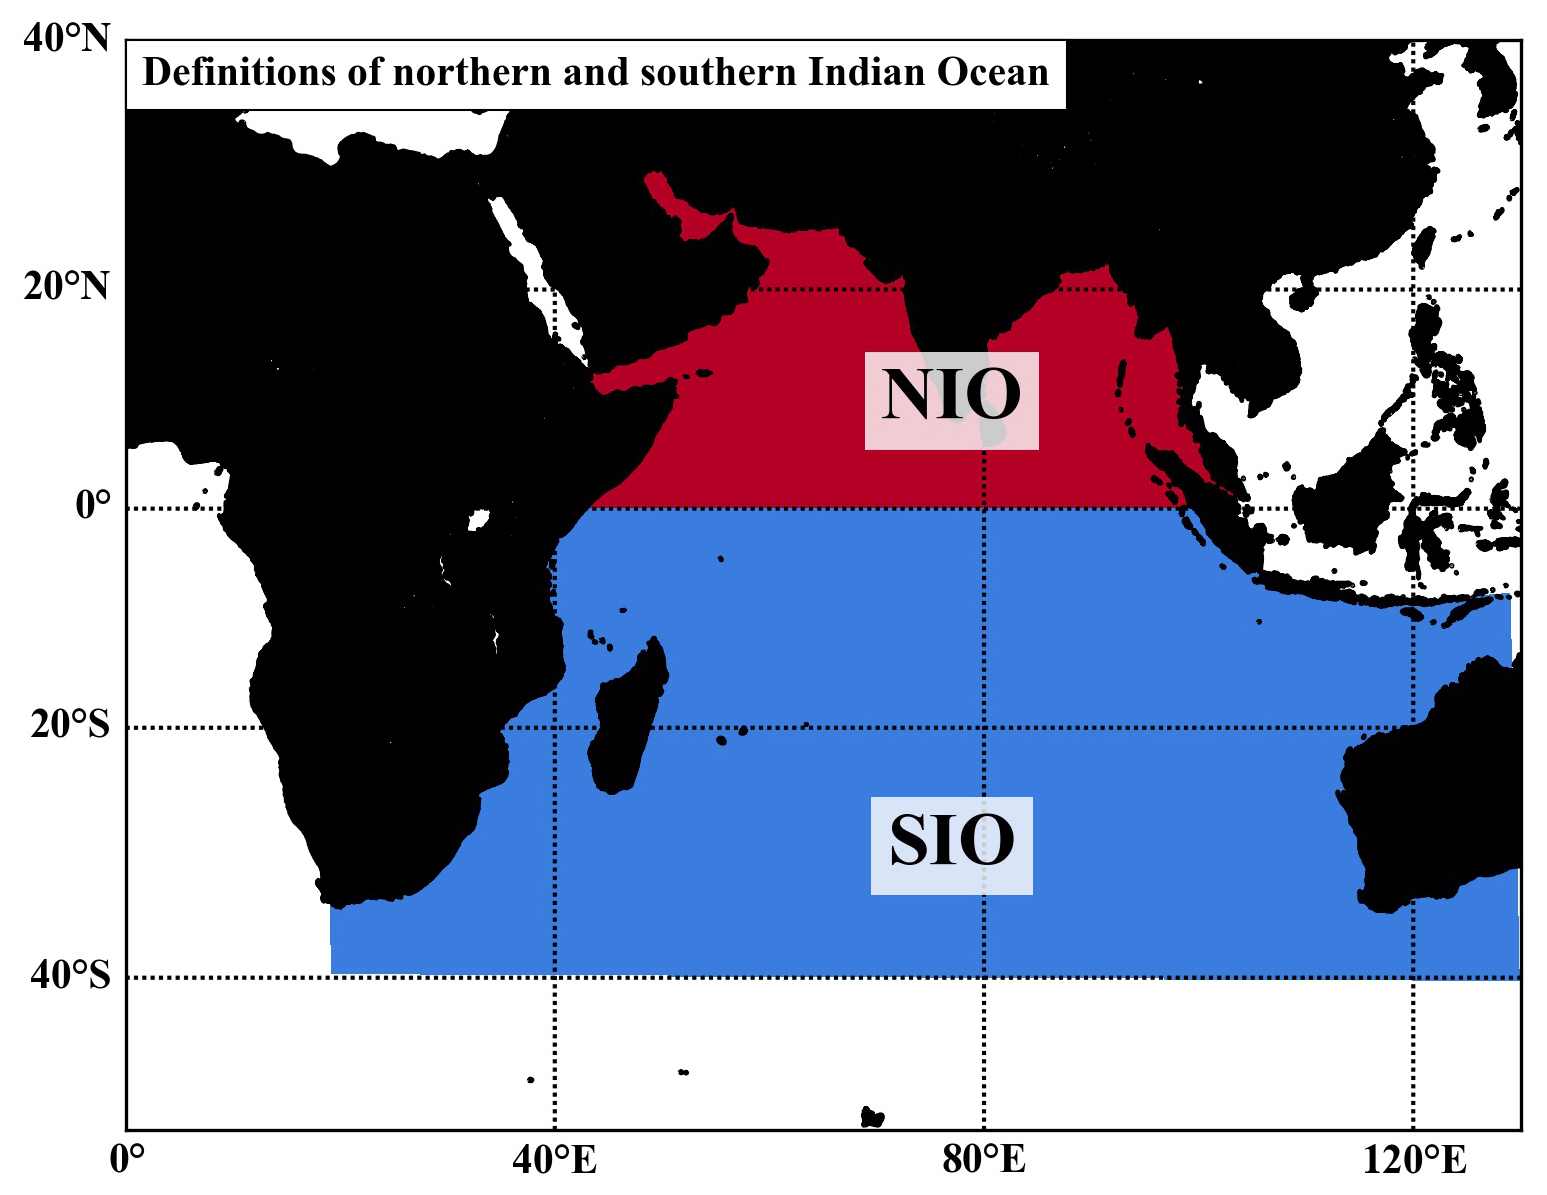
Figure A1Definition of the Northern Hemisphere Indian Ocean (NIO) and Southern Hemisphere Indian Ocean (SIO). We use these definitions to select release locations of particles from the NIO only and to determine the fate of particles during the simulation (e.g. beached or floating in the NIO or SIO).
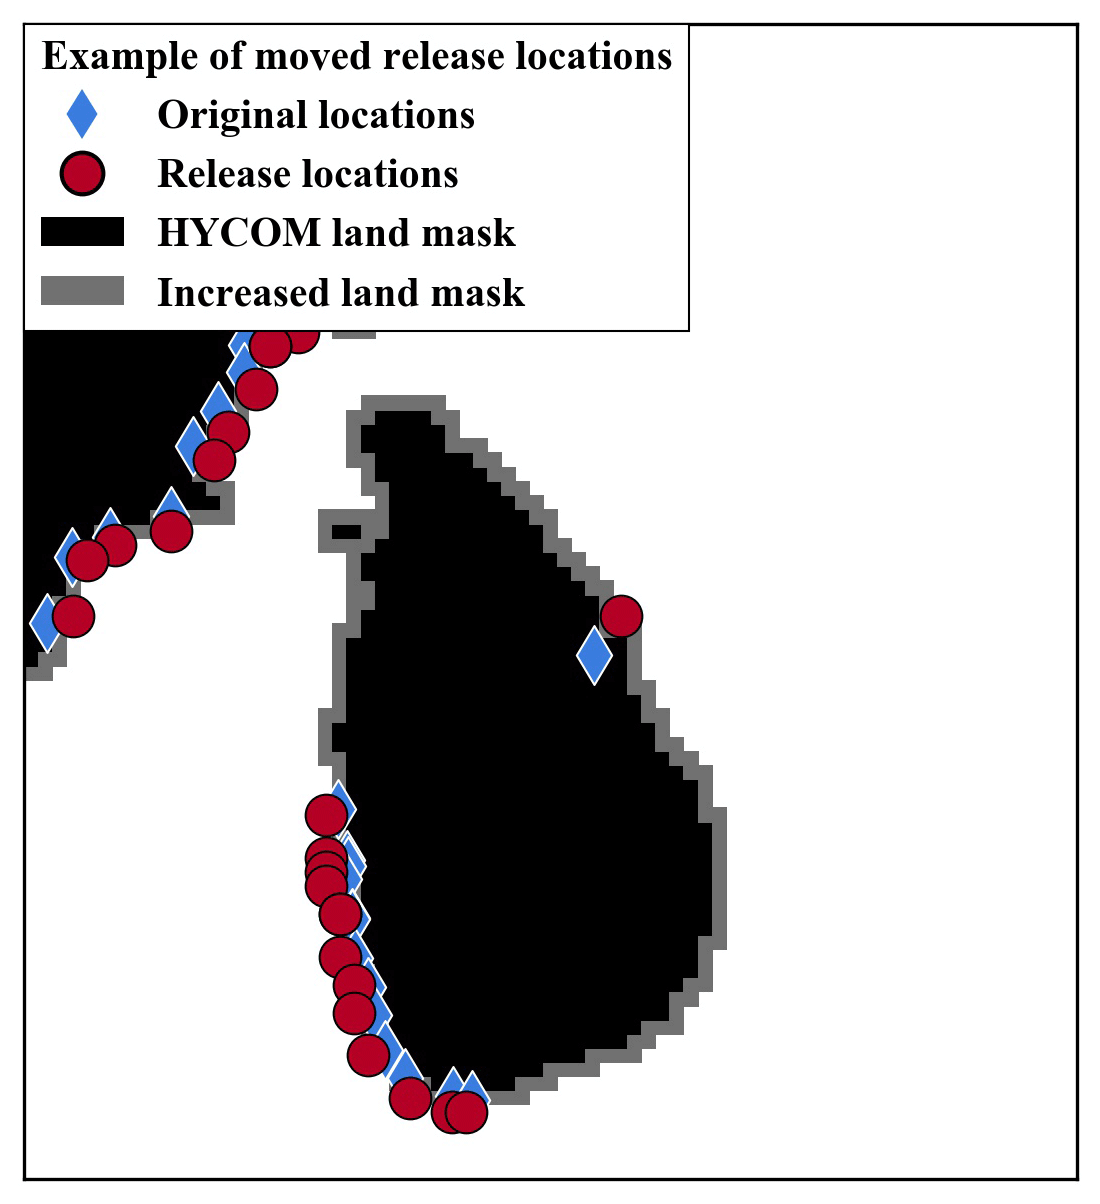
Figure A2Example of original river source locations estimated by Lebreton et al. (2017) and moved release locations in relation to the HYCOM land mask around Sri Lanka. Release locations are shifted compared to original source locations where necessary to prevent particles from being released on or too close to land in particle-tracking simulations.
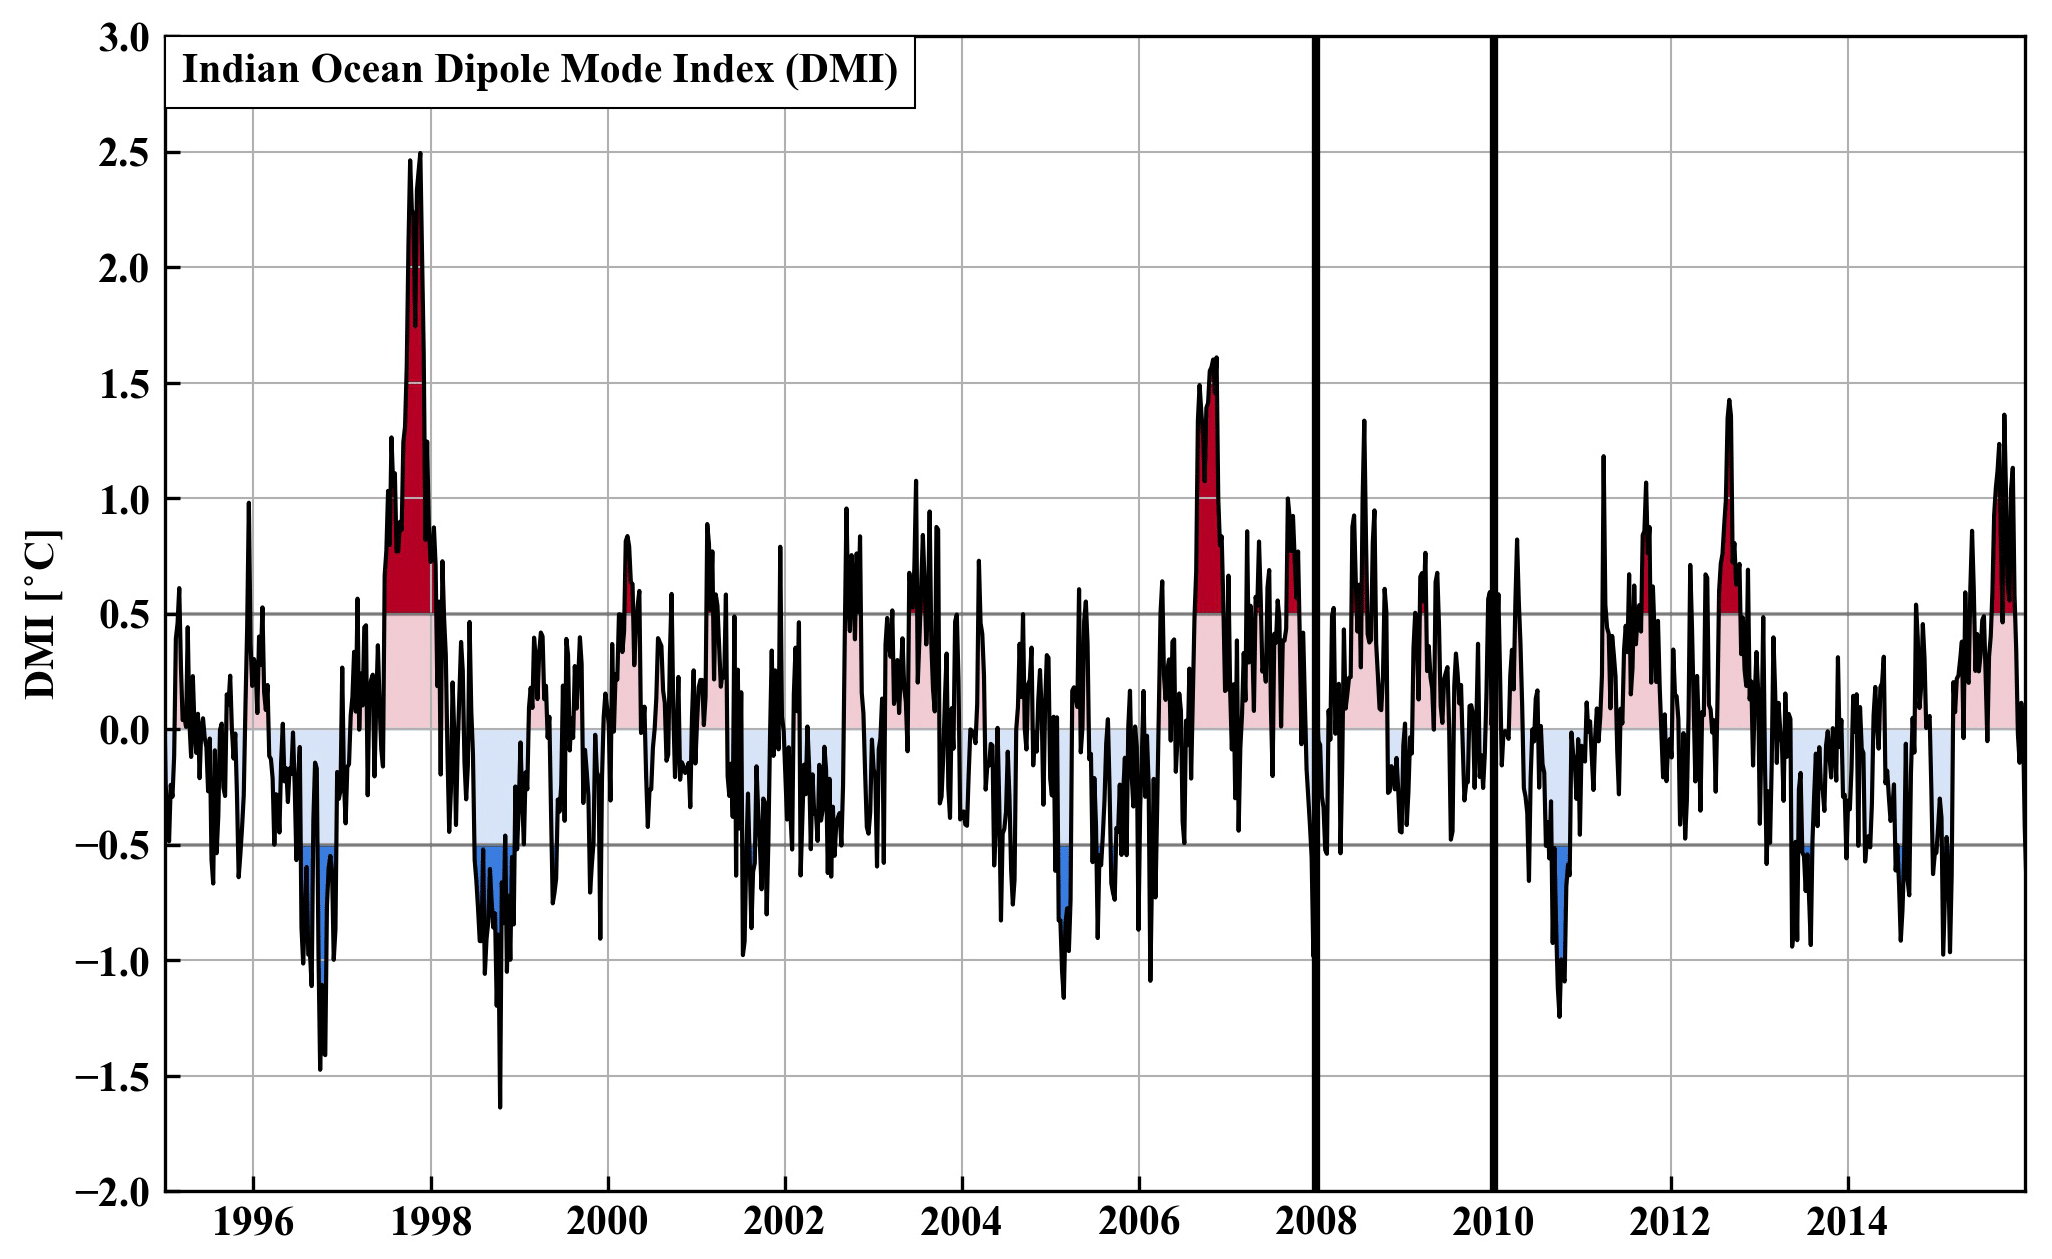
Figure A3Indian Ocean Dipole Mode Index (DMI) as defined by Saji et al. (1999) and obtained from the National Oceanic and Atmospheric Administration. Red and blue shading indicate positive and negative modes of the Indian Ocean Dipole (IOD), respectively. We use 2008 and 2009 (marked between thick vertical black lines) as neutral IOD years to simulate the influence of monsoon seasons on the transport of plastics in the Indian Ocean.
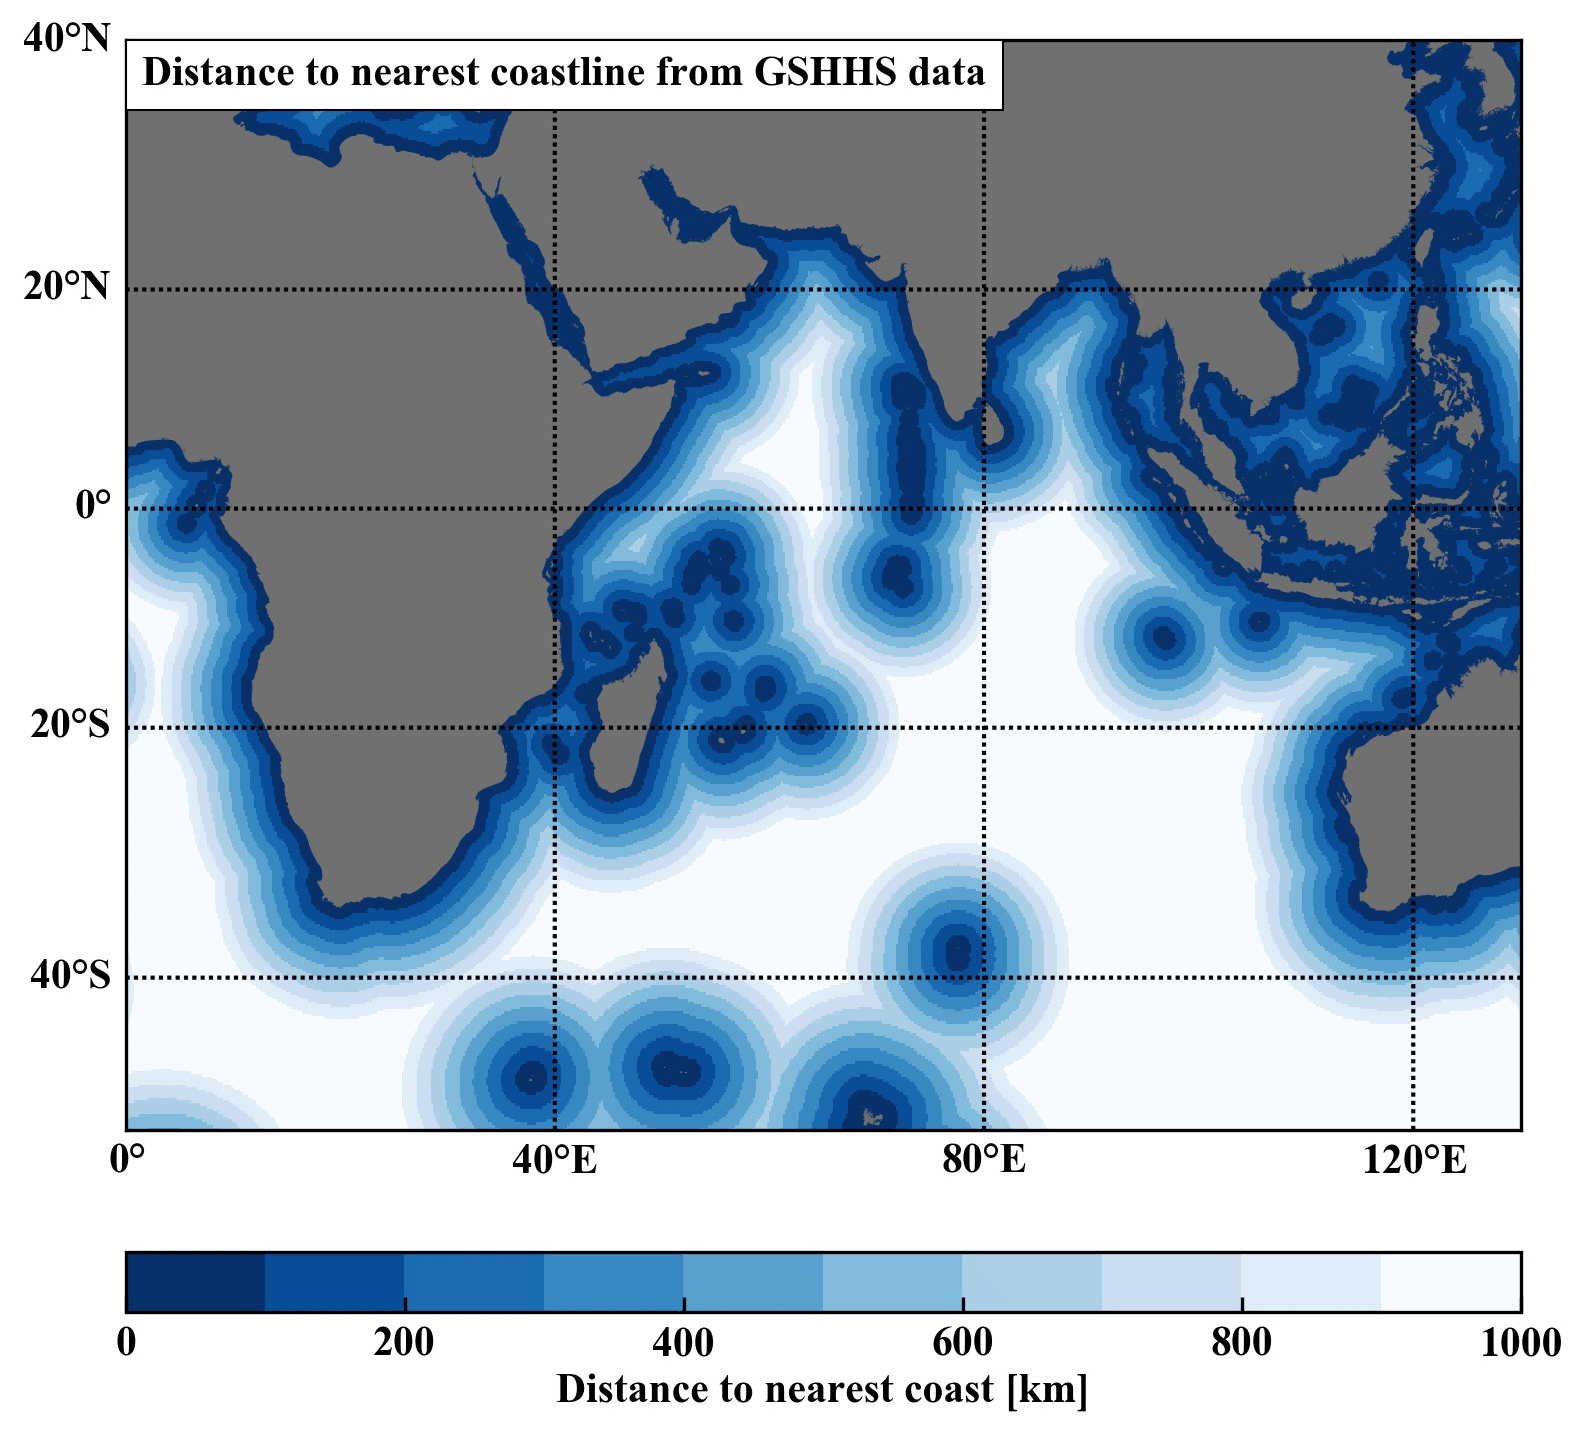
Figure A4Distance to the nearest coastline based on GSHHG-v2.3.7 data (Wessel and Smith, 1996). We use this distance to determine beaching conditions for simulated particles.
Table A2Top 15 most affected countries by beaching plastics released from the Northern Hemisphere Indian Ocean from river sources. Results are shown for different beaching probabilities p.
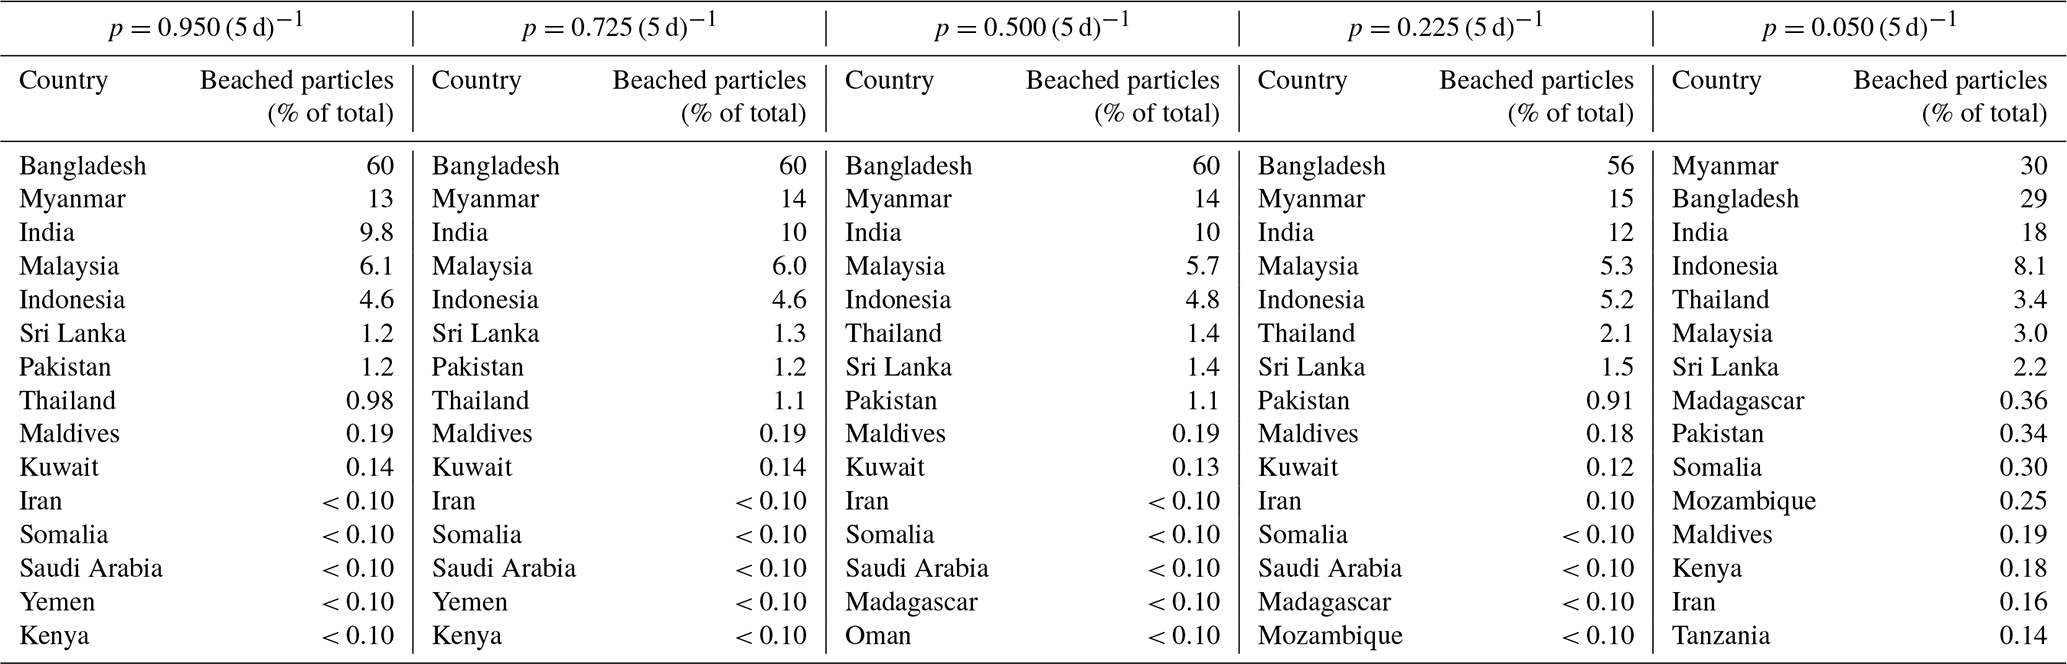
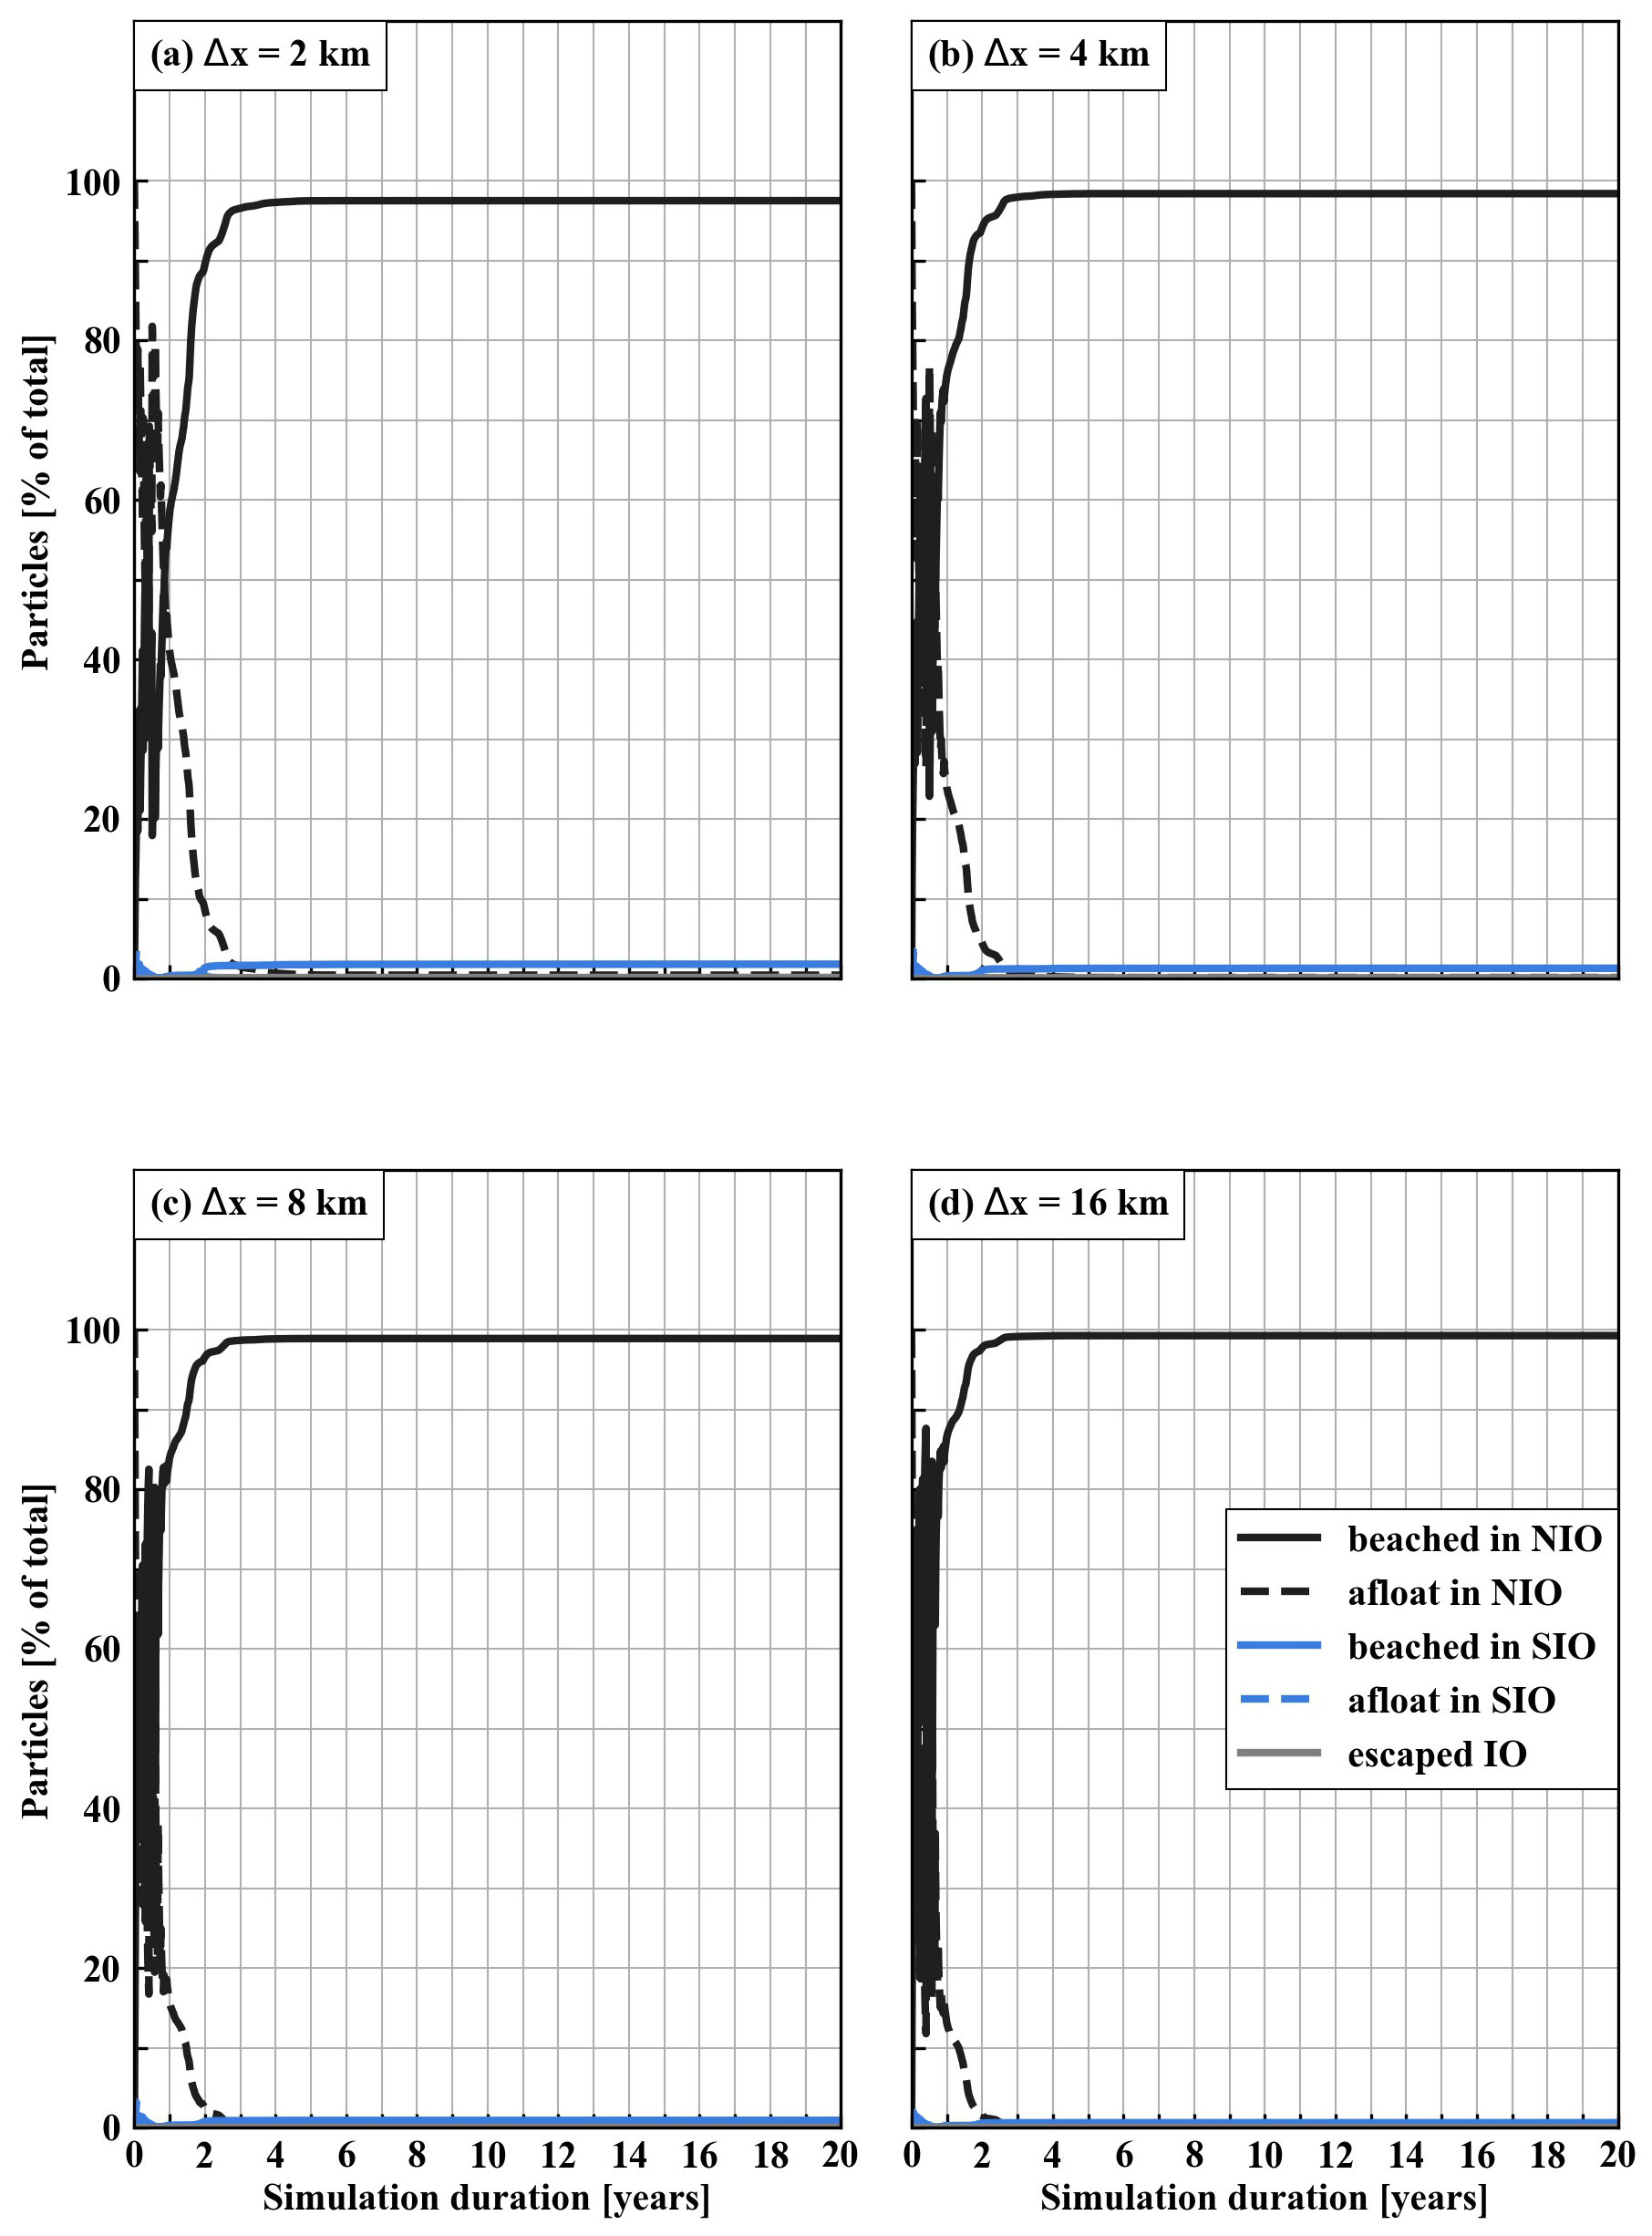
Figure A5Sensitivity analysis results where beaching occurs with a probability p=0.50 (5 d)−1 for particles within a distance km to the nearest coastline that are moving towards the coast. Results are not very sensitive to different values for Δx, and we use Δx=8 km as the default value in further simulations.
Ocean surface currents from the HYCOM+NCODA Global 1∕12∘ Reanalysis dataset are available from https://www.hycom.org/data/glbv0pt08/expt-53ptx (HYCOM Consortium for Data Assimilative Modeling, 2020). Distances to the nearest coastline based on the GSHHS dataset are available from https://www.soest.hawaii.edu/pwessel/gshhg/ (Wessel, 2020). We obtained values of the Indian Ocean Dipole Mode Index from http://stateoftheocean.osmc.noaa.gov/sur/ind/dmi.php (The State of the ocean climate, 2020). Our code to run particle-tracking simulations with OceanParcels and to apply beaching conditions is available under an MIT license: https://www.github.com/mheen/io_beaching (https://doi.org/10.5281/zenodo.4138759, van der Mheen, 2020).
Animations of 10-year particle-tracking simulation results of particles entering the Indian Ocean from river plastic sources are available with beaching occurring at a distance Δx=8 km to the nearest coastline with a probability of p=0.05 (5 d)−1 (https://doi.org/10.5446/47056, van der Mheen et al., 2020a), p=0.50 (5 d)−1 (https://doi.org/10.5446/47057, van der Mheen et al., 2020b), and p=0.95 (5 d)−1 (https://doi.org/10.5446/47058, van der Mheen et al., 2020c).
MvdM performed the research and prepared the manuscript. EvS and CP jointly supervised the work. All authors reviewed the manuscript.
The authors declare that they have no conflict of interest.
This research has been supported by the Australian Government (Research Training Program (RTP) Scholarship), the University of Western Australia (CFH & EA Jenkins Postgraduate Research Scholarship and Ad Hoc Scholarship), and the H2020 European Research Council (TOPIOS grant no. 715386).
This paper was edited by Anna Rubio and reviewed by two anonymous referees.
Andrady, A.: Microplastics in the marine environment, Mar. Pollut. Bull., 62, 1596–1605, https://doi.org/10.1016/j.marpolbul.2011.05.030, 2011. a
Ashok, K. and Guan, Z.: Individual and combined influences of ENSO and the Indian Ocean Dipole on the Indian Summer Monsoon, Am. Meteorol. Soc., 17, 3141–3155, https://doi.org/10.1175/1520-0442(2004)017<3141:IACIOE>2.0.CO;2, 2004. a
Barnes, D.: Natural and plastic flotsam stranding in the Indian Ocean, in: The effects of human transport on ecosystems: Cars and planes, boats and trains, edited by: Davenport, J. and Davenport, J., Royal Irish Academy, Dublin, Ireland, 193–205, 2004. a, b, c, d, e, f, g, h, i, j, k, l, m, n, o
Bouwman, H., Evans, S., Cole, N., Yive, N. S. C. K., and Kylin, H.: The flip-or-flop boutique: Marine debris on the shores of St Brandon's rock, an isolated tropical atoll in the Indian Ocean, Mar. Environ. Res., 114, 58–64, https://doi.org/10.1016/j.marenvres.2015.12.013, 2016. a, b, c, d, e
Bower, A.: A simple kinematic mechanism for mixing fluid parcels across a meandering jet, J. Phys. Oceanogr., 21, 173–180, https://doi.org/10.1175/1520-0485(1991)021<0173:ASKMFM>2.0.CO;2, 1991. a
Brambilla, E. and Talley, L.: Surface drifter exchange between the North Atlantic subtropical and subpolar gyres, J. Geophys. Res.-Oceans, 111, 1–16, https://doi.org/10.1029/2005JC003146, 2006. a
Cózar, A., Echevarria, F., Gonzalez-Gordillo, J., Irigoien, X., Ubeda, B., Hernandez-Leon, S., Palma, A., Navarro, S., de Lomas, J. G., Ruiz, A., de Puelles, M. F., and Duarte, C.: Plastic debris in the open ocean, P. Natl. Acad. Sci. USA, 111, 10239–10244, https://doi.org/10.1073/pnas.1314705111, 2014. a
Cummings, J.: Operational multivariate ocean data assimilation, Q. J. Roy. Meteor. Soc., 131, 3583–3604, https://doi.org/10.1256/qj.05.105, 2005. a
Cummings, J. and Smedstad, O.: Variational data assimilation for the global ocean, Data Assimilation for Atmospheric, Oceanic and Hydrologic Applications, 2, 303–343, https://doi.org/10.1007/978-3-642-35088-7_13, 2013. a
Delandmeter, P. and van Sebille, E.: The Parcels v2.0 Lagrangian framework: new field interpolation schemes, Geosci. Model Dev., 12, 3571–3584, https://doi.org/10.5194/gmd-12-3571-2019, 2019. a
de Vos, A., Pattiaratchi, C. B., and Wijeratne, E. M. S.: Surface circulation and upwelling patterns around Sri Lanka, Biogeosciences, 11, 5909–5930, https://doi.org/10.5194/bg-11-5909-2014, 2014. a, b, c
Dijkstra, H.: Dynamical Oceanography, chap. 11 Equatorial ocean circulation, Springer, Heidelberg, Germany, 241–272, 2008. a
Duhec, A., Jeanne, R., Maximenko, N., and Hafner, J.: Composition and potential origin of marine debris stranded in the western Indian Ocean on remote Alphonse Island, Seychelles, Mar. Pollut. Bull., 96, 76–86, https://doi.org/10.1016/j.marpolbul.2015.05.042, 2015. a, b, c, d, e
Eriksen, M., Maximenko, N., Thiel, M., Cummins, A., Lattin, G., Wilson, S., Hafner, J., Zellers, A., and Rifman, S.: Plastic pollution in the South Pacific subtropical gyre, Mar. Pollut. Bull., 68, 71–76, https://doi.org/10.1016/j.marpolbul.2012.12.021, 2013. a
Eriksen, M., Lebreton, L., Carson, H., Thiel, M., Moore, C., Borerro, J., Galgani, F., Ryan, P., and Reisser, J.: Plastic pollution in the world's oceans: More than 5 trillion plastic pieces weighing over 250,000 tons afloat at sea, PLOS ONE, 9, e111913, https://doi.org/10.1371/journal.pone.0111913, 2014. a
Escalle, L., Phillips, J., Brownjohn, M., Brouwer, S., Gupta, A., van Sebille, E., Hampton, J., and Pilling, G.: Environmental versus operational drivers of drifting FAD beaching in the Western and Central Pacific Ocean, Sci. Rep., 9, 1–12, https://doi.org/10.1038/s41598-019-50364-0, 2019. a
Froyland, G., Stuart, R., and van Sebille, E.: How well-connected is the surface of the global ocean?, Chaos, 24, 033126, https://doi.org/10.1063/1.4892530, 2014. a
Gordon, A.: The brawniest retroflection, Nature, 421, 904–905, https://doi.org/10.1038/421904a, 2003. a
Hinata, H., Ohno, K., Sagawa, N., Kataoka, T., and Takeoka, H.: Numerical modeling of the beach process of marine plastics: 2. A diagnostic approach with onshore-offshore advection-diffusion equations for buoyant plastics, Mar. Pollut. Bull., 160, 1–13, https://doi.org/10.1016/j.marpolbul.2020.111548, 2020a. a
Hinata, H., Sagawa, N., Kataoka, T., and Takeoaka, H.: Numerical modeling of the beach process of marine plastics: A probabilistic and diagnostic approach with a particle tracking method, Mar. Pollut. Bull., 152, 1–13, https://doi.org/10.1016/j.marpolbul.2020.110910, 2020b. a
HYCOM Consortium for Data Assimilative Modeling: GOFS 3.1: 41-layer HYCOM + NCODA Global 1∕12∘ Reanalysis, available at: https://www.hycom.org/data/glbv0pt08/expt-53ptx, last access: 27 October 2020. a
Imhof, H., Sigl, R., Brauer, E., Feyl, S., Giesemann, P., Klink, S., Leupolz, K., Löder, M., Löschel, L., Missun, J., Muszynski, S., Ramsperger, A., Schrank, I., Speck, S., Steibl, S., Trotter, B., Winter, I., and Laforsch, C.: Spatial and temporal variation of macro-, meso- and microplastic abundance on a remote coral island of the Maldives, Indian Ocean, Mar. Pollut. Bull., 116, 340–347, https://doi.org/10.1016/j.marpolbul.2017.01.010, 2017. a, b, c, d, e
Isobe, A., Kubo, K., Tamura, Y., Kako, S., Nakashima, E., and Fujii, N.: Selective transport of microplastics and mesoplastics by drifting in coastal waters, Mar. Pollut. Bull., 89, 324–330, https://doi.org/10.1016/j.marpolbul.2014.09.041, 2014. a
Jambeck, J., Geyer, R., Wilcox, C., Siegler, T., Perryman, M., Andrady, A., Narayan, R., and Law, K.: Plastic waste inputs from land into the ocean, Science, 347, 768–771, https://doi.org/10.1126/science.1260352, 2015. a, b, c, d, e
Jayasiri, H., Purushothaman, C., and Vennila, A.: Quantitative analysis of plastic debris on recreational beaches in Mumbai, India, Mar. Pollut. Bull., 77, 107–112, https://doi.org/10.1016/j.marpolbul.2013.10.024, 2013. a, b, c, d, e
Kumar, A. A., Sivakumar, R., Reddy, Y. S. R., Raja, M. B., Nishanth, T., and Revanth, V.: Preliminary study on marine debris pollution along Marina beach, Cheannai, India, Regional Studies in Marine Science, 5, 35–40, https://doi.org/10.1016/j.rsma.2016.01.002, 2016. a, b, c, d, e
Lange, M. and van Sebille, E.: Parcels v0.9: prototyping a Lagrangian ocean analysis framework for the petascale age, Geosci. Model Dev., 10, 4175–4186, https://doi.org/10.5194/gmd-10-4175-2017, 2017. a
Lavers, J., Dicks, L., Dicks, M., and Finger, A.: Significant plastic accumulation on the Cocos (Keeling) Islands, Australia, Sci. Rep., 9, 7102, https://doi.org/10.1038/s41598-019-43375-4, 2019. a, b, c, d, e
Law, K.: Plastics in the marine environment, Annu. Rev. Mar. Sci., 9, 205–229, https://doi.org/10.1146/annurev-marine-010816-060409, 2017. a
Lebreton, L., Greer, S., and Borrero, J.: Numerical modelling of floating debris in the world's oceans, Mar. Pollut. Bull., 64, 653–661, https://doi.org/10.1016/j.marpolbul.2011.10.027, 2012. a, b, c
Lebreton, L., van der Zwet, J., Damsteeg, J., Slat, B., Andrady, A., and Reisser, J.: River plastic emissions to the world's oceans, Nat. Commun., 8, 15611, https://doi.org/10.1038/ncomms15611, 2017. a, b, c, d, e, f, g, h, i, j, k, l, m
Lebreton, L., Egger, M., and Slat, B.: A global mass budget for positively buoyant macroplastic debris in the ocean, Sci. Rep., 9, 12922, https://doi.org/10.1038/s41598-019-49413-5, 2019. a, b, c, d
Madzena, A. and Lasiak, T.: Spatial and temporal variations in beach litter on the Transkei coast of South Africa, Mar. Pollut. Bull., 34, 900–907, https://doi.org/10.1016/S0025-326X(97)00052-0, 1997. a, b, c, d, e
Maximenko, N., Hafner, J., and Niiler, P.: Pathways of marine debris derived from trajectories of Lagrangian drifters, Mar. Pollut. Bull., 65, 51–62, https://doi.org/10.1016/j.marpolbul.2011.04.016, 2012. a, b, c
McAdam, R. and van Sebille, E.: Surface connectivity and interocean exchanges from drifter-based transition matrices, J. Geophys. Res.-Oceans, 123, 514–532, https://doi.org/10.1002/2017JC013363, 2018. a
Moore, C., Moore, S., Leecaster, M., and Weisberg, S.: A comparison of plastic and plankton in the North Pacific central gyre, Mar. Pollut. Bull., 42, 1297–1300, https://doi.org/10.1016/S0025-326X(01)00114-X, 2001. a
Morris, R.: Plastic debris in the surface waters of the South Atlantic, Mar. Pollut. Bull., 11, 164–166, https://doi.org/10.1016/0025-326X(80)90144-7, 1980. a
Nel, H. and Froneman, P.: A quantitative analysis of microplastic pollution along the south-eastern coastline of South Africa, Mar. Pollut. Bull., 101, 274–279, https://doi.org/10.1016/j.marpolbul.2015.09.043, 2015. a, b, c, d, e
Paul, S., Chakraborty, A., Pandey, P., Basu, S., Satsangi, S., and Ravichandran, M.: Numerical simulation of Bay of Bengal circulation features from ocean general circulation model, Mar. Geod., 32, 1–18, https://doi.org/10.1080/01490410802661930, 2009. a, b, c
Pawlowicz, R., Hannah, C., and Rosenberger, A.: Lagrangian observations of estuarine residence times, dispersion and trapping in the Salish Sea, Estuar. Coast. Shelf Sci., 225, 106246, https://doi.org/10.1016/j.ecss.2019.106246, 2019. a
Peliz, A., Marchesiello, P., Dubert, J., Marta-Almeida, M., Roy, C., and Queiroga, H.: A study of crab larvae dispersal on the Western Iberian Shelf: Physical processes, J. Marine Syst., 68, 215–235, https://doi.org/10.1016/j.jmarsys.2006.11.007, 2007. a
Qui, Y. and Yu, W.: Behaviour of the Wrytki Jet observed with surface drifting buoys and satellite altimeter, Geophys. Res. Lett., 36, 1–5, https://doi.org/10.1029/2009GL039120, 2009. a, b
Reisser, J., Shaw, J., Wilcox, C., Hardesty, B., Proietti, M., Thums, M., and Pattiaratchi, C.: Marine plastic pollution in waters around Australia: Characteristics, concentrations, and pathways, PLoS ONE, 8, e80466, https://doi.org/10.1371/journal.pone.0080466, 2013. a
Ryan, P.: The origin and fate of artefacts stranded on islands in the African sector of the Southern Ocean, Environ. Conserv., 14, 341–346, https://doi.org/10.1017/S0376892900016854, 1987. a, b, c, d, e, f
Ryan, P.: A simple technique for counting marine debris at sea reveals steep litter gradients between the Straits of Malacca and the Bay of Bengal, Mar. Pollut. Bull., 69, 128–136, https://doi.org/10.1016/j.marpolbul.2013.01.016, 2013. a
Saji, N., Goswami, B., Vinayachandran, P., and Yamagata, T.: A dipole mode in the tropical Indian Ocean, Nature, 401, 360–363, https://doi.org/10.1038/43854, 1999. a, b, c
Schmidt, C., Krauth, T., and Wagner, S.: Export of plastic debris by rivers into the sea, Environ. Sci. Technol., 51, 12246–12253, https://doi.org/10.1021/acs.est.7b02368, 2017. a, b, c, d
Schott, F., Xie, S., and McCreary, J.: Indian Ocean circulation and climate variability, Rev. Geophys., 47, RG1002, https://doi.org/10.1029/2007RG000245, 2009. a, b, c, d, e, f, g, h, i, j
Slip, D. and Burton, H.: Accumulation of fishing debris, plastic litter, and other artefacts, on Heard and Macquarie Islands in the Southern Ocean, Environ. Conserv., 18, 249–254, https://doi.org/10.1017/S0376892900022177, 1991. a, b, c, d, e, f
Sprintall, J., Wijffels, S., Molcard, R., and Jaya, I.: Direct estimates of the Indonesian Throughflow entering the Indian Ocean: 2004-2006, J. Geophys. Res.-Oceans, 114, 1–19, https://doi.org/10.1029/2008JC005257, 2009. a
Sprintall, J., Wijffels, S., Molcard, R., and Jaya, I.: Direct evidence of the South Java Current system in Ombai Strait, Dynam. Atmos. Oceans, 50, 140–156, https://doi.org/10.1016/j.dynatmoce.2010.02.006, 2010. a, b
The State of the ocean climate: Dipole Mode Index (DMI), available at: http://stateoftheocean.osmc.noaa.gov/sur/ind/dmi.php, last access: 27 October 2020. a
Uneputty, P. and Evans, S.: Accumulation of beach litter on islands of the Pulau Seribu Archipelago, Indonesia, Mar. Pollut. Bull., 34, 652–655, https://doi.org/10.1016/S0025-326X(97)00006-4, 1997. a, b, c, d, e
van der Mheen, M.: Indian Ocean beaching, Zenodo, https://doi.org/10.5281/zenodo.4138759, 2020. a
van der Mheen, M., Pattiaratchi, C., and van Sebille, E.: Role of Indian Ocean dynamics on accumulation of buoyant debris, J. Geophys. Res.-Oceans, 124, 2571–2590, https://doi.org/10.1029/2018JC014806, 2019. a, b, c, d, e, f
van der Mheen, M., van Sebille, E., and Pattiaratchi, C.: Beaching at 8 km from coastline with 0.05/5 days probability, Beaching patterns of plastic debris along the Indian Ocean rim, Copernicus Publications, https://doi.org/10.5446/47056, 2020a. a, b, c
van der Mheen, M., van Sebille, E., and Pattiaratchi, C.: Beaching at 8 km from coastline with 0.50/5 days probability, Beaching patterns of plastic debris along the Indian Ocean rim, https://doi.org/10.5446/47057, 2020b. a, b, c
van der Mheen, M., van Sebille, E., and Pattiaratchi, C.: Beaching at 8 km from coastline with 0.95/5 days probability, Beaching patterns of plastic debris along the Indian Ocean rim, https://doi.org/10.5446/47058, 2020c. a, b, c
van Sebille, E., England, M., and Froyland, G.: Origin, dynamics and evolution of ocean garbage patches from observed surface drifters, Environ. Res. Lett., 7, 044040, https://doi.org/10.1088/1748-9326/7/4/044040, 2012. a
van Sebille, E., Wilcox, C., Lebreton, L., Maximenko, N., Hardesty, B., van Franeker, J., Eriksen, M., Siegel, D., Galgani, F., and Law, K.: A global inventory of small floating plastic debris, Environ. Res. Lett., 10, 124006, https://doi.org/10.1088/1748-9326/10/12/124006, 2015. a, b, c, d, e
Wessel, P.: GSHHG A Global Self-consistent, Hierarchical, High-resolution Geography Database, available at: https://www.soest.hawaii.edu/pwessel/gshhg/, last access: 27 October 2020. a
Wessel, P. and Smith, W.: A global self-consistent, hierarchical, high-resolution shoreline database, J. Geophys. Res.-Sol. Ea., 101, 8741–8743, https://doi.org/10.1029/96JB00104, 1996. a, b
Wyrtki, K.: An equatorial jet in the Indian Ocean, Science, 181, 262–264, https://doi.org/10.1126/science.181.4096.262, 1973. a
Zhang, H.: Transport of microplastics in coastal seas, Estuar. Coast. Shelf Sci., 199, 74–86, https://doi.org/10.1016/j.ecss.2017.09.032, 2017. a, b, c
Zhang, Z., Wu, H., Peng, G., Xu, P., and Li, D.: Coastal ocean dynamics reduce the export of microplastics to the open ocean, Sci. Total Environ., 713, 1–12, https://doi.org/10.1016/j.scitotenv.2020.136634, 2020. a
beachand end up on coastlines throughout the Indian Ocean. Coastlines where a lot of plastic enters the ocean are heavily affected by beaching plastic, but plastics can also beach far from the source on remote islands and countries that contribute little plastic pollution of their own.