the Creative Commons Attribution 4.0 License.
the Creative Commons Attribution 4.0 License.
 | 11 Jul 2019
Simulating the spread of disinfection by-products and anthropogenic bromoform emissions from ballast water discharge in Southeast Asia
Josefine Maas
Susann Tegtmeier
Birgit Quack
Arne Biastoch
Jonathan V. Durgadoo
Siren Rühs
Stephan Gollasch
Matej David
Ballast water treatment is required for vessels to prevent the introduction of potentially invasive neobiota. Some treatment methods use chemical disinfectants which produce a variety of halogenated compounds as disinfection by-products (DBPs). One of the most abundant DBPs from oxidative ballast water treatment is bromoform (CHBr3), for which we find an average concentration of 894±560 nmol L−1 (226±142 µg L−1) in the undiluted ballast water from measurements and the literature. Bromoform is a relevant gas for atmospheric chemistry and ozone depletion, especially in the tropics where entrainment into the stratosphere is possible. The spread of DBPs in the tropics over months to years is assessed here for the first time. With Lagrangian trajectories based on the NEMO-ORCA12 model velocity field, we simulate DBP spread in the sea surface and quantify the oceanic bromoform concentration and emissions to the atmosphere from ballast water discharge at major harbours in the tropical region of Southeast Asia. The exemplary simulations of two important regions, Singapore and the Pearl River Delta, reveal major transport pathways of DBPs and anthropogenic bromoform concentrations in the sea surface. Based on our simulations, we expect DBPs to spread into the open ocean, along the coast and through advection with monsoon-driven currents into the North Pacific and Indian Ocean. Furthermore, anthropogenic bromoform concentrations and emissions are predicted to increase locally around large harbours. In the sea surface around Singapore, we estimate an increase in bromoform concentration by 9 % compared to recent measurements. In a moderate scenario in which 70 % of the ballast water is chemically treated, bromoform emissions to the atmosphere can locally exceed 1000 pmol m−2 h−1 and double climatological emissions. In the Pearl River Delta all bromoform is directly outgassed, which leads to an additional bromine (Br) input into the atmosphere of 495 kmol Br a−1 (∼42 t CHBr3). For Singapore ports the additional atmospheric Br input is calculated as 312 kmol Br a−1 (∼ 26 t CHBr3). We estimate a global anthropogenic Br input from ballast water into the atmosphere of up to 13 Mmol a−1. This is 0.1 % of global Br input from background bromoform emissions and thus not relevant for stratospheric ozone depletion.
- Article
(8752 KB) - Full-text XML
-
Supplement
(195 KB) - BibTeX
- EndNote


1.1 Ballast water treatment
Ballast water is necessary for ships to maintain stability and draught during voyage and port operations. Usually, ballast water is taken up during cargo unloading and discharged during loading operations. However, the uptake and discharge of ballast water by commercial ships represent the main driver of the global spread of marine invasive species, which can cause negative impacts on ecosystems, economies and public health (Ruiz et al., 2000; Briski et al., 2012). In September 2017, the Ballast Water Management Convention (IMO, 2004) entered into force, aiming to minimise the survival of organisms carried in ballast water tanks. According to the convention, shipowners from ratified flag states have different options to manage their ballast water, one being the on-board operation of ballast water treatment systems (BWTSs), which are type approved by the member states. Over the next years, more than 75 000 vessels have to instal such BWTSs in order to control the transport of potentially harmful species (David and Gollasch, 2015).
Different BWTSs are available which can be separated into physical and chemical oxidation methods (e.g. David and Gollasch, 2015). Physical methods include filtration, cavitation and treatment with ultraviolet radiation. Chemical treatment is achieved via, e.g. electrolysis, chlorination or ozonation. Electrolysis makes use of electricity in the ballast water to generate sodium hypochlorite as an oxidant from the chemical reaction of salt in the seawater. During chlorination, a chemical such as sodium hypochlorite or chlorine dioxide is added in solution to the ballast water. Ozone treatment forms hydroxyl and oxyl radicals that react with bromide ions in seawater to hypobromous acid or to the hypobromite ion, which act as disinfecting agents (Werschkun et al., 2012). As of January 2019, 76 systems had received approval, 33 of which use chemical treatment (IMO, 2019). However, it is currently unknown which treatment methods will be applied most on ships over the next years.
Chemical BWTSs that apply oxidative treatment have been shown to produce a variety of so-called disinfection by-products (DBPs) including trihalomethanes, halogenated acetic acids and bromate (Delacroix et al., 2013; Werschkun et al., 2014; Shah et al., 2015). The generally proposed mechanism for generating DBPs is the reaction of oxidants such as chlorine and ozone with organic and inorganic substances, such as bromide (Br-) and iodide (I-), in the water via the formation of hypobromous (HOBr) and hypoiodous (HOI) acid. The nature and amount of DBPs generated in seawater depend on many factors including the type of oxidant, the injected concentration, the amount and composition of dissolved organic matter (DOM) (Liu et al., 2015), and the concentrations of the specific halide ions, i.e. salinity (Shah et al., 2015). The chlorination and ozonation of seawater, for example, have been shown to produce bromoform (CHBr3) as one major DBP (Jenner et al., 1997; Padhi et al., 2012; Liu et al., 2015). Bromoform concentration is generally higher for chlorination than ozonation or other treatment methods. Moreover, in the presence of DOM mainly organohalogens are produced as DBPs (Shah et al., 2015), which is often the case for harbour seawater with a high influence from land use or river runoff.
DBPs like bromoform will spread in the marine environment once the ship discharges its ballast water. To receive approval with the Ballast Water Management Convention, BWTSs need to include a risk assessment according to the methodology of the Joint Group of Experts on the Scientific Aspects of Marine Environmental Protection – Ballast Water Working Group (GESAMP-BWWG) (IMO, 2017). The methodology tries to identify if the DBPs found in ballast water have an ecotoxicological effect on marine life as well as human health. The risk assessment uses a worst-case scenario in which the DBPs discharged into the harbour are modelled to calculate their predicted environmental concentration. A recent study by David et al. (2018) showed that the GESAMP-BWWG methodology does not fully account for potential environmental risks. To date, the GESAMP-BWWG methodology has not assessed the environmental impacts of volatile DBPs on atmospheric chemistry.
1.2 Brominated very short-lived substances
Trihalomethanes generated in BWTSs such as bromoform are also formed naturally in the oceans. Bromoform is of biological origin with both macroalgae and microalgae as potential producers, which oxidise primary metabolic compounds with haloperoxidases in the presence of hydrogen peroxide (e.g. Theiler et al., 1978; Moore et al., 1996). Currently available measurements of bromoform in seawater suggest a large spatial variability with elevated abundances in coastal, equatorial and upwelling regions due to biological sources (Quack and Wallace, 2003; Ziska et al., 2013; Fuhlbrügge et al., 2016).
Bromoform is the most important carrier of organic bromine from the ocean to the atmosphere, contributing together with dibromomethane (CH2Br2) up to 70 % of organic bromine to the marine troposphere (Hossaini et al., 2012). Both compounds have relatively short lifetimes of around 2 weeks (CHBr3) and 3 months (CH2Br2) in the tropical boundary layer of the atmosphere and thus belong to the so-called very short-lived substances (VSLSs; Carpenter and Reimann et al., 2014). Given the highly variable oceanic production and its short lifetime, the atmospheric distribution of bromoform is characterised by strong variations (Quack and Wallace, 2003).
Upon their release into the atmosphere, bromoform and other brominated VSLSs impact atmospheric chemistry. VSLSs are quickly oxidised or photodissociated to reactive halogen species, which participate in the depletion of tropospheric ozone by catalytic cycles (Saiz-Lopez and von Glasow, 2012). Furthermore, reactive halogen species reduce tropospheric NOx by the formation of nitryl halides (XNO2, where X=Cl, Br and I) (Simpson et al., 2015) and alter tropospheric HOx ratios towards OH (Sherwen et al., 2016). Thereby, reactive halogens from VSLSs impact the atmospheric lifetimes of dimethyl sulfide (DMS), many pollutants and greenhouse gases, such as methane and mercury (Simpson et al., 2015; Saiz-Lopez and von Glasow, 2012).
In the stratosphere, VSLSs also contribute to the depletion of ozone. Due to their short lifetime, they are mostly oxidised and subsequently removed through tropospheric precipitation. However, in regions of deep convection, they can be entrained into the stratosphere through rapid vertical transport (e.g. Aschmann et al., 2009; Tegtmeier et al., 2015). Deep convective events are most common in the tropics near the Equator where solar irradiance is high throughout the year and the ocean is an efficient source of bromoform and other VSLSs (Quack and Wallace, 2003). Observational (e.g. Dorf et al., 2006) and modelling (e.g. Warwick et al. 2006; Liang et al., 2010) studies have suggested that VSLSs provide a significant contribution to stratospheric total bromine (Bry), with current estimates ranging between 2 and 8 ppt (Carpenter and Reimann et al., 2014; Wales et al., 2018). Once brominated VSLSs have reached the stratosphere, they participate in ozone depletion at middle and high latitudes (Yang et al., 2014; Sinnhuber and Meul, 2015).
1.3 Motivation
Recent publications have analysed the production of DBPs from oxidative ballast water treatment and assessed its ecotoxicity (Delacroix et al., 2013; Shah et al., 2015; Werschkun et al., 2014). These studies focussed on risk assessments on board ships or in the near-ship environment. So far, the focus has been on the small-scale immediate exposure of DBPs to humans and the marine environment. The long-term effects of ballast water discharge on regional to global scales has not been assessed so far and the atmosphere, as a sink for volatile halocarbons, has not been considered in any existing risk assessment of oxidative ballast water treatment. In particular, brominated species such as bromoform are frequently produced in treated ballast water and are known to impact atmospheric chemistry. In this study, we provide a first analysis of how DBPs and any other passive substances contained in treated ballast water spread over a period of months to years around different harbours in Southeast Asia (Sect. 3). The derived spread can serve as a proxy for assessing the environmental impact of any chemical or biological species contained in treated or untreated ballast water. In a second step, we derive an estimate of bromoform released from ballast water into the marine environment and quantify its emission into the atmosphere (Sect. 4). We further discuss the methods and data used for this study including port statistics, DBP concentrations in ballast water and our Lagrangian simulations (Sect. 2).
2.1 Port statistics
For a regional to global analysis, volumes of ballast water discharge for individual ports and the typical bromoform concentration in the treated ballast water are needed. As ships are usually not required to report ballast water operations to harbour officials, exact numbers of localised ballast water discharge are not available. Thus, any approach to calculate such numbers from ship size or cargo is challenging (Seebens et al., 2013). Here, we derive estimates of the discharge volumes by linking the annual amount of global ballast water volume with the cargo throughput at each port. Global annual discharge volume is estimated to range from 3 to 5 billion m3 (Tamelander et al., 2010; Endresen et al., 2004; David, 2015). In addition to the global ballast water amount, it is known that the discharged ballast water amounts on average to roughly 33 % of the loaded cargo volume (David, 2015). We use the global ballast water discharge as 33 % of the global 10 286.9 million tonnes of loaded goods (UNCTAD, 2017) to obtain a ballast water volume of 3.4 billion m3, which agrees well with the estimates from the studies mentioned above.
The cargo throughput is obtained from the world port ranking 2016 published by the American Association of Port Authorities (AAPA, 2016). This statistic includes the 100 biggest ports for two categories: containerised and bulk cargo. Containerised cargo is given in twenty-foot equivalent units (TEUs), while bulk cargo is given in tonnes. In order to combine these two rankings, we generate a modified world port ranking and calculate the percentage share of containerised and tonnage goods according to their global ratio given by the Review of Maritime Transport (UNCTAD, 2017). The percentage share of containerised goods in 2016 amounts to 16.6 %, while the rest makes up 83.4 % of the total goods loaded (UNCTAD, 2017). According to the percentage share of their category and their individual size in the ranking, each container and bulk port is assigned its relative fraction under the simplified assumption that these ports account for all of the global commercial ship trade and receive all of the global ballast water. Since many of the harbours appear in both statistics (containerised and bulk), both percentage values are added to give their total cargo share, which forms our modified world port ranking encompassing 144 ports (Supplement table). We use the calculated percentages to divide global ballast water volume among all ports to derive the estimated discharge for each port.
Our study focus was set on the coastal region of Southeast Asia (10∘ S–40∘ N, 95–145∘ E) where 38 harbours from our modified world port ranking are located, comprising 57 % of the global shipping industry (Fig. 1). This region is to a major extent located in the tropics, which makes it very relevant for the entrainment of oceanic VSLS emissions into the stratosphere.
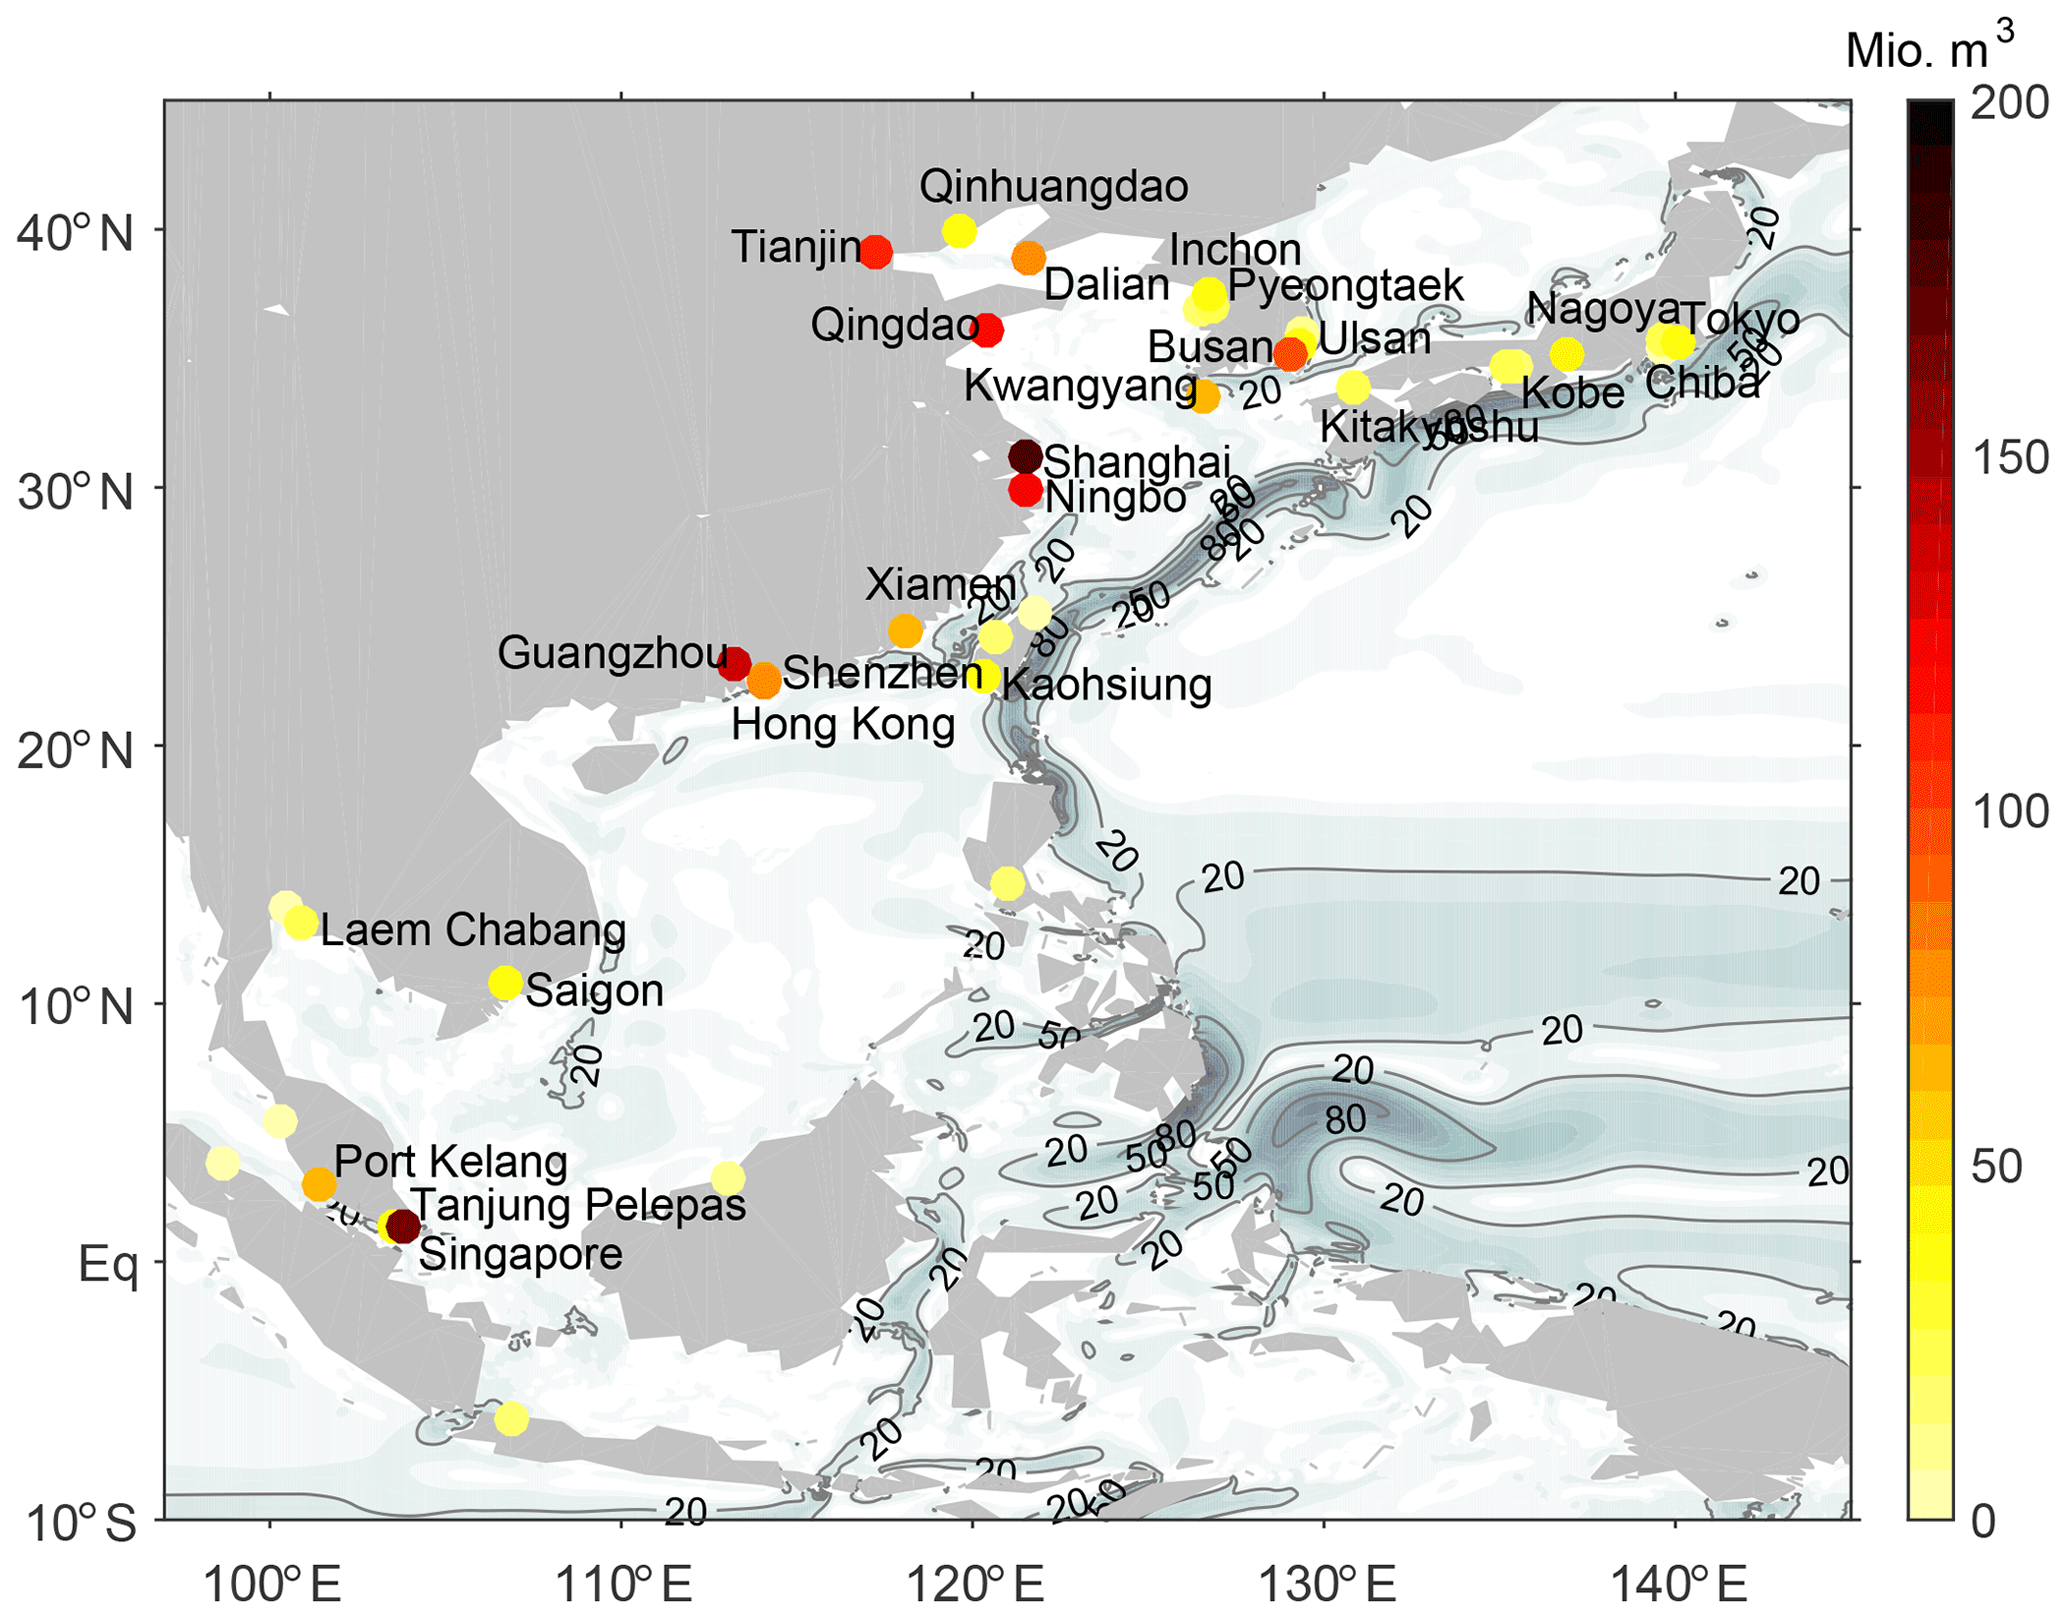
Figure 1Estimated annual ballast water discharge volume (106 m3) from each harbour in the modified world port ranking in Southeast Asia with the names of the 26 largest ports (Supplement table). Contours and black contour lines show climatological ocean surface velocities (cm s−1) from NEMO-ORCA.
For our detailed analysis, we choose two different locations in the tropics that are characterised by large harbours and different ocean dynamics. The first area is Singapore, where the two ports of Singapore and Tanjung Pelepas (Malaysia) are located very close to the Equator. This location in the Maritime continent is characterised by sea surface currents of over 0.2 m s−1 in the climatological mean (Fig. 1). The other location is the Pearl River Delta where the harbour cities of Guangzhou, Hong Kong and Shenzhen are located. There, only weak coastal currents can be found in the climatology.
2.2 Bromoform production from oxidative ballast water treatment
In a second step, we derive estimates of the bromoform concentration produced during chemical ballast water treatment. Since there are many BWTSs that use different chemical treatment methods with different water parameters and residence times, the produced amount of bromoform can show large variations. Here, we determine a range of possible bromoform concentrations which can be used in our analysis to estimate the environmental input of bromoform. For this purpose we use measurements of chemically treated ballast water taken during shipboard tests, as well as literature data. The formation of disinfection by-products in BWTSs is most commonly investigated during land-based tests. In contrast, we have conducted one of the first shipboard tests of the formation of major halocarbons in treated ballast water. The samples were taken from the discharge of treated ballast water for three unnamed BWTSs, two in Norway and one in Germany, which use chlorination techniques. This allows us to obtain a more robust estimate of the initial bromoform concentrations in the ballast water. The bromoform measurements were carried out with a purge-and-trap gas chromatograph–mass spectrometer (GC–SM) system with a detection limit of around 0.1 pmol L−1. Bromoform concentrations of 244.5±163.6 µg L−1 (967.6±647.4 nmol L−1) were found in 12 ballast water samples taken in Norway from two different BWTSs (Table 1). Bromoform concentrations of 202.0±74.0 µg L−1 (799.1±292.7 nmol L−1) were found in nine ballast water samples taken in Germany from one BWTS (Table 1). These samples were taken on board the vessel at three time periods during ballast water discharge in 15–20 min intervals. The particulate organic matter in the water was 11.1 to 12.6 mg L−1.
Table 1Bromoform (CHBr3) data from samples of undiluted ballast water given as an average and standard deviation (µg L−1; nmol L−1). Samples 1 and 2 are measurements from shipboard tests of a chlorination BWTS. Samples 3 and 4 are data from the IMO Marine Environmental Protection Committee (MEPC) reports on approval for different BWTSs using chemical treatment.
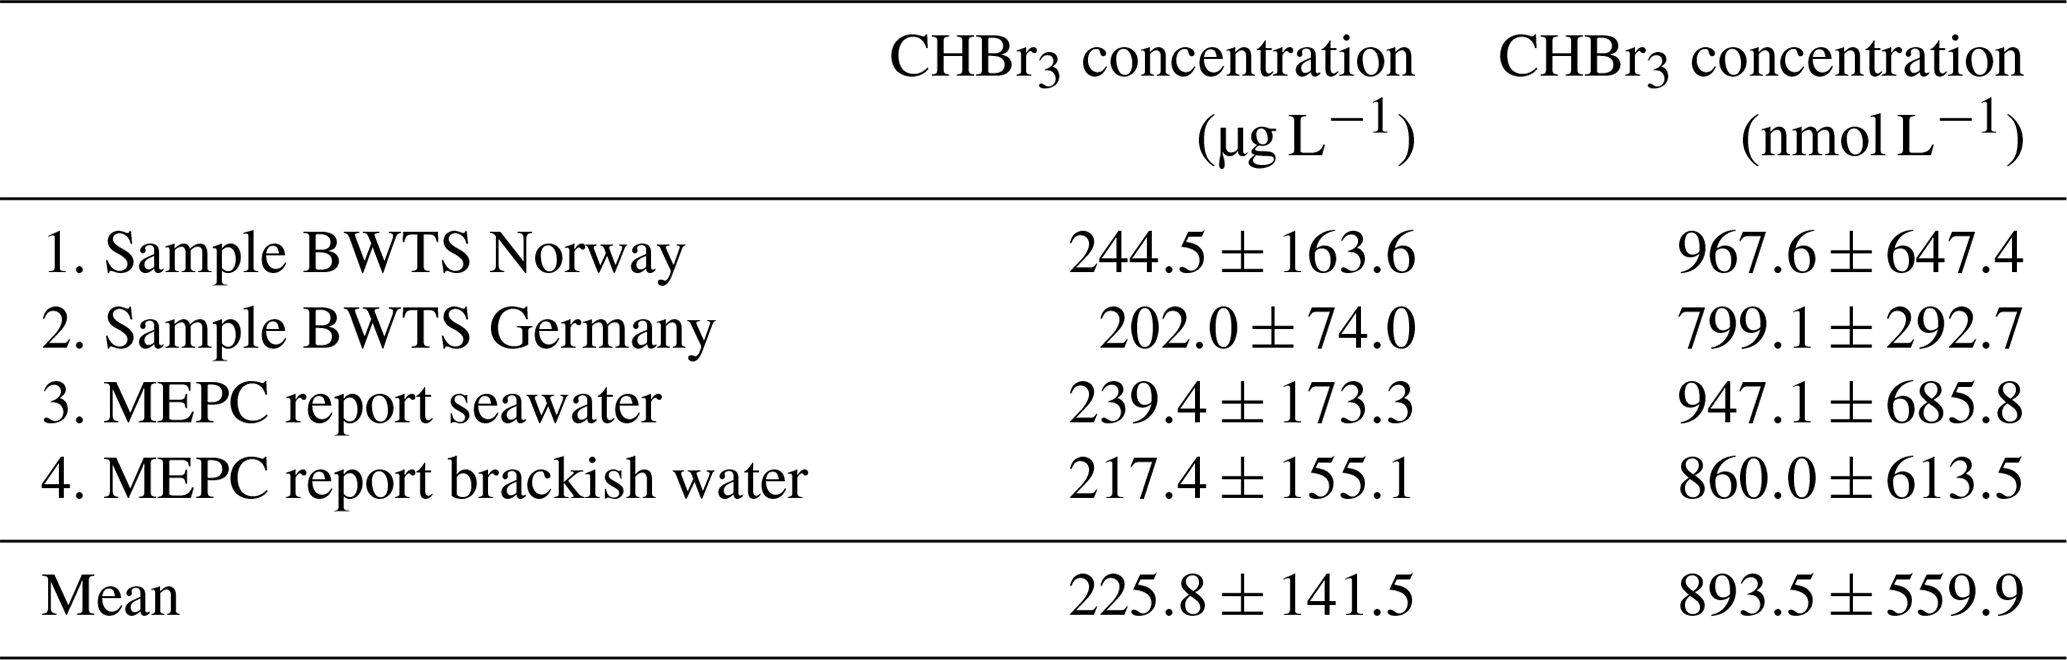
In addition, we use bromoform concentrations given in the reports of the International Maritime Organization (IMO) Marine Environment Protection Committee (MEPC) for Final Approval of BWTSs (https://docs.imo.org, last access: 3 July 2019). Mean bromoform values for seawater and brackish water from the MEPC reports on 29 BWTSs, 22 of which use chlorine as the main disinfecting agent, are also given in Table 1.
Different chemical treatment systems show greatly varying bromoform concentrations, as illustrated by the large standard deviations in the MEPC data. This is due to different doses and types of oxidant, varying residence time in the tank, and different water properties such as salinity, temperature and the amount of DOM (Shah et al., 2015). In general, the systems using chlorination as the main disinfecting agent generate higher bromoform concentrations than ozonation systems. Samples of the same treatment system (German system in Table 1), show a smaller standard deviation. Overall, our shipboard DBP measurements are in the range of the land-based test results published in the MEPC reports, suggesting a similar amount of bromoform production. On average 226±142 µg CHBr3 L−1 can be expected in ballast water, which corresponds to 894±560 nmol L−1 (Table 1) with the mean values of all four data sets in good agreement. The values shown here mainly stem from chlorination-based treatment systems. Therefore, we will focus on chlorination-based treatment in the following.
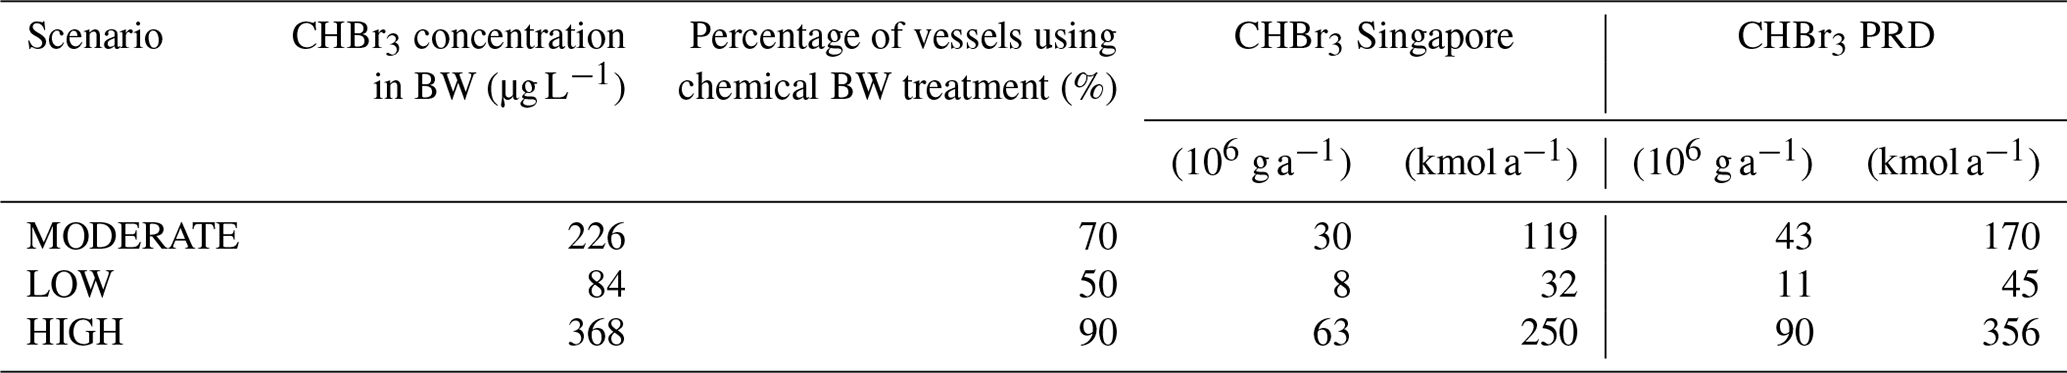
The exact percentage of vessels that will eventually use chemical BWTSs is unknown. Oxidative water treatment is more suited for larger vessels such as bulk carriers or tankers, which are typically the types of ships that carry the largest volumes of ballast water (Maritime Impact, 2017). Thus, we assume that 70±20 % of the ballast water will be chemically treated, producing DBPs. In order to capture the range of uncertainty resulting from the variations of the bromoform concentrations in ballast water samples and from the unknown share of chemical BWTSs, we set up three scenarios: LOW, MODERATE and HIGH (Table 2). The scenarios are assigned an initial bromoform concentration corresponding to the mean and the mean ± 1 standard deviation, and they use different shares (50 %, 70 % and 90 %) of chemically treated ballast water. Based on these two assumptions, we derive different amounts of annually discharged bromoform for the selected regions in Singapore and the Pearl River Delta (Table 2). In these scenarios, other brominated species like dibromomethane have been neglected because their concentrations in treated water were usually more than 10 times lower than bromoform concentrations. Variations in the usage of the different treatment methods will lead to variations of anthropogenic bromine release. We include these variations by applying the three scenarios in which we include a best- and a worst-case scenario, LOW and HIGH, respectively.
Table 2Scenarios for the simulation of ballast water (BW) spread with different initial bromoform concentration and annual bromoform amount for two regions in Southeast Asia, Singapore and the Pearl River Delta (PRD).
2.3 Lagrangian simulations
In contrast to earlier studies which focussed on the local effect of DBPs from ballast water (e.g. David et al., 2018), we investigate the long-term, large-scale influence of DBPs in the ocean and atmosphere. Therefore, we need regional to global ocean velocity and surface wind data, which can be obtained from high-resolution ocean general circulation models (OGCMs). We simulate the spread of treated ballast water and the DBPs contained within by applying a Lagrangian trajectory integration scheme to the 3-D velocity output from an eddy-resolving OGCM. The model output stems from a hindcast experiment with the ORCA0083 model configuration based on the NEMO-ORCA code version 3.6 (Madec, 2008). The ORCA0083 configuration from the European DRAKKAR consortium (The DRAKKAR Group, 2007) has a horizontal resolution of and 75 vertical levels, with 46 levels in the upper 1000 m and spacing increasing with depth (see also Marzocchi et al., 2015; Durgadoo et al., 2017). Atmospheric forcing comes from the DFS5.2 data set (Dussin et al., 2016) and varies on a range of scales, from synoptic to interannual and longer. The experiment ORCA0083-N06 used in this study was run by the National Oceanography Centre, Southampton, UK. Model output is given at a temporal resolution of 5 d for the time period 1963 to 2012.
To simulate the spread of DBPs in the surface ocean, the ARIANE software was used (Blanke et al., 1999). ARIANE performs offline trajectory calculations by passively advecting virtual particles along analytically computed 3-D streamlines. This method has been developed and extensively used for analysing mean large-scale spreading of water masses or minor species from a known source over different time periods (e.g. Durgadoo et al., 2017; van Sebille et al., 2015; Rühs et al., 2019). In our study, the DBPs from ballast water discharge are approximated as particles that are passively advected with the simulated flow. The streamline calculations are purely advective and no diffusivity is applied. For both regions of interest, 10 individual simulations are conducted starting each year in January from 2001 to 2010. The 10 different simulations are used to obtain more robust ensemble results and avoid extremes from internal variability. In each simulation, particles are continuously released close to the port site at every model output time step (once every 5 d), which represents a continuous ballast water discharge at this location. Subsequently, the particle advection is simulated for 2 years. For the purpose of calculating seasonal and annual means and to allow for an initial accumulation period, only months 12 to 23 (December of one year to November of the following year) are analysed for each simulation. Additionally, all particles older than 11 months are not considered in the analysis so that the total particle number is constant at each time step.
The experiments were run for the Pearl River Delta region and the Singapore region. The Pearl River Delta region comprises three major ports, Hong Kong, Guangzhou and Shenzhen, for which we derive a total annual ballast water discharge volume of 271 million m3 (8 % of the global ballast water discharge) from the modified world port ranking (Supplement table). The Singapore region comprises the ports of Singapore and Tanjung Pelepas, with a ballast water amount of 190 million m3 (5.6 %) each year. The discharge location where particles are released has been chosen in the vicinity of the harbours at approximately 8 to 40 km off the coast, as the model resolution does not allow for the capture of small-scale coastal structures such as harbours. Our method ensures minimal influence of the land boundaries on the initialisation of the simulation. We assume that the DBPs are transported from the inner harbour into the adjacent coastal areas where our model simulations are initialised. For many ports this is reasonable since rivers and tidal flushing cause a steady turnover of coastal waters with the ocean.
For the analysis of the experiments, we distinguish (1) the passive spread of DBPs without any environmental sinks (hereafter PASSIVE) and (2) the spread of bromoform as a major volatile DBP accounting for atmospheric fluxes and oceanic sinks (hereafter FLUX). For the PASSIVE analysis, we consider the full history of simulated particle positions, which is equivalent to assuming no particles getting lost through sinks in the ocean or emission into the atmosphere. The resulting distribution shows where DBPs in ballast water or assumingly dimensionless and immotile species can be transported through ocean currents within 1 year.
For the FLUX analysis, each particle is given an initial mass of bromoform based on the ballast water volume of the harbour and the produced bromoform according to the three scenarios MODERATE, HIGH and LOW (Table 2). Moreover, different sinks of bromoform, such as constant exchange at the air–sea interface and chemical loss rates, are taken into account.
We calculate the bromoform air–sea exchange based on the flux parameterisation from Nightingale et al. (2000) for all particles that reach the mixed layer at a certain time step. The mixed layer depth (MLD) is defined as the ocean layer in which the vertical density gradient does not exceed 0.02 kg m−3 referenced to the 10 m depth. According to ORCA, the annual mean MLD is less than 20 m deep within our research area. Since the results are given at a 5 d temporal resolution and the MLD is relatively shallow, it is reasonable to assume that the whole mixed layer is in contact with the atmosphere at least once during each time step. Treated ballast water provides an additional source of bromoform to the environment, adding to the natural bromoform occurring in the ocean and atmosphere. Given the additive nature of the ocean and atmospheric terms in the air–sea flux parameterisation, it is possible to calculate the flux of the anthropogenic and natural bromoform portions separately. For our simulations, we only consider bromoform from ballast water treatment and apply the air–sea flux parameterisation to the anthropogenic bromoform in water and air. We have conducted sensitivity tests with an atmospheric transport model which shows that outgassed anthropogenic bromoform is quickly advected from the sea surface to other areas and different heights. Therefore, we can assume that anthropogenic bromoform in the atmosphere is always zero at the ocean surface in the region of interest. The air–sea exchange is linearly proportional to the gas transfer velocity of bromoform, which depends on surface wind velocities and sea surface temperature and salinity. Surface wind velocities are taken from the NEMO-ORCA forcing data set DFS5.2 (Dussin et al., 2016).
Oceanic sinks are also taken into account, although they are negligible on the timescales considered in this study. These include degradation through halide substitution and hydrolysis with a half-life of 4.37 years (Hense and Quack, 2009), as well as remineralisation with a half-life of 5.72 years (Hense and Quack, 2009).
The particle density distribution is calculated on a horizontal grid over the upper 20 m of the ocean (further mentioned as the “surface”). The distribution is given as a percentage per grid box of the total particle number (PASSIVE) and as bromoform concentration (pmol L−1; FLUX). Statistical values are calculated over three grid boxes with the highest concentration around the discharge location. Analyses on seasonal to interannual timescales were conducted by averaging and concatenating the simulations from the model years 2001 to 2010. For the calculation of time series, we use the smoothed 2-week (15 d) running mean of the concentration and emission rates from the three grid boxes around the discharge location for the three scenarios MODERATE, LOW and HIGH. Wind speed values from these boxes are also smoothed with a 15 d running mean in order to better show the seasonal to annual variations.
The global atmospheric input of bromoform from ballast water emissions can be estimated by multiplying the initial concentrations with the global ballast water volume for each scenario, taking into account different percentages of chemical treatment systems (Table 2). The global atmospheric bromine input from the source-gas bromoform is derived by multiplying the global annual emissions with the number of bromine (Br) atoms.
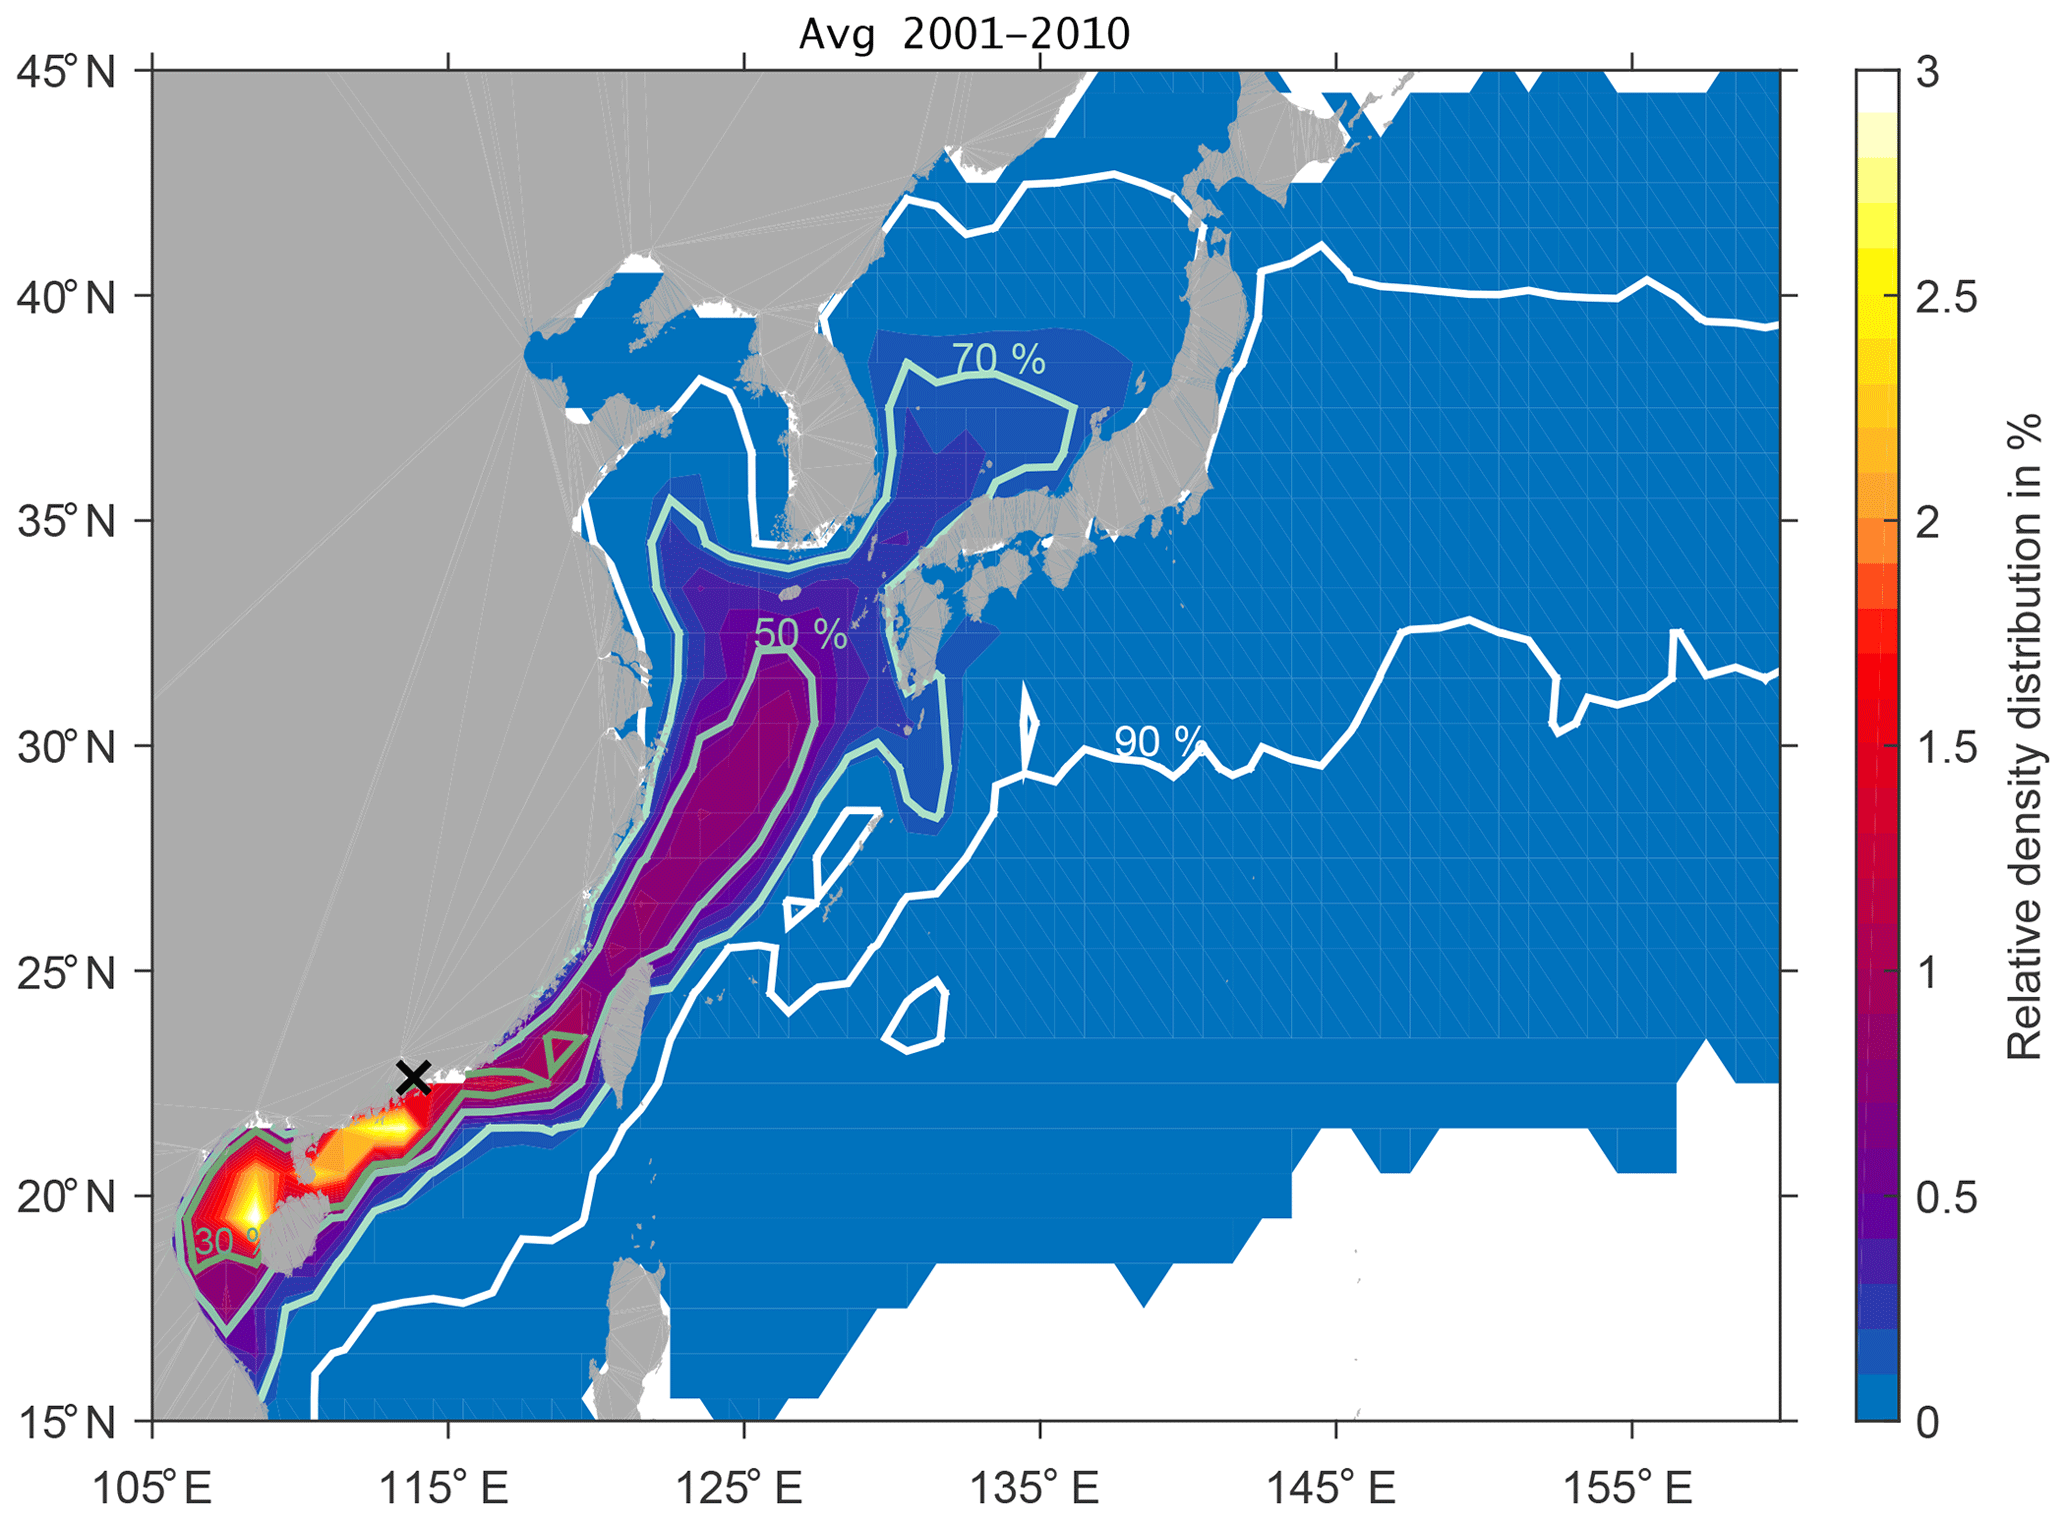
Figure 2Annual mean surface (20 m) spread of DBPs from discharge in the Pearl River Delta relative to the total number of particles released. Contours show the area of the percentage of particles (30 %, 50 %, 70 % and 90 %) characterised by the highest density.
Figure 2 shows the relative particle density distribution of DBPs averaged over 10 years released from the Pearl River Delta. We estimate the contour lines of the percentage of DBPs (30 %, 50 %, 70 % and 90 %) that are characterised by the highest particle density. The distribution shows that 90 % of DBPs spread past Japan and the Korean Peninsula, with the Kuroshio into the North Pacific, and southwards into the South China Sea towards the Philippines within 1 year. On average, 30 % of the DBPs with the highest density will stay southward of the Pearl River Delta along the coast and are now distributed in the Gulf of Tonkin west of the island of Hainan. There, the highest relative particle density distribution reaches up to 3 % locally with respect to total DBP discharge.
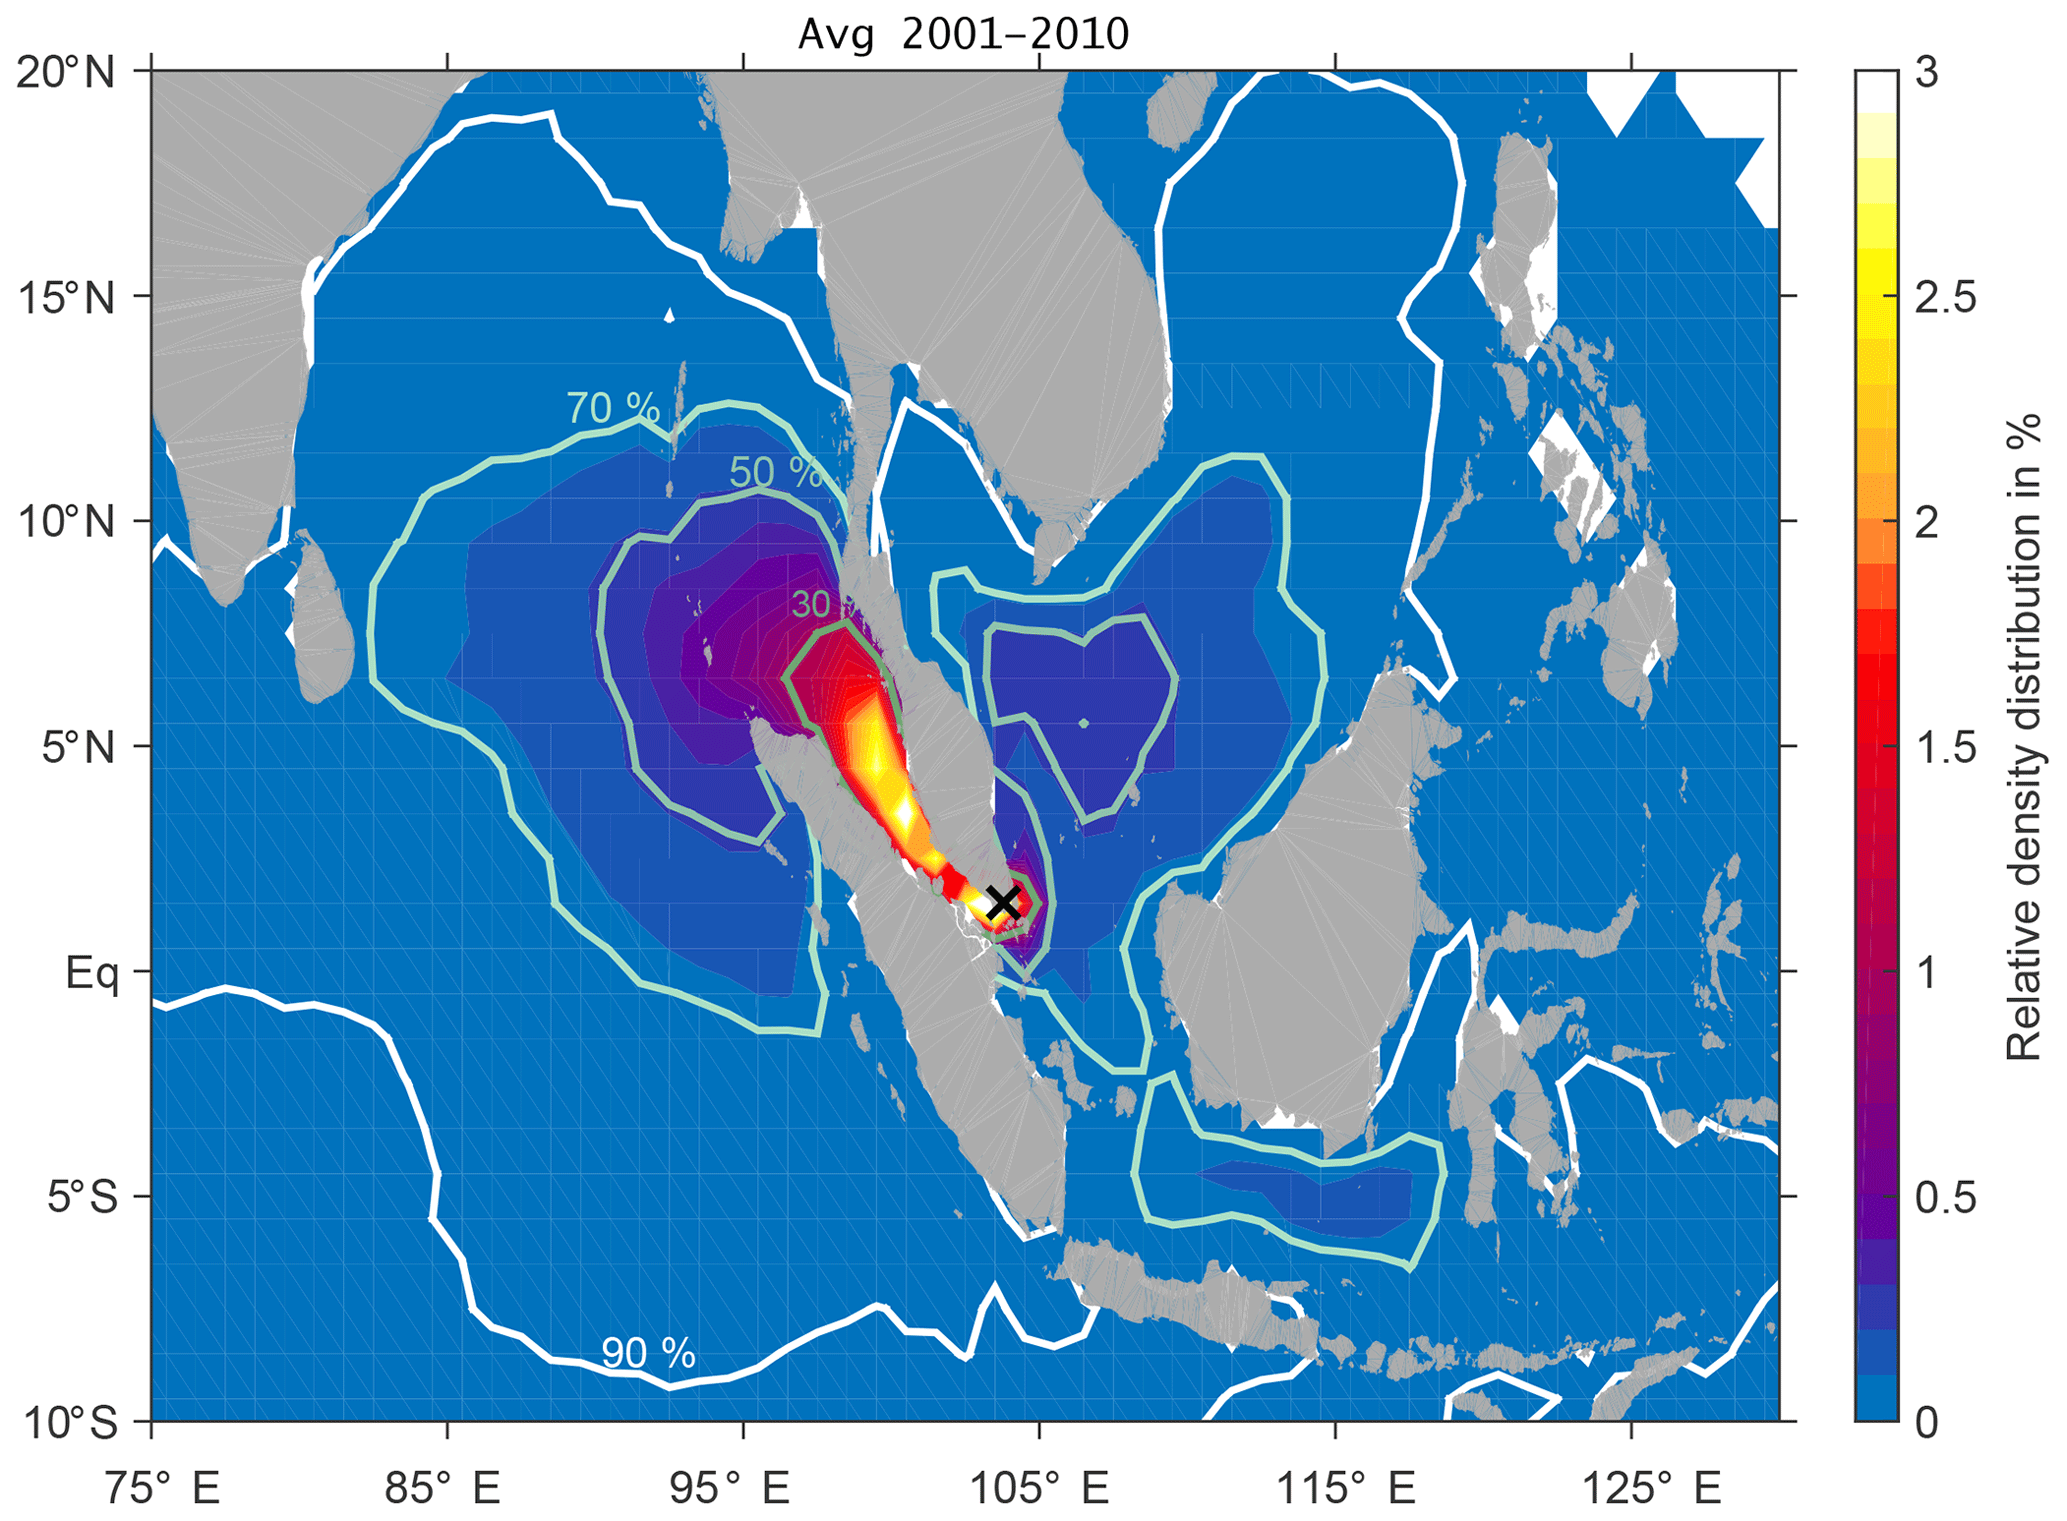
Figure 3Annual mean surface (20 m) spread of DBPs from discharge in Singapore relative to the total number of particles released. Contours show the area of the percentage of particles (30 %, 50 %, 70 % and 90 %) characterised by the highest density.
For the Singapore harbour region, the relative DBP distribution averaged over the years 2001–2010 is shown in Fig. 3. As for the Pearl River Delta, most of the DBPs stay in the close vicinity of the coastlines, with the highest relative density distribution of 4 %. On an annual mean basis, the 30 % of DBPs that are characterised by the highest particle density have been transported northwestward and accumulate in the Strait of Malacca, in close contact with the coastlines of the Malay Peninsula and the island of Sumatra. DBPs within the 50 %–70 % distribution expand mostly into the Indian Ocean towards Sri Lanka, but a small fraction is advected into the South China Sea between Borneo and Vietnam and even into the Java Sea. The main driver for the mean state of DBP transport from Singapore is the Indonesian throughflow, generally directed westward through the different passages of the Indonesian Archipelago (Gordon, 2001).
For the Pearl River Delta and Singapore, the areas of the 90 % of DBPs with the highest particle density expand over 5.0 and 8.6 million km2, respectively, illustrating the large possible spread of longer-lived DBPs in ballast water. The size of the area and dominant direction of expansion are subject to variability on different timescales.
We investigate the interannual variations in the spread of DBPs by analysing the area extent of the 30 %, 50 %, 70 % and 90 % of particles with the highest density for the time period 2001–2010 (Fig. 4). The largest variations are found for the annual mean distribution of the 90 % area which expands over 6.6–10.2 million km2 for the Pearl River Delta region depending on the surface velocity strength in the area. The extent of the 30 % and 50 % regions varies less on interannual timescales. Our results show that half of the longer-lived organisms and chemicals in ballast water can be expected to be spread over a relatively constant area of 0.5–1 million km2 around the harbour, while the other 50 % is transported into a much larger region (up to 10.2 million km2) that fluctuates depending on interannual variations of ocean surface transport.
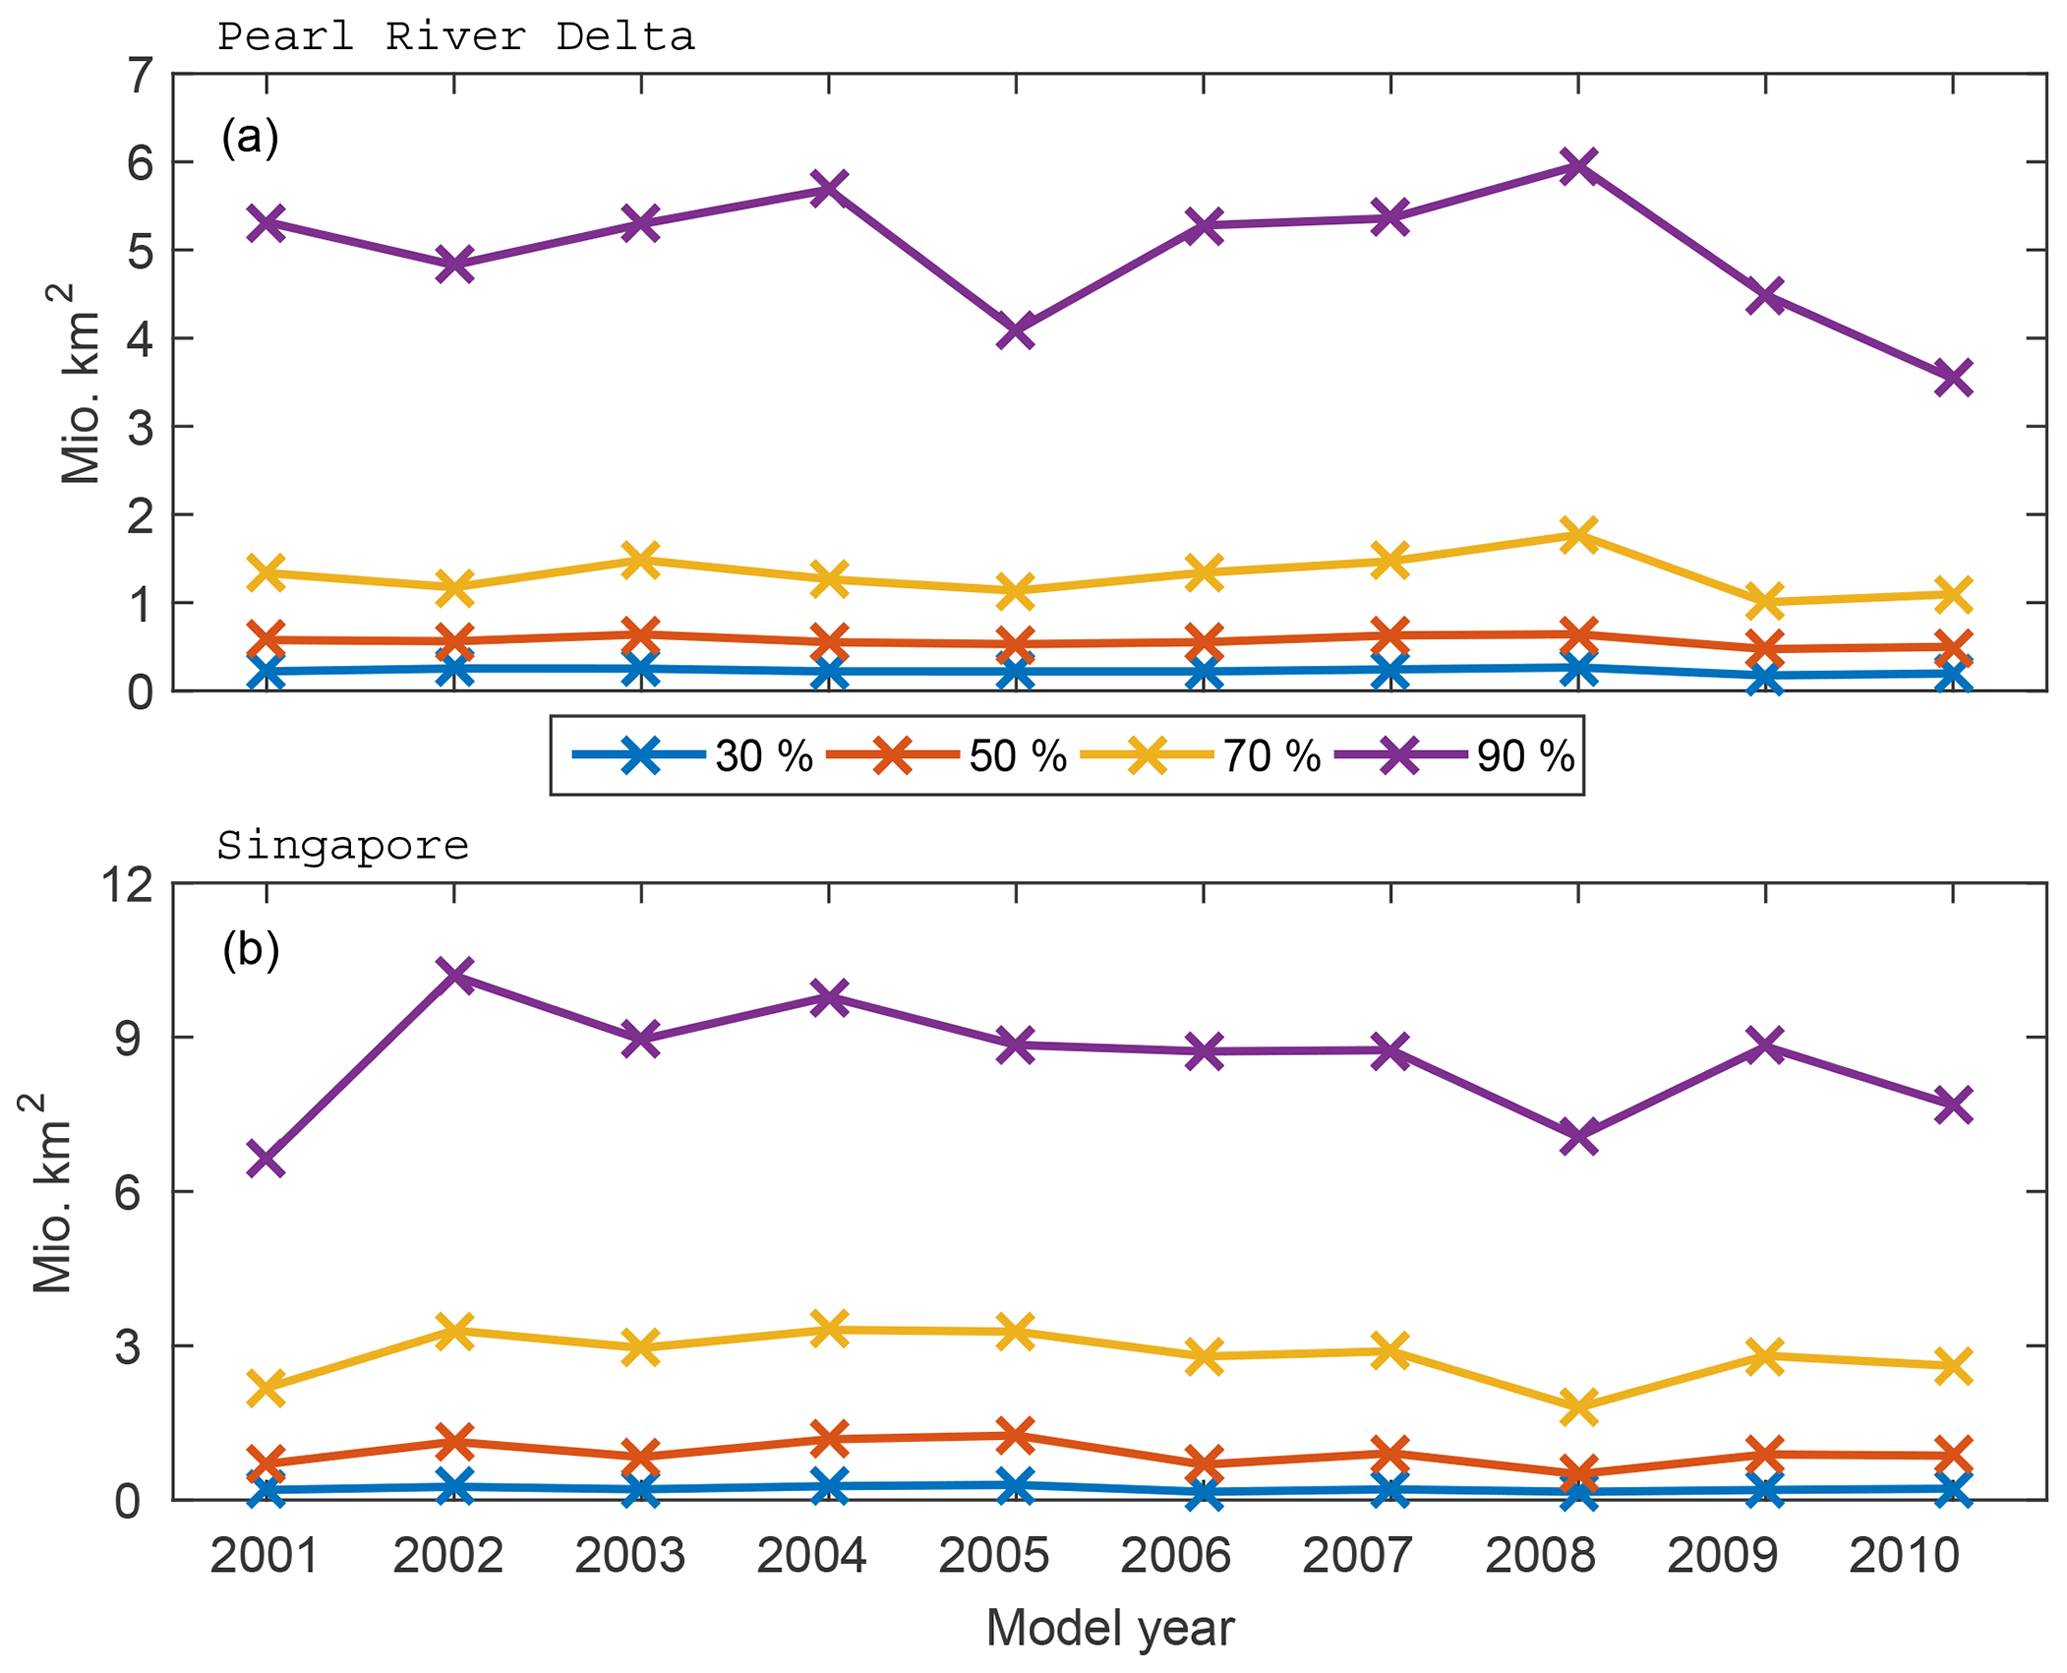
Figure 4Annual mean area extent of DBP spread in the (a) Pearl River Delta and (b) Singapore based on 30 %, 50 %, 70 % and 90 % of the particles characterised by the highest density.
Since a lot of the volatile DBPs will be emitted into the atmosphere and other short-lived non-volatile DBPs degrade in the ocean on relatively short timescales of weeks to months, the seasonal timescales are also of interest when evaluating the main pathways of DBP distribution. Depending on the season of discharge, the dominant atmospheric winds and oceanic currents can vary substantially in strength and direction in the region considered. We calculate seasonal anomalies of the particle density distribution for the time period 2001–2010 by subtracting the annual mean climatology from the seasonal mean climatologies.
Seasonal anomalies of the main pathways of ballast water spread from the Pearl River Delta region show a clear reversal of main spread from boreal winter (DJF) to summer (JJA) (Fig. 5). Surface currents in the South China Sea are wind-driven and seasonally affected by the northwest Pacific monsoon (Shaw and Chao, 1994). During DJF, the main pathway is towards the southwest, with an accumulation of DBPs west of Hainan and positive anomalies up to 9 %. There is a clear separation of these positive anomalies south of the Pearl River Delta and negative anomalies north of this region. Furthermore, the area of the 90 % DBP distribution is located in a narrower band towards the coast during DJF. This anomaly pattern reverses in JJA. More DBPs are transported northward, while there is less advection to the south. However, the northeast winter monsoon prevails much longer in the Pearl River Delta than the southwest summer monsoon, which explains why in the annual mean the largest part of DBPs is advected southward. During boreal spring (MAM) and autumn (SON) anomalies are less pronounced. In MAM, the anomalies are mostly positive around the discharge location, which means more DBP accumulation along the coast and slower transport than in the annual mean due to weaker currents. The opposite happens in SON with negative anomalies around the discharge location, indicating that the fastest transport occurs during SON.
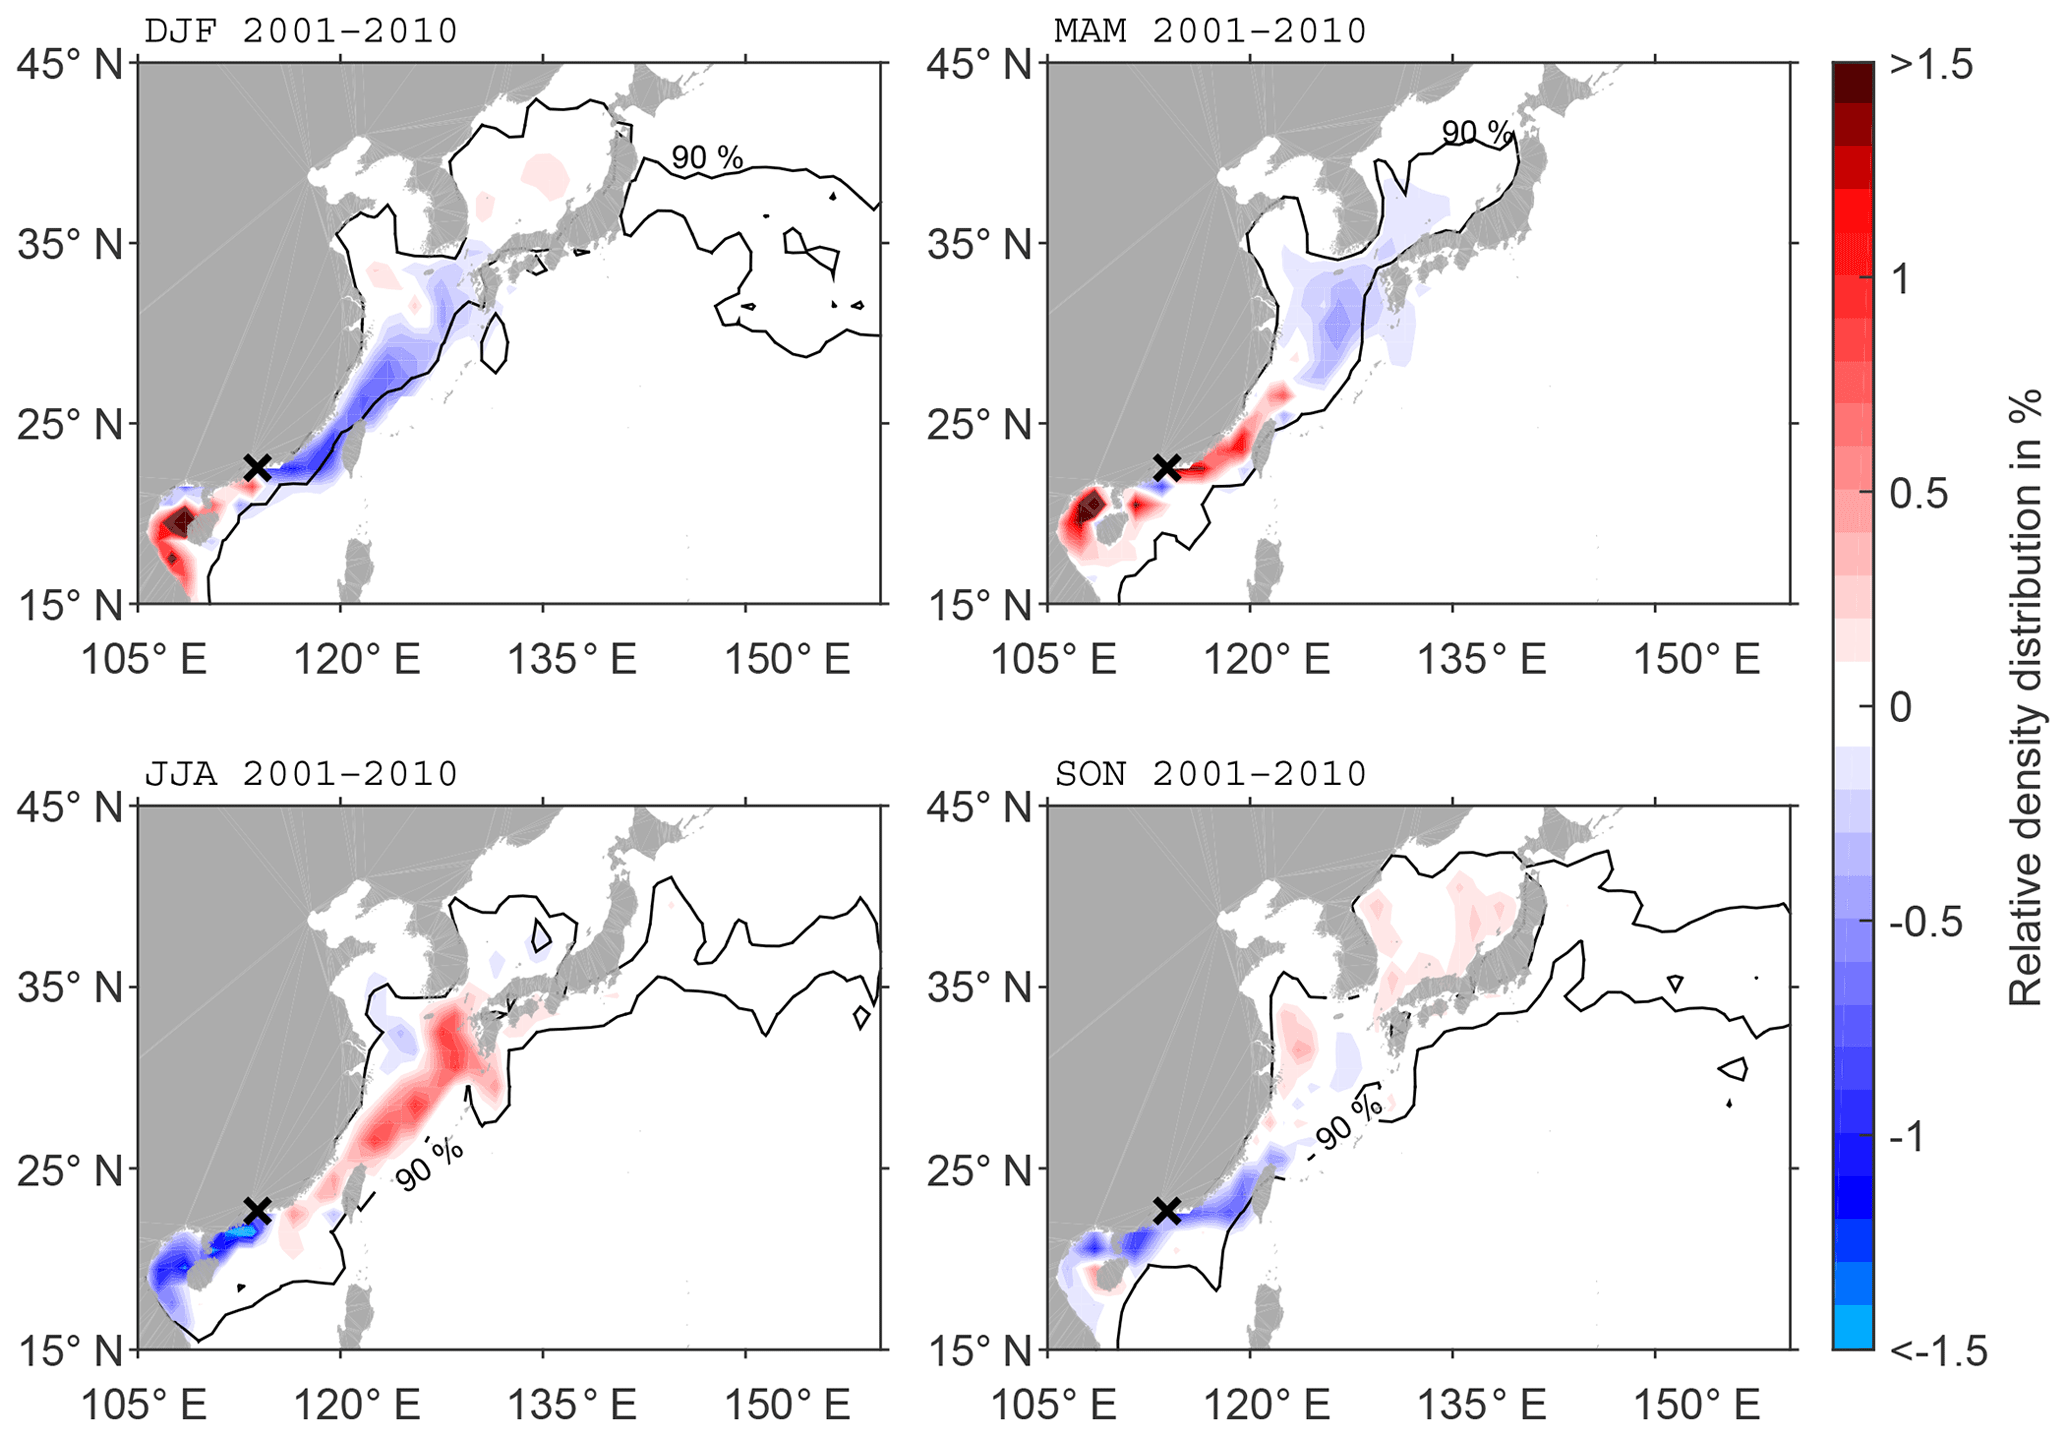
Figure 5Anomaly of seasonal DBP spread compared to climatology (2001–2010) at the surface (20 m) for discharge in the Pearl River Delta. The black contour line shows the area of the 90 % of particles characterised by the highest density in the seasonal mean.
A similar seasonality in DBP spread can be seen from discharge in the Singapore region (Fig. 6). Here, close to the Equator, the monsoon winds seasonally reverse from northwesterly winds in JJA to southeasterly winds in DJF. As a result, more DBPs are transported towards the northwest through the Strait of Malacca into the Indian Ocean in DJF, and Singapore ports show a negative anomaly. As expected from the reversed winds in JJA, fewer DBPs are advected towards the west and more towards the east so that the DBPs can reach the Pacific Ocean. During SON, the strongest positive anomalies can be found in the southern Strait of Malacca. Then winds transition and become very weak, and thus DBPs cannot be transported quickly and accumulate near the discharge location of Singapore. The lowest anomalies are found in MAM, with a slightly enhanced accumulation of DBPs north of Malaysia.
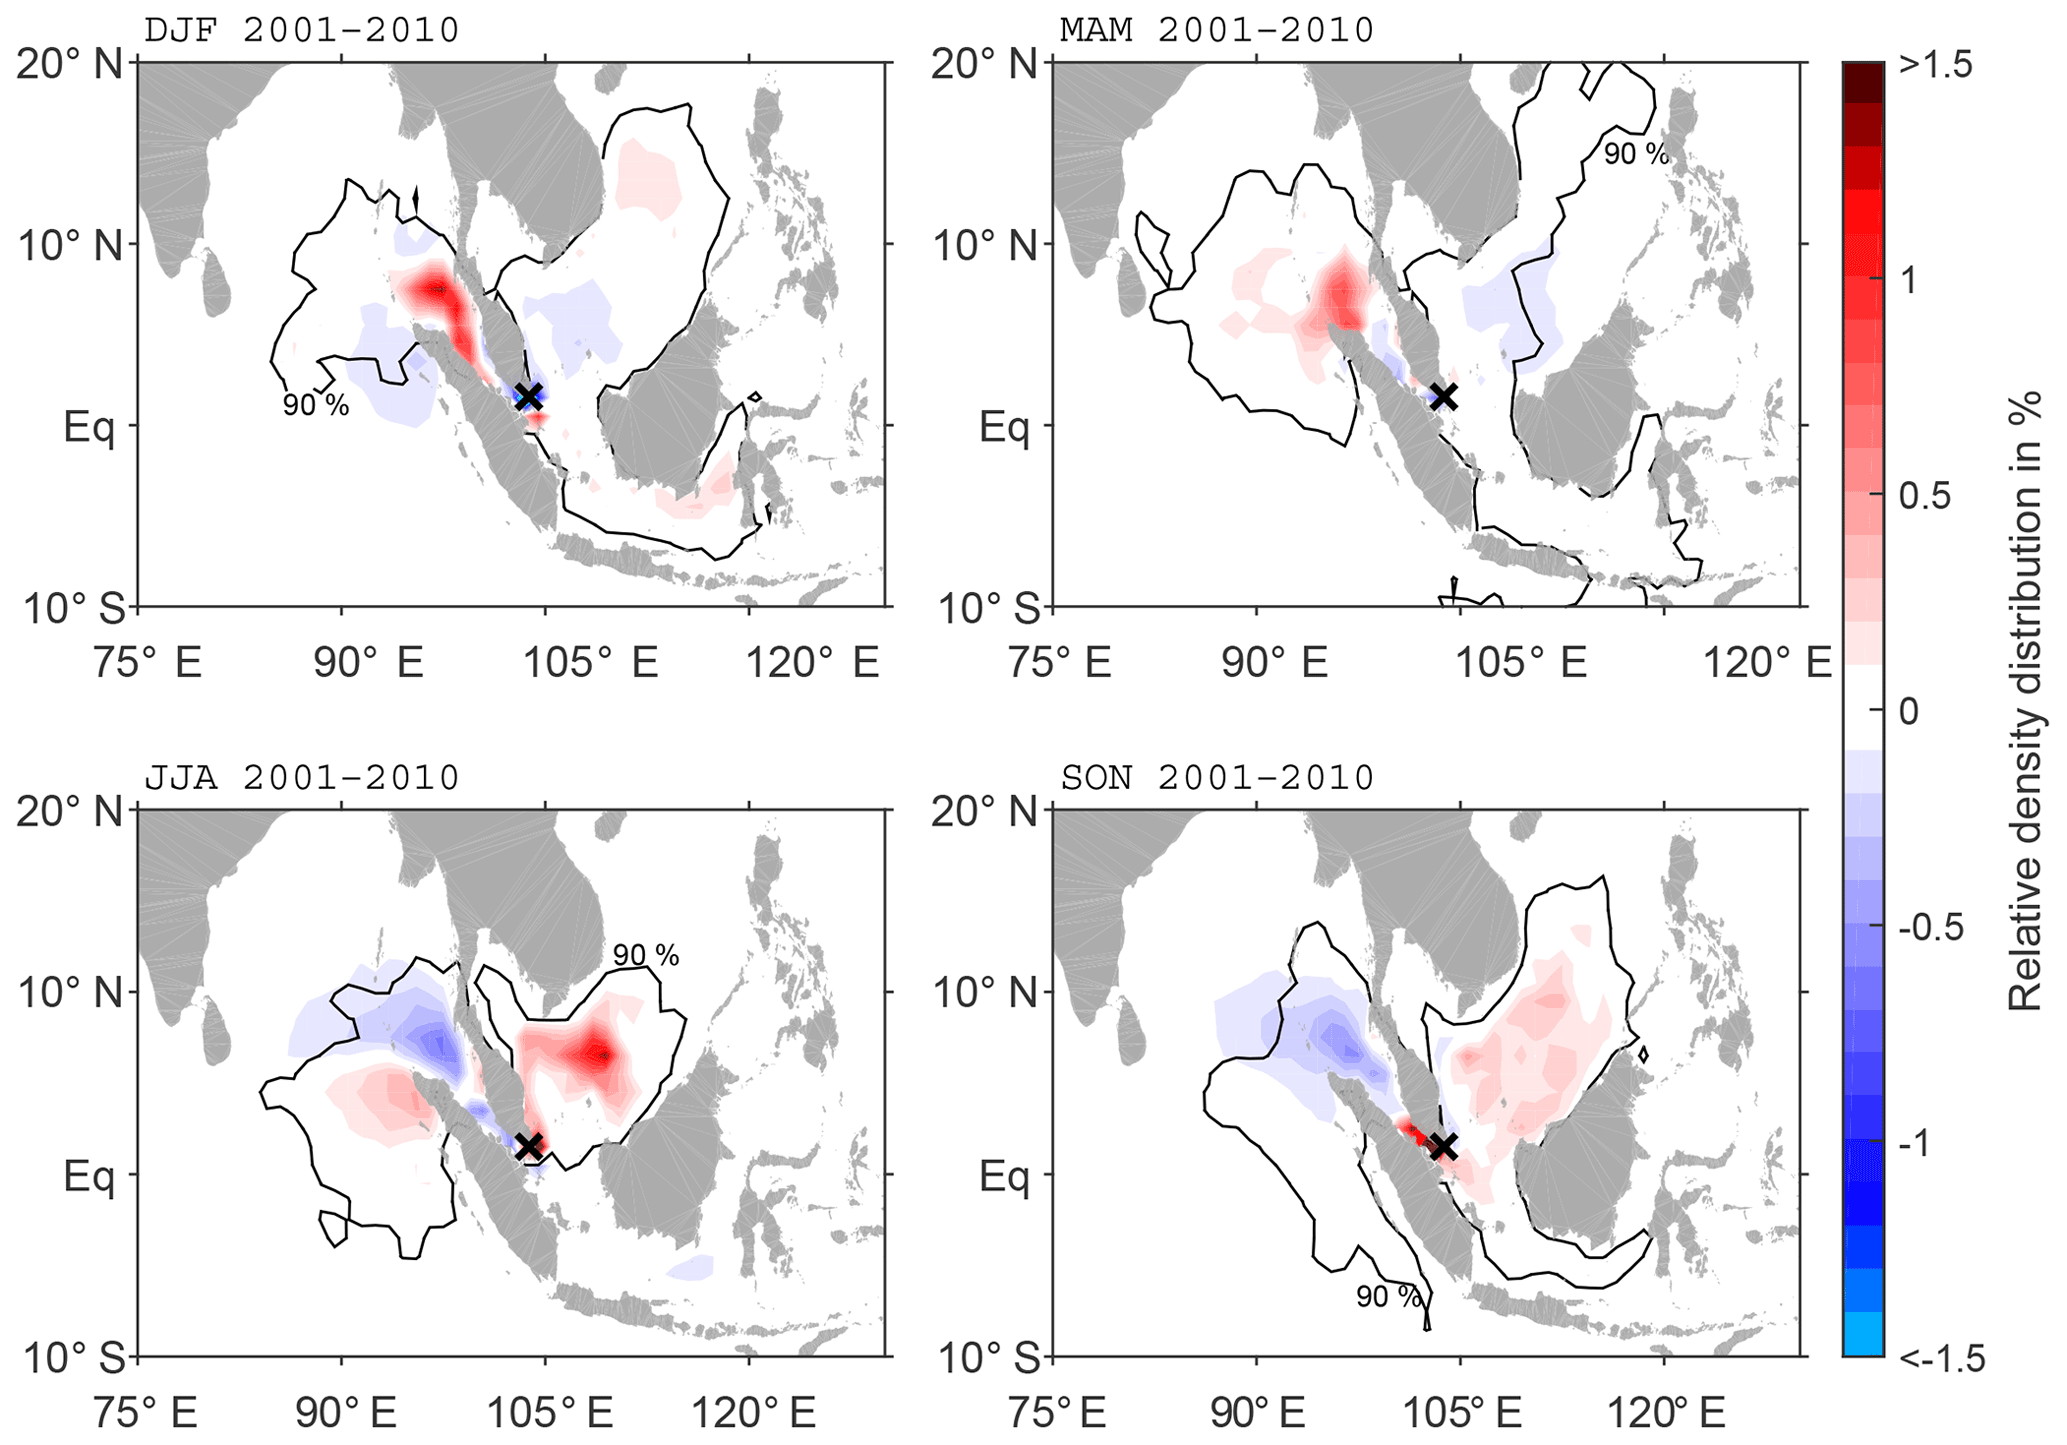
Figure 6Anomaly of seasonal DBP spread compared to climatology (2001–2010) at the surface (20 m) for discharge in Singapore. The black contour line shows the area of the 90 % of particles characterised by the highest density in the seasonal mean.
The oceanic distribution of bromoform from ballast water treatment and its emissions into the marine boundary layer are estimated from the FLUX analysis based on the simulated velocity fields from 2006 and the corresponding Lagrangian experiments. As shown in Sect. 3, the interannual transport variability is small and therefore a 1-year simulation is sufficient to derive the representative emission estimates. Bromoform as a volatile gas can be outgassed into the marine atmospheric boundary layer, as long as it stays at the ocean–atmosphere interface. In the FLUX analysis, we calculate the bromoform outgassing rate for all particles within the mixed layer at every time step. We also calculate the bromoform surface concentration in the upper 20 m and the sea-to-air flux averaged over 1 year for the three scenarios MODERATE, HIGH and LOW. For comparison we calculate the bromoform concentrations that would prevail without outgassing into the atmosphere from the PASSIVE analysis.
We find that surface concentrations from the FLUX analysis are largely reduced compared to PASSIVE. In the Pearl River Delta region, bromoform only remains in the box around the discharge location due to the new input of ballast water at every time step (Fig. 7). Thus, the majority of released bromoform is instantly outgassed into the atmosphere, resulting in a relatively constant concentration of 10 pmol L−1 in the MODERATE scenario around the discharge location, ranging from 22 (HIGH) to 3 pmol L−1 (LOW) (Table 3).
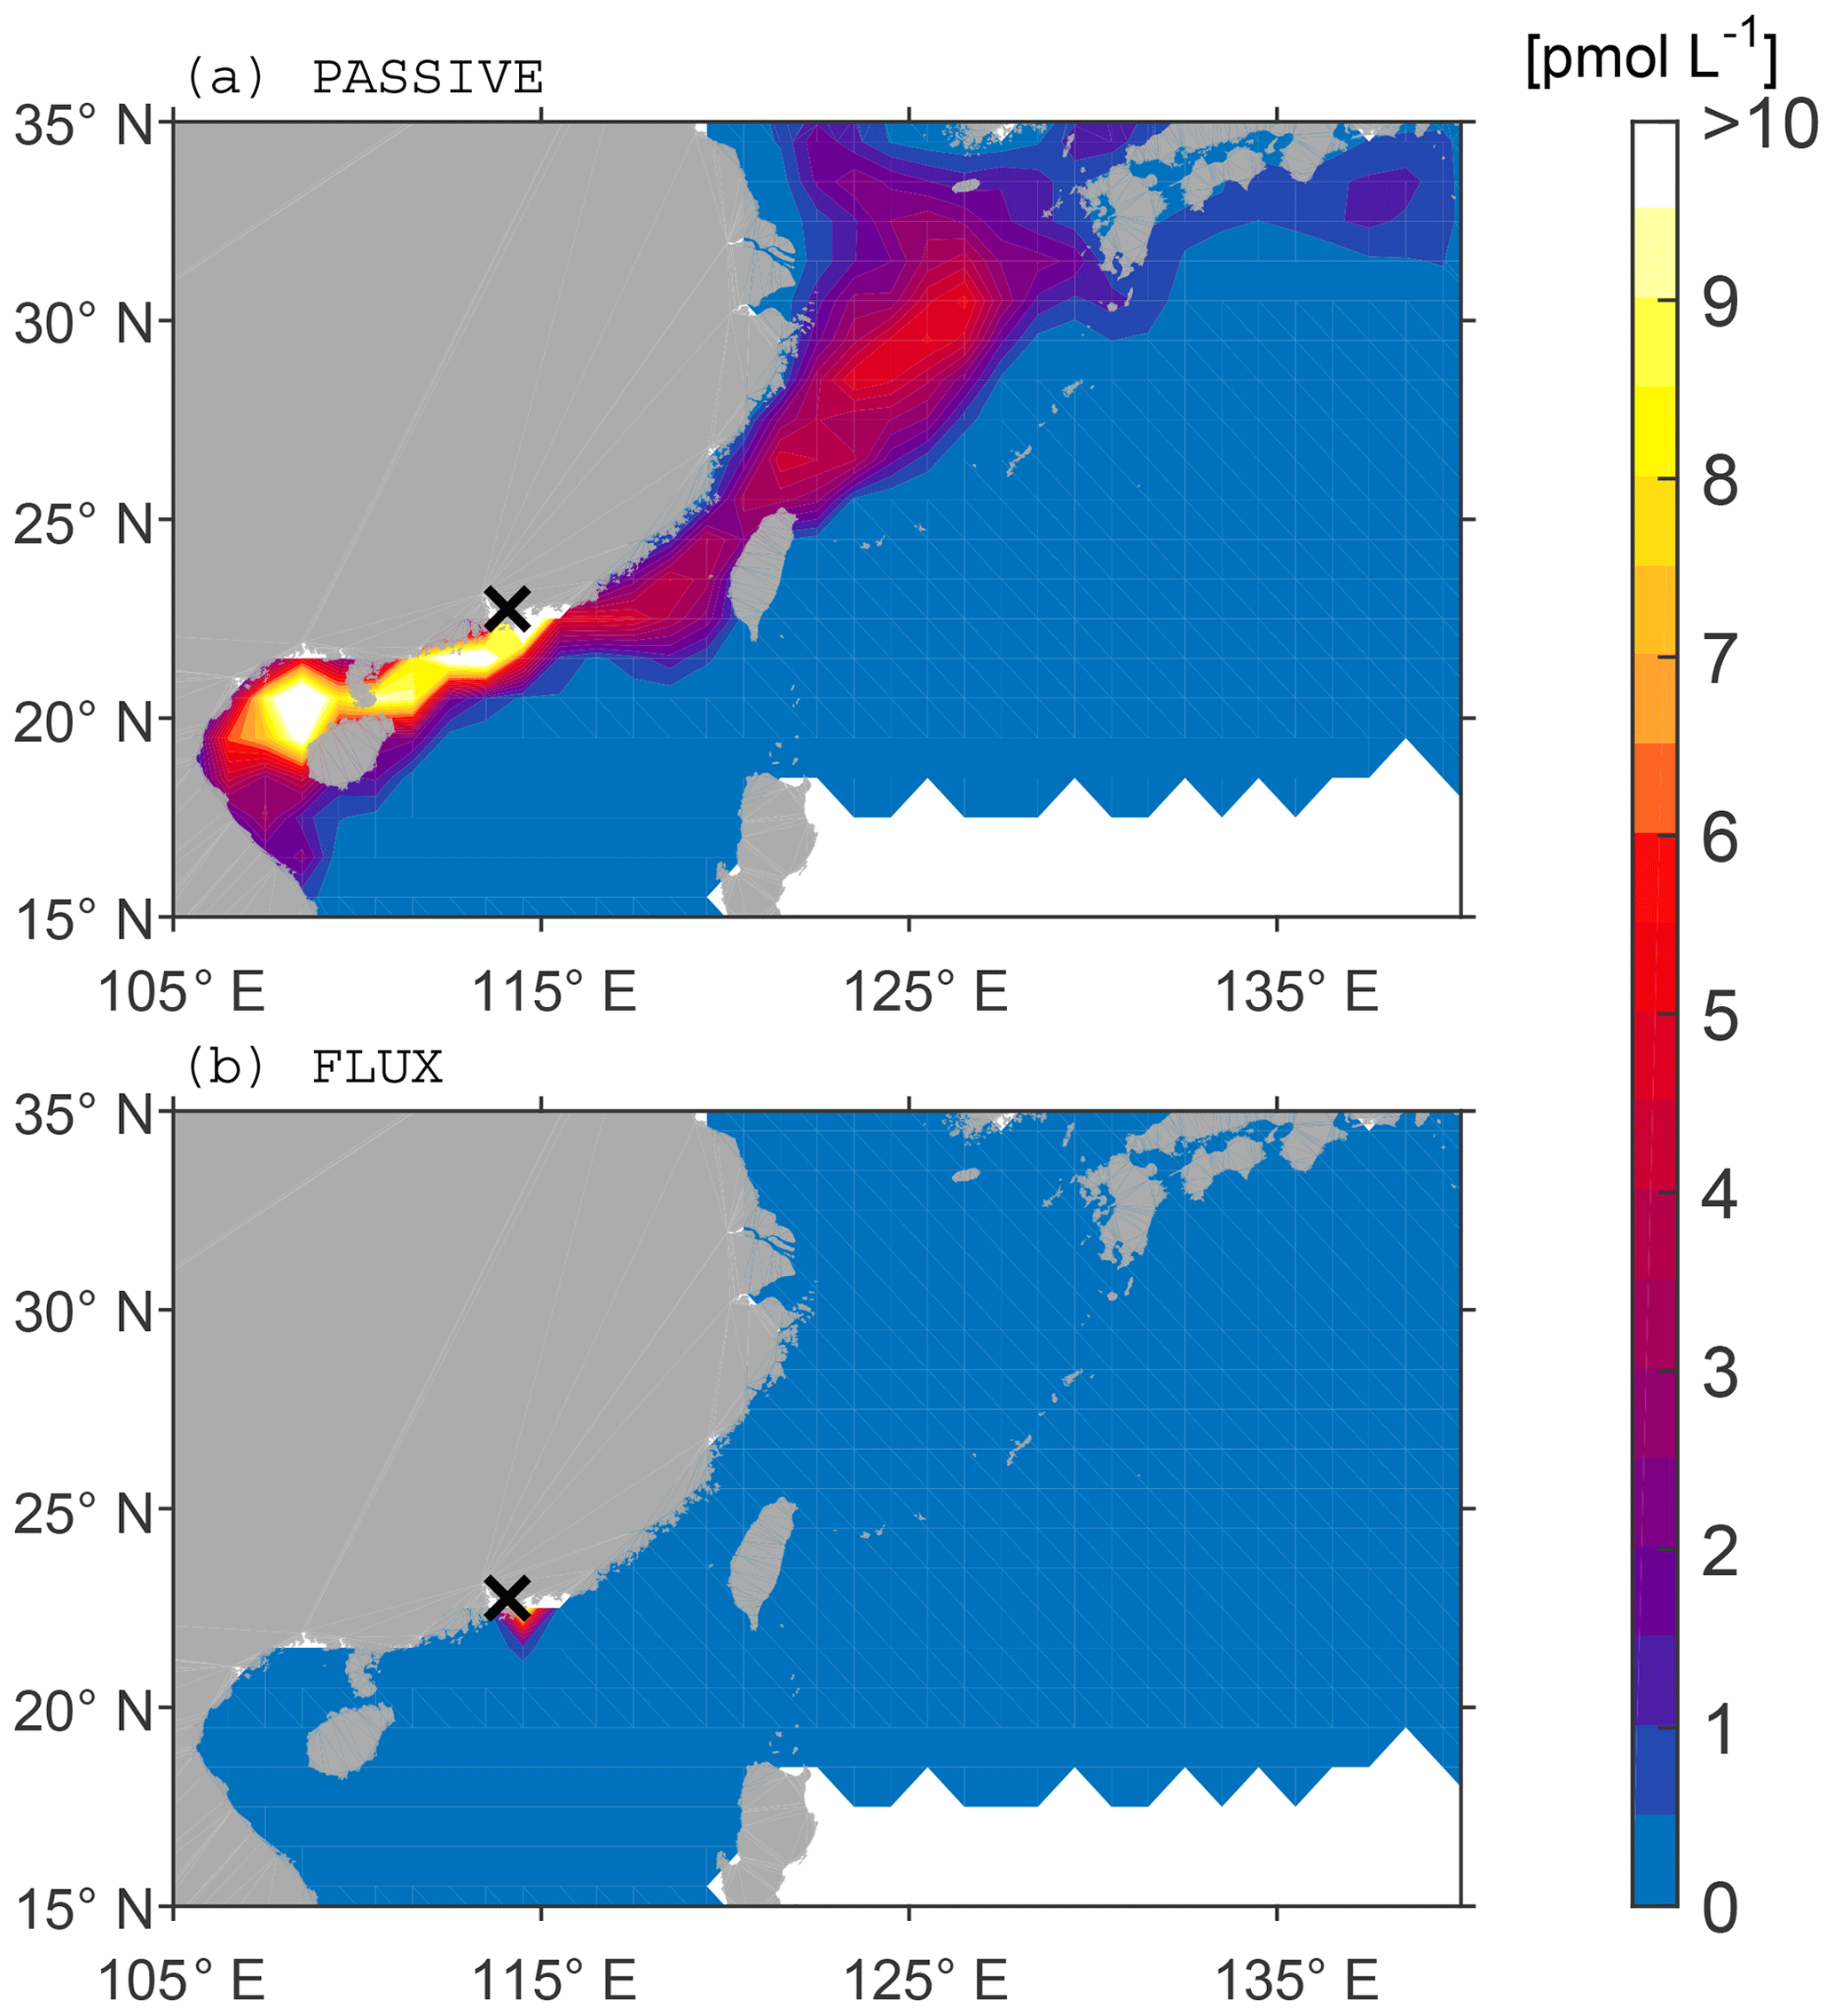
Figure 7Surface bromoform concentration in the Pearl River Delta for the MODERATE scenario averaged over 1 year. (a) PASSIVE analysis without loss rates. (b) FLUX analysis with outgassing.
Table 3Average values for the FLUX experiment in Singapore and the Pearl River Delta region for different scenarios. Values are calculated as the sum of three grid boxes around the discharge location.

Also, bromoform concentrations from Singapore ballast water stay much more centred around the discharge location when compared to the PASSIVE analysis without outgassing (Fig. 8). Small concentrations of 1 to 2 pmol L−1 can still be found in the Strait of Malacca. Average bromoform concentrations around Singapore add up to 11 pmol L−1 in the MODERATE scenario, ranging from 23 (HIGH) to 3 pmol L−1 (LOW). Measurements of bromoform in this region showed elevated surface concentrations of up to 130 pmol L−1 (Fuhlbrügge et al., 2016), most likely due to the combination of strong natural and already existing anthropogenic coastal sources. The additional bromoform input expected from ballast water discharge in Singapore would thus lead to a 9 % (18.5 %; 2.4 %) increase.
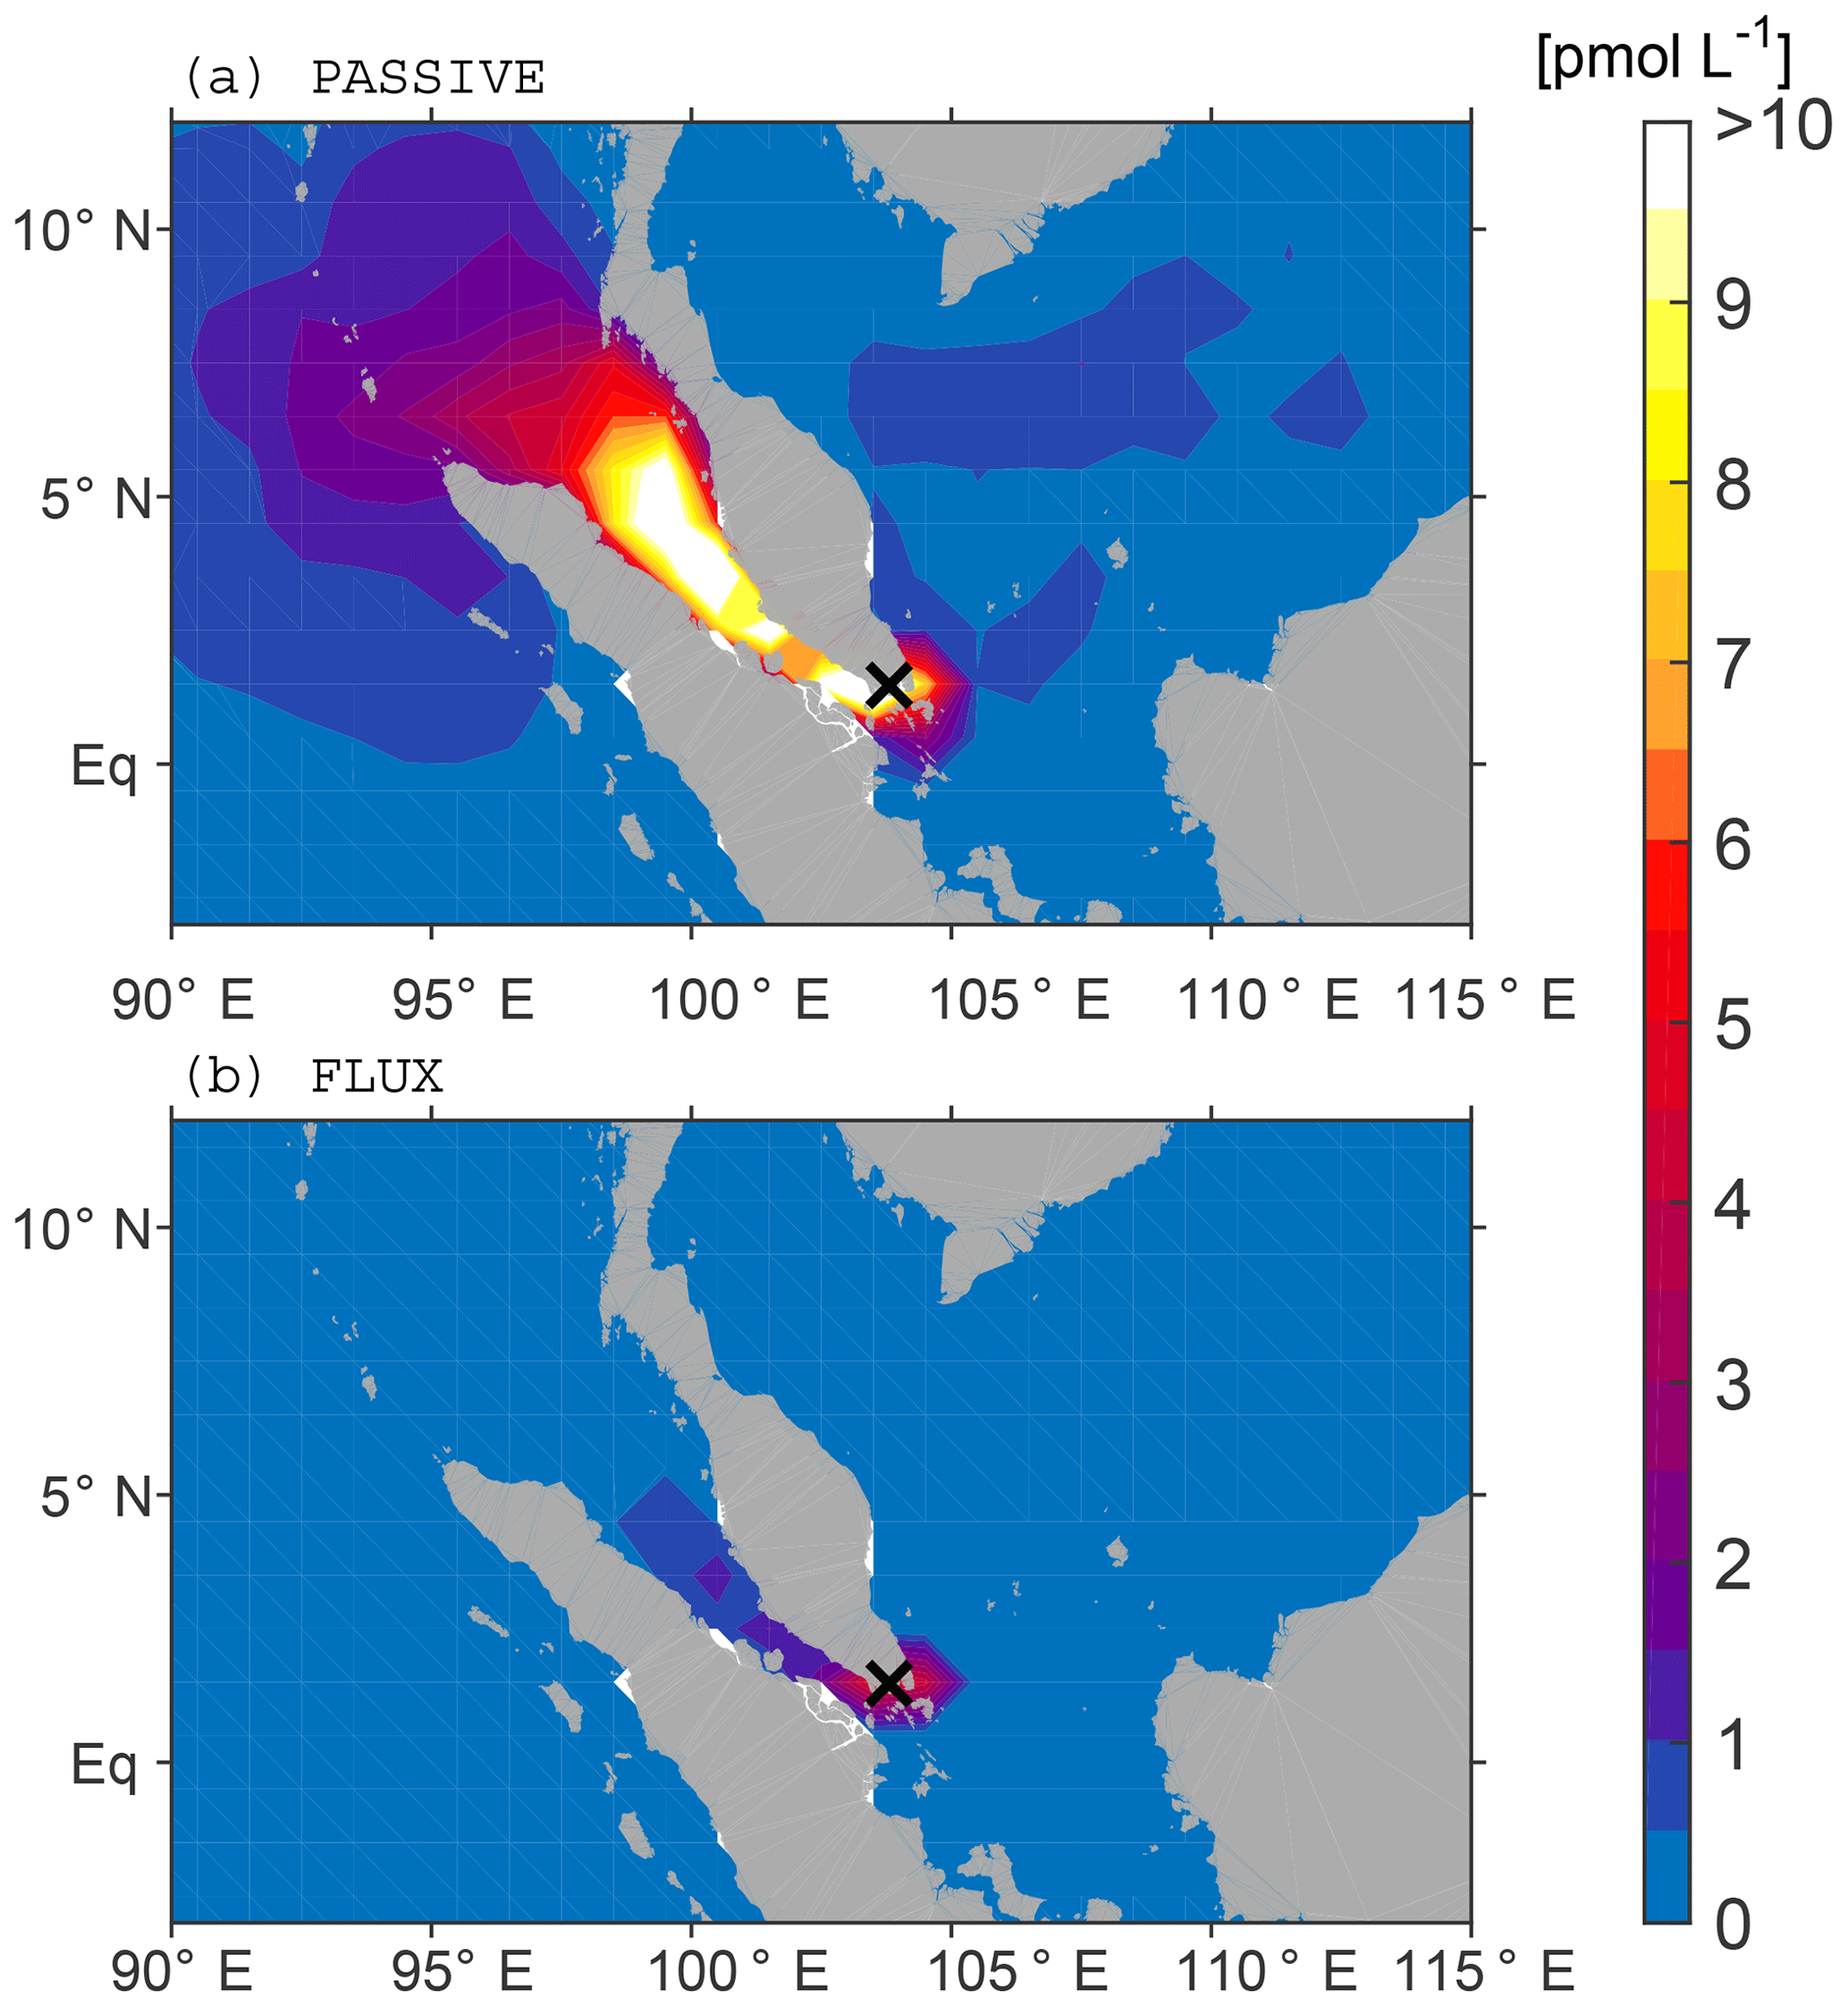
Figure 8Surface bromoform concentration in Singapore for the MODERATE scenario averaged over 1 year. (a) PASSIVE analysis without loss rates. (b) FLUX analysis with outgassing.
Evaluation of the time series shows that wind velocities are enhanced in the Pearl River Delta region with a strong seasonal cycle (Fig. 9). Such strong winds cause high exchange velocities, which in turn lead to high emission rates. The bromoform emission rate stays constant at 1690 pmol m2 h−1 because everything discharged into the ocean is instantly outgassed into the atmosphere. Therefore, both oceanic concentrations and emissions into the atmosphere stay relatively constant throughout the time period, independent of the wind variations. The bromoform emissions in the Pearl River Delta region range between 440 and 3530 pmol m2 h−1 for the three different scenarios (Table 3). This flux is much larger than in the Singapore region where the average range is 250 to 1940 pmol m2 h−1. Around Singapore, concentrations and emissions underlie a strong seasonality driven by the wind speed. Two times a year in summer and winter, wind velocities increase and cause bromoform emissions to increase as well. At the same time, oceanic bromoform concentrations around the discharge location drop due to the increased emissions and faster oceanic transport (Fig. 9). For weaker winds, the bromoform response is reversed with lower emissions and higher oceanic concentrations.
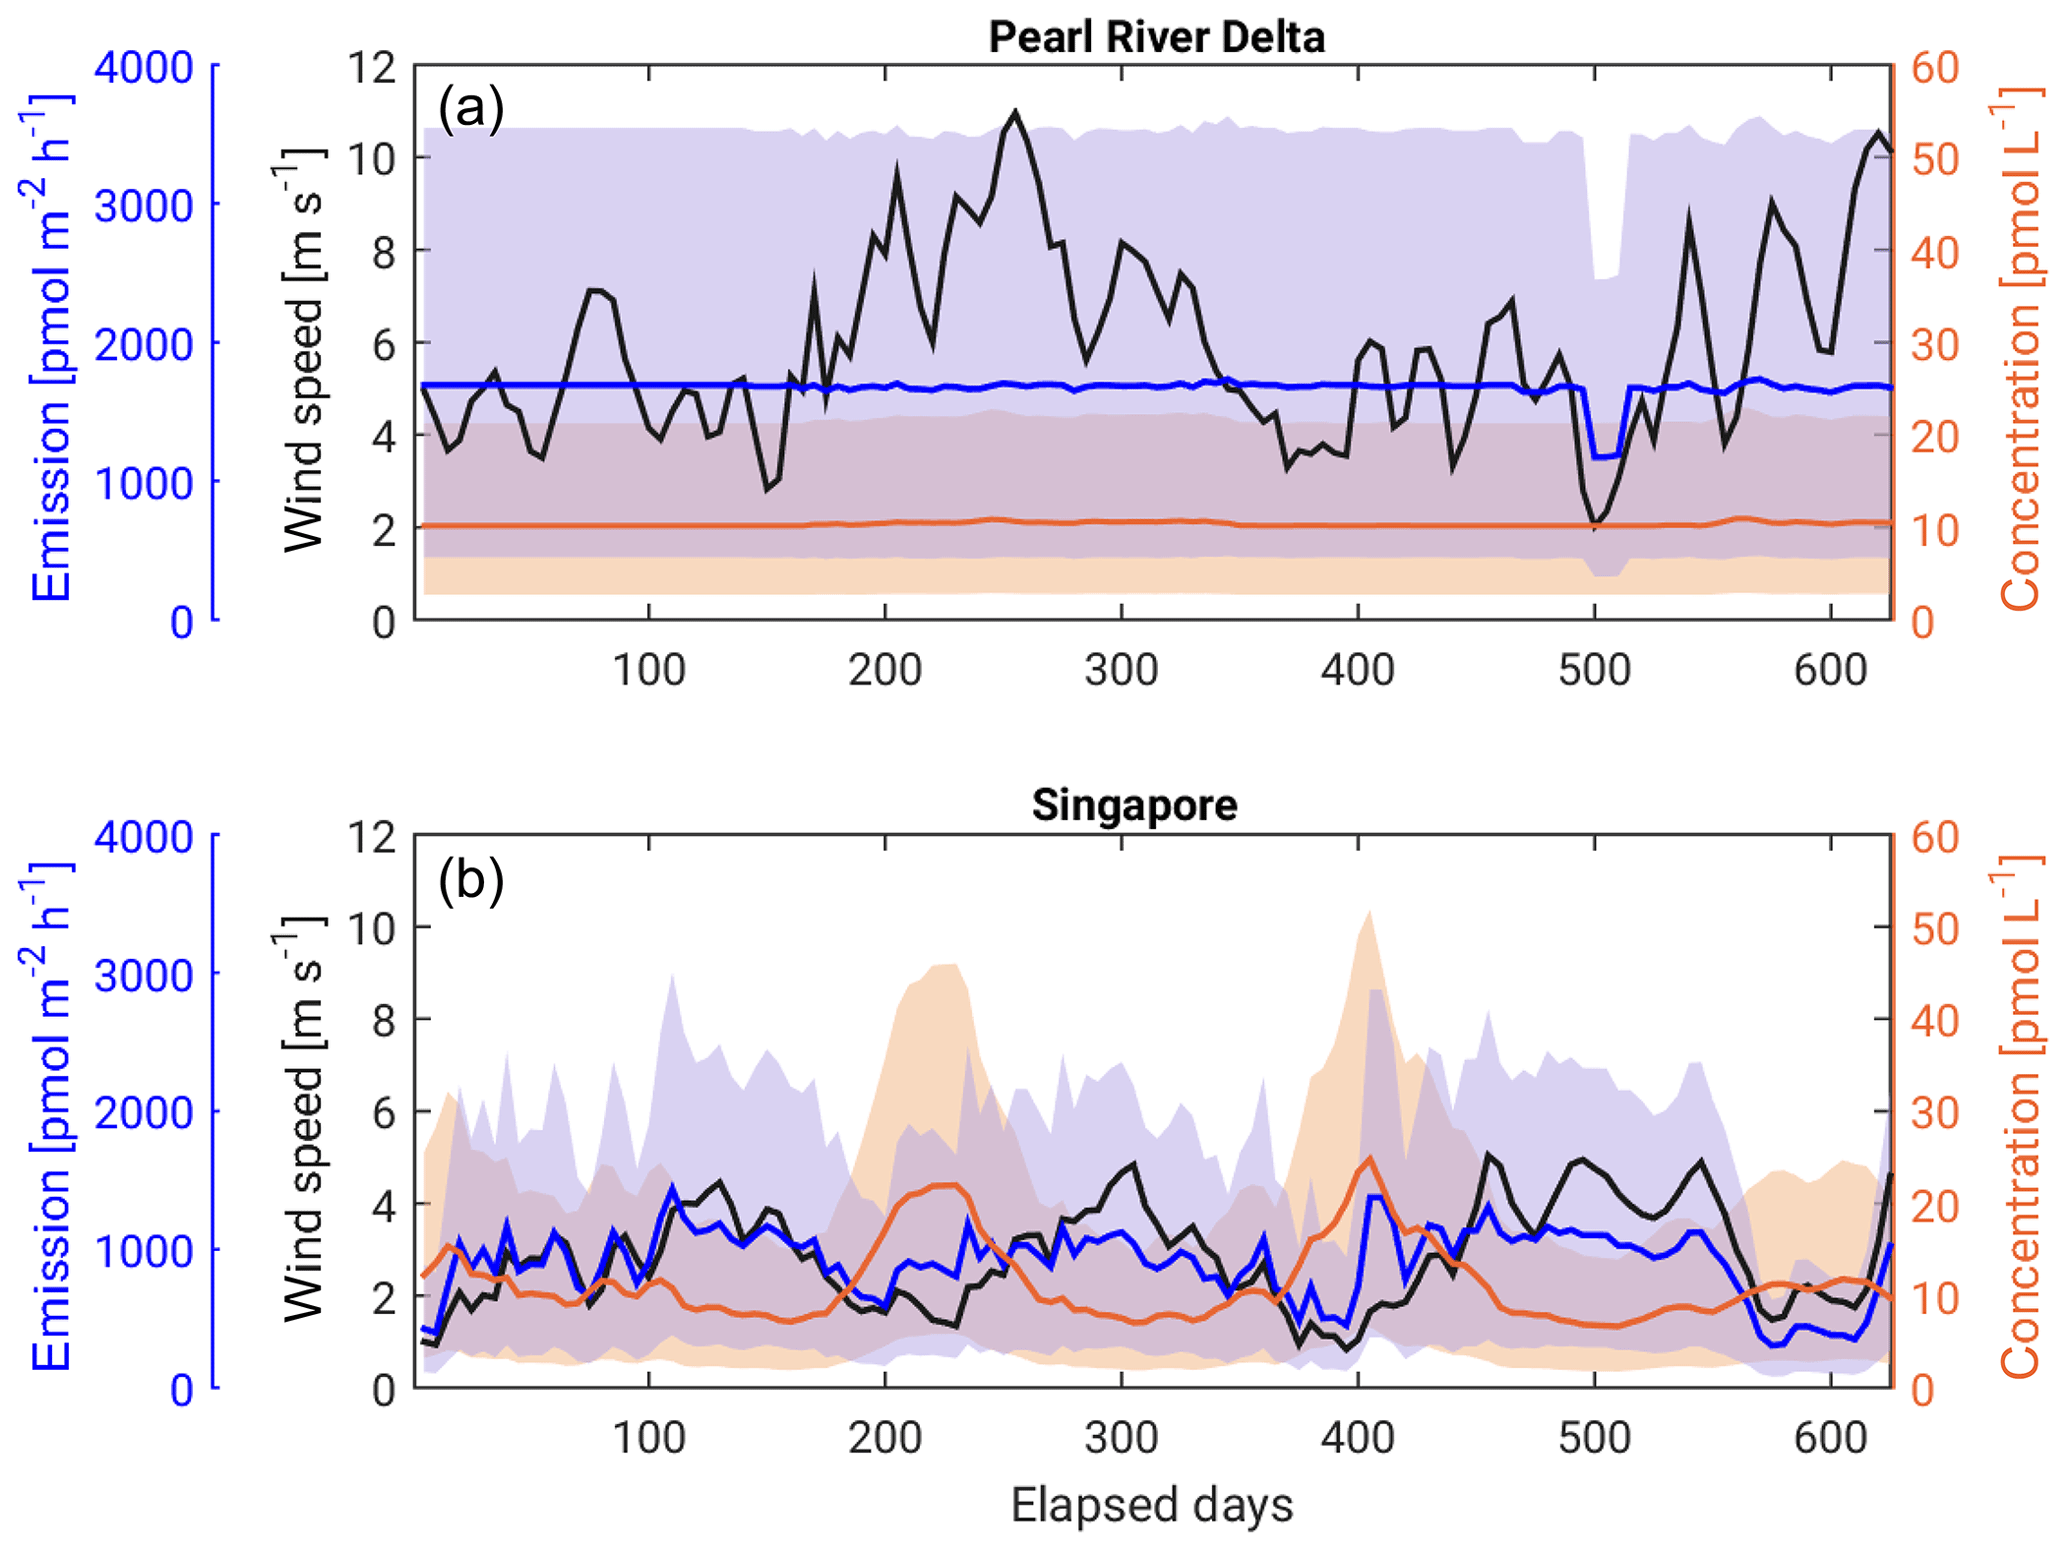
Figure 9Time series of the 2-week running mean of wind speed (black), bromoform surface concentration (orange) and emissions (blue) for (a) Singapore and (b) Pearl River Delta. Solid lines show values from the MODERATE scenario. Shaded areas show the range between the HIGH and LOW scenarios for both bromoform concentration and emissions.
Adding up the air–sea flux rate of bromoform over 1 year, we derive the annual air–sea flux of bromine (Br) resulting from ballast water treatment. In Singapore, the total Br flux ranges from 80 to 640 kmol (7 to 55 t) Br a−1 from LOW to HIGH, which corresponds to an outgassing of roughly 85 % of the original 8 to 63 t Br produced as bromoform in ballast water (Table 3). The remaining 15 % is transported from the port site into the open ocean where it is either eventually outgassed into the atmosphere or transported into the deeper ocean. In the Pearl River Delta region, the flux ranges from 136 to 1070 kmol (12 to 92 t) Br a−1, which corresponds to an outgassing of 100 % of the Br produced from ballast water treatment.
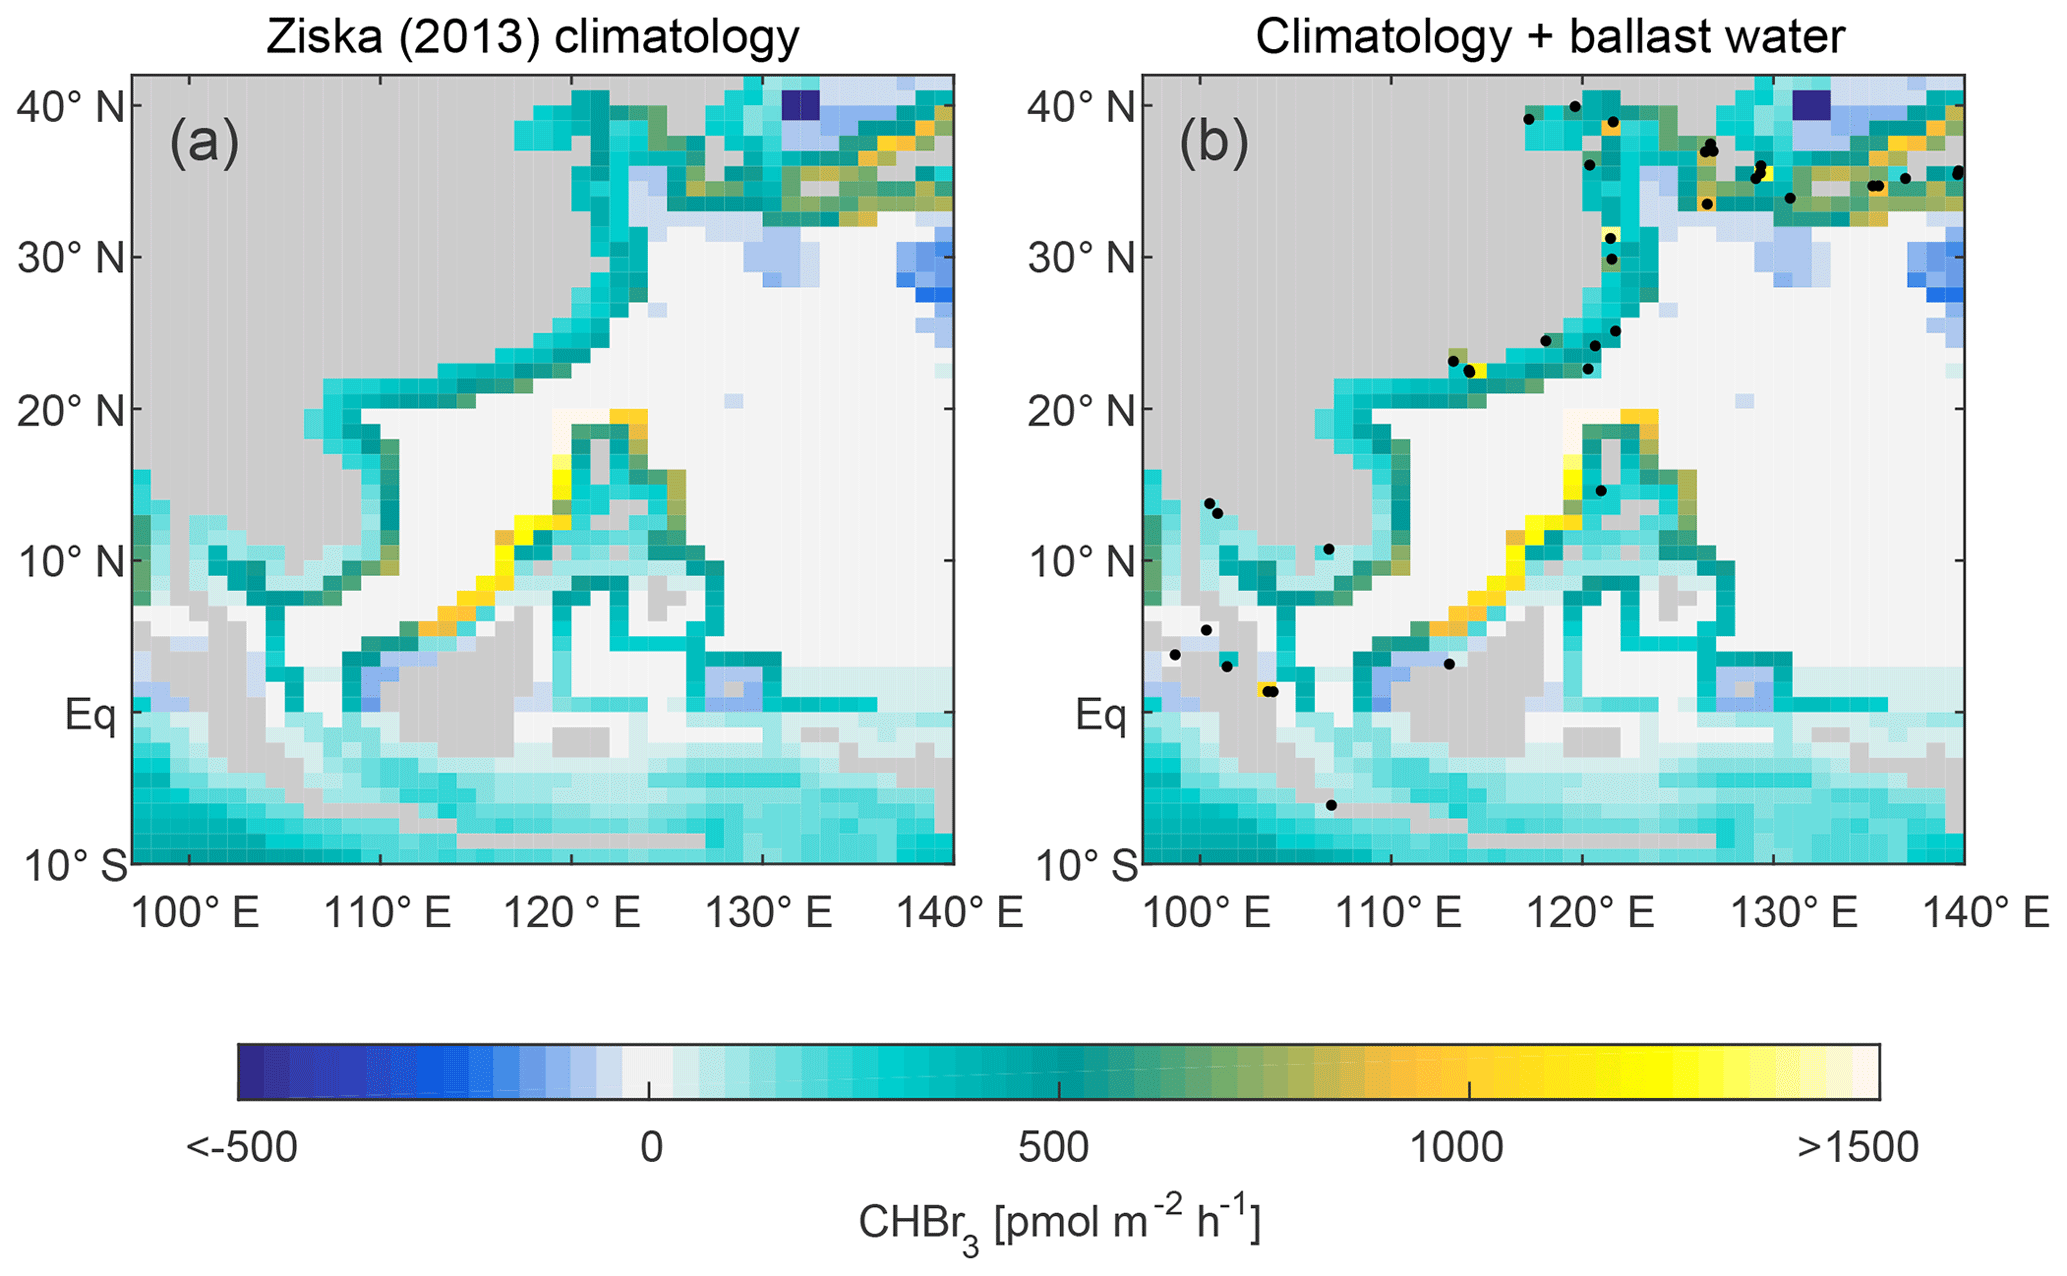
Figure 10(a) Modelled bromoform emission rates updated from Ziska et al. (2013). (b) Same as (a) with additional anthropogenic emission rates calculated as 90 % of total bromoform release from ballast water treatment at each harbour. Black dots indicate the location of all harbours from the modified world port ranking in Southeast Asia.
Given that 85 % of Singapore and 100 % of Pearl River Delta ballast water bromoform is directly outgassed into the atmosphere, we expect that on average 90 % of the anthropogenic bromoform is quickly outgassed after ballast water discharge in the Southeast Asia region. Based on this assumption, we estimate the anthropogenic outgassing rate of bromoform at each of the 38 harbours in the modified world port ranking in Southeast Asia according to its calculated ballast water volume for a MODERATE scenario. These emission rates are calculated on a horizontal grid box closest to the harbour so that the values can be compared to emission maps reconstructed from observations after Ziska et al. (2013) (Fig. 10). Note that anthropogenic emissions are always positive (from ocean to atmosphere) since they were calculated with zero concentration in the atmosphere. The climatological emissions can have negative (atmosphere to ocean) fluxes whereby the reconstructed atmosphere has higher concentrations than the sea surface. Thus, adding anthropogenic emissions to the climatology can theoretically reduce emissions. However, the climatology from Ziska et al. (2013) shows that bromoform emissions in coastal areas are generally characterised by high positive emissions with 500 to 1000 pmol m2 h−1 wherein macroalgae act as efficient bromoform producers (Quack and Wallace, 2003) (Fig. 10a). When we add the estimated anthropogenic bromoform emissions from ballast water to the climatological emissions, many of the grid boxes clearly show a strong increase in emissions, sometimes more than doubling the emission rates of bromoform (Fig. 10b). This is especially visible at very big harbours such as Shanghai, Singapore and the Pearl River Delta region where the new emission rates exceed 1000 pmol m2 h−1. These regions appear as local hot spots of anthropogenic bromoform emissions. Most of these areas are characterised by heavy industry and other anthropogenic activities, resulting in strong emissions of greenhouse gases like methane and ozone. The expected additional source of bromoform to the atmospheric environment can perturb the oxidising capacity and thus the atmospheric lifetime of greenhouse gases and other pollutants (Saiz-Lopez and von Glasow, 2012). The atmospheric chemistry around large ports is highly sensitive to additional emissions of volatile DBPs from treated ballast water.
We investigate a new source of halogenated disinfection by-products to the ocean and atmosphere from the release of chemically treated ballast water. Over the next years, more than 75 000 ships have to instal a ballast water treatment system to prevent the continued spread of harmful invasive species (David and Gollasch, 2015). As a side effect, halogenated DBPs at high concentrations will be produced in ballast water and released into coastal waters (Werschkun et al., 2012; Delacroix et al., 2013). In particular, bromoform shows concentrations in undiluted ballast water up to 1 million times higher than in the natural environment.
Our simulations of the DBP spread from the Singapore and Pearl River Delta harbours in the PASSIVE analysis show that within 1 year about half of the DBPs discharged with the ballast water spreads fast in the surface ocean, while the other half accumulates close to coastal areas around the discharge location with a relative abundance of 3 % to 4 % of DBPs per grid box. The currents determining the DBP spread in Southeast Asia are seasonally influenced by monsoon winds. In Singapore, the main driver of DBP transport throughout the year is the westward Indonesian throughflow, and most of the DBPs spread into the Strait of Malacca and the Indian Ocean. For the Pearl River Delta region, the majority of DBPs is transported southwestward during the northeast monsoon period in boreal winter and northeastward during the southwest monsoon period in boreal summer. Thus, non-volatile DBPs can either spread over large areas at the sea surface or accumulate in specific regions, such as the accumulation of DBPs from the Pearl River Delta in the Gulf of Tonkin. While interannual variations of the DBP spread are relatively small, the seasonal cycle in transport patterns leads to enhanced coastal accumulations depending on the region and time of year.
Based on our simulations in the FLUX analysis, we expect brominated VSLS concentrations and emissions to increase locally in regions with high industrial activity. Anthropogenic bromoform can locally add up to 23 pmol L−1 (0.006 µg L−1) in the HIGH scenario around the port sites. Our simulations assume that DBPs are transported out of the harbour, thereby providing a lower boundary for environmental concentrations. Other studies like David et al. (2018), which use a port-based model approach to calculate the predicted environmental concentration, estimate higher bromoform values (e.g. 0.3 µg L−1) due to the smaller areas considered and the missing air–sea exchange. Once ballast water treatment has been established globally, in situ measurements will be necessary to confirm if existing model-based results provide realistic estimates.
Our simulations reveal that bromoform emissions to the atmosphere can exceed 1000 pmol m−2 h−1 for the MODERATE scenario. This is caused by moderate to high wind speeds above 10 m s−1, which occur especially in the Pearl River Delta. In this region the transfer velocity is sufficiently high so that all anthropogenic bromoform within the mixed layer is instantly outgassed into the atmosphere. Anthropogenic bromoform from ballast water discharge does not accumulate in the ocean but is rather an immediate additional input of Br to the atmosphere. This new source can locally double the climatological bromoform flux calculated from Ziska et al. (2013) around big harbours like Singapore, Shanghai and in the Pearl River Delta. Here, the bromoform emissions to the atmosphere are substantially larger than natural fluxes. For the HIGH scenario, emissions of up to 3500 pmol m−2 h−1 can occur, which is in the range of the highest natural emissions found in global shelf waters but does not exceed reported maximum values of 4450 pmol m−2 h−1 (Quack and Wallace, 2003). The area of Southeast Asia shown in Figure 10 gives a total Br input of 80 Mmol yr−1 for the Ziska et al. (2013) climatology, while anthropogenic bromoform leads to an additional 3 Mmol Br yr−1.
Over the next decades, the impact of brominated VSLSs on climate and ozone depletion will increase due to changes in atmospheric transport and chemistry (Hossaini et al., 2015; Tegtmeier et al., 2015; Fernandez et al., 2017). Increasing VSLS production from anthropogenic activities needs to be investigated and monitored in order to quantify its input to atmospheric bromine. Measurements of VSLSs in coastal areas and ports can reveal the local impact of anthropogenic emissions. For some harbours, they can be even higher than our simulations suggest because our initialisation assumes a dilution of DBPs in the coastal ocean approximately 8 to 40 km off the coast. Moreover, anthropogenic sources like ballast water are always subject to economic fluctuations and trading policies and are thus likely to increase in the future. The choice of simulation scenarios covers a broad range of possible cases, and an increase of ballast water discharge according to current economic growth of ∼2 % per year will not change the main results.
On a global scale the bromine emissions from ballast water treatment reach up to 13 Mmol Br a−1 in the HIGH scenario. Compared to current estimates of background emissions of 2 to 10 Gmol Br a−1 (see Ziska et al., 2013, and references therein) the anthropogenic bromine input is rather small, amounting to 0.1 %. Thus, we do not expect an impact of anthropogenic VSLSs from ballast water treatment on global atmospheric chemistry or the stratospheric ozone layer.
Ballast water, however, is not the only anthropogenic source of DBPs to the coastal oceans. DBPs are also produced through the oxidation of drinking water, wastewater, seawater in desalination plants and cooling water in power plants (e.g. Jenner et al., 1997; Werschkun et al., 2012). In contrast to drinking water for which by-products are strictly regulated (Richardson et al., 2007), the chemical treatment of seawater or brackish water containing high levels of inorganic bromine is not monitored regularly, although it can lead to much higher levels of brominated DBPs. Thus, it is of interest to investigate in future studies the combined effect of anthropogenic VSLSs from all types of oxidative water treatment on the environment.
Data from the ARIANE simulations are available upon request from the corresponding author.
The supplement related to this article is available online at: https://doi.org/10.5194/os-15-891-2019-supplement.
JM wrote the paper, performed the simulations and created the output. ST developed the research question and guided the research process. BQ helped in the formulation of the research question and analysed water samples. SG and MD provided water samples. AB and JVD provided the model data; SR and JVD set up the ARIANE environment and helped with the simulation. All authors took part in the process of paper preparation.
The authors declare that they have no conflict of interest.
This article is part of the special issue “Shipping and the Environment – From Regional to Global Perspectives (ACP/OS inter-journal SI)”. It is a result of the conference Shipping and the Environment – From Regional to Global Perspectives, Gothenburg, Sweden, 23–24 October 2017.
We thank Stephanie Delacroix for providing ship-based samples of ballast water. The authors would also like to thank Yue Jia for simulations of the atmospheric bromoform mixing ratios. Furthermore, we wish to thank Bruno Blanke and Nicolas Grima for realising and providing the Lagrangian software ARIANE. The OGCM and trajectory simulations were performed in the High-Performance Computing Centre at the Christian-Albrechts-Universität zu Kiel. The OGCM model data used for this study were kindly provided through collaboration within the DRAKKAR framework by the National Oceanographic Centre, Southampton, UK. We especially thank Andrew C. Coward, Adrian L. New and colleagues for making the data available. This study was carried out within the Emmy-Noether group AVeSH (A new threat to the stratospheric ozone layer from Anthropogenic Very Short-lived Halocarbons) funded by the Deutsche Forschungsgemeinschaft (DFG, German Research Foundation) – TE 1134/1. Siren Rühs received funding from the Cluster of Excellence 80 “The Future Ocean” within the framework of the Excellence Initiative by the Deutsche Forschungsgemeinschaft (DFG) on behalf of the German federal and state governments (grant CP1412). Finally, we thank the editor and two anonymous reviewers for their helpful comments to improve the paper.
This research has been supported the Deutsche Forschungsgemeinschaft (DFG, German Research Foundation) – (grant no. TE 1134/1).
This paper was edited by David Turner and reviewed by two anonymous referees.
AAPA: World Port Rankings 2016, Port Industry Statistics, Am. Assoc. Port Authorities, available at: http://www.aapa-ports.org/unifying/content.aspx?ItemNumber=21048, last access: 19 December 2018.
Aschmann, J., Sinnhuber, B. M., Atlas, E. L., and Schauffler, S. M.: Modeling the transport of very short-lived substances into the tropical upper troposphere and lower stratosphere, Atmos. Chem. Phys., 9, 9237–9247, https://doi.org/10.5194/acp-9-9237-2009, 2009.
Blanke, B., Arhan, M., Madec, G., and Roche, S.: Warm Water Paths in the Equatorial Atlantic as Diagnosed with a General Circulation Model, J. Phys. Oceanogr., 29, 2753–2768, 1999.
Briski, E., Ghabooli, S., Bailey, S. A., and MacIsaac, H. J.: Invasion risk posed by macroinvertebrates transported in ships' ballast tanks, Biol. Invasions, 14, 1843–1850, https://doi.org/10.1007/s10530-012-0194-0, 2012.
Carpenter, L. J., Reimann, S., (Lead Authors), Burkholder, J. B., Clerbaux, C., Hall, B. D., Hossaini, R., Laube, J. C., and Yvon-Lews, S. A.: Update on Ozone-Depleting Substances (ODSs) and Other Gases of Interest to the Montreal Protocol, Chapter 1 Sci. Assess. Ozone Deplet. 2014, (Global Ozone Research and Monitoring Project-Report No. 55), World Meteorological Organization, Geneva, Switzerland, 1.1–1.101, 2014.
David, M.: Vessels and Ballast Water, in: Glob. Marit. Transp. Ballast Water Manag., edited by: David, M. and Gollasch, S., Invading Nature-Springer Series, Invasion Ecology, 8, 13–34, https://doi.org/10.1007/978-94-017-9367-4_2, 2015.
David, M. and Gollasch, S.: Ballast Water Management Systems for Vessels, Glob. Marit. Transp. Ballast Water Manag., edited by: David, M. and Gollasch, S., Invading Nature-Springer Series, Invasion Ecology 8, 109–132, https://doi.org/10.1007/978-94-017-9367-4_6, 2015.
David, M., Linders, J., Gollasch, S., and David, J.: Is the aquatic environment sufficiently protected from chemicals discharged with treated ballast water from vessels worldwide? – A decadal environmental perspective and risk assessment, Chemosphere, 207, 590–600, https://doi.org/10.1016/j.chemosphere.2018.05.136, 2018.
Delacroix, S., Vogelsang, C., Tobiesen, A., and Liltved, H.: Disinfection by-products and ecotoxicity of ballast water after oxidative treatment – Results and experiences from seven years of full-scale testing of ballast water management systems, Mar. Pollut. Bull., 73, 24–36, 2013.
Dorf, M., Butler, J. H., Butz, A., Camy-Peyret, C., Chipperfield, M. P., Kritten, L., Montzka, S. A., Simmes, B., Weidner, F., and Pfeilsticker, K.: Long-term observations of stratospheric bromine reveal slow down in growth, Geophys. Res. Lett., 33, L24803, https://doi.org/10.1029/2006GL027714, 2006.
DRAKKAR Group: Eddy permitting ocean circulation hindcasts of past decades, CLIVAR Exchanges, 42, 8–10, 2007.
Durgadoo, J. V., Ruehs, S., Biastoch, A., and Boening, C. W. B.: Indian Ocean sources of Agulhas leakage, J. Geophys. Res.-Ocean., 122, 1–19, https://doi.org/10.1002/2016JC012676, 2017.
Dussin, R., Barnier, B., Brodeau, L., and Molines, J. M.: The Making Of the DRAKKAR FORCING SET DFS5, DRAKKAR/MyOcean Rep. 01-04-16, 1–34, 2016.
Endresen, Ø., Lee Behrens, H., Brynestad, S., Bjørn Andersen, A., and Skjong, R.: Challenges in global ballast water management, Mar. Pollut. Bull., 48, 615–623, https://doi.org/10.1016/j.marpolbul.2004.01.016, 2004.
Fernandez, R. P., Kinnison, D. E., Lamarque, J. F., Tilmes, S., and Saiz-Lopez, A.: Impact of biogenic very short-lived bromine on the Antarctic ozone hole during the 21st century, Atmos. Chem. Phys., 17, 1673–1688, https://doi.org/10.5194/acp-17-1673-2017, 2017.
Fuhlbrügge, S., Quack, B., Atlas, E., Fiehn, A., Hepach, H., and Krüger, K.: Meteorological constraints on oceanic halocarbons above the Peruvian upwelling, Atmos. Chem. Phys., 16, 12205–12217, https://doi.org/10.5194/acp-16-12205-2016, 2016.
Gordon, A. L.: Interocean Exchange, Interocean Exch. Int. Geophys. Ser., 77, 303–316, 2001.
Hense, I. and Quack, B.: Modelling the vertical distribution of bromoform in the upper water column of the tropical Atlantic Ocean, Biogeosciences, 6, 535–544, https://doi.org/10.5194/bg-6-535-2009, 2009.
Hossaini, R., Chipperfield, M. P., Dhomse, S., Ordóñez, C., Saiz-Lopez, A., Abraham, N. L., Archibald, A., Braesicke, P., Telford, P., Warwick, N., Yang, X., and Pyle, J.: Modelling future changes to the stratospheric source gas injection of biogenic bromocarbons, Geophys. Res. Lett., 39, GL053401, https://doi.org/10.1029/2012GL053401, 2012.
Hossaini, R., Chipperfield, M. P., Montzka, S. A., Rap, A., Dhomse, S., and Feng, W.: Efficiency of short-lived halogens at influencing climate through depletion of stratospheric ozone, Nat. Geosci., 8, 186–190, https://doi.org/10.1038/ngeo2363, 2015.
IMO: International Convention for the Control and Management of Ships' Ballast Water and Sediments, in: BWM/CONF/36, 1–38, 2004.
IMO: Methodology for information gathering and conduct of work of the GESAMMP-BWWG, BWM.2/Circ.13/Rev.4, 1–99, 2017.
IMO: List of ballast water management systems that make use of Active Substances which received Basic and Final Approval, BWM.2/Circ.34/Rev.7, 1–28, 2019.
Jenner, H. A., Taylor, C. J. L., van Donk, M., and Khalanski, M.: Chlorination by-products in chlorinated cooling water of some European coastal power stations, Mar. Environ. Res., 43, 279–293, https://doi.org/10.1016/S0141-1136(96)00091-8, 1997.
Liang, Q., Stolarski, R. S., Kawa, S. R., Nielsen, J. E., Douglass, A. R., Rodriguez, J. M., Blake, D. R., Atlas, E. L., and Ott, L. E.: Finding the missing stratospheric Bry: A global modeling study of CHBr3 and CH2Br2, Atmos. Chem. Phys., 10, 2269–2286, https://doi.org/10.5194/acp-10-2269-2010, 2010.
Liu, Z., Wang, X., Luo, Z., Huo, M., Wu, J., Huo, H., and Yang, W.: Removing of disinfection by-product precursors from surface water by using magnetic graphene oxide, PLoS One, 10, e0143819, https://doi.org/10.1371/journal.pone.0143819, 2015.
Madec, G. and the NEMO team: NEMO ocean engine. Note du Pôle de modélisation, Institut Pierre-Simon Laplace (IPSL), France, No. 27, ISSN No. 1288–1619, 2008.
Maritime Impact: Treat Her Right, Issue 01, 18–19, https://issuu.com/dnvgl/docs/dnv_gl_maritime_impact_01-2017 (last access: 18 December 2018), 2017
Marzocchi, A., Hirschi, J. J. M., Holliday, N. P., Cunningham, S. A., Blaker, A. T., and Coward, A. C.: The North Atlantic subpolar circulation in an eddy-resolving global ocean model, J. Mar. Syst., 142, 126–143, https://doi.org/10.1016/j.jmarsys.2014.10.007, 2015.
Moore, R. M., Webb, M., Tokarczyk, R., and Wever, R.: Bromoperoxidase and iodoperoxidase enzymes and production of halogenated methanes in marine diatom cultures, J. Geophys. Res.-Ocean., 101, 20899–20908, https://doi.org/10.1029/96JC01248, 1996.
Nightingale, D., Malin, G., Law, C. S., Watson, A. J., Liss, P. S., Liddicoat, M. I., Boutin, J., and Upstill-Goddard, R. C.: In situ evaluation of air-sea gas exchange parameterizations using novel conservative and volatile tracers, Global Biogeochem. Cy., 14, 373–387, 2000.
Padhi, R. K., Subramanian, S., Mohanty, A. K., Bramha, S. N., Prasad, M. V. R., and Satpathy, K. K.: Trihalomethanes in the cooling discharge of a power plant on chlorination of intake seawater, Environ. Eng. Res., 17, 57–62, https://doi.org/10.4491/eer.2012.17.S1.S57, 2012.
Quack, B. and Wallace, D. W. R.: Air-sea flux of bromoform: Controls, rates, and implications, Global Biogeochem. Cy., 17, 1023, https://doi.org/10.1029/2002GB001890, 2003.
Richardson, S. D., Plewa, M. J., Wagner, E. D., Schoeny, R., and DeMarini, D. M.: Occurrence, genotoxicity, and carcinogenicity of regulated and emerging disinfection by-products in drinking water: A review and roadmap for research, Mutat. Res.-Rev. Mutat. Res., 636, 178–242, https://doi.org/10.1016/j.mrrev.2007.09.001, 2007.
Rühs, S., Schwarzkopf, F. U., Speich, S., and Biastoch, A.: Cold vs. warm water route – sources for the upper limb of the Atlantic Meridional Overturning Circulation revisited in a high-resolution ocean model, Ocean Sci., 15, 489–512, https://doi.org/10.5194/os-15-489-2019, 2019.
Ruiz, G. M., Rawlings, T. K., Dobbs, F. C., Drake, L. A., Mullady, T., Huq, A., and Colwell, R. R.: Global spread of microorganisms by ships, Nature, 408, 49–50, https://doi.org/10.1038/35040695, 2000.
Saiz-Lopez, A. and Von Glasow, R.: Reactive halogen chemistry in the troposphere, Chem. Soc. Rev., 41, 6448–6472, https://doi.org/10.1039/c2cs35208g, 2012.
Seebens, H., Gastner, M. T., and Blasius, B.: The risk of marine bioinvasion caused by global shipping, Ecol. Lett., 16, 782–790, https://doi.org/10.1111/ele.12111, 2013.
Shah, A. D., Liu, Z.-Q., Salhi, E., Höfer, T., Werschkun, B., and von Gunten, U.: Formation of disinfection by-products during ballast water treatment with ozone, chlorine, and peracetic acid: influence of water quality parameters, Environ. Sci. Water Res. Technol., 1, 465–480, https://doi.org/10.1039/C5EW00061K, 2015.
Shaw, P. T. and Chao, S. Y.: Surface circulation in the South China Sea, Deep-Sea Res. Pt. I, 41, 1663–1683, https://doi.org/10.1016/0967-0637(94)90067-1, 1994.
Sherwen, T., Schmidt, J. A., Evans, M. J., Carpenter, L. J., Großmann, K., Eastham, S. D., Jacob, D. J., Dix, B., Koenig, T. K., Sinreich, R., Ortega, I., Volkamer, R., Saiz-Lopez, A., Prados-Roman, C., Mahajan, A. S., and Ordóñez, C.: Global impacts of tropospheric halogens (Cl, Br, I) on oxidants and composition in GEOS-Chem, Atmos. Chem. Phys., 16, 12239–12271, https://doi.org/10.5194/acp-16-12239-2016, 2016.
Simpson, W. R., Brown, S. S., Saiz-Lopez, A., Thornton, J. A., and von Glasow, R.: Tropospheric Halogen Chemistry: Sources, Cycling, and Impacts, Chem. Rev., 115, 4035–4062, https://doi.org/10.1021/cr5006638, 2015.
Sinnhuber, B. M. and Meul, S.: Simulating the impact of emissions of brominated very short lived substances on past stratospheric ozone trends, Geophys. Res. Lett., 42, 2449–2456, https://doi.org/10.1002/2014GL062975, 2015.
Tamelander J., Riddering L., Haag F., and Matheickal J.: Guidelines for Development of National Ballast Water Management Strategies. GEF-UNDP-IMO GloBallast, London, UK and IUCN, Gland, Switzerland, GloBallast Monographs No. 18, 2010.
Tegtmeier, S., Ziska, F., Pisso, I., Quack, B., Velders, G. J. M., Yang, X., and Krüger, K.: Oceanic bromoform emissions weighted by their ozone depletion potential, Atmos. Chem. Phys., 15, 13647–13663, https://doi.org/10.5194/acp-15-13647-2015, 2015.
Theiler, R., Cook, J. C., Hager, L. P., and Siuda, J. F.: Halohydrocarbon synthesis by bromoperoxidase, Science, 202, 1094–1096, https://doi.org/10.1126/science.202.4372.1094, 1978.
UNCTAD: Review of Maritime Transport 2017, UN, New York, https://doi.org/10.18356/a9b345e7-en (last access: 4 July 2019), 2017.
Van Sebille, E., Scussolini, P., Durgadoo, J. V., Peeters, F. J. C., Biastoch, A., Weijer, W., Turney, C., Paris, C. B., and Zahn, R.: Ocean currents generate large footprints in marine palaeoclimate proxies, Nat. Commun., 6, 6521, https://doi.org/10.1038/ncomms7521, 2015.
Wales, P. A., Salawitch, R. J., Nicely, J. M., Anderson, D. C., Canty, T. P., Baidar, S., Dix, B., Koenig, T. K., Volkamer, R., Chen, D., Huey, L. G., Tanner, D. J., Cuevas, C. A., Fernandez, R. P., Kinnison, D. E., Lamarque, J. F., Saiz-Lopez, A., Atlas, E. L., Hall, S. R., Navarro, M. A., Pan, L. L., Schauffler, S. M., Stell, M., Tilmes, S., Ullmann, K., Weinheimer, A. J., Akiyoshi, H., Chipperfield, M. P., Deushi, M., Dhomse, S. S., Feng, W., Graf, P., Hossaini, R., Jöckel, P., Mancini, E., Michou, M., Morgenstern, O., Oman, L. D., Pitari, G., Plummer, D. A., Revell, L. E., Rozanov, E., Saint-Martin, D., Schofield, R., Stenke, A., Stone, K. A., Visioni, D., Yamashita, Y., and Zeng, G.: Stratospheric Injection of Brominated Very Short-Lived Substances: Aircraft Observations in the Western Pacific and Representation in Global Models, J. Geophys. Res.-Atmos., 123, 5690–5719, https://doi.org/10.1029/2017JD027978, 2018.
Warwick, N. J., Pyle, J. A., Carver, G. D., Yang, X., Savage, N. H., O'Connor, F. M., and Cox, R. A.: Global modeling of biogenic bromocarbons, J. Geophys. Res.-Atmos., 111, D24305, https://doi.org/10.1029/2006JD007264, 2006.
Werschkun, B., Sommer, Y., and Banerji, S.: Disinfection by-products in ballast water treatment: An evaluation of regulatory data, Water Res., 46, 4884–4901, https://doi.org/10.1016/j.watres.2012.05.034, 2012.
Werschkun, B., Banerji, S., Basurko, O. C., David, M., Fuhr, F., Gollasch, S., Grummt, T., Haarich, M., Jha, A. N., Kacan, S., Kehrer, A., Linders, J., Mesbahi, E., Pughiuc, D., Richardson, S. D., Schwarz-Schulz, B., Shah, A., Theobald, N., von Gunten, U., Wieck, S., and Höfer, T.: Emerging risks from ballast water treatment: The run-up to the International Ballast Water Management Convention, Chemosphere, 112, 256–266, https://doi.org/10.1016/j.chemosphere.2014.03.135, 2014.
Yang, X., Abraham, N. L., Archibald, A. T., Braesicke, P., Keeble, J., Telford, P. J., Warwick, N. J., and Pyle, J. A.: How sensitive is the recovery of stratospheric ozone to changes in concentrations of very short-lived bromocarbons?, Atmos. Chem. Phys., 14, 10431–10438, https://doi.org/10.5194/acp-14-10431-2014, 2014.
Ziska, F., Quack, B., Abrahamsson, K., Archer, S. D., Atlas, E., Bell, T., Butler, J. H., Carpenter, L. J., Jones, C. E., Harris, N. R. P., Hepach, H., Heumann, K. G., Hughes, C., Kuss, J., Krüger, K., Liss, P., Moore, R. M., Orlikowska, A., Raimund, S., Reeves, C. E., Reifenhäuser, W., Robinson, A. D., Schall, C., Tanhua, T., Tegtmeier, S., Turner, S., Wang, L., Wallace, D., Williams, J., Yamamoto, H., Yvon-Lewis, S., and Yokouchi, Y.: Global sea-to-air flux climatology for bromoform, dibromomethane and methyl iodide, Atmos. Chem. Phys., 13, 8915–8934, https://doi.org/10.5194/acp-13-8915-2013, 2013.