the Creative Commons Attribution 4.0 License.
the Creative Commons Attribution 4.0 License.
 | 24 Jun 2019
The CMEMS GlobColour chlorophyll a product based on satellite observation: multi-sensor merging and flagging strategies
Philippe Garnesson
Antoine Mangin
Odile Fanton d'Andon
Julien Demaria
Marine Bretagnon
This paper concerns the GlobColour-merged chlorophyll a products based on satellite observation (SeaWiFS, MERIS, MODIS, VIIRS and OLCI) and disseminated in the framework of the Copernicus Marine Environmental Monitoring Service (CMEMS).
This work highlights the main advantages provided by the Copernicus GlobColour processor which is used to serve CMEMS with a long time series from 1997 to present at the global level (4 km spatial resolution) and for the Atlantic level 4 product (1 km spatial resolution).
To compute the merged chlorophyll a product, two major topics are discussed:
-
The first of these topics is the strategy for merging remote-sensing data, for which two options are considered. On the one hand, a merged chlorophyll a product computed from a prior merging of the remote-sensing reflectance of a set of sensors. On the other hand, a merged chlorophyll a product resulting from a combination of chlorophyll a products computed for each sensor.
-
The second topic is the flagging strategy used to discard non-significant observations (e.g. clouds, high glint and so on).
These topics are illustrated by comparing the CMEMS GlobColour products provided by ACRI-ST (Garnesson et al., 2019) with the OC-CCI/C3S project (Sathyendranath et al., 2018). While GlobColour merges chlorophyll a products with a specific flagging, the OC-CCI approach is based on a prior reflectance merging before chlorophyll a derivation and uses a more constrained flagging approach.
Although this work addresses these two topics, it does not pretend to provide a full comparison of the two data sets, which will require a better characterisation and additional inter-comparison with in situ data.
- Article
(9500 KB) - Full-text XML
- BibTeX
- EndNote


The Copernicus Marine Environmental Service (CMEMS) provides regular and systematic reference information on the physical state and on marine ecosystems for global oceans and for European regional seas, including temperature, currents, salinity, sea surface height, sea ice, marine optical properties and other such parameters.
This capacity encompasses satellite and in situ data-derived products, the description of the current situation (analysis), the prediction of the situation a few days ahead (forecast) and the provision of consistent retrospective data records for recent years (re-analysis).
The Ocean Thematic Assembly Centre (OCTAC) is part of CMEMS and is dedicated to the dissemination of ocean colour (OC) products derived from satellite-based remote sensing (Le Traon et al., 2015). OCTAC provides global and regional (Arctic, Atlantic, Baltic Sea, Black Sea and Mediterranean Sea) products for the period spanning from 1997 to the present.
For global products, the Copernicus GlobColour processor has been used operationally since 2009 to serve CMEMS and its precursors (a series of EU research projects called MyOcean).
The GlobColour processor was initially developed in the framework of the GlobColour project that started in 2005 as an ESA Data User Element (DUE) project to provide a continuous data set of merged L3 ocean colour products. Since the beginning of the project, GlobColour has been continuously used by more than 600 users worldwide. This effort has been continued in the framework of CMEMS to derive (among others) the chlorophyll a ocean colour core product.
Many algorithms have been published to retrieve chlorophyll a from reflectance data derived from satellite observations (e.g. Müller-Karger et al., 1990; Aiken et al., 1995; Morel, 1997; O'Reilly et al., 1998, 2000). Since early 2018, the CMEMS GlobColour chlorophyll a product has been based on the merging of three algorithms:
-
the CI approach (Hu et al., 2012) for oligotrophic water (70 % to 80 % of ocean),
-
the common approach OCx (OC3, OC4 or OC4Me depending on the sensor) for mesotrophic water and
-
the OC5 algorithm (Gohin et al., 2002) for complex waters, which is of specific interest for end users who manage complex waters along the coastal zone.
It should be noted that the OC5 algorithm is based on a lookup table implementation that handles both complex and mesotrophic waters (see Sect. 2.1)
The work presented here highlights the conceptual advantage of the CMEMS Copernicus GlobColour processor with regards to the flagging and merging of sensors. In the following sections, results are described and illustrated with comparison to the OC-CCI products.
The comparison between GlobColour and OC-CCI is especially relevant as the same chlorophyll a algorithms (CI and OC5) are used by the two initiatives: this implies that the differences in performance mainly result from the merging strategies and flagging schemes.
2.1 Merging approach
At present, the CMEMS GlobColour-merged chlorophyll a product relies on the following sensors: SeaWiFS (1997–2010), MERIS (2002–2012), MODIS Aqua (2002–present), VIIRS-NPP (2012–present) and OLCI-S3A (2016–present).
Table 1Main characteristics of sensors/bands used for CMEMS (VIIRS-JPPS1 and OLCI-S3B will be used by the GlobColour processor in the framework of the CMEMS release scheduled in July 2019).
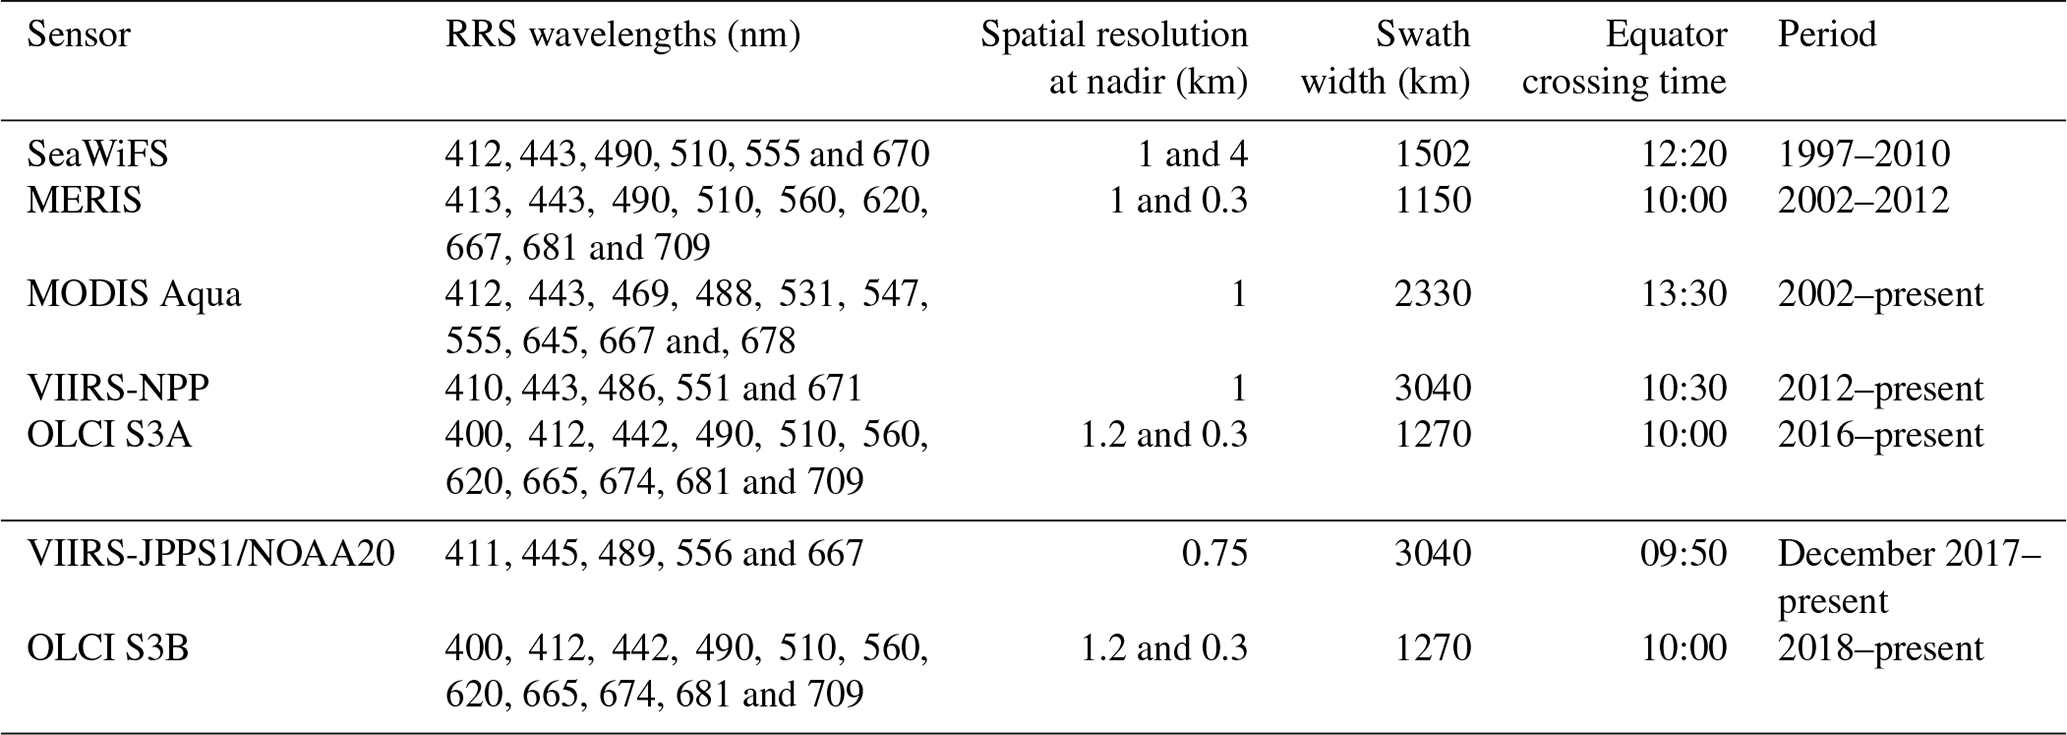
The long time series from 1997 to the present relies on different sensors, observing the Earth at different spectral bands (and different bandwidths), with different acquisition times (so different atmospheric and sun conditions), and with different spatial resolutions from about 300 m to 1 km at nadir (larger on the swath border). The main characteristics of the sensors/bands used for CMEMS are summarised in Table 1. VIIRS-NOOA20 and OLCI-S3B will be ingested in the operational products in 2019.
It should be noted that the global chlorophyll a product is provided at a 4 km spatial resolution at present, but the objective in the coming years is to provide (at least along the coast) a chlorophyll a product at a 300 m resolution.
All of the sensors used observe the Earth along a helio-synchronous orbit. Figure 1 displays the coverage of a single sensor that is unable to provide the full Earth coverage over a single day (Maritorena et al., 2015). VIIRS provides a larger swath than the other sensors, but the coverage is incomplete due to sun glint.
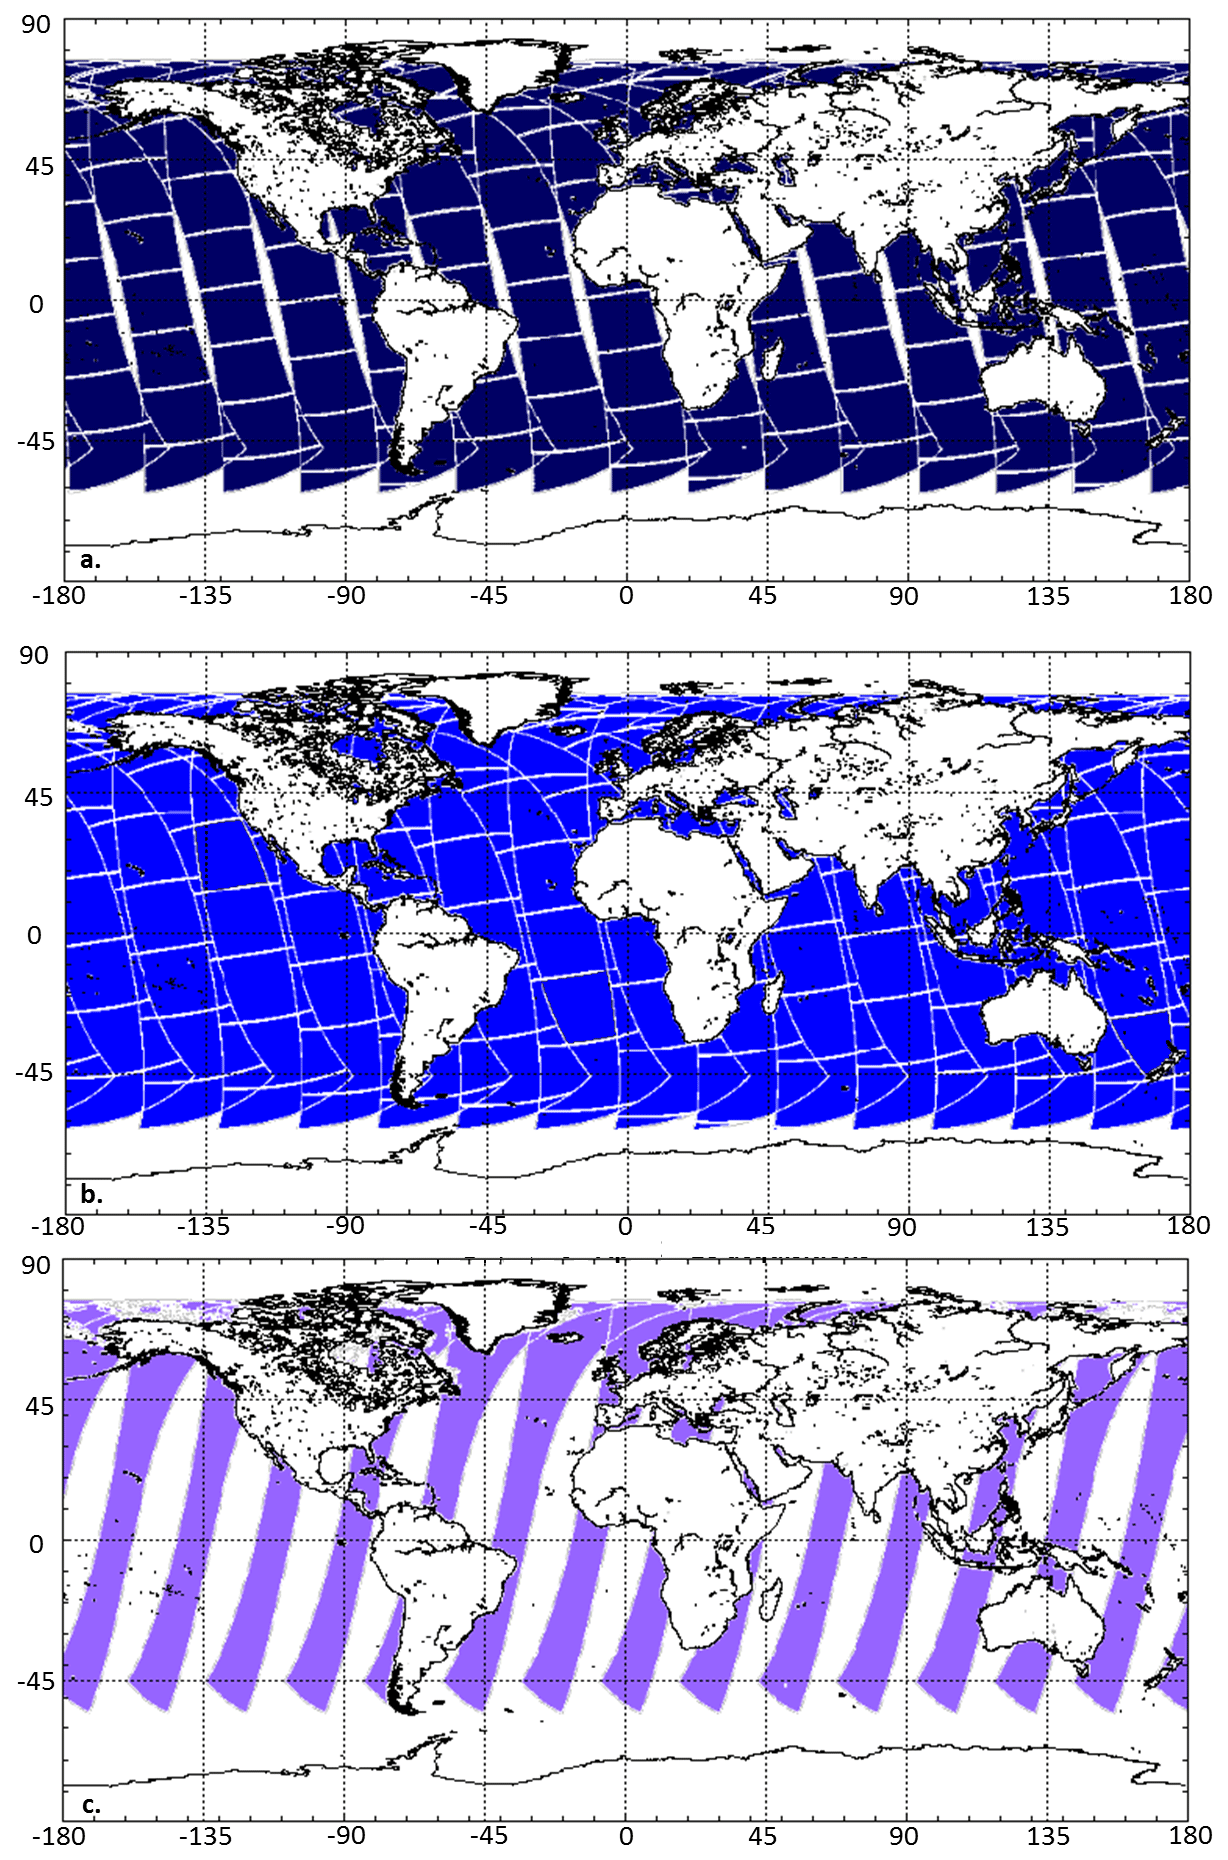
Figure 1Swath of the different sensors used at present by CMEMS for (a) MODIS Aqua, (b) VIIRS-NPP and (c) OLCI-S3A. In practice the effective swath coverage is reduced, which is mainly due to clouds or sun glint effects. Source: http://octac.acri.fr (last access: 15 January 2019).
When more than one sensor is available for the same period it is possible to take advantage of their complementarity and redundancy for a number of benefits. For instance, as they may record the same spot at different times of the day, morning haze may impact one sensor but not another (Toole et al., 2000).
To compute a multi-sensor chlorophyll a product, two main merging approaches exist:
-
The first approach (used by OC-CCI) is based on merged reflectance of remote-sensing (RRS) computed in a prior step and then used to derive chlorophyll a. Based on a band shifting and bias correction approach, merged RRS for the standard SeaWiFS wavelengths (412, 443, 490, 510, 555 and 670 nm) are provided. The blended chlorophyll a algorithm used in the OC-CCI v3.1 release attempts to weight the outputs of the best performing algorithms based on the water types present.
-
Conversely, in a second approach (used by CMEMS GlobColour), chlorophyll a is computed in an initialisation step for each sensor using its specific characteristics (spectral band and resolution), and then the mono-sensor chlorophyll a products are resampled and merged. The continuity of the different algorithms was initially obtained using a water classification approach (Saulquin al., 2018). Since early 2018, a new approach has been adopted:
-
First, the continuity of algorithms used for mesotrophic and complex waters is guaranteed by the OC5 lookup table. The OC5 lookup table is initialised using the OC3 and OC4 coefficients from agencies and then empirically adjusted when the green band exceeds a given threshold (see Gohin et al., 2002, for details).
-
Then, the CI and OC5 continuity is ensured using the same approach as that utilised by NASA. When the chlorophyll a concentration is in the range from 0.15 to 0.2 mg m−3, a linear interpolation of OC5 and CI is used. This provides continuity between the two algorithms.
-
2.2 Flagging approach
Inputs of the Copernicus GlobColour processor are the level 2 products provided by the space agencies. To derive chlorophyll a, the input level 2 reflectance and input flags are used (level 2 provides flags/indicators regarding the quality of the reflectance on a pixel basis). For instance, a pixel can be impacted by a sun glint effect. In such cases reflectance data are available, but agencies recommend not to use them for further processing. Each space agency publishes flagging data based on its own strategy, which has been designed to guarantee the quality of its products. The drawback is that for complex water (especially along coastal area), a large proportion of the data is flagged, resulting in level 3 products with limited coverage.
Since early 2018, the GlobColour processor has been modified to apply a lower level of flagging, resulting in a better spatial and temporal coverage. This modification is inherited from the OC5 algorithm (Gohin et al., 2002) which was initially designed for coastal monitoring. OC5 uses its own strategy to flag data: the algorithm uses both the official flags and empirical thresholds that have been tuned for each sensor (e.g. the OC5 sun zenith angle, SZA, is set to 78∘ instead of 70∘).
The OC5 flagging strategy is used by the GlobColour sensor approach but not by the OC-CCI approach, which uses a specific OC5 lookup table applied on the merged reflectances.
Concerning OC-CCI, the flagging strategy for the v3.1 release depends on the sensor. When the reflectance data originate from level 2 data provided by the agency (SeaWiFS and VIIRS-SNPP) the official flags are applied. When the POLYMER algorithm (Steinmetz et al., 2011) is used for atmospheric correction (MERIS and MODIS) a generic pixel identification and classification algorithm called Idepix is used (part of BEAM software) instead of the standard POLYMER flagging (which is too permissive).
3.1 The reflectance merging approach
The reflectance merging approach is used by OC-CCI to derive the global chlorophyll a OC-CCI time series and by the regional CMEMS products. As pointed out by Volpe et al. (2019) for the regional Mediterranean products, the band merging approach has the advantage of providing a homogeneous data set of spectral reflectance from which the following environmental parameters (amongst others) can be derived, in full consistency for the long term: chlorophyll a products, light attenuation, Kd and suspended particulate matter.
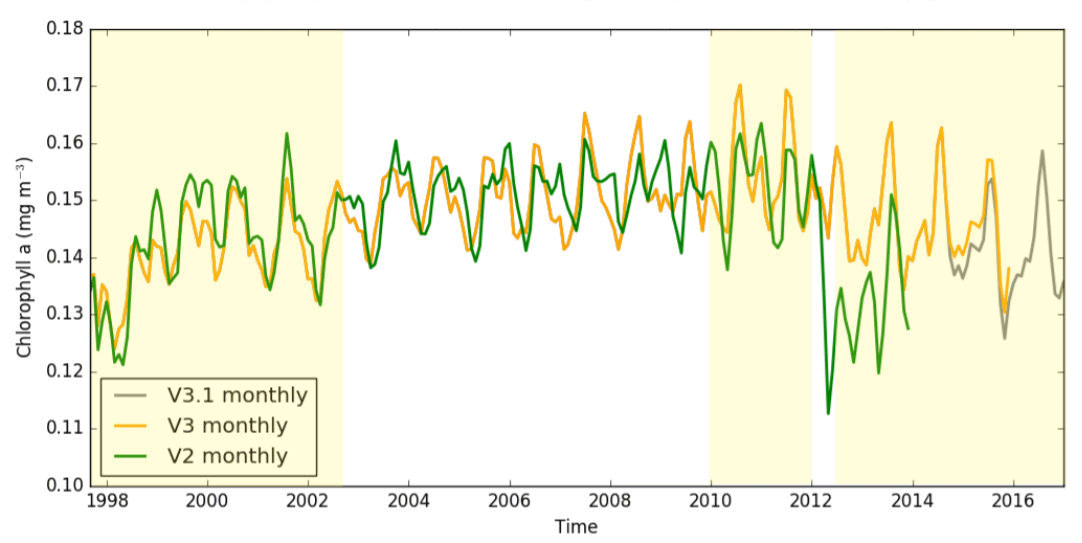
Figure 2Comparison of the global median chlorophyll a concentration as function of time for v2.0, v3.0 and v3.1 using the monthly composite as input. Source: OC-CCI Product User Guide, release 3.1.0, 24 April 2017. The yellow shaded regions show the change of sensor combinations (see Table 1).
However, the consistency of the long time series provided by OC-CCI suffers from some limitations. Figure 2 from the OC-CCI Product User Guide inter-compares the different releases of the OC-CCI time series. It shows that the V2 release was strongly impacted by the MERIS sensor ceasing operation in April 2012 (see Table 1). The V3 release demonstrates a trend depending on the sensors used: it increases for the period from 2002 to 2010, based on the contributions of SeaWiFS, MODIS and MERIS, and decreases for the period from 2012 to 2017, as only MODIS and VIIRS-SNPP were used.

Figure 3Arctic time series and trend (1997–2017) from the OC-CCI product. The time series are derived from the regional chlorophyll a reprocessed (REP) products as distributed by CMEMS which, in turn, results from the application of the regional chlorophyll a algorithms with remote-sensing reflectances provided by the ESA Ocean Colour Climate Change Initiative (ESA OC-CCI). Daily regional mean values are calculated by averaging (weighted by pixel area) over the region of interest. A fixed annual cycle is extracted from the original signal, using the “Census-I” method as described in Vantrepotte and Mélin (2009). The de-seasonalised time series is derived by subtracting the seasonal cycle from the original time series, and then fitted to a linear regression to obtain the linear trend. Source: CMEMS OMI (Ocean Monitoring Indicator) QUID (Quality Information Document) (Pardo et al., 2018).
On a regional scale, strong limitations regarding the consistency of the time series and trends derived are observed as illustrated for the Arctic in Fig. 3. Strong variations are also observed throughout the years. For instance, before 2002, only SeaWiFS is available, limiting the quality of the output data. Furthermore, the end of the MERIS lifetime and start of VIIRS SNPP in 2012 causes the same trend as described above.
It is known that both MODIS and VIIRS instruments have major calibration issues starting in about 2012. VIIRS-SNPP degradation was identified a few months after launch, and MODIS, while designed for a lifetime of 7 years, is still operating after 17 years. MODIS calibration has required regular modifications to adjust the temporal trends (R2009.1, R2010.0 and especially R2012.0). Since the end of 2017, a NASA reprocessing called R2018 has significantly alleviated VIIRS issues and, more importantly, has corrected the MODIS drift using a new procedure to regularly update the MODIS calibration (available about 3 months after acquisition).
It should be noted that this new NASA processing (called R2018.1) does not yet benefit the full OC-CCI series (only for the recent OC-CCI v3.1 extension until June 2018), but a new OC-CCI v4 release is scheduled for 2019.
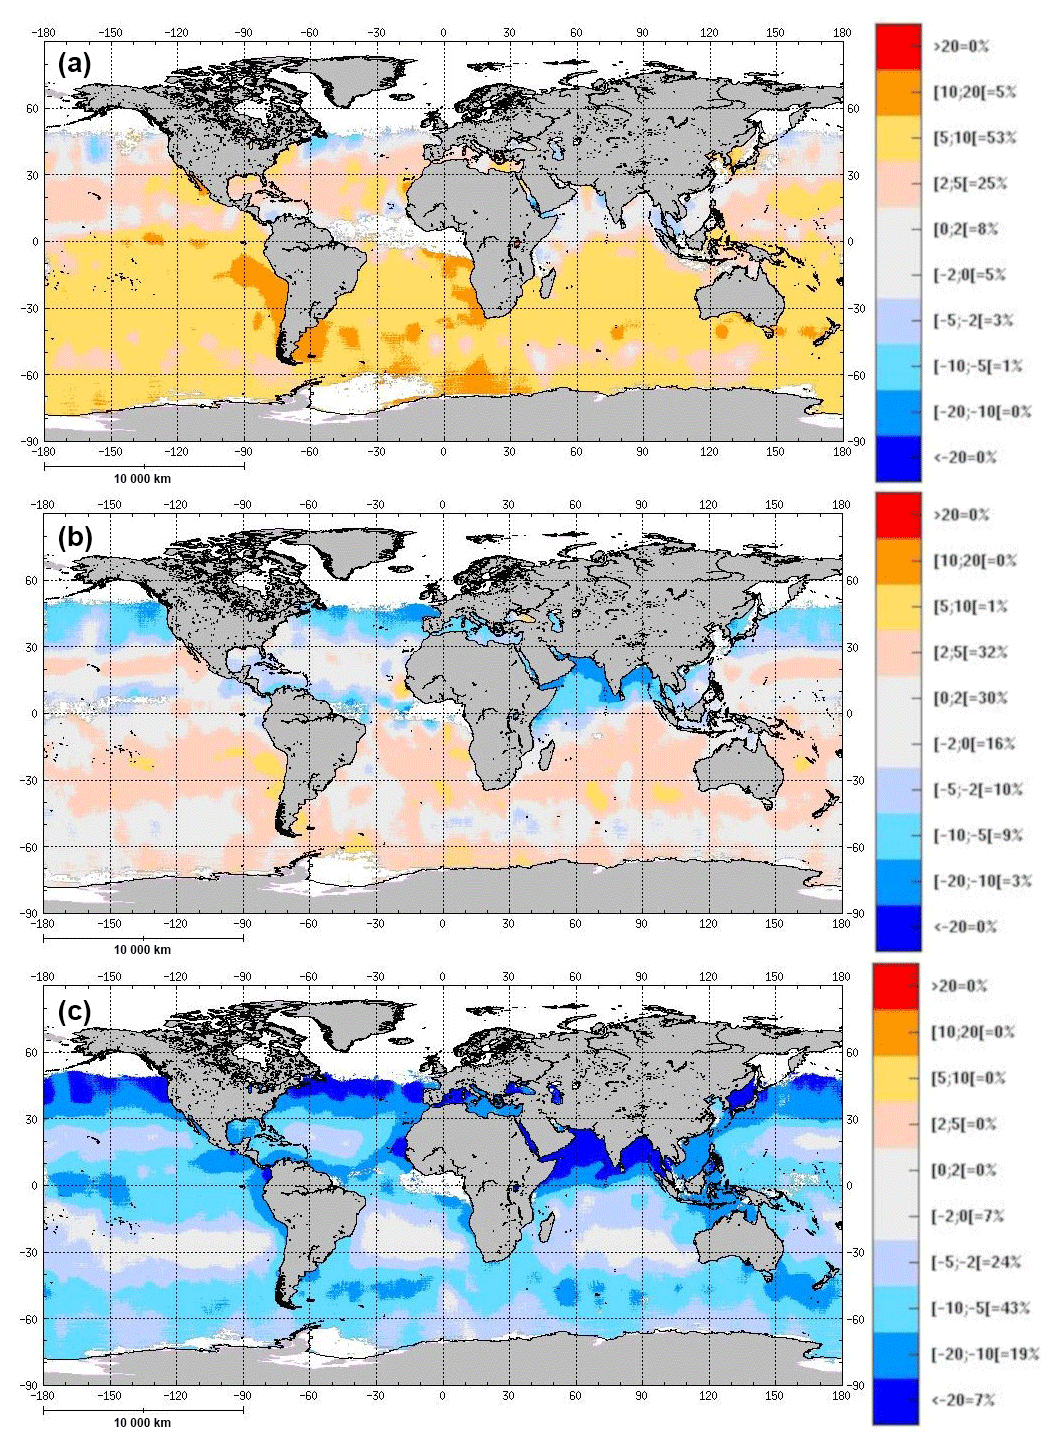
Figure 4Relative difference of VIIRS and MODIS at Rrs(443) (in percent) based on the monthly NASA R2018 global products at 4 km. VIIRS has suffered from a significant trend since its launch, as illustrated by the January monthly evolution for the years (a) 2012, (b) 2016 and (c) 2019.
It should also be mentioned that the R2018 data set still suffers from issues which will continue to impact future reprocessing attempts. Indeed, VIIRS Rrs(443) and Rrs(488) have increased regularly since 2012, whereas MODIS is comparatively more stable. Figure 4 shows the relative Rrs(443) difference between VIIRS and MODIS (in percent) based on the monthly NASA R2018 global products at 4 km. VIIRS has suffered from a significant drift since its launch, as illustrated by the January evolution for the years 2012, 2016 and 2019. In January 2012, 90 % of the MODIS pixels at global level were higher than VIIRS-SNPP, whereas in January 2019 100 % of the VIIRS-SNPP pixels were higher than MODIS.
Another major difficulty with merging RRS for the different sensors is that the observed bias varies according to the region and season considered, as previously shown by the artificial trends along the years.

Figure 5Relative difference between sensors [(S1 − S2) ∕ S2] regarding monthly RRS (June 2018), for (top) MODIS Rrs(667) and OLCI Rrs(665) and (bottom) VIIRS Rrs(671) and MODIS Rrs(667). Source: these plots are part of the monitoring carried out by the OCTAC and reported on http://octac.acri.fr.
Figure 5 shows the inter-comparison of RRS at about 670 nm between VIIRS-SNPP and OLCI-S3A compared with MODIS. It shows very important bias (e.g. 82 % of the OLCI pixels exceed a relative difference of 20 %), and in the case of MODIS, the equatorial zone shows different behaviour to the high latitudes.

Figure 6Inter-comparison of the (a) OC-CCI and (b) GlobColour products (13 June 2018) for oligotrophic water (CI algorithm). The colour scale ranges from 0.01 to 0.2 mg m−3: discontinuities between tracks of the sensor clearly appear at the top of the OC-CCI case.
The impact of such reflectance merging on chlorophyll a is shown in Fig. 6. For the year 2018, limitation is visible regarding the ability to handle clear water between tracks of the different sensors (the colour scale has been set to range from 0.01 to 0.2 mg m−3).
The previous illustrations demonstrate the limitation of the assumption of consistency along the OC-CCI time series (and on a daily basis in Fig. 6), but it is clear that the GlobColour products are also affected by the quality of input RRS upstream.
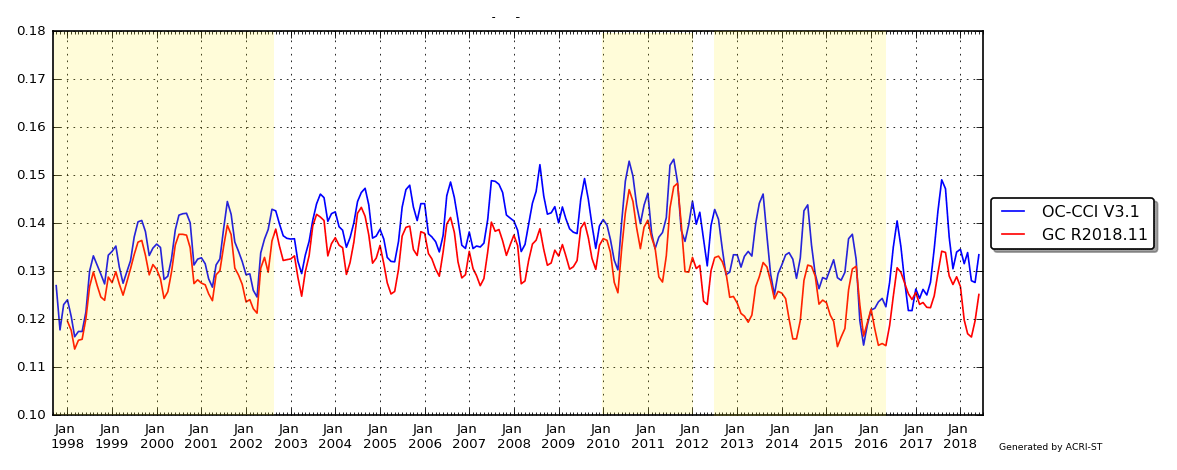
Figure 7Comparison of the global median chlorophyll a concentration as function of time for OC-CCI v3.1 (blue line) and GlobColour R2018.11 (red line) at the global level and for common pixels. The yellow shaded sections show the change of sensor combinations. The discontinuities and trends of the median with time should be interpreted carefully according the sensors used.
Figure 7 shows the month to month evolution of the chlorophyll a median concentration computed at the global level for OC-CCI and GlobColour products. To make the two data sets inter-comparable, monthly statistics are computed on common pixels. The yellow sections on the plot show the change of sensor combinations. Trends and gaps should be carefully interpreted according to the sensors used. The oscillations of the median through time are linked to the sensor coverage, which moves from north to south for high latitudes (due to the variation of the sun zenith angle which render measurements in winter unfeasible). At the beginning of SeaWiFS (September 1997 to mid-1998) data were only partially available, resulting in limited coverage. When MODIS and MERIS started providing data in 2002, the spatial coverage was improved. This means that the gap at this time does not correspond to a change in the continuity of the time series, but to a change in the spatial coverage of pixels used to compute the median. The higher values for OC-CCI are most likely linked to the NASA R2018 reprocessing that is used by GlobColour, but not yet by OC-CCI. During this R2018 reprocessing, MOBY (Marine Optical BuoY; in situ data) and SeaWiFS calibration were also improved with a resulting decrease in chlorophyll a of the order of 10 % for all sensors.
3.2 The chlorophyll a merging approach
The chlorophyll a merging approach is used by the GlobColour processor for the CMEMS products and is not designed to solve the issues linked to the upstream data. However, the sensor approach (instead starting from merged RRS) has crucial advantages compared with the previous approach:
-
When a new sensor (or a new reprocessing of an existing sensor) becomes available, limited effort is required with respect to bias correction because the bias correction is limited to the chlorophyll a field of the sensor considered. For the merged reflectance approach, the bias correction of five reflectance measurements and interpolations are required to simulate the 510 band (this band is not available for VIIRS-SNPP, VIIRS-JPPS1 or MODIS; see Table 1).
-
For the CI algorithm, the GlobColour processor benefits from the efforts of the space agencies with respect to adjusting the coefficients accounting for the high variability of the 670 band (Fig. 5) for each sensor.
-
It should be noted that the chlorophyll a algorithm is applied on the level 2 sensor grid, whereas in the merging approach it is applied on the common grid that is required to merge the reflectance. The use of the sensor level 2 grid guarantees that the algorithm is applied on reflectance with consistent time observations. Conversely, when reflectance is re-projected onto a common grid, it results in mixing pixels observed with an observation shift that can reach 4 h (see Table 1) in the case of MODIS and VIIRS-JPSS1). This consideration is of minor significance with respect to the global product that has a spatial resolution of 4 km but will become more significant when the product is provided at a resolution of 300 m.
3.3 The flagging approach
When compared to the official agencies' recommendations, the OC5 flagging strategy significantly improves the spatial coverage of the product, especially for NASA sensors. In the framework of CMEMS we estimated that at the sensor level the coverage is increased by a factor of 3.2 for VIIRS-NPP, 2.6 for MODIS Aqua, 1.6 for MERIS, 2 for SeaWiFS and 1.3 for OLCI-S3A.

Figure 8The chlorophyll a concentration (15 December 2017) for (a) the OC-CCI level 3 product and (b) the GlobColour product. The two initiatives used MODIS Aqua, and VIIRS-SNPP at this time, while OLCI-S3A was also used by GlobColour products.
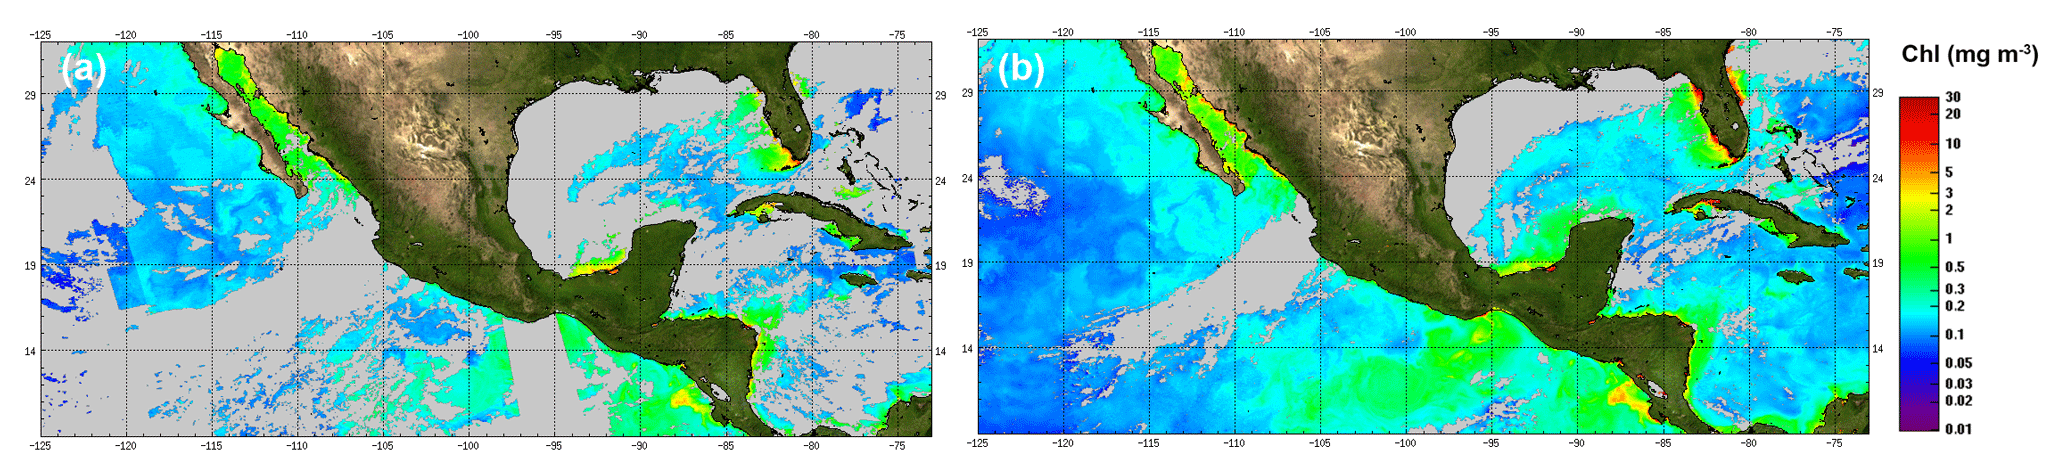
Figure 9The chlorophyll a concentration (15 December 2017) for (a) the OC-CCI level 3 product and (b) the GlobColour product.
Therefore, for the merged product, GlobColour chlorophyll a coverage is improved by a factor of 2.8 compared with OC-CCI. For the period from 2002 to 2012 the increase in coverage is limited to a factor of 1.5. Figures 8 and 9 show the result of the flagging strategy depending the OC-CCI or GlobColour approach.

Figure 10The chlorophyll a concentration (1 January 2012) for (a) the OC-CCI level 3 product and (b) the GlobColour product. The two initiatives used MODIS Aqua, MERIS and VIIRS-SNPP at this time.
Figure 10 shows that the combination of the usage of this flagging strategy and OLCI leads to a considerable improvement of the coverage without creating additional artefacts. Currently, both products benefit from the latest NASA R2018 reprocessing.
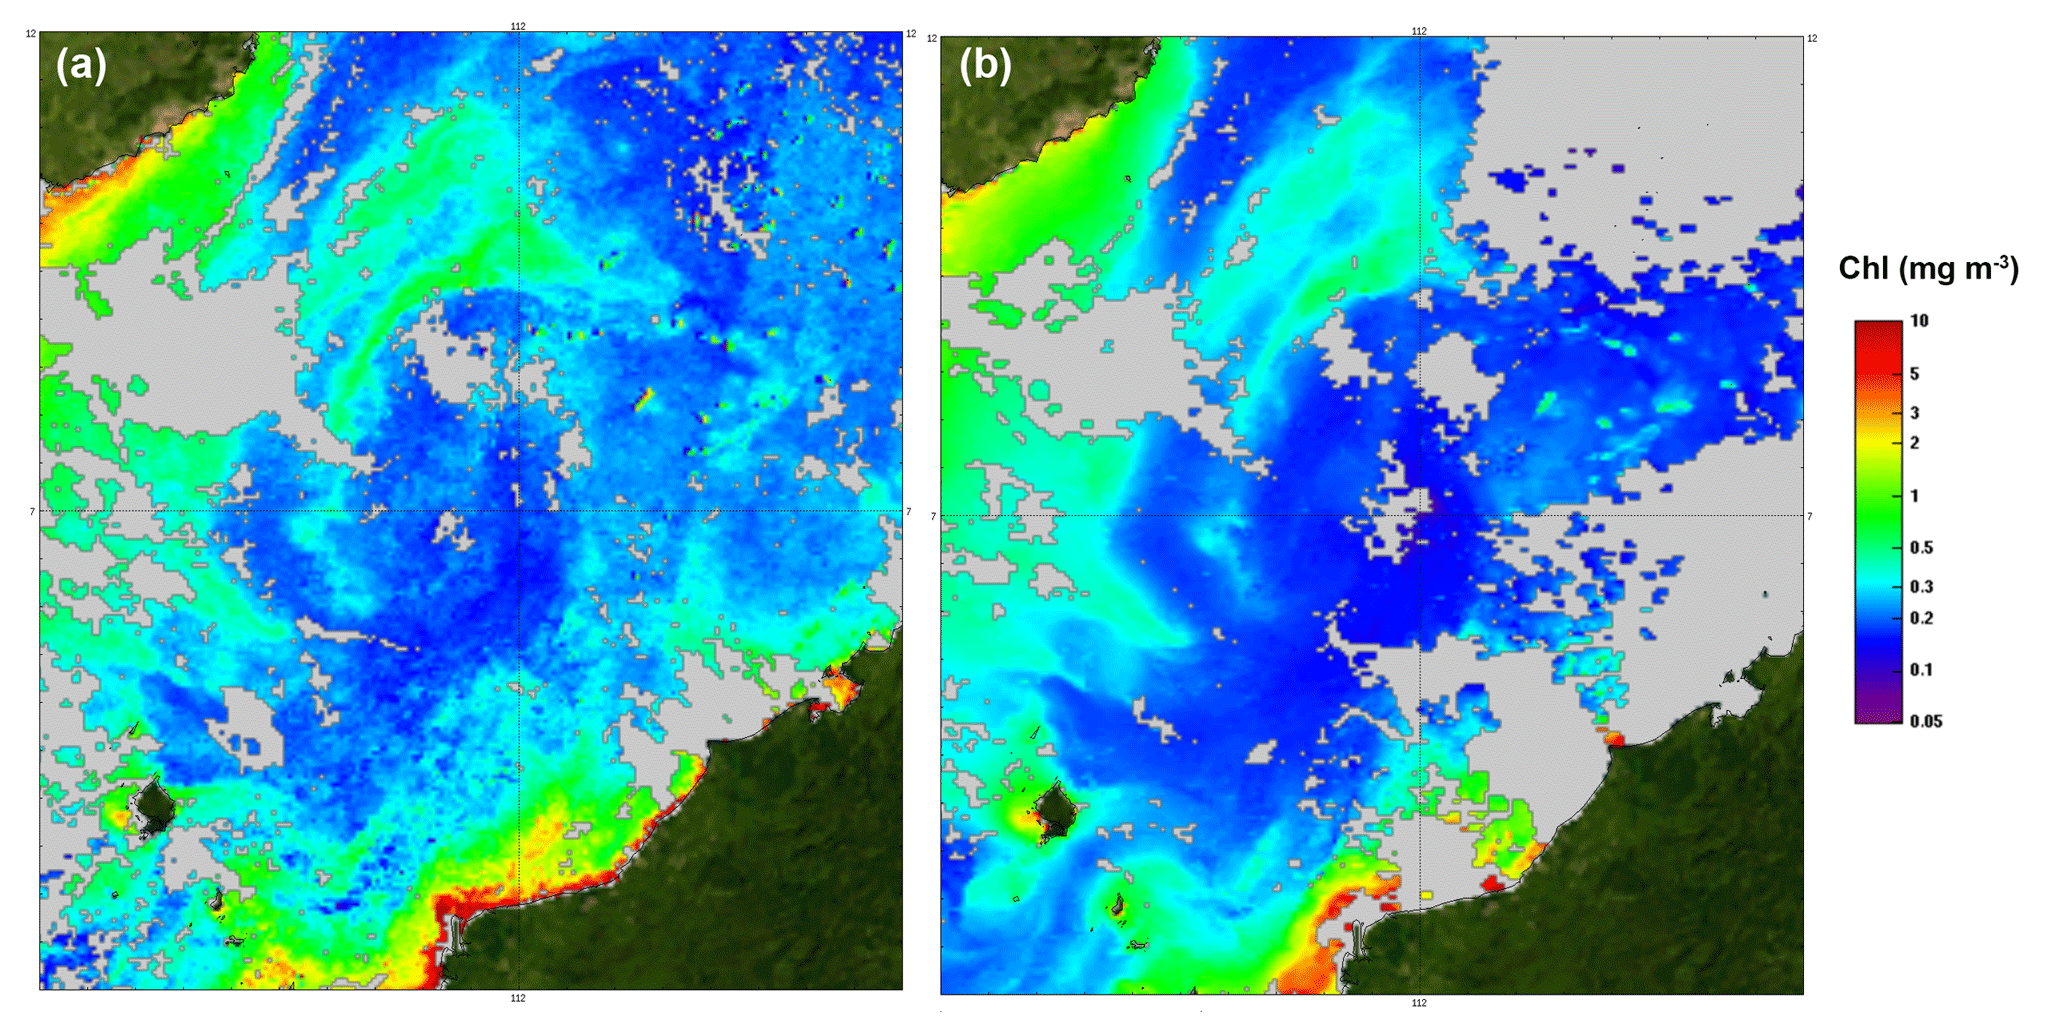
Figure 11The chlorophyll a concentration (1 January 2012) for (a) the OC-CCI level 3 product and (b) the GlobColour product.
Figure 11 shows that, in certain cases, the OC-CCI coverage may be better than the GlobColour coverage. However, in this example, the OC-CCI approach is affected by significant noise, potentially due to cloud contamination. This noise might be due to level 2 inputs. Indeed, while GlobColour uses the level 2 product from agencies, OC-CCI starts from level 1, and applies the POLYMER algorithm to MERIS and MODIS along with a specific flagging.
This work presents different ways to merge sensors and different flagging strategies to estimate the daily chlorophyll a field.
Compared with the chlorophyll a merging approach, the key advantage of the reflectance merging approach is that it provides a homogeneous data set of spectral reflectance that is useful when deriving the chlorophyll a product using a common algorithm. One could expect better consistency for the long time series. However, as illustrated above, this assumption is not correct as the homogeneity of the spectral reflectance is currently not obtained (spatial and temporal discontinuities exist).
It should be emphasised that this limitation also exists in the sensor chlorophyll a merging approach: in both approaches if a temporal trend is observed it should be carefully analysed.
The present findings highlight the advantage of a chlorophyll a per sensor merging approach compared with the reflectance merging approach:
-
The sensor merging approach facilitates the ingestion of a new sensor or a new reprocessing. Consequently, NASA R2018 and OLCI-S3A were successfully introduced in April 2018 for the merged chlorophyll a GlobColour chain but are not yet available in the other initiatives (OC-CCI or CMEMS regional product). The addition of VIIRS-NOOA20 (JPSS) and OLCI-S3B in the merged GlobColour chlorophyll a product will occur in July 2019.
-
It should be noted that the reflectance merging approach provides a limited set of six common spectral bands based on the SeaWiFS sensor. For more recent sensors (i.e. MODIS, VIIRS-SNPP and VIIRS-JPPS1) only five native reflectance bands are available (see Table 1): the band at 510 nm is obtained by interpolation. Other extra bands from MERIS, MODIS or OLCI that are not part of the six bands are not usable in the reflectance merging approach (because the spatial complementarity of the sensors cannot be used at a daily level and for the full time series). For the chlorophyll a merging approach, when extra bands are available (i.e. MERIS, MODIS and OLCI) they can be used to improve the algorithm in the future. This perspective has already been investigated to retrieve PFT (phytoplankton functional type) from OLCI (e.g. Xi et al., 2018).
-
The sensor approach provides an improved daily spatial coverage when OC5 is applied on the sensor reflectance (not on merged reflectance). For the period spanning from 2012 to the present the spatial coverage is improved by an important factor (of about 2.8) when compared with the OC-CCI product. Both open ocean and coastal areas are improved. This is required for many users involved in the EU Water Framework and Marine Strategy Framework Directive. To satisfy users interested in coastal data, a better spatial resolution (300 m) is also required. From this point of view the chlorophyll a merging approach is also more promising (the algorithm can be applied on the level 2 track grid to limit the mixing of the pixels).
A better spatial coverage is also a key point to help guarantee the quality of the CMEMS GlobColour chlorophyll a “cloud free” product (referred to as “daily L4” in the CMEMS catalogue) which is based on a spatial and temporal interpolation of the daily level 3 product. A better daily coverage limits the risk of artefacts due to interpolation.
The CMEMS GlobColour chlorophyll products are publicly available on the CMEMS web portal.
The GlobColour chlorophyll products are available
as daily, 8 d, monthly and daily filled (spatial and temporal interpolation)
products with a 4 km spatial resolution at the global level and a 1 km resolution for a European zone called “ATL”. Products are divided into two categories:
NRT (near-real-time) products covering about 1 year of data (extended on a daily basis); and REP (long-time series) products starting in 1997.
For NRT, the CMEMS catalogue references are as follows:
OCEANCOLOUR_GLO_CHL_L3_NRT_OBSERVATIONS_009 _032 (global and daily);
OCEANCOLOUR_GLO_CHL_L4_NRT_OBSERVATIONS_009 _033 (global, 8 d, monthly and daily-filled);
OCEANCOLOUR_ATL_CHL_L4_NRT_OBSERVATIONS_009 _037 (Atlantic and daily-filled).
For the REP the CMEMS catalogue references are as follows:
OCEANCOLOUR_GLO_CHL_L3_REP_OBSERVATIONS_009 _085 (global and daily);
OCEANCOLOUR_GLO_CHL_L4_REP_OBSERVATIONS_009 _082 (global, 8 d, monthly and daily-filled);
OCEANCOLOUR_ATL_CHL_L4_REP_OBSERVATIONS_009 _098 (Atlantic and daily-filled). Access to products is granted after free registration at http://marine.copernicus.eu/ (last access: 15 June 2019). Data can be accessed via different protocols (ftp, WMS and direct access with subsetting capabilities).
The co-authors are all from the ACRI-ST company and are all involved in the in the CMEMS project: PG is the technical manager concerning the delivery of the Copernicus-GlobColour products to CMEMS; AM is the product quality leader for the CMEMS OCTAC (Ocean Colour Theamtic Assembly Centre); MB is involved as a scientific expert; JD is the technician responsible of the Copernicus-GlobColour processor; and OFd'A is the director of the ACRI-ST company and is the OCTAC consortium leader for the ACRI-ST PU (production unit).
The authors declare that they have no conflict of interest.
This article is part of the special issue “The Copernicus Marine Environment Monitoring Service (CMEMS): scientific advances”. It is not associated with a conference.
We thank Emmanuel Boss and another anonymous referee for their constructive comments which allowed us to improve the quality of this paper.
This paper was edited by Pierre-Yves Le Traon and reviewed by Emmanuel Boss and one anonymous referee.
Aiken, J., Moore, G. F., Trees, C. C., Hooker, S. B., and Clark, D. K.: The SeaWiFS CZCS-type pigment algorithm, in: SeaWiFS Technical Report Series, edited by: Hooker, S. B. and Firestone, E. R., 29, Goddard Space Flight Center, Greenbelt, Maryland, USA, 38 pp., 1995.
Garnesson, P., Mangin, A., and Bretagnon, M.: Quality User Guide, Ocean Colour Production Centre, Satellite Observation GlobColour-Copernicus Products, available at: http://marine.copernicus.eu/services-portfolio/access-to-products/?option=com_csw&view=details&product_id=OCEANCOLOUR_GLO_CHL_L3_NRT_OBSERVATIONS_009_032, 15 January 2019.
Gohin, F., Druon, J. N., and Lampert, L.: A five channel chlorophyll concentration algorithm applied to SeaWiFS data processed by SeaDAS in coastal waters, Int. J. Remote Sens., 23, 1639–1661, 2002.
Hu, C., Lee, Z., and Franz, B.: Chlorophyll-a algorithms for oligotrophic oceans: A novel approach based on three-band reflectance difference, J. Geophys. Res.-Oceans, 117, C01011, https://doi.org/10.1029/2011JC007395, 2012.
Le Traon, P. Y., Antoine, D., Bentamy, A., Bonekamp, H., Breivik, L. A., Chapron, B., Corlett, G., Dibarboure, G., DiGiacomo, P., Donlon, C., and Faugère, Y.: Use of satellite observations for operational oceanography: recent achievements and future prospects, J. Oper. Oceanogr., 8, s12–s27, 2015.
Maritorena, S., d'Andon, O. H. F., Mangin, A., and Siegel, D. A.: Merged satellite ocean color data products using a bio-optical model: Characteristics, benefits and issues, Remote Sens. Environ., 114, 1791–1804, 2015.
Morel, A.: Optical properties of oceanic case 1 waters revisited, in: Ocean Optics XIII, International Society for Optics and Photonics, 2963, 108–115 1997.
Müller-Karger, F. E., McClain, C. R., Sambrotto, R. N., and Ray, G. C.: A comparison of ship and coastal zone color scanner mapped distribution of phytoplankton in the southeastern Bering Sea, J. Geophys. Res.-Oceans, 95, 11483–11499, 1990.
O'Reilly, J. E., Maritorena, S., Mitchell, B. G., Siegel, D. A., Carder, K. L., Garver, S. A., Kahru, M., and McClain, C.: Ocean color chlorophyll algorithms for SeaWiFS, J. Geophys. Res.-Oceans, 103, 24937–24953, 1998.
O'Reilly, J. E., Maritorena, S., Siegel, D. A., O'Brien, M. C., Toole, D., Mitchell, B. G., Kahru, M., Chavez, F. P., Strutton, P., Cota, G. F., Hooker, S. B., McClain, C. R., Carder, K. L., Mueller-Karger, F., Harding, L., Magnusson, A., Phinney, D., Moore, G. F., Aiken, J., Arrigo, K. R., Letelier, R., Culver, M., Hooker, S. B., and Firestone, E. R. (Eds.): Ocean color chlorophyll a algorithms for SeawiFS, OC2, and OC, 9–23, Version 4, NASA Technical Memorandum 2000-206892, vol. 20, NASA-GSFC, Greenbelt, Maryland, USA, 2000.
Pardo, S., Brando, V., and Taylor, B.: Quality Information Document (QUID) of Ocean Monitoring Indicators (OMI) for OC-TAC Release 1.0, available at: http://marine.copernicus.eu/science-learning/ocean-monitoring-indicators/catalogue (last access: 15 June 2019), 2018.
Sathyendranath, S., Grant, M., Brewin, R. J. W., Brockmann, C., Brotas, V., Chuprin, A., Doerffer, R., Dowell, M., Farman, A., Groom, S., Jackson, T., Krasemann, H., Lavender, S., Martinez Vicente, V., Mazeran, C., Mélin, F., Moore, T. S., Müller, D., Platt, T., Regner, P., Roy, S., Steinmetz, F., Swinton, J., Valente, A., Zühlke, M., Antoine, D., Arnone, R., Balch, W. M., Barker, K., Barlow, R., Bélanger, S., Berthon, J.-F., Beşiktepe, Ş., Brando, V. E., Canuti, E., Chavez, F., Claustre, H., Crout, R., Feldman, G., Franz, B., Frouin, R., García-Soto, C., Gibb, S. W., Gould, R., Hooker, S., Kahru, M., Klein, H., Kratzer, S., Loisel, H., McKee, D., Mitchell, B. G., Moisan, T., Muller-Karger, F., O'Dowd, L., Ondrusek, M., Poulton, A. J., Repecaud, M., Smyth, T., Sosik, H. M., Taberner, M., Twardowski, M., Voss, K., Werdell, J., Wernand, M., and Zibordi, G.: ESA Ocean Colour Climate Change Initiative (Ocean_Colour_cci): Version 3.1 Data, Centre for Environmental Data Analysis, https://doi.org/10.5285/9c334fbe6d424a708cf3c4cf0c6a53f5, 2018.
Saulquin, B., Gohin, F., and Fanton d'Andon, O.: Interpolated fields of satellite-derived multi-algorithm chlorophyll a estimates at global and European scales in the framework of the European Copernicus-Marine Environment Monitoring Service, J. Oper. Oceanogr., 12, 47–57, https://doi.org/10.1080/1755876X.2018.1552358, 2018.
Steinmetz, F., Deschamps, P.-Y., and Ramon, D.: Atmospheric correction in presence of sun glint: application to MERIS, Opt. Express, 19, 9783–9800, https://doi.org/10.1364/OE.19.009783, 2011.
Toole, D. A., Siegel, D. A., Menzies, D. W., Neumann, M. J., and Smith, R. C.: Remote-sensing reflectance determinations in the coastal ocean environment: impact of instrumental characteristics and environmental variability, Appl. Optics, 39, 456–469, 2000.
Vantrepotte, V. and Mélin, F.: Temporal variability of 10-year global SeaWiFS time-series of phytoplankton chlorophyll a concentration, ICES J. Mar. Sci., 66, 1547–1556, 2009.
Volpe, G., Colella, S., Brando, V. E., Forneris, V., La Padula, F., Di Cicco, A., Sammartino, M., Bracaglia, M., Artuso, F., and Santoleri, R.: Mediterranean ocean colour Level 3 operational multi-sensor processing, Ocean Sci., 15, 12700146, https://doi.org/10.5194/os-15-127-2019, 2019.
Xi, H., Losa, S. N., Mangin, A., Soppa, M. A., Garnesson, P., Demaria, J., d'Andon, O. H. F., and Bracher, A.: Global Retrieval Algorithms for Phytoplankton Functional Types (PFTs): toward the Applications to OLCI and GlobColour Merged Products, Ocean Optics Conference XXIV, Dubrovnik Croatia, 7 October 2018, hdl:10013/epic.e9a41e28-ef93-43bd-b20a-c613693bd5d8, 2018.