the Creative Commons Attribution 4.0 License.
the Creative Commons Attribution 4.0 License.
 | 14 Jan 2026
Compounded effects of long-term warming and the exceptional 2023 marine heatwave on North Atlantic coccolithophore bloom dynamics
Thibault Guinaldo
Griet Neukermans
The North Atlantic is undergoing rapid ecological evolution under the influence of both long-term warming and the increasing frequency of marine heatwaves. In 2023, the North Atlantic experienced record-breaking sea surface temperature anomalies, exceeding +5 °C regionally and lasting several months. Using 25 years of satellite-derived particulate inorganic carbon data (1998–2023), we assess the response of coccolithophore blooms across two biogeographical boundaries: the Celtic Sea and the Barents Sea. We show that the 2023 marine heatwave led to reduced bloom intensity and fragmentation in the Celtic Sea, while leading to record-high intensity and extent in the Barents Sea. These contrasting responses are modulated by long-term sea surface temperature trends, upper-ocean stratification, and polar front shifts. Our findings suggest a spatial shift of coccolithophore blooms with potential implications for the carbon cycle under long-term warming and stratification.
- Article
(8823 KB) - Full-text XML
- BibTeX
- EndNote


During boreal spring and summer, large parts of the North Atlantic Ocean are transformed into shades of color, indicating the occurrence of phytoplankton blooms. Among these, coccolithophores, particularly Gephyrocapsa huxleyi (Bendif et al., 2023) the most abundant species, form extensive summer blooms, which may weaken the ocean sink for atmospheric carbon dioxide as calcification releases CO2 and reduces seawater alkalinity (Shutler et al., 2010; Kondrik et al., 2018). During the decline phase of these blooms, the overproduction and detachment of calcite plates (coccoliths) color the surface waters a distinctive milky-turquoise, detectable by optical satellite sensors (Ackleson et al., 1988; Moore et al., 2012; Neukermans and Fournier, 2018). As photosynthetic organisms, coccolithophores contribute 1 %–10 % to global ocean primary production (Poulton et al., 2007) and about 50 % to the deep ocean flux of particulate inorganic carbon (PIC) contributing to both the organic carbon pump and the carbonate counter pump mechanisms (Neukermans et al., 2023). Finally, coccolithophores are a major producer of dimethylsulfide (Malin et al., 1993), that can promote the formation of marine clouds with important implications for climate regulation (Fiddes et al., 2018; Mahmood et al., 2019).
Optical satellite observations, available since the late 1970's, reveal a poleward expansion of G.huxleyi blooms (Winter et al., 2014), at a particularly rapid rate in the Barents Sea (Neukermans et al., 2018). This shift of G.huxleyi blooms may be driven by increased advection of water masses in which G.huxleyi is already established (Oziel et al., 2020), and/or by improved blooming conditions at higher latitudes, including increasing water temperatures (Winter et al., 2014; Beaugrand et al., 2013; Rivero-Calle et al., 2015; Neukermans et al., 2018), or increasing water column stratification giving competitive advantages for G.huxleyi (Neukermans et al., 2018).
Over the past 40 years, oceans have absorbed approximately 91 % of anthropogenic excess heat (von Schuckmann et al., 2023), leading to significant increases in ocean heat content (Li et al., 2023; Minière et al., 2023). Globally, sea surface temperatures (SST) have risen by an average of 1.0 °C between 1850–1900 and 2015–2024 (Forster et al., 2025). This long-term warming trend, combined with internal variability, results in anomalously high SSTs known as marine heatwaves (MHW, Hobday et al., 2016; Oliver et al., 2021). These events have become more frequent and intense, can extend vertically and increase environmental pressure on marine ecosystems altering trophic functions, thus leading to economic impacts (Smith et al., 2021, 2023). These effects are exacerbated by a combination of biogeochemical or atmospheric conditions known as compound events (Zscheischler et al., 2018; Burger et al., 2022; Le Grix et al., 2022) causing an irreversible state for marine communities (Santana-Falcón et al., 2023; Wernberg et al., 2025).
In recent years, the Atlantic Ocean has experienced unprecedented MHW, particularly affecting the Northwest European Shelf (Fig. 1a; Guinaldo et al., 2023; Simon et al., 2023). In 2023, a record-breaking MHW developed, resulting in SST anomalies exceeding +5 °C across broad areas of the shelf for 16 d in June (Berthou et al., 2024). In fact, the entire North Atlantic has reached record-level SSTs explained by anomalies in the air-sea heat fluxes, amplified by anthropogenically driven stratification of the upper ocean and shoaling of the mixed layer depth (MLD; Guinaldo et al., 2025; England et al., 2025).
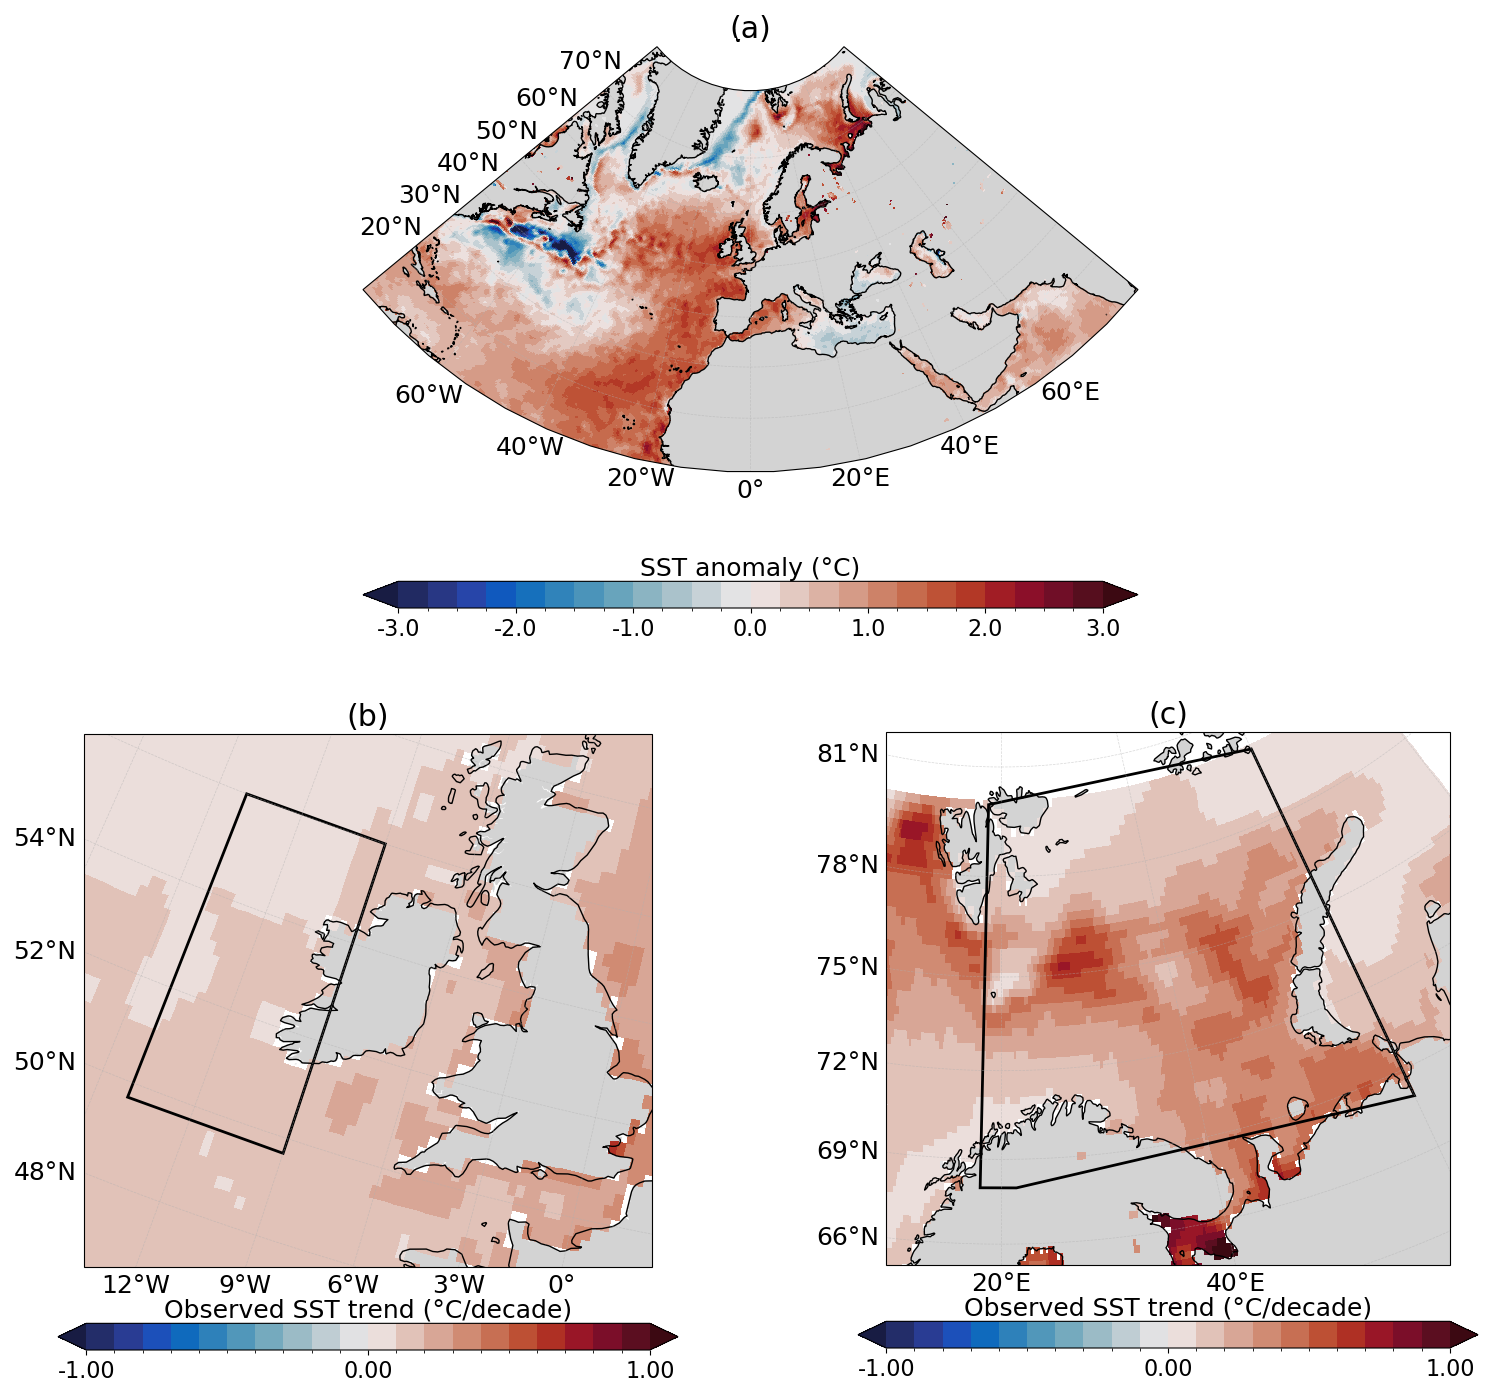
Figure 1Maps of SST anomalies for May–June 2023 in the North Atlantic and SSTs trends over the study sites. (a) May–June averaged SSTs anomalies compared to the corresponding 1991–2020 period. Observed SST linear trend expressed in Celsius degrees by decade, computed from OSTIA over the period 1958–2023 for (b) the Celtic Sea and (c) the Barents Sea. Black boxes indicated the study sites chosen.
Several studies have assessed the causes of MHW and their impacts on phytoplankton communities based on chlorophyll-a measurements (Sen Gupta et al., 2020; Capotondi et al., 2024) and some have documented impacts of MHWs on phytoplankton blooms using remotely sensed chlorophyll-a observations (Cheung and Frölicher, 2020; Arteaga and Rousseaux, 2023; Cyr et al., 2024). In this study, we investigate how the 2023 MHW impacted coccolithophore bloom dynamics across the North Atlantic Ocean, using remotely sensed PIC observations. We focus on two biogeographical limits, the Celtic Sea and the Barents Sea, respectively representing the trailing (or equatorward) edge and the leading (or poleward) edge of G.huxleyi bloom distribution in the North Atlantic Ocean (Winter et al., 2014). Using 25 years of ocean-color satellite data (1998–2023), we assess changes in the phenology of G.huxleyi blooms, as well as spatial extent, and contextualise them within long-term trends.
2.1 Environmental conditions
To evaluate the impact of MHW on G.huxleyi blooms, we examine impacts on the three most influential environmental variables that characterize the ecological niches of coccolithophore species, namely SST, photosynthetically active radiation (PAR), and the depth of the mixed layer (MLD), an indicator for the water column stratification (see Appendix A1.4; O'Brien et al., 2016). For G.huxleyi, the optimal SST range was found to be between 6 and 16 °C, optimal PAR between 35 and 42 Einstein m−2 d−1, and optimal MLD between 20 and 30 m (O'Brien, 2015). These ranges were extracted from the realized ecological niche of G.huxleyi (i.e. the environmental conditions under which it can be observed) set up by O'Brien (2015), based on a global compilation of in situ measurements of coccolithophore species abundance and diversity (O'Brien et al., 2013).
In 2023, both the CS and BS experienced exceptional MHWs beginning in spring (Fig. 2a–b). Annual mean SST anomalies reached +0.67 °C in the CS, peaking in June, and +0.92 °C in the BS, peaking in August. Maximum daily SST anomalies reached +3.9 °C (corresponding to 17 °C) in CS and +3.3 °C (corresponding to 8.8 °C) in BS with warmer SSTs locally.
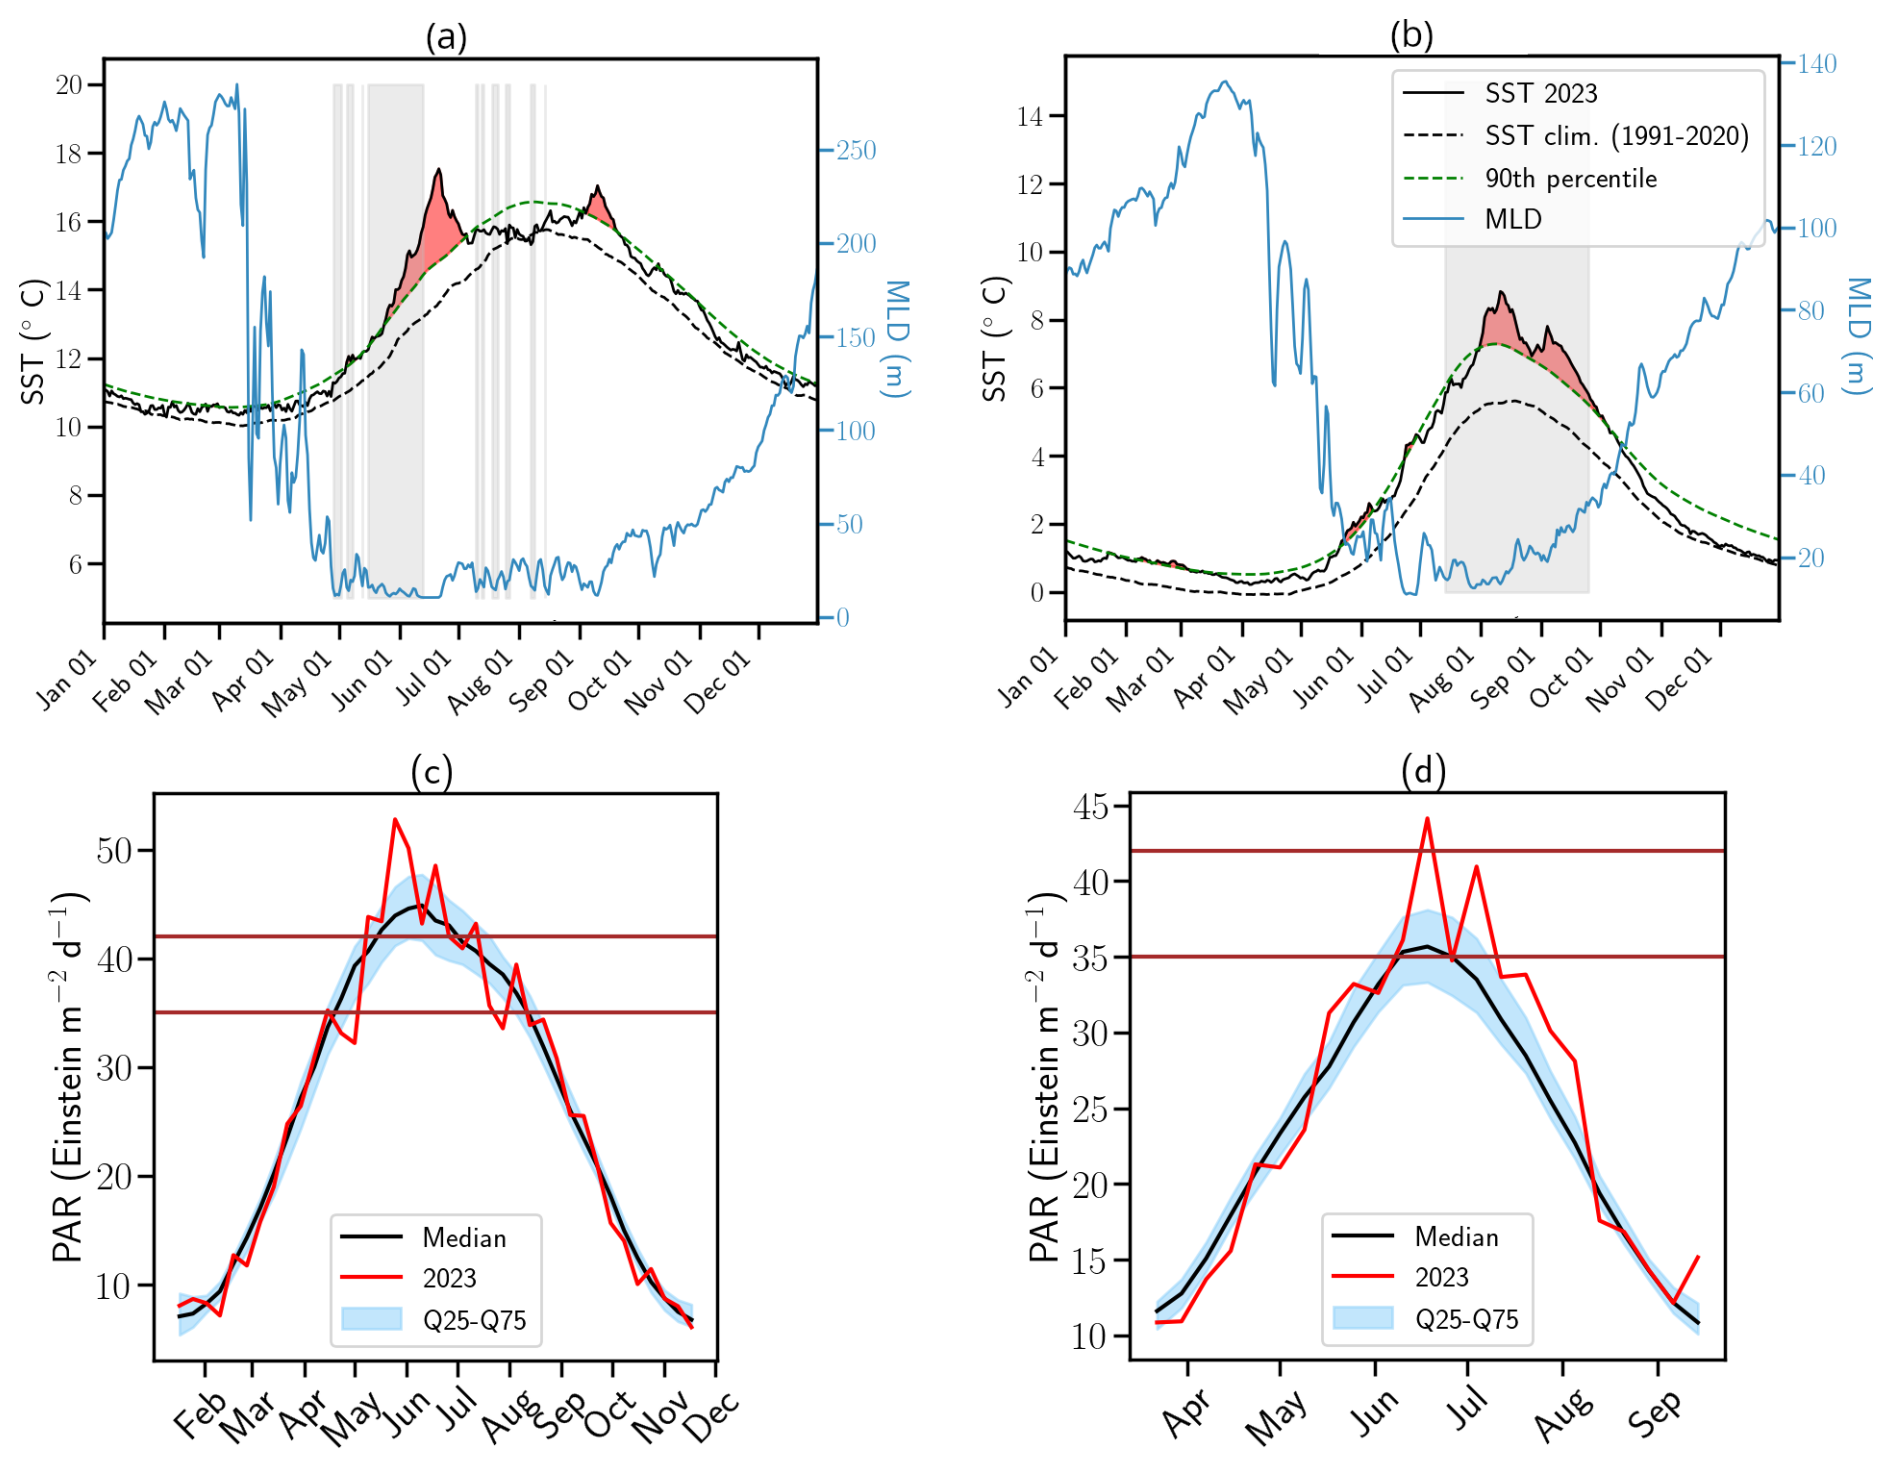
Figure 2Daily spatially averaged SST, MLD and PAR variables for 2023. Spatially averaged SST (black solid line) and MLD (blue solid line) anomalies for 2023 in (a) the Celtic Sea and (b) the Barents Sea. The black dashed line represents the climatological SST averaged over each basin for the period 1991–2020, while the green dashed line marks the 90th percentile threshold for MHWs, as defined by Hobday et al. (2016). Red shading indicates periods of MHWs, while grey shading highlights conditions favorable to G.huxleyi blooms based on optimal ranges for SST and MLD in the species' realized ecological niche (see Appendix A1.4; O'Brien, 2015). Spatially averaged PAR for 2023 in (c) the Celtic Sea and (d) the Barents Sea. The vertical brown lines inform on the optimal range for G.huxleyi blooms (see Appendix A1.4).
These MHWs were exceptional in both intensity and duration, lasting 82 d in the CS and 120 d in the BS. These events were boosted by the long-term warming trend, particularly in the BS, where the trend is more than twice the global average (Fig. 1c).
Likewise, PAR in CS was strong in May–June with values surpassing 42 Einstein m−2 d−1 (upper-range of the optimal conditions for G.huxleyi (see Appendix A1.4 and O'Brien, 2015) with conditions becoming more favorable in July later (Fig. 2c). These variations are primarily influenced by the atmospheric conditions. In June, a persistent high-pressure system over Fennoscandia (Fig. A1 in the Appendix) led to exceptionally weak wind conditions (Fig. A2) and low cloud cover (Fig. A3) but increased toward climatological values later. In BS, PAR was exceptionally high compared to the summer climatology allowing sufficient sunlight to reach the surface ocean for photosynthesis throughout summer (Fig. 2d). These results are influenced by the cloud cover over BS where a large portion of the sea experienced significant clear-sky conditions during summer (Fig. A3).
In 2023, MLD dynamics followed the usual seasonal cycle in both basins, with winter deepening and summer shoaling, modulated by atmospheric conditions (de Boyer Montégut et al., 2004, Fig. 2a–b). In winter, the atmospheric circulation patterns associated with a positive phase of the North Atlantic Oscillation (NAO) correspond to a basin-wide configuration that enhances storm activity and westerlies, thereby influencing vertical turbulent mixing (Hurrell et al., 2003). Even at the northern edge of the North Atlantic, the BS atmospheric and oceanic internal variability responds to the circulation anomalies linked to both positive and negative NAO phases (Levitus et al., 2009; Chafik et al., 2015). In contrast, summer conditions favor the likelihood of high-pressure blocking systems over northern Europe (Rantanen et al., 2022; Rousi et al., 2022), characterized by weak winds and high solar radiation (Figs. A1, A2, and A3). These favour upper-ocean warming, weak winds and shallow MLD, leading to MHW development (Holbrook et al., 2020). This relationship is particularly visible in CS during June where the upper-ocean remained stratified in response to persistent high-pressure systems (Fig. A1).
In the CS, SSTs remained around 13 °C from May to mid-June, in the optimal thermal range for G.huxleyi blooms (6–16 °C, see Appendix A1.4 and Fig. 2a). However, from June onwards SSTs frequently exceeded 16 °C, with localized peaks over 20 °C at the peak of the MHW (Berthou et al., 2024). This period was followed by a temporary deepening of the MLD greater than 40 m due to the return of westerly winds in July and August (Fig. A2). A second MHW developed in September associated with the return of both SST and MLD (<40 m) to favorable bloom conditions.
Conversely, the BS exhibited less temporal variability throughout summer and maintained temperature within the 6–16 °C range (summer mean: 6.8 °C) and exhibited persistent shallow MLD (summer mean: 18 m) consistent with weaker than normal or close to normal winds (Fig. A2), providing sustained conditions favorable for bloom development from July to early October (Fig. 2b, see Appendix A1.4).
2.2 Bloom dynamics and characteristics
Satellite-derived PIC time series revealed contrasting bloom variations reflecting the SST and MLD conditions in both basins. In the CS, the bloom followed a typical seasonal evolution, intensifying from April, peaking in June at 0.30 mmol m−3 (below the climatological median of 0.43 mmol m−3; Fig. 3a), and ending early July. An unusual secondary bloom emerged in August–September, coinciding with positive SST anomalies and reached 0.38 mmol m−3, above the climatological Q75 (0.24 mmol m−3, Fig. 3a). While late-summer and autumn blooms have been observed historically (September maximum over the 1997–2022 period: 0.61 mmol m−3, Fig. 3a), the 2023 event exceeded the interquartile climatological range. The 2023 mean bloom surface extent in the CS reached a record 46 460 km2 (Fig. 3c), representing a 30 % increase over the previous record (2007) and an 85 % increase relative to the 1998–2021 mean. However, the maximum extent (126 163 km2) remained close to the 1998–2010 mean (126 345 km2) suggesting persistent but unevenly distributed blooms across the CS (Fig. A4). These levels were anomalously high in 2022 and 2023 (mean surface extent anomaly: 25 551 km2; maximum surface extent anomaly: 25 864 km2) and showed a significant correlation with spring–summer SSTs. Correlation coefficients reached 0.76 and 0.70 for mean and maximum surface extent, respectively, in relation to May–June SSTs, and 0.98 and 0.77 for mean and maximum surface extent, respectively, in relation to July–August–September SSTs (all p-value < 0.01). These strong correlations are consistent with the multi-year trend of increasing spring–summer SSTs (Figs. 3e and A5a). The significant correlation between summer SST and bloom extent suggests an important role for sustained surface warming in modulating bloom dynamics in this region.
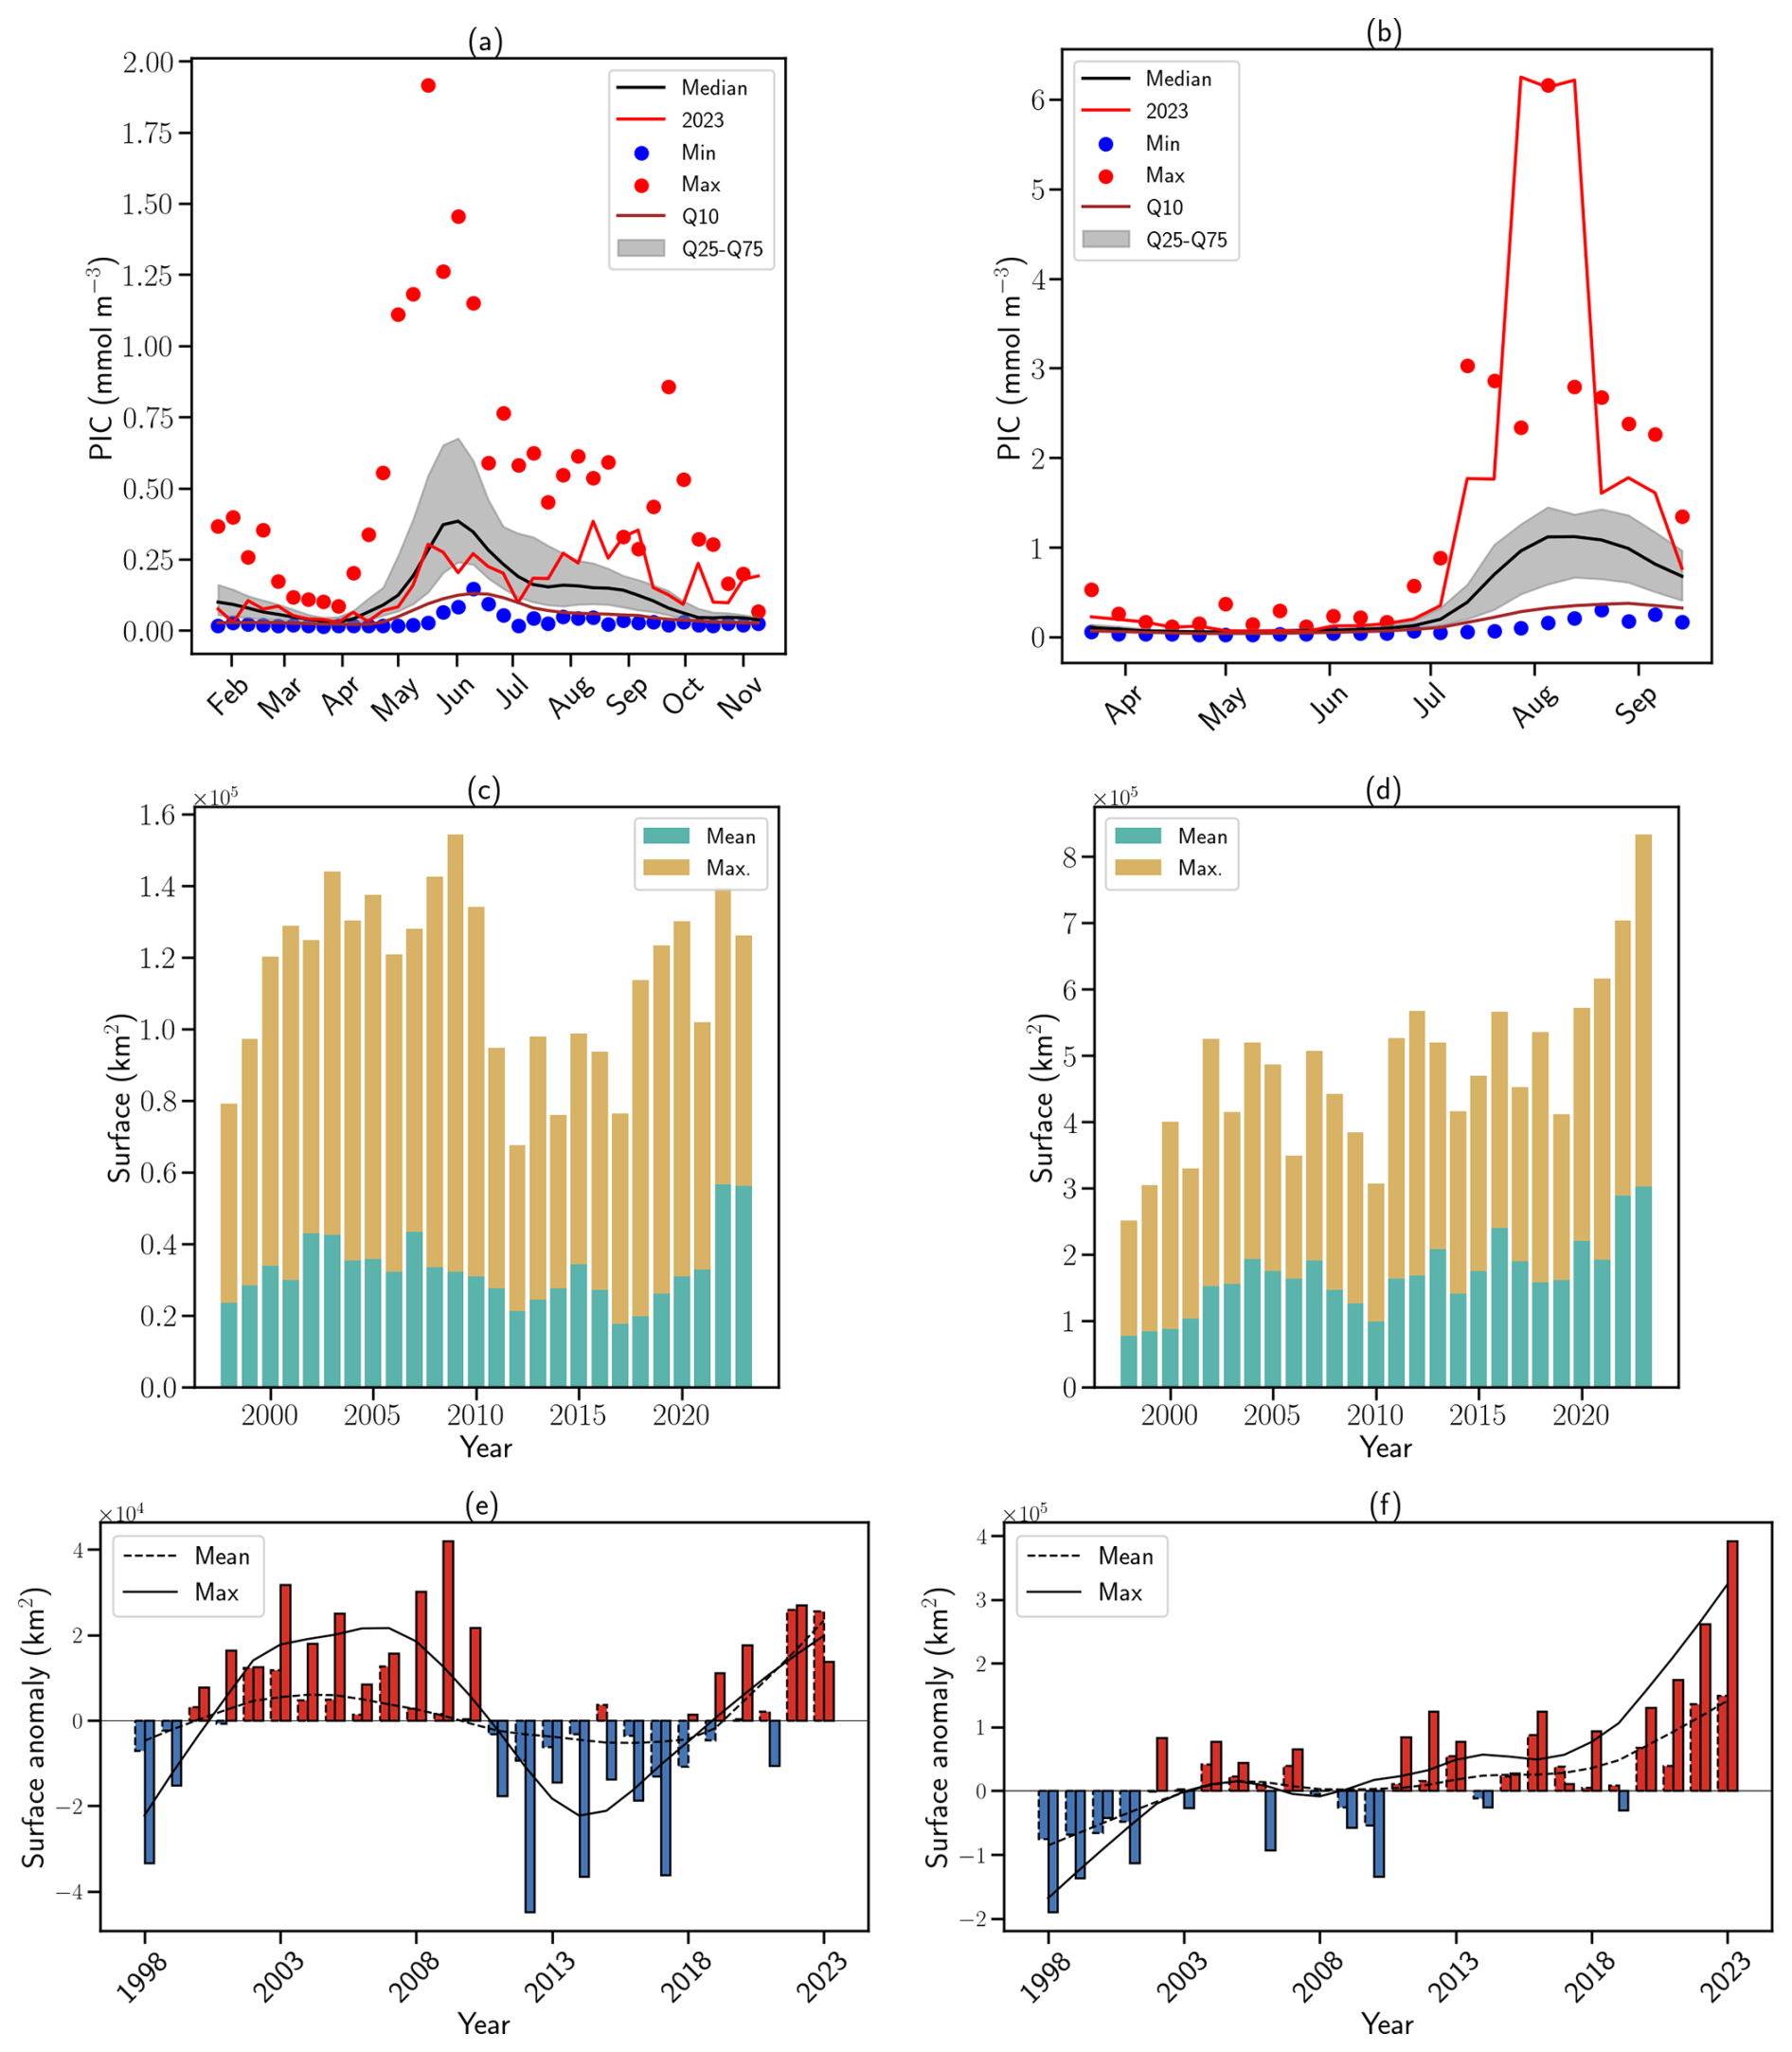
Figure 3G.huxleyi bloom phenology and surface extent in the Celtic and Barents Seas over the satellite record (1998–2023). Seasonality in satellite-derived PIC concentration in 2023 (red line) compared to the 1998–2020 climatology (black line) in the (a) Celtic Sea and (b) the Barents Sea. Blue (resp. red) dots indicate minimum (resp. maximum) PIC concentration in the 1997–2022 climatology. Grey shading represents the 25–75 interquantile range. Brown lines represent the 10th percentile. Maximal (yellow bars) and mean (green bars) bloom spatial extent in the (c) CS and (d) BS. Corresponding surface extent anomalies (seasonal mean are in solid contour and seasonal maximum in dashed contour) for (e) CS and (f) BS. Anomalies are computed relatively to the 1998–2018 climatological period. Red bars indicate positive anomalies, while blue bars indicate negative anomalies. The lines indicate the corresponding 10-year LOESS trend.
In the BS, an exceptional summer bloom in 2023 peaked at 6.25 mmol m−3 (much higher than the climatological median value of 1.15 mmol m−3, Fig. 3b), reaching values similar to the previous record set in 2022 (6.16 mmol m−3). The 2023 bloom occurred simultaneously with the development of the MHW in June, providing SST and MLD conditions ideal for blooms (see Appendix A1.4 and Sect. 2.1). The bloom extent reached record highs of 833 561 km2 in 2023; much higher than the mean value of 164 188 km2 and 18 % higher than the previous record of 703 174 km2 set in 2022 (Fig. 3d). This reflects a northeastward expansion of coccolithophores in the BS linked to the shifting Polar Front (Figs. A6 and A7, Neukermans et al., 2018; Oziel et al., 2020), with blooms covering 59 % of the basin in 2023, a new record for expansion. Over the past 25 years, Locally Estimated Scatterplot Smoothing regression (LOESS, Cleveland, 1979) reveals significant positive trends in bloom extent: 3137 km2 yr−1 for the mean and 12 346 km2 yr−1 of the maximum spatial (p-value < 0.01) with a record maximum area exceeding by 392 000 km2 the climatological value (Fig. 3f).
In the BS, the increase in bloom extent was also strongly and significantly correlated with summer SSTs (Fig. A5b), with correlation coefficients of 0.95 and 0.96 for mean and maximum surface extent, respectively, in relation to July–August–September SSTs (all p-value < 0.01). This highlights the role of warming in driving these changes. Two distinct processes contribute to this warming: long-term ocean temperature increase, especially pronounced at high latitudes, and the enhanced influence/inflow of Atlantic Water, commonly referred to as “atlantification” (Årthun et al., 2012; Polyakov et al., 2017). In the BS, atlantification encompasses not only a northward shift of the Polar Front, but also the progressive warming, increase of salinity, loss of winter sea ice, and modification of stratification conditions of waters. While these changes are strongest south of the front, modified Atlantic water increasingly reaches the northern, traditionally Arctic domain, particularly during ice-free winters (Årthun et al., 2012). To disentangle these contributions, we tracked the annual position of the Polar Front (Fig. A7a, Neukermans et al., 2018). While the mean position of the front has shifted approximately 95 km northward since the early 2000s (Fig. A7b), its position has stabilized over the past two years following a strong southward shift from 2016 to 2020, with extension occurring primarily toward the east rather than the north (Figs. A6 and A7a). In parallel, ocean warming continued, with a long-term trend of +0.26 °C per decade (Figs. 1c and A5b). The 2023 MHW further amplified this trend, producing localized SST anomalies across the BS basin and leading to one of the warmest boreal summer anomalies in the Barents Sea (Fig. A5b). A significant correlation between bloom surface extent and SSTs confirms the influence of gradual warming and interannual variability on coccolithophore proliferation. However, the polar front is only a proxy of the process of atlantification with weak correlation between the position of the thermal front and the leading edge of coccolithophore bloom distribution (western basin: 0.45, p-value < 0.05; eastern basin: 0.35, p-value = 0.07; Fig. A8) suggesting an important role for SST which should exceed the 6 °C limit for G.huxleyi to proliferate.
2.3 G.huxleyi bloom trends in the satellite era (1998–2023)
Basin-averaged analysis can disregard spatial features such as the repartition and the evolution of blooms across each basin. Here, we focus on the spatial features of the blooms. In the CS, no significant trend in summer PIC maxima was detected (Fig. A9a). In contrast, the BS exhibited a northeastward shift in summer maximum concentrations (Figs. A6 and A8). While the western BS shows limited front variability and no consistent trend, the eastern BS is characterized by high interannual variability and a long-term northward shift of 300 km for the northernmost position of the bloom and an eastward shift of 155 km for the latitudinal mean position of the bloom. Even though the latitudinal mean front position has regressed since 2016, a value close to the maximum reached in 2023 (Fig. A8), exhibiting a spike in the northward maximal expansion in 2022 and 2023 (Fig. A6). This spatial reorganization of phytoplankton distribution in the Barents Sea has been associated with atlantification, which in turn enhances G.huxleyi blooms through bio-advection (Oziel et al., 2017). However, this phenomenon does not fully explain the exceptional bloom observed in 2023 even if the interannual variability in the position of the polar front is accompanied by shifts in PIC maxima (e.g. 2004, 2010; Figs. A6, A7, and A9b).
Phenological analysis reveals contrasting bloom dynamics in the two regions. In the CS, bloom timing, duration and intensity exhibited interannual variability (Fig. 4a). On average, blooms last 90 d, ranging from 21 to 200 d with onset typically in mid-April and decline by mid-July. For the last three years (2021–2023), bloom duration increased by 130 % relative to the 1998–2020 mean (Fig. 4a), reflecting a shift in seasonal conditions due to recurrent late-summer warming (Fig. A5a). However, average peak PIC concentration declined by 20 % during the last three years compared to the 1998–2020 period (2021–2023 average compared to the 1998–2020: 1.4 mmol m−3). This recent decline results in a non-significant negative trend in bloom intensity over the 25-year period (−0.03 mmol m−3 yr−1, p-value = 0.07; Fig. A9a).
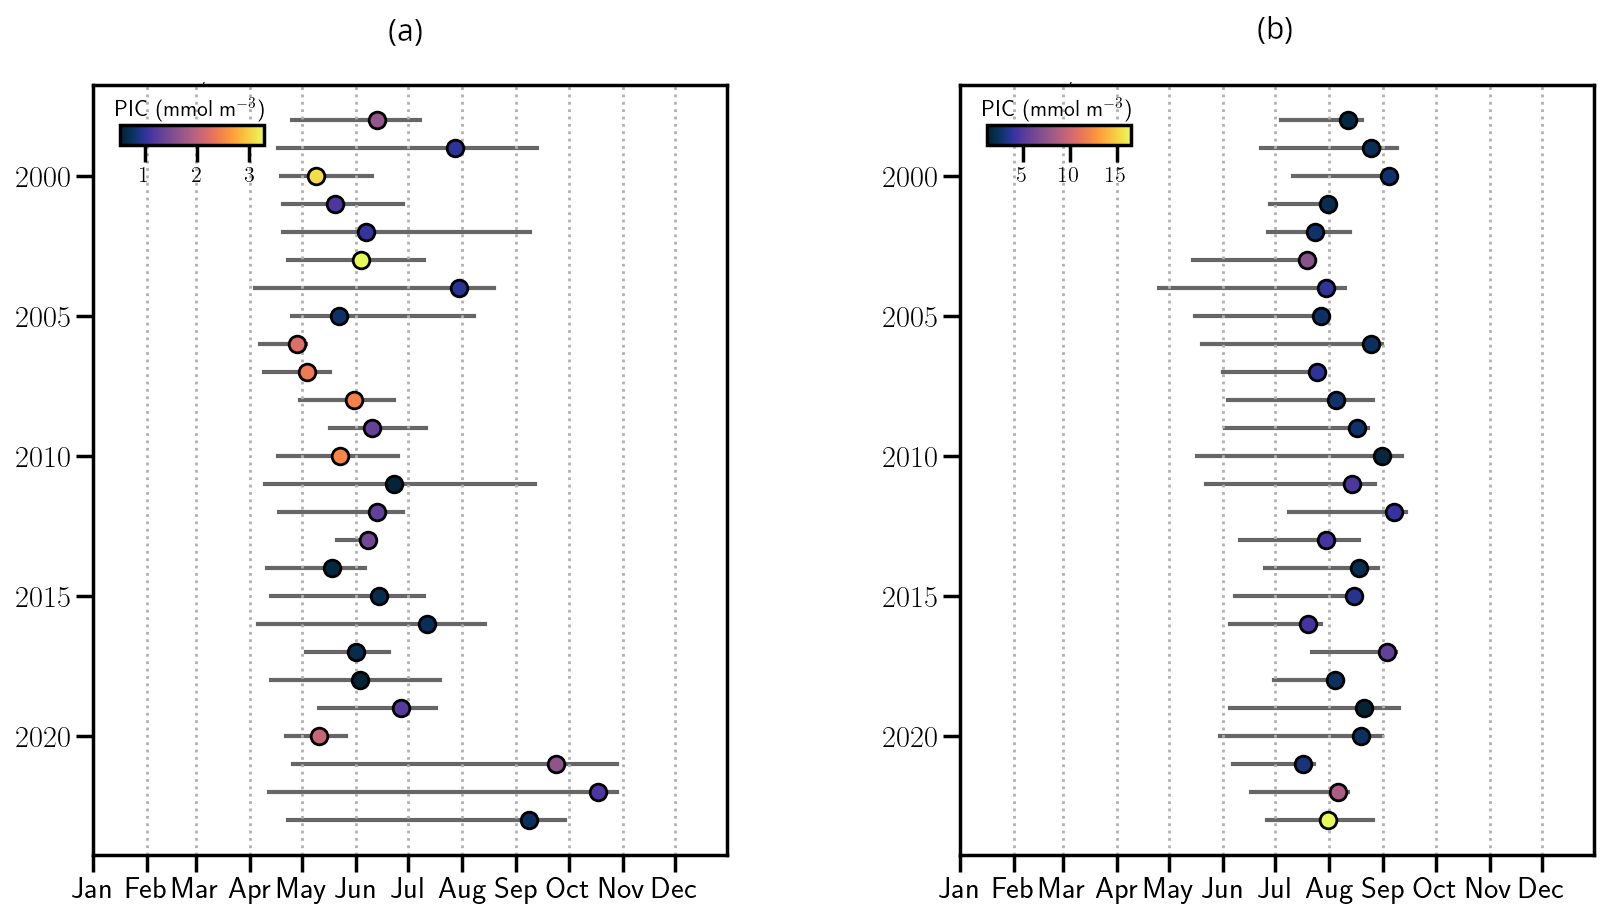
Figure 4Phenology of coccolithophore blooms in the North-eastern Atlantic ocean (1998–2023). Start and end dates of blooms with maximum PIC, colored by peak PIC concentration (mmol m−3) in the (a) CS and (b) the BS.
In contrast, the BS exhibited more consistent bloom timing, with mean bloom duration of 70 d [35–118], beginning in mid-June and ending in mid-August (Fig. 4b), reflecting a shorter seasonal window for bloom. No temporal trend in bloom timing was detected between 1998 and 2023. However, bloom intensity increased significantly in recent years. A new record daily PIC value of 16.5 mmol m−3 was observed in 2023, nearly double the previous record set in 2022 (8.6 mmol m−3). The mean peak intensity over 2021–2023 reached 12.5 mmol m−3, compared to the 3.2 mmol m−3 over 1998–2020. This surge resulted in a significant positive trend in bloom intensity (0.17 mmol m−3 yr−1, p<0.05, Fig. A9a).
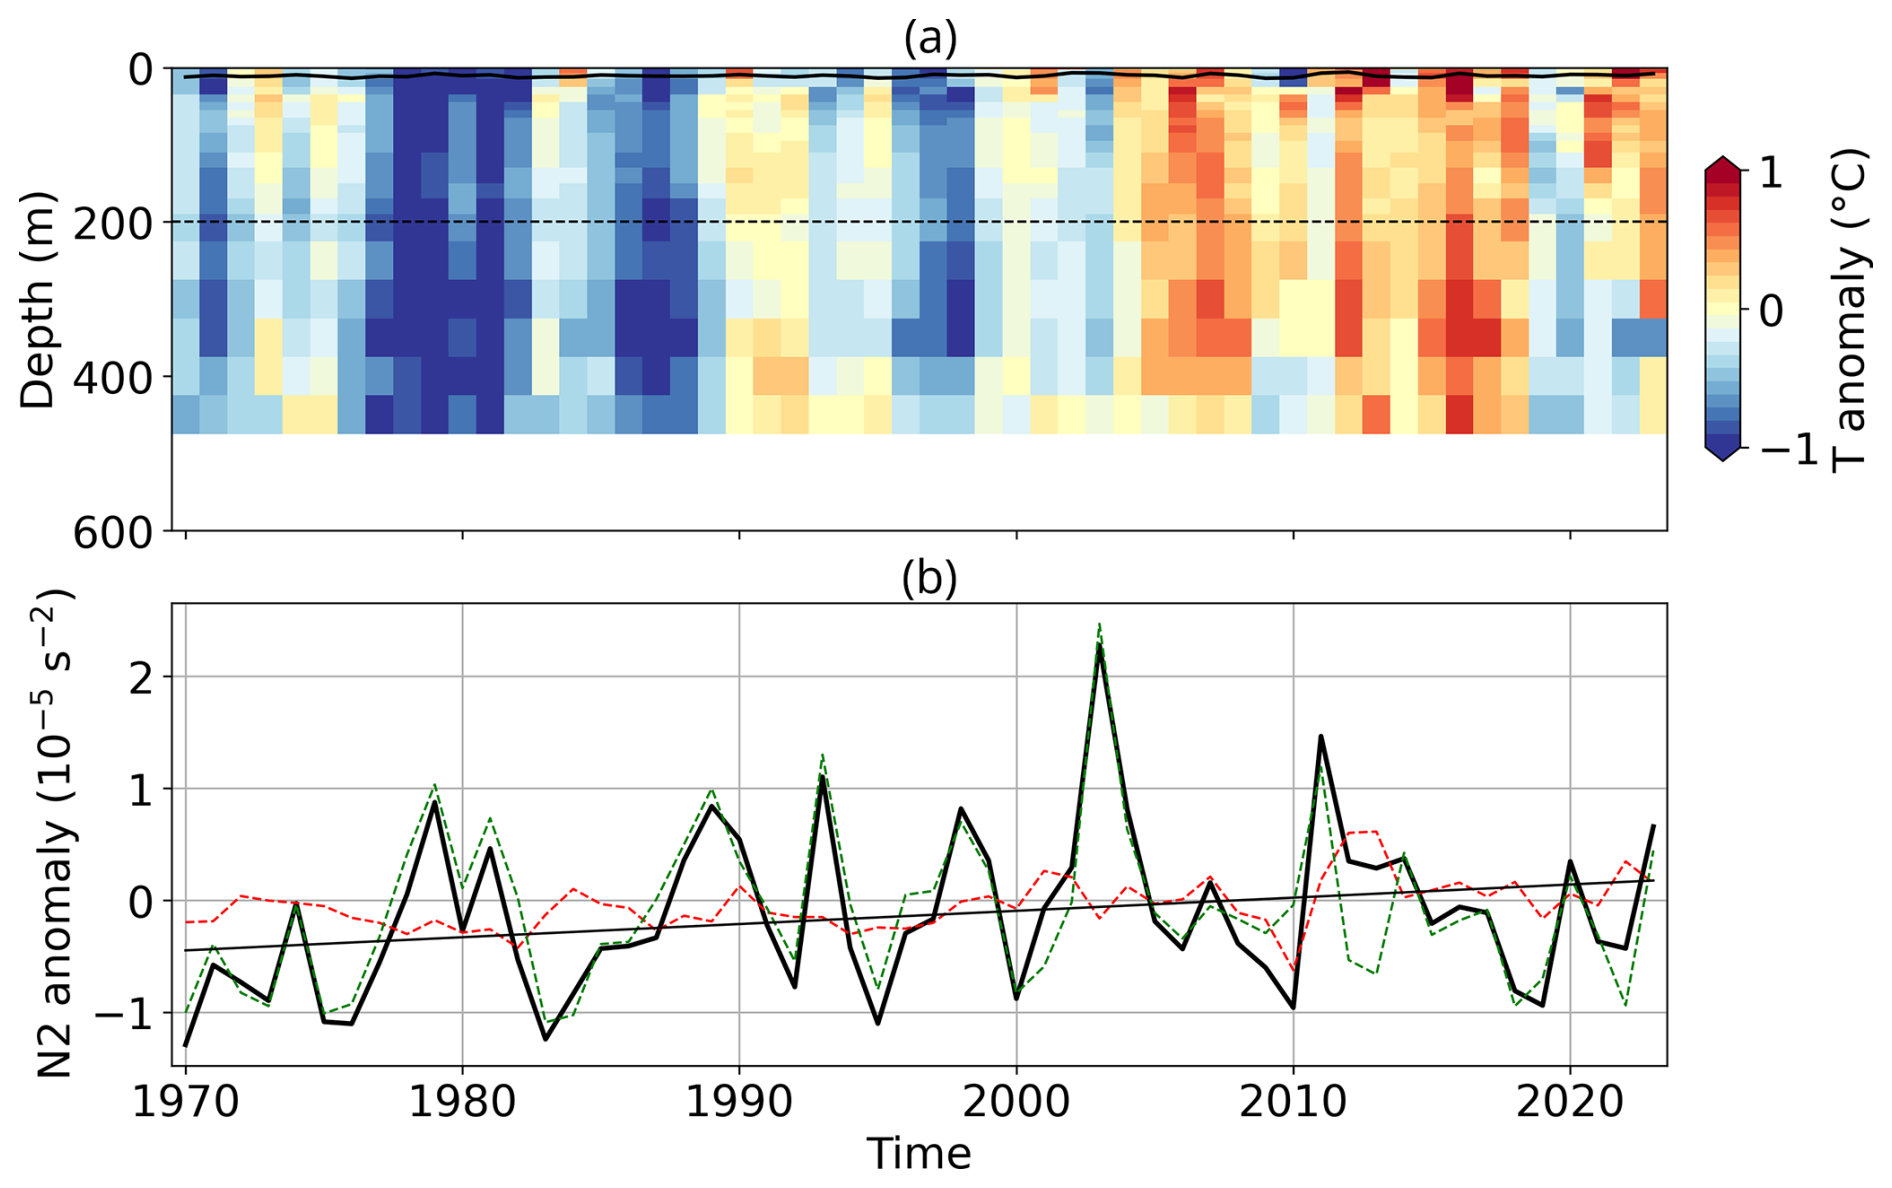
Bloom development also depends on upper-ocean stratification, which relates to nutrient and light availability, as well as mixing. Both the CS and BS exhibit long-term trends toward stronger stratification (Figs. A10 and A11). In the CS, this trend is driven by temperature (Fig. A10), while in the BS, the trend is mostly driven by changes in salinity, with temperature playing a secondary role (Fig. A11). Positive stratification anomalies were recorded in both regions in 2023, with the CS reaching record levels, which supported favourable conditions for G.huxleyi (see Appendix A1.4).
The year 2023 was marked by extreme surface ocean temperatures extending across the North Atlantic over a prolonged period. In particular, the Northeast Atlantic experienced extremes that were both anomalously intense and prolonged (Berthou et al., 2024). Using ocean-color data, our results reveal how G.huxleyi responds differently at their biogeographic limits: degradation at the trailing edge (Celtic Sea) and amplification at the leading edge (Barents Sea).
In the Celtic Sea, recent anomalies reflected prolonged bloom duration but reduced intensity. The primary bloom was attenuated when both SSTs and PAR exceeded the optimal thermal limit of G.huxleyi (>16 °C), and although a secondary bloom developed in late summer, overall bloom intensity declined over the 1998–2023 period. A trend of prolonged but weaker blooms was observed in 2021–2023, combined with increased stratification which may indicate a shift toward less favorable conditions for blooms.
In contrast, the Barents Sea exhibited an unprecedented bloom in 2023, both in intensity and spatial coverage. The persistence of favourable SSTs and PAR, coupled with a stable water column and shallow MLDs, sustained intense bloom conditions over three months. This intensification is consistent with long-term atlantification trends (Oziel et al., 2020; Neukermans et al., 2018), a northward migration of the polar front (Fig. A7), and haline-driven stratification (Fig. A11). The Barents bloom peaked at 16.5 mmol m−3, more than five times the 1998–2020 mean, confirming the development of blooms in high-latitude regions (Hutchins and Tagliabue, 2024) and the poleward shift of temperate phytoplankton in the Barents Sea (Neukermans et al., 2018).
These contrasting phenological responses illustrate the sensitivity of coccolithophore bloom dynamics to both short-term (MHWs) and long-term (warming, stratification) regional environmental changes. The observed phenology aligns with previous phenological studies (Hopkins et al., 2015) but suggests a change since 2021, with poleward shifts in bloom intensity and extent potentially indicative of a regime transition. However, the weak correlation between the polar front and leading-edge bloom extent and the strong correlation between SST anomaly and bloom surface extent (see Sect. 2.2) suggest that while atlantification supports expansion, MHWs are also important in reaching thermal thresholds for bloom development. These changes need further confirmation, particularly with additional data from diverse regions undergoing similar MHWs (e.g. North Sea). Whether these changes represent a persistent regime shift remains uncertain at this point and will require analysis of a longer time series.
Nevertheless, several limitations must be acknowledged. First, our estimates of bloom spatial extent may be underestimated due to the spatial averaging inherent in satellite observations and due to masking by cloud cover at high latitudes. Future studies could explore the use of more precise spatial masking techniques to address this or rely on potentially improved retrieval of PIC from hyperspectral ocean-color sensors such as the recently launched Plankton, Aerosols, Clouds and Ecosystems (PACE) mission (Werdell et al., 2019).
Our analysis was limited to surface ocean PIC concentration, detectable from ocean-color satellites. The lack of vertically resolved observational data constrains our ability to capture the vertical distribution and PIC standing stock of these blooms. This limitation may be overcome by applying statistical relationships extrapolating surface observations to sub-surface (e.g. Balch et al., 2018).
Coccolithophores are microscopic, calcifying phytoplankton that contribute substantially to marine primary production and global carbon cycling through both the organic carbon and carbonate pumps (Rost and Riebesell, 2004; Neukermans et al., 2023). Ocean acidification, driven by increased CO2 uptake, reduces carbonate ion availability and lowers pH, creating challenging chemical conditions for calcifying organisms (Riebesell et al., 2000; Iglesias-Rodriguez et al., 2008; Terhaar et al., 2020). Laboratory experiments show that impacts are dependent on the species. G. huxleyi exhibits decreased calcification and lighter coccoliths under elevated CO2, while other species may be more resilient but remain vulnerable to future acidification (Meyer and Riebesell, 2015). Global models project regionally heterogeneous effects, with some areas experiencing enhanced calcification due to carbon limitation alleviation, but a general decline in growth rate and calcification are expected above 600 µatm CO2 (Krumhardt et al., 2019; Tong et al., 2018). Considering ocean acidification alongside warming and atlantification provides essential context for interpreting the observed long-term declines in North Atlantic coccolithophore blooms.
Additionally, the evolution of water column stratification plays a key role in promoting blooms with a clear signal in the North Atlantic. These dynamics, including the vertical variation of the summertime MLD (Sallée et al., 2021), may reduce both light and nutrient availability, and also have implications for carbon export, a critical function of calcifying species. Coccolithophore blooms can influence the regional ocean carbon cycling by modifying surface pCO2 through the combined effect of primary production and calcification, and carbon export and deep particle fluxes through the calcite ballast effect (Shutler et al., 2013; Delille et al., 2005; Rigual Hernández et al., 2020; Klaas and Archer, 2002). Understanding and disentangling these influences on carbon cycling now and in the future is therefore crucial, especially as any potential long-term weakening of the ocean carbon sink may compound with short-term decline associated with MHW events (Müller et al., 2025).
The changes observed in 2023 are an extreme signature of multi-annual variability superimposed on long-term trends. There is a need to disentangle the contributions of internal variability, such as decadal variability, from the impacts of anthropogenic climate change. This will increase our capacity to assess extreme but plausible events such as the record SSTs in 2023–2024 (Terhaar et al., 2025) and anticipate their consequences. Although attribution science has made substantial progress in recent years (Stott et al., 2016; Ribes et al., 2020; Faranda et al., 2024), these developments have focused primarily on terrestrial and atmospheric variables. In ocean biogeochemistry, formal attribution frameworks are still lacking, mainly because they require multi-decadal observations and dedicated model ensembles, which are not yet available for PIC. Developing attribution capabilities for marine biogeochemical systems would therefore require both multi-scale observation networks providing robust initial conditions and/or a solid observational “baseline” and improved modelling frameworks able to resolve subsurface dynamics and multi-stressor interactions (Gregg and Casey, 2007; Nissen et al., 2018; Krumhardt et al., 2019). Establishing such tools and datasets would be essential before the respective roles of internal variability, extreme events, and long-term anthropogenic forcing can be formally disentangled.
A1 Data and Methods
A1.1 Study sites
The 2023 MHW in the North Atlantic, unprecedented in its extent and intensity, provides a unique opportunity to study the resilience and adaptation of phytoplankton species, including G.huxleyi, to extreme temperatures. In the North Atlantic, G.huxleyi typically blooms annually in regions situated between the continental shelf of Western Europe (Celtic Sea) and an Arctic shelf Sea (Barents Sea), respectively representing the trailing and leading edges of the bloom distribution (Winter et al., 2014; Neukermans et al., 2018).
The Celtic Sea [14–9° E/49.7–56° N] is a region where blooms occur annually and MHW resulted in temperature anomalies of up to +5 °C in June 2023 (Berthou et al., 2024). The Barents Sea [18–60° W/68–80° N] is a region experiencing rapid warming and sea-ice loss due to Arctic amplification and “atlantification” of its water masses (Oziel et al., 2020; Rantanen et al., 2022; He et al., 2024). Within these study sites, a bathymetry mask has been applied to limit turbid waters caused by resuspended bottom sediments and input from rivers, which create false-positive PIC signals. The bathymetric limits are respectively −150 and −100 m for the Celtic Sea and the Barents Sea and derived from the ETOPO 2022 global relief model at 60 arcsec resolution (MacFerrin et al., 2025).
A1.2 Satellite data
To assess anomalies in G.huxleyi bloom phenology and spatial extent, we used both the daily and the weekly-merged L3 multi-sensor PIC products, derived from MERIS, MODIS, SeaWIFS, VIIRS, and OLCI, providing a ° spatial resolution for 1997–2024 from the GlobColour project (https://hermes.acri.fr/, last access: 9 January 2026). NASA's standard PIC algorithm (Balch et al., 2005; Gordon and Du, 2001) was used, based on remote sensing reflectance in either two or three bands in the visible and the near-infrared domain (Balch and Mitchell, 2023). Ocean-color observations are limited by the presence of clouds (predominant at high latitudes) which motivate the choice of using weekly-merged rather than daily products for the climatological comparison. To construct a reliable climatology, we employed a 20-year archive (1998–2018), following Cael et al. (2023) who demonstrated that climate change indicators can be derived from ocean-color data within a shorter time period than the 30-year WMO recommendation. Daily (weekly) anomalies were calculated by comparing daily (weekly) PIC data to the corresponding constructed seasonal climatology. For PAR, only weekly-merged L3 multi-sensor PAR products are used, derived from MERIS, MODIS, SeaWIFS, VIIRS, and OLCI, providing a ° spatial resolution for 1997–2024 from the GlobColour project (https://hermes.acri.fr/).
For SST, we used, as a reference climatology, the ESA-CCI level 4 Climate Data Record version 3 (CDR, Embury et al., 2024), which offers a daily and globally consistent record at 0.05° spatial resolution. The daily climatology over the 1991–2020 period is computed with a 5 d moving average. To derive the daily anomalies we compared the daily CDR data to the Operational Sea surface Temperature and sea Ice Analysis (OSTIA) L4 analysis data (Donlon et al., 2012). The SST product is released on a daily basis on a regular latitude-longitude grid with a 0.05° spatial resolution. Marine heatwaves were identified following (Hobday et al., 2016) by comparing daily SSTs with a seasonally varying threshold defined as the local 90th percentile of a 30-year climatology. Periods of at least five consecutive days above this threshold were classified as marine heatwaves.
In the Barents Sea, previous studies have shown that the polar front, separating Atlantic and Arctic water masses, acts as a physical barrier to coccolithophore bloom expansion (Neukermans et al., 2018; Oziel et al., 2020). We therefore computed the Barents Sea polar front position using a local variance filter applied to March-April OSTIA SSTs with a window size of 7×7 pixels (Neukermans et al., 2018). We, first, computed the monthly average from the daily OSTIA archive. Polar Front Waters were then defined as waters having SSTs between the 16th and 84th percentiles (Oziel et al., 2016). The shifting position of the polar front since 1998 is shown in Figs. A6 and A7.
A1.3 Ocean stratification data
MLD data were obtained from the daily GLORYS12 Version 1 reanalysis, which provides a daily and global record from 1993 to 2024 at ° spatial resolution (Lellouche et al., 2021). Vertical temperature and the stratification are derived from the Institute of Atmospheric Physics (IAP) observation-based temperature/salinity fields at 1° × 1° horizontal resolution and 41 vertical levels from 1–2000 m and a monthly resolution from January 1940 to September 2023 were used. The product is described by (Cheng and Zhu, 2016; Cheng et al., 2017).
Based on this dataset, we define the upper 200 m stratification as the squared buoyancy frequency computed from the density gradient over the top 200 m layer:
where σ0 is potential density referenced to the surface, and g is the gravitational acceleration. The squared buoyancy frequency, N2 expressed in s−2.
The stratification can be expressed, to a first, approximation, as a linear combination of distinct temperature and salinity contributions (Gill and Niller, 1973):
where β is the haline contraction coefficient and α is the thermal expansion coefficient.
A1.4 Bloom detection and phenology
To assess G.huxleyi bloom phenology, we applied the methods of Hopkins et al. (2015) on the L3 daily multi-sensor PIC product (Appendix A1.2). This allows us to estimate bloom start and end dates, maximum concentration, and extent knowing the limitations of such data at high latitudes. This method is based on the analysis of the temporal evolution of the PIC concentration over the study site and the identification of both a local minimum before and after the detected peak of the bloom.
The surface extent computation relies on the number of relevant pixel areas detected with a PIC concentration greater than a region-based threshold (defined on daily products) applied to the weekly-merged L3 products. The threshold is computed based on the 1998–2018 climatology and determined as the PIC concentration on the climatological bloom start date, serving as a baseline for identifying significant anomalies. The respective values for CS and BS are 0.06 and 0.1 mmol m−3. The study sites are located in mid- and high-latitudes, the surface extent must take into account the surface spherical deformation, defined as follows:
Based on a global compilation of in situ measurements of coccolithophore species abundance and diversity (O'Brien et al., 2013), the realized ecological niche of G.huxleyi (i.e. the environmental conditions under which it can be observed) has been characterized (O'Brien, 2015). Out of seven environmental variables considered, O'Brien et al. (2016) showed that SST, PAR, and MLD were the most important variables influencing coccolithophore diversity. For G.huxleyi, the optimal SST range is situated between 6 and 16 °C, optimal PAR between 35 and 42 Einstein m−2 d−1, and optimal MLD between 20 and 30 m.
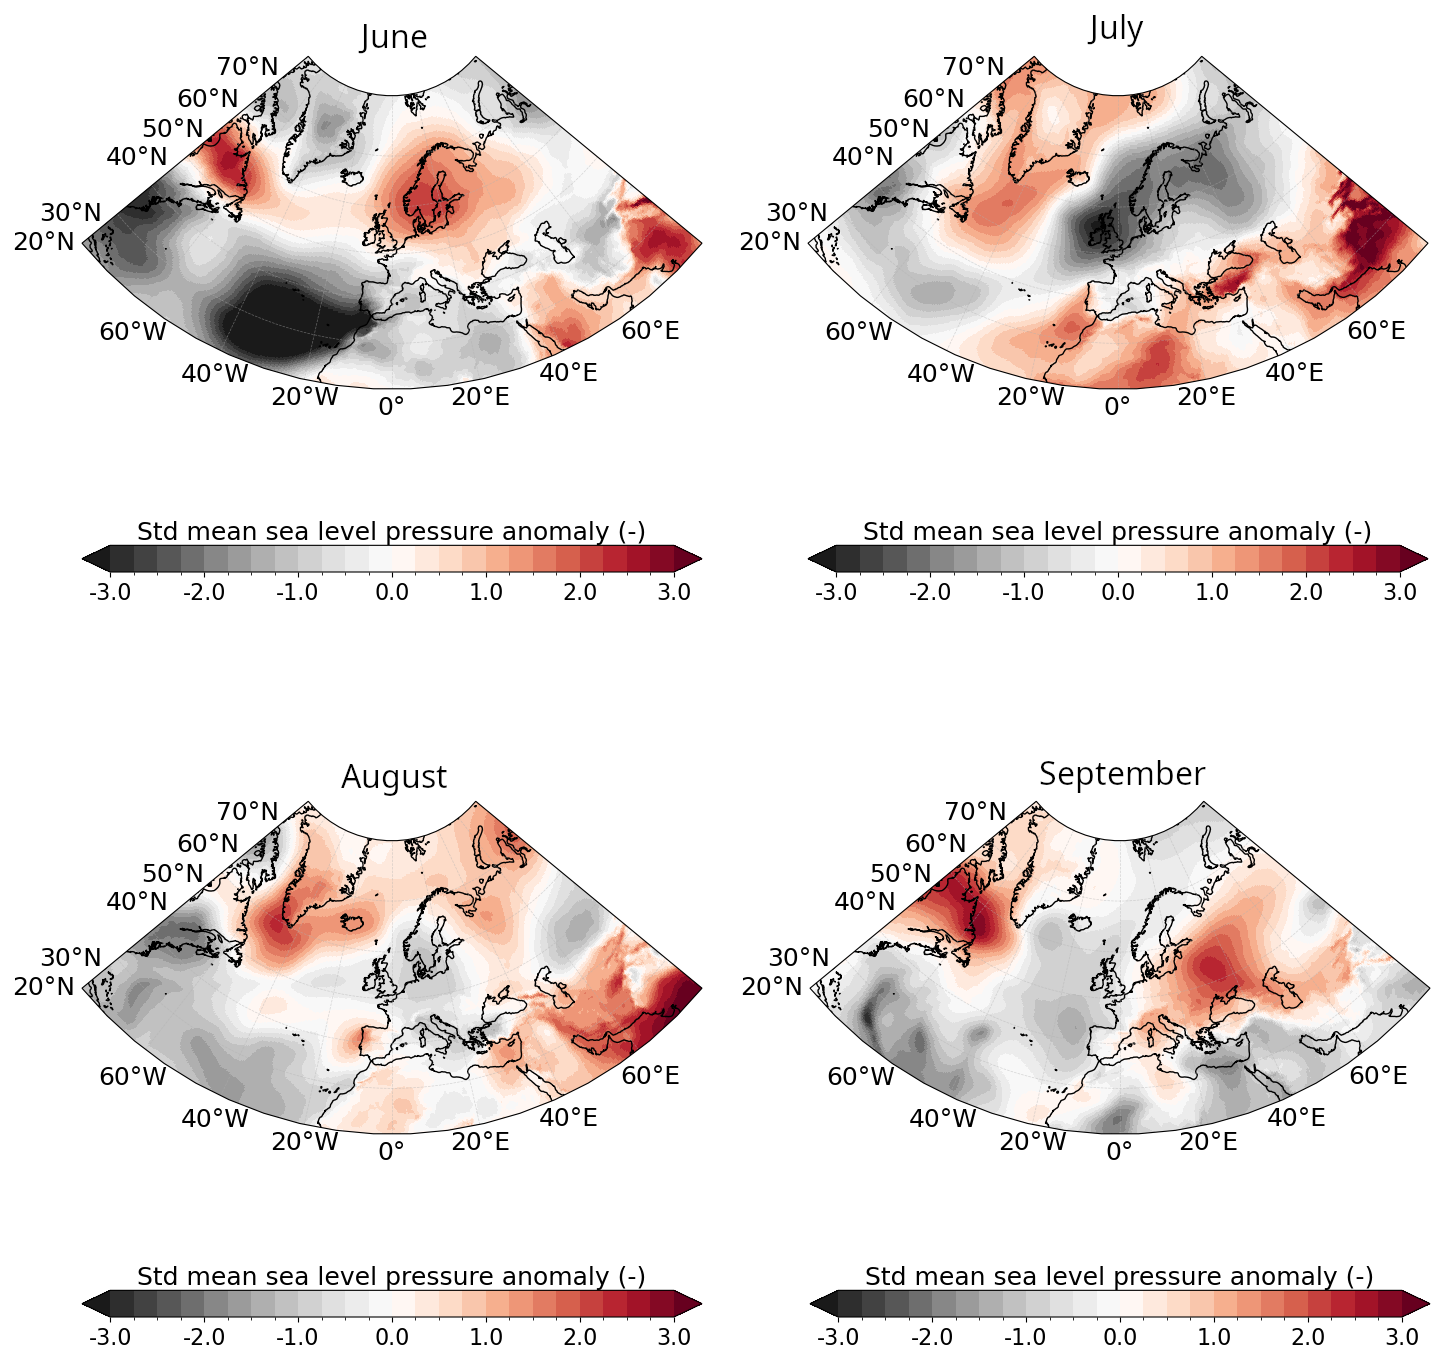
Figure A1Ocean-atmosphere conditions in June–July–August–September 2023. Standardised monthly anomalies from ERA5 in 2023 compared to the 1991–2020 climatological period for mean sea level pressure.
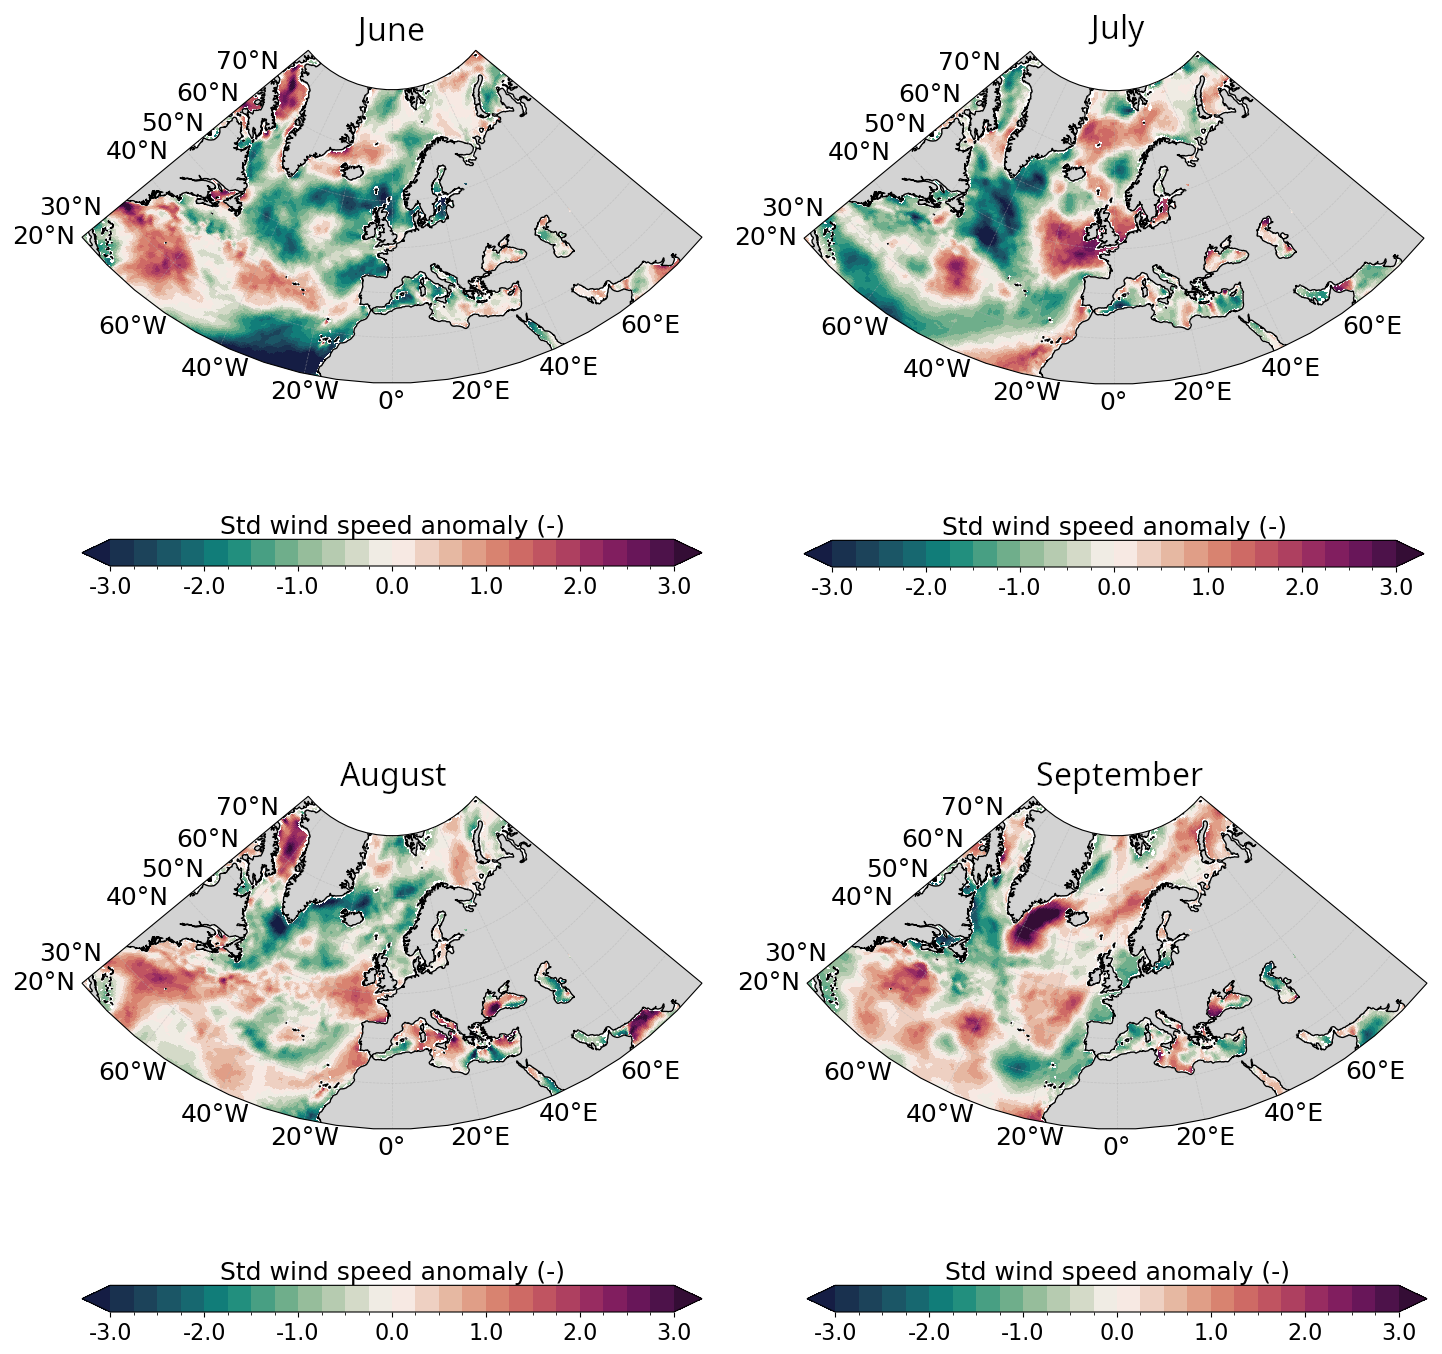
Figure A2Same as Fig. A1 for 10 m wind speed.
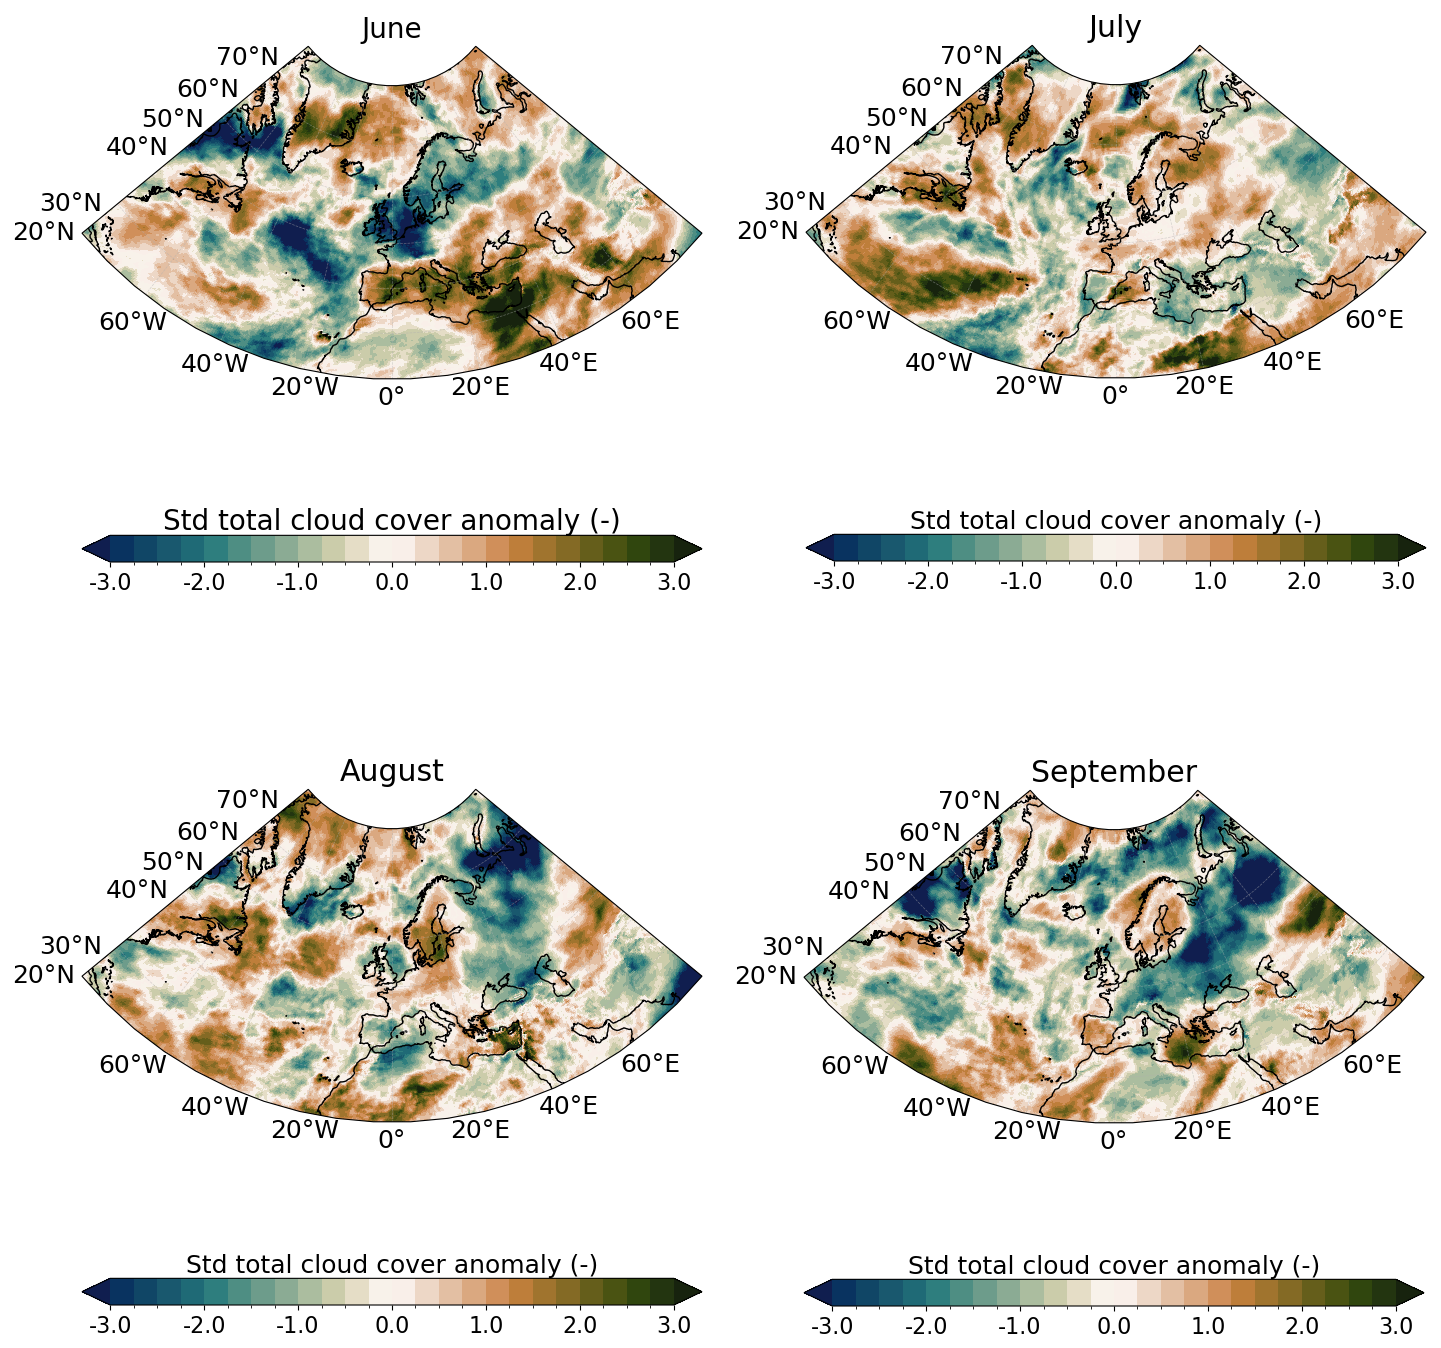
Figure A3Same as Fig. A1 for total cloud cover.
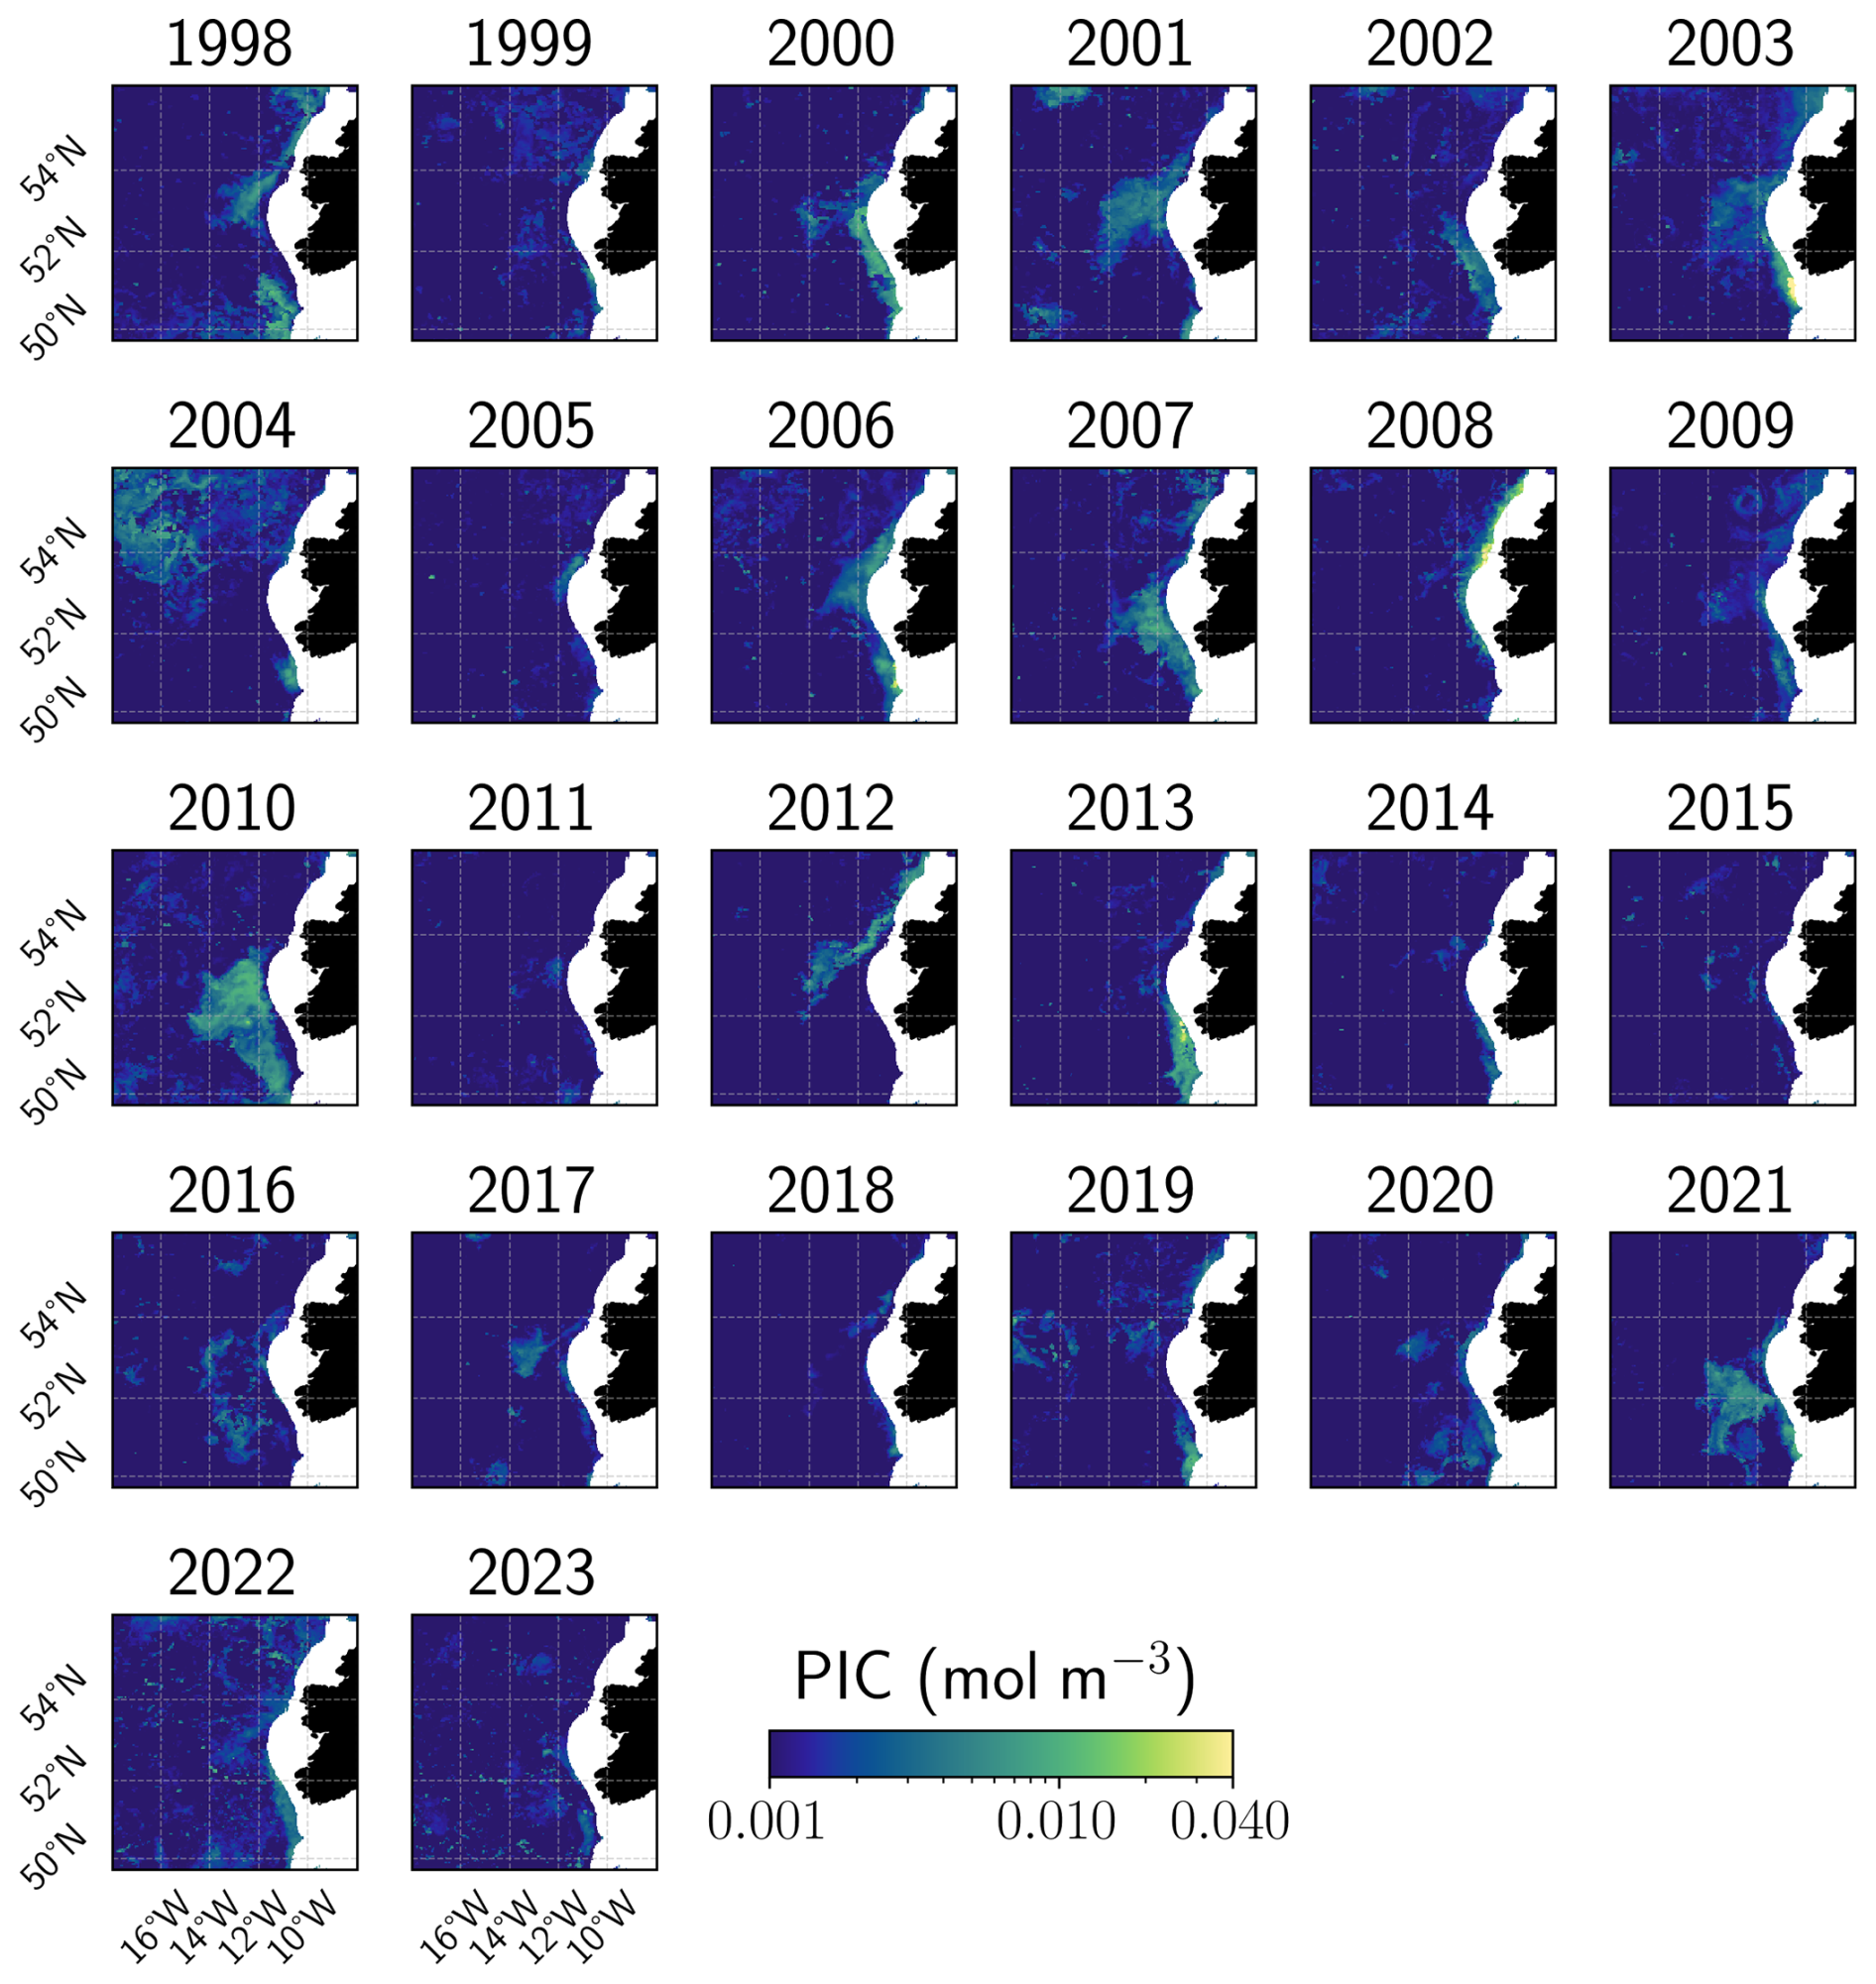
Figure A4Summer maximum PIC concentration in the Celtic Sea. Annual evolution of the remotely-sensed summer maximum PIC concentration. White areas defined coastal zones where the bathymetry is higher than −150 m.
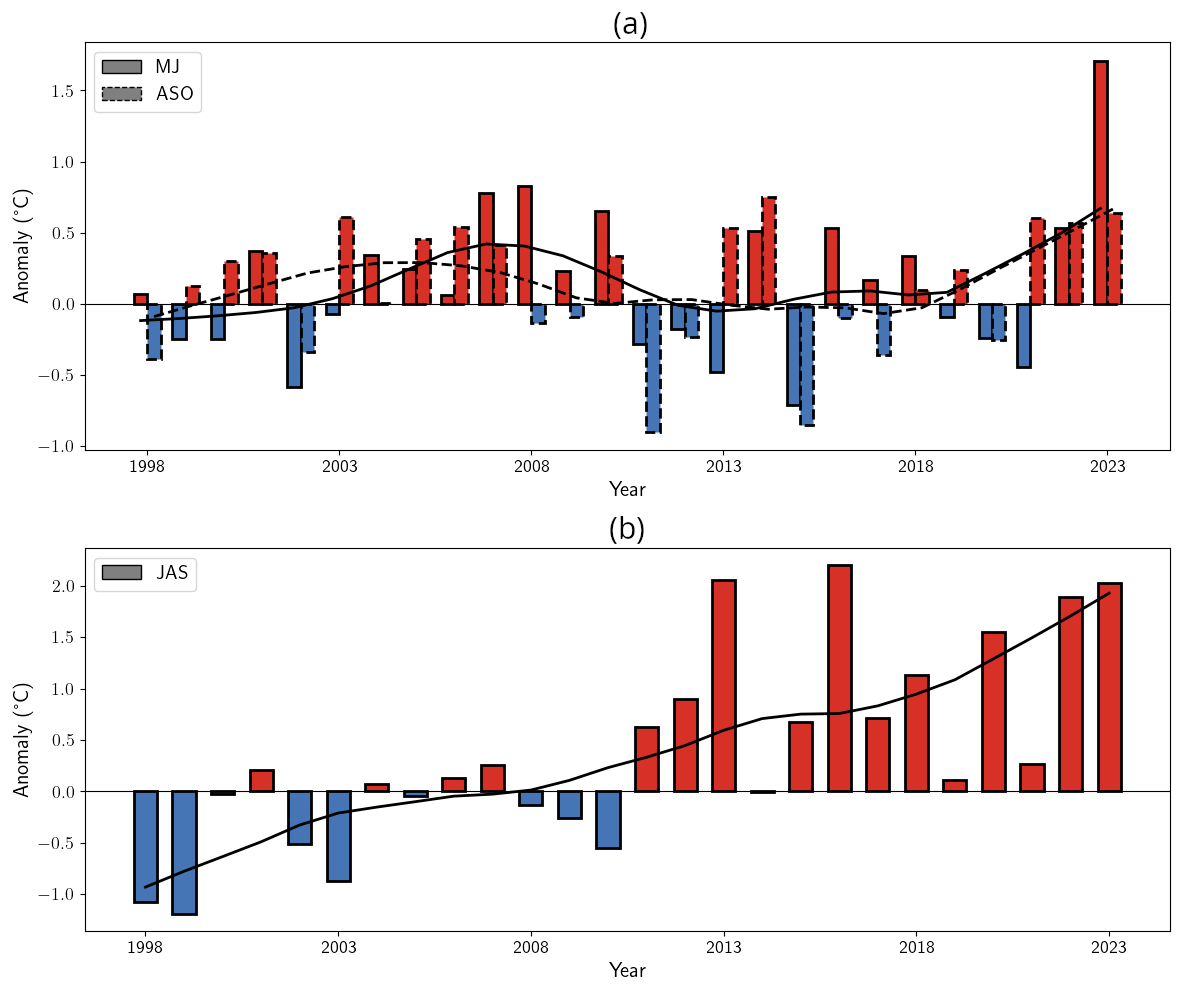
Figure A5Long-term SST evolution in the Celtic and Barents seas. SST anomalies for (a) the Celtic Sea (May–June in solid contour & August–September–August in dashed contour) and (b) the Barents Sea (July–August–September), computed relatively to the 1991–2020 climatological period. Red bars indicate positive anomalies, while blue bars denote negative anomalies. The line indicated the 10-year LOESS trend.
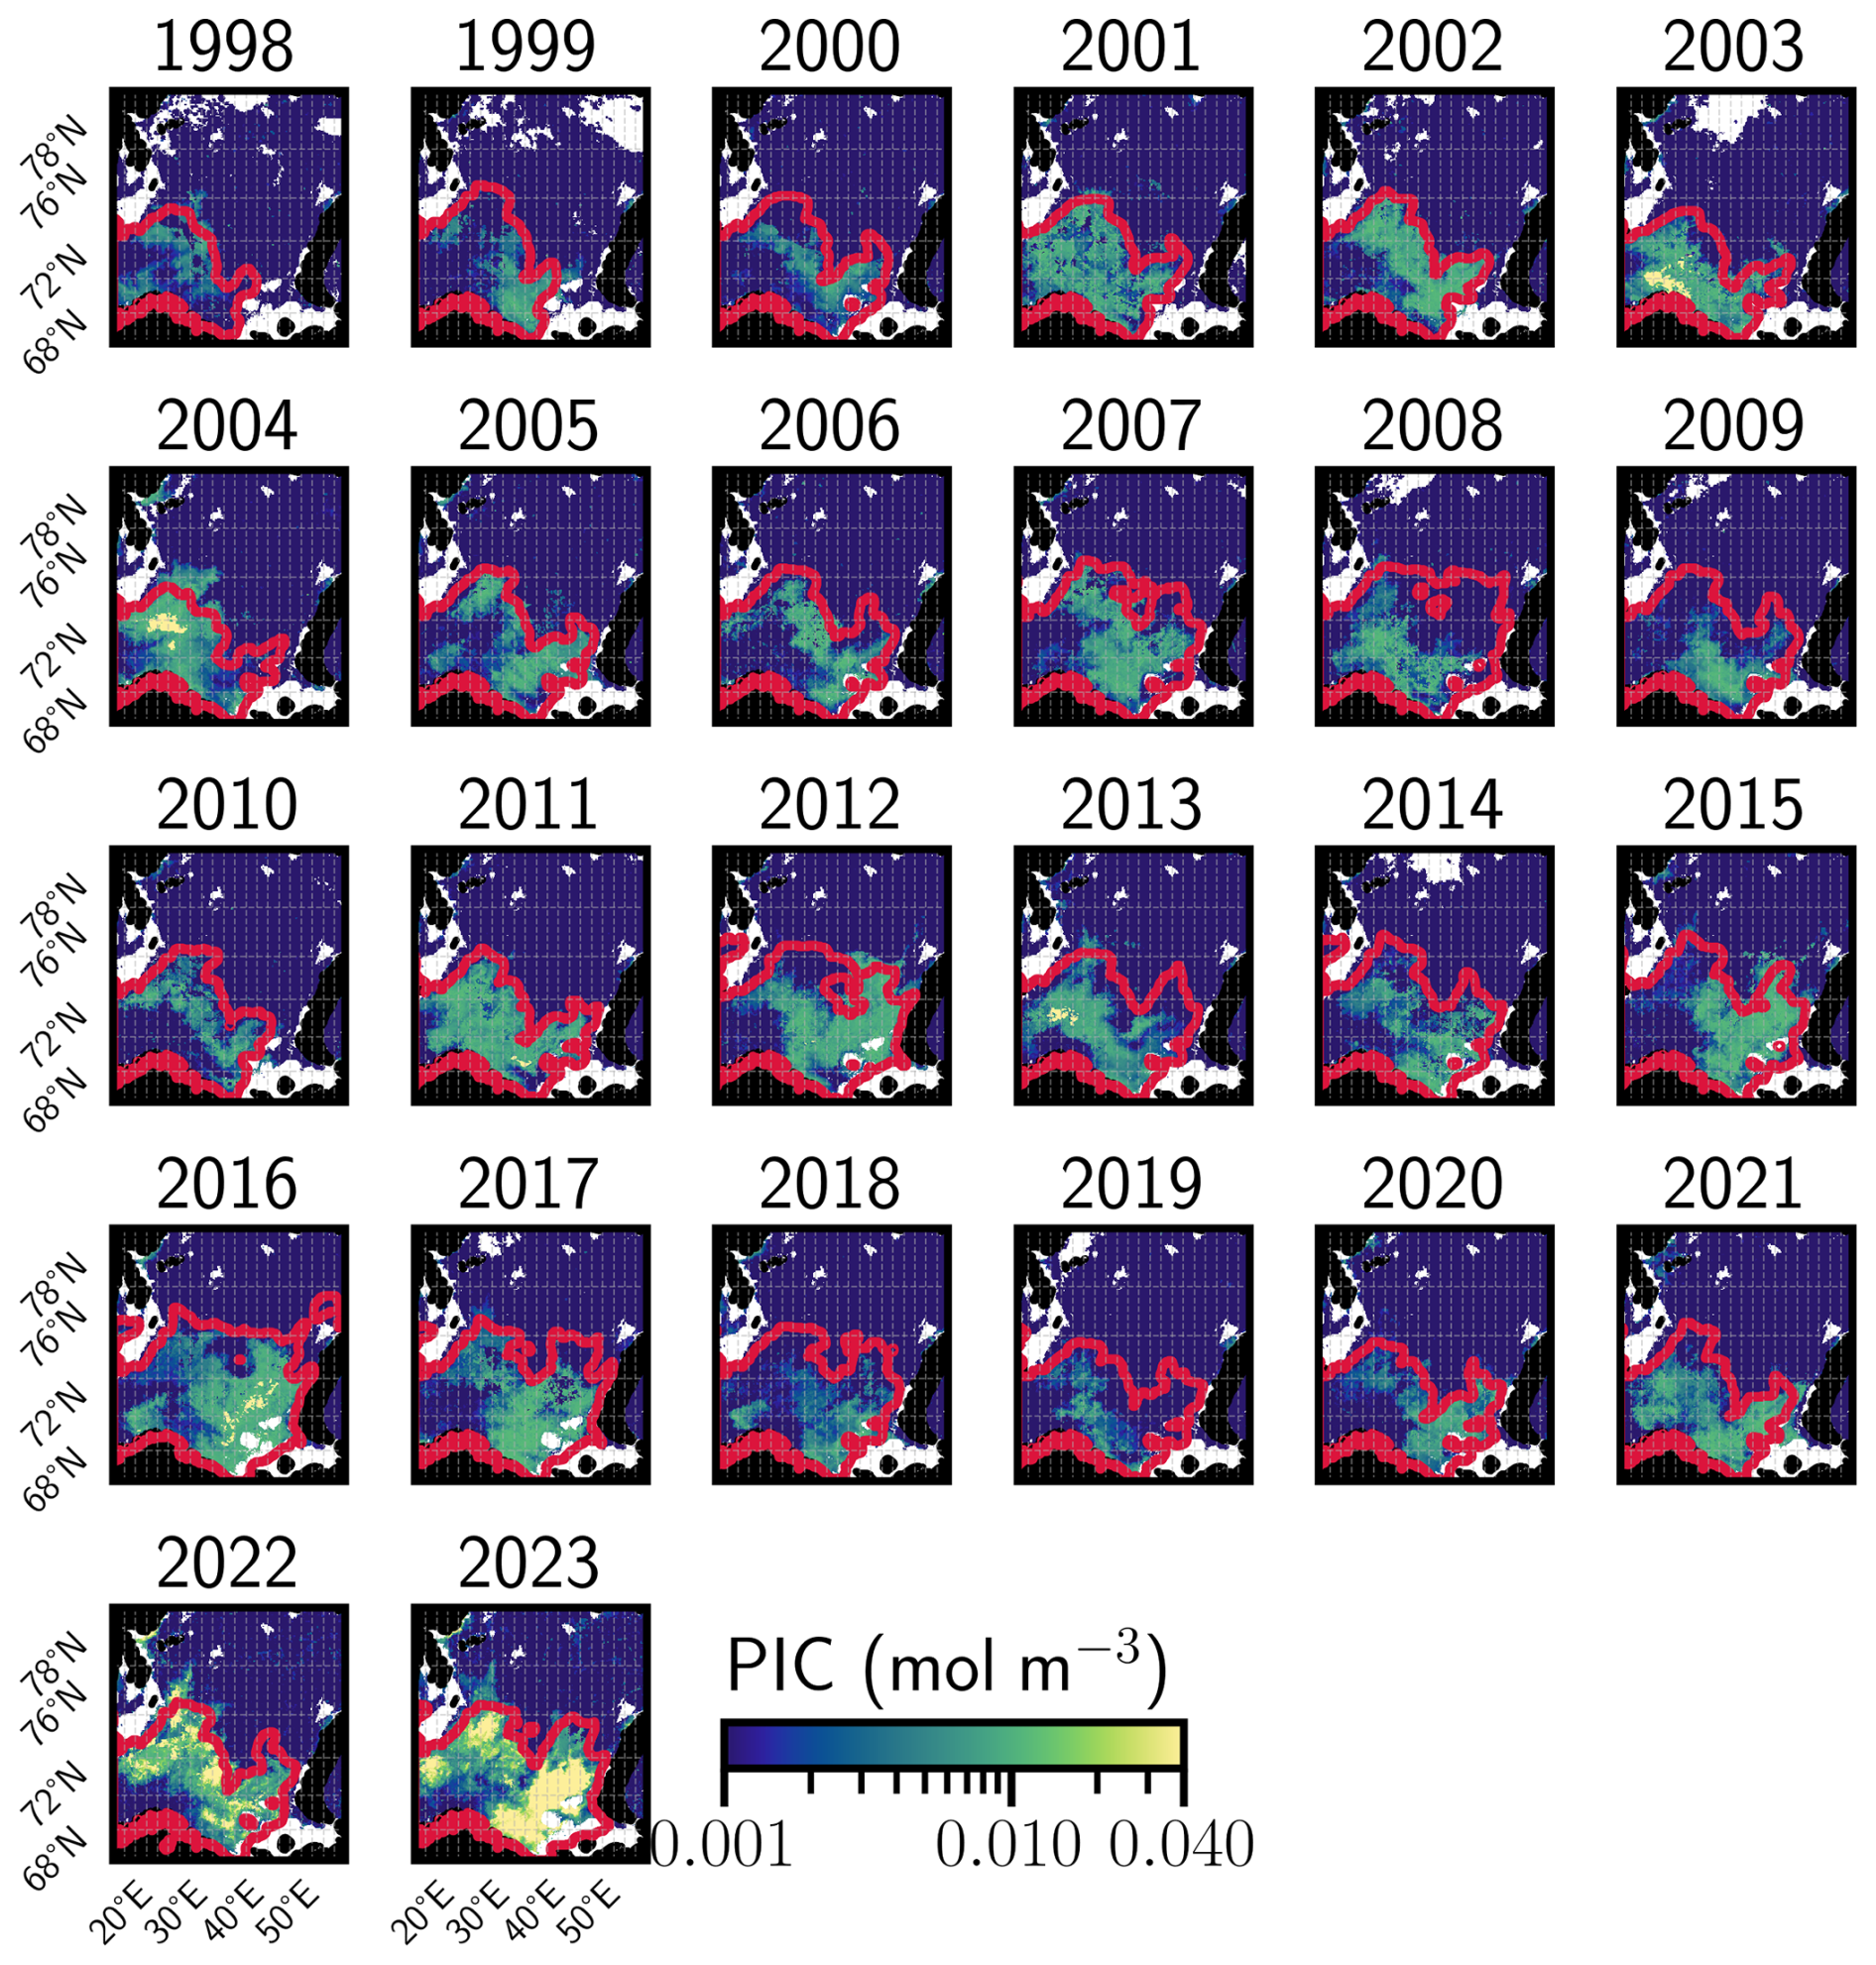
Figure A6Summer maximum PIC concentration in the Barents Sea. Annual evolution of the remotely-sensed summer maximum PIC concentration and the corresponding polar front in red. The polar front is based on an analysis of the ice-free March–April SSTs. White areas defined coastal zones where the bathymetry is higher than −100 m.
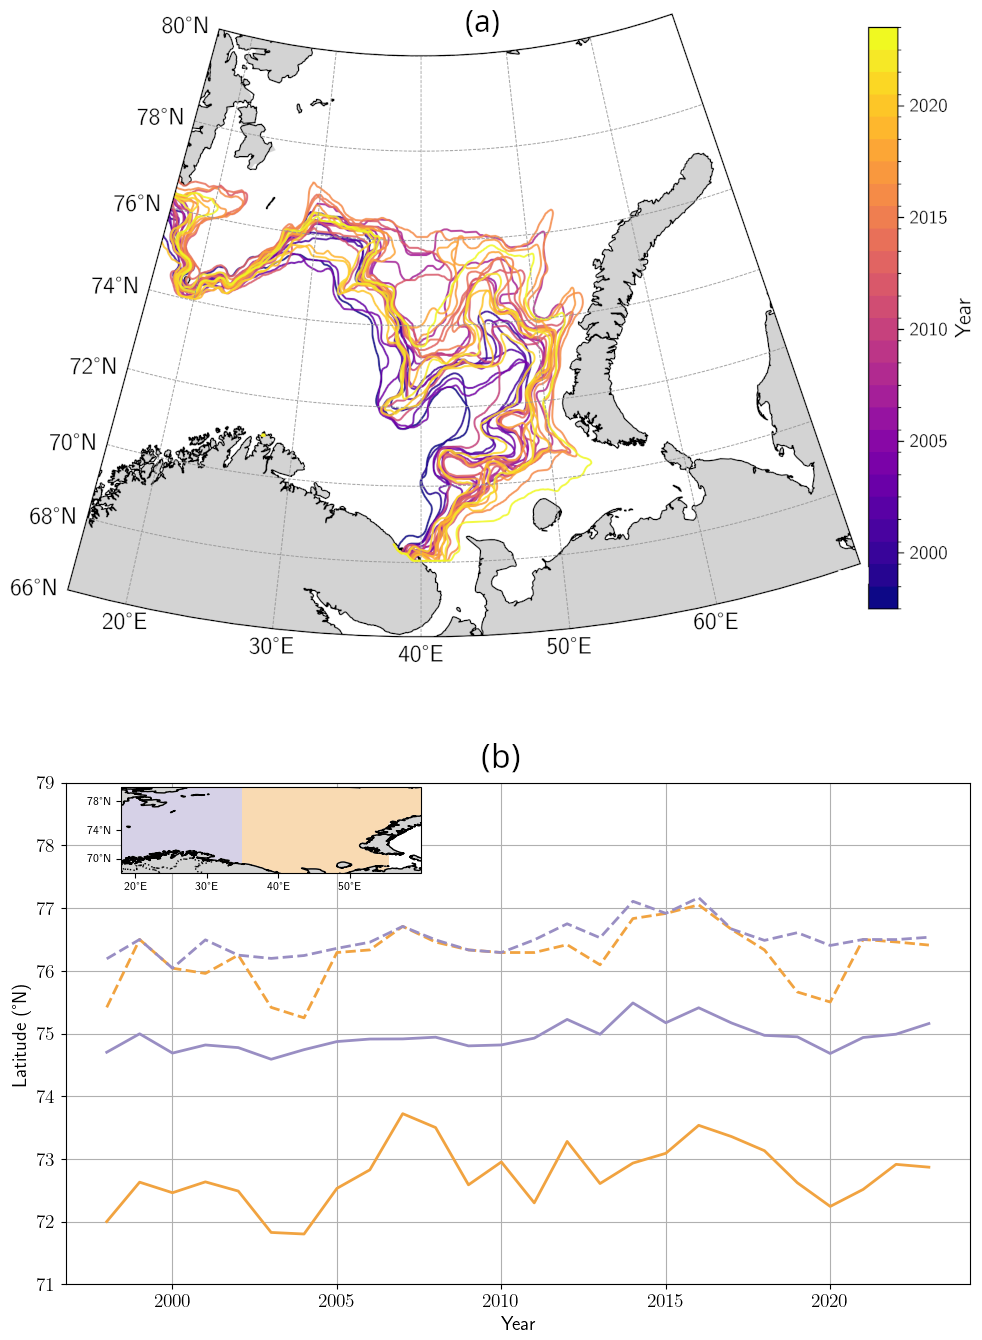
Figure A7Shifting position of the polar front in the Barents Sea. (a) Position of the polar front in the Barents Sea obtained from remotely sensed SST imagery and (b) corresponding position of the polar front maximum latitude in the western (blue lines) and eastern (orange lines) basins of the Barents Sea over the period 1998–2023.
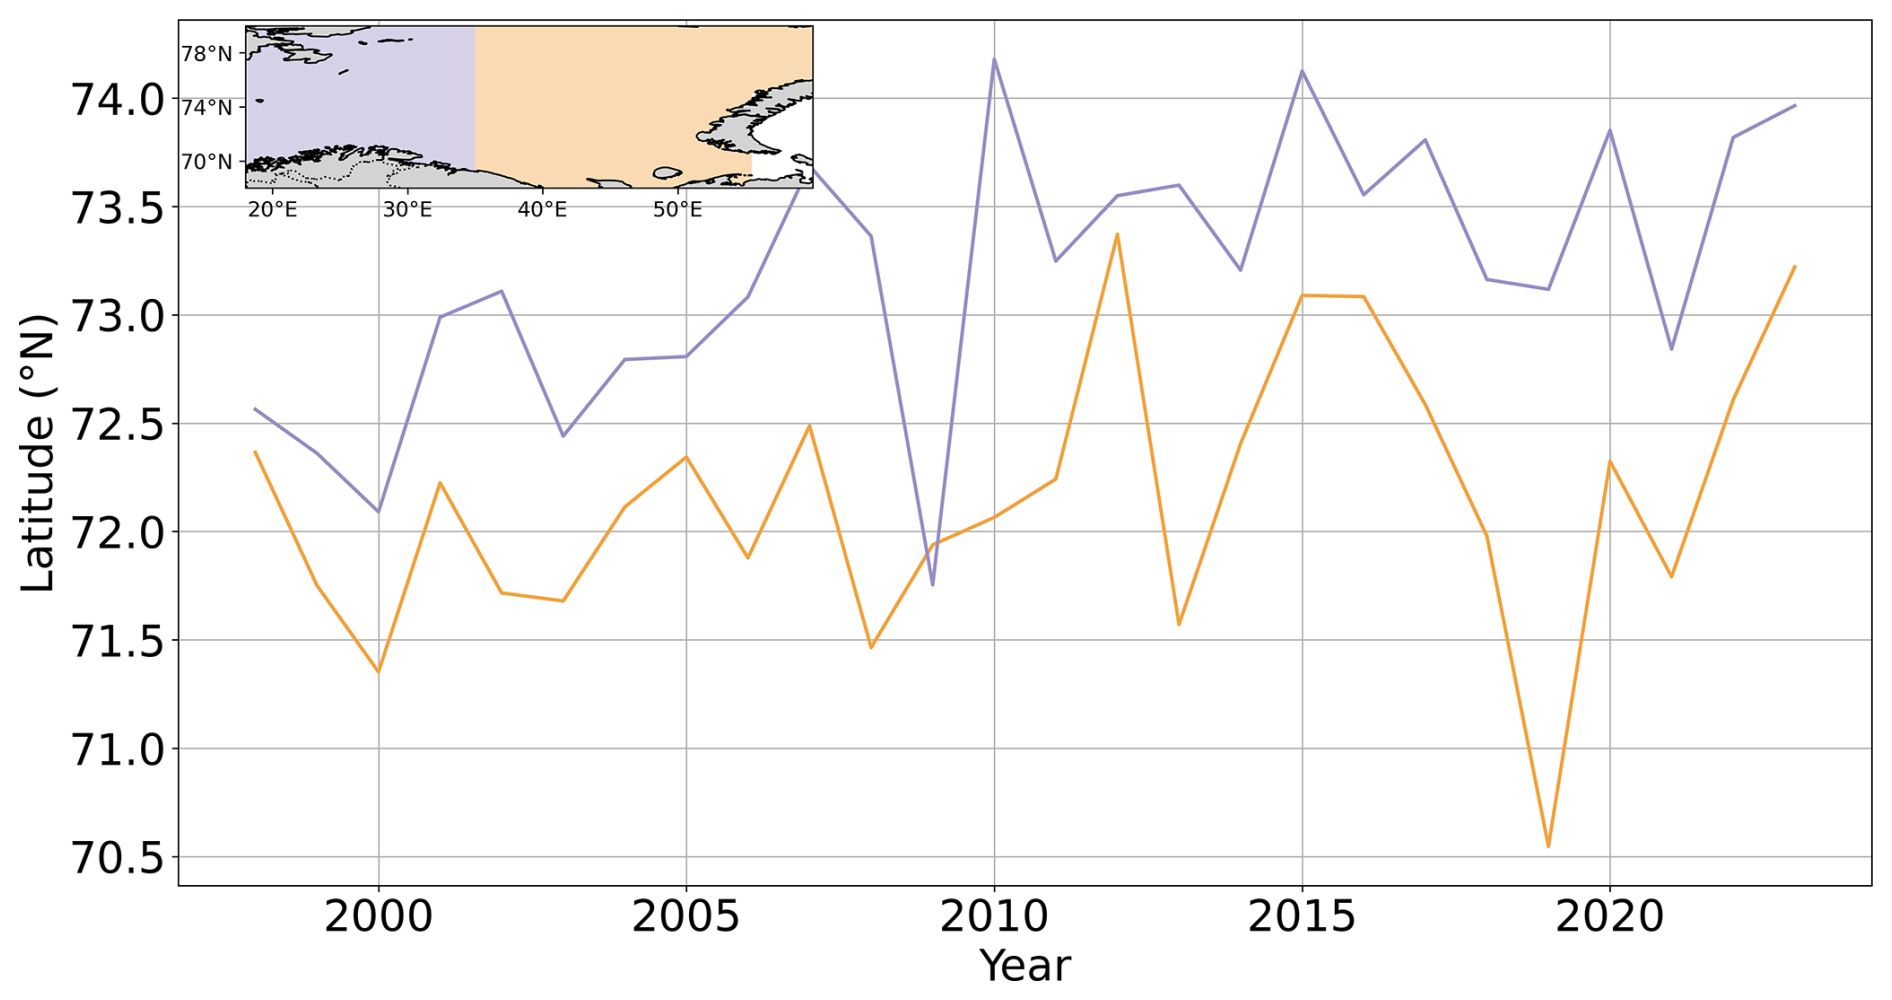
Figure A8Shifting position of the leading edge of G.huxleyi summer blooms in the Barents Sea. Temporal evolution of the mean latitude of the bloom summer maximum extent for the western (blue lines) and eastern (orange lines) basins of the Barents Sea over the period 1998–2023.
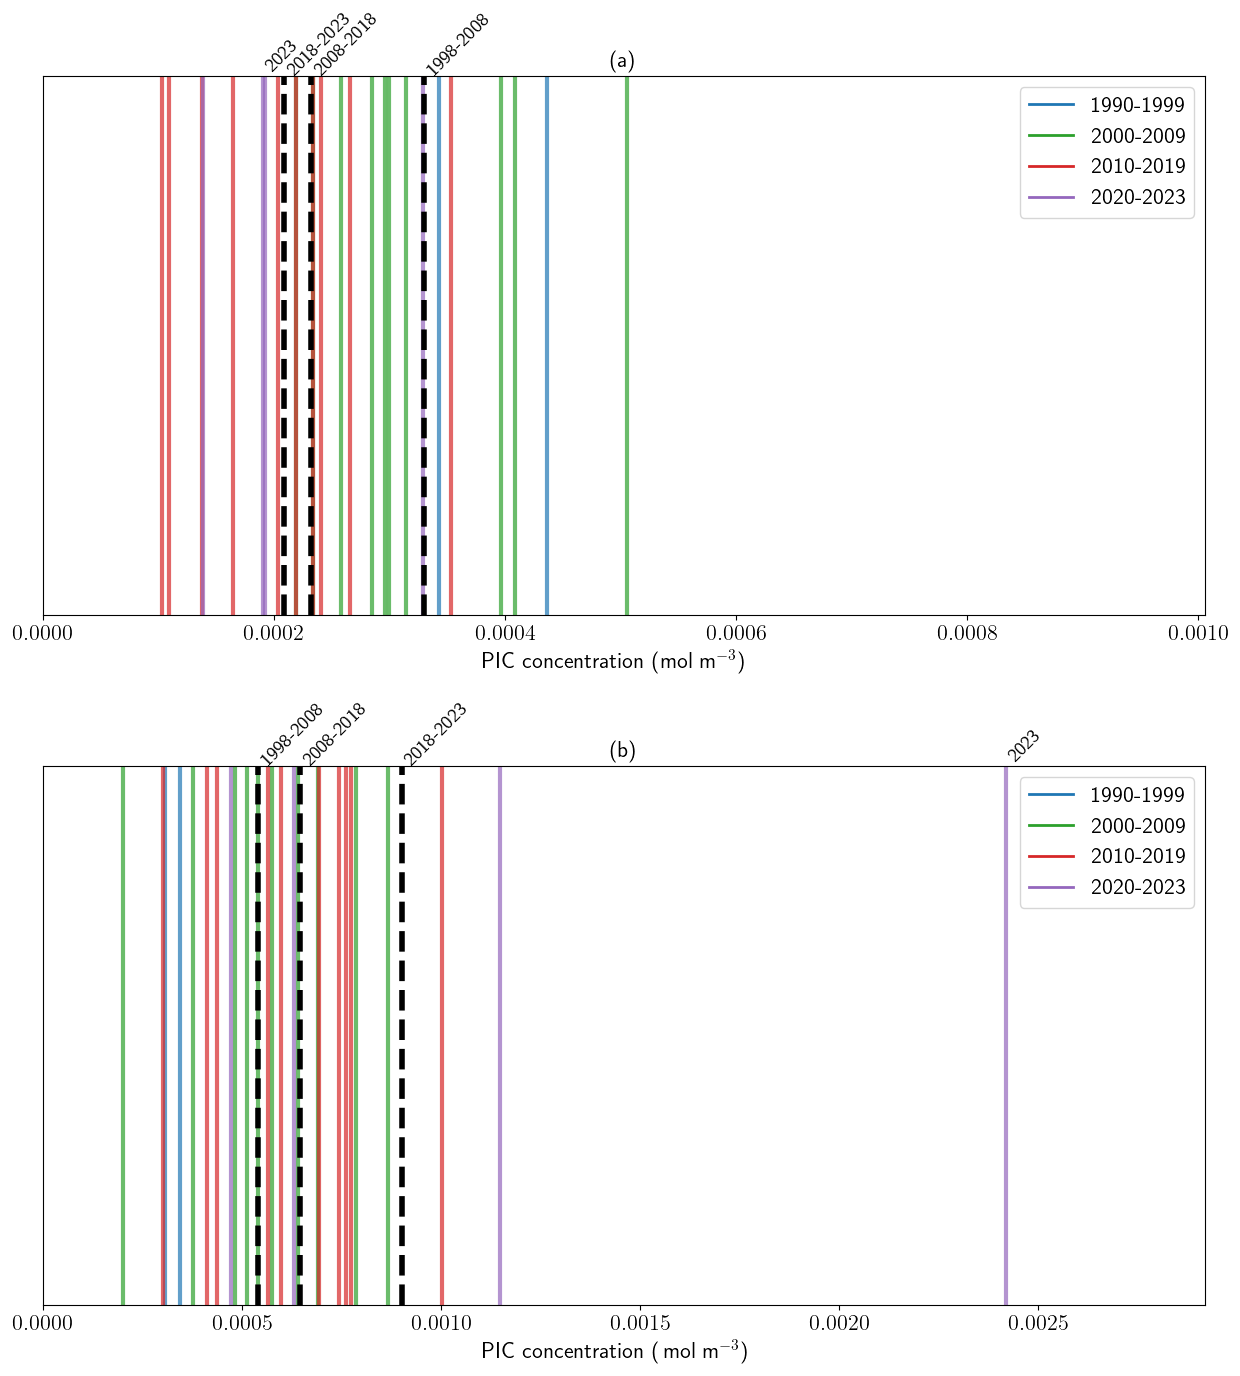
Figure A9Decadal evolution of summer mean PIC concentration in the Celtic Sea and Barents seas. Barcode plots of the distribution of yearly summer (June–July–August) mean PIC concentrations (mol m−3). Colors refer to the corresponding decade with decadal means indicated by black dashed lines. (a) Celtic sea and (b) Barents Sea.
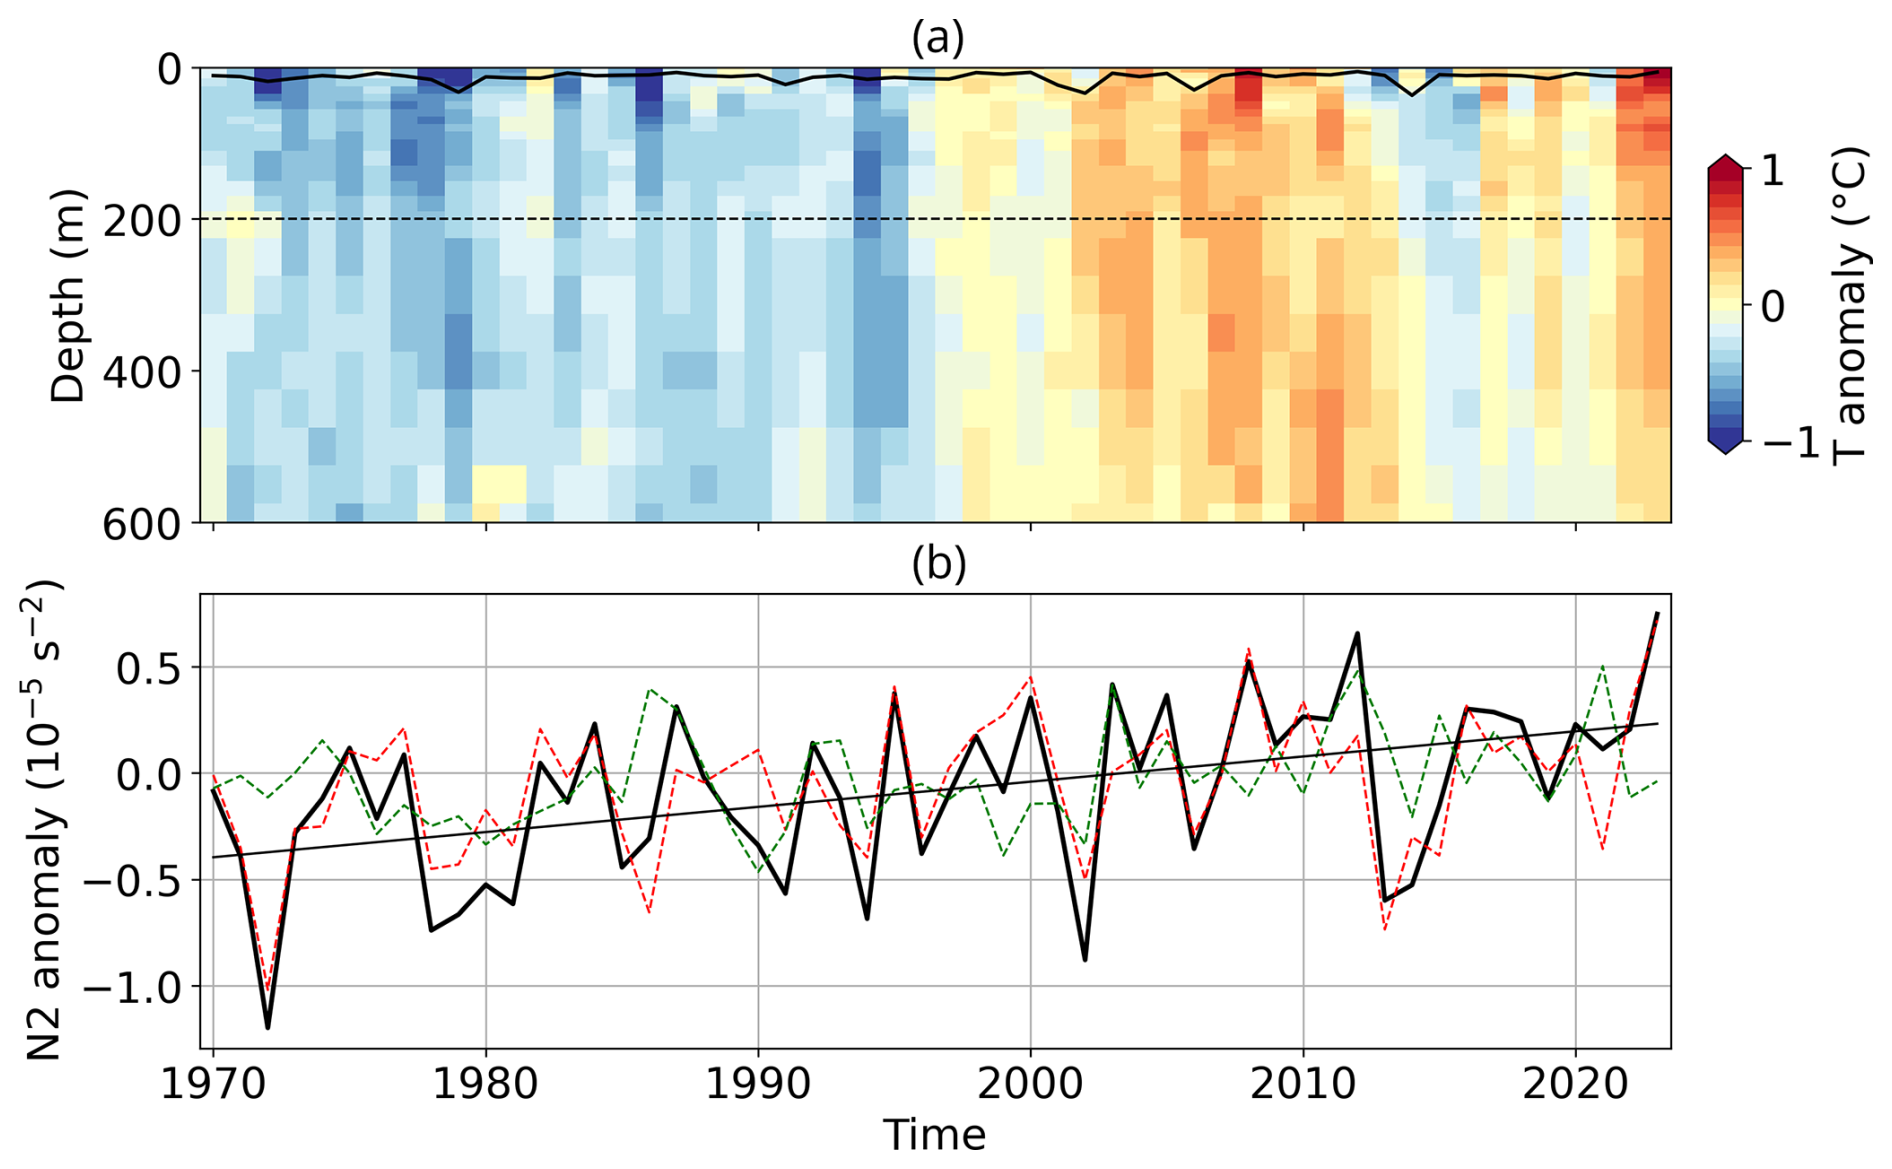
Figure A10Stratification conditions in the Celtic Sea. Vertical profile of (a) May–June anomalous temperature compared to the 1991–2020 climatological mean from the IPA dataset (b) time-series of the 0–200 m stratification anomaly, N2 and temperature (red dashed) and haline contribution (green dashed) to stratification in the Celtic Sea.
OSTIA SST data are publicly available for download from the UK Met Office dedicated website: https://ghrsst-pp.metoffice.gov.uk/ostia-website/index.html (last access: 9 January 2026). Ocean color data are publicly available for download from the ACRI-ST website: https://hermes.acri.fr. Mixed layer depth data are publicly available on the CMEMS website: https://data.marine.copernicus.eu/product/GLOBAL_MULTIYEAR_PHY_001_030/description (last access: 9 January 2026).
TG and GN designed the study; TG conducted analysis and wrote the paper with contributions from GN. TG and GN took part in discussions and revisions of the paper.
The contact author has declared that neither of the authors has any competing interests.
Publisher's note: Copernicus Publications remains neutral with regard to jurisdictional claims made in the text, published maps, institutional affiliations, or any other geographical representation in this paper. The authors bear the ultimate responsibility for providing appropriate place names. Views expressed in the text are those of the authors and do not necessarily reflect the views of the publisher.
This article is part of the special issue “Special issue on ocean extremes (55th International Liège Colloquium)”. It is a result of the 55th International Liège Colloquium on Ocean Dynamics, Liège, Belgium, 27–30 May 2024.
TG sincerely thanks Jean-Baptiste Sallée for many fruitful discussions on the evolution of current dynamics in the Barents Sea and for providing with stratification diagnostics. TG sincerely thanks Christophe Cassou for his mentoring and help in understanding climate internal variability.
This work was supported by the funding from EUMETSAT and Météo-France in the context of the EUMETSAT OSI SAF. This work is a contribution to CarbOcean (European Research Council under the European Union's Horizon 2020 research and innovation programme Grant agreement No. 853516) awarded to GN.
This paper was edited by Mario Hoppema and reviewed by three anonymous referees.
Ackleson, S., Balch, W., and Holligan, P.: White waters of the Gulf of Maine, Oceanography, 1, 18–22, 1988. a
Arteaga, L. A. and Rousseaux, C. S.: Impact of Pacific Ocean heatwaves on phytoplankton community composition, Communications Biology, 6, 263, https://doi.org/10.1038/s42003-023-04645-0, 2023. a
Årthun, M., Eldevik, T., Smedsrud, L. H., Skagseth, Ø., and Ingvaldsen, R.: Quantifying the influence of Atlantic heat on Barents Sea ice variability and retreat, Journal of Climate, 25, 4736–4743, 2012. a, b
Balch, W., Gordon, H. R., Bowler, B., Drapeau, D., and Booth, E.: Calcium carbonate measurements in the surface global ocean based on Moderate-Resolution Imaging Spectroradiometer data, Journal of Geophysical Research: Oceans, 110, https://doi.org/10.1029/2004JC002560, 2005. a
Balch, W. M. and Mitchell, C.: Remote sensing algorithms for particulate inorganic carbon (PIC) and the global cycle of PIC, Earth-Science Reviews, 239, 104363, https://doi.org/10.1016/j.earscirev.2023.104363, 2023. a
Balch, W. M., Bowler, B. C., Drapeau, D. T., Lubelczyk, L. C., and Lyczkowski, E.: Vertical distributions of coccolithophores, PIC, POC, biogenic Silica, and chlorophyll a throughout the global ocean, Global Biogeochemical Cycles, 32, 2–17, 2018. a
Beaugrand, G., McQuatters-Gollop, A., Edwards, M., and Goberville, E.: Long-term responses of North Atlantic calcifying plankton to climate change, Nature Climate Change, 3, 263–267, 2013. a
Bendif, E. M., Probert, I., Archontikis, O. A., Young, J. R., Beaufort, L., Rickaby, R. E., and Filatov, D.: Rapid diversification underlying the global dominance of a cosmopolitan phytoplankton, The ISME Journal, 17, 630–640, 2023. a
Berthou, S., Renshaw, R., Smyth, T., Tinker, J., Grist, J. P., Wihsgott, J. U., Jones, S., Inall, M., Nolan, G., Berx, B., Arnold, A., Blunn, L. P., Castillo, J. M., Cotterill, D., Daly, E., Dow, G., Gómez, B., Fraser-Leonhardt, V., Hirschi, J. J.-M., Lewis, H. W., Mahmood, S., and Worsfold, M.: Exceptional atmospheric conditions in June 2023 generated a northwest European marine heatwave which contributed to breaking land temperature records, Communications Earth & Environment, 5, 287, https://doi.org/10.1038/s43247-024-01413-8, 2024. a, b, c, d
Burger, F. A., Terhaar, J., and Frölicher, T. L.: Compound marine heatwaves and ocean acidity extremes, Nature communications, 13, 4722, https://doi.org/10.1038/s41467-022-32120-7, 2022. a
Cael, B., Bisson, K., Boss, E., Dutkiewicz, S., and Henson, S.: Global climate-change trends detected in indicators of ocean ecology, Nature, 619, 551–554, 2023. a
Capotondi, A., Rodrigues, R. R., Sen Gupta, A., Benthuysen, J. A., Deser, C., Frölicher, T. L., Lovenduski, N. S., Amaya, D. J., Le Grix, N., Xu, T., Hermes, J., Holbrook, N. J., Martinez-Villalobos, M., Masina, S., Roxy, M. K., Schaeffer, A., Schlegel, R. W., Smith, K. E., and Wang, C.: A global overview of marine heatwaves in a changing climate, Communications Earth & Environment, 5, 701, https://doi.org/10.1038/s43247-024-01806-9, 2024. a
Chafik, L., Nilsson, J., Skagseth, Ø., and Lundberg, P.: On the flow of Atlantic water and temperature anomalies in the Nordic Seas toward the Arctic Ocean, Journal of Geophysical Research: Oceans, 120, 7897–7918, 2015. a
Cheng, L. and Zhu, J.: Benefits of CMIP5 multimodel ensemble in reconstructing historical ocean subsurface temperature variations, Journal of Climate, 29, 5393–5416, 2016. a
Cheng, L., Trenberth, K. E., Fasullo, J., Boyer, T., Abraham, J., and Zhu, J.: Improved estimates of ocean heat content from 1960 to 2015, Science Advances, 3, e1601545, https://doi.org/10.1126/sciadv.1601545, 2017. a
Cheung, W. W. and Frölicher, T. L.: Marine heatwaves exacerbate climate change impacts for fisheries in the northeast Pacific, Scientific Reports, 10, 6678, https://doi.org/10.1038/s41598-020-63650-z, 2020. a
Cleveland, W. S.: Robust locally weighted regression and smoothing scatterplots, Journal of the American Statistical Association, 74, 829–836, 1979. a
Cyr, F., Lewis, K., Bélanger, D., Regular, P., Clay, S., and Devred, E.: Physical controls and ecological implications of the timing of the spring phytoplankton bloom on the Newfoundland and Labrador shelf, Limnology and Oceanography Letters, 9, 191–198, 2024. a
de Boyer Montégut, C., Madec, G., Fischer, A. S., Lazar, A., and Iudicone, D.: Mixed layer depth over the global ocean: An examination of profile data and a profile-based climatology, Journal of Geophysical Research: Oceans, 109, https://doi.org/10.1029/2004JC002378, 2004. a
Delille, B., Harlay, J., Zondervan, I., Jacquet, S., Chou, L., Wollast, R., Bellerby, R. G., Frankignoulle, M., Borges, A. V., Riebesell, U., and Gattuso, J.-P.: Response of primary production and calcification to changes of pCO2 during experimental blooms of the coccolithophorid Emiliania huxleyi, Global Biogeochemical Cycles, 19, https://doi.org/10.1029/2004GB002318, 2005. a
Donlon, C. J., Martin, M., Stark, J., Roberts-Jones, J., Fiedler, E., and Wimmer, W.: The operational sea surface temperature and sea ice analysis (OSTIA) system, Remote Sensing of Environment, 116, 140–158, 2012. a
Embury, O., Merchant, C. J., Good, S. A., Rayner, N. A., Høyer, J. L., Atkinson, C., Block, T., Alerskans, E., Pearson, K. J., Worsfold, M., McCarroll, N., and Donlon, C.: Satellite-based time-series of sea-surface temperature since 1980 for climate applications, Scientific Data, 11, 326, https://doi.org/10.1038/s41597-024-03147-w, 2024. a
England, M. H., Li, Z., Huguenin, M. F., Kiss, A. E., Sen Gupta, A., Holmes, R. M., and Rahmstorf, S.: Drivers of the extreme North Atlantic marine heatwave during 2023, Nature, 642, 1–8, 2025. a
Faranda, D., Messori, G., Coppola, E., Alberti, T., Vrac, M., Pons, F., Yiou, P., Saint Lu, M., Hisi, A. N., Brockmann, P., Dafid, S., Mengaldo, G., and Vautard, R.: ClimaMeter: contextualizing extreme weather in a changing climate, Weather and Climate Dynamics, 5, 959–983, 2024. a
Fiddes, S. L., Woodhouse, M. T., Nicholls, Z., Lane, T. P., and Schofield, R.: Cloud, precipitation and radiation responses to large perturbations in global dimethyl sulfide, Atmospheric Chemistry and Physics, 18, 10177–10198, https://doi.org/10.5194/acp-18-10177-2018, 2018. a
Forster, P. M., Smith, C., Walsh, T., Lamb, W. F., Lamboll, R., Cassou, C., Hauser, M., Hausfather, Z., Lee, J.-Y., Palmer, M. D., von Schuckmann, K., Slangen, A. B. A., Szopa, S., Trewin, B., Yun, J., Gillett, N. P., Jenkins, S., Matthews, H. D., Raghavan, K., Ribes, A., Rogelj, J., Rosen, D., Zhang, X., Allen, M., Aleluia Reis, L., Andrew, R. M., Betts, R. A., Borger, A., Broersma, J. A., Burgess, S. N., Cheng, L., Friedlingstein, P., Domingues, C. M., Gambarini, M., Gasser, T., Gütschow, J., Ishii, M., Kadow, C., Kennedy, J., Killick, R. E., Krummel, P. B., Liné, A., Monselesan, D. P., Morice, C., Mühle, J., Naik, V., Peters, G. P., Pirani, A., Pongratz, J., Minx, J. C., Rigby, M., Rohde, R., Savita, A., Seneviratne, S. I., Thorne, P., Wells, C., Western, L. M., van der Werf, G. R., Wijffels, S. E., Masson-Delmotte, V., and Zhai, P.: Indicators of Global Climate Change 2024: annual update of key indicators of the state of the climate system and human influence, Earth System Science Data, 17, 2641–2680, https://doi.org/10.5194/essd-17-2641-2025, 2025. a
Gill, A. and Niller, P.: The theory of the seasonal variability in the ocean, Deep Sea Research and Oceanographic Abstracts, 20, 141–177, 1973. a
Gordon, H. R. and Du, T.: Light scattering by nonspherical particles: application to coccoliths detached from Emiliania huxleyi, Limnology and Oceanography, 46, 1438–1454, 2001. a
Gregg, W. W. and Casey, N. W.: Modeling coccolithophores in the global oceans, Deep Sea Research Part II: Topical Studies in Oceanography, 54, 447–477, 2007. a
Guinaldo, T., Voldoire, A., Waldman, R., Saux Picart, S., and Roquet, H.: Response of the sea surface temperature to heatwaves during the France 2022 meteorological summer, Ocean Science, 19, 629–647, https://doi.org/10.5194/os-19-629-2023, 2023. a
Guinaldo, T., Cassou, C., Sallée, J.-B., and Liné, A.: Internal variability effect doped by climate change drove the 2023 marine heat extreme in the North Atlantic, Communications Earth & Environment, 6, 291, https://doi.org/10.1038/s43247-025-02197-1, 2025. a
He, Y., Shu, Q., Wang, Q., Song, Z., Zhang, M., Wang, S., Zhang, L., Bi, H., Pan, R., and Qiao, F.: Arctic Amplification of marine heatwaves under global warming, Nature Communications, 15, 8265, https://doi.org/10.1038/s41467-024-52760-1, 2024. a
Hobday, A. J., Alexander, L. V., Perkins, S. E., Smale, D. A., Straub, S. C., Oliver, E. C., Benthuysen, J. A., Burrows, M. T., Donat, M. G., Feng, M., Sen Gupta, A., Hobday, A. J., Holbrook, N., J., Perkins-Kirkpatrick, S. E., Scannell, H. A., Straub, S. C., and Wernberg, T.: A hierarchical approach to defining marine heatwaves, Progress in Oceanography, 141, 227–238, 2016. a, b, c
Holbrook, N. J., Sen Gupta, A., Oliver, E. C., Hobday, A. J., Benthuysen, J. A., Scannell, H. A., Smale, D. A., and Wernberg, T.: Keeping pace with marine heatwaves, Nature Reviews Earth & Environment, 1, 482–493, 2020. a
Hopkins, J., Henson, S. A., Painter, S. C., Tyrrell, T., and Poulton, A. J.: Phenological characteristics of global coccolithophore blooms, Global Biogeochemical Cycles, 29, 239–253, 2015. a, b
Hurrell, J. W., Kushnir, Y., Ottersen, G., and Visbeck, M.: An overview of the North Atlantic oscillation, Geophysical Monograph-American Geophysical Union, 134, 1–36, 2003. a
Hutchins, D. A. and Tagliabue, A.: Feedbacks between phytoplankton and nutrient cycles in a warming ocean, Nature Geoscience, 17, 495–502, 2024. a
Iglesias-Rodriguez, M. D., Halloran, P. R., Rickaby, R. E., Hall, I. R., Colmenero-Hidalgo, E., Gittins, J. R., Green, D. R., Tyrrell, T., Gibbs, S. J., Von Dassow, P., Rehm, E., Armbrust, E. V., and Boessenkool, K. P.: Phytoplankton calcification in a high-CO2 world, Science, 320, 336–340, 2008. a
Klaas, C. and Archer, D. E.: Association of sinking organic matter with various types of mineral ballast in the deep sea: Implications for the rain ratio, Global Biogeochemical Cycles, 16, https://doi.org/10.1029/2001GB001765, 2002. a
Kondrik, D., Pozdnyakov, D., and Johannessen, O.: Satellite evidence that E. huxleyi phytoplankton blooms weaken marine carbon sinks, Geophysical Research Letters, 45, 846–854, 2018. a
Krumhardt, K. M., Lovenduski, N. S., Long, M. C., Lévy, M., Lindsay, K., Moore, J. K., and Nissen, C.: Coccolithophore growth and calcification in an acidified ocean: Insights from community Earth system model simulations, Journal of Advances in Modeling Earth Systems, 11, 1418–1437, 2019. a, b
Le Grix, N., Zscheischler, J., Rodgers, K. B., Yamaguchi, R., and Frölicher, T. L.: Hotspots and drivers of compound marine heatwaves and low net primary production extremes, Biogeosciences, 19, 5807–5835, https://doi.org/10.5194/bg-19-5807-2022, 2022. a
Lellouche, J.-M., Greiner, E., Bourdalle-Badie, R., Garric, G., Melet, A., Drévillon, M., Bricaud, C., Hamon, M., Le Galloudec, O., Regnier, C., Candela, T., Testut, C.-E., Gasparin, F., Ruggiero, G., Benkiran, M., Drillet, Y., and Le Traon, P.-Y.: The Copernicus global 1/12 oceanic and sea ice GLORYS12 reanalysis, Frontiers in Earth Science, 9, 698876, https://doi.org/10.3389/feart.2021.698876, 2021. a
Levitus, S., Matishov, G., Seidov, D., and Smolyar, I.: Barents Sea multidecadal variability, Geophysical Research Letters, 36, https://doi.org/10.1029/2009GL039847, 2009. a
Li, Z., England, M. H., and Groeskamp, S.: Recent acceleration in global ocean heat accumulation by mode and intermediate waters, Nature Communications, 14, 6888, https://doi.org/10.1038/s41467-023-42468-z, 2023. a
MacFerrin, M., Amante, C., Carignan, K., Love, M., and Lim, E.: The Earth Topography 2022 (ETOPO 2022) global DEM dataset, Earth System Science Data, 17, 1835–1849, https://doi.org/10.5194/essd-17-1835-2025, 2025. a
Mahmood, R., von Salzen, K., Norman, A.-L., Galí, M., and Levasseur, M.: Sensitivity of Arctic sulfate aerosol and clouds to changes in future surface seawater dimethylsulfide concentrations, Atmospheric Chemistry and Physics, 19, 6419–6435, https://doi.org/10.5194/acp-19-6419-2019, 2019. a
Malin, G., Turner, S., Liss, P., Holligan, P., and Harbour, D.: Dimethylsulphide and dimethylsulphoniopropionate in the Northeast Atlantic during the summer coccolithophore bloom, Deep Sea Research Part I: Oceanographic Research Papers, 40, 1487–1508, 1993. a
Meyer, J. and Riebesell, U.: Reviews and Syntheses: Responses of coccolithophores to ocean acidification: a meta-analysis, Biogeosciences, 12, 1671–1682, https://doi.org/10.5194/bg-12-1671-2015, 2015. a
Minière, A., von Schuckmann, K., Sallée, J.-B., and Vogt, L.: Robust acceleration of Earth system heating observed over the past six decades, Scientific Reports, 13, 22975, https://doi.org/10.1038/s41598-023-49353-1, 2023. a
Moore, T. S., Dowell, M. D., and Franz, B. A.: Detection of coccolithophore blooms in ocean color satellite imagery: A generalized approach for use with multiple sensors, Remote Sensing of Environment, 117, 249–263, 2012. a
Müller, J. D., Gruber, N., Schneuwly, A., Bakker, D. C., Gehlen, M., Gregor, L., Hauck, J., Landschützer, P., and McKinley, G. A.: Unexpected decline in the ocean carbon sink under record-high sea surface temperatures in 2023, Nature Climate Change, 15, 978–985, 2025. a
Neukermans, G. and Fournier, G.: Optical modeling of spectral backscattering and remote sensing reflectance from Emiliania huxleyi blooms, Frontiers in Marine Science, 5, 146, https://doi.org/10.3389/fmars.2018.00146, 2018. a
Neukermans, G., Oziel, L., and Babin, M.: Increased intrusion of warming Atlantic water leads to rapid expansion of temperate phytoplankton in the Arctic, Global Change Biology, 24, 2545–2553, 2018. a, b, c, d, e, f, g, h, i, j
Neukermans, G., Bach, L., Butterley, A., Sun, Q., Claustre, H., and Fournier, G.: Quantitative and mechanistic understanding of the open ocean carbonate pump-perspectives for remote sensing and autonomous in situ observation, Earth-Science Reviews, 239, 104359, https://doi.org/10.1016/j.earscirev.2023.104359, 2023. a, b
Nissen, C., Vogt, M., Münnich, M., Gruber, N., and Haumann, F. A.: Factors controlling coccolithophore biogeography in the Southern Ocean, Biogeosciences, 15, 6997–7024, https://doi.org/10.5194/bg-15-6997-2018, 2018. a
O'Brien, C. J.: Global-scale distributions of marine haptophyte phytoplankton, Phd thesis, ETH Zurich, https://www.research-collection.ethz.ch/bitstream/handle/20.500.11850/155234/eth-48069-01.pdf?sequence=1 (last access: 9 January 2026), 2015. a, b, c, d, e
O'Brien, C. J., Peloquin, J. A., Vogt, M., Heinle, M., Gruber, N., Ajani, P., Andruleit, H., Arístegui, J., Beaufort, L., Estrada, M., Karentz, D., Kopczyńska, E., Lee, R., Poulton, A. J., Pritchard, T., and Widdicombe, C.: Global marine plankton functional type biomass distributions: coccolithophores, Earth System Science Data, 5, 259–276, https://doi.org/10.5194/essd-5-259-2013, 2013. a, b
O'Brien, C. J., Vogt, M., and Gruber, N.: Global coccolithophore diversity: Drivers and future change, Progress in Oceanography, 140, 27–42, 2016. a, b
Oliver, E. C., Benthuysen, J. A., Darmaraki, S., Donat, M. G., Hobday, A. J., Holbrook, N. J., Schlegel, R. W., and Sen Gupta, A.: Marine heatwaves, Annual Review of Marine Science, 13, 313–342, 2021. a
Oziel, L., Sirven, J., and Gascard, J.-C.: The Barents Sea frontal zones and water masses variability (1980–2011), Ocean Science, 12, 169–184, https://doi.org/10.5194/os-12-169-2016, 2016. a
Oziel, L., Neukermans, G., Ardyna, M., Lancelot, C., Tison, J.-L., Wassmann, P., Sirven, J., Ruiz-Pino, D., and Gascard, J.-C.: Role for Atlantic inflows and sea ice loss on shifting phytoplankton blooms in the Barents Sea, Journal of Geophysical Research: Oceans, 122, 5121–5139, 2017. a
Oziel, L., Baudena, A., Ardyna, M., Massicotte, P., Randelhoff, A., Sallée, J.-B., Ingvaldsen, R. B., Devred, E., and Babin, M.: Faster Atlantic currents drive poleward expansion of temperate phytoplankton in the Arctic Ocean, Nature Communications, 11, 1705, https://doi.org/10.1038/s41467-020-15485-5, 2020. a, b, c, d, e
Polyakov, I. V., Pnyushkov, A. V., Alkire, M. B., Ashik, I. M., Baumann, T. M., Carmack, E. C., Goszczko, I., Guthrie, J., Ivanov, V. V., Kanzow, T., Krishfield, R., Kwok, R., Sundfjord, A., Morison, J., Rember, R., and Yulin, A.: Greater role for Atlantic inflows on sea-ice loss in the Eurasian Basin of the Arctic Ocean, Science, 356, 285–291, 2017. a
Poulton, A. J., Adey, T. R., Balch, W. M., and Holligan, P. M.: Relating coccolithophore calcification rates to phytoplankton community dynamics: Regional differences and implications for carbon export, Deep Sea Research Part II: Topical Studies in Oceanography, 54, 538–557, 2007. a
Rantanen, M., Karpechko, A. Y., Lipponen, A., Nordling, K., Hyvärinen, O., Ruosteenoja, K., Vihma, T., and Laaksonen, A.: The Arctic has warmed nearly four times faster than the globe since 1979, Communications Earth & Environment, 3, 168, https://doi.org/10.1038/s43247-022-00498-3, 2022. a, b
Ribes, A., Thao, S., and Cattiaux, J.: Describing the relationship between a weather event and climate change: a new statistical approach, Journal of Climate, 33, 6297–6314, 2020. a
Riebesell, U., Zondervan, I., Rost, B., Tortell, P. D., Zeebe, R. E., and Morel, F. M.: Reduced calcification of marine plankton in response to increased atmospheric CO2, Nature, 407, 364–367, 2000. a
Rigual Hernández, A. S., Trull, T. W., Nodder, S. D., Flores, J. A., Bostock, H., Abrantes, F., Eriksen, R. S., Sierro, F. J., Davies, D. M., Ballegeer, A.-M., Fuertes, M. A., and Northcote, L. C.: Coccolithophore biodiversity controls carbonate export in the Southern Ocean, Biogeosciences, 17, 245–263, https://doi.org/10.5194/bg-17-245-2020, 2020. a
Rivero-Calle, S., Gnanadesikan, A., Del Castillo, C. E., Balch, W. M., and Guikema, S. D.: Multidecadal increase in North Atlantic coccolithophores and the potential role of rising CO2, Science, 350, 1533–1537, 2015. a
Rost, B. and Riebesell, U.: Coccolithophores and the biological pump: responses to environmental changes, in: Coccolithophores From Molecular Processes to Global Impact, edited by: Thierstein, H. R. and Young, J. R., Springer, https://doi.org/10.1007/978-3-662-06278-4_5, 2004. a
Rousi, E., Kornhuber, K., Beobide-Arsuaga, G., Luo, F., and Coumou, D.: Accelerated western European heatwave trends linked to more-persistent double jets over Eurasia, Nature Communications, 13, 3851, https://doi.org/10.1038/s41467-022-31432-y, 2022. a
Sallée, J.-B., Pellichero, V., Akhoudas, C., Pauthenet, E., Vignes, L., Schmidtko, S., Garabato, A. N., Sutherland, P., and Kuusela, M.: Summertime increases in upper-ocean stratification and mixed-layer depth, Nature, 591, 592–598, 2021. a
Santana-Falcón, Y., Yamamoto, A., Lenton, A., Jones, C. D., Burger, F. A., John, J. G., Tjiputra, J., Schwinger, J., Kawamiya, M., Frölicher, T. L., Ziehn, T., and Séférian, R.: Irreversible loss in marine ecosystem habitability after a temperature overshoot, Communications Earth & Environment, 4, 343, https://doi.org/10.1038/s43247-023-01002-1, 2023. a
Sen Gupta, A., Thomsen, M., Benthuysen, J. A., Hobday, A. J., Oliver, E., Alexander, L. V., Burrows, M. T., Donat, M. G., Feng, M., Holbrook, N. J., Perkins-Kirkpatrick, S., Moore, P. J., Rodrigues, R. R., Scannell, H. A., Taschetto, A. S., Ummenhofer, C. C., Wernberg, T., and Smale, D. A.: Drivers and impacts of the most extreme marine heatwave events, Scientific Reports, 10, 19359, https://doi.org/10.1038/s41598-020-75445-3, 2020. a
Shutler, J., Grant, M., Miller, P., Rushton, E., and Anderson, K.: Coccolithophore bloom detection in the north east Atlantic using SeaWiFS: Algorithm description, application and sensitivity analysis, Remote Sensing of Environment, 114, 1008–1016, 2010. a
Shutler, J. D., Land, P. E., Brown, C. W., Findlay, H. S., Donlon, C. J., Medland, M., Snooke, R., and Blackford, J. C.: Coccolithophore surface distributions in the North Atlantic and their modulation of the air-sea flux of CO2 from 10 years of satellite Earth observation data, Biogeosciences, 10, 2699–2709, https://doi.org/10.5194/bg-10-2699-2013, 2013. a
Simon, A., Poppeschi, C., Plecha, S., Charria, G., and Russo, A.: Coastal and regional marine heatwaves and cold spells in the northeastern Atlantic, Ocean Science, 19, 1339–1355, https://doi.org/10.5194/os-19-1339-2023, 2023. a
Smith, K. E., Burrows, M. T., Hobday, A. J., Sen Gupta, A., Moore, P. J., Thomsen, M., Wernberg, T., and Smale, D. A.: Socioeconomic impacts of marine heatwaves: Global issues and opportunities, Science, 374, 3593, https://doi.org/10.1126/science.abj3593, 2021. a
Smith, K. E., Burrows, M. T., Hobday, A. J., King, N. G., Moore, P. J., Sen Gupta, A., Thomsen, M. S., Wernberg, T., and Smale, D. A.: Biological impacts of marine heatwaves, Annual Review of Marine Science, 15, 119–145, 2023. a
Stott, P. A., Christidis, N., Otto, F. E., Sun, Y., Vanderlinden, J. P., van Oldenborgh, G. J., Vautard, R., von Storch, H., Walton, P., Yiou, P., and Zwiers, F. W.: Attribution of extreme weather and climate-related events, Wiley Interdisciplinary Reviews: Climate Change, 7, 23–41, 2016. a
Terhaar, J., Kwiatkowski, L., and Bopp, L.: Emergent constraint on Arctic Ocean acidification in the twenty-first century, Nature, 582, 379–383, 2020. a
Terhaar, J., Burger, F. A., Vogt, L., Frölicher, T. L., and Stocker, T. F.: Record sea surface temperature jump in 2023–2024 unlikely but not unexpected, Nature, 639, 942–946, 2025. a
Tong, S., Gao, K., and Hutchins, D. A.: Adaptive evolution in the coccolithophore Gephyrocapsa oceanica following 1,000 generations of selection under elevated CO2, Global Change Biology, 24, 3055–3064, 2018. a
von Schuckmann, K., Minière, A., Gues, F., Cuesta-Valero, F. J., Kirchengast, G., Adusumilli, S., Straneo, F., Ablain, M., Allan, R. P., Barker, P. M., Beltrami, H., Blazquez, A., Boyer, T., Cheng, L., Church, J., Desbruyeres, D., Dolman, H., Domingues, C. M., García-García, A., Giglio, D., Gilson, J. E., Gorfer, M., Haimberger, L., Hakuba, M. Z., Hendricks, S., Hosoda, S., Johnson, G. C., Killick, R., King, B., Kolodziejczyk, N., Korosov, A., Krinner, G., Kuusela, M., Landerer, F. W., Langer, M., Lavergne, T., Lawrence, I., Li, Y., Lyman, J., Marti, F., Marzeion, B., Mayer, M., MacDougall, A. H., McDougall, T., Monselesan, D. P., Nitzbon, J., Otosaka, I., Peng, J., Purkey, S., Roemmich, D., Sato, K., Sato, K., Savita, A., Schweiger, A., Shepherd, A., Seneviratne, S. I., Simons, L., Slater, D. A., Slater, T., Steiner, A. K., Suga, T., Szekely, T., Thiery, W., Timmermans, M.-L., Vanderkelen, I., Wjiffels, S. E., Wu, T., and Zemp, M.: Heat stored in the Earth system 1960–2020: where does the energy go?, Earth System Science Data, 15, 1675–1709, https://doi.org/10.5194/essd-15-1675-2023, 2023. a
Werdell, P. J., Behrenfeld, M. J., Bontempi, P. S., Boss, E., Cairns, B., Davis, G. T., Franz, B. A., Gliese, U. B., Gorman, E. T., Hasekamp, O., Knobelspiesse, K. D., Mannino, A., Vanderlei Martins, J., McClain, C. R., Meister, G., and Remer, L. A.: The plankton, aerosol, cloud, ocean ecosystem mission: Status, science, advances, Bulletin of the American Meteorological Society, 100, 1775–1794, 2019. a
Wernberg, T., Thomsen, M. S., Burrows, M. T., Filbee-Dexter, K., Hobday, A. J., Holbrook, N. J., Montie, S., Moore, P. J., Oliver, E. C., Sen Gupta, A., Smale, D. A., and Smith, K.: Marine heatwaves as hot spots of climate change and impacts on biodiversity and ecosystem services, Nature Reviews Biodiversity, 1, 461–479, 2025. a
Winter, A., Henderiks, J., Beaufort, L., Rickaby, R. E., and Brown, C. W.: Poleward expansion of the coccolithophore Emiliania huxleyi, Journal of Plankton Research, 36, 316–325, 2014. a, b, c, d
Zscheischler, J., Westra, S., Van Den Hurk, B. J., Seneviratne, S. I., Ward, P. J., Pitman, A., AghaKouchak, A., Bresch, D. N., Leonard, M., Wahl, T., and Zhang, X.: Future climate risk from compound events, Nature Climate Change, 8, 469–477, 2018. a