the Creative Commons Attribution 4.0 License.
the Creative Commons Attribution 4.0 License.
 | 01 Apr 2026
Coastal circulation and dispersion of passive tracers in the Red River plume region: unveiling seasonal- and intra-seasonal variability
Thanh Huyen Tran
Alexei Sentchev
Dylan Dumas
Charles-Antoine Guerin
Sylvain Ouillon
The Red River (RR) plume region of the Gulf of Tonkin (GoT) plays an important role in driving coastal dynamic variability and regulating sediment and nutrient transport and budgets, and is therefore vital for coastal ecosystems and maritime activities. High-frequency radar (HFR) surface current measurements were used to characterize surface circulation and assess passive-tracer dispersion from August to December 2024, improving understanding of particle transport, dispersal, and fate in this region. The coastal circulation in the region, found to be strongly influenced by winds, tidal forcing, riverine input, and coastal bathymetry, exhibited a large spatio-temporal variability during the analysis period with the occurrence of small-scale structures, i.e., submesoscale eddies. The dispersion under varying forcing conditions and an extreme event – the typhoon Yagi – was analyzed by particle tracking and Lagrangian diagnostics. The results revealed that the dispersion within the RR plume region predominantly approached a Richardson super-diffusive regime after 24 h of tracking. Under the influence of typhoon Yagi, the dispersion was approximated by a ballistic regime after 12 h of tracking, with the spreading rate 10 times faster than that during normal conditions. In addition, the presence of Lagrangian Coherent Structures (LCSs), i.e., eddies next to the river outflow jets, coastal plume fronts, and zones of surface current convergence and divergence in the vicinity of river outlets, significantly influenced the dispersion behavior of tracers in the RR plume region. Overall, this study provides new insights into how coastal circulation and material dispersal in the RR plume respond across a wide range of weather conditions, including extreme events.
- Article
(5117 KB) - Full-text XML
- BibTeX
- EndNote


River plume regions and deltas are of strategic importance to coastal and marine management authorities, as they encompass ecologically productive habitats, support socio-economic activities such as fisheries and aquaculture, and serve as critical connections in regional and international maritime navigation. A crucial concern in the contemporary context is the rise in anthropogenic pollution in coastal waters, which poses significant threats to both ecosystem health and human well-being. Effective mitigation of coastal pollution requires a comprehensive understanding of the underlying mechanisms governing the transport, dispersal and fate of pollutants in river plume areas and neighboring coastal waters.
A river plume is a buoyant mass of fresh or brackish water in the vicinity of river mouths, characterized by lower salinity than that of the ambient seawater. The freshwater from a river, when entering the sea, forms a buoyant coastal current which can travel long distances along the coast before being dispersed by mixing and advection (Garvine, 1995; Horner-Devine et al., 2015; Lentz, 2012; Münchow and Garvine, 1993; Zong et al., 2024). Simultaneously, it carries suspended materials along its pathway. The density contrast between freshwater and seawater, regulated by mixing and advection at the river mouth, significantly influences sediment transport and fate (Geyer et al., 2004). At the initial stage, when sediment and other material sources are flushed into the coastal water, the initial dispersion is strongly regulated by the direction and magnitude of alongshore tidal currents (van Maren, 2007). Mazzini et al. (2014) emphasized that freshwater plumes can significantly enhance the transport and alongshore propagation of suspended materials through the formation of coherent structures, thereby influencing sediment pathways, nutrient, and pollutant distribution in coastal waters. Due to the highly dynamic nature of plume regions – governed by the interplay of fluvial discharge, tides, winds, shallow bathymetry, and mesoscale circulations – studying coastal dynamics and dispersion processes requires high-resolution and reliable observational data and simulations capable of capturing small-scale processes and featuring dispersion patterns.
How can we quantitatively inspect the dispersion of passive tracers and plume dynamics based on the acquired data from measurements? Satellite-based imagery and derived products, e.g., sea surface temperature (SST), suspended sediment concentration or turbidity, Chlorophyll-a concentration, colored dissolved organic matter (CDOM), etc., from various sensors such as SeaWiFS, Sentinel-2, Sentinel-3, or Landsat-8 have been widely used for assessing river plume behaviors influencing passive tracer transport and dispersion in the coastal ocean adjacent to rivers (Durand et al., 2002; Fratantoni and Glickson, 2002; Molleri et al., 2010; Tavora et al., 2023; Tran, 2023a). Despite advances in spatial coverage, satellite data are limited by coarse temporal resolution, cloud cover during the rainy season, and the need for calibration since they do not directly measure surface water properties.
Other studies presented different approaches to investigate the plume dynamics by using modelling exclusively (Kourafalou and Androulidakis, 2013; Nguyen-Duy et al., 2021), or particle dispersion associated with plumes using modelling in combination with observations, i.e., surface drifters (Sentchev et al., 2025). By using wind ensemble analysis to examine plume sensitivity to wind forcing, Nguyen-Duy et al. (2023) demonstrated that plume area variability is highly sensitive to the uncertainty of wind forcing, as represented by different ensemble members. Thus, modeling results become highly uncertain under extreme conditions, where the spatio-temporal variability of forcing is large, and accurate forcing input data – particularly wind fields – are often insufficient or unavailable. Regarding particle tracking, surface drifters are used to compare and validate modelled surface current velocity fields. However, in highly dynamic regions, dispersion is strongly modulated by fine-scale processes, governed by complex interplay of forcings, which is difficult to capture with a limited number of surface drifters.
High-frequency radar (HFR), a land-based remote-sensing technology, has been used together with other observational data for inspecting submesoscale processes and pathways of passive tracers in coastal regions influenced by freshwater inputs (Bertin et al., 2024; Davila et al., 2021; Ruiz et al., 2022). As a ground-based system, HFR observes the ocean at grazing incidence with antennas nearly parallel to the sea surface, which extends range and enhances signal-to-noise ratio through efficient Bragg backscatter, unlike nadir-looking radars that view from above and do not exploit resonant Bragg scattering for surface current measurements. There are two common HFR configuration: CODAR, a compact antenna system using direction finding (DF); and WERA, a phased-array antenna system using beam forming (BF) techniques. In CODAR, DF performance depends on accurate antenna pattern characterization and external calibration (Mantovani et al., 2020), thus is sensitive to signal decorrelation in energetic sea states, reducing azimuthal accuracy and degrading current estimates in highly dynamic coastal environments. On the contrary, in WERA, BF can self-calibrate via internal antenna-array consistency checks (direct path test; Mantovani et al., 2020), reducing reliance on external calibration, and thus improves signal coherence under various sea states. With this physical principle, WERA provides near-real-time continuous surface current velocity fields with large spatial coverage, high spatio-temporal resolution, and is able to work under dynamic sea states, thereby constituting a robust tool for characterizing coastal dynamics in highly-dynamic river plume regions. In this study, a WERA system was used to monitor surface currents in the area of interest, the Red River (RR) plume region.
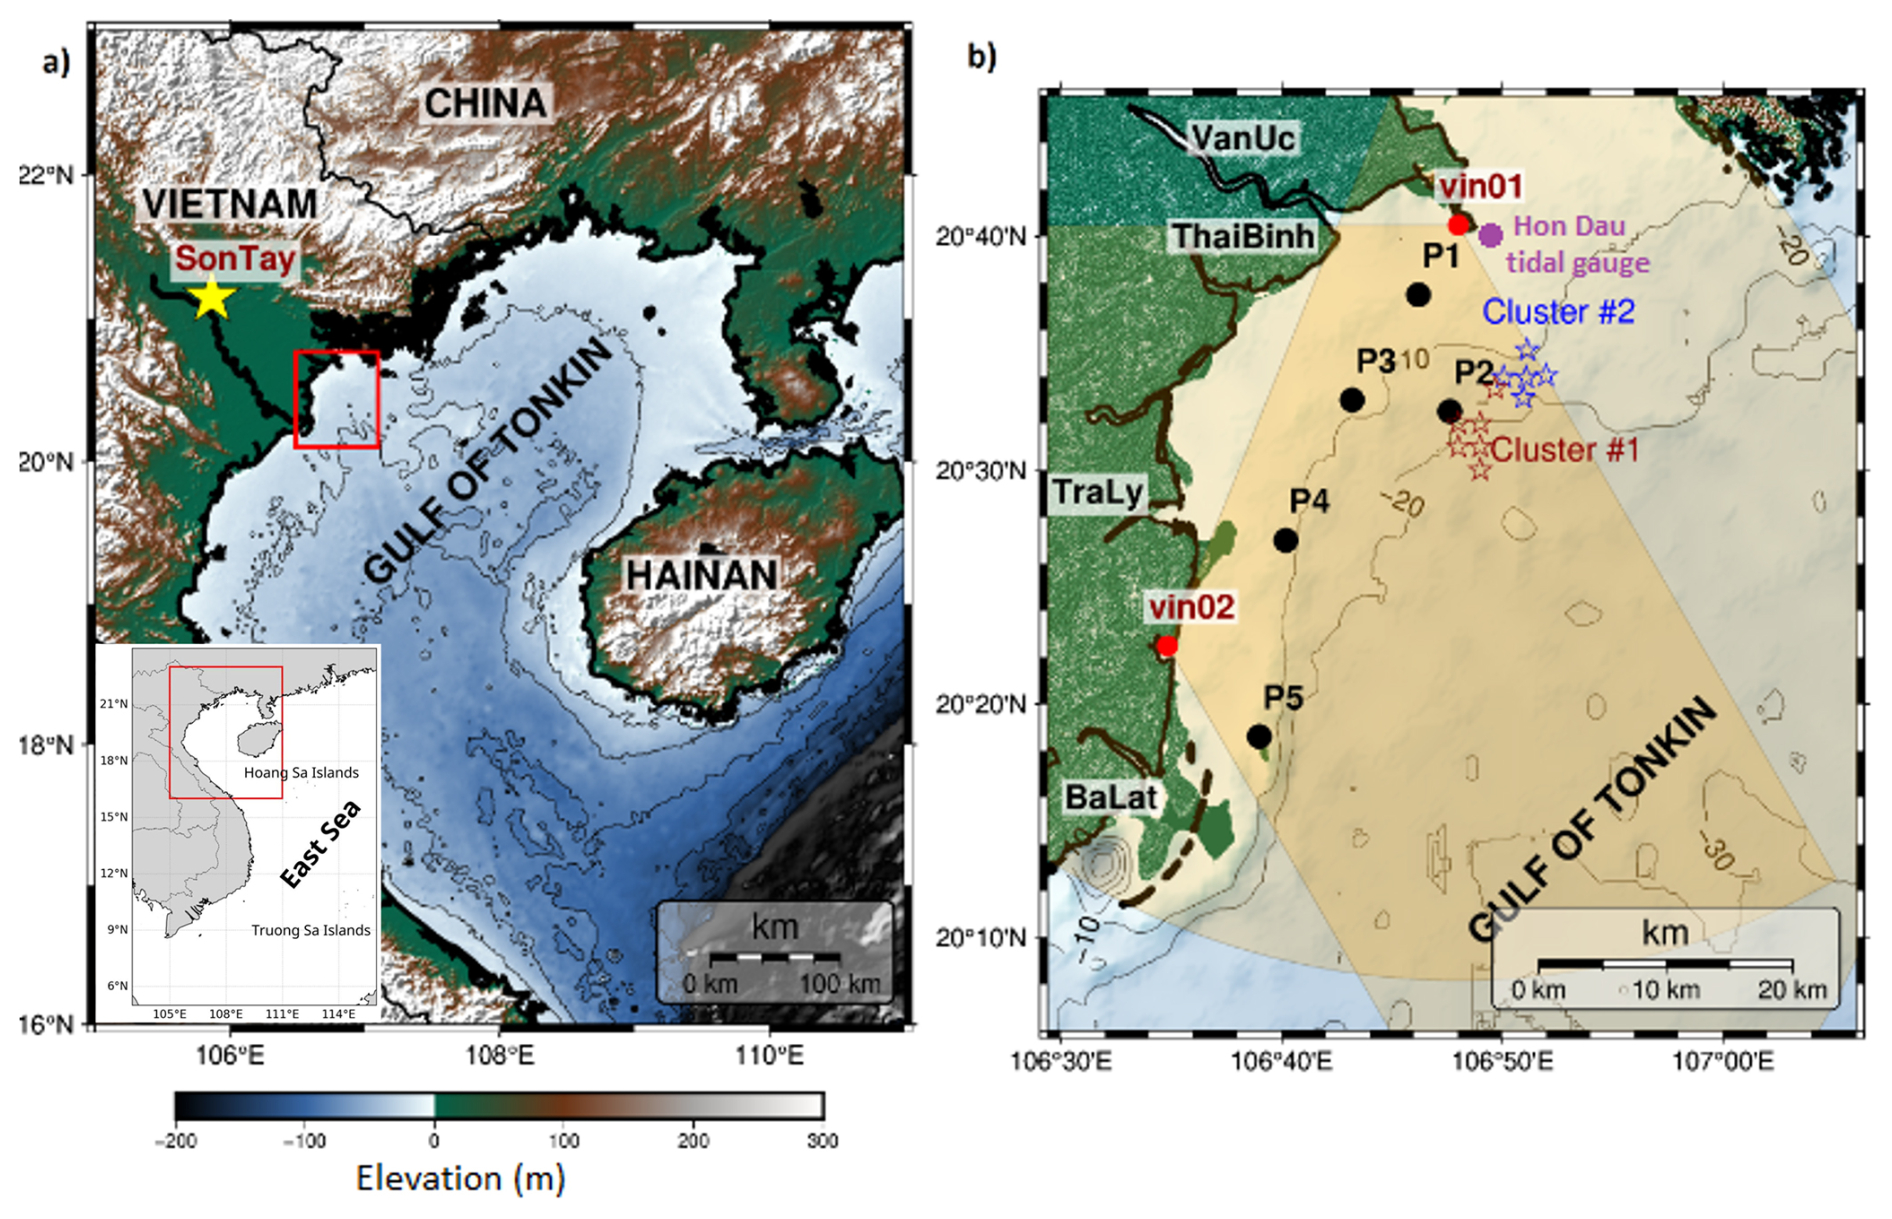
Figure 1(a) Map of the GoT, Son Tay hydrological station is marked by the yellow star, the red rectangular shows the RR plume domain; (b) map of RR plume area. Yellow areas indicate the coverage of the two HFR stations. Drifter locations are denoted by red stars for C1, released on 30 November 2024, and blue stars, for C2 released on 3 December 2024. Black dots show locations of virtual clusters selected for particle tracking. Red dots are locations of two radar stations (vin01, vin02). The purple dot represents the Hon Dau tidal gauge. Names of main rivers are highlighted with white boxes. Black solid lines indicate depth contours of 10, 20, and 30 m.
The RR plume domain, located along the western margin of the Gulf of Tonkin (GoT) (Fig. 1a), is characterized by shallow waters and deltaic-estuarine coastlines. Due to the strong thermal and salinity contrasts between river and coastal water, frontal zones and stratification are formed in the river plume region, primarily driven by buoyancy and density gradients (Horner-Devine et al., 2015; Mazzini et al., 2014; Münchow and Garvine, 1993). The RR plume plays an important role in driving coastal dynamic variability and regulating sediment transport and budgets (van Maren, 2007). Previous studies on the western GoT, particularly the RR plume, have relied primarily on numerical modeling and surface drifters to investigate coastal plume dynamics and turbulent dispersion (Nguyen-Duy et al., 2021; Sentchev et al., 2025; Tran et al., 2022; Zavala-Garay et al., 2022). Although HFR measurements have been used to study coastal circulation variability in the GoT (Nguyen-Duy et al., 2021; Rogowski et al., 2019; Tran et al., 2022; Zavala-Garay et al., 2022), their spatial resolution was coarse (∼6 km) and spatial coverage did not encompass the entire plume region. Consequently, fine-scale processes, such as submesoscale eddies and fronts, that drive tracer dispersion in the RR plume, as well as the interaction between river outflows and coastal waters, could not be comprehensively characterized.
To address this problem, we employed a combination of surface drifters and higher spatio-temporal resolution HFR measurements to characterize coastal dynamics and dispersion in the RR plume region from August to December 2024. This study delivers the first near-real-time, 1 km-resolution dataset of surface currents in the RR plume region using HFR technology. Subsequently, we implement Lagrangian analysis with particle-tracking simulation based on HFR-derived surface velocity fields to identify the main driving force controlling turbulent dispersion in the RR plume region. Lagrangian diagnostics have been widely employed to investigate the dispersion behavior of particles in coastal waters (Berti and Lapeyre, 2021; Bertin et al., 2024; d'Ovidio et al., 2004; Gough et al., 2016; Hernández-Carrasco et al., 2011; Sentchev et al., 2025; Tran et al., 2022). Unlike traditional Eulerian diagnostics that examine turbulence from fixed locations over time, the Lagrangian approach helps to interlink it with the behaviors of water parcels moving through the flow fields (d'Ovidio et al., 2009) and therefore, is more straightforward to represent the fate and pathways of particles in the oceans. Leimann et al. (2025) emphasized that, Lagrangian diagnostics offered a robust and complementary view of flow variability to Eulerian approach, especially in coastal regions characterized by strong fronts and non-geostrophic motions. On HFR flow fields, the Lagrangian diagnostics and approach have been deployed with a various range of purposes: investigating scales of motions via relative and absolute dispersion (Berti et al., 2010; Bertin et al., 2024; Tran et al., 2022), identifying coherent structures, i.e., eddies, filaments, and fronts strongly affecting the rate of dispersion via finite-size Lyapunov exponent (FSLE) or finite-time Lyapunov exponent (FTLE) (Berti et al., 2010; Gough et al., 2016; Tran et al., 2022), or investigating the advection and the evolution of bio-chemical substances, e.g., Chlorophyll, in the sea waters via Lagrangian residual currents (Davila et al., 2021), or a Lagrangian modelling with biological parameters in Mckee et al. (2024). Within the scope of this paper, we use relative and absolute dispersion metrics to investigate the dispersion of particles in the RR plume area. A number of studies have been undergone in the region, however, primarily focused on seasonal patterns (van Maren, 2007; Nguyen-Duy et al., 2021; Sentchev et al., 2025; Tran et al., 2022). In a broader context, this current study provides a unique opportunity to examine flow fields and dispersion regimes not only during mature monsoon periods, but also during the monsoonal transition from summer to winter, as well as under the influence of an extreme event, i.e., the typhoon Yagi. Accordingly, our findings contribute to a deeper understanding of plume dynamics under a wide range of environmental conditions.
2.1 The Red River (RR) plume region
The RR plume region includes several river estuaries, Van Uc, Thai Binh, Tra Ly, and Ba Lat, arranged from north to south along the coast (Fig. 1b). Coastal plumes in the region exhibit pronounced seasonal spatial variability. During summer, the plumes expand eastward and offshore, referring to an upwelling-favorable condition, occupying a significantly larger area which can extend up to ∼100 km offshore (Nguyen-Duy et al., 2021; Rogowski et al., 2019), whereas in winter, they remain confined near the coastline, typically within 10 km from shore (Nguyen-Duy et al., 2021; Zavala-Garay et al., 2022), referring to a downwelling condition. A mutual agreement has been established based on a number of conditions (e.g. Nguyen, 2022; Rogowski et al., 2019; Zavala-Garay et al., 2022) that the seasonal variability of river plumes in the GoT is mainly governed by monsoon wind. During our experiment (August to December 2024), winds predominantly exhibited a southwesterly direction in August, consistent with the prevailing summer monsoon regime. The passage of typhoon Yagi on 7 September led to an anomalous peak in wind speed (exceeding 15 m s−1), observed between 5 and 9 September. After the passage of typhoon Yagi, the typical summer monsoon wind was replaced by a more complex pattern, marking a transitional period before the onset of the winter monsoon, which was characterized by northeasterly winds in December (Fig. 2).
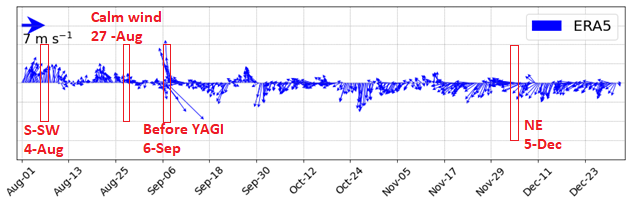
Figure 2Wind time-series from the ERA5 global dataset extracted at the position of Hon Dau meteorological station, August–December 2024. Red boxes present the selected periods of Lagrangian tracking.
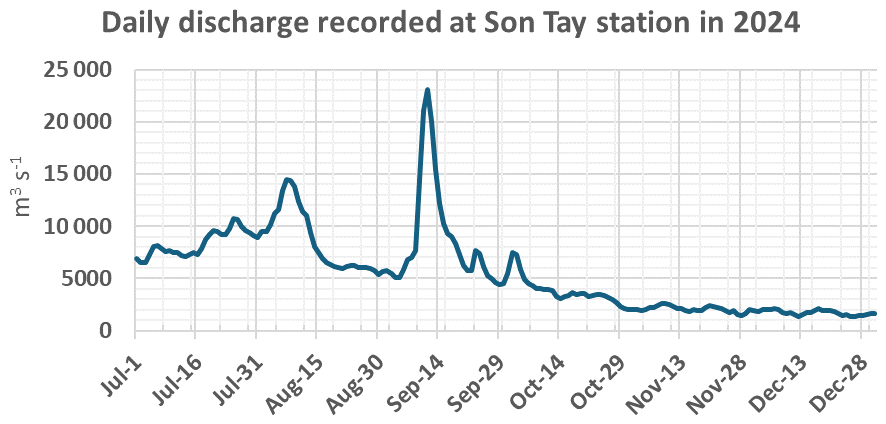
Regarding discharge, high-resolution simulations for the period 2011–2016 conducted by Nguyen-Duy et al. (2021) and statistics based on discharge from 2019–2024 recorded at Son Tay station (the yellow star in the Fig. 1a), at the apex of the RR delta (see Vinh and Thanh, 2014), showed that the flooding season with large discharges varies from the end of July till the end of September, and the lowest discharges were observed from November onward. The maximum peak discharge over the past years since 2011 did not exceed 15 000 m3 s−1. During the analysis period of this study, there was a high discharge recorded during the first week of August, with a peak discharge of approximately 15 000 m3 s−1. An anomalously high discharge, induced by typhoon Yagi and dam releases from upstream regions, occurred between 7 and 18 September, with peak values exceeding 23 000 m3 s−1 (Fig. 3). The impacts of this abnormal event will be analyzed and discussed in the next sections.
2.2 Data
2.2.1 HF radar data
The HF radar system deployed in the RR plume area is a WERA system, consisting of two separated radar stations denoted as vin01 and vin02 in Fig. 1. Each site was designed with a matrix of 4 transmitting antennas (Tx) and a linear array of 12 receiving antennas (Rx). Both radars were configured at a central operating frequency of 16.15 MHz, 1 km grid resolution and 30 min integration time. The domain spans from [20.1°N 106.5° E] to [20.75° N 107.2° E] and covers the RR plume region, from Ba Lat to Van Uc river mouths. In total, the measurements were performed over eight months from August 2024 to April 2025. The measurement data used in this study were available only during three subperiods due to interruptions: 1 August–7 September 2024, 18 September–31 October 2024, and 30 November–31 December 2024. The gaps between these subperiods reflect data interruptions associated with Typhoon Yagi and post-typhoon flooding (7–18 September), as well as an HFR system failure caused by flood-induced cable submergence, resulting in inconsistent data quality in November 2024.
At first, raw data collected from two HF radar stations were processed via an advanced radar signal processing software developed by the Mediterranean Institute of Oceanography (MIO), University of Toulon, with the method described in Dumas and Guérin (2023), and Dumas et al. (2025). The software incorporates three sequential steps: (1) phase calibration to correct phase shift errors between receiving antennas; (2) pre-conditioning of the First Order Bragg Region using a classical Beam Forming technique; (3) antenna grouping to optimize the filling ratio in the Direction Finding method to provide less gappy and less noisy current maps. This approach allows the MIO software to produce radial current data with improved spatial resolution, extended range, and more accurate source direction identification. Subsequently, the processed radial velocity data were used to reconstruct velocity fields of surface currents at 1km grid resolution with 2DVar interpolation method described in Yaremchuk and Sentchev (2009). 2DVar interpolation was proven for its robustness in working with gaps and coastline constraints. In details, gap-handling performance was evaluated in that study under conditions characterized by fine-scale structures (e.g., eddies) across a range of noise levels (0.1–0.5) and for scenarios both with and without data gaps.
Overall, the combined MIO and 2DVar procedure increased spatial coverage and reduced gaps in the reconstructed flow fields, which was particularly beneficial in the highly dynamic river-plume region where small-scale structures are prominent, resulting in more continuous and consistent current patterns than in the original flow fields. After processing with MIO software, spatial coverage of radial current fields extended beyond 60 km at vin01 and over 70 km at vin02 (Fig. 4a and b). Data gaps along the radar baseline (Fig. 4c) were effectively filled using the 2DVar interpolation method, resulting in increased data availability near the Van Uc River mouth. Spatial coverage expanded by over 15 km in the southern part of the domain (south of the Vin02 station) and extended further offshore beyond the 20 m isobath (Fig. 4c and d).
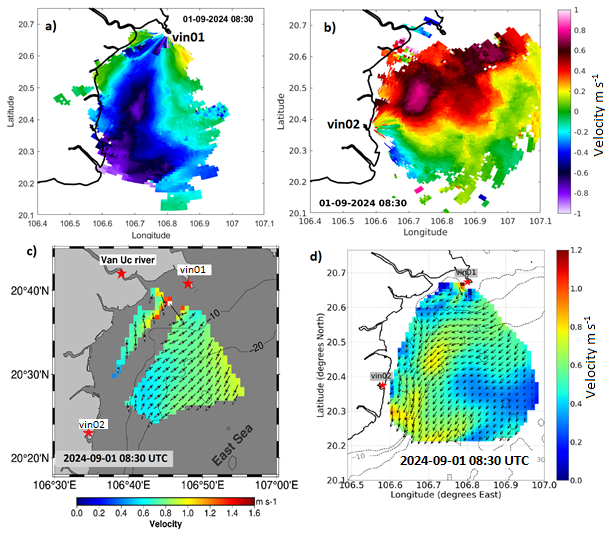
Figure 4Radial current velocity fields obtained from MIO software at Vin01 (a) and Vin02 (b) stations. Surface current velocity maps before (c) and after applying radar processing procedure (d).
2.2.2 Drifter data
To investigate the dispersion processes in the RR plume area under the northeasterly monsoon wind condition, two clusters of drifters were deployed on different days: Cluster 1 (C1) of six drifters (SVU5, SVU7, SVU8, SVU9, SVU12, SVU13) on 30 November 2024 and Cluster 2 (C2) of five drifters (SVU1, SVU2, SVU3, SVU14, SVU15) on 3 December 2024 (Fig. 1b). Release locations were chosen in the vicinity of the river plume extension. Those drifters are drogued plastic containers, 9 cm in height and 9.5 cm in diameter, with an approximate mass of 200 g, with a windage coefficient of less than 1 %. With the type of drifters used in this study, the instant wind effect was not substantial for a short period of tracking (Poulain et al., 2009). In addition, the drifter data were used to validate the HF radar measurements by comparing the trajectories and velocities of observed drifters with those of virtual drifters advected in HF radar-derived surface current fields.
2.2.3 Wind and other datasets
Wind, water level, and discharge data were used to consider the weather and hydrological conditions during the period of analysis. Hourly wind data at 0.25° resolution were collected from the ERA5 dataset provided by the European Centre for Medium-Range Weather Forecasts (ECMWF). Water level information was extracted from the tidal gauge at Hon Dau station. Discharge information was referred to Son Tay hydrological station [21°09′ N–105°52′ E] (Fig. 1a), upstream of the RR mouth, with the retention time to coastal outlets estimated at approximately 24 h.
2.3 Statistical estimates of dispersion
2.3.1 Lagrangian tracking
Virtual particles were released and tracked at different times and locations using the OceanParcels package (https://oceanparcels.org/, last access: 10 October 2025, Delandmeter and van Sebille, 2019), based on surface current velocity data obtained through the radar processing method described earlier. To validate the surface current velocity fields from HFR, virtual particles were released at the same times and positions as the real drifters and tracked within the real tracking time duration. For the Lagrangian diagnostics, 100 virtual particles were released with an initial spacing of 500 m and tracked over 48 h, with particle positions recorded every 30 min.
The accuracy of simulated trajectories was assessed via Lagrangian error metric εL, which was described in Liu and Weisberg (2011), Ruiz et al. (2022) and recently applied in Bertin et al. (2024). For each drifter, N denotes the number of recorded real drifter positions along its trajectory (sampled every 30 min over the 48 h tracking window). Virtual drifters are initialized at each of these 30 min recorded positions and tracked until the end of the tracking window, producing an ensemble of virtual trajectories, with maximum tracking duration of 48 h. For each time step of release ti, εL(ti) is the average of mean separation distances Dik between the real drifter trajectory and the corresponding virtual trajectories, where i indexes the time step after initial release, and k indexes the drifter position. Hence, the Lagrangian error, at each release time ti, and the Lagrangian error of the whole tracking time are represented as follows:
Details about the computation of the Lagrangian error were described in Fig. A1. The Lagrangian error, , after averaging over all buoy trajectories and tracking time, represents the degree of deviation between virtual and real trajectories caused by uncertainties in the flow fields e.g. resolution of interpolation grid, specification error of HF radar system, gap filling and interpolation process, etc., and thus serves as an effective measure of the goodness of the flow fields for Lagrangian tracking applications.
For a simpler interpretation, another dimensionless metric, the L-index, was computed. It is defined as the Lagrangian error over the entire tracking period divided by the mean travel distance of the real drifters in the same cluster. As being normalized by travel distance, “L” demonstrates the amplitude of Lagrangian error, regardless of tracking time and travel distance, thus, is suitable for comparison between different datasets.
2.3.2 Lagrangian diagnostics
Relative dispersion
Relative dispersion (δ2) is computed as the average separation distance between pairs of particles at a time t according to the following formula:
where and are the location of particles i and j within a cluster of release at time t, N is the total number of particles in the cluster.
Dispersion at the sea surface is governed by turbulent motions spanning a range of spatial scales and is therefore closely linked to the kinetic energy distribution of the flow. Previous studies (Berti et al., 2011; LaCasce, 2008) have shown that, under locality assumptions, relative dispersion may follow a power-law growth of the form: , where the exponent depends on the slope of the kinetic energy spectrum .
In two-dimensional turbulence, which provides a relevant framework for horizontal transport at the ocean surface, kinetic energy is transferred toward larger scales through an inverse energy cascade characterized by an inertial-range spectrum: (LaCasce, 2008). In this regime, relative dispersion is controlled by local interactions between eddies of comparable size and is therefore expected to approach asymptotically Richardson's super-diffusive scaling, δ2(t)∼t3, consistent with locality assumptions.
For β=1, the scaling δ2(t)∼t2 corresponds to a ballistic dispersion regime, often associated with shear-dominated flows in which large-scale velocity gradients control particle separation.
For , the particle-pair separation satisfies δ2(t)∼t, reflecting a diffusive, non-local dispersion regime. In this regime, particle separations are driven by large scale velocity gradients rather than by eddies of size comparable to the separation scales. This case should therefore be understood as a formal limiting behavior, rather than as a physically realistic turbulent cascade.
In a 2D flow field, the relative dispersion can be presented by the spreading of particles with respect to their center position (barycenter). This spreading behavior can be illustrated by an ellipse accounting for the variance of dispersion along its minor and major axes, and , respectively, at time t. At each time step, and are estimated via the Principal Component Analysis (PCA) method (Thomson and Emery, 2014). Hence, the two semi-axes and the orientation angle θ of the ellipse are calculated as follows:
where , are variances of particle coordinates along x and y axes, respectively, while is their covariance.
Absolute dispersion
Unlike relative dispersion, which is based on pairwise particle separation, absolute dispersion measures how particles individually spread from their initial positions over travel distances. Thus, absolute dispersion is defined as the variance of the displacement of individual particles to the initial position of the cluster at the release time t0. The absolute dispersion (A2) is presented in two components ( and ) along x and y axes, and the total variance: .
The absolute dispersion for particles with i and j coordinates along x and y axes, respectively, can be calculated as:
where ij=xy, N is the total number of particles in a cluster, xk(t) is the position vector, of coordinates (x, y), of the kth particle at time t, and xk(t0) is that at the release time. This approach facilitates a clearer understanding of how particle dispersion evolves spatially over time. Under a short time limit, when particle velocities are correlated, the dispersion is expected to follow a ballistic regime with A2(t)∼t2 (Sentchev et al., 2025; Sukhatme, 2005). In contrast, if the time-scale is larger than that of the current characteristic flow field, the particle velocities are no longer correlated, and the absolute dispersion evolves linearly with time: A2(t)∼αt, where α estimates the rate of dispersion or the diffusivity of particles in a cluster.
3.1 Comparison of real and virtual drifter trajectories
Overall, the trajectories of virtual drifters in the two clusters showed good agreement with those of the real drifters. The drifters were advected along the coastline, under the combined influence of downwelling-favorable currents, wind forcing, and tidal oscillations. Regarding the C1, there is a notable separation in the trajectories of SVU5 and SVU7 observed in real drifters but not in virtual ones (Fig. 5a and b). At the same grid cell (106.7° E, 20.5° N–106.8° E, 20.6° N) observed in C2, SVU1 trajectory was also detached from other trajectories of the same cluster, which was not seen in that of the virtual drifter (Fig. 5c and d).
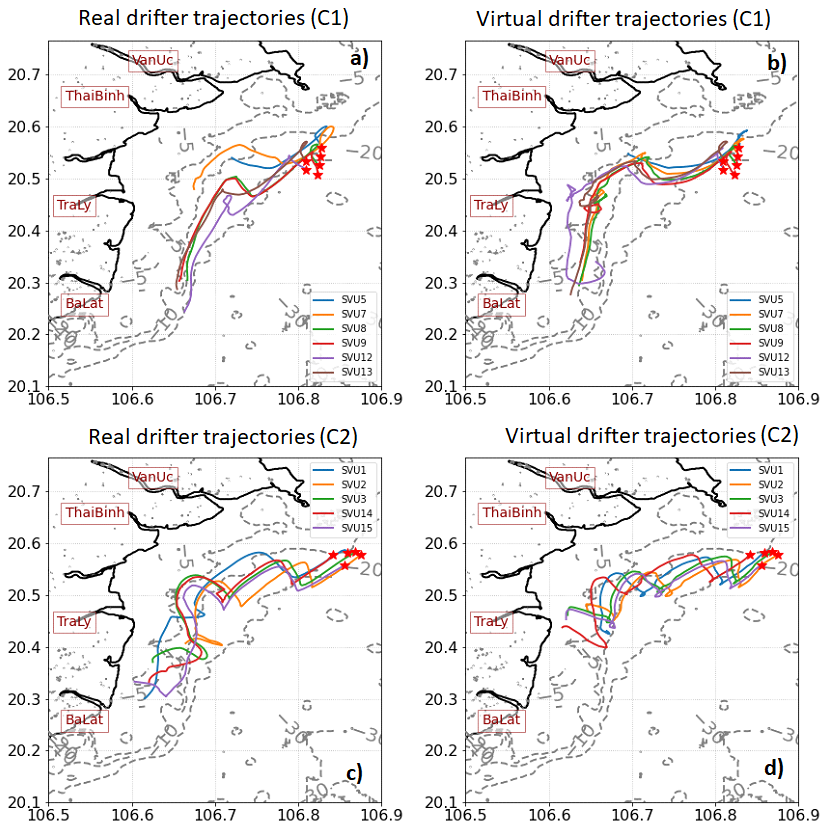
Figure 5Trajectories of real drifters in C1 and C2 (a, c); and virtual drifters (b, d) within 48 h of tracking.
During the first ∼36 h, trajectories of real and virtual drifters showed relatively small discrepancies, with the maximum separation distance not exceeding 5 km in C1 and 4 km in C2 (Fig. 6a and b). Thereafter, the separation distance increased sharply in C1 and more gradually in C2, with a pronounced separation amongst drifters as they travelled between the Thai Binh and Tra Ly River mouths. After 48 h, the final separation distance averaged across drifters reached 16.8 km for C1 and 4.5 km for C2, while the overall mean separation distance was 4.3 and 2.5 km, respectively (Fig. 6, Table 1). The causes for these discrepancies will be further discussed in Sect. 4.1.
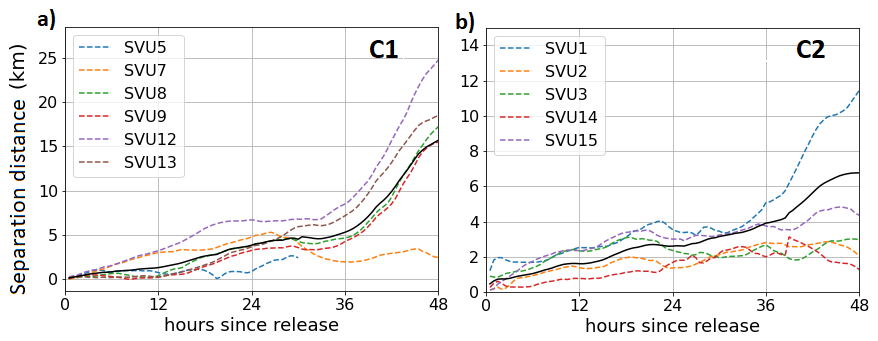
Figure 6Separation distances between virtual and real trajectories for C1 (a) and C2 (b), black solid lines are separation distances averaged over all buoys within each cluster.
Table 1Comparison of real- and virtual drifters in C1 and C2 after 48 h: the mean and maximum separation distance (Sep. dist.) between trajectories of virtual and real drifters; the mean travel distance (Dmean); the mean and maximum drifter velocities (vmean, vmax) estimated from the distances between consecutive drifter positions sampled every 30 min; and the mean L-index over the 48 h tracking period of real and virtual clusters, with values averaged across all drifters in each cluster.
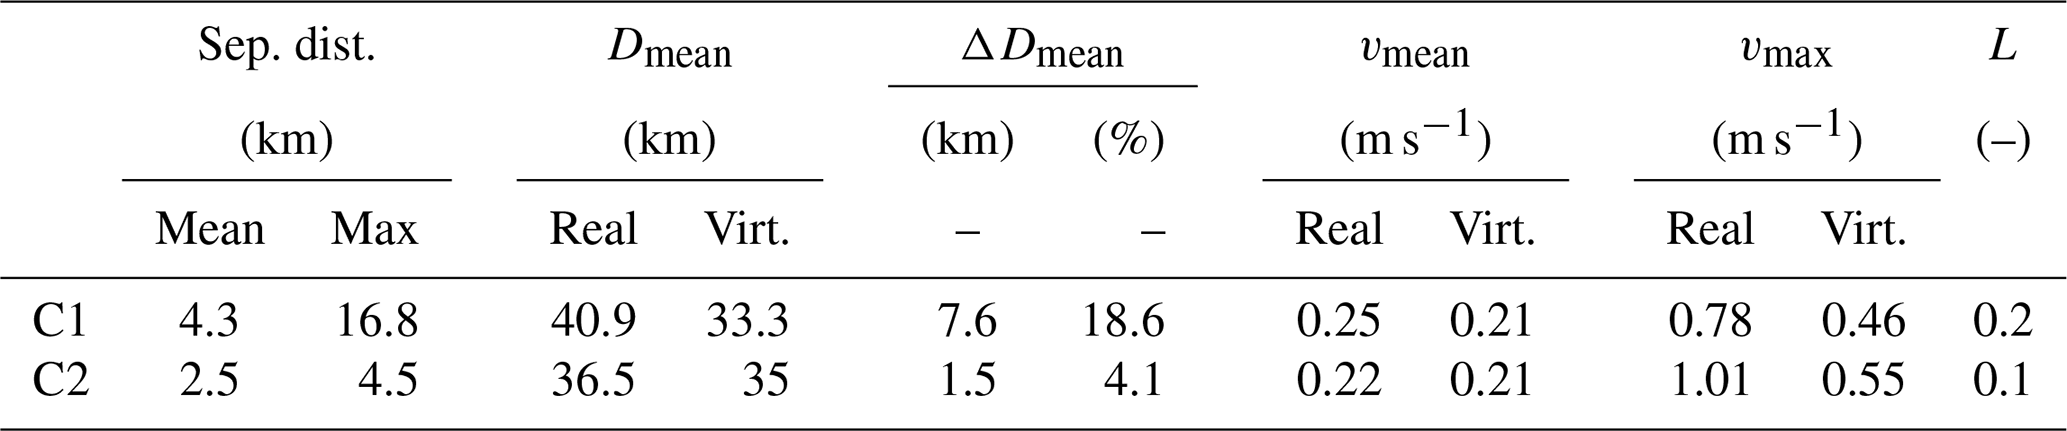
The mean travel distances show good agreement in both clusters, with the difference between real and virtual clusters, ΔDmean, of ∼7.6 and ∼1.5 km in C1 and C2, respectively. The maximum velocities averaged over each cluster were underestimated in the HFR-based simulation; however, the mean values are comparable between real and virtual drifters. The mean “L” index is notably small for both clusters C1 and C2 (0.2 and 0.1, respectively).
3.2 Temporal variability of surface circulation
The rotary spectra of surface currents were calculated for the entire analysis period (Fig. 7) to resolve the contribution of clockwise (CW) and counter-clockwise (CCW) processes at different frequencies to the temporal variability of surface current velocities. The energy spectra display a cascade consistent with Kolmogorov's empirical power law (dashed line) within the subtidal and tidal frequency bands. In both CW and CCW spectra, the strongest peak appears at the 24 h period corresponding to diurnal tidal constituents (O1, K1), followed by a smaller peak at semi-diurnal tidal periods (M2, S2). Another peak in higher frequency bands, detected at third-diurnal frequency, represents the tidal harmonics. The quarter-diurnal peak at 6 h was also detected, however, with the energy level much lower than the other tidal peaks. The two tidal frequencies are not originated from astronomical tides but generated by the interference of diurnal and/or semi-diurnal tides when they enter the gulf and meet shallow bathymetrical basin and coastlines (Tran, 2023b).
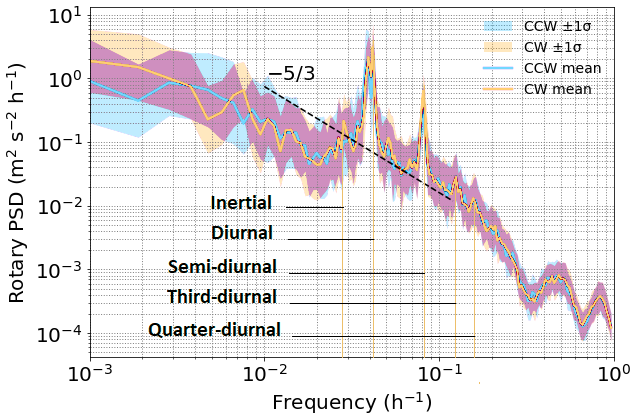
Figure 7Rotary spectra of surface currents during the measurement period (August–December 2024): mean spectra (lines) and confidence interval (±σ, shaded) for the clockwise (yellow) and counter-clockwise (turquoise) components. The black dashed line shows Kolmogorov's power law.
The inertial signal is prominent in the CW spectrum but not in the CCW spectrum, with a peak period of 35 h. Within a shallow basin as the GoT, the influence of inertial forcing on surface circulation decrease remarkably towards the shore (Fontán and Cornuelle, 2015). In this specific case, the inertial band energy accounted for 0.2 m2 s−2 h−1, notably smaller than those of diurnal and semi-diurnal tides (1.8 and 0.9 m2 s−2 h−1, respectively).
3.3 Seasonal spatial patterns of surface circulation
Seasonal variability of surface circulation was assessed over three periods aligned with the monsoonal wind regimes: August (summer), mid-September to October (transition), and December (winter). Surface circulation, averaged over each period, exhibited a large spatio-temporal seasonal variability (Fig. 8).
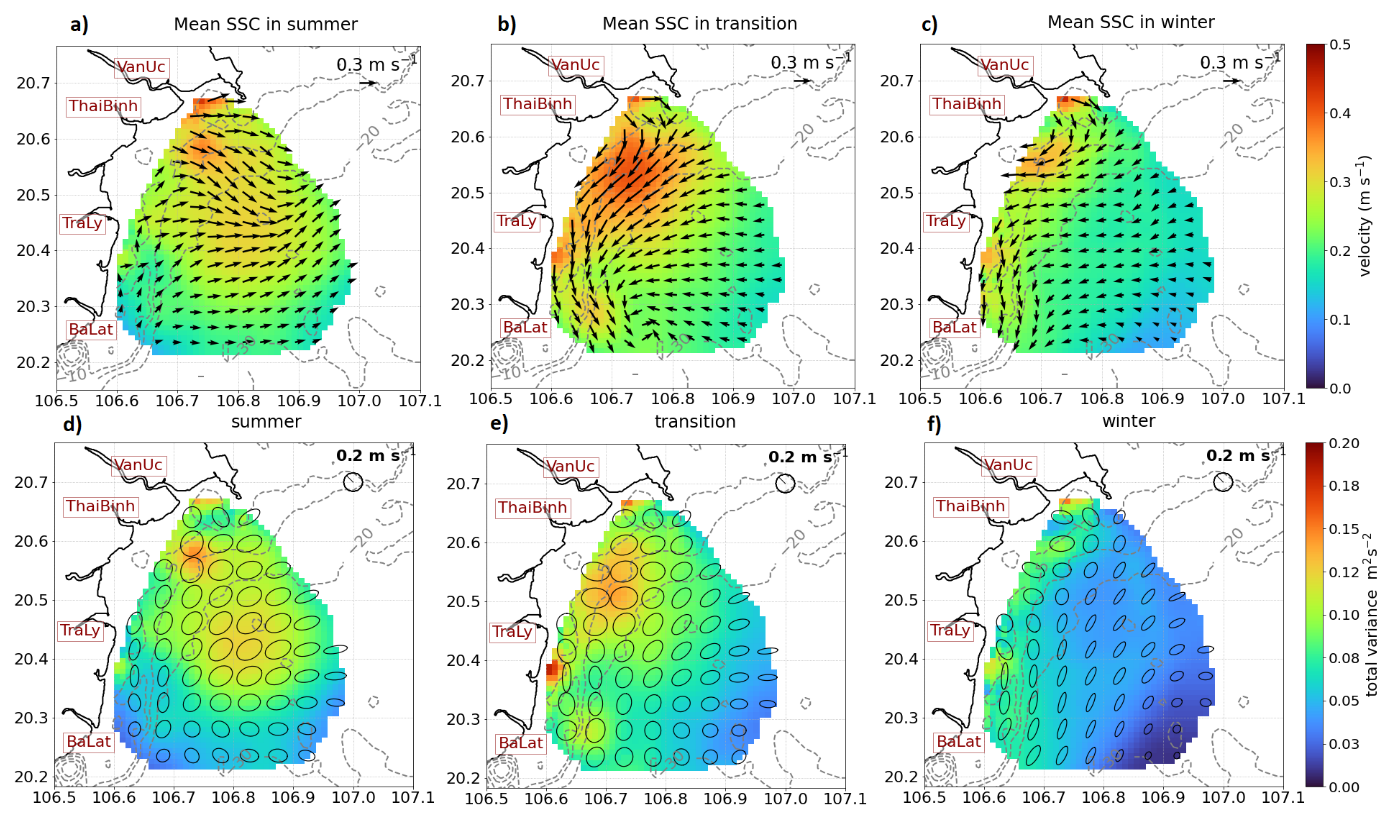
Figure 8Mean surface current velocity fields (a–c) during summer (August 2024), transition period (mid-September–October 2024), and winter (December 2024), respectively; and ellipses of current velocity variance superimposing total variance of surface current velocity (d–f).
During summer, strong outflow from rivers presents with high velocities at approximately 0.4 m s−1 (Fig. 8a). The river plumes expanded largely to more than 30 km offshore and joined with the northeastward currents driven by southwesterly wind (Fig. 2). This effect is due to a strong stratification during summer at the river plume area caused by large runoff. As a result, instead of penetrating and mixing vertically, the water was advected horizontally. Principal component analysis (PCA) has been implemented to quantify the total variance of velocities and to identify the contributions from the zonal and meridional components. The large total variance area coincides with the expanded area of the river plumes in front of the Van Uc river mouth (Fig. 8d). The minor and major axes of ellipses obtained from PCA analysis illustrate the variability of surface circulation magnitudes evolving spatially and temporally. Off the Van Uc and Thai Binh estuaries, ellipses reach the largest sizes and orient in the northeast direction with a subtle isotropic pattern following the shape of bathymetry. On the contrary, in the south of the RR plume domain, the ellipses are anisotropic along the coasts with smaller velocity magnitudes. These findings indicate that river outflows from the Van Uc and Thai Binh rivers contribute significantly to the variability of coastal surface circulation in summer. Their influence is not confined to the nearshore region but extends offshore, enhanced by favorable upwelling conditions associated with southwesterly winds and by buoyant currents sustained under strong stratification.
As entering mid-September to October, when wind direction changed from southwesterly to easterly and northeasterly (shown in Fig. 2), a reversal in current direction compared to summer was observed (Fig. 8b). The Van Uc and Thai Binh river outflows are well captured in the mean surface current velocity field. In contrast to the offshore expansion of the river plume in summer, a strong southwestward current was observed flowing from the Van Uc River mouth, continuing southward along the coastline. Elevated mean current speeds (>0.45 m s−1) relative to the surrounding areas were observed over approximately one-third of the domain, addressing that the radius of influence of river discharge during this time was rather large (∼20 km). It is worth noting that the beginning of the analysis period was 10 d after the landfall of the Yagi typhoon. A series of heavy rainfalls was recorded in the watersheds of the RR system, which led to abnormally large discharge at the river outlets after the storm passed by. The strong flow is the result of the joint contribution of large river discharge and the southwestward current driven by winds flowing over a shallow bathymetry along the coastlines. Outside of the 20 m isobath, surface current fields were characterized by a shoreward direction, diverting to a southward flow as they reached shallow depths. In front of the Ba Lat river mouth, a convergence zone of southward alongshore current and westward current from the offshore area was identified (Fig. 8b).
A different pattern of surface circulation was revealed in December as northeasterly wind blows persistently (Fig. 2). Surface currents flew southward near the coasts and southwestward to westward at depths greater than 10 m (Fig. 8c). The trace of river outflow from the Van Uc river mouth still presented in the mean surface velocity field, however, the area of expansion is narrowed significantly up to 10 m depth near the coasts due to stronger vertical mixing and lower discharge compared to summer time. The alongshore current speed (approx. 0.25–0.3 m s−1) was globally weaker than that observed in summer and autumn. An anti-cyclone veering effect was identified at the right outer skirt of the Van Uc river outflow as the result of a buoyant flow deflected by the Coriolis force. During winter, the variability of the surface current velocity field was found to be lower than that in summer and transition periods, which is illustrated by the smaller-sized ellipses of variance (Fig. 8f). A significantly greater variability was found along the coasts within the first 10 m depth compared to that offshore according to the high magnitude of flow velocities near the coasts. In front of the Van Uc river mouth, surface current velocities varied in both zonal and meridional directions, as indicated by a more circular shape of the variance ellipses. In contrast, the ellipses are elongated southward along the coast and southwestward offshore which are mainly driven by coastal bathymetry and winter monsoonal wind.
During all three periods, notably large variability, evidenced by high total variance values, was observed south of the Thai Binh River mouth. The width of the high-variability zone increased during summer and narrowed in winter, consistent with the seasonal variation in the expansion of the Van Uc River plume.
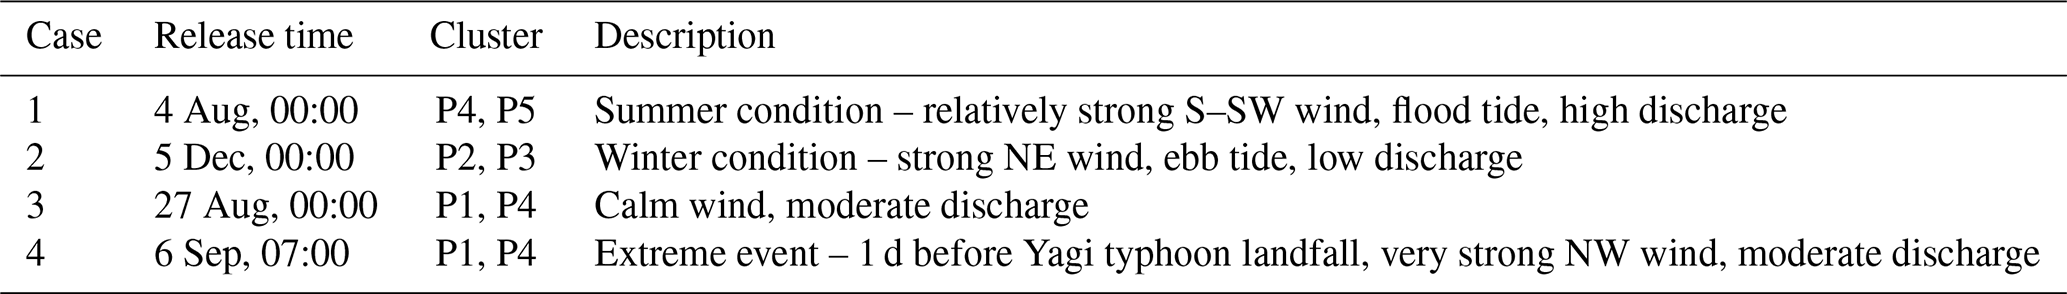
The PCA analysis and mean surface current velocity maps reveal that the distinctive patterns as well as the large spatio-temporal variability of surface circulation during three sub-periods are mainly governed by winds and river discharge. Additionally, tidal currents play a substantial role in driving variability, as shown in Sect. 3.1. The rapid change in time and large spatial variability in surface current velocity fields lead to the complexity in the dispersion and convergence behaviors of passive tracers and suspended materials in the coastal waters. Therefore, to acquire a more comprehensive understanding of the seasonal and intraseasonal characteristics of dispersion, including its primary drivers in the RR plume area, a series of dates representing selective conditions associated with wind, river discharge, and tides (Fig. 2, Table 2) were selected for Lagrangian analysis.
Five clusters (P1–P5) of 100 virtual particles released at selected locations (Fig. 1) representing the estuaries within RR plume domain: P1 in front of Van Uc river mouth; P2 at the location of real drifters in C2 for comparison; P3 in front of Thai Binh river mouth; and P4 and P5 in front of the Tra Ly and Ba Lat river mouths, respectively. At the initial release locations, the virtual particles were evenly distributed with 0.5 km spacing. For each case in Table 2, specific clusters were selected to allow sufficient tracking duration while preventing rapid exit from the computational domain.
3.4 Turbulent dispersion in the RR lume region
3.4.1 Case 1 – southwest wind
In the case of summer monsoon wind, the main flow direction is northeastward, associated with S–SW winds. Tidal forcing exerts a strong influence on particle movements, as reflected in the trajectories which exhibit regular reversals in direction roughly every 12 h, corresponding to the transformation from flood tide to ebb tide and vice versa (Fig. 9a). During the first 12 h, particles in P5 moved northward parallel to the coastline, then dispersed in front of the Tra Ly river mouth, stretching along the orientation of the 20 m isobath. The northward alongshore advection of P5 at the beginning of the tracking time was forced by wind-driven current and tides. Meanwhile, P4 exhibited a lower spreading rate compared to P5, as indicated by the smaller ellipse size (Fig. 9a). However, after less than 10 h, the dispersion of P4 exhibited an anisotropic behavior, marked by a shift in pathway direction at the 10 m isobath, where the bathymetry orientation changed from north to northeast. After 48 h, the final positions of P4 and P5, which did not yet leave the domain, were aligned along the 20 m isobath (pink ellipses in Fig. 9a). At the beginning of the tracking period, the dispersion of particles in both P4 and P5 was mainly controlled by wind-driven currents and tides. Upon reaching the Tra Ly and Van Uc river mouths, the particles were advected offshore by river outflows, and their dispersion became strongly anisotropic along the isobaths and in the direction of the mean flow. This behavior reflects the combined influence of river outflows and wind-driven currents under upwelling-favorable conditions.
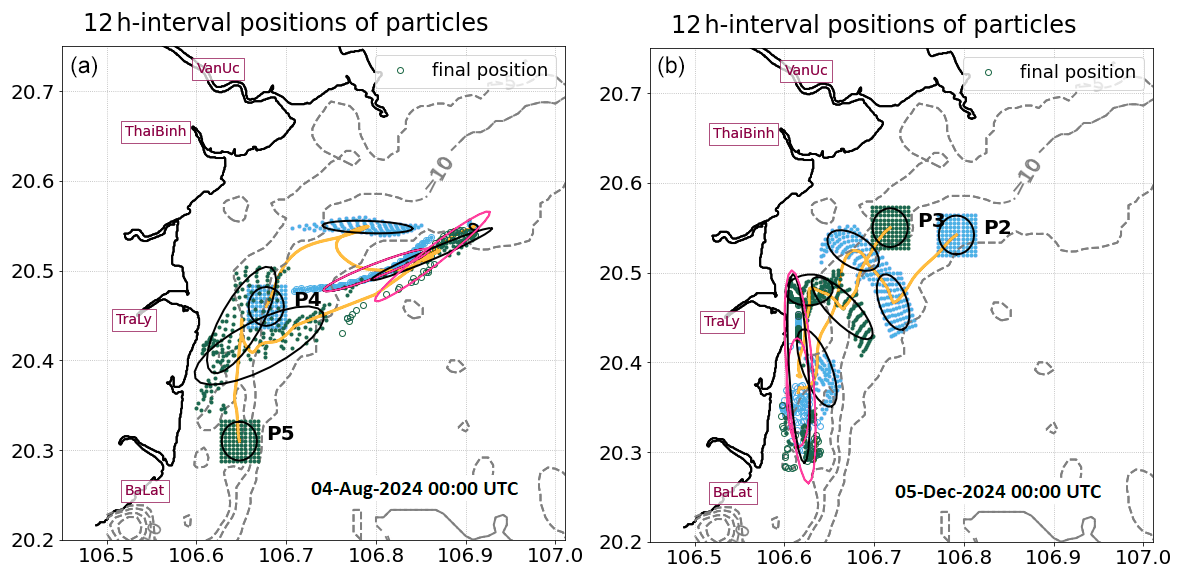
Figure 9Positions of virtual particles at 12 h intervals for releases on 4 August (Case 1; a) and 5 December (Case 2; b). Solid dots indicate intermediate positions, and hollow dots indicate the final positions. Green and turquoise colors illustrate P4, P5 in (a); and P2, P3 in (b), respectively. Dispersion ellipses illustrate the spreading of particles. The ellipse representing the spreading at the final positions is shown in pink.
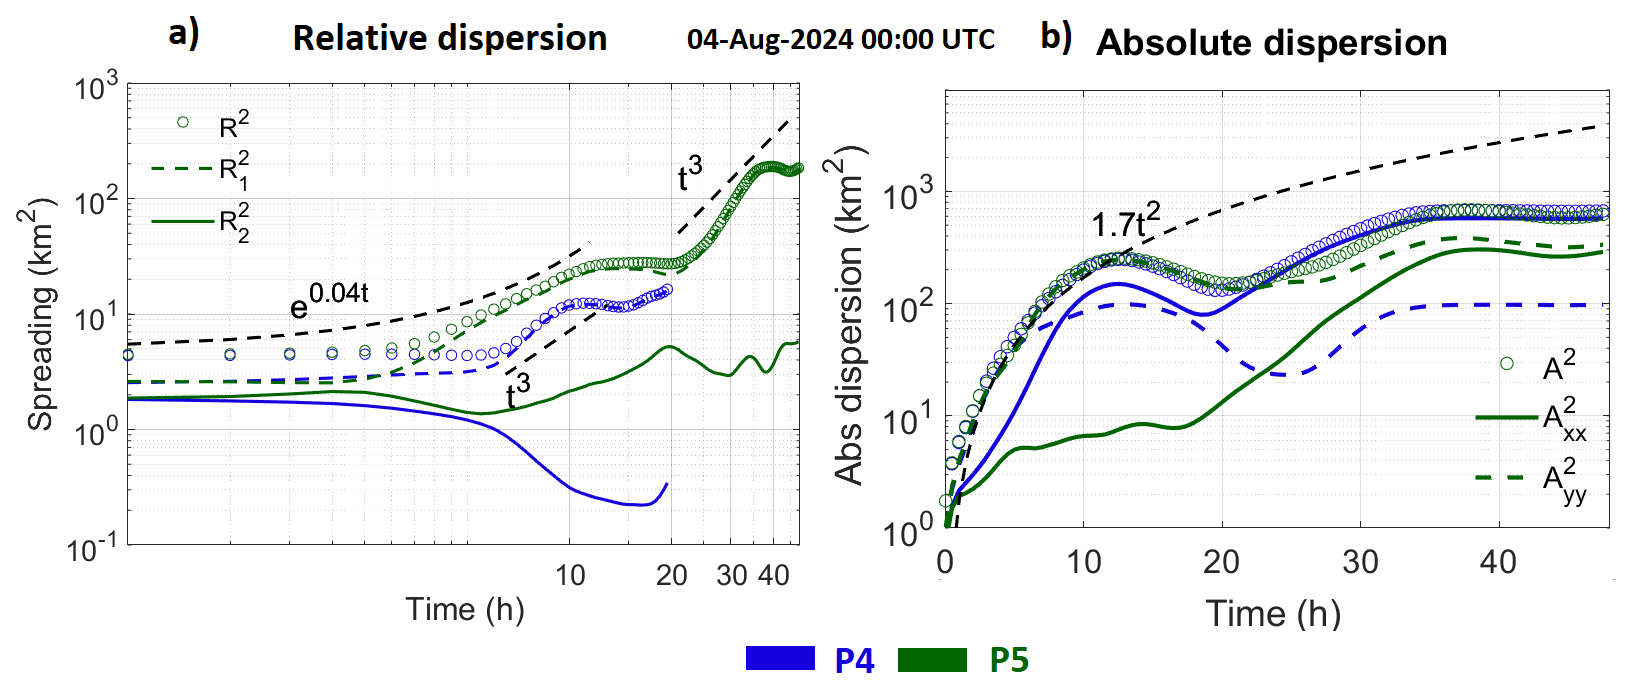
Figure 10Relative (a) and absolute (b) dispersion of particles in clusters P4 (blue) and P5 (green) released on 4 August (Case 1). Colored circles indicate total R2; dashed colored lines show along the major axis; solid colored lines represent along the minor axis. Black dashed lines represent curves of different regimes: exponential (δ2∼eat), Richardson super-diffusive dispersion (δ2∼t3), and ballistic regime for absolute dispersion (A(t)2∼at2).
Absolute and relative dispersion were calculated for P4 and P5 within 48 h tracking time (Fig. 10). 6 h after release, particles moved together without spreading. At the initial stage, the dispersion is approximated at a weak exponential growth (δ2∼e0.04t) for P5 and low dispersion for P4 (Fig. 10a), under the influence of large-scale processes, i.e., alongshore coastal current and tides. Subsequently, particles in P4 and P5, upon reaching the Tra Ly and Van Uc river plumes, respectively, exhibit more intense and anisotropic spreading, approaching a Richardson-like dispersion regime. For P5, this transition occurs after approximately 24 h, whereas for P4 it takes place within less than 10 h. In both cases, the observed dispersion reflects a transitional regime influenced by the inverse energy cascade, while still retaining the imprint of the initial flow configuration. In particular, particle separation is affected by the interaction between the outflows from the Tra Ly and Van Uc rivers and the background circulation, which is further shaped by the northeast-oriented shallow bathymetry.
The spreading of P5 increased from ∼4 km2 to over 100 km2 within 48 h of tracking. After entering the Richardson-like dispersion regime, P4 quickly exited the domain, as reflected by the subsequent drop in spreading rate in Fig. 10a.
The absolute dispersion of particles in both P4 and P5 clusters exhibited a ballistic regime with a comparable growth rate of A(t)2∼1.7t2 and reached their maximum of approximately 700 km2 (Fig. 10b). For P5, the spreading along the x axis evolved more slowly than along the y axis during the first 24 h, as the dispersion of P5 within the south of the RR plume domain was mainly driven by the northward alongshore current. In contrast, the dispersion of P4 evolved in both zonal and meridional dimensions. It is noteworthy that, amongst other contributing factors, the dispersion and transport of both P4 and P5 were strongly constrained by bathymetry, which guides the surface currents along the 20 m isobath in summer (shown in Fig. 8a).
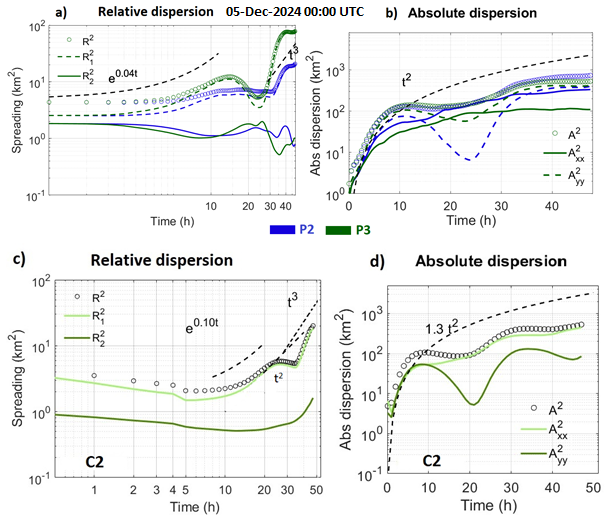
Figure 11The same representation of relative and absolute dispersion of particles as in Fig. 10 but for clusters P2 (blue) and P3 (green) (a, b) and real drifters in cluster C2 (c, d) on 5 December (Case 2). Black dashed lines represent curves of different regimes: exponential (δ2∼eat), ballistic (δ2∼t2), Richardson super-diffusive dispersion (δ2∼t3), and ballistic regime for absolute dispersion (A(t)2∼at2).
3.4.2 Case 2 – northeast wind
During the northeast monsoon, the surface current field exhibits a prevailing southward direction (Fig. 9b). As in summer, tidal cycles exerted a significant influence on particle trajectories. 12 h after release, during the flood tide, both clusters, P2 and P3, were advected shoreward, bringing the particles closer to and parallel with the shoreline. Before passing the Tra Ly River mouth, both clusters showed dispersion across the mean flow, as reflected by the orientation of ellipses. Once they passed the mouth and entered the southern RR plume, advection shifted along the flow, producing pronounced anisotropy.
In terms of relative dispersion, a good agreement has been established between C2 (real drifters) and P2 (virtual particles). In both C2 and P2, the large disparity between minor and major axes of relative dispersion represents a strongly anisotropic behavior (Fig. 11a and c). The spreading of particles in both clusters expanded from 4 km2 to over 20 km2 after 48 h. During the first 12 h, the real buoys in cluster C2 exhibited approximately exponential dispersion (δ2∼0.1t), while a lower exponential growth (δ2∼e0.04t) was estimated for P2. For both virtual particles in clusters P2, P3 and real buoys in C2, dispersion slightly decreased over the following 12 h as the flood tide advected the drifters closer to shore. In contrast, during the final 24 h, as drifters passed the Tra Ly River mouth and entered the southern domain, a significant increase in spreading rate was observed for all of P2, P3, and C2. More specifically, the dispersion regime exhibits an approximately exponential growth at early times, while the subsequent Richardson-like dispersion, characterized by δ2∼t3, could be influenced by the combined effects of the strong ebb-tide outflow from the Tra Ly River and wind-driven alongshore coastal currents.
The absolute dispersion of P2, P3, and C2 also showed good agreement and closely followed a t2-scaling, characteristic of a ballistic regime. The dispersion of particles in P2 and P3 shows a slower rate at the beginning of the tracking time compared to real buoys in C2 (Fig. 11b and d). By 30 h of tracking, the absolute dispersion in all three clusters reached approximately 300 km2. After 30 h, as particles began to disperse rapidly following approximately Richardson-like regime, their absolute dispersions showed different spreading intensities, reaching ∼700–800 km2 for P2 and P3, and ∼600 km2 for C2 by the end of the tracking period. A regular fluctuation at roughly a 24 h period was observed along the y axis for all clusters, indicating the significant influence of diurnal tidal components on the dispersion behavior of particles in the RR plume region during this period.
Compared to Case 1 (summer condition), during the 48 h tracking period under both wind conditions, two distinct relative dispersion regimes were observed: a low exponential regime, followed by a Richardson-like regime after ∼24 h. This regime was evident in the virtual cluster (P5) in summer and in the dispersion of real drifters of C2 in winter, regardless of monsoonal wind conditions. However, after 48 h, the spreading of particles is much higher in summer (∼200 km2) than in winter (∼20–80 km2), reflecting a substantially stronger dispersion in summer.
3.4.3 Case 3 – calm wind
As discussed in Case 1 (summer) and Case 2 (winter), particles followed two distinct transport pathways under typical wind conditions: during S–SW winds, particles were predominantly advected northeastward, whereas during NE winds, they were transported southward. In contrast, under weak wind conditions, in particular, P1 and P4 (separated by about 20 km), released in front of the Van Uc River mouth and the Tra Ly River mouth, respectively, exhibited opposite directions of movement and different dispersion behaviors (Fig. 12a). During calm winds, surface circulation developed a complex spatial pattern. We identified an eddy-like pattern (size of ∼10 km) south of the Van Uc River plume, between the Tra Ly and Thai Binh river mouths, and a domain-scale cyclonic eddy (∼25 km) offshore of the 20 m isobath, evident in the surface current velocity field on 27 August (Fig. 12b) and 28 August (Fig. A2). These eddies, with a lifetime of more than 2 d, together with the outflow from the Van Uc River, played a dominant role in controlling dispersion within the Van Uc River plume during this tracking period. Meanwhile, in the south of the RR plume, the forces driving dispersion can be different: the background alongshore currents and the outflow jet from the Tra Ly River (Fig. 12b).
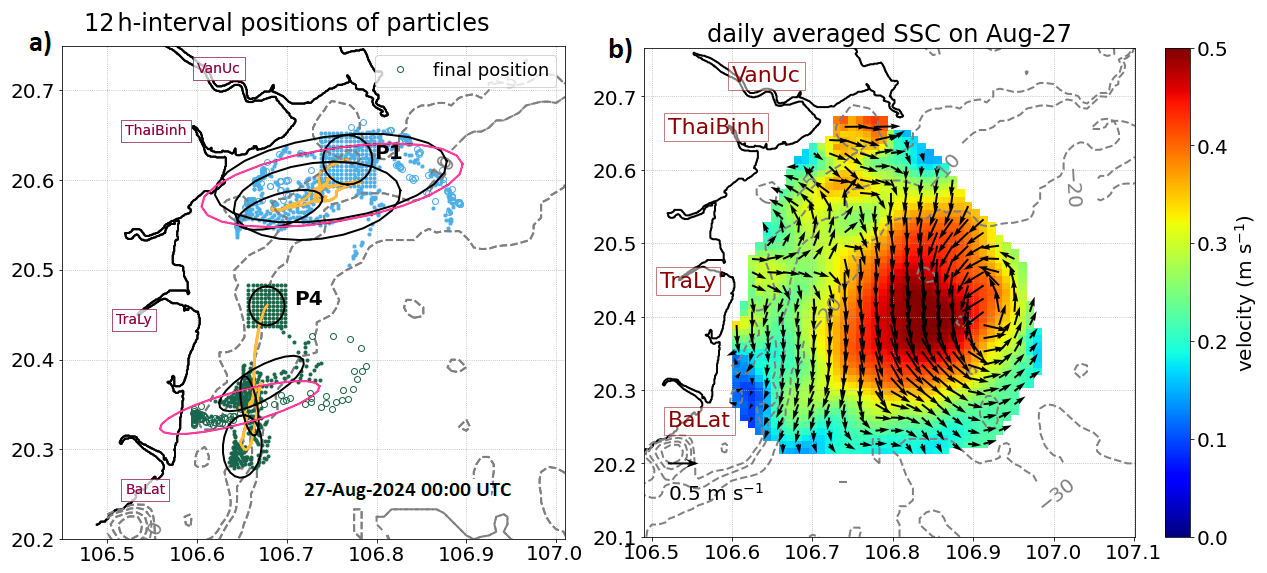
Figure 12(a) Similar presentation as in Fig. 7 but for cluster P4 (green) and P1 (turquoise) released on 27 August (Case 3). (b) Mean SSC on 27 August.
During the 48 h tracking period, the P1 cluster remained largely confined within the Van Uc River plume area, with anisotropic dispersion (Fig. 12a, turquoise dots). The persistent eddy-like structure between Tra Ly and Thai Binh Rivers inhibited the southward dispersion of particles, whereas the domain-scale cyclonic eddy suppressed the offshore advection.
Meanwhile, P4 initially advected southward along the coastline. The western limit of the offshore cyclonic eddy was constrained by the bathymetry contour of 20 m (Fig. 12b), thereby intensifying shear in the down-coast flow during the first 24 h. After about 24 h, as it reached the southern boundary of the Tra Ly river plume, the spreading direction changed to northeastward (Fig. 12a, green dots). On the second day, the northeastward advection was under the influence of outflow from the Tra Ly River. The impact of tides on particle movement is clearly illustrated by the positions of the ellipses moving back and forth, which represent locations of virtual particles at different tidal stages.
Relative dispersion of particles in both clusters P1 and P4 after 12 h tracking exhibited an increase with different spreading rate, in particular, dispersion of P1 approached a Richardson super diffusive regime (δ2∼t3) whereas that of P4 is more consistent with a ballistic regime (δ2∼t2) (Fig. 13a). During the final 12 h of tracking, P4 exhibited strong spreading, with scaling larger than t3, while P1 maintained the Richardson regime. The dispersion regime in P1 was caused by the energetic flow from the Van Uc river runoff, confined by two coherent structures (the domain-scale eddy and the veering structure). Meanwhile, the t2- and t3-scaling approximation in P4 is the result of local shear produced by a southward current following the 20 m isobath. In addition, a reduced spreading rate, observed in both P1 and P4 at approximately 24 h after release, was associated with the reversal of tidal phase.
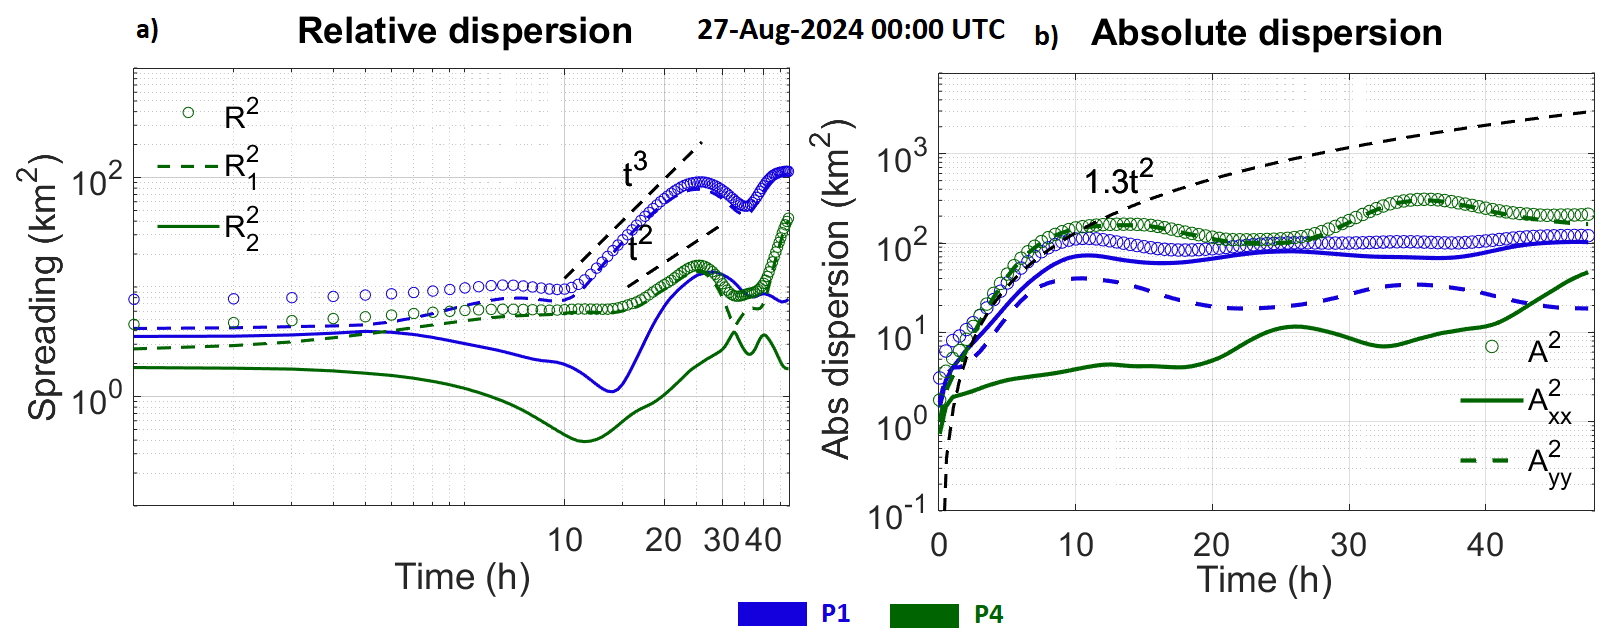
Figure 13The same representation of relative (a) and absolute (b) dispersion of particles as in Fig. 10 but for clusters P1 (blue) and P4 (green) on 27 August (Case 3). Black dashed lines represent curves of different regimes: ballistic (δ2∼t2), Richardson super-diffusive dispersion (δ2∼t3), and ballistic regime for absolute dispersion (A(t)2∼at2).
Absolute dispersion of both P1 and P4 was consistent with a ballistic regime at A2∼1.3t2 (Fig. 13b). For P4, significantly larger dispersion along the y axis is observed, indicating dominant alongshore advection by the background downcoast currents. It is noteworthy that absolute dispersion along the x axis in P4 increased over time, indicating progressive displacement of particles across the mean current. Specifically, the cross-shore advection driven by the Tra Ly River outflow was established when P4 was transported near this plume during the rising tide. Meanwhile, dispersion along the x axis was slightly higher than that along the y axis for P1, reflecting the dominant flow direction of the runoff from the Van Uc River. After 48 h of tracking, the final absolute dispersion of both P1 and P4 reached ∼300 km2, more than two times lower than in Case 1 and Case 2 (∼800 km2) when winds were active.
3.4.4 Case 4 – extreme event (typhoon Yagi)
Three to 4 d prior to the landfall of typhoon Yagi, wind conditions were calm, with the wind speed below 3 m s−1 (Fig. 2). From 4 September onward, northwester winds intensified (Fig. 14). 1 d before Yagi, the wind speed increased sharply from 10 to 17 m s−1 (wind vectors denoted by blue arrows in Fig. 14a–d). Surface current velocity fields were predominantly wind-driven, with the flow direction rotating quickly from southwest to southeast as wind intensity increased (Fig. 14a–d). Interestingly, on 7 September, when the wind speed reached 17 m s−1, the surface current direction aligned with the wind, generating current divergence and upwelling (Fig. 14d).
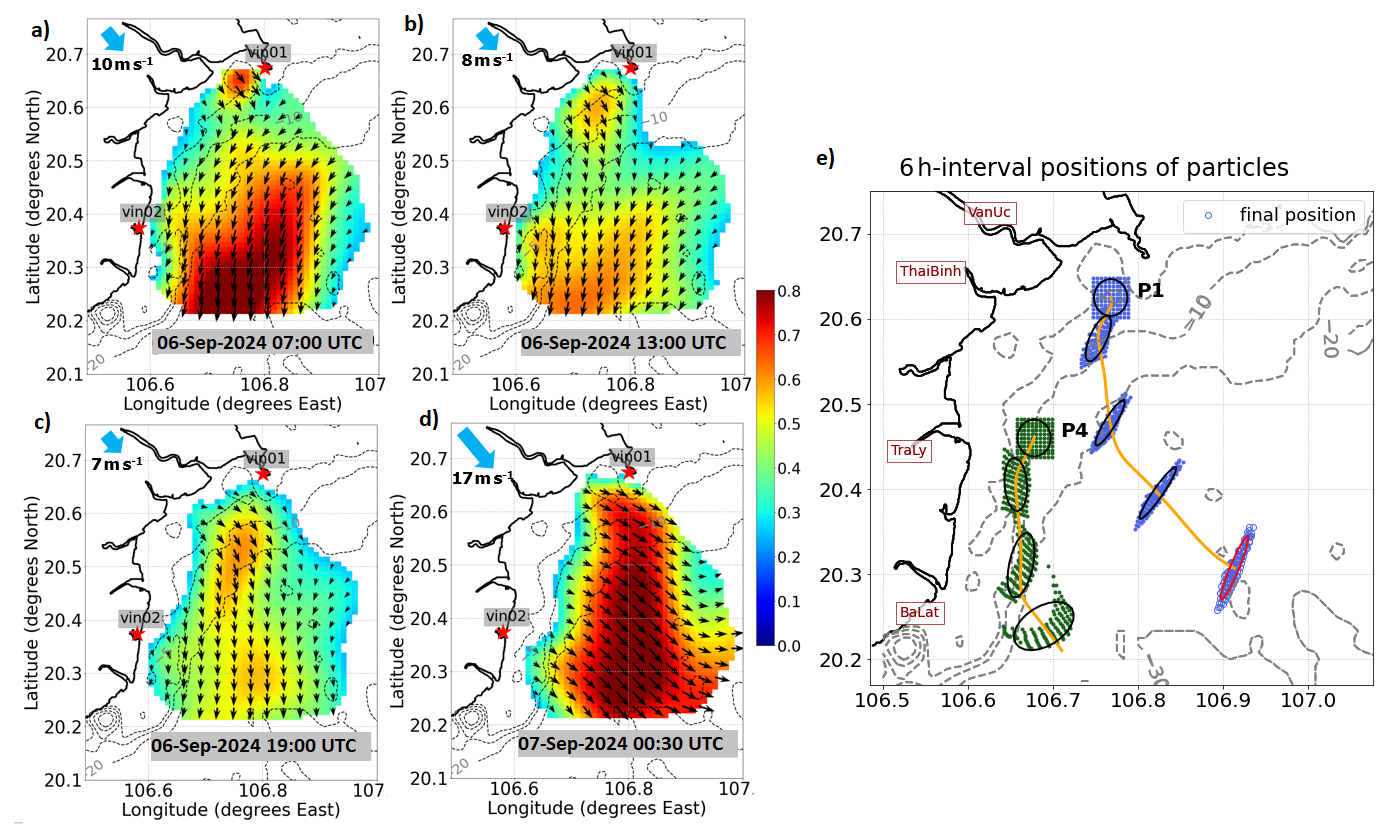
Figure 14Surface current velocity fields at 6 h interval on 6 September, before Yagi typhoon landfall (Case 4), colorbar in m s−1, upper-left blue arrows demonstrate wind direction and speed (a–d); Accordingly, (e) positions of particles at 6 h intervals, released off the river mouths: P1 (Van Uc, turquoise) and P4 (Tra Ly, green).
Clusters P1 (north) and P4 (south) of the RR plume region, released simultaneously on 6 September, 1 d before the landfall of typhoon Yagi, exhibited distinct dispersion behaviors and trajectories. Particles in P1, released off of the Van Uc estuary, exhibited strongly anisotropic dispersion across the dominant flow direction, revealing shear dispersion. Meanwhile, the spreading of particles in P4 showed anisotropic dispersion, oriented along the shoreline and aligned with the flow, except at the southern limit, where it became normal to the flow (Fig. 14e). The difference can be attributed to the stronger influence of bathymetry on surface circulation and dispersion in shallow waters. Stronger bottom friction enhances turbulent mixing and steering, which can spread particles differently than in deeper water. After 24 h, wind-driven currents transported both clusters offshore, with particle spreading occurring perpendicular to the flow.
A high degree of anisotropy was demonstrated by the temporal evolution of relative dispersion in both clusters (Fig. 15). However, for P1, the regime of dispersion was found unsteady and showed no clear agreement with ballistic scaling (except between 12 and 18 h). Meanwhile, the dispersion of P4 approached a t2-scaling associated with a ballistic regime, after 15 h of release. The relative dispersion of particles increased from 4 to ∼10 km2 in P1 and ∼20 m2 in P4 after 24 h tracking. Referring to previous cases at the end of a 24 h tracking period, the relative dispersion during typhoon Yagi was found comparable to that in winter (–20 km2), significantly lower than that under calm wind conditions (–100 km2), and 10 times lower than that in summer ( km2).
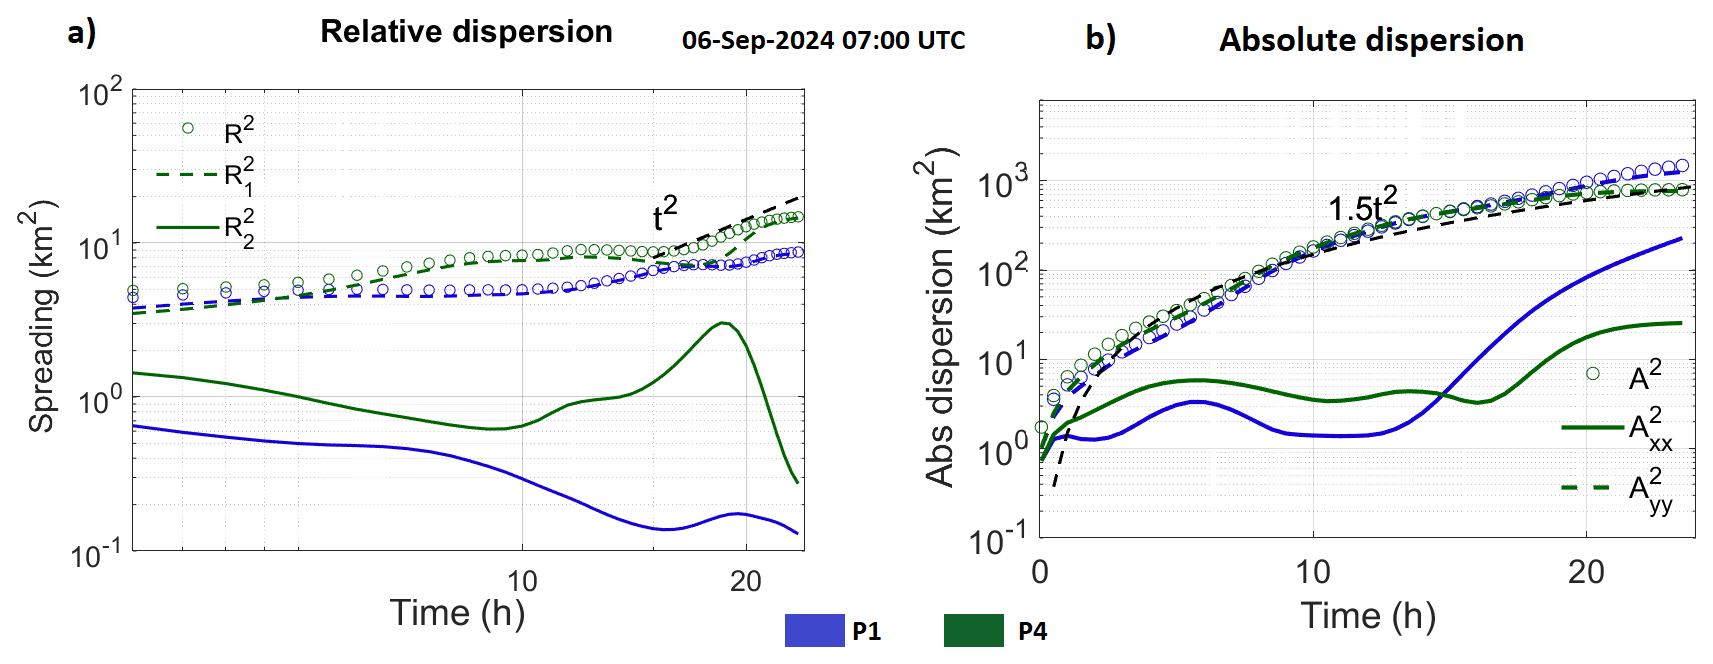
Figure 15The same representation of relative and absolute dispersion of particles as in Fig. 10 but for clusters P1 (blue), and P4 (green), released on 6 September. The black dashed line represents the t2-scaling.
Absolute dispersion at the first 12–15 h was significantly higher along the y axis for both clusters, as particles were advected along the shore at the beginning of tracking time. As wind speed rapidly increased from 7 to 17 m s−1, the current direction shifted from southwestward to southeastward, and dispersion along the x axis increased correspondingly with the change in wind and current direction.
Unlike Cases 1–3, where absolute dispersion did not exceed 800 km2 over a 48 h tracking period, this special case exhibited absolute dispersion exceeding 1000 km2 within only 24 h (half the tracking duration, corresponding to a doubling of the spreading scale), following a ballistic regime with an approximate A(t)2∼1.3t2-scaling. This indicates that during Typhoon Yagi, particles drifted rapidly and their travel pathways were governed primarily by storm-induced wind-driven circulation.
4.1 Validation of flow fields
The accuracy of the underlying Eulerian velocity fields directly determines the reliability of the Lagrangian tracking and the estimates of Lagrangian dispersion, since uncertainties in the velocity fields can lead to errors propagating along virtual drifter trajectories.
The large discrepancies between virtual and real drifter trajectories found at the grid cell mentioned in Sect. 3.1 can be explained by the limited spatial resolution of the HFR surface current data, which cannot resolve sub-grid processes smaller than 1 km observed in the field. Additional uncertainty arose from the interpolation procedure, which might smoothen fine-scale velocity features. These discrepancies are most pronounced in the region between the Thai Binh and Tra Ly river mouths, where highly turbulent sub-grid motions are not captured at 1 km resolution. In detail, the drifter inside the plume was accelerated by the freshwater, which is not applied to the drifter outside of the plume, due to a high gradient of the velocity fields at the plume boundaries.
The errors in the mean total travel distance increased during the final hours of the 48 h tracking period (4.1 % and 18.6 % for C1 and C2, respectively; Table 1), as the drifters passed the Tra Ly river mouth. This area is located far from the northern station (vin01), therefore, surface currents near the southern edge of the interpolation domain may be reconstructed with limited information from that site, owing to the reduction of working range at vin01. This reduction could be caused by low-salinity river discharge near the Van Uc River mouth, which decreases seawater electrical conductivity and thus degrades HFR signal propagation (Halverson et al., 2017; Mantovani et al., 2020). In addition, uncertainties in HFR-derived surface currents generally increase at far range and toward the edges of the coverage, because vector reconstruction becomes less well conditioned as the geometric dilution of precision (GDOP) increases (Cosoli and Bolzon, 2015), and surface current reconstruction via 2DVar interpolation tends to be less constrained near domain boundaries where observations are sparse (Yaremchuk and Sentchev, 2009). As a result, these Eulerian uncertainties can then propagate into larger errors in Lagrangian particle tracking.
Therefore, benchmarking our results against existing studies is essential for assessing how HFR-derived currents influence Lagrangian tracking across grid resolutions, velocity magnitudes, and regional dynamics.
Our mean L-index (0.1–0.2) was smaller than that of Bertin et al. (2024) (0.2–0.5) in the Bay of Biscay, where they used a coarser grid resolution (2.5 km vs. 1 km in our study). The discrepancies in the mean travel distance between real and virtual drifters within 48 h tracking were substantially larger in their results (5–18 km, representing ∼24 %–30 % of the total travel distance) than in ours (1.5–8 km, ∼5 %–19 %). Compared with Kalampokis et al. (2016), who used 1 km HFR fields in the Gulf of Naples and found a mean separation of ∼3.5 km after 24 h, our results (2–4 km) are consistent, though their larger drifter dataset (22 drifters vs. 5 and 6 drifters in our study) could provide more reliable statistics. Overall, these comparisons underscore the importance of high-resolution flow fields in Lagrangian tracking and validate the goodness of the HFR-derived velocities and processing methods applied in our study.
4.2 Plume dynamics
During summer, the RR plume in the GoT extends farther offshore. The offshore plume extension can be due to enhanced stratification that suppresses vertical mixing, combined with upwelling-favorable wind conditions associated with prevailing southwesterly winds, which has been reported in previous studies of Rogowski et al. (2019), Nguyen-Duy et al. (2021) and Tran (2023b). Mazzini et al. (2014) with a study on the Oregon Coast, also highlighted the offshore expansion effects of river plume under upwelling-favorable winds, which make the plume wider and thinner. The same conclusion was reported by Lentz (2012) in the Chesapeake Bay. In contrast, during winter, under the influence of northeasterly winds, the plume is more confined, typically restricted to about 10 km from the coast. This is primarily due to the enhanced vertical mixing that deepens the mixing layer, thereby suppressing horizontal advection of plume waters, while strong downcoast currents further constrain the plume closer to the shore as demonstrated in Nguyen-Duy et al. (2021), Piton et al. (2021), and Rogowski et al. (2019).
Our results showed that the plume could expand more than 30–40 km offshore during summer. This result falls within the range obtained from the clustering analysis of Nguyen-Duy et al. (2021) based on 6-year long simulations by the high-resolution SYMPHONIE model (2011–2016). The study reported more than 75 % of probability that the RR plume can extend up to 40 km offshore during August and September. For the winter months, their study also indicated that the plume was narrow and restricted to a 20 m isobath, closely matching our results. Therefore, our observation-based results support the previous modelling studies Nguyen-Duy et al., 2021; Rogowski et al., 2019; Tran et al., 2022) and further reinforce the understanding of river plume variability in the RR plume region.
Strong surface current variability was observed off the Van Uc and Tra Ly river mouths, reflected by cross-shore–elongated ellipses (Fig. 8d and e), highlighting the seasonal influence of river discharge and tidal forcing on surface circulation within the RR plume region. Flow patterns differ between the northern sector (from the Thai Binh to Van Uc) and the southern sector (from the Tra Ly southward) (Fig. 8a–c). In the northern sector, coastal dynamics is dominated by freshwater discharge from the Van Uc River, whereas in the southern sector, surface circulation is controlled by alongshore currents modulated by the intrusion of the western boundary current through the Qiongzhou Strait (Rogowski et al., 2019; Zavala-Garay et al., 2022) and by buoyant flows driven by the Tra Ly river discharge. Moreover, the spatial variability in coastal circulation is modulated by coastline morphology and bathymetry, as reflected by its consistency with bathymetric contour lines. This statement aligns with Zavala-Garay et al. (2022), who showed that seasonal circulation in the western GoT is largely governed by topographic steering and along-isobath transport.
Using 1 km HFR surface currents, we resolved seasonal submesoscale features, i.e., eddies off the Van Uc and Ba Lat mouths (Fig. 8b and c) and current convergence zone (Fig. 8a), which were not captured by HFR measurements with 6 km resolution in previous studies in the GoT (Rogowski et al., 2019; Tran et al., 2022). This detailed characterization of surface circulation in the RR plume region is essential for accurately assessing the dispersion behavior and trajectories of passive tracers, which are strongly influenced by variations in flow fields and local-scale coherent structures such as eddies and fronts.
4.3 Transport and dispersion
Across all four cases under varying wind conditions, it is clear that winds play an important role in dispersion within the RR plume domain. In Cases 1 and 2, under seasonal monsoon wind conditions, particle pathways and dispersion indicate that transport is primarily wind-driven with trajectories of particles aligning with the seasonal monsoon winds, while river discharge plays a pivotal role in driving dispersion. In detail, across 48 h, dispersion changed from approximately a weak exponential regime to a Richardson-like regime at ∼24 h, as the Van Uc and Tra Ly outflows joined the wind-driven circulation. It should be noted that Richardson scaling is strictly expected only when particle separations and integration times are sufficiently large for the dynamics to fully develop within the inverse-cascade inertial range. In the present study, particle-pair separations are analyzed over relatively short time intervals (20–48 h), which may not be sufficient for the asymptotic Richardson regime to be fully established. As a consequence, the observed dispersion reflects a transitional regime (approaching Richardson regime), influenced by the inverse energy cascade, but still affected by finite-time effects and by the imprint of the initial flow configuration. This is consistent with previous studies of surface and quasi-two-dimensional turbulence, where Richardson scaling emerges only at sufficiently large spatial and temporal scales (Foussard et al., 2017; LaCasce, 2008). In addition, the maximum relative dispersion was found much larger in August (∼200 km2, Fig. 10a) than in December (∼15 km2, Fig. 11a), consistent with a ∼5 times difference in discharge (5000 and 1000 m3 s−1, respectively, Fig. 3). Stronger stratification in summer compared to winter, resulting in a thinner and wider plume, also contributes to larger and faster spreading, since freshwater from rivers can travel longer distances offshore. Nguyen-Duy et al. (2021), using a modelling approach, have computed the Rossby radius of deformation (Rd) for the GoT. In shallow areas of the GoT (less than 60 m depth), including the RR plume domain, Rd decreases from 3–8 km in summer to 1–5 km in winter. Turbulent eddies of larger size in summer enhance particle spreading compared with winter.
For the first time, turbulent dispersion in the RR plume and the broader GoT was analyzed under conditions when seasonal monsoon winds are not dominant, during calm wind conditions (Case 3). We observed effects of coherence structures, i.e., submesoscale eddies and individual river plumes, on particle dispersion. Unlike Cases 1 and 2, dispersion was not only controlled by river discharges but also by submesoscale coherent structures, in this case, the cyclonic veering to the right of the Van Uc plume combined with the domain-scale cyclonic eddy, influenced particle dispersion. Particles tended to disperse strongly along the eddy periphery and at the intersections of river plumes with the surrounding higher-density water, where strong velocity gradients were observed. Therefore, the spreading was found five times larger (100 km2) during calm winds than that in winter conditions (20 km2) within the Van Uc River plume. On the contrary, absolute dispersion under calm winds was two times lower (∼300 km2) than under monsoonal wind conditions (∼800 km2), emphasizing the enhanced downwind spreading under strong winds, which exerts a first-order control on coastal circulation in the Red River plume region of the Gulf of Tonkin. This behavior is discussed in Section 4.2 and is consistent with previous studies (Nguyen-Duy et al., 2021; Rogowski et al., 2019; Zavala-Garay et al., 2022).
During extreme events, i.e., typhoon Yagi (Case 4), characterized by much stronger winds, the passing storm induced significant changes in coastal circulation and river plume morphology, resulting in a substantial influence on particle transport. In detail, particles were advected much farther from their initial positions, with absolute dispersion 10 times larger than under normal conditions. Similar effect was documented by of Zhou and Liu (2025) who studied the impact of tropical cyclone and river discharge on sediment transport in Hangzhou bay with modelling approach. In the GoT, Piton et al. (2021) investigated typhoon impacts on surface fluxes using modelling approach. They showed that typhoons consistently generated strong southward fluxes along the delta, with typhoon-induced currents producing daily water fluxes comparable in magnitude to monthly climatological fluxes. In general, such events are accompanied by increases in concentrations of tracers, including Chlorophyll a, following the storm. This response has been reported off northeastern Taiwan by Xu et al. (2017), where Chlorophyll-a enhancement is frequently observed after typhoon passages. A composite analysis of 46 typhoon events between 1998 and 2013 revealed an average 38 % increase in Chlorophyll-a concentration following typhoon passage. The enhancement of tracer concentrations may result from multiple sources, including land-based inputs delivered by river discharge and subsurface nutrients entrained into the surface layer through storm-induced vertical mixing.
With respect to dispersion behavior, particles in Case 4 exhibited a remarkably lower spreading rate under stormy conditions compared to other cases (5 and 10 times lower than that in calm wind and in summer, respectively), reflecting the suppression of current velocity fluctuations by strong winds. It should also be considered that, during storms, the contribution of wave-induced currents (Stokes drift) to the total currents can be substantial, and may be underestimated in the flow fields derived from HFR measurements. Chavanne (2018) demonstrated that HFR can measure surface Stokes drift, however, suggesting that approximately only half of the Stokes drift is included in the currents measured by HFR. Therefore, the Stokes drift component was not sufficiently considered in the Lagrangian tracking and analysis in our study.
This study presents the first investigation of the variability in surface circulation, transport, and dispersal in the RR plume region, based on remotely sensed velocities provided by HF radars. Enhanced resolution of radar measurements through MIO radar processing method (1° azimuthal spacing and 1 km along the beam) together with a robust interpolation method (2DVar) allowed for reconstructing current maps on a 1 km regular grid at a 0.5 h time step. This resolution is sufficient to detect and characterize small-scale features of surface circulation.
The velocity fields were validated with surface drifters tracked over 3 d within the radar coverage zone, using a Lagrangian tracking approach. A very good agreement was established within the first 36 h of tracking (mean separation distance ∼ 4 km), and errors in total travel distance were two times lower than those reported in previous studies using similar methods.
This study strengthens the existing understanding of seasonal circulation variability in the RR plume region through measurement-based analysis: In summer, prevailing southwesterly winds allowed the plume to extend more than 30 km offshore, whereas in winter, northeasterly winds confined it to approximately 10 km from the coast. Large variability of current velocities was found in the regions of freshwater influence (ROFI, as defined by Simpson, 1997) throughout all periods of analysis. In addition, seasonal and intraseasonal patterns of surface circulation of different scales have been revealed: a number of cyclonic and anti-cyclonic structures with sizes of 10–30 km, at time scales varying from days to weeks, were detected, particularly in the vicinity of river mouths.
A dispersion regime approaching Richardson super-diffusive behavior was found within the plume area during both winter and summer seasons. However, the exact Richardson scaling, δ2(t)∼t3, was not reached since relative dispersion was analyzed over relatively short time intervals (20–48 h), which may not be sufficient for the Richardson regime to be fully established. In addition, this regime may be strongly influenced by the prevailing flow configuration, including tidally dominated circulation, large river runoff, and intense wind forcing.
Independently of this limitation, the dispersion rate was found to be higher in summer compared to winter, likely due to increased river discharge and the presence of submesoscale structures, such as eddies, which enhance particle spreading.
During extreme events such as Typhoon Yagi, tracers were spread more than 10 times faster compared to normal conditions as the mean flow altered quickly under strong winds, while the relative dispersion amongst particle pairs exhibited a lower rate than that under normal conditions. Shear dispersion was rapidly established in the flow fields, reflected by a high degree of anisotropy in tracer spreading.
Future studies integrating near-real-time, high-resolution observations (e.g., HF-radar data) with numerical modeling will provide new insights into how coastal circulation and material dispersal in the RR plume respond across a wide range of weather conditions, including extreme events. In addition, applying complementary Lagrangian diagnostics (e.g., FSLE) and comparing them with satellite-based biogeochemical parameters (e.g., chlorophyll-a and SPM) will be key next steps to investigate how LCSs influence the spatial distribution of these properties in coastal waters.
A1 Lagrangian error computation
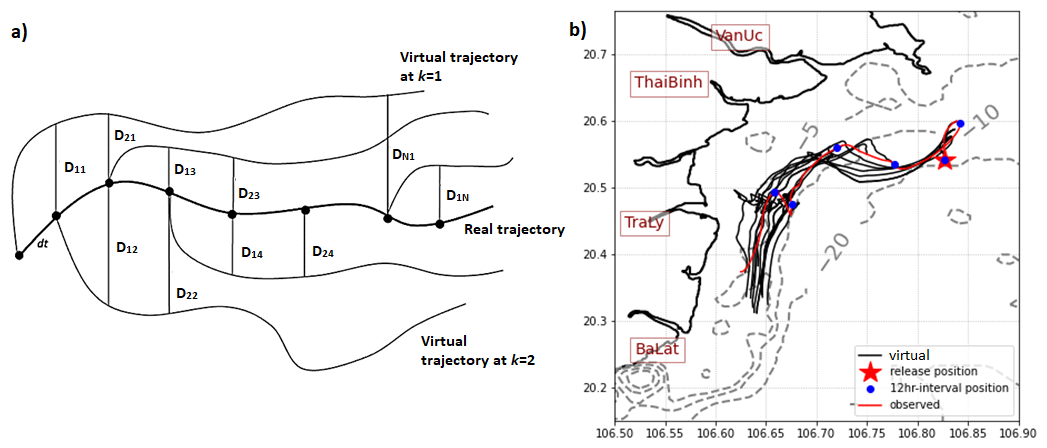
Figure A1(a) Schematic illustration of the Lagrangian error computation (adapted from Bertin et al., 2024); (b) the trajectory of a real drifter (red solid line) and virtual trajectories (black solid lines). The red star denotes the initial release position of the real drifter, and the blue dots indicate 12 h interval positions at which virtual drifters were released.
A2 Supplementary daily maps of surface current velocity under calm wind conditions (Case 3)
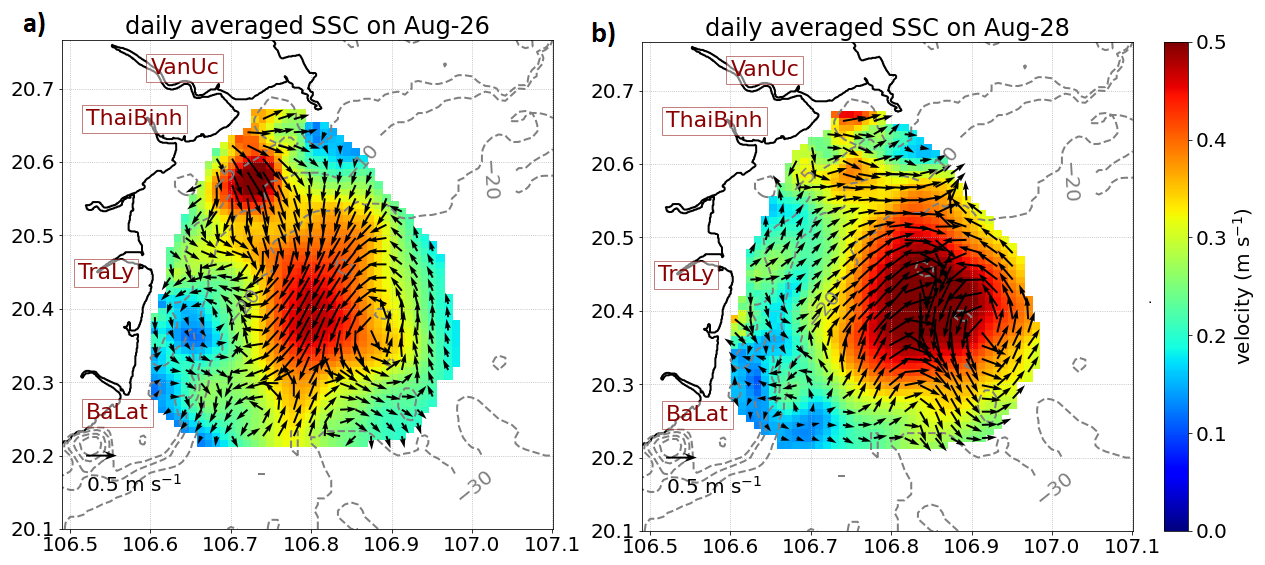
Figure A2Daily surface current map on 26 August (a) and 28 August 2024 (b).
OceanParcels package can be downloaded free of charge from https://oceanparcels.org/ (last access: 10 October 2025), explained in Delandmeter and van Sebille (2019).
Measurement data (HFR and surface drifters) were provided by an ongoing project led by the corresponding author. These data are not publicly available at this time but can be obtained from the corresponding author upon reasonable request.
THT and AS developed study methodologies. CG and DD developed MIO Radar processing software. THT, KCN, and DD conducted radar processing. THT and AS worked on the Lagrangian analysis. KCN provided measurement data from HFR and surface drifters and was responsible for the project funding. THT prepared the paper and collected all contributions from other authors.
The contact author has declared that none of the authors has any competing interests.
Publisher's note: Copernicus Publications remains neutral with regard to jurisdictional claims made in the text, published maps, institutional affiliations, or any other geographical representation in this paper. The authors bear the ultimate responsibility for providing appropriate place names. Views expressed in the text are those of the authors and do not necessarily reflect the views of the publisher.
This research was funded by Vingroup Innovation Foundation (VINIF) under project code VINIF.2023.DA151. The first author was supported by the joint Doctoral Program between the University of the Littoral Opal Coast (ULCO) and the University of Science and Technology (http://lotus.usth.edu.vn/, last access: 10 October 2025). The study is in collaboration with the MIO oceanographic research laboratory (https://www.mio.osupytheas.fr, last access: 10 October 2025). The HFR data were collected from the measurement campaign in the Gulf of Tonkin, 2024, and provided by VINIF.2023.DA151 project.
This research has been supported by the Vingroup Innovation Foundation (VINIF) (grant no. VINIF.2023.DA151).
This paper was edited by Katsuro Katsumata and reviewed by three anonymous referees.
Berti, S. and Lapeyre, G.: Lagrangian pair dispersion in upper-ocean turbulence in the presence of mixed-layer instabilities, Phys. Fluids, 33, https://doi.org/10.1063/5.0041036, 2021.
Berti, S., Haza, A. C., Özgökmen, T. M., Griffa, A., Molcard, A., Poulain, P. M., and Peggion, G.: Transport properties in small-scale coastal flows: Relative dispersion from VHF radar measurements in the Gulf of la Spezia, Ocean Dynam., 60, 861–882, https://doi.org/10.1007/s10236-010-0301-7, 2010.
Berti, S., Dos Santos, F. A., Lacorata, G., and Vulpiani, A.: Lagrangian Drifter Dispersion in the Southwestern Atlantic Ocean, J. Phys. Oceanogr., 41, 1659–1672, https://doi.org/10.1175/2011JPO4541.1, 2011.
Bertin, S., Rubio, A., Hernández-Carrasco, I., Solabarrieta, L., Ruiz, I., Orfila, A., and Sentchev, A.: Coastal current convergence structures in the Bay of Biscay from optimized high-frequency radar and satellite data, Sci. Total Environ., 947, https://doi.org/10.1016/j.scitotenv.2024.174372, 2024.
Chavanne, C.: Do High-Frequency Radars Measure the Wave-Induced Stokes Drift?, J. Atmos. Ocean. Tech., 35, 1023–1031, https://doi.org/10.1175/JTECH-D-17-0099.1, 2018.
Cosoli, S. and Bolzon, G.: Accuracy of surface current mapping from High-Frequency (HF) ocean radars, Boll. di Geofis. Teor. ed Appl., 56, 55–70, https://doi.org/10.4430/bgta0132, 2015.
d'Ovidio, F., Fernández, V., Hernández-García, E., and López, C.: Mixing structures in the Mediterranean Sea from finite-size Lyapunov exponents, Geophys. Res. Lett., 31, 1–4, https://doi.org/10.1029/2004GL020328, 2004.
d'Ovidio, F., Isern-Fontanet, J., López, C., Hernández-García, E., and García-Ladona, E.: Comparison between Eulerian diagnostics and finite-size Lyapunov exponents computed from altimetry in the Algerian basin, Deep-Sea Res. Pt. I, 56, 15–31, https://doi.org/10.1016/j.dsr.2008.07.014, 2009.
Davila, X., Rubio, A., Artigas, L. F., Puillat, I., Manso-Narvarte, I., Lazure, P., and Caballero, A.: Coastal submesoscale processes and their effect on phytoplankton distribution in the southeastern Bay of Biscay, Ocean Sci., 17, 849–870, https://doi.org/10.5194/os-17-849-2021, 2021.
Delandmeter, P. and van Sebille, E.: The Parcels v2.0 Lagrangian framework: new field interpolation schemes, Geosci. Model Dev., 12, 3571–3584, https://doi.org/10.5194/gmd-12-3571-2019, 2019.
Dumas, D. and Guérin, C.-A. A.: New Signal Processing Techniques for Phased-Array Oceanographic Radars: Self-Calibration, Antenna Grouping, and Denoising, J. Atmos. Ocean. Tech., 40, 753–769, https://doi.org/10.1175/JTECH-D-22-0064.1, 2023.
Dumas, D., Bennis, A.-C., Guérin, C.-A., Lopez, G., and Benoit, L.: High-Frequency Radar observation of strong and sheared currents: the Alderney race paradigm, Ocean Dynam., 75, 45, https://doi.org/10.1007/s10236-025-01689-0, 2025.
Durand, N., Fiandrino, A., Fraunié, P., Ouillon, S., Forget, P., and Naudin, J. J.: Suspended matter dispersion in the Ebro ROFI: an integrated approach, Cont. Shelf Res., 22, 267–284, https://doi.org/10.1016/S0278-4343(01)00057-7, 2002.
Fontán, A. and Cornuelle, B.: Anisotropic response of surface circulation to wind forcing, as inferred from high-frequency radar currents in the southeastern Bay of Biscay, J. Geophys. Res.-Oceans, 120, 2945–2957, https://doi.org/10.1002/2014JC010671, 2015.
Foussard, A., Berti, S., Perrot, X., and Lapeyre, G.: Relative dispersion in generalized two-dimensional turbulence, J. Fluid Mech., 821, 358–383, https://doi.org/10.1017/jfm.2017.253, 2017.
Fratantoni, D. M. and Glickson, D. A.: North Brazil Current Ring Generation and Evolution Observed with SeaWiFS, J. Phys. Oceanogr., 32, 1058–1074, https://doi.org/10.1175/1520-0485(2002)032<1058:NBCRGA>2.0.CO;2, 2002.
Garvine, R. W.: A dynamical system for classifying buoyant coastal discharges, Cont. Shelf Res., 15, 1585–1596, https://doi.org/10.1016/0278-4343(94)00065-U, 1995.
Geyer, W. R., Hill, P. S., and Kineke, G. C.: The transport, transformation and dispersal of sediment by buoyant coastal flows, Cont. Shelf Res., 24, 927–949, https://doi.org/10.1016/j.csr.2004.02.006, 2004.
Gough, M. K., Reniers, A., Olascoaga, M. J., Haus, B. K., MacMahan, J., Paduan, J., and Halle, C.: Lagrangian Coherent Structures in a coastal upwelling environment, Cont. Shelf Res., 128, 36–50, https://doi.org/10.1016/j.csr.2016.09.007, 2016.
Halverson, M., Pawlowicz, R., and Chavanne, C.: Dependence of 25-MHz HF Radar Working Range on Near-Surface Conductivity, Sea State, and Tides, Am. Meteorol. Soc., 447–462, https://doi.org/10.1175/JTECH-D-16-0139.1, 2017.
Hernández-Carrasco, I., López, C., Hernández-García, E., and Turiel, A.: How reliable are finite-size Lyapunov exponents for the assessment of ocean dynamics?, Ocean Model., 36, 208–218, https://doi.org/10.1016/j.ocemod.2010.12.006, 2011.
Horner-Devine, A. R., Hetland, R. D., and MacDonald, D. G.: Mixing and Transport in Coastal River Plumes, Annu. Rev. Fluid Mech., 47, 569–594, https://doi.org/10.1146/annurev-fluid-010313-141408, 2015.
Kalampokis, A., Uttieri, M., Poulain, P.-M., and Zambianchi, E.: Validation of HF radar-derived currents in the Gulf of Naples with Lagrangian data, IEEE Geosci. Remote Sens. Lett., 13, 10, 1452–1456, https://doi.org/10.1109/LGRS.2016.2591258, 2016.
Kourafalou, V. H. and Androulidakis, Y. S.: Influence of Mississippi River induced circulation on the Deepwater Horizon oil spill transport, J. Geophys. Res.-Oceans, 118, 3823–3842, https://doi.org/10.1002/jgrc.20272, 2013.
LaCasce, J. H.: Statistics from Lagrangian observations, Prog. Oceanogr., 77, 1–29, https://doi.org/10.1016/j.pocean.2008.02.002, 2008.
Leimann, I., Epke, M. J., Griesel, A., Walter, M., Linardakis, L., Korn, P., and Br, N.: Diagnosing Kinetic Energy Scaling using Lagrangian and Eulerian Metrics in Different Dynamical Regimes of the North Atlantic Diagnosing Kinetic Energy Scaling using Lagrangian and Eulerian Metrics in Different Dynamical Regimes of the North Atlantic, ESS Open Arch., https://doi.org/10.22541/essoar.176236197.76973627/v1, in press, 2025.
Lentz, S.: Buoyant coastal currents, Cambridge University Press, 64–202, https://doi.org/10.1017/CBO9780511920196.005, 2012.
Liu, Y. and Weisberg, R. H.: Evaluation of trajectory modeling in different dynamic regions using normalized cumulative Lagrangian separation, J. Geophys. Res., 116, C09013, https://doi.org/10.1029/2010JC006837, 2011.
Mantovani, C., Corgnati, L., Horstmann, J., Rubio, A., Reyes, E., Quentin, C., Cosoli, S., Asensio, J. L., Mader, J., and Griffa, A.: Best Practices on High Frequency Radar Deployment and Operation for Ocean Current Measurement, Front. Mar. Sci., 7, 1–21, https://doi.org/10.3389/fmars.2020.00210, 2020.
Mazzini, P. L. F., Barth, J. A., Shearman, R. K., and Erofeev, A.: Buoyancy-Driven Coastal Currents off Oregon during Fall and Winter, J. Phys. Oceanogr., 44, 2854–2876, https://doi.org/10.1175/JPO-D-14-0012.1, 2014.
Mckee, D. C., Doney, S. C., Veatch, J. M., Kavanaugh, M. T., and Kohut, J. T.: Disentangling Advection and Lagrangian Evolution of Surface Chlorophyll in a Nearshore Submarine Canyon Using Satellite Remote Sensing and High – Frequency Radar, J. Geophys. Res.-Oceans, 130, e2024JC022101, https://doi.org/10.1029/2024JC022101, 2024.
Molleri, G. S. F., Novo, E. M. L. D. M., and Kampel, M.: Space-time variability of the Amazon River plume based on satellite ocean color, Cont. Shelf Res., 30, 342–352, https://doi.org/10.1016/j.csr.2009.11.015, 2010.
Münchow, A. and Garvine, R. W.: Dynamical properties of a buoyancy-driven coastal current, J. Geophys. Res.-Oceans, 98, 20063–20077, https://doi.org/10.1029/93JC02112, 1993.
Nguyen, D. T.: Variability of the Red River plume in the Gulf of Tonkin from stochastic modeling and cluster analysis. Ocean, Atmosphere, PhD thesis, Université Paul Sabatier, Toulouse III, France, https://theses.hal.science/tel-03828544v1 (last access: 10 October 2025), 2022.
Nguyen-Duy, T., Ayoub, N. K., Marsaleix, P., Toublanc, F., De Mey-Frémaux, P., Piton, V., Herrmann, M., Duhaut, T., Tran, M. C., and Ngo-Duc, T.: Variability of the Red River Plume in the Gulf of Tonkin as Revealed by Numerical Modeling and Clustering Analysis, Front. Mar. Sci., 8, 1–25, https://doi.org/10.3389/fmars.2021.772139, 2021.
Nguyen-Duy, T., Ayoub, N. K., De-Mey-Frémaux, P., and Ngo-Duc, T.: How sensitive is a simulated river plume to uncertainties in wind forcing? A case study for the Red River plume (Vietnam), Ocean Model., 186, 102256, https://doi.org/10.1016/j.ocemod.2023.102256, 2023.
Piton, V., Herrmann, M., Marsaleix, P., Duhaut, T., Ngoc, T. B., Tran, M. C., Shearman, K., and Ouillon, S.: Influence of winds, geostrophy and typhoons on the seasonal variability of the circulation in the Gulf of Tonkin: A high-resolution 3D regional modeling study, Reg. Stud. Mar. Sci., 45, 101849, https://doi.org/10.1016/j.rsma.2021.101849, 2021.
Poulain, P.-M., Gerin, R., Mauri, E., and Pennel, R.: Wind Effects on Drogued and Undrogued Drifters in the Eastern Mediterranean, J. Atmos. Ocean. Tech., 26, 1144–1156, https://doi.org/10.1175/2008JTECHO618.1, 2009.
Rogowski, P., Zavala-Garay, J., Shearman, K., Terrill, E., Wilkin, J., and Lam, T. H.: Air-Sea-Land Forcing in the Gulf of Tonkin: Assessing Seasonal Variability Using Modern Tools, Oceanography, 32, 150–161, https://doi.org/10.5670/oceanog.2019.223, 2019.
Ruiz, I., Rubio, A., Abascal, A. J., and Basurko, O. C.: Modelling floating riverine litter in the south-eastern Bay of Biscay: a regional distribution from a seasonal perspective, Ocean Sci., 18, 1703–1724, https://doi.org/10.5194/os-18-1703-2022, 2022.
Sentchev, A., Duc, T. N., Berti, S., Ayoub, N. K., and Vinh, V. D.: Lagrangian Dispersion in the Red River Plume Region, Northeast Vietnam, from Drifter Observations and Modeling, SSRN, https://doi.org/10.2139/ssrn.5127385, 2025.
Simpson, J. H.: Physical processes in the ROFI regime, J. Mar. Syst., 12, 3–15, https://doi.org/10.1016/S0924-7963(96)00085-1, 1997.
Sukhatme, J.: Lagrangian Velocity Correlations and Absolute Dispersion in the Midlatitude Troposphere, J. Atmos. Sci., 62, 3831–3836, https://doi.org/10.1175/JAS3560.1, 2005.
Tavora, J., Gonçalves, G. A., Fernandes, E. H., Salama, M. S., and van der Wal, D.: Detecting turbid plumes from satellite remote sensing: State-of-art thresholds and the novel PLUMES algorithm, Front. Mar. Sci., 10, https://doi.org/10.3389/fmars.2023.1215327, 2023.
Thomson, R. E. and Emery, W. J.: Data Analysis Methods in Physical Oceanography, in: 3rd Edn., Elsevier, Oxford, ISBN 9780123877826, 2014.
Tran, D. M.: Monitoring of the quality of marine waters in French Guiana by remote sensing and in-situ measurements, Université du Littoral Côte d'Opale, 284 pp., https://doi.org/10.13140/RG.2.2.17296.62724, 2023a.
Tran, M. C.: Characterization of the coastal dynamics and turbulent dispersion in the Gulf of Tonkin from HF radar measurements and modeling: the effect of fine-scale dynamics on the spatial structuring of phytoplankton, PhD thesis, Université du Littoral Côte d'Opale, France, https://theses.hal.science/tel-03988218v1 (last access: 10 October 2025), 2023b.
Tran, M. C., Sentchev, A., Berti, S., Ayoub, N. K., Nguyen-Duy, T., and Cuong, N. K.: Assessment of relative dispersion in the Gulf of Tonkin using numerical modeling and HF radar observations of surface currents, Cont. Shelf Res., 245, 104784, https://doi.org/10.1016/j.csr.2022.104784, 2022.
van Maren, D. S.: Water and sediment dynamics in the Red River mouth and adjacent coastal zone, J. Asian Earth Sci., 29, 508–522, https://doi.org/10.1016/j.jseaes.2006.03.012, 2007.
Vinh, V. D. and Thanh, T. D.: Characteristics of current variation in the coastal area of Red River delta – results of research using the 3D numerical model, J. Mar. Sci. Technol., 14, 139–148, https://doi.org/10.15625/1859-3097/14/2/4480, 2014.
Xu, F., Yao, Y., Oey, L., and Lin, Y.: Impacts of pre-existing ocean cyclonic circulation on sea surface chlorophyll-a concentrations off northeastern Taiwan following episodic typhoon passages, J. Geophys. Res.-Oceans, 122, 6482–6497, https://doi.org/10.1002/2016JC012625, 2017.
Yaremchuk, M. and Sentchev, A.: Mapping radar-derived sea surface currents with a variational method, Cont. Shelf Res., 29, 1711–1722, https://doi.org/10.1016/j.csr.2009.05.016, 2009.
Zavala-Garay, J., Rogowski, P., Wilkin, J., Terrill, E., Shearman, R. K., and Tran, L. H.: An Integral View of the Gulf of Tonkin Seasonal Dynamics, J. Geophys. Res.-Oceans, 127, 1–19, https://doi.org/10.1029/2021JC018125, 2022.
Zhou, H. and Liu, X.: Enhanced Transport Induced by Tropical Cyclone and River Discharge in Hangzhou Bay, Water, 17, 164, https://doi.org/10.3390/w17020164, 2025.
Zong, X., Cheng, X., Zhang, S., Lian, Q., Deng, F., and Chen, Z.: effects on dynamics and freshwater transport of a medium-scale river plume with multiple outlets, Ocean Model., 188, 102338, https://doi.org/10.1016/j.ocemod.2024.102338, 2024.