the Creative Commons Attribution 4.0 License.
the Creative Commons Attribution 4.0 License.
 | 26 Mar 2026
Characterisation of past marine heatwaves around South Pacific Island countries: what really matters?
Sophie Cravatte
Christophe Menkes
Jed Macdonald
Romain Le Gendre
Ines Mangolte
Cyril Dutheil
Neil J. Holbrook
Simon Nicol
Marine heatwaves (MHWs) can have devastating and lasting impacts on marine ecosystems. We investigated past MHW characteristics around 12 southwestern Pacific Island countries and territories (PICTs) using two observed sea surface temperature products and an ocean reanalysis product. PICTs are highly dependent on their marine resources for their livelihoods: a better understanding of MHW characteristics is needed for planning and adaptation to risks associated with MHWs. Our research builds on previous studies where MHWs have been detected and described using a point-based definition. We first revisit past MHW characteristics based on their spatial extent, vertical extent and seasonality. We show that filtering MHWs by size (spatial extent) and seasonality can greatly affect their characterisation and help trace their physical drivers. We then characterise past events inside each Exclusive Economic Zone (EEZ) and at the coast with MHW indices tailored to benefit Pacific Island stakeholders. We consider two types of events: large-scale events, covering a large part of the EEZ, likely to affect pelagic fisheries, and events affecting coastal zones and ecosystems. We distinguish between events occurring in the hot season (November to April), and in the cold season (May to October). We show that all 12 PICTs experienced MHWs in the past 30 years that are getting more frequent with greater spatial extents, longer durations, explained by the long-term warming trend in sea surface temperature, but with lower maximum intensity. New Caledonia, Vanuatu, Fiji and Tonga appear to be more exposed to MHWs with longer duration, higher maximum intensity, and deeper extent compared to other countries.
- Article
(18438 KB) - Full-text XML
-
Supplement
(3716 KB) - BibTeX
- EndNote


Marine heatwaves (MHWs) are warm ocean temperature extremes, often characterised in terms of anomalously warm sea surface temperatures that persist above some threshold value. MHWs have gained traction in recent years by both scientists and the general public due to their detrimental impacts on ecology and the economy. MHWs affect marine life both directly and indirectly, and can reverberate up the food chain. Some iconic events have had devastating effects on coastal species, open-ocean resources and economies at local through to global scales (Hobday et al., 2018; Smith et al., 2021). The 2011 Western Australian event affected several ecological communities including corals, seaweeds, sea grass and commercially important species such as king and tiger prawns, blue crabs and scallops (Caputi et al., 2016; Moore et al., 2012; Thomson et al., 2015; Wernberg et al., 2013). The 2015 northeast Pacific Blob resulted in massive die off in seabirds and mammals, changes in community structure of phytoplankton and zooplankton, and fisheries closures due to harmful algal blooms (Cavole et al., 2016; Jones et al., 2018). The 2012 northwest Atlantic event saw shifts in the distribution and phenological changes in commercially important lobster species, resulting in serious consequences for the lobster fishery in the US and Canada (Mills et al., 2013). Smith et al. (2021) estimate that the economic cost of certain MHW events can exceed several million US dollars (USD) (e.g. USD 38 million, 2012 northwest Atlantic event) in direct losses and several billion USD per annum in indirect losses for events lasting multiple consecutive years.
Significant efforts have been made recently to better understand these extreme events, with the ultimate goal to provide useful information to stakeholders to enable effective adaptation measures. As a first step, the need to have a common definition of a MHW, which was valid for both summer and winter seasons and for various areas with different sea surface temperature (SST) variability, was recognised (Hobday et al., 2016, hereafter Hob16). Building on an existing definition developed from the concept of atmospheric heatwaves, Hob16 developed a definition for MHWs. In this now widely used definition, a MHW occurs when ocean (here, sea surface) temperatures are warmer than the daily climatological 90th percentile threshold based on a 30-year historical baseline for a period of five or more days. To better account for the maximum intensity and possible impacts of a MHW, Hobday et al. (2018) further defined MHW categories as integer multiples of the difference between the 90th percentile and the climatological value: these are Moderate (Category 1, between 1 and 2 integer multiple), Strong (Category 2, 2–3 integer multiples), Severe (Category 3, 3–4 integer multiples) and Extreme (Category 4, above 4). This definition has been used in many subsequent studies, and statistics obtained on past and future MHWs for the global ocean often rely on this definition, albeit with slight modifications (for example in Oliver et al., 2021; Sen Gupta et al., 2020; Plecha and Soares, 2020). These studies show that all regions in the ocean have been experiencing MHWs in the past decades, with projected increases in MHW maximum intensity, duration and frequency in the coming decades (Oliver et al., 2021).
Although the southwestern Pacific has been less studied than other regions such as the northeastern Pacific, it has not been spared by MHWs. This region is composed of a myriad of vulnerable islands and atolls, with marine ecosystems and coral reef environments highly sensitive to increasing temperatures, threatening the entire ecosystem and causing concerns for food security, tourism and fish catch rates (Andréfouët et al., 2015; Holbrook et al., 2022; Uthicke et al., 2015; Wyatt et al., 2023, Smith et al., 2021). With the projected increase of temperature, and MHWs frequency with climate change (IPCC, 2023) there are concerns that such ecosystems may disappear completely by 2050 (Dixon et al., 2022; Hughes et al., 2018; van Hooidonk et al., 2013). Holbrook et al. (2022), hereafter H22, examined past MHW characteristics and climate change projections of MHW metrics (frequency, maximum intensity and duration) in the tropical western and central Pacific region. In the whole region (except along the equator), H22 showed that there are on average 1 to 3 MHW events per year at any particular location, typically lasting from 8 to 13 d, with a mean maximum intensity of 1.1 to 1.7 °C. H22 also suggested that MHW days are projected to significantly increase in the coming decades, with rates depending on the carbon emissions scenario. H22 also investigated 3 main events over the past period: the February 2016 event in Fiji, the 2015 mass coral bleaching event in Samoa, and the 2010 mass coral bleaching event in Palau.
These analyses are a useful first step for Pacific Island countries towards becoming aware of the past and future risk of exposure to MHWs of varying intensities, frequencies and durations. Yet, the information that decision makers could extract from these metrics is often insufficient to allow them to fully understand MHW impacts on ecosystems, and to take effective action. We illustrate this through the following four points. First, as Hob16's detection method is performed independently at each location, it does not consider MHW spatial extent and does not distinguish between large events and smaller, more localised events. Secondly, in most studies, the detection is done at the surface, and does not consider the MHW vertical extent. These metrics alone do not fully measure all ecosystem exposure. Highly mobile pelagic species, such as tunas, are likely not affected in the same way by very localised events as compared to sessile species. The extent of exposure for mobile species is likely more linked to large-scale events covering hundreds or thousands of square kilometres. Many pelagic species also regularly move vertically through the water column to track prey resources and/or meet oxygen demands (Briand et al., 2011; Arrizabalaga et al., 2011; Nikolic et al., 2017), and metrics measuring the depth of MHWs are needed to capture this exposure. Thirdly, seasonal distinctions are essential as MHWs' impacts on ecosystems depend on their thermal tolerance levels, thus on the time of year of occurrence (summer or winter). Finally, time-mean statistics for MHWs alone do not inform decision makers on the strongest events that occurred in the past, nor on the statistical distributions of events, to better anticipate the types of future events that are likely to occur in the countries' waters.
Here, we aim to go beyond these limitations. We characterise past MHWs (1981–2023) for 12 Pacific Island countries and territories (PICTs) within their EEZs, so that the results can be more easily usable for marine management and decision making in each PICT. We consider two different types of events that can significantly affect Pacific Island ecosystems and economies: (i) large-scale events, henceforth referred to as “macroscale events”, covering a large part of the EEZ, with potentially significant impacts for pelagic fisheries, and (ii) coastal events, that may have smaller spatial extents, yet may impart significant impacts on reef ecosystems and coastal resource management. We distinguish between events occurring in summer and in winter months. We extract the vertical extents of surface MHWs to gain an understanding of the volume of water that may be subjected to heat stress during MHW events. Finally, we also explore climate trends in MHW properties.
This paper is organised as follows. In Sect. 2, we present the data used, and the methodology applied. In the same vein as some recent studies (Sun et al., 2023; Bonino et al., 2023), we propose an easy and simple way to quantify the spatial extent of surface MHWs by calculating areas of connected points. In Sect. 3, we explore the spatial extent of MHWs in the whole southwest Pacific region, and show that the MHW metrics, when excluding small scale events, change substantially from what has been previously published (H22; Oliver et al., 2021). We also show that discussing MHW statistics in terms of sizes helps to infer the underlying physical drivers. In Sect. 4, we provide information on past MHW characteristics for PICTs. For each PICT, we provide past MHW metrics for the two types of events (macroscale and coastal events), separately. We conclude and provide perspectives in Sect. 5 on what should now be done, with this information, to better assess the vulnerability of PICTs to future MHWs.
The study region extends from 2.4 to 34.8° S and 145° E to 151° W (Fig. 1a). It contains the eastern coastline of Australia and Papua New Guinea and full EEZs of 12 PICTs; on the western side, Solomon Islands, New Caledonia, Vanuatu; in the centre, Tuvalu, Fiji, Wallis and Futuna, Tonga; and on the eastern side, Tokelau, Samoa, American Samoa, Niue and Cook Islands.
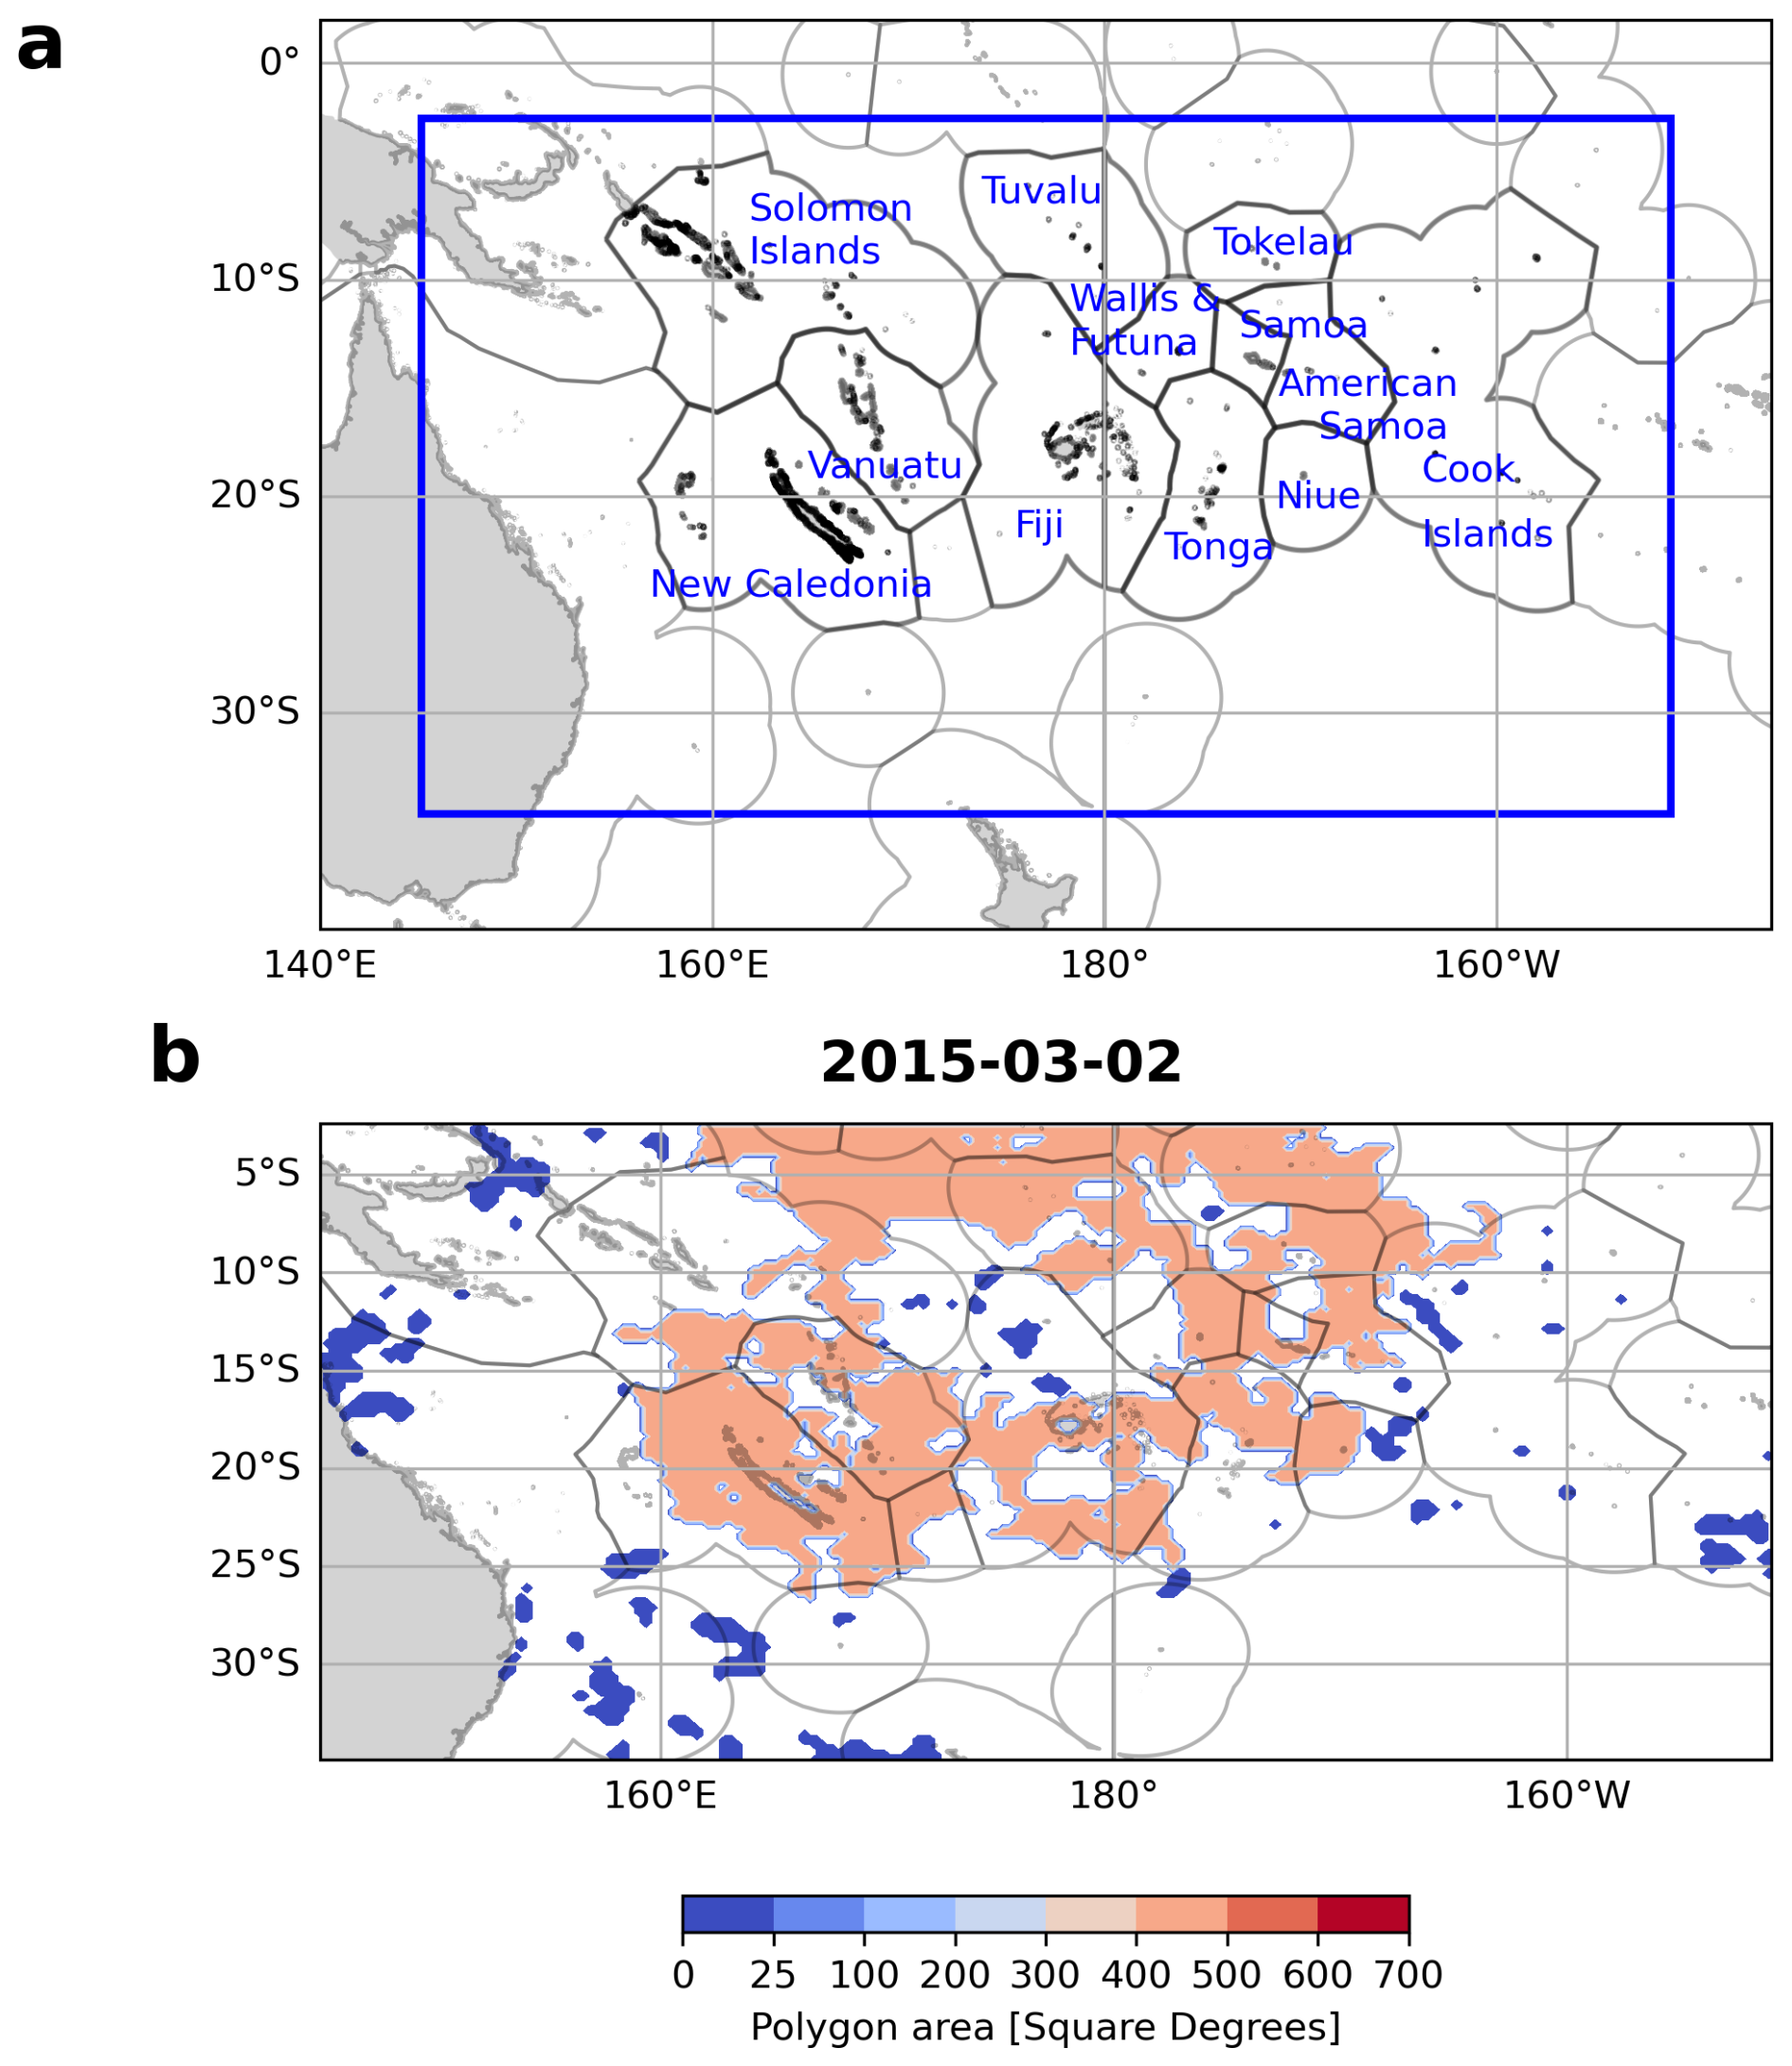
Figure 1(a) Map showing the study area, the Tropical Southwest Pacific enclosed by the blue box. The 12 PICTs explored in depth in this study with their Exclusive Economic Zones (EEZs) are labelled in blue and outlined in black inside the blue box, from left to right Solomon Islands, New Caledonia, Vanuatu, Tuvalu, Fiji, Wallis and Futuna, Tonga, Tokelau, Samoa, American Samoa, Niue and Cook Islands. Other PICTs and their EEZs in the region are outlined in grey. (b) MHW polygon areas on 2 March 2015. MHWs detected using NOAA-OISST from September 1981 to June 2023.
2.1 Temperature datasets
We used three ocean temperature products to detect MHWs over the study region. We first used the NOAA-OISST version 2.1, which is a blended daily SST product (representing temperatures at 0.2 m depth) mixing satellite and in situ SST data. These data are mapped onto a 0.25° grid for the period 1 September 1981 to 26 June 2023 (Huang et al., 2021).
We also used ocean temperatures from GLORYS12, an ocean reanalysis product with a 1/12° horizontal resolution and 50 vertical levels (Lellouche et al., 2021). For comparison with NOAA-OISST, the GLORYS12 data was regridded to 0.25° and the first depth level was used (0.49 m) for the period 1 January 1993 to 31 December 2019 for open ocean events. The advantage of GLORYS12 is that it allows us to explore the vertical extent of MHWs. For investigation of the MHW events at the coast (Sect. 4), grid cells closest to the land mask of the 12 PICTs in waters deeper than 200 m depth were used at 1/12° horizontal resolution and at the first depth level (0.49 m) for the period 1 January 1993 to 24 October 2023. As GLORYS12 does not resolve processes in very shallow coastal waters adequately, a depth of 200 m allowed MHW detection to be made in sufficiently deep waters outside the lagoon but close enough to the coast so that inferences could be made about MHW events that could have affected coastal waters.
Finally, we use the Operational Sea Surface Temperature and Ice Analysis (OSTIA) product to validate and compare robust features in coastal MHWs with GLORYS12 over the 1 January 1993 to 24 October 2023 period. OSTIA is a 0.05° horizontal resolution, blended SST product using in-situ and satellite data from both infrared and microwave radiometers (Good et al., 2020).
2.2 MHW detection method and product intercomparison
MHWs were detected using all products, based on the Hob16 definition at each pixel in the tropical southwest Pacific (Fig. 1a). A 90th percentile threshold was used with the 1993–2019 climatological period. This baseline was chosen since it was common to all products and for consistency, as the detection method is quite sensitive to the baseline chosen (Amaya et al., 2023). No trend was removed to understand the impact of total heat exposure (to account for both temporary extreme heat events and long-term warming; see also discussion in Sect. 5.3). In Secti. 3.3 only, we detrended the SST and calculated trends on MHWs detected on the detrended SST to understand if the trends that we are seeing are due to long term warming (Figs. 7 and 8).
The marineHeatWaves package available in Python (https://github.com/ecjoliver/ marineHeatWaves, last access: 24 September 2024) was used for the detection of MHWs and calculation of key MHW parameters such as duration, intensities, onset and decline rates.
We also computed linear trends for the annual number of MHW days, duration, maximum intensity, vertical extent and their significance using linear least-squares regression from the Scipy Package in Python. For the detection and calculation of trends, annual mean time series of these variables were used for full years from 1982 to 2022 for NOAA-OISST and 1993 to 2022 for GLORYS12 and OSTIA coastal events.
The statistical significance of the slope was determined from the p value of the linear least-squares regression (Scipy Package in Python, https://docs.scipy.org/doc/scipy/reference/generated/scipy.stats.linregress.html, last access: 12 February 2026).
2.3 MHW spatial extent
Here we present a simple and easy way to measure the daily spatial extent of MHWs, using contours drawn over spatially connected MHW patches. It is an intuitive method, easy to follow and sufficient for the purposes of this paper, allowing MHWs to be described in a way complementary to the parameters originally presented in Hob16. As in the method used by Bonino et al. (2023), our method does not consider the physical processes behind an event, it just calculates the area occupied by connected pixels in active MHW state.
After MHWs were detected at each grid cell in the study area (Fig. 1a), a boolean 1 was assigned to each day in an active MHW state at each location and a 0 otherwise. Contours were drawn over regions with 1 and 0 s. The contours were then turned into polygons and the area of the polygons were calculated. In the case where non-MHW areas were enclosed by MHW areas, the area occupied by the non-MHW polygon was subtracted from the MHW polygon. Each grid cell within a particular MHW polygon was assigned a value equal to the area of that MHW polygon (Fig. 1b). Polygons greater than 25 square degrees were categorised as “macroscale” MHWs and polygons smaller than 25 square degrees as “microscale” MHWs on each day. This was done for each day separately. This choice follows Sun et al. (2023) and allows the elimination of the MHWs linked to the passage of mesoscale eddies, which occupy areas of around 1–2 square degrees up to 20 square degrees, with diameters between 50–500 km in the region (Keppler et al., 2018). The micro and macroscale spatial extents were then used as masks to filter MHW properties described in Sect. 2.2 (MHW detection method and product intercomparison) by their sizes (spatial extent), every day independently. Once information relevant to events of particular sizes (spatial extent) were obtained, comparisons between the MHW properties related to microscale and macroscale sized MHWs were made by sizes and seasons. Properties associated with macroscale MHWs were then clipped with country EEZs to obtain relevant country level information as macroscale sized events have higher chances of affecting large ocean areas and their marine resources.
2.4 MHW vertical extent
MHWs were identified independently at each of the upper ocean 38 depth levels available in GLORYS12 from 0.49 to 1500 m, as has been done by others (Schaeffer et al., 2023; Schaeffer and Roughan, 2017). We only consider events detected at the surface. Then, the maximum depth of MHW detection without interruption from the surface in MHW detection, was recorded as the vertical extent of the surface MHW event at that location. This method does not allow for the identification of subsurface-only MHWs (Schaeffer et al., 2023). Vertical extents associated with microscale and macroscale MHWs were explored in terms of their seasonality and trends. Macroscale MHWs were clipped with country EEZs to obtain relevant country level information.
3.1 MHW spatial extent
Before characterising “macroscale” MHWs, we first investigate the distribution of MHW polygon sizes in the study region. Figure 2 shows histograms of MHW polygons, by size, for both NOAA-OISST and GLORYS12 products, and separately for cold season (May to October) and hot season (November to April). A large majority of the MHW events (80 % for GLORYS12, 72 % for NOAA-OISST) detected daily are of very small spatial extent, less than one square degree (Fig. 2a). The two products give quite different results for the number of small-scale events, highlighting the dependence of the Hob16 detection method on the product used. Hob16 have acknowledged that the method is sensitive to the product chosen, and differences may arise in terms of MHWs statistics among products, even when using the same baseline (see Appendix A). This is particularly true in the cold season, when there are more than twice as many events smaller than 1 square degree identified using GLORYS12 compared with the NOAA-OISST product (Fig. 2a). This might also be related to higher energy of fine-scale processes in the cold season in the region (Rocha et al., 2016; Sérazin et al., 2020) represented in the 1/12° GLORYS simulation. Interestingly, the differences in the number of macroscale polygons (i.e. polygons greater than 25 square degrees) between the two products is strongly reduced (17 % difference between NOAA-OISST and GLORYS12 compared to 94 % difference for sizes smaller than 25 square degrees, not shown). This is an important result, since it lowers the dependence of the method on the product used when examining properties of macroscale MHWs. Up to 20 square degrees, microscale MHWs are more numerous in the cold season than in the hot season (18 % and 60 % more, for NOAA-OISST and GLORYS12, respectively, Fig. 2b). The contrary is true for macroscale sizes: there are more macroscale sized MHWs in the hot season than in the cold season (37 % and 32 % more, for NOAA-OISST and GLORYS12, respectively, Fig. 2b) as will be discussed later.
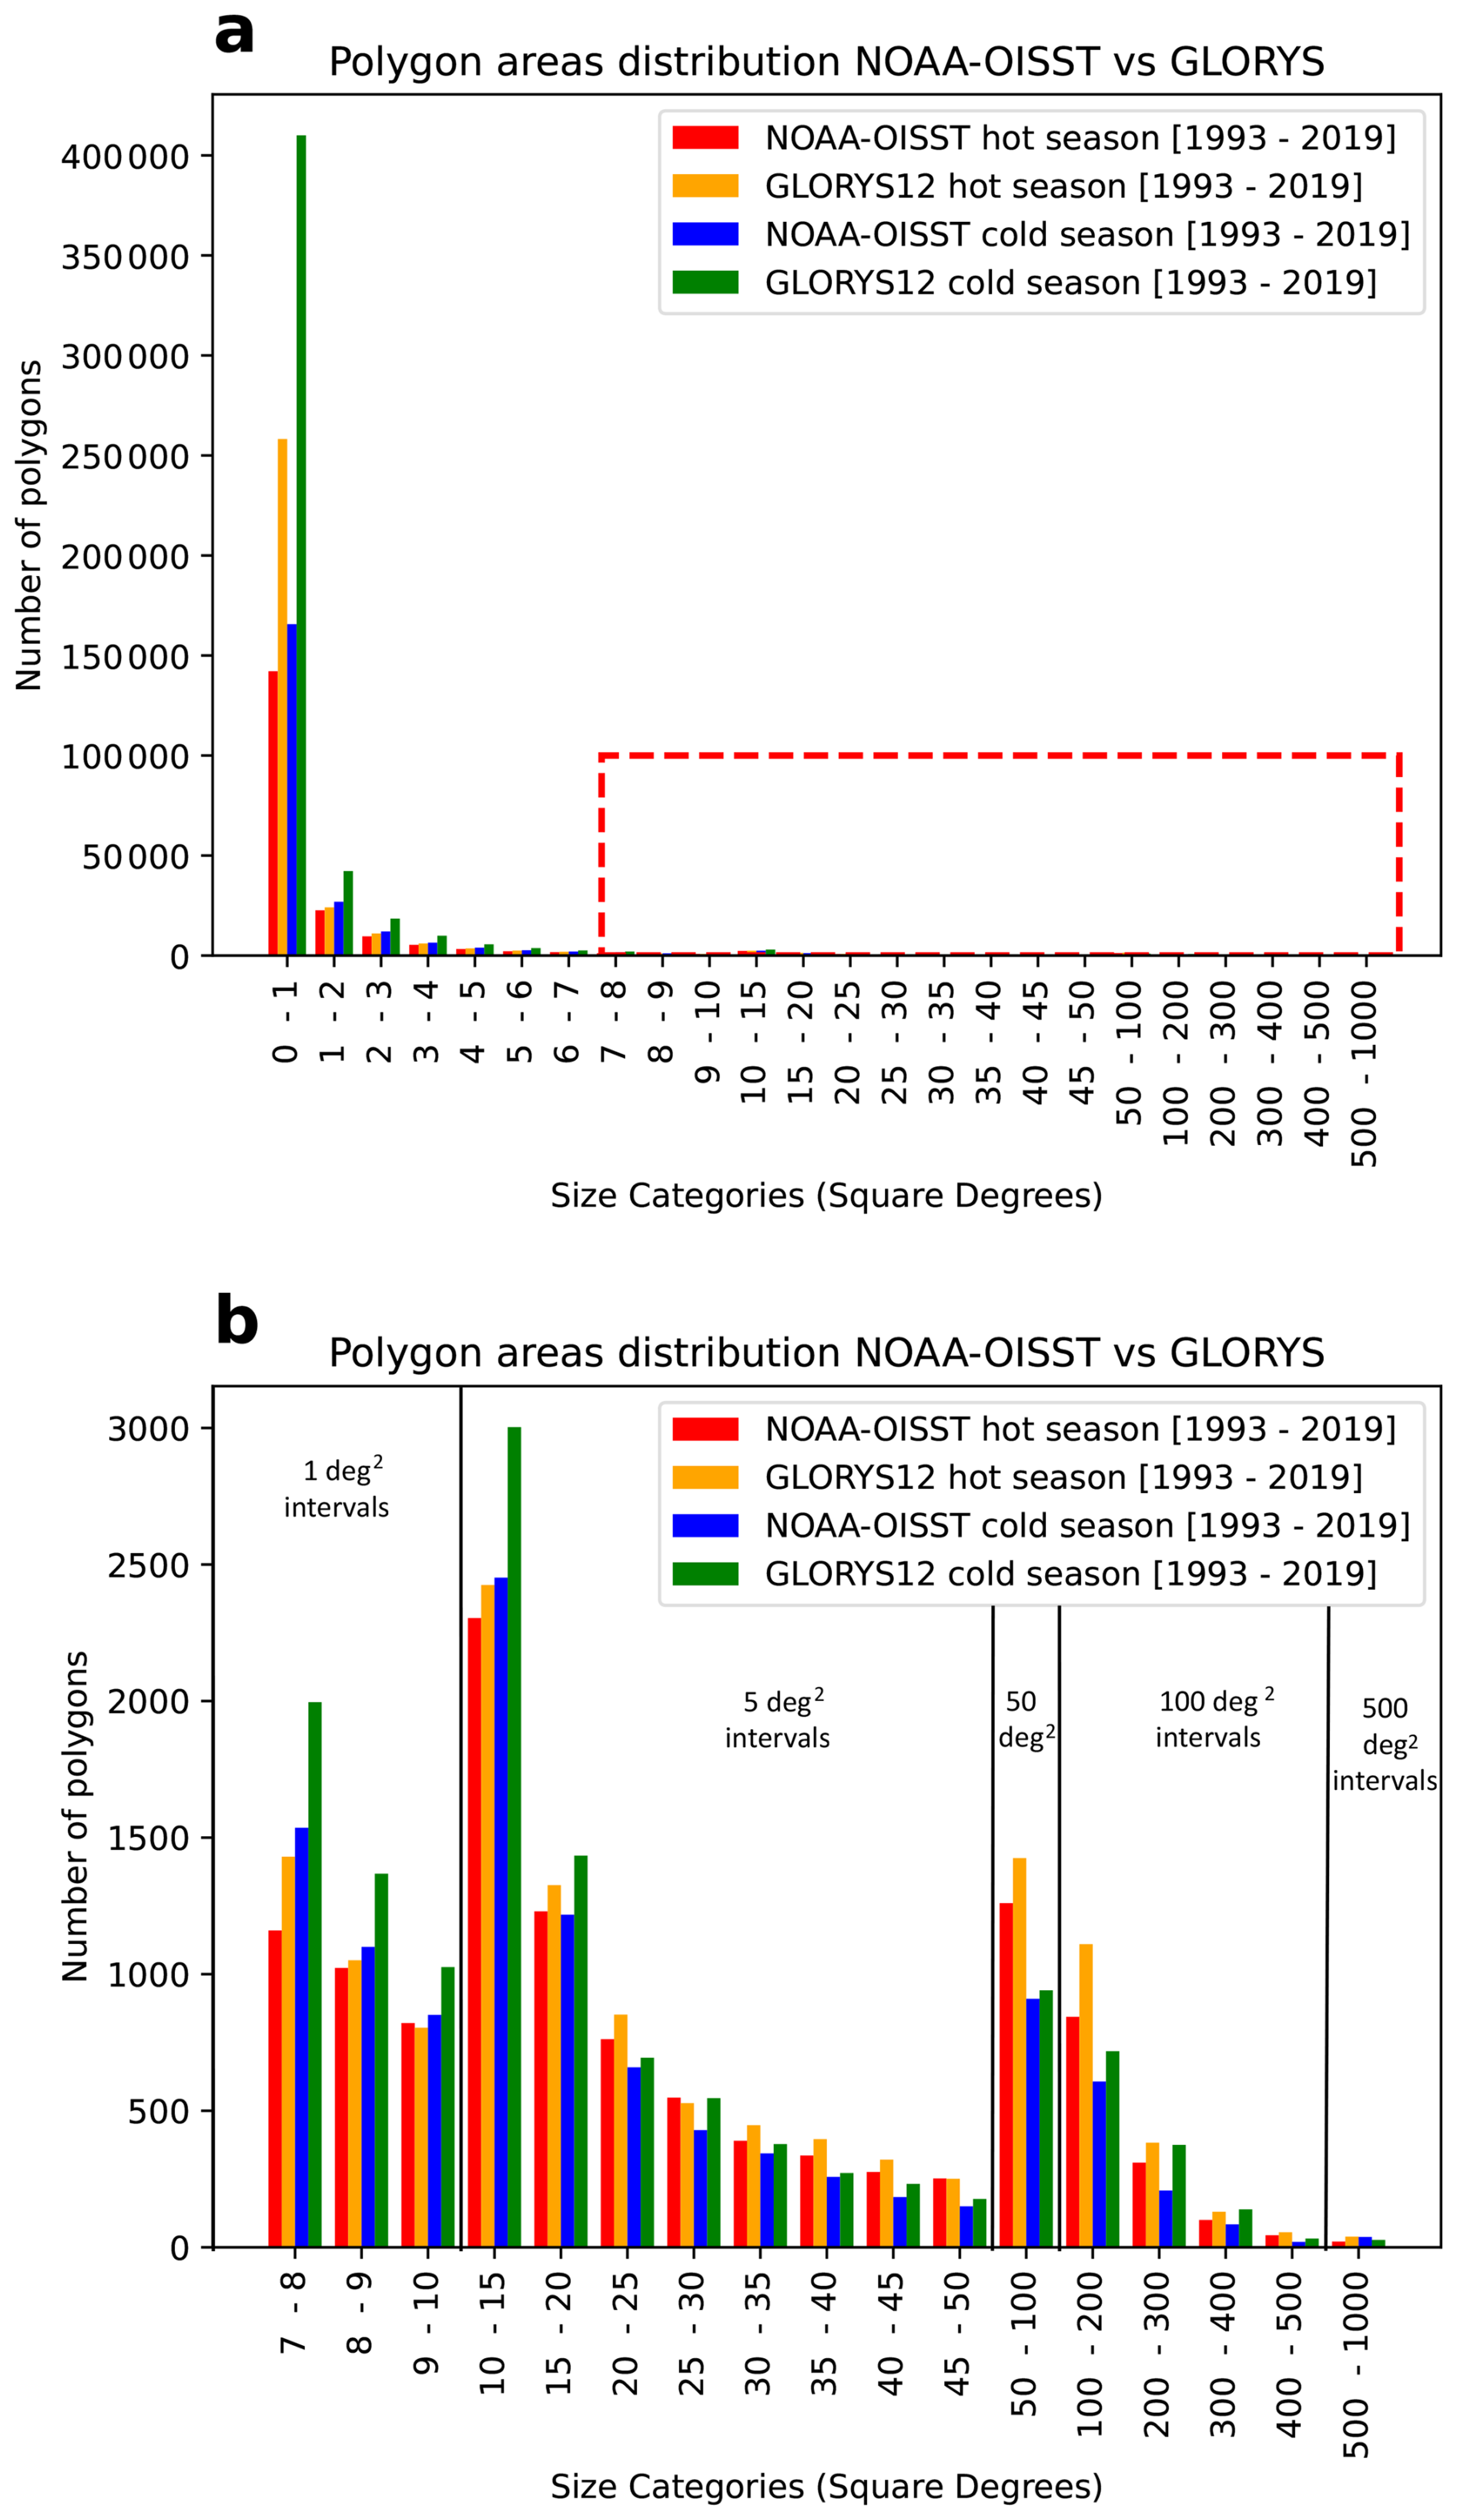
Figure 2Bar chart showing the number of MHW polygons belonging to various size categories in the hot (November to April) and cold (May to October) seasons. (a) shows all the size categories from 0 to 1000 square degrees. The red dashed rectangle is to indicate the zoom used in (b). (b) is a zoom in on sizes 7 to 1000 square degrees. Polygon areas were calculated from MHWs detected using NOAA-OISST and GLORYS12 from years 1993 to 2019.
Figure 3 shows the median size of the MHWs occurring in the southwest Pacific region. MHWs have highly variable spatial extents throughout the region. However, caution must be taken at the edges of the domain as size calculations are limited to the pixels inside the boundary box. Hence spatial extents of MHWs reaching the edges of the boundary box may in reality extend be larger than they appear in the figure. The majority of events occurring around New Caledonia, Vanuatu and Fiji are large-scale events of more than 160 square degrees (Fig. 3). This suggests that for these areas, the underlying processes could be linked to drivers impacting large-scale atmospheric or oceanic conditions, such as ENSO or MJO (Madden Julian Oscillation), as suggested previously (Dutheil et al., 2024; Holbrook et al., 2019; Sen Gupta et al., 2020; Vogt et al., 2022). MHWs become slightly smaller towards the east, with a median size of less than 100 square degrees. In the eddy-rich region (green box, Fig. 3) (Qiu and Chen, 2004), associated with the East Australian Current and its retroflection (west of ∼170° E and south of 25° S), MHWs are all small sized, with the median being smaller than the 25 square degrees limit (marked in dashed lines in magenta, Fig. 3). They are mostly associated with the occurrence of mesoscale eddies (Everett et al., 2012; Keppler et al., 2018). MHWs are also small in the Warm Pool region, equatorward of 5° S (Fig. 3).
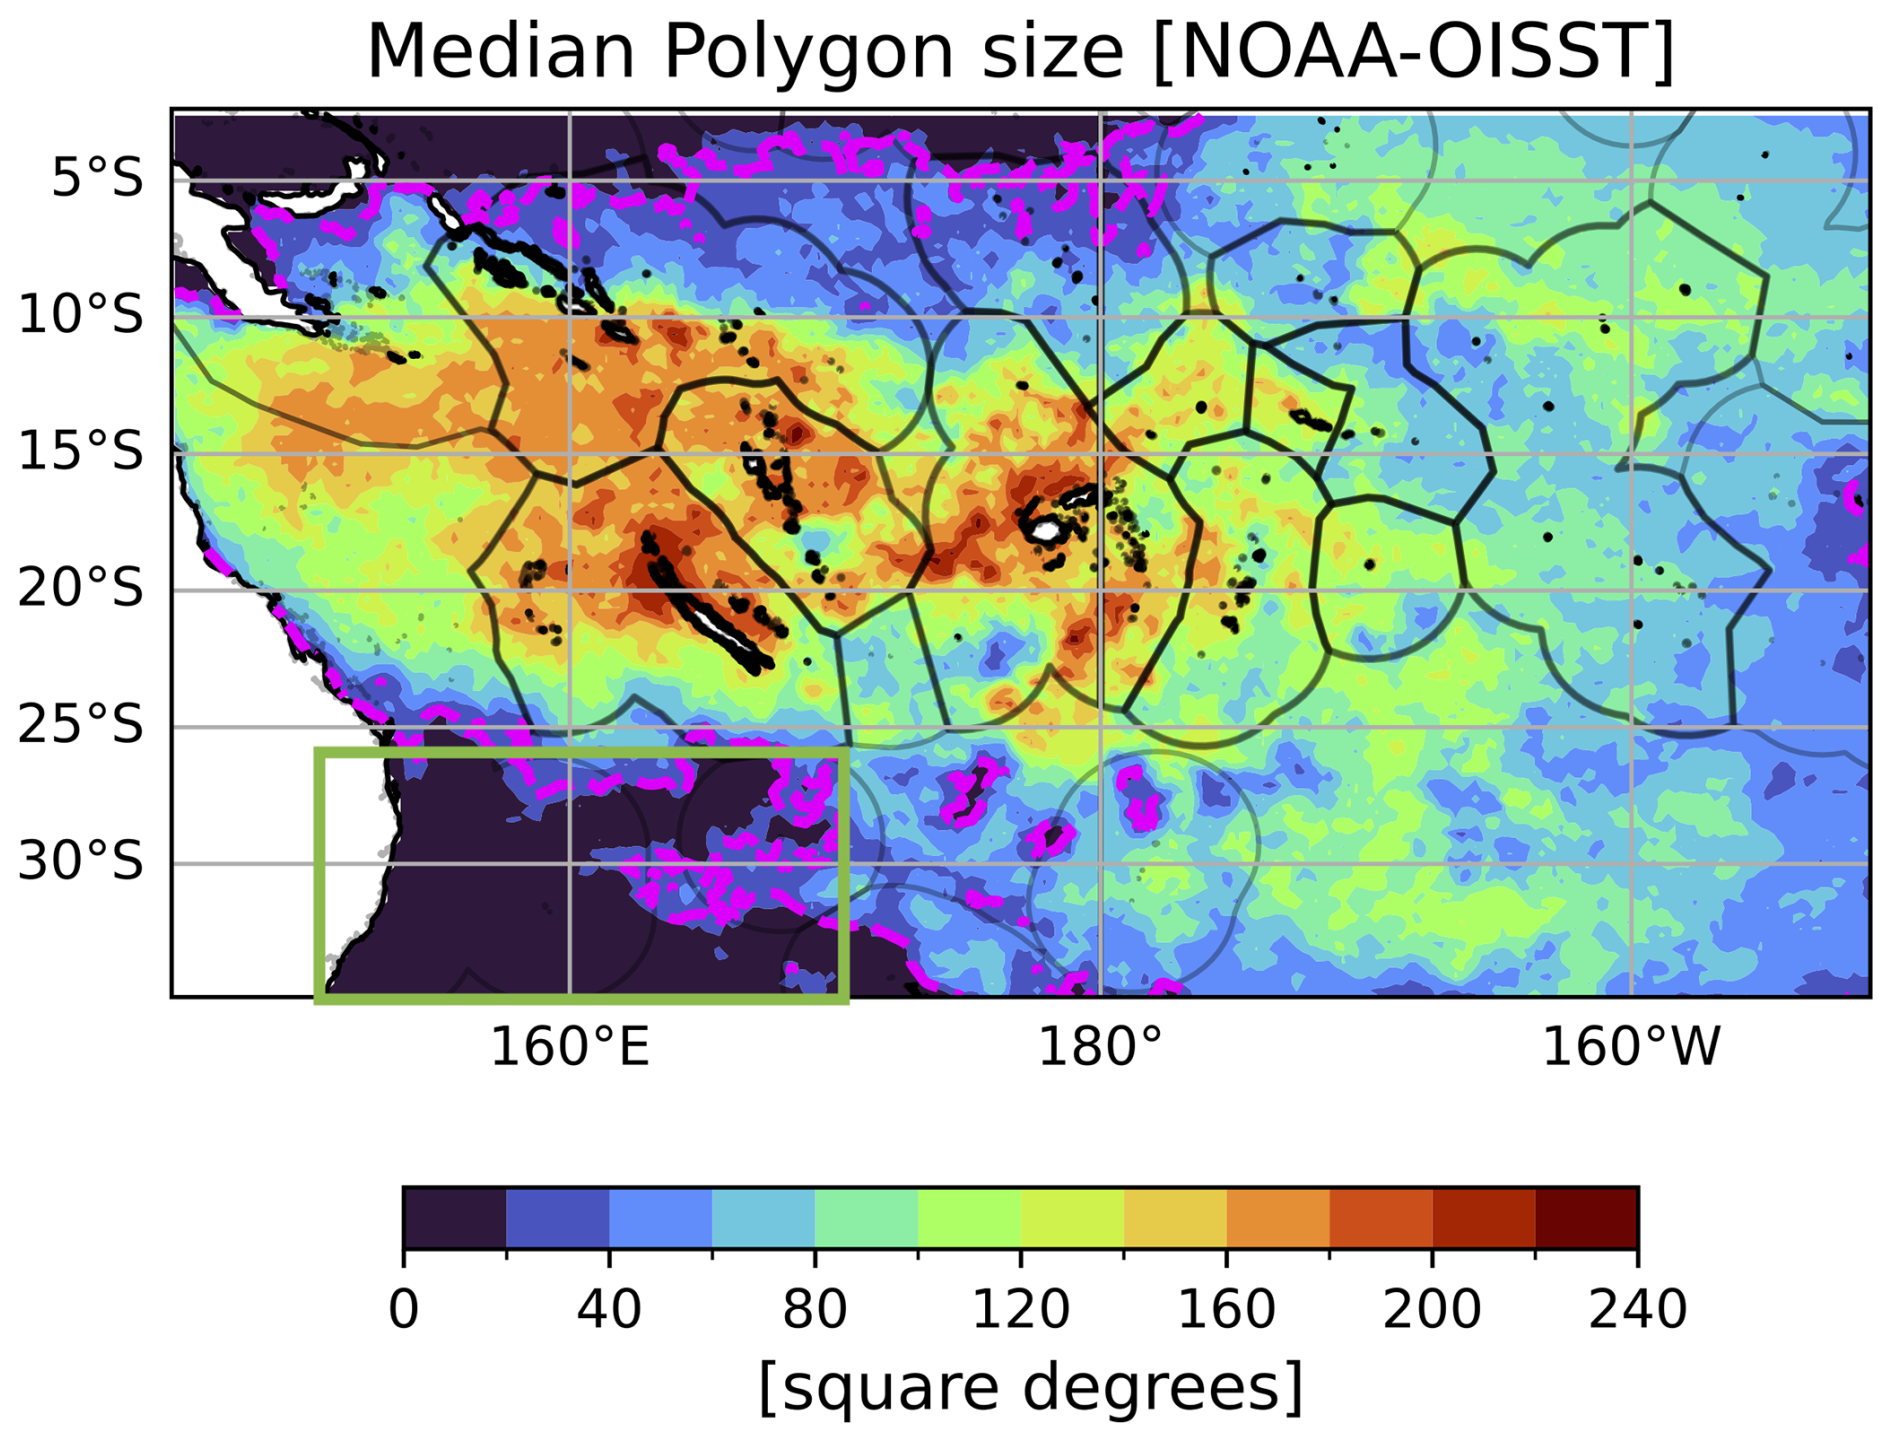
Figure 3Map showing median MHW polygon size computed only for pixels inside the domain with a dashed contour line at 25 square degrees in magenta. MHWs detected using NOAA-OISST from September 1981 to June 2023. The green rectangle marks the eddy rich region, where eddies shed at the southern extent of the East Australian Current. Caution must be taken at the edges of the domain. As calculations are limited to the pixels inside the boundary box, spatial extents of MHWs extending out of the boundary box may be larger than they appear in the figure.
3.2 Properties of MHWs filtered by size and season
Investigating the properties of MHWs (number of MHW days, mean duration, mean maximum intensity and vertical extent) as a function of size and season revealed patterns resembling dominant ocean-atmosphere processes in regions within the study area. The climate of the region is largely influenced by the presence of the South Pacific Convergence Zone (SPCZ), a band of low-level atmospheric convergence, cloudiness and rainfall, roughly extending from the Solomon Islands southeastward toward French Polynesia (Brown et al., 2020; Vincent et al., 2014). In the northern part of the region, equatorward of ∼10° S, the waters are warmer than 29 °C, forming the western Pacific Warm Pool (Cravatte et al., 2009). The region south of 20° S, in the area of the Subtropical Counter Current and in the area of the meandering East Australian Current, is characterised by ubiquitous, long lived, deep extending mesoscale eddies (Keppler et al., 2018; Qiu et al., 2009).
We chose to divide the study area into five subregions. The subregion division was inspired by Longhurst (2007) and Houssard et al. (2017). While these authors made the divisions based on ecological reasons for example due to nitrogen biochemistry at the base of marine food chains, ours has been modified to consider important climatological processes in the region, including the expected location of the SPCZ (subregions 1, 2, South-SPCZ and North-SPCZ), the transition between the western Pacific and the central eastern Pacific (subregion 3, Equatorial central region), presence of high energy eddies generated by the Eastern Australian Current (subregion 4, Southeastern Australian eddy region) and the more homogenous subtropical region (subregion 5, Subtropical region), which is part of the south Pacific subtropical gyre in Longhurst (2007) and Houssard et al. (2017). We have named our subregions to reflect our choice of classification. These also correspond to different properties in MHW metrics, as seen in Figs. 4–6. Figure 4 shows mean MHW characteristics for all events, and also separately for microscale (0–25 square degrees) and macroscale sized MHWs (25–700 square degrees). The mean duration and mean maximum intensity values shown in Fig. 4 are from MHWs detected at each grid cell, filtered by sizes day by day, with averaging done on this day by day filter.
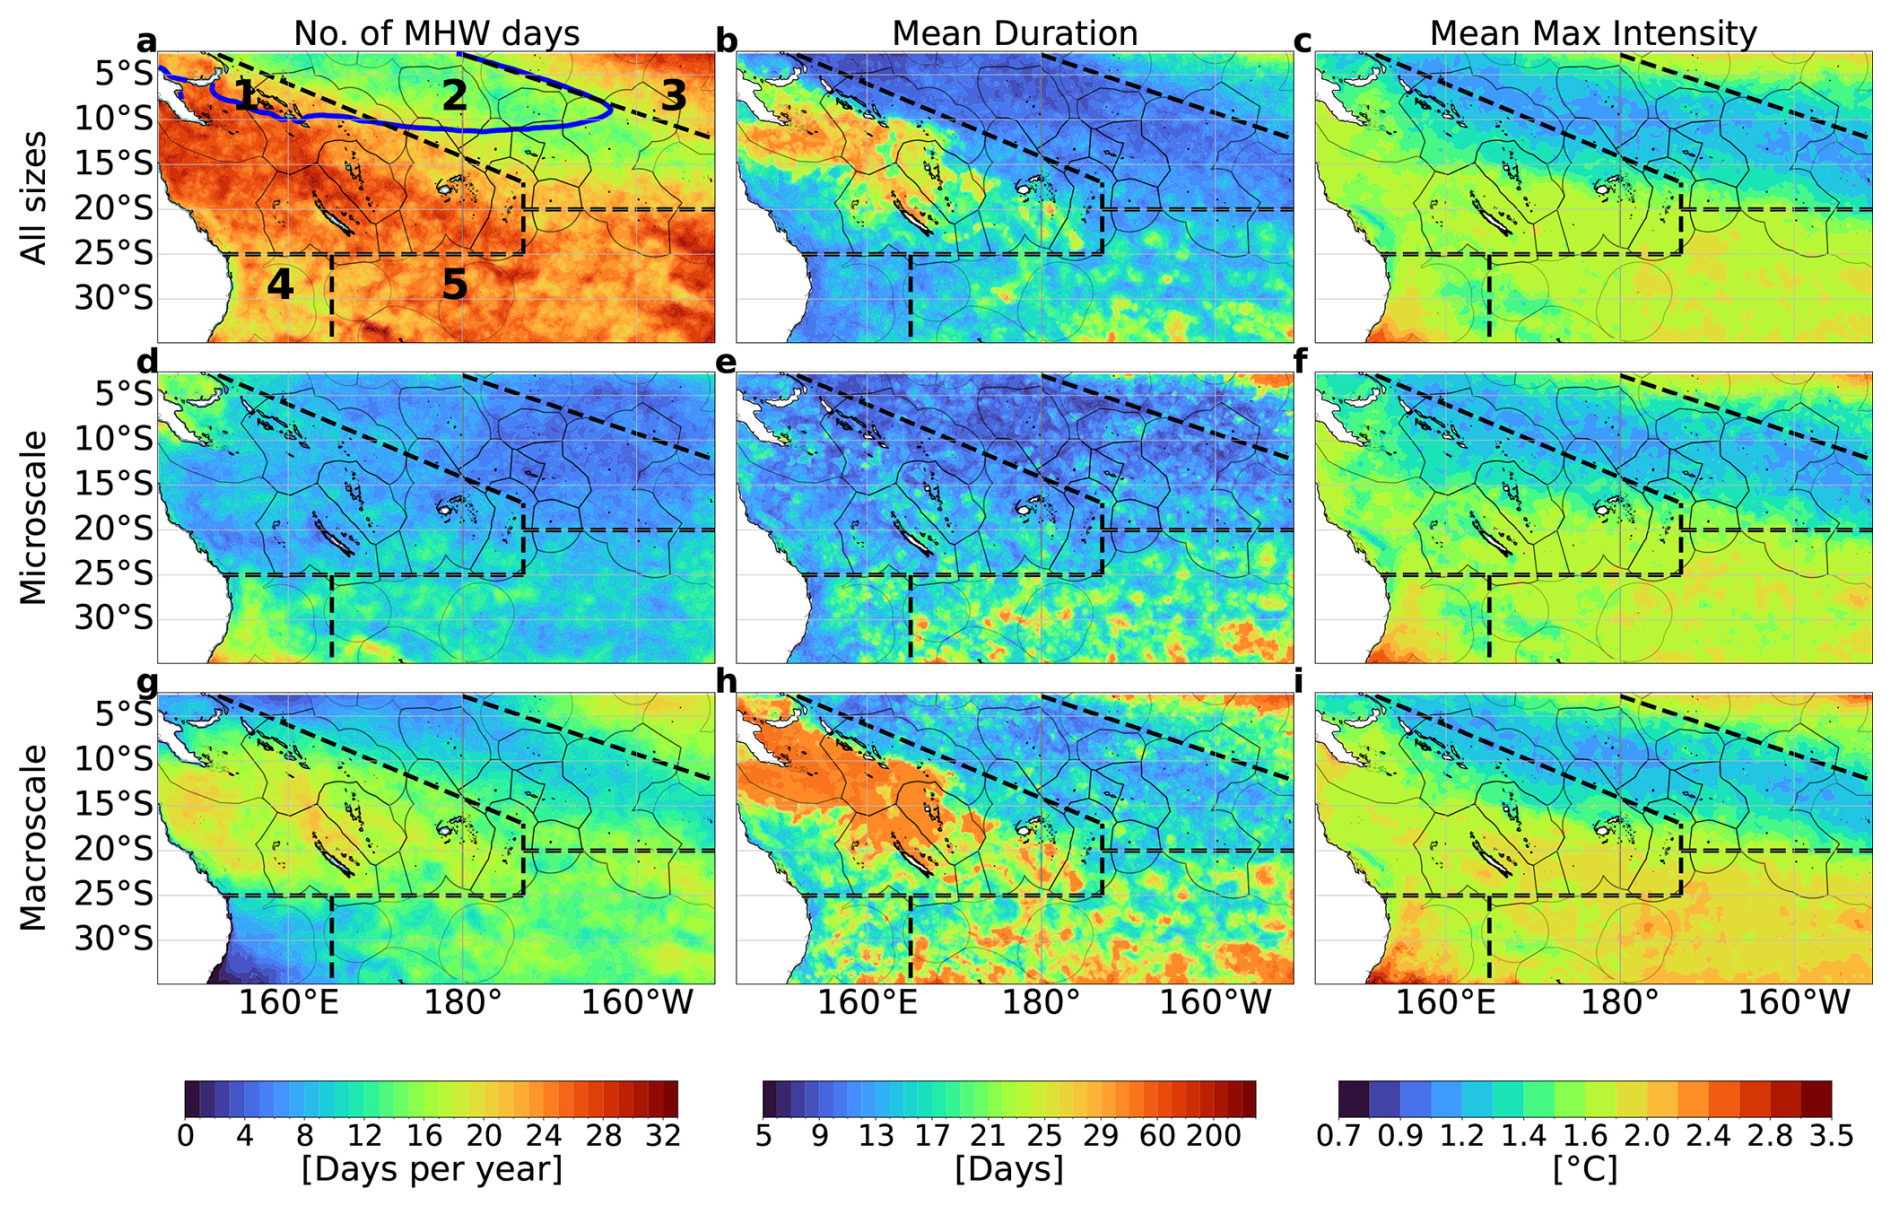
Figure 4Panel plots showing number of MHW days, mean duration and maximum intensity by spatial extent; (a–c) for all sizes (0–700 square degrees), (d–f) for microscale (sizes 0–25 square degrees), (g–i) for macroscale (sizes 25–700 square degrees) respectively. MHWs detected using NOAA-OISST from September 1981 to June 2023. Regions of special interest based on common ocean-atmospheric process demarcated with black dashed lines; (1) South-SPCZ region, (2) North-SPCZ region, (3) Equatorial central region, (4) Southeastern Australia eddy region and (5) Subtropical region. The blue line in a is the 29 °C isotherm (mean temperature) showing the mean position of the western Pacific warm pool.
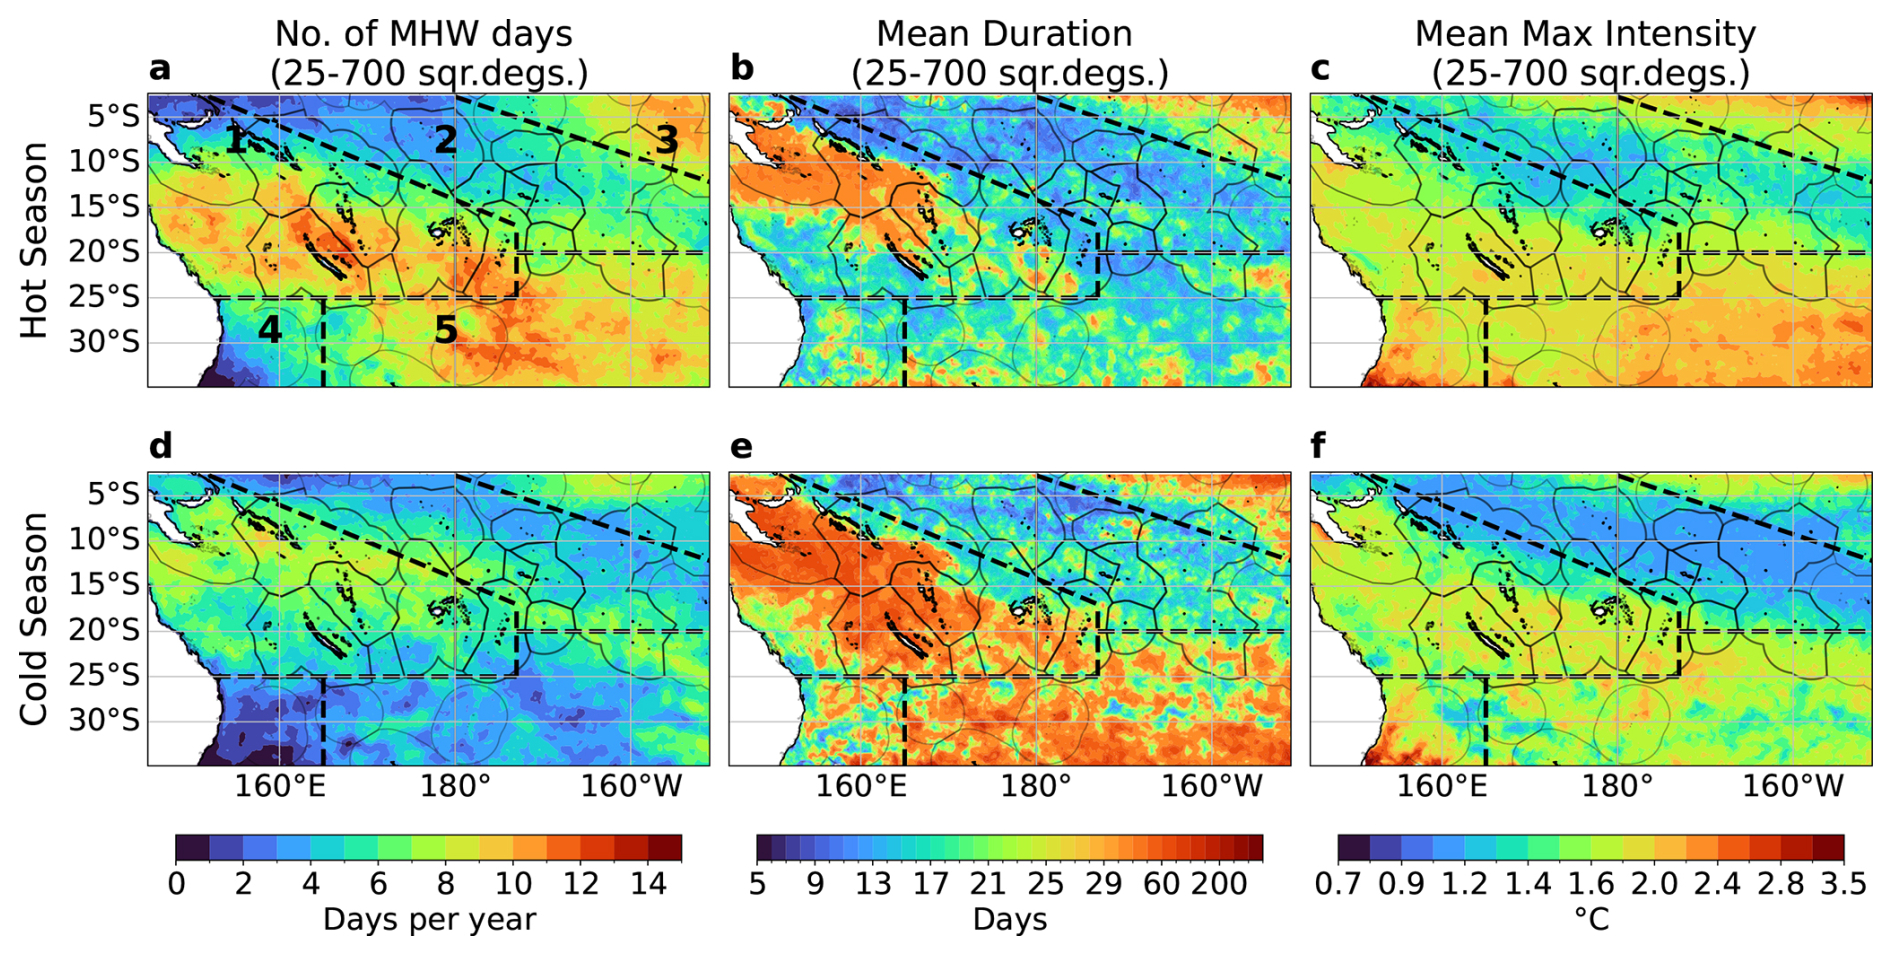
Figure 5Panel plots showing number of MHW days, mean duration and mean maximum intensity for macroscale sizes (25–700 square degrees); (a–c) in hot and (d–f) in cold season respectively. MHWs detected using NOAA-OISST from September 1981 to June 2023. Refer to Fig. 4a for regions numbered 1–5, demarcated with black dashed lines.
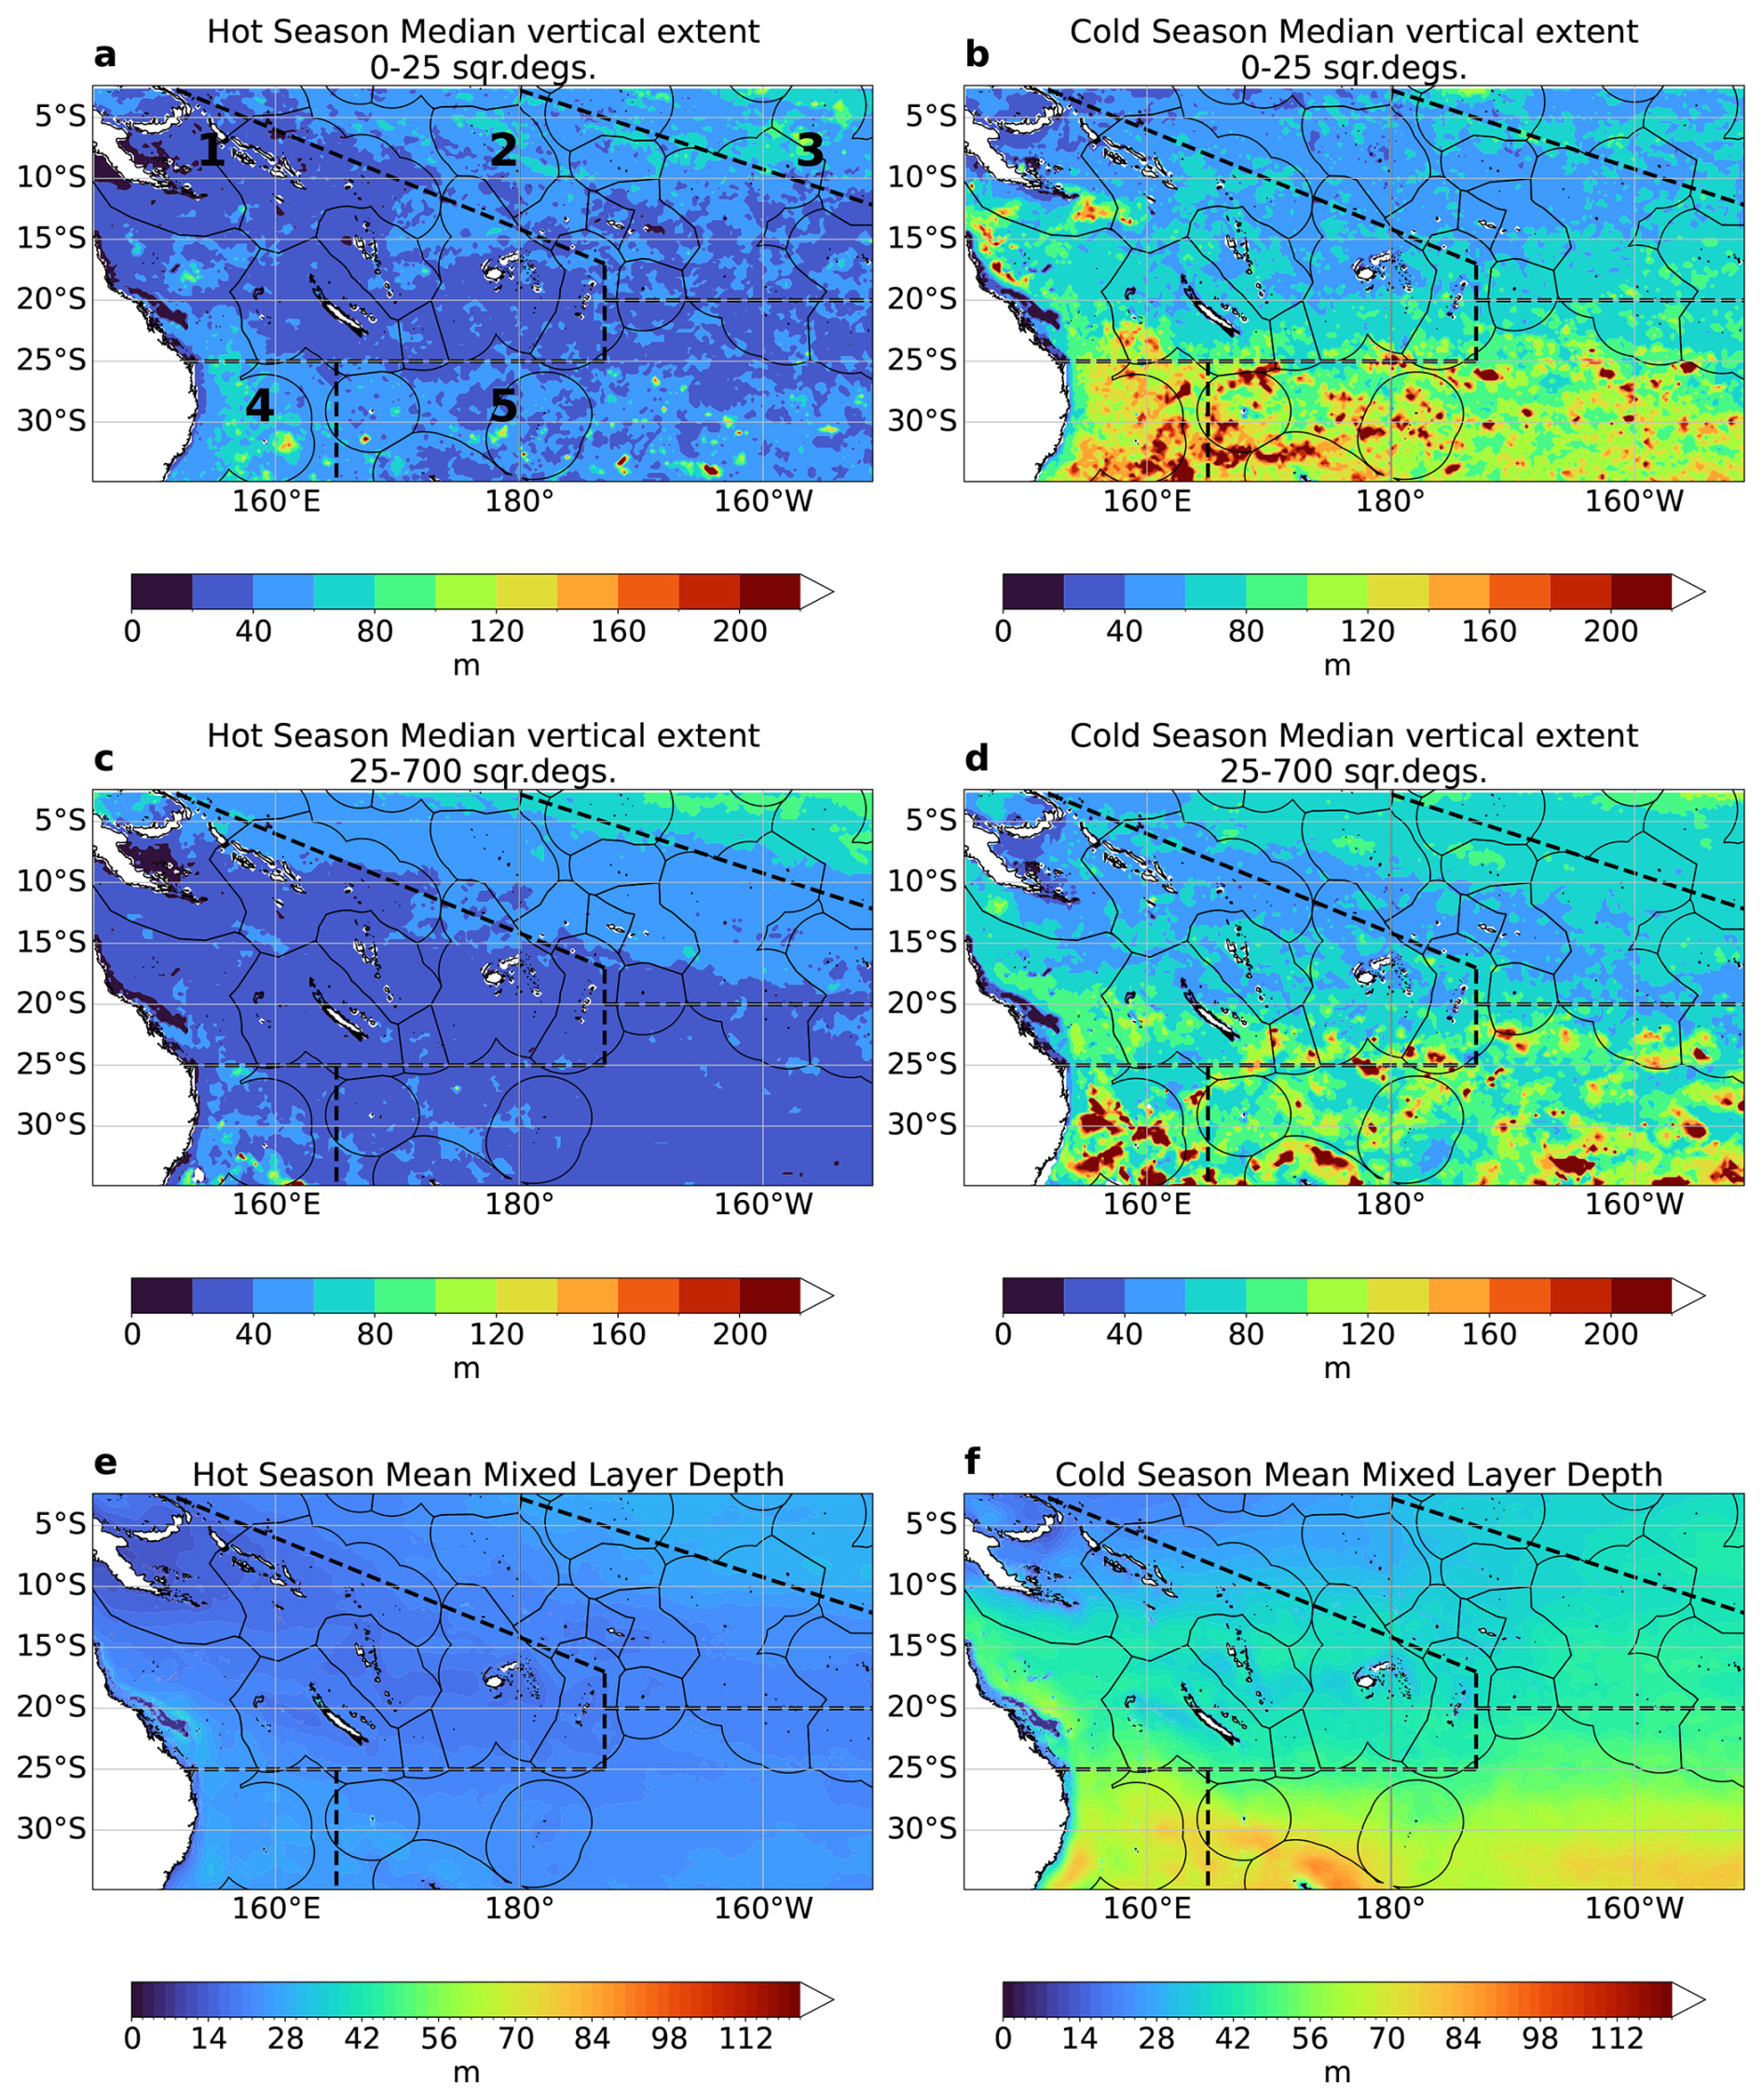
Figure 6Median vertical extent of surface MHWs by spatial extent and seasons. (a, b) Microscale events (0–25 square degrees) in hot and cold seasons respectively, (c, d) macroscale events (25–700 square degrees) in hot and cold seasons respectively. (e, f) Mean mixed layer depth in hot and cold seasons respectively from GLORYS12. MHWs detected using GLORYS12 from 1993 to 2019. Refer to Fig. 4 a for regions numbered 1–5, demarcated with black dashed lines.
Figure 5 further shows these properties for the hot and cold seasons for macroscale size MHWs. Figure 6 shows the mean vertical extent of the MHWs for both micro and macroscale MHWs for the two seasons.
Across the whole study area, there are between 10 to 30 d of MHWs per year (Fig. 4a), with contrasting properties within the domain. Subregion 2 stands out with less MHW days than the rest of the region (around 12 to 18 d yr−1), with a similar amount of microscale and macroscale MHWs all year around, i.e., in both the cold season and hot season (Fig. 5 for macroscale only, microscale not shown). There, MHWs are of short duration (typically 5 to 10 d), and of small maximum intensities (+1.4 °C). This subregion corresponds to the location of the warmest surface waters of the Warm Pool, where temperatures are greater than 29 °C in the mean (blue contour in Fig. 4a), and where the cloud cover is important. MHWs here extend from 40 to 80 m depth in the hot season, deeper than the mean mixed layer depth, and even deeper in colder months (Fig. 6).
In contrast, subregion 3 (the equatorial region east of 180° central region) is exposed to MHWs around 25 to 30 d yr−1 (Fig. 4a). There, the majority of MHWs are large-scale events (compare Fig. 4d and g) and most present during the hot months (Fig. 5). These MHWs are of longer duration (on average 40 d) and of higher intensities (approx. +2 °C) closer to the equatorial band and they extend quite deeply (down to 80 to 100 m depth, Fig. 6c and d). We isolated the long duration, large-scale MHWs in this region and found episodes in 1982–1983, 1987, 1991–1992, 1997–1998, 2009, 2010, and 2015–2016 (not shown). They are thus systematically associated with El Niño events, in accord with Sen Gupta et al. (2020), and consistent with processes associated with the eastward displacement of the Warm Pool waters and deepening of the thermocline in the region during the development of El Niño events (e.g. Picaut et al., 2001).
Subregion 1, the “South-SPCZ region” is, interestingly, the region which is more exposed to MHWs, with as much as 30 d of MHWs per year on average. This area encompasses the Solomon Sea and the Coral Sea, and extends eastward to the Fiji archipelago. Here, the MHWs are mostly of large scale (compare Fig. 4d and g, see also Fig. 3), and associated with long durations (more than 30 d on average, Fig. 4h). Their maximum intensity is slightly greater for macroscale MHWs than microscale, typically being around +1.6 to +2 °C. In the hot season, macroscale MHWs are more numerous but of shorter duration compared to the cold season. Their depth corresponds to the mean seasonal depth of the mixed layer, typically from 20 to 40 m in the hot season and from 40 to 80 m in the cold season (Fig. 6). In the cold season, macroscale MHWs are less numerous, but last longer: some can last up to one year (see Fig. 5e). They are slightly deeper, typically from 40 to 80 m, also mirroring the winter depth of the mixed layer (Fig. 6). The very long events in the cold season correspond to the recent La Niña years, as will be discussed later, and to the associated warmer anomalous SST conditions in the southwest Pacific. More studies will be required to characterise the processes driving other MHW events, but the characteristics described here argue for mixed layer dynamics and large-scale atmospheric forcing events.
Subregion 4, the “Southeastern Australia eddy region”, is characterised by 15 to 25 MHW days per year. In this eddy-rich area, associated with the retroflection of the energetic East Australian Current, MHWs events are all of small size and short duration (10 to 25 d). They have large maximum intensities, reaching above 3.5 °C south of the domain. These microscale MHWs exhibit substantial vertical extent, much deeper than the mixed layer depth, both in the hot season (100 to 150 m) and in the cold season (more than 200 m) suggesting that they are mostly associated with passing eddies (see Fig. 6) with deeper impacts in winter (Bian et al., 2023).
Finally, subregion 5, the “subtropical region”, is a mix between subregions 1 and 4 in terms of MHW properties. This area experiences between 20 and 32 d of MHWs each year (Fig. 4a), both of large and small scales. As with subregion 1, the macroscale MHWs are more prevalent in the hot season (Fig. 5a), with short durations of 10 to 20 d, but high intensities (2 to 2.5 °C), and shallow depths (20 to 40 m depth, corresponding to the mean seasonal depth of the mixed layer, see Fig. 6). Very few macroscale events occur in the cold season, but they do last longer than in summer and are on average of lower maximum intensity (+1.4 to +2 °C). It is worth noting that MHW properties are quite noisy here, with small-scale features of longer duration, higher intensities, and overall much deeper extent (Fig. 6). It is probable that these MHWs arise through several processes, with large-scale atmospheric forcing contributing to large-scale, shallow events, and mesoscale eddies contributing to smaller scale events, with much deeper extents, as also suggested by Bian et al. (2023).
Overall, seasonality appears to play a very important role in the characterisation of MHW properties in the study region. For macroscale events, MHW properties have contrasting characteristics in different seasons. This suggests that the combination of drivers of MHW events in the hot and cold seasons may actually be quite different. In general, over the study area, there is a tendency for macroscale events to be of short duration and high maximum intensity during the hot season, while the opposite is true for the cold season. While microscale MHWs tend to have higher variability in terms of vertical extent, and can extend deeper than macroscale MHWs in some locations regardless of the season (compare Fig. 6a and b to Fig. 6c and d), both microscale MHWs and macroscale MHWs are much shallower in the hot season and extend much deeper in the cold season. This is likely due to shoaling of the mixed layer depth (MLD) during the hot season (median MLD ∼ 14–28 m, Fig. 6e), restricting surface related MHWs within the shallower mixed layer, and due to deeper MLD in the cold season (median MLD ∼ 14–90 m, Fig. 6f) allowing greater mixing and MHWs to be detected without interruption over greater depths.
3.3 Long term trends
The previous figures showed the mean MHW properties over the 1981–2023 period. A key question now is whether, if, and how, these properties have changed over time. This was investigated in H22. They found that, except for the central equatorial subregion 3, there has been an increase in the number of events per year, but with no strong nor consistent trend in maximum intensity or duration.
Figure 7 shows trends in annual number of MHW days, annual mean duration, annual mean maximum intensity, computed from the full SST data (left panels), as well as from detrended SST data (right panels). Hatched areas indicating significant (p value < 0.05) trends. More specifically, in subregions 1, 2 and 5, the number of MHWs per year significantly increased over time when the trend is computed with the full SST data in the original version and decreased significantly between subregions 1 and 2 in the detrended version. As the 12 countries studied in detail are located in these three regions, all countries also have experienced significant positive trends in the annual number of MHW days in the past decades (Fig. 7a). Region 1 experiences between 12 to 24 MHW days per year on average (Fig. 4g); this number was multiplied up to four times during the last 4 decades around the Solomon Islands, New Caledonia and Vanuatu (Fig. 7a). The same is true for the trend in MHW duration, with MHW events becoming longer over the past decades (Fig. 7c). Average MHW duration is between 5–30 d over most of the countries (Fig. 4). The mean duration has also largely increased, since 1982, especially in subregion 1, in the Solomon Sea. On the contrary, and consistent with H22 findings, there is no strong and significant trend in MHW maximum intensity (Fig. 7e). The only significant pattern is a decreased maximum intensity in the Warm Pool area (subregion 2), where the maximum intensity was already the smallest in the whole region. No significant trends were observed over most parts of the study region in terms of the vertical extent (figure not shown).
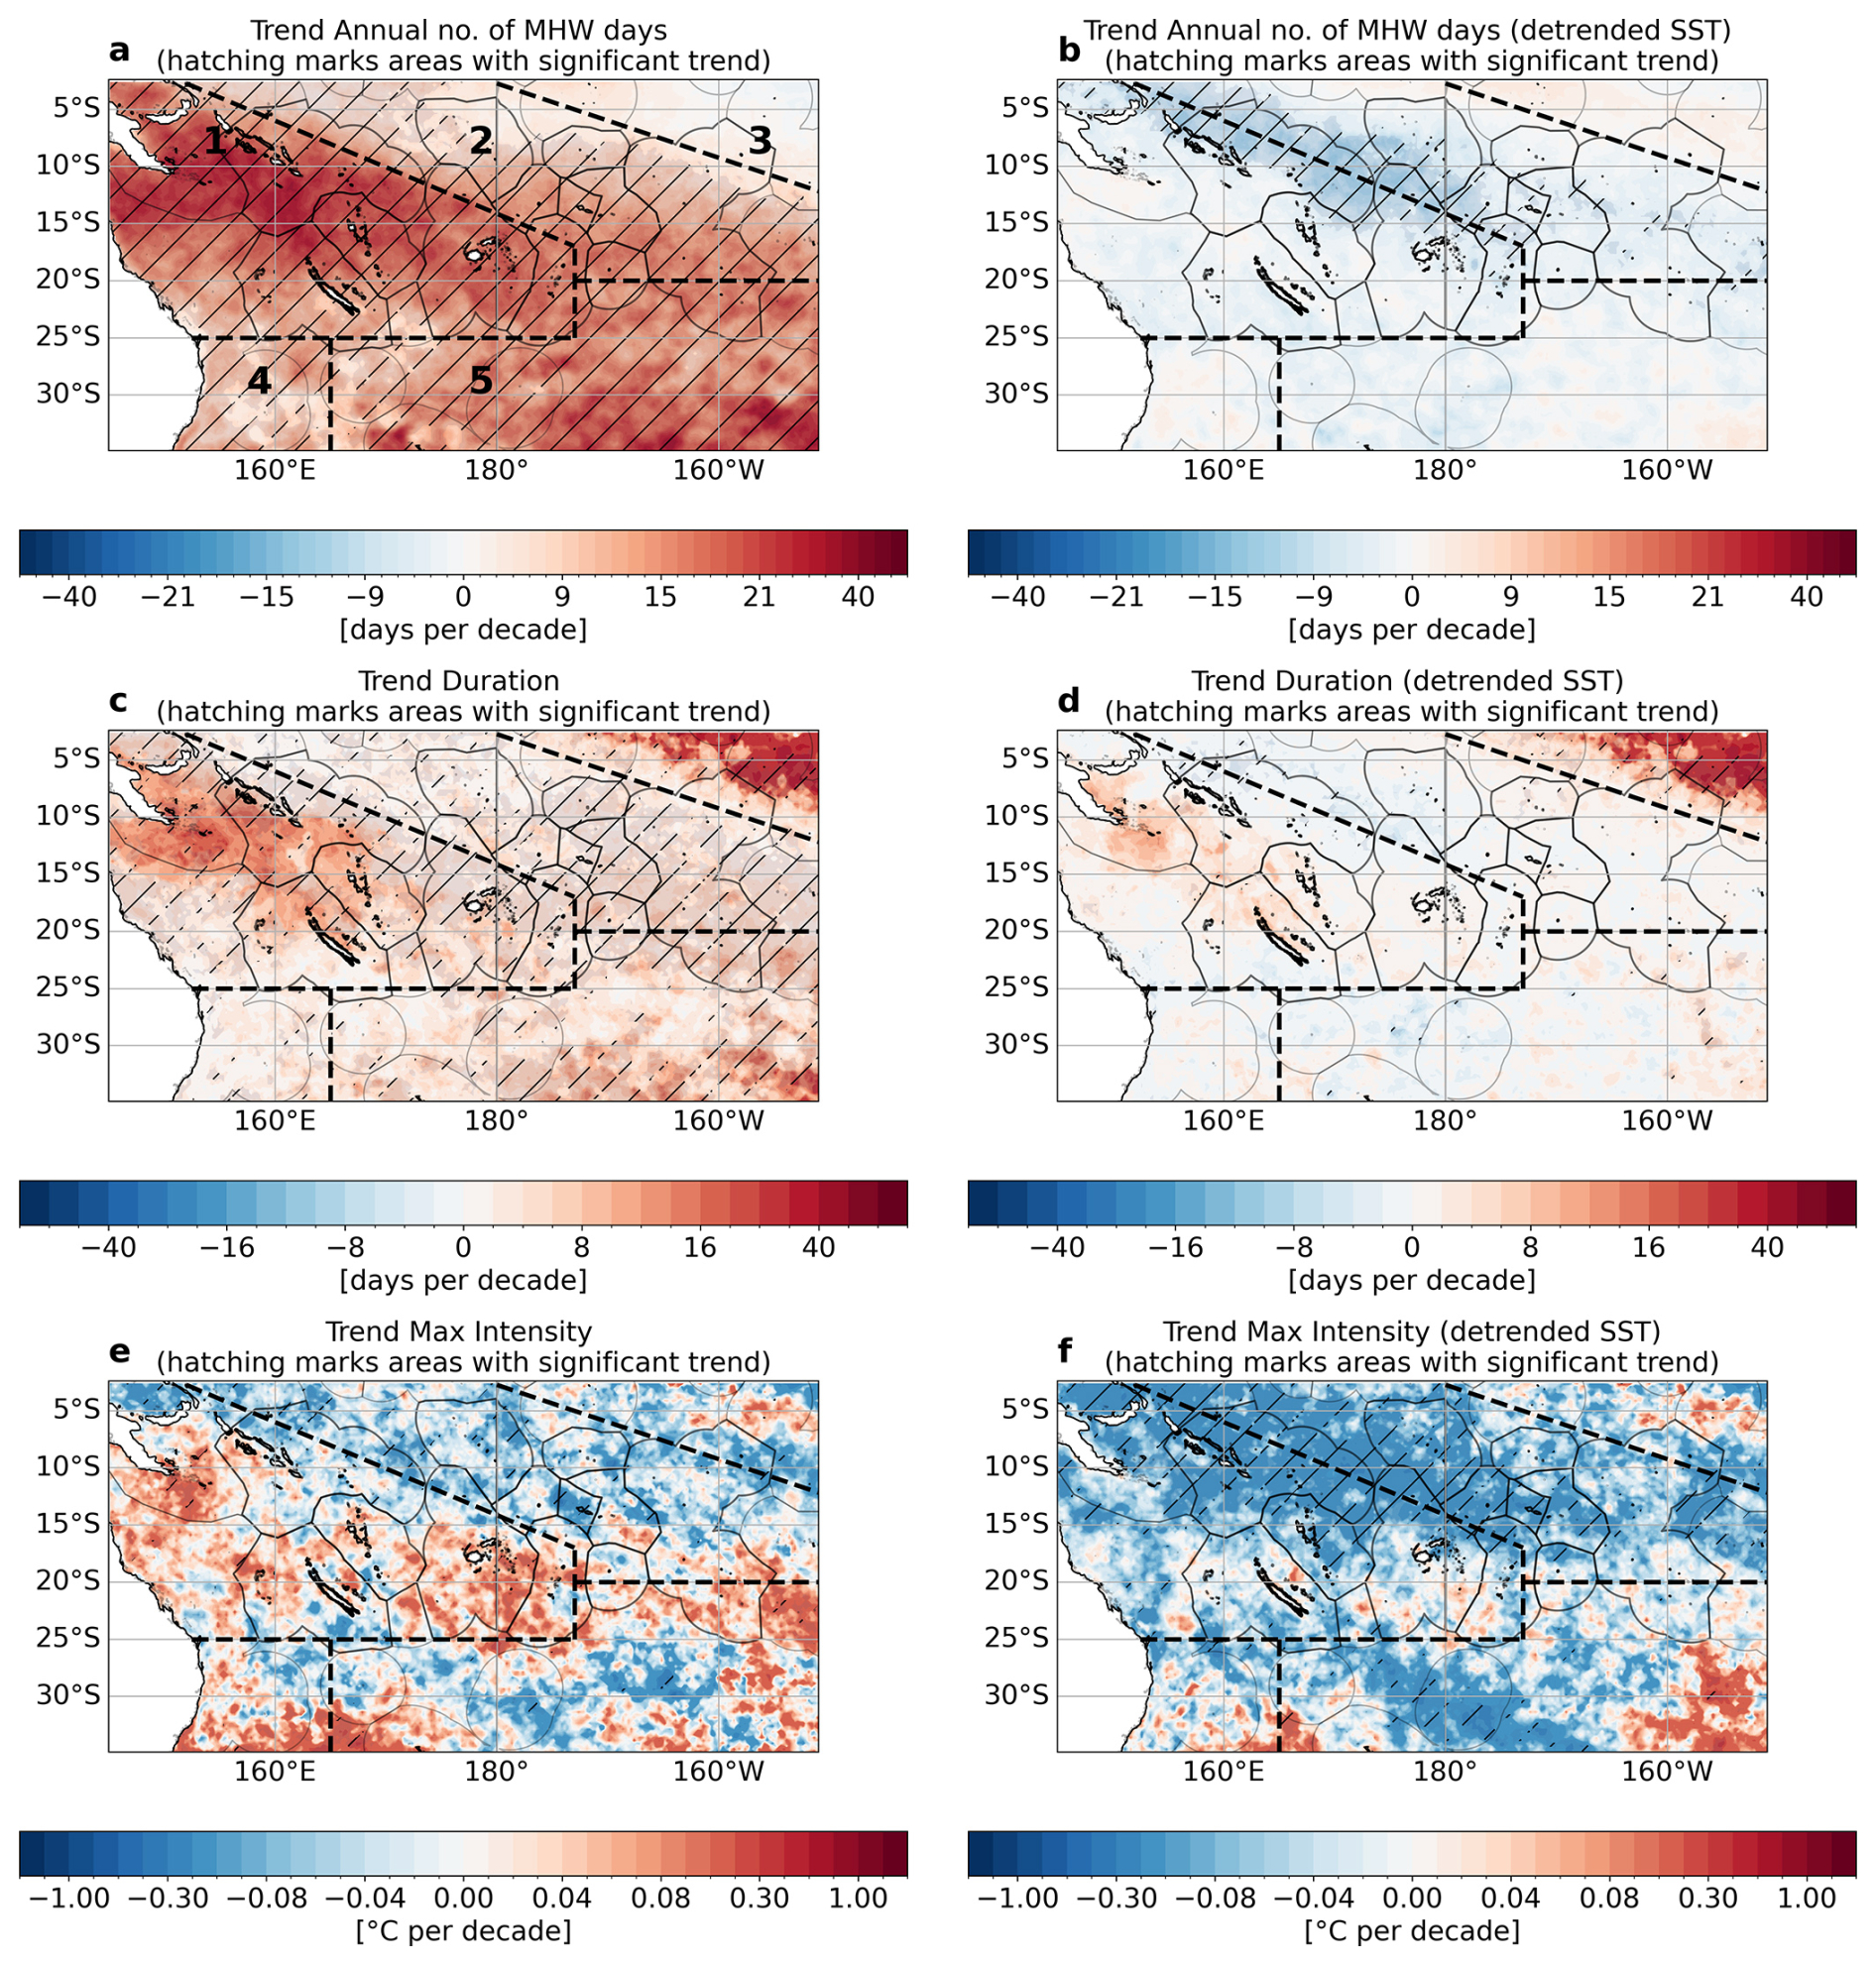
Figure 7Panels showing trends in MHW properties. MHW detection using full SST time series (a, c, e) and MHW detection using detrended SST time series (b, d, f). (a, b) Annual number of MHW days, (c, d) duration, (e, f) maximum intensity. MHWs detected using NOAA-OISST from 1982 to 2022. The regions demarcated in black are, (1) South-SPCZ region, (2) North-SPCZ region, (3) Equatorial central region, (4) Southeastern Australia eddy region and (5) Subtropical region. The data in the maps refer to average changes in these metrics per decade over the 40 years.
We also present trends on the MHW properties for MHWs detected on the detrended SST. This allows us to investigate if the trends observed are explained by the long warming trend only. The results obtained show that the increase in the number of MHW days during the last decades is clearly due to the long-term warming (compare Fig. 7a to Fig. 7b). A large part of the increase in MHW duration in subregion 1 seen in Fig. 7c is also reduced or even disappears on the detrended version (Fig. 7d). Also, on the detrended version, we now have a decrease in maximum intensity over the last decades in many areas, whereas there is no significant trend on the initial version (compare Fig. 7e to Fig. 7f). The trends in MHWs metrics are thus largely explained by the long-term warming trend.
Finally, Fig. 8 shows the daily time series of the percentage of surface area of the study region in a MHW state, for both GLORYS12 and NOAA-OISST. A significant trend of ∼3.5 % (∼70 square degrees) increase per decade is observed (Fig. 8a). Over the past decade, there has not been a single day when at least part of the region was not exposed to MHWs. Results obtained from the SST detrended version (Fig. 8b) indicates that the trend in spatial extent observed in Fig. 8a is also due to the long-term ocean warming.
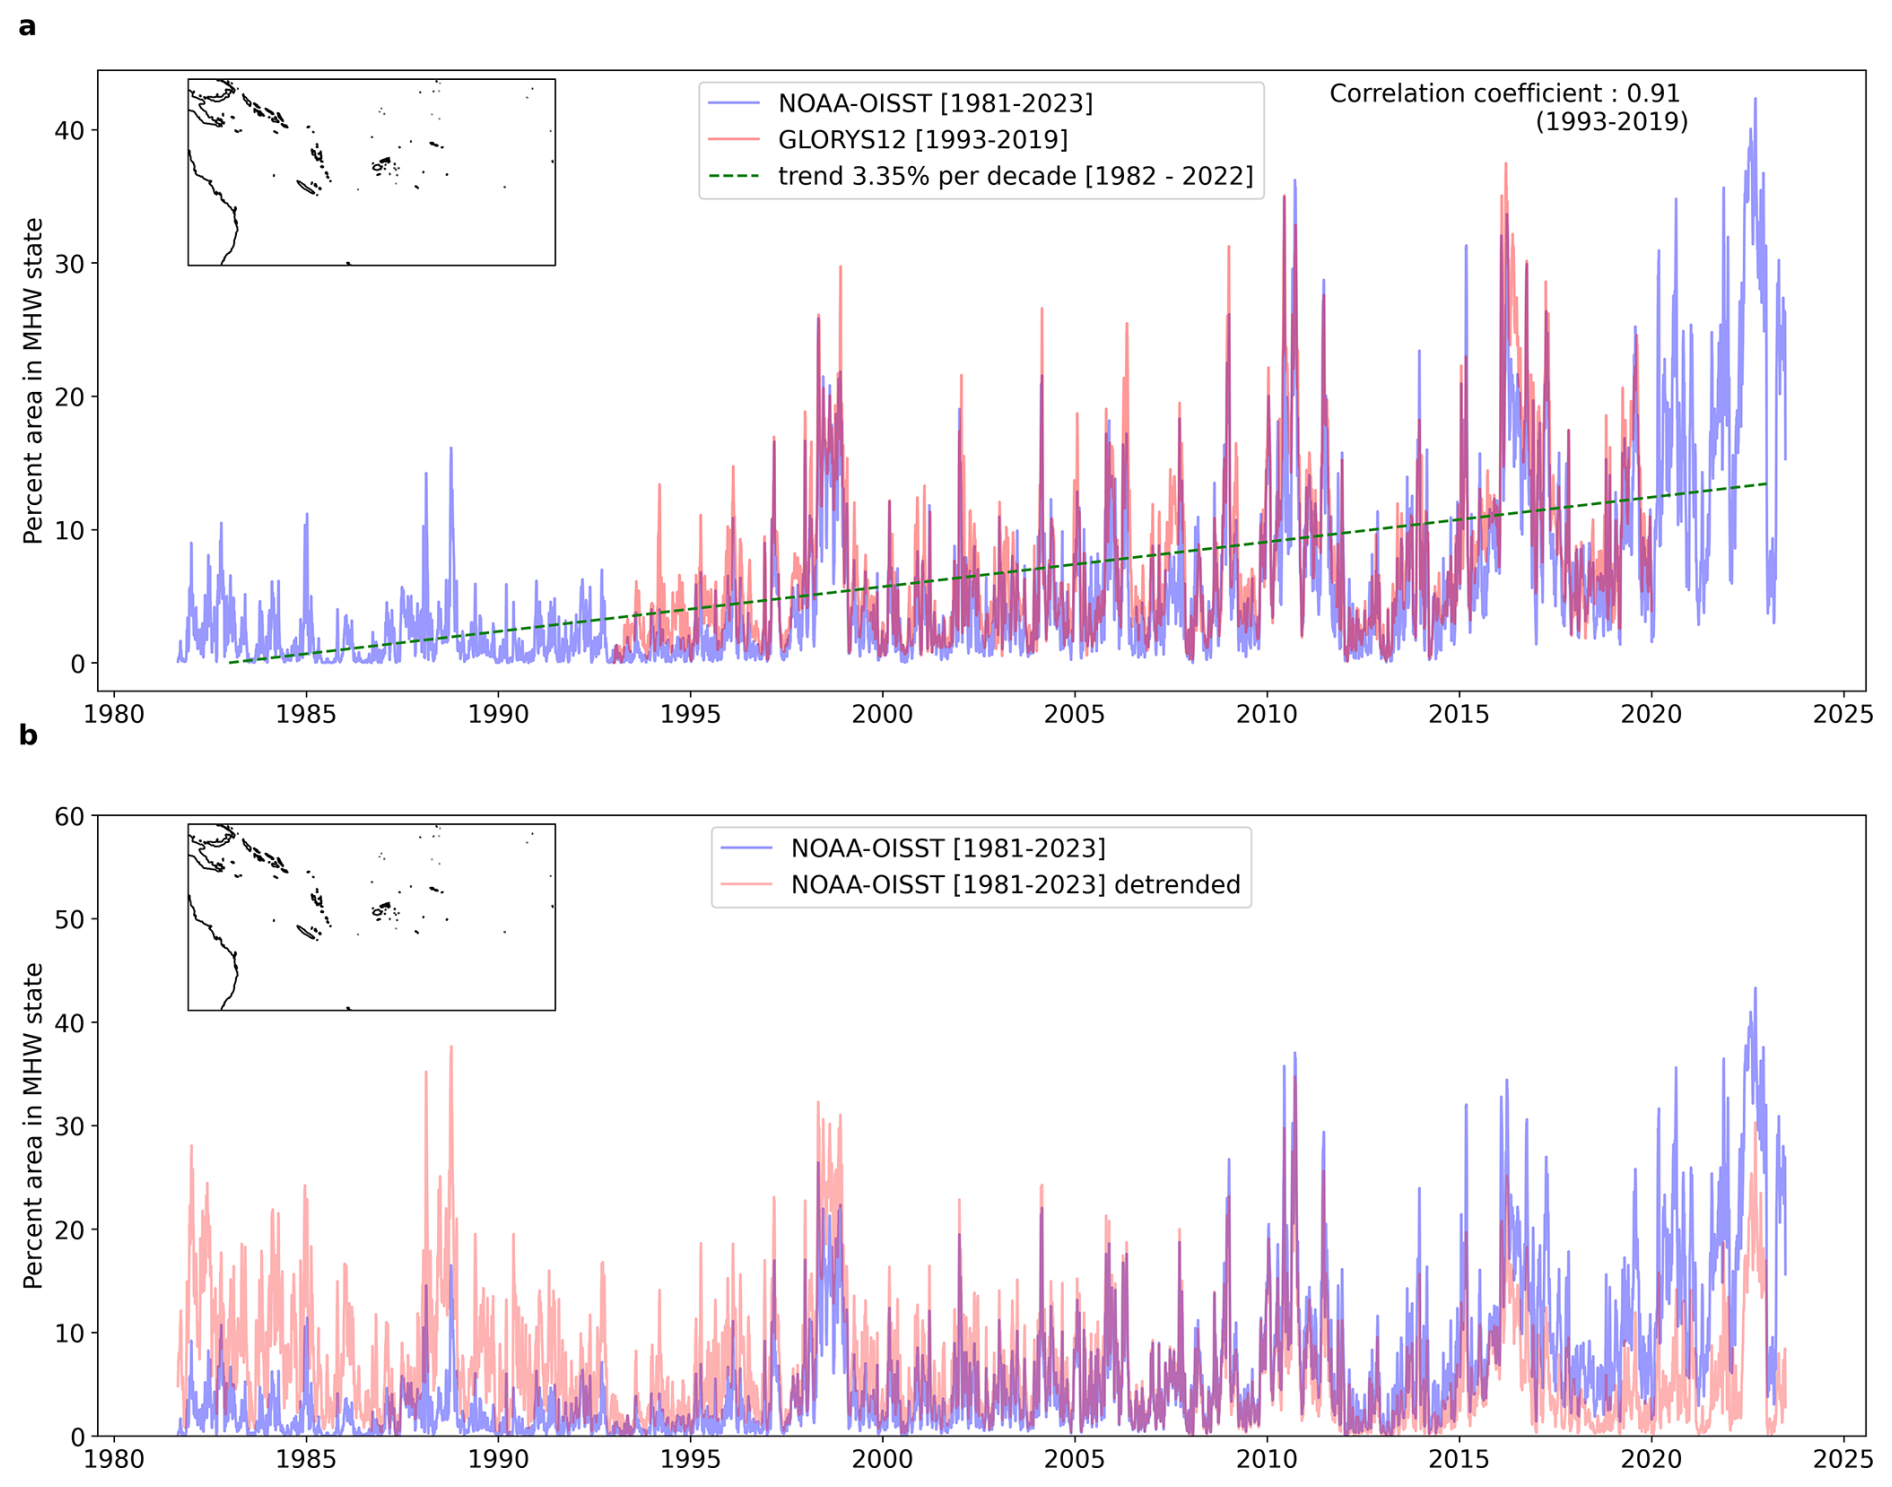
Figure 8(a) Time series showing percent of study region in MHW state, with a statistically significant trend line (p value < 0.05) in green calculated between 1982 to 2022 for NOAA-OISST and Pearson correlation coefficient calculated between 1993 and 2019 for NOAA-OISST (blue line) and GLORYS12 (red line) (p value < 0.05). (b) Time series of percent of study region in MHW state using the NOAA-OISST (blue line) and the detrended NOAA-OISST (red line) from 1982 to 2022.
4.1 Macroscale MHWs: statistics for each country
Section 3 discussed MHW properties at the regional scale. To provide more usable information for PICTs, we now investigate statistics of past macroscale MHWs that affected each EEZ separately. Figure 9 shows the mean and standard deviation of the mean duration and mean maximum intensity in the 12 PICTs studied. PICTs in the western and south-central part of the study region: Solomon Islands, New Caledonia, Vanuatu, Fiji and Tonga appear to be more exposed to MHWs of higher duration (Fig. 9a) but with a large variability in MHW duration (Fig. 9b). These PICTs are also exposed to higher maximum intensity events (Fig. 9c) with a higher standard deviation (Fig. 9d) compared to other PICTs (Fig. 9), suggesting that the types of MHWs to which they are exposed are more diverse in terms of features and possible drivers. Figure 10 illustrates the seasonal distribution of macroscale MHW properties (i.e. MHW duration, maximum intensity, onset rate, decline rate and vertical extent) inside the EEZs of each of the 12 PICTs. These properties have been chosen for their relevance for marine ecosystem management and to help guide adaptation planning across the Pacific region. Maximum intensity and onset and decline rates (two MHW metrics describing how quickly a MHW develops or dissipates) are of particular interest (Jessica Randall, personal communication, 2024) as these parameters allow managers to gauge the amount of time they would need to better prepare for MHWs, and the potential severity of their impacts (Spillman et al., 2021; Jessica Randall, personal communication, 2024).
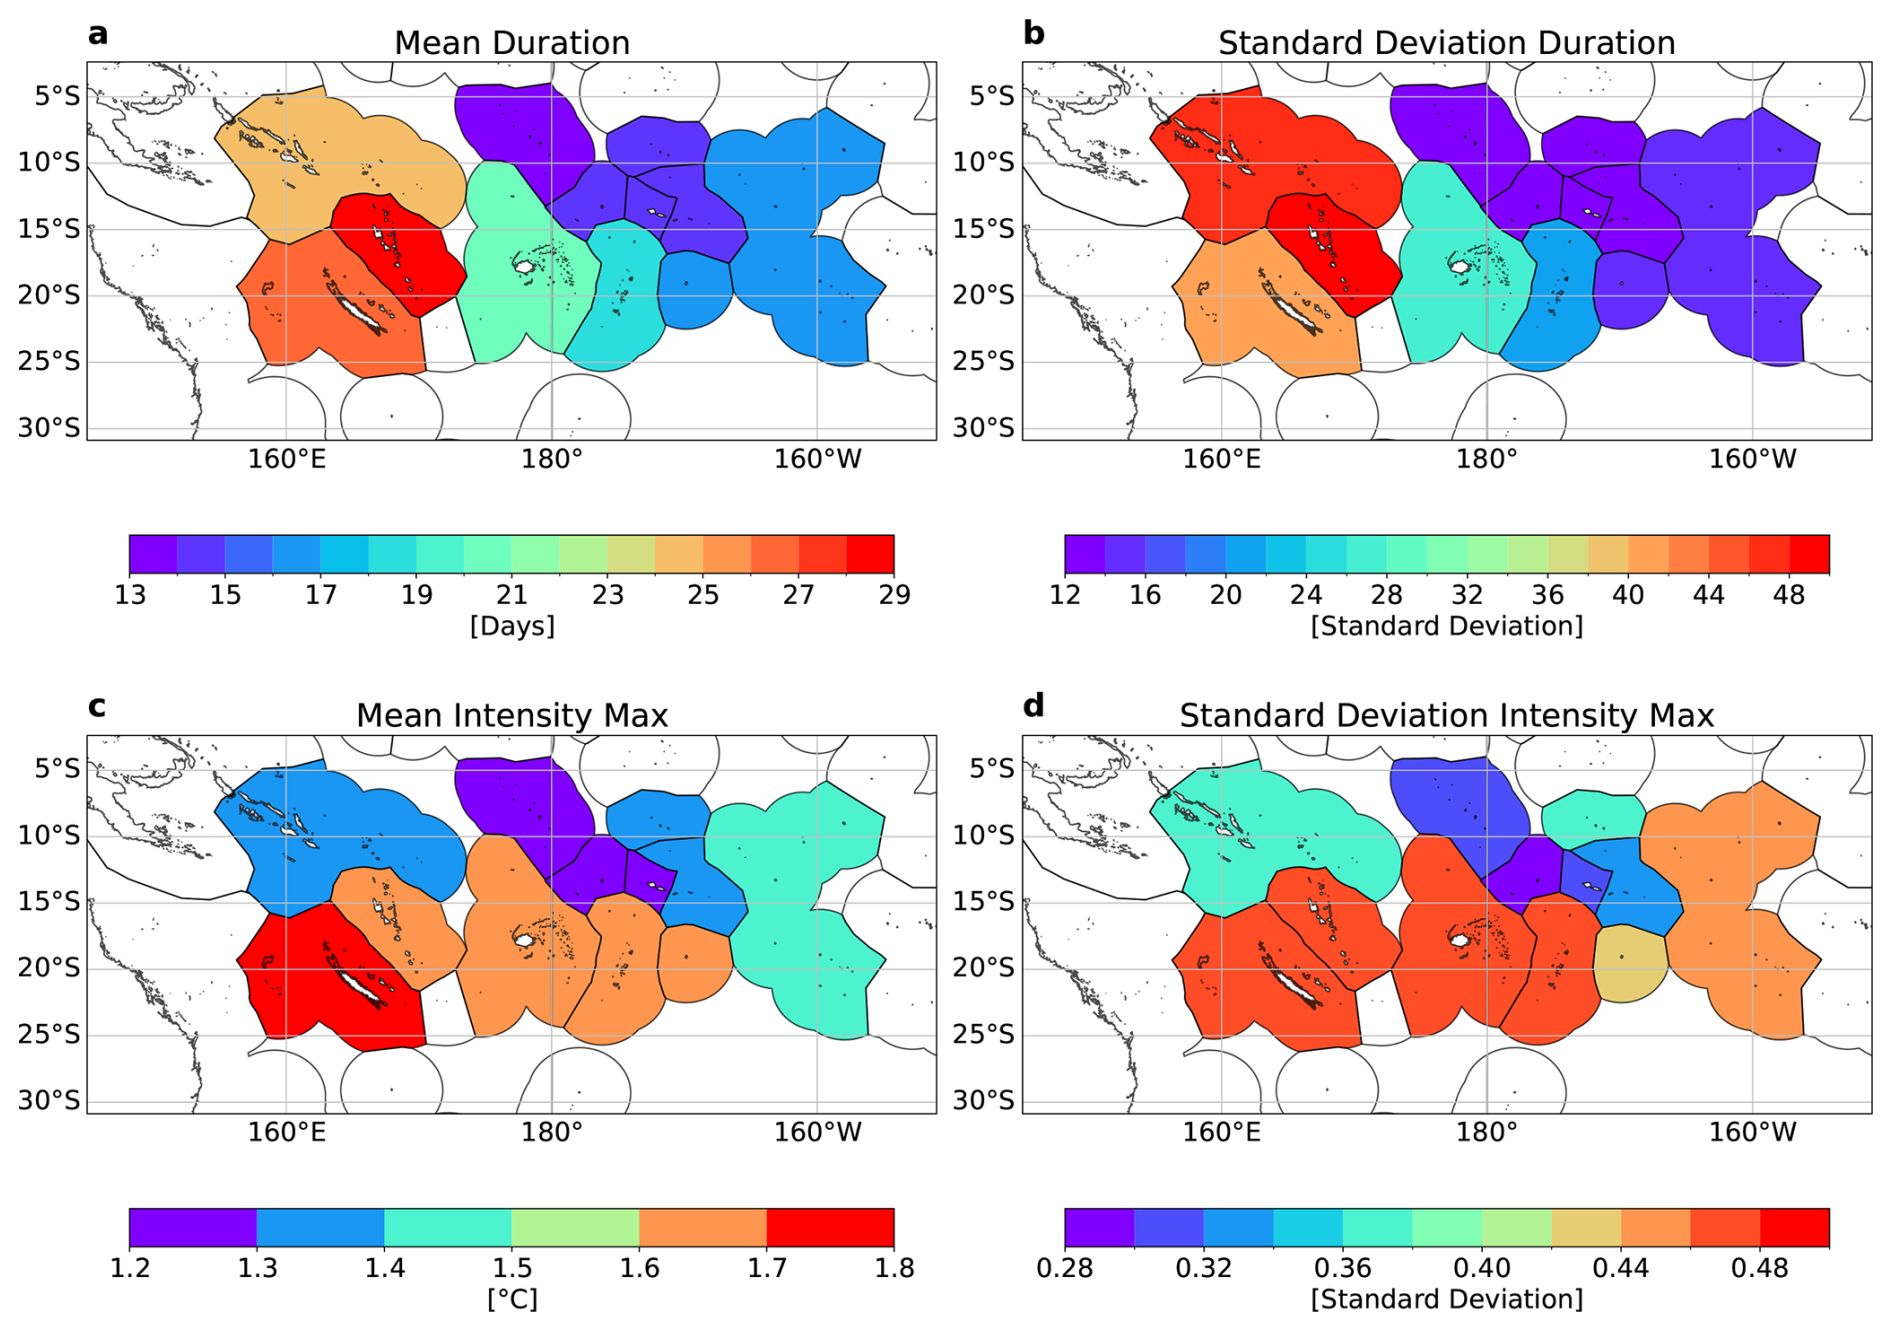
Figure 9Mean and standard deviation of MHW duration (a, b) and mean maximum intensity (c, d) spatially averaged inside each EEZ from macroscale MHWs. MHWs detected using NOAA-OISST from September 1981 to June 2023.
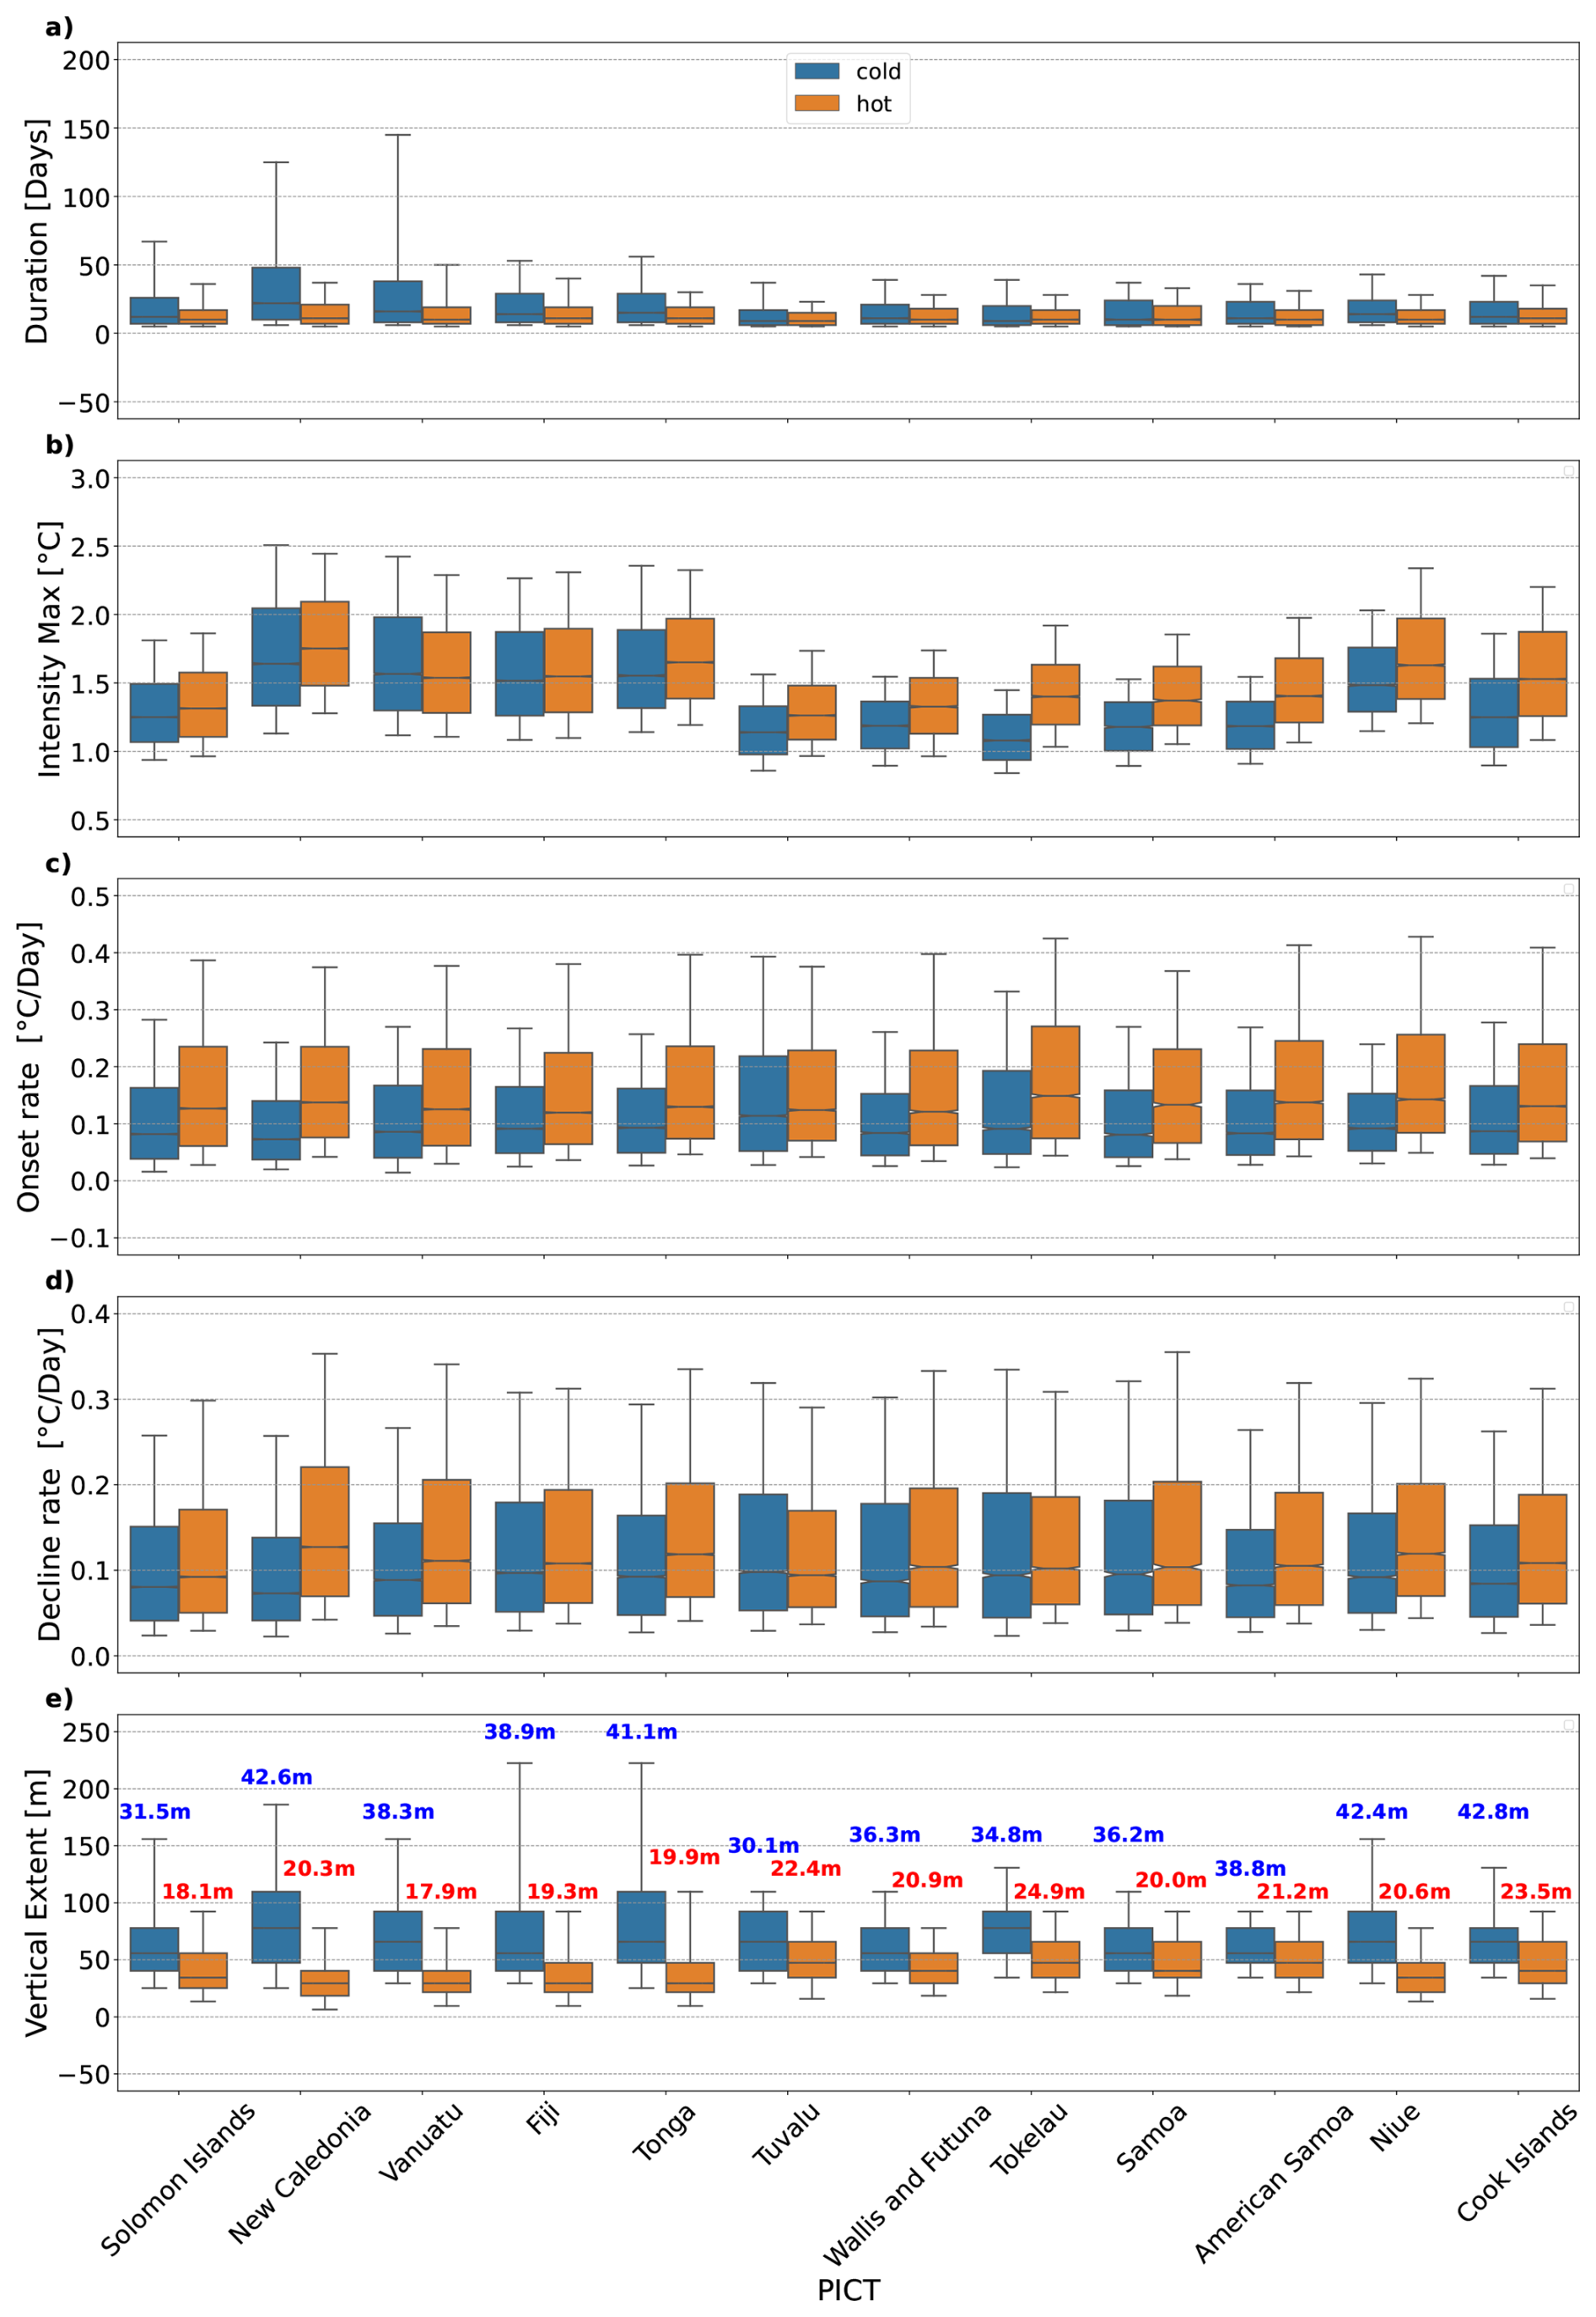
Figure 10Box whisker plots showing MHW properties for macroscale MHWs by Pacific Island Country and Territory (PICT) and seasons, (a) duration, (b) maximum intensity, (c) onset rate, (d) decline rate and (e) vertical extent. The red and blue texts in (e) are the mean mixed layer depth (MLD) in hot and cold season respectively. Lower edge of whisker marks 10th percentile, lower edge of box marks 25th percentile, the line in the middle marks the median, the upper edge of the box marks 75th percentile and the upper edge of the whisker marks 90th percentile. MHWs detected using NOAA-OISST from September 1981 to June 2023. MHW vertical extents and mean MLD obtained from GLORYS12 for period 1993 to 2019.
Figure 10 confirms, at EEZ scales, and similar to the results presented in Sect. 3, that in the hot season, most of the macroscale events in all countries are of short duration. Half of the MHW events lasted <10 d, 75 % of the events were <20 d (Fig. 10a), and for most of the PICTs, 90 % of the MHWs lasted <30 d. However, there is some variability among the PICTs; 90 % of the MHWs events affecting Tuvalu were <20 d, whereas 10 % of the events affecting Vanuatu were >50 d (Fig. 10a). In the cold season, the MHW duration is more variable, and events can last much longer. This is especially true for PICTs within subregion 1 (New Caledonia, and Vanuatu) which experienced 25 % of events > 40 d and 10 % of the events lasting up to 4 to 5 months (Fig. 10a). New Caledonia and Vanuatu also experienced the highest maximum intensities compared to other PICTs, followed by Tonga and Fiji.
For PICTs located in the eastern part of the region, the median maximum intensities are between 0.25 to 0.5 °C higher in the hot season than in the cold season, for example in American Samoa, Cook Islands, Niue, Samoa, Tokelau and Tuvalu (Fig. 10b). For PICTs located in the western side of the study region (Fiji, New Caledonia, Solomon Islands, Tonga and Vanuatu), the maximum intensities are similar in hot and cold seasons (Fig. 10b). As shown also in Sect. 3, for all PICTs, MHWs are much deeper in winter than in the hot season, with 10 % of the MHW events reaching depths more than >200 m around Fiji and Tonga.
Finally, the onset and decline rates are also shown. The faster the onset rate is, the quicker the MHW emerges, and the shorter the reaction window for management responses is. The slower the decline rate is, the longer it takes for the MHW to dissipate, and the slower heat is removed. Clearly, the onset rate is higher during the hot season and lower in the cold season for all PICTs (Fig. 10c and d). The median value is around 1.14 °C d−1, and 25 % of all onset rates are °C d−1 (Fig. 10c), which is consistent with the results of Spillman et al. (2021), but in the medium to high range compared to other regions (compare the values shown here with Fig. 3 from Spillman et al., 2021). This is true for all PICTs, especially for Niue and Tokelau. In these PICTs, where MHWs are typically of short duration (Fig. 4a), summer MHWs develop quickly, and marine managers have little time to react. This also indicates rapid warming of the upper, shallow mixed layer (see Fig. 6e and f).
The pattern in the decline rate is similar to the onset rate. For all PICTs except Tuvalu, the decline rate is larger in the hot season than in the cold season. This means that MHWs also dissipate more quickly in the hot season.
We have also found that Fiji, New Caledonia, Vanuatu and Tonga experience higher maximum intensity events compared to other countries in the study region and longer lasting events, especially in the cold season, with deeper vertical extent. In the hot season, all countries experience MHWs of similar duration (less than 25 d). These are short duration events but of maximum intensity comparable or slightly higher than cold season (central and eastern Pacific countries). The results suggest that these cold-season, long-duration, high-intensity events may or may not translate into ecological disturbances in the Solomon Islands, Fiji, New Caledonia, Vanuatu, and Tonga, and therefore warrant continued monitoring.
Figure 11 also shows the time series of the percentage fraction of EEZ in a MHW state, for two examples, New Caledonia and Fiji. This figure allows the identification of the main events that have impacted a large portion of the territory of each PICT, in both seasons. Some events – for example between 1997–1999, 2010/2011, 2015/2016, 2020, and 2022, – covered more than 80 % of the New Caledonia EEZ (Fig. 11a). In the hot season, the largest events occurred in 1993, 2002, 2004, 2009, 2015, 2016 and 2022. These events, however, were short lived. In Fiji, the events of 2010, hot season events from 2014 to 2017, and the events of 2022, were most striking (Fig. 11c).
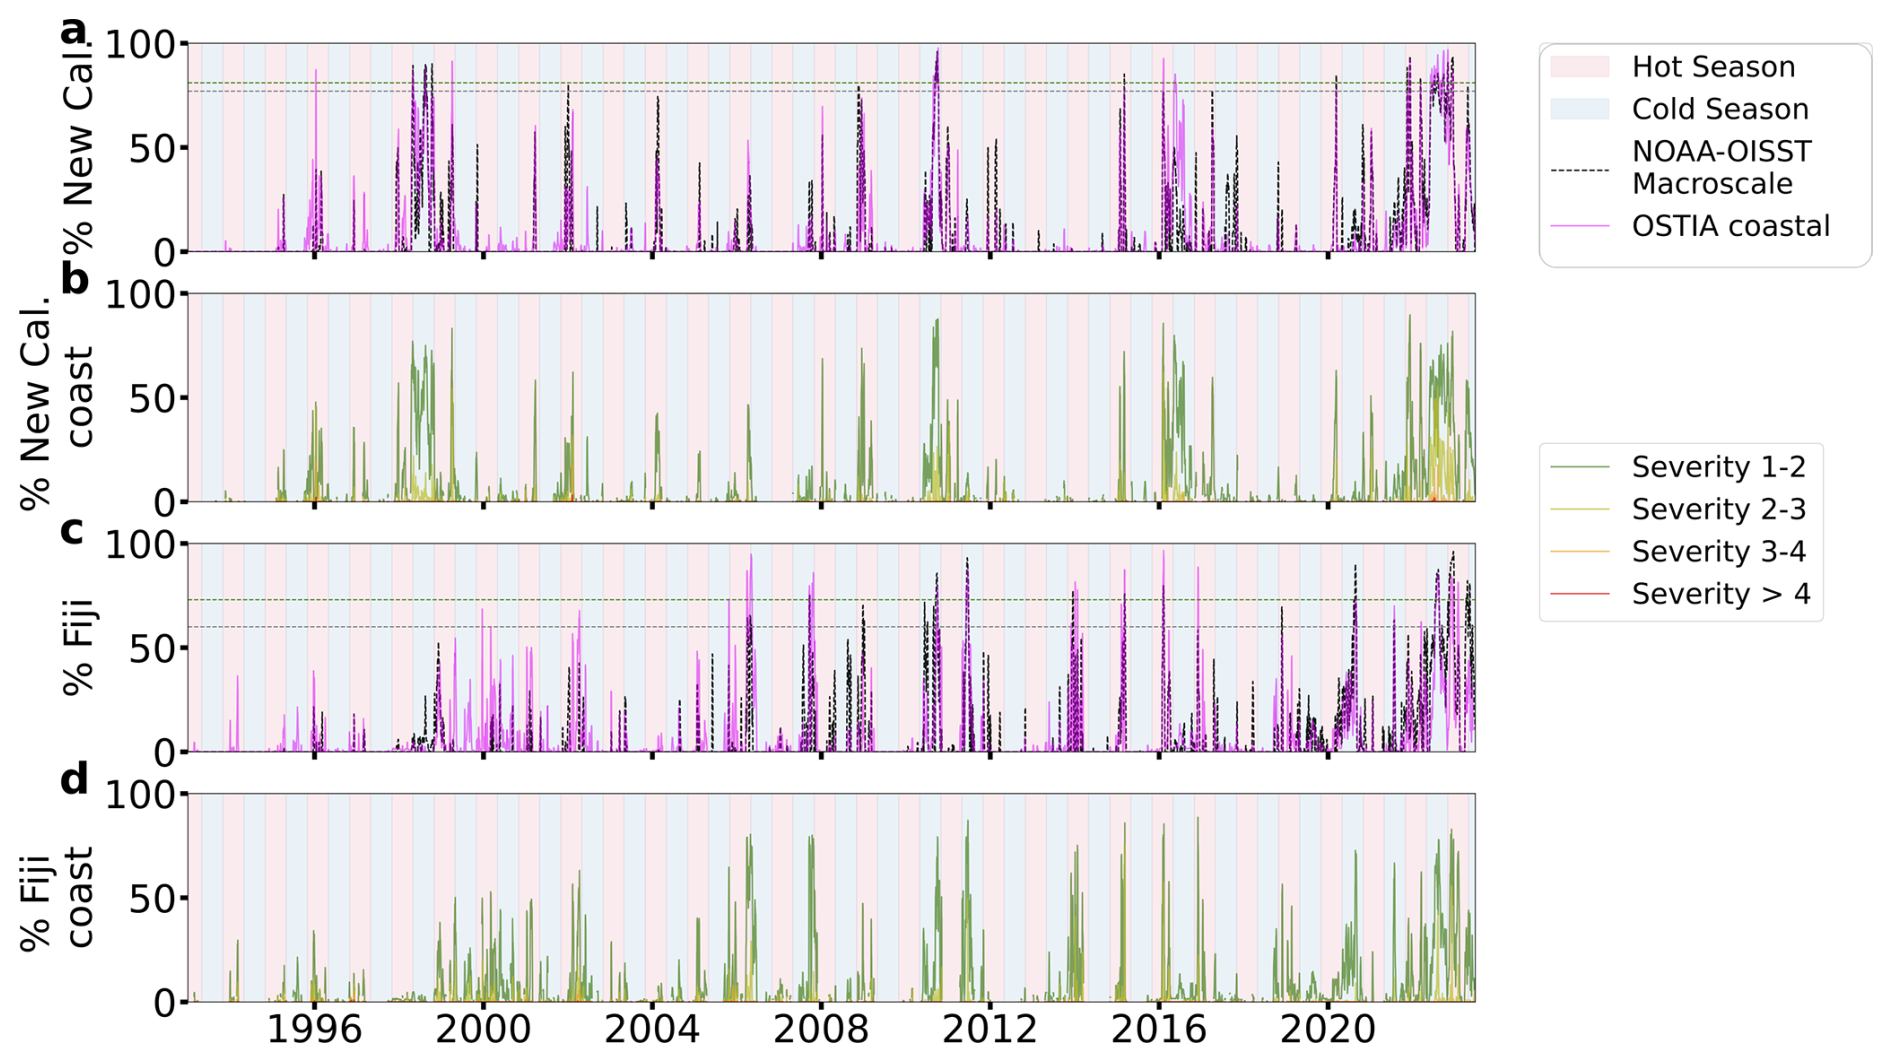
Figure 11(a, c) Time series of % EEZ (in black dashed line) and % coastline (in magenta dashed line) in MHW state for New Caledonia and Fiji respectively. The horizontal green and grey dashed lines mark the 95 percentile of % EEZ covered by macroscale MHWs and the 95 percentile of the % coastline in MHW state, respectively. (b, d) Time series of % coastline with 4 levels of severity for New Caledonia and Fiji respectively. Green line for severity 1 to 2, yellow for severity 2 to 3, orange for severity 3 to 4 and red for severity greater than 4. Coastal MHW and severity detected using OSTIA from 1993 to 2023, macroscale MHWs detected using NOAA-OISST from 1993 to 2023. In all panels (a–d), the alternating pink and blue background colours represent the hot and cold season respectively.
4.2 Coastal events: spatial structures
We now investigate past MHW events around each country close to the coast, to provide answers to the following questions: (1) are open ocean events observed at the coastal level too? (2) Which coastal areas have been more impacted in the last decades? (3) Are there any refugia areas, less impacted by MHWs? (4) Are coastal MHWs longer now or of stronger maximum intensity compared with the past, and if so, where?
To answer questions (2) and (3), Figs. 12 and 13 show MHW properties around the coast of New Caledonia and the Fijian archipelago, as examples, for both the cold and hot seasons using the OSTIA product, which better resolves at the coastal scale. The same plots showing MHW properties at the coast, but using GLORYS12, are also shown to estimate the robustness of the signals, and evaluate the ability of the GLORYS12 reanalysis to detect MHWs near the coast. The Fiji and New Caledonia coastlines are used here as examples because they provide interesting insights into the nature of MHWs along large coastline oceanic islands. Their long coastlines offer diverse interactions between MHWs and local oceanographic conditions allowing us to gain further insights into the nature of coastal MHW events. Coastal MHWs for Solomon Islands, Vanuatu and Tonga are shown in Figs. S1–S3 in the Supplement. As shown in Sect. 3, the small-scale MHWs events detected can be quite different depending on the product, especially in the cold season. Here, only the robust patterns shown in both products (OSTIA and GLORYS12) will be discussed.
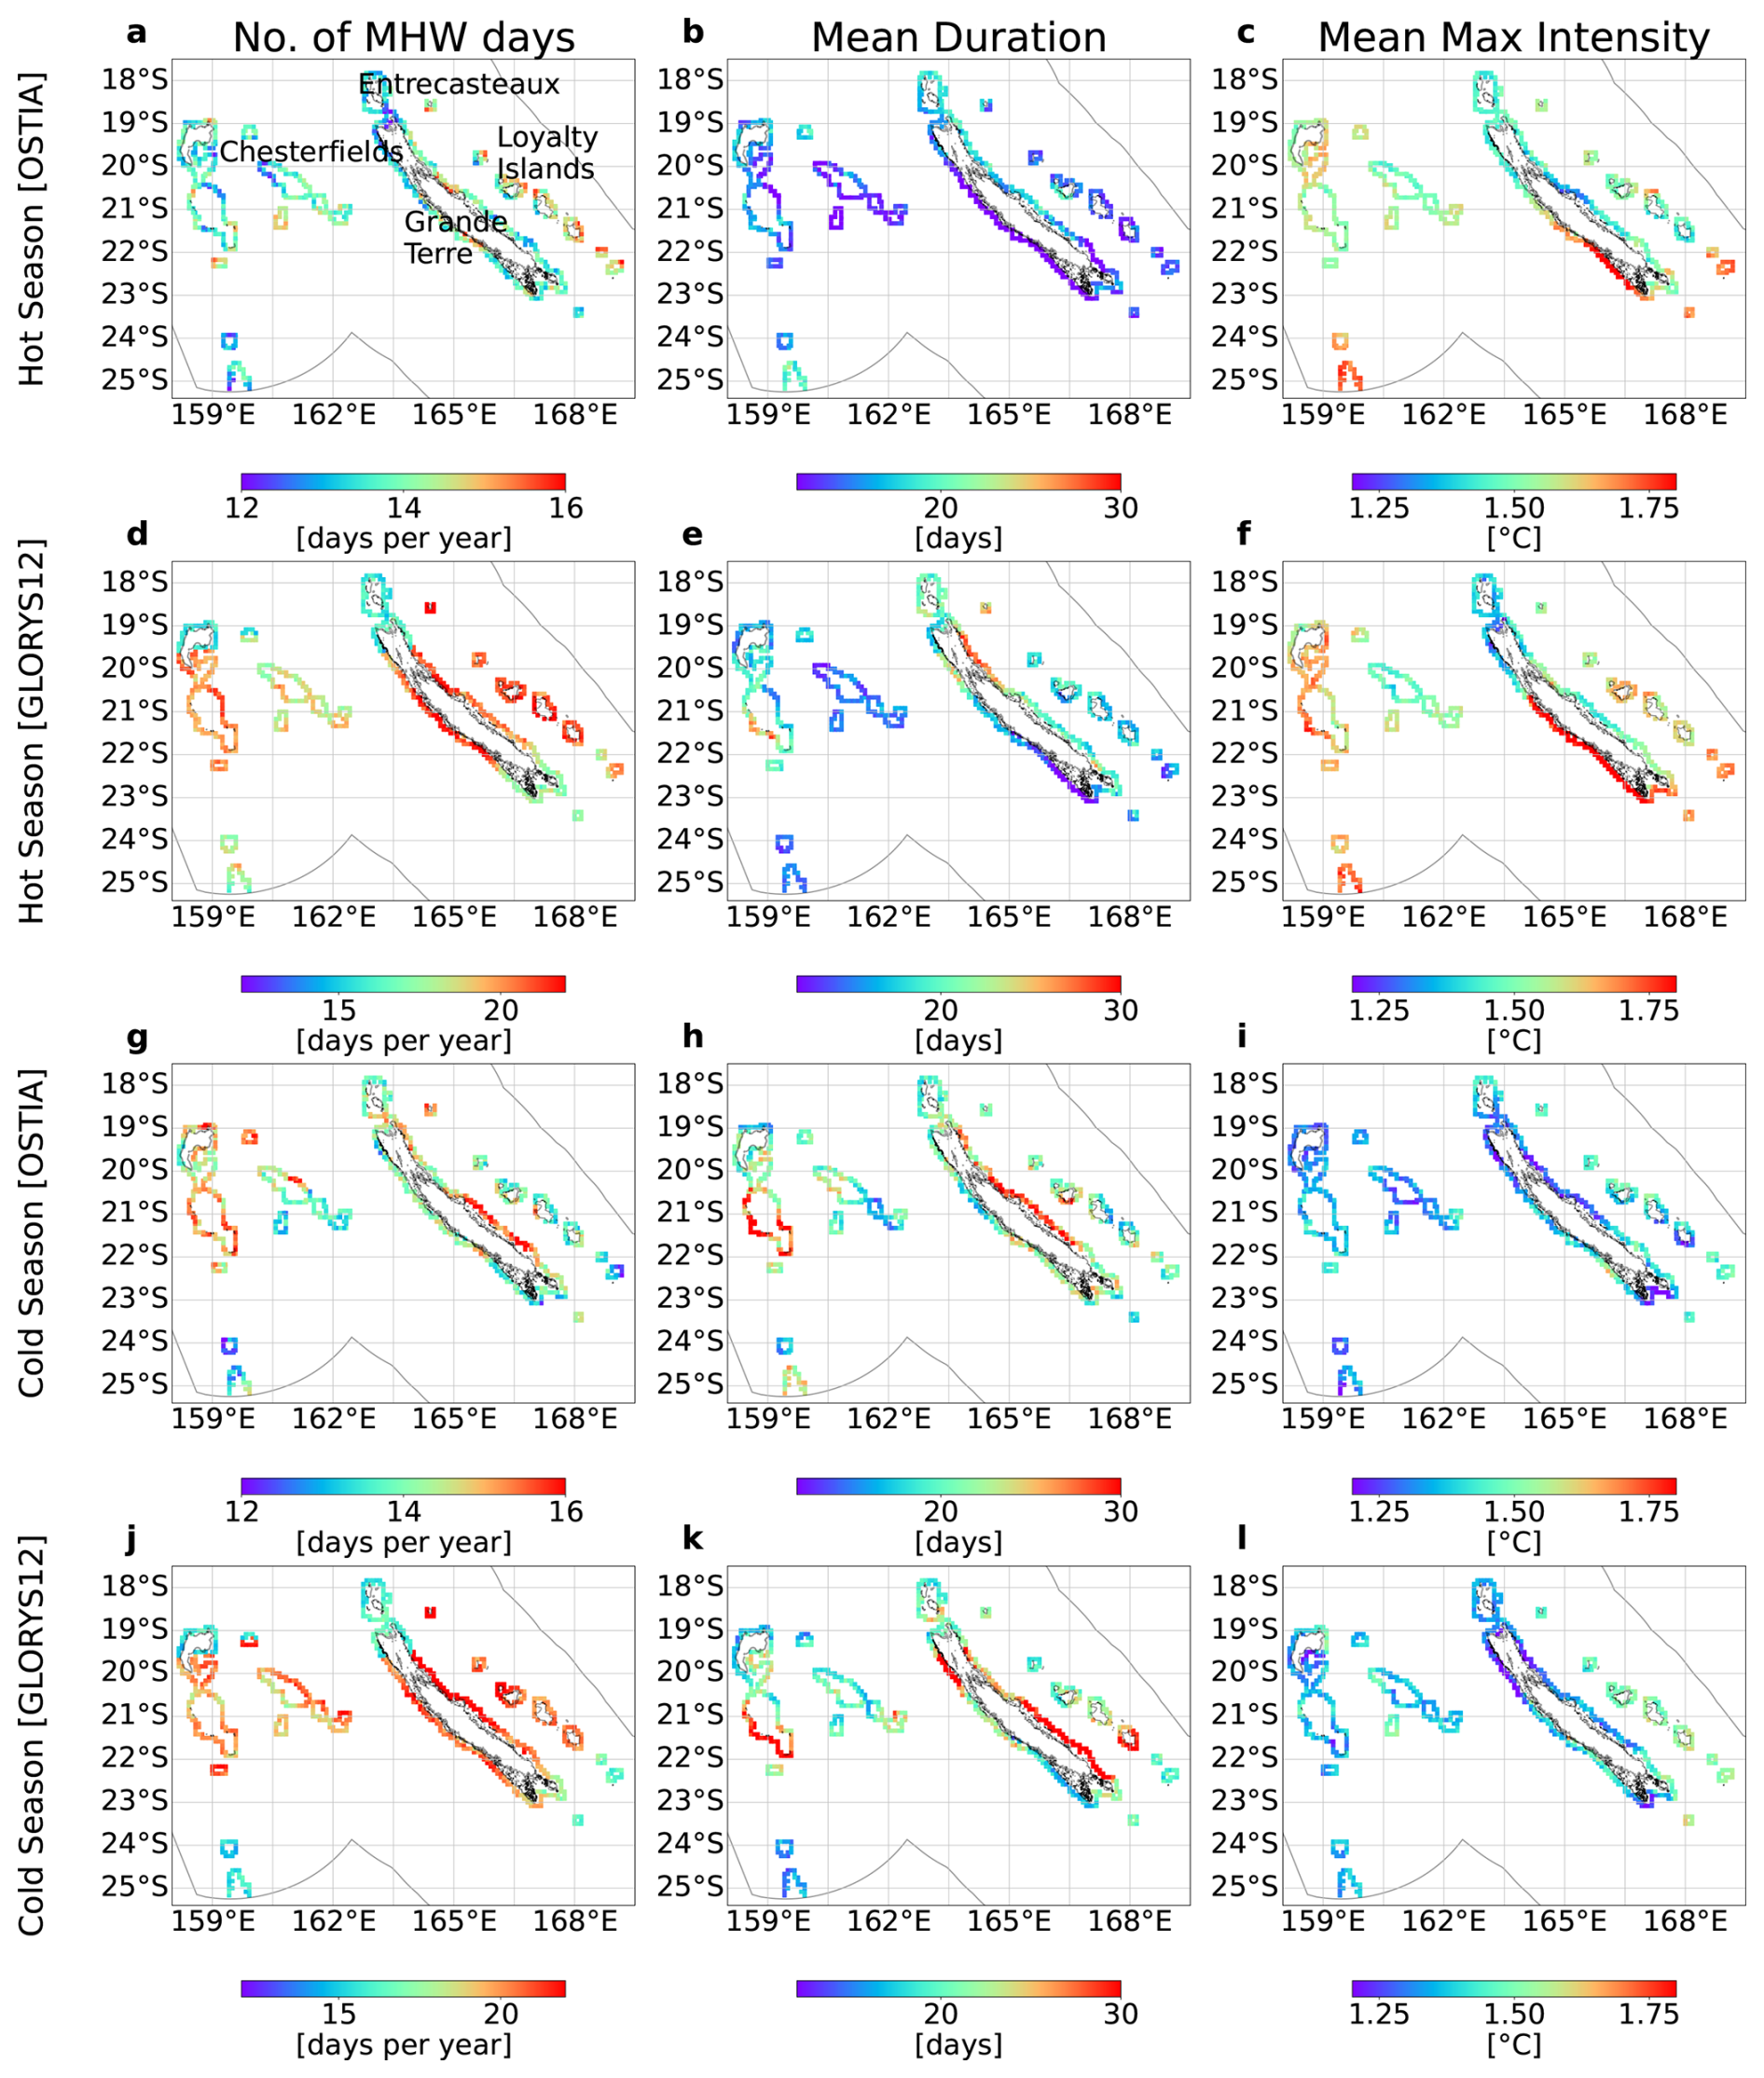
Figure 12Total mean number of MHW days per year, mean duration and mean maximum intensity in coastal New Caledonia: (a–c) in OSTIA and (d–f) in GLORYS12, hot season; (g–i) in OSTIA and (j–l) in GLORYS12, cold season. The colorbar in (a, g) have been adjusted to reflect the spatial variability in the number of MHW days in OSTIA's hot and cold season for New Caledonia coastline.
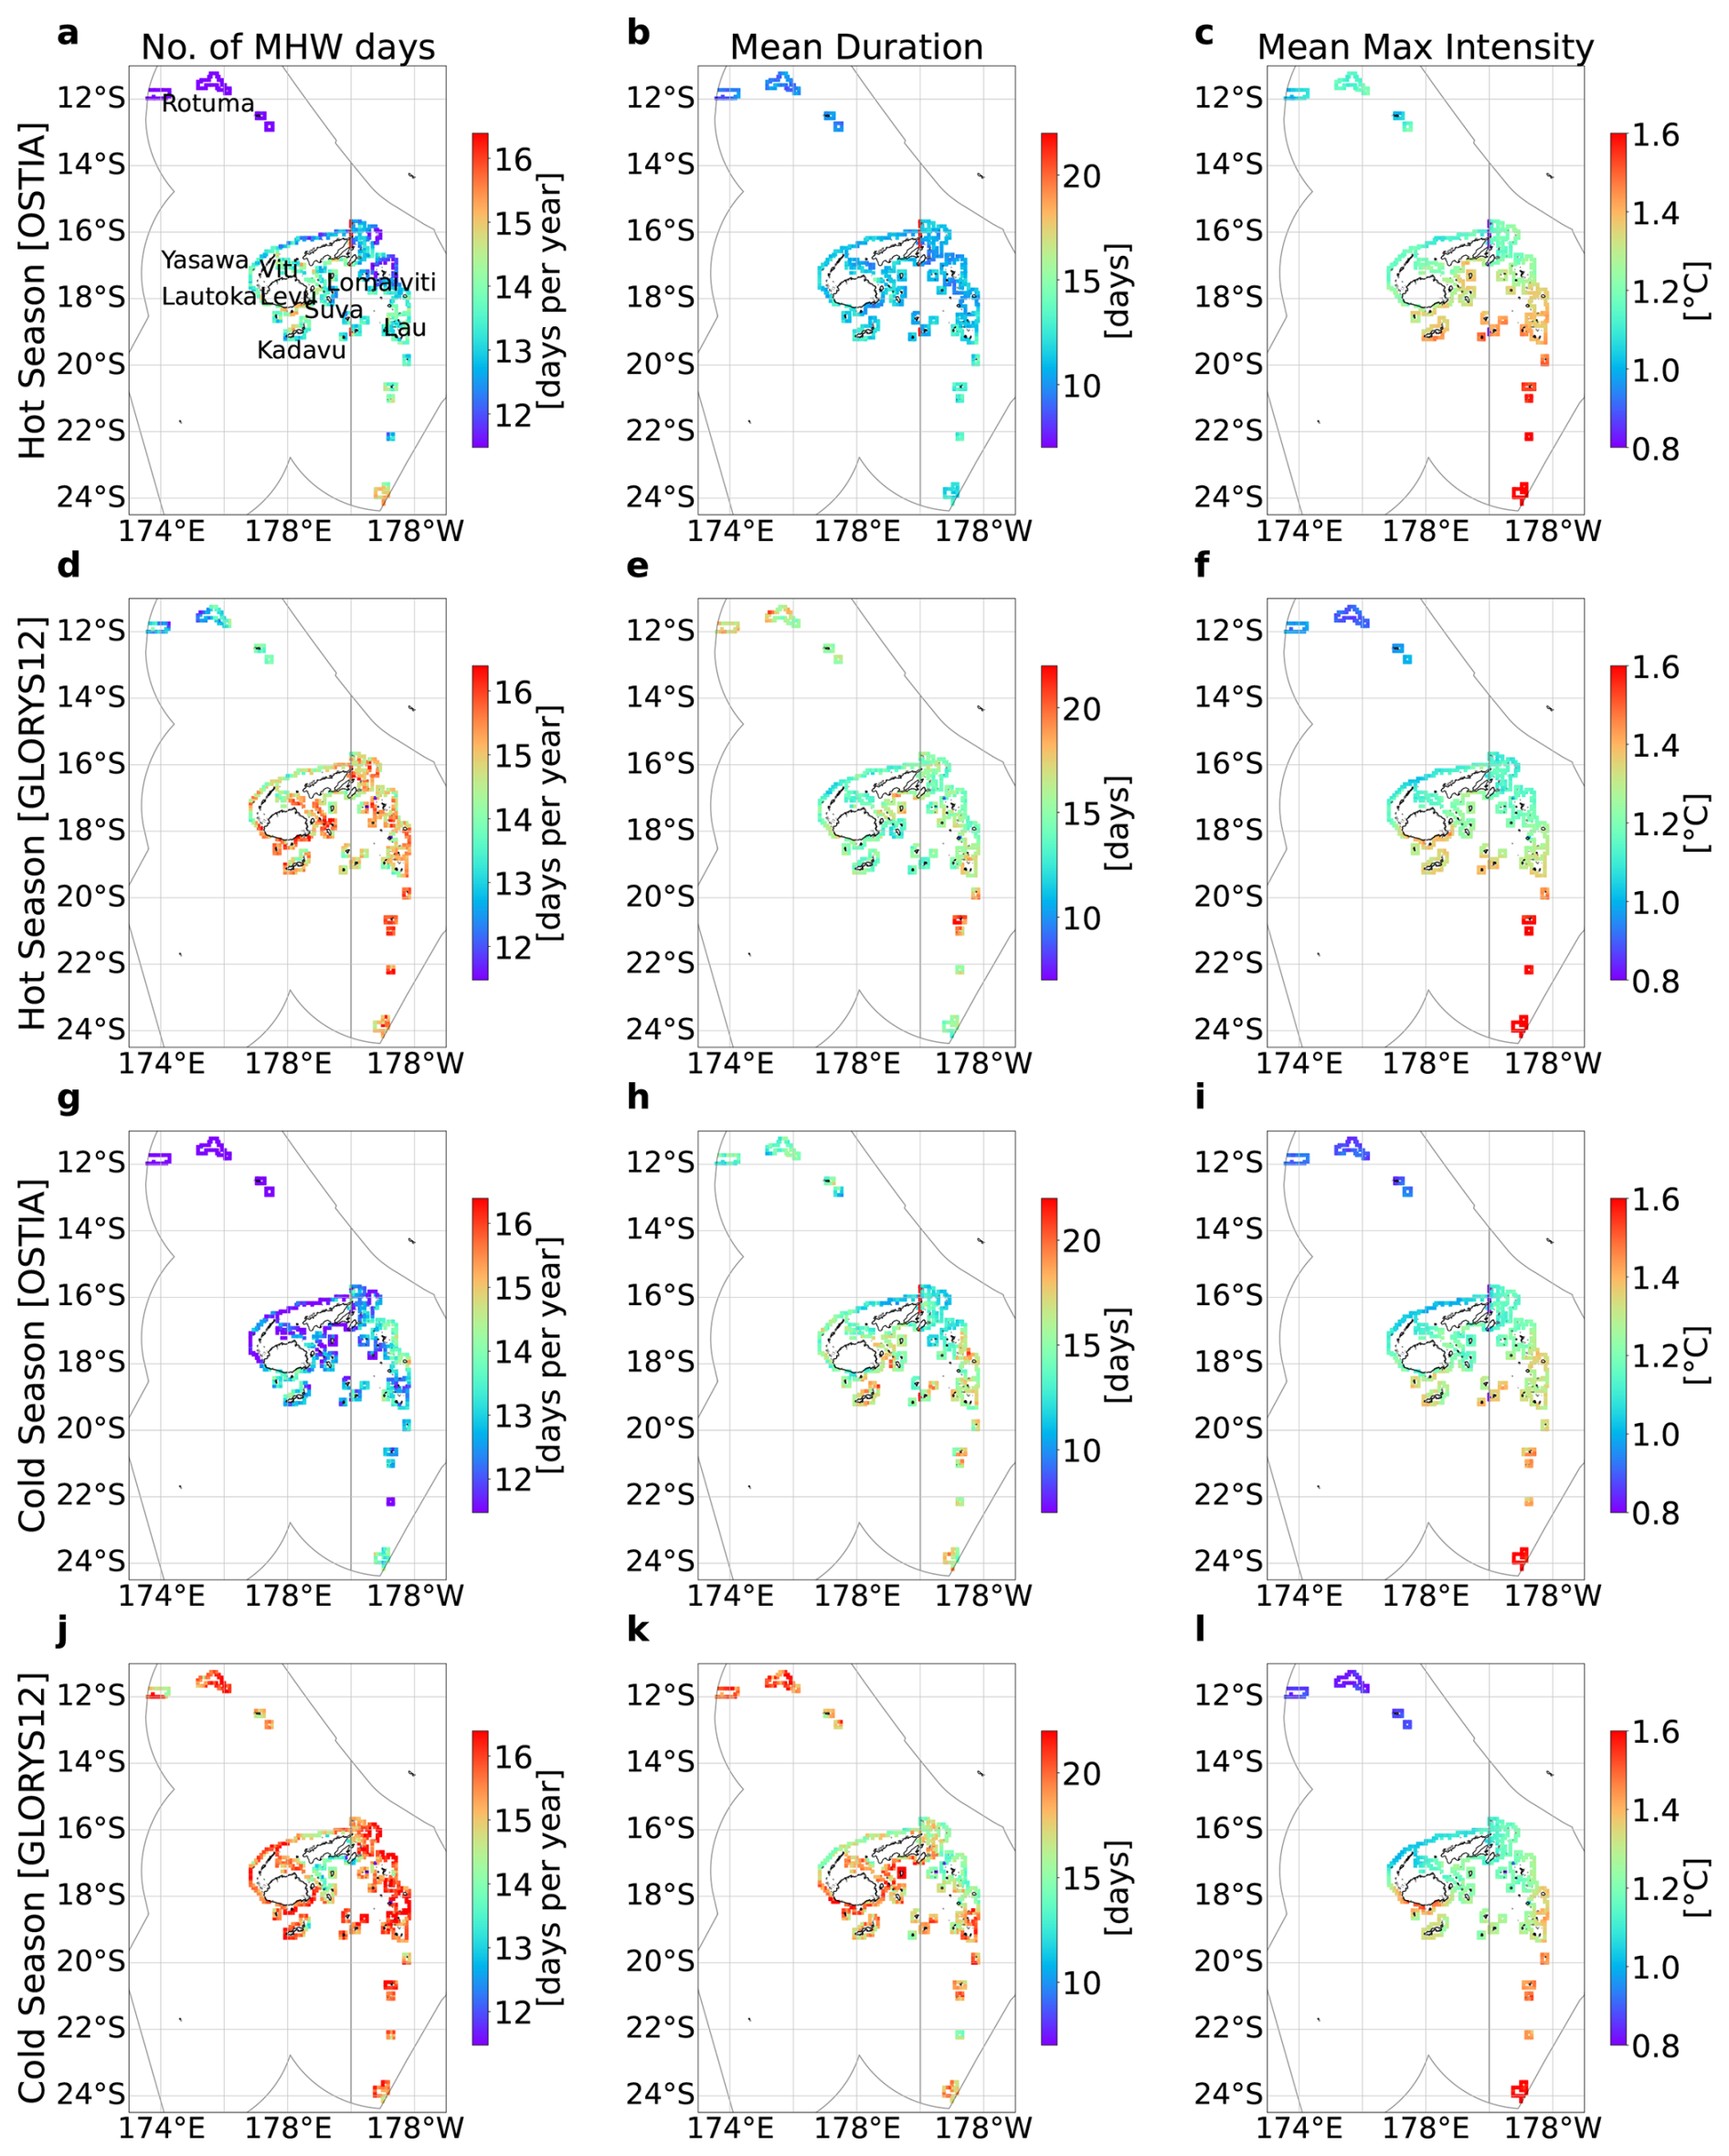
Figure 13Total mean number of MHW days, mean duration and mean maximum intensity in coastal Fiji, (a–c) in OSTIA, (d–f) in GLORYS12 in hot season and (g–i) in OSTIA, (j–l) in GLORYS12 in cold season. MHWs detected using OSTIA and GLORYS12 from January 1993 to October 2023.
As expected, the absolute number of MHW days at the coast are different among the two products, with GLORYS12 showing a higher number of MHW days (approx. 2 more days) in the cold season around New Caledonia's reef and higher mean duration (up to 10 d) (compare Fig. 12a to Fig. 12g and Fig. 12b and e to Fig. 12h and k). These findings (more MHWs days of longer duration in GLORYS12 compared to OSTIA) are consistent with the conclusions from Chevillard et al. (2025) that compared SST products, and can be explained by a larger variance of the high frequency SST signal (from 2 to 15 d) in OSTIA, compared to a smoother GLORYS12 product. In both products, significant contrasts between the various islands exist. The eastern coast of New Caledonia's main island, Grande Terre, experiences generally longer but less intense MHWs than the western coast, both in the hot and cold seasons. MHWs there are longer in the cold season, lasting >25–30 d on average (Fig. 12b, e, h and k). The southwest coast of Grande Terre is exposed to short (<15 d), but very intense (+2.5 °C of maximum intensity) MHWs in the hot season (Fig. 12b, c, e and f). In these areas, southeasterly trade winds along the coast favour occasional coastal upwelling events bringing colder waters to the surface, whose signature in SST is modulated by the seasonal stratification (Alory et al., 2006; Marchesiello et al., 2010). The MHW occurrence might be related to occasional cessation of upwelling explaining the short time scales of these events and the high amplitude in a region with usually much colder (upwelling) conditions; this deserves more investigation.
The northeastern part of the New Caledonian archipelago, equatorward of 19.5° S, comprising the north coast of Grande Terre, the northern part of the Chesterfield Islands, and Entrecastaux reefs, seem to be less exposed to MHWs than the rest of New Caledonia, with less MHWs days, both in the cold and hot seasons, with small maximum intensities (around +1.2–1.5° C). The southern part of the Chesterfields Islands is more exposed, with more MHW days, of longer duration in the cold season, but of moderate maximum intensity (+1.6 °C in the hot season, +1.4 °C in the cold season).
Figure 13 presents MHW properties around coastal Fiji. Coastal Fiji experiences between 11 and 18 MHW days per year, with certain parts of the Yasawas, parts of the Lau group and Kadavu having higher values in the hot season compared to the cold season (Fig. 13a and d). The opposite is true for GLORYS, where the number of MHW days is generally higher in the cold season compared to the hot season. Generally, the mean MHW duration around coastal Fiji is similar everywhere. In the hot season it is between 12 and 15 d and between 12 and 20 d in the cold season (Fig. 13b, e, h and k). These values are much shorter than what is experienced along coastal New Caledonia. The patterns in mean maximum intensity are quite similar between the hot and cold seasons in coastal Fiji (between +0.8 to +1.6 °C, Fig. 13c, f, i and l), with the southern part of the country experiencing more intense MHWs in both the hot and cold seasons.
To answer question (4), Fig. 14 shows locations with significant trends in annual number of MHW days around coastal New Caledonia and Fiji for the OSTIA product. Similar trends are found with GLORYS12 (not shown). Significant trends in annual number of MHW days were observed around most of the coastlines of the PICTs studied (Fiji, Fig. 14b and Solomon Islands, Vanuatu and Tonga in Fig. S4; other PICTs not shown). In New Caledonia, the only significant trends in MHWs days are found north of 20° S, especially along the northeast coast of Grande Terre, which has significant positive trends of around 23 d of MHWs per decade (Fig. 14a), 1.5 times the typical number of current annual MHW days (approx. 14 MHW days per year averaging over the seasons, Fig. 12a and d). The trends in maximum intensity and other MHW parameters were not significant around most parts of New Caledonia (not shown). In Fiji, most of the coastline shows a significant increasing trend of around 8 to 15 MHW days per decade (Fig. 14b). However, the southern coast of Viti Levu, all the way from coastal Suva to Lautoka and Rotuma, exhibits a stronger positive trends in annual number of MHW days (between 18 and 20 d per decade) (Fig. 14b), about 1.3 times the typical number of MHW days per year (approx. 15 d yr−1 from Fig. 13 a and d).
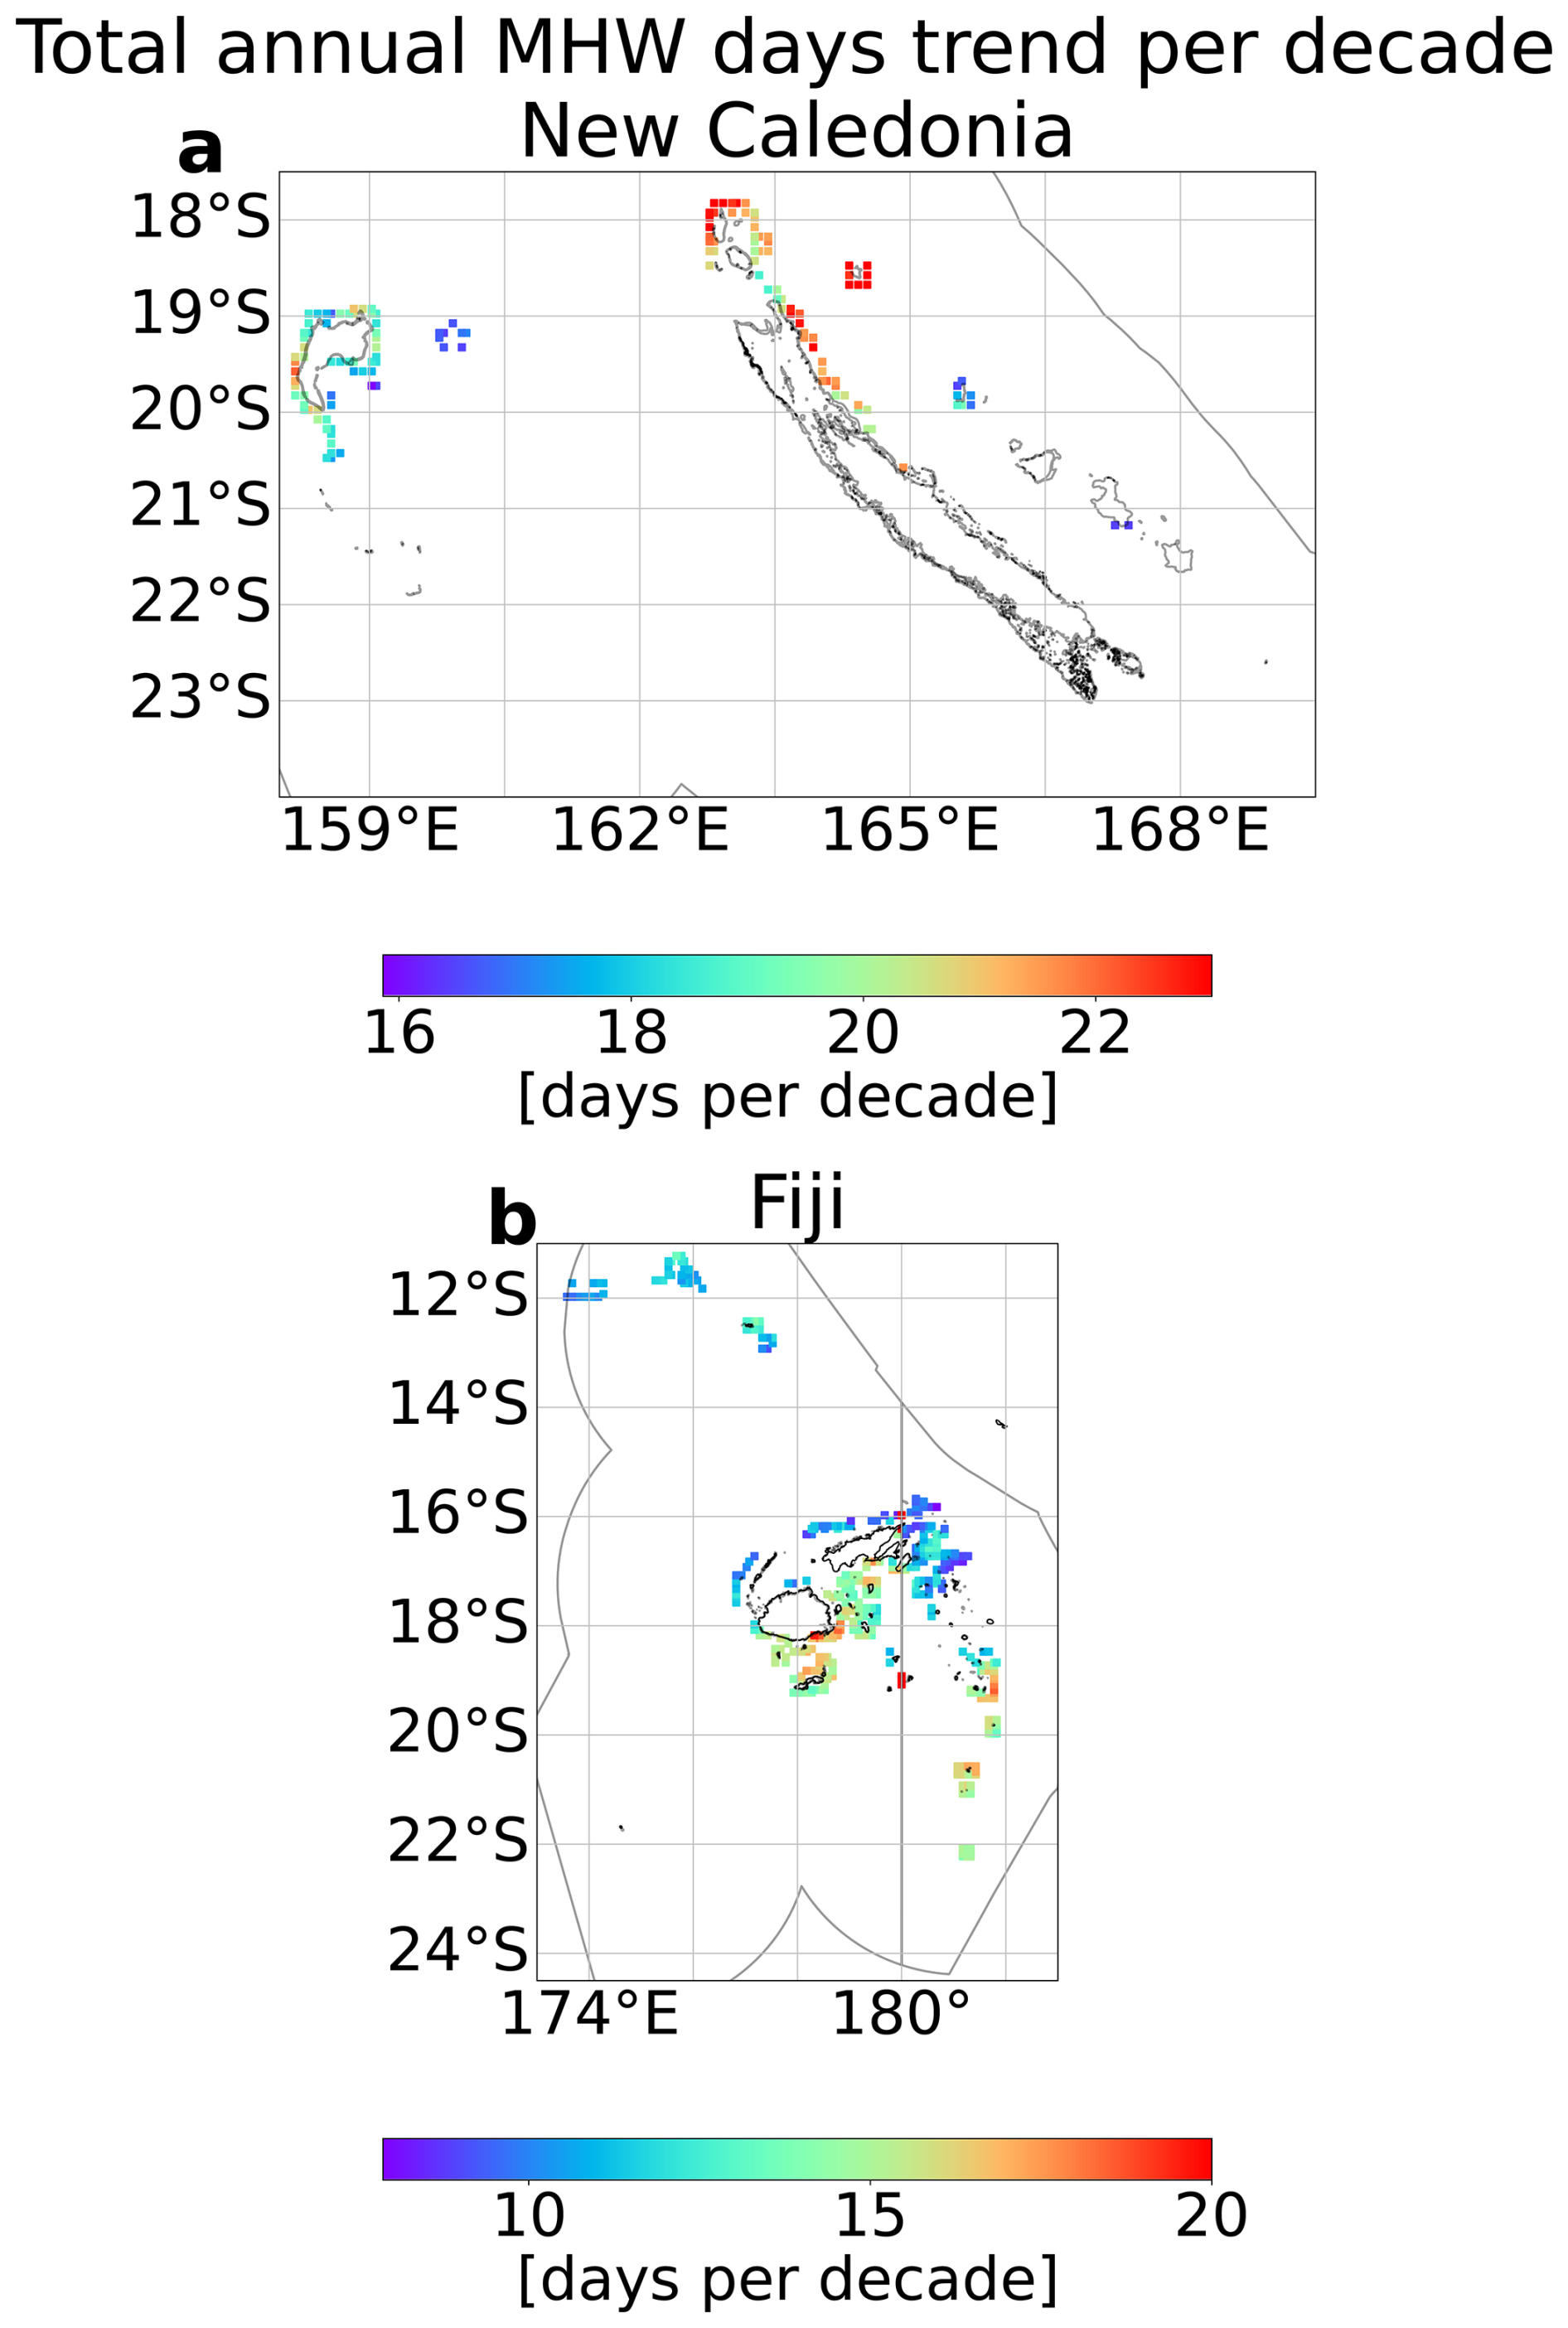
Figure 14Significant trends in annual number of coastal MHW days in New Caledonia (a) and coastal Fiji (b). MHWs detected using OSTIA from 1993 to 2022.
Are open ocean marine heatwaves also observed at the coast? To answer this question (1), Fig. 11 shows the percentage of the coastline (dashed line in magenta) in MHW state for New Caledonia and Fiji, superimposed on the percentage of each EEZ (dashed line in black) in MHW state. The green and black horizontal dashed lines indicate the 95 percentile of the percent of EEZ covered by macroscale events and percent of coastline in experiencing MHW events respectively. For the period between 1993 and 2023, most of the MHWs with large EEZ spatial coverage were observed along large parts of the coastline as well (Fig. 11a and c). In New Caledonia, 77 % of days with large macroscale events (greater than 80 % of the EEZ, corresponding to the 95 percentile) also experienced coastal events of large spatial extents (71 % of the coastlines, corresponding to the 95 percentile). 53 % of MHW events that affected a large part of the coastlines, remained uniquely coastal, that is, not occurring together with large macroscale events in the EEZ (Fig. 11a). Coastal MHWs with large spatial extents are more prevalent than large macroscale events in New Caledonia EEZ. A similar pattern was observed in Fiji. Sixty eight percent of large macroscale events in Fiji EEZ coincided with a large part of the coastline being in a MHW state as well, with 60 % of large-scale coastal events (greater than 60 % of the coastlines, corresponding to the 95th percentile) not detected as macroscale events in the EEZ (Fig. 11c). The events of 1997–1999, 2010/2011 and 2022, affected large parts of the EEZ and the coastline in both New Caledonia and Fiji. While the events seem to peak in the hot season, some large scale events extend across several seasons (including the cold season), for example, the 1997–1999 and 2022 events in New Caledonia and the 2022 event in Fiji. The severity of coastal MHW events are usually between 1 and 3 (Fig. 11b and d) which corresponds to Moderate to Strong events according to naming criteria established by Hobday et al. (2018). While it is known that high severity index events in the hot season may have detrimental effects on coastal ecosystems, for example fish kills in coastal Fiji in February 2016 noted in H22 (high percentage of high severity events in the 2016 hot season around Fiji, Fig. 11d), it is uncertain if high severity index events in the cold season detrimentally affected coastal ecosystems as no bleaching events were observed along coastal New Caledonia in the cold season of 2022, despite the severity index being higher than usual around that time (Fig. 11b).
4.3 Coastal events: statistics for each country
Figure 15 shows the seasonal distribution of coastal MHW properties (MHW duration, maximum intensity, onset and decline rates) in the 12 PICTs studied in the form of box whisker plots for OSTIA. The duration of MHWs can be much longer for coastal events compared to macroscale events. In the cold season, 75 % of the events have MHW durations of up to or longer than 80 d in New Caledonia, and Vanuatu (Fig. 15a), compared to up to 40 d during macroscale events (Fig. 10a). The patterns and values in maximum intensity are similar for coastal and macroscale events for all the 12 PICTs. The median maximum intensities are typically higher in the hot season for all countries except Fiji, New Caledonia, Solomon Islands, Tonga and Vanuatu, where the difference between the seasons is small or there are higher maximum intensities in the cold season (Fig. 15b). The statistical distribution of MHWs durations can display much longer MHWs for coastal events (Fig. 15) compared to macroscale MHWs in the EEZ (Fig. 10). In the cold season, 75 % of the events (summed over the whole time period, and over all coastal points) have MHW durations of up to or longer than 80 d in New Caledonia, and Vanuatu (Fig. 15a), compared to up to 40 d during macroscale events (Fig. 10a). This is especially striking for Vanuatu, which is exposed along its coasts to long duration MHWs. This is explained by the occurrence of long macroscale MHWs during winters of La Niña years (not shown), that encompass all the coasts of Vanuatu Archipelago, but not its whole EEZ. The onset and decline rates are smaller in value for the coastal events (Fig. 15c and d) compared to macroscale MHWs (Fig. 10c and d). This suggests that these PICTs could have a longer time to prepare (that is, the reaction window is longer) for coastal MHWs compared to macroscale MHWs. The slower onset and decline rates in coastal MHWs could also be the reason why they have longer durations compared to macroscale MHWs.
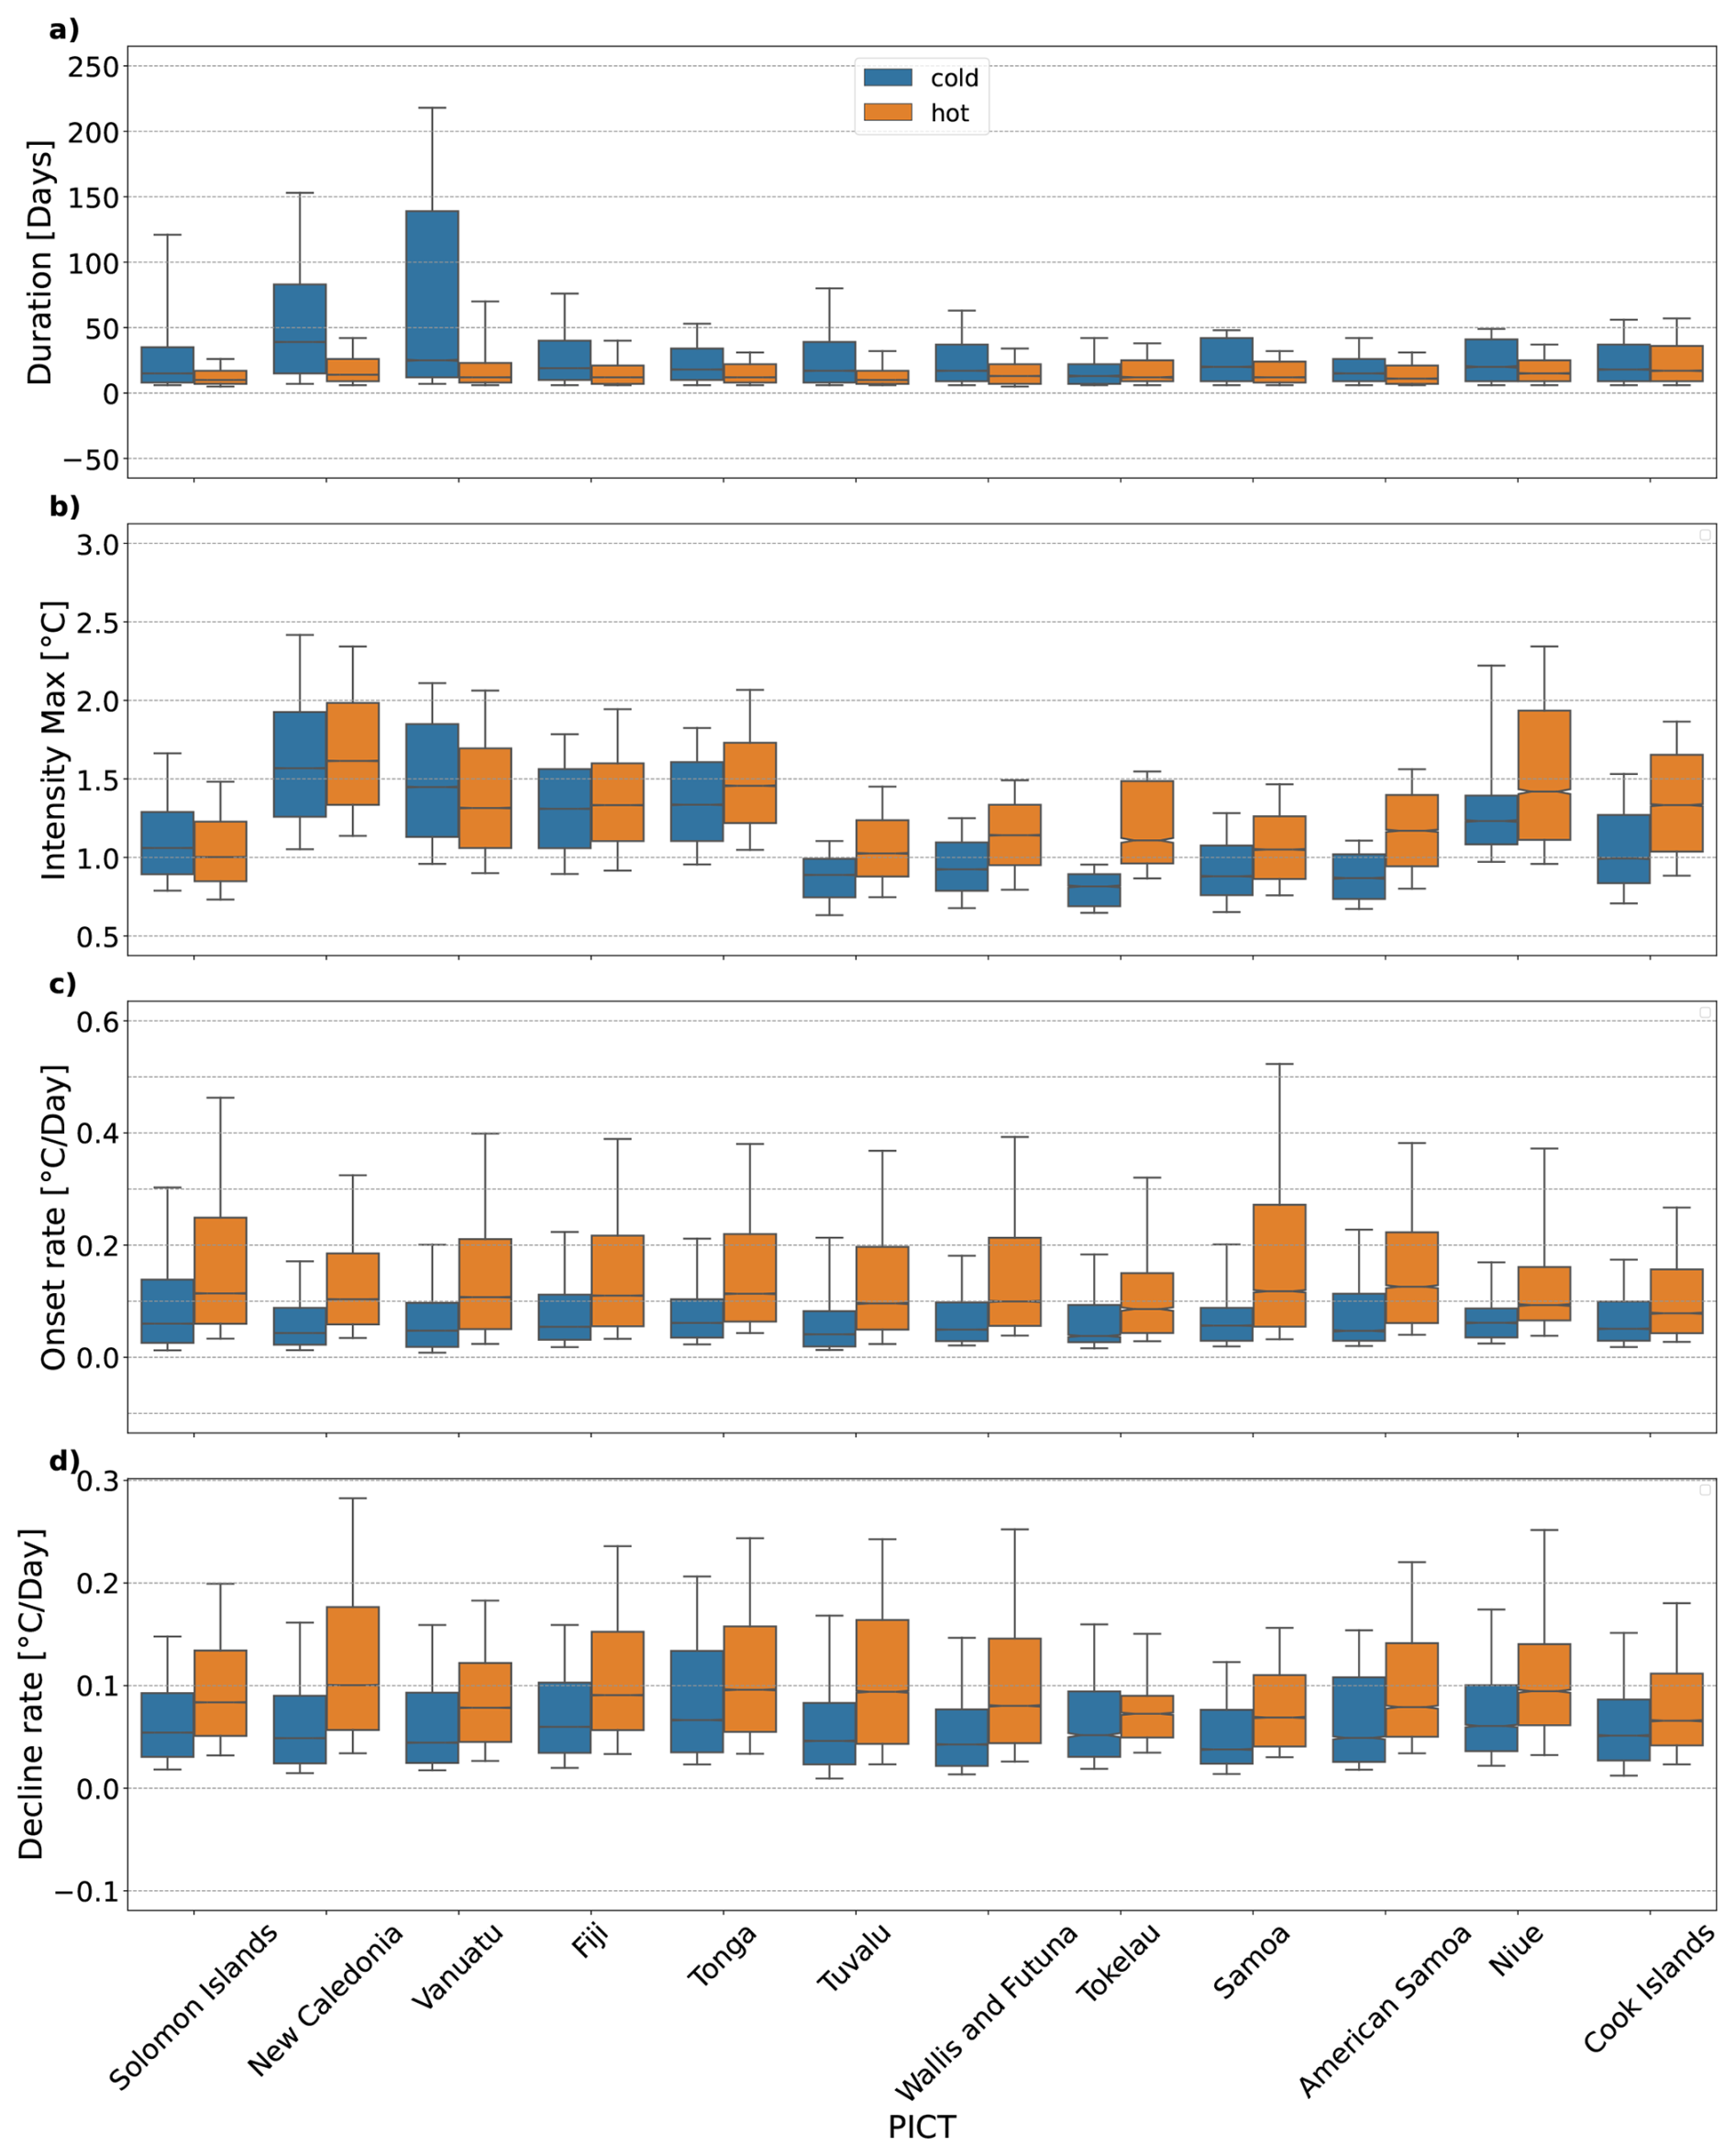
Figure 15Box whisker plots showing MHW properties for coastal events by Pacific Island Country and Territory (PICT) and seasons (a) duration, (b) maximum intensity, (c) onset rate and (d) decline rate. Lower edge of whisker marks 10th percentile, lower edge of box marks 25th percentile, the line in the middle marks the median, the upper edge of the box marks 75th percentile and the upper edge of the whisker marks 90th percentile. MHWs detected using OSTIA from January 1993 to October 2023.
In this paper, we investigated the characteristics of past MHWs in the Southwest Pacific. One novelty of this work is that we revisited the past MHWs statistics by distinguishing between macroscale and microscale sized MHWs, and among hot and cold seasons. We also described the statistics of past MHWs for each PICT. For each EEZ, we provided information on their vertical extent and on their signatures at the coast. This provides important elements that allow both (i) a better understanding of the physical processes that generate MHWs, and (ii) a better anticipation of their impacts on ecosystems.
5.1 What does this paper tell us about possible physical drivers?
We showed that the characteristics of past MHWs (duration, maximum intensity, and vertical extent) depend on their spatial extent, and on the subregion considered. We now discuss what this can tell us in terms of the physical processes driving the MHWs, and what governs these processes, for the five subregions identified. The spatial extent of the MHW provides clues about its drivers: a large-scale MHW is likely driven by a large-scale climate mode (e.g. Dutheil et al., 2024), while a small-scale MHW is more likely driven by a local advection or atmospheric forcing process. While still in its infancy, the exploration of MHW vertical extent also provides some interesting information on MHW dynamics: shallow MHWs are more likely to be generated by mixed layer depth dynamics, and deep MHWs by advection, or downwelling linked to planetary waves or anticyclonic eddies. Recent work has led to the classification of the types of MHW events that can occur in the vertical dimension (i.e. shallow, subsurface reversed/intensified, deep/extended events) (Schaeffer et al., 2023; Zhang et al., 2023), characterisation based on surface features (e.g. block-like, deepening, shoaling, multi-surfacing) (Köhn et al., 2024), as well as exploration of the mechanisms underpinning such events (Elzahaby et al., 2021).
Previous studies investigating the physical processes and drivers generating MHWs have found El Niño–Southern Oscillation (ENSO) to be one of the important modulators of MHW activity (in terms of extent, duration and maximum intensity) in this area (Sen Gupta et al., 2020). While El Niño has been found to enhance MHW occurrence in the central Pacific region, it tends to suppress MHW occurrence in the western Pacific in a chevron shaped region extending towards the east (opposite is true during La Niña) (Holbrook et al., 2019).
Some of our results are consistent with this view, but many other processes can generate MHWs. In subregion 3, the “Equatorial central region”, our results indeed showed that the MHWs detected are deep, of large scale and long duration, and occur during El Niño events. MHW characteristics there are consistent with the deepening of the thermocline in the region during the development of El Niño events. On the contrary, in subregion 1, in the “South-SPCZ region”, MHWs exhibit a diversity of characteristics. Some of the large-scale and long duration MHW, mostly occurring in winter, are related to La Niña years (not shown). Yet, several other MHWs in the area occurring in summer are of shorter duration, are shallow and can occur throughout the years independently of the ENSO phase. One of the most extensive MHW ever recorded in the southwest tropical Pacific region occurred in February 2016, during El Niño (Dutheil et al., 2024) where the El Niño was expected to induce cooler temperatures on average. That MHW event has been explained by exceptionally clear skies and light winds allowing strong surface heating in response linked to the combined effects of an El Niño and an MJO event (Dutheil et al., 2024). More studies will be required to characterise the various processes driving other MHW events, but our analyses suggest that mixed layer dynamics and large-scale atmospheric forcing events are important factors.
On the contrary, in subregion 4 (the “Southeastern Australia eddy region”), where it has been shown that eddies are ubiquitous, most of MHWs detected are of small scale and short duration, and extend very deep. As suggested by previous studies, MHWs in this subregion are often associated with mesoscale eddies (Bian et al., 2023) and driven by advection (Zhang et al., 2023). In addition to mesoscale eddies, oceanic downwelling Rossby waves, and downwelling-favourable winds are also MHW drivers near the Australian coast (Li et al., 2023; Misra et al., 2021; Schaeffer and Roughan, 2017).
Finally, in subregion 5, the “subtropical region”, MHWs properties are a mix between subregion 1 and subregion 4. In this area, the oceanic circulation is quite complex, with a zonally and vertically sheared current system comprising the westward South Caledonian Jet in subsurface, the eastward Subtropical Counter Current and EAC eastern extension. Mesoscale eddies are also ubiquitous (Keppler et al., 2018). It is probable that MHWs are of mixed generation processes, with large-scale atmospheric forcing contributing to large-scale, shallow events, and mesoscale eddies superimposed contributing to smaller scale events, with much deeper extents, as also suggested by Bian et al. (2023). Investigating the oceanic heat budget to understand the physical processes at play for the main MHWs events, in the different regions, will help to better understand the various MHW types and will be done in a forthcoming study.
5.2 What do our results on the different characteristics of MHW imply for ecosystem vulnerability?
Distinguishing between macro and micro-scale MHWs, and providing information on their vertical extent, their seasonality and their signatures at the coast are also important outcomes from an ecosystem point of view, both for open-ocean ecosystems and coastal ecosystems.
In the open ocean, highly mobile pelagic fishes like tunas are likely not affected in the same way by small-scale and large-scale events covering a few, versus hundreds or thousands of square kilometres, respectively. While tunas' mobility means that they can easily escape from the former, it is conceivable that such species may sometimes be exposed to sub-optimal environmental conditions for extended periods during larger scale events, necessitating long-range distributional shifts to more favourable areas (Bond et al., 2015; Walker et al., 2020). Moreover, the consequences for affected individuals' physiology, feeding, growth and reproductive success as well as overall fishery productivity can be substantial (e.g. Mills et al., 2013), yet often remain uncertain, and hence unaccounted for in fisheries management (Jacox et al., 2020).
The PICTs located in subregion 1 – Papua New Guinea, Solomon Islands, New Caledonia, Fiji and Vanuatu – each supporting commercially-important tuna fisheries and dependent economies (Vidal et al., 2024), have all been exposed to macroscale MHWs over the past 40 years, affecting a large portion of their EEZ in both cold and hot seasons. In the other PICTs, MHWs are generally of smaller size, potentially limiting the local impact of MHWs on pelagic species like tunas; however, the cumulative impact of increasing regional MHW maximum intensity, duration and time spent in MHW state on pelagic and coastal fisheries resources remains unknown.
Dutheil et al. (2024) have shown that the 2016 MHW near New Caledonia deeply impacted surface chlorophyll also and it is hence likely that during these events, all trophic levels will be impacted in addition to oxygen and nutrients. Further research will have to investigate how these effects can combine to impact the trophic web.
The vertical extent of MHWs is also important for predicting ecosystem vulnerability. The extension of warm waters deeper is likely to affect both the fish species but also the fisheries. As an example, pelagic fishes like bigeye tuna (Thunnus obesus), yellowfin tuna (T. albacares) and albacore tuna (T. alalunga) regularly move vertically through the water column to track prey resources and/or meet oxygen demands (Briand et al., 2011; Arrizabalaga et al., 2011; Nikolic et al., 2017). Data from tagging studies and fishery catch records both demonstrate these species' propensity to dive to depths of several hundred metres (Williams et al., 2015; Schaefer et al., 2011; Forget et al., 2015; Abascal et al., 2018; Phillips et al., 2019), thereby traversing habitats likely to be severely affected by MHWs at-depth, such as those associated with the ENSO (Lehodey et al., 2020). Our results show that in the hot season, the majority of macroscale MHWs are shallower than 50 m depth; 90 % of them are shallower than 100 m for all PICTs. One exception concerns the central equatorial Pacific, where pelagic species may be more impacted. In winter, MHWs can extend deeper, especially around Solomon Islands, New Caledonia, Vanuatu, Fiji and Tonga. For these PICTs, which are exposed to large-scale events, potential impacts on pelagic species are more likely.
The modification of the species habitat in the vertical also impacts species vulnerability to fisheries as they may, for example and depending on the species, be able to escape (or inversely) the fishing gears more easily in an extended (or reduced) favourable habitat. These considerations of modified fishing pressure versus fish responses to MHW will have to be considered when estimating the impacts of MHWs on commercial fish.
For coastal ecosystems, the important thing is to know which MHW have formed at the coast. Some MHWs can indeed affect a large part of an EEZ, but without forming at the coast, and therefore without any significant impact on reef ecosystems, coastal fisheries or coastal resource management. Here, we have provided information on past MHWs for each PICTs coast to help establish a link between observed and reported impacts on coastal ecosystems (such as coral bleaching and mass mortality events), and to identify key coastal MHW characteristics. For these ecosystems, already close to the thermal tolerance threshold, summer MHWs may be particularly threatening, yet the consequences of such events remain highly uncertain. A logical next next step is to work more closely with ecologists and coastal managers to understand the impacts on, and to define relevant MHW indices and thresholds for coastal ecosystems across the region. Such information could theoretically inform a risk assessment framework for coastal ecosystems and guide country-led adaptation planning (e.g. Woods et al., 2022).
5.3 Dependence of our results on the product and methodology
In this paper, we used three different sea surface temperature products for the analyses (NOAA-OISST, GLORYS12 and OSTIA). The choice of these three products was made either because they are widely used (e.g. NOAA-OISST), because they have a good spatial resolution at the coast (OSTIA) or because they provide the subsurface structure and vertical extent (GLORYS). This choice has also been motivated by the fact that these three products have a Near Real Time mode or are used in forecast mode (for GLORYS): as such, they are used for warning systems for stakeholders and scientists. As shown by others (and illustrated in Appendix A), the MHWs detection method is highly sensitive to the product used. One of our important results is that this sensitivity on SST products lessens when considering macroscale events: the confidence in the results obtained for macroscale is thus higher. On the contrary, for coastal events, the results greatly depend on the product used (see also Marin et al., 2021).
We briefly showed that different products and methods can result in different output in terms of MHW characteristics. Here however, we only considered 2 SST products of different nature to illustrate the range of uncertainties. We concentrated on identifying and discussing features that were robust across these 2 products. However, a recent paper (Chevillard et al., 2025) specifically focussed on quantifying the differences between different SST products and associated uncertainties in MHW metrics. In that work, they systematically analyse MHW parameters across four gridded SST products, a reanalysis product and an ensemble mean. The conclusions are that the dispersion among SST products can be very high, especially for some metrics such as the onset and decline rates. Their recommendation is that MHW studies should account for the uncertainty associated with SST product choice when reporting MHW metric estimates. When feasible, the use of several SST datasets can substantially increase the robustness of the results, by defining upper and lower bounds of metric estimates.
We also examined the MHWs long-term trends in the southwest Pacific, and showed that all 12 PICTs experienced MHWs in the past 30 years and that these events are getting more frequent with greater spatial extents, longer durations, but with lower maximum intensity. Moreover, the percentage of surface area of the study region in a MHW state exhibits a significant increasing trend (Fig. 8). Over the past decade, there has not been a single day when at least part of the region was not exposed to a MHW.
These results are essentially due to the choice of our fixed baseline (1993–2019), that is, the period of time we used as a reference to compute the “normal” seasonal cycle. They are also due to the fact that we did not remove any long-term trend in the temperature fields before applying the MHW detection method, as shown by the comparison with results obtained when we first remove a long-term warming trend from the SST data. As discussed by several others (see Amaya et al., 2023 for a comment), the choice of baseline matters, and can modify the results significantly. We chose the fixed 1993–2019 baseline in order to capture total heat exposure, encompassing both temporary extreme heat events and long-term trends. To characterise MHWs in a future climate, both approaches (fixed baseline and shifting baseline) will be necessary. This will allow managers to better anticipate the potential MHW impacts on species which will adapt quickly to a slow temperature increase but will still be vulnerable to heat extremes, and those who are sensitive to absolute thresholds (see Amaya et al., 2023).
5.4 Responding to MHW threats
Better knowledge of past MHW characteristics around each country allows us to relate past bleaching or mass mortality events observed by the local populations to historical MHWs, or to other external disturbances. It also helps to predict the types of MHWs that will occur in the future and their probability of occurrence. By revealing which coastal areas experienced more MHWs, in which season, our results inform the countries on the relative vulnerability of certain areas and ecosystems (e.g. those more susceptible to coral bleaching, mass mortality of sessile marine species or thermal stress on resident, site-attached fishes). For the macroscale MHWs, our data on MHW vertical extent, and the percentage of the EEZ affected by MHWs can help to better assess MHWs impacts on mobile pelagic fishes.
Here, we have provided detailed spatial maps of past MHW characteristics (number of MHW days, mean duration, mean maximum intensity, Figs. 12 and 13) along the coastlines of Fiji, New Caledonia and Tonga, Solomon Islands and Vanuatu in the Supplement, indicative of potentially sensitive areas to ecological impacts of MHWs. This is of strong interest to stakeholders in these PICTS as it points to the fact that not all coastal areas may be subjected to the same MHW maximum intensity impacts.
We also show the regions where significant climate trends in MHW characteristics arise (Figs. 14 and S4) pointing out also to regions of higher vulnerabilities to climate change when considering future management of coastal ecosystems. Not all regions are affected similarly and such information is useful when prioritizing areas for MHW impact management in the present and future climates.
In the context of Pacific Island communities, marine management would involve several stakeholders; the local communities who claim rights and ownership over particular reef areas, resource users, local government authorities, national government institutions, nongovernmental organisations and funding bodies. Any species or area management plan therefore requires engagement of multiple stakeholders who hold interests in that species or area. Unless it is certain that MHWs affect a species or resource, the motivation to include MHW information for resource management may not be a priority. For many species, the impact of MHWs may not be easily identified because of coarse resolution of temperature products used in MHW detection, the definition of MHWs not being sensitive enough to capture MHWs and MHW properties which are ecologically relevant or species and areas showing resilience and no visible symptoms of thermal stress. Without knowing which species are affected or what areas are affected and how, effective conservation, management plans can't be made.
The results presented in this paper can help local authorities to conduct outreach and consultation with stakeholders of reef areas that are showing a positive trend in MHW maximum intensity and MHW duration. Citizen science initiatives can greatly help in surveillance of sensitive reef areas. As the concept of MHWs is relatively new, having only been formally defined in 2016, many stakeholders may not yet be familiar with it. Nonetheless, they may recall historical ecological impacts in vulnerable reef areas based on their lived experiences, which need to be documented and compared with MHW event timelines from SST products. These observations can help identify species that are prone to experiencing thermal stress so that conservation plans can be made to understand and manage them better for greater reef resilience. Once the vulnerable species and the nature of MHWs affecting them are identified, MHW forecast systems can be developed to help inform local communities and resource users of forthcoming events, so that they can plan their fishing effort and economic activities to offset the negative impact a MHW may bring.
In terms of early-warning systems to forecast the occurrence of MHW, products are increasingly being made available to help resource managers prepare for their occurrence (e.g. BoM-CSIRO Marine Heatwave Seasonal Prediction Project by CSIRO and Bureau of Meteorology, Coral reef watch made by NOAA, other forecast products developed by Copernicus). They inform local communities and resource users of forthcoming events, so that they can plan their fishing effort and economic activities to offset the negative impact a MHW may bring. These tools typically track the formation and movement of pools and fronts of warm-water to forecast out to 3-months. However, the ecological impact of forecasted MHWs may not be easily identified because of coarse resolution of temperature products used in MHW detection. The mean, standard deviation and trend values summarise the nature of the event but they do not imply ecological impact. Our results show that the extent, maximum intensity and timing of MHW in the Pacific region can be more nuanced than just the presence of warm water. We expect that as these forecasting tools mature they will include greater clarity on the expected impact of forecasted MHWs (particularly as the forecast window shortens). Our results identify additional parameters that can be used to build forecast systems with increased information of the expected impact of MHW events.
When communities and stakeholders are prepared, the negative impacts of stressors can be lessened, or sometimes mitigated (Woods et al., 2022). Hobday et al. (2023) proposed a table of action, which can be used by researchers, industry, managers, policy makers and governments, to respond to potential MHW arrival in several stages. The first step to take before any action plan is to assess the risk, revisiting past MHW statistics for regions of interest, and determining, in particular, the reaction window. This is exactly what we did here. Our findings indicate that the rate of onset of MHWs in summer, for all countries, is in the upper range of the values observed at the global scale (Fig. 3 in Spillman et al., 2021): MHWs develop quickly, and the preparation window for countries is rather short. This preparation window is longer for coastal events, and for winter MHWs. Marine managers should be prepared for rapid responses based on warning bulletins, as MHWs develop and evolve.
The next steps will be to work closely with ecologists and anthropologists to identify the vulnerable species, populations and ecosystems, and to define threshold limits and bio-cultural indicators to better assess the risk. In the interdisciplinary project that supported this study, MaHeWa (https://mahewa.fr, last access: 15 February 2026), we work closely with biologists and anthropologists to produce adapted indices of MHWs' impacts for Pacific Island countries, useful for marine managers. Through the work presented in this paper, and these next steps, we hope to help PICTs and their communities to become prepared for the threats that MHWs will represent in the near future.
In this appendix, we illustrate how and why important differences may arise in MHW detection statistics when applying the Hobday et al. (2016) detection method on two different, but similar, SST products. Figure A1 (upper panels) shows the differences obtained in total MHW days between the two products, and Fig. A1 (lower) illustrates how such differences may arise during the year 2016. Even if the two climatologies and 90th quantile levels are close, GLORYS12 is a smoother SST product than NOAA-OISST, and the Hob16 method detects a greater number of longer duration MHWs events in GLORYS12, while it detects fewer events and of shorter duration in NOAA-OISST.
The darker colours and pink shading represent the MHW detected in GLORYS12 and the lighter colours and blue shading is for MHWs detected in NOAA-OISST. The SST time series are shown in black and grey lines for GLORYS12 and NOAA-OISST, respectively. The associated 1993–2019 climatologies are shown in blue (dark and light), the 90th percentile threshold in green (dark and light).
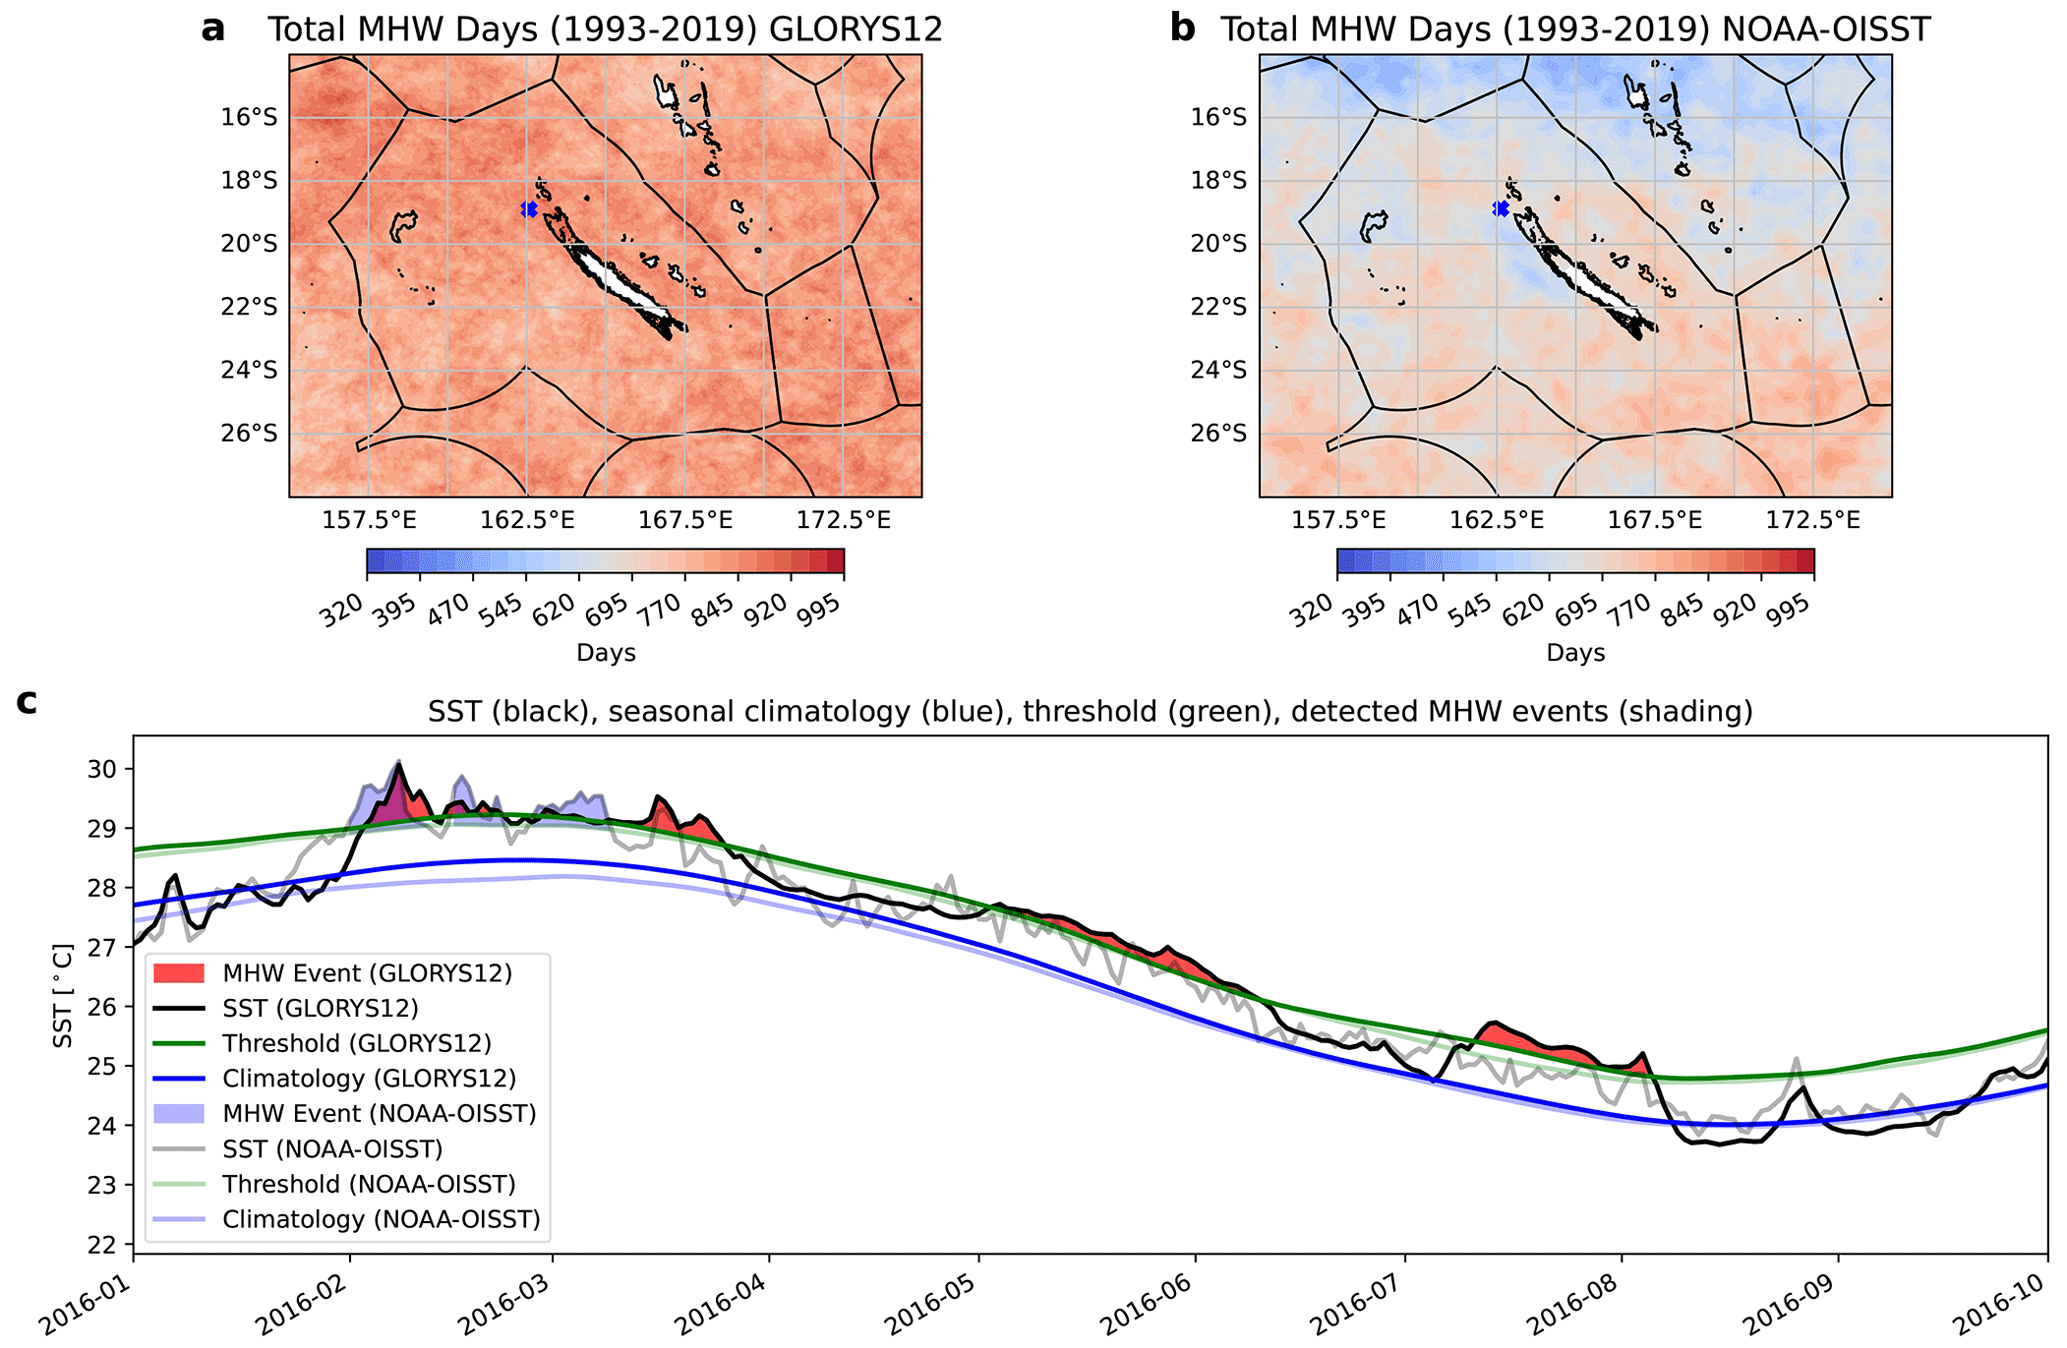
Figure A1Upper panels: total number of MHWs days around New Caledonia for the period 1993–2019, detected at each point with the method from Hobday et al. (2016) using two different SST products: GLORYS12 reanalysis (upper left panel) and NOAA-OISST (upper right panel). Lower panel: Example of a timeseries at one particular location Latitude = −18.89° Longitude = 162.58° for the January to September 2016 period for both products.
Code for MHW detection and analysis used in this study are available at https://doi.org/10.5281/zenodo.19143518 (Lal, 2026).
MHW output data used in this study are available at https://doi.org/10.23708/XFOV7D (Lal et al., 2026).
The supplement related to this article is available online at https://doi.org/10.5194/os-22-1023-2026-supplement.
SL, SC and CM led the design and implementation of the research, and wrote the first draft of the manuscript. SL led the analyses and the preparation of the Figures. CD, JM, RL, IM, NH and SN contributed to text sections. All authors contributed to manuscript revision, and read and approved the submitted version.
The contact author has declared that none of the authors has any competing interests.
Publisher's note: Copernicus Publications remains neutral with regard to jurisdictional claims made in the text, published maps, institutional affiliations, or any other geographical representation in this paper. The authors bear the ultimate responsibility for providing appropriate place names. Views expressed in the text are those of the authors and do not necessarily reflect the views of the publisher.
This article is part of the special issue “Special issue on ocean extremes (55th International Liège Colloquium)”. It is not associated with a conference.
The authors gratefully acknowledge the contribution of Zijie Zhao of the University of Tasmania for his assistance with spatial extent of MHWs and Awnesh Singh of the University of the South Pacific for his support during the research. The authors would like to thank Eric Oliver for developing the Marine heatwaves package and making it publicly available (https://github.com/ecjoliver/marineHeatWaves, last access: 15 February 2026). The authors appreciate organizations responsible for providing the data; NOAA-OISST from NOAA Physical Sciences Laboratory, Boulder, Colorado, USA (https://downloads.psl.noaa.gov//Datasets/noaa.oisst.v2.highres/, last access: 15 February 2026), GLORYS-12 and OSTIA from Copernicus Marine Services and Mercator Ocean International (MOi) (https://data.Marine.copernicus.eu/product/GLOBAL_MULTIYEAR_PHY_001_030/description, last access: 15 February 2026, https://data.marine.copernicus.eu/product/SST_GLO_SST_L4_REP_OBSERVATIONS_010_011/description, last access: 15 February 2026).
Shilpa Lal was funded by the Institut de Recherche pour le Développement (IRD) and the Pacific Community. Sophie Cravatte, Christophe Menkes and Cyril Dutheil were funded by IRD. Ines Mangolte was funded by IRD and the New Caledonia Government (TICTAC project). Jed Macdonald and Simon Nicol were funded through the Pacific-European Union Marine Partnership (PEUMP) program. Neil Holbrook acknowledges support from the ARC Centre of Excellence for Climate Extremes (CE170100023) and Australia's National Environmental Science Program (NESP) Climate Systems Hub. The authors acknowledge support from the Fonds Pacifique (HEAT project) and from the Agence Nationale de la Recherche under the France 2030 program (MaHeWa project, ANR-23-POCE-0001).
This paper was edited by Aida Alvera-Azcárate and reviewed by Wei Chen and one anonymous referee.
Abascal, F. J., Peatman, T., Leroy, B., Nicol, S., Schaefer, K., Fuller, D. W., and Hampton, J.: Spatiotemporal variability in bigeye vertical distribution in the Pacific Ocean, Fish. Res., 204, 371–379, https://doi.org/10.1016/j.fishres.2018.03.013, 2018.
Alory, G., Vega, A., Ganachaud, A., and Despinoy, M..: Influence of upwelling, subsurface stratification, and heat fluxes on coastal sea surface temperature off southwestern New Caledonia, J. Geophys. Res., 111, https://doi.org/10.1029/2005JC003401, 2006.
Amaya, D., Jacox, M., Fewings, M., Saba, V., Stuecker, M., Rykaczewski, R., Ross, A., Stock, C., Capotondi, A., Petrik, C., Bograd, S., Alexander, M., Cheng, W., Hermann, A., Kearney, K., and Powell, B.: Marine heatwaves need clear definitions so coastal communities can adapt, Nature, 616, 29–32, https://doi.org/10.1038/d41586-023-00924-2, 2023.
Andréfouët, S., Dutheil, C., Menkes, C. E., Bador, M., and Lengaigne, M.: Mass mortality events in atoll lagoons: environmental control and increased future vulnerability, Global Change Biol., 21, 195–205, https://doi.org/10.1111/gcb.12699, 2015.
Arrizabalaga, H., de Bruyn, P., Diaz, G. A., Murua, H., Chavance, P., de Molina, A. D., Gaertner, D., Ariz, J., Ruiz, J., and Kell, L. T.: Productivity and susceptibility analysis for species caught in Atlantic tuna fisheries, Aquat. Liv. Resour., 24, 1–12, https://doi.org/10.1051/alr/2011007, 2011.
Bian, C., Jing, Z., Wang, H., Wu, L., Chen, Z., Gan, B., and Yang, H.: Oceanic mesoscale eddies as crucial drivers of global marine heatwaves, Nat. Commun., 14, 2970, https://doi.org/10.1038/s41467-023-38811-z, 2023.
Bond, N. A., Cronin, M. F., Freeland, H., and Mantua, N.: Causes and impacts of the 2014 warm anomaly in the NE Pacific, Geophys. Res. Lett., 42, 3414–3420, https://doi.org/10.1002/2015GL063306, 2015.
Bonino, G., Masina, S., Galimberti, G., and Moretti, M.: Southern Europe and western Asian marine heatwaves (SEWA-MHWs): A dataset based on macroevents, Earth Syst. Sci. Data, 15, 1269–1285, https://doi.org/10.5194/essd-15-1269-2023, 2023.
Briand, K., Molony, B., and Lehodey, P.: A study on the variability of albacore (Thunnus alalunga) longline catch rates in the southwest Pacific Ocean, Fish. Oceanogr., 20, 517–529, https://doi.org/10.1111/j.1365-2419.2011.00599.x, 2011.
Brown, J. R., Lengaigne, M., Lintner, B. R., Widlansky, M. J., van der Wiel, K., Dutheil, C., Linsley, B. K., Matthews, A. J., and Renwick, J.: South Pacific Convergence Zone dynamics, variability and impacts in a changing climate, Nat. Rev. Earth Environ., 1, 530–543, https://doi.org/10.1038/s43017-020-0078-2, 2020.
Caputi, N., Kangas, M., Denham, A., Feng, M., Pearce, A., Hetzel, Y., and Chandrapavan, A.: Management adaptation of invertebrate fisheries to an extreme marine heat wave event at a global warming hot spot, Ecol. Evol., 6, 3583–3593, https://doi.org/10.1002/ece3.2137, 2016.
Cavole, L. M., Demko, A. M., Diner, R. E., Giddings, A., Koester, I., Pagniello, C. M. L. S., Paulsen, M.-L., Ramirez-Valdez, A., Schwenck, S. M., Yen, N. K., Zill, M. E., and Franks, P. J. S.: Biological Impacts of the 2013–2015 Warm-Water Anomaly in the Northeast Pacific: Winners, Losers, and the Future, Oceanography, 29, 273–285, 2016.
Chevillard, C., Le Gendre, R., Menkes, C., Izumo, T., Pagli, B., Van Wynsberge, S., and Cravatte, S.: Sensitivity of marine heatwaves metrics to SST products, focusing on the Tropical Pacific, EGUsphere [preprint], https://doi.org/10.5194/egusphere-2025-5417, 2025.
Cravatte, S., Delcroix, T., Zhang, D., McPhaden, M., and Leloup, J.: Observed freshening and warming of the western Pacific Warm Pool, Clim. Dynam., 33, 565–589, https://doi.org/10.1007/s00382-009-0526-7, 2009.
Dixon, A. M., Forster, P. M., Heron, S. F., Stoner, A. M. K., and Beger, M.: Future loss of local-scale thermal refugia in coral reef ecosystems, PLOS Clim., 1, e0000004, https://doi.org/10.1371/journal.pclm.0000004, 2022.
Dutheil, C., Lal, S., Lengaigne, M., Cravatte, S., Menkès, C., Receveur, A., Börgel, F., Gröger, M., Houlbreque, F., Le Gendre, R., Mangolte, I., Peltier, A., and Meier, H. E. M.: The massive 2016 marine heatwave in the Southwest Pacific: An “El Niño–Madden-Julian Oscillation” compound event, Sci. Adv., 10, eadp2948, https://doi.org/10.1126/sciadv.adp2948, 2024.
Elzahaby, Y., Schaeffer, A., Roughan, M., and Delaux, S.: Oceanic Circulation Drives the Deepest and Longest Marine Heatwaves in the East Australian Current System, Geophys. Res. Lett., 48, e2021GL094785, https://doi.org/10.1029/2021GL094785, 2021.
Everett, J. D., Baird, M. E., Oke, P. R., and Suthers, I. M.: An avenue of eddies: Quantifying the biophysical properties of mesoscale eddies in the Tasman Sea, Geophys. Res. Lett., 39, 2012GL053091, https://doi.org/10.1029/2012GL053091, 2012.
Forget, F. G., Capello, M., Filmalter, J. D., Govinden, R., Soria, M., Cowley, P. D., and Dagorn, L.: Behaviour and vulnerability of target and non-target species at drifting fish aggregating devices (FADs) in the tropical tuna purse seine fishery determined by acoustic telemetry, Can. J. Fish. Aquat. Sci., 72, 1398–1405, https://doi.org/10.1139/cjfas-2014-0458, 2015.
Good, S., Fiedler, E., Mao, C., Martin, M. J., Maycock, A., Reid, R., Roberts-Jones, J., Searle, T., Waters, J., While, J., and Worsfold, M.: The Current Configuration of the OSTIA System for Operational Production of Foundation Sea Surface Temperature and Ice Concentration Analyses, Remote Sens., 12, 4, https://doi.org/10.3390/rs12040720, 2020.
Hobday, A., Oliver, E., Sen Gupta, A., Benthuysen, J., Burrows, M., Donat, M., Holbrook, N., Moore, P., Thomsen, M., Wernberg, T., and Smale, D.: Categorizing and Naming Marine Heatwaves, Oceanography, 31, https://doi.org/10.5670/oceanog.2018.205, 2018.
Hobday, A. J., Alexander, L. V., Perkins, S. E., Smale, D., Straub, S., Oliver, E. C. J., Benthuysen, J. A., Burrows, M. T., Donat, M. G., Feng, M., Holbrook, N. J., Moore, P. J., Scannell, H. A., Sen Gupta, A., and Wernberg, T.: A hierarchical approach to defining marine heatwaves, Prog. Oceanogr., 141, 227–238, https://doi.org/10.1016/j.pocean.2015.12.014, 2016.
Hobday, A. J., Burrows, M. T., Filbee-Dexter, K., Holbrook, N. J., Sen Gupta, A., Smale, D. A., Smith, K. E., Thomsen, M. S., and Wernberg, T.: With the arrival of El Niño, prepare for stronger marine heatwaves, Nature, 621, 38–41, https://doi.org/10.1038/d41586-023-02730-2, 2023.
Holbrook, N. J., Scannell, H. A., Sen Gupta, A., Benthuysen, J. A., Feng, M., Oliver, E. C. J., Alexander, L. V., Burrows, M. T., Donat, M. G., Hobday, A. J., Moore, P. J., Perkins-Kirkpatrick, S. E., Smale, D. A., Straub, S. C., and Wernberg, T.: A global assessment of marine heatwaves and their drivers, Nat. Commun., 10, 2624, https://doi.org/10.1038/s41467-019-10206-z, 2019.
Holbrook, N. J., Hernaman, V., Koshiba, S., Lako, J., Kajtar, J. B., Amosa, P., and Singh, A.: Impacts of marine heatwaves on tropical western and central Pacific Island nations and their communities, Global Planet. Change, 208, 103680, https://doi.org/10.1016/j.gloplacha.2021.103680, 2022.
Houssard, P., Lorrain, A., Tremblay-Boyer, L., Allain, V., Graham, B. S., Menkes, C. E., Heidi, P., Couturier, L. I. E., Point, D., Leroy, B., Receveur, A., Hunt, B. P. V., Vourey, E., Bonnet, S., Rodier, M., Raimbault, P., Feunteun, E., Kuhnert, P. M. ,Munaron, J., Lebreton, B., Otake, T., and Letourneur, Y.: Trophic position increases with thermocline depth in yellowfin and bigeye tuna across the Western and Central Pacific Ocean, Prog. Oceanogr., 154, 49–63, https://doi.org/10.1016/j.pocean.2017.04.008, 2017.
Huang, B., Liu, C., Banzon, V., Freeman, E., Graham, G., Hankins, B., Smith, T., and Zhang, H.-M.: Improvements of the Daily Optimum Interpolation Sea Surface Temperature (DOISST) Version 2.1, J. Climate, 34, 2923–2939, https://doi.org/10.1175/JCLI-D-20-0166.1, 2021.
Hughes, T. P., Anderson, K. D., Connolly, S. R., Heron, S. F., Kerry, J. T., Lough, J. M., Baird, A. H., Baum, J. K., Berumen, M. L., Bridge, T. C., Claar, D. C., Eakin, C. M., Gilmour, J. P., Graham, N. A. J., Harrison, H., Hobbs, J.-P. A., Hoey, A. S., Hoogenboom, M., Lowe, R. J., McCulloch, M. T., Pandolfi, J. M., Pratchett, M., Schoepf, V., Torda, G., and Wilson, S. K.: Spatial and temporal patterns of mass bleaching of corals in the Anthropocene, Science, 359, 80–83, https://doi.org/10.1126/science.aan8048, 2018.
IPCC: Summary for Policymakers, in: Climate Change 2023: Synthesis Report, Contribution of Working Groups I, II and III to the Sixth Assessment Report of the Intergovernmental Panel on Climate Change, IPCC, 1–34, https://doi.org/10.59327/IPCC/AR6-9789291691647.001, 2023.
Jacox, M. G., Alexander, M. A., Bograd, S. J., and Scott, J. D.: Thermal displacement by marine heatwaves, Nature, 584, 7819, https://doi.org/10.1038/s41586-020-2534-z, 2020.
Jones, T., Parrish, J. K., Peterson, W. T., Bjorkstedt, E. P., Bond, N. A., Ballance, L. T., Bowes, V., Hipfner, J. M., Burgess, H. K., Dolliver, J. E., Lindquist, K., Lindsey, J., Nevins, H. M., Robertson, R. R., Roletto, J., Wilson, L., Joyce, T., and Harvey, J.: Massive Mortality of a Planktivorous Seabird in Response to a Marine Heatwave, Geophys. Res. Lett., 45, 3193–3202, https://doi.org/10.1002/2017GL076164, 2018.
Keppler, L., Cravatte, S., Chaigneau, A., Pegliasco, C., Gourdeau, L., and Singh, A.: Observed Characteristics and Vertical Structure of Mesoscale Eddies in the Southwest Tropical Pacific, J. Geophys. Res.-Oceans, 123(4), 2731–2756, https://doi.org/10.1002/2017JC013712, 2018.
Köhn, E. E., Vogt, M., Münnich, M., and Gruber, N.: On the Vertical Structure and Propagation of Marine Heatwaves in the Eastern Pacific, J. Geophys. Res.-Oceans, 129, e2023JC020063, https://doi.org/10.1029/2023JC020063, 2024.
Lal, S.: shilpa-s-lal/mhws: Marine heatwaves in the South West Tropical Pacific (Version v1), Zenodo [code], https://doi.org/10.5281/zenodo.19143518, 2026.
Lal, S., Cravatte, S., Menkes, C., Macdonald, J., Le Gendre, R., Mangolte, I., Dutheil, C., Holbrook, N., and Nicol, S.: Coastal Marine Heatwaves (MHWs) in the South West Tropical Pacific (SWTP) – (1993–2023), DataSuds [data set], https://doi.org/10.23708/XFOV7D, 2026.
Lehodey, P., Bertrand, A., Hobday, A. J., Kiyofuji, H., McClatchie, S., Menkès, C. E., Pilling, G., Polovina, J., and Tommasi, D.: ENSO Impact on Marine Fisheries and Ecosystems, in: El Niño Southern Oscillation in a Changing Climate, AGU – American Geophysical Union, 429–451, https://doi.org/10.1002/9781119548164.ch19, 2020.
Lellouche, J.-M., Greiner, E., Bourdallé-Badie, R., Garric, G., Melet, A., Drévillon, M., Clément, B., Hamon, M., Le Galloudec, O., Regnier, C., Candela, T., Testut, C.-E., Florent, G., Giovanni, R., Mounir, B., Drillet, Y., and Le Traon, P.Y.: The Copernicus Global 1/12° Oceanic and Sea Ice GLORYS12 Reanalysis, Front. Earth Sci., 9, https://doi.org/10.3389/feart.2021.698876, 2021.
Li, J., Roughan, M., and Hemming, M.: Interactions between cold cyclonic eddies and a western boundary current modulate marine heatwaves, Commun. Earth Environ., 4, 1–11, https://doi.org/10.1038/s43247-023-01041-8, 2023.
Longhurst, A. R.: Toward an Ecological Geography of the Sea, Ecological Geography of the Sea, Elsevier, 1–17, https://doi.org/10.1016/B978-012455521-1/50002-4, 2007.
Marchesiello, P., Lefèvre, J., Vega, A., Couvelard, X., and Menkes, C.,: Coastal upwelling, circulation and heat balance around New Caledonia's barrier reef, Mar. Pollut. Bull., 61, 432–448, https://doi.org/10.1016/j.marpolbul.2010.06.043, 2010.
Marin, M., Feng, M., Phillips, H. E., and Bindoff, N. L.: A Global, Multiproduct Analysis of Coastal Marine Heatwaves: Distribution, Characteristics, and Long-Term Trends, J. Geophys. Res.-Oceans, 126, e2020JC016708, https://doi.org/10.1029/2020JC016708, 2021.
Mills, K. E., Pershing, A. J., Brown, C. J., Chen, Y., Chiang, F.-S., Holland, D. S., Lehuta, S., Nye, J. A., Sun, J. C., Thomas, A. C., and Wahle, R. A.: Fisheries Management in a Changing Climate: Lessons from the 2012 Ocean Heat Wave in the Northwest Atlantic, Oceanography, 26, 191–195, 2013.
Misra, R., Sérazin, G., Meissner, K. J., and Sen Gupta, A.: Projected Changes to Australian Marine Heatwaves, Geophys. Res. Lett., 48, e2020GL091323, https://doi.org/10.1029/2020GL091323, 2021.
Moore, J. A. Y., Bellchambers, L. M., Depczynski, M. R., Evans, R. D., Evans, S. N., Field, S. N., Friedman, K. J., Gilmour, J. P., Holmes, T. H., Middlebrook, R., Radford, B. T., Ridgway, T., Shedrawi, G., Taylor, H., Thomson, D. P., and Wilson, S. K.: Unprecedented Mass Bleaching and Loss of Coral across 12° of Latitude in Western Australia in 2010–11, PLOS ONE, 7, e51807, https://doi.org/10.1371/journal.pone.0051807, 2012.
Nikolic, N., Morandeau, G., Hoarau, L., West, W., Arrizabalaga, H., Hoyle, S., Nicol, S. J., Bourjea, J., Puech, A., Farley, J. H., Williams, A. J., and Fonteneau, A.: Review of albacore tuna, Thunnus alalunga, biology, fisheries and management, Rev. Fish Biol. Fisher., 27, 775–810, https://doi.org/10.1007/s11160-016-9453-y, 2017.
Oliver, E. C. J., Benthuysen, J. A., Darmaraki, S., Donat, M. G., Hobday, A. J., Holbrook, N. J., Schlegel, R. W., and Sen Gupta, A.: Marine Heatwaves, Annu. Rev. Mar. Sci., 13, 313–342, https://doi.org/10.1146/annurev-marine-032720-095144, 2021.
Phillips, J. S., Escalle, L., Pilling, G., Gupta, A. S., and van Sebille, E.: Regional connectivity and spatial densities of drifting fish aggregating devices, simulated from fishing events in the Western and Central Pacific Ocean, Environ. Res. Commun., 1, 055001, https://doi.org/10.1088/2515-7620/ab21e9, 2019.
Picaut, J., Ioualalen, M., Delcroix, T., Masia, F., Murtugudde, R., and Vialard, J.: The oceanic zone of convergence on the eastern edge of the Pacific warm pool: A synthesis of results and implications for El Niño–Southern Oscillation and biogeochemical phenomena, J. Geophys. Res.-Oceans, 106, 2363–2386, https://doi.org/10.1029/2000JC900141, 2001.
Plecha, S. M. and Soares, P. M. M.: Global marine heatwave events using the new CMIP6 multi-model ensemble: From shortcomings in present climate to future projections, Environ. Res. Lett., 15, 124058, https://doi.org/10.1088/1748-9326/abc847, 2020.
Qiu, B. and Chen, S.: Seasonal modulations in the eddy field of the South Pacific Ocean, J. Phys. Oceanogr., 34, 1515–1527, 2004.
Qiu, B., Chen, S., and Kessler, W. S.: Source of the 70-Day Mesoscale Eddy Variability in the Coral Sea and the North Fiji Basin, J. Phys. Oceanogr., 39, 404–420, https://doi.org/10.1175/2008JPO3988.1, 2009.
Rocha, C. B., Gille, S. T., Chereskin, T. K., and Menemenlis, D.: Seasonality of submesoscale dynamics in the Kuroshio Extension, Geophys. Res. Lett., 43, 11304–11311, https://doi.org/10.1002/2016GL071349, 2016.
Schaeffer, A. and Roughan, M.: Subsurface intensification of marine heatwaves off southeastern Australia: The role of stratification and local winds, Geophys. Res. Lett., 44, 5025–5033, https://doi.org/10.1002/2017GL073714, 2017.
Schaeffer, A., Sen Gupta, A., and Roughan, M.: Seasonal stratification and complex local dynamics control the sub-surface structure of marine heatwaves in Eastern Australian coastal waters, Commun. Earth Environ., 4, 1–12, https://doi.org/10.1038/s43247-023-00966-4, 2023.
Schaefer, K. M., Fuller, D. W., and Block, B. A.: Movements, behavior, and habitat utilization of yellowfin tuna (Thunnus albacares) in the Pacific Ocean off Baja California, Mexico, determined from archival tag data analyses, including unscented Kalman filtering, Fish. Res., 112, 22–37, https://doi.org/10.1016/j.fishres.2011.08.006, 2011.
Sen Gupta, A., Thomsen, M., Benthuysen, J. A., Hobday, A. J., Oliver, E., Alexander, L. V., Burrows, M. T., Donat, M. G., Feng, M., Holbrook, N. J., Perkins-Kirkpatrick, S., Moore, P. J., Rodrigues, R. R., Scannell, H. A., Taschetto, A. S., Ummenhofer, C. C., Wernberg, T., and Smale, D. A.: Drivers and impacts of the most extreme marine heatwave events, Sci. Rep., 10, 1, https://doi.org/10.1038/s41598-020-75445-3, 2020.
Sérazin, G., Marin, F., Gourdeau, L., Cravatte, S., Morrow, R., and Dabat, M.-L.: Scale-dependent analysis of in situ observations in the mesoscale to submesoscale range around New Caledonia, Ocean Sci., 16, 907–925, https://doi.org/10.5194/os-16-907-2020, 2020.
Smith, K. E., Burrows, M. T., Hobday, A. J., Sen Gupta, A., Moore, P. J., Thomsen, M., Wernberg, T., and Smale, D. A.: Socioeconomic impacts of marine heatwaves: Global issues and opportunities, Science, 374, eabj3593, https://doi.org/10.1126/science.abj3593, 2021.
Spillman, C. M., Smith, G. A., Hobday, A. J., and Hartog, J. R.: Onset and Decline Rates of Marine Heatwaves: Global Trends, Seasonal Forecasts and Marine Management, Front. Clim., 3, https://doi.org/10.3389/fclim.2021.801217, 2021.
Sun, D., Jing, Z., Li, F., and Wu, L.: Characterizing global marine heatwaves under a spatio-temporal framework, Prog. Oceanogr., 211, 102947, https://doi.org/10.1016/j.pocean.2022.102947, 2023.
Thomson, J. A., Burkholder, D. A., Heithaus, M. R., Fourqurean, J. W., Fraser, M. W., Statton, J., and Kendrick, G. A.: Extreme temperatures, foundation species, and abrupt ecosystem change: An example from an iconic seagrass ecosystem, Global Change Biol., 21, 1463–1474, https://doi.org/10.1111/gcb.12694, 2015.
Uthicke, S., Logan, M., Liddy, M., Francis, D., Hardy, N., and Lamare, M.: Climate change as an unexpected co-factor promoting coral eating seastar (Acanthaster planci) outbreaks, Sci. Rep., 5, 8402, https://doi.org/10.1038/srep08402, 2015.
van Hooidonk, R., Maynard, J. A., and Planes, S.: Temporary refugia for coral reefs in a warming world, Nat. Clim. Change, 3, 5, https://doi.org/10.1038/nclimate1829, 2013.
Vidal, T., Williams, P., and Ruaia, T.: Overview of tuna fisheries in the Western and Central Pacific Ocean, including economic conditions – 2023, Rev.01, WCPFC Meetings, https://meetings.wcpfc.int/node/23098 (last access: 17 February 2026), 2024.
Vincent, E. M., Emanuel, K. A., Lengaigne, M., Vialard, J., and Madec, G.: Influence of upper ocean stratification interannual variability on tropical cyclones, J. Adv. Model. Earth Syst., 6, 680–699, https://doi.org/10.1002/2014MS000327, 2014.
Vogt, L., Burger, F. A., Griffies, S. M., and Frölicher, T. L.: Local Drivers of Marine Heatwaves: A Global Analysis With an Earth System Model, Front. Clim., 4, https://doi.org/10.3389/fclim.2022.847995, 2022.
Walker, H. J., Hastings, P. A., Hyde, J. R., Lea, R. N., Snodgrass, O. E., and Bellquist, L. F.: Unusual occurrences of fishes in the Southern California Current System during the warm water period of 2014–2018, Estuar. Coast. Shelf Sci., 236, 106634, https://doi.org/10.1016/j.ecss.2020.106634, 2020.
Wernberg, T., Smale, D. A., Tuya, F., Thomsen, M. S., Langlois, T. J., de Bettignies, T., Bennett, S., and Rousseaux, C. S.: An extreme climatic event alters marine ecosystem structure in a global biodiversity hotspot, Nat. Clim. Change, 3, 78–82, https://doi.org/10.1038/nclimate1627, 2013.
Williams, A. J., Allain, V., Nicol, S. J., Evans, K. J., Hoyle, S. D., Dupoux, C., Vourey, E., and Dubosc, J.: Vertical behavior and diet of albacore tuna (Thunnus alalunga) vary with latitude in the South Pacific Ocean, Deep-Sea Res. Pt. II, 113, 154–169, https://doi.org/10.1016/j.dsr2.2014.03.010, 2015.
Woods, P. J., Macdonald, J. I., Bárðarson, H., Bonanomi, S., Boonstra, W. J., Cornell, G., Cripps, G., Danielsen, R., Färber, L., Ferreira, A. S. A., Ferguson, K., Holma, M., Holt, R. E., Hunter, K. L., Kokkalis, A., Langbehn, T. J., Ljungström, G., Nieminen, E., Nordström, M. C., Oostdijk, M., Richter, A., Romagnoni, G., Sguotti, C., Simons, A., Shackell, N. L., Snickars, M., Whittington, J. D., Wootton, H., and Yletyinen, J.: A review of adaptation options in fisheries management to support resilience and transition under socio-ecological change, ICES J. Mar. Sci., 79, 463–479, https://doi.org/10.1093/icesjms/fsab146, 2022.
Wyatt, A. S. J., Leichter, J. J., Washburn, L., Kui, L., Edmunds, P. J., and Burgess, S. C.: Hidden heatwaves and severe coral bleaching linked to mesoscale eddies and thermocline dynamics, Nat. Commun., 14, 1, https://doi.org/10.1038/s41467-022-35550-5, 2023.
Zhang, Y., Du, Y., Feng, M., and Hobday, A. J.: Vertical structures of marine heatwaves, Nat. Commun., 14, 6483, https://doi.org/10.1038/s41467-023-42219-0, 2023.
- Abstract
- Introduction
- Data and methods
- Revisiting past MHW metrics in the southwest Pacific in terms of spatial extent and seasonality
- Past MHWs for each Pacific country
- Discussion
- Appendix A
- Code availability
- Data availability
- Author contributions
- Competing interests
- Disclaimer
- Special issue statement
- Acknowledgements
- Financial support
- Review statement
- References
- Supplement