the Creative Commons Attribution 4.0 License.
the Creative Commons Attribution 4.0 License.
 | 11 Feb 2025
Investigation of the impact of complex coastline geometry on the evolution of storm surges along the eastern coast of India: a sensitivity study using a numerical model
Ambarukhana D. Rao
Smita Pandey
Vimlesh Pant
We conduct a comprehensive investigation of the generation of storm surges along the coast in response to complex coastline geometry using a standalone advanced circulation (ADCIRC) model. The study deals with sensitivity experiments using various idealized concave and/or convex model domains with the same intensity in terms of parallel cyclone tracks. It demonstrates that a sharp curvature, along with the landfall location of each track within the domain, has more influence on the surge evolution. Peak surges (PSs) are generated in the domain with tracks possessing strong onshore winds, while intense alongshore winds are responsible for PSs spreading along the coast. The time evolution of both positive and negative surges along the coast is also demonstrated. The propagation of energy density per unit length associated with surge waves is computed for concave coasts to explain the funneling effect. Using parallel tracks, the development of PSs is also seen, with actual intricate coastal stretch having concave and convex coastlines along the eastern coast of India, which is consistent with the findings of idealized experiments. Further simulations are carried out along real coastlines, with the different approach angles of the track exhibiting that maximum PSs are not always aligned with the east of the track. Depending on the track angle, PSs may also develop on the western side. Experiments on real coastlines also indicate that peak surge in the concave coastline is more influenced by the cyclone's radius of maximum winds. Surge generation with different radii of maximum winds is seen to the western side of the track, though the cyclone does not experience landfall in this region. Simulation with a recent cyclone, Michaung, reveals that the occurrence of storm tides is also seen to the west of the landfall location as the track moves parallel to the coast, which agrees with the observations. This study shows the importance of the local coastline configuration, particularly for the concave coasts, in relation to the intensification of storm surges.
- Article
(3657 KB) - Full-text XML
- BibTeX
- EndNote


The shape of the coastline, whether concave or convex, significantly influences the generation and propagation of storm surges (SSs) during any extreme weather events, such as tropical cyclones (TCs). Concave coastlines are curved inwards, which tends to focus and funnel SS waters into a narrower channel, amplifying surge heights and their impact on the coastal regions. The concave coastline forces the storm waters to converge as any cyclone approaches the coast, resulting in a buildup of water levels that can cause more severe flooding near coastal areas (Sebastian et al., 2019). On the other hand, convex coastlines, which protrude outwards, can help dissipate the energy of incoming SSs by spreading the water over a wider area. The associated dispersion may reduce the SS's intensity, mitigating its impact on coastal communities. Hence, concave coastlines amplify SS heights, which may pose a greater risk to coastal populations and infrastructure. In contrast, convex coastlines serve as natural buffers, dispersing and reducing the impact of SSs (NOAA, 2022).
There have been many studies in the past on the generation of SSs along the coast, which depends on many factors, such as the cyclone intensity (Zhong et al., 2010; Resio and Westerink, 2008); forward speed (Rego and Li, 2009); Rmax, known as the radius of maximum winds (Peng et al., 2004, 2006); orientation of the coastline (Dube et al., 1982); coastal bathymetry (Johns et al., 1983); width and slope of the continental shelf (Poulose et al., 2017); and angle at which the cyclone crosses the coast (Zhang, 2012). Several earlier researchers developed many numerical models to establish the contribution of various factors to the development of SSs in the Bay of Bengal (BoB) (Das, 1972; Johns et al., 1983; Dube et al., 1994; Rao et al., 1997; Murty and Kolukula, 2023; Pandey and Rao, 2018; Pandey et al., 2021; Tiwari et al., 2024).
Ueno (1981) developed a simplified model, investigated the effect of SS over a curved coastline, and learned that even a slightly curved shoreline produces more SSs than straight coasts. According to Dasallas and Lee (2019), regions with concave coastlines are prone to much higher SSs than a straight coastline of the same topography and bathymetry. It is further revealed that flooding as a result of SSs is more likely to occur if a typhoon approaches perpendicularly compared to if it were to approach parallel to the coastline. Xuan et al. (2021) showed that the SS enhancement is highly dependent upon coastline shape, with flaring (convex) coastlines suffering from higher SSs, mostly when the TCs strengthen into severe cyclones. On the other hand, for the arch (concave) coastline, greater surge enhancement occurs during severe or super typhoons. Hope et al. (2013) found that the translation speed and coastline geometry significantly influence maximum SS heights, with slender bays showing increased susceptibility to extreme SSs from fast-moving hurricanes, while short and wide bays exhibited elevated SS levels during slower storms. According to Qian et al. (2024), the shape of the coast is majorly represented by the bay category, leading to high maximum SS in narrow bays when a TC strikes. For instance, longer and broader bays are prone to higher SSs during slow-TC events. Under certain conditions, square-bay cases showed utterly different behavior compared to open-coast cases, and, as a result, the maximum SS was lowered. Subramaniam et al. (2019) reported that, in the case of convex dikes, the wave run-up is increased at the center as the opening angle increases. Contrarily to this, for concave dikes, wave run-up is enhanced as the opening angle gets narrower. As studied by Van der Meer et al. (2008), the concave curvature may contribute to the accumulation of wave energy, enhancing the wave's run-up and overtopping. The opposite is the case for convex curvature because the distribution of wave energy affects the wave run-up, and overtopping will consequently decrease.
The shape of the coastline is one of the factors which determines the vulnerability of the region due to tsunami and SS waves. The study of Zhao and Niu (2022) highlighted that, when a tsunami wave approaches a concave coastline, it meets with the uniqueness of an environment that irregularly concentrates and redirects the wave's energy. The waves are tightly squeezed in the concave coast, which creates a natural amplifier that makes them higher as they approach the center of the coastline. Salaree et al. (2021) also highlighted how the coast's concave geometry concentrates the tsunami wave amplitudes with idealized bathymetry, consistently with edge wave theory (Munk et al., 1956).
Sebastian et al. (2019) examined the concave-coast features in relation to SS generation through net flux movement computation. A concave-shaped coastline, along with the cyclonic approach angle, defined as the angle between the tangent drawn at the landfall location and the cyclone track measured clockwise, leads to an impact on the concave coast. This contributes to the complicated behavior of non-linear surges in the sites situated along the concave coasts throughout the entire coastline. Pandey and Rao (2019) performed a numerical assessment of hurricane approach tracks of different angles. They unveiled that higher SSs and their interactions with tides and wind waves are associated with the perpendicular cyclone track. Irish et al. (2008) employ numerical simulations to quantify the effect of storm track variations on SSs in different slope areas along the Gulf of Mexico as the northern gulf boundary has a linear coastline oriented east–west. Numerical simulations by Flierl and Robinson (1972) for the northern part of the BoB demonstrated that surge heights depend on the track angle between two perpendicular straight beaches.
Earlier studies were only concerned with SS development along the actual concave coastlines and mostly dealt with the short waves generated by the normal winds. However, no mention is made of the impact of any irregular coastal stretch associated with the cyclonic winds with different approach angles on the generation mechanism of SSs. Limited studies were carried out with concave coastlines, but none were carried out with convex coastlines. Also, past studies suggest that the eastern side of the cyclone landfall is affected mostly due to higher onshore winds, whereas the western side experiences less damage due to offshore winds. However, these studies do not account for surge behavior with the changing curvature of both the concave and convex shapes. A detailed analysis regarding surge generation and its mechanisms in the concave- and/or convex-shaped coastlines is needed for a better understanding of the development of SSs, which is the focus of this study.
The coastline along India's eastern coast covers about 2500 km, with mostly irregular geometries like concave, convex, and straight coastlines of varying horizontal dimensions, as shown in Fig. 2. In the past, several cyclones hit these coastal stretches from different approach angles, such as the Lehar (2013), Helen (2013), Laila (2010), and Ogni (2006) cyclones. Some of the cyclones move parallel to these areas without making any landfall, for example, the Roanu (2016), Jawad (2021), and Andhra Pradesh (1977) cyclones. They can generate significant SSs and associated coastal inundation, particularly on the western side of the track. Hence, this emphasized the influence of complex coastal geometry and cyclone approach angle on the generation of SSs. Owing to its significance, the present study thoroughly investigates the role of different coastal shapes and approach angles (parallel and oblique) in generating SSs over idealized and natural coastlines.
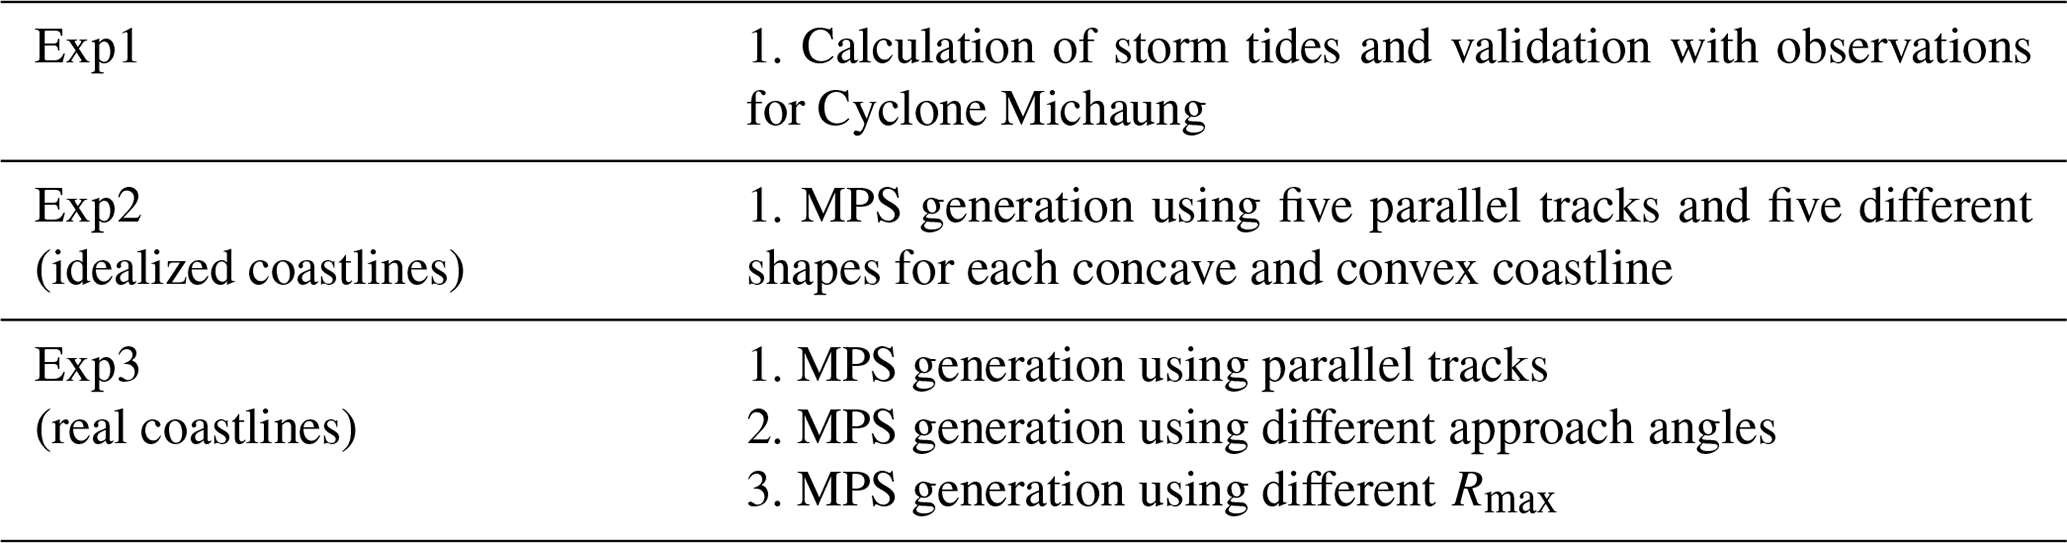
The study examines the evolution of SSs by considering idealized parallel tracks based on the information from the historical cyclone track data over the BoB. The study uses the advanced circulation (ADCIRC) model to analyze peak-surge (PS) trends over various dimensions of concave and/or convex coasts. The experiments are divided into three sections; the first one computes and validates storm tides (STs) for a cyclone, named Michaung (RSMC report, 2023), which experienced landfall in one of the concave regions of the eastern coast of India. The second experiment is a sensitivity analysis based on idealized and different forms of concave and/or convex shorelines, along with parallel cyclone tracks experiencing landfall in these domains. The third part considers the actual shoreline representing the eastern coast of India by considering oblique, perpendicular, and parallel tracks in relation to the landfall location. The present study investigates the surge dynamics, mechanisms, and propagation along the coast for idealized and/or real concave and/or convex coastlines, which is crucial for effective coastal planning, hazard mitigation, and disaster preparedness efforts in vulnerable regions.
Synoptic history of the Michaung cyclone
The Michaung cyclone initially formed as a cyclonic circulation in the south of Thailand on 26 November 2023. Following a westward path, by 1 December 2023, it had strengthened into a depression over the southeastern BoB, as shown in Fig. 1. The cyclone continued its northwestward path, off the coastlines of northern Tamil Nadu and southern Andhra Pradesh, until 4 December 2023. It strengthened further into a severe cyclonic storm (SCS) over the western–central and adjacent southwestern BoB. Later, it experienced landfall as an SCS near Bapatla in the afternoon of 5 December 2023, with maximum sustained winds of 90–100 km h−1. It then moved nearly northwards, parallel and close to the coast of southern Andhra Pradesh. In the North Indian Ocean, Michaung was the sixth cyclone to have formed in the same year, with maximum sustained winds surpassing 55 knots (101 km h−1). A lot of flooding was observed around Chennai due to cyclone-induced precipitation and intense gale winds that hit the coastal regions of southern Andhra Pradesh and northern Tamil Nadu. A maximum SS of about 1.0–1.5 m was observed and flooded low-lying parts of southern coastal Andhra Pradesh. The entire cyclone track covered a long distance of about 1150 km (RSMC report, 2023).
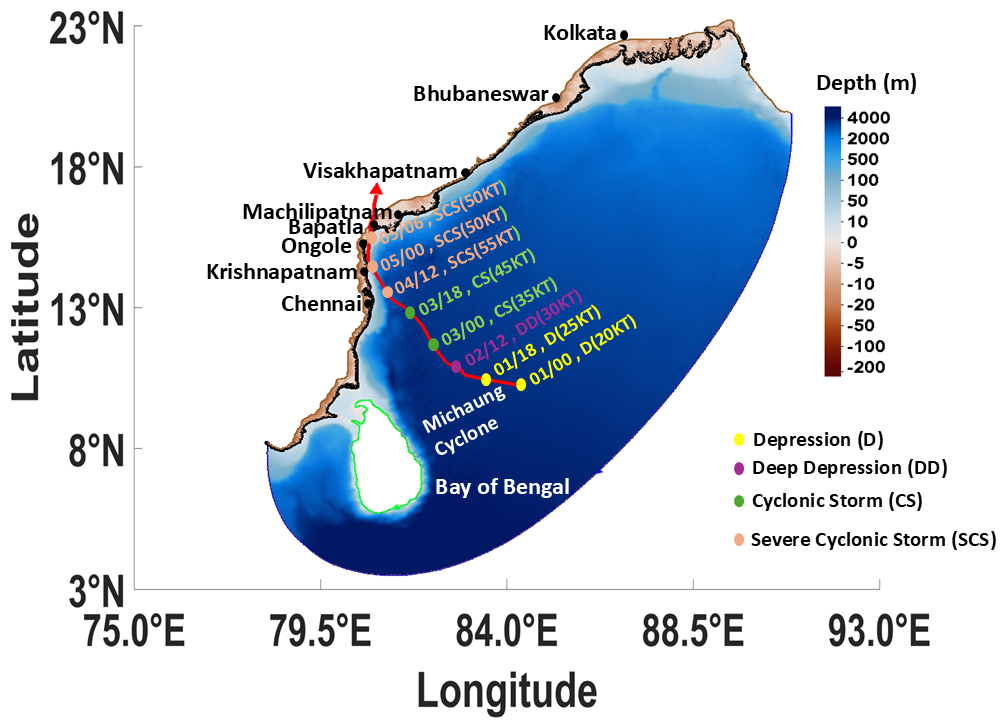
Figure 1Michaung cyclone track and its intensity with time.
2.1 Hydrodynamical surge model
The study utilizes the 2D depth-integrated hydrodynamic advanced circulation (ADCIRC-2DDI) model developed by Luettich et al. (1992) and Kolar et al. (1994). Luettich et al. (1992) provided a detailed explanation of the ADCIRC-2DDI hydrodynamic model. More information about the model can be found at https://adcirc.org/home/documentation/users-manual-v50/ (last access: 9 February 2025). The momentum and continuity equations of the ADCIRC-2DDI model are solved on an unstructured grid using the Galerkin finite-element method. The model solves the generalized wave continuity equation (GWCE) to determine the maximum water elevation and the vertically integrated momentum equation for the currents. The model's governing equations are approximated using Boussinesq, incompressibility, and hydrostatic pressure. The ADCIRC incorporates boundary conditions such as normal flux per unit width and free-surface elevation from different tidal components at the open boundary.
The model employs a hybrid bottom friction formulation with a minimum drag coefficient of 0.0015 to compute SS; the chosen value is due to model stability. The duration of the ramp function for all simulations is around 1 d. The weighting factor (τ0) in GWCE is 0.05, according to Pandey and Rao (2018), while the eddy viscosity is 2 m2 s−1, as reported by Cyriac et al. (2018). τ0 weighs the relative contribution of the primitive and wave portions of the GWCE. The ramp function simply scales the applied forcing, making it a unitless value that varies from 0 (no forcing) to 1 (full forcing). The detailed formulation for the hybrid friction is mentioned in Luettich et al. (1992). The drag coefficient, ramp function, and weighing factor are dimensionless. The simulations utilize the wind drag formulation proposed by Garratt (1977).
2.2 Holland wind module
Wind stress and horizontal variations in surface air pressure primarily produce SSs. The inverse barometric effect results from the impact of changing air pressure on the sea surface. The sea level rises by 1 cm for each hectopascal (hPa) decrease in atmospheric pressure. The wind stress on the sea surface leads to a notable fluctuation in sea level, influenced by the maximum wind speed and geographic distribution of winds (Ross, 1854). The study uses a cutting-edge wind module (Holland et al., 2010, cited as H10) as an input in the model to compute horizontal cyclonic winds. H10 is a revised, more advanced version of the earlier model by Holland (1980), known as H80, that uses an improved estimation of the wind speed and wind direction near the cyclone eye, optimizes the information that is essential to determine the Rmax, resolves bimodal wind profiles, and provides a higher spatial resolution for a more precise assessment of the wind parameters in TCs. Murty et al. (2020) used the H10 wind module in the hydrodynamic and wave model in the BoB.
3.1 Experiments using Cyclone Michaung (Exp1)
In the first set of experiments (Exp1), the recent cyclone of Michaung, which experienced landfall in the same region, is considered. The information for the cyclone is taken from the IMD's best-track data (https://rsmcnewdelhi.imd.gov.in/report.php?internal_menu=MzM=, last access: 2 August 2024). The INCOIS website provides the tide gauge data used in this study (https://incois.gov.in/portal/datainfo/drform.jsp, last access: 9 February 2025). In Exp2 and Exp3, the tides are not considered in the model; however, in Exp1, the tides are simulated in the model to compute storm tides (STs) during the Michaung cyclone period. The model uses 13 tidal constituents (K1, M2, N2, O1, P1, S2, K2, L2, 2 N2, MU2, NU2, Q1, and T2) at the open boundary, extracted from the Le Provost tidal database (Le Provost et al., 1998) for the simulations of tides. With these configurations, model simulations are performed with a standalone ADCIRC model to compute SS. However, we are interested in plotting maximum SS at any location during the cyclone period, denoted here as PS. Among all PS values along the coast, the maximum PS is referred to as the MPS.
3.2 Experiments using idealized coastline (Exp2)
The eastern coast of India has a very irregular coastline consisting of concave, convex, and straight coastlines, as shown in Fig. 2. To understand the effect of concave, convex, and straight coastlines on the generation of SSs, the concave-shaped coastline near Machilipatnam is selected for the study as this area is frequently affected by SSs. The bathymetry of the region also follows a concave-shaped coastline.
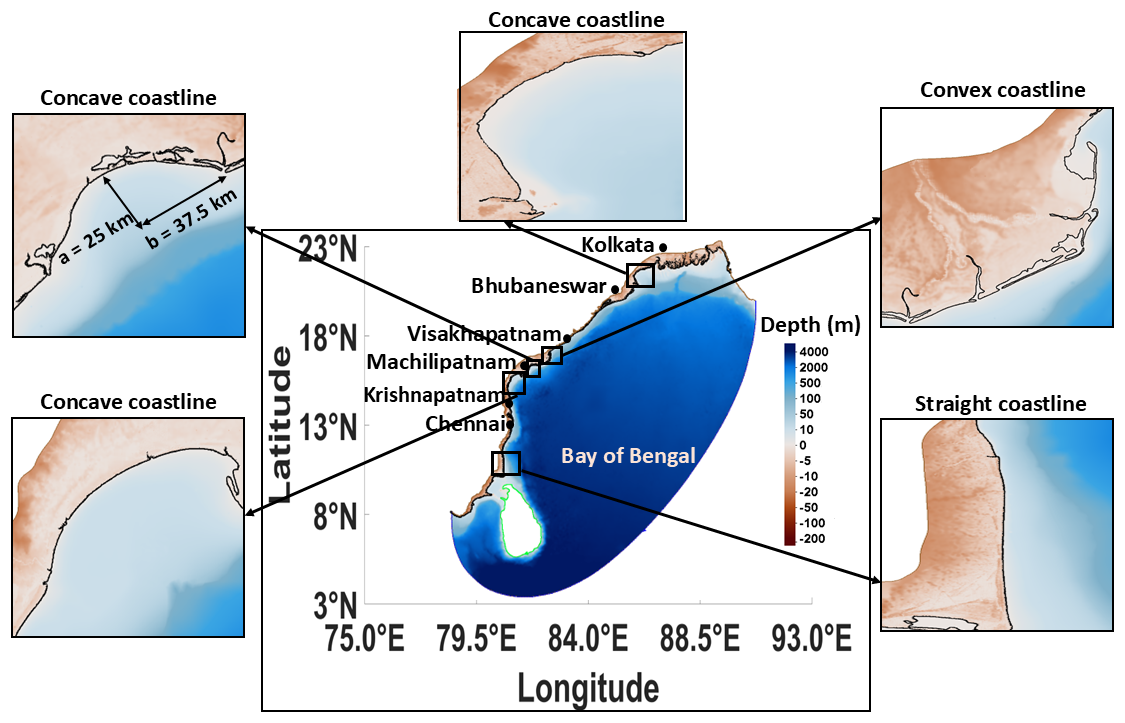
Figure 2Model domain, along with different coastline geometry (zoomed).
For the experiments (Exp2), different ellipse-shaped concave and convex meshes are designed with distinct a and b values, as shown in Fig. 3. Each designed shape has different a and b values compared to the actual one because a and b values are very small along the actual coastline. Therefore, domains of concave and/or convex shapes are designed based on the use of diverse a and b values. Figure 3ii–vii represent different concave shapes, with a=50, 100, 150, 200, 250, and 300 km, respectively, retaining the same value of b=150 km. These shapes are named CC1, CC2, CC3, CC4, CC5, and CC6, respectively. Similarly, Fig. 3viii–xiii represent a convex shape, with a=50, 100, 150, 200, 250, and 300 km, respectively, keeping the same b=150 km. These shapes are named CV1, CV2, CV3, CV4, CV5, and CV6. Figure 3xiv shows the straight-coastline domain. All the above concave and convex domains represent the ellipse shape, where b acts as the semi-major axis and a acts as the semi-minor axis until a=150 km (circular shape), after which a becomes the semi-major axis and b becomes the semi-minor axis.
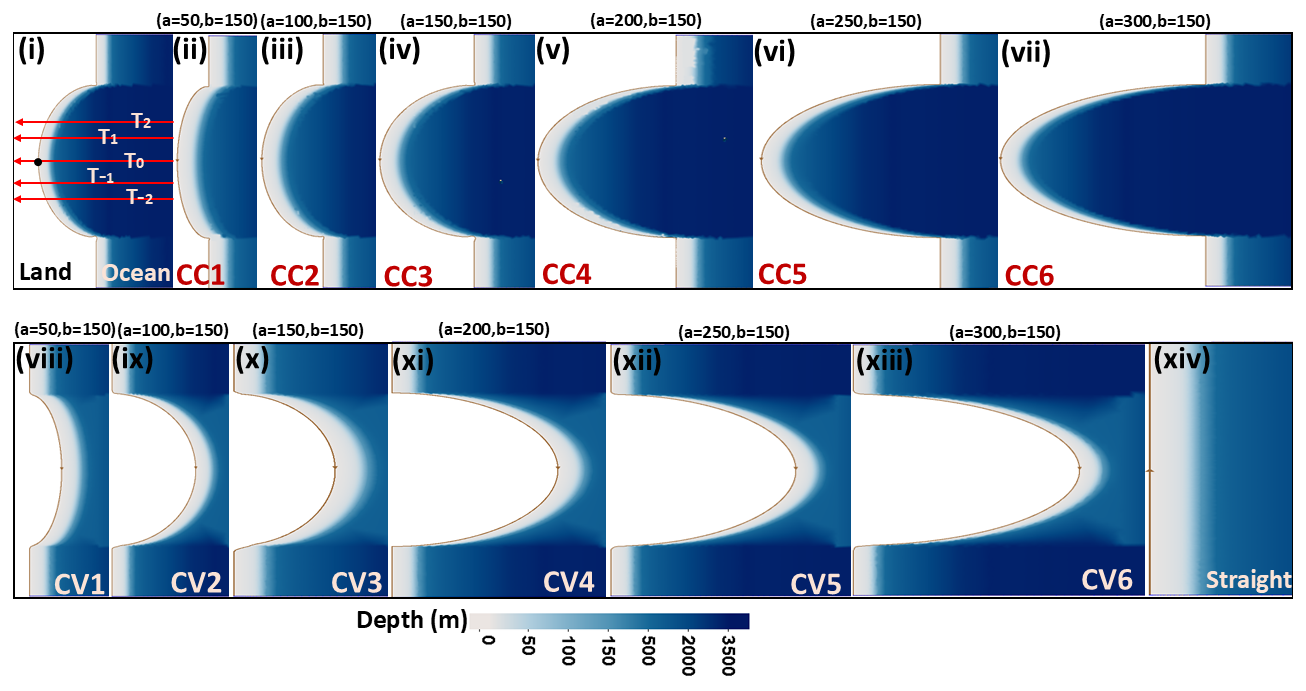
Figure 3(i) Parallel tracks used in the study. Black dot (•) represents the vertex of the domain. (ii–vii) Shapes of idealized coastlines considered for concave (CC1–CC6), (viii–xiii) convex (CV1–CV6), and (xiv) straight coastlines.
A total of 13 meshes are created (six for concave, six for convex, and one for straight coastline) using the surface water modeling system (SMS) application (http://www.aquaveo.com/products, last access: 9 February 2025), with a maximum resolution of 200 m near the coast and 15 km in the open ocean. The bathymetry of the domain is generated using a constant continental shelf width of about 50 km, which is an average value for the region. The depth contours follow the coastline, with a maximum depth of 3500 m in the open ocean. As shown in Fig. 3i, five idealized parallel cyclone tracks are considered, with a maximum pressure drop of 50 hPa. The translational speed of all cyclone tracks is maintained at about 13 km h−1, which is the average speed of a cyclone observed in this region based on past historical data. The wind field for each track is calculated by taking a constant radius of maximum (Rmax) winds of 30 km, based on observations of the past cyclones in this region (Mohapatra and Sharma, 2015; Sharma and Mohapatra, 2017). These tracks are named T0 for the center, T1 and T2 for the tracks experiencing landfall 30 and 50 km north of the center, and T−1 and T−2 for the tracks experiencing landfall 30 and 50 km south of the center track. All the tracks experience landfall at the same time (at the 48th hour). The curvature of the mesh increases from west to east for both the concave- and convex-shaped coastlines, as shown in Fig. 3ii–xiii.
Calculation of angles with respect to maximum-peak-surge (MPS) location based on the shape of the domain
The shape of the domain is represented by an ellipse, which is given by
where a is the semi-major axis, and b is the semi-minor axis. If b becomes the semi-major axis and a becomes the semi-minor axis, the equation remains the same. Then, the equation of a tangent angle in relation to an ellipse is given by
where (x1,y1) is any point on the ellipse above the semi-major axis, as shown in Fig. 4, and, in this case, the angle is positive. Similarly, the corresponding angle will be negative if a point is considered to be below the semi-major axis.
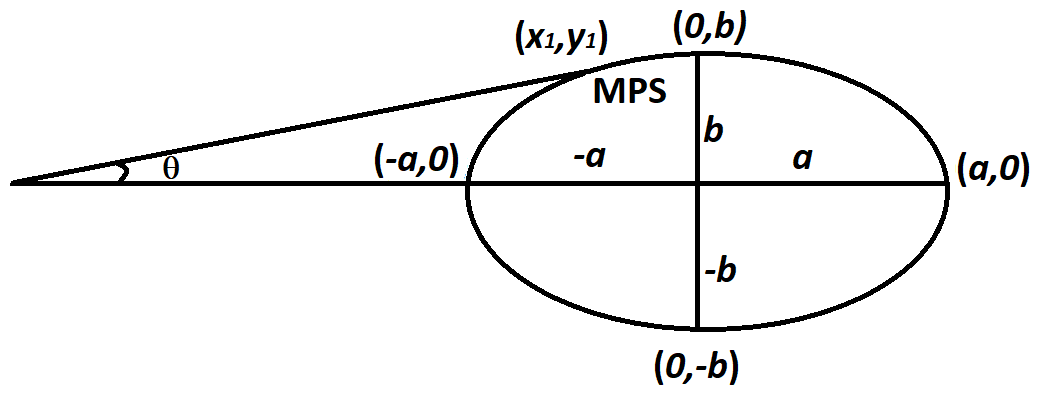
Figure 4Angle of a tangent (θ) in relation to an ellipse at the point of maximum peak surge (MPS).
3.3 Experiments using real coastline (Exp3)
In the last set of experiments (Exp3), the model domain incorporates actual coastline geometry and the prevailing bathymetry, which is complex in nature, including coastal water features (river channels, lakes, etc.). The analysis area for this experiment only covers 15° N and 80° E to 16.50° N and 82° E along the eastern coast of India, as shown in Fig. 2. The domain mesh uses several digital elevation models (DEMs) (airborne, CARTO2, and SRTM30) and bathymetry datasets (ETOPO-2 and MIKE-CMAP) (Mandal et al., 2020), as in Exp1.
The model's landward boundary is considered for up to 10 m of contour from the shore, assuming the surge never exceeds 10 m topography. The mesh has a high resolution of about 100 m near the coast and of 18 km in the open ocean. Since the study focuses only on the generation of surges at the coastline, the computation of associated coastal inundation is not a part of this study. Therefore, the land is masked to counteract the impact of river openings or the presence of other waterbodies. For the sensitivity experiments, cyclones of parallel, oblique, and straight tracks are considered to have the same intensity as in the previous experiment. Refer to Table 1 for the detailed set of experiments used in the study.
4.1 Computation of storm tides for the Michaung cyclone
In the Exp1, maximum STs are computed for the Michaung cyclone by considering tides in the model during the cyclone period, as shown in Fig. 5i. The amplitude of the local tide coincides with the spring tide at Krishnapatnam, which is observed to be about 0.5 m (not shown in the figure) at the time of the cyclone's crossing of this region. It is observed that the STs are simulated along the coast on both the western and eastern sides of the track as the cyclone moves northwards, parallel to the southern coast, before its landfall. The ST of about 1.6 m is computed on the eastern side of the track on the concave-shaped coast near Bapatla. Moreover, STs of 1.25 m are also generated along the coast near Ongole on the western side of the track. The STs of 1.0 m are also seen along the coast near Diviseema.
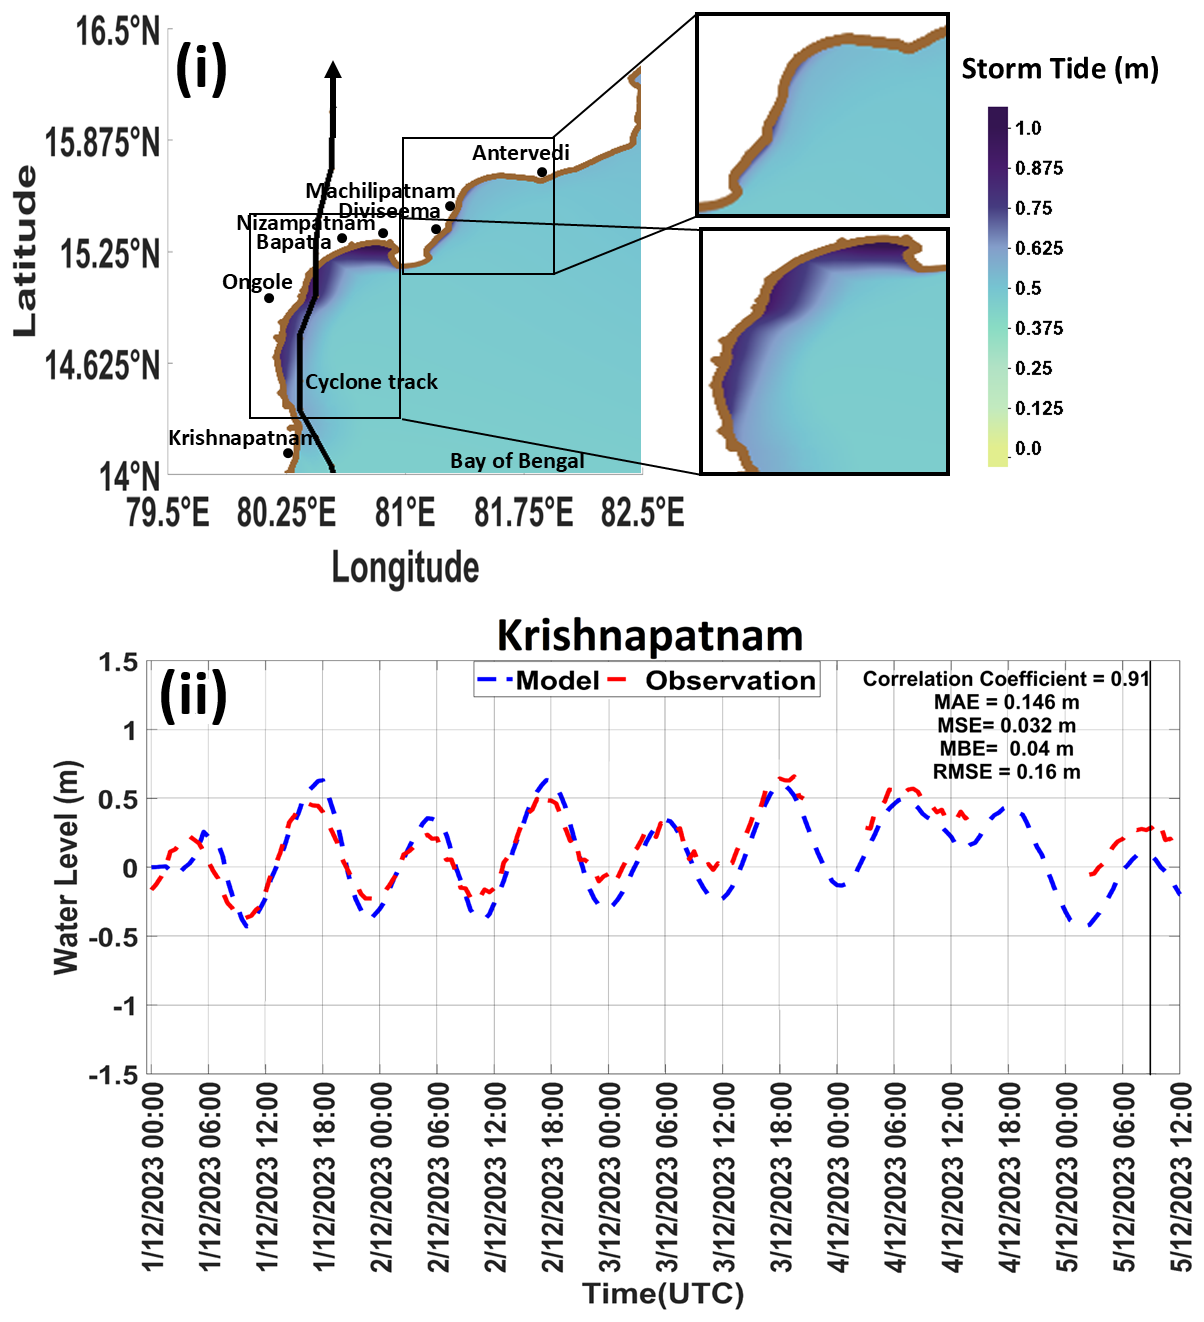
Figure 5(i) Model-computed maximum storm tide for the Michaung cyclone. (ii) Comparison of model and tide gauge data at Krishnapatnam. Vertical black line represents landfall time.
Validation of the model-simulated ST is conducted with the only available tide gauge data at Krishnapatnam, which falls to the west of the cyclone track, located about 30 km from the track and 160 km from the landfall point, as shown in Fig. 5i.
As shown in Fig. 5ii, at Krishnapatnam, the maximum STs from the model and tide gauge are noted as 0.63 and 0.66 m, respectively, occurring 36 h before landfall. On the other hand, the ST values are reduced at the time of landfall to 0.08 and 0.28 m, respectively. However, the simulated maximum ST at Krishnapatnam is qualitatively in agreement with that of the tide gauge observations. The computed correlation coefficient, mean absolute error (MAE), mean square error (MSE), mean bias error (MBE), and root mean square error (RMSE) are 0.91, 0.146, 0.032, 0.04, and 0.16 m, respectively. Though some gaps in the tide gauge data are seen, no missing data are found during the maximum ST or landfall time. The reason for the generation of lower STs may be due to the location of Krishnapatnam, located to the west of the cyclone track, which was mostly influenced by the offshore winds during the cyclone period. This experiment confirms the hypothesis that the concave coasts are always subjected to more vulnerability in terms of SSs whenever a cyclone approaches, irrespective of whether the coast is to the east or west of the cyclone track.
4.2 Peak-surge generation with parallel cyclone tracks in the idealized domains
Numerical simulations are carried out without tides using different parallel cyclone tracks, as described for Exp2, to delineate their effect on the generation of SSs in the concave and/or convex domain. The model is integrated for 3 d, out of which the cyclone experiences landfall after 2.5 d. Figure 3i shows the computational domain, along with five idealized parallel cyclone tracks experiencing distinct landfalls within the domain. In this study, parallel tracks (T−2 to T2) are considered, and the central track, T0, experiences landfall at the vertex of the domain. The distributions of PS while moving from track T−2 (south) to track T2 (north) within the same domain and between differently shaped domains are depicted in Fig. 6.
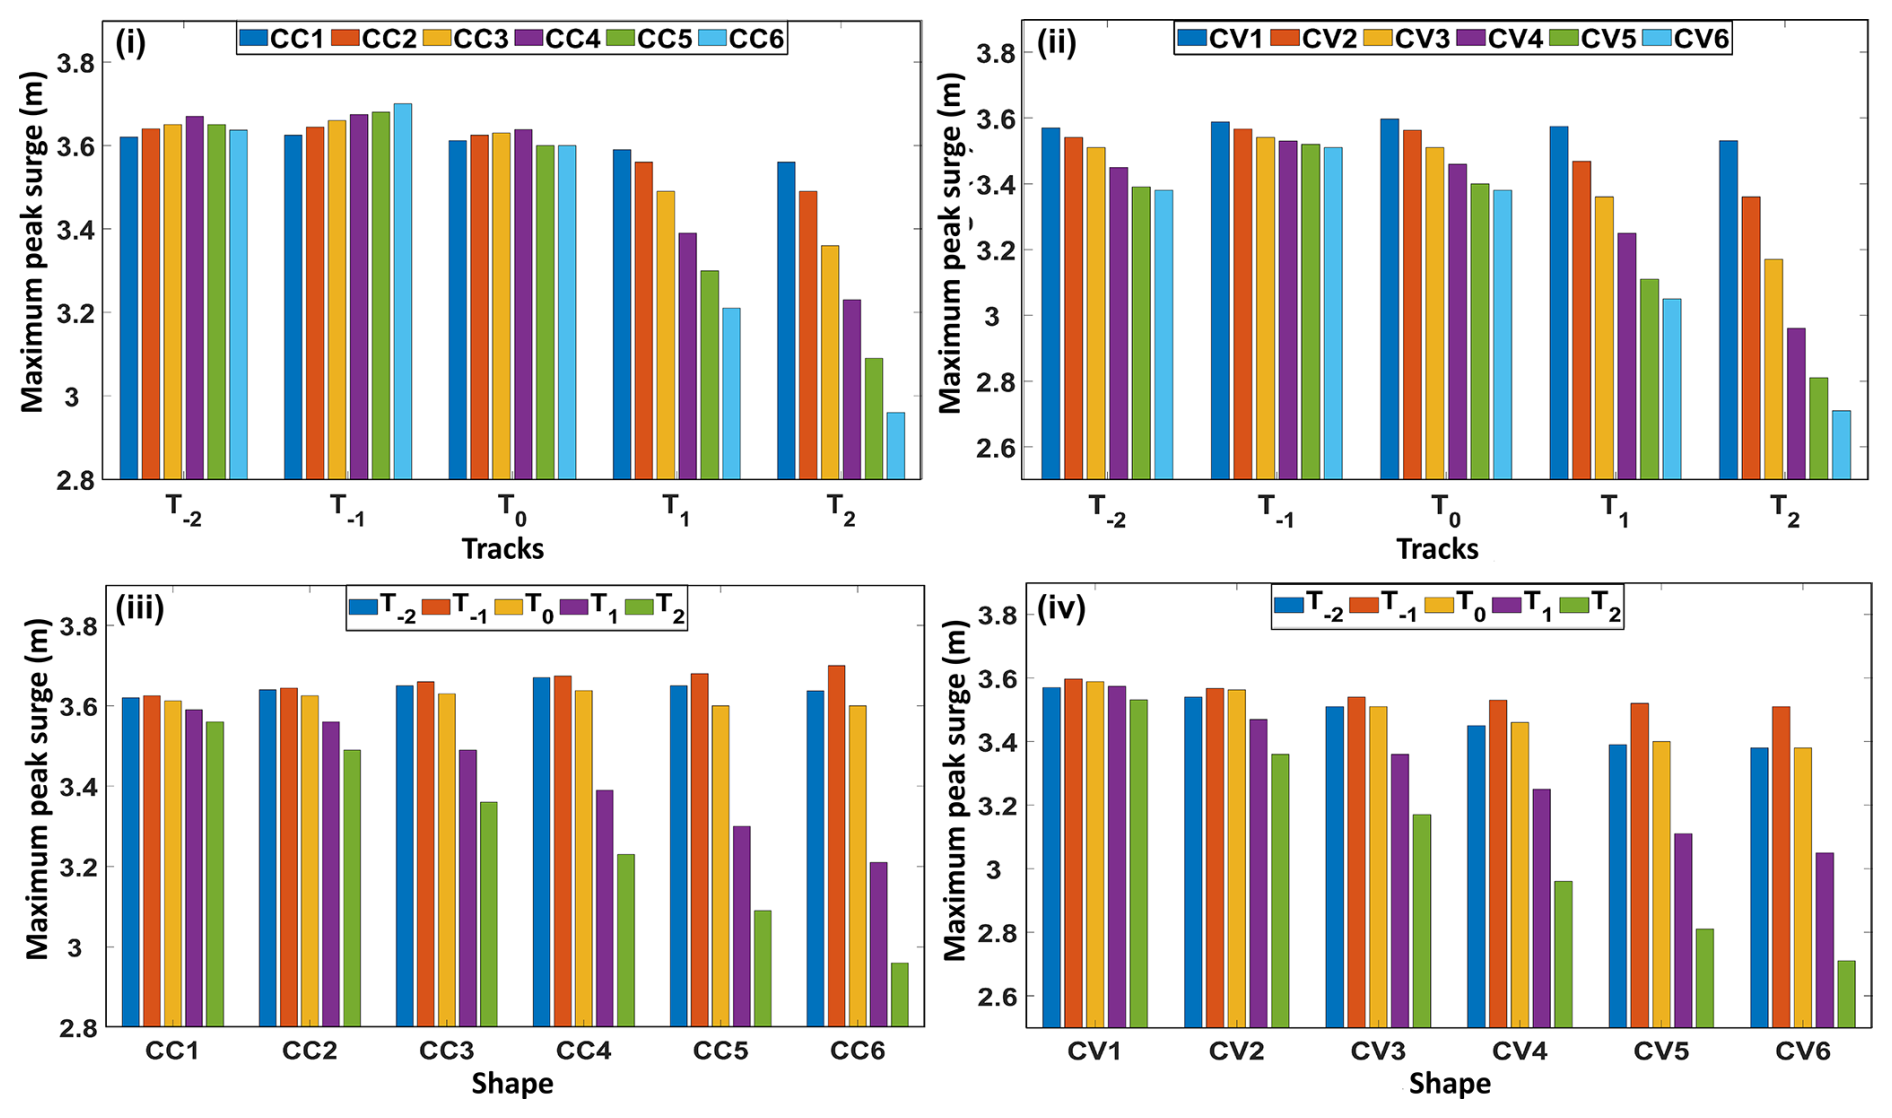
Figure 6Generation of maximum peak surge (MPS) for all the cyclone tracks for (i) concave and (ii) convex coastlines and due to different tracks within the (iii) concave and (iv) convex curvatures.
The computed MPSs for different concave domains are shown in Fig. 6i. For the track T−2, the value of the MPS does not vary much for different concave shapes (CC1 to CC6), and a maximum difference of only 0.04 m is observed. There is an increasing trend in the MPS for the track T−1 as the curvature of the domain increases from CC1 to CC6, with a maximum difference of 0.075 m. On the other hand, for the central track T0, the value of PS increases up to CC4 and then decreases marginally. It is noticed that the trend is seen to decrease linearly with the increase in the curvature of the domain from track T−2 to track T2.
The maximum difference in the MPS between CC1 and CC6 is computed to be about 0.38 and 0.60 m for the tracks T1 and T2, respectively. The decrease may be attributed to the curvature of the coastline, which becomes more convergent from CC1 to CC6. This indicates that, as the cyclone track and the landfall position move northwards from the vertex or center of the concave coast, the MPS value decreases in correspondence with the increasing convergence. Further investigation is done in this regard and is explained in the subsequent sections.
Figure 6ii shows the MPS trends for different convex domains. It is noted that there is a linear decreasing trend in PS from CV1 to CV6, and the decrease is substantial as the curvature increases. The maximum differences in MPS values between CV1 and CV6 range from 0.02 to 0.83 m for tracks T−2 to T2. It is observed that, if the curvature of the convex shape increases, the MPS values for a particular track decrease significantly. This also underscores the influence of coastline shape and landfall position on surge computation. Furthermore, these simulations quantify the behavior of the MPS distribution for both concave and convex shapes.
Figures 6iii–iv depict the tendency of the MPS within the concave and convex domains, respectively, as the tracks move from south to north (T−2 to T2). For all the concave and/or convex curvatures, the MPS initially increases from T−2 to T−1, which is followed by a decrease. However, the MPS is noticed at T−1 in both shapes, though it is more apparent for the concave coast, being that it is a convergent type. The value of the MPS varies from 3.62 to 3.7 m for CC1 to CC6, while it ranges from 3.60 to 3.51 m for CV1 to CV6, as depicted in Fig. 6iv. The reason for simulating a higher MPS for T−1 may be due to the value of Rmax that lies at the vertex of the curvature as it provides maximum winds in this region. For the straight coastline (not shown here), the MPS is simulated at about 3.6 m, which falls mostly between the concave and convex values. From the above analysis, it is noted that there is not much difference in terms of the MPS computed for CC1 as the track moves from south to north. However, the difference increases as the curvature increases for both concave and convex shapes. The maximum differences in the MPS between parallel tracks (T−1 to T2) within the CC1 to CC6 domains are 0.07, 0.14, 0.30, 0.44, 0.59, and 0.74 m, respectively. For the convex-coastline domains, CV1 to CV6, these values are 0.07, 0.20, 0.37, 0.57, 0.71, and 0.80 m. In general, the values of the MPS increase as concave curvature increases because of the accumulation of more wave energy towards the coast. On the other hand, energy gets distributed or dissipated on the convex coast with increasing curvature, which results in a lower MPS along the coast.
This analysis is further explained using a tangent angle at the location of the MPS, which usually coincides with the location of maximum sustained winds along the coast based on the value of Rmax. The detailed calculation of the angle corresponding to the location of the MPS for each track and shape of the domain is explained in Fig. 4. Tables 2 and 3 provide tangent angles corresponding to the location of the MPS generated by various tracks against each domain. Table 2 shows that the difference in the angle between T−1 and T2 increases as the domain curvature increases from CC1 to CC6, while the angle (negative) decreases for the track T−2. A similar observation is also made for the convex domain, as given in Table 3.
Table 2Maximum peak surge along with the tangent angle at Rmax for the different tracks for the concave shape.
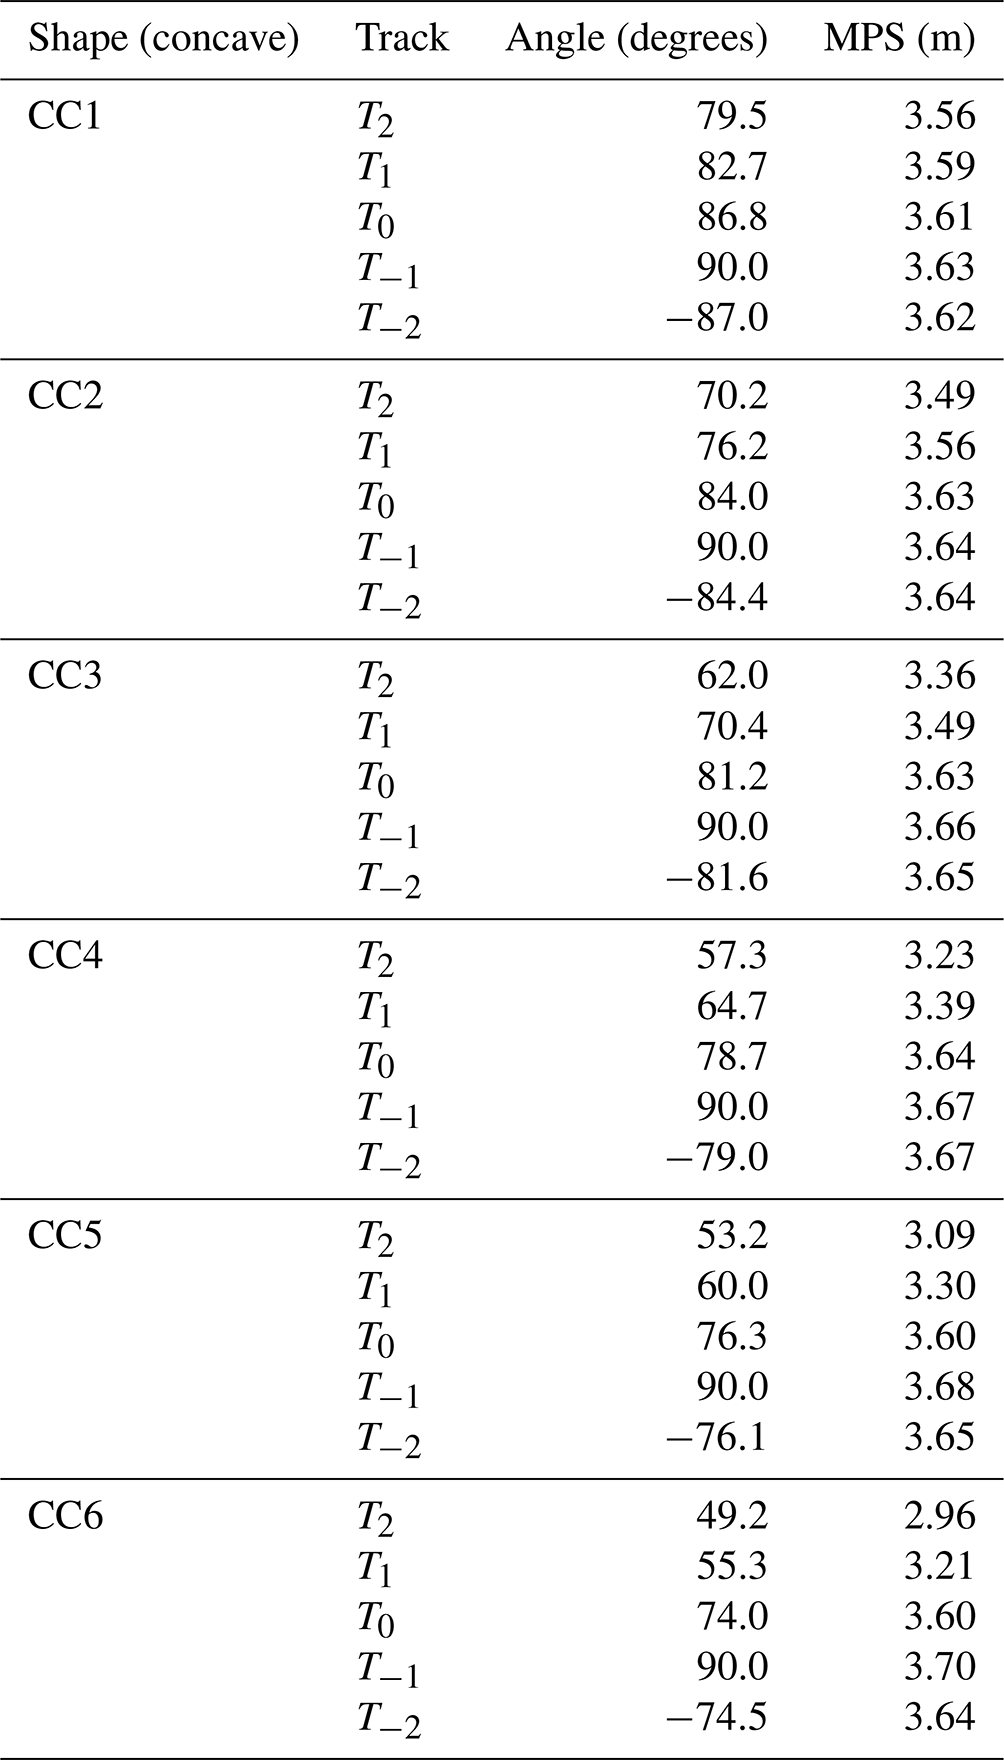
Table 3Maximum peak surge along with the tangent angle at Rmax for the different tracks for the convex shape.
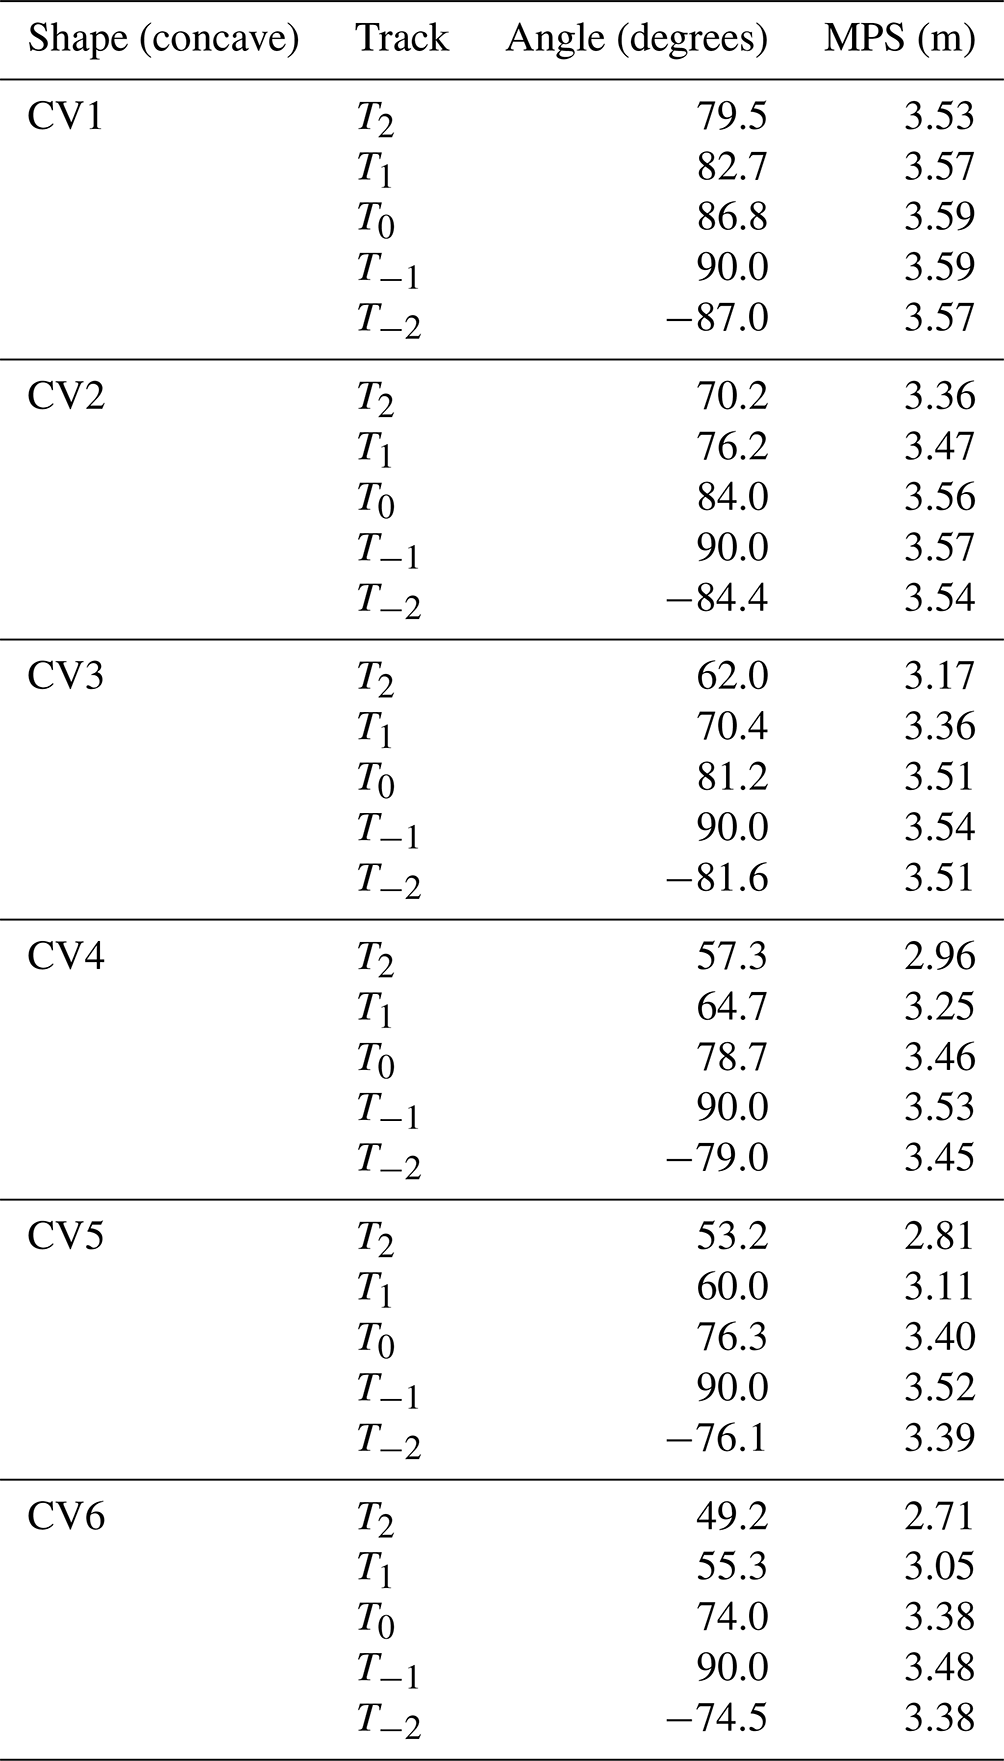
These angles have a significant effect on the generation of the MPS, as shown in Tables 2 and 3. It is noted that the maximum-curvature domain (CC6) produces different MPS values for different tracks (T−2 to T2) compared to that of the minimum (CC1). This leads us to infer that the curvature of the coast plays a significant role in the generation of PSs, along with the landfall location of the track in the domain. To understand further whether this angle is also responsible for the spread of PSs, the spatial distribution of PSs along the coast during the cyclone period is shown in Fig. 7 for the domains CC1–CC6 and CV1–CV6 as these two domains represent the minimum- and the maximum-curvature domains. It is noted that the lowest spread of PS is seen at the vertex of the domain when the angle is at its maximum (θ=90°) and is more as the theta decreases on either side of it. This leads us to infer that the spread along the coast increases as the curvature of the domain increases.
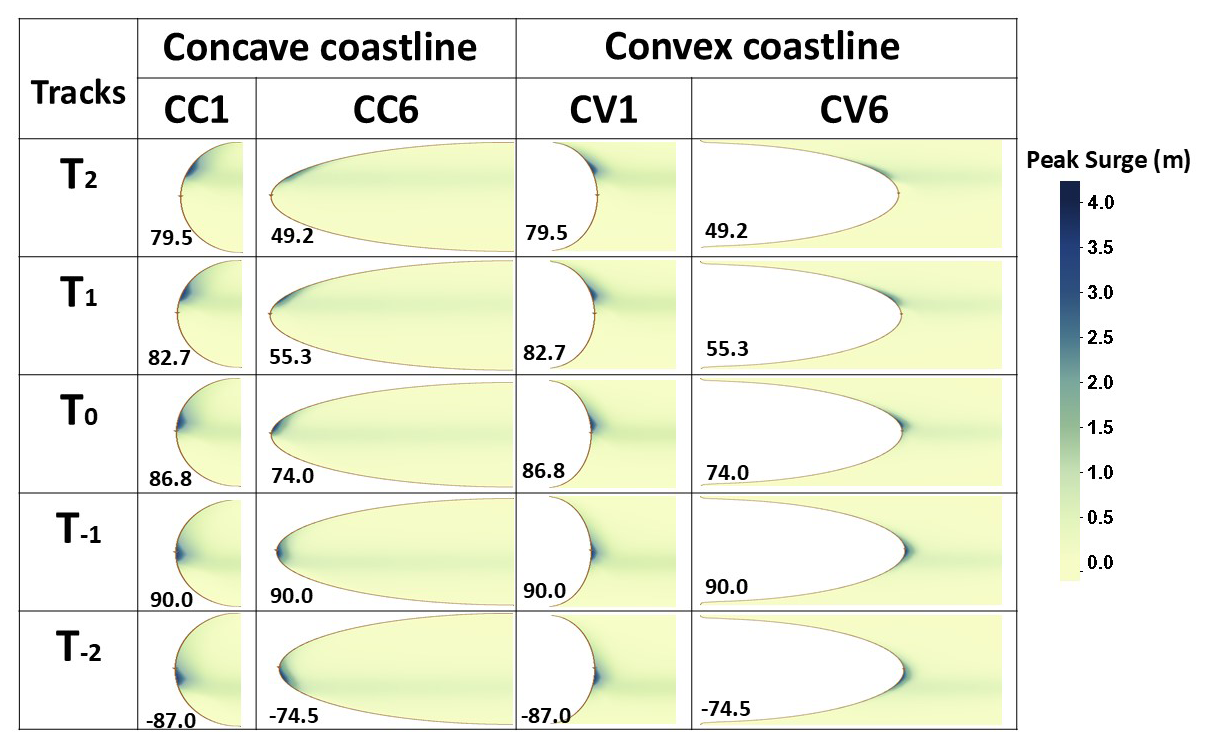
Figure 7Peak surge generated along the coast for two distinct shapes of concave (CC1 and CC6) and convex (CV1 and CV6) coastlines. Numbers inside the plot represent the tangent angle (θ) in relation to the location of peak surge.
4.3 Onshore and alongshore winds
As cyclone winds are the primary forcing for the generation of SSs, it is important to investigate the wind distribution along the coast with reference to each curvature of the domain. For this, wind components onshore and alongshore are estimated at the location of the MPS, along with how these components vary due to differently shaped concave and convex coasts. These components provide insight into PS and its distribution along the coast. Storm waters are driven towards the coast by onshore winds originating at sea. Due to the accumulation of water caused by these winds along the coast, PS is enhanced. However, the alongshore wind component influences the distribution or spread and direction of water movement along the coast. Hence, the onshore wind plays a vital role in developing SS at the coast, while the alongshore wind is responsible for the spread of surges along the coast. Figure 8 represents the temporal variation of the onshore and alongshore wind components for the domains CC1, CC6, CV1, and CV6 as calculated at the location of the MPS. From Fig. 8, it is noted that, in general, the onshore wind increases as the cyclone approaches the coast. The negative sign represents the onshore wind towards the west (positive towards the east) and the alongshore wind towards the south (positive towards the north). At the time of landfall, the onshore winds for CC1 are −45.1, −49.0, −48.2, −47.7, and −46.7 m s−1, and the alongshore wind is −25.0, −15.0, −14.3, −15.7, and −23 m s−1 for the tracks T−2, T−1, T0, T1, and T2, respectively. Similarly, CC6 experiences onshore winds of −49.2, −52.3, −46.0, −40.0, and −32.4 m s−1 and alongshore winds of −15.0, −4.0, −22.0, 27, and 40.4 m s−1 for the tracks T−2, T−1, T0, T1, and T2. The onshore wind decreases and the alongshore wind increases from track T−2 to T2 for CC6, which is consistent with the MPS (refer to Fig. 6), as depicted in Fig. 8. Although the maximum wind speed of 54 m s−1 of the cyclone is used for all the tracks, the generation of SS depends upon the strength of the onshore wind at the time of landfall, which varies with the curvature. For the convex domain (CV1), there is not much change in the onshore wind for all the tracks, which is the same as for CC1.
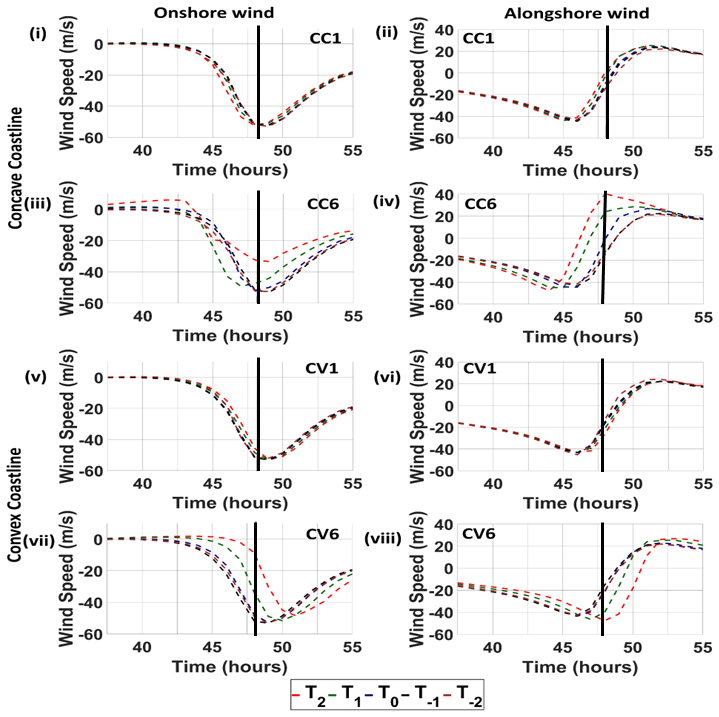
Figure 8Time series of onshore and alongshore cyclonic wind components for (i, ii) CC1, (iii, iv) CC6, (v, vi) CV1, and (vii, viii) CV6. Vertical black line represents the landfall time.
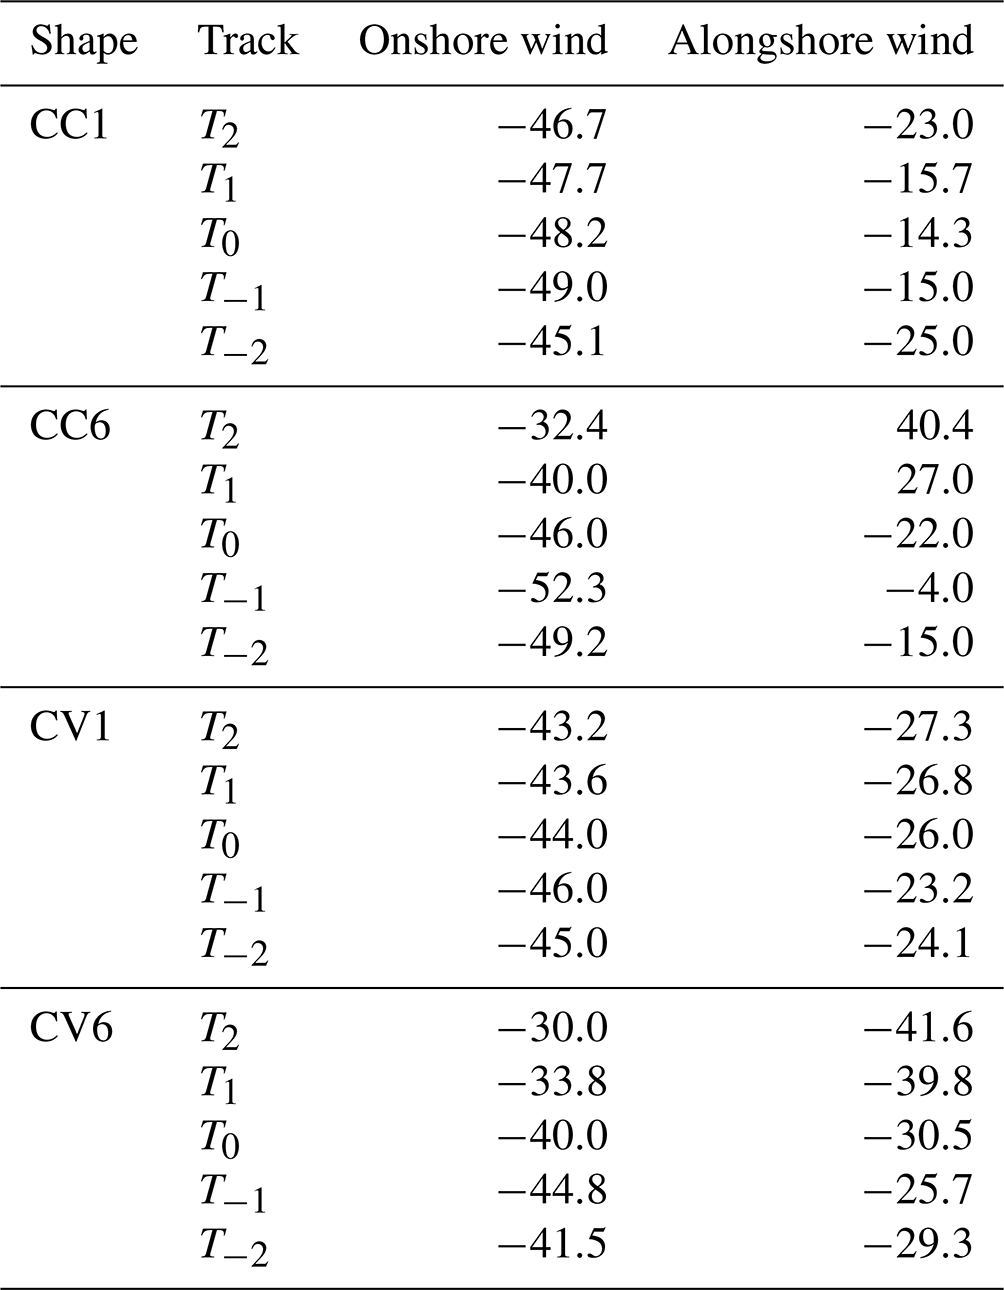
However, the change becomes significant as the curvature increases, as shown in Fig. 8vii. At the time of landfall, the onshore winds for CV1 are −45.0, −46.0, −44.0, −43.6, and −43.2 m s−1, and the alongshore wind is −24.1, −23.2, −26.0, −26.8, and −27.3 m s−1 for the tracks T−2, T−1, T0, T1, and T2, respectively, as shown in Fig. 8v–vi. Similarly, CV6 experiences onshore winds of −41.5, −44.8, −40.0, −33.8, and −30.0 m s−1 and alongshore winds of −29.3, −25.7, −30.5, −39.8, and −41.6 m s−1 for the tracks T−2, T−1, T0, T1, and T2, as shown in Fig. 8vii–viii and Table 4. Similarly, the onshore wind does not change much for CV1, but it experiences significant changes for CV6. From all the cases discussed above, the maximum onshore wind is noticed for track T−1 as the Rmax coincides with the vertex of the curvature. Hence, the occurrence of the MPS is observed for track T−1. It is also noted that the distribution of PS along the coast increases as the alongshore wind is enhanced, which is evident from Fig. 7.
Table 4Onshore and alongshore wind for different tracks for the shapes CC1, CC6, CV1, and CV6.
4.4 Generation of positive and negative surges along the coast
Figure 9i–xx describe the generation of positive and negative surges along the coast during the cyclonic period for the shapes CC1, CC6, CV1, and CV6 for all the tracks from T2 to T−2.
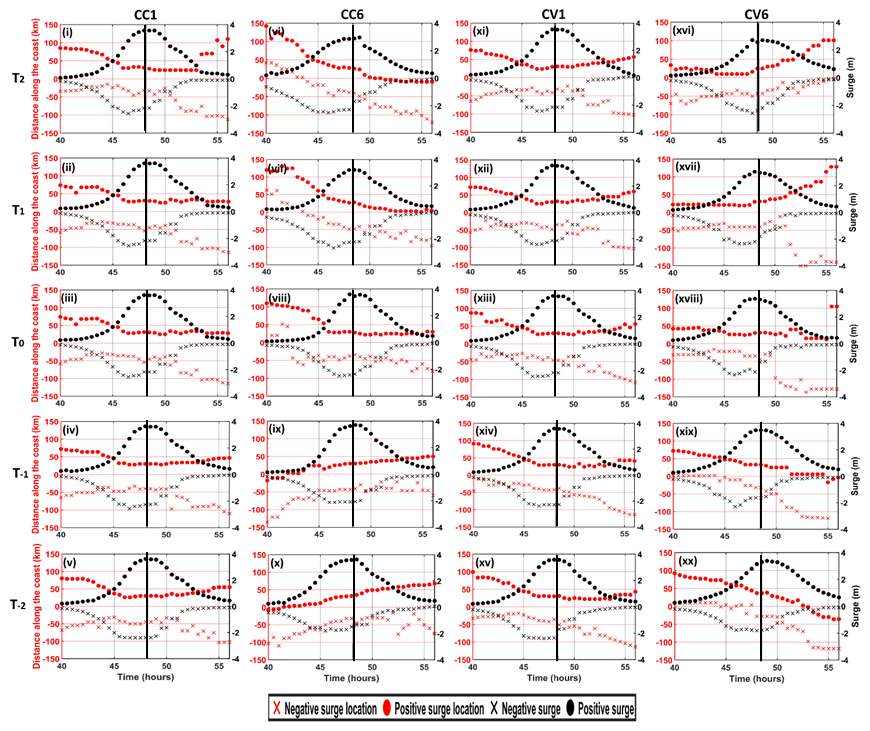
Figure 9Time of occurrence of surges along the coast with reference to the landfall location for CC1, CC6, CV1, and CV6 for all the tracks. Vertical black line represents the landfall time.
Figure 9i–xx show that the distance along the coast is considered with reference to the landfall location, implying positive values on the right and negative values on the left, along with the surge values. The left y axis (red) indicates the landfall location of the cyclone track, and the right y axis depicts the surge value. Figure 9i–v describe surge development for CC1 for all tracks. It is observed that the positive surge occurs close to the landfall on the right side, while the negative surge on the left is generated about 2 h prior to the landfall time. A similar observation is made based on Fig. 9vi–x for CC6. The simulations for different concave coasts (CC1–CC6) suggest that the positive surge decreases for the tracks from T−2 to T2, while the negative surge increases. This can be attributed to the reduction in available domains on the eastern side of any track in CC6 required to drag water masses by means of the onshore winds towards the coast, as considered for T−2 to T2.
As seen from all the simulations for CC6, it is observed that the maximum surge along the coast always propagates towards the center or vertex of the curvature. In the case of convex coasts (CV1–CV6), the surges generated along the coast, in general, diverge or spread from the vertex of the curvature. As the curvature increases from CV1 to CV6, a reduction in PS is seen for all the tracks because of lower onshore and higher alongshore winds (refer to Fig. 8v–viii). The onshore winds are responsible for the accumulation of surge waters towards the concave coasts, while the alongshore winds are responsible for the divergence or spreading of the waters along the convex coasts.
4.5 Computation of energy density per unit length of a surge wave in the concave coast
As observed from the earlier simulations, the value of PS in the concave domain increases as the SS waves are propagated towards the coast. The increase in SS can be related to an increase in the corresponding energy flux in the domain. If the shape of the domain becomes narrower and shallower away from the sea, the surge will increase in the domain. This may be known as the funneling effect. If we neglect frictional losses, the wave energy flux will theoretically remain constant as the wave progresses upwards in the domain, and the wave energy density is given by:
where A is the amplitude of the surge wave, ρ is the density of the water, and g is the acceleration due to gravity. The energy density per unit length of the domain is given by EB, where B is the width of the domain. Then the energy flux in the domain given by EBc will be constant (c being the phase speed or energy propagation speed in the shallow water), i.e.,
where h is the depth.
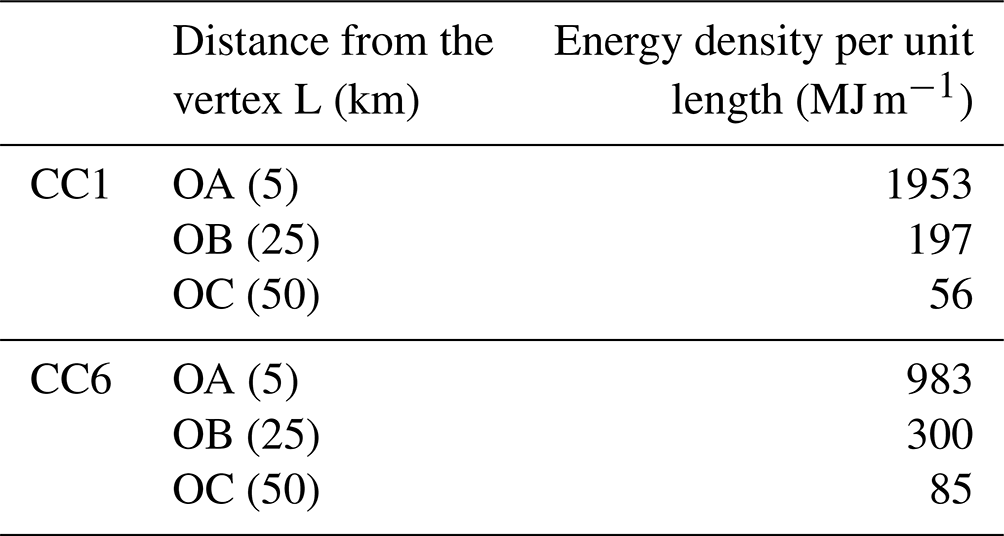
Energy density per unit length EB is computed for the concave coasts of CC1 and CC6, as shown in Fig. 10i and ii, using the computed PS (A) at each grid multiplied by the grid resolution (B) for the track T0. It is observed that the maximum EB values of 60 and 58 MJ m−1 are computed near the coast for CC1 and CC6, respectively, at the time of the MPS. As seen in the figure, the integrated value of EB is computed across the lines AA′, BB′, and CC′, falling 5 km (LA), 25 km (LB), and 50 km (LC) from the vertex (L) of the domain for the shapes of CC1 and CC6. These values are 1953, 197, and 56 MJ m−1 for CC1, while they are 983, 300, and 85 MJ m−1 for CC6, as shown in Table 5. The higher energies (AA′) are seen close to the landfall for CC1 while decreasing significantly for CC6. However, higher values are seen in CC6 much further away from the landfall (BB′, CC′) compared to in CC1, implying more spread of EB for CC6. For track T0, the funneling effect is not seen in terms of surge generation (refer to Table 5). The peak EB is associated with the radius of maximum winds (Rmax) in either case. However, the spread or extent of the peak EB is seen more in CC6 compared to in CC1 due to the funneling effect.
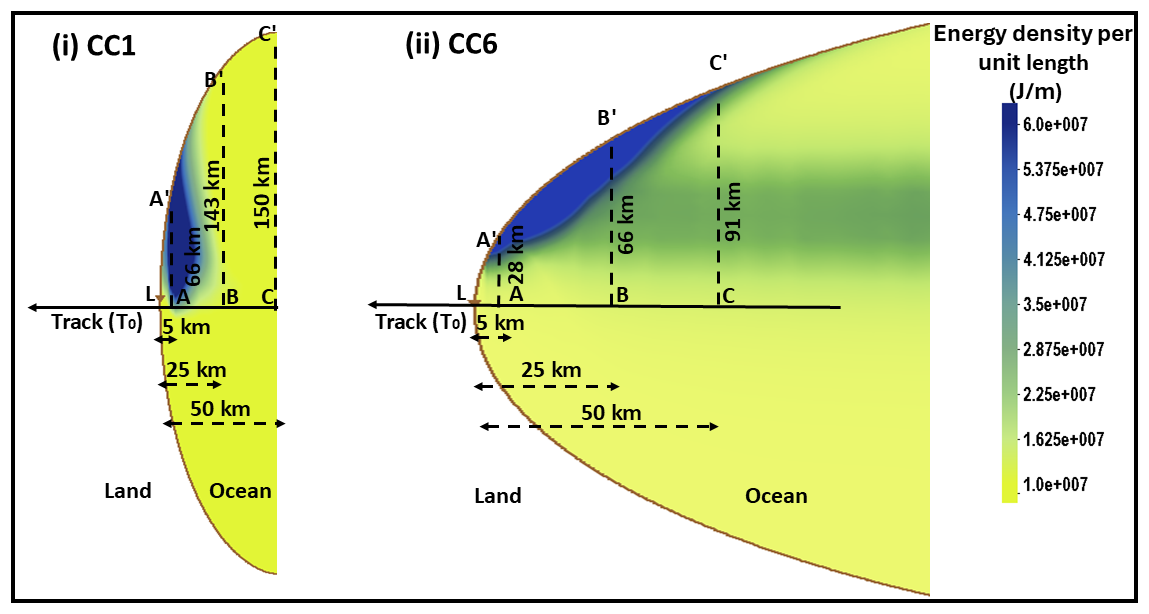
Figure 10Energy propagation associated with the peak surge for (i) CC1 and (ii) CC6 as the cyclone proceeds towards the coast. The L refers to the cyclone landfall.
Table 5Energy density per unit length at different location for the shapes CC1 and CC6.
The value of the width (B) is reduced as the cyclone gets closer to the concave shore, resulting in an increase in the energy density and EB. This increase in energy is directly responsible for the enhancement of surges in the concave-shaped domains. Since B has a more significant influence on A than h, we have considered only B in the above computations, leaving out h. This explanation holds well for all other concave shapes as well. This formula may not be directly applicable for convex domains. However, it is expected that more energy will dissipate instead of accumulate along the coast for the convex domains, as in the case of concave domains. The simulations for all the concave domains (not shown), in general, suggest that the energy is more focused towards the coast as the tracks move from T2 to T−2.
In the next experiment (Exp3), complex coastal stretch with both concave and convex geometry is selected along the eastern coast of India to investigate the impact of PS in the region. This experiment consists of three parts. The first part computes PS using three independent parallel tracks (Fig. 11). The second part deals with the tracks approaching from different angles at different locations in the domain (Fig. 12). The final part examines the generation of PS with three straight tracks parallel to the coast, with different Rmax values (Fig. 13). In all these experiments, the strength of the cyclone remains the same.
4.6 Computation of peak surges by parallel tracks using actual coastal stretch along the eastern coast of India
As shown in Fig. 11, three parallel tracks, 1, 2, and 3, are considered in the concave-shaped coast, showing landfall at different locations on the southern, center, and northern sides of the concave coast, respectively. Rmax is considered to be 30 km for all three of the tracks. Track 1 experiences landfall near Diviseema, with an MPS of 3.94 m occurring in the middle of the concave coast, as shown in Fig. 11i. The reason for this is attributed to the prevailing maximum onshore winds associated with track 1, which is found close to the vertex of the concave coast as the Rmax is 30 km. Tracks 2 and 3 experience landfall near Machilipatnam and Antervedi, with MPS values of 3.51 m (Fig. 11ii) and 3.13 m (Fig. 11iii), respectively.
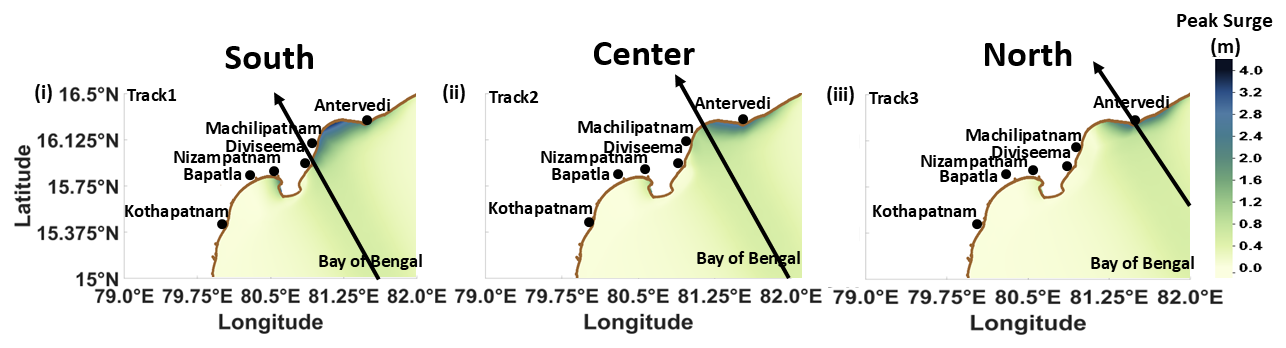
Figure 11Occurrence of peak surge along the actual concave coastline with the different parallel cyclonic tracks experiencing landfall (i) to the west (track 1), (ii) at the center (track 2), and (iii) to the east (track 3) of the concave coastline.
As the tracks move from south to north, a reduction in PS or the MPS and a shifting of its location are perceived. The reason for the reduction is due to the change in landfall location on the concave coast, which leads to a reduction in the onshore winds as the tracks change from 1 to 3. Hence, accumulation of the storm waters is reduced as the tracks move to the north, leading us to deduce that the effect of the concave coast is reduced as the landfall location of the track moves to the north of the coast. It is also important to note that the MPS is also generated to the west of tracks 1 and 2 near Nizampatnam due to the presence of another concave coast close to Bapatla. A convex-shaped coastline is also enclosed between the concave coasts of Nizampatnam and Diviseema.
However, PS is reduced in this region as the tracks shift to the north. The experiments lead us to infer that the concave-coastline geometry is more susceptible to higher SSs, especially when the track experiences landfall to the south of the coast. Additionally, SS computed along the concave-shaped coastline is higher compared to that along the convex coastline, which aligns with the observations made with the idealized concave and convex domains (refer to Sect. 5.2).
4.7 Computation of peak surges based on the tracks with different approach angles using actual coastal stretch along the eastern coast of India
In this part of Exp3, the impact of various approach angles and the location of the landfall on the generation of PSs along the concave coastline is explored. The approach angles and landfall locations considered in this study are based on the history of the cyclones formed in this region, which include the 1977 Andhra Pradesh cyclone and the Ogni (2006), Khaimuk (2008), Laila (2010), Helen (2013), Lehar (2013), and Roanu (2016) cyclones.
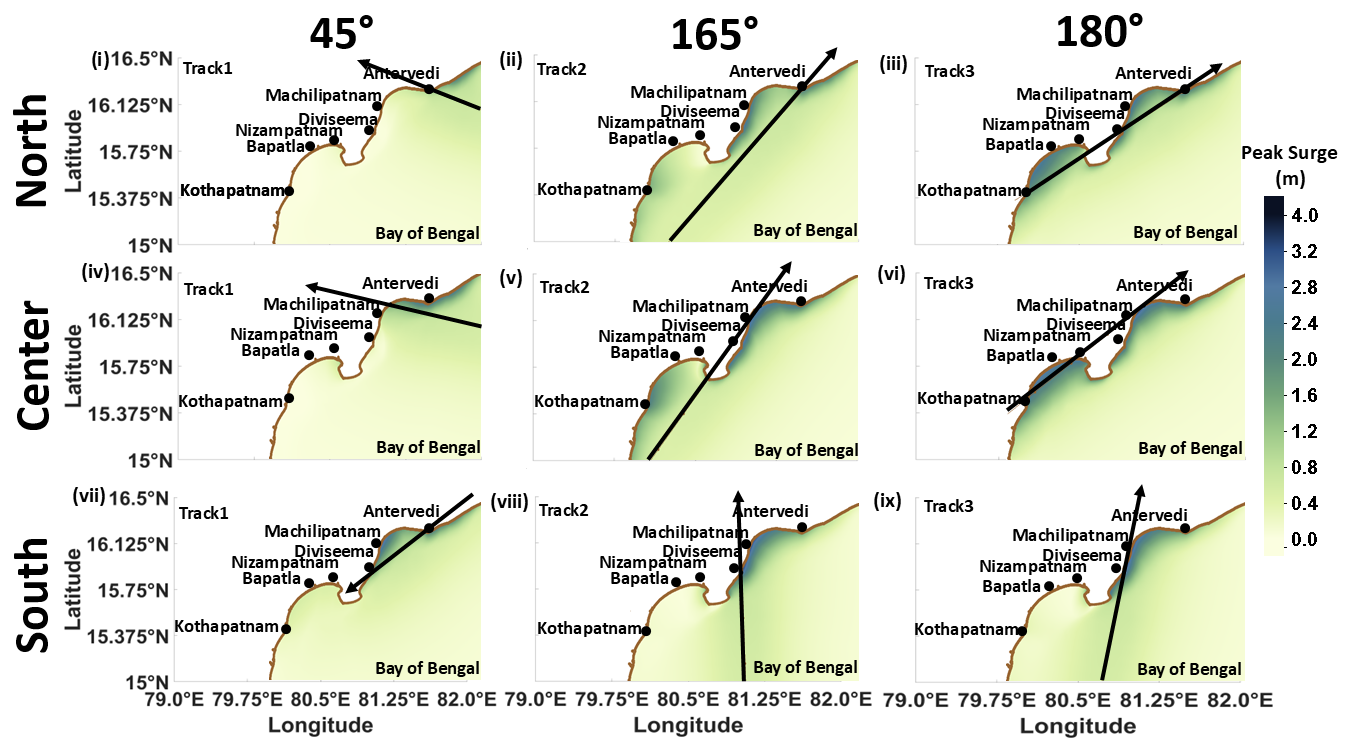
Figure 12Effect of approach angle (45 (track 1), 165 (track 2), and 180° (track 3)) on peak surges due to tropical-cyclone landfall (i–iii) to the west, (iv–vi) at the center, and (vii–ix) to the east of the concave coastline.
The model domain is the same as that of Sect. 4.6. Here, three landfall locations along the concave coast are considered in relation to three different approach angles. Though some tracks cross the coast multiple times, PS is studied at selected landfall locations in the concave domain, as discussed in the above section. As a part of this exercise, PS is simulated in the concave-shaped coastline with approach angles of 45, 165, and 180°, as experienced at the landfall location (east, center, and west), represented as tracks 1, 2, and 3, as shown in Fig. 12. The reason for selecting these tracks is that some generate PS over the region that is west of the track. The track angle is measured clockwise, with the tangent drawn parallel to the landfall location. These tracks are chosen so that they have more influence on the occurrence of PS in the concave domain. The tracks that strike on the eastern side of a concave coastline near Antervedi generate MPS values of about 2.56, 3.08, and 3.15 m for tracks 1, 2, and 3, respectively, as shown in Fig. 12i–iii.
The MPS is also computed in the neighboring concave-shaped coastline near Bapatla at about 2.01 and 3.02 m for tracks 2 and 3, respectively. The MPS for track 1 is computed on the eastern side, while for tracks 2 and 3, it is on the western side due to the concave nature of the coastline. In Fig. 12iv–vi, tracks 1, 2, and 3 experience landfall at the center of the concave domain near Machilipatnam, and the associated MPS values are about 2.83, 3.59, and 3.62 m, respectively. Tracks 2 and 3 also generate MPS values in the adjacent concave-shaped coastline near Bapatla of about 2.75 and 3.27 m, respectively. The simulations shown in Fig. 12vii–ix correspond to the landfall location near Diviseema, with different approach angles. The simulated MPS values for tracks 1, 2, and 3 are approximately 3.34, 3.61, and 3.67 m, respectively, each exhibiting higher SSs in the concave domain compared to in any other landfall locations. This suggests that the occurrence of the MPS is not always confined to the eastern side of the cyclone track if a cyclone experiences landfall towards the concave geometry with unique approach angles. These simulations lead us to infer that the generation of PS depends on both the track approach angle and the landfall location in the concave domain.
4.8 Computation of peak surges by means of parallel tracks with different Rmax using actual coastal stretch along the eastern coast of India
In the past, many parallel cyclonic tracks along the eastern coast of India were seen passing through the coastal stretch covering Kothapatnam to Antervedi, which has a complex geometry with concave- and convex-shaped coastlines. Though the cyclones may not experience landfall in this region, this coast is prone to higher SSs due to its irregular coastline geometry. Hence, this experiment is designed to study the effect of PS with equally spaced (20 km) tracks moving parallel to this coast and with different Rmax values of 20, 30, and 40 km for tracks 1, 2 and 3, respectively, as shown in Fig. 13. The PS in the domain is depicted in Fig. 13i–iii as the cyclonic tracks move parallel to the coast, with Rmax of 20 km. It is important to note from the simulations that all these parallel tracks generate SSs along the coast. However, the MPS of 2.85 m is simulated with track 1, and the minimum of 2.0 m is simulated with track 3. Similarly, the experiments are carried out with Rmax of 30 and 40 km, as shown in Fig. 13iv–vi and vii–ix, respectively. The pattern of surge development at the coast is very similar to that of an Rmax value of 20 km. However, the MPS simulated for track 1 is 3.1 m, and that for Rmax values of 30 and 40 km is 3.2 m. It is also observed that the MPS values for track 3 are 2.5 and 3.0 m for Rmax values of 30 and 40 km, respectively. It is worth noting that PS is generated only to the west of the concave coasts due to strong associated onshore winds, and the maximum is produced along the coast, with Rmax of 40 km. It is observed from the simulations made for Rmax of more than 40 km (not shown here) that the effect of SS on the coast is reduced as the tracks move away from the coast. Moreover, the concave coast in the north, covering Diviseema to Antervedi, experiences higher SS compared to that of the adjacent concave coast lying in the southern part of the domain at Bapatla. The increase in Rmax does not affect the magnitude of the wind but modifies the cyclonic horizontal wind distribution. Higher surges are expected to be generated at coastal locations far from the landfall point as Rmax increases.
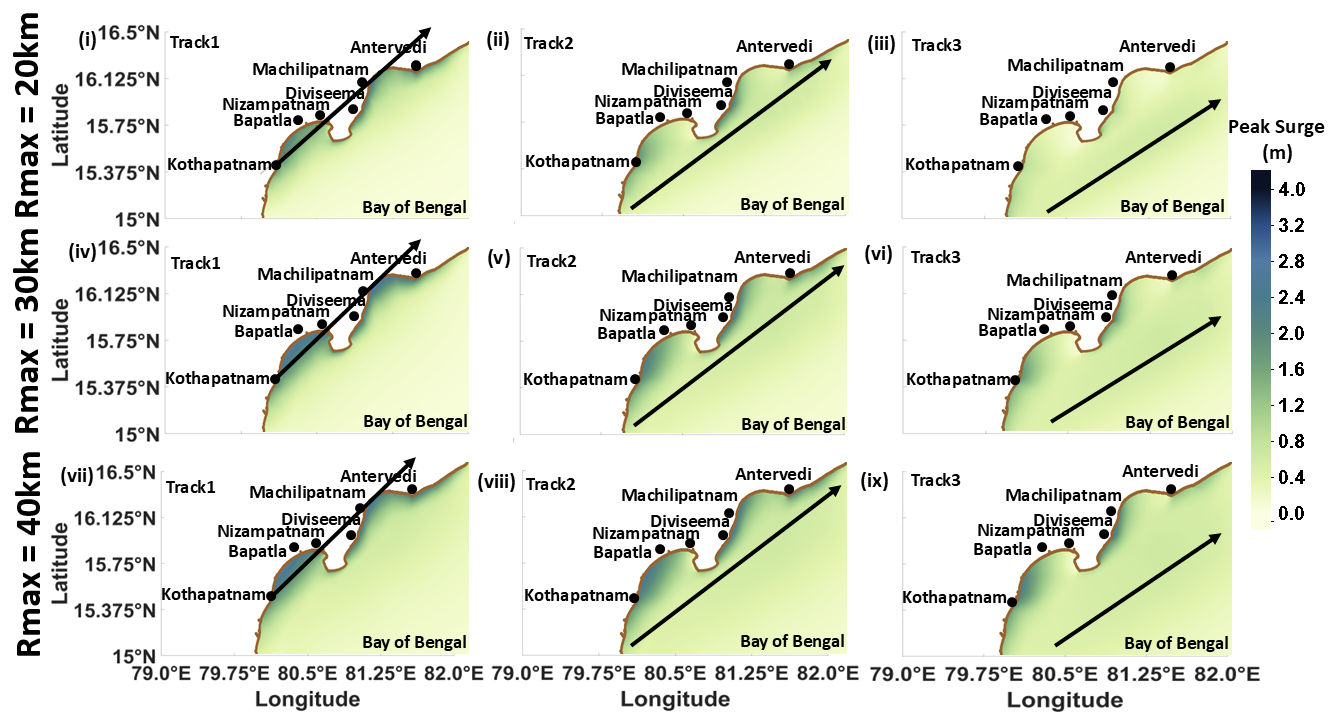
Figure 13The occurrence of peak surge over a concave coastline with different parallel tracks and a radius of maximum wind (Rmax) of (i–iii) 20 km, (iv–vi) 30 km, and (vii–ix) 40 km.
This study emphasizes the complex interrelationship between the growth of SSs and irregular coastline geometry, such as concave and convex shapes. For this, a numerical model, ADCIRC, is used for the generation of SSs with differently shaped shorelines, along with diverse cyclonic tracks with the same intensity. The study is confined to the computation of PSs during cyclone periods and delineates the distribution of PSs along the coast. The present study is divided into three experiments by considering idealized and actual coastal domains of concave and convex shapes. Exp1 is performed to compute ST associated with a recent cyclone, Michaung. The simulations of ST are computed by considering the tides in the model, with maximum values of 1.65 m near Bapatla (right of the track) and 1.25 m near Ongole (west of the track), which are consistent with the reports of the India Meteorological Department (RSMC report, 2023). A comparison of model ST with the tide gauge data available at Krishnapatnam suggests that the model can simulate the ST reasonably well, even in the complex coastal stretch, as considered in the study. In Exp2, idealized differently shaped concave and convex domains are considered with many parallel tracks. The curvature effect of the concave coast on the generation of the MPS is observed more for the tracks moving from south to north (T−1 to T2) in the domain. However, the MPS associated with southern tracks (T−2 to T0) produces higher MPS values compared to that of T1 and T2 because of greater accumulation of storm waters in the domain. The MPS associated with T−1 is the highest among all the tracks as the Rmax value coincides with the domain's vertex. In general, higher curvature of the domain (CC6) produces larger amplitudes of PS, as seen with the track T−1. Similar experiments with the convex-shaped domain reveal a monotonic decrease in the MPS as the curvature of the domain increases from CV1 to CV6, with the highest difference for track T2. It is noticed that the MPS decreases from T−1 to T2 as higher dissipation of energy is expected along the convex domain as the tracks move from T−1 to T2.
As the curvature effect plays a significant role in PS generation along the coast, the tangent angle with respect to all the tracks is computed for the domains with the lowest (CC1 and CV1) and the highest (CC6 and CV6) curvature, which can act as a proxy for the generation of MPS values by any parallel track. If the angle is close to 90°, as in the case of T−1, the computed MPS is seen to be higher, and it decreases on either side as the angle decreases. With the decrease in angle, the spread of PS along the coast is also seen more, which is explained by the alongshore wind. At the same time, the MPS along the coast is attributed to the onshore wind. It is important to observe that the onshore wind is at maximum for T−1 and decreases as it moves to T2 with increasing curvature, and, hence, the MPS decreases. On the other hand, the alongshore wind increases from T−1 to T2, resulting in higher spread of PS along the coast. The time evolution of SS for concave coasts suggests that both positive and negative surges incline towards the vertex of the domain as the track moves from T2 to T−2; the opposite is true for the vertex of convex coasts. Computation of EB for the concave coasts demonstrates the funneling effect and suggests that the spread of energy along the coast is enhanced as the curvature of the coast increases from CC1 to CC6. These idealized experiments signify the effect of important parameters like the tangent angle, wind components, and the shape of the curvature, which are closely related to the growth and spread of PS along the coast for any track.
Exp3 is carried out with a real coastline of complex geometry, covering Kothapatnam to Antervedi, which is one of the most prominent cyclone-prone regions along the eastern coast of India. The simulations are designed using parallel and oblique tracks experiencing landfall at different locations in the region. Initially, Exp3 considers three parallel tracks to evaluate PS development in the domain of the concave coast. The study reveals that MPS values are simulated if the track is close to the south of the concave coast and decrease as it moves northwards, which is consistent with Exp2. The second part of Exp3 considers the exact landfall locations as in the first part, this time with oblique tracks and different approach angles of 45, 165 and 180°. These experiments suggest that PS along the coast is enhanced as the approach angle increases, leading us to infer that the track parallel to the coast generates more PS not only to the east but also to the west of the track for certain tracks. In the final part of Exp3, three parallel cyclone tracks are considered to have different Rmax values of 20, 30, and 40 km as these tracks produce a larger amplitude of PS along the coast. The study reveals that the cyclone with higher Rmax generates more PS to the west of the track, particularly on the concave coast, signifying the vulnerability of the region even though the cyclone moves parallel to the coast without experiencing landfall as there are many cyclones in the past that have experienced landfall in the same region.
Our experiments suggest that the concave coastlines are responsible for enhanced surges due to the accumulation of waters as a result of the funneling effect, which is consistent with earlier studies (Dasallas and Lee, 2019; Van der Meer et al., 2018; Sebastian et al., 2019). Our study demonstrates less surge generation along the convex and straight coastlines compared to along concave coastlines, which is also in agreement with the studies of Subramaniam et al. (2019), Pandey and Rao (2019), and Ueno (1981). Our study includes the effect of parallel and oblique tracks on surge generation due to different idealized concave and convex coastlines, along with actual coastlines. This study provides detailed insights into the mechanisms of surge generation. The funneling effect in terms of EB in concave-shaped domains is demonstrated. Our experiments suggest that western side of the cyclone track experiences higher surges for some approach angles, which has not been reported previously.
Since the study is limited to idealized concave ad convex domains, with idealized bathymetry being used to investigate the effects of curvature on the generation of SSs, it may not fully capture the intricacies of actual coastal geometries. The absence of tides in the experiments will not influence the understanding of storm surge generation; however, it will have an impact on its amplitude, which is dependent on the phase of the tide. Real-world coasts may have irregular coastlines with many inlets and complex bathymetry that might influence SS behaviors differently. Further, the study assumes uniform cyclone intensity and a limited range of Rmax values (20–40 km). Our study is confined to the generation of surges, and it neglects the influence of tides and interactions like tidal asymmetry and spring–neap tide interactions. The study should be extended in future by including tides and wind waves with different cyclone intensities for a better understanding of the generation of extreme water levels in the region of interest.
This study helps to unearth the complex relation in generating SS with respect to the coastline geometry, approach angle, and Rmax of the cyclone. This comprehensive study applies to any part of the coastal region with complex geometry. This study may also be important as concave and convex coastline domains may face shape alteration due to several factors, including erosion, sediment deposition, sea level rise, and human activities. In addition, the investigations may assist in better preparedness and response strategies that target coastal communities. Such knowledge can thus be utilized in developing more accurate predictive and warning systems.
The best-track data used in the study can be obtained from the Indian Meteorological Department (IMD) website (https://rsmcnewdelhi.imd.gov.in/rsmc-tropical-cyclones.php, IMD, 2023), and the tide gauze data used in this study can be obtained from the Indian National Centre for Ocean Information Services (INCOIS) website (https://incois.gov.in/portal/datainfo/drform.jsp, INCOIS, 2023).
PT: conceptualization, formal analysis, investigation, methodology, software, validation, visualization, writing (original draft, review and editing). ADR: conceptualization, investigation, methodology, supervision, visualization, writing (review and editing). SP: writing (review and editing). VP: writing (review and editing).
The contact author has declared that none of the authors has any competing interests.
Publisher's note: Copernicus Publications remains neutral with regard to jurisdictional claims made in the text, published maps, institutional affiliations, or any other geographical representation in this paper. While Copernicus Publications makes every effort to include appropriate place names, the final responsibility lies with the authors.
This article is part of the special issue “Extremes in the marine environment: analysis of multi-temporal and multi-scale dynamics using observations, models, and machine learning techniques”. It is not associated with a conference.
The authors are grateful to the Indian National Center for Ocean Information Services (INCOIS) for providing tide gauge data and to the India Meteorological Department (IMD) for providing the best-track data. The authors also thank the IIT Delhi HPC facility for providing the computational resources.
This research is supported by Ambarukhana D. Rao through their contingency funds (grant no. IITD/IESI/2022/28413).
This paper was edited by Giovanni Liguori and reviewed by two anonymous referees.
Cyriac, R., Dietrich, J. C., Fleming, J. G., Blanton, B. O., Kaiser, C., Dawson, C. N., and Luettich, R. A.: Variability in Coastal Flooding predictions due to forecast errors during Hurricane Arthur, Coast. Eng., 137, 59–78, 2018.
Das, P. K.: Prediction model for storm surges in the Bay of Bengal, Nature, 239, 211–213, 1972.
Dasallas, L. and Lee, S.: Topographical Analysis of the 2013 Typhoon Haiyan Storm Surge Flooding by Combining the JMA Storm Surge Model and the FLO-2D Flood Inundation Model, Water, 11, 144, https://doi.org/10.3390/w11010144, 2019.
Dube, S. K., Sinha, P. C., and Rao, A. D.: The effect of coastal geometry on the location of peak surge, Mausam, 33, 445–450, 1982.
Dube, S. K., Rao, A. D., Sinha, P. C., and Chittibabu, P.: A real-time storm surge prediction system: an application to the east coast of India, Proc. Indian Nat. Sci. Acad. Pt. A, 60, 157–157, 1994.
Flierl, G. R. and Robinson, A. R.: Deadly surges in the Bay of Bengal: Dynamics and storm-tide tables, Nature, 239, 213–215, 1972.
Garratt, J. R.: Review of drag coefficients over oceans and continents, Mon. Weather Rev., 105, 915–929, 1977.
Holland, G. J.: An analytic model of the wind and pressure profiles in hurricanes, Mon. Weather Rev., 108, 1212–1218, 1980.
Holland, G. J., James, B. I., and Fritz, A.: A revised model for radial profiles of hurricane winds, Am. Meteorol. Soc., 138, 4393–4401, https://doi.org/10.1175/2010MWR3317.1, 2010.
Hope, M. E., Westerink, J. J., Kennedy, A. B., Kerr, P. C., Dietrich, J. C., Dawson, C., Bender, C. J., Smith, J. M., Jensen, R. E., Zijlema, M., Holthuijsen, L. H., Luettich, R. A., Powell, M. D., Cardone, V. J., Cox, A. T., Pourtaheri, H., Roberts, H. J., Atkinson, J. H., Tanaka, S., Westerink, H. J., and Westerink, L. G.: Hindcast and validation of Hurricane Ike (2008) waves, forerunner, and storm surge, J. Geophys. Res.-Oceans, 118, 4424–4460, https://doi.org/10.1002/jgrc.20314, 2013.
IMD: Regional Specialized Meteorological Centre for Tropical Cyclones Over North Indian Ocean, Best track data [data set], https://rsmcnewdelhi.imd.gov.in/rsmc-tropical-cyclones.php (last access: 9 February 2025), 2023.
INCOIS: Indian Tsunami Early Warning System, Tide gauze data [data set], https://incois.gov.in/portal/datainfo/drform.jsp (last access: 9 February 2025), 2023.
Irish, J. L., Resio, D. T., and Ratcliff, J. J.: The influence of storm size on hurricane surge, J. Phys. Oceanogr., 38, 2003–2013, 2008.
Johns, B., Sinha, P. C., Dube, S. K., Mohanty, U. C., and Rao, A. D.: On the effect of bathymetry in numerical storm surge simulation experiments, Comp. Fluids, 11, 161–174, 1983.
Kolar, R. L., Gray, W. G., Westerink, J. J., and Luettich, R. A.: Shallow water modeling in spherical coordinates: Equation formulation, numerical implementation, and application, J. Hydraul. Res., 32, 3–24, 1994.
Le Provost, C., Lyard, F., Molines, J. M., Genco, M. L., and Rabilloud, F.: A hydrodynamic ocean tide model improved by assimilating a satellite altimeter-derived data set, J. Geophys. Res.-Oceans, 103, 5513–5529, 1998.
Luettich Jr., R. A., Westerink, J. J., and Scheffner, N. W.: ADCIRC: An advanced three-dimensional circulation model for shelves, coasts, and estuaries, Report 1, Theory and methodology of ADCIRC-2DDI and ADCIRC-3DL (No. CERC-TR-DRP-92-6), Coastal Engineering Research Center Vicksburg, MS, 1992.
Mandal, A. K., Ramakrishnan, R., Pandey, S., Rao, A. D., and Kumar, P.: An early warning system for inundation forecast due to a tropical cyclone along the east coast of India, Nat. Hazards, 103, 2277–2293, https://doi.org/10.1007/s11069-020-04082-w, 2020.
Mohapatra, M. and Sharma, M.: Characteristics of surface wind structure of tropical cyclones over the north Indian Ocean, J. Earth Syst. Sci., 124, 1573–1598, https://doi.org/10.1007/s12040-015-0613-6, 2015.
Munk, W., Snodgrass, F., and Carrier, G.: Edge waves on the continental shelf, Science, 123, 127–132, https://doi.org/10.1126/science.123.3187.127, 1956.
Murty, P. L. N. and Kolukula, S. S.: Future projections of storm surges and associated coastal inundation along the East Coast of India, J. Water Clim. Change, 14, 1413–1432, https://doi.org/10.2166/wcc.2023.358, 2023.
Murty, P. L. N., Srinivas, K. S., Rao, E. P. R., Bhaskaran, P. K., Shenoi, S. S. C., and Padmanabham, J.: Improved cyclonic wind fields over the Bay of Bengal and their application in storm surge and wave computations, Appl. Ocean Res., 95, 102048, https://doi.org/10.1016/j.apor.2019.102048, 2020.
NOAA: https://www.nhc.noaa.gov/surge/#:~:text=Storm%20surge%20will%20be%20higher,affect%20the%20flow%20of%20water (last access: 9 February 2025), 2022.
Pandey, S. and Rao, A. D.: An improved cyclonic wind distribution for computation of storm surges, Nat. Hazards, 92, 93–112, https://doi.org/10.1007/s11069-018-3193-3, 2018.
Pandey, S. and Rao, A. D.: Impact of Approach Angle of an Impinging Cyclone on Generation of Storm Surges and Its Interaction with Tides and Wind Waves, J. Geophys. Res.-Oceans, 124, 7643–7660, https://doi.org/10.1029/2019JC015433, 2019.
Pandey, S., Rao, A. D., and Haldar, R.: Modeling of Coastal inundation in response to a tropical cyclone using a coupled hydraulic HEC-RAS and ADCIRC model, J. Geophys. Res.-Oceans, 126, e2020JC016810, https://doi.org/10.1029/2020JC016810, 2021.
Peng, M., Xie, L., and Pietrafesa, L. J.: A numerical study of storm surge and inundation in the Croatan–Albemarle–Pamlico Estuary System, Estuar. Coast. Shelf S., 59, 121–137, 2004.
Peng, M., Xie, L., and Pietrafesa, L. J.: Tropical cyclone-induced asymmetry of sea level surge and fall and its presentation in a storm surge model with parametric wind fields, Ocean Model., 14, 81–101, 2006.
Poulose, J., Rao, A. D., and Bhaskaran, P. K.: Role of continental shelf on non-linear interaction of storm surges, tides and wind waves: An idealized study representing the west coast of India, Estuar. Coast. Shelf S., 207, 457–470, 2017.
Qian, X., Hwang, S., and Son, S.: A study on key determinants in enhancing storm surges along the coast: Interplay between tropical cyclone motion and coastal geometry, J. Geophys. Res.-Oceans, 129, e2023JC020400, https://doi.org/10.1029/2023JC020400, 2024.
Rao, Y. R., Chittibabu, P., Dube, S. K., Rao, A. D., and Sinha, P. C.: Storm surge prediction and frequency analysis for the Andhra coast of India, Mausam, 48, 555–566, https://doi.org/10.54302/mausam.v48i4.4322, 1997.
Rego, J. L. and Li, C.: On the importance of the forward speed of hurricanes in storm surge forecasting: A numerical study. Geophys. Res. Lett., 36, L07609, https://doi.org/10.1029/2019JC015433, 2009.
Resio, D. T. and Westerink, J. J.: Modeling the physics of storm surges, Phys. Today, 9, 33–38, 2008.
Ross, J. C.: On the effect of the pressure of the atmosphere on the mean level of the ocean, Philos. T. R. Soc. Lond., 144, 285–296, 1854.
RSMC report: https://rsmcnewdelhi.imd.gov.in/report.php (last access: 9 February 2025), 2023.
Salaree, A., Huang, Y., Ramos, M. D., and Stein, S.: Relative tsunami hazard from segments of Cascadia subduction zone for Mw 7.5–9.2 earthquakes, Geophys. Res. Lett., 48, e2021GL094174, https://doi.org/10.1029/2021GL094174, 2021.
Sebastian, M., Behera, M. R., and Murty, P. L. N.: Storm surge hydrodynamics at a concave coast due to varying approach angles of cyclone, Ocean Eng., 191, 106437, https://doi.org/10.1016/j.oceaneng.2019.106437, 2019.
Sharma, M. and Mohapatra, M.: Standard Operation Procedure for Tropical Cyclone Vital Parameters over North Indian Ocean, in: Tropical Cyclone Activity over the North Indian Ocean, edited by: Mohapatra, M., Bandyopadhyay, B., and Rathore, L., Springer, Cham, https://doi.org/10.1007/978-3-319-40576-6_24, 2017.
Subramaniam, S. P., Scheres, B., Schilling, M., Liebisch, S., Kerpen, N. B., Schlurmann, T., Altomare, C., and Schüttrumpf, H.: Influence of Convex and Concave Curvatures in a Coastal Dike Line on Wave Run-up, Water, 11, 1333, https://doi.org/10.3390/w11071333, 2019.
Tiwari, P., Rao, A. D., Pandey, S., and Pant, V.: Assessing the influence of land use and land cover data on cyclonic winds and coastal inundation due to tropical cyclones: a case study for the east coast of India, Nat. Hazards, 12, 10219–10240, https://doi.org/10.1007/s11069-024-06603-3, 2024.
Ueno, T.: Numerical computations of the storm surges in Tosa Bay, J. Oceanogr. Soc. Jpn., 37, 61–73, https://doi.org/10.1007/BF02072559, 1981.
Van der Meer, J. W., Allsop, N. W. H., Bruce, T., De Rouck, J., Kortenhaus, A., Pullen, T., Schüttrumpf, H., Troch, P., and Zanuttigh, B.: Manual on wave overtopping of sea defences and related structures. An overtopping manual largely based on European research, but for worldwide application, https://www.overtopping-manual.com (last access: 1 October 2020), 2018.
Xuan, J., Ding, R., and Zhou, F.: Storm surge risk under various strengths and translation speeds of landfalling tropical cyclones, Environ. Res. Lett., 16, 124055, https://doi.org/10.1088/1748-9326/ac3b78, 2021.
Zhang, C.: Effect of hurricane forward speed and approach angle on coastal storm surge, LSU Master's Theses, 3468, Louisiana State University, USA, https://doi.org/10.31390/gradschool_theses.3468, 2012.
Zhao, G. and Niu, X.: Amplification of tsunami waves along the west coast of Negros Island and Panay Island, Appl. Ocean Res., 123, 103175, https://doi.org/10.1016/j.apor.2022.103175, 2022.
Zhong, L., Li, M., and Zhang, D. L.: How do uncertainties in hurricane model forecasts affect storm surge predictions in a semi-enclosed bay?, Estuar. Coast. Shelf S., 90, 61–72, 2010.