the Creative Commons Attribution 4.0 License.
the Creative Commons Attribution 4.0 License.
 | 13 Nov 2025
Diagnosing the Atlantic Meridional Overturning Circulation in density space is critical in warmer climates
Fernanda DI Alzira Oliveira Matos
Dmitry Sidorenko
Xiaoxu Shi
Lars Ackermann
Janini Pereira
Gerrit Lohmann
Christian Stepanek
The Atlantic Meridional Overturning Circulation (AMOC) plays a crucial role in shaping the global climate system by redistributing heat and influencing large-scale climate patterns. Utilizing the AWI-CM3 model, we investigate the AMOC sensitivity to an abrupt climate change scenario (abrupt-4xCO2) with respect to pre-industrial climate (PI), comparing the AMOC diagnosed in depth (z-AMOC) and density (ρ-AMOC) space. Water mass transformations are assessed to analyze the impact of background climate on surface-forced and interior-mixing-induced transformations. We find that both the location and magnitude of AMOC maximum are directly affected by the framework choice. In PI, the ρ-AMOC maximum is substantially stronger than that of the z-AMOC, while at 26° N the two diagnostics are nearly equivalent. Consequently, the variability of the z-AMOC maximum correlates only with that at 26° N, reflecting isopycnal flattening into constant depth levels in the subpolar North Atlantic inherent to these diagnostics. Strong AMOC weakening is observed under 4xCO2 forcing in both frameworks until simulation year 75. Subsequently, both diagnostics reveal a weaker AMOC with an approximate strength of 7.1 Sv, although with z-AMOC displaying a slight recover towards the end of the simulation and ρ-AMOC oscillating steadily around 5 Sv. At 26° N, variability patterns remain comparable to PI, albeit with an additional ρ-AMOC weakening of approximately 2 Sv, indicating divergence between the representation of AMOC dynamics in the subtropical Atlantic within both frameworks in comparison to PI. The diagnostics in density space allow for the attribution of this further ρ-AMOC weakening to increased entrainment of fresher overflows from amplified GIN seas overturning and reduced deep convection in the Labrador and Irminger Seas. In contrast, the diagnostics in depth space only reveals reduced downwelling around the southwestern Greenland coast and along the path of the Gulf Stream, features that are more challenging to evaluate against available observations. Thus, the comparison between z-AMOC and ρ-AMOC indicates that diagnosing the AMOC in density space provides more physically meaningful information regarding the state of the water mass transformations and their contribution to ocean circulation regimes across the entire Atlantic basin, not only the subpolar North Atlantic, and especially as the climate continues to warm. These findings emphasize the importance of diagnosing AMOC in density space to better understand water mass transformations, which are concealed in depth space and to capture AMOC variability in warmer climates, across all latitudes.
- Article
(12419 KB) - Full-text XML
- BibTeX
- EndNote


The Atlantic Meridional Overturning Circulation (AMOC) plays a crucial role in the global climate, accounting for approximately 25 % of global heat transport and nearly half of the deep-water formation in the ocean (Srokosz et al., 2012). The AMOC is also deemed as a global tipping point that is weakening and likely to collapse if subject to enough climate forcing, although the magnitude of this weakening or probability of collapse remain uncertain and are under heavy discussion (McKay et al., 2022; Ditlevsen and Ditlevsen, 2023; van Westen et al., 2025; Dima et al., 2025; Zimmerman et al., 2025). Such potential weakening under anthropogenic climate change has gained increasing scientific attention, given its association with potentially catastrophic climatic events, particularly affecting economically vulnerable regions (Orihuela-Pinto et al., 2022; Meccia et al., 2025; Zhang et al., 2024). Consequently, understanding the AMOC sensitivity to climates warmer than present, here defined relative to the Pre-Industrial (PI) period (1850 CE (Common Era)), is critical for assessing the potential environmental and societal impacts of future climate change and to better prepare for them (Bellomo et al., 2021).
At current background climate, the AMOC firstly consists of an upper limb of warm, saline waters flowing northward towards the subpolar North Atlantic (SPNA) (Buckley and Marshall, 2016). This upper limb is fed by two primary pathways: the “cold route”, which transports relatively cold and fresh waters from the Drake Passage in the Southern Ocean, and the “warm route”, which carries relatively warm and saline waters from the Agulhas Plateau at the boundary between the Indian and Atlantic Oceans (Rühs et al., 2019), with the latter representing the dominant contribution. The maximum AMOC overturning strength occurs within its mid-depth cell, at approximately 1000 m below the ocean surface and between 30–65° N (Matos et al., 2020). Upon reaching the northern North Atlantic, these waters lose heat to the atmosphere, become denser, sink, and return southward as a cold lower limb dominated by the North Atlantic Deep Water (NADW) (Buckley and Marshall, 2016). Furthermore, meridional overturning in the Atlantic Ocean includes the abyssal cell, sustained by the Antarctic Bottom Water (AABW) sourced from the Southern Ocean (Biló et al., 2024).
The AMOC is primarily driven by winds, buoyancy fluxes and interior mixing processes that vary over synoptic to multi-centennial timescales (Buckley and Marshall, 2016). These dynamics are strongly influenced by fluctuations in heat and freshwater fluxes throughout the Atlantic Ocean, which regulate the density of water masses transported via ocean currents (Sévellec and Fedorov, 2016). However, observing variations in buoyancy fluxes at fine resolution remains challenging due to current technological limitations, despite recent advances in AMOC fingerprint analysis and observational arrays (Frajka-Williams et al., 2019). Consequently, numerical model simulations remain indispensable for investigating AMOC variability across multiple scales. In this context, the Coupled Model Intercomparison Project (CMIP) was developed aiming at providing a standardized framework for developing climate model simulations and facilitating robust inter-model comparison. The sixth phase, CMIP6 (Eyring et al., 2016), has enabled a wide range of studies focused on evaluating the AMOC sensitivity to different forcings and scenarios and over various time and spatial scales. Concurrent with the increased number of studies concerning the AMOC response to climate change, another critical factor has gained attention: the choice of vertical coordinate system employed to derive AMOC-related output and diagnostics (Foukal and Chafik, 2024). These coordinate systems refer to the AMOC diagnostics in depth (z-AMOC) or density (ρ-AMOC) space. In depth space, the AMOC is derived from the zonally averaged streamfunction varying with latitude and depth, whereas in density space, the AMOC varies with density instead of depth. It is important to highlight, however, that ρ- and z-AMOC are not two different AMOCs but different representations of the same circulation, thus emphasizing different aspects of it.
The choice of coordinate system becomes particularly relevant when comparing the overturning estimates in the SPNA with those in the subtropical North Atlantic (STNA). In the STNA, the strong stratification and relatively flat isopycnals allow the southward limb to flow directly beneath the northward upper limb, resulting in similar estimates of magnitude and variability of ρ- and z-AMOC (Moat et al., 2025). Conversely, in the SPNA, sloped isopycnals induce horizontal separation between the upper and lower limbs, resulting in divergence between ρ- and z-AMOC in terms of both strength and variability (Foukal and Chafik, 2024). This divergence arises because zonal averaging in depth space conceals this horizontal separation, which in turn compromises the accuracy of AMOC estimates under this representation, particularly in the SPNA. Moreover, deriving the overturning circulation in density space instead of depth space is advantageous beyond studies that focus mostly on the North Atlantic and on current climate change, as constant-depth averaging can lead to spurious features such as the Deacon cell in the Southern Ocean (Döös and Webb, 1994; Stevens and Ivchenko, 1997; Speer et al., 2000) and has been linked to discrepancies between modeled and observed AMOC variability across timescales (Liu et al., 2017). Thus, diagnosing AMOC in density space yields a more continuous and physically consistent representation of the AMOC and its underlying mechanisms (Megann, 2018; Xu et al., 2018; Sidorenko et al., 2020a, 2021; Megann et al., 2021; Foukal and Chafik, 2024).
Although diagnosing AMOC in density space provides clear advantages, the establishment of ρ-AMOC as the standard diagnostic is still hindered by the research community's long-standing familiarity with z-AMOC, built over decades of studies employing the latter definition, with some articles providing a supplementary figure of ρ-AMOC remapped onto depth coordinates to facilitate comparisons between depth and density space AMOC representations (e.g. Xu et al., 2018; Tesdal et al., 2023; Foukal and Chafik, 2024). An additional caveat includes the higher computational cost associated with diagnosing ρ-AMOC (Sidorenko et al., 2021), which can discourage its implementation in studies that require long integration periods or high-resolution output. Furthermore, while the streamfunction in density space has been requested as output in CMIP6 (Griffies et al., 2016), it was not provided consistently for all experiments by all participating modelling centers (Baker et al., 2025; Jackson and Petit, 2023), which limits model intercomparison. While these barriers remain, the scientific gain through diagnosing ρ-AMOC outweighs these challenges, driving its increasing recognition in recent decades, with a strong momentum towards diagnosing AMOC in density space either in modelling studies or observational arrays at various latitudes (e.g. Frajka-Williams et al., 2023; Jackson and Petit, 2023; Fu et al., 2023; van Westen et al., 2025). In particular, observational arrays such as the OSNAP (Overturning in the Subpolar North Atlantic Program; Lozier et al., 2017) and RAPID-MOCHA (RAPID Climate Change – Meridional Overturning Circulation and Heatflux Array; McCarthy et al., 2015), already provide ρ-AMOC output and have, since their launch, changed our view on overturning in the subpolar and subtropical North Atlantic (Lozier et al., 2019; Moat et al., 2025; Frajka-Williams et al., 2023). Consequently, this dichotomy between the studies employing ρ- and/or z-AMOC frameworks introduces increased uncertainty regarding the occurrence and timing of a substantial AMOC weakening under a warming climate. At the inception of CMIP7, where both ρ- and z-AMOC are requested (Fox-Kemper et al., 2025), we see a timely opportunity to advertise the more widespread adoption of ρ-AMOC, at least as an additional, if not even the main, overturning diagnostic.
Motivated by this uncertainty surrounding the importance of diagnosing AMOC in density space under amplified climate change and across different latitudes, we conducted two simulations using the AWI-CM3 model (Alfred Wegener Institute Climate Model version 3; Streffing et al., 2022): (1) the CMIP6 abrupt-4xCO2 scenario (4xCO2 hereafter), characterized by quadrupled atmospheric CO2 concentration relative to pre-industrial levels (∼1120 ppmv); and (2) the CMIP6 piControl experiment (PI hereafter) as our control climate. We employ the 4xCO2 experiment as our warm climate instead of the CMIP6 shared socioeconomic pathway scenarios (SSPs; O'Neill et al., 2016) for future climate change because the idealized and abrupt forcing in 4xCO2 allows a clearer attribution of AMOC changes to greenhouse-gas forcing alone. In contrast to SSPs, which combine multiple forcings and are constrained by scenario-specific socioeconomic assumptions, the 4xCO2 framework facilitates the diagnosis of isolated physical mechanisms underlying the AMOC response. Moreover, while the 4xCO2 simulation may appear extreme relative to the current climate trajectory, prior research has demonstrated its utility in contextualizing ongoing climate change (Yang et al., 2023) and in assessing AMOC resilience to high CO2 forcing considering natural variability (Baker et al., 2025), as this experiment provides a clearer assessment of physical mechanisms under strong radiative forcing. Our primary objective is to determine whether the framework choice (z-AMOC vs. ρ-AMOC) affects our understanding of AMOC changes that occur in the severely perturbed warm climate state of 4xCO2. Additionally, we aim at assessing whether ρ-AMOC becomes a more relevant diagnostics also in the STNA in warmer climates, through evaluating the degree of similarity between ρ- and z-AMOC mean state and variability at high latitudes and at 26° N. Finally, we demonstrate the potential and advantages of adopting ρ-AMOC as standard output in future model intercomparison and model-observation comparison efforts, independently from the scope of the study.
2.1 Description of Model and Simulations
Utilizing the AWI-CM3 model (Streffing et al., 2022), we conduct a quasi-equilibrium pre-industrial simulation (PI) that we employ as the control climate, and a perturbed warm climate simulation with an abrupt quadrupling of PI CO2 concentration (4xCO2). Both simulations span 200 years and were branched off from an equilibrated 1000 year PI spin-up simulation, adhering to CMIP6 guidelines (Eyring et al., 2016), as introduced in Sect. 1. Analyses of mean large-scale processes were performed utilizing the output of the final 50 years of each simulation.
AWI-CM3 comprises both an atmospheric and an ocean and sea ice component. The atmospheric component is the open-source version of the Integrated Forecast System, version 43r3v2 (OpenIFS; Buizza et al., 2017), developed by the European Center for Medium Range Weather Forecast (ECMWF). The ocean component, FESOM2.5 (Finite volumE Sea-ice Ocean Model, version 2.5; Danilov et al., 2017; Scholz et al., 2019, 2022, FESOM2 hereafter), developed at AWI, features a triangular unstructured mesh and the embedded Finite volumE Sea Ice Model (FESIM; Danilov et al., 2015). Relevant fluxes are coupled between ocean and atmosphere via the OASIS3-MCT4 coupler (Ocean, Atmosphere, Sea Ice, Soil Model Coupling Toolkit, version 4; Craig et al., 2017).
OpenIFS was employed at approximately 100 km horizontal resolution on a cubic octahedral grid (TCo95L91) for higher computational efficiency (Malardel et al., 2016). FESOM2 was employed with an ocean mesh configuration of one-degree nominal resolution, refined near the Equator (), north of 50° N (∼24 km), and near coastlines. In this configuration, FESOM2 consists of approximately 127 000 surface mesh nodes and 47 depth levels implemented under an Arbitrary–Lagrangian–Eulerian (ALE) vertical coordinate scheme, which allows for flexible vertical layer configurations. For our simulations, we employed the z∗ vertical coordinate system (Adcroft and Campin, 2004), which scales vertical layers proportionally to sea surface height, thereby reducing spurious mixing in regions with strong stratification (Petersen et al., 2015; Scholz et al., 2019). Vertical mixing in FESOM2 is parameterized using the K-Profile Parameterization (KPP; Large et al., 1994) scheme, through which locally enhanced vertical diffusivity, set to 0.01 m2 s−1, is implemented to represent convection arising from local static instability. Given that the mesh employed in this study is not eddy-resolving, mesoscale eddy stirring is included via the Gent–McWilliams (GM) parameterization (Gent and McWilliams, 1990), implemented according to the explicit eddy-induced stream-function algorithm of Ferrari et al. (2010), as detailed in Danilov et al. (2017) and evaluated in Scholz et al. (2019).
To enable diagnostics of AMOC in density space, we remapped the model vertical levels onto 89 uneven density bins referenced to 2000 dbar (σ2; kg m−3), ranging from σ2=30–40 kg m−3, following methodologies described by Megann (2018), Xu et al. (2018), and Sidorenko et al. (2020a). The specific bins used in this study are provided in Matos (2025d), and the analysis of the ρ-AMOC sensitivity to the number of bins implemented is discussed in detail in Sidorenko et al. (2020b). The model outputs standard variables in depth space while computing transports in density space during runtime, thereby optimizing storage and computational costs (Sidorenko et al., 2021). In addition to the calculation of z-AMOC and ρ-AMOC, surface-forced diapycnal (ψS) and interior-mixing-induced (ψI) water mass transformations that are the two main components of ρ-AMOC (hereafter referred to as surface and interior transformations) were computed.
2.2 Mathematical Framework and Definitions
Our study adopts the mathematical framework defined in Sidorenko et al. (2020a) and applies the algorithms developed by Sidorenko et al. (2020b) for AMOC diagnostics on unstructured meshes. In these algorithms, the overturning streamfunctions are computed directly on the model's native unstructured mesh using a binning approach that avoids interpolation and preserves mass conservation. Specifically, mesh elements (triangles) or edges intersecting a selected latitude or density bins are identified, and fluxes normal to those sections are integrated using the native finite-volume discretization, ensuring full geometric consistency with the unstructured grid. In the following, we provide the mathematical definitions used in this study:
-
AMOC in depth space (z-AMOC):
where w denotes the vertical velocity that includes the GM bolus component w∗. x and y represent the zonal and meridional distances, respectively, and z represents the depth. The limits from North to y indicate the cumulative integration from a reference latitude (usually the northern boundary of the domain) down to the latitude y. The limits from xE to xW indicate the full integration from the eastern to the western boundary of the domain.
-
AMOC in density space (ρ-AMOC):
where wρ represents the diapycnal velocity across the isopycnal surface ρ, reconstructed from the divergence of horizontal flow within each density bin. In our simulations, the vertical structure of the isopycnals that are binned and converted to diapycnal velocity is dynamically modified during runtime via convective adjustment induced by the KPP parameterization. Consequently, wρ directly incorporates diffusive water mass transformations, which facilitates the decomposition of ρ-AMOC into contributions from surface and interior transformations, and model drift.
-
Surface-forced diapycnal water mass transformations (ψS; surface transformations):
where Fp represents buoyancy flux and Δρ is the size of the density bin. This component reflects surface buoyancy fluxes that are confined to the surface mixed layer and relates the rate of density transformation in a given latitude and density class to the surface buoyancy fluxes into that density class over its outcrop area (Walin, 1982; Speer and Tziperman, 1992).
-
The model drift, , which corresponds to the rate of volume change over time. In our simulations, the model drift was calculated and found to be negligible around the density and latitude of the upper cell maximum (Fig. A2).
-
Interior-mixing-induced water mass transformations (ψI; interior transformations):
This component accounts for transformations forced by diapycnal mixing in the ocean interior, cabbeling and thermobaricity (Megann et al., 2021), excluding mixing caused by surface buoyancy fluxes. Therefore, it accounts for water masses initially driven by surface transformations and subsequently modified in the ocean interior.
Please note that, in our study, the AMOC is computed using vertical velocity, w, rather than the conventional approach based on meridional velocity (v; see Table A1 for the equations). We make this choice because the hydrostatic Boussinesq formulation used by FESOM2 implies incompressibility (Banerjee et al., 2024), which makes both methodologies mathematically equivalent (see Sidorenko et al., 2020b, for a detailed comparison) and because not using meridional velocity is advantageous with the spatial discretization used by FESOM2. Using the meridional velocity would require integration along the boundaries of the control volumes, which is less convenient for arbitrary unstructured meshes, and it would also neglect important information about diapycnal velocities. In contrast, the vertical velocity approach naturally yields the AMOC in density space, reduces noise introduced by the beforementioned integration along the boundaries of the control volumes, and enables more efficient online diagnostics in FESOM2 (Sidorenko et al., 2020a, 2021). Additionally, since model drift is negligible during model runtime and at the density range of the upper cell (Fig. A2), surface and interior transformations constitute the only ρ-AMOC components in our simulations.
Figure 1a and b display the meridional overturning in the Atlantic basin in density space. In PI (Fig. 1a), four cells that are associated with different water masses can be identified:
-
the mid-depth clockwise cell, located within the density classes of σ2=36–36.9 kg m−3: this is the cell that we define as ρ-AMOC, that is associated with NADW formation in the subpolar North Atlantic. Its maximum overturning recirculation, located between the latitudes of 40–60° N, will be referred throughout this study as the ρ-AMOC maximum for simplicity;
-
the shallower clockwise cell above the ρ-AMOC, located within the density classes of σ2=32–36 kg m−3: this cell will be referred as the subtropical gyre cell and is centered at 25° N, representing the diapycnal component of the subtropical gyre associated with Subtropical Mode Water formation (Megann, 2018; Groeskamp et al., 2019);
-
the abyssal anticlockwise cell bellow the ρ-AMOC, located within the density classes of σ2=36.9–37.05 kg m−3: this cell represent the Antarctic Bottom Water (AABW) entrainment in the Atlantic Ocean, from the Southern Ocean (Orsi et al., 1999).
-
the weaker clockwise cell north of the ρ-AMOC, located within the density classes of σ2=36.4–37.05 kg m−3: this cell, confined to the latitudes of 60–80° N, represent the Nordic Seas Overflow Waters (NSOW), which are formed in the Greenland, Iceland, and Norwegian (GIN) Seas and exported southward across the Greenland–Scotland Ridge through topographically constrained passages, and contribute to NADW formation via entrainment into the Atlantic Ocean (Saunders, 2001).
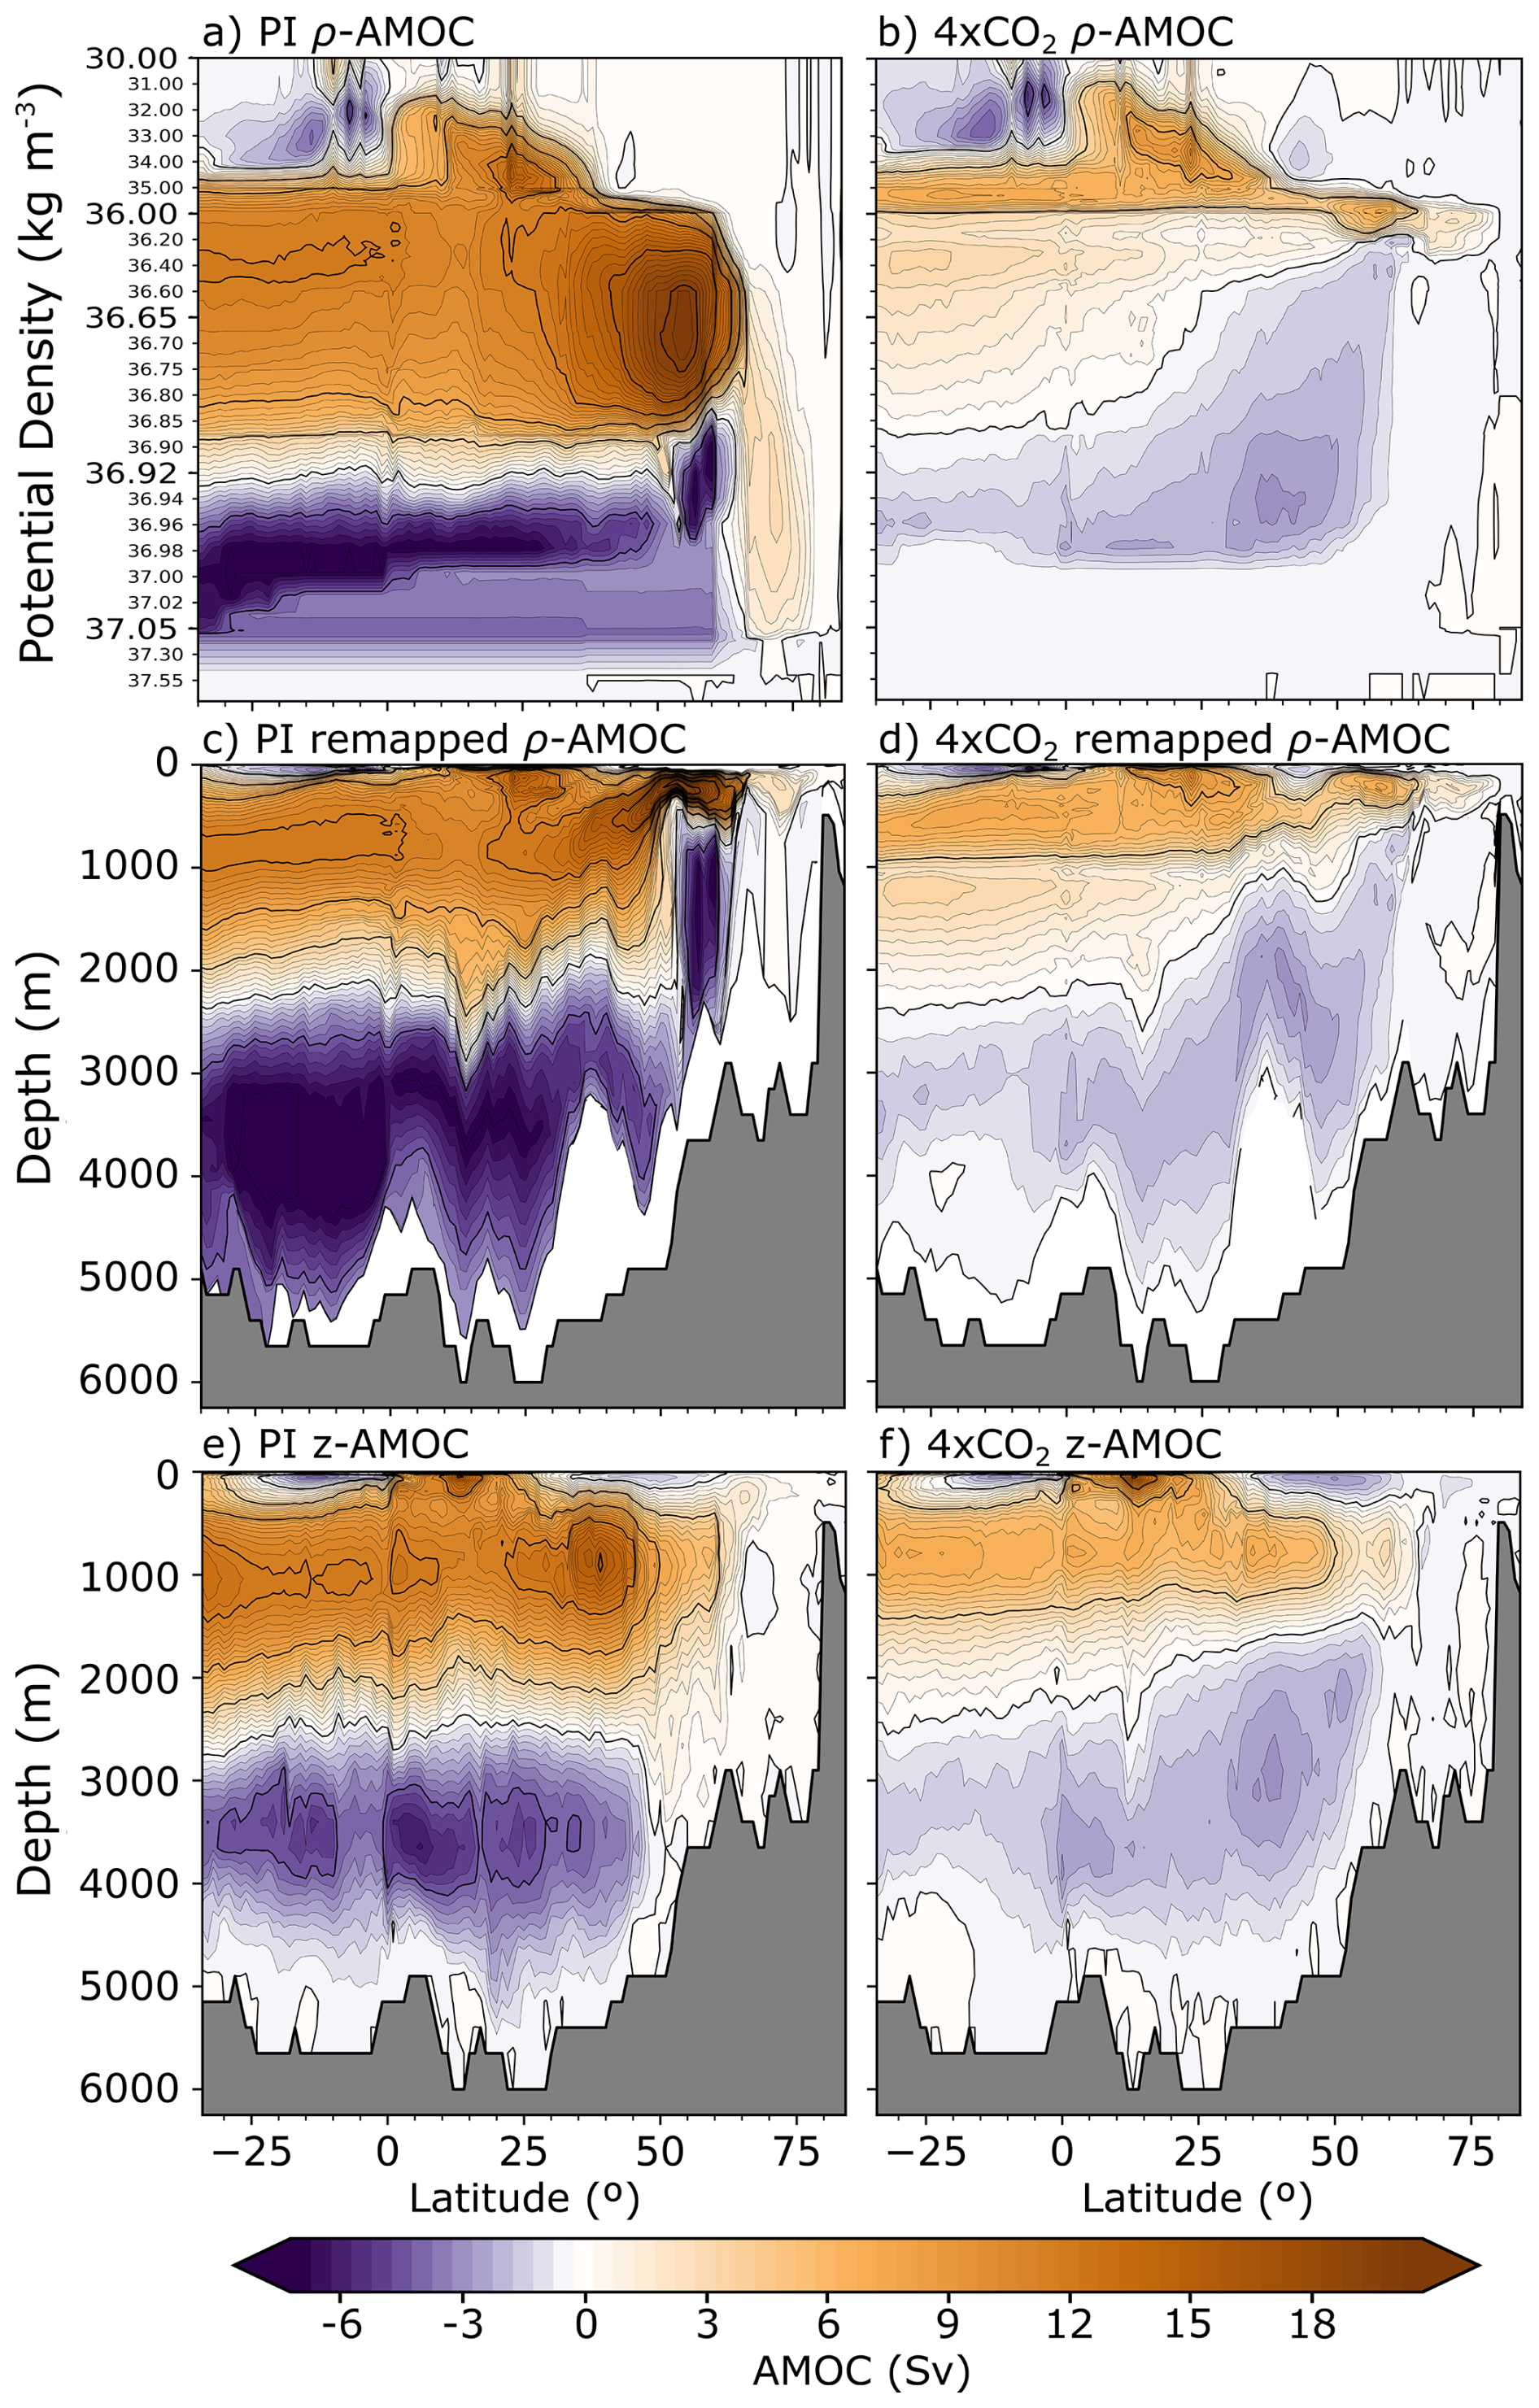
Figure 1Mean AMOC strength in units of Sverdrup (1 Sv ≡106 m3 s−1) averaged over the last 50 years of the PI and 4xCO2 simulations. Panels show (a, b) ρ-AMOC, (c, d) ρ-AMOC remapped into depth coordinates, and (e, f) z-AMOC for (a, c, e) PI and (b, d, f) 4xCO2. In (c, d), ρ-AMOC is remapped into depth coordinates by loading the mean layer thickness of each density class, cumulatively summing these thicknesses to obtain the bottom depth of each class, then shifting the cumulative sum down one index (with the surface layer reset to zero) so that each transport bin appears at the depth of its upper boundary.
Conversely, Fig. 1e and f display the meridional overturning in the Atlantic basin in depth space. In comparison with Fig. 1, the mid-depth clockwise cell (z-AMOC) in Fig. 1e extends from 750–1500 m up to 55° N, with its maximum located between 30–45° N. The abyssal cell is centered near 4 km depth and reaches up to 45° N, with strengths ranging from 2–6 Sv. The subtropycal gyre cell is confined to the upper 500 m and centered around 20° N, in contrast to its more poleward location in density space. Another difference between the frameworks is that the AMOC and abyssal cell maxima appear stronger in density space, while the subtropical gyre maximum is weaker. Overall, the apparent southward displacement of all three cells in depth space relative to density space arises from the averaging of sloping isopycnals into constant-depth intervals in the subpolar North Atlantic. Specifically for the AMOC maximum, this subtropical location is also evident in the z-AMOC representation of many ocean, climate, and Earth System models (Baker et al., 2025), highlighting a systematic bias that arises from the z-AMOC diagnostics.
To facilitate direct comparison between ρ-AMOC and z-AMOC and visualizing not only the better latitudinal coherence of the ρ-AMOC maximum in PI but also of the other before-mentioned cells, we also remapped ρ-AMOC onto depth levels (Fig. 1c and d). Moreover, we provide a detailed comparison of the location and strength of the ρ- and z-AMOC maxima under PI and 4xCO2 conditions in Table 1.
Table 1Location and strength of the ρ- and z-AMOC maxima, computed as the average of the last 50 years of each simulation.
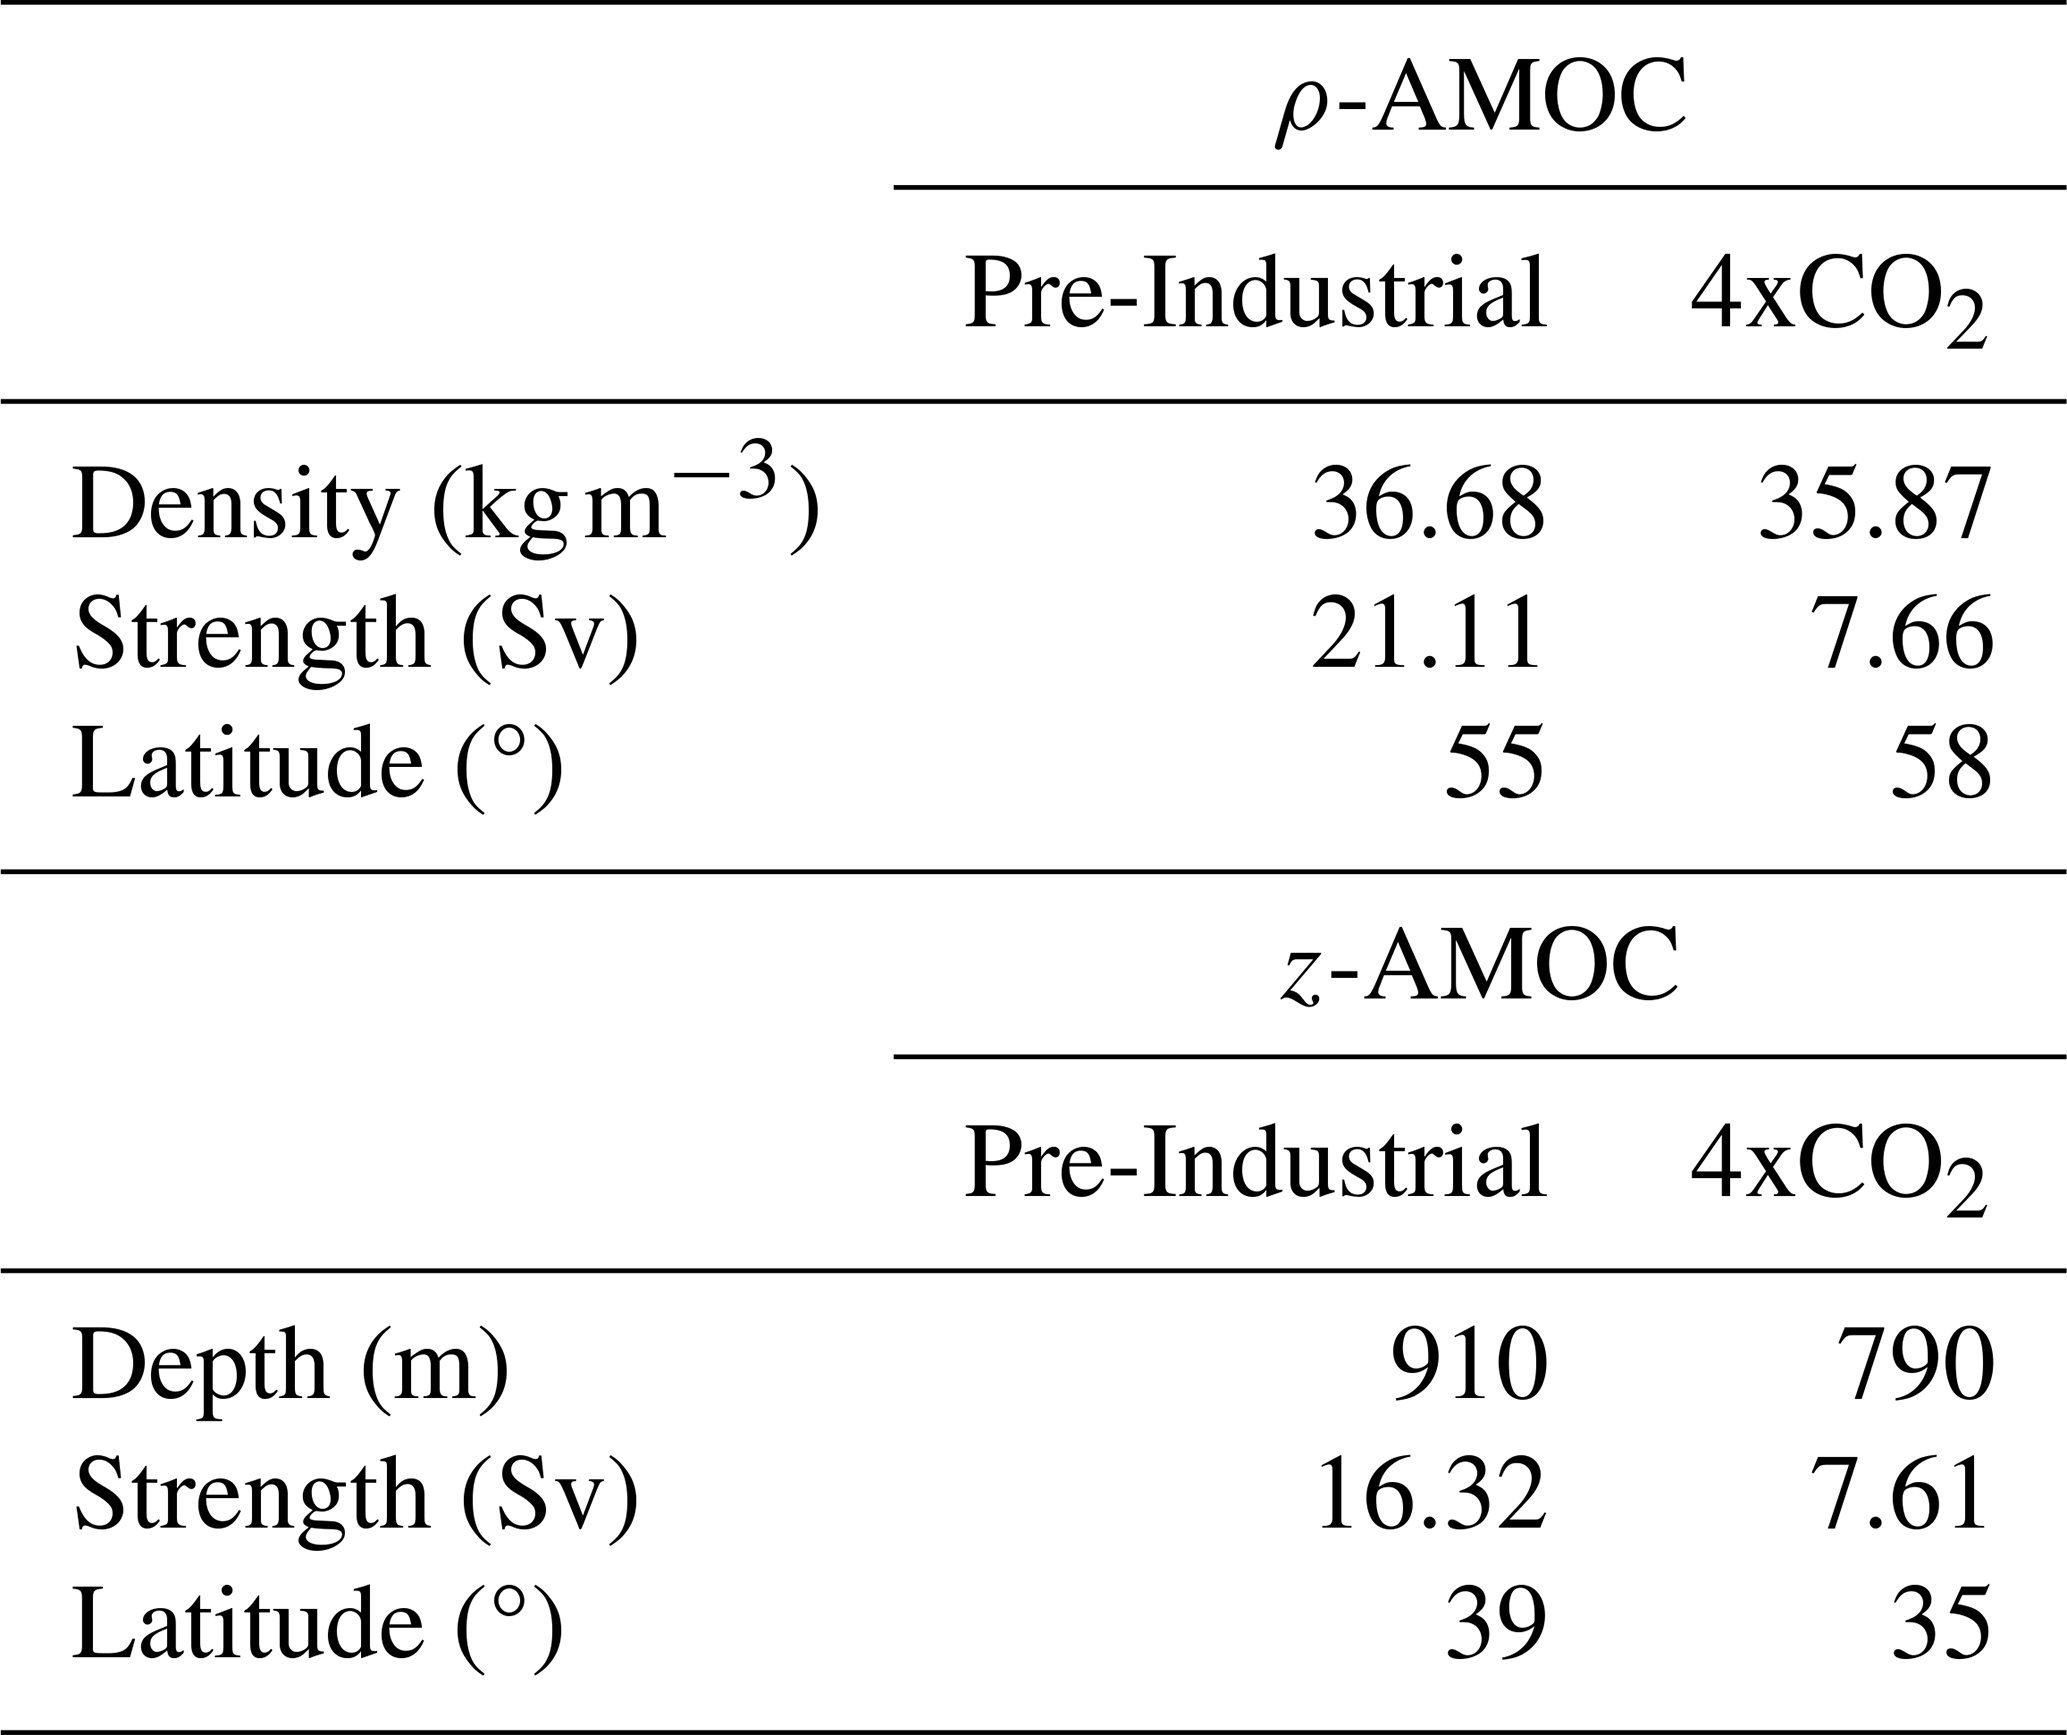
In 4xCO2, the ρ-AMOC maximum weakens significantly to 7.66 Sv in comparison to its PI strength of 21.11 Sv, accompanied by a shift in density from σ2=36.68–35.87 kg m−3. Such an upward shift of the AMOC maximum can also be referred to as AMOC shoaling and is a common feature in modelling studies that employ elevated radiative forcing with respect to the pre-industrial climate (Matos et al., 2020; Baker et al., 2025). The latitude of the maximum undergoes a northward shift, from 55–58° N (Fig. 1a and b), directly followed by the NSOW signature that shifts to the same density class. Both of these shifts are associated with sea ice loss and subsequent increase of deep convection in the GIN Seas that modify the density and rate of entrainment of NSOW into the North Atlantic (Chafik and Rossby, 2019). Similarly, the z-AMOC maximum strength declines from 16.32 Sv in PI to 7.61 Sv under 4xCO2 conditions, with a corresponding shoaling from 910 to 790 m but with a southward shift in latitude from 39–35° N (Fig. 1e and f, Table 1). Overall, Fig. 1 highlights two major consequences of quadrupling atmospheric CO2 concentrations to the AMOC in both frameworks: (1) the AMOC weakening and shoaling, and (2) the AABW weakening and upward expansion. These findings regarding the AMOC mean state in PI and under a warmer climate, both in depth and density space, corroborate those from other models with similar configurations (Xu et al., 2018; Sidorenko et al., 2020a, 2021; Megann, 2018; Megann et al., 2021; Baker et al., 2025), which increases confidence that the simulated mechanisms are robust features of the AMOC response to strong radiative forcing.
To evaluate the consistency of these phenomena across our 200 year integration period, we define two AMOC indices in both density and depth spaces, derived from the streamfunction of each model year: (1) AMOCmax, denoting the annual maximum overturning between north of 50° N, representing subpolar AMOC; and (2) AMOC26, denoting the annual maximum overturning at 26° N, representing the subtropical AMOC. The indices were generated within the entire density range for ρ-AMOC, and below 500 m for z-AMOC, generating continuous 200-point time series for each index.
Figure 2 displays the time series of both indices, with annual means represented by thin lines and 15 year running means superimposed as thick lines to attenuate interannual fluctuations and accentuate multi-decadal variability. A first-degree polynomial trend was fitted and subtracted from the multi-decadal time series to facilitate correlation analysis using Pearson's correlation test (Table A2). Furthermore, the magnitude of AMOC variability was quantified by its standard deviation (σ). Please note that 50 year averages previously referenced relate exclusively to the climatological fields (mean state) depicted in Fig. 1.
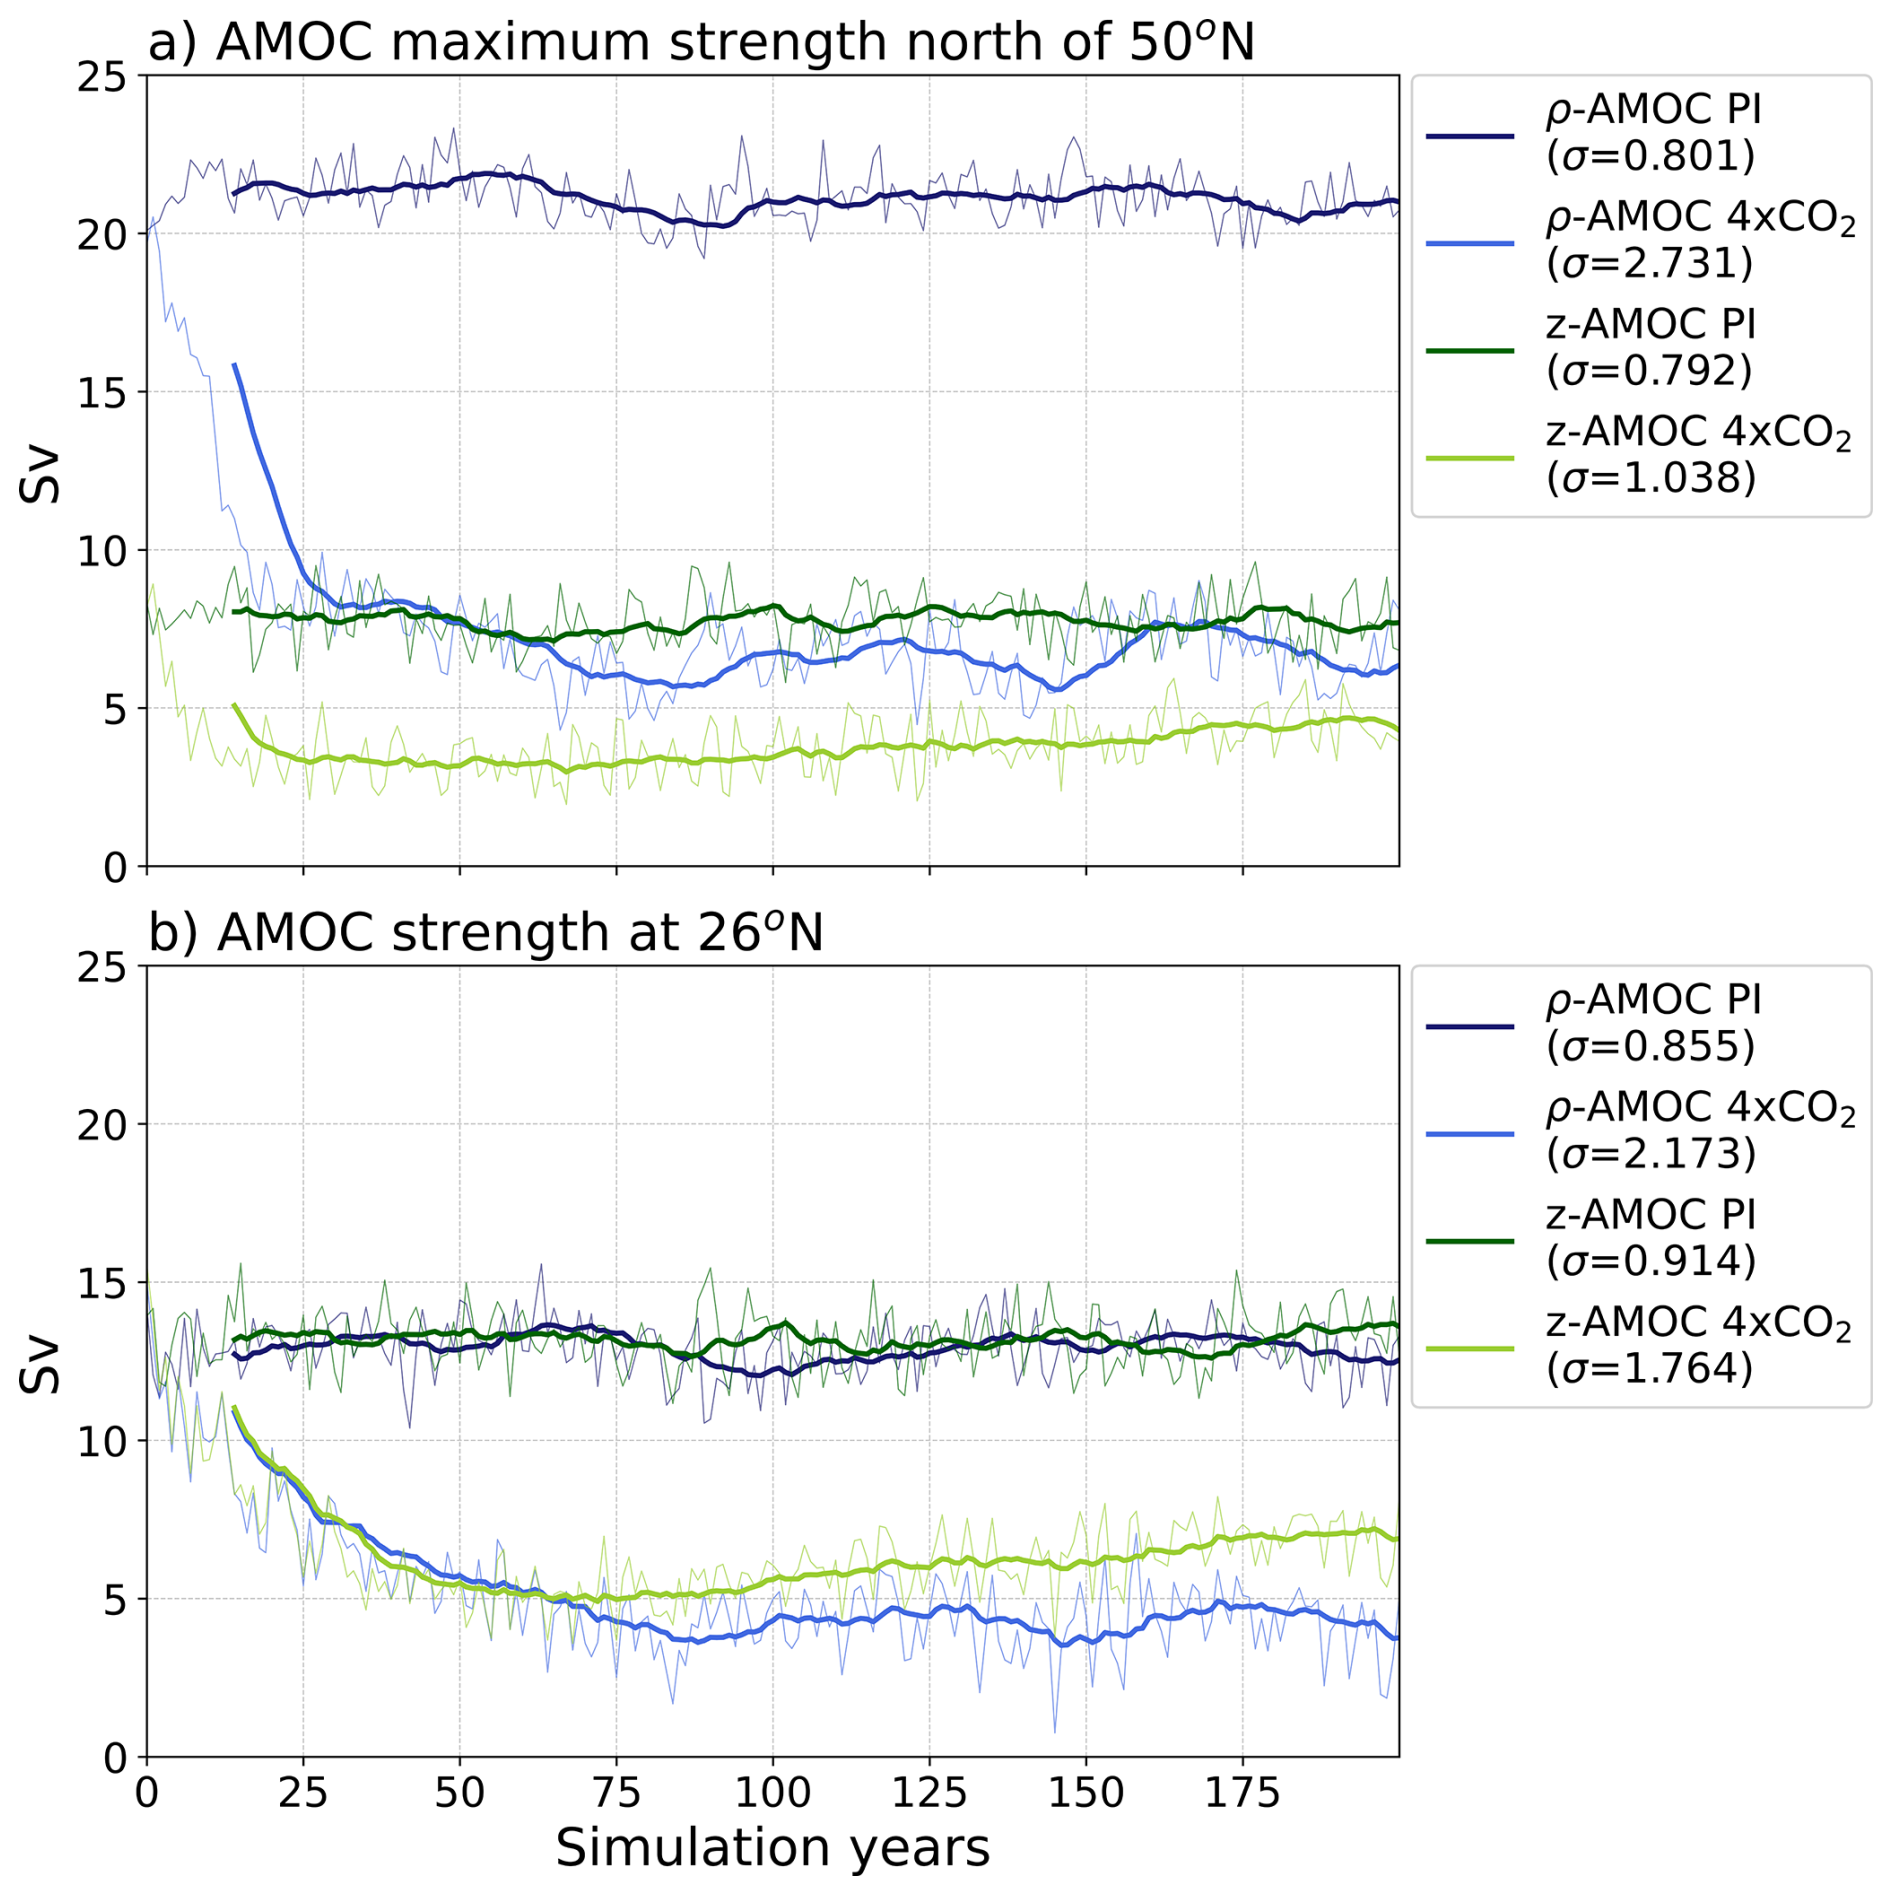
Figure 2Annual mean time-series (thin lines) of ρ-AMOC (dark blue, royal blue) and z-AMOC (green, yellowgreen) in units of Sverdrup (Sv) under PI (dark blue, green) and 4xCO2 (royal blue, yellowgreen) forcing with superimposed 15 year rolling mean (thick lines). (a) AMOC strength at 26° N (AMOC26 index), (b) maximum AMOC strength north of 50° N (AMOCmax index).
The AMOC26 and AMOCmax indices (Fig. 2) emphasize that the choice of framework significantly influences the interpretation of AMOC changes to different forcings across latitudes. In PI (Fig. 2a), ρ-AMOCmax is about 13 Sv stronger than z-AMOCmax, with both displaying similar intra- to multi-decadal variability, but not correlated (Table A2). This difference in magnitude arises from the distinct latitudinal location of the AMOC maximum in density and depth space and has implications for the comparison of z-AMOC with AMOC observations in the SPNA, potentially creating model-observation discord and adding further uncertainty to assessments of the AMOC state as the climate continues to change. Under 4xCO2 conditions, the magnitude of AMOC weakening is similar in both diagnostics until simulation year 50. Thereafter, ρ-AMOCmax and z-AMOCmax diverge in both magnitude and variability, with z-AMOCmax displaying a slight recovery toward the end of the simulation and ρ-AMOCmax oscillating around 7 Sv, suggesting a mechanism that inhibits AMOC recovery that is concealed in depth space diagnostics. Moreover, z-AMOCmax in PI and in 4xCO2 are weaker than at 26° N, which highlights the fact that z-AMOC does not display overturning in the subpolar North Atlantic, as its maximum is located at 39° N and not at 50° N.
The AMOC26 time series (Fig. 2b) further underscore the influence of framework choice to the interpretation of the AMOC strength and variability. In PI, both ρ-AMOC26 and z-AMOC26 exhibit interannual to multi-decadal variability, with an average strength of approximately 13 Sv. The equivalent ρ-AMOC26 and z-AMOC26 strengths in PI are attributable to the less steep isopycnals in subtropical regions, which are more closely aligned with z-coordinates, thus enhancing the similarity of z- and ρ-AMOC (Wett et al., 2025; Moat et al., 2025). In contrast, in 4xCO2, ρ-AMOC26 and z-AMOC26 diverge substantially in magnitude and variability, suggesting that continued diagnosis of the AMOC in depth space, even in subtropical-focused studies predicated on their similarity under pre-industrial conditions, may lead to biased conclusions. In summary, Figs. 1 and 2 together demonstrate that the two frameworks, despite targeting the same circulation, can yield fundamentally different representations and interpretations of AMOC sensitivity to climate change. Ultimately, the broader question of which framework is more physically meaningful and advantageous, whether in model-based studies or in observational analyses, remains open, particularly when assessing the AMOC in climates warmer than present.
Regarding the influence of background climate on the AMOC, previous modelling studies have indicated that the extent of AMOC decline under increased radiative forcing depends on initial AMOC strength and subsequent changes in large-scale climate patterns, including surface air temperature, precipitation and sea-ice concentration (Bellomo et al., 2021; Zhao et al., 2024; Sigmond et al., 2020). These investigations indicate a tendency for models exhibiting stronger (weaker) AMOC in the control state to manifest a greater (smaller) degree of AMOC weakening. However, our modelling effort reveals that these conclusions might require revision once more research institutes adopt the ρ-AMOC diagnostics in their simulations, as our PI ρ-AMOCmax (stronger) and z-AMOCmax (weaker) reach a comparable strength in at the end of the 4xCO2 simulation. Because these two magnitudes are derived within the same simulation, the large-scale climatic consequences of quadrupling CO2 remain identical, even though the interpretation of the AMOC's role in driving these changes depends on the chosen diagnostics. We certainly do not aim at questioning the discussions arising from AMOC analyses in these or other studies, but simply refer to the fact that the AMOC is usually stronger in the subpolar North Atlantic in density space in comparison to depth space, therefore, the degree of ρ-AMOC weakening tends to be greater than in z-AMOC (Baker et al., 2025). Furthermore, the implementation of ρ-AMOC as a standard output may lead to convergence between models previously exhibiting diverging AMOC strengths, as the magnitude of strength and weakening may be framework-dependent. Therefore, our findings suggest that calculating AMOC solely in depth space may underestimate both the magnitude of AMOC weakening and its long-term impacts.
In addition to the relation between AMOC initial strength and subsequent weakening, Bellomo et al. (2021) demonstrated AMOC recovery occurring after surface air temperature stabilizes. However, even upon reaching quasi-equilibrium, our simulations show that this recovery only holds true for z-AMOC, with ρ-AMOC showing damped oscillations around a nearly collapsed state, which contradicts the recent hypotheses of AMOC collapse in warmer climates (Ditlevsen and Ditlevsen, 2023). These damped oscillations can be attributed to feedbacks involving interactions between AMOC and Arctic and Antarctic winter sea-ice throughout the simulation period (Zhao et al., 2024; Nobre et al., 2023). Additionally, previous studies suggest that winter sea-ice loss in the Arctic leads to increased freshwater input into the Atlantic and Pacific basins via Arctic gateways, which directly influences interior cross-isopycnal mixing through entrainment of overflows with fresher and warmer characteristics, thereby reducing or disrupting deep-water formation (Ionita et al., 2016; Mecking et al., 2017; Liu and Fedorov, 2022). An intensified hydrological cycle is also suggested as a potential driver of AMOC weakening due to freshwater forcing from runoff and the melting of land and sea-ice (Sévellec et al., 2017). In fact, the Arctic winter sea-ice area through our simulation (Fig. 3) reveals a similar multidecadal variability superimposed onto the intra-decadal variability of both ρ-AMOC indices, suggesting that Arctic winter sea ice loss and subsequent increased entrainment of lighter overflow waters constitute one of the mechanisms driving the AMOC weakening in our 4xCO2 simulation.
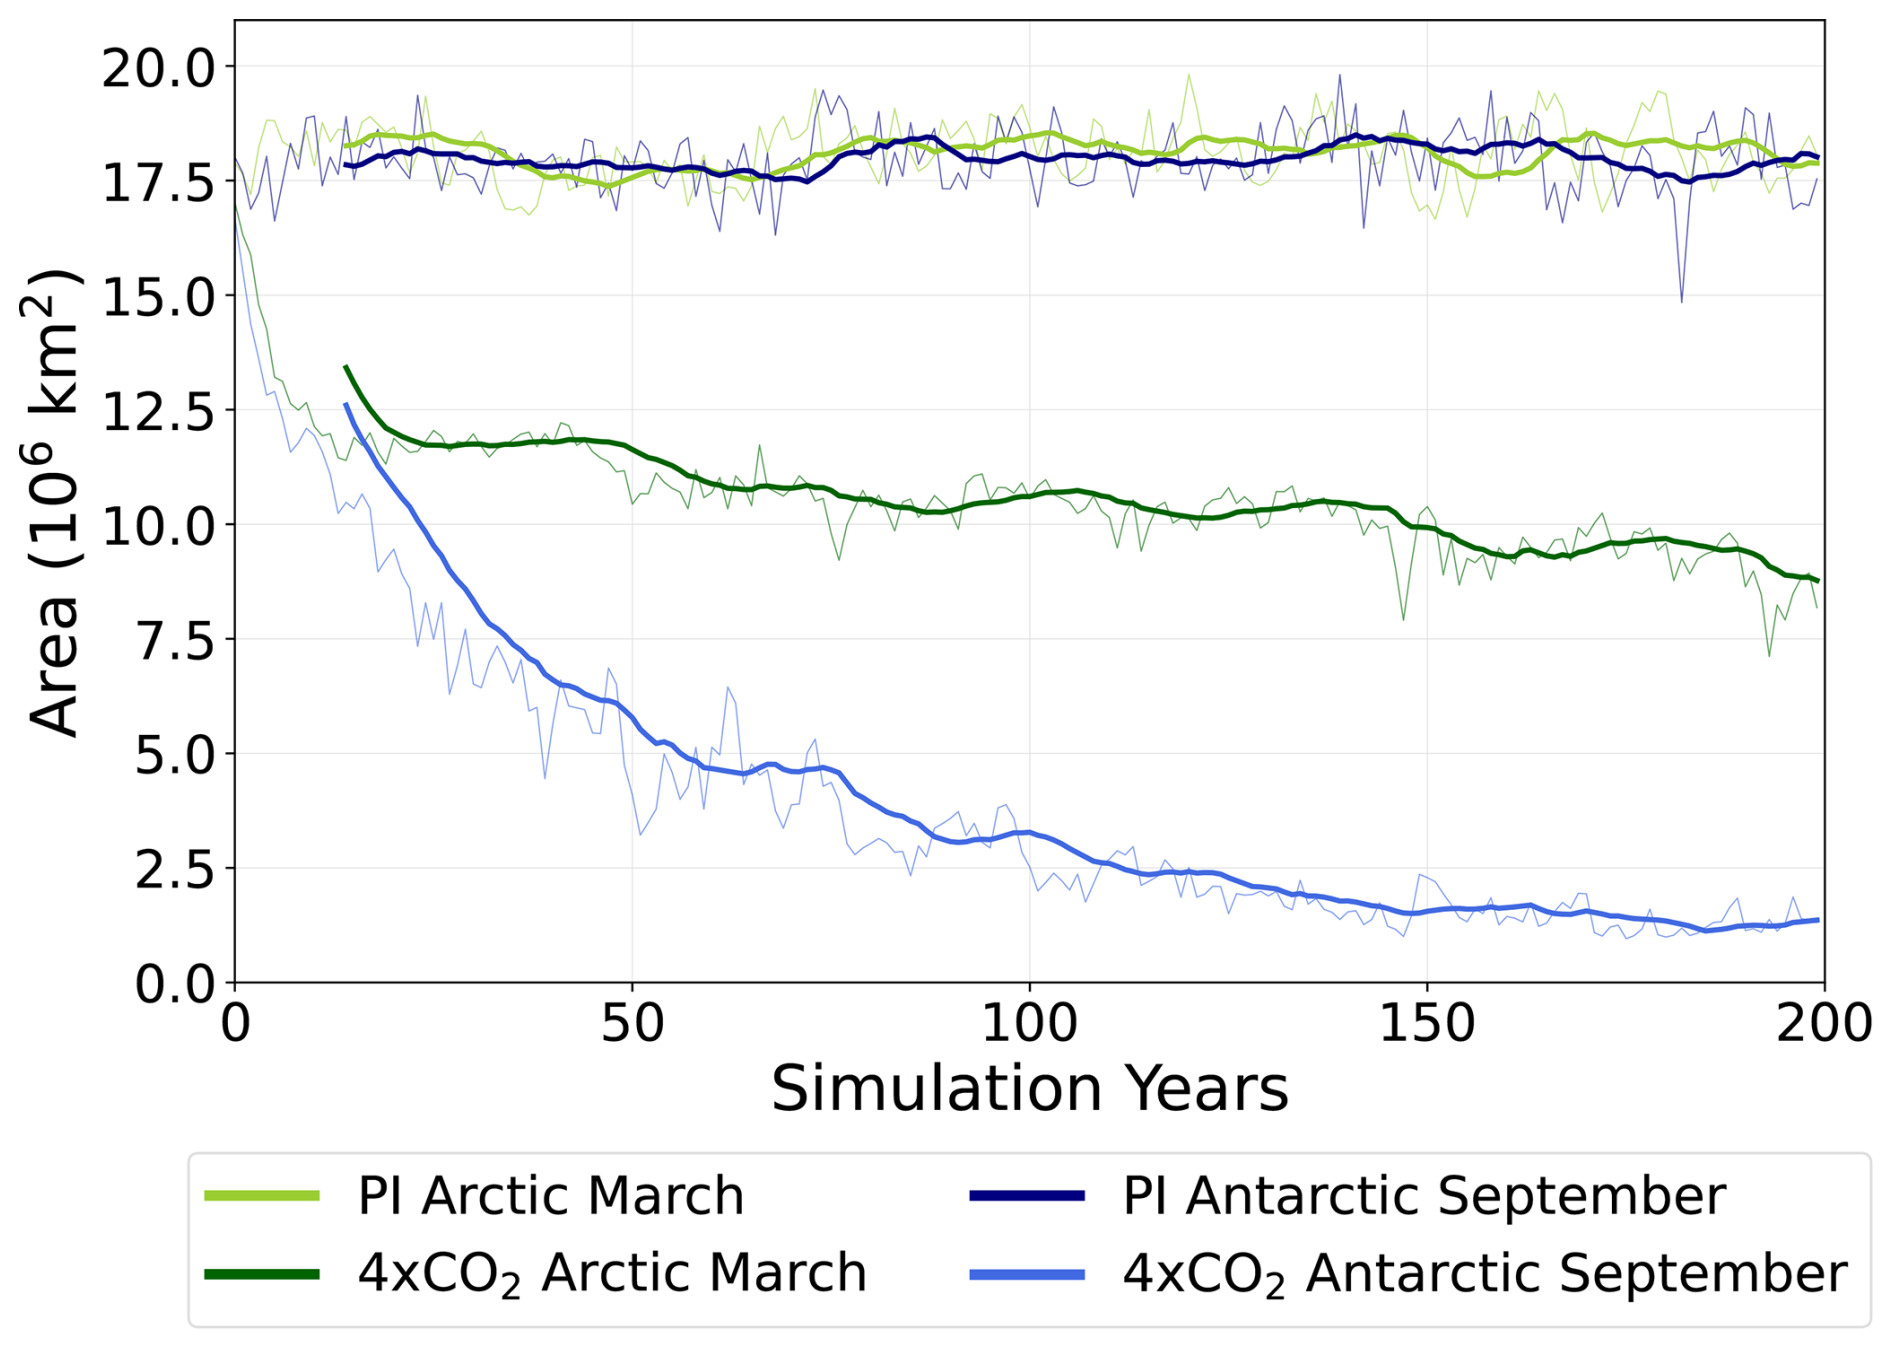
Figure 3Winter Sea ice area in the Arctic and Southern Oceans in PI and 4xCO2 simulations. Annual means are represented in thin lines and a superimposed 15 year rolling mean is represented in thick lines to highlight multidecadal variability.
However, such a relationship is not apparent upon comparing z-AMOC and Arctic winter sea ice area curves, indicating that stable sea-ice loss resulting from a 4xCO2 climate establishes a new regime of persistently weak AMOC and may preclude AMOC recovery, at least on interannual to centennial timescales. On the other hand, some studies indicate a z-AMOC recovery due to the salinization of the surface ocean layers driven by increased net-evaporation over the North Atlantic in warmer climates (e.g. Weijer et al., 2020; Ackermann et al., 2020), which contradicts our ρ-AMOC results and supports our z-AMOC results. However, the magnitude and timescale of this recovery vary greatly among the model simulations (Bonan et al., 2022; Zhao et al., 2024; Nobre et al., 2023), which increases the uncertainty in the AMOC state in warm climates when diagnosed in depth space. Additional climatic phenomena have been suggested as drivers or contributors to AMOC weakening, especially in the common era, such as atmospheric blocking, meso- to submesoscale dynamics, and increase in atmospheric CO2 driving sea-ice and ice sheet melting (Ionita et al., 2016; Mecking et al., 2017; Liu and Fedorov, 2022). However, to derive such analyses, we must have model output at finer time and spatial resolutions, and transient simulations, respectively. Our simulations, however, were performed in a quasi-equilibrium formulation without dynamical ice sheets, deriving annual ρ-AMOC output and at a relatively coarse resolution. Further studies tackling the AMOC sensitivity to multiple forcings, resolutions, and components of the Earth system, while comparing both diagnostics would be beneficial to increase the confidence in our understand of the AMOC dynamics across multiple scales.
As detailed in Sect. 2, the diapycnal velocity we diagnose inherently reflects water mass transformations. This provides a natural framework for investigating the respective contributions of surface and interior transformations to the AMOC response to abrupt climate change. These analyses are not performed in depth space here for two main reasons. First, in depth coordinates, changes in density at a given depth from both surface buoyancy forcing and interior mixing are superimposed, making it challenging to disentangle their individual contributions. Additionally, buoyancy fluxes, driven by heat and freshwater exchanges, act primarily along density surfaces rather than depth levels, therefore diagnosing them in depth-space may lead to more biases arising from averaging across constant depth intervals (Walin, 1982). In contrast, in density space, interior transformations can be obtained directly from the difference between the overturning streamfunction, model drift, and surface transformations (Eq. 3). This approach is less convoluted and allows for a clearer attribution of density changes in the mixed layer to modifications in the thermohaline properties of water masses and mixing with waters advected from, and to, other regions.
Surface transformations (ψS; Fig. 4a and c), are not intrinsically suited for water mass tracking since they measure only the magnitude and sign of diapycnal transformations (Xu et al., 2018). Nevertheless, they indicate upwelling or downwelling of water masses and provide attribution of their latitudinal circulation regimes based on the density range of each transformation cell. In the pre-industrial simulation (Fig. 4a), three main surface transformation cells can be identified within the latitudinal limits of the AMOC upper limb:
-
a tropical cell centered at σ2=31.5 kg m−3, that enters the basin from the south and upwells at around 10° N, were the peak anticlockwise overturning is reached;
-
a subtropical cell centered at σ2=35 kg m−3, that becomes progressively denser due to buoyancy loss in the subtropics, thereby reaching a maximum of 40° N; and
-
a subpolar cell, that occupies the density classes between σ2=36.75–37 kg m−3, flowing northward until ∼65° N, where it becomes denser, and return southwards as the NADW.
The Antarctic Intermediate Water (AAIW) can also be identified within the subpolar cell at intermediate density (σ2≈36.55 kg m−3) and is originated in the Southern Ocean at intermediate density levels due to its low temperature and salinity contrast (Santoso and England, 2004). In summary, surface transformations occur toward lighter waters in the tropics, and toward denser waters in the subtropical and subpolar North Atlantic in PI, but do not fully resembles the ρ-AMOC structure as depicted in Fig. 1a, which arises from the sum of surface and interior transformations in our simulation (as model drift is negligible). Therefore, the three cells identified in Fig. 4a are modified by interior transformations that either reinforce or counteract their contribution of surface transformations to the overturning circulation. Within the tropical cell, interior transformations act towards denser waters, while in the subtropical cell they act towards lighter waters, thereby counteracting surface transformations. This interplay results, in Fig. 1a, in the clockwise (downwelling) circulation for σ2<32 kg m−3 south of the Equator and anticlockwise (upwelling) circulation before the shallower secondary maxima in the subtropical North Atlantic. At higher densities, interior transformations drive the AMOC maximum recirculation cell, indicating the entrainment of water masses and processes associated with the non-linearity of the equation of state (e.g. cabbeling and thermobaricity), that contribute to NADW formation in the North Atlantic at σ2=36.8–36.9 kg m−3. The abyssal cell associated with Antarctic Bottom Water (AABW) in Fig. 1 appears in Fig. 4b as an anticlockwise cell counteracting surface transformations for σ2=36.8–37 kg m−3. The signature of NSOW north of 60° N and σ2=36.4–37.05 kg m−3 is also present, which indicates that its contribution to ρ-AMOC is primarily driven by interior transformations.
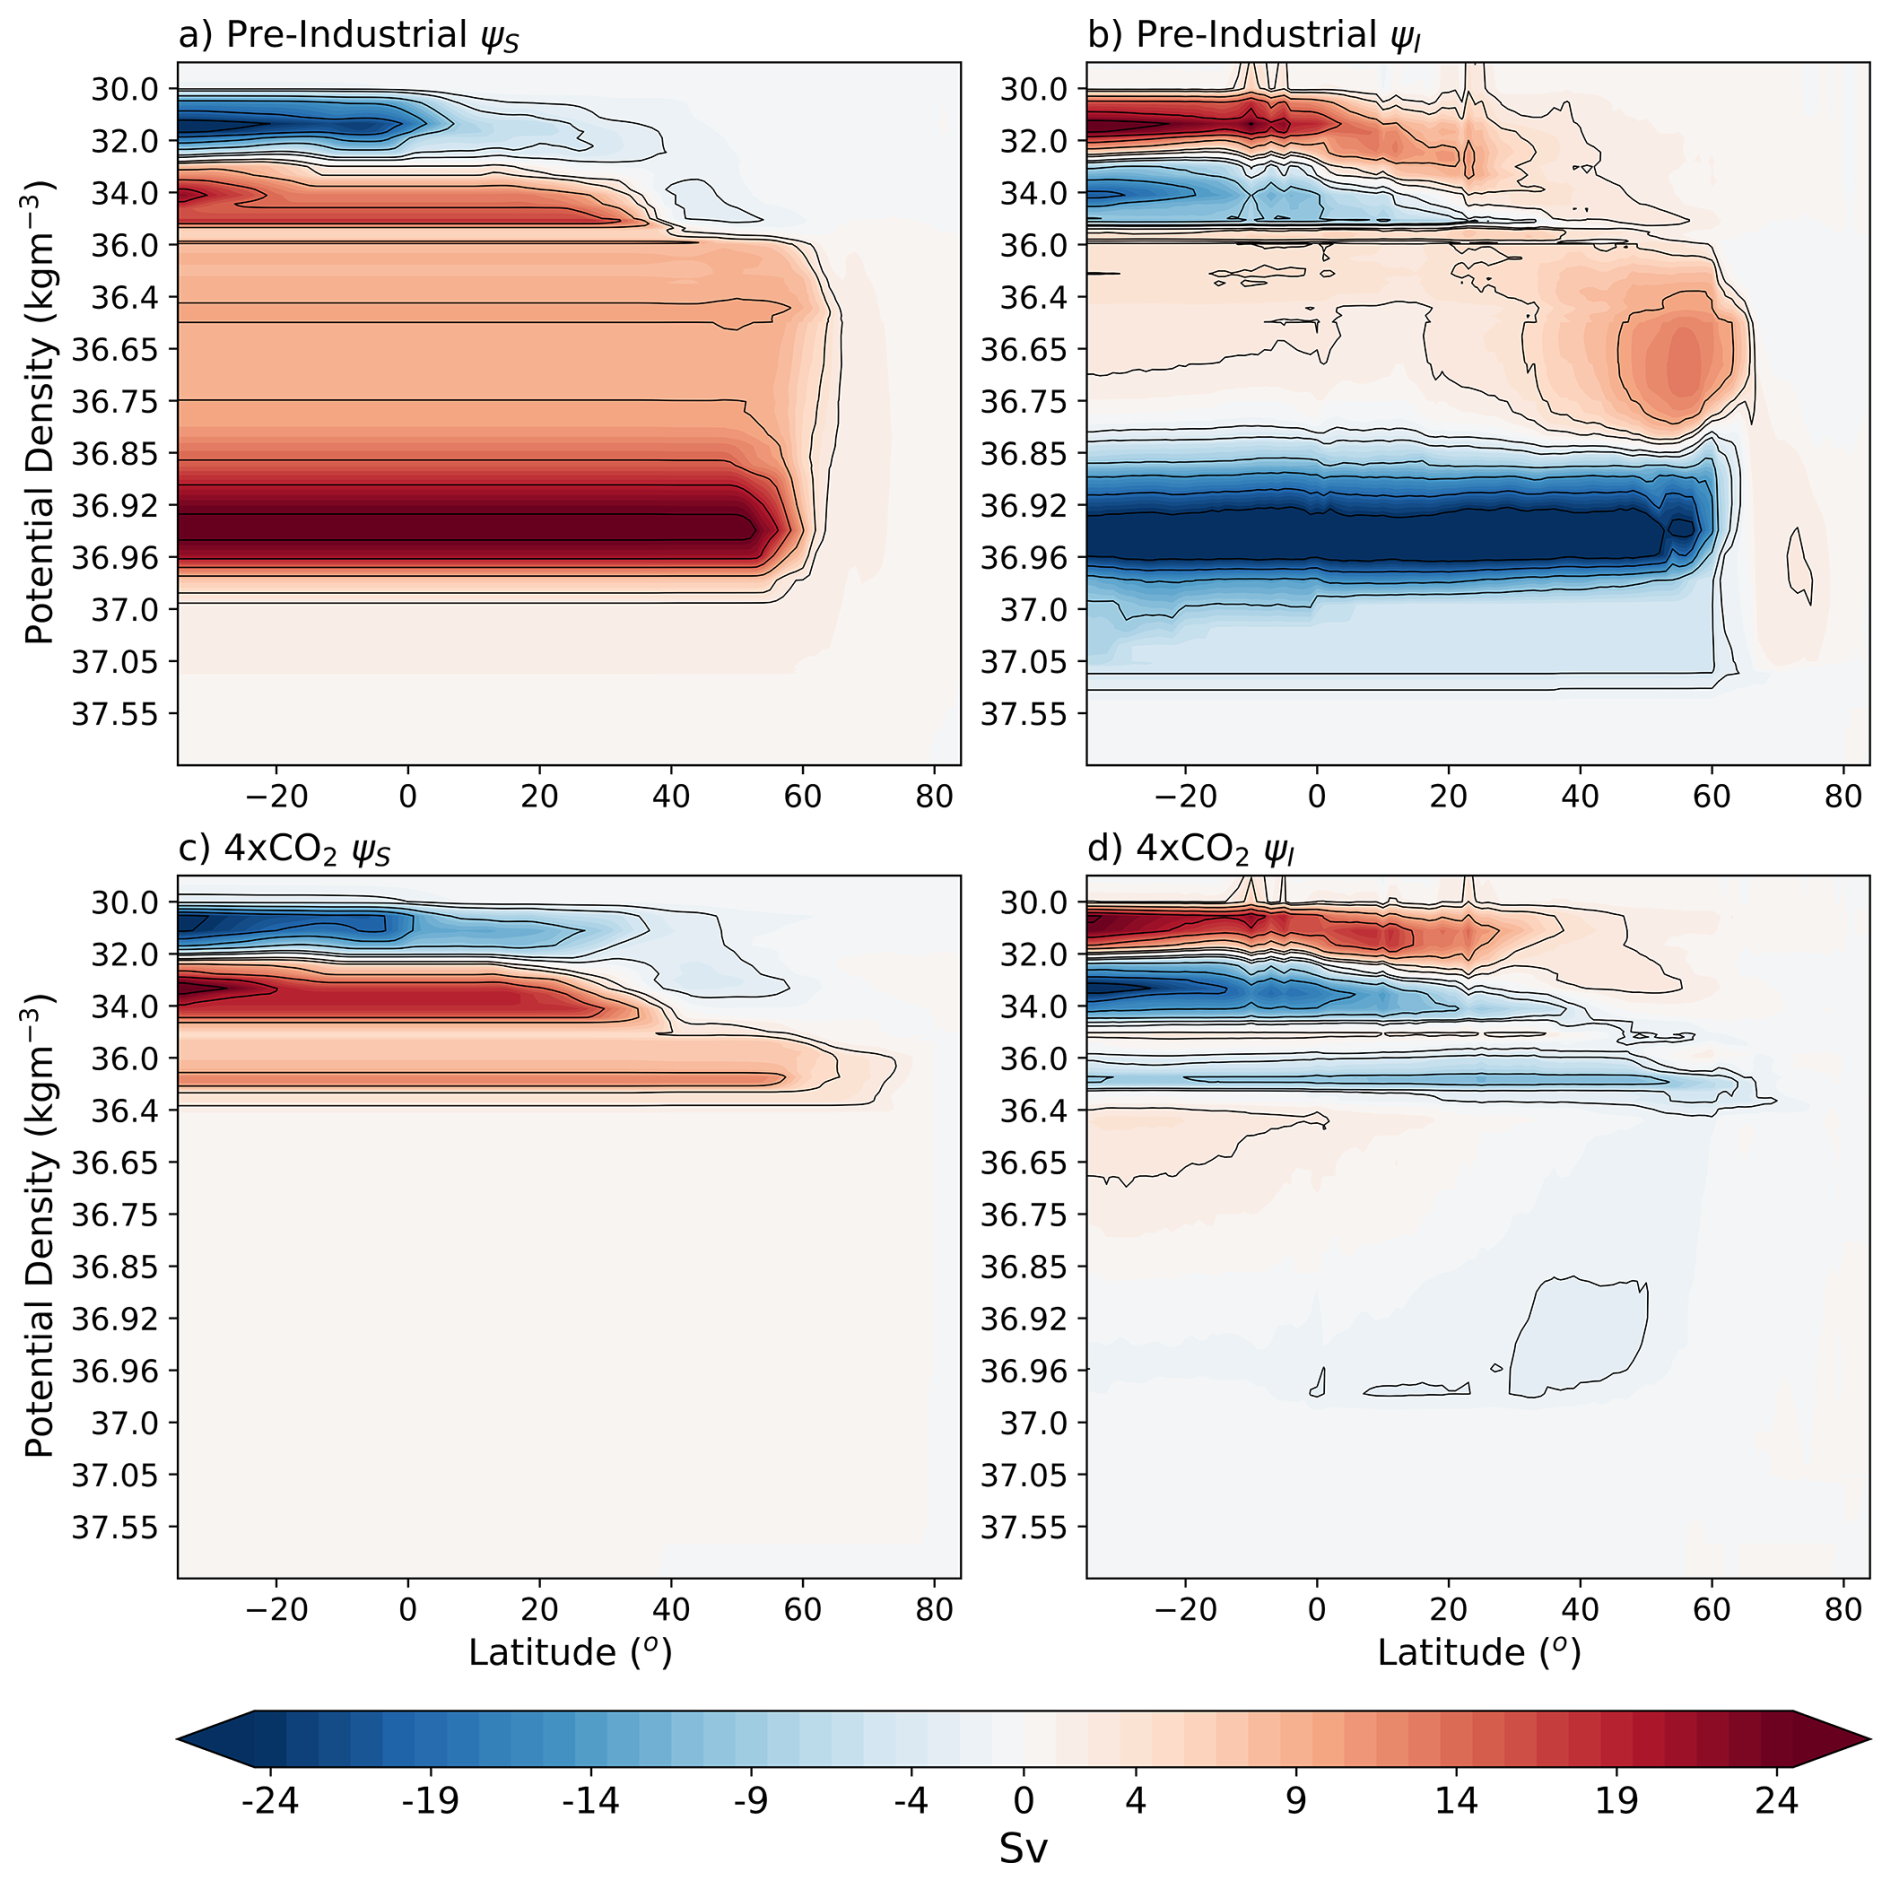
Figure 4Mean surface (ψS; a, c) and interior (ψI; b, d) water mass transformation streamfunctions in (a, b) PI and (c, d) 4xCO2, respectively. Blue contours indicate upwelling (i.e., transformations toward lighter waters), while red contours indicate downwelling (i.e., transformations toward denser waters).
In 4xCO2 (Fig. 4c and d), a similar counterbalance between surface and interior transformations occurs in the tropics and subtropics. While their individual contribution to water mass transformations in these regions is stronger, the net result is a weaker secondary maximum than in Fig. 1a. In the subpolar cell, both surface and interior transformations occur at lighter density classes, reflecting shoaling of the ρ-AMOC. This shift is accompanied by a large-scale reduction in meridional heat transport to the subpolar North Atlantic of approximately 0.2 PW between 30 to 65° N (Fig. 5), which is consistent with the decrease of about 4 Sv in surface transformations in this region (Fig. 4c). Concurrently, interior transformations within the subpolar cell act toward lighter rather than denser waters, yielding a net ρ-AMOC weakening. This suggests that the NSOW contributes with lighter waters to NADW formation in comparison to PI, occupying the same density classes of the subpolar cell in Fig. 1b in comparison to Fig. 1a. Moreover, the abyssal cell remains identifiable as an anticlockwise deep cell in Fig. 4d albeit at much reduced magnitude and occupying density classes from σ2=36.4–37 kg m−3, consistent with the weakened and upward-expanded AABW in Fig. 1b. Overall, this reversal in contribution of interior transformations to the AMOC strength, concurrently with its pronounced multidecadal variability (Fig. 6f and h) driven by modifications in the entrainment of lighter overflows attributed to extensive Arctic winter sea ice loss (Fig. 3), yields the dampened oscillation of ρ-AMOCmax and ρ-AMOC26 in 4xCO2 (Fig. 2). This suggests that the variability of interior transformations in the subpolar North Atlantic is the main driver of ρ-AMOC variability. Nevertheless, surface transformations remain the dominant driver of ρ-AMOC strength throughout the simulation (Fig. 6a, c, e, and g), predominantly forced by heat flux contributions toward denser waters in both PI and 4xCO2 (Fig. A1). This implies that the cooling of the upper ocean within the subpolar North Atlantic triggers deep convection, which is either reinforced (in the PI case) or dampened (in the 4xCO2 case) by interior transformations, modulated by the variability of the latter.
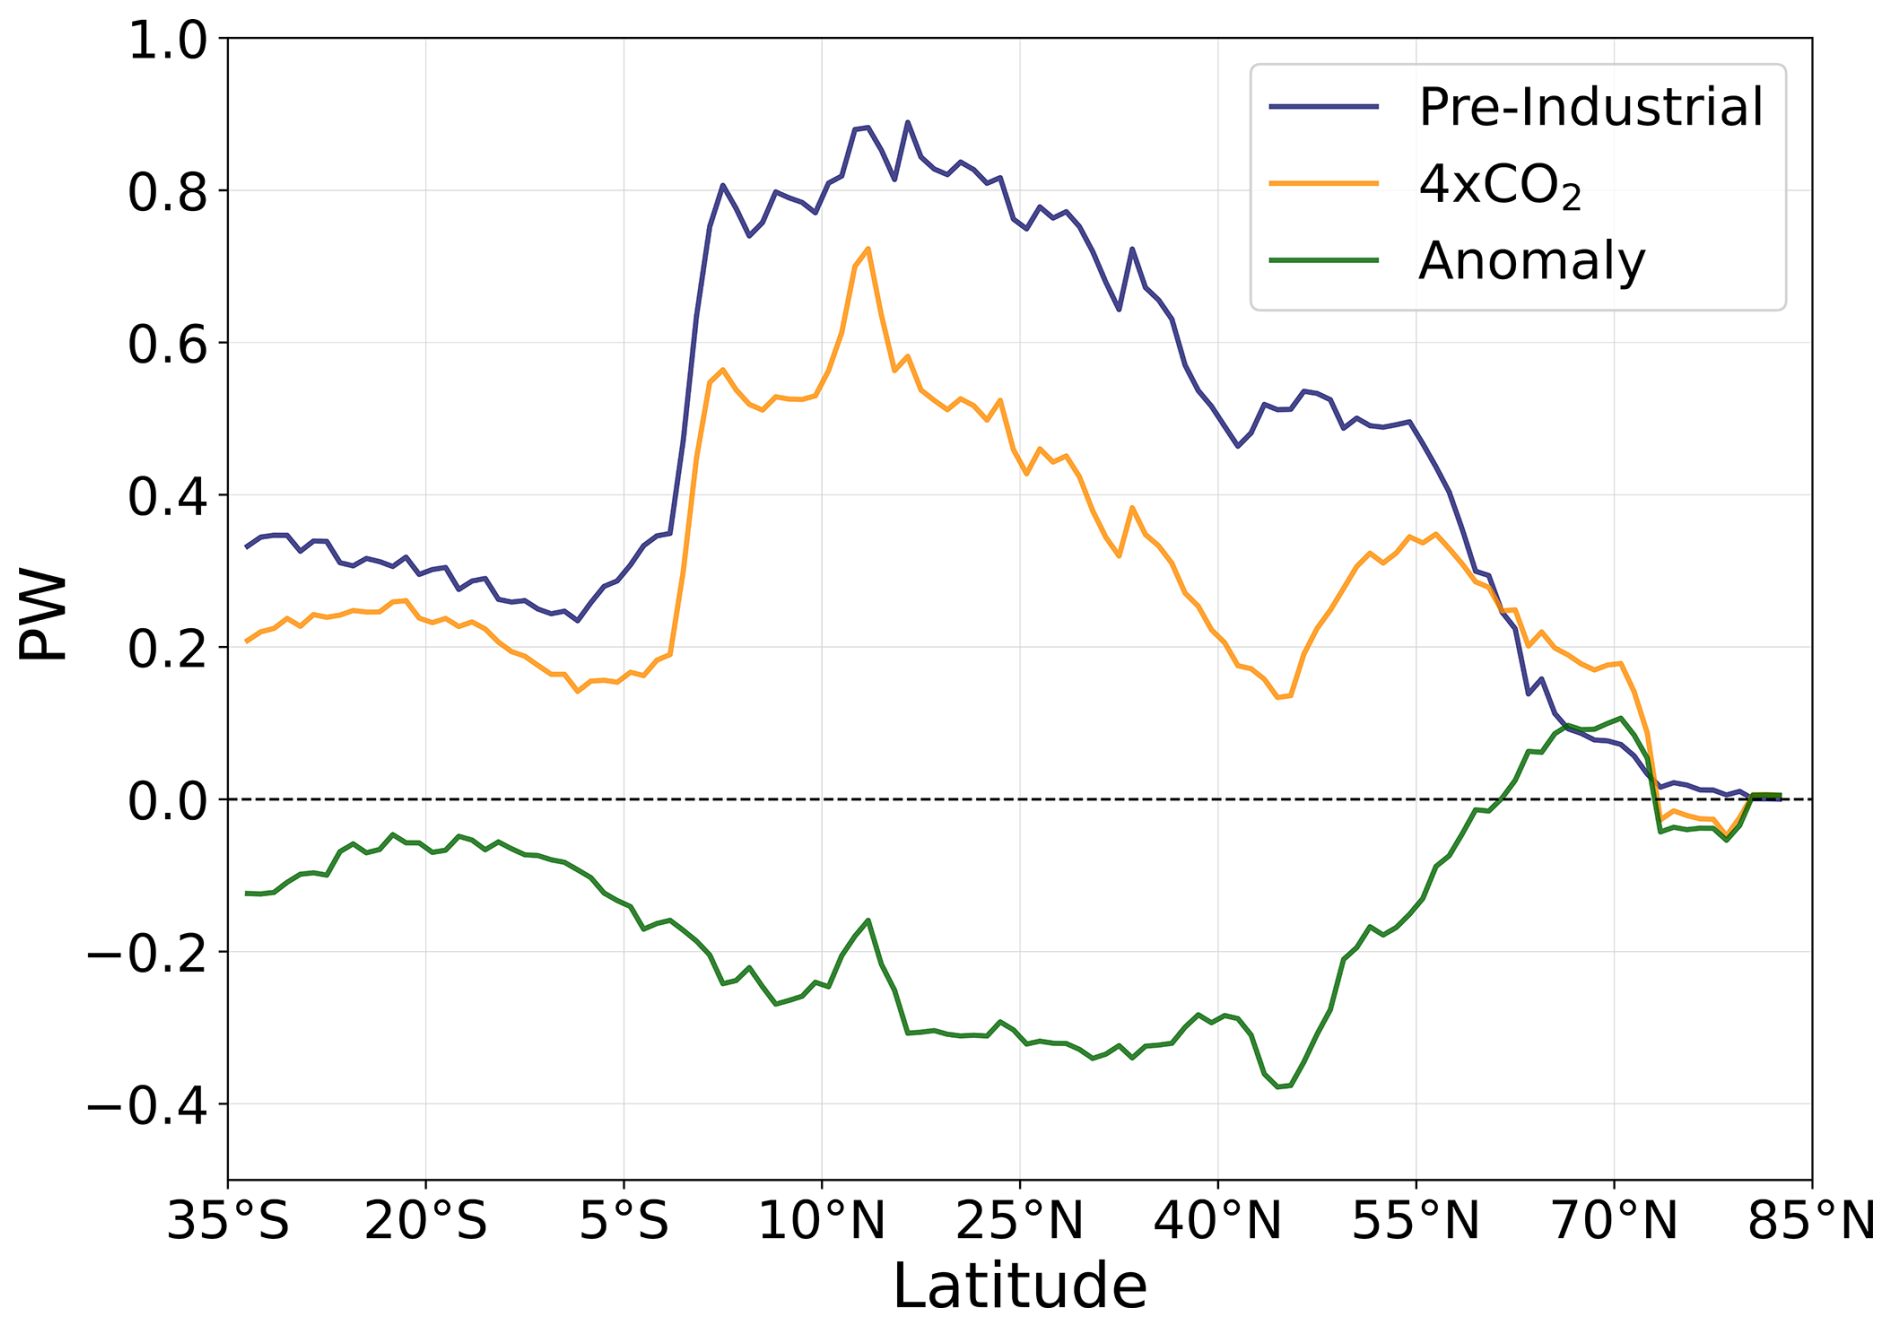
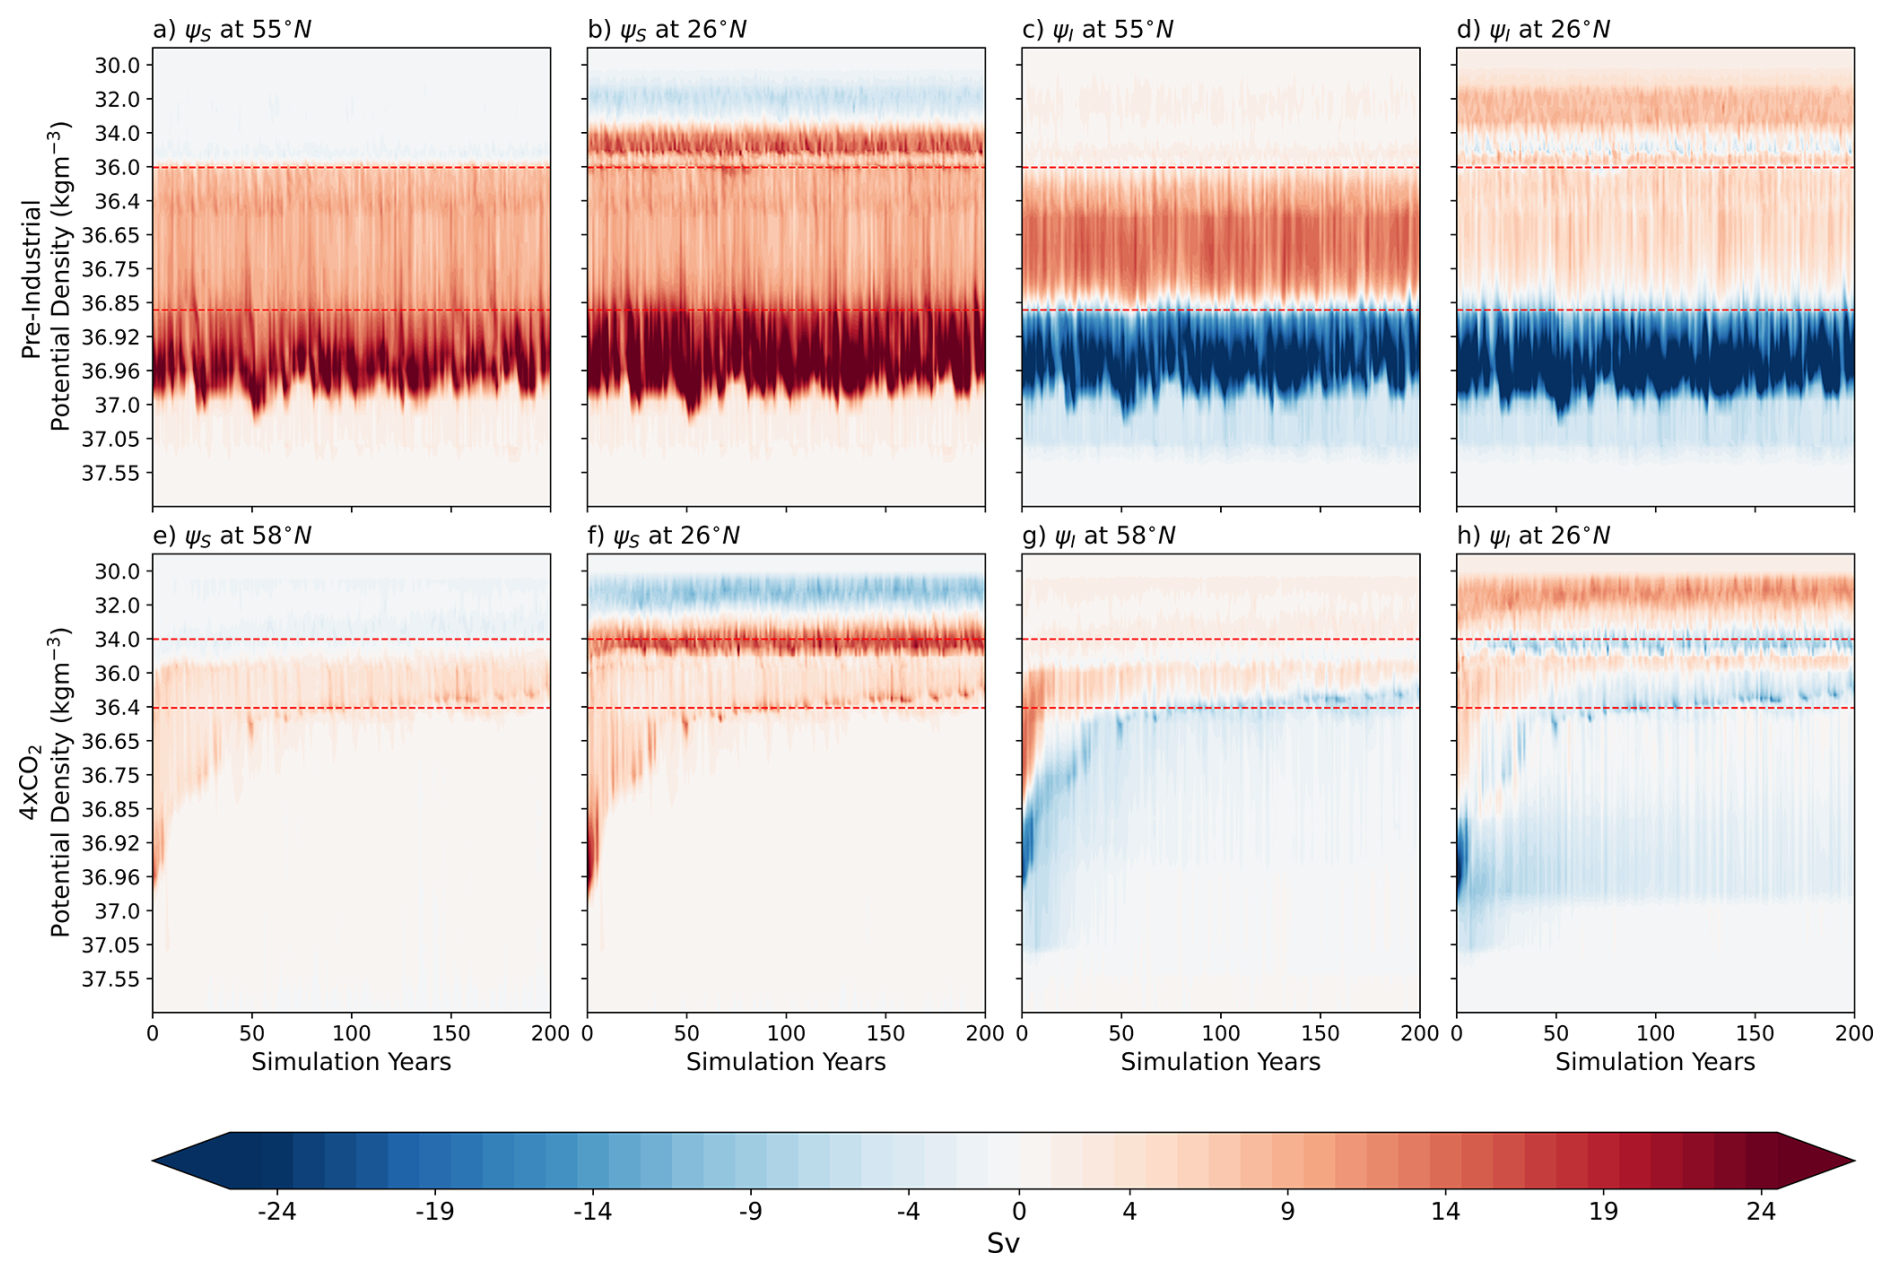
Figure 6Hovmöller diagrams of surface and interior transformations in density space for PI (a–d) and 4xCO2 (e–h). First two columns (a, b, e, f) display the surface transformations, ψS, at (a, e) the ρ-AMOC maximum latitude and (b, f) 26° N, while last two columns (c, d, g, h) display the interior transformations, ψI, at (c, g) the ρ-AMOC maximum latitude and (d, h) 26° N. Positive (red) values indicate transformations toward lighter waters (buoyancy gain/upwelling), and negative (blue) values indicate transformations toward denser waters (buoyancy loss/downwelling). Red dashed lines denote the upper and lower density bounds of the ρ-AMOC upper limb, computed from the mean over the last 50 years of each simulation. The ρ-AMOC maximum latitude for both simulations is displayed in Table 1.
Figures 4 and 6 present a latitudinal density-based depiction of the ρ-AMOC components. However, acknowledging that a key factor contributing to the discrepancy between the ρ- and z-AMOC is the loss of information on the horizontal separation of the AMOC upper and lower limbs inherent in the diagnosis of the z-AMOC, the spatial distribution of vertical transport and diapycnal transformations within the North Atlantic is investigated (Fig. 7), specifically at the density and depth levels corresponding to the maximum of the AMOC upper limb (Table 1). These characteristic densities differ between experiments, as each represents the overturning maximum specific to its climate state. It should be noted that, within Fig. 7, negative values (depicted in blue) indicate downward fluxes (buoyancy loss or downwelling), while positive values (depicted in red) indicate upward fluxes (buoyancy gain or upwelling).
In PI (Fig. 7a), pronounced downwelling occurs in the Labrador (LS) and Irminger Seas (IS), and along the Norwegian coast, while comparatively weaker upwelling is confined to areas north of Iceland. The location of these transformations, occurring at the isopycnal surface of σ2=36.68 kg m−3, generally align with the diapycnal velocity field (Fig. 7c), but the magnitude of upward and downward fluxes reveals the intensified contribution from interior transformations to ρ-AMOC. Additionally, in Fig. 7c, upward fluxes emerge in the Baffin Bay, along the Gulf Stream, along the path of the North Atlantic Current (NAC), and in the western GIN seas, whereas downward fluxes are stronger in the IS compared to the LS, which is consistent with observations (Lozier et al., 2019; Fu et al., 2023).
Conversely, vertical velocities at ∼910 m in PI (Fig. 7e) exhibit much noisier patterns of upwelling and downwelling compared to diapycnal velocities (Fig. 7c). A significant downward flux is evident south of Greenland, contributing to z-AMOC, while upward fluxes prevail in the LS and IS. Deep convection at these sites is still represented by a dipole pattern, indicating upwelling (downwelling) in the southern (northern) LS and IS. However, z-AMOC lacks a subpolar maximum (Fig. 1e), as opposing fluxes when integrated zonally result in weaker overturning strength. In contrast, due to the predominance of downwelling as the form of vertical motion from 30–50° N, the zonally integrated northward overturning is amplified in this region, explaining the subtropical location of the z-AMOC maximum.
Under 4xCO2 forcing, the diapycnal velocity field (Fig. 7d) exhibits significantly reduced downward flux in the LS coupled with the emergence of upward fluxes south of Greenland. Strong downward fluxes remain in the IS, primarily driven by surface transformations (Fig. 7b). These fluxes emerge from the eastern GIN seas towards the northeastern North Atlantic, reflecting amplified GIN seas deep convection and subsequent entrainment of lighter NSOW in the North Atlantic at this isopycnal surface, consistent with the shift of the overturning maximum to a lighter isopycnal in 4xCO2. Concurrently, upward fluxes are reduced along the path of the Gulf Stream, which is coherent with the reduced ocean meridional heat transport that is more pronounced north of 10° N (Fig. 5). In contrast, the vertical velocity field (Fig. 7f), indicates reduced downward and upward fluxes across all regions, except the eastern North Atlantic and Greenland Sea. Overall, the reduced downward flux near the latitudinal location of both the ρ- and z-AMOC maxima highlights that both diagnostics capture the reduced deep convection that drives AMOC weakening in 4xCO2, albeit at different latitudinal bands (e.g. SPNA in density space and STNA in depth space).
Given that deep convection in the North Atlantic occur in the SPNA, we argue that only the diagnostics in density space provide physically meaningful information on the AMOC response to abrupt climate change in this region, by directly accounting for the contributions of surface and interior transformations to deep water formation. Comparing the diapycnal velocity field with observations in the SPNA reveals that this metric is able to capture the North Atlantic Ocean circulation regime in the current climate, like the dominant contribution of the IS to deep convection in the SPNA (Lozier et al., 2019; Sanchez-Franks et al., 2024) and the horizontal separation of the AMOC upper and lower limbs (Foukal and Chafik, 2024). Moreover, Årthun et al. (2023) suggest that not only does the Irminger Sea remain the dominant deep convection site in the North Atlantic, but also the GIN Seas experience amplified overturning under future climate projections, as suggested by the 4xCO2 diapycnal velocity field (Fig. 7d). With respect to oceanic heat transport, AMOC weakening is associated with a decrease in Gulf Stream volume transport towards the subpolar North Atlantic (Piecuch and Beal, 2023), a phenomenon evident in Figs. 5 and 7d. However, the vertical velocity field (Fig. 7e) contradicts the aforementioned studies, displaying a dominant contribution from the Labrador Sea, increased upwelling in the Greenland-Iceland-Norwegian Seas, and a convoluted picture of the upper and lower AMOC limbs (Fig. 7e). Therefore, our findings corroborate the evidence from literature that ρ-AMOC can provide a substantially more accurate representation of circulation changes, and AMOC resilience and natural variability under warmer climates (e.g. Xu et al., 2018; Megann, 2018; Megann et al., 2021; Sidorenko et al., 2020a, 2021; Frajka-Williams et al., 2023; Foukal and Chafik, 2024).
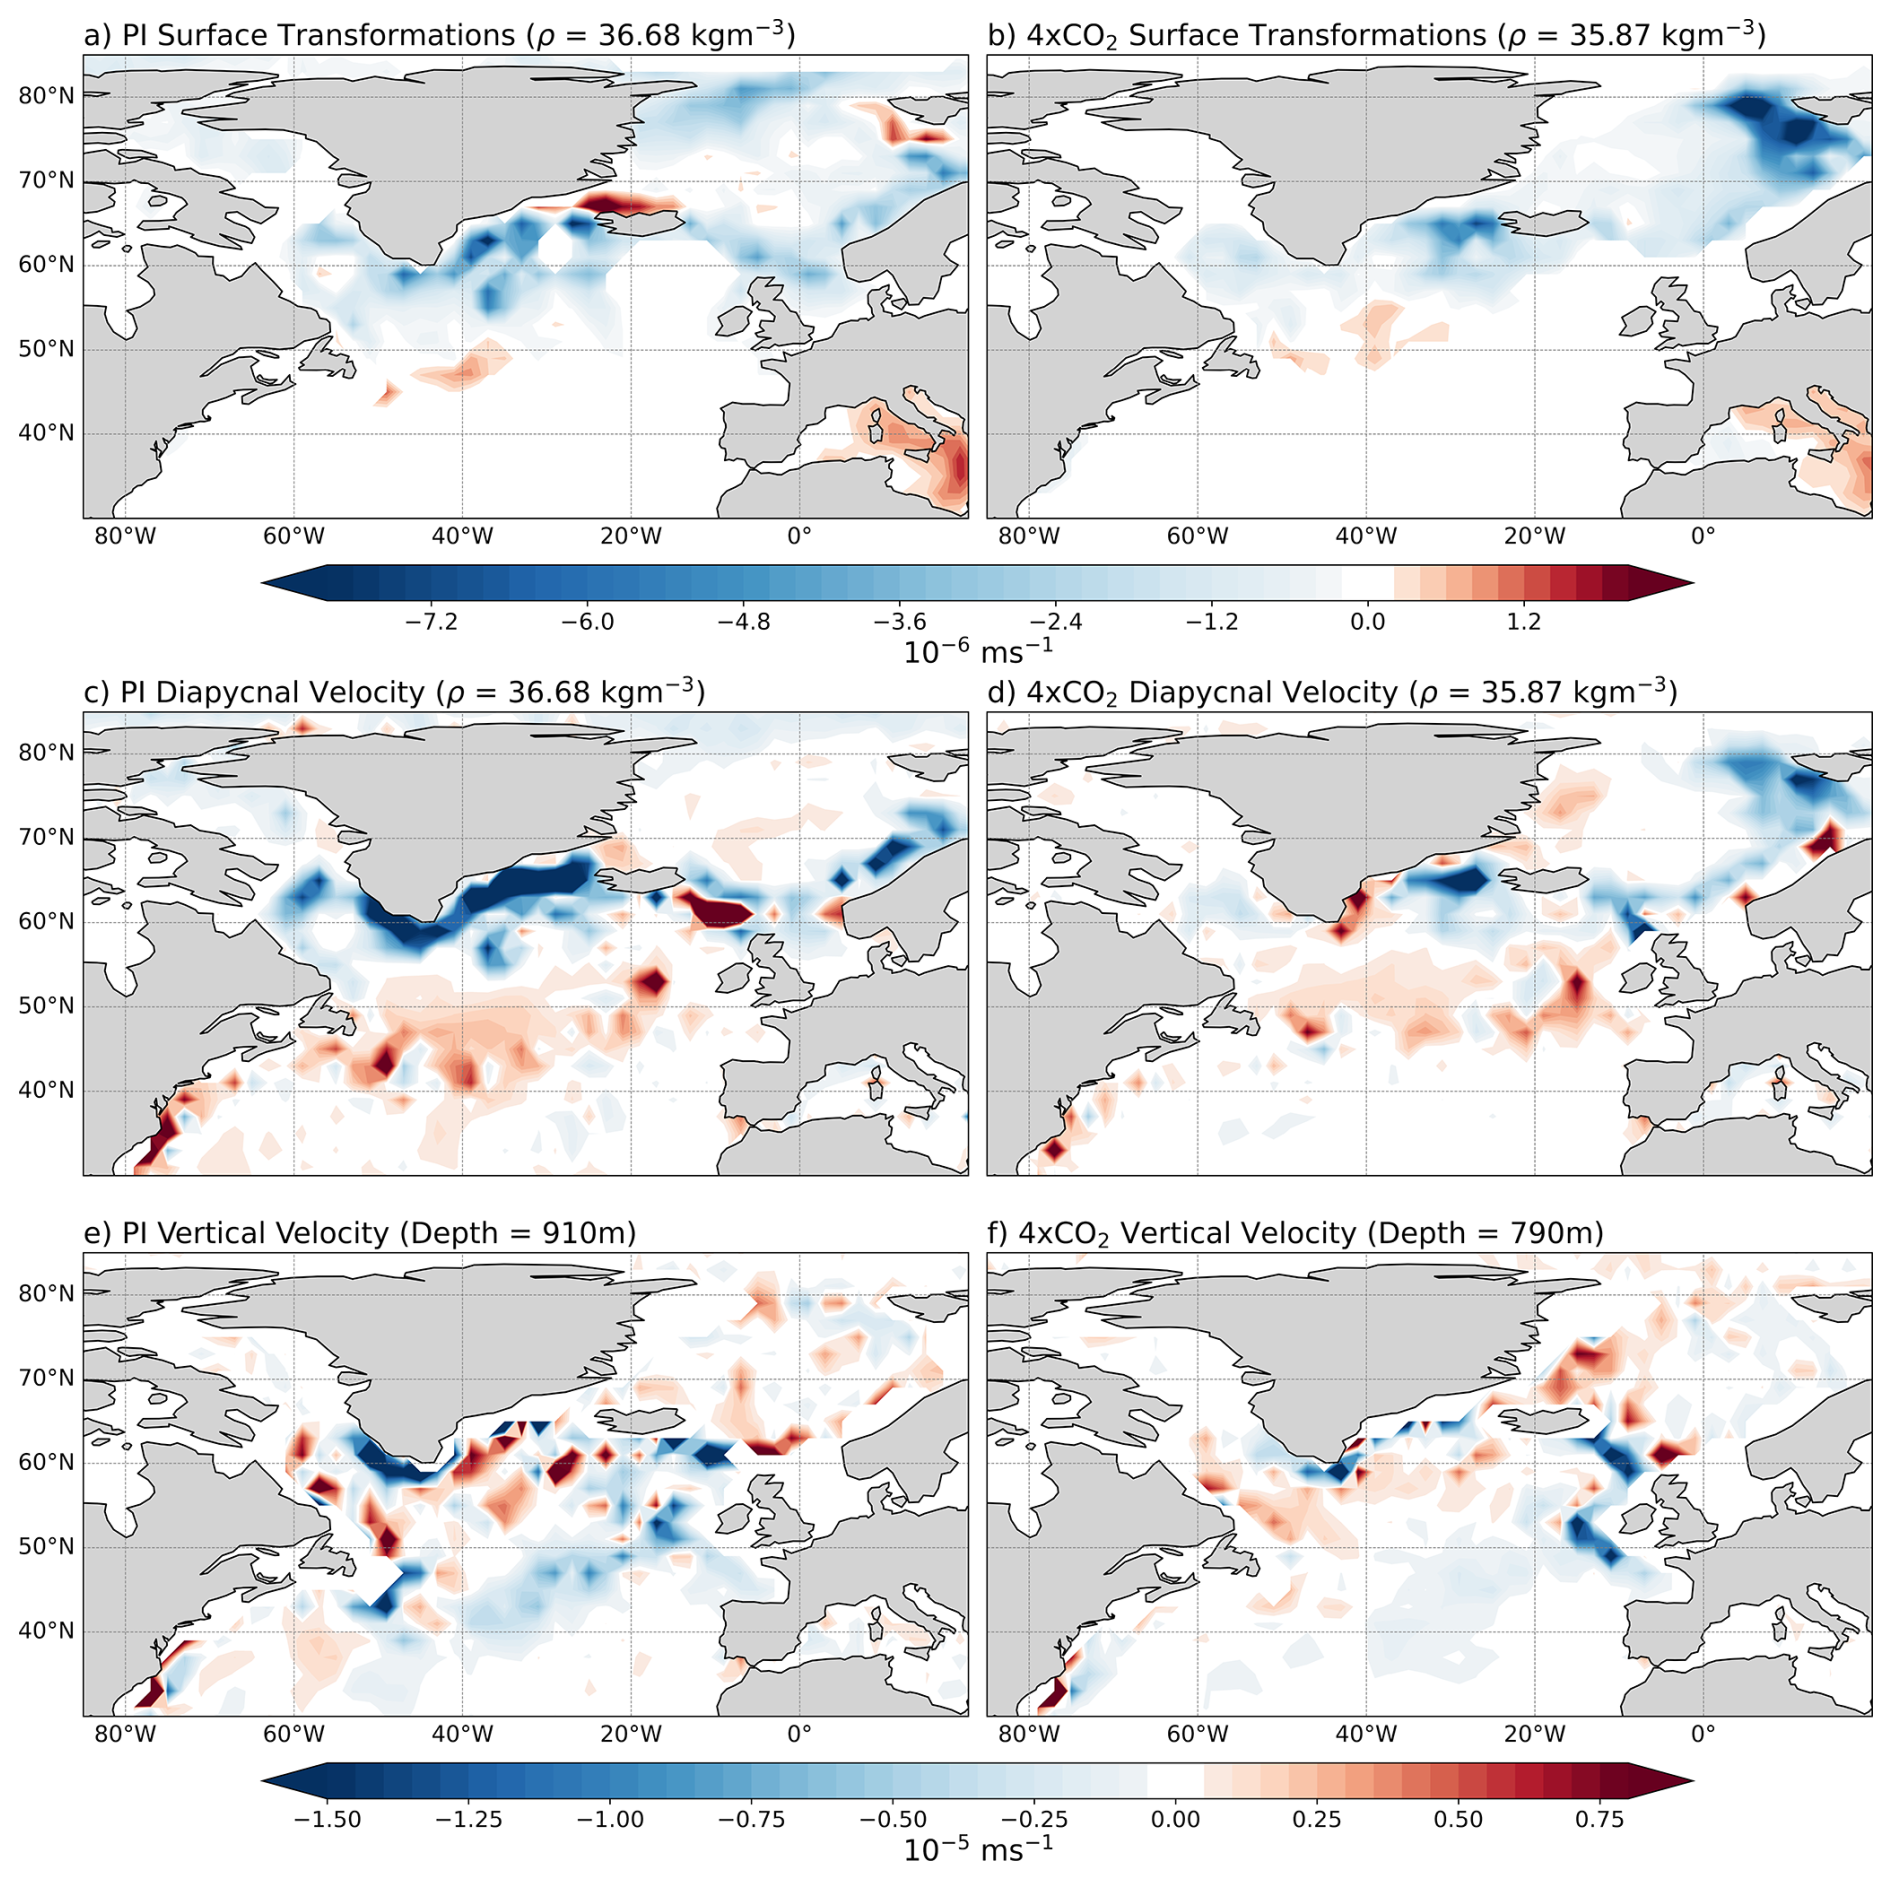
Figure 7Mean surface-forced diapycnal water mass transformations (ψS; a, b), diapycnal velocity (c, d) and vertical velocity (e, f) under (a, c, e) PI and (b, d, f) 4xCO2 conditions. Depth and density levels differ: PI (910 m, 36.68 kg m−3) vs. 4xCO2 (790 m, 35.87 kg m−3). Negative values (blue) indicate downward fluxes (buoyancy loss), whereas positive values (red) indicate upward fluxes (buoyancy gain).
We have examined the patterns and variability of the AMOC and associated water mass transformations in depth (z-AMOC) and density (ρ-AMOC) spaces using the AWI-CM3 model. Building upon previous studies that compare these frameworks in different model configurations and experiments, and through model intercomparison projects, we argue that more modelling efforts like this study are critical to evaluate the model skill in representing the basin-scale AMOC sensitivity different boundary conditions and forcings. Additionally, as surface and interior water mass transformations play a crucial role in setting AMOC strength and variability, accounting for these transformations as we do in our study is essential to advance our understanding of overturning regimes across various scales. Nevertheless, the majority of models with simulations included in the CMIP6 project at various resolutions for past, present and future climate only derive z-AMOC as output, thus a community-wide adoption of ρ-AMOC is necessary to reduce model uncertainty in the future (Foukal and Chafik, 2024). Conversely, observational arrays like the RAPID and OSNAP arrays, already provide AMOC estimates in density space, even when the difference between ρ-AMOC and z-AMOC appears negligible, like at 26.5° N (Frajka-Williams et al., 2023; Moat et al., 2025). Therefore, continuing to study the AMOC only in depth space risks increasing the model-data discord, particularly at higher latitudes. Such discrepancies raise important questions regarding the reliability of our current understanding the AMOC, and our ability to project the response of large-scale ocean circulation under the impact of climate change. To this extent, the warm climate experiment that we employed in this study provides valuable insights into AMOC sensitivity to abrupt climate change, highlighting the interplay between sea-ice formation (Fig. 3), meridional heat transport (Fig. 5), and water mass transformations (Figs. 4 and 6) in driving the AMOC dynamics (Nobre et al., 2023; Baker et al., 2025). Moreover, even though one might argue that a substantially warmer world might seem far-fetched, our findings in density space suggest that its effect on the ocean circulation is not unrealistic and quite similar to the changes in overturning circulation occurring in the past decade and projected to occur in the future (Lozier et al., 2019; Chafik et al., 2022; Sanchez-Franks et al., 2024; Årthun et al., 2023; Baker et al., 2025).
Our results demonstrate that z- and ρ-AMOC, despite targeting the same circulation, can yield fundamentally different representations and interpretations of AMOC dynamics. In our PI simulation, the first discrepancy between the frameworks concerns the latitude of the maximum overturning strength. While the ρ-AMOC maximum is located at the subpolar North Atlantic, where deep convection occurs (Lozier et al., 2019), the z-AMOC maximum is located in the subtropical North Atlantic. This reflects the loss of information on the horizontal separation of the AMOC upper and lower limbs that occur as an effect of averaging density levels into constant-depth intervals during zonal integration (Foukal and Chafik, 2024). Consequently, z-AMOC indices reflect subtropical rather than subpolar dynamics, underestimating AMOC strength by approximately 13 Sv compared to ρ-AMOC. Conversely, both diagnostics appear interchangeable at 26° N under PI conditions, implying that density space is not essential for present-climate studies utilizing subtropical AMOC strength as a basin-scale index. This equivalence, however, dissipates in warmer climates, with substantial divergence in both magnitude and variability between frameworks, not only in the subpolar North Atlantic but also at 26° N. Nevertheless, both AMOC diagnostics only agree to the AMOC strength of about 7 Sv in the final simulation years, and to the overall shoaling of the AMOC, and AABW northward-upward shift.
Furthermore, our findings suggest that the divergence between the results of our PI and 4xCO2 simulations stems from the distinct role of interior and surface transformations in driving the AMOC, that can only be directly accounted for in density space. In 4xCO2, overall, surface transformations drive the AMOC strength while interior transformations drive the variability of the AMOC. In this sense, deep convection is maintained in the Irminger Sea and is intensified in the GIN Seas, driven by amplified winter sea-ice melt in the Arctic. This signal is evident through the analysis of the diapycnal velocity field (Fig. 7d) and from the shoaling of the NSOW to the same density class of the mid-depth cell that represents ρ-AMOC (Fig. 1b). The deep convection in the IS and GIN seas is maintained mostly by surface transformations in 4xCO2, contrary to PI, where interior transformations contribute at a similar magnitude. On the other hand, the effect of interior transformations in the ρ-AMOC in 4xCO2 continues to be substantial, particularly to its variability, as the entrainment of lighter overflows occur concurrently with shifts in ρ-AMOC strength. Finally, by showing that ρ- and z-AMOC diverge not only in the subpolar North Atlantic but also in the subtropical North Atlantic under warmer climates, our work provides a novel perspective on the implications of framework choice. Additionally, we have provided substantial evidence that the role of surface and interior transformations in driving the AMOC must be explicitly assessed.
Despite the valuable insights gained through our findings we acknowledge that ρ-AMOC computations require higher computational costs and are not as readily available in large model ensembles as z-AMOC output (Sidorenko et al., 2021; Baker et al., 2025), which may delay the community-wide transition between diagnostics. However, advances towards resolving computational costs including online diagnostics and evaluation of appropriate time averaging periods may facilitate this transition (Sidorenko et al., 2020a; Megann, 2024). Indubitably, z-AMOC has provided meaningful advances in our understanding of the mechanism driving AMOC variability, and we do not advocate for its exclusion. Rather, we advocate for including ρ-AMOC as standard model output in the forthcoming CMIP phase (CMIP7), alongside with more studies that employ ρ-AMOC as the standard diagnostics. The present results, coupled with existing observational, modelling, and comprehensive studies suggest that computing AMOC in density space provides a more physically coherent depiction of the mechanisms governing AMOC internal variability and stability (e.g. Roberts et al., 2020; Sidorenko et al., 2020a, 2021; Frajka-Williams et al., 2023; Foukal and Chafik, 2024) and that both inter-model and model-observation discrepancies can be reduced through a further community-wide effort towards diagnosing the AMOC in density space. As the Earth continues to warm, diagnosing the AMOC in density space becomes even more critical given the potential divergence in basin-wide AMOC representations and their respective interpretations across different latitudes, and time- and spatial scales, as both models and observations inform political, economic, and societal decision-making under climate change scenarios.
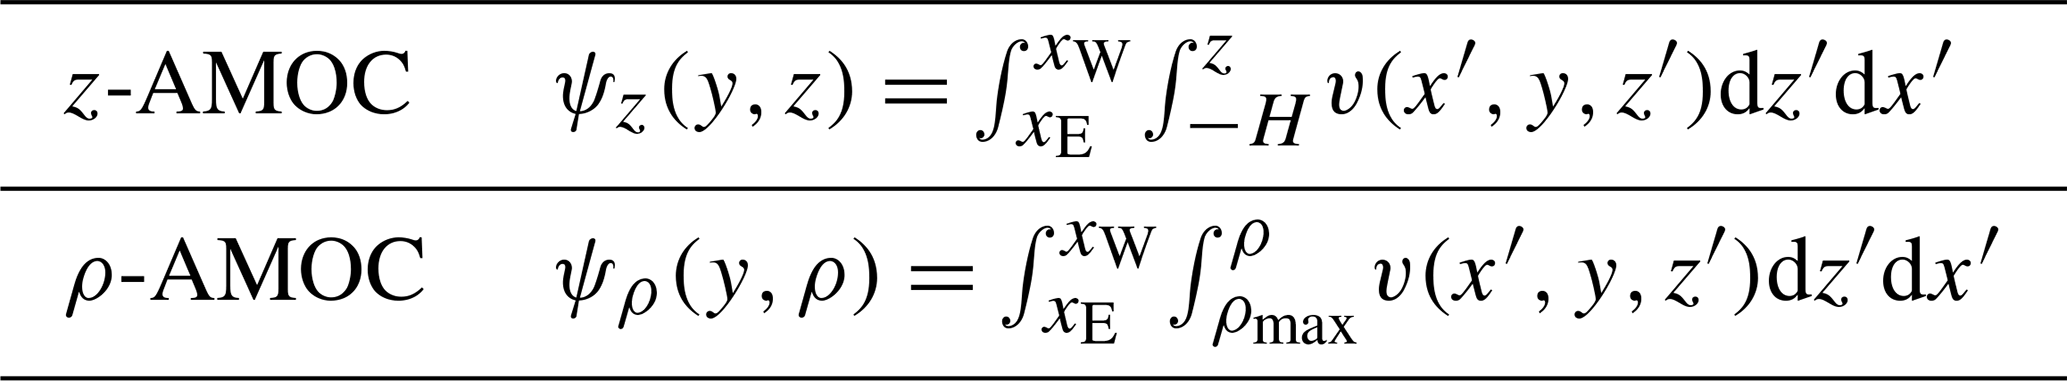
Table A2Correlation coefficients for z- and ρ-AMOC timeseries. NS = not significant.
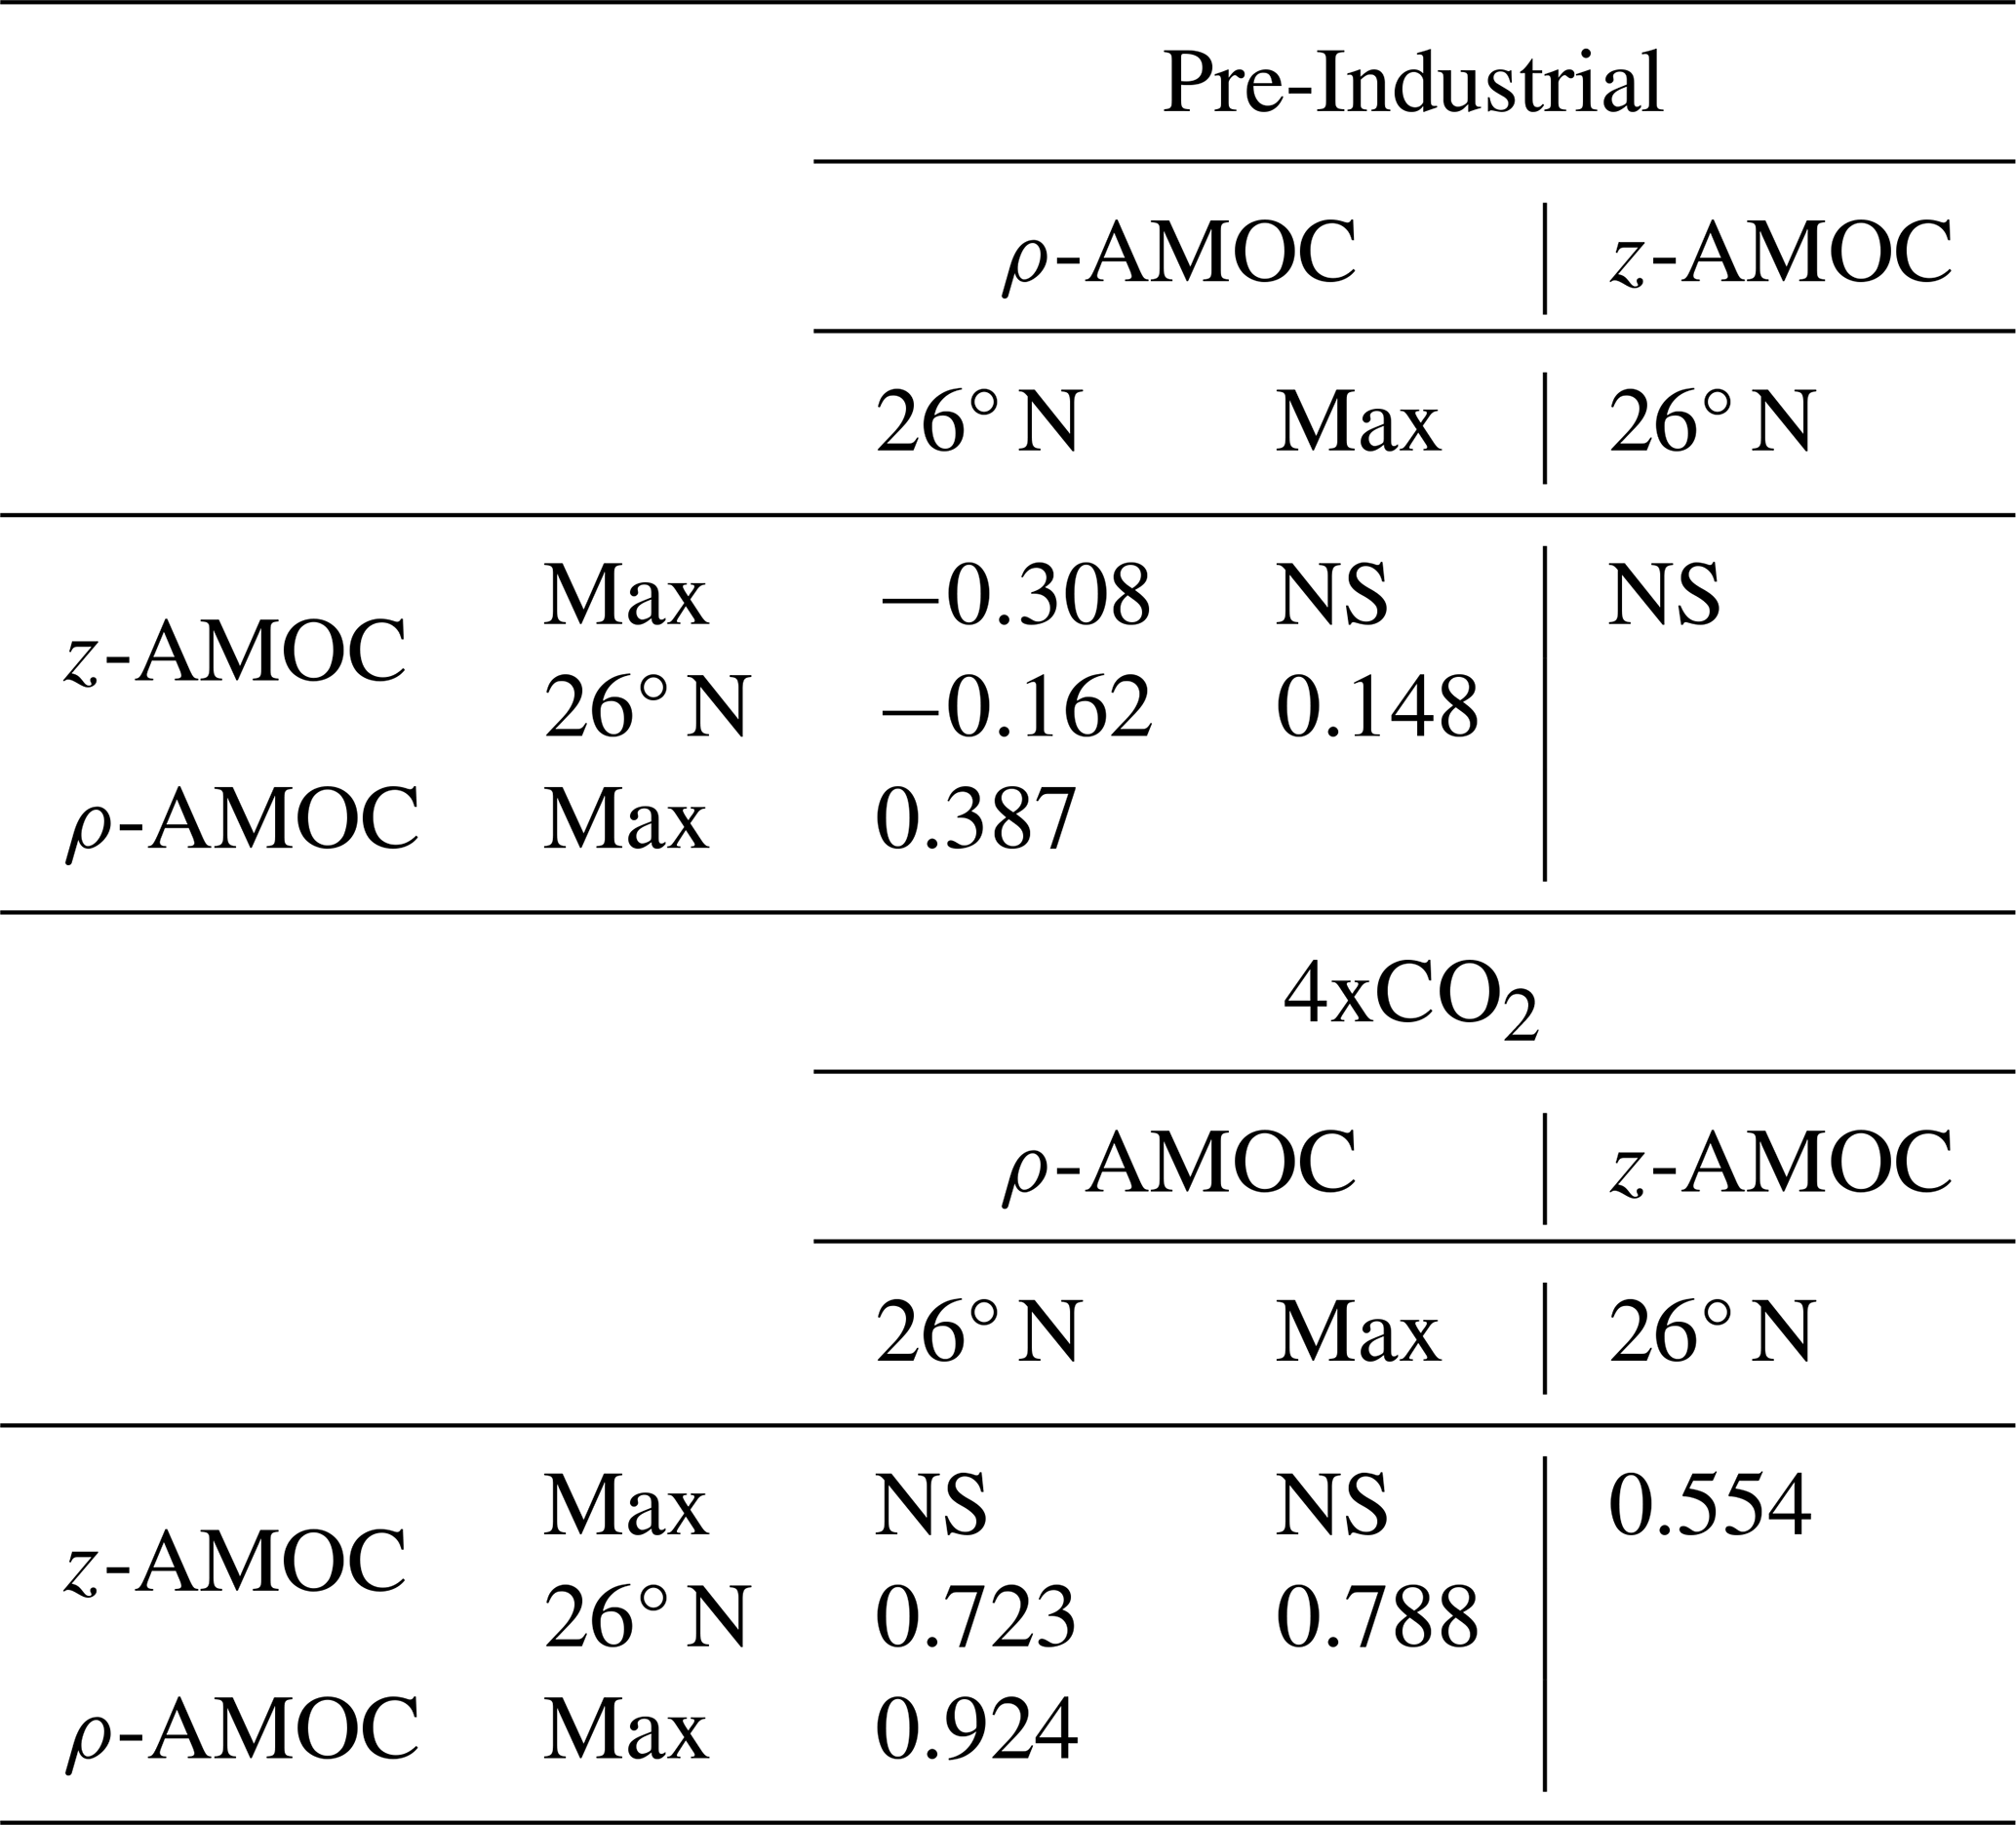
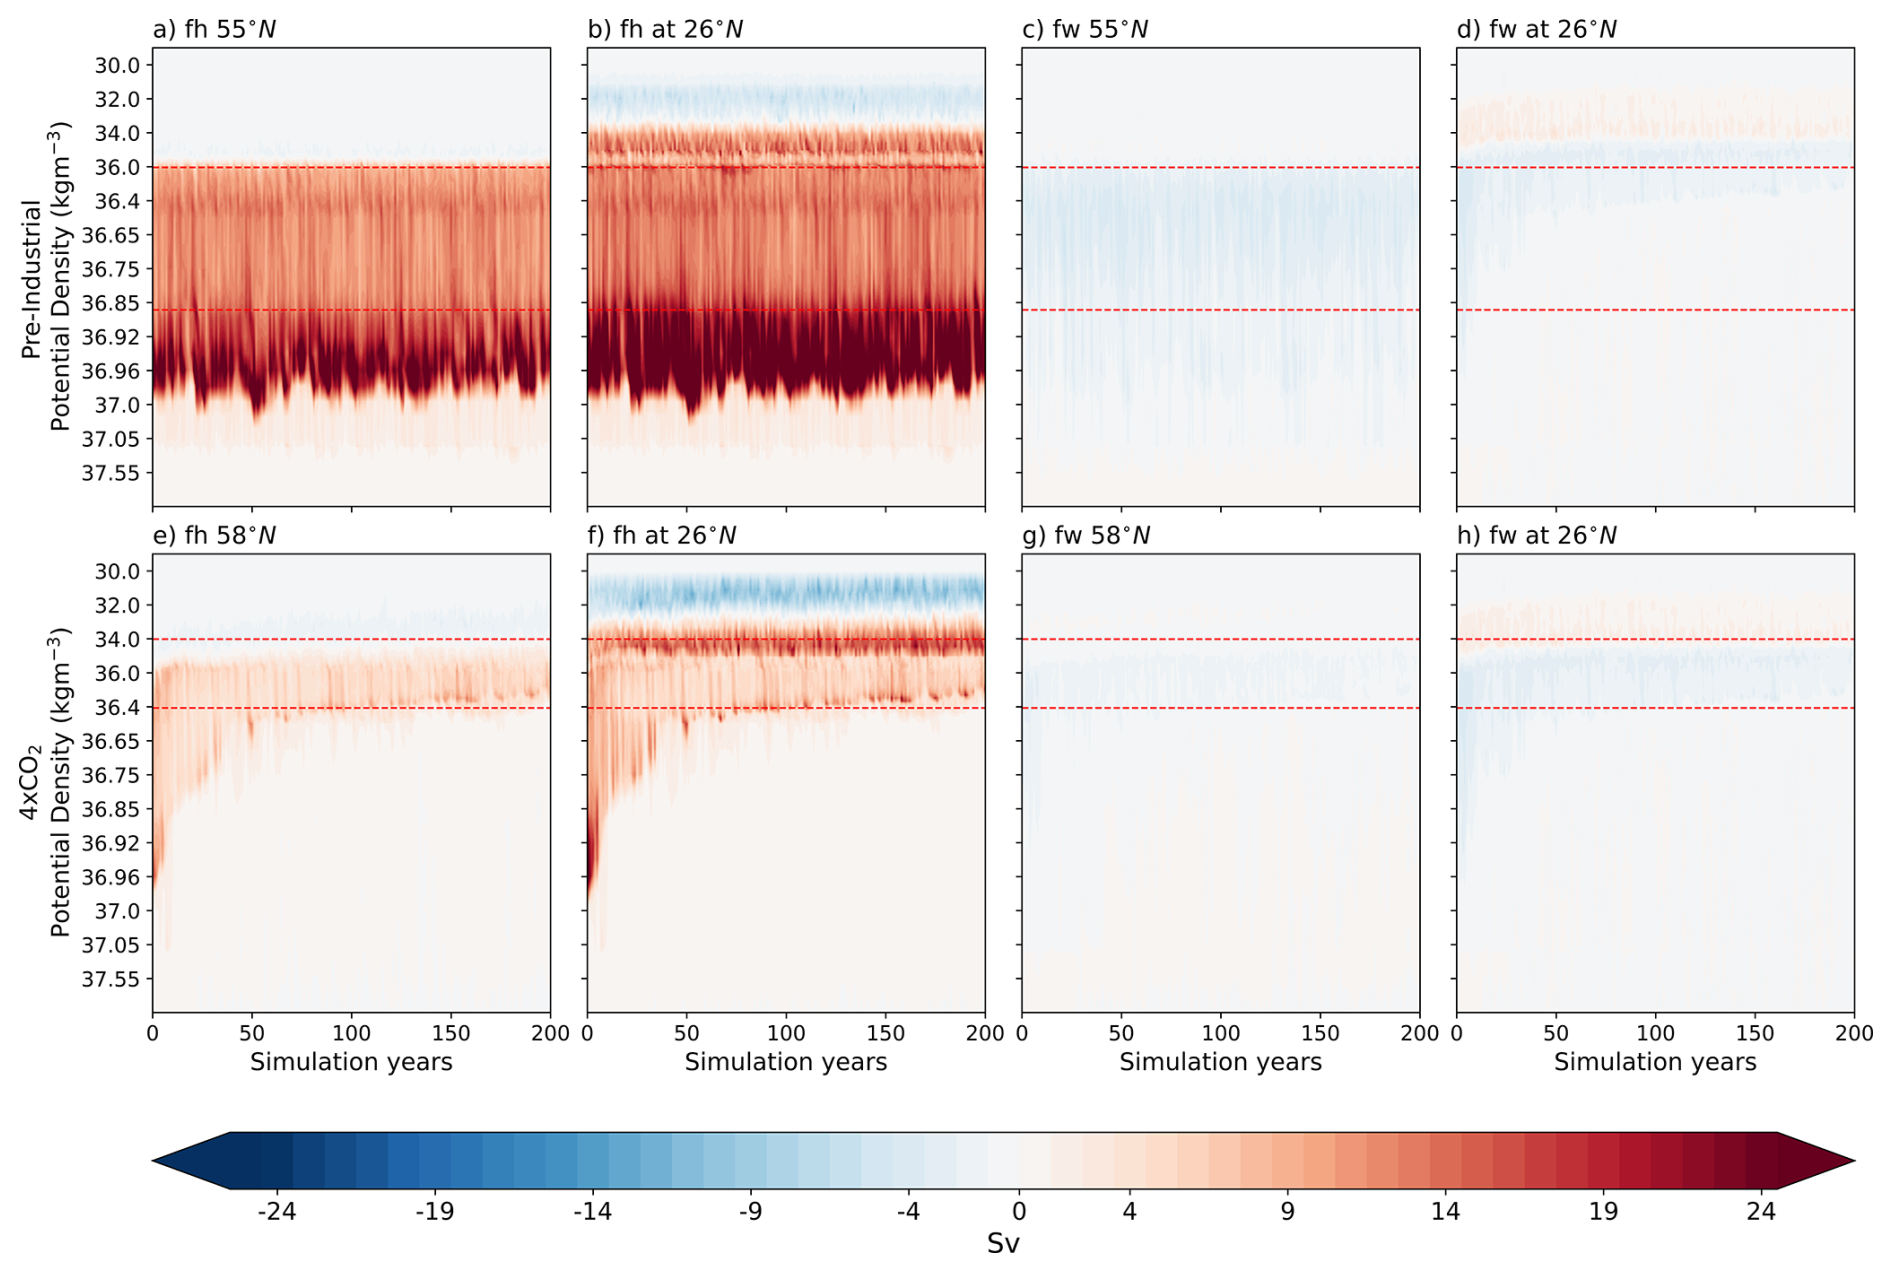
Figure A1Hovmöller diagrams of the contributions of heat fluxes (FH) and freshwater fluxes (FW) to surface transformations for PI (a–d) and 4xCO2 (e–h). First two columns (a, b, e, f) display the FH at (a, e) the ρ-AMOC maximum latitude and (b, f) 26° N, while last two columns (c, d, g, h) display the FW at (c, g) the ρ-AMOC maximum latitude and (d, h) 26° N. Positive (red) values indicate transformations toward lighter waters (buoyancy gain/upwelling), and negative (blue) values indicate transformations toward denser waters (buoyancy loss/downwelling). Red dashed lines denote the upper and lower density bounds of the ρ-AMOC upper limb, computed from the mean over the last 50 years of each simulation. The ρ-AMOC maximum latitude for both simulations is displayed in Table 1.
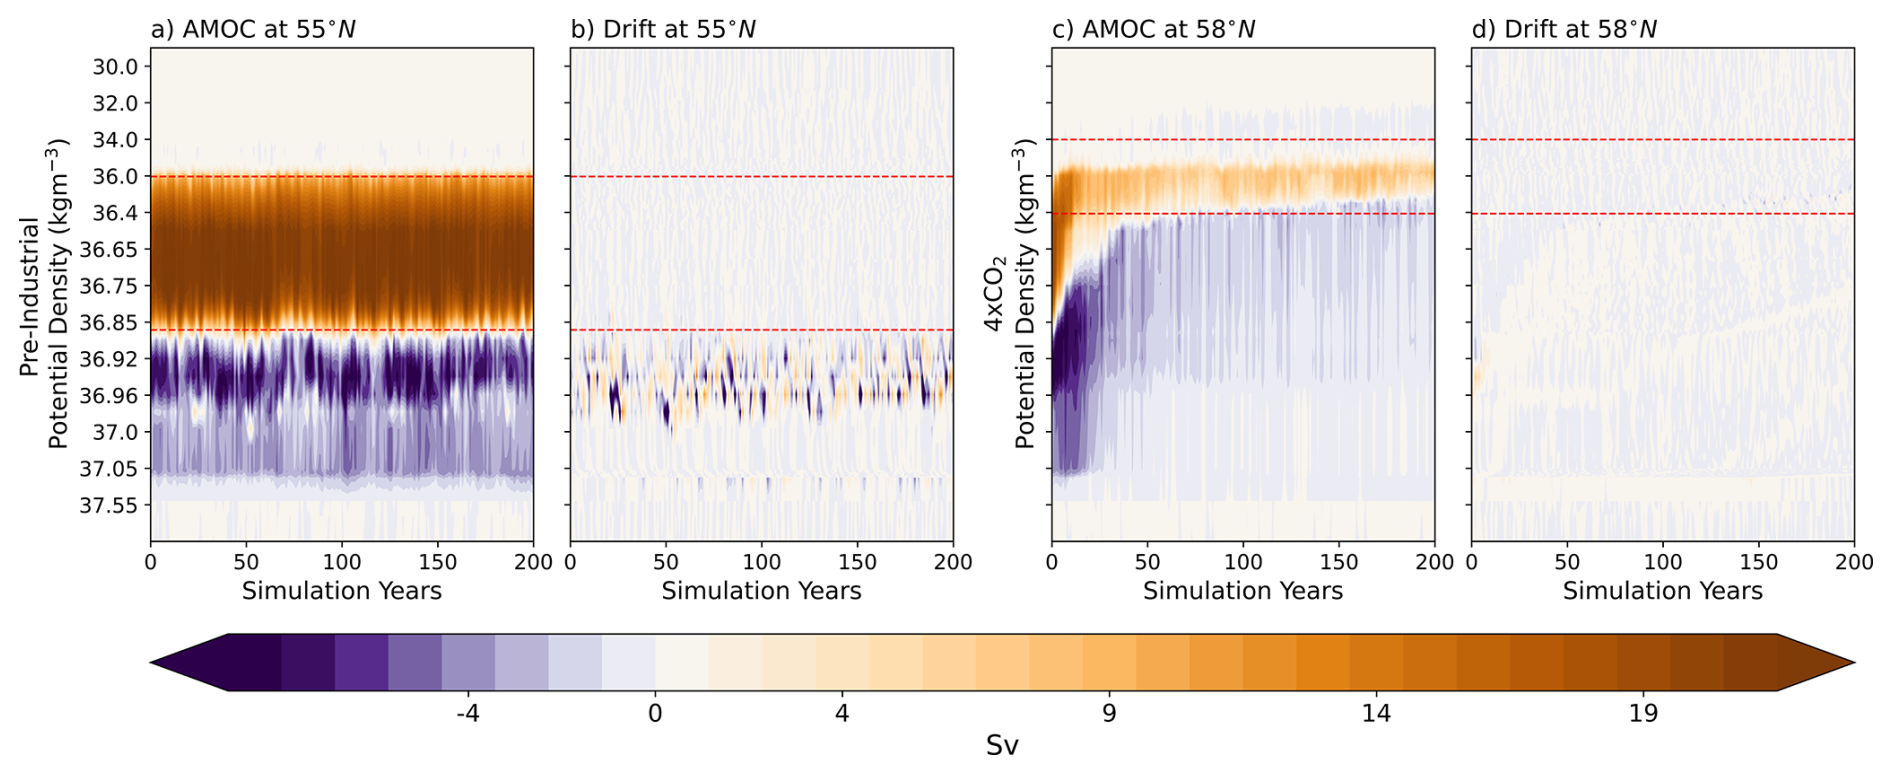
Figure A2Hovmöller diagrams of ρ-AMOC (a, c) and model drift (b, d) in density space for PI (a, b) and 4xCO2 (c, d). Red dashed lines denote the upper and lower density bounds of the ρ-AMOC upper limb, computed from the mean over the last 50 years of each simulation. The ρ-AMOC maximum latitude for both simulations is displayed in Table 1.
Full documentation of AWI-CM3 is available at Streffing et al. (2022), except for the updates done in the ocean model FESOM2.5, available at https://github.com/FESOM/fesom2/releases/tag/AWI-CM3_v3.2, last access: 4 May 2024 with a GPL-3.0 licence. All model output, as well as the postprocessing and visualisation scripts, are archived on https://doi.org/10.5281/zenodo.15043857 (Matos, 2025a), https://doi.org/10.5281/zenodo.15044678 (Matos, 2025c), https://doi.org/10.5281/zenodo.15047024 (Matos, 2025b), and https://doi.org/10.5281/zenodo.15050831 (Matos, 2025d).
Conceptualization and methodology, FDAOM, DS; Formal analysis, FDAOM, DS, XS, LA; Investigation, FDAOM, DS; Resources, FDAOM, CS, GL; Data curation, FDAOM; Writing – original draft preparation, FDAOM; writing – review and editing, FDAOM, DS, XS, LA, JP, GL, CS; All authors have significantly contributed to the preparation of this manuscript.
The contact author has declared that none of the authors has any competing interests.
Publisher's note: Copernicus Publications remains neutral with regard to jurisdictional claims made in the text, published maps, institutional affiliations, or any other geographical representation in this paper. While Copernicus Publications makes every effort to include appropriate place names, the final responsibility lies with the authors. Views expressed in the text are those of the authors and do not necessarily reflect the views of the publisher.
The work was supported by the Helmholtz Association in its climate initiatives REKLIM (Regional Climate Change) (Q. Wang, D. Sidorenko, C. Stepanek), and INSPIRES (International Science Program for Integrative Research in Earth Systems), at the Alfred Wegener Institute, Helmholtz Centre for Polar and Marine Research. The authors gratefully acknowledge the Jülich Supercomputing Centre (JSC) and the German Climate Computing Centre (DKRZ) for providing computing time on the supercomputers JUWELS and LEVANTE, respectively. The Python packages pyfesom2 (https://github.com/FESOM/pyfesom2, last access: 4 February 2025) and tripyview (https://github.com/FESOM/tripyview, last access: 6 February 2025), as well as CDO version 2.4.1 (Schulzweida, 2023), last access: 4 February 2025) were utilized for post-processing and plotting of the data. We also acknowledge the Nippon Foundation and the Partnership for the Observation of the Global Ocean (POGO) for support under the NF-POGO Centre of Excellence (NF-POGO CofE) programme. Finally, we thank Dr. Paul Gierz and Dr. Sergey Danilov for their valuable guidance during the preparation and revision of this article. We are extremely grateful to the editor, Dr. Julian Mak, the reviewer, Dr. Henri Drake, and one more anonymous reviewer for their constructive feedback and comments that have greatly increased the quality and comprehensibility of our manuscript.
Fernanda DI Alzira Oliveira Matos was supported by the International Science Program for Integrative Research in Earth Systems (INSPIRES) at AWI, via the project “Warming Climates across time scales – insights from the multiresolution climate model AWI-ESM3” (WaClim). Gerrit Lohmann and Christian Stepanek are funded through the Alfred Wegener Institute’s research program “Changing Earth – Sustaining our Future” of the Helmholtz Association. Christian Stepanek also acknowledges funding from the Helmholtz Climate Initiative REKLIM. This work is also supported by the ERC grant “i2B” (grant no. 101118519), funded by the European Union. Views and opinions expressed are however those of the author(s) only and do not necessarily reflect those of the European Union or the European Research Council Executive Agency. Neither the European Union nor the granting authority can be held responsible for them. Lars Ackermann acknowledges funding from the Federal Ministry for Education and Research initiative PalMod (grant no. 01LP2313A). Xiaoxu Shi is supported by the Southern Marine Science and Engineering Guangdong Laboratory (Zhuhai) (grant no. SML2023SP204), the Ocean Negative Carbon Emissions (ONCE) Program, and the National Natural Science Foundation of China (NSFC) (grant no. 42206256).
The article processing charges for this open-access publication were covered by the Alfred-Wegener-Institut Helmholtz-Zentrum für Polar- und Meeresforschung.
This paper was edited by Julian Mak and reviewed by Henri Drake and one anonymous referee.
Ackermann, L., Danek, C., Gierz, P., and Lohmann, G.: AMOC Recovery in a Multicentennial Scenario Using a Coupled Atmosphere-Ocean-Ice Sheet Model, Geophysical Research Letters, 47, e2019GL086810, https://doi.org/10.1029/2019GL086810, 2020. a
Adcroft, A. and Campin, J.-M.: Rescaled height coordinates for accurate representation of free-surface flows in ocean circulation models, Ocean Modelling, 7, 269–284, https://doi.org/10.1016/j.ocemod.2003.09.003, 2004. a
Årthun, M., Asbjørnsen, H., Chafik, L., Johnson, H. L., and Våge, K.: Future strengthening of the Nordic Seas overturning circulation, Nature Communications, 14, 2065, https://doi.org/10.1038/s41467-023-37846-6, 2023. a, b
Baker, J. A., Bell, M. J., Jackson, L. C., Vallis, G. K., Watson, A. J., and Wood, R. A.: Continued Atlantic overturning circulation even under climate extremes, Nature, 638, 987–994, https://doi.org/10.1038/s41586-024-08544-0, 2025. a, b, c, d, e, f, g, h, i
Banerjee, T., Scholz, P., Danilov, S., Klingbeil, K., and Sidorenko, D.: Split-explicit external mode solver in the finite volume sea ice–ocean model FESOM2, Geosci. Model Dev., 17, 7051–7065, https://doi.org/10.5194/gmd-17-7051-2024, 2024. a
Bellomo, K., Angeloni, M., Corti, S., and von Hardenberg, J.: Future climate change shaped by inter-model differences in Atlantic meridional overturning circulation response, Nature Communications, 12, 3659, https://doi.org/10.1038/s41467-021-24015-w, 2021. a, b, c
Biló, T., Perez, R., Dong, S., Johns, W., and Kanzow, T.: Weakening of the Atlantic Meridional Overturning Circulation abyssal limb in the North Atlantic, Nature Geoscience, 17, 419–425, https://doi.org/10.1038/s41561-024-01422-4, 2024. a
Bonan, D. B., Thompson, A. F., Newsom, E. R., Sun, S., and Rugenstein, M.: Transient and Equilibrium Responses of the Atlantic Overturning Circulation to Warming in Coupled Climate Models: The Role of Temperature and Salinity, Journal of Climate, 35, 5173–5193, https://doi.org/10.1175/JCLI-D-21-0912.1, 2022. a
Buckley, M. W. and Marshall, J.: Observations, inferences, and mechanisms of the Atlantic Meridional Overturning Circulation: A review, Reviews of Geophysics, 54, 5–63, https://doi.org/10.1002/2015RG000493, 2016. a, b, c
Buizza, R., Bechtold, P., Bonavita, M., Bormann, N., Bozzo, A., Haiden, T., Hogan, R., Hólm, E., Radnoti, G., Richardson, D., and Sleigh, M.: IFS Cycle 43r3 brings model and assimilation updates, ECMWF newsletter, 152, 18–22, https://doi.org/10.21957/76t4e1, 2017. a
Chafik, L. and Rossby, T.: Volume, Heat, and Freshwater Divergences in the Subpolar North Atlantic Suggest the Nordic Seas as Key to the State of the Meridional Overturning Circulation, Geophysical Research Letters, 46, 4799–4808, https://doi.org/10.1029/2019GL082110, 2019. a
Chafik, L., Holliday, N. P., Bacon, S., and Rossby, T.: Irminger Sea Is the Center of Action for Subpolar AMOC Variability, Geophysical Research Letters, 49, e2022GL099133, https://doi.org/10.1029/2022GL099133, 2022. a
Craig, A., Valcke, S., and Coquart, L.: Development and performance of a new version of the OASIS coupler, OASIS3-MCT_3.0, Geosci. Model Dev., 10, 3297–3308, https://doi.org/10.5194/gmd-10-3297-2017, 2017. a
Danilov, S., Wang, Q., Timmermann, R., Iakovlev, N., Sidorenko, D., Kimmritz, M., Jung, T., and Schröter, J.: Finite-Element Sea Ice Model (FESIM), version 2, Geosci. Model Dev., 8, 1747–1761, https://doi.org/10.5194/gmd-8-1747-2015, 2015. a
Danilov, S., Sidorenko, D., Wang, Q., and Jung, T.: The Finite-volumE Sea ice–Ocean Model (FESOM2), Geosci. Model Dev., 10, 765–789, https://doi.org/10.5194/gmd-10-765-2017, 2017. a, b
Dima, M., Lohmann, G., Nichita, D., Knorr, G., and Scholz, P.: Structural stability changes of the Atlantic Meridional Overturning Circulation, npj Climate and Atmospheric Science, 8, 73, https://doi.org/10.1038/s41612-025-00960-x, 2025. a
Ditlevsen, P. and Ditlevsen, S.: Warning of a forthcoming collapse of the Atlantic meridional overturning circulation, Nature Communications, 14, 4254, https://doi.org/10.1038/s41467-023-39810-w, 2023. a, b
Döös, K. and Webb, D. J.: The Deacon Cell and the Other Meridional Cells of the Southern Ocean, Journal of Physical Oceanography, 24, 429–442, https://doi.org/10.1175/1520-0485(1994)024<0429:TDCATO>2.0.CO;2, 1994. a
Eyring, V., Bony, S., Meehl, G. A., Senior, C. A., Stevens, B., Stouffer, R. J., and Taylor, K. E.: Overview of the Coupled Model Intercomparison Project Phase 6 (CMIP6) experimental design and organization, Geosci. Model Dev., 9, 1937–1958, https://doi.org/10.5194/gmd-9-1937-2016, 2016. a, b
Ferrari, R., Griffies, S. M., Nurser, A. J. G., and Vallis, G. K.: A boundary-value problem for the parameterized mesoscale eddy transport, Ocean Modelling, 32, 143–156, https://doi.org/10.1016/j.ocemod.2010.01.004, 2010. a
Foukal, N. P. and Chafik, L.: Consensus Around a Common Definition of Atlantic Overturning Will Promote Progress, Oceanography, 37, 10–15, https://doi.org/10.5670/oceanog.2024.507, 2024. a, b, c, d, e, f, g, h, i
Fox-Kemper, B., DeRepentigny, P., Treguier, A. M., Stepanek, C., O'Rourke, E., Mackallah, C., Meucci, A., Aksenov, Y., Durack, P. J., Feldl, N., Hernaman, V., Heuzé, C., Iovino, D., Madan, G., Marquez, A. L., Massonnet, F., Mecking, J., Samanta, D., Taylor, P. C., Tseng, W.-L., and Vancoppenolle, M.: CMIP7 Data Request: Ocean and Sea Ice Priorities and Opportunities, EGUsphere [preprint], https://doi.org/10.5194/egusphere-2025-3083, 2025. a
Frajka-Williams, E., Ansorge, I. J., Baehr, J., Bryden, H. L., Chidichimo, M. P., Cunningham, S. A., Danabasoglu, G., Dong, S., Donohue, K. A., Elipot, S., Heimbach, P., Holliday, N. P., Hummels, R., Jackson, L. C., Karstensen, J., Lankhorst, M., Le Bras, I. A., Lozier, M. S., McDonagh, E. L., Meinen, C. S., Mercier, H., Moat, B. I., Perez, R. C., Piecuch, C. G., Rhein, M., Srokosz, M. A., Trenberth, K. E., Bacon, S., Forget, G., Goni, G., Kieke, D., Koelling, J., Lamont, T., McCarthy, G. D., Mertens, C., Send, U., Smeed, D. A., Speich, S., van den Berg, M., Volkov, D., and Wilson, C.: Atlantic Meridional Overturning Circulation: Observed Transport and Variability, Frontiers in Marine Science, 6, 260, https://doi.org/10.3389/fmars.2019.00260, 2019. a
Frajka-Williams, E., Foukal, N., and Danabasoglu, G.: Should AMOC observations continue: how and why?, Philosophical Transactions of the Royal Society A: Mathematical, Physical and Engineering Sciences, 381, 20220195, https://doi.org/10.1098/rsta.2022.0195, 2023. a, b, c, d, e
Fu, Y., Lozier, M. S., Biló, T. C., Bower, A. S., Cunningham, S. A., Cyr, F., de Jong, M. F., deYoung, B., Drysdale, L., Fraser, N., Fried, N., Furey, H. H., Han, G., Handmann, P., Holliday, N. P., Holte, J., Inall, M. E., Johns, W. E., Jones, S., Karstensen, J., Li, F., Pacini, A., Pickart, R. S., Rayner, D., Straneo, F., and Yashayaev, I.: Seasonality of the Meridional Overturning Circulation in the subpolar North Atlantic, Communications Earth & Environment, 4, 1–13, https://doi.org/10.1038/s43247-023-00848-9, 2023. a, b
Gent, P. R. and McWilliams, J. C.: Isopycnal Mixing in Ocean Circulation Models, Journal of Physical Oceanography, 20, 150–155, https://doi.org/10.1175/1520-0485(1990)020<0150:IMIOCM>2.0.CO;2, 1990. a
Griffies, S. M., Danabasoglu, G., Durack, P. J., Adcroft, A. J., Balaji, V., Böning, C. W., Chassignet, E. P., Curchitser, E., Deshayes, J., Drange, H., Fox-Kemper, B., Gleckler, P. J., Gregory, J. M., Haak, H., Hallberg, R. W., Heimbach, P., Hewitt, H. T., Holland, D. M., Ilyina, T., Jungclaus, J. H., Komuro, Y., Krasting, J. P., Large, W. G., Marsland, S. J., Masina, S., McDougall, T. J., Nurser, A. J. G., Orr, J. C., Pirani, A., Qiao, F., Stouffer, R. J., Taylor, K. E., Treguier, A. M., Tsujino, H., Uotila, P., Valdivieso, M., Wang, Q., Winton, M., and Yeager, S. G.: OMIP contribution to CMIP6: experimental and diagnostic protocol for the physical component of the Ocean Model Intercomparison Project, Geosci. Model Dev., 9, 3231–3296, https://doi.org/10.5194/gmd-9-3231-2016, 2016. a
Groeskamp, S., Griffies, S. M., Iudicone, D., Marsh, R., Nurser, A. J. G., and Zika, J. D.: The Water Mass Transformation Framework for Ocean Physics and Biogeochemistry, Annual Review of Marine Science, 11, 271–305, https://doi.org/10.1146/annurev-marine-010318-095421, 2019. a
Ionita, M., Scholz, P., Lohmann, G., Dima, M., and Prange, M.: Linkages between atmospheric blocking, sea ice export through Fram Strait and the Atlantic Meridional Overturning Circulation, Scientific Reports, 6, 32881, https://doi.org/10.1038/srep32881, 2016. a, b
Jackson, L. C. and Petit, T.: North Atlantic Overturning and Water Mass Transformation in CMIP6 Models, Climate Dynamics, 60, 2871–2891, https://doi.org/10.1007/s00382-022-06448-1, 2023. a, b
Large, W. G., McWilliams, J. C., and Doney, S. C.: Oceanic vertical mixing: A review and a model with a nonlocal boundary layer parameterization, Reviews of Geophysics, 32, 363–403, https://doi.org/10.1029/94RG01872, 1994. a
Liu, W. and Fedorov, A.: Interaction between Arctic sea ice and the Atlantic meridional overturning circulation in a warming climate, Climate Dynamics, 58, 1811–1827, https://doi.org/10.1007/s00382-021-05993-5, 2022. a, b
Liu, W., Xie, S.-P., Liu, Z., and Zhu, J.: Overlooked possibility of a collapsed Atlantic Meridional Overturning Circulation in warming climate, Science Advances, 3, e1601666, https://doi.org/10.1126/sciadv.1601666, 2017. a
Lozier, M. S., Bacon, S., Bower, A. S., Cunningham, S. A., de Jong, M. F., de Steur, L., deYoung, B., Fischer, J., Gary, S. F., Greenan, B. J. W., Heimbach, P., Holliday, N. P., Houpert, L., Inall, M. E., Johns, W. E., Johnson, H. L., Karstensen, J., Li, F., Lin, X., Mackay, N., Marshall, D. P., Mercier, H., Myers, P. G., Pickart, R. S., Pillar, H. R., Straneo, F., Thierry, V., Weller, R. A., Williams, R. G., Wilson, C., Yang, J., Zhao, J., and Zika, J. D.: Overturning in the Subpolar North Atlantic Program: A New International Ocean Observing System, Bulletin of the American Meteorological Society, 98, 737–752, https://doi.org/10.1175/BAMS-D-16-0057.1, 2017. a
Lozier, M. S., Li, F., Bacon, S., Bahr, F., Bower, A. S., Cunningham, S. A., de Jong, M. F., de Steur, L., deYoung, B., Fischer, J., Gary, S. F., Greenan, B. J. W., Holliday, N. P., Houk, A., Houpert, L., Inall, M. E., Johns, W. E., Johnson, H. L., Johnson, C., Karstensen, J., Koman, G., Le Bras, I. A., Lin, X., Mackay, N., Marshall, D. P., Mercier, H., Oltmanns, M., Pickart, R. S., Ramsey, A. L., Rayner, D., Straneo, F., Thierry, V., Torres, D. J., Williams, R. G., Wilson, C., Yang, J., Yashayaev, I., and Zhao, J.: A sea change in our view of overturning in the subpolar North Atlantic, Science, 363, 516–521, https://doi.org/10.1126/science.aau6592, 2019. a, b, c, d, e
Malardel, S., Wedi, N., Deconinck, W., Diamantakis, M., Kuehnlein, C., Mozdzynski, G., Hamrud, M., and Smolarkiewicz, P.: A new grid for the IFS, ECMWF Newsletter, 23–28, https://doi.org/10.21957/zwdu9u5i, 2016. a
Matos, F. D. A. O.: Diagnosing the Atlantic Meridional Overturning Circulation in density space is critical under abrupt climate change – Model Output Part I, Zenodo [data set], https://doi.org/10.5281/zenodo.15043857, 2025a. a
Matos, F. D. A. O.: Diagnosing the Atlantic Meridional Overturning Circulation in density space is critical under abrupt climate change – Model Output Part II, Zenodo [data set], https://doi.org/10.5281/zenodo.15044678, 2025b. a
Matos, F. D. A. O.: Diagnosing the Atlantic Meridional Overturning Circulation in density space is critical under abrupt climate change – Model Output Part III, Zenodo [data set] https://doi.org/10.5281/zenodo.15047024, 2025c. a
Matos, F. D. A. O.: Diagnosing the Atlantic Meridional Overturning Circulation in density space is critical under abrupt climate change – Scripts, Zenodo [code], https://doi.org/10.5281/zenodo.17395890, 2025d. a, b
Matos, F. D. A. O., Pereira, J., and Dengler, M.: Salinity Biases and the Variability of the Atlantic Meridional Overturning Circulation in GFDL-CM3, Ocean Science Journal, 55, 505–520, https://doi.org/10.1007/s12601-020-0040-8, 2020. a, b
McCarthy, G. D., Smeed, D. A., Johns, W. E., Frajka-Williams, E., Moat, B. I., Rayner, D., Baringer, M. O., Meinen, C. S., Collins, J., and Bryden, H. L.: Measuring the Atlantic Meridional Overturning Circulation at 26° N, Progress in Oceanography, 130, 91–111, https://doi.org/10.1016/j.pocean.2014.10.006, 2015. a
McKay, D. I. A., Staal, A., Abrams, J. F., Winkelmann, R., Sakschewski, B., Loriani, S., Fetzer, I., Cornell, S. E., Rockström, J., and Lenton, T. M.: Exceeding 1.5 °C global warming could trigger multiple climate tipping points, Science, 377, eabn7950, https://doi.org/10.1126/science.abn7950, 2022. a
Meccia, V. L., Simolo, C., Bellomo, K., and Corti, S.: The impact of a weakened AMOC on European heatwaves, Environmental Research Letters, 20, 024005, https://doi.org/10.1088/1748-9326/ada3e7, 2025. a
Mecking, J., Drijfhout, S. S., Jackson, L. C., and Andrews, M. B.: The effect of model bias on Atlantic freshwater transport and implications for AMOC bi-stability, Tellus A: Dynamic Meteorology and Oceanography, 69, 1299910, https://doi.org/10.1080/16000870.2017.1299910, 2017. a, b
Megann, A.: Estimating the numerical diapycnal mixing in an eddy-permitting ocean model, Ocean Modelling, 121, 19–33, https://doi.org/10.1016/j.ocemod.2017.11.001, 2018. a, b, c, d, e
Megann, A.: Quantifying Numerical Mixing in a Tidally Forced Global Eddy-Permitting Ocean Model, Ocean Modelling, 188, 102329, https://doi.org/10.1016/j.ocemod.2024.102329, 2024. a
Megann, A., Blaker, A., Josey, S., New, A., and Sinha, B.: Mechanisms for Late 20th and Early 21st Century Decadal AMOC Variability, Journal of Geophysical Research: Oceans, 126, e2021JC017865, https://doi.org/10.1029/2021JC017865, 2021. a, b, c, d
Moat, B., Smeed, D., Rayner, D., Johns, W., Smith, R., Volkov, D., Elipot, S., Petit, T., Kajtar, J., Baringer, M. O., and Collins, J.: Atlantic meridional overturning circulation observed by the RAPID-MOCHA-WBTS (RAPID-Meridional Overturning Circulation and Heatflux Array-Western Boundary Time Series) array at 26N from 2004 to 2023 (v2023.1a), https://doi.org/10.5285/33826d6e-801c-b0a7-e063-7086abc0b9db, 2025. a, b, c, d
Nobre, P., Veiga, S. F., Giarolla, E., Marquez, A. L., da Silva, M. B., Capistrano, V. B., Malagutti, M., Fernandez, J. P. R., Soares, H. C., Bottino, M. J., Kubota, P. Y., Figueroa, S. N., Bonatti, J. P., Sampaio, G., Casagrande, F., Costa, M. C., and Nobre, C. A.: AMOC decline and recovery in a warmer climate, Scientific Reports, 13, 15928, https://doi.org/10.1038/s41598-023-43143-5, 2023. a, b, c
O'Neill, B. C., Tebaldi, C., van Vuuren, D. P., Eyring, V., Friedlingstein, P., Hurtt, G., Knutti, R., Kriegler, E., Lamarque, J.-F., Lowe, J., Meehl, G. A., Moss, R., Riahi, K., and Sanderson, B. M.: The Scenario Model Intercomparison Project (ScenarioMIP) for CMIP6, Geosci. Model Dev., 9, 3461–3482, https://doi.org/10.5194/gmd-9-3461-2016, 2016. a
Orihuela-Pinto, B., England, M. H., and Taschetto, A. S.: Interbasin and interhemispheric impacts of a collapsed Atlantic Overturning Circulation, Nature Climate Change, 12, 558–565, https://doi.org/10.1038/s41558-022-01380-y, 2022. a
Orsi, A. H., Johnson, G. C., and Bullister, J. L.: Circulation, mixing, and production of Antarctic Bottom Water, Progress in Oceanography, 43, 55–109, https://doi.org/10.1016/S0079-6611(99)00004-X, 1999. a
Petersen, M. R., Jacobsen, D. W., Ringler, T. D., Hecht, M. W., and Maltrud, M. E.: Evaluation of the arbitrary Lagrangian–Eulerian vertical coordinate method in the MPAS-Ocean model, Ocean Modelling, 86, 93–113, https://doi.org/10.1016/j.ocemod.2014.12.004, 2015. a
Piecuch, C. G. and Beal, L. M.: Robust Weakening of the Gulf Stream During the Past Four Decades Observed in the Florida Straits, Geophysical Research Letters, 50, e2023GL105170, https://doi.org/10.1029/2023GL105170, 2023. a
Roberts, M. J., Jackson, L. C., Roberts, C. D., Meccia, V., Docquier, D., Koenigk, T., Ortega, P., Moreno-Chamarro, E., Bellucci, A., Coward, A., Drijfhout, S., Exarchou, E., Gutjahr, O., Hewitt, H., Iovino, D., Lohmann, K., Putrasahan, D., Schiemann, R., Seddon, J., Terray, L., Xu, X., Zhang, Q., Chang, P., Yeager, S. G., Castruccio, F. S., Zhang, S., and Wu, L.: Sensitivity of the Atlantic Meridional Overturning Circulation to Model Resolution in CMIP6 HighResMIP Simulations and Implications for Future Changes, Journal of Advances in Modeling Earth Systems, 12, e2019MS002014, https://doi.org/10.1029/2019MS002014, 2020. a
Rühs, S., Schwarzkopf, F. U., Speich, S., and Biastoch, A.: Cold vs. warm water route – sources for the upper limb of the Atlantic Meridional Overturning Circulation revisited in a high-resolution ocean model, Ocean Sci., 15, 489–512, https://doi.org/10.5194/os-15-489-2019, 2019. a
Sanchez-Franks, A., Holliday, N. P., Evans, D. G., Fried, N., Tooth, O., Chafik, L., Fu, Y., Li, F., de Jong, M. F., and Johnson, H. L.: The Irminger Gyre as a Key Driver of the Subpolar North Atlantic Overturning, Geophysical Research Letters, 51, e2024GL108457, https://doi.org/10.1029/2024GL108457, 2024. a, b
Santoso, A. and England, M. H.: Antarctic Intermediate Water Circulation and Variability in a Coupled Climate Model, Journal of Physical Oceanography, 34, 2160–2179, https://doi.org/10.1175/1520-0485(2004)034<2160:AIWCAV>2.0.CO;2, 2004. a
Saunders, P.: The dense northern overflows, in: International Geophysics, edited by Siedler, G., Church, J., and Gould, J., vol. 77 of Ocean Circulation and Climate, 401–417, Academic Press, https://doi.org/10.1016/S0074-6142(01)80131-5, 2001. a
Scholz, P., Sidorenko, D., Gurses, O., Danilov, S., Koldunov, N., Wang, Q., Sein, D., Smolentseva, M., Rakowsky, N., and Jung, T.: Assessment of the Finite-volumE Sea ice-Ocean Model (FESOM2.0) – Part 1: Description of selected key model elements and comparison to its predecessor version, Geosci. Model Dev., 12, 4875–4899, https://doi.org/10.5194/gmd-12-4875-2019, 2019. a, b, c
Scholz, P., Sidorenko, D., Danilov, S., Wang, Q., Koldunov, N., Sein, D., and Jung, T.: Assessment of the Finite-VolumE Sea ice–Ocean Model (FESOM2.0) – Part 2: Partial bottom cells, embedded sea ice and vertical mixing library CVMix, Geosci. Model Dev., 15, 335–363, https://doi.org/10.5194/gmd-15-335-2022, 2022. a
Schulzweida, U.: CDO User Guide, Zenodo [software], https://doi.org/10.5281/zenodo.10020800, 2023. a
Sévellec, F. and Fedorov, A. V.: AMOC sensitivity to surface buoyancy fluxes: Stronger ocean meridional heat transport with a weaker volume transport?, Climate Dynamics, 47, 1497–1513, https://doi.org/10.1007/s00382-015-2915-4, 2016. a
Sévellec, F., Fedorov, A. V., and Liu, W.: Arctic sea-ice decline weakens the Atlantic Meridional Overturning Circulation, Nature Climate Change, 7, 604–610, https://doi.org/10.1038/nclimate3353, 2017. a
Sidorenko, D., Danilov, S., Fofonova, V., Cabos, W., Koldunov, N., Scholz, P., Sein, D. V., and Wang, Q.: AMOC, Water Mass Transformations, and Their Responses to Changing Resolution in the Finite-VolumE Sea Ice-Ocean Model, Journal of Advances in Modeling Earth Systems, 12, e2020MS002317, https://doi.org/10.1029/2020MS002317, 2020a. a, b, c, d, e, f, g, h
Sidorenko, D., Danilov, S., Koldunov, N., Scholz, P., and Wang, Q.: Simple algorithms to compute meridional overturning and barotropic streamfunctions on unstructured meshes, Geosci. Model Dev., 13, 3337–3345, https://doi.org/10.5194/gmd-13-3337-2020, 2020b. a, b, c
Sidorenko, D., Danilov, S., Streffing, J., Fofonova, V., Goessling, H. F., Scholz, P., Wang, Q., Androsov, A., Cabos, W., Juricke, S., Koldunov, N., Rackow, T., Sein, D. V., and Jung, T.: AMOC Variability and Watermass Transformations in the AWI Climate Model, Journal of Advances in Modeling Earth Systems, 13, e2021MS002582, https://doi.org/10.1029/2021MS002582, 2021. a, b, c, d, e, f, g, h
Sigmond, M., Fyfe, J. C., Saenko, O. A., and Swart, N. C.: Ongoing AMOC and related sea-level and temperature changes after achieving the Paris targets, Nature Climate Change, 10, 672–677, https://doi.org/10.1038/s41558-020-0786-0, 2020. a
Speer, K. and Tziperman, E.: Rates of Water Mass Formation in the North Atlantic Ocean, Journal of Physical Oceanography, 22, 93–104, https://doi.org/10.1175/1520-0485(1992)022<0093:ROWMFI>2.0.CO;2, 1992. a
Speer, K., Rintoul, S. R., and Sloyan, B.: The Diabatic Deacon Cell, Journal of Physical Oceanography, 30, 3212–3222, https://doi.org/10.1175/1520-0485(2000)030<3212:TDDC>2.0.CO;2, 2000. a
Srokosz, M., Baringer, M., Bryden, H., Cunningham, S., Delworth, T., Lozier, S., Marotzke, J., and Sutton, R.: Past, Present, and Future Changes in the Atlantic Meridional Overturning Circulation, Bulletin of the American Meteorological Society, 93, 1663–1676, https://doi.org/10.1175/BAMS-D-11-00151.1, 2012. a
Stevens, D. P. and Ivchenko, V. O.: The zonal momentum balance in an eddy-resolving general-circulation model of the southern ocean, Quarterly Journal of the Royal Meteorological Society, 123, 929–951, https://doi.org/10.1002/qj.49712354008, 1997. a
Streffing, J., Sidorenko, D., Semmler, T., Zampieri, L., Scholz, P., Andrés-Martínez, M., Koldunov, N., Rackow, T., Kjellsson, J., Goessling, H., Athanase, M., Wang, Q., Hegewald, J., Sein, D. V., Mu, L., Fladrich, U., Barbi, D., Gierz, P., Danilov, S., Juricke, S., Lohmann, G., and Jung, T.: AWI-CM3 coupled climate model: description and evaluation experiments for a prototype post-CMIP6 model, Geosci. Model Dev., 15, 6399–6427, https://doi.org/10.5194/gmd-15-6399-2022, 2022. a, b, c
Tesdal, J.-E., MacGilchrist, G. A., Beadling, R. L., Griffies, S. M., Krasting, J. P., and Durack, P. J.: Revisiting interior water mass responses to surface forcing changes and the subsequent effects on overturning in the Southern Ocean, Journal of Geophysical Research: Oceans, 128, e2022JC019105, https://doi.org/10.1029/2022JC019105, 2023. a
van Westen, R. M., Kliphuis, M., and Dikjstra, H. A.: Collapse of the Atlantic Meridional Overturning Circulation in a Strongly Eddying Ocean-Only Model, Geophysical Research Letters, 62, e2024GL114532, https://doi.org/10.1029/2024GL114532, 2025. a, b
Walin, G.: On the relation between sea-surface heat flow and thermal circulation in the ocean, Tellus, 34, 187–195, https://doi.org/10.3402/tellusa.v34i2.10801, 1982. a, b
Weijer, W., Cheng, W., Garuba, O. A., Hu, A., and Nadiga, B. T.: CMIP6 Models Predict Significant 21st Century Decline of the Atlantic Meridional Overturning Circulation, Geophysical Research Letters, 47, e2019GL086075, https://doi.org/10.1029/2019GL086075, 2020. a
Wett, S., Rhein, M., Kieke, D., Mertens, C., and Moritz, M.: Meridional Connectivity of a 25-Year Observational AMOC Record at 47° N, Geophysical Research Letters, 50, e2023GL103284, https://doi.org/10.1029/2023GL103284, 2025. a
Xu, X., Rhines, P. B., and Chassignet, E. P.: On Mapping the Diapycnal Water Mass Transformation of the Upper North Atlantic Ocean, Journal of Physical Oceanography, 48, 2233–2258, https://doi.org/10.1175/JPO-D-17-0223.1, 2018. a, b, c, d, e, f
Yang, H., Lohmann, G., Stepanek, C., Wang, Q., Huang, R. X., Shi, X., Liu, J., Chen, D., Wang, X., Zhong, Y., Yang, Q., Bao, Y., and Mueller, J.: Satellite-observed strong subtropical ocean warming as an early signature of global warming, Communications Earth & Environment, 4, https://doi.org/10.1038/s43247-023-00839-w, 2023. a
Zhang, B., Wang, S., and Slater, L.: Anthropogenic climate change doubled the frequency of compound drought and heatwaves in low-income regions, Communications Earth & Environment, 5, 1–8, https://doi.org/10.1038/s43247-024-01894-7, 2024. a
Zhao, A., Robson, J., Sutton, R., Lai, M. W., Mecking, J. V., Yeager, S., and Petit, T.: Large diversity in AMOC internal variability across NEMO-based climate models, Climate Dynamics, 62, 3355–3374, https://doi.org/10.1007/s00382-023-07069-y, 2024. a, b, c
Zimmerman, C. C., Wagner, T. J. W., Maroon, E. A., and McNamara, D. E.: Slowed Response of Atlantic Meridional Overturning Circulation Not a Robust Signal of Collapse, Geophysical Research Letters, 52, e2024GL112415, https://doi.org/10.1029/2024GL112415, 2025. a