the Creative Commons Attribution 4.0 License.
the Creative Commons Attribution 4.0 License.
 | 02 Oct 2025
Influence of wind stress and the Isonzo/Soča River outflow on surface currents in the Gulf of Trieste
Sofia Flora
Fabio Giordano
Emanuele Ingrassia
Milena Menna
Stefano Querin
Laura Ursella
In this study, we analysed the extreme meteo-marine event that occurred between October and November 2023 in the northern Adriatic Sea region, focusing on its effects in the Gulf of Trieste (GoT). This event featured a strong inflow of very humid southerly winds, very intense thundershowers and storm surges on the coast, and caused several damages in the north-eastern part of Italy. The heavy rainfall in the Isonzo/Soča catchment led to two major runoff peaks with significant discharges into the GoT. These events represent an ideal case study to investigate how the interplay between local river discharges and the wind regime influence ocean currents in coastal areas.
We adopted an integrated approach to fully understand the dynamics of peculiar environmental processes, clearly emerging from the visual analysis of satellite images (Sentinel-2) collected throughout the event. Therefore, we incorporated in our analysis multiple datasets, including rainfall, wind and surface currents from both HF radars and numerical models. In this way, we could analyse the interaction between river runoff and ocean currents in the GoT, and the importance of prevailing winds such as Bora and Sirocco in modulating current dynamics. The use of rainfall time series allowed us to assess the impact of precipitation on environmental conditions, while the analysis of the wind regime helped to understand the patterns, distribution and intensity of winds in the area of interest. It was observed that the intense runoff of the Isonzo/Soča River triggered by heavy rainfall can override the effects of wind, leading to a dominance of river-induced circulation in the GoT.
Such a multi-platform integrated approach proves to be a useful tool for the analysis and, potentially, forecast of surface ocean dynamics and possible extreme events in coastal areas.
- Article
(11711 KB) - Full-text XML
-
Supplement
(1459 KB) - BibTeX
- EndNote


Coastal environments are inherently vulnerable to extreme events such as coastal storms, river floods, and heavy rainfall, which can lead to significant ecological, economic, and social impacts. Coastal storms, characterised by strong winds and heavy precipitation, can cause severe flooding and erosion (Castelle et al., 2015; Kirezci et al., 2020). Simultaneously, increased river discharge, introduces substantial volumes of freshwater and sediments into coastal zones, affecting salinity, turbidity, temperature, and nutrient dynamics, which can negatively impact marine ecosystems and alter the typical circulation patterns (Bianchi et al., 2010; Syvitski et al., 2005; Mauri et al., 2008; Penna et al., 2004). The interplay of these factors highlights the need for comprehensive monitoring and analysis of coastal processes to assess the interactions between river discharge and coastal storms. Understanding marine conditions and dynamics during these events is crucial for designing effective coastal defence structures.
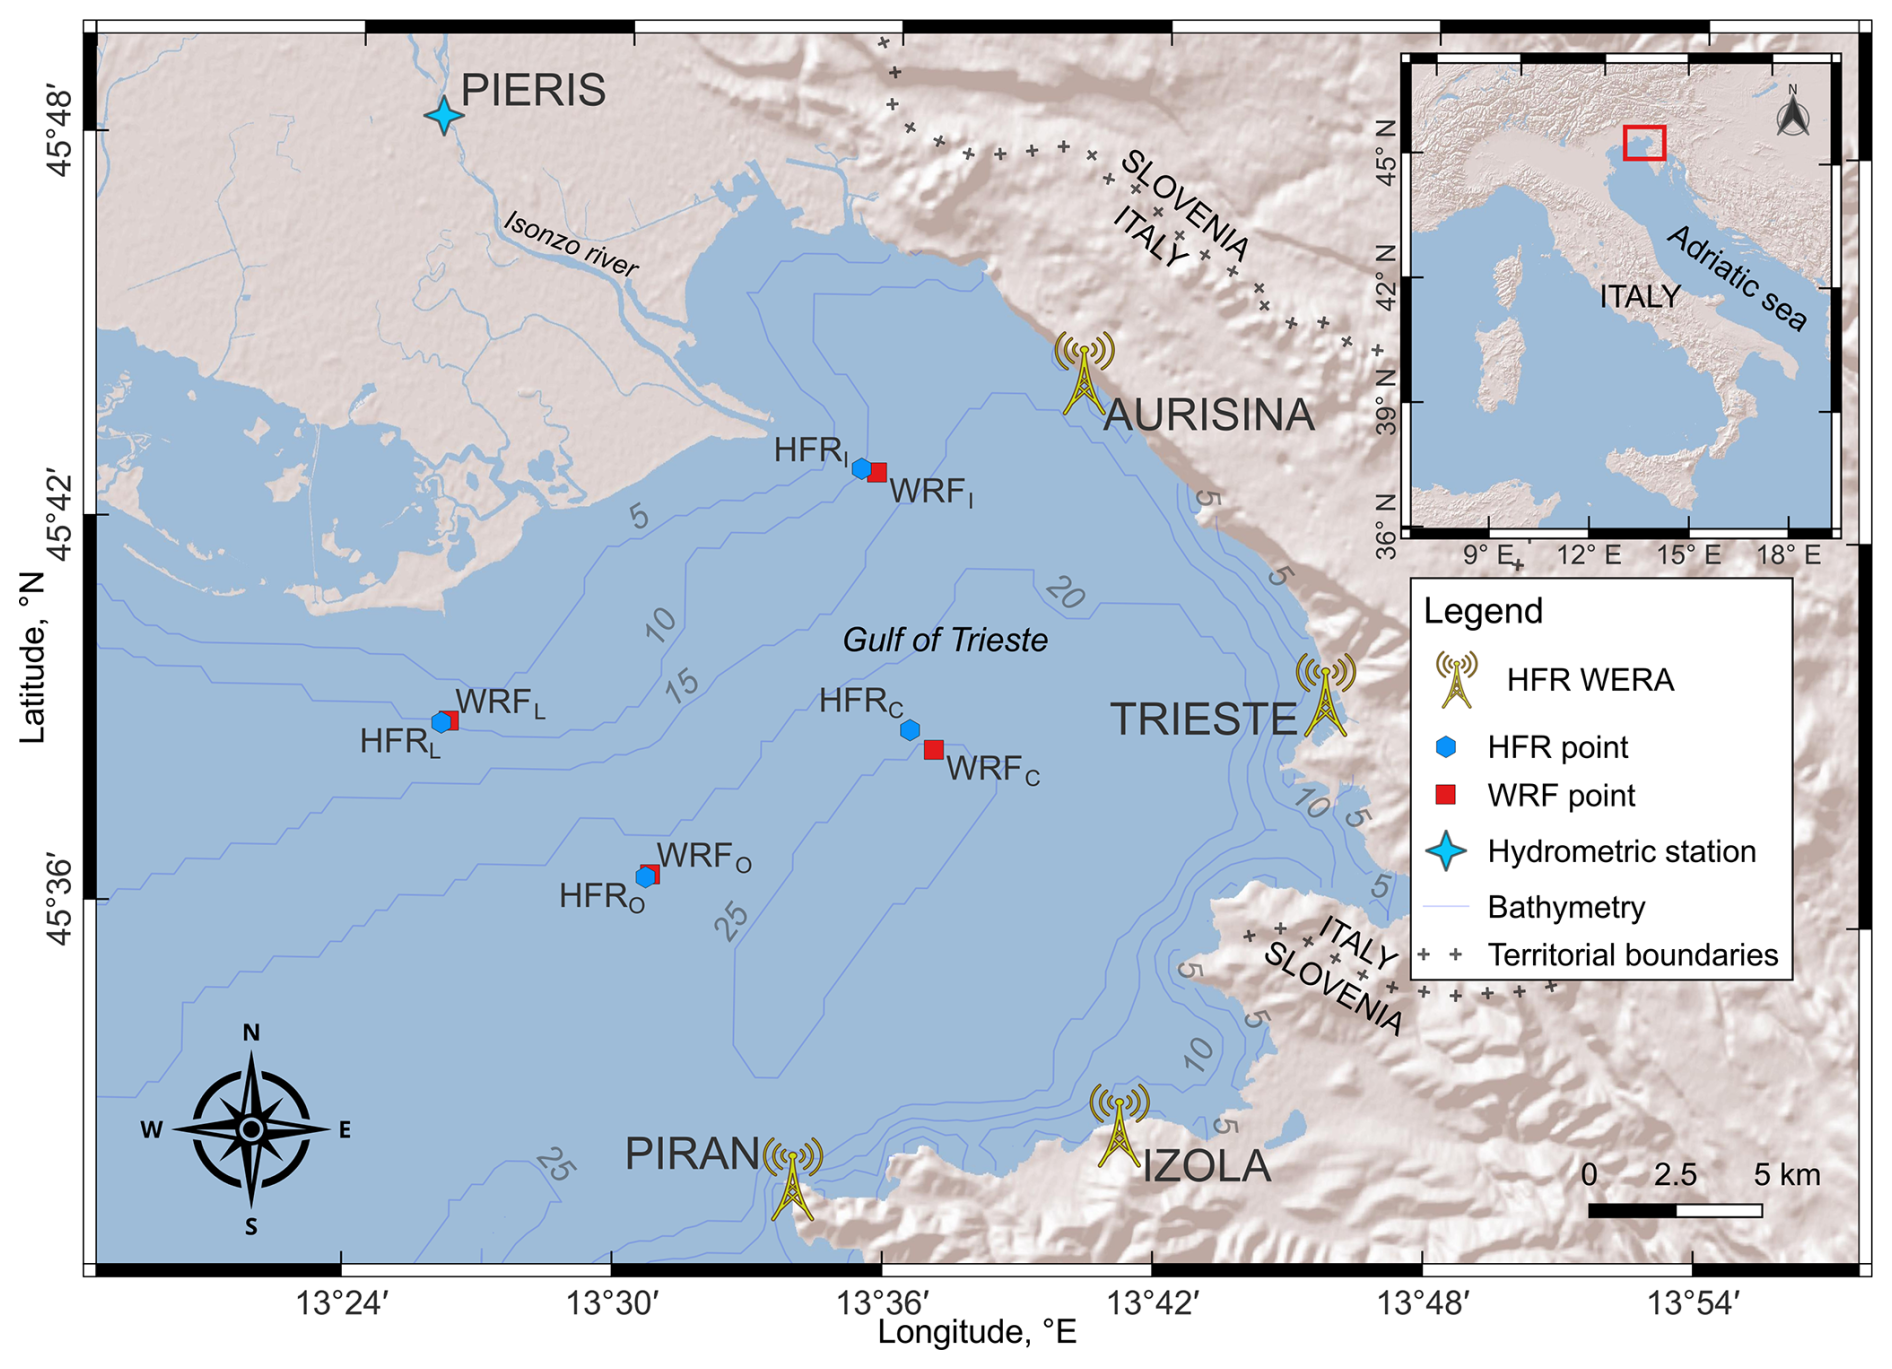
Figure 1Map of the Gulf of Trieste (size of about 20×20 km). Location of HFR network, hydrometric station, points selected in the WRF grid and points selected in the HFR grid in the GoT. The source of the base map is https://server.arcgisonline.com/ArcGIS/rest/services/World_Shaded_Relief/MapServer/tile/{z}/{y}/{x} (last access: 20 March 2025).
Similar studies around the world – such as those in the Mississippi River Delta (Dzwonkowski et al., 2015), in the Chesapeake Bay, Delaware Bay, and New York Bay (Ezer and Updyke, 2024) as well as for the Amazon River Plume (Molleri et al., 2010) – have demonstrated how riverine flow can modify local circulation patterns, especially during periods of high discharge.
In recent years, the Gulf of Trieste (GoT, northernmost part of the Adriatic Sea, Fig. 1) has also experienced a series of extreme events, including intense coastal storms and high river discharge episodes, highlighting the vulnerability of the region to combined meteorological and hydrological impacts.
The primary objective of this study is to assess the influence of river discharge (from the Isonzo/Soča) on the surface circulation in the GoT during extreme weather events, with a particular focus on the interplay between riverine outflow and the prevailing wind regime. By examining the interactions between these factors, we aim to gain insights into the relative contributions of fluvial and meteorological drivers on surface currents in semi-enclosed coastal basins like the GoT.
Water circulation in the GoT is strongly influenced by a combination of oceanographic, meteorological and hydrological factors, including the circulation of the northern Adriatic Sea, the wind regime in the area and freshwater inputs from local rivers such as the Isonzo/Soča, Dragonja, Rižana and Timavo (Querin et al., 2006; Cosoli et al., 2012, 2013; Querin et al., 2021). Due to strong winter heat loss and evaporation, the GoT is an important area for the formation of the Northern Adriatic Dense Water (NAdDW), a key process for the thermohaline circulation of both the Adriatic Sea and the entire eastern Mediterranean.
The dominant winds in the GoT come from the northeastern (Bora), and southern (Sirocco) quadrants (Poulain and Raicich, 2001). The Bora wind, a predominantly winter wind that blows mainly in the northern Adriatic Sea, is a katabatic and gusty wind with very small fetch in the GoT (Cosoli et al., 2013; Querin et al., 2021). The strength of the wind depends on the local topography of the area, with maxima in the GoT and south of the southern tip of the Istrian peninsula (Kvarner Gulf) and minima along the eastern border of the central and southern Adriatic Sea (Cosoli et al., 2013). The Bora contributes to the largest heat loss in the entire Adriatic Sea (Dorman et al., 2006; Raicich et al., 2013), as well as vertical mixing along the water column, as wind-driven surface currents move the upper water layer westwards and cause the phenomenon of upwelling along the eastern coast (Querin et al., 2006). The Sirocco, on the other hand, is less gusty than the Bora and carries warm, moist air, which often causes strong precipitation, leading to flood events in coastal areas.
In addition, Bora remains the most important meteorological input influencing the prevailing cyclonic circulation in the GoT. This counterclockwise current is also affected by the freshwater inflow from the Isonzo River, whose periodic discharge can change the circulation pattern into anticyclonic (Cosoli et al., 2013; Querin et al., 2021). The dynamics associated with Sirocco are less documented, but it is known that this wind causes sea level rise in the northern Adriatic Sea, followed by a strong outflow to the south when the wind subsides (Cosoli et al., 2012).
In the Adriatic Sea, the influence of tides on the overall current variability is generally weak and becomes significant only in coastal areas where tides predominate (Chavanne et al., 2007; Kovačević et al., 2004; Cosoli et al., 2012), such as in the GoT. In addition, the contribution of tides to net transport by residual components is generally considered negligible (Cushman-Roisin and Naimie, 2002; Malačič et al., 2000). In the Adriatic Sea, the most significant tidal fluctuations are due to the semi-diurnal (M2, S2, N2, K2) and diurnal (K1, O1 and P1) frequency bands; among these, only the semi-diurnal (M2, S2) and diurnal (K1) harmonics have an influence on the GoT (Cosoli et al., 2013). Cosoli et al. (2013) found that: (i) the M2 tidal ellipses are mainly polarized along the GoT axis with the highest semi-major axis in the outermost area; (ii) the S2 ellipse's map is similar to the one for M2, with generally lower amplitude values; (iii) finally, the K1 tidal ellipses are more circular all over the GoT with comparable amplitudes as S2.
In this study, we examine an event that occurred in the GoT between October and November 2023. During this period, intense rainfall over the Isonzo River watershed resulted in a significant discharge into the GoT. Simultaneously, strong southerly winds caused extensive damage along the coast, particularly affecting the area north of Trieste, which was severely impacted by the coastal storm. Our study aims to determine whether the river discharge had a significant impact on surface currents in the GoT, in particular with respect to the effect of the prevailing winds. By investigating how the Isonzo outflow interacted with marine conditions in the GoT, we aim to provide valuable information on the relative importance of fluvial discharge and wind-driven circulation, offering insights that could support coastal management also in similar areas of the world ocean.
To achieve these goals, we used a combination of observational data and numerical modelling. Observational data include hydrological measurements from the Isonzo River watershed, meteorological data on wind speed and direction, and oceanographic data from WERA-type HF radar stations operating in the GoT. Additionally, a numerical model was employed to simulate current dynamics under varying conditions of river discharge and wind forcing. The integration of these data sources enables a comprehensive analysis of how extreme discharge and wind events affect coastal circulation.
The paper is structured as follows: Sect. 2 describes the data and methods used, which form the backbone of our analysis. Section 3 presents the results, highlighting the key findings and insights. Finally, Sect. 4 presents the conclusions and addresses the possible implications of our research.
For this study, we collected and used sea surface current data (including tides) from HF radars, together with wind data obtained from meteorological models. Analysed HFR and wind data refer to the period of October and November 2023, during which heavy rainfall and significant outflow from Isonzo/Soča river occurred. To obtain a more comprehensive understanding of atmospheric conditions, we observed precipitation depth (not shown) that affected the Isonzo/Soča River catchment area. The increased runoff due to precipitation required the inclusion of hydrometric data (i.e., water level) and derived discharge rates of the Isonzo/Soča River, in addition to analysing the Sentinel-2A images. Lastly, a numerical simulation was set up to obtain a further insight on ocean dynamics and air–sea–river interactions.
2.1 HFR data
Sea surface currents were measured with the WERA (WEllen Radar) high-frequency radar system (Gurgel et al., 1999) operating in the GoT at a frequency of 24.5 MHz, with a spatial and temporal resolution of 1.5 km and 30 min, respectively.
The data on surface ocean currents originate from the combination of four WERA-type HF radar stations in the GoT: Aurisina (IT) operated by OGS, Trieste (IT) operated by ARPA FVG, Izola (SI) operated by NIB and Piran (SI) operated by ARSO. The description of the system and the data are available at the European HFR node website: https://www.hfrnode.eu/networks/hfr-nadr-2/ (last access: 30 January 2024) (OGS et al., 2023).
To assess the influence of river discharge and winds within the horizontal domain, surface current data were extracted at four peculiar points within the HF radar grid (Fig. 1): one near the Isonzo/Soča delta (HFRI), one in the centre of the GoT (HFRC), one offshore of the GoT (HFRO), and finally one along the 10 m isobath north-west of the GoT (HFRL). The four selected radar points are representative of the surrounding areas in which the complex vector correlation exceeds 0.9 (Fig. S1a–d in the Supplement).
The WERA radars installed in the GoT also provide significant wave height and wave direction data every 30 min at each grid point. Wave information is derived from the second-order peaks of the electromagnetic spectrum normalized to the first-order spectra. The second-order region has a lower signal-to-noise ratio, covering a smaller spatial range and requiring longer integration times (Gomez et al., 2015; Tian et al., 2020). The assumption is a linear relationship between the electromagnetic spectrum and the wave spectrum (Barrick, 1977). The signals are recorded by all the stations and the combining process returns spatially distributed information about the significant wave height.
Methodology for tidal component analysis
The tidal current component was calculated at each HF radar grid point to determine its influence on the overall current signal. To quantify the tidal parameters for different tidal components, the t_tide harmonic analysis package (Pawlowicz et al., 2002) was applied to all grid points in the HF radar domain with a time coverage of more than 40 % data. The tidal analysis was initially carried out on the entire year 2023 (not shown), but we subsequently focussed on the tidal analysis limited to the months of October and November. This approach provided a detailed and comprehensive view of tidal variations across all seasons and verified how these variations affect surface currents under different conditions.
2.2 Wind data
The event at the end of October and beginning of November was characterised by strong southerly winds (average daily wind speed > 3 m s−1), which blew continuously between 24 October and 3 November. The highest peak hourly wind values measured at all four locations were between 16 and 18 m s−1 between 2 and 3 November. On 1 November 2023, the regional Civil Defense issued a weather, hydrogeological and hydraulic criticality warning for these days (see: https://www.protezionecivile.fvg.it/sites/default/files/event/attachment/2023-11/Allerta_regionale_29-2023-Pioggeintense-ventoforte-acquaalta.pdf, last access: 8 May 2024).
In this study, we used the u and v velocity components (and derived speed and direction) of the wind at 10 m above the sea surface, which are output by the Weather Research and Forecasting (WFR) model (retrieved from https://www.mmm.ucar.edu/models/wrf, last access: 25 January 2024), version 4.2.1. This model is run daily by the Regional Agency for Environmental Protection (ARPA FVG) using the initial and boundary conditions provided by the National Oceanic and Atmospheric Administration Global Forecasting System (https://www.ncei.noaa.gov/products/weather-climate-models/global-forecast, last access: 25 January 2024). Three domains are involved in the processing, the smallest of which was selected as it has a higher resolution – a spatial and temporal resolution of 2 km and 1 h respectively – thanks to the two-way nesting technique (Goglio, 2018). Within the WRF grid, wind data were extracted at the nearest points to the four selected HF radar points (Fig. 1): WRFI, WRFC, WRFO and WRFL.
The wind model (WRF) used in this study shows a high degree of similarity with the COSMO-2I atmospheric model used to drive the numerical simulation of currents (described in Sect. 2.5). The time series extracted at the four points analysed (WRFI, WRFC, WRFO and WRFL) were almost identical between the two models, with only minor differences observed (not shown). These differences, which can be ascribed to different model configurations and input data, were minimal and did not significantly affect the overall results of the study. Therefore, the WRF model can be considered consistent with COSMO-2I in representing the wind dynamics over the analysed area.
Methodology for wind stress calculation
To calculate the wind stress in the GoT we applied the bulk Eq. (1):
where ρa=1.2 kg m−3 is the air density, ua is the wind velocity and Cd is the drag coefficient based on the Eq. (2) by Edson et al. (2013):
where , , p1=1.48 and p2=0.21. Since, to the best of our knowledge, there are no specific definitions of the drag coefficient for the GoT, we chose the previous formulation because it is based on global averages. The wind velocity field ua was smoothed using a 12 h moving average, a technique that reduced the short-term fluctuations, emphasising longer-term vorticity patterns influenced by wind variability.
2.3 Satellite images from Copernicus Sentinel-2A
Sentinel-2A satellite images allow to dynamically track the extension of the Isonzo plume. Sentinel-2A is part of the European Copernicus programme (https://sentinels.copernicus.eu/web/sentinel/copernicus/sentinel-2, last access: 24 September 2025) and is equipped with high-resolution multispectral optical sensors that enable observation of the Earth's surface with detailed spatial resolution. In this study, true color images in the visible range were used, based on the Level 2A product, which provides the surface reflectance after atmospheric correction.
2.4 Isonzo/Soča water level and plume events
Water level data refer to the Pieris hydrometric station (Fig. 1) and consist of a t030/40 TLR radar level sensor with temporal resolution of 15 min. These data have been made available by ARPA FVG (https://www.osmer.fvg.it/home.php, last access: 30 January 2024) for the entire year 2023.
Based on these hydrometric data, we identified periods with significant peaks, which are highlighted in red in Fig. 2a. In the period between October and November, heavy rainfall occurred in the Isonzo/Soča River catchment area, causing the water level to rise and reach an annual peak of 7.16 m on 3 November 2023 at 11:15 UTC. Using this information as a temporal reference point, the images taken by the Sentinel-2A satellite (https://link.dataspace.copernicus.eu/l3n1, last access: 15 December 2023) during the periods of interest were then analysed.
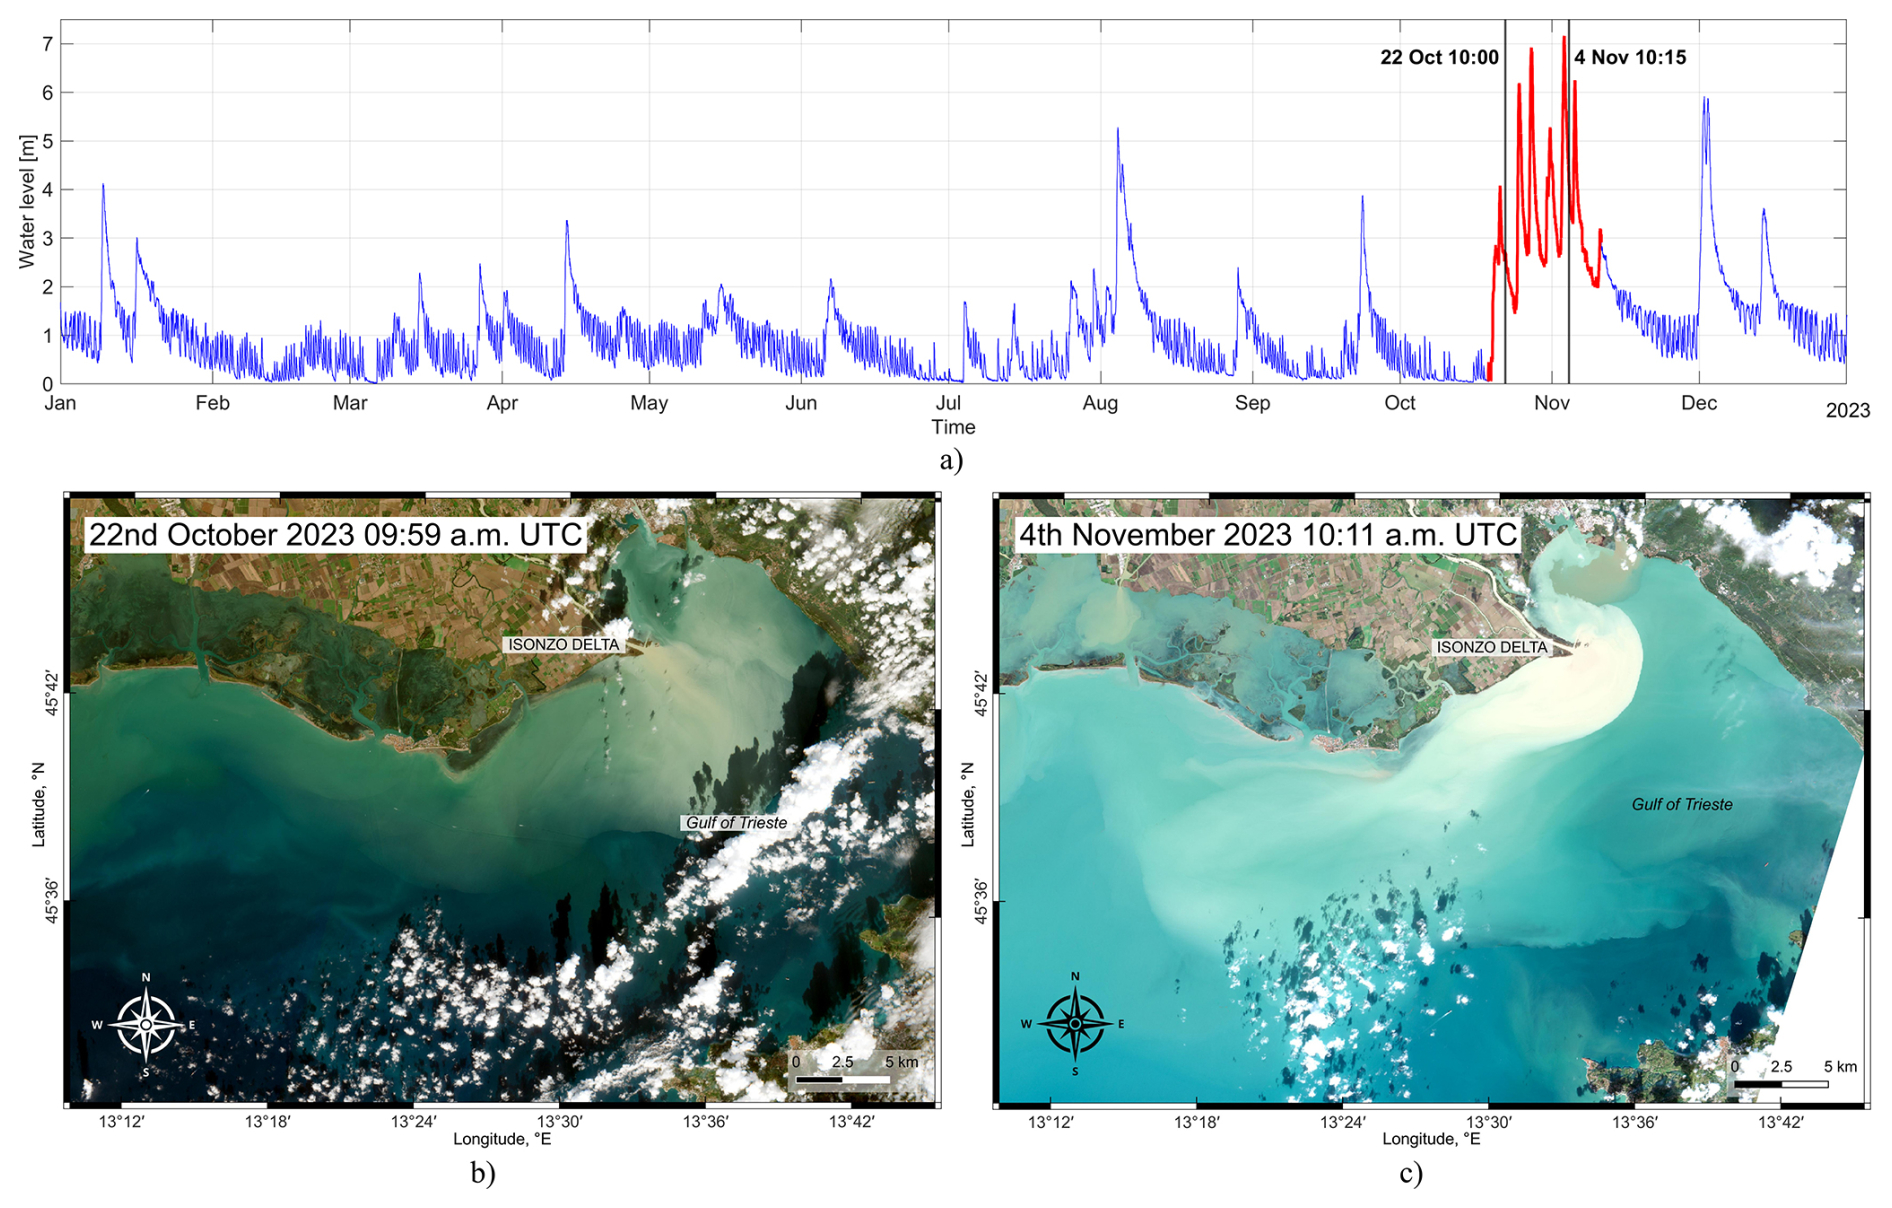
Figure 2(a) Hydrometric data from Pieris hydrometric station in the year 2023, with the highest records highlighted in red. (b) Sentinel-2 image on 22 October 2023 at 09:59 UTC. (c) Sentinel-2 image on 4 November 2023 at 10:11 UTC. Sentinel-2 image were taken from the Copernicus website: https://link.dataspace.copernicus.eu/l3n1 (last access: 15 December 2023).
A significant image of the plume emerging from the Isonzo delta is dated 22 October 2023 (Fig. 2b). This period is important because it corresponds to an increase in hydrometric level, which reached a value of 4.08 m on 21 October 2023. Although the maximum peak of hydrometric level in October was recorded on 27 October (6.92 m), the available Sentinel-2A images from the Copernicus website show cloud cover of more than 90 % for this period, not allowing to assess the plume under these conditions. Another image is from 4 November, downstream of the peak recorded on 3 November at the Pieris hydrometric station, which clearly shows a significant discharge (Fig. 2c).
The Isonzo/Soča River plume was documented by photographs taken from the city of Trieste (Fig. 3). The photos are dated 6 November 2023, two days later than the Sentinel-2A image shown in Fig. 2c. Despite the temporal discrepancy, the images provide further visual documentation of the environmental dynamics that took place during the period under consideration.
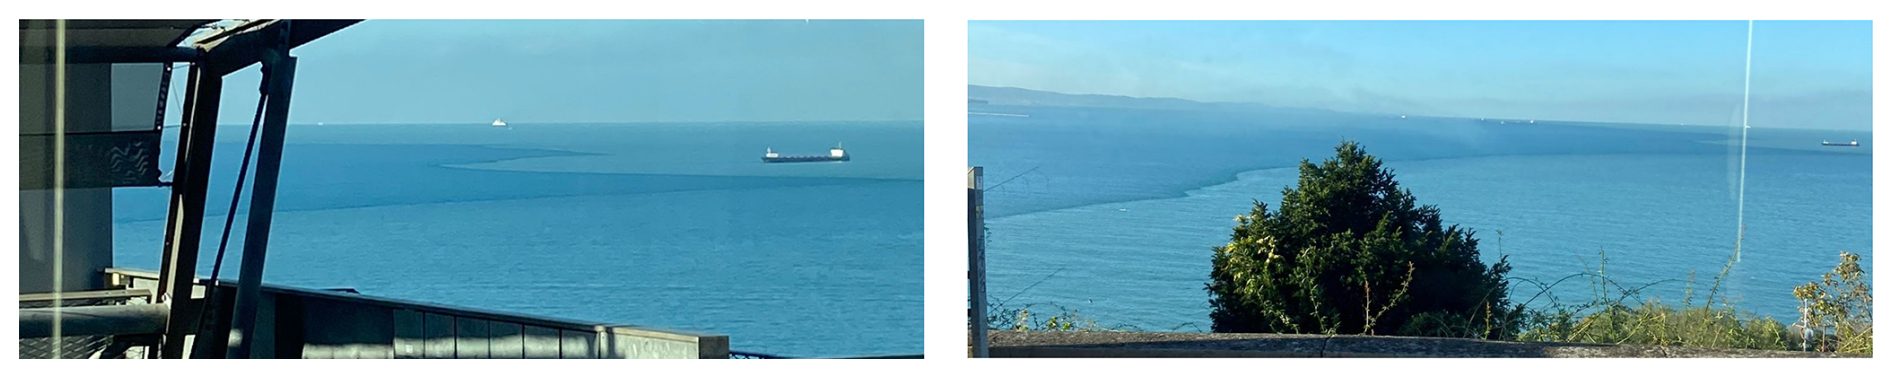
Figure 3The Isonzo/Soča River plume. Pictures kindly provided by Carlotta Dentico.
2.5 Modelling component
A comparison between observed and synthetic data was performed by setting up a yearly simulation covering the whole 2023.
The MITgcm finite volume numerical model (Marshall et al., 1997) was implemented twice. A first simulation included the northern Adriatic (NAD), defined as the portion approximately north of the Ancona-Zadar line, throughout 2023, with an integration time step of 100 s and hourly average output. The domain was discretised in rectangular cells on a Arakawa C-grid, with horizontal spacing of ° (around 750 m), while the vertical levels were characterized by uniform height (1 m) in the topmost 20 m layer, and then increasingly thicker (up to ∼11 m) with depth.
Atmospheric forcing was derived from a sequence of 3 d forecasts provided by the COSMO-2I weather model (https://www.arpae.it/it/temi-ambientali/meteo/, last access: 17 February 2025), while initial and open boundary conditions (at the southern side of the domain) were obtained by the Mediterranean Physics Analysis and Forecast (Clementi et al., 2023) products distributed by the Copernicus Marine Service (CMS). We considered 19 rivers, with flow rate computed with a seasonally modulated climatology except for the Po, Isonzo/Soča and Timavo rivers, where hourly data were available. The riverbeds close to the mouths were simulated as straight channels of uniform depth, from which velocities were imposed as boundary conditions to the model (as in Querin et al., 2021).
A second simulation encompassing the Gulf of Trieste was nested (one-way) into the former one: the boundary conditions were interpolated from the NAD parent run on the higher resolution grid, featuring 6 times higher horizontal resolution (° spacing, around 125 m) and vertical thickness of 0.5 m for the topmost 6 layers, then of 1 m in the interior and of 2 m to the deepest (32 m) layers. The integration time step was set to 10 s, in order to ensure numerical stability even during very high riverine flow rate events. The outputs (averages) were saved at hourly intervals.
The results of this study cover various aspects of oceanographic and atmospheric dynamics in the GoT during the study period, including the analysis of tidal components (Sect. 3.1), the interactions between currents and wind regimes (Sect. 3.2), wind stress and ocean currents vorticity dynamics (Sect. 3.3), as well as the wave data recorded during significant meteorological events (Sect. 3.4). The comparison between measured and modelled sea surface currents (Sect. 3.5) closes this section.
3.1 Tidal components
The results of the tidal components analysis for the whole year 2023 (not shown) were consistent with those already observed and described by Cosoli et al. (2013), highlighting a high signal-to-noise ratio for the S1 component. Then we focused the analysis on October and November, allowing a more detailed and specific look at tidal dynamics during particular weather conditions. Figure 4a–c shows the three main tidal components identified in all HFR grid points: K1, M2, and S2. S1 is not resolved within the two-month time series, and its signal is included in the neighbouring tidal component, i.e. K1.
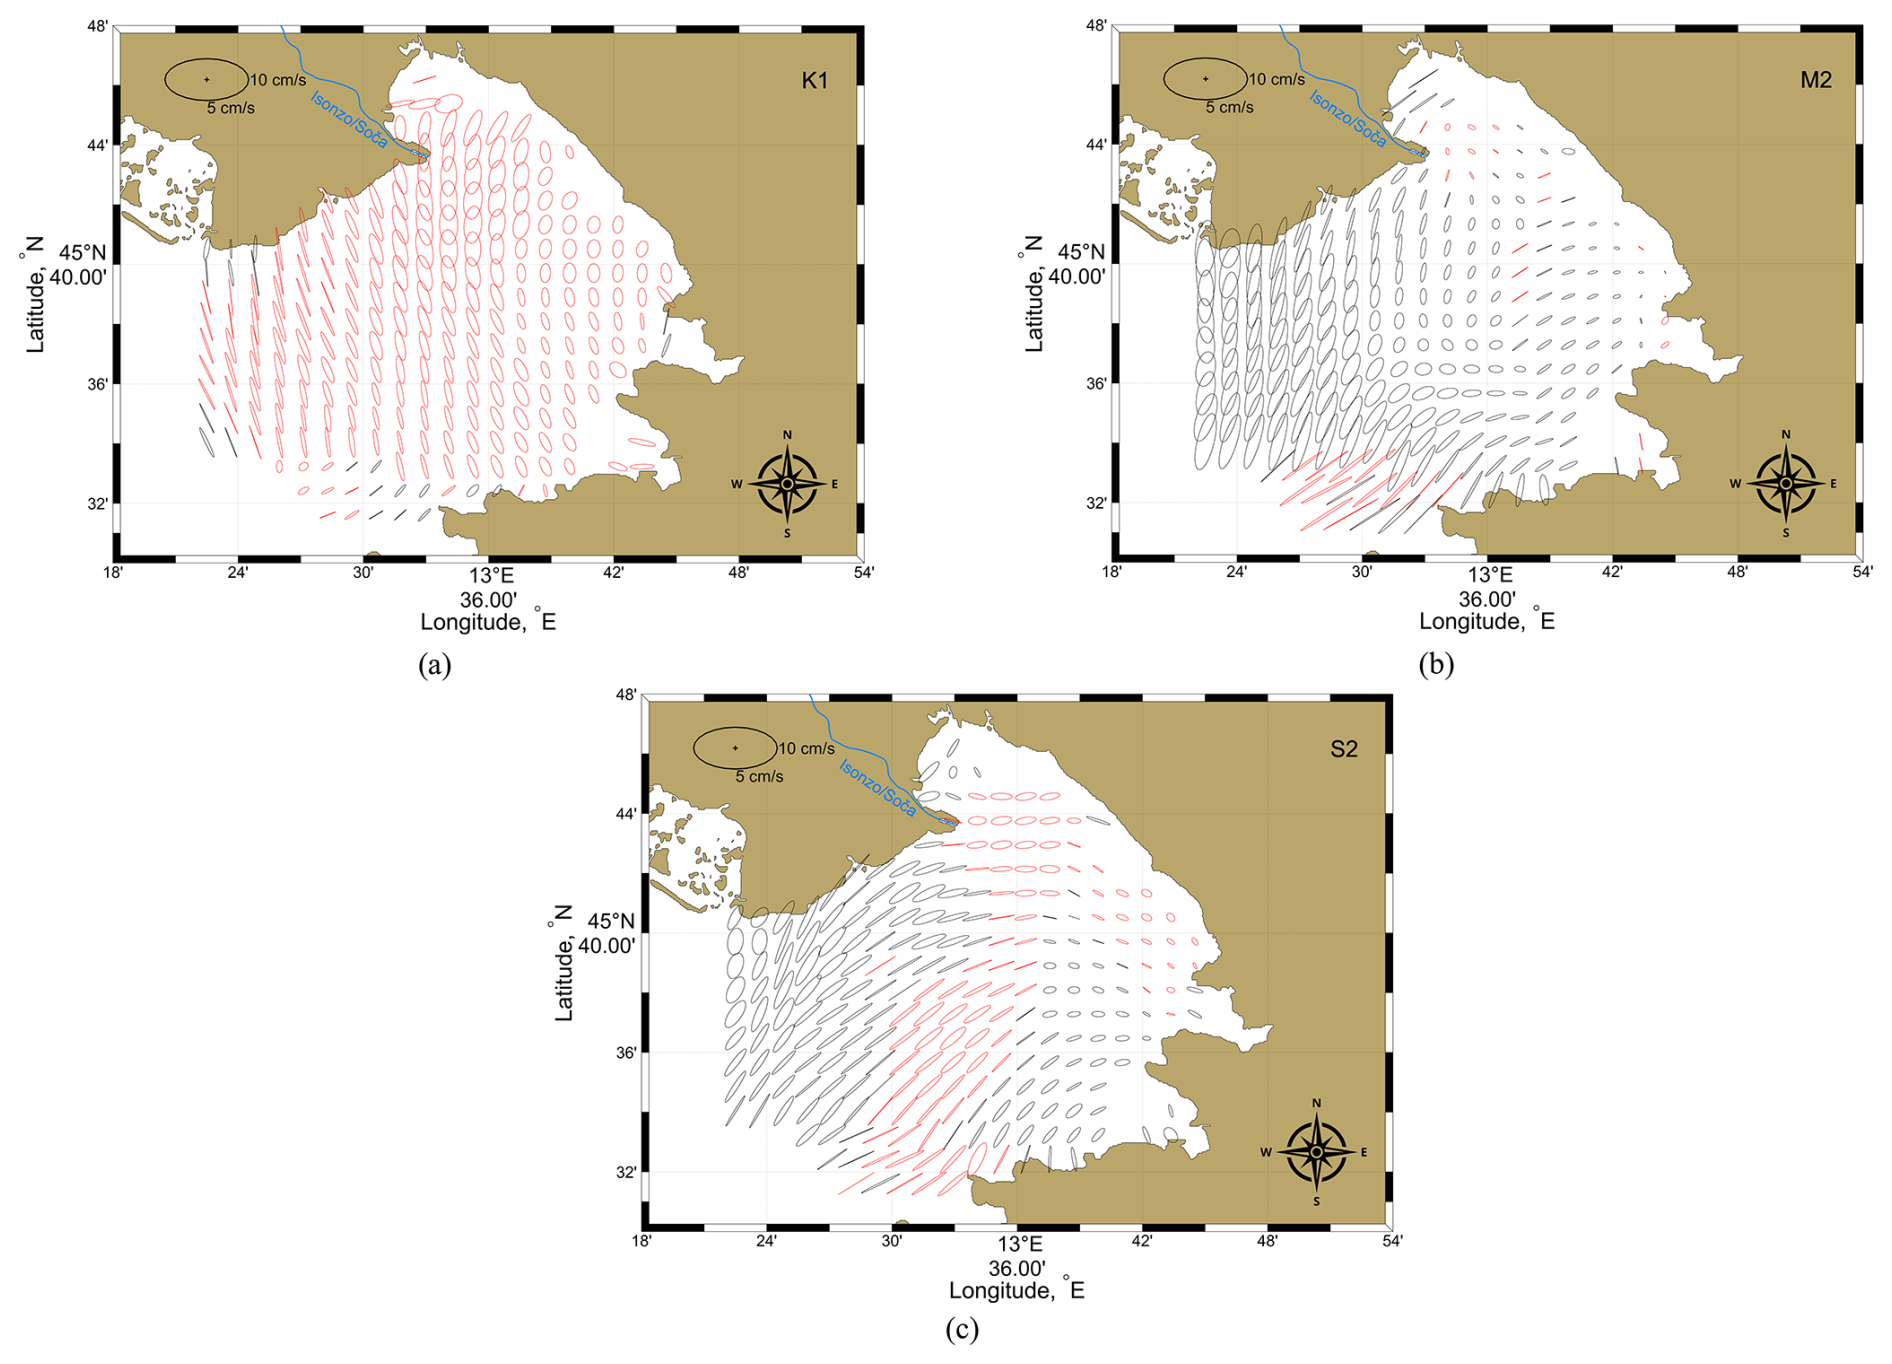
Figure 4Tidal ellipses for the diurnal harmonic K1 (a) and semidiurnal harmonics M2 and S2 (b, c). The black and red ellipses refer to a counterclockwise and clockwise rotation, respectively.
Table 1 summarises the results of the tidal component analysis at the four radar points HFRI, HFRC, HFRO and HFRL.
Table 1Results of the tidal analysis with associated confidence intervals for the four radar points.
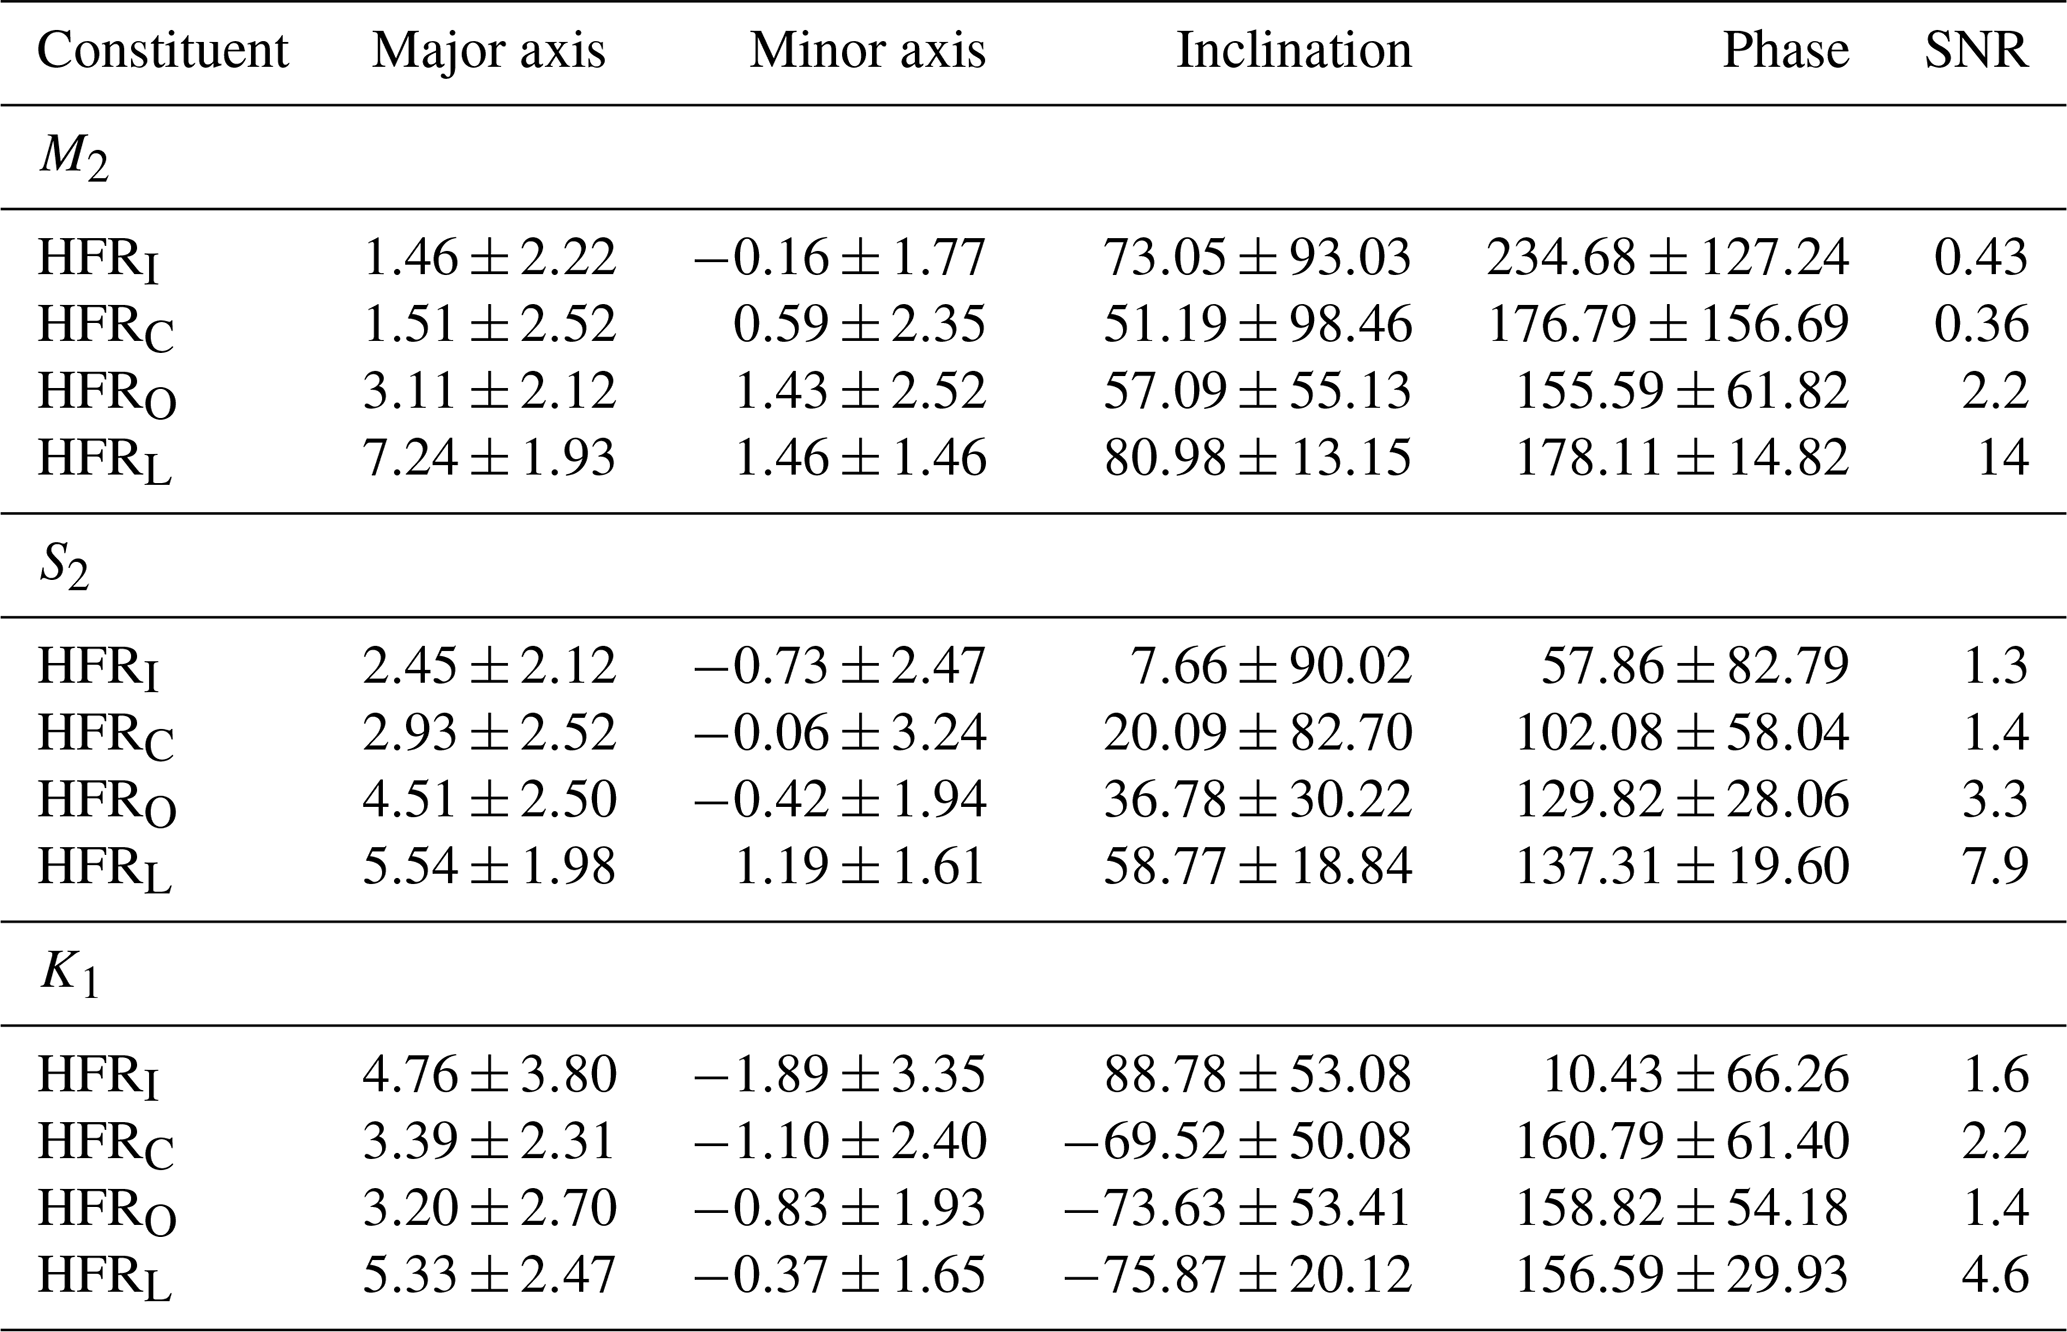
The K1 tidal ellipses (Fig. 4a) tend to be less circular and more elongated in the NW–SE direction in the central and outer parts of the GoT, while the ellipses in the northeastern part were more circular and smaller, with a slight difference in inclination. It is noticeable that the inclination of the ellipses in the northernmost and southernmost parts was different from the other ellipses in the GoT. The highest values for the tidal semi-major axis were found in the north-western and western portion of the GoT. The rotation of the ellipses was anticyclonic (clockwise) throughout the basin, with some exceptions of cyclonic rotation (counterclockwise) in a few isolated areas.
The M2 tidal ellipses (Fig. 4b) showed a higher concentration of elongated ellipses in the SW–NE direction in the southern part of the basin, where anticyclonic rotation of the ellipses was also observed. In the central and western parts of the GoT, the ellipses take on a more circular shape. The semi-major axis are the biggest in the outermost part of the GoT.
The S2 tidal ellipses (Fig. 4c) were mainly elongated in the SW–NE direction throughout the GoT and showed an almost constant inclination, with the exception of the northeastern part. In the eastern and western parts of the GoT, a cyclonic rotation of the ellipses was observed, while the ellipses in the central part rotated clockwise. The semi-major axis for S2 are the biggest in the westernmost part of the GoT.
The maps for the three tidal constituents are generally in good agreement with the results of Cosoli et al. (2013).
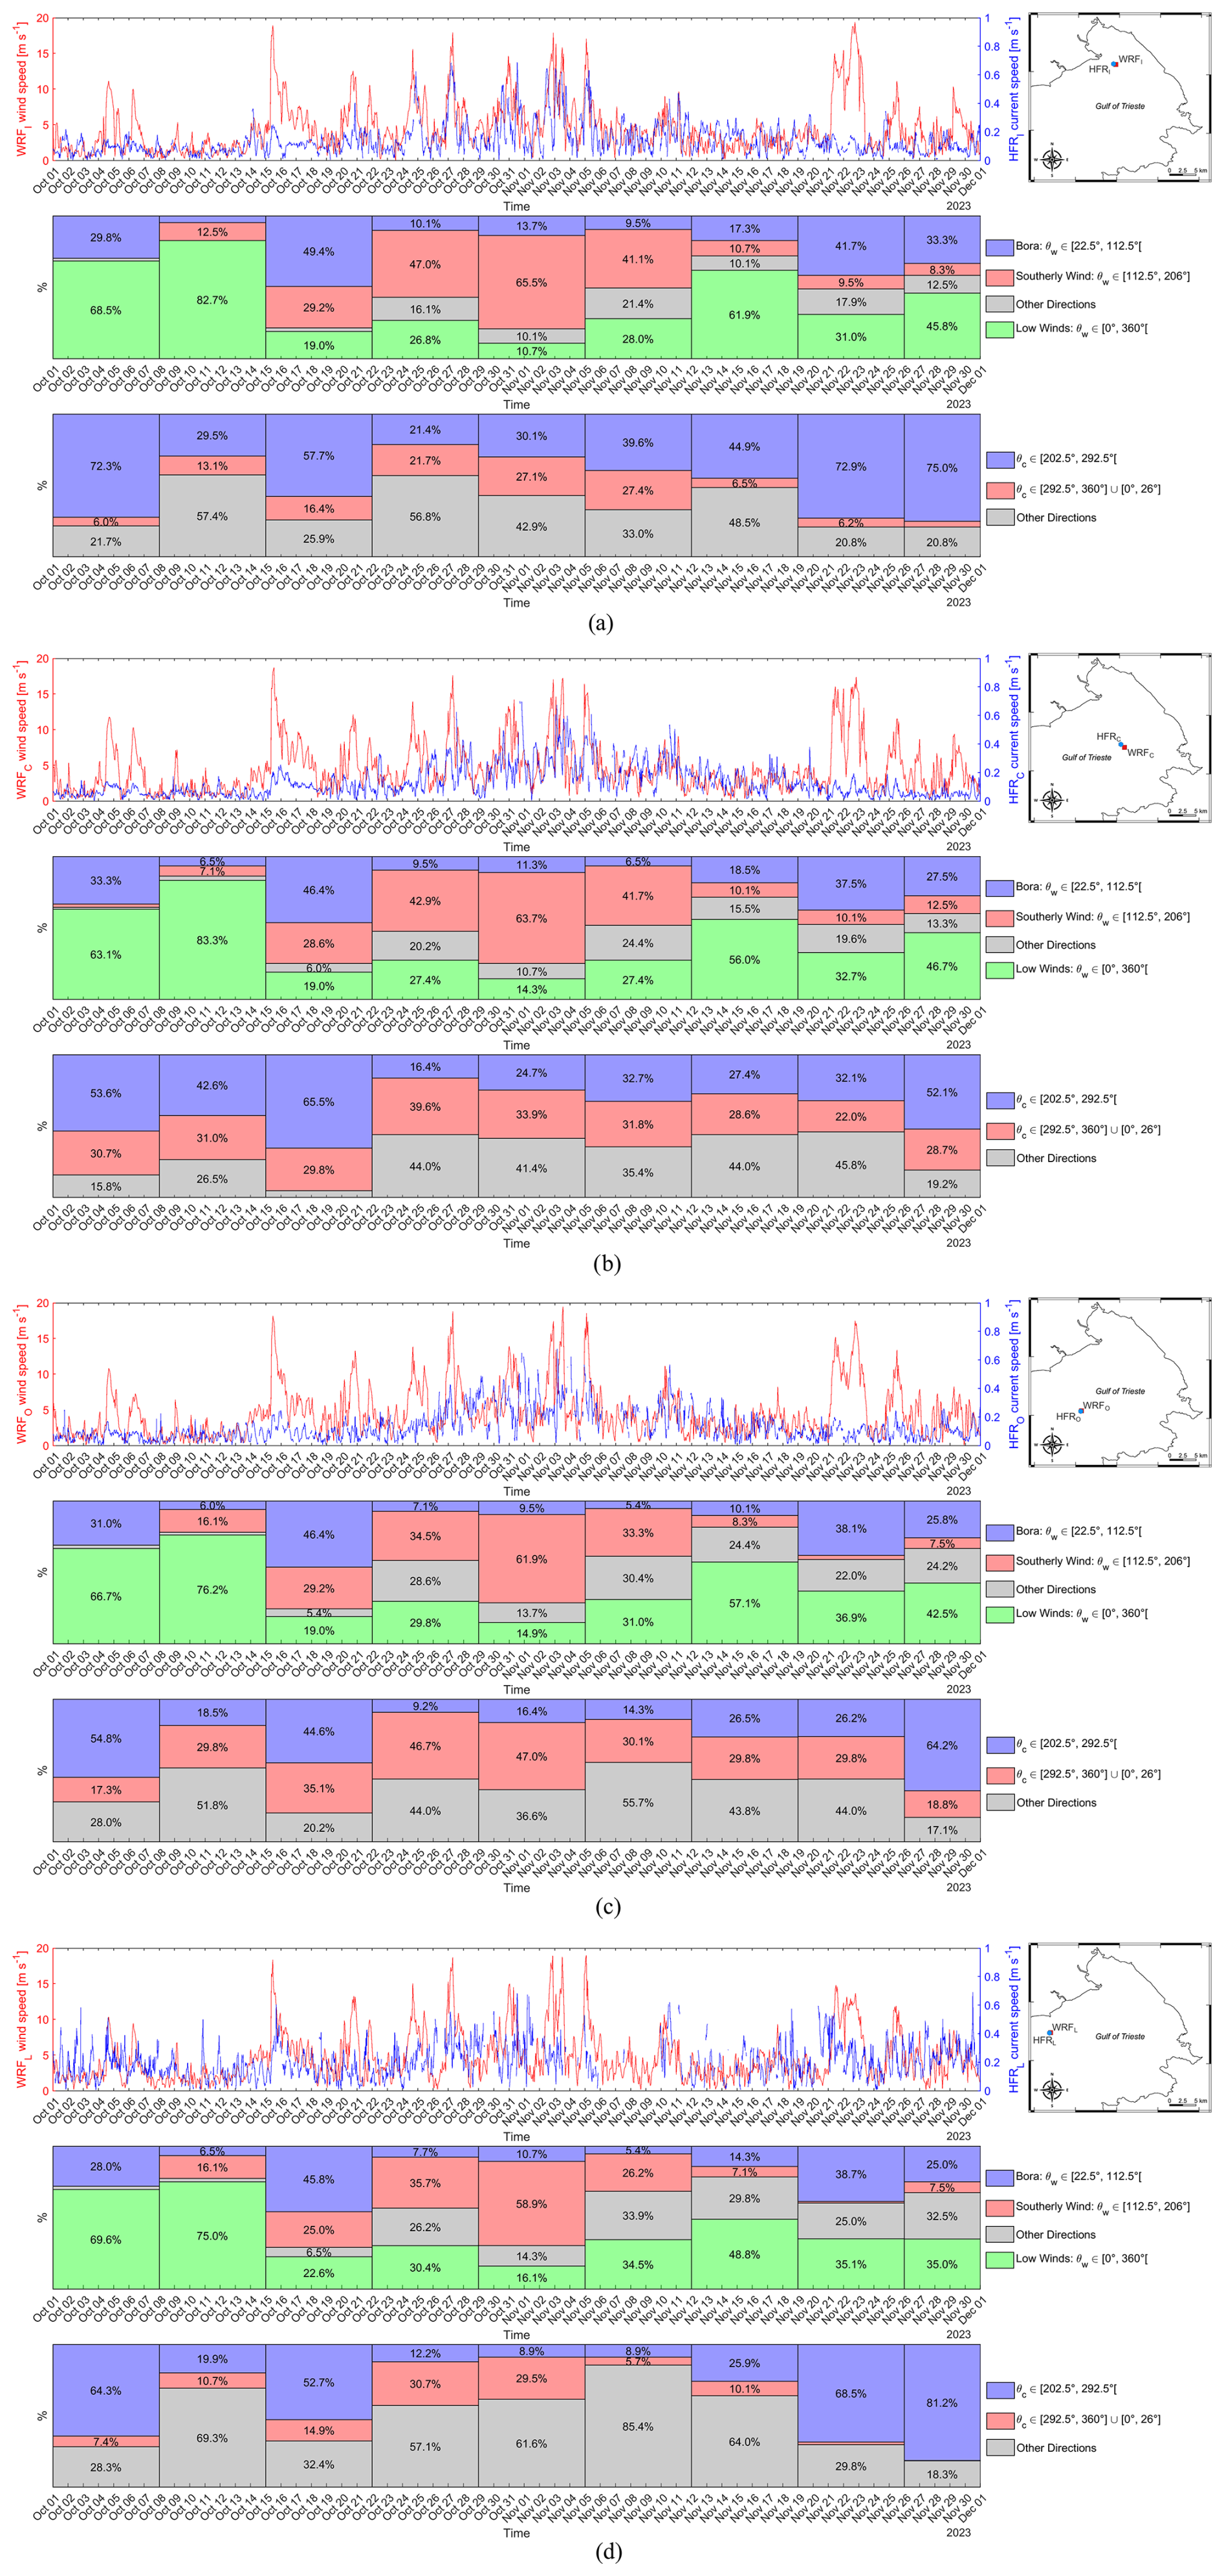
Figure 5Comparison between the time series of surface current speed and wind speed for each of the four selected points in the GoT (a–d). Top panel: time series of surface current velocity measured by HF radar (blue) and wind speed by WRF model (red). Middle panel: Weekly percentage distribution of wind kinds based on the WRF model (the direction refers to where the wind is coming from). Bottom panel: weekly percentage distribution of sea surface current directions derived from HF radar data (the direction refers to where the current is flowing). The angles are calculated clockwise from the north. Segments with percentages below 5 % are not labelled.
3.2 Currents and wind dynamics
Figure 5a–d shows the time series for the period October and November 2023 at the four points indicated in Fig. 1. It describes the current (blue) and wind (red) speed, together with the weekly percentage distribution of different winds based on the WRF model and of sea surface current directions from HFR data. The different wind types were classified according to Flora et al. (2023) and are listed below:
-
Green: low wind events (daily average value below 3 m s−1), ;
-
Blue: Bora wind events, ;
-
Red: southerly wind events, ;
-
Grey: winds coming from other directions;
where θw is the direction from which the wind is blowing.
The same color scheme was used for current direction (θc), assuming the oceanographic convention (i.e., current direction refers to the direction in which the current is flowing). This approach is based on the assumption that the main winds are driving sea surface currents:
-
Blue: ;
-
Red: ;
-
Grey: other directions.
In all figures, between 22 October and 11 November, strong winds blew mainly from the south, while the direction of the sea surface currents showed a rather broad distribution, suggesting an important and complex relationship between wind stress, river discharge and surface currents. In contrast, during Bora events, surface current direction was less variable and showed a more constant southwesterly direction, reflecting the prevailing influence of the wind.
It is important to highlight that during Bora events with hourly wind speed higher than 18 m s−1, the sea surface velocity did not increase, as is the case with southerly winds, but remained at around 0.2 m s−1. This aspect is particularly evident at the HFRI, HFRC and HFRO points (Fig. 5a–c). At the westernmost point of the GoT, HFRL (Fig. 5d), the surface current seems more strongly influenced by the Bora wind, as it was the case on 15 October, at 16:30 UTC, when the wind speed reached 12 m s−1, with an observed sea surface speed of 0.6 m s−1. Overall, the sea surface current at this point was higher than at the other points throughout October and November, with the exception of 27 October and 17 November where the current speed was comparable to the other points.
These observations also showed that the currents are influenced by the Isonzo River during periods of increased discharge into the GoT. Actually, the percentage of the sea surface current direction that is categorised as “Other Directions” is higher than the percentage of the direction the current would have if it were only influenced by the wind.
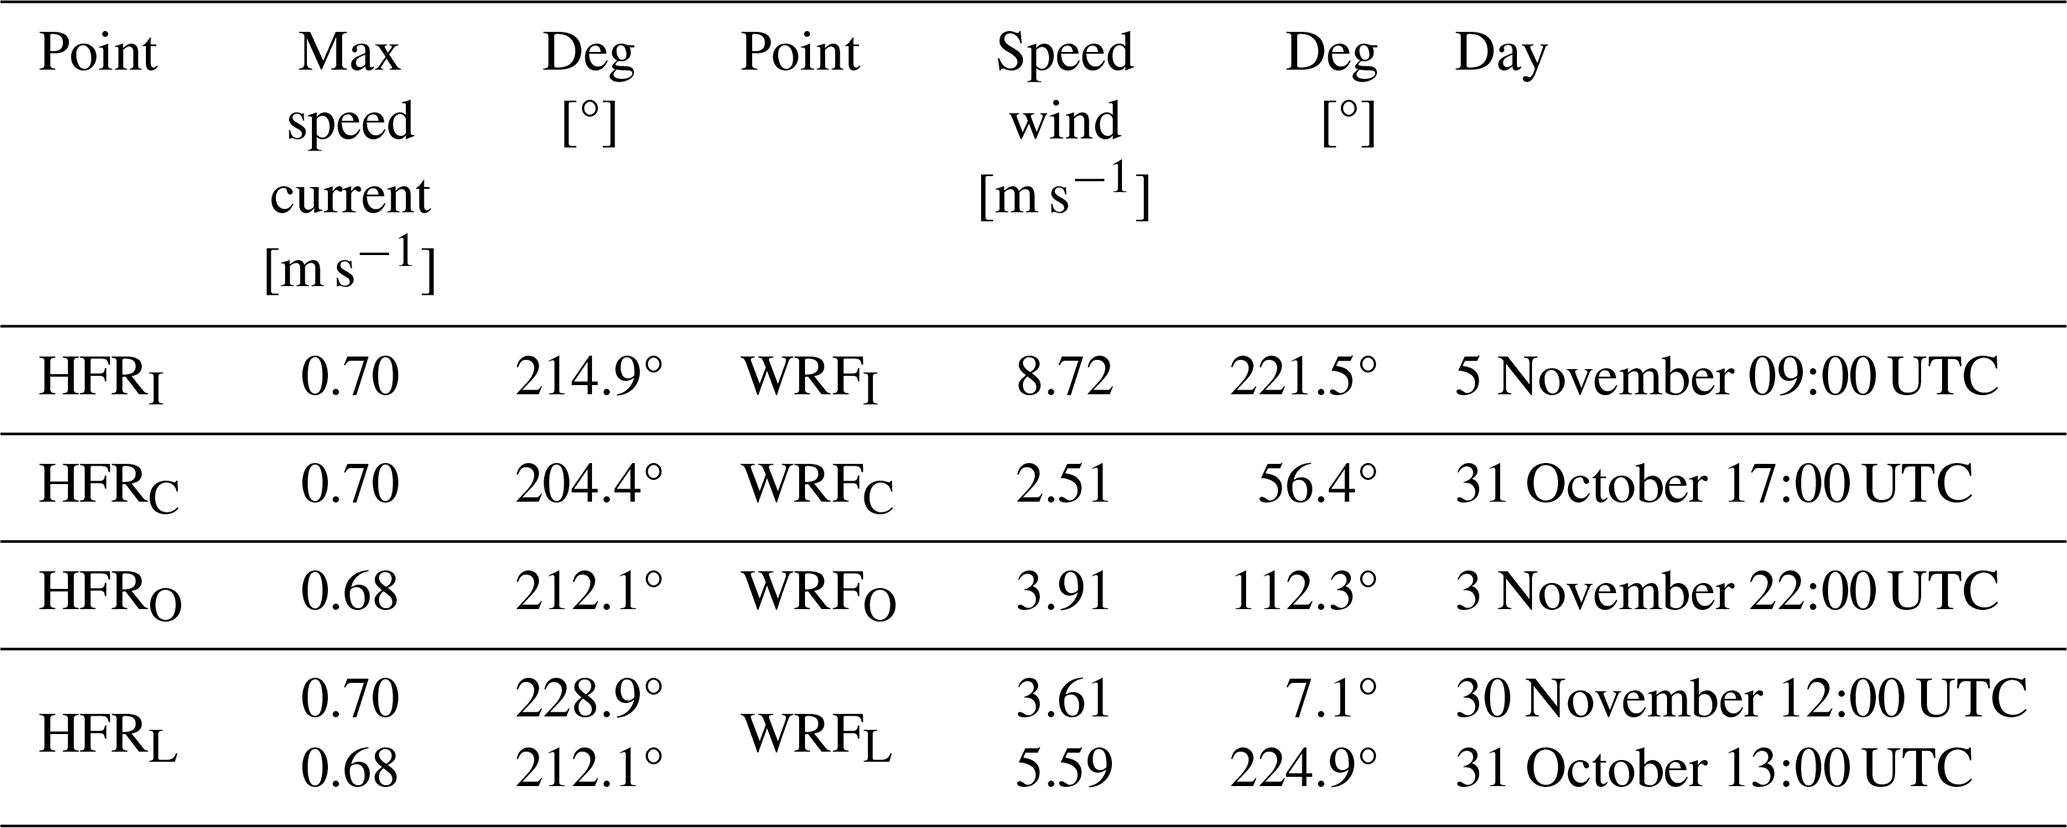
Table 2 summarises the maximum speed and direction of surface currents, together with the corresponding wind intensity and direction. With the exception of 30 November at the HFRL point, the direction of the sea surface current does not appear to be influenced by the wind, which in fact has opposite directions with respect to the current. The current direction at various points indicates local influences probably related to the significant outflow and subsequent storm on 2 and 3 November. In addition, the wind at the WRFC, WRFO and WRFL points does not appear to be strong enough to influence the current speed.
Table 2Maximum current velocity and relative winds. The direction of the current indicates the path in which the current flows, while the direction of the wind refers to the point from which it originates.
3.3 Wind stress curl and sea current vorticity
Figure 6 shows the Isonzo River discharge rate derived from hydrometric data measurements at the Pieris hydrometric station by means of a semi-empirical rating curve. The coloured bands represent the same (daily averaged) wind regimes described in the previous paragraph, extracted from the WRFI point.
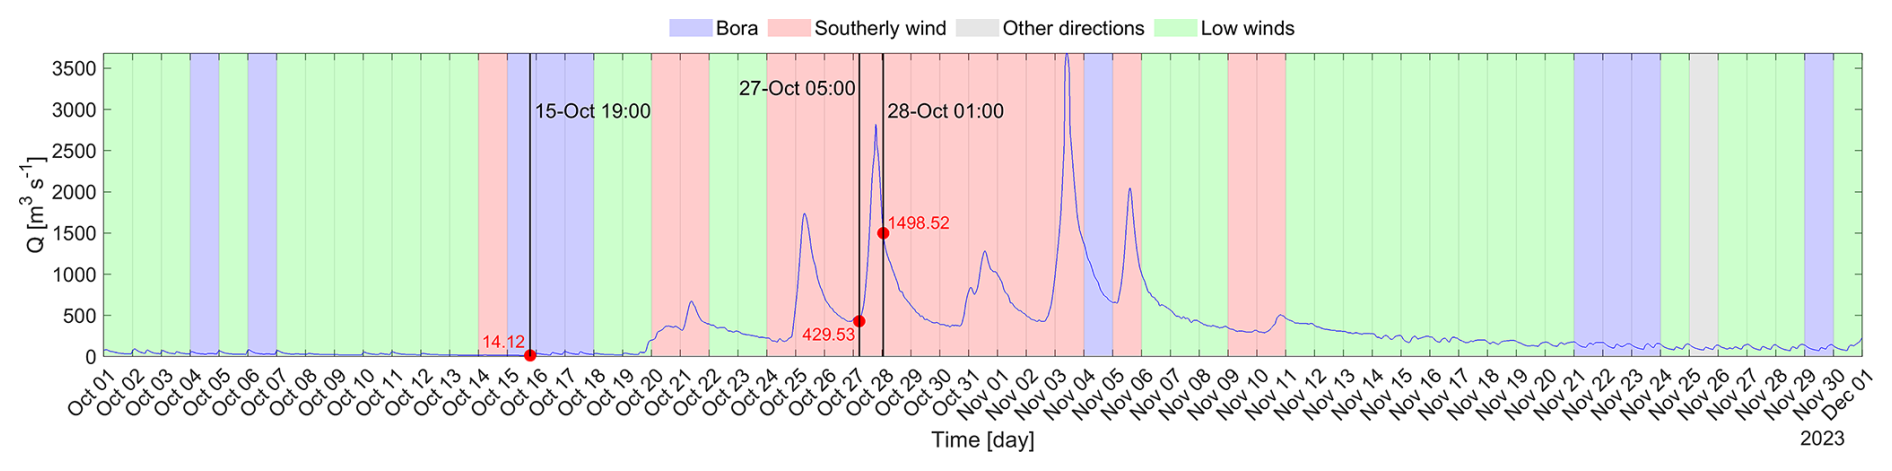
Figure 6Isonzo River discharge derived from a semi-empirical rating curve based on water level data measurements from the Pieris hydrometric station. The black vertical lines mark three events: on 15 October at 19:00 UTC with Bora and no outflow, on 27 October at 05:00 UTC with southerly wind and weak outflow and on 28 October at 01:00 UTC with southerly wind and strong outflow. The red dots indicate the values of the discharge rate corresponding to these events.
Figure 7a–c consists of two panels showing different aspects of the atmospheric and oceanographic conditions in the GoT. Red tones represent cyclonic vorticity (counterclockwise), while blue tones represent anticyclonic vorticity (clockwise). The images were made considering a moving average of 12 h.
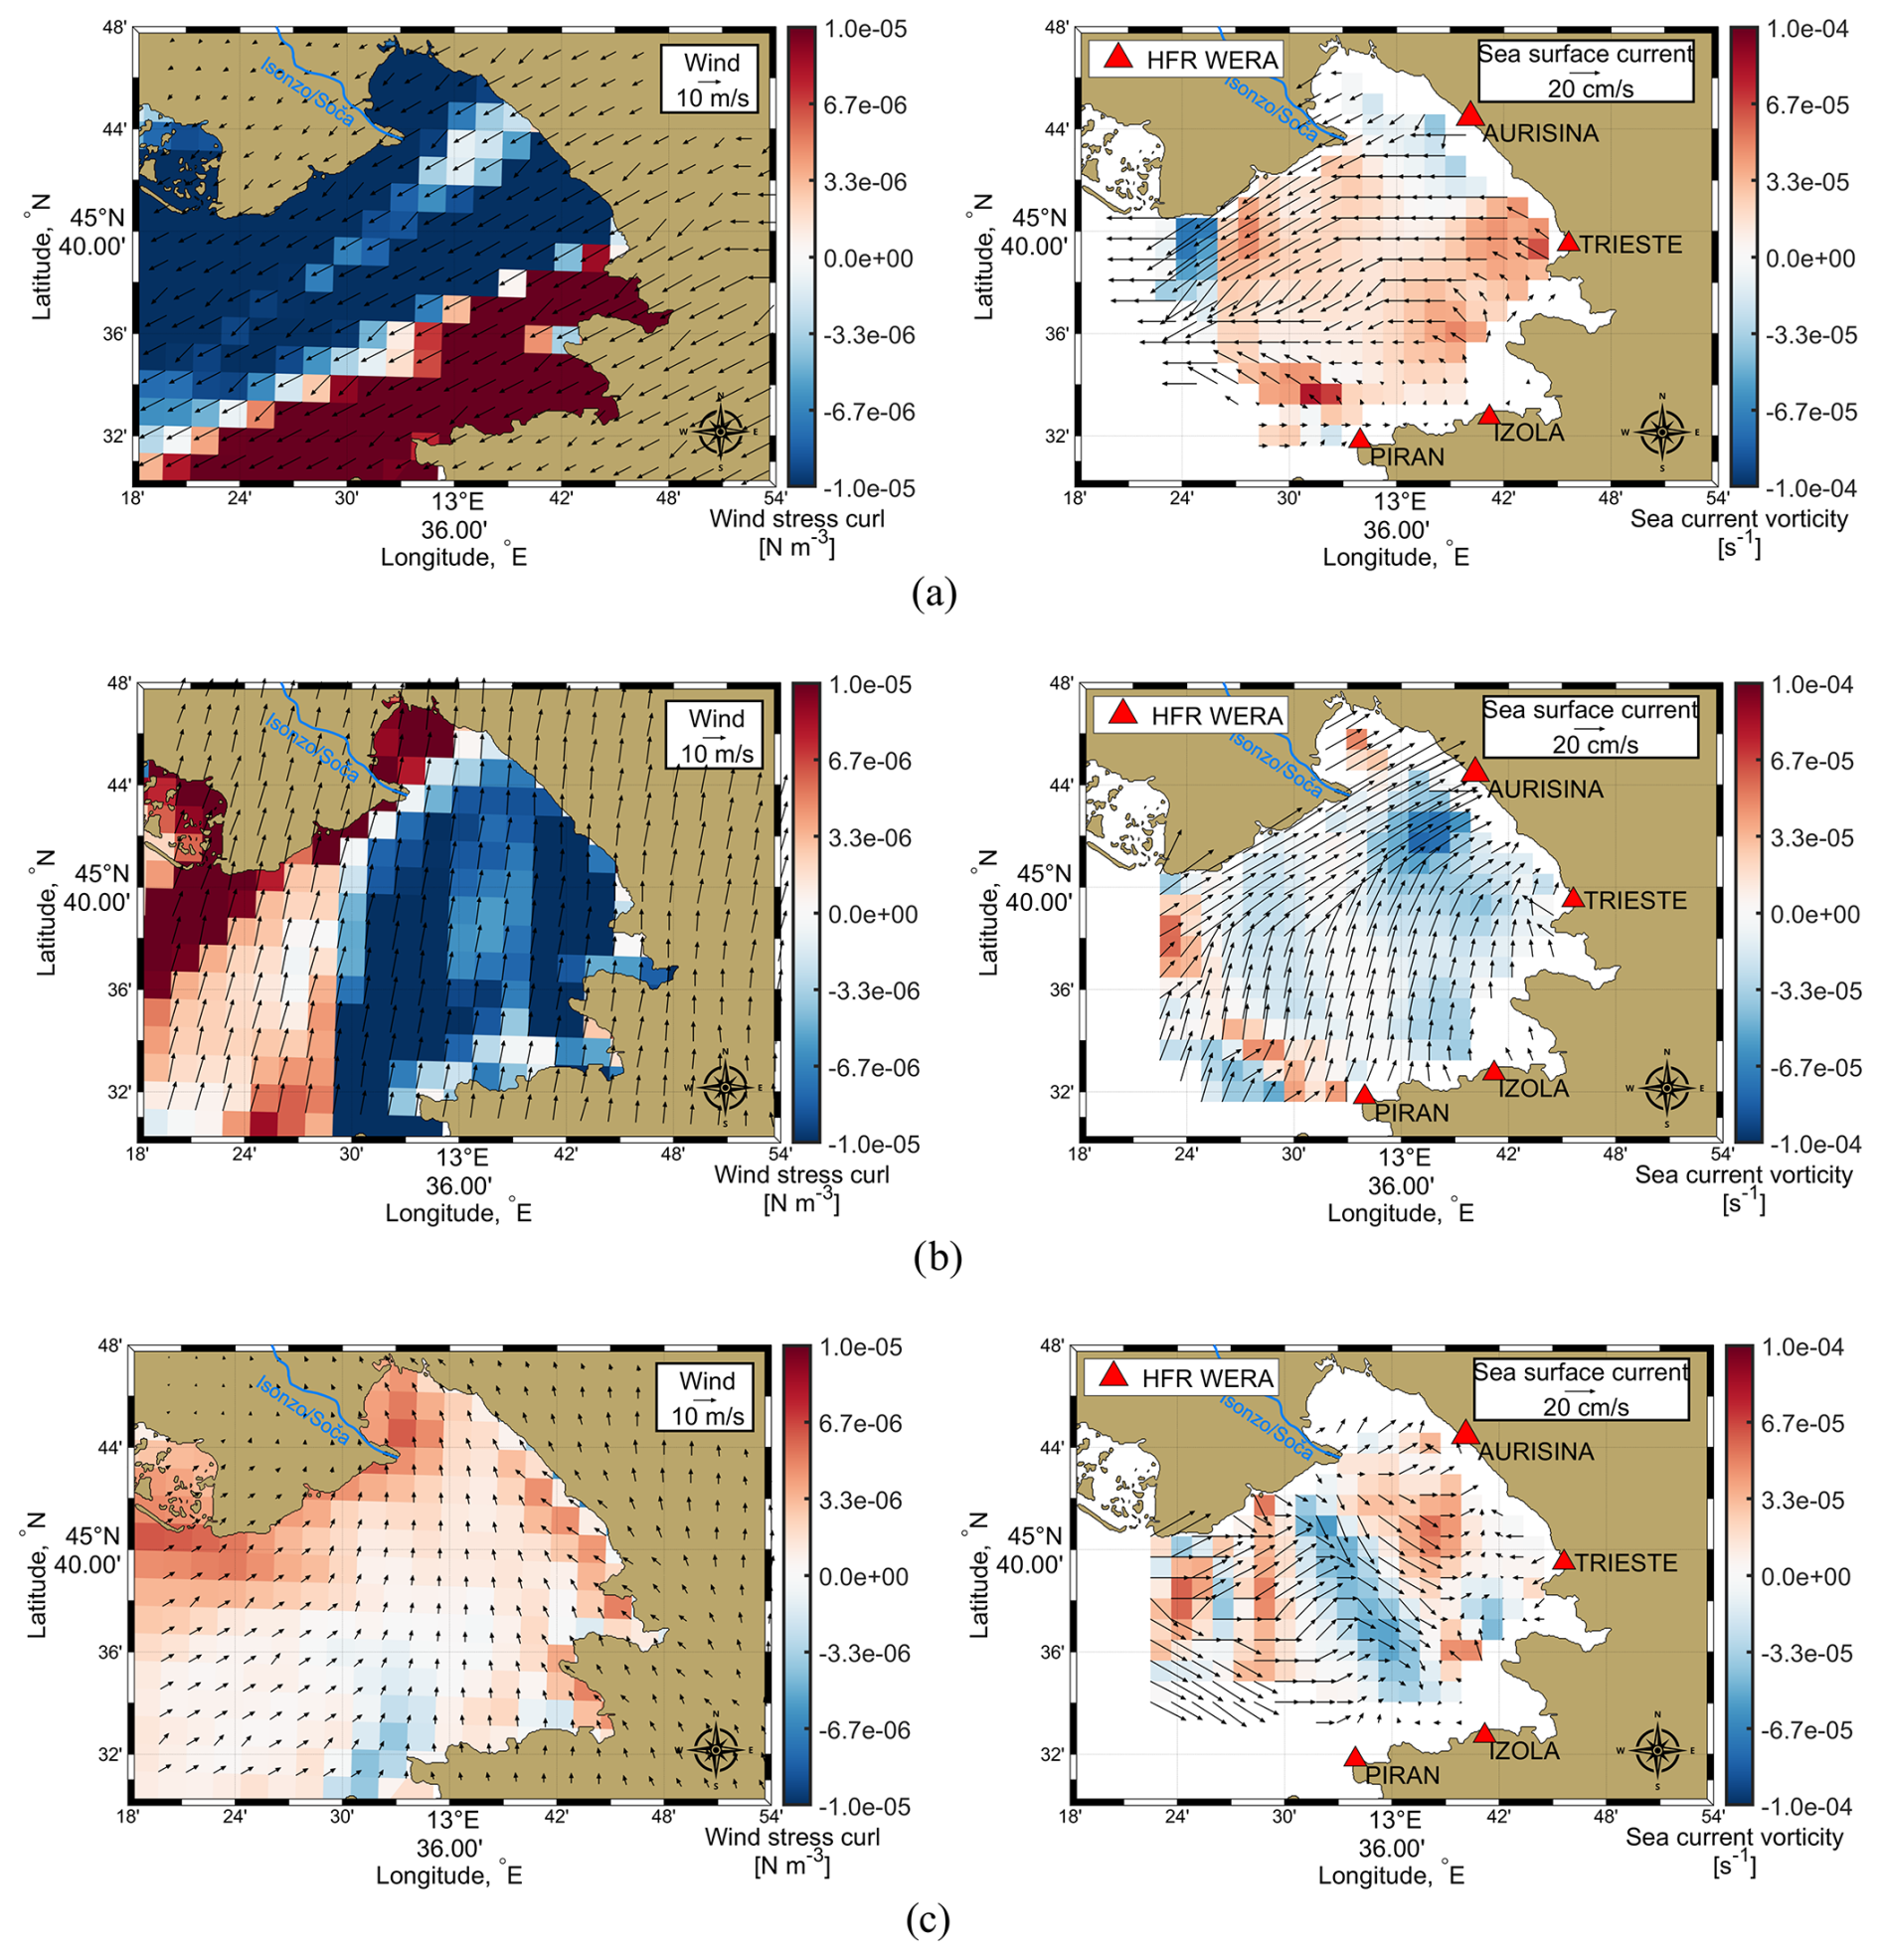
Figure 7(a) Bora wind without outflow on 15 October at 19:00 UTC. (b) Southerly winds and weak outflow conditions on 27 October at 05:00 UTC. (c) Southerly winds and strong outflow conditions on 28 October at 01:00 UTC. The map on the left shows the wind stress curl (colours) in the region, with black arrows indicating the direction and speed of the wind. The shades from blue to red indicate variations in wind stress curl, with red representing positive and blue negative values. The map on the right shows the vorticity of the ocean currents in the GoT (colours) with the overlaid black arrows indicating the direction and speed of the currents. The maps were made considering a moving average of 12 h of the data.
Generally, the Gulf of Trieste is characterised by a cyclonic circulation. However, during the study period, we observed three different conditions: a strong Bora wind episode, strong southerly wind events and a significant outflow from the Isonzo/Soča River in combination with southerly winds. Figure 6 also shows the discharge value during the three selected conditions. These days were chosen on the basis of the largest radar coverage, therefore, they can be considered as the most representative. The lower coverage in other maps (not shown) is probably due to the fact that the radar range decreases when the salinity of the sea decreases (Gurgel et al., 1999).
Figure 7a describes the strong Bora wind event on 15 October 2023 at 19:00 UTC. It shows that the usual cyclonic circulation is intensified throughout the Gulf, with a surface current flowing out of the GoT, in particular in the north western portion.
Figure 7b describes strong southerly winds on 27 October 2023, at 05:00 UTC. In this condition the circulation was mainly anticyclonic and surface currents flowed into the Gulf, leading to sea level rise along the coast. Previous studies suggested that this shift from a cyclonic to an anticyclonic circulation is likely due to the significant variability of the Isonzo river outflow (Malačič and Petelin, 2009; Cosoli et al., 2013). However, in our study, we observed that this change in circulation is primarily caused by the southerly winds, which change the circulation of the GoT from cyclonic (a stable and persistent state) to anticyclonic. This change was observed even when there was no significant river discharge as long as the southerly winds were blowing. The additional level of detail in our results is probably due to the fact that we used a higher temporal resolution compared to previous studies. This finer time scale may have allowed us to identify patterns that were not visible in analyses based on daily or monthly data.
Figure 7c from 28 October 2023 at 01:00 UTC shows a significant river outflow in combination with southerly winds, even if weaker than on 27 October. Here, the circulation is anticyclonic in the central part of the GoT and cyclonic in the northern part. This suggests that, locally, a strong river outflow can prevail over meteorological forcing and influence the circulation patterns in the GoT. Similar behaviour was also observed in Querin et al. (2021).
To further evaluate the role of Ekman dynamics, we compared the direction of the observed surface current field with the theoretical Ekman current calculated from the WRF wind data.
A directional alignment was calculated using the cosine similarity of the angle (Han et al., 2012; Xu et al., 2025) between the current and Ekman vectors. This metric indicates the degree of agreement between the two vector fields, with values close to 1 indicating strong agreement with the Ekman direction.
The results show that during the Bora wind event (Fig. S2a) the sea surface currents generally follow the expected Ekman response, especially in the southern and eastern parts of the GoT. However, in the northwestern part, lower alignment values (cos θ<1, light red) indicate that the sea surface currents are not fully aligned with the theoretical Ekman direction, but are perfectly aligned with the wind direction. During the southerly winds events (Fig. S2b), the surface currents show a strong correspondence with the Ekman dynamics. In contrast, the directional alignment decreases significantly during episodes of intense river discharge with southerly winds (Fig. S2c), with values approaching −1 in the central GoT, in agreement with Fig. 7c. This reversal indicates that the current field appears to decouple from the wind, suggesting that other forcings may dominate the surface circulation.
3.4 Significant wave height
According to the reports from the Civil Defence and various local newspapers, the coastal storm began on 2 November and intensified on 3 November, particularly affecting the eastern coast of the GoT.
Figure 8 shows the significant wave height in metres in the whole HFR grid, including the location of the Zarja ondametric buoy (45°36′10′′ N, 13°32′11′′ E). It represents the situation with the highest significant wave height during the observation period, recorded by the HFR on 3 November 2023 at 14:30 UTC.
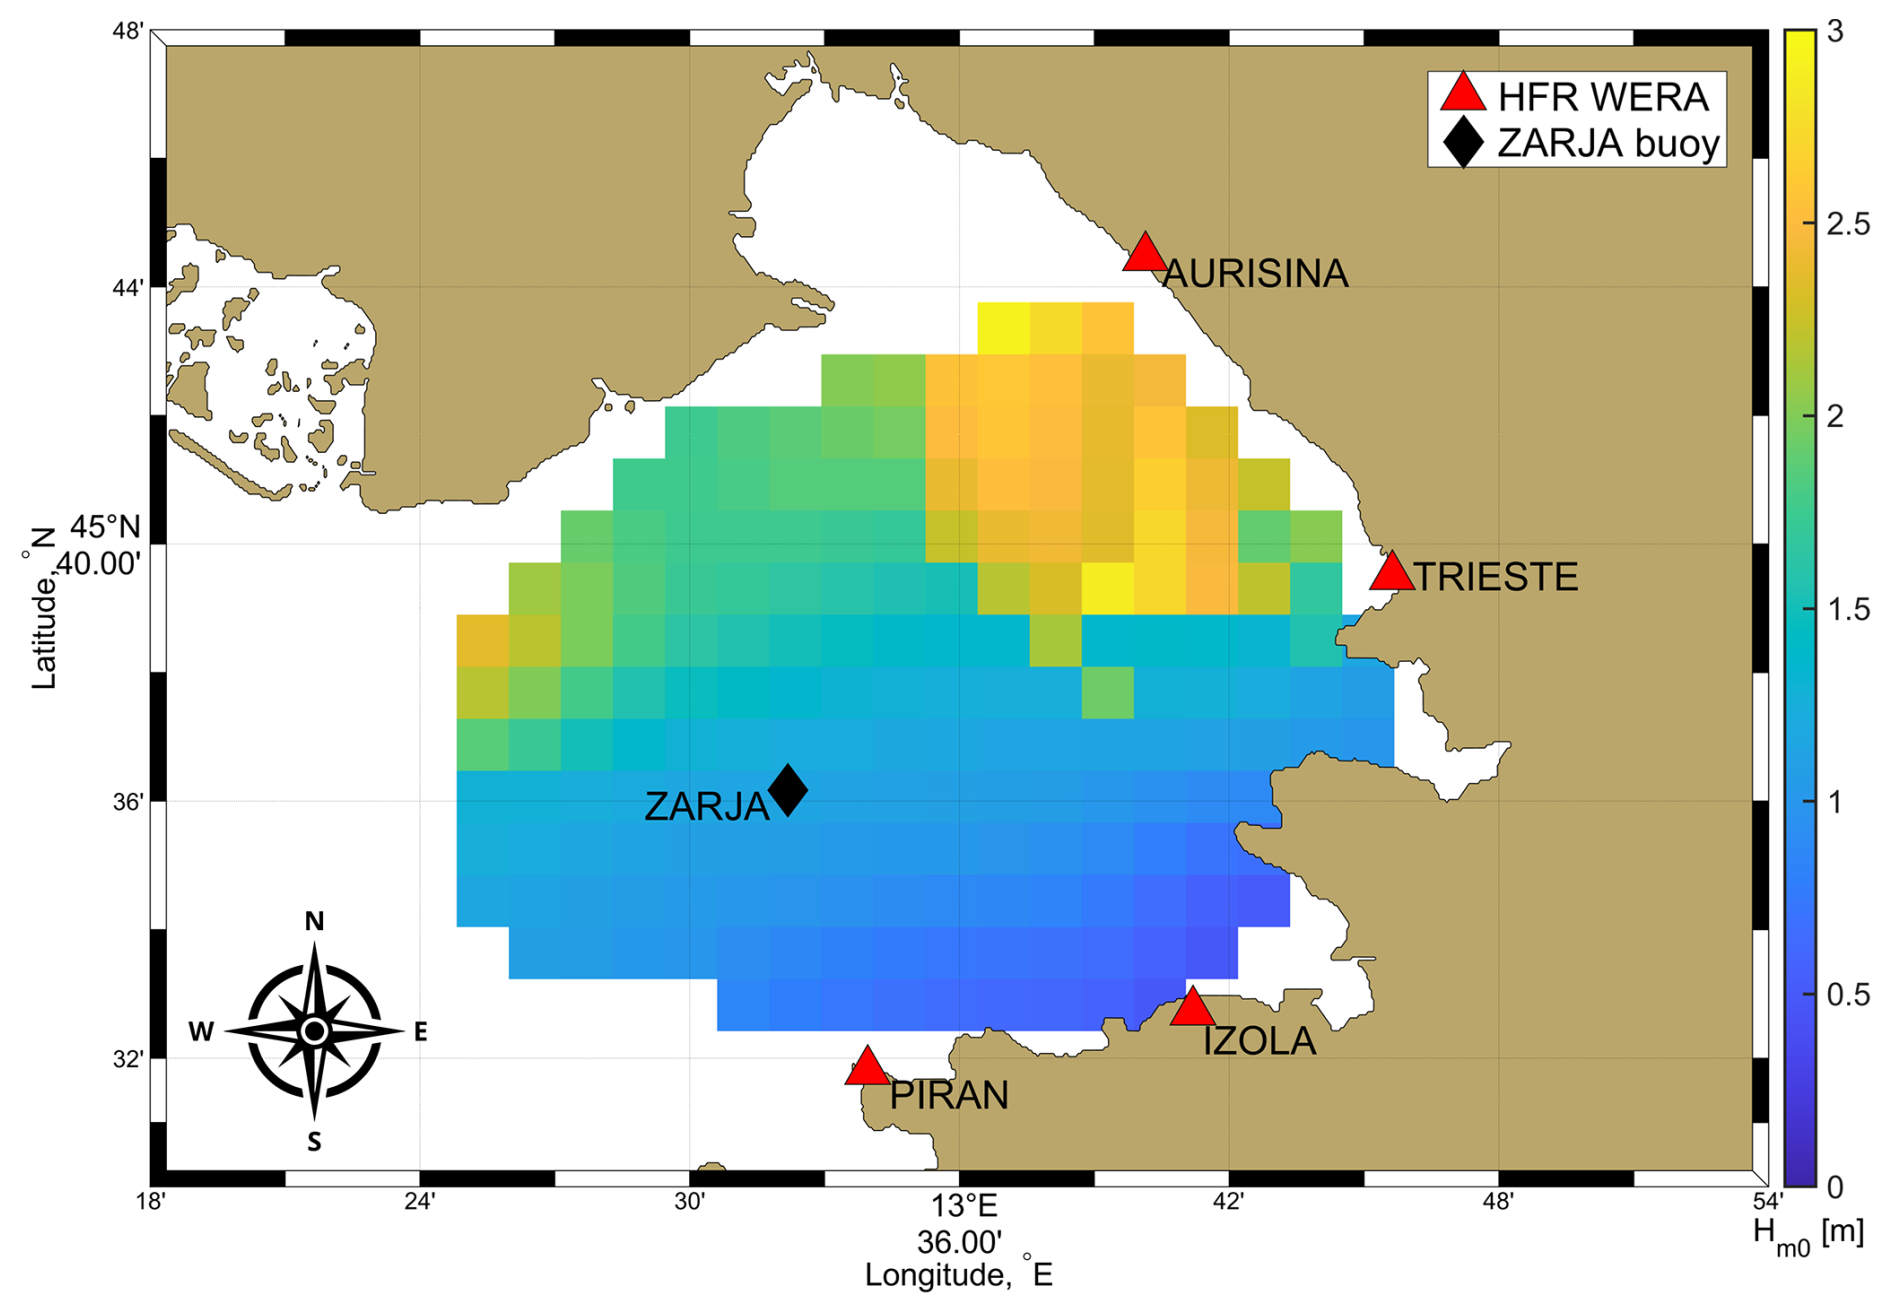
Figure 8Significant wave height () on 3 November at 14:30 UTC from HFR data and location of the Zarja buoy.
In the southern part of the GoT waves are characterised by a significant height of less than 1.5 m (colours from light blue to green). Meanwhile, in the central-north part of the GoT, heavier conditions are recorded, with values that exceed 2 m, showing the severe effect of the storm in this area. HFR wave direction coverage for this period is scarce, due to the fact that direction is a very sensitive parameter to all the antenna's conditions and behaviour, but, where present, it roughly indicates a towards-direction between 0 and 50° (not shown), thus mainly towards the coast. The same behaviour is conserved at least from the early morning of that day (not shown).
This data clearly shows the intensity of the waves during the coastal storm and confirms the warnings of worsening conditions on 3 November. The combination of high waves and their prevalent direction towards the coast has contributed to this coastal storm being particularly harmful for the GoT coast.
Data recorded by buoy Zarja (Fig. 9) shows the evolution of the significant wave height values during this period. In fact, the severe wind storms induced important changes in the wave regime. The data recorded by the Zarja buoy show clearly low energetic sea states during weak wind periods, like during the first weeks of October or during the third week of November (Fig. S4). Severe wave storms occurred during the strongest wind events (Fig. S4).
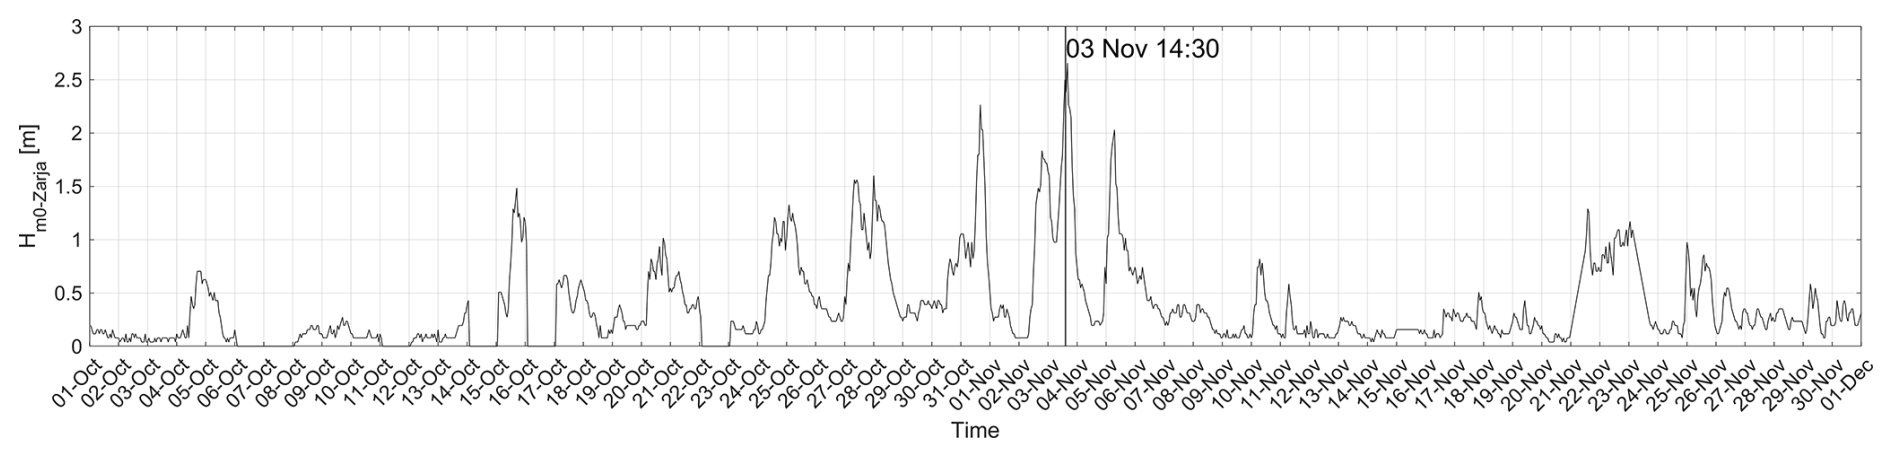
As the buoy data is recorded hourly, while the HFR data is available every 30 min, no direct comparison is possible at 14:30 UTC. At 14:00 UTC the HFR system recorded a m, while the buoy measured m. At 15:00 UTC was 1.03 m, while the was 2.40 m. The significant wave height measured by the HFR system, , at the nearest point of the Zarja buoy, seems to be underestimated compared to the measurements of the buoy, . This discrepancy indicates the need for further investigation and could serve as a starting point for future studies on the accuracy and reliability of radar-derived wave height measurements.
3.5 HFR data – model comparison
We compared HF radar observations and the synthetic surface currents obtained from the simulation set up described in Sect. 2.5, focusing on the two month period between October and November 2023. The surface currents from the numerical simulation were defined as the horizontal velocities of the first computational layer, 0.5 m thick. Since the model outputs consisted of hourly means, the 30 min HF radar measurements were averaged to match them. Furthermore, to smooth the time series and allow for better comparisons, a 3 h average was computed on the two datasets.
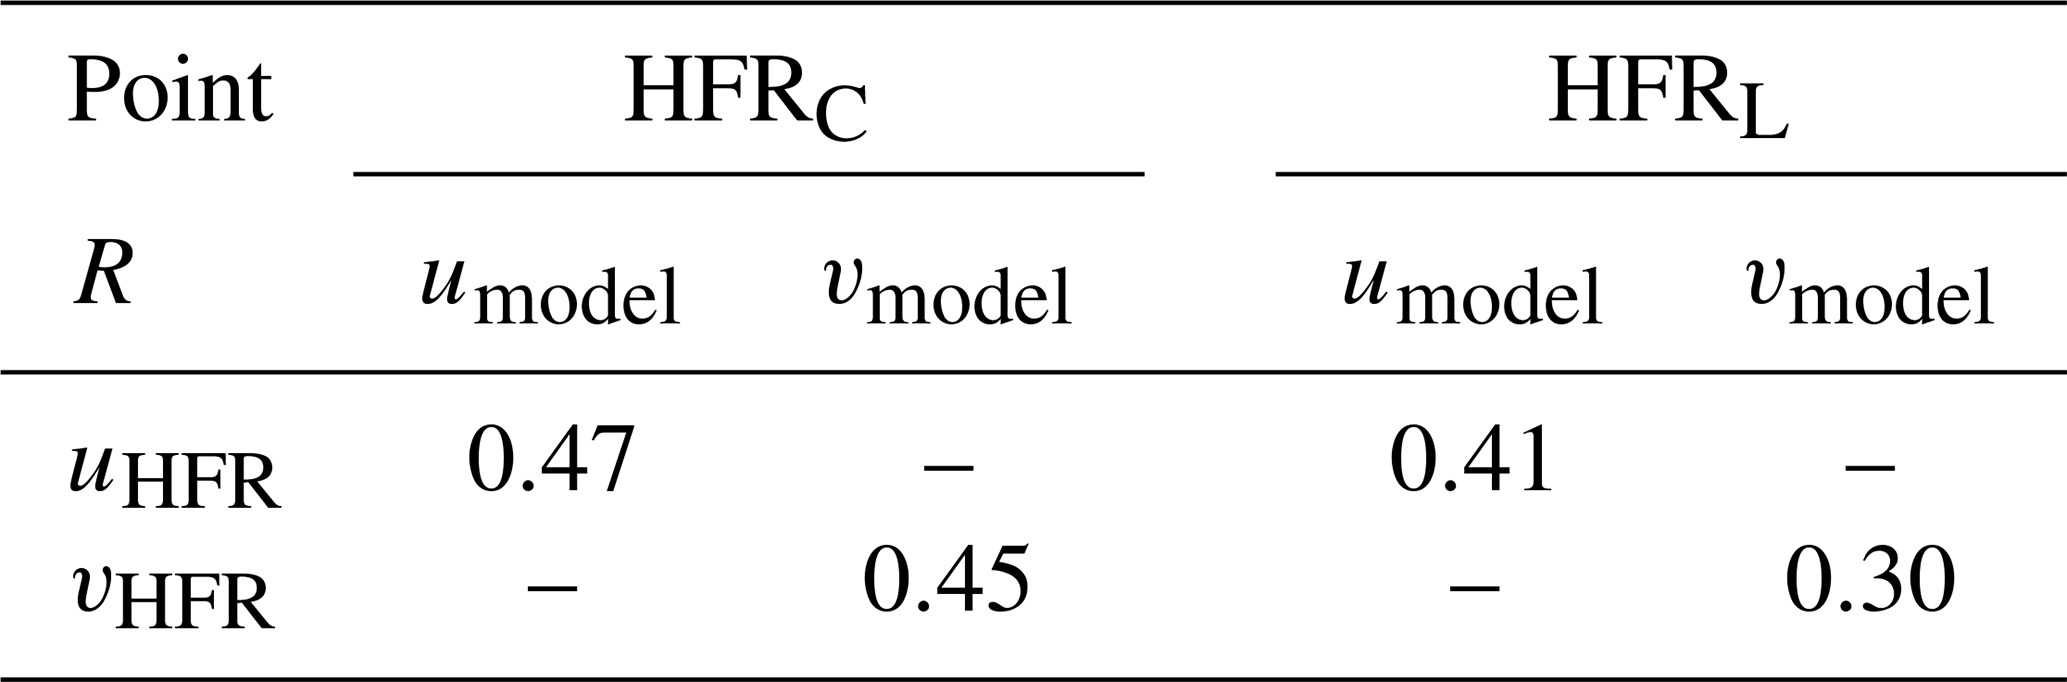
Table 3 shows the correlation coefficients between the zonal and meridional components of the HF radar and model currents, for the “C” point, where the correlation is higher, and the “L” point, where it is lower, respectively. The difference is most probably due to the greater skill of the model in describing the dynamics in the more offshore point, while the coastal characteristics of the “L” point affect the skill of the simulation.
Table 3Correlation coefficients (R) between the u and v components (m s−1) of the HFR radar and the model at two representative points: HFRC and HFRL.
Further details for these two points are shown in Fig. 10a and b. The topmost panel presents stick diagrams of the two datasets, highlighting the differences in sea surface current direction; the middle and bottom panels show the time series for difference between the model and HFR zonal and meridional velocity components, respectively, superimposed with the significant wave height obtained from the Zarja buoy. While there is not a clear, one-to-one correlation between high waves and larger surface current discrepancies, the period of worst match between simulations and observations corresponds to the strongest wave activity, between the end of October and the beginning of November, when heights in excess of 2 m were reached. Since the model does not include wave dynamics, it is likely that at least part of the discrepancies could be attributed to the missing coupling of wave-mean motion that affects particularly the surface velocity field.
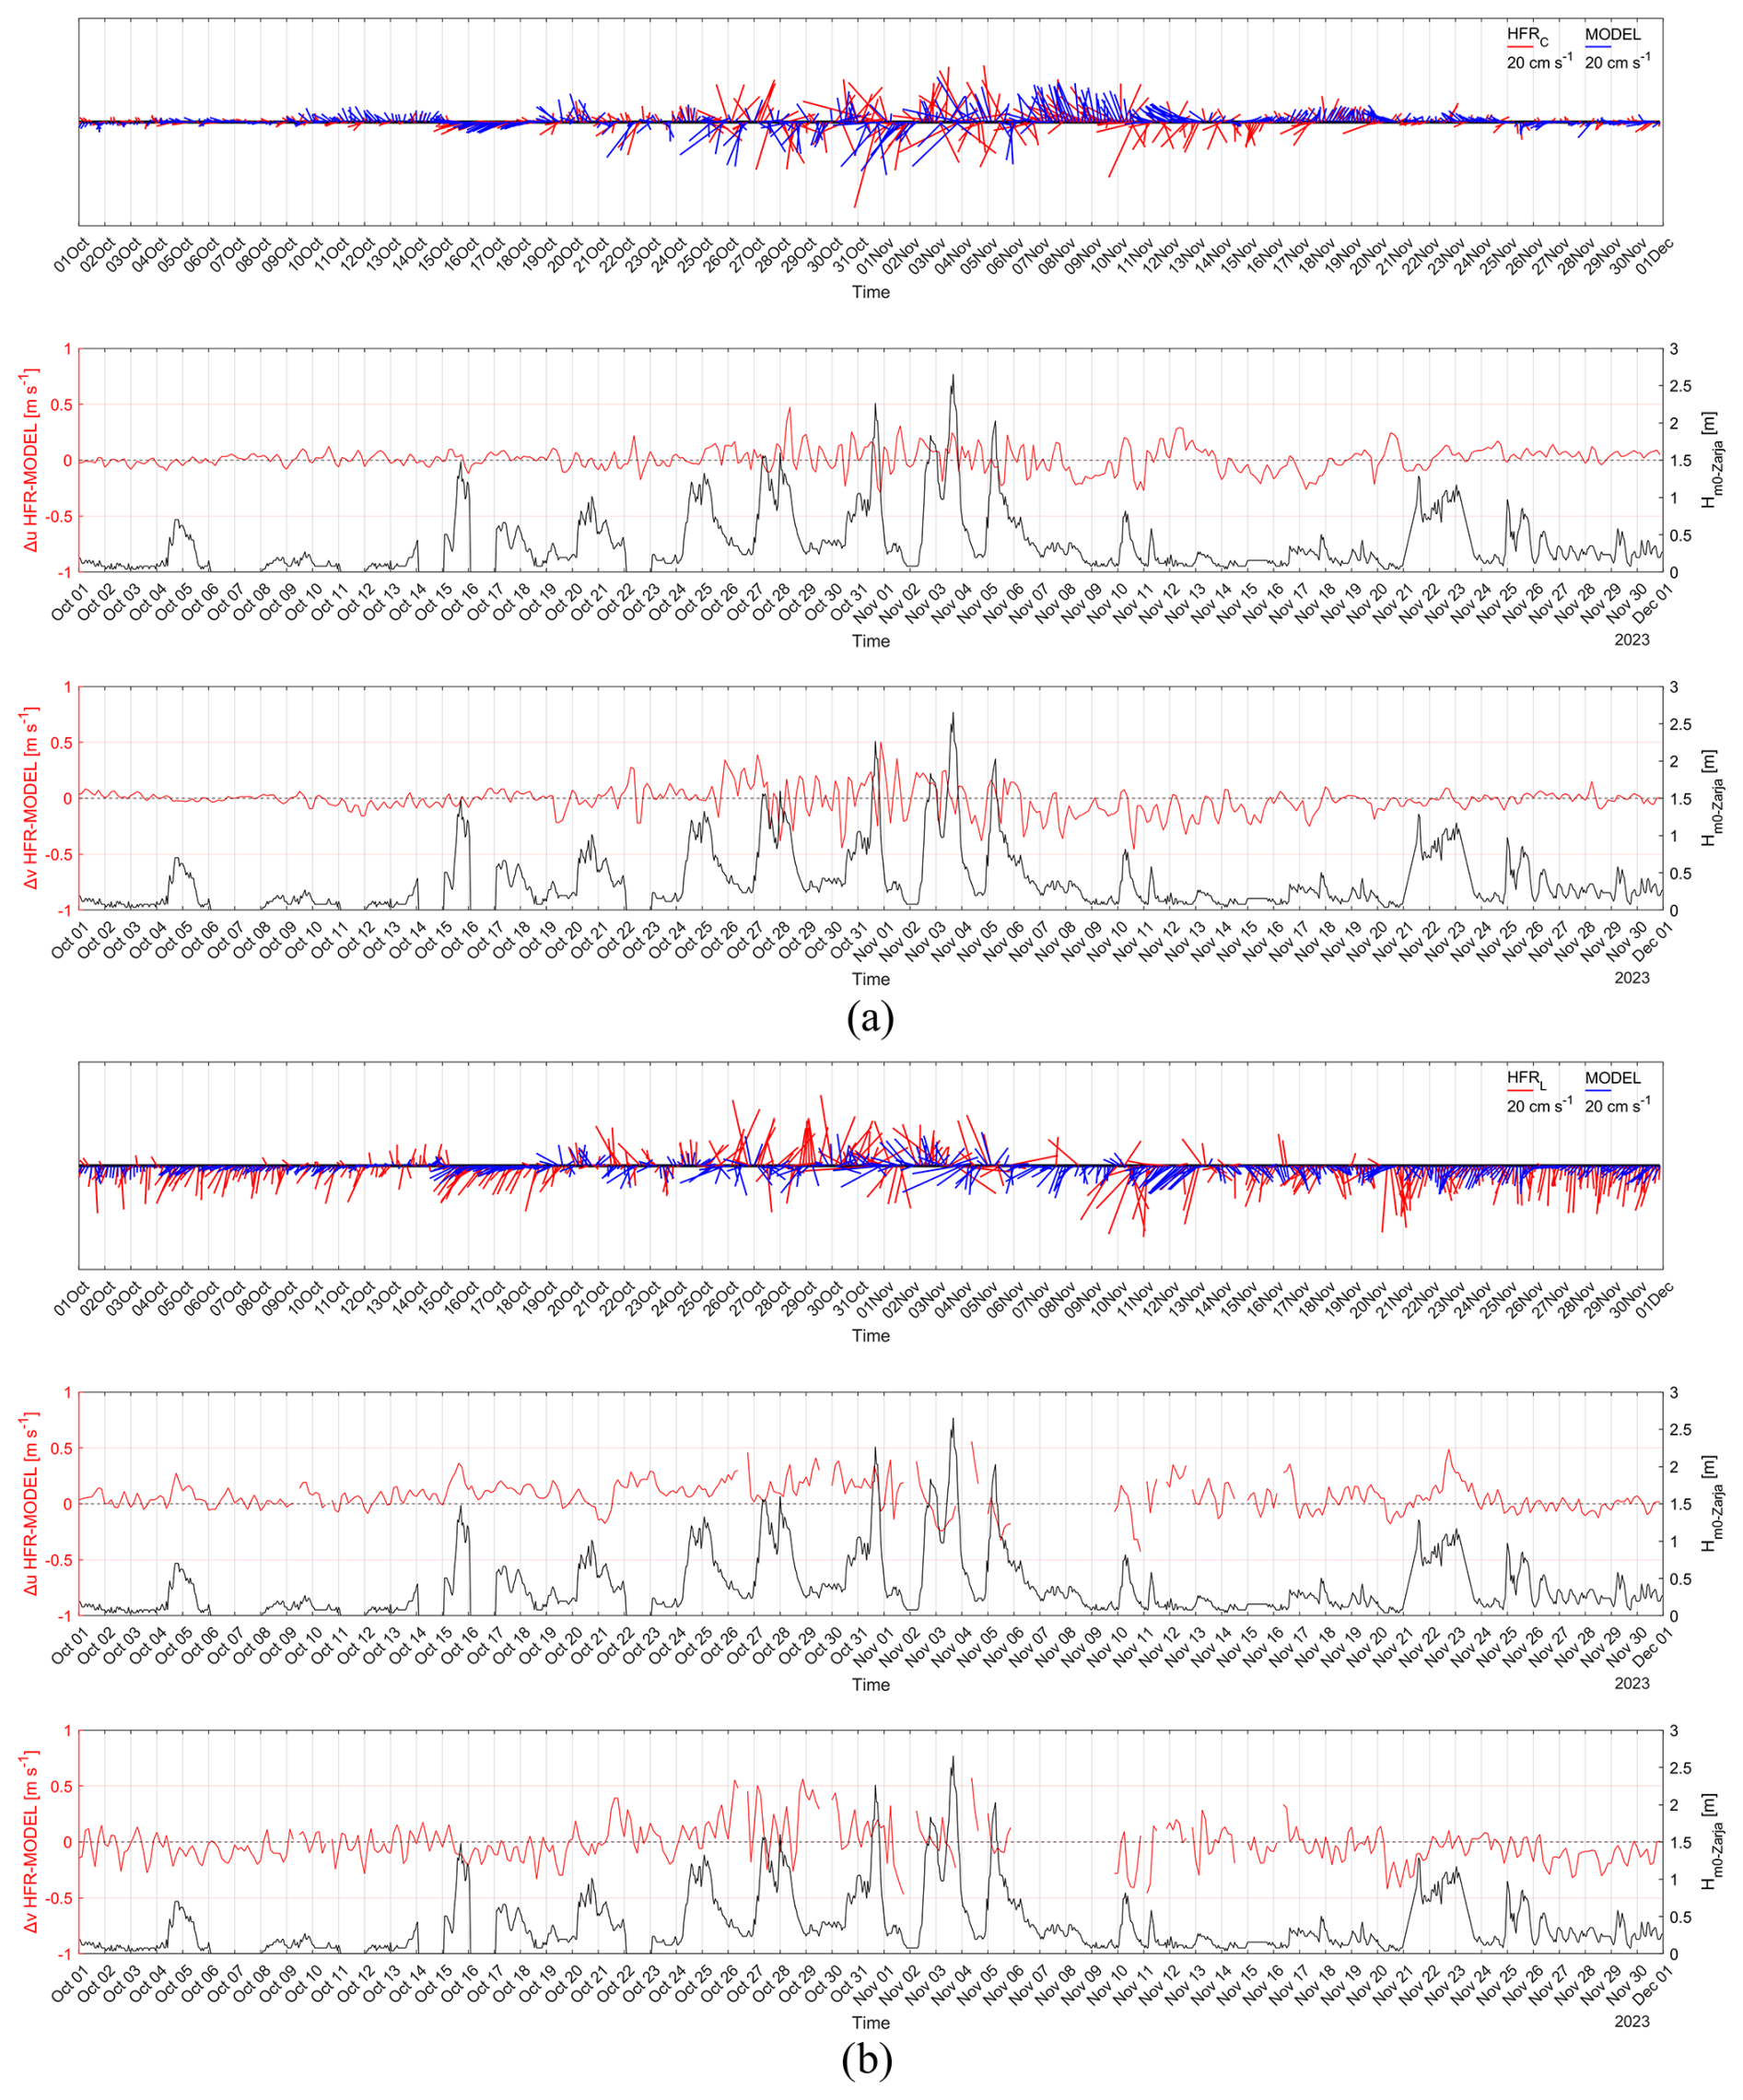
Figure 10Comparison of HFR and MODEL data for HFRC (a) and HFRL (b) points. Top panel: stick plot. Middle panel: time series of u component difference between HFR and MODEL data (in red) and significant wave height data, , from the Zarja buoy (in black). Bottom panel: same as middle panel, for the v component.
Figure 11a–c seems to confirm this hypothesis: the panels show surface current maps, made considering a moving average of 12 h, comparing the simulated and measured circulation in three different regimes. Figure 11a represents a Bora event, during which model and HF radar show good agreement, with a westward current in the middle of the Gulf that becomes more southward and intense along the northern coast. Since Bora winds do not have a large fetch (Fig. S3) in the Gulf, strong wave activity cannot develop. On the contrary, in Fig. 11b and c the wind regime is southerly, blowing over a much larger fetch, from the Adriatic Sea, thus driving stronger wave dynamics. In the simulation, where the effect of waves is not taken into account, the Isonzo plume is visible, while, in HFR maps, it is overridden by the strong northeastern current that follows the wind direction, especially in Fig. 11b, where the Isonzo flow rate is relatively low.
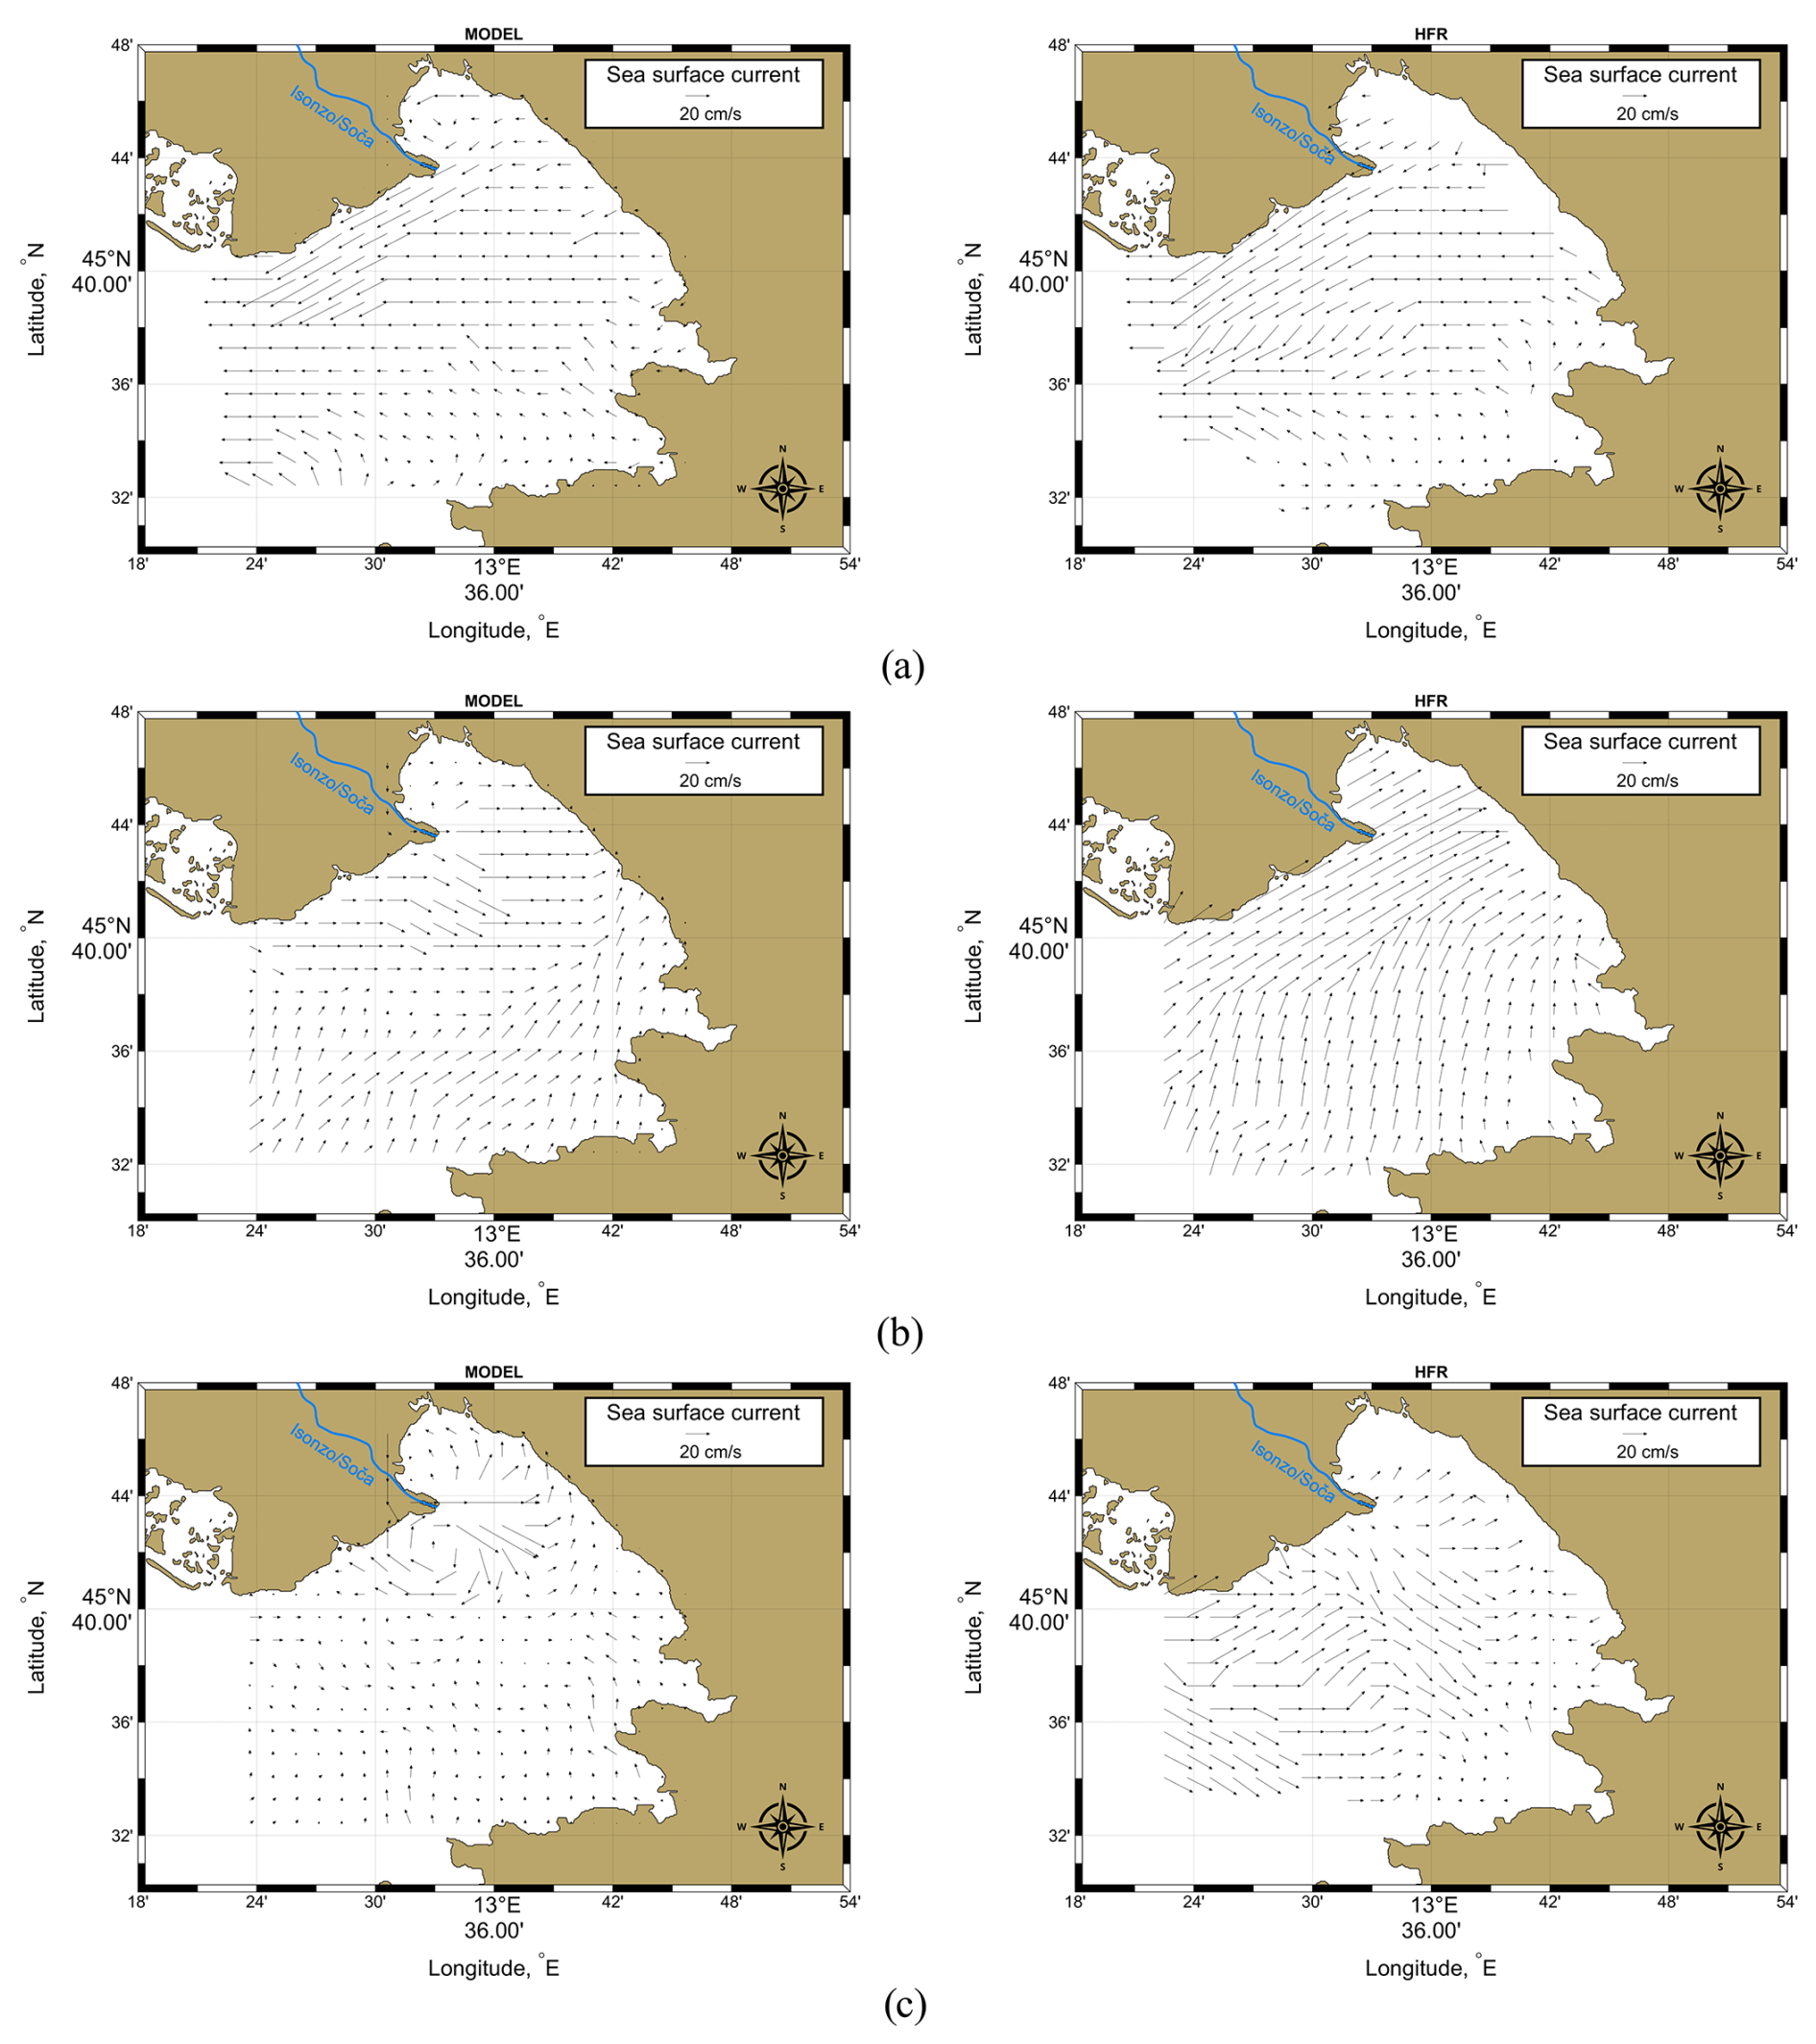
Figure 11Comparison of MODEL and HFR data for the three different cases discussed in Sect. 3.3. (a) Bora wind without river outflow. (b) Southerly winds and weak outflow conditions. (c) Southerly winds and strong outflow conditions. The maps on the left and on the right show the MODEL and HFR data, respectively, with black arrows indicating the direction and speed of the currents.
In the period between October and November 2023, the Isonzo/Soča River catchment area, in the north eastern part of Italy, experienced particularly heavy rainfalls (precipitation depth data from ARPA FVG: https://www.osmer.fvg.it/archivio.php?ln=&p=dati, last access: 30 January 2024). Remarkable runoff peaks were recorded, exceeding all previous records for the year and leading to significant discharges into the GoT. At the same time, sea level rise and coastal inundation were observed. The event at the beginning of November is of particular significance as it was also accompanied by strong coastal storm and waves. Various types of damage occurred throughout the region: flooding, tree uprootings, landslides, disrupted road networks and power outages. In particular, the coastal storm that hit the north-east coast of the GoT in the last few days of the event caused severe damage to the coast north of Trieste (Fig. S5a–d). The pine forest was devastated and the promenade collapsed in several spots. Part of the retaining walls were washed away by the sea and the refreshment areas and shops overlooking the sea were badly damaged. According to newspaper reports, it was a disaster unlike anything seen in recent years.
An important result of our study is the assessment of the influence of the southerly winds on the current speed, which is greater than that of the Bora winds. While both wind patterns are intense, the southerly winds significantly accelerate the surface currents throughout the GoT, while the Bora winds, although strong, do not amplify the currents as much as the southerly ones. This contrast illustrates how important the wind direction is for the strength and direction of surface currents in the area.
This study has also revealed the different effects of the Bora and southerly winds on surface current dynamics in the GoT and clarified the role of river discharge in modulating these dynamics. Our observations show that while the GoT generally exhibits a cyclonic circulation, this pattern can change under specific atmospheric and hydrological conditions. During periods of strong Bora winds, the cyclonic circulation intensifies, promoting an outward flow of surface currents from the GoT, as observed on 15 October 2023. However, when southerly winds prevail, as on 27 October 2023, the circulation switches to an anticyclonic pattern, with surface currents moving into the GoT and leading to coastal sea level rise.
Interestingly, our results suggest that this shift from cyclonic to anticyclonic is primarily driven by the southerly winds and not solely by the river outflow. This result gives a different view than previous studies found in the literature (Malačič and Petelin, 2009; Cosoli et al., 2013). This result can be attributed to the higher spatial resolution and precision of the surface current data from our combined radar stations, which provide a more comprehensive view of current dynamics across the GoT. Finally, our analysis of the combined effects of a significant Isonzo River outflow and southerly winds, as observed on 28 October 2023, demonstrates the ability of riverine discharge to locally influence circulation patterns in the GoT. During this event, river runoff generated an anticyclonic circulation in the central GoT and a cyclonic pattern in the north, suggesting that intense river runoff can alter the local circulation despite the prevailing meteorological forcing.
A hydrodynamical simulation was also set up to try to investigate with increased detail these extreme events owing to the high resolution (∼125 m) employed. While the model is able to capture the overall dynamics of the GoT, it exhibits lower skill during the strong southerly wind phase, recorded between the end of October and the beginning of November, that lead to the coastal damage. A likely explanation for this disagreement has been found in the lack of coupling with wave motion in the simulation, which lacks a wave model. These effects, if neglected, can lead to considerable discrepancies with respect to the measured velocity field, during intense wind events. This shortcoming did not allow for the simulation to fully replicate the extent of the event, highlighting the importance of coupled models to properly describe coastal dynamics; in this sense, work is underway to develop a wave dynamics model in the northern Adriatic Sea in the framework of iNEST (Interconnected Nord-Est Innovation Ecosystem) PNRR (National Recovery and Resilience Plan) project (https://www.consorzioinest.it/#inest, last access: 11 March 2025).
Overall, this study provides valuable insights into the relative influence of wind and river discharge on surface currents in the GoT and contributes to a more comprehensive understanding of coastal dynamics that can inform coastal management and improve predictive modelling tools for these vulnerable regions.
HFR sea surface currents data of the Gulf of Trieste are publicly available at the European HFR node website: https://www.hfrnode.eu/networks/hfr-nadr-2/ (https://doi.org/10.57762/8RRE-0Z07, OGS et al., 2023). The WRF forecasted wind field is obtainable upon request from ARPA FVG (https://www.arpa.fvg.it, CRMA, 2023). Sentinel-2A satellite images are available on The Copernicus Data Space Ecosystem Browser (https://dataspace.copernicus.eu/browser/, last access: 15 December 2023). The hydrometric data, referring to the Pieris hydrometric station, have been made available by Regione Autonoma Friuli Venezia Giulia – Direzioni centrali dell'amministrazione regionale – Direzione centrale difesa dell'ambiente, energia e sviluppo sostenibile – Servizio gestione risorse idriche (https://www.osmer.fvg.it/home.php, last access: 30 January 2024). The precipitation depth data are available on ARPA FVG website: https://www.osmer.fvg.it/archivio.php?ln=&p=dati (last access: 30 January 2024). The weather, hydrogeological and hydraulic criticality warning issued from the regional Civil Defense are available on https://www.protezionecivile.fvg.it/it/la-protezione-civile/eventi/allerta-regionale-29-e-302023 (last access: 8 May 2024). Model sea surface currents data, subset at the October–November period, are available at https://doi.org/10.5281/zenodo.14772824 (Giordano and Querin, 2025). HFR significant wave height can be provided by the corresponding authors upon request. The base map in Fig. 1, in WMS (Web Mapping Service) format, is an ESRI Shaded Relief from https://server.arcgisonline.com/ArcGIS/rest/services/World_Shaded_Relief/MapServer/tile/{z}/{y}/{x} (last access: 20 March 2025). The bathymetry in Fig. 1 was retrieved from the GEBCO website: https://download.gebco.net/ (last access: 26 September 2023). Territorial boundaries, shown in Fig. 1, was retrieved from the INSPIRE Geoportal website: https://inspire-geoportal.ec.europa.eu/srv/ita/catalog.search#/metadata/m_d:000031:20240304:163814 (last access: 21 February 2024). The hydrographic network of the Isonzo/Soča River in WFS (Web Feature Service) format, shown in Figs. 4a–c, 7a–c and 11a–c, was retrieved from the INSPIRE Geoportal website: https://inspire-geoportal.ec.europa.eu/srv/api/records/r_friuve:m3201-cc-i9755 (last access: 21 February 2024).
The supplement related to this article is available online at https://doi.org/10.5194/os-21-2197-2025-supplement.
DL, SF, FG, EI, MM, SQ and LU were responsible for analysing and writing the original draft. MM, SQ and LU contributed to the revision of the text and helped to determine the final structure of the article. LU and DL acquired funding.
The contact author has declared that none of the authors has any competing interests.
Publisher's note: Copernicus Publications remains neutral with regard to jurisdictional claims made in the text, published maps, institutional affiliations, or any other geographical representation in this paper. While Copernicus Publications makes every effort to include appropriate place names, the final responsibility lies with the authors. Also, please note that this paper has not received English language copy-editing. Views expressed in the text are those of the authors and do not necessarily reflect the views of the publisher.
This article is part of the special issue “Special issue on ocean extremes (55th International Liège Colloquium)”. It is not associated with a conference.
The authors would like to thank the Regional Center for Environmental Modeling (CRMA), a division of the Environmental Agency of Friuli Venezia Giulia (ARPA FVG), for providing the meteorological data of the WRF model. We would also like to thank Regione Autonoma Friuli Venezia Giulia – Direzioni centrali dell'amministrazione regionale – Direzione centrale difesa dell'ambiente, energia e sviluppo sostenibile – Servizio gestione risorse idriche for providing the hydrometric data from the “Pieris” hydrometric station.
Furthermore, we acknowledge the Slovenian Environment Agency (ARSO), the National Institute of Biology (NIB) and ARPA FVG for managing the radar stations in Piran, Izola and Trieste, respectively.
We are also grateful to all those who gave us valuable advice during this work. We thank PhD student Carlotta Dentico for taking and providing the pictures shown in Fig. 3.
In additional, the author acknowledges the creators of ChatGPT and InstaText, used to improve the English writing in some parts of this manuscript.
This research has been carried out in the framework of the project iNEST – Interconnected Nord-Est Innovation Ecosystem, funded by the European Union – NextGenerationEU, PNRR – Mission 4 Component 2 Investment 1.5 – Call for tender no. 3277 of 30 December 2021 of Italian Ministry of University and Research funded by the European Union – NextGenerationEU (Project code ECS00000043, Concession Decree no. 1058 of 23 June 2022 adopted by the Italian Ministry of University and Research, CUP F43C22000190006). It has also been supported by the project iNEST-NEREIDES – Young Researcher grant issued by OGS, funded under the National Recovery and Resilience Plan (NRRP) in the framework of the iNEST project.
This paper was edited by Denise Fernandez and reviewed by two anonymous referees.
Barrick, D. E.: Extraction of wave parameters from measured HF radar sea-echo Doppler spectra, Radio Sci., 12, 415–424, https://doi.org/10.1029/RS012i003p00415, 1977.
Bianchi, T. S., DiMarco, S. F., Cowan, J. H., Hetland, R. D., Chapman, P., Day, J. W., and Allison, M. A.: The science of hypoxia in the Northern Gulf of Mexico: A review, Sci. Total Environ., 408, 1471–1484, https://doi.org/10.1016/j.scitotenv.2009.11.047, 2010.
Castelle, B., Marieu, V., Bujan, S., Splinter, K. D., Robinet, A., Sénéchal, N., and Ferreira, S.: Impact of the winter 2013–2014 series of severe Western Europe storms on a double-barred sandy coast: Beach and dune erosion and megacusp embayments, Geomorphology, 238, 135–148, https://doi.org/10.1016/j.geomorph.2015.03.006, 2015.
Chavanne, C., Janeković, I., Flament, P., Poulain, P. -M., Kuzmić, M., and Gurgel, K. -W.: Tidal currents in the northwestern Adriatic: High-frequency radio observations and numerical model predictions, J. Geophys. Res., 112, 2006JC003523, https://doi.org/10.1029/2006JC003523, 2007.
Clementi, E., Drudi, M., Aydogdu, A., Moulin, A., Grandi, A., Mariani, A., Goglio, A. C., Pistoia, J., Miraglio, P., Lecci, R., Palermo, F., Coppini, G., Masina, S., and Pinardi, N.: Mediterranean Sea Physical Analysis and Forecast (CMEMS MED-Physics, EAS8 system): MEDSEA_ANALYSISFORECAST_PHY_006_013 (1), https://doi.org/10.25423/CMCC/MEDSEA_ANALYSISFORECAST_PHY_006_013_EAS8, 2023.
Cosoli, S., Gačić, M., and Mazzoldi, A.: Surface current variability and wind influence in the northeastern Adriatic Sea as observed from high-frequency (HF) radar measurements, Cont. Shelf Res., 33, 1–13, https://doi.org/10.1016/j.csr.2011.11.008, 2012.
Cosoli, S., Ličer, M., Vodopivec, M., and Malačič, V.: Surface circulation in the Gulf of Trieste (northern Adriatic Sea) from radar, model, and ADCP comparisons: Hf Radar and Model Study of Trieste Gulf, J. Geophys. Res.-Oceans, 118, 6183–6200, https://doi.org/10.1002/2013JC009261, 2013. CRMA – Centro Regionale di Modellistica Ambientale: Progetto NAUSICA – Downscaling di analisi meteorologiche ad alta risoluzione sul dominio Alpe Adria, https://www.arpa.fvg.it (last access: 25 January 2024), 2023.
Cushman-Roisin, B. and Naimie, C. E.: A 3D finite-element model of the Adriatic tides, J. Mar. Syst., 37, 279–297, https://doi.org/10.1016/S0924-7963(02)00204-X, 2002.
Dorman, C. E., Carniel, S., Cavaleri, L., Sclavo, M., Chiggiato, J., Doyle, J., Haack, T., Pullen, J., Grbec, B., Vilibić, I., Janeković, I., Lee, C., Malačič, V., Orlić, M., Paschini, E., Russo, A., and Signell, R. P.: February 2003 marine atmospheric conditions and the bora over the northern Adriatic, J. Geophys. Res., 111, 2005JC003134, https://doi.org/10.1029/2005JC003134, 2006.
Dzwonkowski, B., Park, K., and Collini, R.: The coupled estuarine-shelf response of a river-dominated system during the transition from low to high discharge, J. Geophys. Res.-Oceans, 120, 6145–6163, https://doi.org/10.1002/2015JC010714, 2015.
Edson, J. B., Jampana, V., Weller, R. A., Bigorre, S. P., Plueddemann, A. J., Fairall, C. W., Miller, S. D., Mahrt, L., Vickers, D., and Hersbach, H.: On the Exchange of Momentum over the Open Ocean, J. Phys. Oceanogr., 43, 1589–1610, https://doi.org/10.1175/JPO-D-12-0173.1, 2013.
Ezer, T. and Updyke, T.: High-frequency radar surface current data reveals local and remote drivers of three bays: Chesapeake Bay, Delaware Bay, and New York Bay, Research Square, https://doi.org/10.21203/rs.3.rs-4783316/v1, 2024.
Flora, S., Ursella, L., and Wirth, A.: Superstatistical analysis of sea surface currents in the Gulf of Trieste, measured by high-frequency radar, and its relation to wind regimes using the maximum-entropy principle, Nonlin. Processes Geophys., 30, 515–525, https://doi.org/10.5194/npg-30-515-2023, 2023.
Giordano, F., and Querin, S.: Sea surface currents from MITgcm 2023 GoT run, October–November period (1.0), Zenodo [data set], https://doi.org/10.5281/zenodo.14772824, 2025.
Goglio, A. C.: Progetto NAUSICA – Downscaling di analisi meteorologiche ad alta risoluzione sul dominio Alpe Adria, ARPA FVG, https://fenice.arpa.fvg.it/geonetwork/srv/ita/catalog.search#/metadata/f1291927-7772-4677-8db0-2d83a621acdd (last access: 29 September 2025), 2018.
Gomez, R., Helzel, T., Wyatt, L., Lopez, G., Conley, D., Thomas, N., Smet, S., and Sicot, G.: Estimation of wave parameters from HF radar using different methodologies and compared with wave buoy measurements at the Wave Hub, in: OCEANS 2015 – Genova, Genova, Italy, 1–9, https://doi.org/10.1109/OCEANS-Genova.2015.7271477, 2015.
Gurgel, K.-W., Essen, H.-H., and Schlick, T.: Tracking of fresh-water plumes in Dutch coastal waters by means of HF radar, in: IEEE 1999 International Geoscience and Remote Sensing Symposium, IGARSS'99, Cat. No. 99CH36293, Hamburg, Germany, 2548–2550, https://doi.org/10.1109/IGARSS.1999.771572, 1999.
Han, J., Kamber, M., and Pei, J.: Getting to Know Your Data, in: Data Mining, Elsevier, 39–82, https://doi.org/10.1016/b978-0-12-381479-1.00002-2, 2012.
Kirezci, E., Young, I. R., Ranasinghe, R., Muis, S., Nicholls, R. J., Lincke, D., and Hinkel, J.: Projections of global-scale extreme sea levels and resulting episodic coastal flooding over the 21st Century, Sci. Rep., 10, 11629, https://doi.org/10.1038/s41598-020-67736-6, 2020.
Kovačević, V., Gačić, M., Mancero Mosquera, I., Mazzoldi, A., and Marinetti, S.: HF radar observations in the northern Adriatic: surface current field in front of the Venetian Lagoon, J. Mar. Syst., 51, 95–122, https://doi.org/10.1016/j.jmarsys.2004.05.026, 2004.
Malačič, V. and Petelin, B.: Climatic circulation in the Gulf of Trieste (northern Adriatic), J. Geophys. Res., 114, 2008JC004904, https://doi.org/10.1029/2008JC004904, 2009.
Malačič, V., Viezzoli, D., and Cushman-Roisin, B.: Tidal dynamics in the northern Adriatic Sea, J. Geophys. Res., 105, 26265–26280, https://doi.org/10.1029/2000JC900123, 2000.
Marshall, J., Adcroft, A., Hill, C., Perelman, L., and Heisey, C.: A finite-volume, incompressible Navier Stokes model for studies of the ocean on parallel computers, J. Geophys. Res., 102, 5753–5766, https://doi.org/10.1029/96JC02775, 1997.
Mauri, E., Poulain, P., and Notarstefano, G.: Spatial and temporal variability of the sea surface temperature in the Gulf of Trieste between January 2000 and December 2006, J. Geophys. Res., 113, 2007JC004537, https://doi.org/10.1029/2007JC004537, 2008.
Molleri, G. S. F., Novo, E. M. L. de M., and Kampel, M.: Space-time variability of the Amazon River plume based on satellite ocean color, Cont. Shelf Res., 30, 342–352, https://doi.org/10.1016/j.csr.2009.11.015, 2010.
OGS, NIB, ARSO, and ARPA FVG: HFR-NAdr (High Frequency Radar NAdr network), European HFRadar Node [data set], https://doi.org/10.57762/8RRE-0Z07, 2023.
Pawlowicz, R., Beardsley, B., and Lentz, S.: Classical tidal harmonic analysis including error estimates in MATLAB using T_TIDE, Comput. Geosci., 28, 929–937, https://doi.org/10.1016/S0098-3004(02)00013-4, 2002.
Penna, N., Capellacci, S., and Ricci, F.: The influence of the Po River discharge on phytoplankton bloom dynamics along the coastline of Pesaro (Italy) in the Adriatic Sea, Mar. Pollut. Bull., 48, 321–326, https://doi.org/10.1016/j.marpolbul.2003.08.007, 2004.
Poulain, P.-M. and Raicich, F.: Forcings, in: Physical Oceanography of the Adriatic Sea, edited by: Cushman-Roisin, B., Gačić, M., Poulain, P.-M., and Artegiani, A., Springer Netherlands, Dordrecht, 45–65, https://doi.org/10.1007/978-94-015-9819-4_2, 2001.
Querin, S., Crise, A., Deponte, D., and Solidoro, C.: Numerical study of the role of wind forcing and freshwater buoyancy input on the circulation in a shallow embayment (Gulf of Trieste, Northern Adriatic Sea), J. Geophys. Res., 111, 2006JC003611, https://doi.org/10.1029/2006JC003611, 2006.
Querin, S., Cosoli, S., Gerin, R., Laurent, C., Malačič, V., Pristov, N., and Poulain, P.-M.: Multi-Platform, High-Resolution Study of a Complex Coastal System: The TOSCA Experiment in the Gulf of Trieste, JMSE, 9, 469, https://doi.org/10.3390/jmse9050469, 2021.
Raicich, F., Malačič, V., Celio, M., Giaiotti, D., Cantoni, C., Colucci, R. R., Čermelj, B., and Pucillo, A.: Extreme air-sea interactions in the Gulf of Trieste (North Adriatic) during the strong Bora event in winter 2012: air–sea interactions in winter 2012, J. Geophys. Res.-Oceans, 118, 5238–5250, https://doi.org/10.1002/jgrc.20398, 2013.
Syvitski, J. P. M., Vörösmarty, C. J., Kettner, A. J., and Green, P.: Impact of Humans on the Flux of Terrestrial Sediment to the Global Coastal Ocean, Science, 308, 376–380, https://doi.org/10.1126/science.1109454, 2005.
Tian, Z., Tian, Y., Wen, B., Wang, S., Zhao, J., Huang, W., and Gill, E. W.: Wave-Height Mapping From Second-Order Harmonic Peaks of Wide-Beam HF Radar Backscatter Spectra, IEEE Trans. Geosci. Remote, 58, 925–937, https://doi.org/10.1109/TGRS.2019.2941823, 2020.
Xu, X., Ai, B., Zhao, J., and Liu, Y.: Estimation of Eulerian Sea Surface Currents and Lagrangian Trajectory Using Ocean Color Elements From GOCI Images in Turbid Coastal Water, J. Geoophys. Res.-Oceans, 130, https://doi.org/10.1029/2024jc022666, 2025.