Impact of Hurricane Irma on coral reef sediment redistribution at Looe Key Reef, Florida, USA
Zachery Fehr
Selena Johnson
David Zawada
Understanding event-driven sediment transport in coral reef environments is essential to assessing impacts on reef species, habitats, restoration, and mitigation, yet a global knowledge gap remains due to limited quantitative studies. Hurricane Irma made landfall in the Lower Florida Keys with sustained 209 km h−1 winds and waves greater than 8 m on 10 September 2017, directly impacting the Florida Reef Tract (FRT) and providing an opportunity to perform a unique comprehensive, quantitative assessment of its impact on coral reef structure and sediment redistribution. We used lidar and multibeam derived digital elevation models (DEMs) collected before and after the passing of Hurricane Irma over a 15.98 km2 area along the lower FRT including Looe Key Reef to quantify changes in seafloor elevation, volume, and structure due to storm impacts. Elevation change was calculated at over 4 million point locations across 10 habitat types within this study area for two time periods using data collected (1) approximately 1 year before the passing of Irma and 3 to 6 months following the storm's impact as well as (2) 3 to 6 months after and up to 16.5 months after the storm. Elevation change data were then used to generate triangulated irregular network (TIN) models in ArcMap to calculate changes in seafloor volume during each time period. Our results indicate that Hurricane Irma was primarily a depositional event that increased mean seafloor elevation and volume at this study site by 0.34 m and up to 5.4 Mm3, respectively. Sediment was transported primarily west-southwest (WSW) and downslope, modifying geomorphic seafloor features including the migration of sand waves and rubble fields, formation of scour marks in shallow seagrass habitats, and burial of seagrass and coral-dominated habitats. Approximately 16.5 months after Hurricane Irma (during a 13-month period between 2017 and 2019), net erosion was observed across all habitats with mean elevation change of −0.15 m and net volume change up to −2.46 Mm3. Rates of elevation change during this post-storm period were 1 to 2 orders of magnitude greater than decadal and multi-decadal rates of change in the same location, and changes showed erosion of approximately 50 % of sediment deposited during the storm event as seafloor sediment distribution began to re-equilibrate to non-storm sea-state conditions. Our results suggest that higher-resolution elevation change data collected over seasonal and annual time periods could enhance characterization and understanding of short-term and long-term rates and processes of seafloor change.
- Article
(13443 KB) - Full-text XML
- BibTeX
- EndNote


Coral reefs provide a variety of services to coastal communities including protection from coastal hazards such as storms, waves, and erosion (Ferrario et al., 2014; Storlazzi et al., 2021); socioeconomic benefits such as fisheries, recreation, and tourism (Moberg and Folk, 1999; Hall et al., 2020); and supporting numerous habitats and diverse marine species (Knowlton, 2001). Socioeconomic benefits of Florida reefs have an estimated value of over USD 8 billion a year, supporting 39 000 South Florida jobs and 70 400 total jobs, with at least USD 2.9 billion contributing directly to the local economy (Krediet et al., 2010; Gorstein et al., 2016; Towle et al., 2020). Benthic communities of the Florida Reef Tract (FRT) have been degrading for the past several decades. Coral coverage has declined across the Caribbean and Florida reefs by more than 50 % since the 1970s due to coral disease and bleaching (Porter et al., 2001; Patterson et al., 2002; Williams and Miller, 2012; Joyner et al., 2015; Walker, 2018), pollution and overfishing (Littler et al., 1986; Lapointe and Clark, 1992; and Hughes, 1994), and mass mortality of macroalgal grazers (e.g., Lessios et al., 1984). Progression of climate change has increased thermal stress, coral bleaching and disease, ocean acidification, and corallivory (predation of corals) (Wilkinson, 1996; Mumby et al., 2006; Brandt and McManus, 2009; Soto et al., 2011; Kuffner et al., 2015; Randall and van Woesik, 2015; Muehllehner et al., 2016; Hughes et al., 2017; Rice et al., 2019). These multiple stressors and increased storm occurrences have caused a shift from stony-coral-dominated reefs to macroalgae- and octocoral-dominated reefs (Bohsnack, 2002; Hughes, 1994; Knowlton, 1992; Miller et al., 2002; Norström et al., 2009; Bruno et al., 2009; Ruzicka et al., 2013; Jackson et al., 2014). Coral coverage has been reported at less than 7 % along the Florida Keys Reef Tract and less than 3 % along the northern FRT in recent years (Jackson et al., 2014; Walton et al, 2018; Knowlton, 2020), and many of Florida's reefs are in a net erosional state (Yates et al., 2017; Morris et al., 2022). Additionally, seagrass has been decreasing in coverage since early Thalassia testudinum die-offs in 1987 following decreased water quality and phytoplankton blooms during the previous decade and more contemporary die-offs in 2015 following storm events and water quality variations (Hall et al., 2016; Krause et al., 2023). Analysis of 25 years of benthic monitoring data (from 1995 to 2020) from South Florida including the Florida Keys National Marine Sanctuary (FKNMS) by Krause et al. (2023) showed primarily long-term stability of seagrass meadows over this period with species composition transitions from dense T. testudinum meadows toward mixed communities including macroalgae in locations with higher nutrient inputs. However, their results also showed instantaneous seagrass loss due to storm-related physical disturbance at over 10 % of monitoring sites including near the FRT likely due to wave-induced erosion during major storm events, and none of these sites showed full revegetation with seagrass over the 25-year monitoring period.
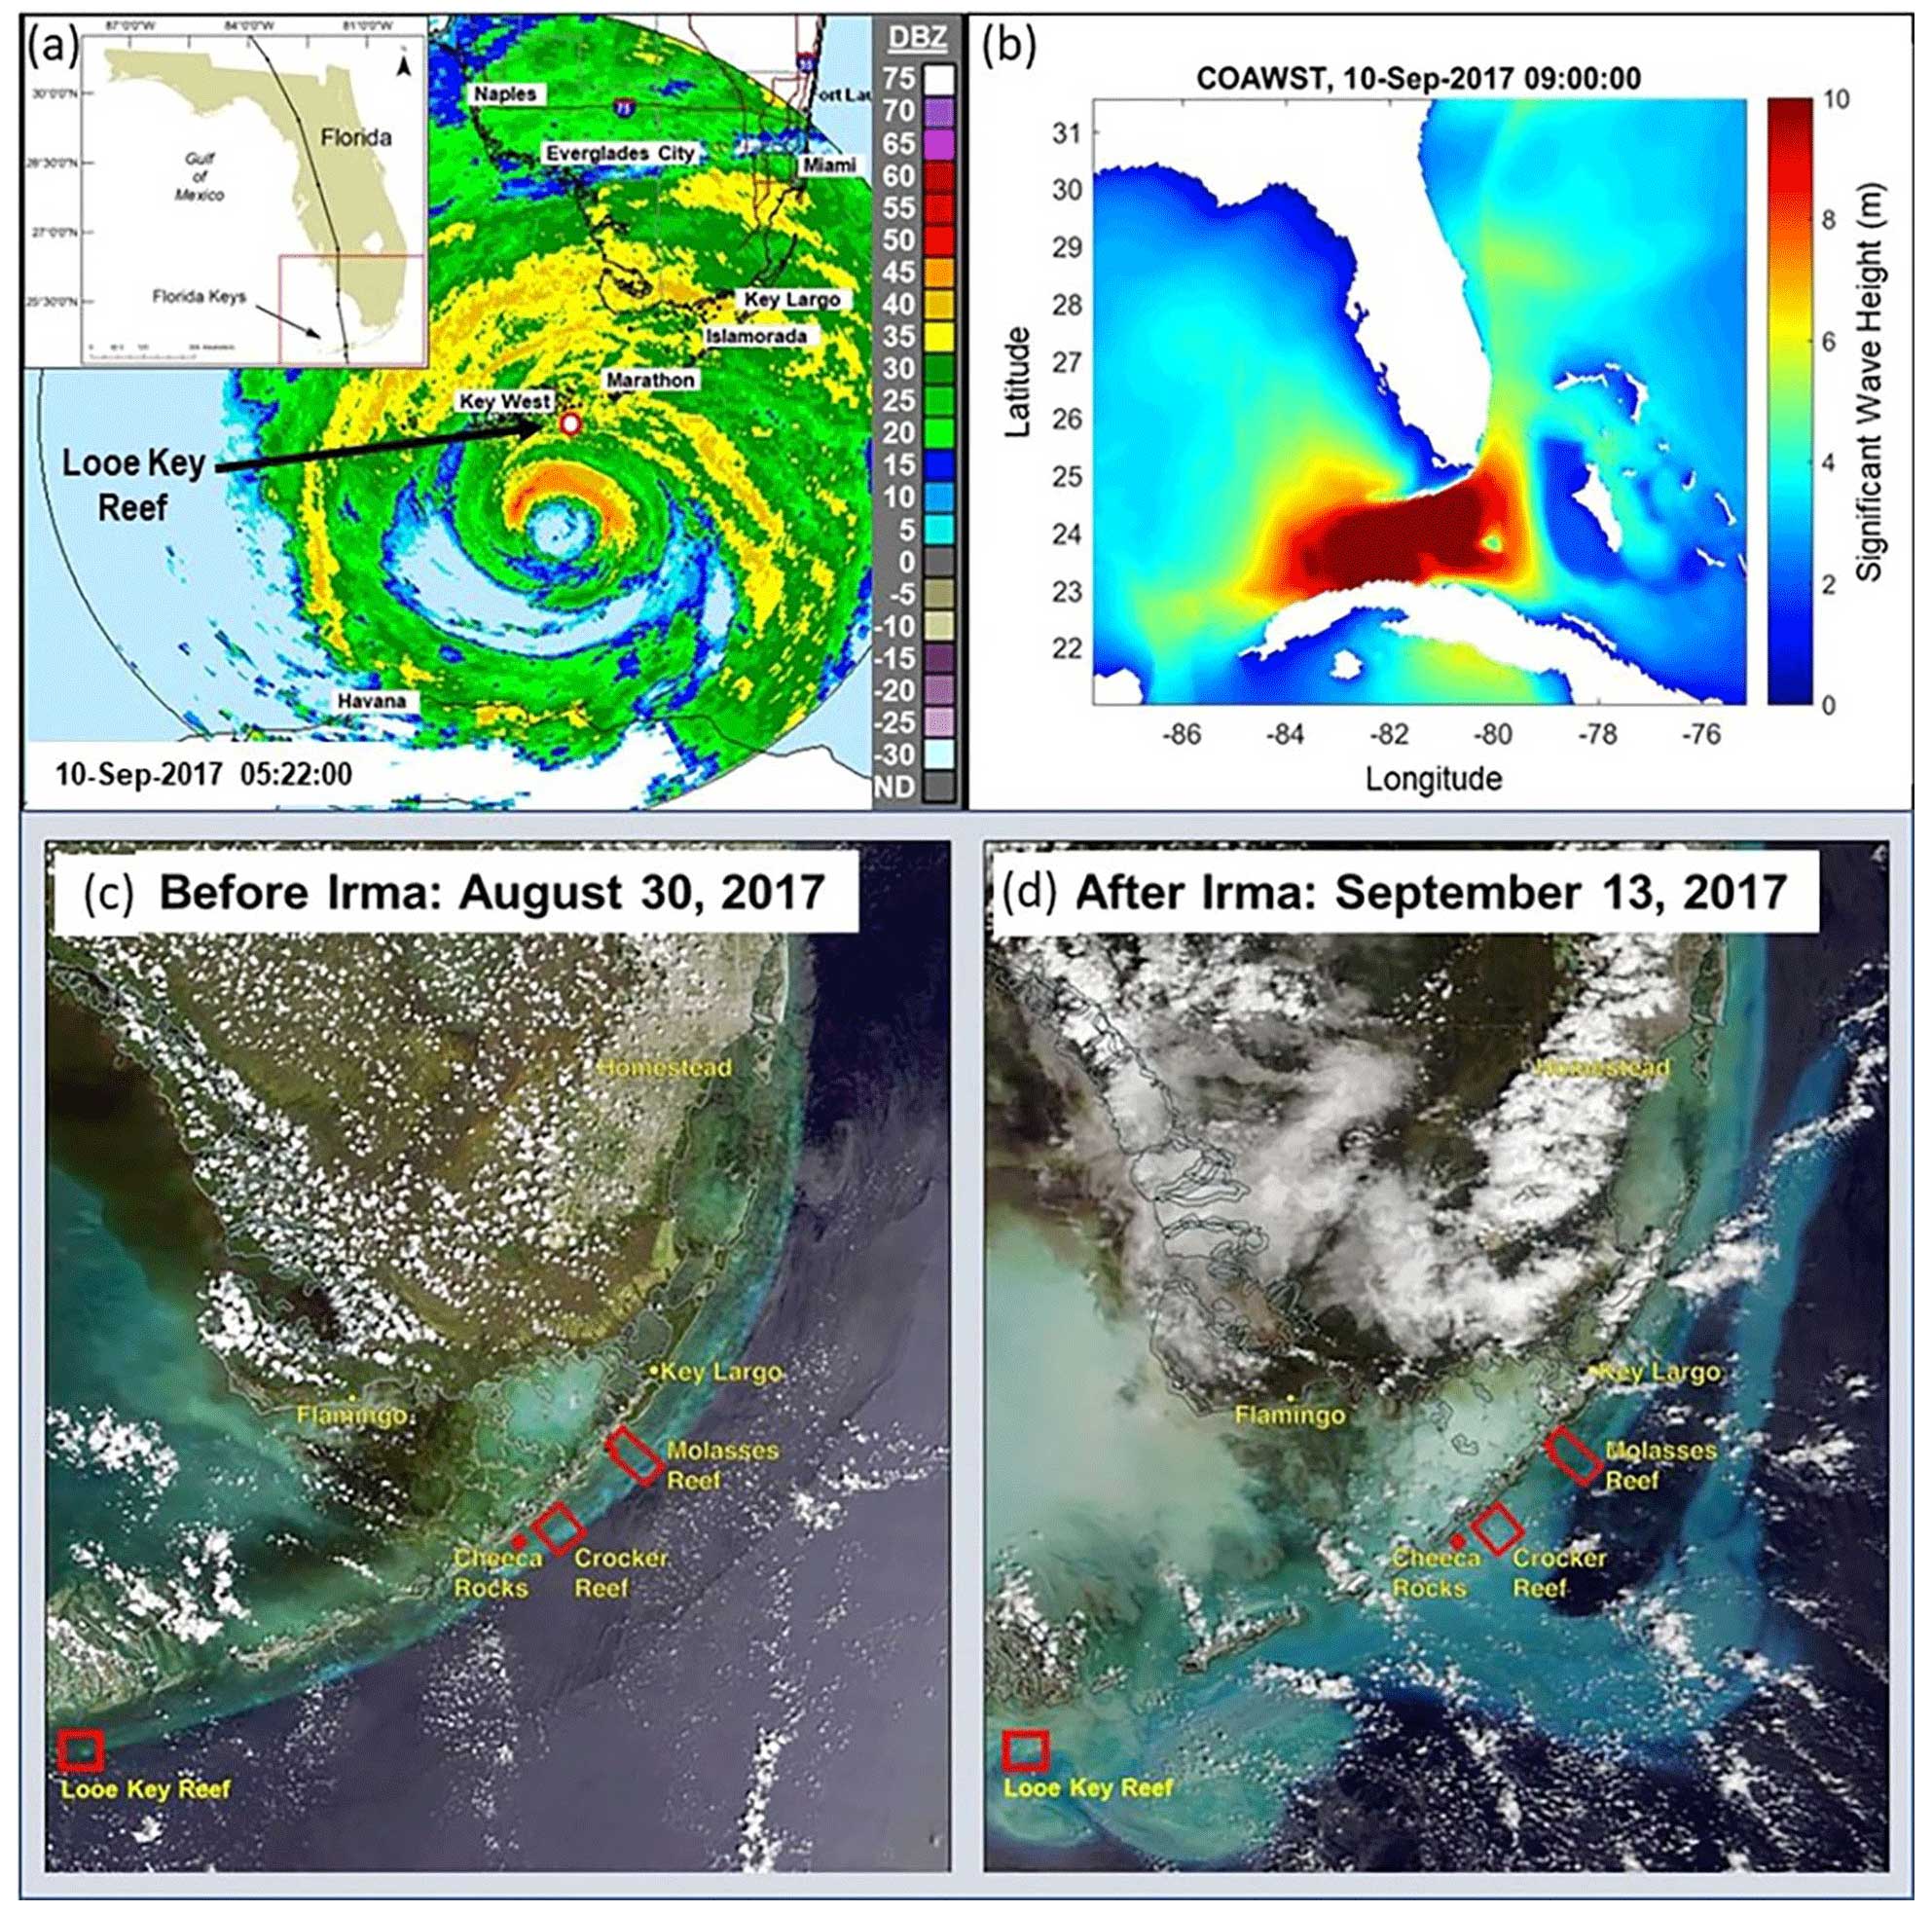
Figure 1Location of the Florida Keys Reef Tract, Hurricane Irma track line, and impact. (a) NOAA–National Weather Service WSR-88D radar image (decibels, DBZ) from South Florida on 10 September 2017 at 05:22 Eastern Daylight Time (EDT) showing the approach of Hurricane Irma (the inset black line is the hurricane track line). (b) Significant wave height (m) from the US Geological Survey (USGS) Coupled Ocean, Atmosphere, Wave, and Sediment Transport (COAWST) model on 10 September 2017 at 05:00 EDT (Warner et al., 2010, image credit: Patricia Dalyander, USGS). (c) Satellite imagery from 30 August 2017, 11 d prior to landfall of Hurricane Irma in the Florida Keys (NASA, 2023, EOSDIS Worldview Imagery). (d) Satellite imagery from 13 September 2017, 3 d after Hurricane Irma landfall in the Florida Keys, showing an extensive resuspended sediment plume (NASA, 2023, EOSDIS Worldview Imagery). Red boxes show the location of Looe Key Reef relative to other reefs along the reef tract.
Multi-decadal seafloor elevation change analyses along the FRT indicate that degradation of coral reefs and surrounding seafloor habitats led to substantial erosion and loss of elevation from the 1930s to 2002 and increased water depths to levels not expected until near the year 2100 (Yates et al., 2017). Continued FRT coral reef degradation and loss of seafloor elevation is projected to increase flooding risk from storms and coastal inundation for more than 7300 people and to cause USD 823.6 million in direct and indirect damage to housing, buildings, and businesses annually (Storlazzi et al., 2021, estimated in USD 2010). Storm frequency and strength are projected to increase as sea surface temperatures and atmospheric energy increase due to climate change and global warming (Elsner et al., 2008; Bhatia et al., 2019; Knutson et al., 2020). While advances have been made in understanding long-term change in seafloor elevation and structure and its potential socioeconomic consequences, understanding the effects of event-driven changes to seafloor geomorphology due to storms remains a major knowledge gap.
Major tropical storms persistently impact the state of Florida, with historical hurricane impacts estimated to have caused more than USD 450 billion in damage across the state from the early 1900s to 2007 (Malmstadt et al., 2009). The Middle to Lower Florida Keys (from Islamorada to Key West) were impacted by 15 major hurricane landfall events (category 3 through 5) and numerous tropical storms and category 1 and 2 hurricanes from the early 1900s to 2022 (NOAA, 2022a). Hurricane Irma made landfall at Cudjoe Key in the Lower Florida Keys after passing directly over Looe Key Reef on 10 September 2017 as a category 4 hurricane with maximum wind speeds of 213 km h−1 (115 kts) (Cangialosi et al., 2021) and significant wave heights of approximately 14 m a few kilometers offshore of the Florida Keys (Xian et al., 2018, Fig. 1a, b). Satellite imagery showed extensive sediment plumes throughout South Florida and the FRT caused by sediment resuspension and transport during the storm (Fig. 1c, d). The storm damaged up to 75 % of buildings near its landfall point and caused approximately USD 50 billion in wind and water damage across the state of Florida (Xian et al., 2018; Cangialosi et al., 2021; NOAA, 2022b). Prior to Hurricane Irma, the most recent direct impact to Looe Key Reef from a tropical storm was in 2008 during Tropical Storm Fay (NOAA, 2022a).
Numerous rapid assessments of seafloor habitats were conducted along the FRT in the weeks following Hurricane Irma. Diver-based surveys of coral reefs at 57 locations along the FRT by the National Oceanic and Atmospheric Administration showed the highest levels of damage in the Middle to Lower Keys including dislodged and fractured corals, clogged and damaged sponges, heavy sedimentation, burial of corals, displaced rubble and sand, reef erosion, fractured substrate, and marine debris; 14 % of sites showed a severe impact, 33 % showed a moderate impact, and 53 % showed a minimal impact (Viehman et al., 2018). Looe Key Reef, located near the hurricane landfall location, showed more than 26 % prevalence of hurricane-impacted corals (Florida Resilience Program, 2017). Similar surveys along the northern FRT from Key Biscayne north showed approximately 5 % to 17 % of 62 sites with impacts on corals, including dislodged and buried colonies, and at least one site with slabs of hard bottom 2 to 5 m in size fractured and displaced several meters (Walker, 2018). Analyses of long-term monitoring-transect data at 40 sites throughout the Florida Keys National Marine Sanctuary (FKNMS) showed instantaneous losses in seagrass and calcareous green macroalgae density after the storm passed, particularly in the Lower Florida Keys near where Hurricane Irma made landfall (Wilson et al., 2020). Additionally, several locations showed moderate burial of seagrass with up to 5 to 10 cm of sand, while other locations showed heavy erosion or moderate seagrass canopy thinning (Wilson et al., 2020). Reef visual census (RVC) surveys including structure-from-motion (SfM) habitat photogrammetry at sites in the Lower Florida Keys from February 2017 to December 2018 showed a 30 % decrease in macroalgae at the Looe Key Sanctuary Preservation Area (SPA) and a 30 % increase at the Looe Key special use area (SPU) post-Irma, while both Looe Key locations showed a 10 % decrease in live coral cover and a 20 % increase in octocoral cover (Simmons et al., 2022). Comparison of restored (outplant) coral survival rates at two fore-reef and two patch reef sites near Tavernier Key in the Upper Florida Keys showed approximately 85 % outplant survival at all locations prior to the passage of Hurricane Irma; however, no outplants survived at the fore-reef sites and only 51 % of outplants survived at the patch reef sites post-Irma, with the difference likely due to protection of the patch reefs from dissipation of wave energy by the reef crest (Lohr et al., 2020). Examination of Diadema antillarum sea urchin (a key reef grazer) density, size structure, and coral reef community structure before and 2.5 months after Irma at 10 locations in the Middle and Upper Florida Keys showed a significant decrease in D. antillarum density with increased sedimentation, suggesting that sediment transport caused mortality through abrasion and burial (Kobelt et al., 2020).
While observational data from several locations indicate that seafloor sediments were transported and likely caused damage to benthic habitats, the direct impact of Hurricane Irma or other tropical storms on seafloor elevation and geomorphologic structures has not previously been quantified along the FRT. In this study, we used high-resolution light detection and ranging (lidar) and multibeam bathymetry data collected before and after the passage of Hurricane Irma to quantify seafloor elevation and volume change of benthic habitats and geomorphological structures resulting from the storm's impact and post-storm re-equilibration of seafloor sediments at more than 4 million point locations in the Looe Key Reef system in the Lower FRT.
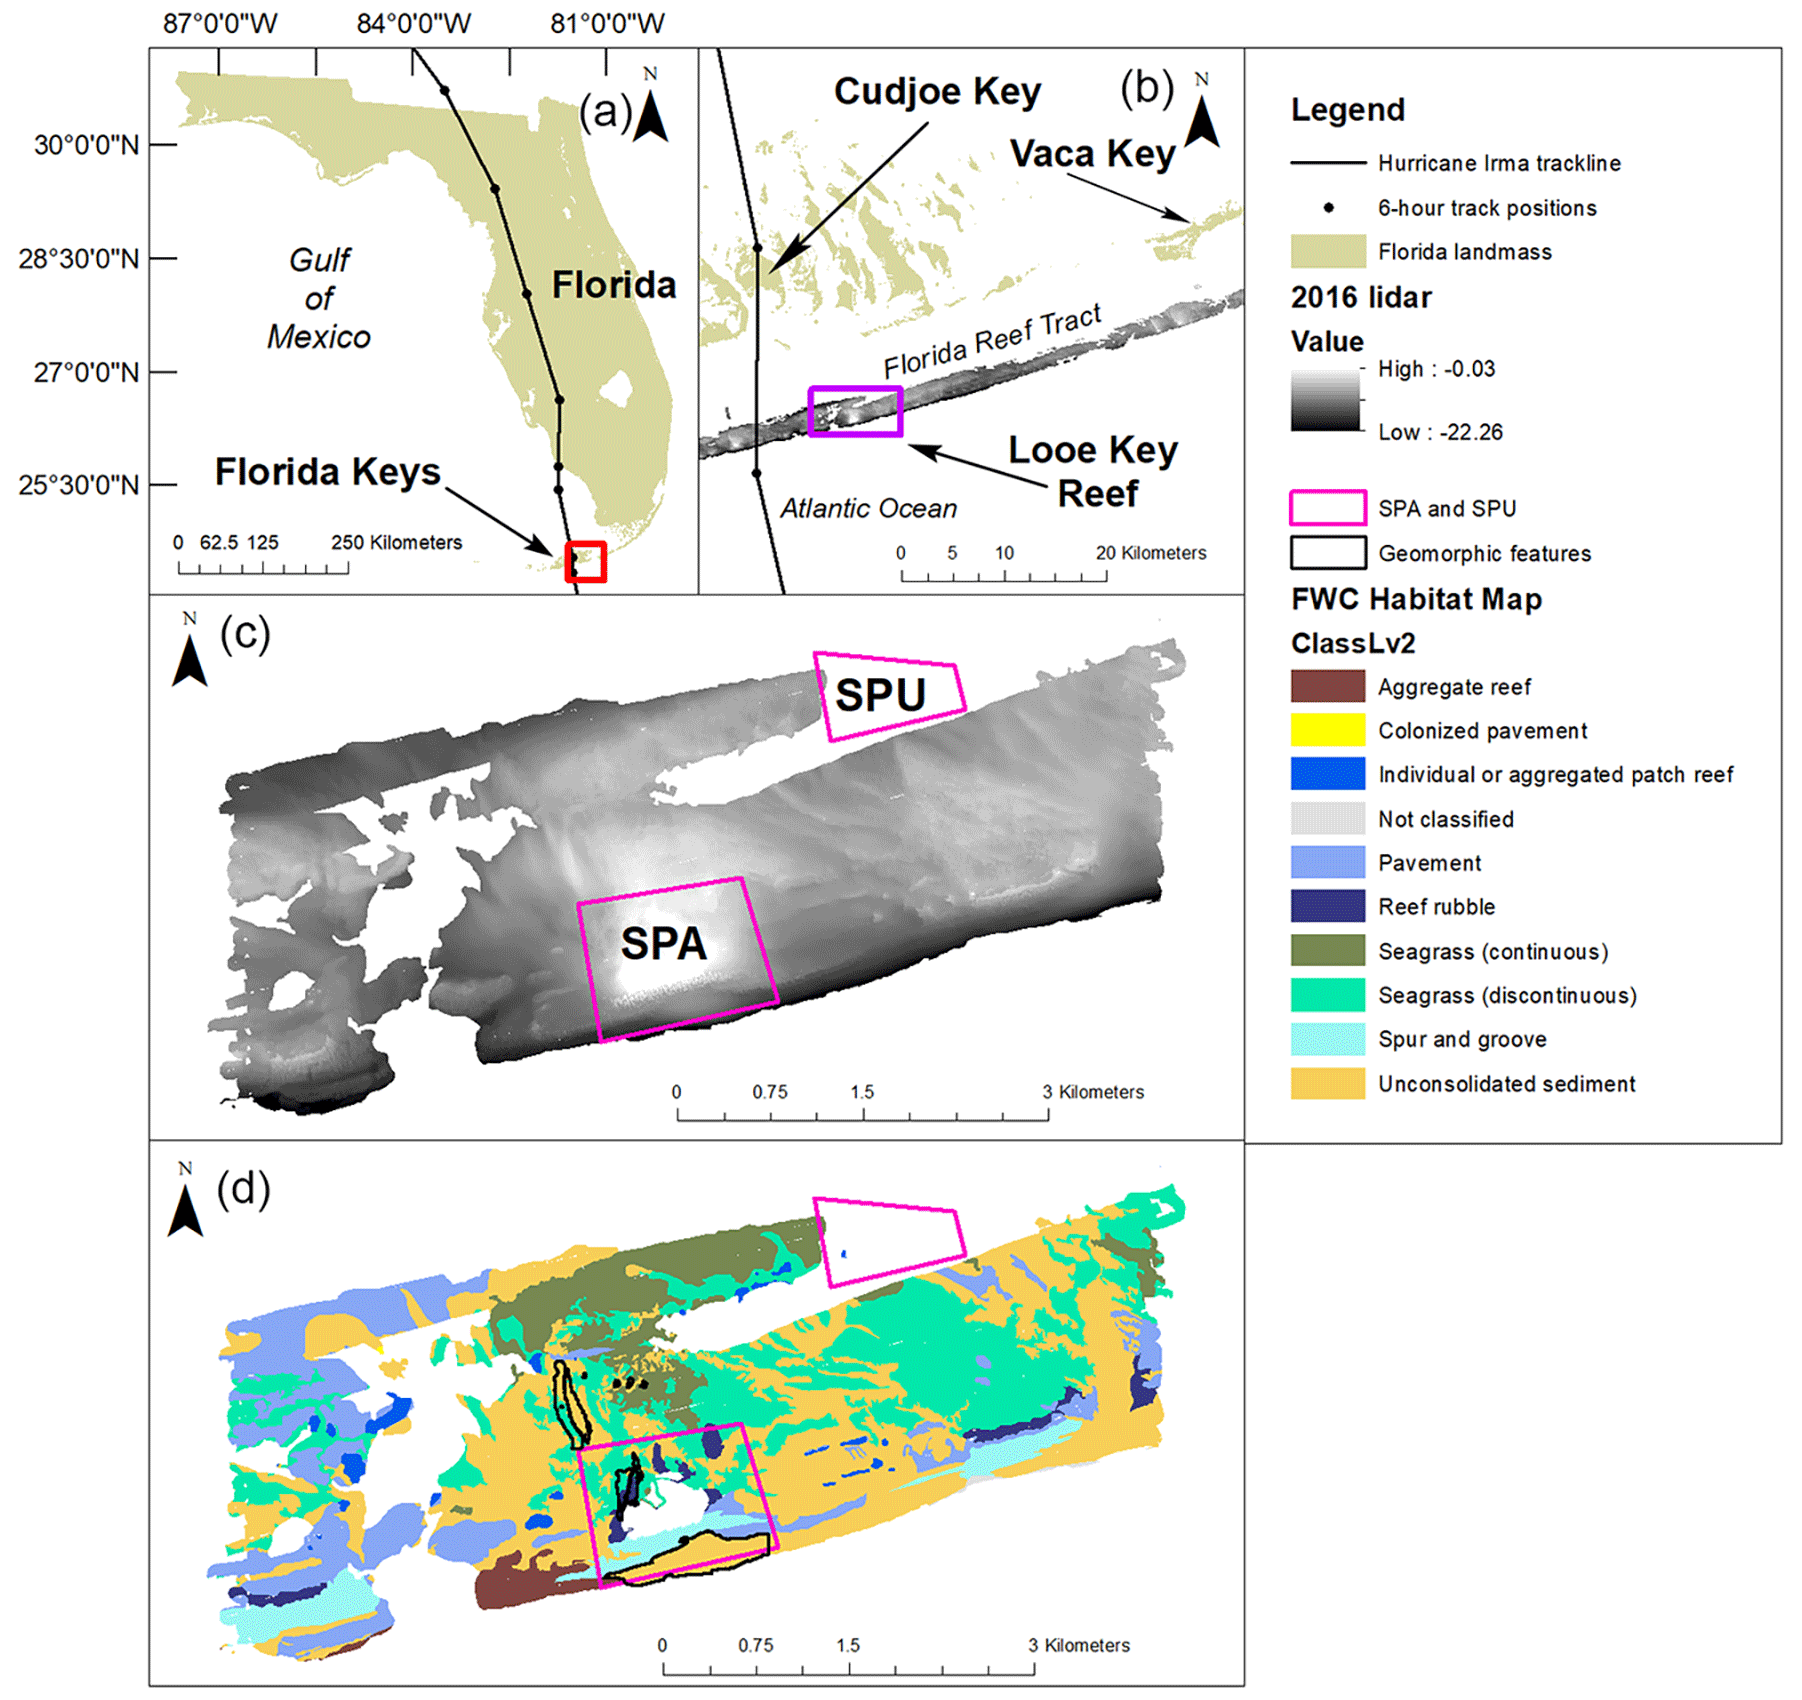
Figure 2Looe Key Reef location, bathymetry, and seafloor habitats. (a) Location of the Florida Keys along the southern coast of Florida, track line of Hurricane Irma, and the location of its landfall (red box). (b) Proximity of Hurricane Irma's track line to the Looe Key Reef study site (purple box), location of landfall at Cudjoe Key, and location of Vaca Key where the nearest NOAA-NOS (2023) tide and current station was located. (c) 2016 lidar bathymetric map of the Looe Key Reef study site showing the location of the Florida Keys National Marine Sanctuary special preservation area (SPA), special use area (SPU), and geomorphic features of focused investigation for this study. (d) Habitat distribution at the Looe Key study site from the Florida Fish and Wildlife Conservation Commission, Fish and Wildlife Research Institute (2015).
2.1 Looe Key Reef study site
The FRT is the only living coral shelf reef in the continental United States, and it spans more than 580 km along the east coast of Florida from St. Lucie Inlet to the Dry Tortugas, with total reef area of approximately 1179 km2 (Lidz et al., 2003; Finkl and Andrews, 2008; Jackson et al., 2014; Florida Department of Environmental Protection, 2023). Water depth along the FRT is up to approximately 20 m with discontinuous spur-and-groove formations and patch reefs separated by tidal passes, and it is characterized by both coral-dominated and non-coral-dominated seafloor habitat as characterized and mapped by the Florida Fish and Wildlife Conservation Commission, Fish and Wildlife Research Institute (FWC, 2015). Much of the FRT is protected by the FKNMS, Biscayne National Park, and Dry Tortugas National Park and includes several special preservation areas (SPAs) and special use areas (SPUs) within FKNMS, including the Looe Key SPA and SPU, that together protect over 6000 marine species (Keller and Donahue, 2006). Looe Key Reef is a barrier bank reef located approximately 10 km offshore in the Lower Florida Keys, south of Cudjoe Key, and it is characterized by a prominent, shallow reef crest with two extensive coral rubble fields, a fore reef with a spur-and-groove formation, a fore-reef terrace and deep reef zone, and a back-reef area with seagrass communities, patch reefs, and individual coral heads (Fig. 2a–d). Seagrass beds and sand flats with intermittent patch reefs extend shoreward from Looe Key Reef proper to Hawk Channel, approximately 2 km to the north. Looe Key SPA, located at approximately 24°32′ N, 81°24′ W, is just over 18 km2 and surrounds LKR proper, which is less than 1.7 km2. Looe Key Reef contains a coral nursery and several restoration sites for coral outplants; it is one of seven FKNMS iconic reefs and the focus of a major collaborative habitat restoration effort known as “Mission: Iconic Reefs” (NOAA Fisheries, 2022).
The northeastern eyewall of Hurricane Irma passed directly over LKR with the storm's center passing approximately 9 km west of LKR. However, the storm was approximately 684 km in diameter and covered the entire FRT and much of South Florida. The National Weather Service's technical summary of the storm reported tropical-storm-force winds more than 640 km away from the storm's center and hurricane-force winds more than 125 km from the storm's center (NOAA, 2022b). Gale-force winds (sustained winds above 63 km h−1) were detected by the evening of 9 September 2017 at the National Oceanic and Atmospheric Administration–National Ocean Service (NOAA-NOS) tide and current station at Vaca Key (number 8723970), 35 km to the northeast of LKR; maximum sustained winds of 213 km h−1 were reported as the storm made landfall, and latent gale-force winds were detected after the storm passed on the evening of 10 September 2017 (NOAA-NOS, 2023). The average wind direction for this period was 67.01°, indicating that winds moved from ENE toward WSW. Wind speeds fell sharply below gale force after the storm, shifting northeastward. Wind conditions were relatively quiescent from July 2016 through January 2019 (except during Hurricane Irma), with wind speeds occasionally ranging up to approximately 56 km h−1 during winter storms (NOAA-NOS, 2023).
Table 1Elevation datasets used in this analysis; collection dates are specific to the geographic extent of this study.
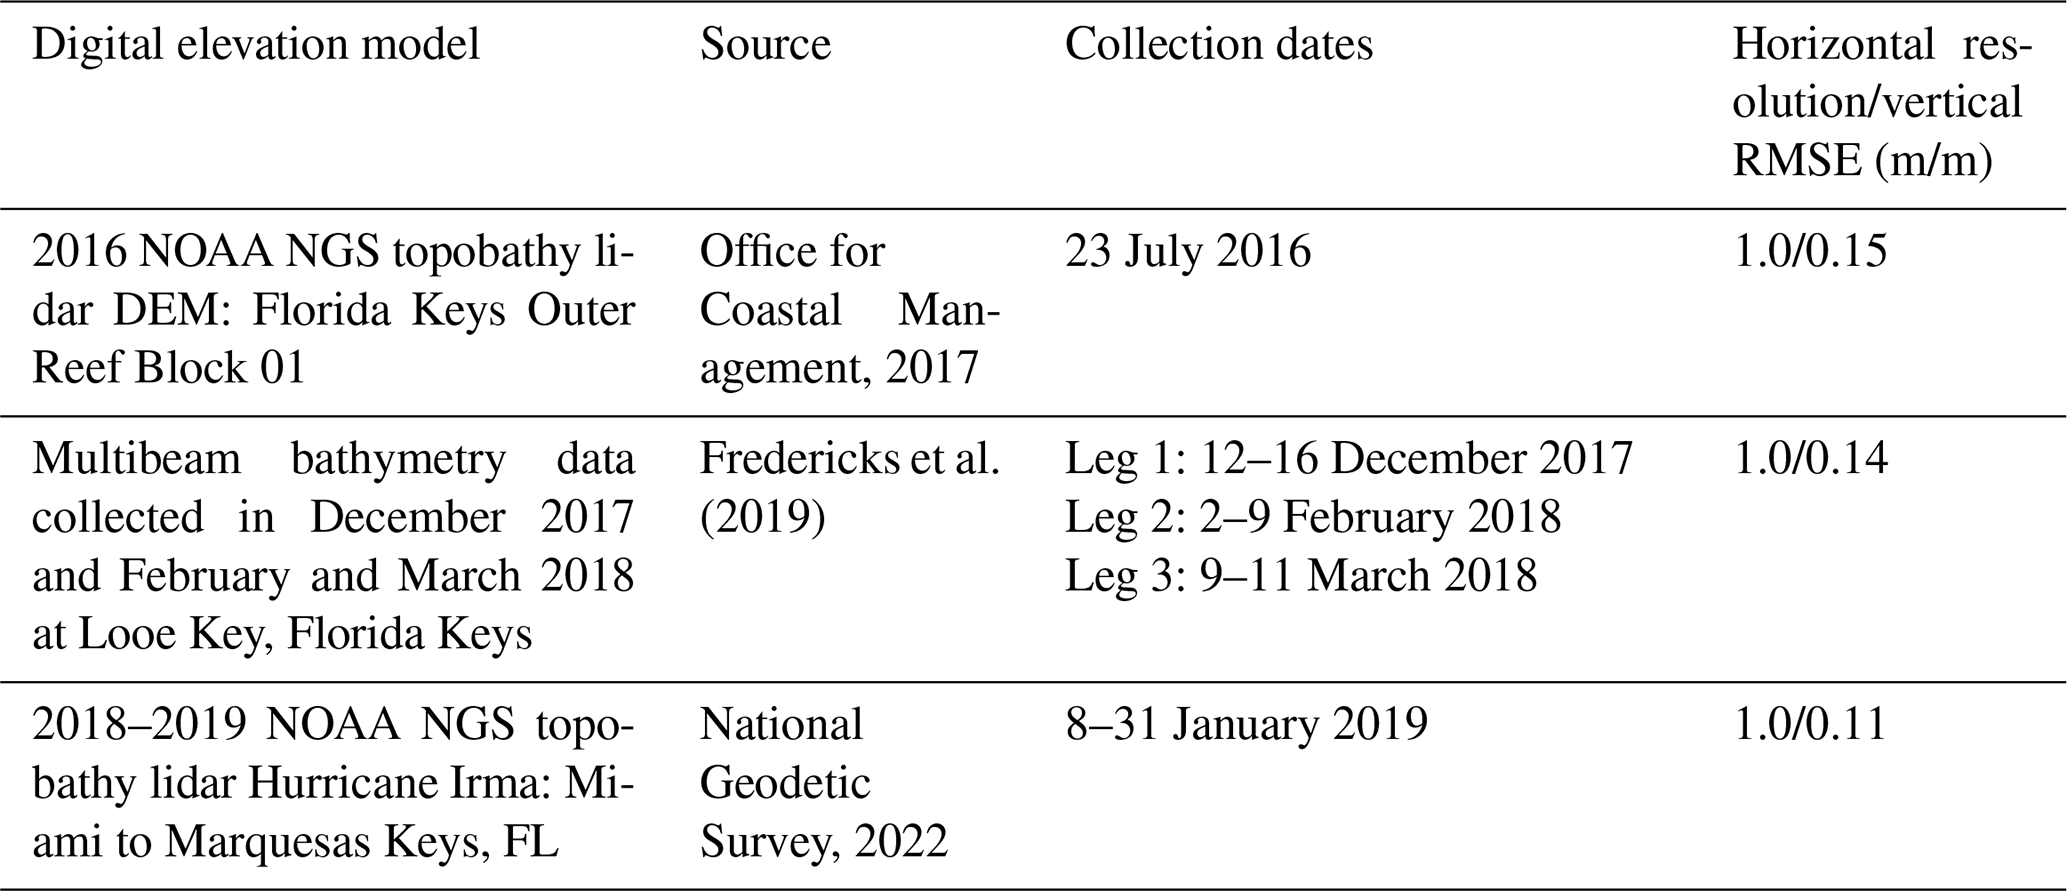
RMSE: root mean square error.
2.2 Elevation and habitat data
Three digital elevation models (DEMs) derived from lidar or multibeam bathymetric surveys were used for seafloor elevation and volume change analyses and are referenced in this study as 2016 lidar, 2017 multibeam, and 2019 lidar (Table 1). The 2016 lidar DEM refers to data that were collected on 23 July 2016 (13.5 months before the passage of Hurricane Irma) by the NOAA Office for Coastal Management, National Geodetic Survey, topobathy lidar DEM Block 01 dataset (Office for Coastal Management, 2017). The 2017 multibeam DEM refers to multibeam bathymetry data collected by the US Geological Survey in December 2017 and February–March 2018 at Looe Key Reef (between 3 and 6 months after the passage of Hurricane Irma), specifically to examine impacts from the storm (Fredericks et al., 2019). The 2019 lidar DEM refers to data collected 8–31 January 2019 by the NOAA NGS topobathy lidar DEM Hurricane Irma: Miami to Marquesas Keys, FL (National Geodetic Survey, 2022). The Florida Fish and Wildlife Conservation Commission (FWC) Unified Florida Reef Tract (UFRT) map version 2.0, level 2 habitat categories (FWC, 2015) were used to delineate geographic boundaries for 10 habitat types within the LKR study site (Fig. 2d). The habitat labeled as “not classified” was indistinguishable during mapping due to turbidity, cloud cover, water depth, or other interferences in obtaining an optical signature of the seafloor (Zitello et al., 2009).
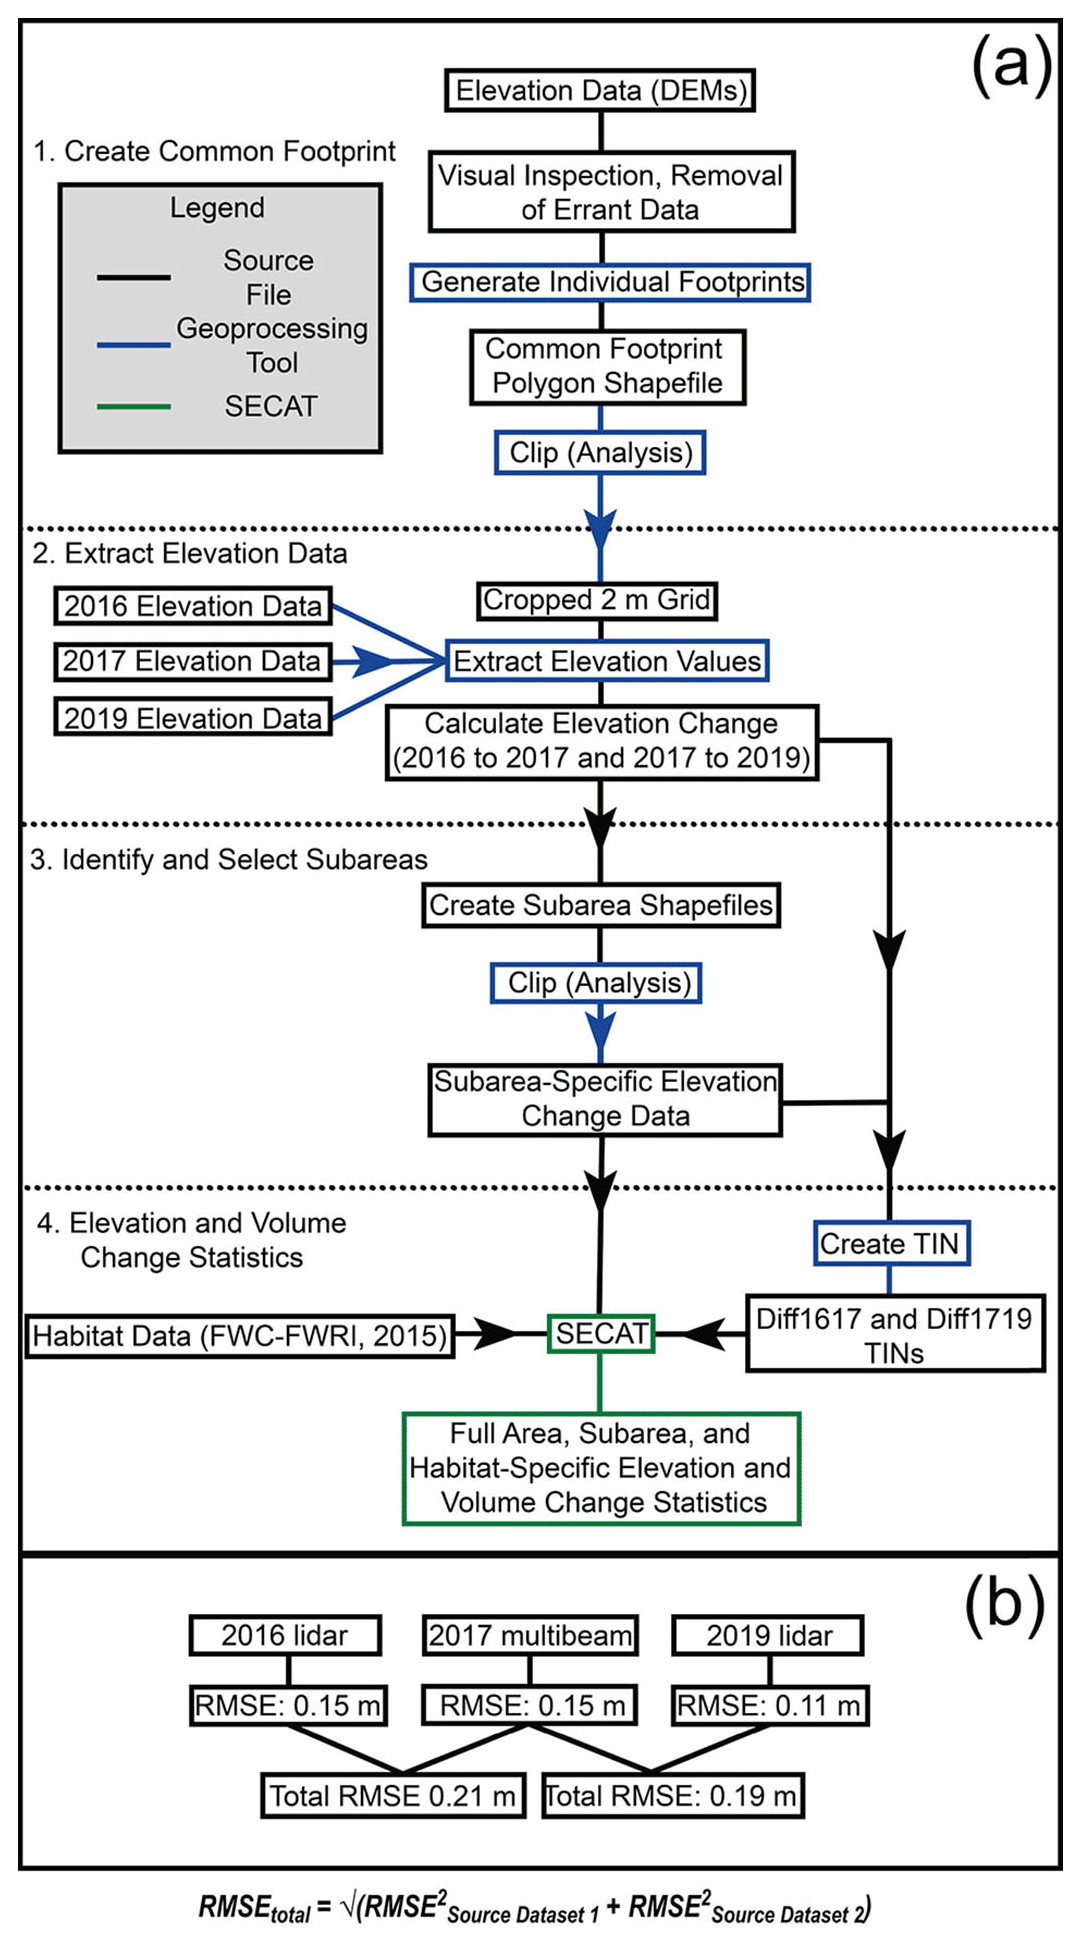
Figure 3Seafloor elevation and volume change methods. (a) Flowchart outlining generalized geoprocessing steps in ArcMap and Global Mapper (steps 1 through 3), as well as in the Seafloor Elevation Change Analysis Tool (SECAT, step 4), for seafloor elevation and volume change analyses based on Yates et al. (2017), Murphy et al. (2022), and Zieg and Zawada (2021). (b) Composite RMSE (RMSETotal) for each elevation change analysis (2016 to 2017 and 2017 to 2019) calculated using reported RMSE for lidar and multibeam source data and methods of Yates et al. (2017). Black boxes indicate source data files. Blue boxes indicate steps using geoprocessing tools from ArcMap or Global Mapper. Green boxes indicate data analysis conducted using SECAT.
2.3 Elevation and volume change analyses
Seafloor elevation and volume change analyses were conducted using the methods of Yates et al. (2017) and 2 m grid spacing techniques of Murphy et al. (2022) (Fig. 3a). Briefly, individual geographic footprint areas (polygons) were created for each of the three 1 m resolution digital elevation models (DEMs) in ArcMap 10.7 and were used to create a common footprint polygon shapefile for the total LKR study site encompassing the overlapping area among the three datasets. The original (full areal extent, or unclipped) 2016–2017 elevation change dataset was 19.71 km2 and included 4 934 364 data points. The overlapping areal extent for the 2016, 2017, and 2019 DEMs was 15.98 km2 and excluded areas where water depths were too shallow for boat access to collect multibeam data in 2017 and areas of coarse interpolation within the 2017 DEM. The areal extent of each DEM was then clipped to the areal extent of the common overlapping footprint prior to elevation change analysis using the “Clip” tool in ArcMap. The following steps were performed in Global Mapper 22.1 due to file size limitations in ArcMap. A 2 m X–Y grid was created in Global Mapper and clipped to the same footprint. Elevation values were then extracted from each of the three DEMs at the center points of co-aligned 2 m grid boxes. Elevation change between time periods was calculated for each of 4 007 961 paired elevation values (e.g., 2017 elevation–2016 elevation and 2019 elevation–2017 elevation). Elevation change (X–Y–Z) point maps were generated as shapefiles for each time period of change for the total study site; positive values indicate an increase in elevation and negative values indicate a decrease in elevation. We used these changes in elevation to estimate the net effect of all processes affecting accretion and erosion in the system, and the use of these terms for our study indicates estimates of net accretion and net erosion from our measurements. Data are available from Fehr et al. (2021). Vertical uncertainty of elevation change analyses was estimated using methods of Yates et al. (2017) and the reported vertical accuracy of the lidar and multibeam datasets (typically reported as the 95 % root mean square error – RMSE, Table 1) to calculate a composite RMSE (RMSETotal) for each elevation change analysis (Fig. 3b). The RMSE of lidar and multibeam datasets used for elevation change analyses in our study ranged from 0.11 to 0.15 m (Table 1). These values are consistent with RMSEs determined in performance evaluations of lidar sensors that ranged from 0.08 to 0.52 m (Fernandez-Diaz et al., 2014; Legleiter et al., 2016; Kinzel et al., 2007; Tonina et al., 2019; Yoshida et al., 2023). Composite RMSE values for elevation change analyses based on comparison of lidar to multibeam DEMs ranged from 0.19 to 0.21 m in our study. These values are consistent with RMSEs determined in performance evaluations of lidar sensors against multibeam echo-sounders that ranged from 0.02 to 0.23 m (Awadallah et al., 2023). The FWC UFRT habitat map was clipped to the intersect footprint for each elevation change analysis using ArcMap 10.7. Each total study site elevation change dataset was then clipped to individual habitat polygons to create individual elevation change shapefiles for each habitat type.
Elevation change data from each time period were then used to generate TIN (triangulated irregular network) surface models in ArcMap for calculation of volume change. TIN models were clipped to the original overall study site intersect footprint to remove interpolation across areas where no data were collected. Lower-bound (conservative) volume change was calculated based on areal volume above and below surface plane heights corresponding to plus and minus the RMSETotal of the elevation change analysis (RMSETotal =21 cm for 2016 to 2017, and 19 cm for 2017 to 2019 change analyses). Upper-bound volume changes were calculated based on area volume above and below a plane height of 0 m. The attribute values stored within the elevation change and TIN surface shapefiles were then used to compute elevation and volume change statistics for the total LKR study site and each habitat type using the Seafloor Elevation Change Analysis Tool (SECAT) custom Python script of Zieg and Zawada (2021). Pearson correlation and linear regression analyses were performed using Microsoft Excel Version 2302 (build 16.0.16130.20690) to assess relationships between mean habitat water depth, elevation change, and area-normalized volume change for each habitat type including (1) 2016 mean water depth (estimated from mean elevation) and mean elevation change, (2) 2016 mean water depth and area-normalized volume change, (3) 2017 mean water depth and mean elevation change, (4) 2017 mean water depth and area-normalized volume change, and (5) 2017 to 2019 mean elevation change as well as 2016 to 2017 mean elevation.
2.4 Geomorphic feature analyses
Sub-areas or geomorphic features of high-magnitude elevation change (greater than approximately ±0.5 m) were delineated on each total study site elevation change point map by manually drawing polygons in ArcMap 10.7 and creating elevation change shapefiles for each sub-area. Each sub-area was clipped to individual habitat polygons to create individual shapefiles for each habitat type within a given sub-area. Elevation and volume change statistics were computed for each geomorphic feature of interest and each habitat within sub-areas of interest using SECAT and methods described in Sect. 2.3.
We examined elevation and elevation change along four 200 to 300 m transects across examples of high-elevation change geomorphic features. Elevation profiles for 2016, 2017, and 2019 were created for each feature of interest by extracting elevation values from each DEM along transect lines across the areas of greatest elevation change for each feature using ArcMap. Points were selected using the “Select Feature by Line” tool in ArcMap, and the selected features were then exported as a new shapefile. Positions and types of geomorphic features of interest were verified through in situ observation by scuba divers using methods of Fehr and Yates (2020) at 30 diver reconnaissance sites throughout the total study site.
Table 2Elevation change data by habitat type associated with each period and geomorphic feature sub-area.
* 58 data points fell on borders between habitats and were counted twice during habitat analysis. SD: standard deviation.
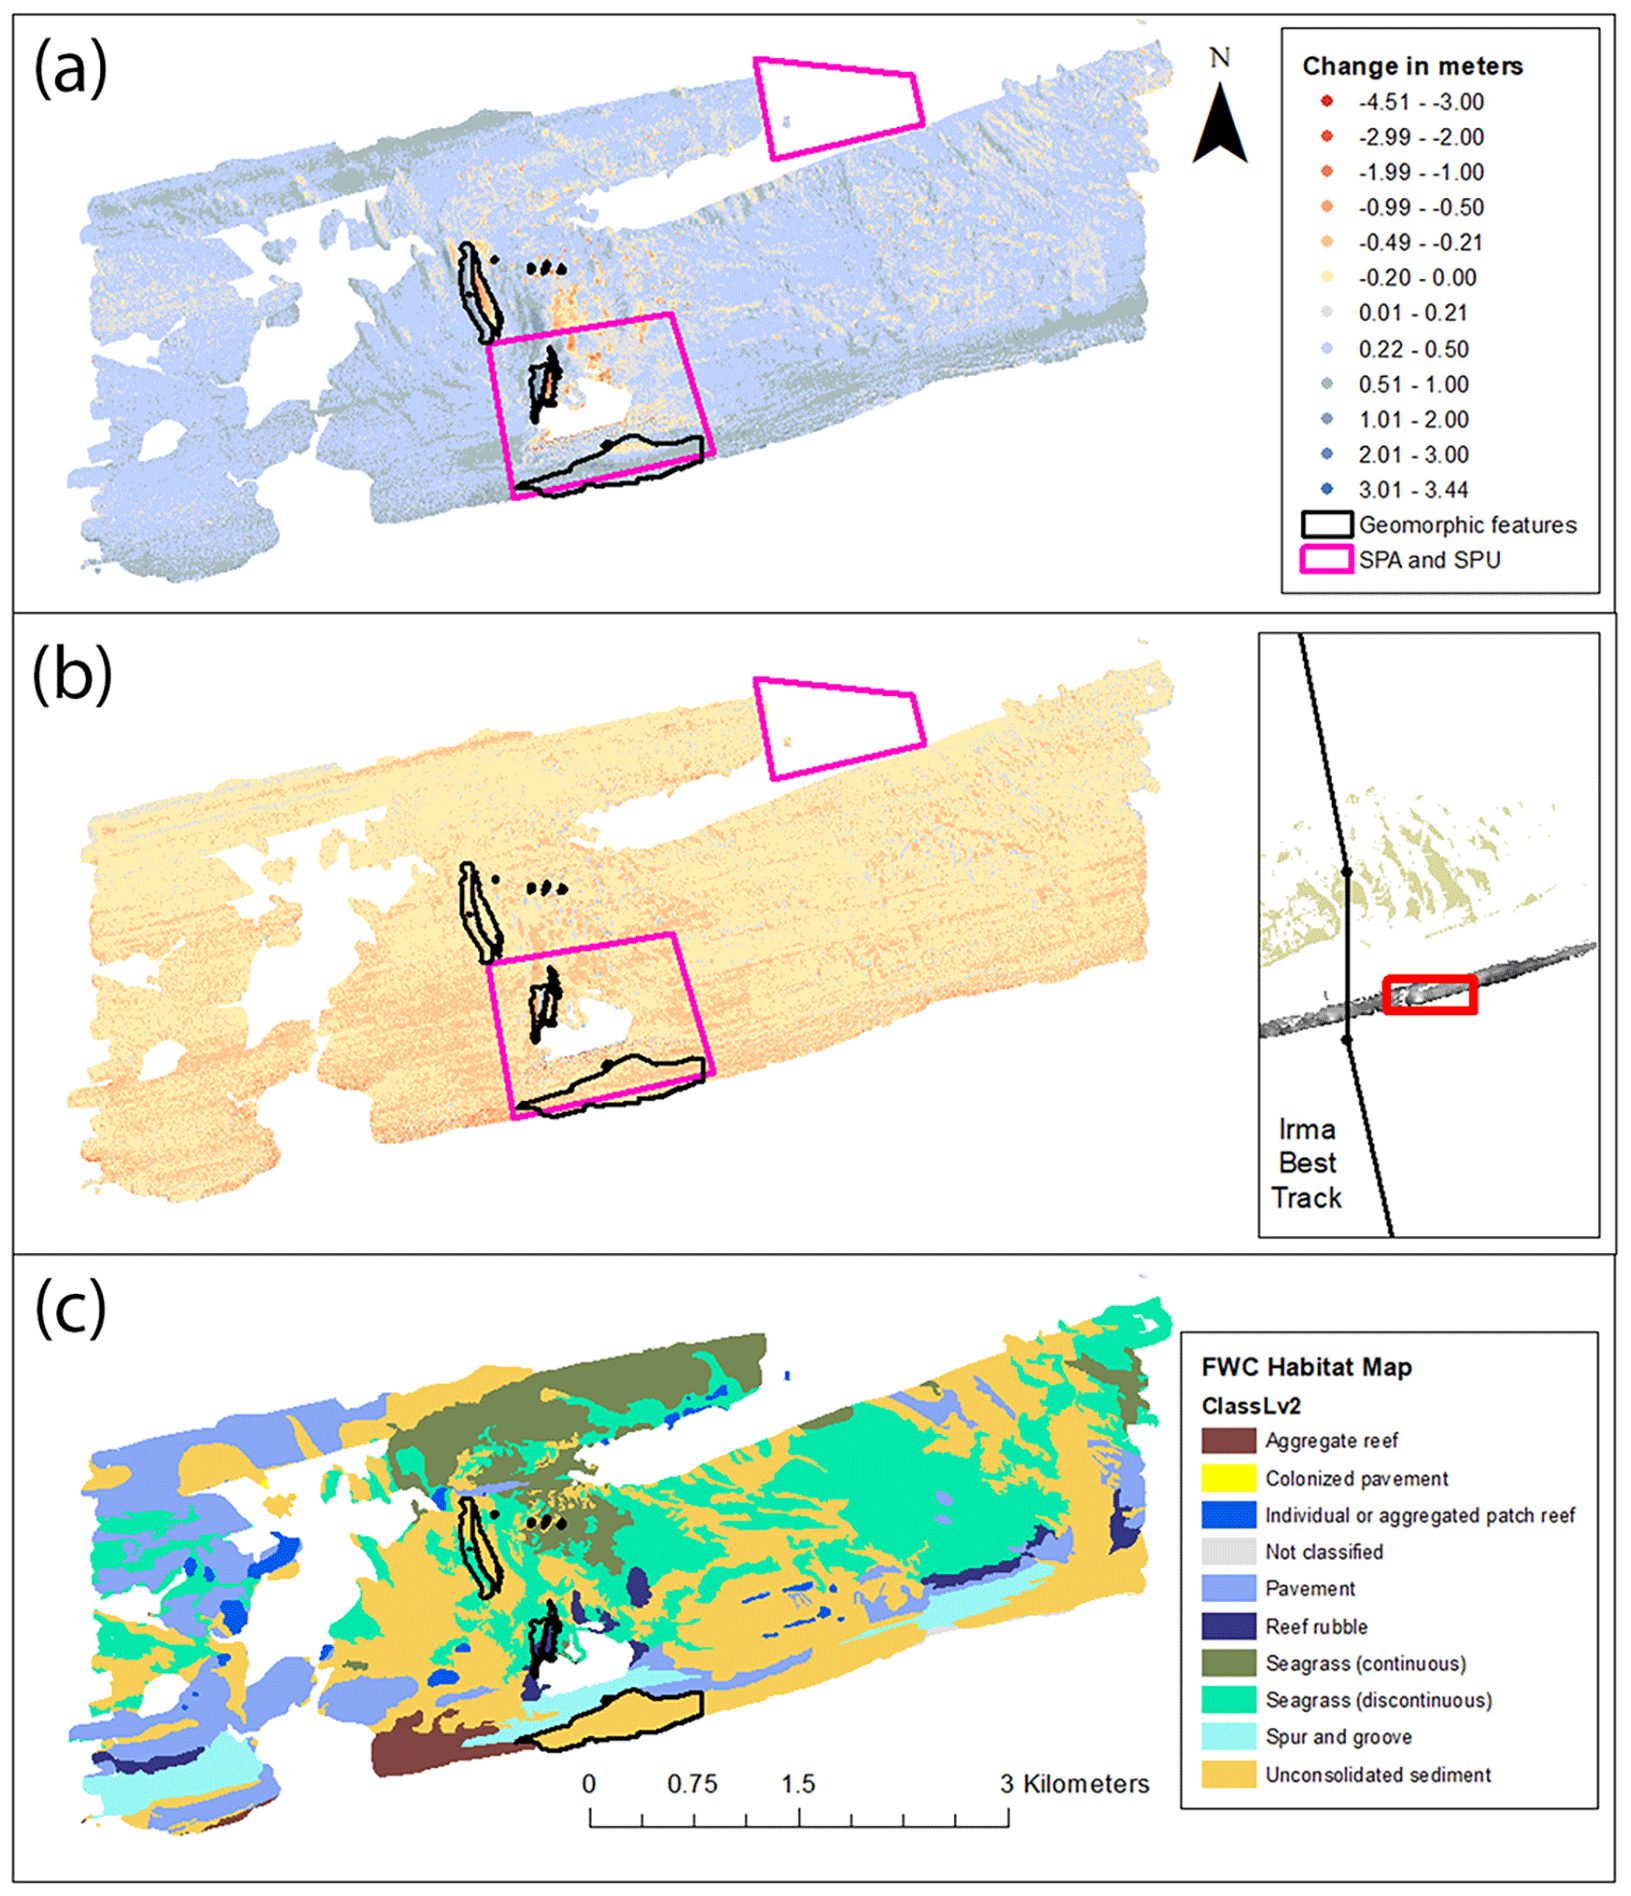
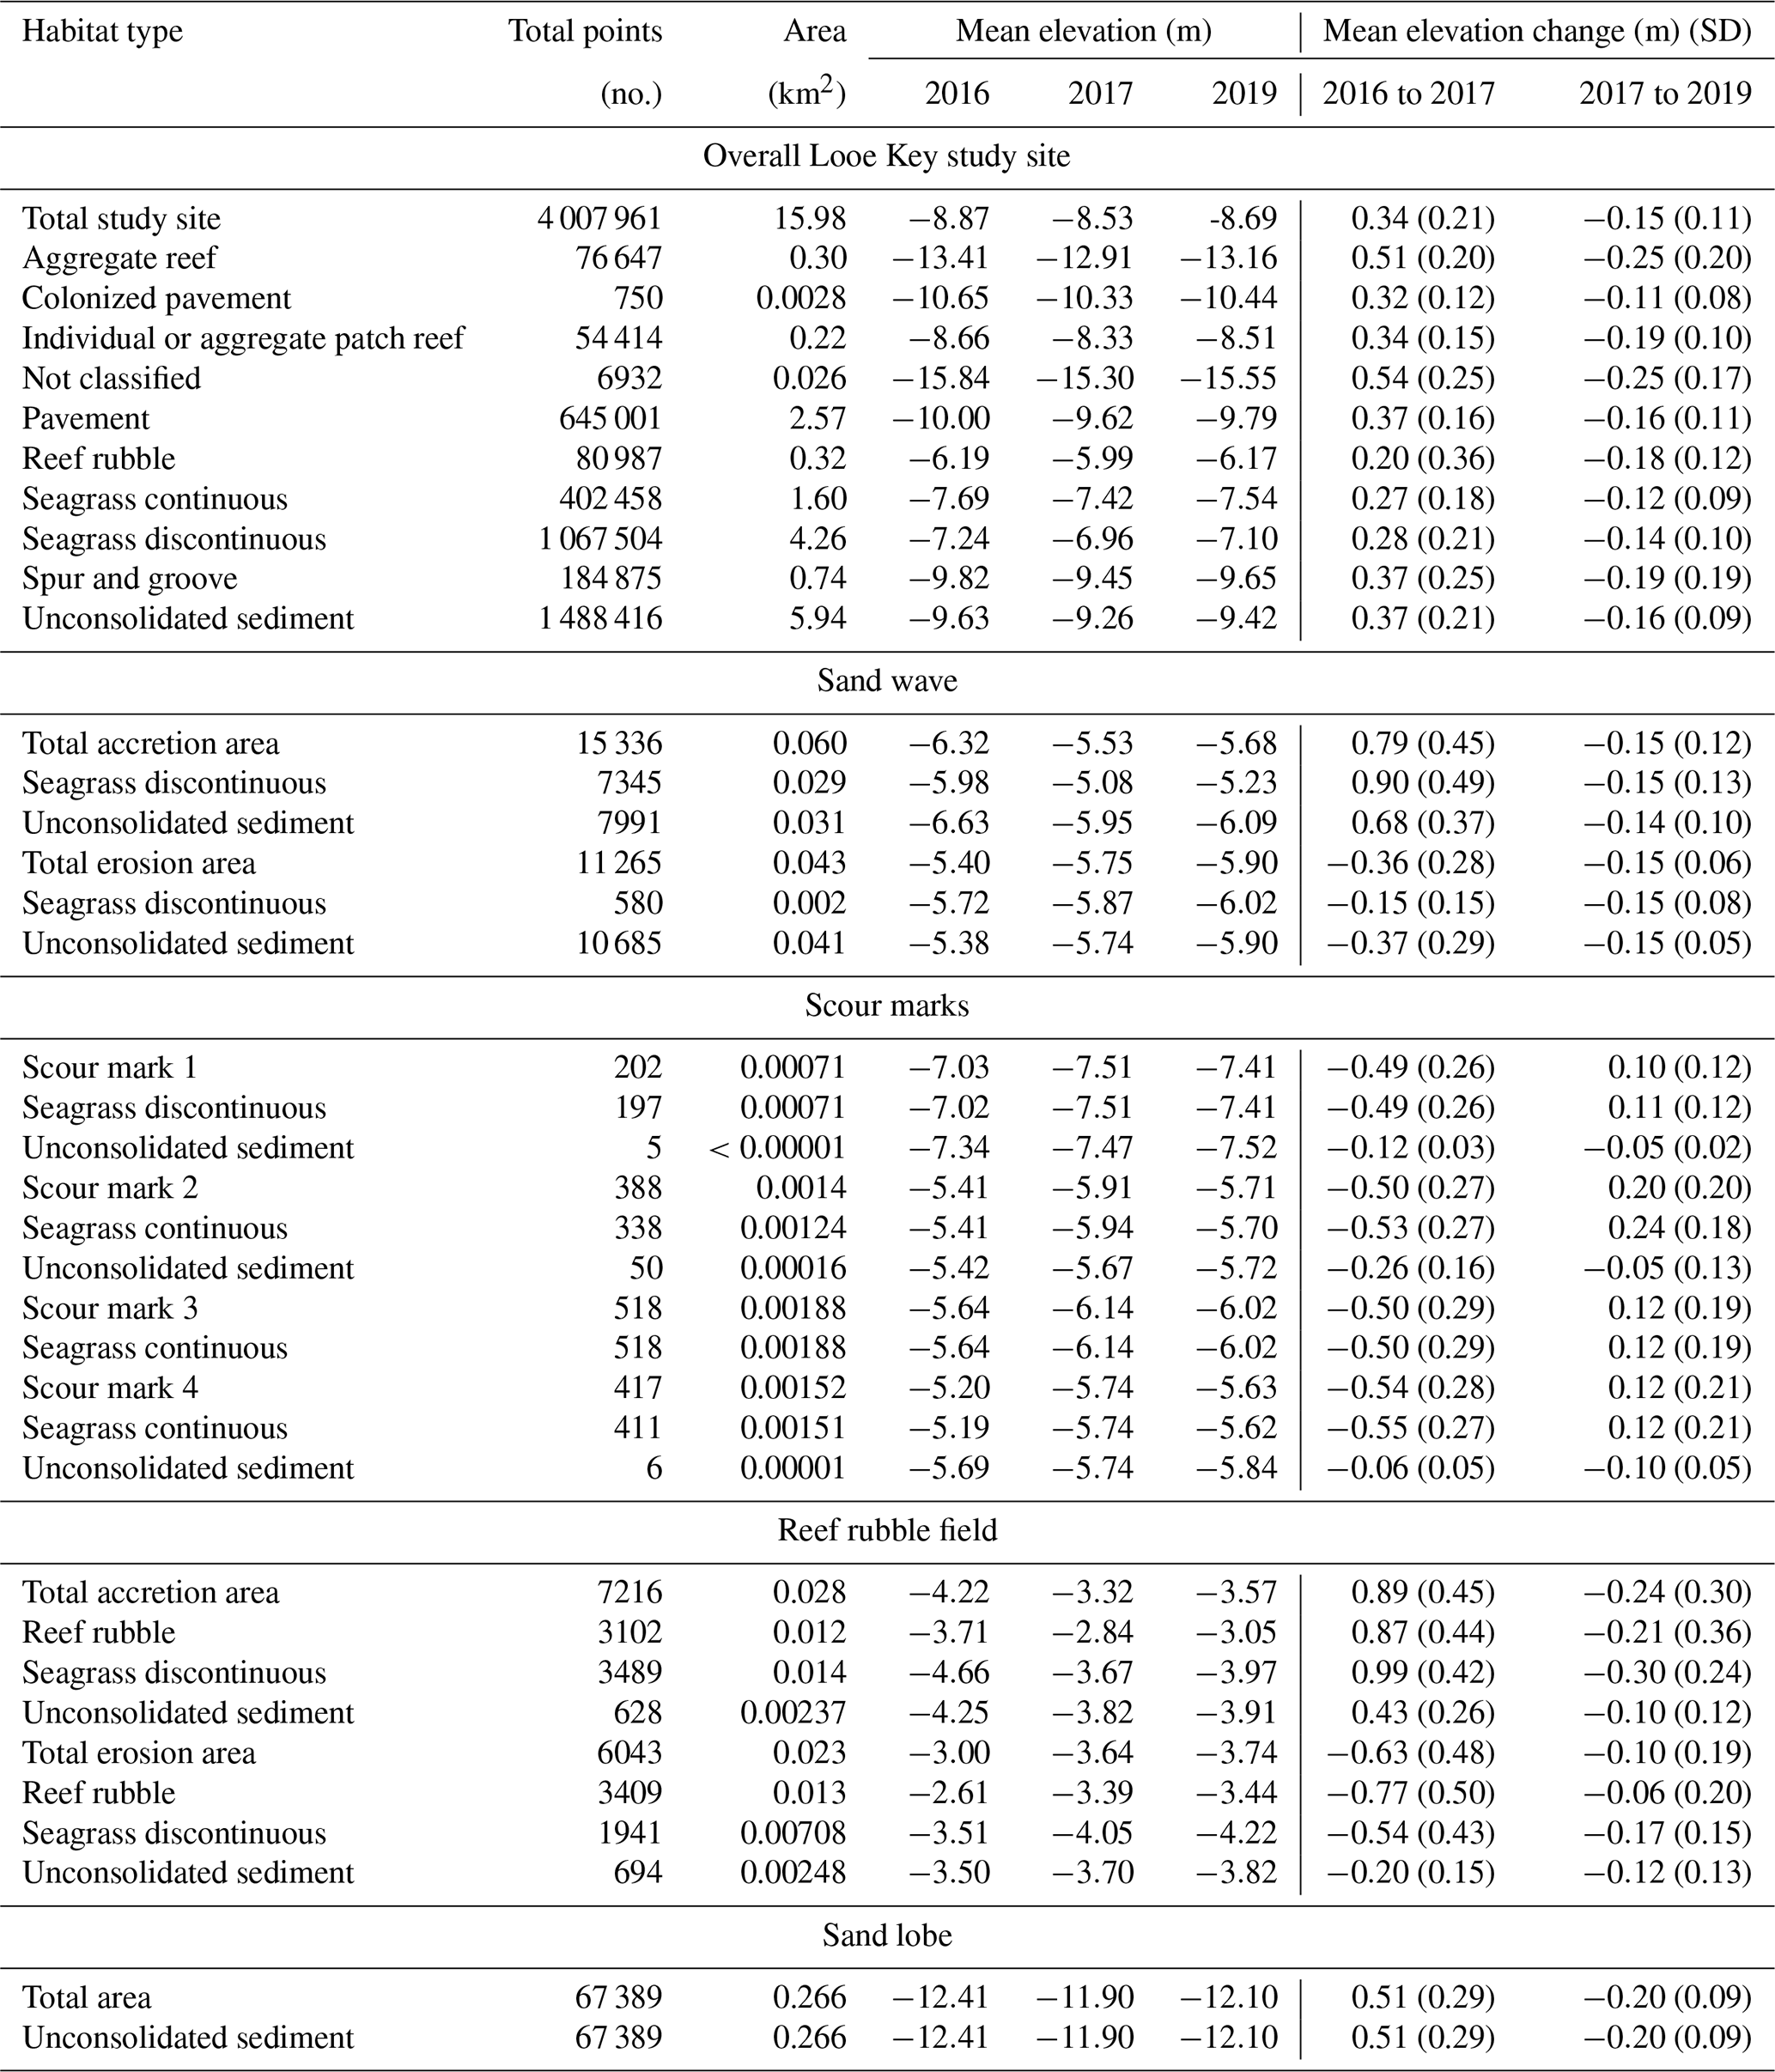
Figure 4Elevation change results for 4 007 961 point locations at Looe Key Reef. Elevation change between (a) 2016 and 2017 (13.5 months before and 3 to 6 months after Hurricane Irma) and (b) between 2017 and 2019 (from approximately 3 to 16.5 months after Hurricane Irma), as well as (c) corresponding seafloor habitats (FWC, 2015). The Hurricane Irma best track data in the panel (b) inset are from the NOAA NHC Irma Storm Track resource page (NHC, 2018, see also Fig. 2b). Boundaries for the Looe Key Sanctuary special protection area (SPA) and special protection unit (SPU) are shown as pink polygons. Geomorphic features of interest are indicated with black polygons. Gaps in map areas indicate locations where water depth was too shallow for collection of multibeam bathymetric data.
3.1 Elevation and volume change analyses
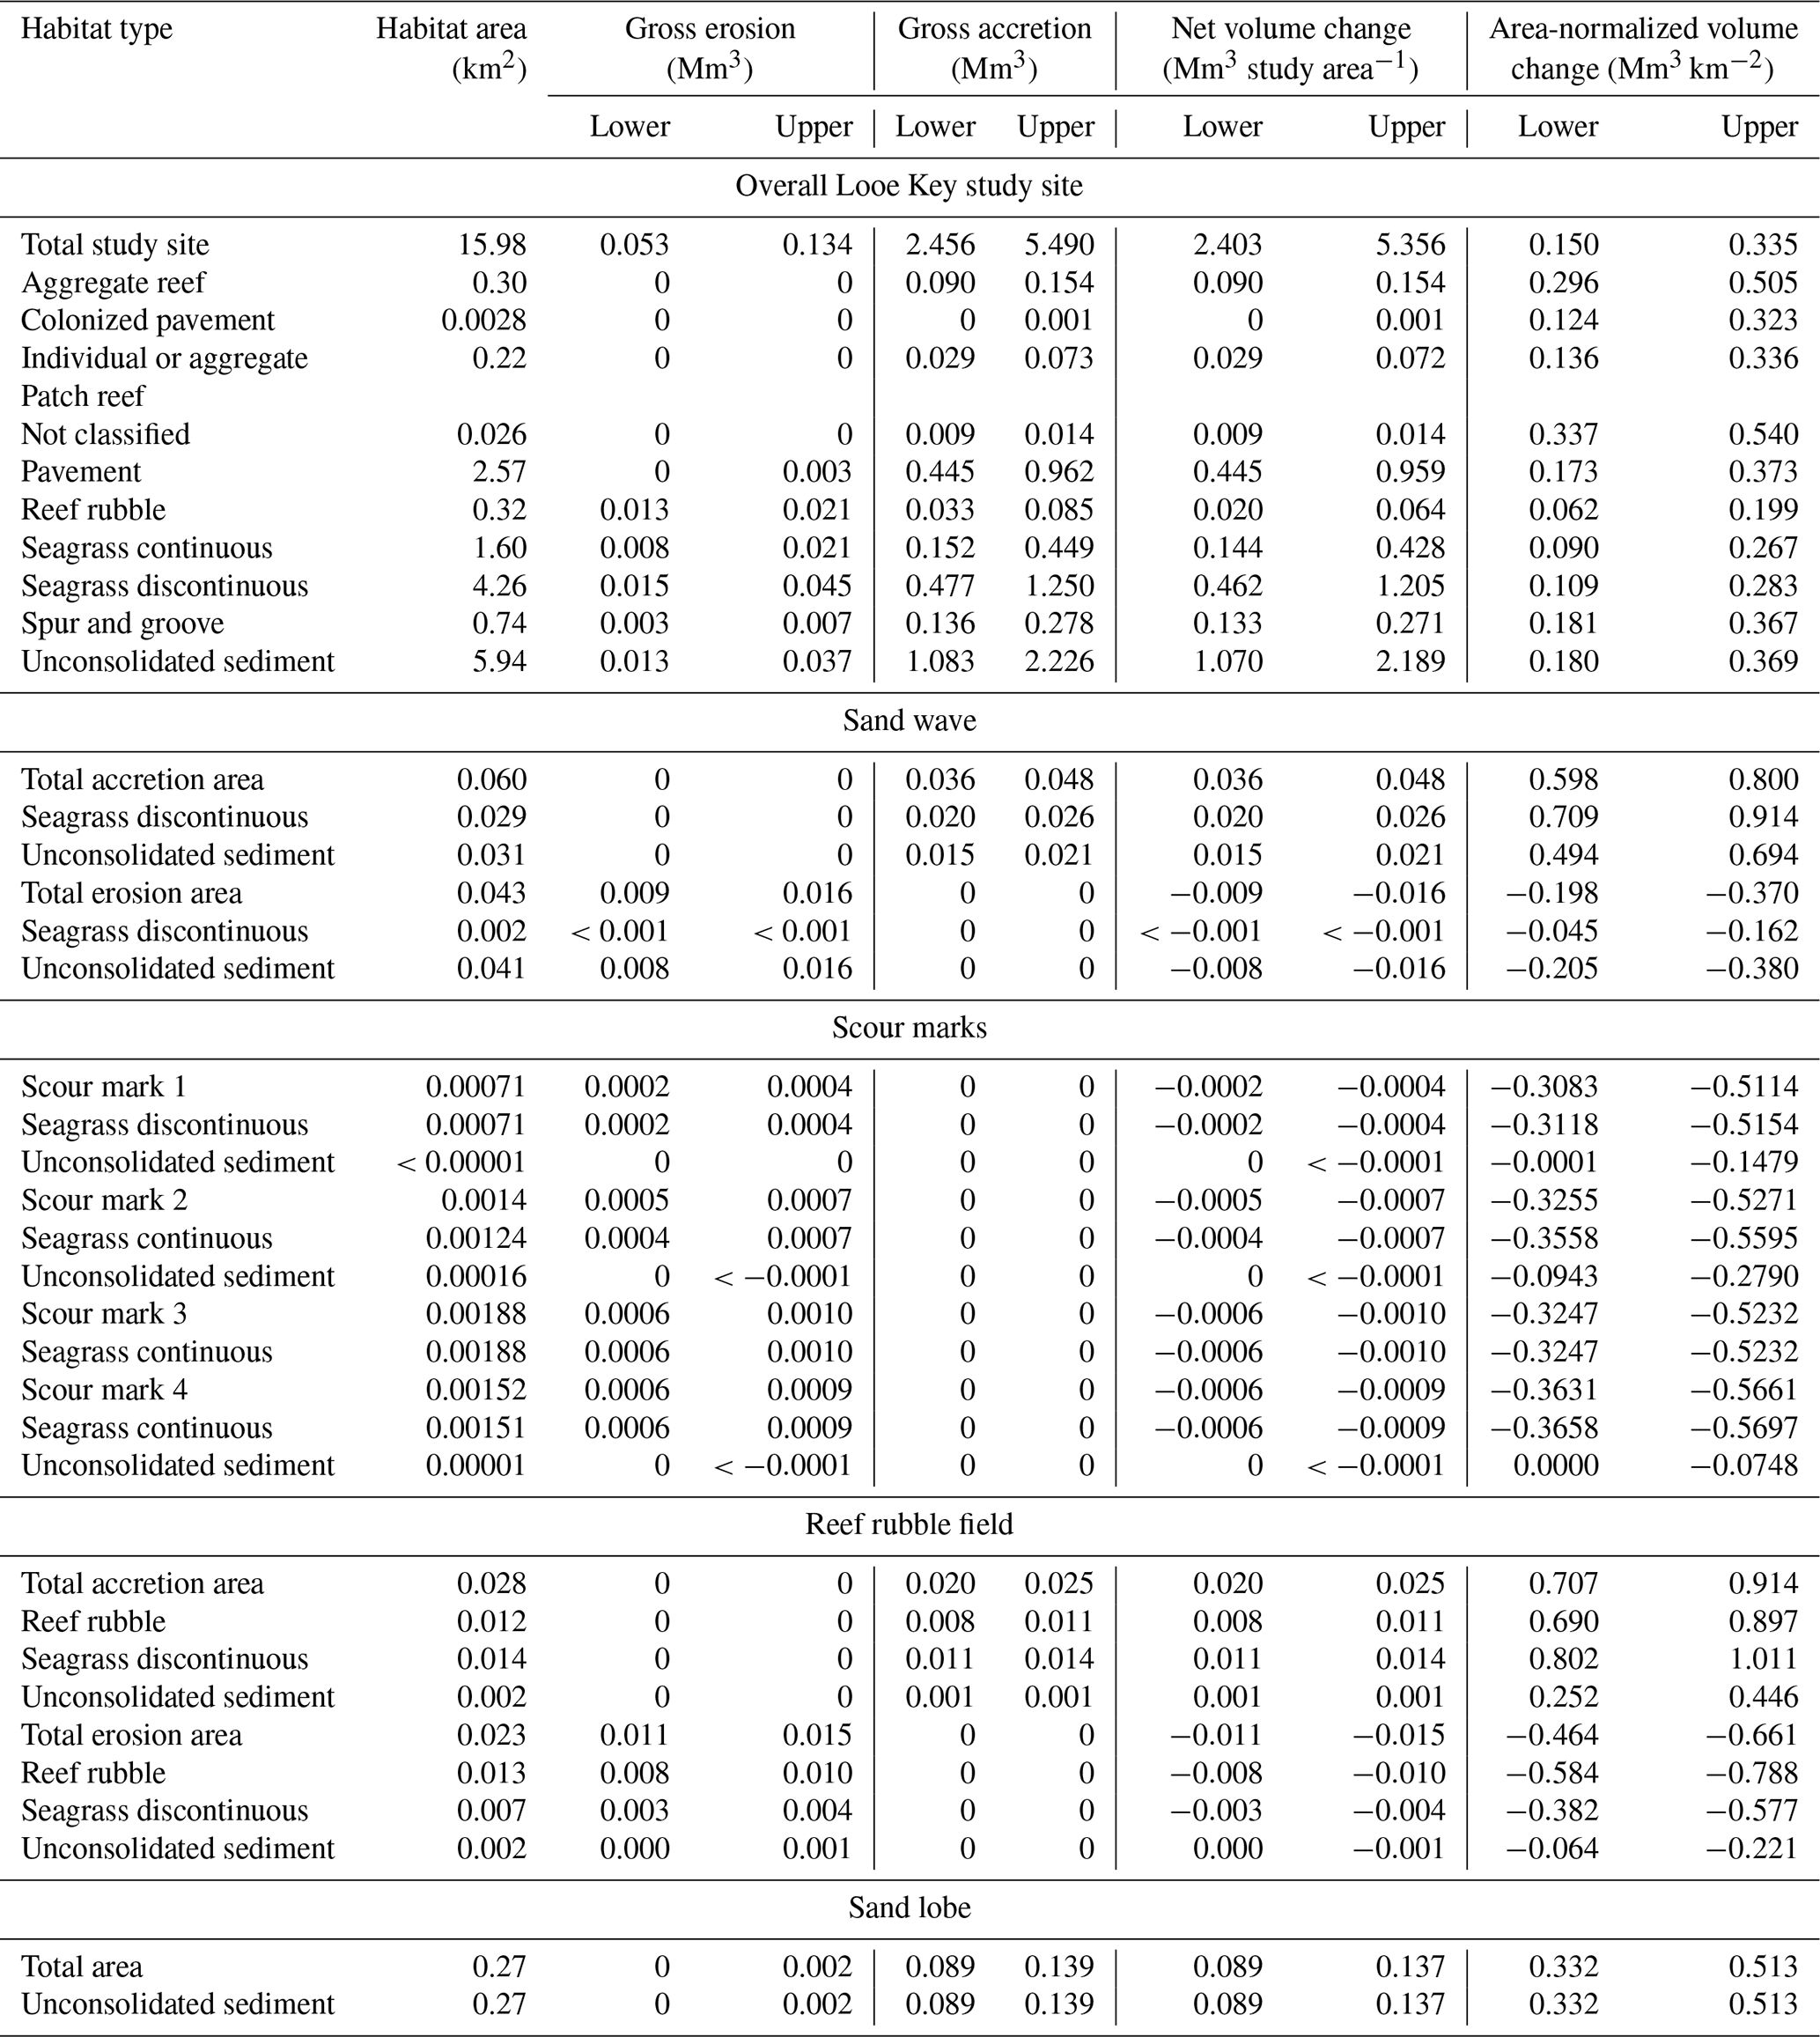
Elevation change results for 4 007 961 point locations at LKR between 2016 and 2017 (approximately 13.5 months before and 3 to 6 months after Hurricane Irma) and between 2017 and 2019 (from approximately 3 to 16.5 months after Hurricane Irma) are shown in Fig. 4a and b, respectively. Mean elevation change for the total LKR study site from 2016–2017 was 0.34 m ±0.21, and all 10 habitat types (Fig. 4c) showed increases in mean elevation (accretion) ranging from 0.20 to 0.54 m (Table 2). The largest mean elevation changes were associated with the aggregate reef (mean 2016 elevation −13.41 m) and not classified (mean 2016 elevation −15.84 m) habitat types. The smallest mean elevation changes were associated with reef rubble (mean 2016 elevation −6.19 m) and seagrass continuous (mean 2016 elevation −7.69 m) habitats (Table 2). Only 4 % of all data points showed losses in elevation (erosion) ranging from −0.01 to −0.44 m, while 96 % of all data points showed gains in elevation ranging from 0.31 to 0.55 m across all habitats. Pearson correlation analysis showed a very strong positive correlation (r(8)=0.96, p=0.000) and linear relationship (r2=0.92, Fig. 5a) between 2016 mean habitat water depth (estimated from mean elevation) and mean elevation change; mean elevation gains increased significantly with increasing water depth (i.e., decreasing seafloor elevation). Net volume change was up to 5.36 Mm3 over the total 15.98 km2 Looe Key study site, and all habitat types showed increases in net volume (accretion) with upper-bound ranges from 0.001 to 2.19 Mm3 (Table 3). The largest net volume changes were associated with habitats covering the largest areal extent of the study area including pavement, discontinuous seagrass, and unconsolidated sediment. Pearson correlation analysis also indicated a very strong positive correlation (r(8)=0.99, p=0.000) and linear relationship (r2=0.92, Fig. 5b) between 2016 mean habitat water depth and area-normalized volume change; area-normalized volume gains increased significantly with increasing water depth. The largest area-normalized volume changes of 0.51 and 0.54 Mm3 were observed for aggregate reef and not classified habitats, respectively, and the smallest changes of 0.20 to 0.27 Mm3 were observed for reef rubble and continuous seagrass habitats (Table 3), consistent with mean elevation changes for those habitats. Mean elevation change values of the 2016–2017 elevation change dataset that was clipped to an area of 15.98 km2 and used for this analysis were within ±0.01 m, and area-normalized volumes were within ±0.016 Mm3 km−2 among values calculated in the original 19.71 km2 published dataset (unclipped) for the overall study site and all habitats (Yates et al., 2019a).
Table 3Compiled volume change data by habitat type for all study areas during the 2016 to 2017 study period (storm period).
“Upper” and “lower” headings refer to the upper and lower bounds of volume change based on total RMSE (root mean square error). Lower bounds use total RMSE as a plane height in calculating volume.
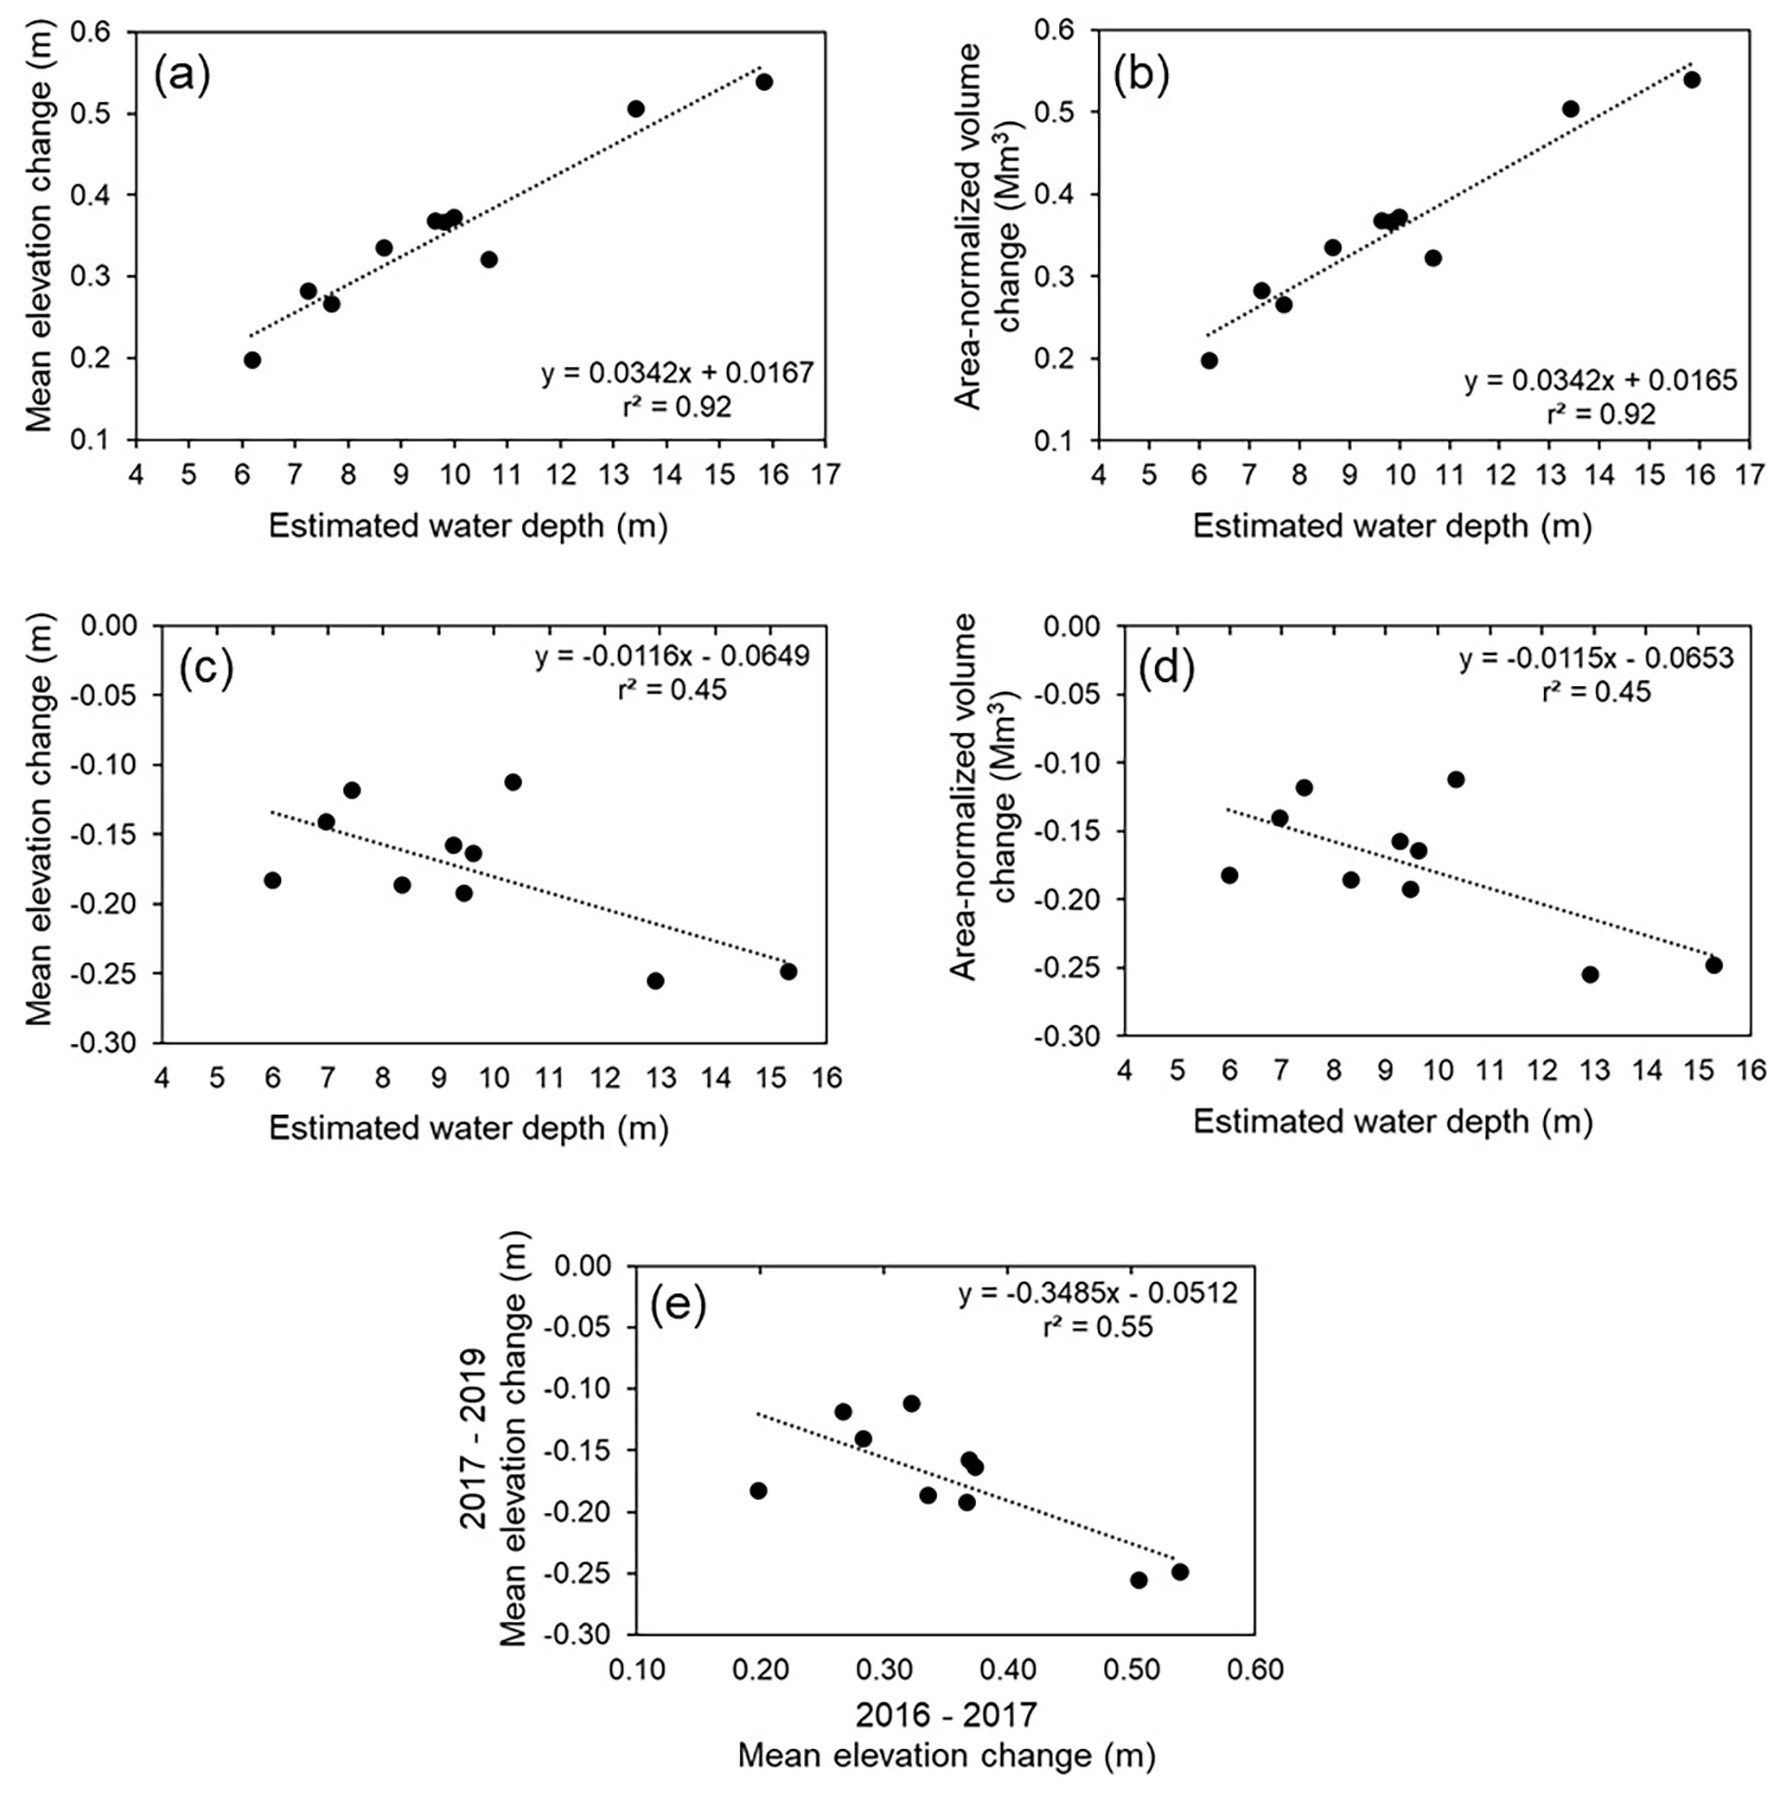
Figure 5Linear relationships between elevation change, volume change, and water depth. Linear relationships and coefficients of determination between (a) mean elevation change, (b) mean area-normalized volume change, and estimated 2016 mean water depth for seafloor habitats of the Looe Key study site between 2016 and 2017. Linear relationships and coefficients of determination between (c) mean elevation change, (d) mean area-normalized volume change, and estimated 2017 mean water depth for seafloor habitats of the Looe Key study site between 2017 and 2019 (a, b). Linear relationship between 2017–2019 mean elevation change and 2016–2017 mean elevation change (e).
Mean elevation change during a 13-month time period between December 2017 and June 2019 (up to approximately 16.5 months after Hurricane Irma) was m, and all habitat types showed losses in mean elevation ranging from −0.11 to −0.25 m (Fig. 4b, Table 2). The largest mean elevation changes were associated with aggregate reef and not classified habitat types, and the smallest changes were associated with colonized pavement and continuous seagrass habitats (Table 2). Only 5 % of all data points showed gains in elevation with mean accretion ranging from 0.04 to 0.19 m, while 95 % of all data points showed losses in elevation with mean erosion ranging from −0.13 to −0.27 m across all habitat types. Pearson correlation analysis indicated a moderate correlation (, p=0.035) and linear relationship (r2=0.45, Fig. 5c) between estimated 2017 mean habitat water depth and mean elevation change; mean elevation loss generally increased with increasing water depth. Net volume change was up to −2.46 Mm3 over the total 15.98 km2 Looe Key study site and area-normalized volume change was −0.15 Mm3km−2. Losses in net volume up to −0.931 Mm3 (erosion) were observed across all habitat types (Table 4).
Table 4Compiled volume change data by habitat type for all study areas during the 2017 to 2019 study period (post-storm re-equilibration period).
“Upper” and “lower” headings refer to the upper and lower bounds of volume change based on total RMSE (root mean square error).
The largest net volume changes were associated with habitats covering the largest areal extent of the study area including pavement, discontinuous seagrass, and unconsolidated sediment. Pearson correlation analysis indicated a moderate correlation (, p=0.035) and linear relationship (r2=0.45, Fig. 5d) between 2017 mean habitat water depth and area-normalized volume change; area-normalized volume losses generally increased with increasing water depth. The largest area-normalized volume changes were observed for aggregate reef and not classified habitats at −0.254 and −0.247 Mm3 km−2, respectively, and the smallest changes were observed for colonized pavement and continuous seagrass habitats at −0.112 to −0.118 Mm3 km−2, respectively (Table 4), consistent with mean elevation changes for those habitats. Pearson correlation analysis indicated a strong negative correlation (, p=0.014) and linear relationship (r2=0.55, Fig. 5e) between 2017–2019 mean habitat elevation change and 2016–2017 mean habitat elevation change; mean elevation losses during 2017 to 2019 were significantly greater in habitats with larger mean elevation gains during 2016 to 2017. Mean elevation change (loss) during 2017 to 2019 was 35 to 55 % of the mean elevation change (gain) during 2016 to 2017 for all habitats except for reef rubble, which was 92 % and had the shallowest mean depth (6.0 m) of all habitats.
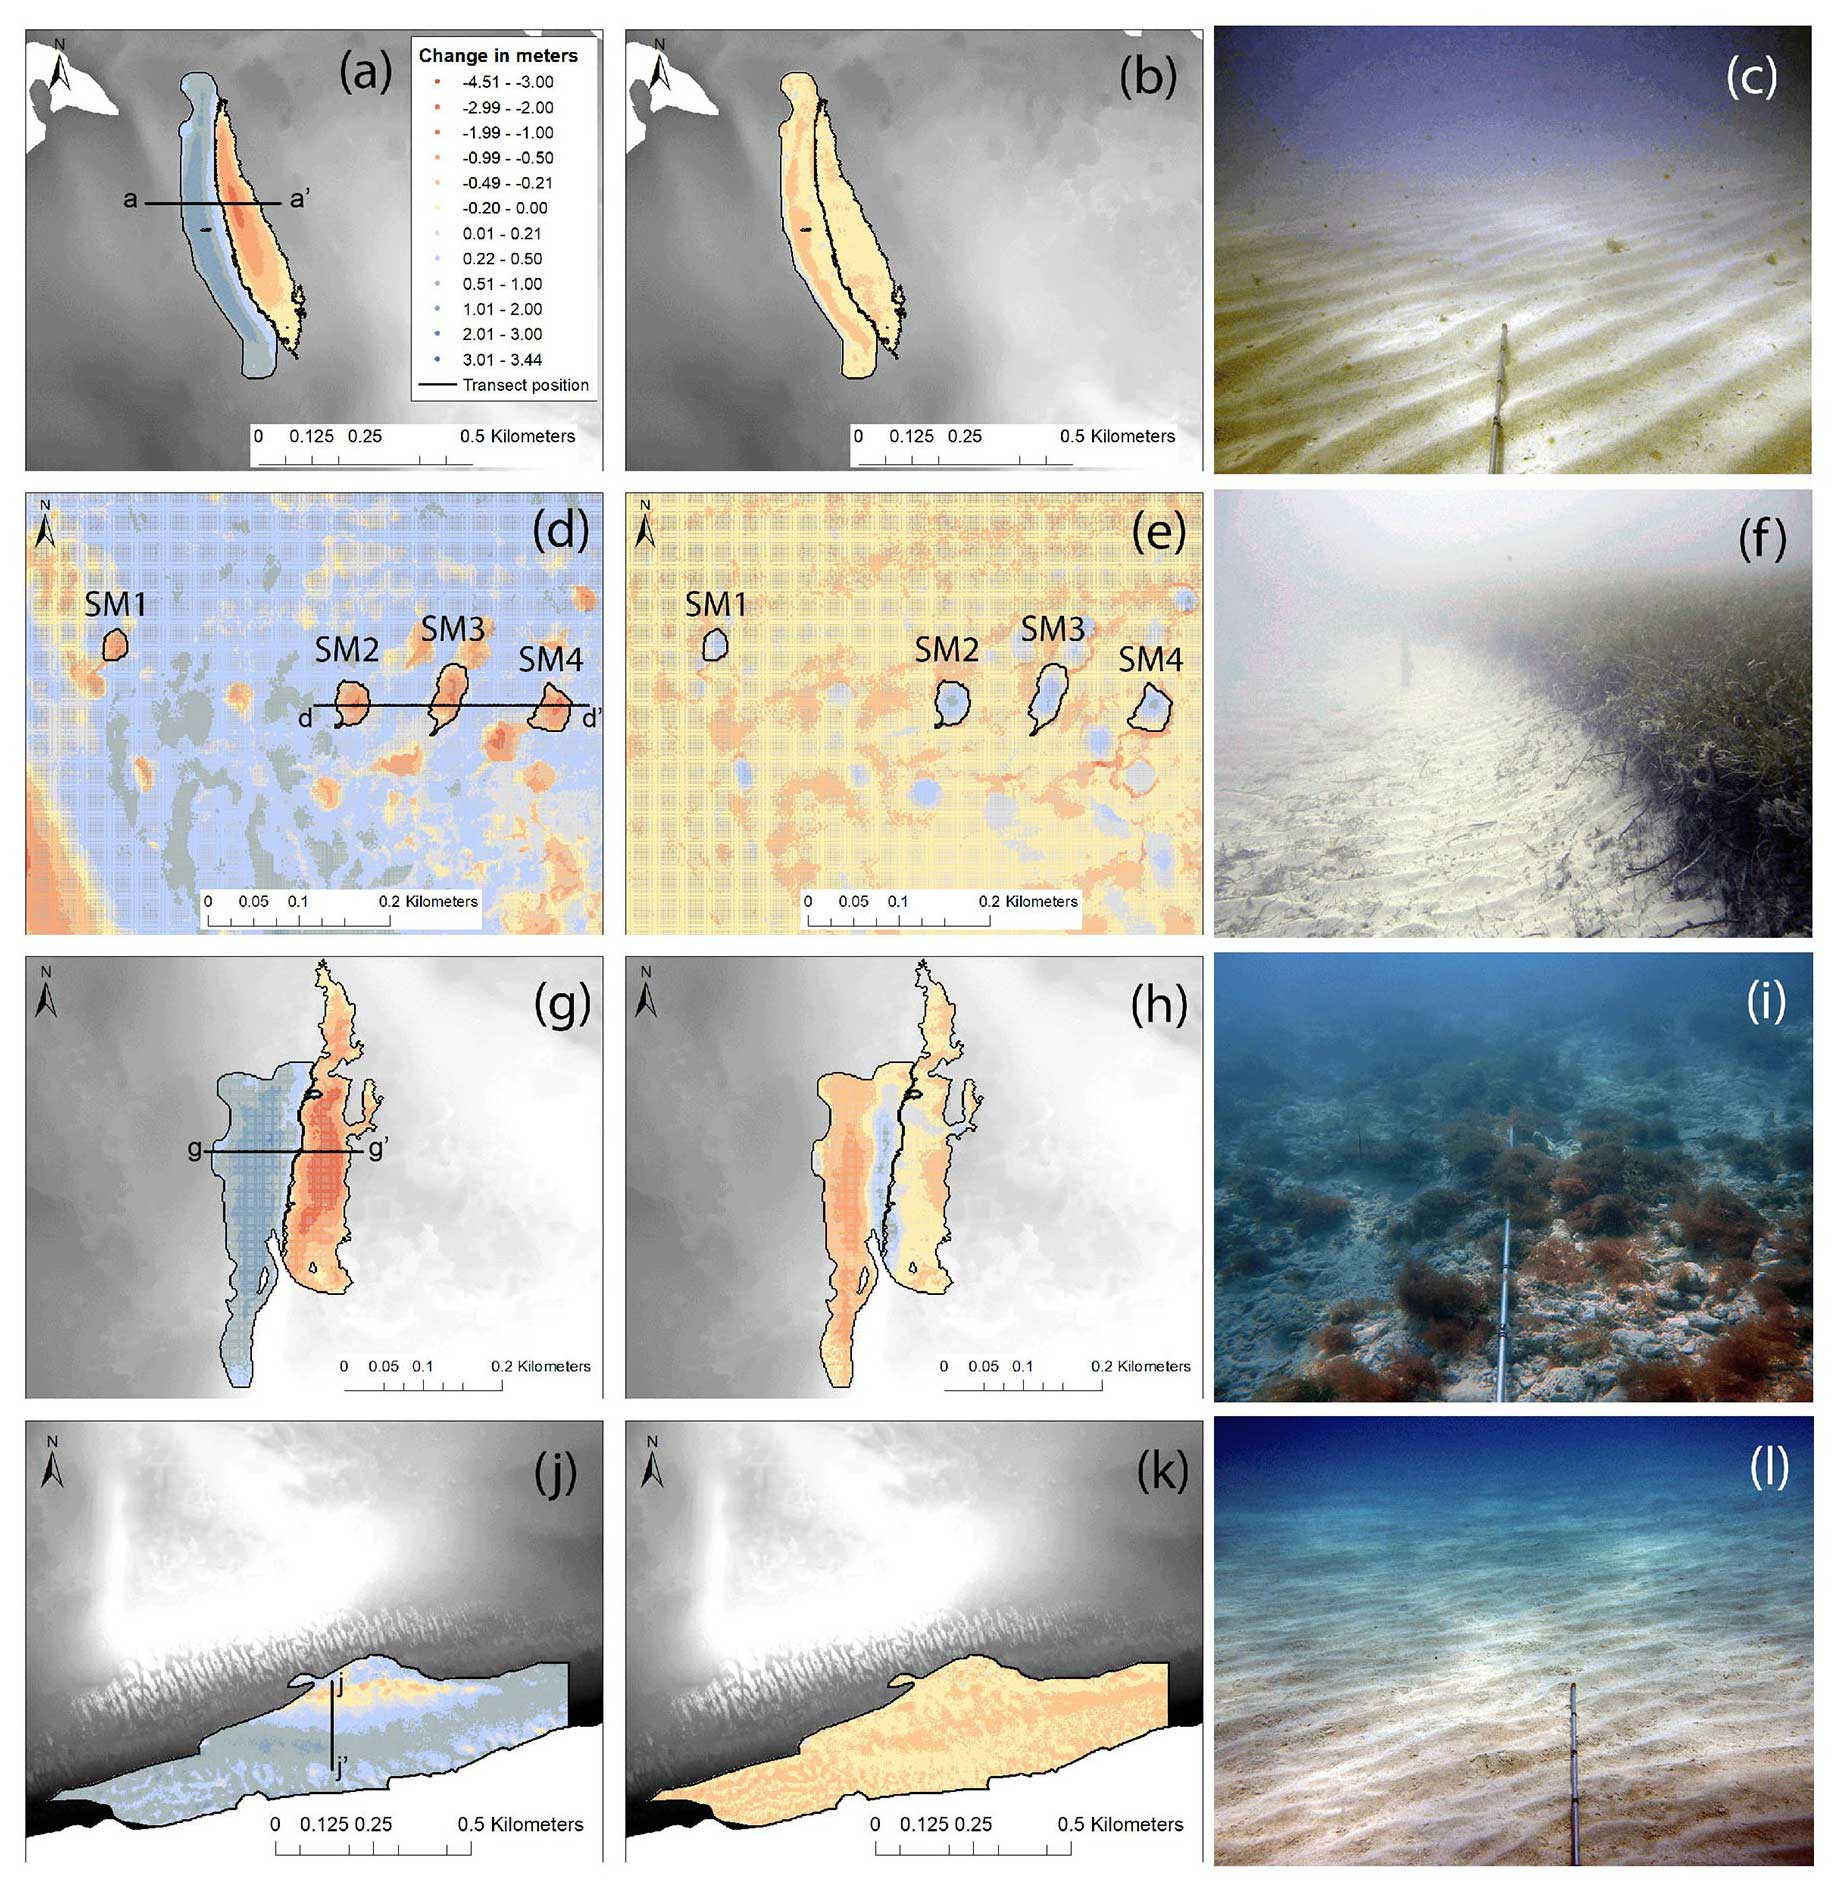
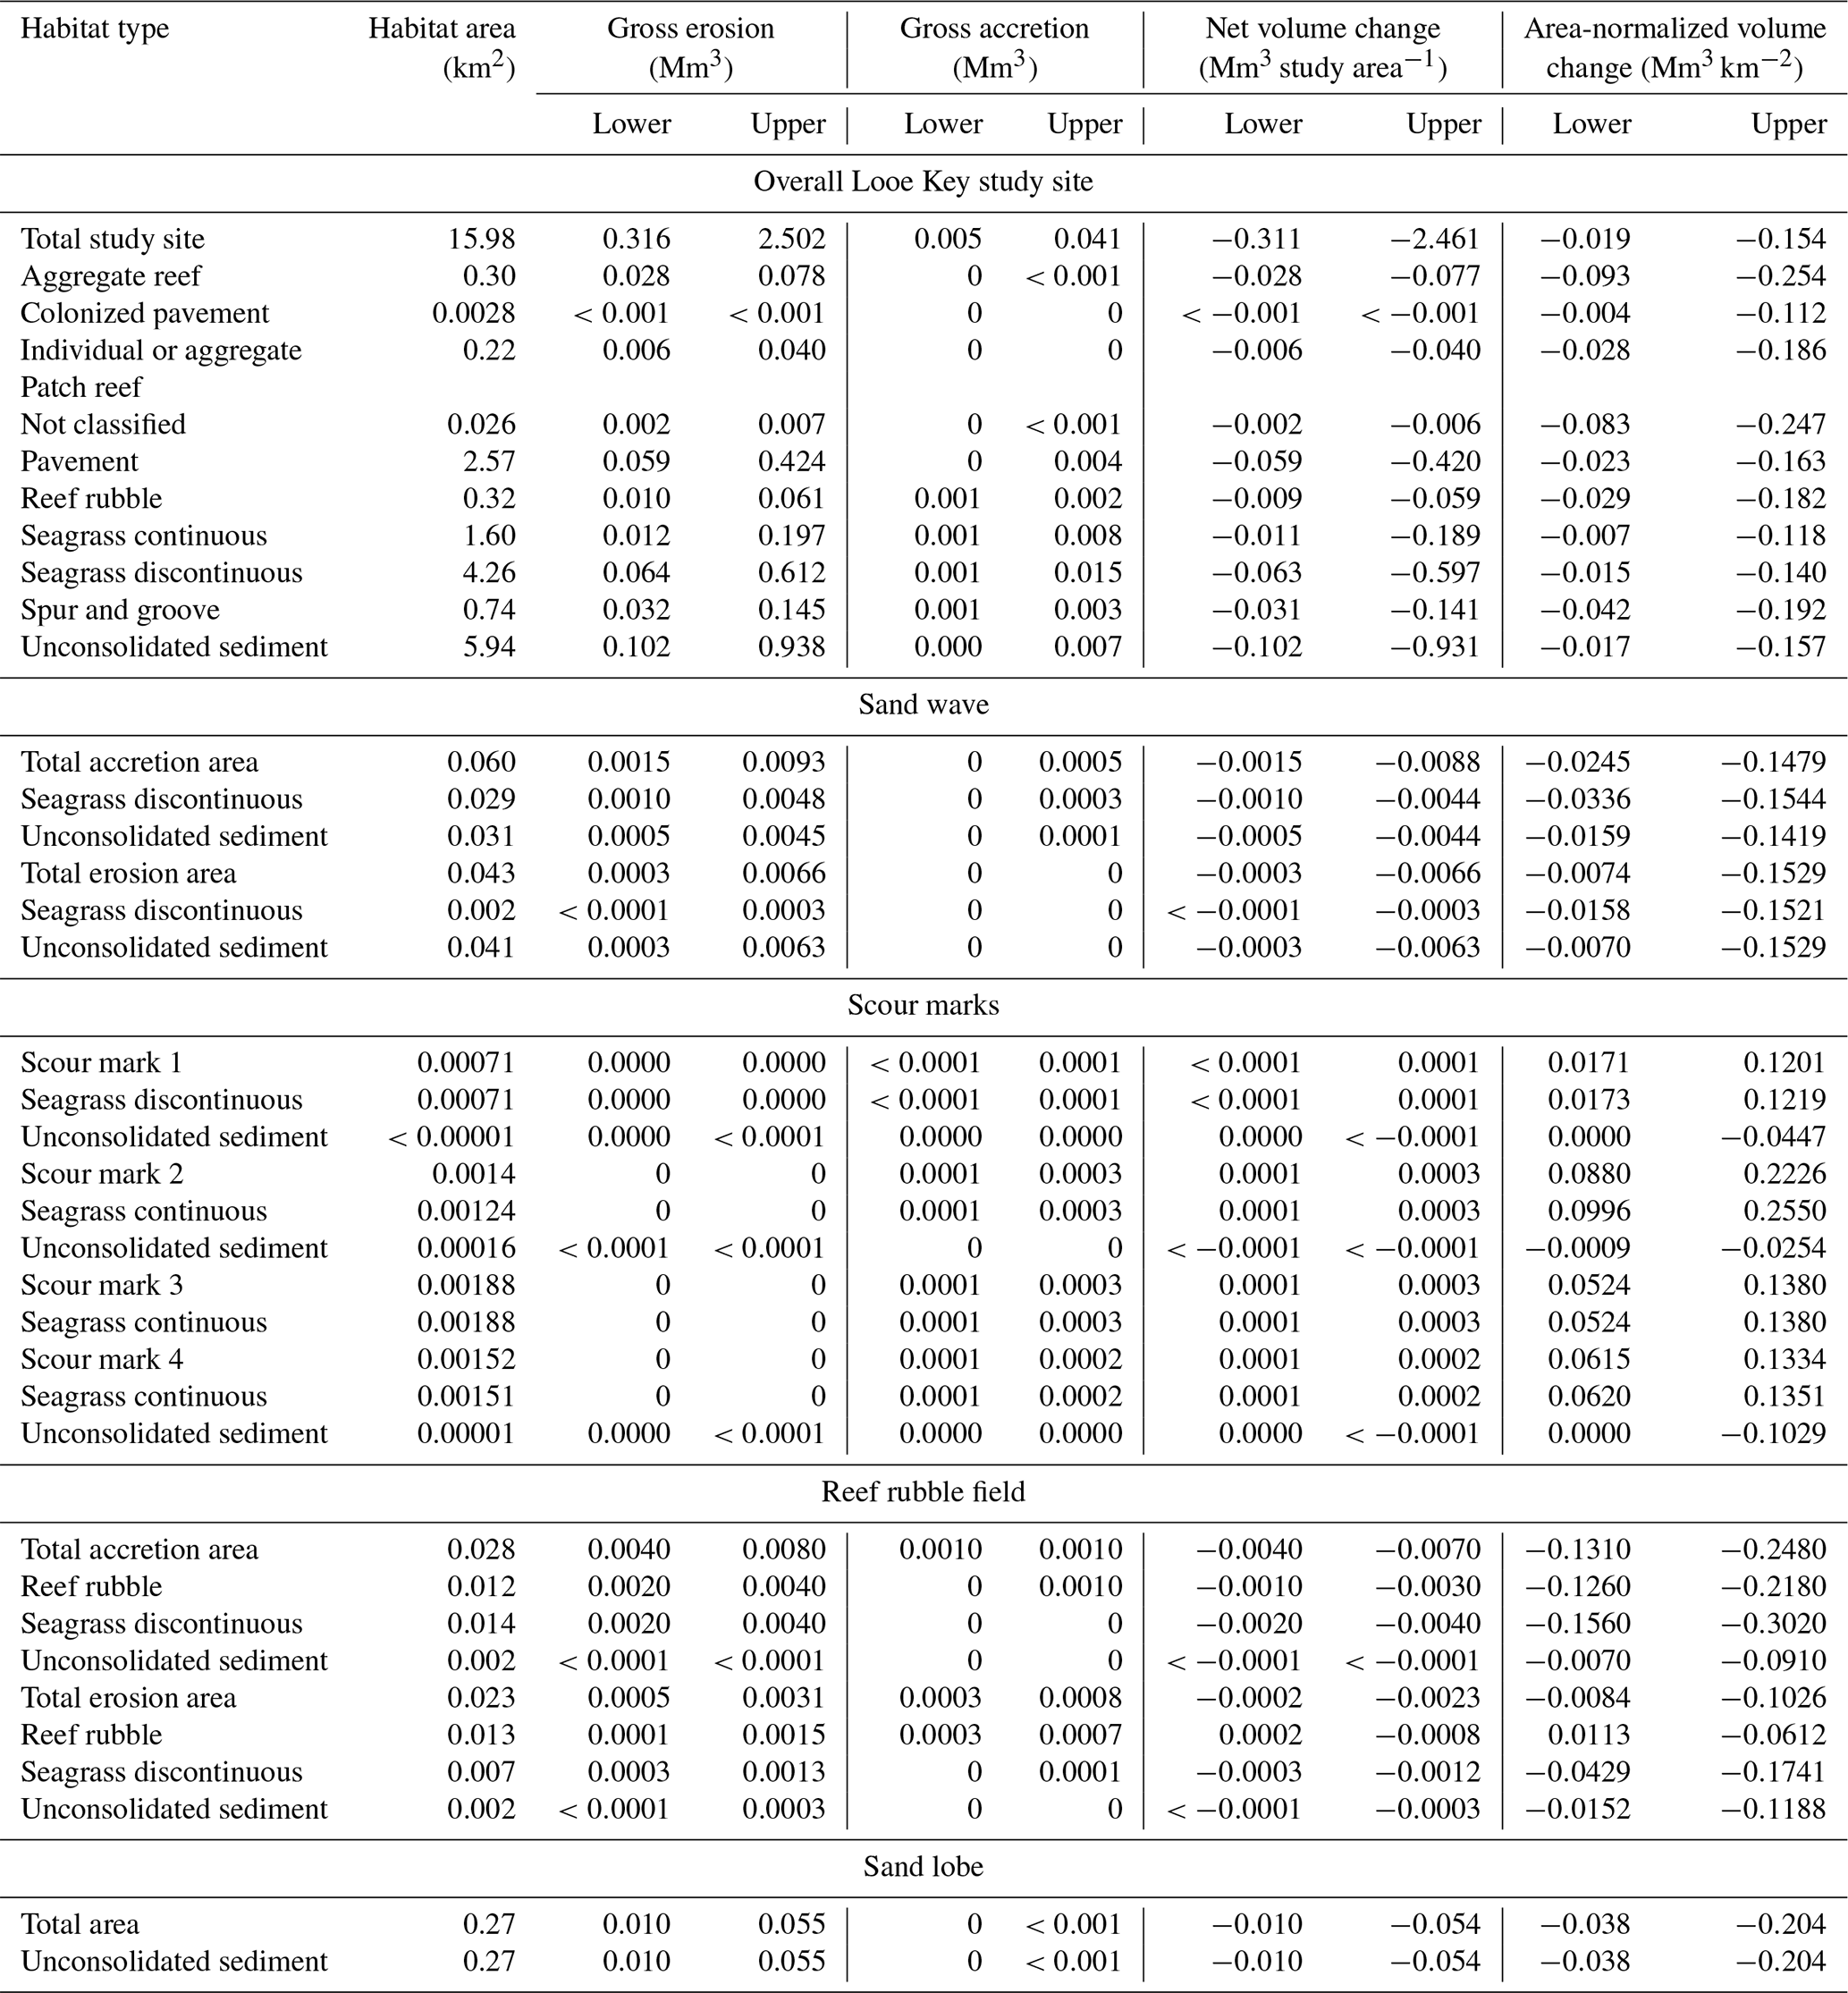
Figure 6Elevation change data and transect positions for each geomorphic feature sub-area. Geomorphic features included a sand wave (a, b, c), scour marks (d, e, f), western rubble field (g, h, i), and sand lobe sub-areas (j, k, l). These feature locations and corresponding habitats are also shown in Fig. 4. Elevation change from 2016 to 2017 (a, d, g, j) and 2017 to 2019 (b, e, h, k), as well as corresponding reconnaissance imagery (c, f, i, l). Transect positions are indicated by black lines and lowercase letters in the elevation change panels (see also Fig. 7). Scour marks in panels (d) and (e) are labeled SM1 through 4. Photo credit: Mitch Lemon, Cherokee Nations System Solutions for the US Geological Survey.
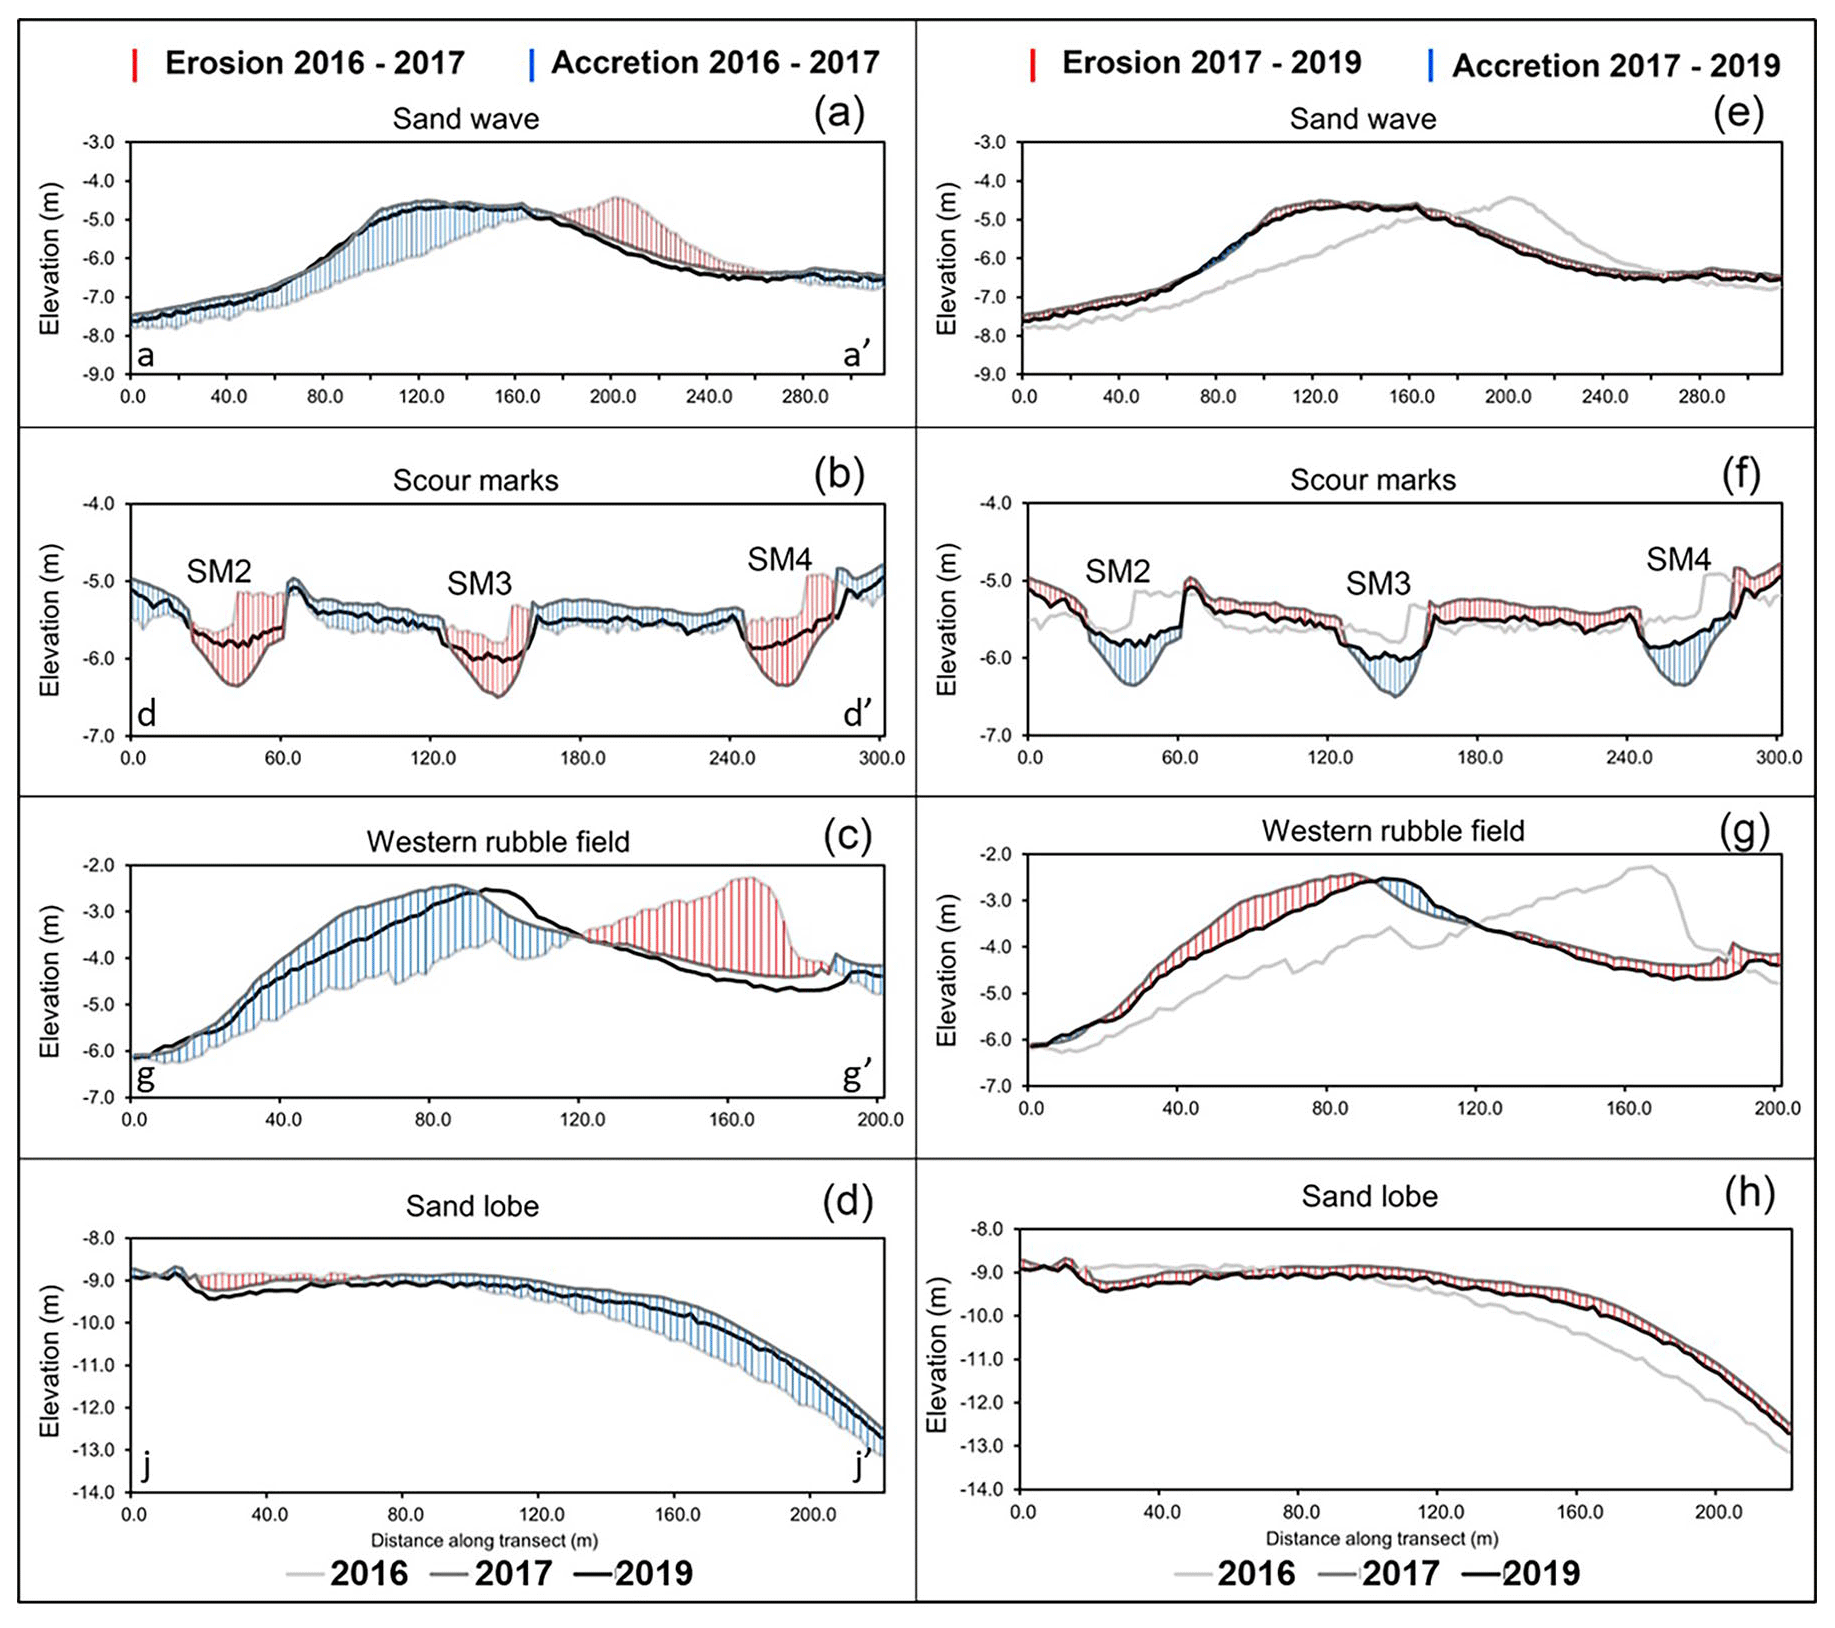
Figure 7Elevation transects across geomorphic features in 2016, 2017, and 2019. Geomorphic features included a sand wave (a, e), scour marks (b, f), western reef rubble field (c, g), and a sand lobe (d, h). Lowercase letters indicate direction of transects as shown in Fig. 6. Vertical red lines indicate areas of erosion, and vertical blue lines indicate areas of accretion between (a–d) 2016 and 2017 (before and after Hurricane Irma) and between (e–f) 2017 and 2019. SM: scour mark.
3.2 Geomorphic feature analyses
Large-scale geomorphic features that were tens to hundreds of square meters in areal extent and showed extensive erosion and/or accretion with elevation changes greater than 0.5 m were observed between 2016 and 2017 (Figs. 6 and 7). Examples of these features included migration of a sand wave in the back-reef area of Looe Key reef indicated by adjacent areas of erosion and accretion. Several scour features developed in discontinuous seagrass and unconsolidated sediment habitats of the Looe Key back reef, indicated by areas of erosion that appear as pits. Rubble fields within and near the Looe Key SPA were displaced, as indicated by adjacent areas of accretion and erosion. Substantial deposition of sediments occurred along a sand lobe at the base of the Looe Key Reef spur-and-groove habitat.
3.2.1 Sand wave
Migration of a sand wave was observed in the back-reef area of Looe Key Reef between 2016 and 2017, with minor erosion of this feature occurring between 2017 and 2019 (Fig. 6a, b, and c). The sand wave was approximately 733 m long and 104 m wide at its widest point in 2017, 2 m in height from the crest to base on the deepest (western) edge, with average water depth of approximately 5.6 m. Transect elevation profiles showed the location of this feature in 2016, westward migration of approximately 78 m (crest to crest) in 2017, and minor erosion in 2019 (Fig. 7a). An accretion of 0.060 km2 included approximately 50 % discontinuous seagrass and 50 % unconsolidated sediment habitat.
Between 2016 and 2017, mean elevation change of the accretion area (2017 location of the sand wave) was 0.79 m (Table 2) with a maximum elevation gain at the crest of 1.84 m. An adjacent area of erosion was approximately 630×122 m in length and width (0.043 km2) and included approximately 5 % discontinuous seagrass and 95 % unconsolidated sediment. Mean elevation change of the erosion area was −0.36 m (Table 2) with a maximum elevation loss of −1.23 m near the 2016 location of the sand wave crest. Total net volume change for the accretion area of the feature was 0.048 Mm3 and area-normalized volume change was 0.800 Mm3 km−2 (Table 3). Mean elevation change and area-normalized volume change were greatest within the discontinuous seagrass habitat (0.90 m and 0.914 Mm3 km−2, respectively), approximately 2.7 times greater than mean elevation change and area-normalized volume change for the overall Looe Key study site. It accounted for 55 % of total net volume gain, indicating burial of seagrass habitat during migration of the sand wave. Net volume change of the erosion area was approximately −0.016 Mm3 and area-normalized volume change −0.37 Mm3 km−2, with 98 % of net volume change associated with erosion of unconsolidated sediment habitat (Table 3).
Between 2017 and 2019, the sand wave (accretion area) showed mean elevation and net volume change of approximately −0.15 m and approximately −0.009 Mm3, respectively (Tables 2, 4 and Fig. 6b). Similar mean elevation change values were observed for discontinuous seagrass and unconsolidated sediment habitats associated with the feature, and net volume change for each habitat was approximately 50 % of the total net volume change (Table 4). Area-normalized volume change was similar for the total area of the sand wave and the sub-areas within it, including discontinuous seagrass and unconsolidated sediment habitats, ranging from approximately −0.148 to −0.154 Mm3 km−2. The adjacent erosion area (original 2016 location of the sand wave) also showed a mean elevation change of −0.15 m with similar values for the associated discontinuous seagrass and unconsolidated sediment habitats. Net volume change of the erosion area was approximately −0.007 Mm3, with approximately 95 % of this loss associated with unconsolidated sediment (Table 4). Area-normalized volume change was also consistent across the total erosion feature area, discontinuous seagrass, and unconsolidated sediment habitats at −0.15 Mm3 km−2.
Figure 8Cardinal orientation imagery (a, b, d, and e represent north, west, east, and south, respectively) and elevation change (c) at a scour mark location used to validate benthic features observed in elevation change data. East and west arrows show the boundaries between seagrass beds and sand flats in the elevation change data (c) and imagery (b, d). High erosion was noted between 2016 and 2017 on the sand flat (western) side of the habitat transition and minimal accretion was noted on the seagrass bed (eastern) side of the habitat transition. Photo credit: Mitch Lemon, Cherokee Nations System Solutions for the US Geological Survey.
3.2.2 Scour marks
Development of scour marks was observed in seagrass and unconsolidated sediment habitats in the back-reef area of Looe Key Reef between 2016 and 2017 (Fig. 6d, e, and f). These features ranged from approximately 30 to 60 m in length and width with average depths of approximately 5.7 to 7.5 m in 2017. Visual validation of select scour features indicated they developed between 2016 and 2017 at the edges of seagrass beds where small (approximately 0.5 m) ledges marked the transition between the slightly higher elevation of seagrass beds and lower elevation of adjacent unconsolidated sediment (Fig. 6f). Transect analyses showed considerable erosion of the western boundaries of seagrass beds, development of pit-like features up to approximately 20 m in diameter and 1 m deep, transport of sediment westward, and burial of seagrass between scour features (Fig. 7b). Scour marks showed some infilling between 2017 and 2019. Validation imagery showed exposed rhizomatous growth at the western edges of seagrass beds (Fig. 8).
Elevation and volume change analyses were performed on four examples of these features (Fig. 6d and e). Scour mark 1 was 714 m2 with 99 % of the area consisting of discontinuous seagrass. Between 2016 and 2017, mean elevation change was −0.49 m (Table 2) with a maximum observed change of −1.09 m. Net volume change was less than −0.001 Mm3, and area-normalized volume change was approximately −0.51 Mm3 km−2 (Table 3). Between 2017 and 2019, this feature showed accretion with mean elevation change of 0.10 m and a net volume change of less than 0.001 Mm3 (Tables 2 and 4). Area-normalized volume change was approximately 0.12 Mm3 km−2. Scour mark 2 was 1400 m2, with 88 % of the area consisting of continuous seagrass and 12 % unconsolidated sediment. Between 2016 and 2017, mean elevation change was −0.50 m (Table 2) with maximum observed change of −1.28 m. Net volume change was less than −0.001 Mm3 and area-normalized volume change was approximately −0.53 Mm3 km−2 (Table 3). A total of 94 % of net volume change was associated with continuous seagrass habitat, which also had the highest area-normalized volume change of −0.56 Mm3 km−2. Between 2017 and 2019, this feature showed accretion with mean elevation change of 0.20 m and net volume change of 0.0003 Mm3 (Tables 2 and 4). Continuous seagrass showed an increase in mean elevation (0.24 m) and net volume (0.0003 Mm3), while unconsolidated sediment showed a decrease in mean elevation (−0.05 m) and net volume (less than −0.0001 Mm3). Area-normalized volume change across the entire scour mark was approximately 0.22 Mm3 km−2. Scour mark 3 was 1882 m2 with 100 % of the area consisting of continuous seagrass. Between 2016 and 2017, mean elevation change was −0.50 m with a maximum observed change of −1.25 m (Table 2). Net volume change was −0.001 Mm3 and area-normalized volume change was approximately −0.52 Mm3 km−2 (Table 3). Between 2017 and 2019, this feature showed accretion with mean elevation change of 0.12 m and net volume change of 0.0003 Mm3 (Tables 2 and 4). Area-normalized volume change was approximately 0.14 Mm3 km−2. Scour mark 4 was 1520 m2 with 99 % of the area consisting of continuous seagrass and 1 % unconsolidated sediment. Between 2016 and 2017, mean elevation change was −0.54 m with a maximum observed change of −1.29 m (Table 2). Net volume change was −0.0009 Mm3 and area-normalized volume change was approximately −0.57 Mm3 km−2 (Table 3). A total of 99 % of net volume change was associated with continuous seagrass habitat, which also had the highest area-normalized volume change of −0.57 Mm3 km−2. Between 2017 and 2019, this feature showed accretion with mean elevation change of 0.12 m and net volume change of −0.0002 Mm3 (Tables 2 and 4). Area-normalized volume change was approximately 0.13 Mm3 km−2. More than 99 % of net volume change was associated with continuous seagrass habitat, which also had the highest area-normalized volume change of approximately 0.14 Mm3 km−2.
3.2.3 Rubble fields
Migration of reef rubble fields was observed in areas north and northeast of Looe Key Reef between 2016 and 2017. The largest of these features was approximately 418 m long and 122 m wide at its widest point in 2017, 3 m in height from the crest to base on the deepest (western) edge, with average water depth of approximately 3.3 m (Fig. 6g, h, and i). Transect elevation profiles showed the location of this feature in 2016, westward migration of approximately 80 m (crest to crest) in 2017, and minor eastward migration of 8 m (crest to crest) in 2019 (Fig. 7c). The accretion area of this feature covered an area of about 0.03 km2 including approximately 43 % reef rubble, 49 % discontinuous seagrass, and 9 % unconsolidated sediment. Between 2016 and 2017, mean elevation change of the accretion area (2017 location of the rubble field) was 0.89 m (Table 2) with a maximum elevation gain of 2.21 m. Total net volume change was 0.025 Mm3 and area-normalized volume change was 0.914 Mm3 km−2, with discontinuous seagrass accounting for 54 % of net volume change, indicating burial of seagrass during migration of the rubble field (Table 3). The highest mean elevation and area-normalized volume changes were also associated with discontinuous seagrass habitat. An area of erosion (0.023 km2) was observed in 2017 at the original 2016 location of the rubble field that was approximately 428 m long and 78 m wide including 58 % reef rubble, 31 % discontinuous seagrass, and 11 % unconsolidated sediment. Mean elevation change of the erosion area between 2016 and 2017 was −0.63 m (Table 2) with a maximum elevation loss of −2.11 m. Total net volume change was approximately −0.015 Mm3 and area-normalized volume change was −0.661 Mm3 km−2 with 69 % of net volume change associated with reef rubble (Table 3). The highest mean elevation and area-normalized volume changes were also associated with reef rubble.
Between 2017 and 2019, the rubble field (accretion area) showed mean elevation change of −0.24 m, net volume change of −0.007 Mm3, and area-normalized volume change of −0.248 Mm3 km−2 (Tables 2 and 4). Discontinuous seagrass showed the greatest loss in mean elevation and area-normalized volume change and accounted for 59 % of net volume change. The adjacent erosion area (original 2016 location of the rubble field) showed a mean elevation change of −0.10 m (Table 2) with a maximum elevation loss of −0.52 m. Total net volume change was approximately −0.002 Mm3 and area-normalized volume change was −0.103 Mm3 km−2, with 53 % of net volume change associated with discontinuous seagrass (Table 4). The highest mean elevation and area-normalized volume changes were also associated with discontinuous seagrass. Mean elevation and volume losses generally decreased with increasing mean habitat depth in the erosion area (Tables 2 and 4).
3.2.4 Sand lobe
Substantial accretion was observed along a sand lobe located near the base of the fore-reef slope of Looe Key Reef between 2016 and 2017 (Fig. 6j, k, and l). This feature was approximately 1383 m long and 344 m wide (approximately 0.27 km2) at the widest point, with an average water depth of approximately 11.9 m in 2017, and included only unconsolidated sediment habitat. Between 2016 and 2017, mean elevation change was 0.51 m (Table 2) with maximum gains in elevation up to 1.5 m along the southern (seaward) downslope section of this feature and maximum elevation losses of −0.58 m along the northern landward section, nearest to the base of the fore-reef slope (Fig. 7d). Total net volume change was 0.14 Mm3 and area-normalized volume change was 0.51 Mm3 km−2 (Table 3). Between 2017 and 2019, mean elevation change was −0.20 m with maximum elevation losses up to −1.12 m (Table 2, Fig. 7d). Only 852 of 67 389 elevation points analyzed for this feature showed gains in elevation after 2017, averaging 0.05 m. Transect elevation profiles showed relatively consistent losses in elevation (erosion) across the sand lobe north to south (landward to seaward) during this time period. Total net volume change was −0.05 Mm3 and area-normalized volume change was −0.20 Mm3 km−2 (Table 4).
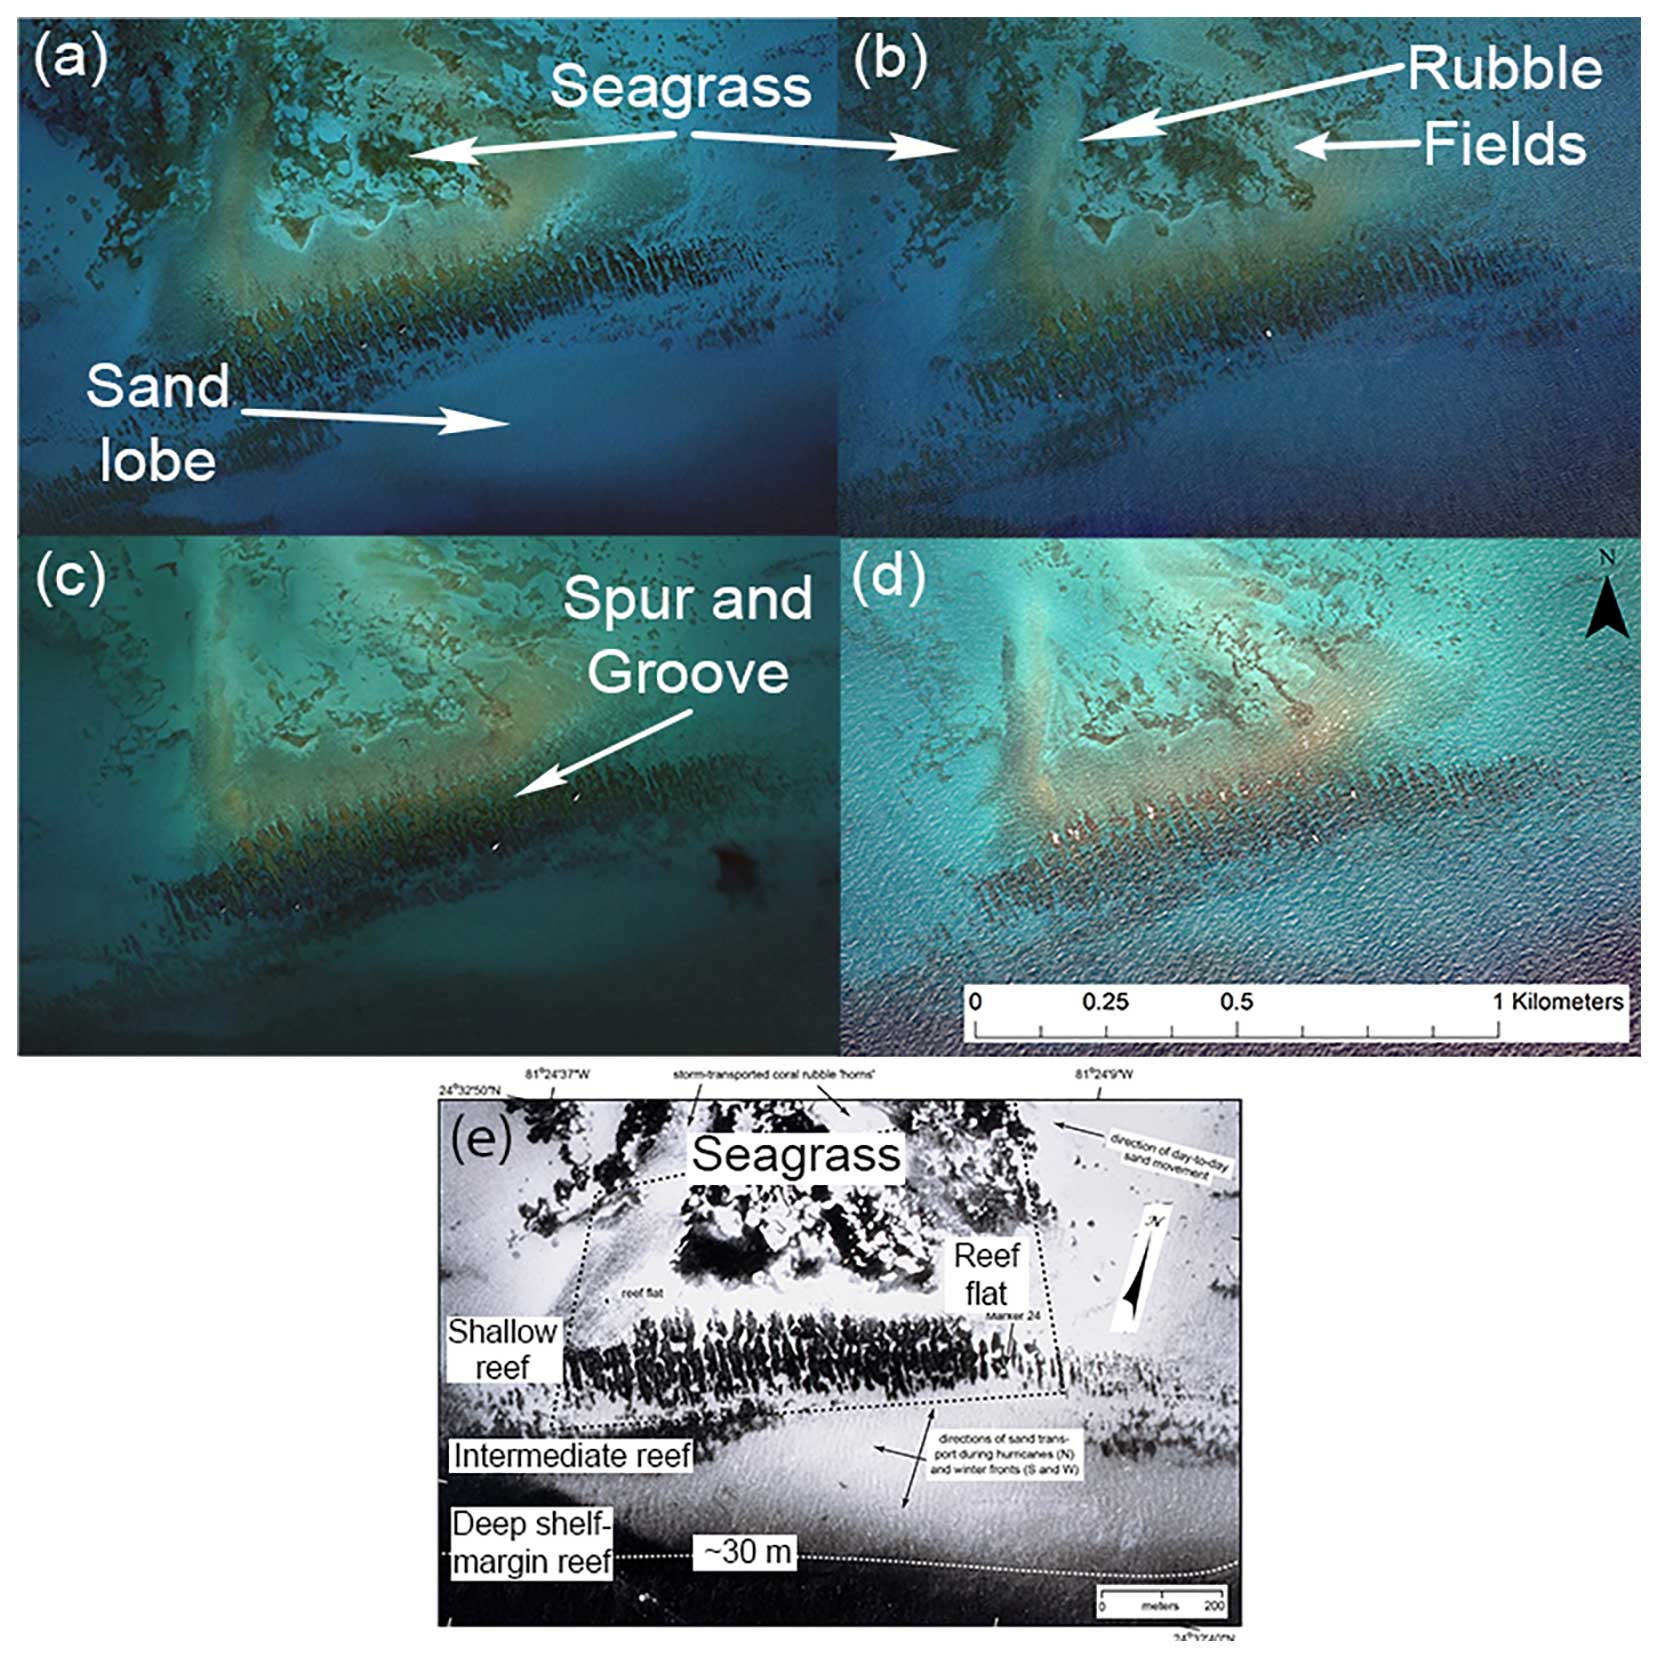
Figure 9Historical satellite and aerial imagery of Looe Key Reef. Imagery from (a) 17 December 2014 before Hurricane Irma, (b) 18 March 2017 before Hurricane Irma, (c) 30 December 2017 (3 months after Hurricane Irma), (d) 2019 (16.5 months after Hurricane Irma), and (e) 1975 (Lidz et al., 2007). Panels (a), (b), and (c) are sourced from Maxar 2023 via © Google Earth Pro 7.3.6.9345, downloaded 11 September 2023. Panel (d) is sourced from the 2019 NOAA National Geodetic Survey via NOAA Digital Coast, downloaded 11 September 2023 from https://www.fisheries.noaa.gov/inport/item/63292 (last access: 11 September 2023).
4.1 Storm impacts
There are few comprehensive assessments of the effects of major hurricanes on seafloor elevation and geomorphology on coral reefs, and no quantitative studies of reef-scale seafloor elevation change resulting from tropical storm impacts have previously been conducted in the Florida Keys. Our results showed that Hurricane Irma was primarily a depositional event that increased mean seafloor elevation and volume over a 15.98 km2 section of Looe Key Reef by 0.34 m (annualized elevation change rate of up to 247 mm yr−1) and up to 5.4 Mm3, respectively, with area-normalized volume change of approximately 0.34 Mm3 km−2. Our observations were based on elevation measurements collected 13.5 months before the storm and 3 to 6 months after the storm and therefore included any persistent change that occurred during quiescent sea-state conditions before and after the passing of Irma. However, observations during several rapid reef assessments after the storm also indicated broad-scale sediment deposition as a direct result of Hurricane Irma (Viehman et al., 2018; Walker, 2018; Wilson et al., 2020; Kobelt et al., 2020), which corroborates our findings of increased mean elevation and sediment accretion resulting from this storm event.
Furthermore, wind conditions were relatively quiescent from the 2016 lidar acquisition date up to the passing of Hurricane Irma and after the storm. Historical aerial imagery of LKR from 2014 and 18 March 2017 (3 years and 6 months prior to Hurricane Irma, respectively, Fig. 9) shows that patterns of major sedimentary features were mostly static in the few years prior to the storm (Finkl and Vollmer, 2017), further suggesting that broad-scale sediment deposition resulted directly from Hurricane Irma.
Numerical modeling of the impact of hurricane-induced wave–current interactions on the transport of material along the FRT during Hurricane Irma showed that wave radiation stress primarily affected particle transport trajectories during the passage of the hurricane (Dobbelaere et al., 2022). Additionally, wave energy dissipation occurred through depth-induced wave breaking and bottom dissipation at the shelf break and over the coral reefs. Our 2016 to 2017 elevation change results showed general movement of sediment and migration of major geomorphic features from ENE to WSW in shallow areas of the reef proper and back-reef area (ranging from approximately 2 to 5.5 m water depth in 2016), consistent with the direction of sustained, high-magnitude winds and modeled particle transport trajectories during the passing of Hurricane Irma (Figs. 4; 6a, d, and g). For example, large sand waves and rubble fields (approximately 0.02 to 0.06 km2 in area) migrated westward approximately 80 m (Fig. 6a and g), causing burial of seagrass habitat. Scour marks developed due to erosion of the western edges of seagrass beds and westward transport of sediment, causing burial of adjacent seagrass beds between scour marks (Fig. 6d). Furthermore, numerical modeling showed that, after the passage of the hurricane, suspended particles were transported northeastward by the Florida Current and were advected (via Stokes drift) from the outer shelf to inshore for approximately 2 d (Dobbelaere et al., 2022), consistent with observations of sediment plumes that likely contributed to broad-scale sediment deposition resulting from Hurricane Irma (Fig. 1d).
Geomorphic seafloor changes, like those observed in our study, have been documented for other category 4 hurricanes in the Florida Keys based on photographic air and ground surveys, maps, sediment cores, and bottom markers. For example, in 1967, Hurricane Donna approached from the southeast and passed over the central islands of the Florida Keys in September 1960 with sustained winds of 226 km h−1 (category 4) and with breaking waves and storm currents causing broken coral rubble up to a meter in diameter, shoreward transport of gravel- to boulder-sized rubble and sand approximately 60 to 150 m shoreward, and burial of seagrass with 15 cm of sediment (Ball et al., 1967). Hurricane Betsy approached from the west and passed over the Florida Keys approximately 25 km north of Hurricane Donna's landfall in September 1965 with sustained winds of up to 226 km h−1. While both storms had similar destructive effects on corals on the outer reefs, Hurricane Betsy produced less rubble, showed an overall effect of erosion and recycling of sediment in the environment, and caused sediment plumes from the mainland to the edge of the Gulf Stream for several days after the hurricane passed (Perkins and Enos, 1968). Perkins and Enos (1968) noted that the difference in wind directions for the two storms caused different effects and that it is difficult to extrapolate quantitative sedimentation rates from the sedimentary record of one hurricane and frequency of recorded hurricanes. Hurricane Andrew made landfall along the southeast coast of Florida just south of Miami, also with sustained winds of 226 km h−1 and maximum wave heights of less than 2 m. Branching corals were broken, massive coral heads were toppled, sea fans and sponges were ripped loose, and shallow reefs sustained the most damage (Orr and Ogden, 1992); however, there was little damage to seagrass beds immediately seaward of coastal mangroves (Tilmant et al., 1994). Hurricane Georges was a category 2 storm that passed over Key West with maximum sustained winds of only 145 km h−1. However, data from 30 seagrass monitoring transects showed a 3 % decline in density of Thalassia testudinum and 19 % decline in density of Syringodium filiforme seagrasses, with complete loss of seagrass beds at three monitoring stations, burial of one station with 50 cm of sediment, and substantial erosion at two stations (Fourqurean and Rutten, 2004). Furthermore, Fourqurean and Rutten (2004) showed that seagrass recovery was slowest at sites that were eroded; losses by mechanical thinning and burial with only a few centimeters of sediment recovered quickly, and seagrass buried with tens of centimeters of sediment had not recovered by 3 years after the storm. Analysis of long-term benthic monitoring stations in the FKNMS by Krause et al. (2023) showed some locations with substantial erosion of seagrass due to storm events that resulted in bare patches of seafloor or “blowouts” often larger than 20 m in diameter, similar to the scour marks observed in our study. Studies of post-storm seagrass recovery in other geographic locations indicate that revegetation of these large bare patches may take several years to multiple decades (Patriquin, 1975; Hastings et al., 1995; Kirkman and Kirkman, 2000; Carter et al., 2022). Results from these studies show the variability in storm impacts due to complex interactions among factors such as location, fetch, wind speed, duration, storm history, and water depth (Fourqurean and Rutten, 2004), and they demonstrate the value of comprehensive, quantitative post-storm assessments of geological and ecological impacts.
Analysis of seafloor elevation change at LKR during the decade prior to Hurricane Irma (from 2004–2016, during which only one minor tropical storm impacted this location in 2008) indicated an increase in mean elevation of 0.39 m (annualized elevation change rate of 32.5 mm yr−1), net volume gain of up to 6.4 Mm3, and area-normalized volume change of 0.39 Mm3 km−2, with accretion observed across all habitat types and some WSW movement of sand waves (Yates et al., 2019b). Our results showed that sediment deposited during the approximately 16.5- to 19.5-month time period including impacts from Hurricane Irma caused changes in seafloor elevation and volume across all habitat types similar in magnitude to net changes observed over the past decade and at annualized elevation change rates 1 order of magnitude greater (247 mm yr−1). Previous studies on several coral reefs around St. Croix, US Virgin Islands, showed that storms can increase sediment transport by an order of magnitude higher than during non-storm conditions and that physical transport of sediment is primarily due to wave-induced oscillatory and unidirectional currents (Hubbard et al., 1981; Hubbard, 1986). Measurements from 15 locations around St. Croix showed sediment transport rates ranging from 0.009 to 0.3 Mm3 km−2 yr−1 during non-storm conditions and 0.09 to 1.5 Mm3 km−2 yr−1 during storm conditions (Hubbard et al., 1981; Yates et al., 2017). Similarly, sediment trap studies along the southwest coast of Puerto Rico showed that median sediment accumulation rates increased by an order of magnitude (from approximately 6 to 68 mg m−2 d−1) after the passage of Hurricane Maria in September of 2017 (a category 4 storm) and a large October 2017 storm that caused resuspension of bottom sediments (Takesue et al., 2021). Furthermore, these accumulation rates exceeded the threshold of 10 mg m−2 d−1, which is considered heavy sedimentation and has been associated with fewer coral species, less live coral, lower coral growth rates, reduced coral recruitment and calcification rates, and slower rates of reef accretion (Rogers, 1990).
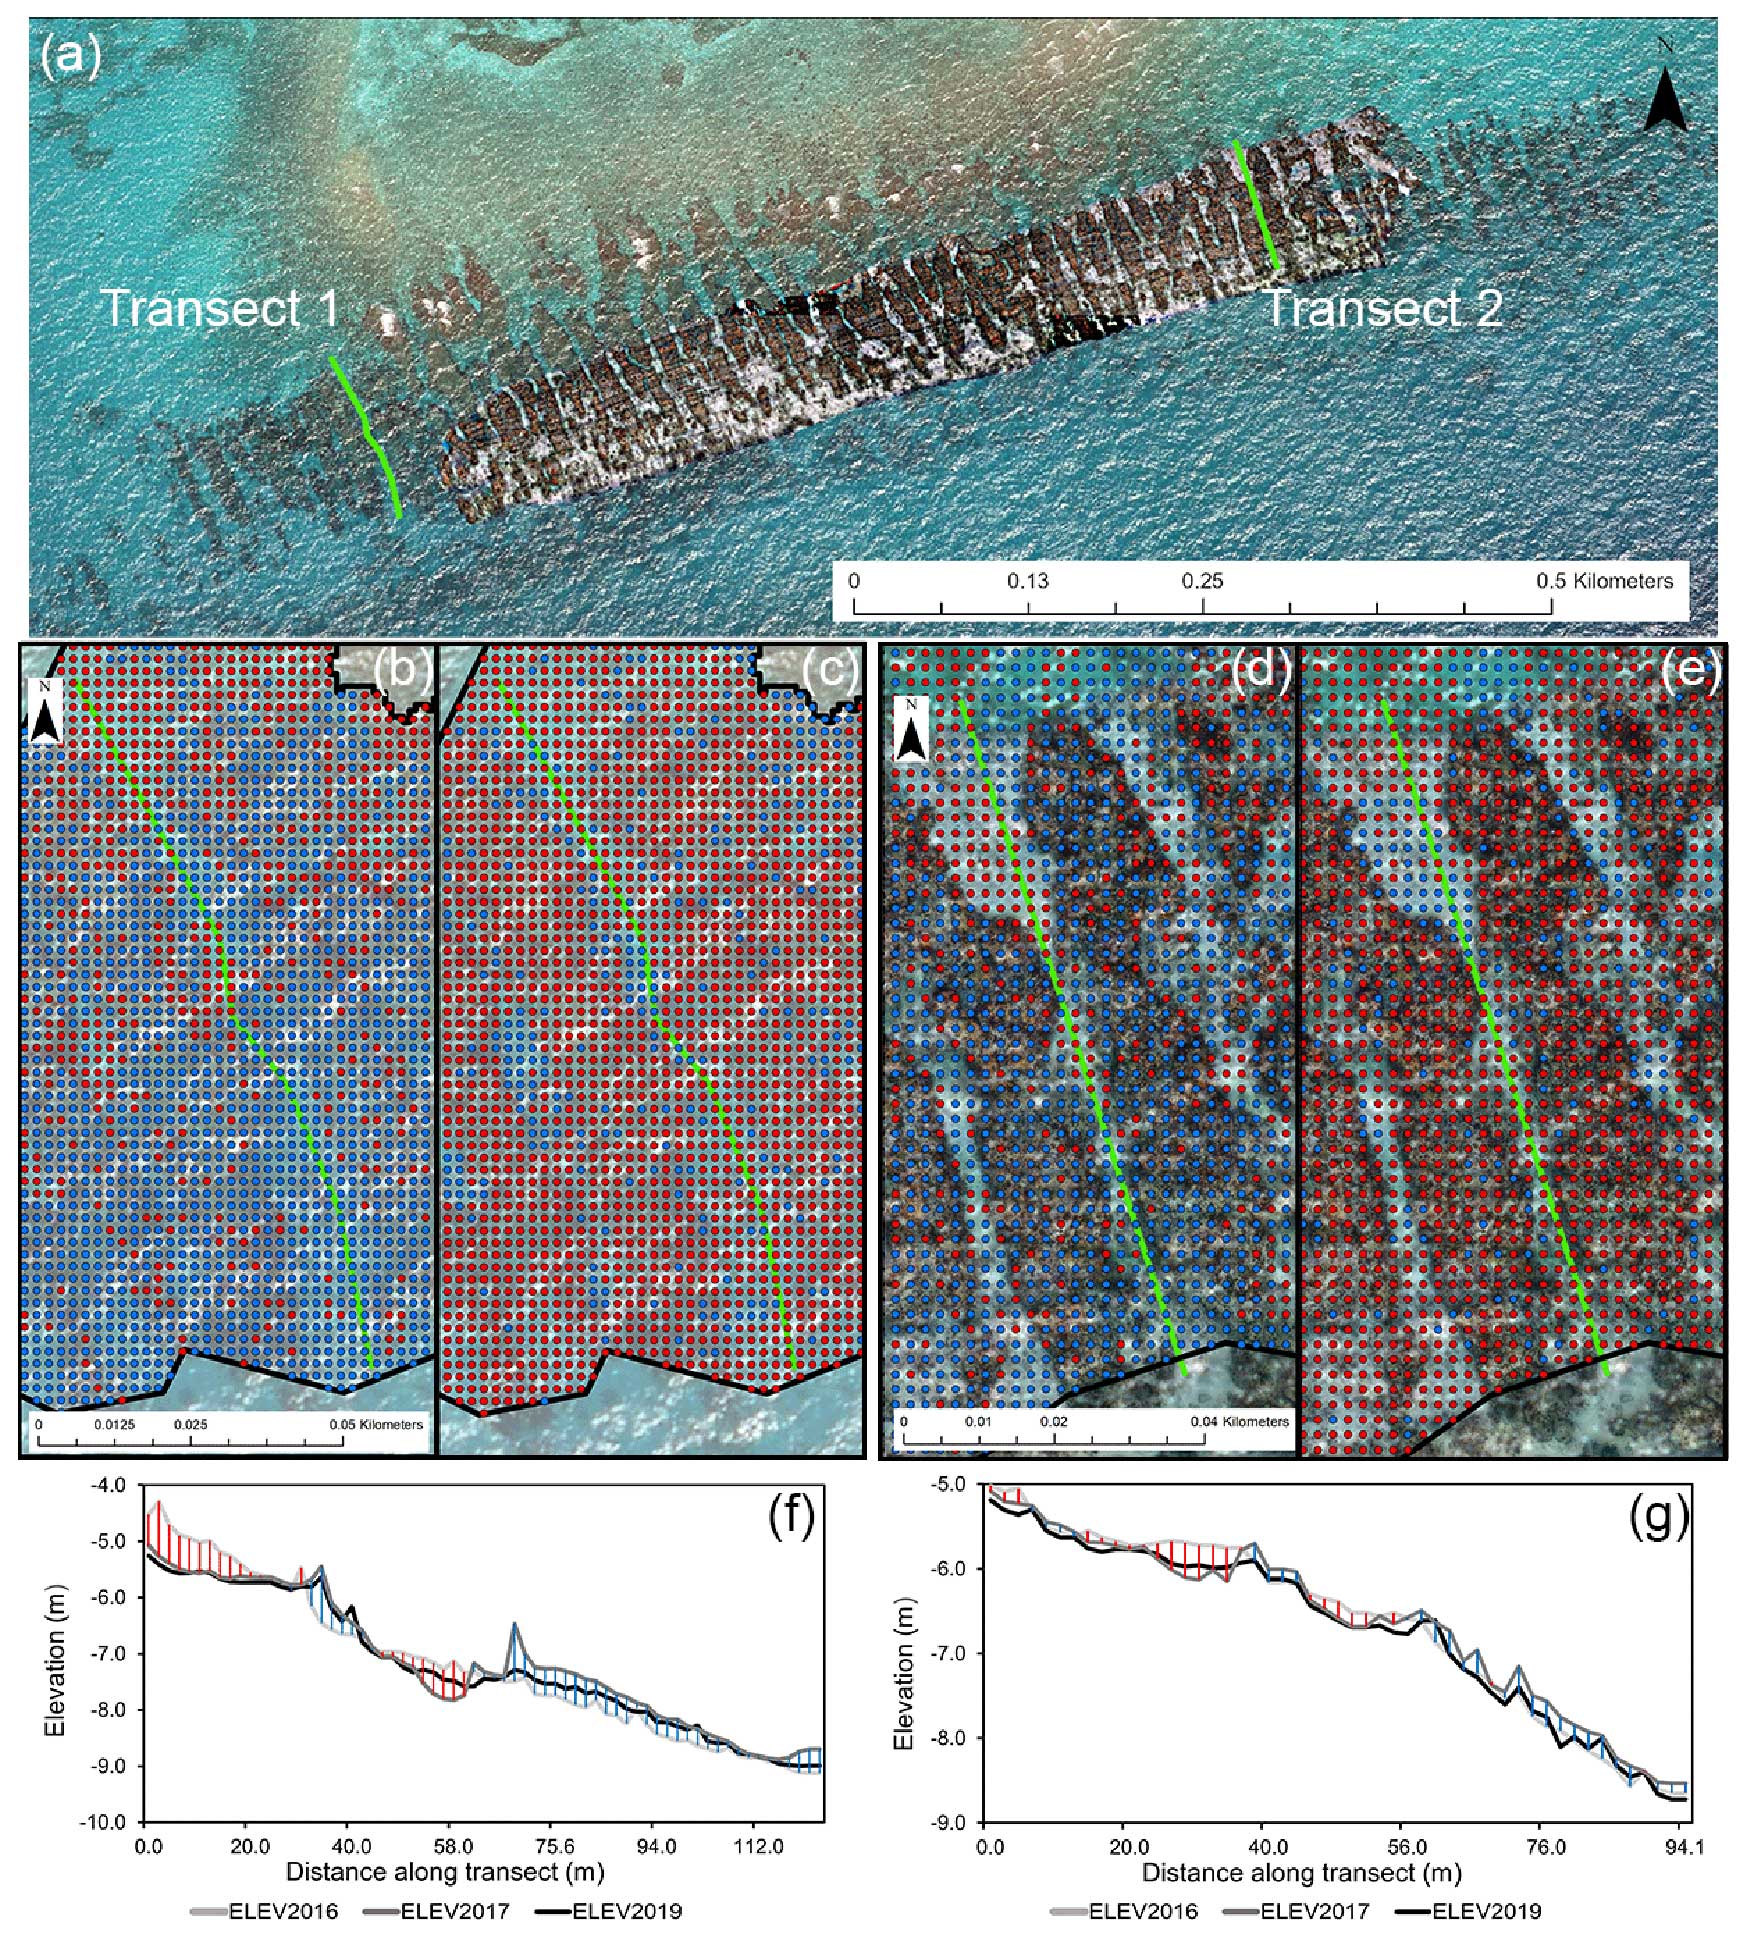
Figure 10Elevation change along Looe Key Reef spur-and-groove formation. (a) Upslope to downslope transects along Looe Key Reef spur-and-groove formation (green lines). Image sourced from the 2019 NOAA National Geodetic Survey via NOAA Digital Coast, downloaded 11 September 2023 from https://www.fisheries.noaa.gov/inport/item/63292 (last access: 11 September 2023), with structure-from-motion overlay image of Hatcher et al. (2022). Areas of erosion (red circles) and accretion (blue circles) along transect 1 between (b) 2016 and 2017 and between (c) 2017 and 2019. Areas of erosion (red circles) and accretion (blue circles) along transect 2 between (d) 2016 and 2017 and between (e) 2017 and 2019. Elevation profiles from 2016, 2017, and 2019 for (f) transect 1 and (g) transect 2. Vertical red lines indicate net erosion, and vertical blue lines indicate net accretion between 2016 and 2017.
Mean elevation and area-normalized volume change from 2016–2017 for habitats examined in our study increased significantly with water depth, suggesting that, in addition to broad-scale sediment deposition across the study site, sediment was also transported from shallower to deeper habitats (Fig. 5a and b). Notably, the greatest increases in elevation (accretion) were associated with habitats in water depths exceeding 11 m including aggregate reef, a sand lobe consisting of unconsolidated sediment, and not classified habitat located seaward and near the base of the reef's spur-and-groove formation, suggesting some movement of sediment offshore and downslope (Fig. 4a, Table 2). Additionally, erosion was observed in the shallower, upslope grooves of the spur-and-groove formation, and accretion was observed in the deeper, downslope areas of the grooves from 2016 to 2017, further suggesting downslope, offshore movement of sediments (Fig. 10). The sand lobe at the base of the spur-and-groove formation also showed upslope erosion and considerable downslope (seaward) accretion, further suggesting offshore transport of sediments (Fig. 7d). Our observations are consistent with previous bathymetric change analyses conducted along the northern FRT from 2001 to 2008 (approximately 3 years before Hurricane Ivan and 3 years after Hurricane Katrina) that showed movement of up to 1.8 Mm3 of sediment between these time periods and transport of sediment from the inner shelf to offshore and beyond the shelf edge through gaps in the barrier reef and diabathic (cross-shore) channels during high-energy events or when the back reef overfills with sand (Finkl, 2004; Finkl and Vollmer, 2017). These observations are also consistent with results of Yates et al. (2017) that show a multi-decadal trend along the FRT of reef sediment transport down the fore-reef slope and export offshore.
Results from previous studies of sediment mobility along the FRT suggest that some sediment transport observed in our study could be due to persistent transport of sand during quiescent sea-state conditions. Field observations of currents, waves, and reef sediment grain size analyses coupled with integrated ocean–atmosphere–wave–sediment transport modeling during a 1-year study at Crocker reef in the Upper Florida Keys showed that sediment mobility was primarily driven by wave stress exceeding critical shear stress; current stress alone only exceeded the critical shear stress for sediment mobility 5 % of the time, usually due to Florida Current eddies (Torres-Garcia et al., 2018). Torres-Garcia et al. (2018) showed that non-breaking wave stress (characteristic of quiescent sea states) mobilizes sand approximately 23 % to 59 % of the time, and fine-grained material is winnowed from the shallow areas of the reef and deposited to the flanks and offshore, particularly to the southwest. Southwest countercurrents due to the formation of Florida Current eddies (Lee and Williams, 1999) and WSW movement of sand wave features over a decadal time period (Yates et al., 2019b) have also been observed near LKR. However, Torres-Garcia et al. (2018) also showed that the critical stress threshold of gravel-sized material was exceeded 1 % to 13 % of the time, particularly during near-field tropical storm conditions (similar to Hurricane Wilma, a category 3 hurricane) that cause breaking waves, mobilize and transport gravel material, and can cause physical reef degradation. Their results suggest the large volume of material transported at Looe Key Reef (including gravel-sized and larger reef rubble) during the short time period of our study from 2016 to 2017 was likely primarily due to storm conditions caused by Hurricane Irma.
4.2 Post-storm change
Approximately 16.5 months after Hurricane Irma (during a 13-month period between 2017 and 2019), decreased elevation was observed across all habitats with mean elevation change of −0.15 m (annualized elevation change rate of −139 mm yr−1), net volume change up to −2.46 Mm3, and area-normalized volume change of −0.15 Mm3 km−2 due to erosion. Newly deposited carbonate sediments typically have porosities of 40 % to 70 % (Choquette and Pray, 1970) at shallow sediment depths of a few hundred meters (Schmoker and Halley, 1982). Porosity of carbonate sands on the FRT and in Hawk Channel ranges from 60 % to 72 % in the upper 22 cm of deposited sediment (Walter et al., 2007). Schmoker and Halley (1982) showed that there is little or no sediment porosity loss at near-surface sediment depths. Application of their exponential function for porosity versus depth of sediment (porosity (%) , where z= depth below sediment surface) indicates that the decrease in porosity of deposited carbonate sediments at 2 m below the sediment surface due to compaction is only 0.03 %. Furthermore, carbonate sands have settling velocities ranging from 0.025 to 0.364 m s−1 (Riazi et al., 2020). Satellite imagery shows that the sediment plume caused by resuspension of sediment during Hurricane Irma cleared within approximately 5 d of the storm's passing (NASA, 2023). Therefore, it is likely that resuspended sediment settled quickly (within days) when storm conditions subsided, and compaction and loss of sediment porosity after the storm cannot account for the decrease in elevation observed at our study site between 2017 and 2019. This suggests that approximately 50 % of sediment deposited between 2016 and 2017 was eroded by 2019 due to physical transport away from the study site.
Geomorphic features including the sand wave and reef rubble field showed continued erosion between 2017 and 2019 with some evidence for migration of the crest of the rubble field back toward its original 2016 position indicated in the elevation profile (Figs. 6 and 7). Shallow areas between the scour marks showed erosion, while the scour mark pits showed infilling (Figs. 6 and 7). Spurs of the spur-and-groove formation primarily showed erosion, while shallow (landward) sections of grooves showed some accretion, likely due to transport of sediments from spurs to grooves and downslope from the shallow reef (Fig. 10). Deeper (seaward) areas of grooves and the sand lobe located at the base of the spur-and-groove formation showed erosion (Figs. 4 and 6k), suggesting continued downslope, offshore transport of sediments. Historical aerial and satellite imagery from before and after the passing of Hurricane Irma corroborates our elevation change observations (Fig. 9). Imagery from 2014 and March 2017 shows that major geomorphic features of Looe Key proper, such as distribution of seagrass beds and the size and position of the sand lobe and rubble fields, were relatively static between these time periods leading up to Hurricane Irma (Fig. 9a and b). Imagery from December 2017, 3 months after Hurricane Irma passed, shows broad-scale sediment deposition and burial of seagrass beds in the shallow areas of the reef proper, erosion and exposure of deeper, downslope spur-and-groove formation, and downslope deposition on the sand lobe (Fig. 9c). Imagery from 2019 shows re-exposure of some shallow seagrass beds and deep spur-and-groove formation as sediments were eroded (Fig. 9d). Historical aerial imagery from 1975 (Fig. 9e, Lidz et al., 2007) shows a distribution of seagrass, presence of rubble fields, and patterns of sediment along the sand lobe similar to 2014 and 2017 imagery (before Hurricane Irma), indicating these features have persisted over the past several decades despite repeated impact from tropical and seasonal storms. Lidz et al. (2007) suggested that the formation of rubble fields in the shallow back-reef area is mainly due to historical passage of hurricanes and winter storms, and our elevation change results suggest that these structures continue to migrate in response to storm conditions. Lidz et al. (2007) also suggested that transport of sediment during hurricanes was primarily to the north. Our observations showed that primary sediment movement during Hurricane Irma was WSW and downslope from shallow to deep habitats with apparent seaward movement of the sand lobe after the storm passed, illustrating the variability in storm impacts associated with individual storm events.
Table 5Annualized mean elevation change rates (mm yr−1) for event-driven to multi-decadal time periods at the Florida Keys Reef Tract.
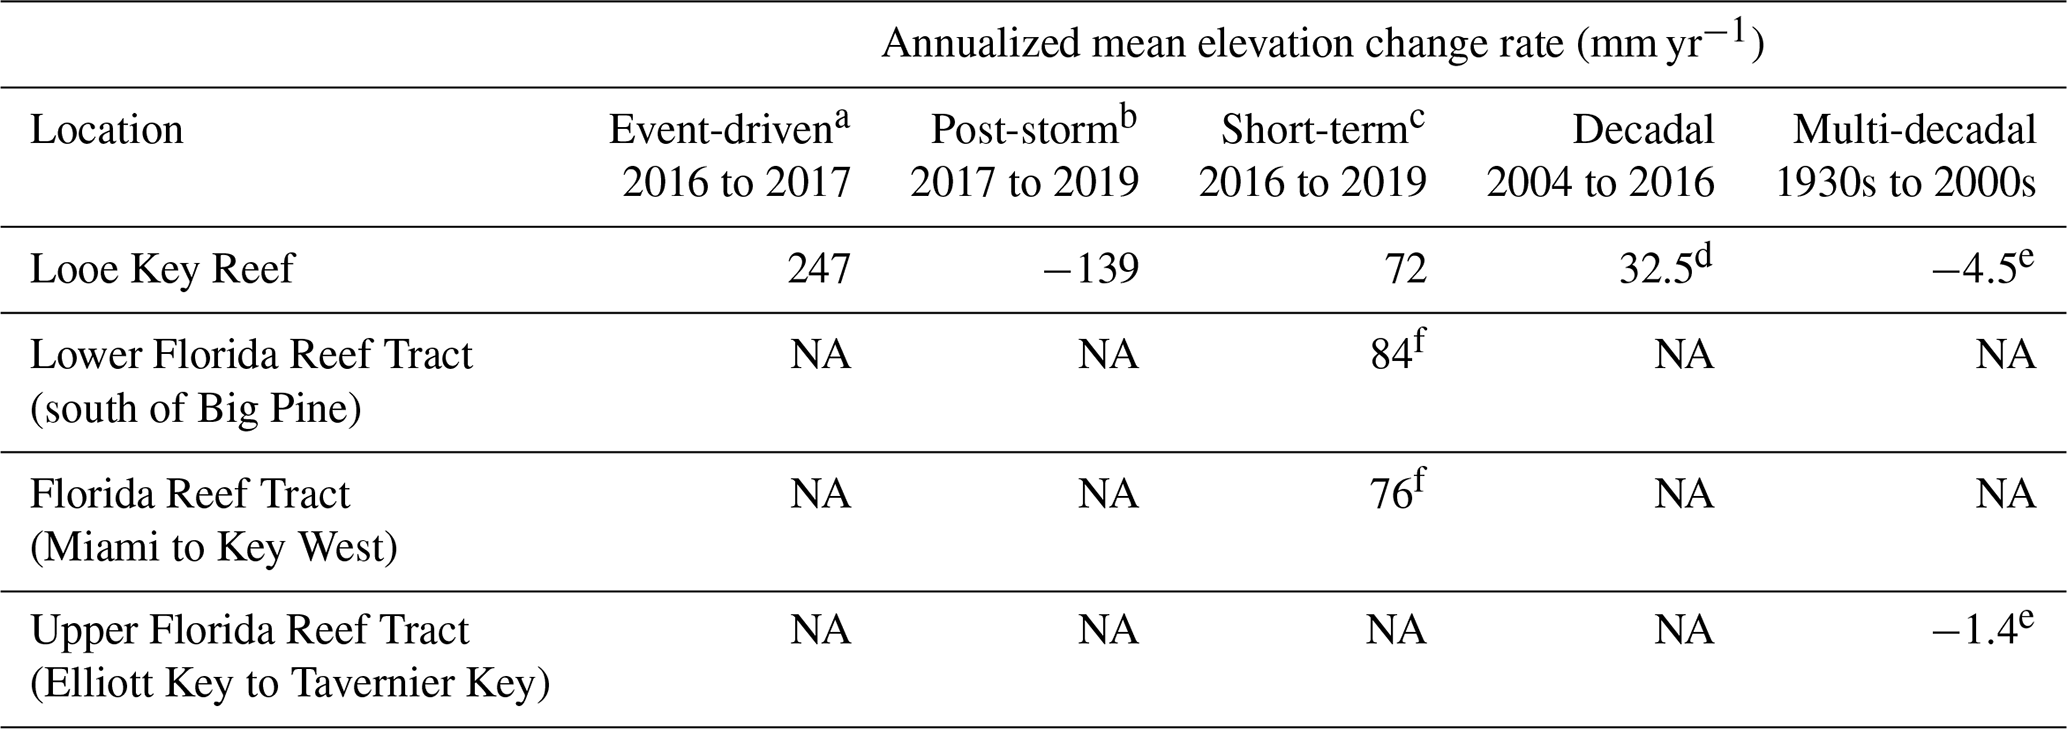
a Calculated assuming a total time period of 16.5 months (13.5 months pre-storm to 3 months post-storm). b Total time period 13.5 months (3 to 16.5 months post-storm). c Total time period approximately 30 months (13.5 months pre-storm to 16.5 months post-storm). d Using data from Yates et al. (2019b). e Using data from Yates et al. (2017). f Using data from Fehr et al. (2021). NA – not available.
Previous examination of multi-decadal elevation change in a 19 km2 study site at Looe Key Reef from 1938 to 2004 showed mean elevation change of −0.30 m (annualized elevation change rate of −4.5 mm yr−1), net volume loss up to −5.7 Mm3, and area-normalized volume change of −0.30 Mm3 km−2, indicating a long-term trend of erosion at this location over more than 6 decades (Yates et al., 2017). Similar results were observed for a 241 km2 area of the Upper Florida Keys with an annualized elevation change rate of −1.4 mm yr−1 between 1934 and 2004 (Yates et al., 2017). Furthermore, six of nine habitats at LKR showed elevation loss over those periods, with greatest losses associated with shallow habitats, and mean elevation and volume gains in deep-water habitats including at the base of the spur-and-groove habitat, indicating transport of reef sediments down the fore-reef slope and export offshore (Yates et al., 2017). Our observed rate of mean elevation loss between 2017 and 2019 (−139 mm yr−1) was 2 orders of magnitude higher than the multi-decadal rates of Yates et al. (2017). Additionally, elevation loss (erosion) showed a moderate correlation with water depth, and mean elevation losses during 2017 to 2019 were significantly greater in habitats with larger mean elevation gains during 2016 to 2017, suggesting that sediment distribution was re-equilibrating or stabilizing to quiescent sea-state conditions up to 16.5 months after the storm.
The annualized mean rate of elevation change for LKR from the 2.5-year period between July 2016 and January 2019 examined in our study, including sediment accretion from Hurricane Irma and the post-storm erosion and re-equilibration, was approximately 72 mm yr−1, which is almost double the rate of accretion observed in the previous decade of 32.5 mm yr−1 (Yates et al., 2019b). Numerous field reconnaissance observations immediately after the passing of Hurricane Irma indicated broad-scale sediment deposition across the FRT due to the storm (e.g., Viehman et al., 2018; Walker, 2018; Wilson et al., 2020; Kobelt et al., 2020). Our 2016 to 2019 elevation change rate is consistent with annualized mean elevation change rates from 2016 to 2019 for the lower FRT from approximately Big Pine Key to Key West of 84 mm yr−1 and for the FRT from Miami to Key West of 76 mm yr−1 (Fehr et al., 2021), further suggesting that sediment distribution may have still been undergoing post-storm re-equilibration at our study site and along the broader FRT (Table 5).
Collection and analysis of additional elevation change datasets over shorter time periods (e.g., seasonal to annual) could improve characterization of post-storm elevation change rates and duration of post-storm sediment re-equilibration periods relative to persistent seasonal, interannual, decadal, and multi-decadal time periods. Our results also suggest that caution should be used in selection of DEMs for use in elevation change and projection modeling to minimize bias that could result from selecting elevation surfaces that reflect periods of rapid elevation change due to storm impacts and periods of post-storm re-equilibration.
High-resolution lidar and multibeam bathymetric data were used to quantify seafloor elevation and volume change within the Looe Key Reef system of the Florida Keys Reef Tract over a 2.5-year period from 2016–2019 and to examine impacts from category 4 Hurricane Irma and post-storm re-equilibration of seafloor sediments. Analysis of seafloor elevation and volume change over a 16.5-month period from July 2016 to December 2017 showed that Hurricane Irma caused broad-scale deposition of sediments across all benthic habitats of this reef system and burial of seagrass and coral-dominated habitat. Rates of net elevation change were 1 order of magnitude greater during this short-term period that included storm impacts from Hurricane Irma than for the previous decade (Yates et al., 2019b). Major seafloor geomorphic features such as sand waves and rubble fields migrated tens of meters to the WSW in response to predominant wind conditions during the passing of Hurricane Irma, and sediment accretion was significantly greater in deep habitats than shallow habitats, suggesting downslope and offshore transport of seafloor sediment.
Loss of mean elevation and volume in all habitats in the period following the storm (from December 2017 to January 2019) indicated that 35 % to 50 % of sediment deposited during the storm had eroded by approximately 16.5 months after the storm and that erosion rates were 2 orders of magnitude greater than historical, multi-decadal rates of erosion. Sediment erosion after the storm (2017–2019) was moderately correlated with depth and was significantly greater in habitats that showed greater accumulation during the period including Hurricane Irma from 2016–2017, suggesting a period of rapid sediment re-equilibration after the storm. Historical satellite and aerial imagery shows that major geomorphic features at this location including rubble fields, sand waves, and a sand lobe at the base of the spur-and-groove formation have persisted over the past several decades despite impacts from storms. However, our elevation change results indicate these features are highly ephemeral, migrating rapidly during storms, re-equilibrating to non-storm sea-state conditions between storms, and periodically burying seafloor habitat such as seagrass. Such features and the area surrounding them likely represent localized areas of long- and short-term seafloor instability that could be less suitable for restoration of slow-growing benthic species. Our observed rates of elevation change in the 16-month period after Hurricane Irma were 1 to 2 orders of magnitude greater than during the past decade or multi-decadal period (Yates et al., 2017, 2019b), indicating that seafloor sediments across all habitats may have still been re-equilibrating to non-storm sea-state conditions up January 2019. Higher-resolution elevation change data collected over seasonal and annual time periods could improve characterization and understanding of short-term (event-driven, seasonal, interannual) and long-term (decadal to multi-decadal) rates and processes of seafloor change and help guide benthic habitat post-storm recovery and restoration efforts in topographically complex coral reef systems.
The Python script for the Seafloor Elevation Change Analysis Tool (SECAT), intended to be applied in ArcMap or ArcGIS Pro, is publicly available as a US Geological Survey software release at https://doi.org/10.5066/P9D5UUZ0 (Zieg and Zawada, 2021) and https://www.usgs.gov/software/seafloor-elevation-change-analysis-tool (last access: 20 May 2024).
Elevation change and multibeam bathymetric data are publicly available in US Geological Survey data releases at https://doi.org/10.5066/P9CHC95D (Fehr et al., 2021), https://doi.org/10.5066/P937LNZF (Yates et al., 2019a), https://doi.org/10.5066/P9NXNX61 (Yates et al., 2021), https://doi.org/10.5066/P9JTOOMB (Yates et al., 2019b), and https://doi.org/10.5066/P9P2V7L0 (Fredericks et al., 2019). Lidar topobathymetric data are publicly available from the NOAA Office for Coastal Management at https://www.fisheries.noaa.gov/inport/item/63018 (National Geodectic Survey, 2022) and https://www.fisheries.noaa.gov/inport/item/48373 (Office for Coastal Management, 2017). Seafloor habitat data are publicly available from the Florida Fish and Wildlife Conservation Commission, Fish and Wildlife Research Institute (2015) at http://ocean.floridamarine.org/IntegratedReefMap/UnifiedReefTract.htm.
KKY and DZ conceptualized the research, data acquisition approach, and methodology for analysis of seafloor elevation data. KKY, ZF, and DZ performed formal analysis of data. DZ developed the SECAT software for statistical analysis of elevation and volume change data. KKY and ZF developed data interpretations and prepared the original paper draft with contributions from SJ and DZ. All authors contributed to preparation of the final published paper.
The contact author has declared that none of the authors has any competing interests.
Any use of trade, firm, or product names is for descriptive purposes only and does not imply endorsement by the US Government. Cherokee Nation System Solutions is a contractor to the US Geological Survey.
Publisher's note: Copernicus Publications remains neutral with regard to jurisdictional claims made in the text, published maps, institutional affiliations, or any other geographical representation in this paper. While Copernicus Publications makes every effort to include appropriate place names, the final responsibility lies with the authors.
Funding for this study was provided by the US Geological Survey, Coastal and Marine Hazards and Resources Program, and by 2018 Hurricane and Wildfire Supplemental Funding provided to the US Geological Survey from the Additional Supplemental Appropriations for Disaster Relief Requirements Act of 2018 (P.L. 115-123). We would like to thank Jake J. Fredericks, Billy J. Reynolds, and Andrew S. Farmer, for collection of the multibeam bathymetry data and Jake J. Fredericks for development of the associated multibeam digital elevation model. We also thank Jonathon Zieg for assistance with development of the SECAT software and Kelly Murphy for assistance with development of methods for subsampling large-scale digital elevation models. We greatly appreciate reviews of the original draft paper and constructive comments from Lauren Toth and Gerry Hatcher.
This research has been supported by the US Geological Survey, Coastal and Marine Hazards and Resources Program, and by 2018 Hurricane and Wildfire Supplemental Funding provided to the US Geological Survey from the Additional Supplemental Appropriations for Disaster Relief Requirements Act of 2018 (P.L. 115-123).
This paper was edited by Bernadette Sloyan and reviewed by two anonymous referees.
Awadallah, M.O.M., Malmquist, C., Stickler, M., and Alfredsen, K.: Quantitative evaluation of bathymetric LiDAR sensors and acquisition approaches in Lærdal River in Norway, Remote Sens., 15, 263, https://doi.org/10.3390/rs15010263, 2023.
Ball, M. M., Shinn, E. A., and Stockman, K. W.: The geologic effects of Hurricane Donna in south Florida, J. Geol., 75, 583–597, 1967.
Bhatia, K. T., Vecchi, G. A., Knutson, T. R., Murakami, H., Kossin, J., Dixon, K. W., and Whitlock, C. E.: Recent increases in tropical cyclone intensification rates, Nat. Commun., 10, 1–9, https://doi.org/10.1038/s41467-019-08471-z, 2019.
Bohnsack, J. A., Cantillo, A. Y., and Bello, M. J.: Resource survey of Looe Key National Marine Sanctuary 1983, NOAA Technical Memorandum, NOS NCCOS CCMA 160, NMFS-SEFSC-478, NOAA LISD Current References 2002–8, https://www.aoml.noaa.gov/general/lib/CEDAR_files/cedar106.pdf (last access: 20 May 2024), 2002.
Brandt, M. E. and McManus, J. W.: Disease incidence is related to bleaching extent in reef building corals, Ecology, 90, 2859–2867, https://doi.org/10.1890/08-0445.1, 2009.
Bruno, J. F., Sweatman, H., Precht, W. F., Selig, E. R., Virginia, and Schutte, V. G. W.: Assessing evidence of phase shifts from coral to macroalgal dominance on coral reefs, Ecology, 9, 1478–1484, https://doi.org/10.1890/08-1781.1, 2009.
Cangialosi, J. P., Latto, A. S., and Berg, R.: National Hurricane Center tropical cyclone report Hurricane Irma (AL112017) 24 September 2021, Tropical Cyclone Report, AL112017, https://www.nhc.noaa.gov/data/tcr/AL112017_Irma.pdf (last access: 20 May 2024), 2021.
Carter, A. B., Collier, C., Coles, R., Lawrence, E., and Rasheed, M. A.: Community-specific “desired” states for seagrasses through cycles of loss and recovery, J. Environ. Manage., 314, 115059, https://doi.org/10.1016/j.jenvman.2022.115059, 2022.
Choquette, P. W. and Pray, L. C.: Geologic nomenclature and classification of porosity in sedimentary carbonates, AAPG Bull., 54, 207–250, https://doi.org/10.1306/5D25C98B-16C1-11D7-8645000102C1865D, 1970.
Dobbelaere, T., Curcic, M., Henaff, M. L., and Hanert, E.: Impacts of Hurricane Irma (2017) on wave-induced ocean transport processes, Ocean Model., 171, 1–13, https://doi.org/10.1016/j.ocemod.2022.101947, 2022.
Elsner, J. B., Kossin, J. P., and Jagger, T. H.: The increasing intensity of the strongest tropical cyclones, Nature, 455, 92–95, https://doi.org/10.1038/nature07234, 2008.
Fehr, Z. F. and Yates, K. K.: Underwater photographic reconnaissance and habitat data collection in the Florida Keys–a procedure for ground truthing remotely sensed bathymetric data, USGS Open-File Report, 2020–1118, 13 pp., https://doi.org/10.3133/ofr20201118, 2020.
Fehr, Z. W., Zawada, D. G., and Yates, K. K.: Seafloor elevation and volume change analyses from 2016 to 2019 along the Florida Reef Tract, USA, U.S. Geological Survey data release, USGS [data set], https://doi.org/10.5066/P9CHC95D, 2021.
Fernandez-Diaz, J. C., Glennie, C. L., Carter, W. E., Shrestha, R. L., Sartori, M. P., Singhania, A., Legleiter, C. J., and Overstreet, B. T.: Early results of simultaneous terrain and shallow water bathymetry mapping using a single-wavelength airborne LiDAR sensor, IEEE J. Sel. Top. Appl. Earth Obs., 7, 623–635, 2014.
Ferrario, F., Beck, M. W., Storlazzi, C. D., Miheli, F., Shepard, C. C., and Airoldi, L.: The effectiveness of coral reefs for coastal hazard risk reduction and adaption, Nat. Commun., 5, 3794, https://doi.org/10.1038/ncomms4794, 2014.
Finkl, C. W.: Leaky valves in the littoral sediment budgets: loss of nearshore sand to deep offshore zones via chutes in barrier reef systems, southeast coast of Florida, USA, J. Coast. Res., 20, 605–611, https://doi.org/10.2112/1551-5036(2004)020[0605:LVILSB]2.0.CO;2, 2004.
Finkl, C. W. and Andrews, J. L.: Shelf geomorphology along the southeast Florida Atlantic continental platform: Barrier coral reefs, nearshore bedrock, and morphosedimentary features, J. Coast. Res., 244, 823–849, https://doi.org/10.2112/08A-0001.1, 2008.
Finkl, C. W. and Vollmer, H. M.: Methods for investigating sediment flux under high-energy conditions on the Southeast Florida continental shelf using laser airborne depth sounding (LADS) in a geographic information system (GIS) dataframe, J. Coast. Res., 33, 452–462, https://doi.org/10.2112/JCOASTRES-D-16A-00014.1, 2017.
Florida Department of Environmental Protection: Florida's coral reefs, https://floridadep.gov/rcp/rcp/content/floridas-coral-reefs#:~:text=Florida is the only state,spiny lobster, snapper and grouper (last access: 7 September 2023), 2023.
Florida Fish and Wildlife Conservation Commission-Fish and Wildlife Research Institute, Unified Florida Coral Reef Tract Map v2.0, FWC-FWRI [data set], http://ocean.floridamarine.org/IntegratedReefMap/UnifiedReefTract.htm (last access: 20 May 2024), 2015.
Florida Reef Resilience Program: In Florida Reef Resilience Program Disturbance Response Monitoring and Hurricane Irma Rapid Reef Assessment Quick Look Report: Summer 2017, https://repository.library.noaa.gov/view/noaa/15575 (last access: 28 November 2021), 2017.
Fredericks, J. J., Reynolds, B. J., Farmer, A. S., Yates, K. K., and Zawada, D. G.: Multibeam bathymetry data collected in December 2017, February and March 2018 at Looe Key, the Florida Keys, U.S. Geological Survey data release, USGS [data set], https://doi.org/10.5066/P9P2V7L0, 2019.
Fourqurean, J. W. and Rutten, L. M.: The impact of Hurricane Georges on soft-bottom, back reef communities: site-and species-specific effects in south Florida seagrass beds, B. Mar. Sci., 75, 239–257, 2004.
Gorstein, M., Dillard, M. K., Loerzel, J., Edwards, P. E. T., and Levine, A S.: National coral reef monitoring program socioeconomic monitoring component: summary findings for South Florida, 2014, NOAA Technical Memorandum, CRCP 25, https://doi.org/10.7289/V5VH5KV5, 2016.
Hall, M. O., Furman, B. T., Merello, M., and Durako, M. J.: Recurrence of Thalassia testudnum seagrass die-off in Florida Bay, USA: initial observations, Mar. Ecol. Prog. Ser., 560, 243–249, https://doi.org/10.3354/meps11923, 2016.
Hall, E. R., Wickes, L., Burnett, L. E., Scott, G. I., Hernandez, D., Yates, K. K., Barbero, L., Reimer, J., Baalousha, M., Bennett-Mintz, J., Cai, W. J., Craig, K., Devoe, M. R., Fisher, W. S., Hathaway, T. K., Jewett, E. B., Johnson, Z., Keener, P., Mordecai, R. S., Noakes, S., Phillips, C., Sandifer, P. A., Schnetzer, A., and Styron J.: Acidification in the U.S. Southeast: causes, potential consequences and the role of the Southeast Ocean and Coastal Acidification Network, Front. Mar. Sci., 7, 548, https://doi.org/10.3389/fmars.2020.00548, 2020.
Hastings, K., Hesp, P., and Kendrick, G. A.: Seagrass loss associated with boat moorings at Rottnest Island, Western Australia, Ocean Coastal Manage., 26, 225–246, https://doi.org/10.1016/0964-5691(95)00012-Q, 1995.
Hatcher, G. A., Kranenbug, C. J., Warrick, J. A., Bosse, S. T., Zawada, D. G., Yates, K. K., and Johnson, S. A.: Overlapping seabed images and location data acquired using the SQUID-5 system at Looe Key, Florida, in July 2021, with structure-from-motion derived point cloud, digital elevation model and orthomosaic of submerged topography, U.S. Geological Survey data release, USGS [data set], https://doi.org/10.5066/P9WSF09G, 2022.
Hubbard, D. K.: Sedimentation as a control of reef development: St. Croix, U.S.V.I., Coral Reefs, 5, 117–125, 1986.
Hubbard, D. K., Sadd, J. L., and Roberts, H. H.: The role of physical processes in controlling sediment transport patterns on the insular shelf of St. Croix, US Virgin Islands, Proceedings of the Fourth International Coral Reef Symposium, Manila, 1, 399–404, 1981.
Hughes, T. P.: Catastrophes, phase shifts, and large-scale degradation of Caribbean coral reef, Science, 265, 1547–1551, https://doi.org/10.1126/science.265.5178.1547, 1994.
Hughes, T. P., Kerry, J. T., Álvarez-Noriega, M., Álvarez-Romero, J. G., Anderson, K. D., Baird, A. H., Babcock, R. C., Beger, M., Bellwood, D. R., Berkelmans, R., Bridge, T. C., Butler, I. R., Byrne, M., Cantin, N. E., Comeau, S., Connolly, S. R., Cumming, G. S., Dalton, S. J., Diaz-Pulido, G, Eakin, C. M., Figueira, W. F., Gilmour, J. P., Harrison, H. B., Heron, S. F., Hoey, A. S., Hobbs, J. A., Hoogenboom, M. O., Kennedy, E. V., Kuo, C., Lough, J. M., Lowe, R. J., Liu, G., McCulloch, M. T., Malcolm, H. A., McWilliam, M. J., Pandolfi, J. M., Pears, R. J., Pratchett, M. S., Schoepf, V., Simpson, T., Skirving, W. J., Sommer, B., Torda, G., Wachenfeld, D. R., Willis, B. L., and Wilson, S. K.: Global warming and recurrent mass bleaching of corals, Nature, 543, 373–377, https://doi.org/10.1038/nature21707, 2017.
Jackson, J., Donovan, M., Cramer, K., and Lam, V. (Eds.): Status and trends of Caribbean coral reefs: 1970–2012, Global Coral Reef Monitoring Network, IUCN, Gland, Switzerland, 306 pp., https://www.iucn.org/content/status-and-trends-caribbean-coral-reefs-1970-2012 (last access: 20 May 2024), 2014.
Joyner, J. L., Sutherland, K. P., Kemp, D. W., Berry, B., Griffin, A., Porter, J. W., Amador, M. H., Noren, H. K., and Lipp, E. K.: Systematic analysis of white pox disease in Acropora palmata in the Florida Keys and role of Serratia marcescens, Appl. Environ. Microb., 81, 4451–4457, https://doi.org/10.1128/AEM.00116-15, 2015.
Keller, B. and Donahue, S.: Florida Keys National Marine Sanctuary U.S. Environmental Protection Agency State of Florida 2002—03 Sanctuary Science Report: An Ecosystem Report Card, in: U.S. Department of Commerce, National Oceanic and Atmospheric Administration, National Ocean Service, Office of National Marine Sanctuaries, Florida Keys National Marine Sanctuary, Marathon, FL, http://sanctuaries.noaa.gov/science/conservation/pdfs/Keller1.pdf (last access: 28 November 2021), 2006.
Kinzel, P. J., Wright, C. W., Nelson, J. M., and Burman, A. R: Evaluation of an experimental LiDAR for surveying a shallow, braided, sand-bedded river, J. Hydraul. Eng., 133, 838–842, https://doi.org/10.1061/(ASCE)0733-9429(2007)133:7(838), 2007.
Kirkman, H. and Kirkman, J.: Long-term seagrass meadow monitoring near Perth, Western Australia, Aquat. Bot., 67, 319–332, https://doi.org/10.1016/S0304-3770(00)00097-8, 2000.
Knowlton, N.: Thresholds and multiple stable states in coral reef community dynamics, Am. Zool., 32, 674–682, https://doi.org/10.1093/icb/32.6.674, 1992.
Knowlton, N.: The future of coral reefs, P. Natl. Acad. Sci. USA, 98, 5419–5425, https://doi.org/10.1073/pnas.091092998, 2001.
Knutson, T., Camargo, S. J., Chan, J. C., Emanuel, K., Ho, C.-H., Kossin, J., Mohapatra, M., Satoh, M., Sugi, M., Walsh, K. and Wu, L.: Tropical cyclones and climate change assessment: Part II: Projected response to anthropogenic warming, B. Am. Meteor. Soc., 101, E303–E322, https://doi.org/10.1016/j.tcrr.2020.01.004, 2020.
Kobelt, J. N., Sharp, W. C., Miles, T. N, and Feehan, C. J.: Localized Impacts of Hurricane Irma on Diadema antillarum and Coral Reef Community Structure, Estuar. Coast., 43, 1133–1143, https://doi.org/10.1007/s12237-019-00665-4, 2020.
Krause, J. R., Lopes, C. C., Wilson, S. S., Boyer, J. N., Briceño, H. O., and Fourqurean, J. W.: Status and trajectories of soft-bottom benthic communities of the South Florida Seascape revealed by 25 years of seagrass and water quality monitoring data, Estuar. Coast., 46, 477-493, https://doi.org/10.1007/s12237-022-01158-7, 2023.
Krediet, C. J., Ritchie, K. B., and Teplitski, M.: The importance and status of Florida coral reefs: questions and answers, SL305/SS518, 8/2009, EDIS 2010, Gainesville, FL, https://doi.org/10.32473/edis-ss518-2009, 2010.
Kuffner, I. B., Lidz, B. H., Hudson, J. H., and Anderson, J. S.: A century of ocean warming on Florida Keys coral reefs: historic in situ observations, Estuar. Coast., 38, 1085–1096, https://doi.org/10.1007/s12237-014-9875-5, 2015.
Lapointe B. E. and Clark, M. W.: Nutrient inputs from the watershed and coastal eutrophication in the Florida Keys, Estuaries, 15, 465–476, https://doi.org/10.2307/1352391, 1992.
Lee, T. N. and Williams, E.: Mean distribution and seasonal variability of coastal currents and temperature in the Florida Keys with implications for larval recruitment, B. Mar. Sci., 64, 35–56, 1999.
Legleiter, C. J., Overstreet, B. T., Glennie, C. L., Pan, Z., Fernandez-Diaz, J. C., and Singhania, A: Evaluating the capabilities of the CASI hyperspectral imaging system and Aquarius bathymetric LiDAR for measuring channel morphology in two distinct river environments, Earth Surf. Proc. Land., 41, 344–363, 2016.
Lessios, H. A., Cubit, J. D., Robertson, D. R., Shulman, M. J., Parker, M. R., Garrity, S. D., and Levings, S. C.: Mass mortality of Diadema antillarum on the Caribbean coast of Panama, Coral Reefs, 3, 173–182, https://doi.org/10.1007/BF00288252, 1984.
Lidz, B. H., Reich C. D., and Shinn, E. A.: Regional Quaternary submarine geomorphology in the Florida Keys, GSA Bulletin, 115, 845–866, https://doi.org/10.1130/0016-7606(2003)115<0845:RQSGIT>2.0.CO;2, 2003.
Lidz, B. H., Reich, C. D., and Shinn, E. A.: Systematic mapping of bedrock and habitats along the Florida Reef Tract–Central Key Largo to Halfmoon Shoal (Gulf of Mexico), USGS Professional Paper, 1751, https://doi.org/10.3133/pp1751, 2007.
Littler, M. M., Littler, D. S., and Lapointe, B. E.: Baseline studies of herbivory and eutrophication on dominant reef communities of Looe Key National Marine Sanctuary, NOAA Technical Memorandum, NOS MEMD 1, https://repository.library.noaa.gov/view/noaa/2424 (last access: 20 May 2024), 1986.
Lohr, K. E., Ripple, K., and Patterson, J. T.: Differential disturbance effects and phenotypic plasticity among outplanted corals at patch and fore reef sites, J. Nat. Conserv., 55, 1–7, https://doi.org/10.1016/j.jnc.2020.125827, 2020.
Malmstadt, J., Scheitlin, K., and Elsner, J.: Florida hurricanes and damage costs, Southeastern Geographer, 49, 108–131, 2009.
Miller, M., Bourque, A., and Bohnsack, J.: An analysis of the loss of acroporid corals at Looe Key, Florida, USA: 1983–2000, Coral Reefs, 21, 179–182, https://doi.org/10.1007/s00338-002-0228-7, 2002.
Moberg, F. and Folke, C.: Ecological goods and services of coral reef ecosystems, Ecol. Econ., 29, 215–233, https://doi.org/10.1016/S0921-8009(99)00009-9, 1999.
Morris, J. T., Enochs, I. C., Besemer, N., Viehman, T. S., Groves, S. H., Blondeau, J., Ames, C., Towle, E. K., Grove, L. J. W., and Manzello, D. P.: Low net carbonate accretion characterizes Florida's coral reef, Sci. Rep., 12, 19582, https://doi.org/10.1038/s41598-022-23394-4, 2022.
Muehllehner, N., Langdon C., Venti, A., and Kadko, D.: Dynamics of carbonate chemistry, production, and calcification of the Florida Reef Tract (2009–2010): evidence for seasonal dissolution, Global Biogeochem. Cy., 30, 661–688, https://doi.org/10.1002/2015GB005327, 2016.
Mumby, P. J.: The impacts of exploiting grazers (Scaridae) on the dynamics of Caribbean coral reefs, Ecol. Appl., 16, 747–769, https://doi.org/10.1890/1051-0761(2006)016[0747:TIOEGS]2.0.CO;2, 2006.
Murphy, K. A., Zawada, D. G., and Yates, K. K.: Subsampling Large-Scale Digital Elevation Models to Expedite Geospatial Analyses in Coastal Regions, J. Coast. Res., 38, 1236–1245, https://doi.org/10.2112/JCOASTRES-D-22-00015.1, 2022.
NASA: National Aeronautics and Space Administration, Earth Observing System and Information System (EOSDIS), Worldview Imagery, https://worldview.earthdata.nasa.gov/?v=-87.91450071116984,13.429741986895111,-73.74396320747232,36.509348902639495&t=2017-09-13-T14:29:26Z (last access: 20 May 2024), 2023.
National Geodetic Survey: 2018–2019 NOAA NGS Topobathy Lidar DEM Hurricane Irma: Miami to Marquesas Keys, FL, NOAA Office for Coastal Management [data set], https://www.fisheries.noaa.gov/inport/item/63018 (last access: 20 May 2024), 2022.
NHC: National Oceanic and Atmospheric Administration, National Hurricane Center: NOAA NHC – Irma storm track – best track + advisories, https://doi.org/10.4211/hs.aa5c9982a4694a19be2fa9299b78e5ca, 2018.
NOAA: National Oceanic and Atmospheric Administration, National Ocean Service, Office for Coastal Management, Digital Coast – Historical Hurricane Tracks, https://www.coast.noaa.gov/hurricanes/#map=4/32/-80 (last access: 20 May 2024), 2022a.
NOAA: National Oceanic and Atmospheric Administration, National Weather Service, Detailed meteorological summary on Hurricane Irma, technical summary, https://www.weather.gov/tae/Irma_technical_summary (last access: 20 May 2024), 2022b.
NOAA Fisheries: Restoring seven iconic reefs: a mission to recover the coral reefs of the Florida Keys, https://media.fisheries.noaa.gov/dam-migration/restoring_seven_iconic_reefs_-_a_mission_to_recover_the_coral_reefs_of_the_florida_keys.pdf (last access: 26 January 2023), 2022.
NOAA-NOS: National Oceanic and Atmospheric Administration – National Ocean Service, Tides and Currents Station 8723970, https://tidesandcurrents.noaa.gov/stationhome.html?id=8723970 (last access: 7 September 2023), 2023.
Norström, A. V., Nyström, M., Lokrantz, J., and Folke, C.: Alternative states of coral reefs: beyond coral–macroalgae shifts, Mar. Ecol. Prog. Ser., 376, 295–306, 2009.
Office for Coastal Management: 2016 NOAA NGS Topobathy Lidar DEM: Florida Keys Outer Reef Block 01, NOAA Office for Coastal Management [data set], https://www.fisheries.noaa.gov/inport/item/48373 (last access: 20 May 2024), 2017.
Orr, D. W. and Ogden, J. C.: The impact of Hurricane Andrew on the ecosystems of South Florida, Conserv. Biol., 6, 488–490, https://doi.org/10.1046/j.1523-1739.1992.06040488.x, 1992.
Patriquin, D. G.: “Migration” of blowouts in seagrass beds at Barbados and Carriacou, West Indies, and its ecological and geological implications, Aquat. Bot., 1, 163–189, https://doi.org/10.1016/0304-3770(75)90021-2, 1975.
Patterson, K. L., Porter, J. W., Ritchie, K. B., Poison, S. W., Mueller, E., Peters, E. C., Santavy, D. L., and Smith, G. W.: The etiology of white pox, a lethal disease of the Caribbean elkhorn coral, Acropora palmata, P. Natl. Acad. Sci. USA, 99, 8725–8730, https://doi.org/10.1073/pnas.092260099, 2002.
Perkins, R. D. and Enos, P.: Hurricane Betsy in the Florida-Bahama area: geologic effects and comparison with hurricane Donna, J. Geol., 76, 710–717, https://doi.org/10.1086/627394, 1968.
Porter, J. W., Dustan, P., Jaap, W. C., Patterson, K. L., Kosmynin, V., Meier, O. W., Patterson, M. E., and Parsons, M.: Patterns of spread of coral disease in the Florida Keys, Hydrobiologia, 460, 1–24, https://doi.org/10.1007/978-94-017-3284-0_1, 2001.
Randall, C. and van Woesik, R.: Contemporary white-band disease in Caribbean corals driven by climate change, Nat. Clim. Change 5, 375–379, https://doi.org/10.1038/nclimate2530, 2015.
Riazi, A., Vila-Concejo, A., Salles, T., and Türker, U.: Improved drag coefficient and settling velocity for carbonate sands, Sci. Rep., 10, 9465, https://doi.org/10.1038/s41598-020-65741-3, 2020.
Rice, M. M., Ezzat, L., and Burkepile, D. E.: Corallivory in the Anthropocene: interactive effects of anthropogenic stressors and corallivory on coral reefs, Front. Mar. Sci., 5, 525, https://doi.org/10.3389/fmars.2018.00525, 2019.
Rogers, C. S.: Responses of coral reefs and reef organisms to sedimentation, Mar. Ecol. Prog. Ser., 62, 185–202, https://doi.org/10.3354/meps062185, 1990.
Ruzicka, R. R., Colella, M. A., Porter, J. W., Morrison, J. M., Kidney, J. A., Brinkhuis, V., Lunz, K. S., Macaulay, K. A., Bartlett, L. A., Meyers, M. K., and Colee, J.: Temporal changes in benthic assemblages on Florida Keys reefs 11 years after the 1997/1998 El Niño, Mar. Ecol. Prog. Ser., 489, 125–141, https://doi.org/10.3354/meps10427, 2013.
Schmoker, J. W. and Halley, R. B.: Carbonate porosity versus depth: a predictable relation for South Florida, AAPG Bull., 66, 2561–2570, https://doi.org/10.1306/03B5AC73-16D1-11D7-8645000102C1865D, 1982.
Simmons, K. R., Bohnenstiehl, D. R., and Eggleston, D. B.: Spatiotemporal Variation in Coral Assemblages and Reef Habitat Complexity among Shallow Fore-Reef Sites in the Florida Keys National Marine Sanctuary, Diversity, 14, 153, https://doi.org/10.3390/d14030153, 2022.
Soto, I. M., Muller Karger, F. E., Hallock, P., and Hu, C.: Sea surface temperature variability in the Florida Keys and its relationship to coral cover, J. Mar. Biol., 2011, 981723, https://doi.org/10.1155/2011/981723, 2011.
Storlazzi, C. D., Reguero, B. G., Yates, K. K., Cumming, K. A., Cole, A. D., Shope, J. B., Gaido, L., C., Zawada, D. G., Arsenault, S. R., Fehr, Z. W., Nickel, B. A., and Beck, M. W.: Rigorously valuing the impact of projected coral reef degradation on coastal hazard risk in Florida, USGS Open-File Report, 2021-1055, 38 pp., https://doi.org/10.3133/ofr20211055, 2021.
Takesue, R. K., Sherman, C., Ramirez, N. I., Reyes, A. O., Cheriton, O. M., Rios, R. V., and Storlazzi, C. D.: Land-based sediment sources and transport to southwest Puerto Rico coral reefs after Hurricane Maria, May 2017 to June 2018, Estuar. Coast. Shelf S., 259, 1–12, https://doi.org/10.1016/j.ecss.2021.107476, 2021.
Tilmant, J. T., Curry, R. W., Jones, R. D., Szmant, A., Zieman, J. C., Flora, M., Robblee, M. B., Smith, D., Snow, R. W., and Wanless, H.: Hurricane Andrew's effect on marine resources, BioScience, 44, 230–237, https://doi.org/10.2307/1312227, 1994.
Tonina, D., McKean, J. A., Benjankar, R. M., Wright, C. W., Goode, J. R., Chen, Q., Reeder, W. J., Carmichael, R. A., and Edmondson, M. R.: Mapping river bathymetries: evaluating topobathymetric LiDAR survey, Earth Surf. Proc. Land., 44, 507–520, https://onlinelibrary.wiley.com/doi/10.1002/esp.4513, 2019.
Torres-Garcia, L. M., Dalyander, P. S., Long, J. W., Zawada, D. G., Yates, K. K., Moore, C., and Olabarrieta, M.: Hydrodynamics and sediment mobility processes over a degraded senile coral reef, J. Geophys. Res-Oceans., 123, 7053–7066, https://doi.org/10.1029/2018JC013892, 2018.
Towle, E., Geiger E., Grove, J., Groves, S., Viehman, S., Johnson, M., Blondeau, J., Stein, J., Gorstein, M., Borque, A., Acosta, A., Johnson, M., Feeley, M., Pagan, F., MacLaughlin, L., Lohr, K., Lustic, C., Bohnsack, K., Bohnsack, J., Manzello, D., Enochs, I., Koss, K., Edwards, K., Edwards, P., Bruckner, A., Thanner, S., Herbig, J., Montenero, K., Wusinich-Mendez, D., Gregg, K., Kelble, C., Moore, T., Rutten, L., Kramer, P., Quinn, P., Ault, E., Ault, J., Fangman, S., Fleming, C., Gilliam, D., Kilfoyle, K., Walker, B., and Lirman, D.: Coral reef condition: a status report for Florida's Coral Reef, NOAA Coral Reef Conservation Program and the University of Maryland Center for Environmental Science, https://www.coris.noaa.gov/monitoring/status_report/docs/FL_508_compliant.pdf (last access: 20 May 2024), 2020.
Viehman, S., Gittings, S., Groves, S., Moore, J., Moore, T., and Stein, J.: NCCOS Assessment: Coral Disturbance Response Monitoring (DRM) along the Florida Reef Tract Following Hurricane Irma from 2017-10-09 to 2017-10-18 (NCEI Accession 0179071), NOAA National Centers for Environmental Information [data set], https://doi.org/10.25921/sscd-6h41, 2018.
Walker, B.: Southeast Florida reef-wide Post-Irma coral disease surveys, Florida Department of Environmental Protection, 37 pp., https://floridadep.gov/sites/default/files/Southeast-Florida-Reef-Wide-Post-Irma-Coral-Disease-Surveys_0.pdf (last access: 20 May 2024), 2018.
Walter, L. M., Ku, T. C. W., Muehlenbachs, K., Patterson, W. P., and Bonnell, L.: Controls on the δ13C of dissolved inorganic carbon in marine pore waters: an integrated case study of isotope exchange during syndepositional recrystallization of biogenic carbonate sediments (South Florida Platform, USA), Deep-Sea Res. Pt. II, 54, 1163–1200, https://doi.org/10.1016/j.dsr2.2007.04.014, 2007.
Walton, C., Hayes, N. K., and Gilliam, D. S.: Impacts of a regional, multi-year, multi-species coral disease outbreak in southeast Florida, Front. Mar. Sci., 5, 323, https://doi.org/10.3389/fmars.2018.00323, 2018.
Warner, J. C., Armstrong, B., He, R., and Zambon, J. B.: Development of a Coupled Ocean-Atmsophere-Wave-Sediment Transport (COAWST) Modeling System, Ocean Model., 35, 230–244, https://doi.org/10.1016/j.ocemod.2010.07.010, 2010.
Williams, D. and Miller, M.: Attributing mortality among drivers of population decline in Acropora palmata in the Florida Keys (USA), Coral Reefs, 31, 369–382, https://doi.org/10.1007/s00338-011-0847-y, 2012.
Wilkinson, C. R.: Global change and coral reefs: impacts on reefs, economies and human culture, Glob. Change Biol., 2, 547–558, https://doi.org/10.1111/j.1365-2486.1996.tb00066.x, 1996.
Wilson, S. S., Furman, B. T., Hall, M. O., and Fourqurean, J. W.: Assessments of Hurricane Irma impacts on South Florida seagrass communities using long-term monitoring programs, Estuar. Coast., 43, 1119–1132, https://doi.org/10.1007/s12237-019-00623-0, 2020.
Xian, S., Feng, K., Lin, N., Marsooli, R., Chavas, D., Chen, J., and Hatzikyriakou, A.: Brief communication: Rapid assessment of damaged residential buildings in the Florida Keys after Hurricane Irma, Nat. Hazards Earth Syst. Sci., 18, 2041–2045, https://doi.org/10.5194/nhess-18-2041-2018, 2018.
Yates, K. K., Zawada, D. G., Smiley, N. A., and Tiling-Range, G.: Divergence of seafloor elevation and sea level rise in coral reef ecosystems, Biogeosciences, 14, 1739–1772, https://doi.org/10.5194/bg-14-1739-2017, 2017.
Yates, K. K., Zawada, D. G., and Arsenault, S. R.: Seafloor elevation change from 2016 to 2017 at Looe Key, Florida Keys–Impacts from Hurricane Irma (ver. 2.0, November 2020), U.S. Geological Survey data release, USGS [data set], https://doi.org/10.5066/P937LNZF, 2019a.
Yates, K. K., Zawada, D. G., Murphy, K. A., and Arsenault, S. R.: Seafloor elevation change from 2004 to 2016 at Looe Key, Florida Keys, U.S. Geological Survey data release, USGS [data set], https://doi.org/10.5066/P9JTOOMB, 2019b.
Yates, K. K., Arsenault, S. R., Fehr, Z. W., and Murphy, K. A.: Seafloor elevation change from the 1930s to 2016 along the Florida Reef Tract, USA, U. S. Geological Survey data release, USGS [data set], https://doi.org/10.5066/P9NXNX61, 2021.
Yoshida, K., Kajikawa, Y., Nishiyama, S., Islam, M. T., Adachi, S., and Sakai, K.: Three-dimensional numerical modelling of floods in river corridor with complex vegetation quantified using airborne LiDAR imagery, J. Hydraul. Res., 61, 88–108, https://doi.org/10.1080/00221686.2022.2106596, 2023.
Zieg, J. A. and Zawada, D. G.: Seafloor Elevation Change Analysis Tool, U. S. Geological Survey software release, USGS [code], https://doi.org/10.5066/P9D5UUZ0, 2021.
Zitello, A. G., Bauer, L. J., Battista, T. A., Mueller, P. W., Kendall, M. S., and Monaco, M. E.: Shallow-water benthic habitats of St. John, U.S. Virgin Islands, NOAA technical memorandum NOS NCCOS, Silver Spring, MD, 96, 53 pp., https://repository.library.noaa.gov/view/noaa/543 (last access: 20 May 2024), 2009.