the Creative Commons Attribution 4.0 License.
the Creative Commons Attribution 4.0 License.
 | 16 Jan 2024
Assessing the drift of fish aggregating devices in the tropical Pacific Ocean
Philippe F. V. W. Frankemölle
Peter D. Nooteboom
Joe Scutt Phillips
Lauriane Escalle
Simon Nicol
Erik van Sebille
The tropical Pacific Ocean is characterized by its dominant zonal flow, strong climate dependence on the El Niño–Southern Oscillation (ENSO) and abundant tuna stocks. Tuna fisheries in the West and Central Pacific Ocean accounted for 55 % of the world-wide tuna catch in 2019 and are one of the main sources of income in many Pacific island nations. One of the dominant fishing methods in this region relies on the use of drifting fish aggregating devices (dFADs): rafts with long underwater appendages (on average 50 m deep) that aggregate fish. Although currents such as the North Equatorial Countercurrent (NECC) and South Equatorial Current (SEC) in the tropical Pacific Ocean vary strongly with ENSO, little is known about the impact of this variability in flow on dFAD dispersion. In this study, virtual Lagrangian particles are tracked for the period 2006 to 2021 over the domain in a 3D hydrodynamic model and are advected in simulations with only surface flow, as well as simulations using a depth-averaged horizontal flow over the upper 50 m, representing virtual dFADs. Zonal displacements, eddy-like behaviour and ENSO variability are then studied for both types of virtual particles. It was found that virtual particles advected by surface flow only are displaced up to 35 % farther than virtual dFADs subjected to a depth-averaged flow, but no other major differences were found in dispersion patterns. The strongest correlations between ENSO and virtual dFAD dispersion for the assessed variables were found in the West Pacific Ocean, with Pearson correlation coefficients of up to 0.59 for virtual dFAD displacement. Connections between ENSO and eddy-like behaviour were found in the western part of the SEC, indicating more circulation and meandering during El Niño. These findings may be useful for improving sustainable deployment strategies during ENSO events and understanding the ocean processes driving the distribution of dFADs.
- Article
(3416 KB) - Full-text XML
- BibTeX
- EndNote


In 2019, tuna fisheries in the West and Central Pacific Ocean (WCPO) accounted for 55 % of worldwide tuna catch (Williams and Ruaia, 2020). One of the dominant fishing methods, utilized by industrial purse-seining fleets, relies on the usage of fish aggregating devices (FADs) (Davies et al., 2014). These devices aggregate fish to their location, making it easier to catch large quantities of tuna during one fishing event. These FADs can be grouped in two categories: anchored and drifting FADs (Leroy et al., 2013), where the former are generally used by coastal fleets and artisanal fishers, and the latter (dFADs) are generally used by distant-water and industrial fleets and will be the focus of this research.
In their basic form, dFADs are floating, satellite-tracked bamboo rafts with appendages underwater that can reach average depths of 50 m or more (Fonteneau et al., 2000). Due to these appendages, dFADs move slower than surface drifters (Imzilen et al., 2019). The concept of a dFAD is based around the behavioural tendency of pelagic fish, such as tuna, to associate with floating objects (Fréon and Dagorn, 2000; Castro et al., 2002).
Most technological advances, more often than not kept as trade secrets, share a common goal: increasing efficiency (Fonteneau et al., 2000). In the case of dFADs, these advances are essentially a double-edged sword. On one hand, they can help make the fishing more cost-effective and reduce carbon emissions for a purse-seining fleet, which is a highly mobile and dynamic fishery. On the other hand, however, it could lead to overfishing of stocks, unnecessary by-catch and damage to the ecosystem (Dagorn et al., 2013). Both papers by Dagorn et al. (2013) and Bailey et al. (2013) point out that with proper management these devices can be used as a safe and sustainable fishing method, and building knowledge about dFAD dynamics is important for sustainable management. Similarly, the marine pollution and damage to coastal habitats from abandoned, lost or otherwise discarded dFADs is of increasing concern (Escalle et al., 2019). Here we study the oceanographic dynamics of dFAD dispersion in the tropical Pacific Ocean, where most tuna is caught within the West Pacific warm pool (Lehodey et al., 1997) and which influences dFAD–tuna interactions (Nooteboom et al., 2023; Pérez et al., 2022).
Presumably, three main surface currents influence dFAD dispersion in the tropical Pacific Ocean: the North Equatorial Current (NEC), the South Equatorial Current (SEC) and the North Equatorial Counter Current (NECC). The first two currents flow eastward under normal conditions and are part of the two basin-wide Pacific circulation gyres. The latter current is a westward flow that transports water from the warm pool to the East Pacific Ocean (EPO) and separates the NEC from the SEC (Zhao et al., 2013). A general map showing these currents is given in Fig. A1 in the Appendix. The NEC and SEC are close to the ocean surface, and dominated by the trade winds which also blow in the eastward direction. While these currents are well studied, the effect of their inter-annual variability due to the El Niño–Southern Oscillation (ENSO) cycle on dFAD drift remains less characterized. In particular, accumulation patterns and dFAD drift are more variable in the western warm pool where the oceanography is complex and influenced more by the ENSO phase than in the EPO (Escalle et al., 2021c; Lopez et al., 2020).
During a positive ENSO phase the trade winds weaken or even reverse, changing large-scale circulation patterns (Horel, 1982) and shifting the warm pool in the zonal direction (Picaut et al., 1996). During an El Niño event, the SEC becomes weaker and the NECC becomes stronger (Wyrtki, 1975). Not only does ENSO affect the large-scale circulation, but it also influences mesoscale eddies in the tropical Pacific Ocean. An important mechanism in this study region is the barotropic shear introduced between the westward SEC and the eastward NECC (Willett et al., 2006). This generates tropical instability waves – westward travelling sea surface temperature (SST) anomalies – and tropical instability vortices – anticyclonic eddies also travelling in the westward direction. This velocity shear weakens during an El Niño event, whereas this shear is strengthened during La Niña years, resulting in stronger tropical instability waves and vortices in the latter case (Wang and Fiedler, 2006).
Although considerable research has been done on the El Niño phenomenon and even on its relation to tuna catch (e.g. Lehodey et al., 1997; Lehodey, 2001; Lu et al., 2001; Kumar et al., 2014; OFP-SPC, 2021), the impact of ENSO on the temporal variability in dFAD dispersion in the tropical Pacific Ocean is unknown. The increased attention on the number and distribution of dFADs has raised concerns on the impacts of not only dFADs actively used by fishers but also those drifting outside of the equatorial fishing zone, which subsequently cause pollution and stranding (Escalle et al., 2019). Spatial management has been suggested as one solution to this problem (Imzilen et al., 2021), but this requires a strong characterization of ocean flow and its impacts on dFAD dispersion in a region. In parallel, biodegradable dFADs are now being developed (Escalle et al., 2022a) as a possible mitigation against the marine pollution caused by conventional structures, although their degradation is highly variable (Moreno et al., 2023) and likely to be non-linear. Regardless, although all lost dFADs may retain their entire subsurface structure, many are found as simply rafts or even GPS buoys, having presumably broken apart following long drift times or rough ocean conditions (Escalle et al., 2022b). These remnants experience more surface-driven currents than when they were originally drogued at depth, further complicating spatial management and predictions of high-density areas and corridors of loss.
In the Pacific Ocean, it is estimated that 35 000 to 65 000 dFADs are deployed each year (Escalle et al., 2021b; Lopez et al., 2020). Understanding not only how dFAD drift profiles may change through their lifetime but also where and how their drift patterns may differ during their operational lifetime is a critical step towards the sustainable management of the fishery. The drift trajectories of dFADs clearly have the potential to be useful in this context but could also supplement the data provided by drifters for assimilation into ocean circulation models or other applications (Imzilen et al., 2019). However, the access to such real trajectories remains limited in the Pacific Ocean (Lopez et al., 2020; Escalle et al., 2021b). In this context, Lagrangian simulations can be used to explore the drift of virtual particles with characteristics similar to dFADs (Escalle et al., 2019; Scutt Phillips et al., 2019; Imzilen et al., 2019; Amemou et al., 2020; Curnick et al., 2021).
Here we compare drift due to two types of virtual particles: (i) virtual dFAD drift influenced by currents up to 50 m, given that dFADs are drogued during their operational lifetime, and (ii) virtual particle drift solely due to surface currents. Additionally, we study the correlation between ENSO variability and virtual dFAD displacement, dispersion and metrics that quantify the “loopiness” of their trajectories (e.g. Doglioli et al., 2006). This is done by seeding Lagrangian particles in the Pacific Ocean from 15∘ S to 15∘ N in a 3D hydrodynamic model using the horizontal flow at multiple depths.
2.1 Datasets
2.1.1 Ocean currents
We used velocity fields from the non-profit organization Mercator Ocean International (MOi). The horizontal velocity fields at all depths up to 50 m were obtained from the MOI_GLO12_WEEKLY_run_for_DAILY_FORECAST product (Mercator Ocean International, 2021). These data are the daily mean output of a 3D global ocean model assimilated with satellite data and in situ observations using the Global Ocean Reanalysis and Simulation (GLORYS) assimilation scheme. The fields have a horizontal resolution of , with 50 layers, and are available on an Arakawa C grid, without interpolation. Currently used data span from 11 October 2006 to 31 December 2021.
This product has been validated globally in Lellouche et al. (2013), where it is found that the hydrodynamic data agree well with independent observations. A very recent publication (Fritz et al., 2023) also confirms that the product captures the circulation in the Indonesian Throughflow and western tropical Pacific well. However, it is known that the tropical SEC is slightly too strong in the MOi data when compared to in situ 15 m drogued drifters (Lellouche et al., 2021), which may result in a slight overestimation of virtual dFAD displacement and loopiness for virtual particles released in the SEC. There is no dedicated validation of the full tropical Pacific circulation, but our analysis shows that the Niño3.4 index in the hydrodynamic data agrees well with SST observations (see below).
2.1.2 Sea surface temperature
SST data are taken from the NOAA Physical Sciences Laboratory. The Niño3.4 SST index is used (National Ocean and Atmospheric Administration, 2022), which is derived from SST values from the Met Office's Hadley Centre Sea Ice and Sea Surface Temperature dataset (HadISST1). For data past 1982, these values are a mixture of in situ measurements and satellite data (Rayner et al., 2003; National Centre for Atmospheric Research, 2022). The NOAA dataset gives the spatial mean of the SST over the Niño3.4 region (from 5∘ S to 5∘ N and 170 to 120∘ W; Kug et al., 2009). These data currently span from 1870 to April 2022 on a 1-month interval. To transform these data into the Niño3.4 index, the monthly climatology from 1992 to 2021 is removed.
2.2 Virtual particle simulations
The simulations are done using the Lagrangian framework Parcels (Delandmeter and Van Sebille, 2019). The simulation lasts the entire duration of the MOi datasets. Trajectories are outputted with a daily temporal resolution. Particles are integrated forwards in time with time steps of 6 h using only a kernel for 2D advection. This means we do not account for the mass and small-scale hydrodynamic properties of dFADs in this study. On the scale of the global ocean this assumption holds, as the dFADs have a very low Stokes number and as such do not have their own inertia (Van Sebille et al., 2020). Time steps of 6 h are the limit at which most particles do not travel more than 1 grid cell () per time step, satisfying the Courant–Friedrichs–Lewy condition.
Every 10th day in the simulation, 17 016 new particles are released from 15∘ N to 15∘ S and 140∘ E to 75∘ W, with a fixed 0.5∘ spacing. Particles are deleted after 30 d due to computational limits. Vertical velocities are not taken into account. Two different configurations are used to simulate virtual particle drift: (1) using a depth-averaged flow over the upper 50 m to account for dFAD appendages and (2) using surface flow only. As not all depth layers in the data are equally wide, each layer's contribution to the depth-averaged velocity is weighted depending on the layer thickness.
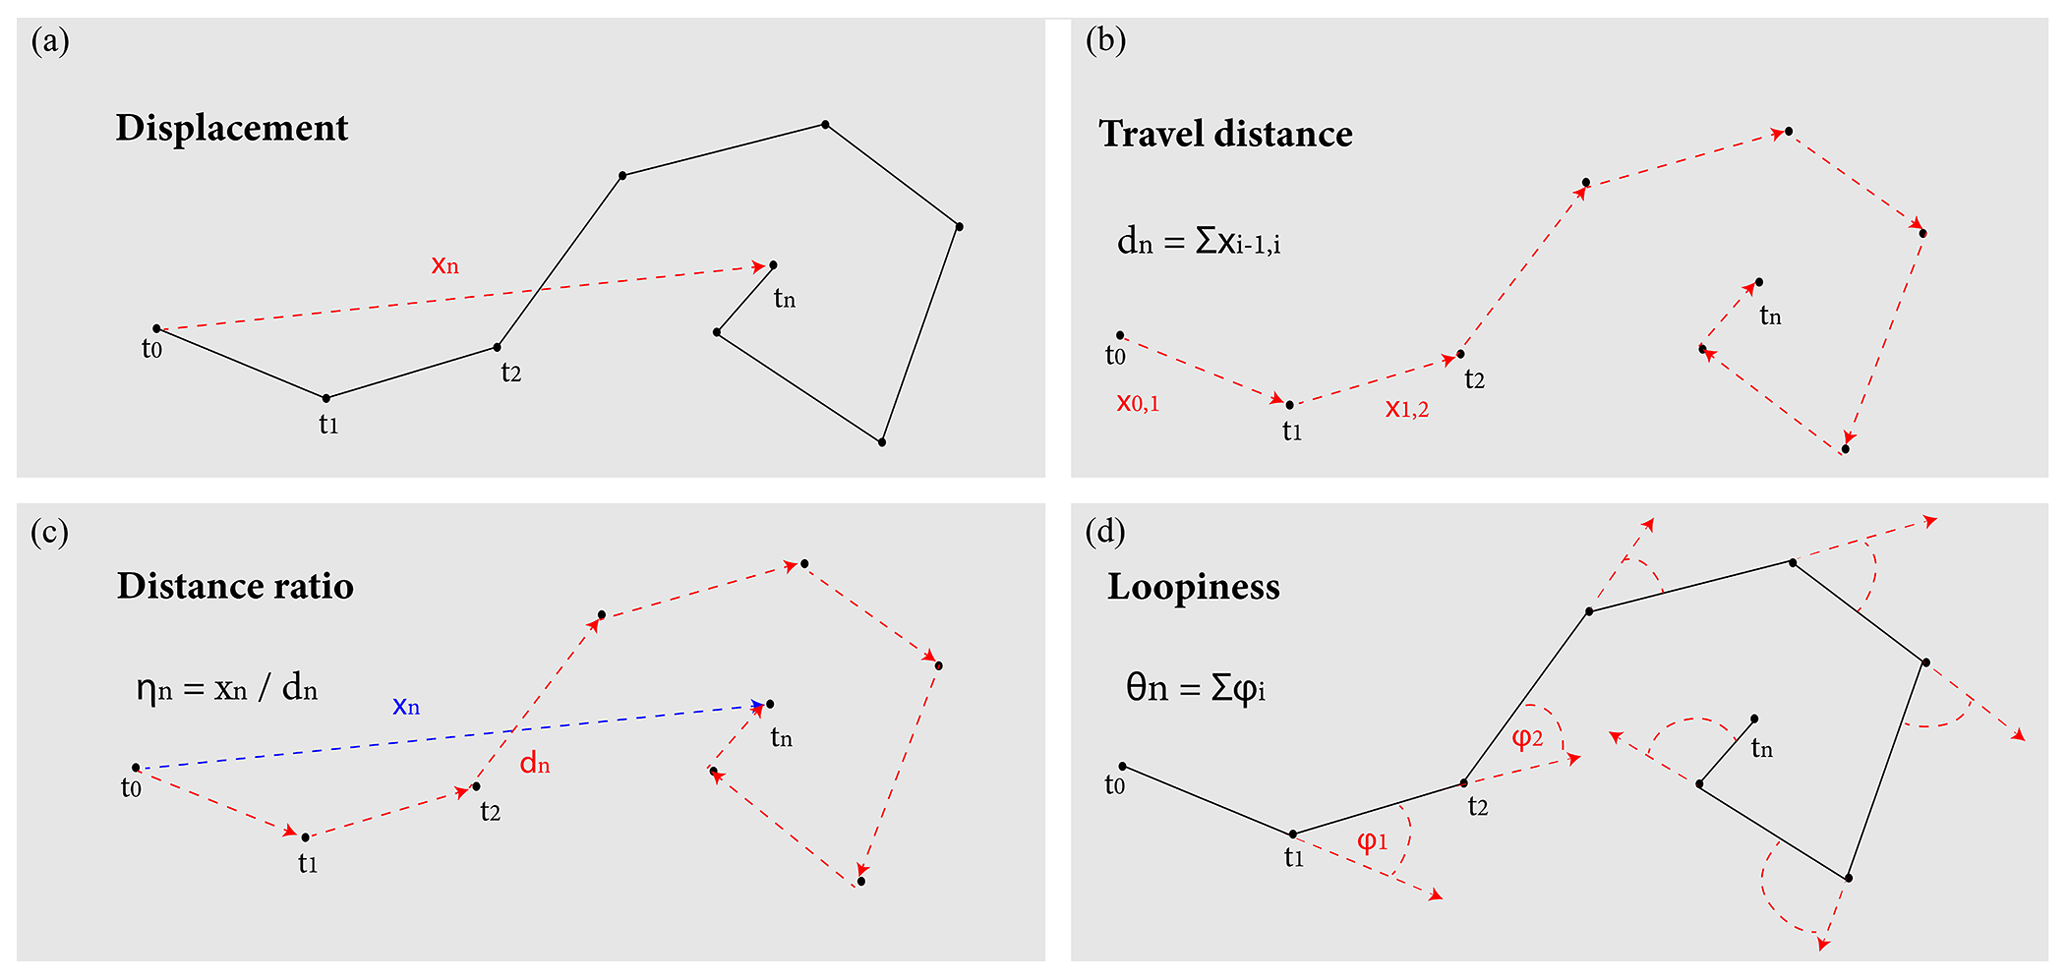
Figure 1Conceptual visualization of the metrics used in this study: displacement (a), travel distance (b), distance ratio (c) and loopiness (d).
2.3 Data analysis
2.3.1 Metrics
Displacement distance, travel distance and distance ratio
We use the displacement distance to quantify the “straightness” of a trajectory. Displacement distances are calculated using the Haversine distance: the formula for calculating the shortest distance between two points on earth. By applying this equation between every subsequent position in a trajectory and taking the sum of all of these small distances, an approximation of the travel distance is made:
where d30 is the travel distance after 30 d, and is the displacement distance between day i−1 and day i. This method becomes more inaccurate if the temporal resolution becomes lower. The distance ratio is obtained through dividing the displacement distance by the travel distance:
where η30 denotes the distance ratio and x30 the displacement distance after 30 d. Ratios closer to 1 imply straight trajectories, whereas ratios closer to 0 imply circulation to the same location.
Loopiness
Loopiness can be used to quantify eddy-like behaviour. To obtain the loopiness of a trajectory, first the bearing (angle clockwise from the north) between each point in the trajectory is calculated. Thereafter, the smallest difference between those angles is calculated, and those differences are summed up, assigning a loopiness value to a trajectory:
where θ30 is the angle after 30 d, and ϕi is the angle difference of the trajectory between day i and day i−1. Here, outliers occur when ϕi comes close to plus or minus π, as this minor difference strongly effects whether the loopiness value increases or decreases. The time step here is sufficiently small that this is a very rare occurrence such that it does not influence the statistical analysis. The definitions of the metrics described in this section are visualized in Fig. 1.
2.3.2 Analysing ENSO variability
To study variability in the virtual dFAD dispersion in relation to ENSO, the correlation between the metrics previously described and the Niño3.4 index is assessed. First, values from each metric (i.e. virtual particle’s displacement, distance ratio and loopiness) are grouped by the month in which the virtual particles were released. Second, a monthly average is calculated for each metric. Then, the correlation between the monthly average and the monthly Niño3.4 index is assessed using Pearson correlation statistics. Two-sided p values are calculated under the assumption that the metrics and the Niño3.4 index are drawn from independent normal distributions. Note that every 10th day new particles are released at the same location; hence, multiple values for displacement and loopiness are observed each month. A monthly average of these values is taken, but due to the irregular time span of months (28–31 d), these monthly averaged values consist of two, three or four data points.
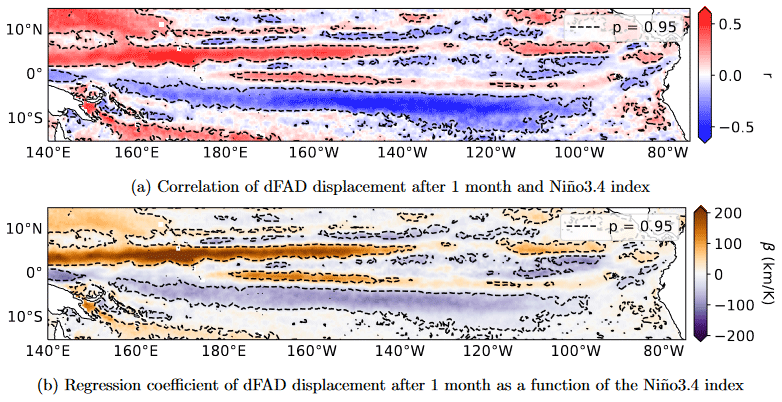
Figure 2(a) Correlation between virtual dFAD displacement after 1 month and the monthly Niño3.4 index. Positive correlations are shown in red, whereas blue colours show a negative correlation. The dotted black lines mark regions where correlations are significant (probability values larger than 95 %). (b) Linear regression coefficient between virtual dFAD displacement after 1 month and the monthly Niño3.4 index. Units are in kilometres per Kelvin (km K−1).
3.1 Displacement
Variability in the (depth-averaged) flow field in the tropical Pacific Ocean with respect to ENSO is more dominant in the zonal direction than in the meridional direction, which by extension also holds for dFAD displacement. Figure 2 shows the correlation (top figure) and linear regression coefficient (bottom figure) between virtual dFAD displacement after 1 month and the ENSO index. Overall, the largest areas with significant correlations are centred around the West and Central Pacific Ocean. The strongest variability is shown at the North Equatorial Countercurrent, with a maximum correlation coefficient of 0.59, from where simulated dFADs can end up 293 ± 30 km further away per unit of ENSO change. This is a considerable change, considering that a virtual dFAD released from this location travels roughly 1000 km in the simulation. This observation of virtual dFADs drifting further east during an El Niño event is in accordance with indications of increased strength of the NECC during El Niño (Zhao et al., 2013). The pattern of alternating positive and negative correlations surrounding the NECC is likely due to the southward shift in the NECC during the 2009–2010 (Zhao et al., 2013) and 2015–2016 (Zhou et al., 2021) El Niño events and the northward shift during La Niña. However, this latitudinal shift in the NECC does not occur during every ENSO event. Our analysis shows no significant correlations of distance ratio and loopiness in Figs. 3 and 4 in the NECC to explain these patterns with eddy-like behaviour. The South Equatorial Current weakens during a warm event (Wyrtki, 1975), offering an explanation for the strongly negatively correlated blue area, indicating that dFADs originating here are less displaced.
3.2 Mesoscale phenomena
Not all behaviour can be attributed solely to large-scale zonal flow, as mesoscale phenomena also impact dFAD trajectories. Besides only looking at how far virtual dFADs have displaced, the full trajectory can also be taken into account. In Fig. 3 the distance ratio between the displacement distance and the travel distance is given, as well as the correlation and linear regression coefficient of the Niño3.4 index.
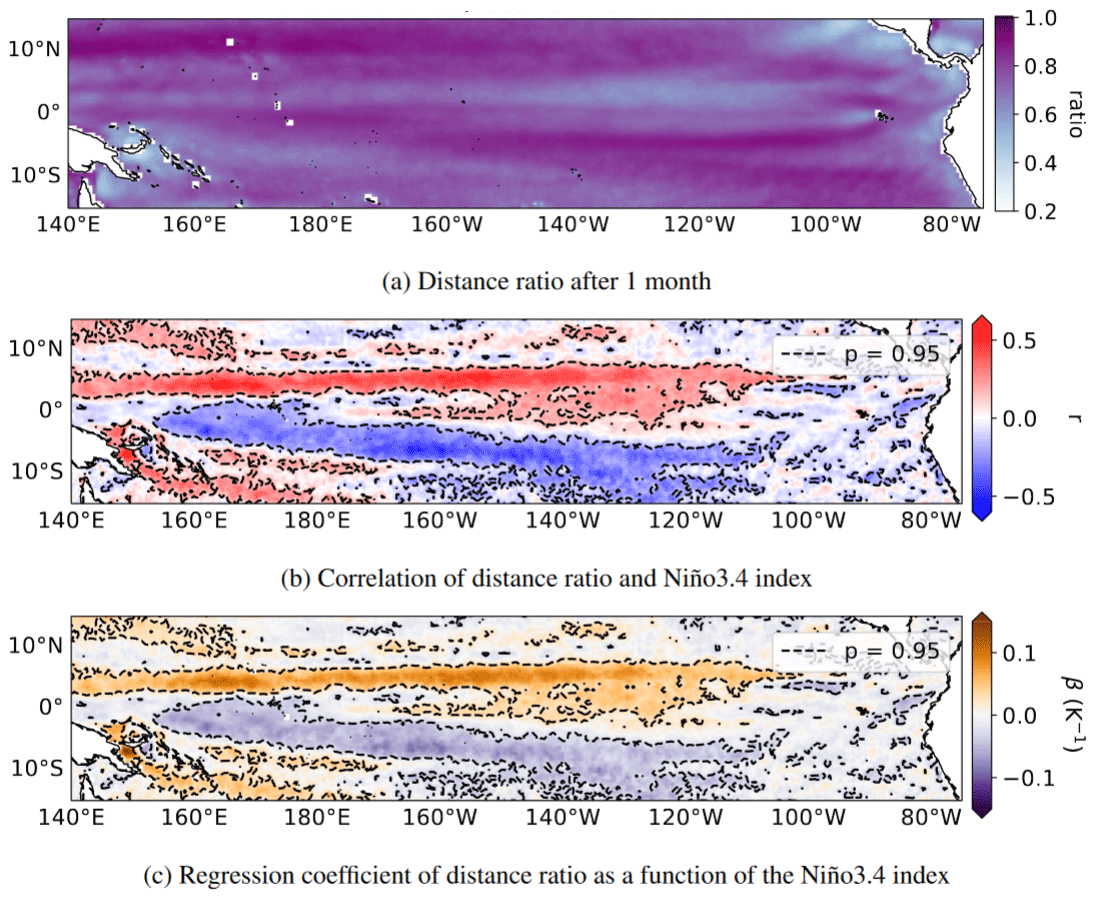
Figure 3(a) Mean virtual dFAD distance ratio after 1 month. Values closer to 1 (in dark purple) indicate nearly straight trajectories, whereas values closer to 0 (in white) indicate stronger circulation. (b) Correlation between virtual dFAD distance ratio after 1 month and the monthly Niño3.4 index. Positive correlations are shown in red, whereas blue colours show negative correlations. The dotted black lines mark regions where correlations are significant (probability values larger than 95 %). (c) Linear regression coefficient between virtual dFAD distance ratio after 1 month and the monthly Niño3.4 index. Units are in per Kelvin (K−1), where K is the unit of the ENSO index.
Figure 3b shows a large negatively correlated region in the SEC that indicates lower distance ratios during warm anomalies. This information suggests that in this region, where many Pacific island nations are located, the decrease in virtual dFAD displacement during El Niño events is also due to eddy-like behaviour. A positively correlated region is observed in the NECC that indicates higher distance ratios during warm anomalies. In the WCPO, this coincides with the region in Fig. 2a, where displacement also shows a strong positive correlation. Together, this shows that virtual dFADs are displaced further and in straighter trajectories during warm events compared to cold events.
Whereas the distance ratio measures how straight particle trajectories are, the loopiness parameter quantifies the total change in direction by taking the sum of all angles during a 1-month trajectory. The modelled loopiness is shown in Fig. 4a. The most notable feature in this figure is the near anti-symmetry between the Northern Hemisphere and Southern Hemisphere: virtual dFAD loopiness generally is clockwise in the north but anticlockwise in the south. This can almost certainly be traced back to the direction of the Coriolis acceleration on each hemisphere.
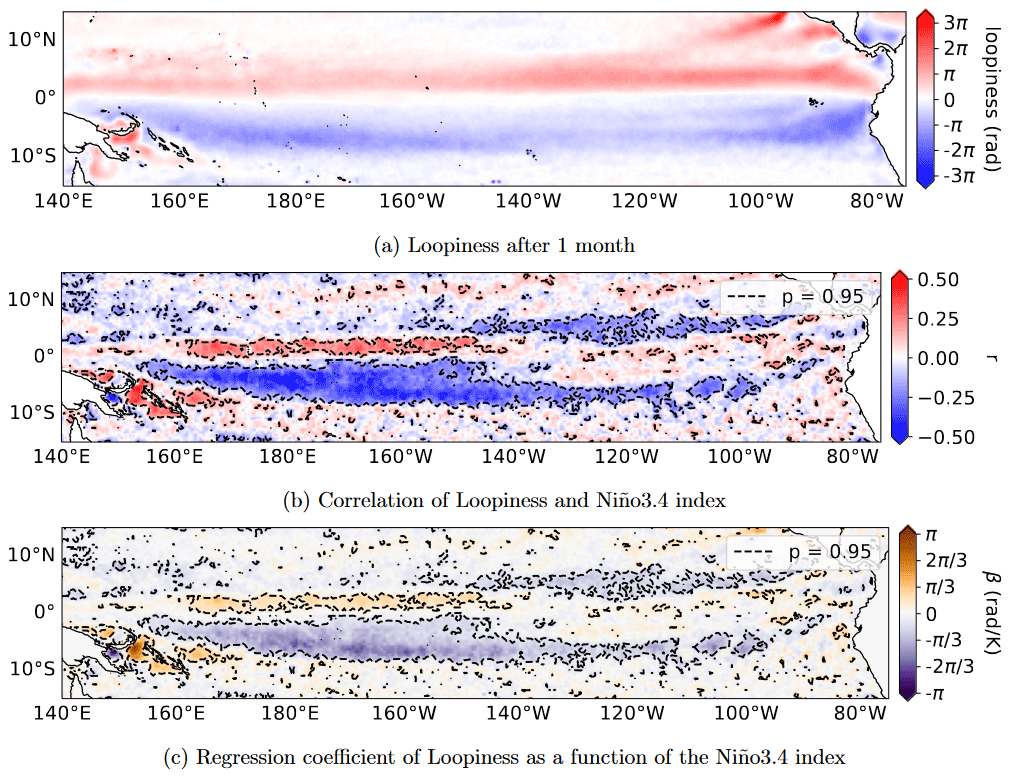
Figure 4(a) Mean virtual dFAD loopiness in radians after 1 month. Red values mark clockwise motion, and blue values mark anticlockwise motion. (b) Correlation between virtual dFAD loopiness after 1 month and the monthly Niño3.4 index. Positive correlations are shown in red, whereas blue colours show negative correlations. The dotted black lines mark regions where correlations are significant (probability values larger than 95 %). (c) Linear regression coefficient between virtual dFAD loopiness after 1 month and the monthly Niño3.4 index. Units are in radians per Kelvin (radK−1), where K is the unit of the ENSO index.
A further feature in this figure is the very low loopiness values near the Equator. This may indicate that the virtual dFAD trajectories near the Equator go straight; however, it is also plausible that this feature is the result of the positive and negative loopiness values corresponding to different Lagrangian trajectories averaging each other out.
Figure 4b and c show a large area slightly south of the Equator where loopiness is significantly negatively correlated to the Niño3.4 index. Judging from the regression coefficients, virtual dFADs seeded in this region can experience more than a 20 % change in loopiness per unit Kelvin. This region coincides with the region where the distance ratio is close to zero, supporting the observation that during El Niño events, eddy-like behaviour in the southern part of the domain becomes more prevalent. A negatively correlated patch is also observed in the East Pacific Ocean, where the NECC and the SEC shear. Together with the positive correlation of the distance ratio observed at the same location in Fig. 3b, this indicates more eddy-like behaviour during La Niña and less during El Niño in this region. This observation is in agreement with the theories that tropical instability waves are stronger in this region during a La Niña event (Yu and Liu, 2003; Imada and Kimoto, 2012) and that the associated tropical instability vortices (which grow between 3 and 8∘ N in the East Pacific Ocean) are less active during El Niño years (Yu and Liu, 2003).
3.3 Depth-averaged flow versus surface flow
The appendages of a dFAD are meant to slow down the dFAD due to the slower-moving currents below the surface. In theory, this opens up possibilities for new interactions that are unseen if only surface currents are considered, which may affect the drift of dFAD rafts after their eventual break down and sinking of their negatively buoyant appendages.
Figure 5 shows the differences between the two simulations. The displacement figures show mainly the same pattern, though with displacements up to 35 % higher over the entire domain when only accounting for surface flow. These higher displacements for surface particles are most likely due to the absence of slower subsurface currents that slow down the virtual dFAD particles. The correlation of the distance ratio and the Niño3.4 index shows similar patterns in both cases. There is however a notable difference with stronger negative correlations that stretch over a larger area in the SEC, indicating that the distance ratio of virtual particles advected by just surface flow experiences stronger variability with ENSO. Lastly, the regression coefficients of loopiness with respect to the Niño3.4 index are shown in Fig. 5e and f. Patterns are similar, with the only difference that the drogued particles in the strongly negatively correlated area experience weaker variability. A likely explanation for this behaviour is that particles with lower velocities travel shorter distances and thus make less loops, which by extension leads to weaker ENSO variability. The behaviour of stronger variability with ENSO of virtual particle drift, advected by only surface currents, shows throughout all metrics used in this research.
In this paper, we analysed the drift of virtual dFADs in the tropical Pacific Ocean using Lagrangian particle tracking. To estimate the effect of their 50 m long appendages, we applied two types of simulations. The first was performed using a depth-averaged flow over the upper 50 m, weighed by layer depth, and the second used only surface flow to advect particles. Using this method, we found that the virtual particles advected by only the surface flow can be displaced up to 35 % more than those subjected to the depth-averaged flow and have a stronger loopiness variability with respect to ENSO, but no substantial differences between the two simulations were found in patterns across the domain of the tropical Pacific Ocean.
Regions identified in this paper as having the highest loopiness and lowest displacement – the south-western part of the WCPO (Papua New Guinea, Solomon Islands, Tuvalu, Kiribati Gilbert Islands), the south-eastern EPO, and the northern part of the EPO between 3 and 8∘ N – are known areas of dFAD aggregations (Escalle et al., 2021c; Lopez et al., 2020). The zone along the Equator, characterized by very high displacements, is an area of known high-speed drifts of dFADs, where most deployments occurred in the EPO before dFADs were brought to each side of the Equator by divergent currents, either accumulating in eddies in the Northern Hemisphere or transferring towards the southern WCPO in the Southern Hemisphere (Lopez et al., 2020).
In some cases, simulations can be directly compared to observations provided by fisheries on dFAD densities (Escalle et al., 2021a; Scutt Phillips et al., 2019), but these data on dFAD distributions do not cover the entire domain studied in this paper, nor are they publicly accessible. Such data could be used to potentially improve the model, for example improving the calculation of the depth-averaged velocity field so that each depth layer is weighed depending on the actual shape of a dFAD instead of only the depth of a layer. Furthermore, scenarios that vary the depth integrated velocity field over individual particle drift times could be undertaken, adjusting the weight given to each depth layer over time to simulate the biodegradable aspect of dFADs (appendages becoming shorter over time).
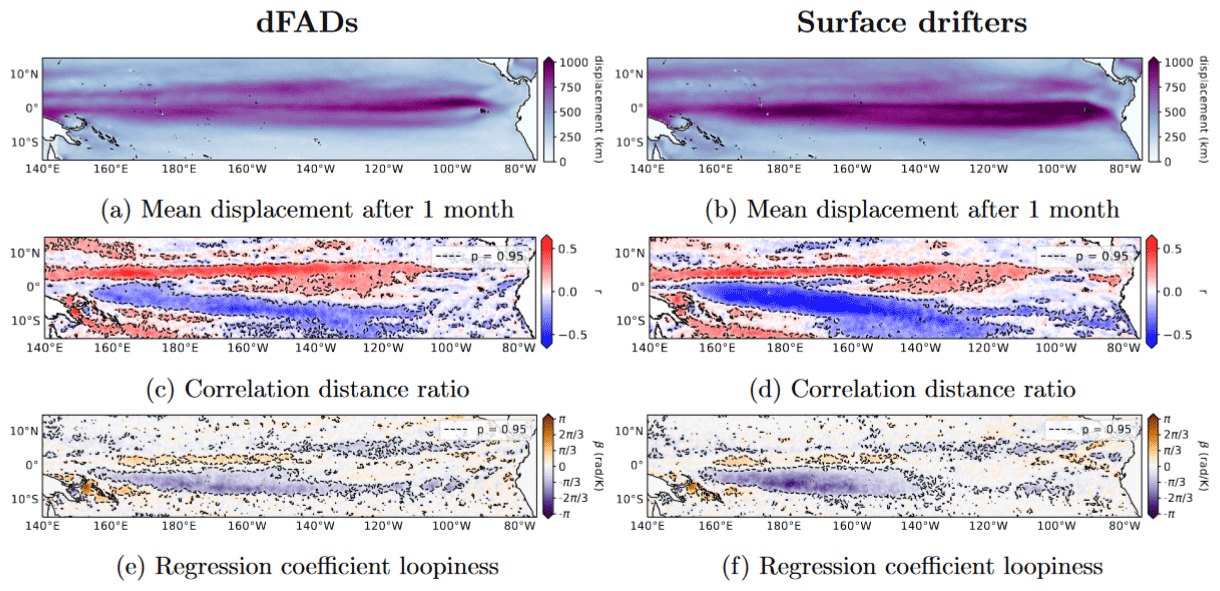
Figure 5Comparison between virtual particle simulations with depth-averaged flow (a, c, e) and only surface flow (b, d, f). (a, b) Mean particle displacement after 1 month of travel. (c, d) Correlation of distance ratio and the monthly Niño3.4 index. (e, f) Linear regression coefficient between loopiness after 1 month and the monthly Niño3.4 index.
Correlations between virtual dFAD displacement and the Niño3.4 index were very high in some locations, up to a maximum of 0.59 in the NECC, indicating strong ENSO variability. Overall, the virtual dFADs tended to be displaced more during an El Niño if seeded in the NECC and less if seeded in part of the SEC below the Equator, which can be attributed to the respective strengthening and weakening of the currents during the positive ENSO phase. These two areas with higher correlation between virtual dFAD displacement and ENSO correspond to areas with lower or higher dFAD aggregation during El Niño, relatively.
Fishing with dFADs in the WCPO NECC is generally low, and it decreases even further during El Niño, with the whole fishery moving east (Williams and Ruaia, 2020). The WCPO SEC indicates negative correlation between virtual dFAD displacement and ENSO, corresponding to an area with a higher dFAD fishing effort during El Niño (Williams and Ruaia, 2020). The mechanisms behind the observed response of the WCPO tuna fishery to El Niño (Williams and Ruaia, 2020; Lehodey et al., 1997; OFP-SPC, 2021) may be related to these same drivers of change in dFAD drift as a result of ocean flow.
Different patterns in displacement, distance ratio, loopiness and pathways often follow zonal lines, as the dominant currents in the open ocean of this domain travel mainly in the zonal direction. Dispersion in the zonal direction may however be overestimated in this research as the tropical SEC is too strong in the MOi data when compared to in situ 15 m drogued drifters (Lellouche et al., 2021).
In the EPO, stronger loopiness and lower distance ratios between the NECC and SEC (north of the Equator) were observed during colder conditions. This coincides with the region where, during La Niña, a stronger generation of tropical instability vortices takes place due to higher-velocity shear between the eastward and westward currents (Yu and Liu, 2003; Imada and Kimoto, 2012). In the WCPO, a region of stronger eddy-like behaviour was found in the SEC that became stronger during warm conditions, with decreased distance ratios and increased loopiness. South of the Equator, weak tropical instability wave (TIW) patterns exist (Xue et al., 2020), but they should have an opposite effect on our eddy statistics, compared to our observations, which suggests TIWs are not the driving mechanism behind these patterns in the WCPO SEC. The mechanisms behind this behaviour require further research, as most research on eddy polarity statistics in this region do not focus on the tropics. The main findings and reasonings of this research are summarized in Fig. 6.
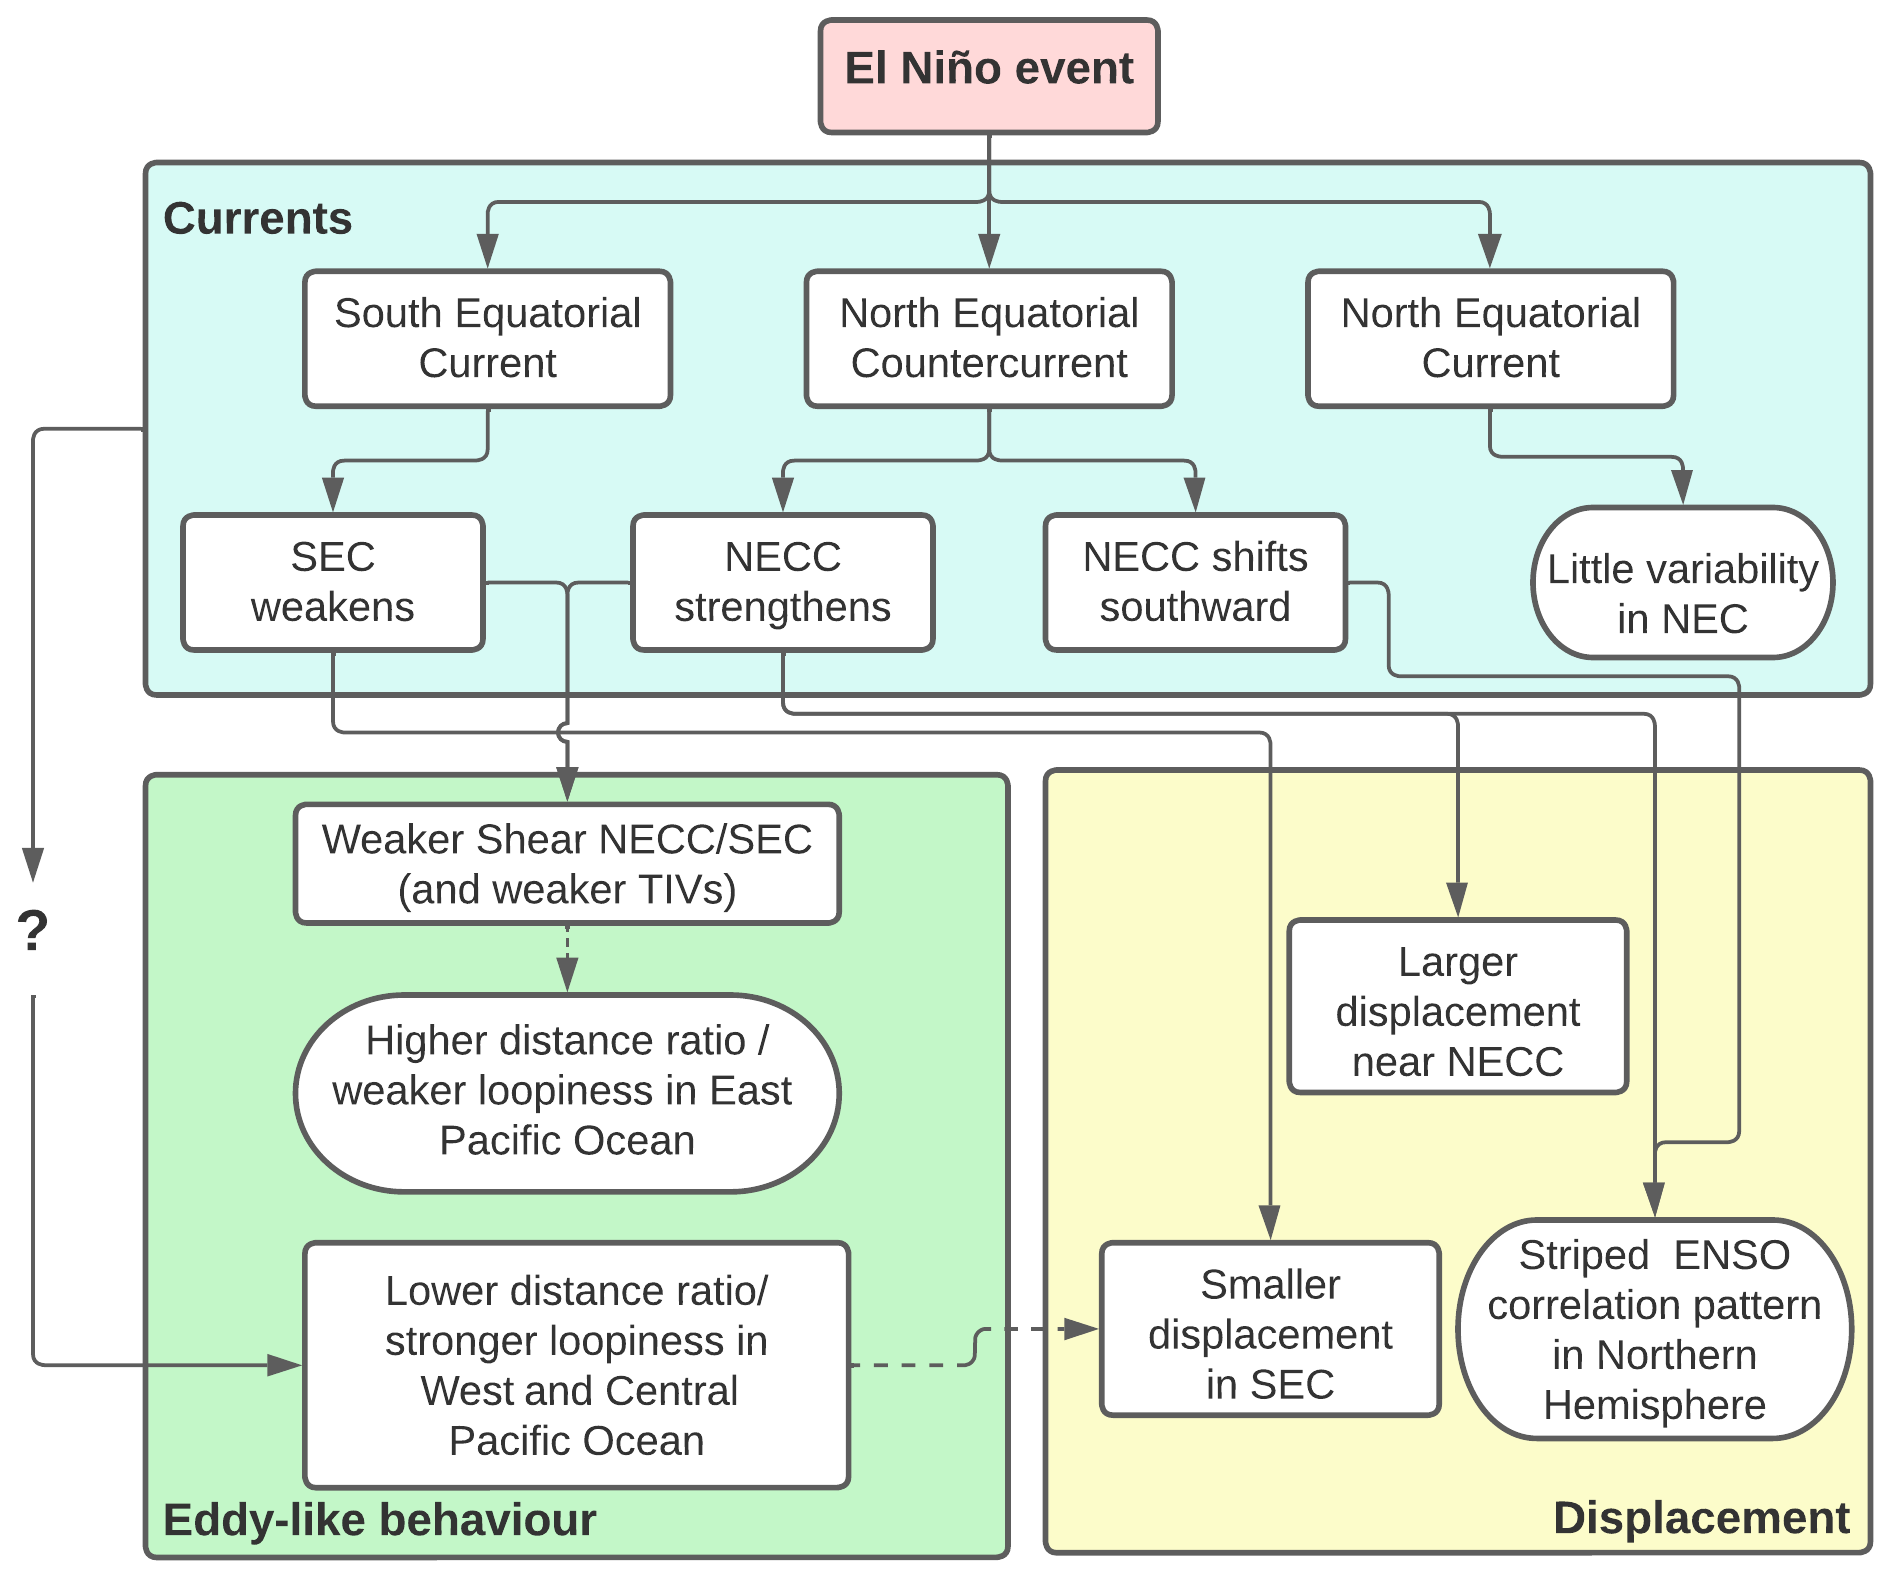
Figure 6Diagram showing the general findings and considerations of this paper. Arrows mark how findings and locations influence each other. Dashed arrows denote possible connections.
In determining the variability in virtual dFAD dispersion with respect to ENSO, correlations were significant, but only a few ENSO events took place in the time frame of this research. The results consist of data with three El Niño and three La Niña events. As the currently used datasets are still being expanded upon for the foreseeable future, more events may eventually be captured and analysed, leading to even more robust results.
Moreover, the phase of the ENSO event is mostly ignored throughout this paper. In some cases, ENSO-related variability in Pacific Ocean currents differs between the developing stages and mature stages of an El Niño/La Niña event (e.g. Wu et al., 2016; Zhai and Hu, 2012; Zhao et al., 2013; Tan and Zhou, 2018) and the delay of its effects depending on the location. In this paper, where most calculated metrics in time series data are already averaged or summed over the time of a month, there is a 1 month phase lag within the calculation of one value assigned to a trajectory. Hence, it is arbitrarily chosen as the time of virtual dFAD deployment. The effects of phase lag of calculated values such as displacement, loopiness and distance ratio with respect to the Niño3.4 index have not been investigated here.
Only a fraction of the amount of data that MOi has to offer has been used in this study, whereas their products have a lot more to offer for further research regarding dFAD drift. Future research could also focus on the actual link to tuna catch or effectiveness of certain release locations. Moreover, it could be interesting to track bio-activity along the dFAD trajectory, such as chlorophyll a concentrations, to see if and how dFADs, released in particular areas, travel through nutrient-rich areas. Furthermore, we used the distance ratio and loopiness to quantify whether dFADs appear to be travelling in an eddy, classifying it as “eddy-like behaviour”. Such data can be further built upon by tracking the along-trajectory eddy diffusivity in order to determine the mechanisms behind specific types of trajectories.
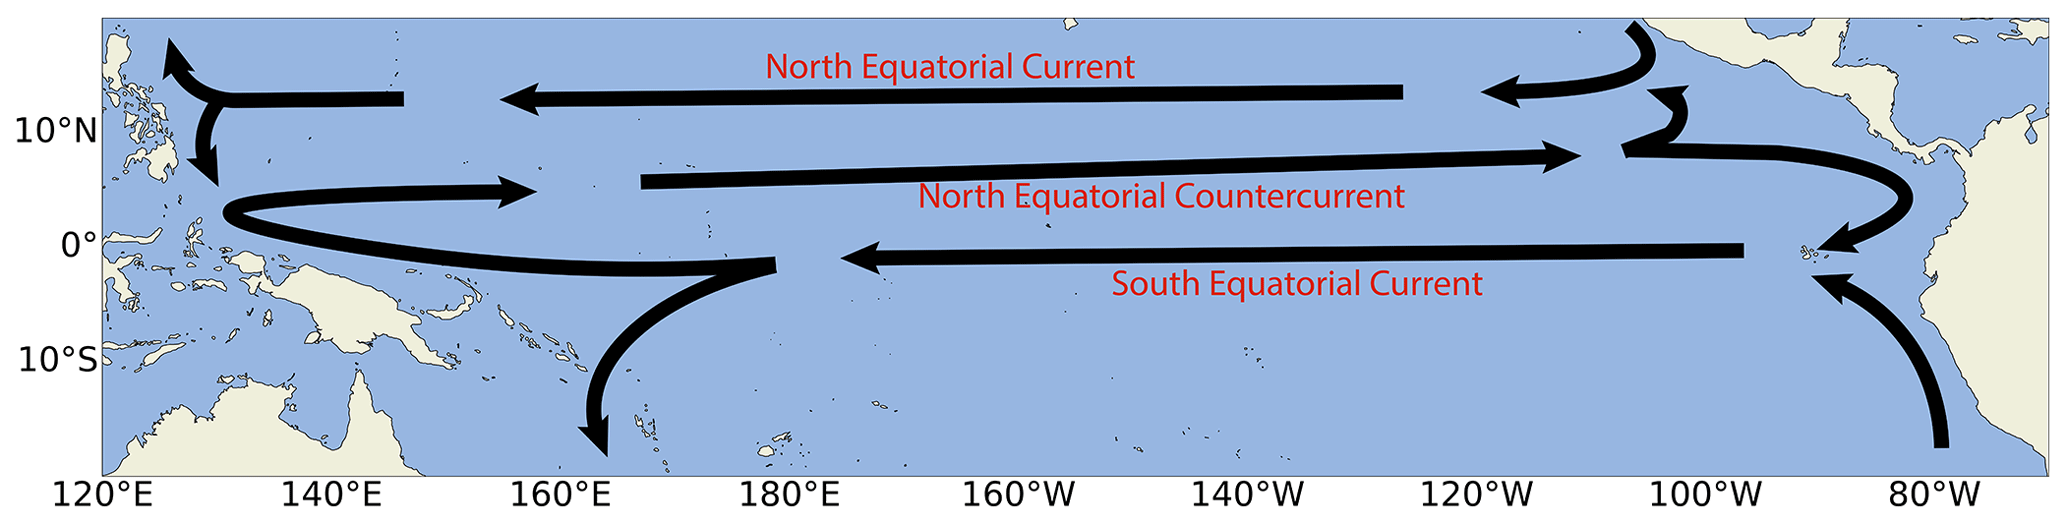
Figure A1General overview of currents in the tropical Pacific Ocean. The three main currents in the open ocean are the North Equatorial Current, the North Equatorial Countercurrent and the South Equatorial Current.
The code used to simulate the dFAD trajectories and create the figures is available via https://doi.org/10.5281/zenodo.8391419 (Frankemölle, 2023).
The MOI_GLO12_WEEKLY_run_for_DAILY_ FORECAST data are available via https://www.mercator-ocean.eu/en/solutions-expertise/accessing-digital-data/product-details/?offer=4217979b-2662-329a-907c-602fdc69c3a3&system=d35404e4-40d3-59d6-3608-581c9495d86a.
PDN and EvS had a supervisory role in the design and carrying out of the research. PFVWF designed the research, developed the model code and performed the simulations. PFVWF prepared the manuscript with contributions from all other co-authors.
At least one of the (co-)authors is a member of the editorial board of Ocean Science. The peer-review process was guided by an independent editor, and the authors also have no other competing interests to declare.
This publication was produced with the financial support of the European Union and Sweden. Its contents are the sole responsibility of the authors and do not necessarily reflect the views of the European Union and Sweden.
Publisher’s note: Copernicus Publications remains neutral with regard to jurisdictional claims made in the text, published maps, institutional affiliations, or any other geographical representation in this paper. While Copernicus Publications makes every effort to include appropriate place names, the final responsibility lies with the authors.
Funding was provided by the Western and Central Pacific Fisheries Commission (WCPFC Project 42) and the European Union “Pacific-European Union Marine Partnership” programme (agreement FED/2018/397-941).
This paper was edited by Anna Rubio and reviewed by two anonymous referees.
Amemou, H., Koné, V., Aman, A., and Lett, C.: Assessment of a Lagrangian model using trajectories of oceanographic drifters and fishing devices in the Tropical Atlantic Ocean, Prog. Oceanogr., 188, 102426, https://doi.org/10.1016/j.pocean.2020.102426, 2020. a
Bailey, M., Sumaila, U. R., and Martell, S. J.: Can cooperative management of tuna fisheries in the Western Pacific solve the growth overfishing problem, Strategic Behavior and the Environment, 3, 31–66, 2013. a
Castro, J. J., Santiago, J. A., and Santana-Ortega, A. T.: A general theory on fish aggregation to floating objects: an alternative to the meeting point hypothesis, Rev. Fish Biol. Fisher., 11, 255–277, 2002. a, b
Curnick, D. J., Feary, D. A., and Cavalcante, G. H.: Risks to large marine protected areas posed by drifting fish aggregation devices, Conserv. Biol., 35, 1222–1232, 2021. a
Dagorn, L., Holland, K. N., Restrepo, V., and Moreno, G.: Is it good or bad to fish with FADs? What are the real impacts of the use of drifting FADs on pelagic marine ecosystems?, Fish Fish., 14, 391–415, 2013. a, b
Davies, T. K., Mees, C. C., and Milner-Gulland, E.: The past, present and future use of drifting fish aggregating devices (FADs) in the Indian Ocean, Mar. Pol., 45, 163–170, 2014. a
Delandmeter, P. and van Sebille, E.: The Parcels v2.0 Lagrangian framework: new field interpolation schemes, Geosci. Model Dev., 12, 3571–3584, https://doi.org/10.5194/gmd-12-3571-2019, 2019. a
Doglioli, A., Veneziani, M., Blanke, B., Speich, S., and Grifa, A.: A Lagrangian analysis of the Indian-Atlantic interocean exchange in a regional model, Geophys. Res. Lett., 33, L14611, https://doi.org/10.1029/2006GL026498, 2006. a, b
Escalle, L., Scutt Phillips, J., Brownjohn, M., Brouwer, S., Sen Gupta, A., Van Sebille, E., Hampton, J., and Pilling, G.: Environmental versus operational drivers of drifting FAD beaching in the Western and Central Pacific Ocean, Sci. Rep., 9, 1–12, 2019. a, b, c
Escalle, L., Hare, S., Hamer, P., and Pilling, G.: Pacific dFAD retrieval feasibility study, WCPFC Scientific Committee 17th Regular Session, https://meetings.wcpfc.int/node/12852 (last access: 2 August 2023), 2021a. a, b
Escalle, L., Hare, S. R., Vidal, T., Brownjohn, M., Hamer, P., and Pilling, G.: Quantifying drifting Fish Aggregating Device use by the world's largest tuna fishery, ICES J. Mar. Sci., 78, 2432–2447, 2021b. a, b
Escalle, L., Muller, B., Hare, S., Hamer, P., and PNAO: Report on analyses of the 2016/2021 PNA FAD tracking programme, WCPFC Scientific Committee 17th Regular Session, https://meetings.wcpfc.int/node/12589 (last access: 2 August 2023), 2021c. a, b
Escalle, L., Moreno, G., Hare, S., and Hamer, P.: Report of Project 110: Non-entangling and biodegradable FAD trial in the Western and Central Pacific Ocean, WCPFC Scientific Committee 18th Regular Session, https://meetings.wcpfc.int/node/16323 (last access: 2 August 2023), 2022a. a
Escalle, L., Mourot, J., Bigler, B., Jaugeon, B., Kutan, M., Lynch, J., Nicholas, T., Pollock, K., Prioul, F., Royer, S., Thellier, T., Wichman, J., Lopez, J., Hare, S., and Hamer, P.: Preliminarily analyses of the regional database of stranded drifting FADs in the Pacific Ocean, WCPFC Scientific Committee 18th Regular Session, https://meetings.wcpfc.int/node/16329 (last access: 2 August 2023), 2022b. a
Fonteneau, A., Pallares, P., and Pianet, R.: A worldwide review of purse seine fisheries on FADs, Pêche thonière et dispositifs de concentration de poissons, Caribbean-Martinique, https://archimer.ifremer.fr/doc/00042/15278/ (last access: 22 February 2023), 15–19 October 1999, 2000. a, b
Frankemölle, P. F. V. W.: dFAD drift WTPO, Zenodo [code], https://doi.org/10.5281/zenodo.8391419 (last access: 5 January 2024), 2023. a
Fréon, P. and Dagorn, L.: Review of fish associative behaviour: toward a generalisation of the meeting point hypothesis, Rev. Fish Biol. Fish., 10, 183–207, 2000. a, b
Fritz, M., Mayer, M., Haimberger, L., and Winkelbauer, S.: Assessment of Indonesian Throughflow transports from ocean reanalyses with mooring-based observations, EGUsphere [preprint], https://doi.org/10.5194/egusphere-2023-435, 2023. a
Horel, J. D.: On the annual cycle of the tropical Pacific atmosphere and ocean, Mon. Weather Rev., 110, 1863–1878, 1982. a
Imada, Y. and Kimoto, M.: Parameterization of tropical instability waves and examination of their impact on ENSO characteristics, J. Climate, 25, 4568–4581, 2012. a, b
Imzilen, T., Chassot, E., Barde, J., Demarcq, H., Maufroy, A., Roa-Pascuali, L., Ternon, J.-F., and Lett, C.: Fish aggregating devices drift like oceanographic drifters in the near-surface currents of the Atlantic and Indian Oceans, Prog. Oceanogr., 171, 108–127, 2019. a, b, c
Imzilen, T., Lett, C., Chassot, E., and Kaplan, D. M.: Spatial management can significantly reduce dFAD beachings in Indian and Atlantic Ocean tropical tuna purse seine fisheries, Biol. Conserv., 254, 108939, https://doi.org/10.1016/j.biocon.2020.108939, 2021. a
Kug, J.-S., Jin, F.-F., and An, S.-I.: Two types of El Niño events: cold tongue El Niño and warm pool El Niño, J. Climate, 22, 1499–1515, 2009. a
Kumar, P. S., Pillai, G. N., and Manjusha, U.: El Nino southern oscillation (ENSO) impact on tuna fisheries in Indian Ocean, SpringerPlus, 3, 1–13, 2014. a, b
Lehodey, P.: The pelagic ecosystem of the tropical Pacific Ocean: dynamic spatial modelling and biological consequences of ENSO, Prog. Oceanogr., 49, 439–468, 2001. a, b
Lehodey, P., Bertignac, M., Hampton, J., Lewis, A., and Picaut, J.: El Niño Southern Oscillation and tuna in the Western Pacific, Nature, 389, 715–718, 1997. a, b, c, d
Lellouche, J.-M., Le Galloudec, O., Drévillon, M., Régnier, C., Greiner, E., Garric, G., Ferry, N., Desportes, C., Testut, C.-E., Bricaud, C., Bourdallé-Badie, R., Tranchant, B., Benkiran, M., Drillet, Y., Daudin, A., and De Nicola, C.: Evaluation of global monitoring and forecasting systems at Mercator Océan, Ocean Sci., 9, 57–81, https://doi.org/10.5194/os-9-57-2013, 2013. a
Lellouche, J.-M., Greiner, E., Bourdallé-Badie, R., Garric, G., Melet, A., Drévillon, M., Bricaud, C., Hamon, M., Le Galloudec, O., Regnier, C., Candela, T., Testut, C.-E., Gasparin, F., Ruggiero, G., Benkiran, M., Drillet, Y., and Le Traon, P.-Y.: The Copernicus global oceanic and sea ice GLORYS12 reanalysis, Front. Earth Sci., 585, 1–27, https://doi.org/10.3389/feart.2021.698876, 2021. a, b
Leroy, B., Phillips, J. S., Nicol, S., Pilling, G. M., Harley, S., Bromhead, D., Hoyle, S., Caillot, S., Allain, V., and Hampton, J.: A critique of the ecosystem impacts of drifting and anchored FADs use by purse-seine tuna fisheries in the Western and Central Pacific Ocean, Aquat. Living Resour., 26, 49–61, 2013. a
Lopez, J., Román, M., Lennert-Cody, C., Maunder, M., and Vogel, N.: Floating-object fishery indicators, Inter-American Tropical Tuna Commision, https://doi.org/10.13140/RG.2.2.21748.17286, 2020. a, b, c, d, e
Lu, H.-J., Lee, K.-T., Lin, H.-L., and Liao, C.-H.: Spatio-temporal distribution of yellowfin tuna Thunnus albacares and bigeye tuna Thunnus obesus in the Tropical Pacific Ocean in relation to large-scale temperature fluctuation during ENSO episodes, Fish. Sci., 67, 1046–1052, 2001. a, b
Mercator Ocean International: MOI GLO12, https://www.mercator-ocean.eu/en/solutions-expertise/accessing-digital-data/product-details/?offer=4217979b-2662-329a-907c-602fdc69c3a3&system=d35404e4-40d3-59d6-3608-581c9495d86a, (last access: 28 June 2022), 2021. a
Moreno, G., Salvador, J., Zudaire, I., Murua, J., Pelegrí, J. L., Uranga, J., Murua, H., Grande, M., Santiago, J., and Restrepo, V.: The Jelly-FAD: A paradigm shift in the design of biodegradable Fish Aggregating Devices, Mar. Pol., 147, 105352, https://doi.org/10.1016/j.marpol.2022.105352, 2023. a
National Centre for Atmospheric Research: SST Data: HADISST v1.1, https://climatedataguide.ucar.edu/climate-data/sst-data-hadisst-v11, (last access: 16 May 2022), 2022. a, b
National Ocean and Atmospheric Administration: Niño3.4 SST index, https://psl.noaa.gov/gcos_wgsp/Timeseries/Data/nino34.long.data, (last access: 3 May 2022), 2022. a
Nooteboom, P., Scutt Phillips, J., Kehl, C., Nicol, S., and van Sebille, E.: Modelling of tuna around fish aggregating devices: The importance of ocean flow and prey, Ecol. Model., 475, 110188, https://doi.org/10.1016/j.ecolmodel.2022.110188, 2023. a
OFP-SPC: WCPO Ecosystem and Climate Indicators from 2000 to 2020, WCPFC Scientific Committee 17th Regular Session, https://meetings.wcpfc.int/node/12606 (last access: 7 December 2022), 2021. a, b, c
Picaut, J., Ioualalen, M., Menkès, C., Delcroix, T., and Mcphaden, M. J.: Mechanism of the zonal displacements of the Pacific warm pool: Implications for ENSO, Science, 274, 1486–1489, 1996. a
Pérez, G., Dupaix, A., Dagorn, L., Deneubourg, J., Holland, K., Beeharry, S., and Capello, M.: Correlated Random Walk of tuna in arrays of Fish Aggregating Devices: A field-based model from passive acoustic tagging, Ecol. Model., 470, 110006, https://doi.org/10.1016/j.ecolmodel.2022.110006, 2022. a
Rayner, N., Parker, D. E., Horton, E., Folland, C. K., Alexander, L. V., Rowell, D., Kent, E. C., and Kaplan, A.: Global analyses of sea surface temperature, sea ice, and night marine air temperature since the late nineteenth century, J. Geophys. Res.-Atmos., 108, 4407, https://doi.org/10.1029/2002JD002670, 2003. a, b
Scutt Phillips, J., Escalle, L., Pilling, G., Gupta, A. S., and Van Sebille, E.: Regional connectivity and spatial densities of drifting fish aggregating devices, simulated from fishing events in the Western and Central Pacific Ocean, Environ. Res. Commun., 1, 055001, https://doi.org/10.1088/2515-7620/ab21e9, 2019. a, b, c
Tan, S. and Zhou, H.: The observed impacts of the two types of El Niño on the North Equatorial Countercurrent in the Pacific Ocean, Geophys. Res. Lett., 45, 10–493, 2018. a, b
Van Sebille, E., Aliani, S., Law, K. L., Maximenko, N., Alsina, J. M., Bagaev, A., Bergmann, M., Chapron, B., Chubarenko, I., Cózar, A., et al.: The physical oceanography of the transport of floating marine debris, Environ. Res. Lett., 15, 023003, https://doi.org/10.1088/1748-9326/ab6d7d, 2020. a
Wang, C. and Fiedler, P. C.: ENSO variability and the eastern tropical Pacific: A review, Prog. Oceanogr., 69, 239–266, 2006. a
Willett, C. S., Leben, R. R., and Lavín, M. F.: Eddies and tropical instability waves in the eastern tropical Pacific: A review, Prog. Oceanogr., 69, 218–238, 2006. a
Williams, P. and Ruaia, T.: Overview of tuna fisheries in the Western and Central Pacific Ocean, including economic conditions – 2019, WCPFC Scientific Committee 16th Regular Session, https://meetings.wcpfc.int/node/11677 (last access: 8 December 2022), 2020. a, b, c, d
Wu, G., Zhai, F., and Hu, D.: Interannual variations of North Equatorial Current transport in the Pacific Ocean during two types of El Niño, Chin. J. Ocean. Limnol., 34, 585–596, 2016. a, b
Wyrtki, K.: El Niño—the dynamic response of the equatorial Pacific Ocean to atmospheric forcing, J. Phys. Ocean., 5, 572–584, 1975. a, b
Xue, A., Jin, F.-F., Zhang, W., Boucharel, J., Zhao, S., and Yuan, X.: Delineating the seasonally modulated nonlinear feedback onto ENSO from tropical instability waves, Geophys. Res. Lett., 47, e2019GL085863, https://doi.org/10.1029/2019GL085863, 2020. a
Yu, J.-Y. and Liu, W. T.: A linear relationship between ENSO intensity and tropical instability wave activity in the eastern Pacific Ocean, Geophys. Res. Lett., 30, 1735, https://doi.org/10.1029/2003GL017176, 2003. a, b, c
Zhai, F. and Hu, D.: Interannual variability of transport and bifurcation of the North Equatorial Current in the tropical North Pacific Ocean, Chin. J. Ocean. Limnol., 30, 177–185, 2012. a, b
Zhao, J., Li, Y., and Wang, F.: Dynamical responses of the west Pacific North Equatorial Countercurrent (NECC) system to El Niño events, J. Geophys. Res.-Oceans, 118, 2828–2844, 2013. a, b, c, d, e
Zhou, H., Liu, H., Tan, S., Yang, W., Li, Y., Liu, X., Ren, Q., and Dewar, W. K.: The Observed North Equatorial Countercurrent in the Far Western Pacific Ocean during the 2014–16 El Niño, J. Phys. Ocean., 51, 2003–2020, 2021. a