the Creative Commons Attribution 4.0 License.
the Creative Commons Attribution 4.0 License.
 | 08 Jan 2024
Integration of microseism, wavemeter buoy, HF radar and hindcast data to analyze the Mediterranean cyclone Helios
Alfio Marco Borzì
Vittorio Minio
Raphael De Plaen
Thomas Lecocq
Salvatore Alparone
Salvatore Aronica
Flavio Cannavò
Fulvio Capodici
Giuseppe Ciraolo
Sebastiano D'Amico
Danilo Contrafatto
Giuseppe Di Grazia
Ignazio Fontana
Giovanni Giacalone
Graziano Larocca
Carlo Lo Re
Giorgio Manno
Gabriele Nardone
Arianna Orasi
Marco Picone
Giovanni Scicchitano
Andrea Cannata
In this work, we study a Mediterranean cyclone, Helios, which took place during 9–11 February 2023 in the southeastern part of Sicily and Malta, by a multiparametric approach combining microseism results with sea state and meteorological data provided by wavemeter buoy, HF radar, hindcast maps and satellite SEVIRI images. The sub-tropical system Helios caused heavy rainfall, strong wind gusts and violent storm surges with significant wave heights greater than 5 m. We deal with the relationships between such a system and the features of microseism (the most continuous and ubiquitous seismic signal on Earth) in terms of spectral content, space–time variation of the amplitude and source locations tracked by means of two methods (amplitude-based grid search and array techniques). By comparing the location of the microseism sources and the area affected by significant storm surges derived from sea state data, we note that the microseism location results are in agreement with the real position of the storm surges. In addition, we are able to obtain the seismic signature of Helios using a method that exploits the coherence of continuous seismic noise. Hence, we show how an innovative monitoring system of the Mediterranean cyclones can be designed by integrating microseism information with other techniques routinely used to study meteorological phenomena.
- Article
(3801 KB) - Full-text XML
-
Supplement
(2499 KB) - BibTeX
- EndNote


Significant storm surges driven by intense low-pressure systems represent one of the main hazards to the Mediterranean coastal areas causing flooding, beach erosion and damage to infrastructures and cultural heritages (Flaounas et al., 2022; Lionello et al., 2019). Occasionally, when there are favorable conditions like high sea temperature and high contrast of sea–air temperature, the cyclones can acquire the characteristics of a Mediterranean hurricane (hereafter “medicane”). Medicane genesis is favored when an extratropical depression gets isolated from the polar jet stream. The “cut-off” feature, when situated above the Mediterranean Sea, remains relatively stable and takes advantage of the abundant heat and humidity from the sea to generate organized convection (Faranda et al., 2022).
The structure of a medicane is characterized by the presence of a central free-cloud “eye”, a strong rotation around the pressure minimum, an eyewall with convective cells, from which rain bands extend. It can be considered as a small-scale tropical cyclone and can lead to sea level rise, storm surge and sea waves that can reach significant heights of about 5 m (Miglietta and Rotunno, 2019). The typical medicane lifetime is limited to generally 2–5 d as a result of the small areal extension of the Mediterranean Sea that represents their main energy source. For the same reason also the diameter is generally restricted to a range between 100 and 300 km (Comellas et al., 2021), and medicane intensity rarely exceeds the category 1 of the Saffir–Simpson hurricane wind scale (Miglietta end Rotunno, 2019). In addition, due to the geometrical and meteorological characteristics of the Mediterranean Sea, a medicane reaches fully tropical characteristics (a symmetric, deep, warm-core structure and convection in its development and maintenance) for a short time, while extratropical features (non-symmetrical structure and not well-developed convection around the core) prevail for most of its lifetime (Miglietta et al., 2011, 2013). As yet, there is no clear separation between tropical and extratropical cyclones, and the first approach to differentiate these cyclones was developed by Hart (2003). This method, called cyclone phase space analysis, relies on a large spectrum of different cyclone types by using several parameters such as the symmetry/asymmetry and the cold or warm core. In this way, as explained by Hart, an objective classification of cyclone phase is possible, merging the basic structural description of tropical, extratropical and hybrid cyclones into a continuum. The favorable months for medicanes to be generated are September to January. Indeed, during these months the Mediterranean Sea preserves high temperatures after summer and the first cold upper-air troughs are observed, thus creating a high sea–air temperature gradient (Cavicchia et al., 2014; Nastos et al., 2018). Specifically, the occurrence of intense convective instability is initiated when the polar jet stream transports cold air masses over the warmer Mediterranean Sea (Cavicchia et al., 2014; Nastos et al., 2018). Medicane generation during February and March is possible but less common (Cavicchia et al., 2014, Tous and Romero, 2013).
These Mediterranean extreme weather events cause various types of damage and harm, such as floods, deaths and injuries, in several Mediterranean coastal areas (e.g., southern France, central and southern Italy, Malta, Balearic Islands, Greece, Crete, Turkey and some African states; Androulidakis et al., 2022; Bouin and Brossier, 2020; Carrió et al., 2017; Dafis et al., 2018; Di Muzio et al., 2019; Faranda et al., 2022; Kerkmann and Bachmeier, 2011; Lagouvardos et al., 2022; Pravia-Sarabia et al., 2021; Portmann et al., 2020; Rumora et al., 2018; Varlas et al., 2020; Zimbo et al., 2022). As explained by Cavicchia et al. (2014), the most frequent regions of origin are the Balearic Islands and the Ionian Sea. In particular, during the past 12 years the majority of medicanes have developed over the Ionian Sea, and this is probably linked to the sea surface temperature that, as shown by Shaltout and Omstedt (2014), in the Ionian Sea is constantly 1.0–1.5 ∘C higher than that in the Tyrrhenian Sea.
Although these extreme Mediterranean events show significant wave heights (SWH, defined as the average wave height of the highest one-third of the waves), comparable to those of common seasonal storms, they cause greater coastal flooding (Scardino et al., 2022; Scicchitano et al., 2021). The strong winds generated during a medicane cause the development of powerful wave motions and lead to an energy transfer from the sea waves to the solid earth (Borzì et al., 2022). This energy transfer between the atmosphere, the hydrosphere and the solid earth is one of the generation mechanisms of the most continuous and ubiquitous seismic signal on the Earth, called microseism (e.g., Hasselmann, 1963; Longuet-Higgins, 1950). In connection with the spectral content and the source mechanism (e.g., Haubrich and McCamy, 1969), it is possible to divide this signal into (i) a primary microseism (PM), which has the same duration as the oceanic waves (13–20 s) and low amplitudes, and is generated by the energy transfer of oceanic waves breaking against the shoreline (Ardhuin et al., 2015; Hasselmann, 1963); (ii) a secondary microseism (SM), generated by sea waves with the same frequency traveling in opposite directions and exhibiting a frequency about twice that of the oceanic waves (duration of 5–10 s) and amplitude higher than that of the PM (e.g., Ardhuin and Roland, 2012; Ardhuin et al., 2015; Lepore and Grad, 2018; Longuet-Higgins, 1950; Oliver and Page, 1963); or (iii) a short-period secondary microseism (SPSM), which has a duration shorter than 5 s and is generated by the interaction between local wave motions near the coastline (Bromirski et al., 2005).
Several works deal with the relationship between microseisms and the sea state (Ardhuin et al., 2019; Cannata et al., 2020; Guerin et al., 2022; Minio et al., 2023; Moschella et al., 2020), while others take into account specifically the relationship between microseisms and cyclonic activity (e.g., Bromirski, 2001; Bromirski et al., 2005; Gerstoft et al., 2006; Gualtieri et al., 2018; Lin et al., 2017; Retailleau and Gualtieri, 2019, 2021; Zhang et al., 2010) considering, in particular, typhoons (Lin et al., 2017), tropical cyclones (Zhang et al., 2010) and hurricanes (Gerstoft et al., 2006). Interestingly, Bromirski (2001) and Bromirski et al. (2005) showed that the microseism bands most affected by the presence of a cyclone are the SM and SPSM bands.
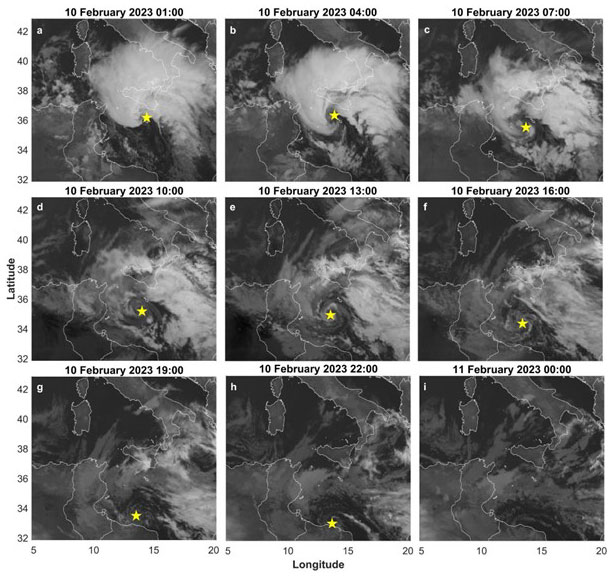
Figure 1Satellite images of the Mediterranean area and of the sub-tropical system Helios during 10 February 2023 01:00 to 11 February 2023 00:00. The yellow stars in (a)–(h) show the position of the cyclone eye. The lack of the star in (i) is due to the dissipation of Helios after the landfall against the Libyan coast (h). (© EUMETSAT SEVIRI images).
For the first time, the relationship between SM, SPSM, and medicane was analyzed by Borzì et al. (2022), who considered the medicane Apollo to reconstruct the seismic variation in terms of power spectral density (PSD), root mean square (RMS) amplitude and medicane position during its lifetime by two methods (array analysis and grid search method by means of seismic amplitude decay). In this work, we explore the relationship between microseisms and the sub-tropical system Helios which occurred in the Sicily Channel during 9–11 February 2023 (Fig. 1). The microseism results are integrated with wavemeter buoy, HF radar, hindcast and satellite data (SEVIRI images) to perform an investigation as comprehensive as possible of this extreme Mediterranean meteo-marine event.
During 9–11 February 2023, a low-pressure system, later renamed Helios, developed over the Sicily Channel due to the strong contrast between the very cold air, coming from the northeast (Balkans area) and the relatively warm sea surface. From satellite data, the warm core anomaly of this cyclone is evident, requisite for the development of the medicane. However, this storm failed to become a medicane, for which it is necessary that the cyclone maintain a well-developed convection around the eye, absent in this case probably due to a little interaction between the sea–air interface caused by a sea surface temperature not suitable for the development of a medicane (D'Adderio et al., 2023; also see MedCyclones, 2023a, b, c).
In spite of this, Helios, due to its proximity to the Sicilian and Maltese coasts, produced damage along these areas. The effects of Helios were significant, especially in the Catania, Ragusa and Siracusa provinces (located in the southeastern part of Sicily), and the Sicilian meteorological service (“Regione Siciliana–SIAS–Servizio Informativo Agrometeorologico Siciliano”, http://www.sias.regione.sicilia.it/; last access: 20 December 2023) recorded (i) heavy rainfall (i.e., more than 200 mm over 48 h and peaks of about 500 mm over 48 h near Noto for 9–10 February 2023), (ii) heavy snowfall starting from 1200 m a.s.l. with accumulations of fresh snow on Etna deeper than 2 m, (iii) strong wind gusts up to 90 km h−1 along the exposed coast (Davies, 2023) and (iv) severe storm surge with SWH greater than 5 m. Similar effects were also recorded in Malta. The minimum pressure value in the cyclone eye amounted to 1002 hPa. An overview of the positions and the extension of Helios is presented in Fig. 1.
As a consequence of the damage caused by Helios, the regional Sicilian government decided to require a state of emergency for 12 months for all the municipalities of the Catania, Siracusa and Ragusa provinces and some municipalities of Messina province (Delibera di Giunta – Regione Siciliana, 2023).
We analyzed the data recorded from 8 to 13 February 2023 comprising the development of Helios, the climax in terms of minimum pressure value, wind velocity, precipitation intensity and SWH, and its decline.
Table 1Main features of the microseism sources and comparison with the coordinates of the cyclone eye retrieved from satellite data. The coordinates of the cyclone eye between 08:00 of 9 February and 00:00 of 10 February are absent since the cyclone eye is clearly visible between 01:00 and 23:00 of 10 February 2023.
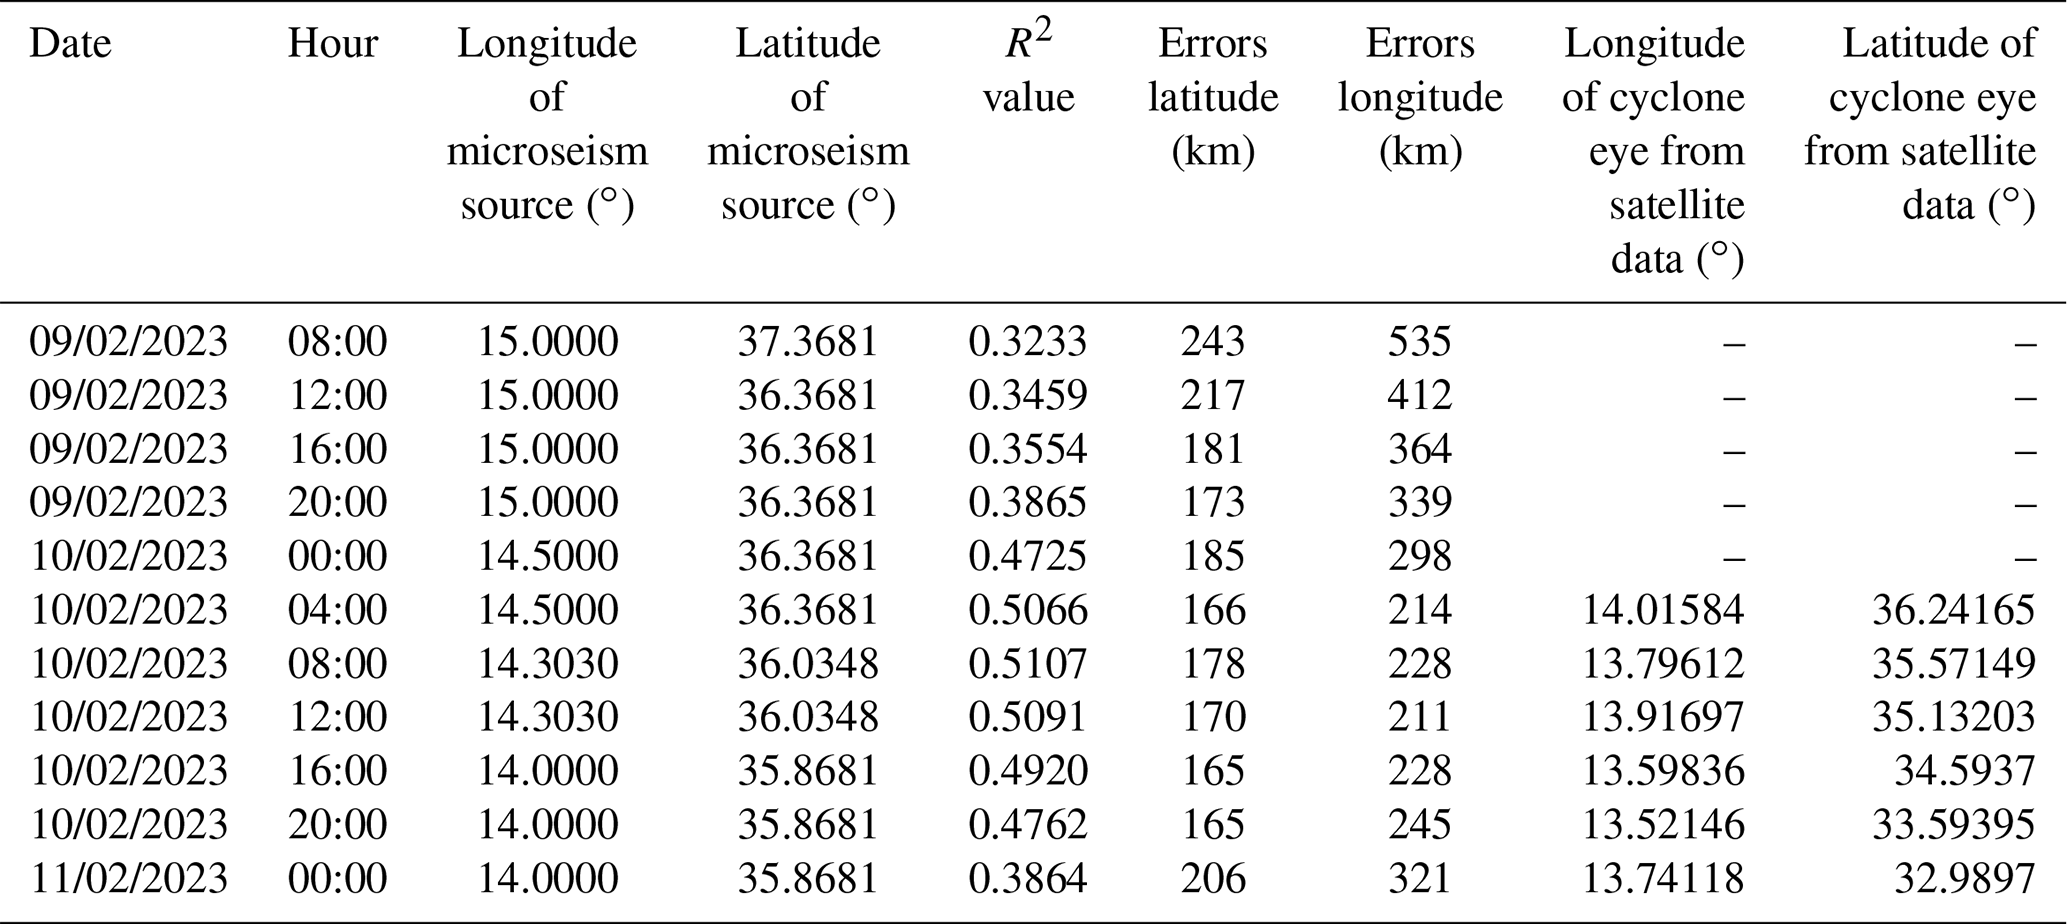
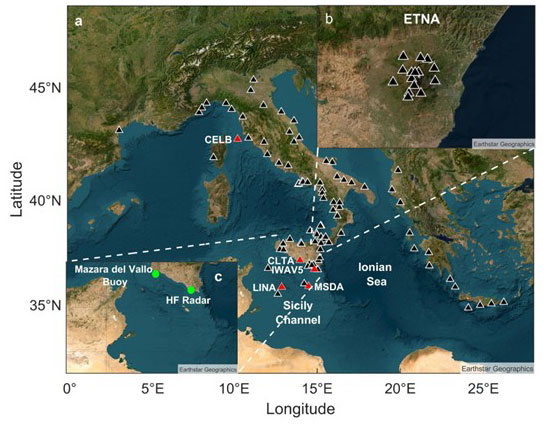
Figure 2Satellite image of the Mediterranean area with a selection of the broadband seismic stations available in the ORFEUS and INGV databases and used in the spectral analysis and in the grid search method (a) and selection of the broadband seismic stations in the Etna area maintained by INGV-OE (b), used in the array analysis (base image source © Earthstar Geographic). The red triangles indicate the stations used in the detailed analysis shown in Figs. 3 and 9 and in Figs. S1 and S2. The green dots in (c) indicate the position of the wavemeter buoy (Mazara del Vallo) and of the HF radar (Marina di Ragusa) used for the sea state monitoring.
3.1 Seismic data
We used 105 seismic stations installed along the Italian and French coastal areas, in the Sicily Channel coastlines (on Malta, Lampedusa and Linosa islands), in Corsica and along the Greek coastal areas to perform spectral analysis, localization analysis by the grid search method based on seismic amplitude decay and to obtain the seismic signature of the analyzed event (Fig. 2a; Table S1 in the Supplement). Three of these stations (IWAV2, IWAV3 and IWAV5) were installed as part of the i-waveNET “Implementation of an innovative system for monitoring the state of the sea in climate change scenarios” project, funded by the Interreg Italia-Malta Programme (https://iwavenet.eu/; last access: 24 October 2023; notice 2/2019 Axis 3; project code C2-3.2-106). The aim of this project is to set up an innovative sea state monitoring network integrating different measurement technologies such as HF radars, seismic stations, sea level probes, wave buoys and weather stations. Additionally, 15 seismic stations, installed in the Etnean area, were used to conduct array analysis (Fig. 2b; Table S2). The selected seismic stations have specific characteristics: they are installed near the coastal areas and equipped with three-component broadband seismic sensors.
3.2 Sea state measures
In this work, we use sea state data derived from four independent methodologies. In particular, we used: (i) significant wave height (SWH-Hind), provided by the hindcast maps produced by Copernicus; (ii) significant wave height (SWH-Buoy), period and direction of the waves measured by the wavemeter buoy installed near Mazara del Vallo; (iii) significant wave height (SWH-HF), period and direction of the waves obtained by the HF radar installed at the Marina di Ragusa harbor; and (iv) SEVIRI images to spatially and temporally track the position of the cyclone. These four data sources have been used to both describe the sea state evolution during the Helios event and characterize the physical state of the sea which is strictly correlated to the microseism derived outputs.
3.2.1 Copernicus data
Regarding the description of the Helios event in terms of spatiotemporal distribution of SWH, wave period and direction over the whole domain, we referred to the “MEDSEA_HINDCAST_WAV_006_012” product provided by the Copernicus Marine Environment Monitoring Service (CMEMS) (Korres et al., 2019). The CMEMS product contains the hindcast maps of the Mediterranean Sea Waves forecasting system and is based on the third-generation wave model WAM Cycle 4.5.4 comprising hourly wave parameters at 1/24∘ horizontal resolution (Korres et al., 2019).
3.2.2 Wavemeter buoy data
Concerning the wave buoy, Fig. 2c shows that this buoy is located offshore of Mazara del Vallo at a depth of 85 m. The Mazara buoy is managed by ISPRA (Italian Institute for Environmental Protection and Research) and is part of the National Wave Buoy Network (RON). The instrumental equipment consists of buoys allowing the acquisition of wave parameters in real time. The long time series represent an important heritage for the knowledge of marine phenomena affecting the Italian seas, both in terms of climatology and extreme events. The RON National Wave Network is now composed of seven stations located off the Italian coasts for the continuous measurement of wave and meteorological parameters, such as wind direction and speed, atmospheric pressure, water surface and air temperatures, with real-time data transmission. Until 2014, the ISPRA wave buoy network was equipped with WatchKeeper™ weather wave meters manufactured by the Canadian company AXYS Ltd. (Bencivenga et al., 2012). The new meteo-marine buoys were developed, designed and built in Italy for the specific needs of ISPRA. Data are collected continuously for periods of 20–25 min and are provided every 30 min.
The parameters recorded by the wavemeter buoy and used in this study are SWH (in meters), wave mean period (in seconds) and wave mean direction (in degrees).
3.2.3 HF radar data
Sea state measures are also provided by the HF system located in the Marina di Ragusa harbor (Fig. 2c) which is owned by the CNR–IAS (“Consiglio Nazionale delle Ricerche – Istituto per lo Studio degli Impatti Antropici e Sostenibilità” in Ambiente Marino). This HF radar is part of the CALYPSO HF network operating in the Malta–Sicily Channel since 2013. The network is nowadays composed of seven HF Codar SeaSonde systems transmitting at 13.5 MHz (central frequency). The network provides sea surface current maps at 3 km of spatial resolution at hourly scale (Capodici et al., 2019). Each HF radar provides sea state variables (SWH-HF, wave period, wave direction) every 15 min; these data are referred to 10 independent annular rings 3 km wide, centered at the HF site location. Data used in this work regard the last annular ring (30 km far from the HF site) showing the best temporal continuity of the measurements. The sea state derived by the HF technology has been extensively validated by several authors (e.g., Long et al., 2011; Lorente et al., 2021; Orasi et al., 2018; Saviano et al., 2019).
3.2.4 Satellite data
The passage of the Helios cyclone in the study area was tracked by means of the high rate SEVIRI level 1.5 image data. The level 1.5 image data represents the geolocated and radiometrically pre-processed images that are prepared for subsequent processing steps, e.g., the extraction of meteorological products helpful in our case study. (For further information about this methodology, see the EUMETSAT website at https://navigator.eumetsat.int/product/EO:EUM:DAT:MSG:HRSEVIRI; last access: 25 May 2023.) In particular, an image at 10.8 µm each 15 min was downloaded and analyzed.
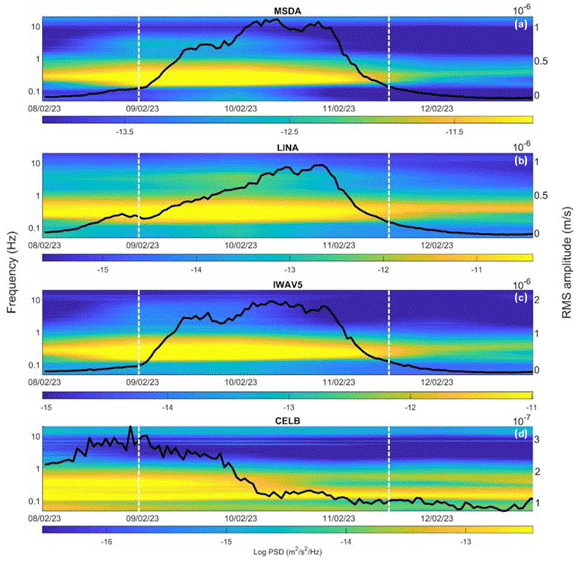
Figure 3Spectrograms and RMS amplitude time series (black lines) for the SM band (0.1–0.2 Hz) of the seismic signal recorded by the vertical component of four stations located along the Maltese coastline (a), on Linosa Island (b), in southern Sicily (c) and in central Italy (d). (See Fig. 2a for the station locations.)
3.3 Spectral analysis of microseism
The seismic data were corrected for the instrument response and thereafter spectral and amplitude analyses were performed. For the spectral analysis, hourly spectra of the seismic signal were calculated by applying Welch's method (Welch, 1967) with time windows of 81.92 s. The hourly spectra, thus obtained, were gathered and represented as spectrograms, with time on the x axis, frequency on the y axis and the log10 of the PSD indicated by a color scale. Some spectrograms obtained from the vertical component of four stations are shown in Fig. 3. Concerning the amplitude, we estimated hourly RMS amplitude time series for the typical microseism frequency bands: 0.2–0.4 Hz (SPSM; Fig. S1 in the Supplement), 0.1–0.2 Hz (SM; black lines in Fig. 3) and 0.05–0.07 Hz (PM; Fig. S2).
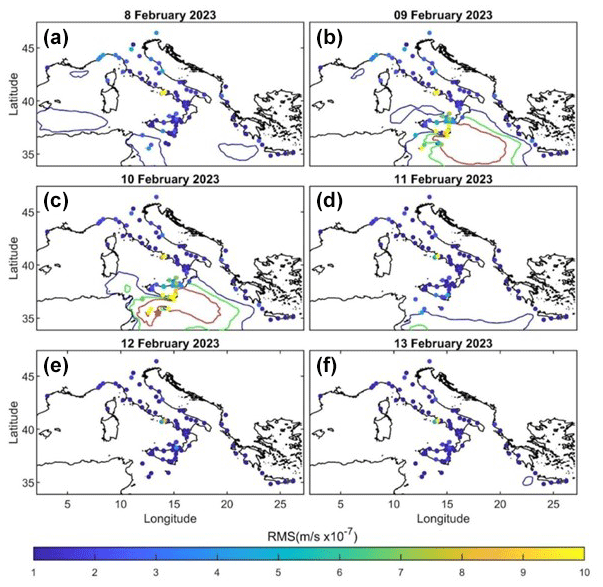
Figure 4Spatial and temporal distribution of the RMS amplitude for the SM band computed at the 105 stations considered (dots). The colors of dots represent the RMS amplitude as specified in the color bar. The blue, green and red contour lines represent significant wave heights of 3, 4 and 5 m, respectively, while the red star in (c) indicates the eye position of Helios obtained from satellite images.
In addition, to show the spatial and temporal distribution of the RMS amplitude during the period under investigation, we plotted the mean RMS amplitude computed on non-overlapped 1 d long moving windows for the three microseism bands (Figs. 4, S3 and S4). Each dot in Figs. 4, S3 and S4 represents a seismic station and the color of the dot relates to the corresponding RMS amplitude at that location, as specified in the color bar. It is noteworthy that the colorbar of the PM band (Fig. S3) shows a different range of RMS amplitude highlighting a different response between the PM and the SM and SPSM bands to Helios (Figs. 4 and S4). Furthermore, in these figures, we compared the RMS amplitude with the SWH, represented by the contour lines. (A detailed description of all the figures cited in this paragraph is given in Sect. 4.2.)
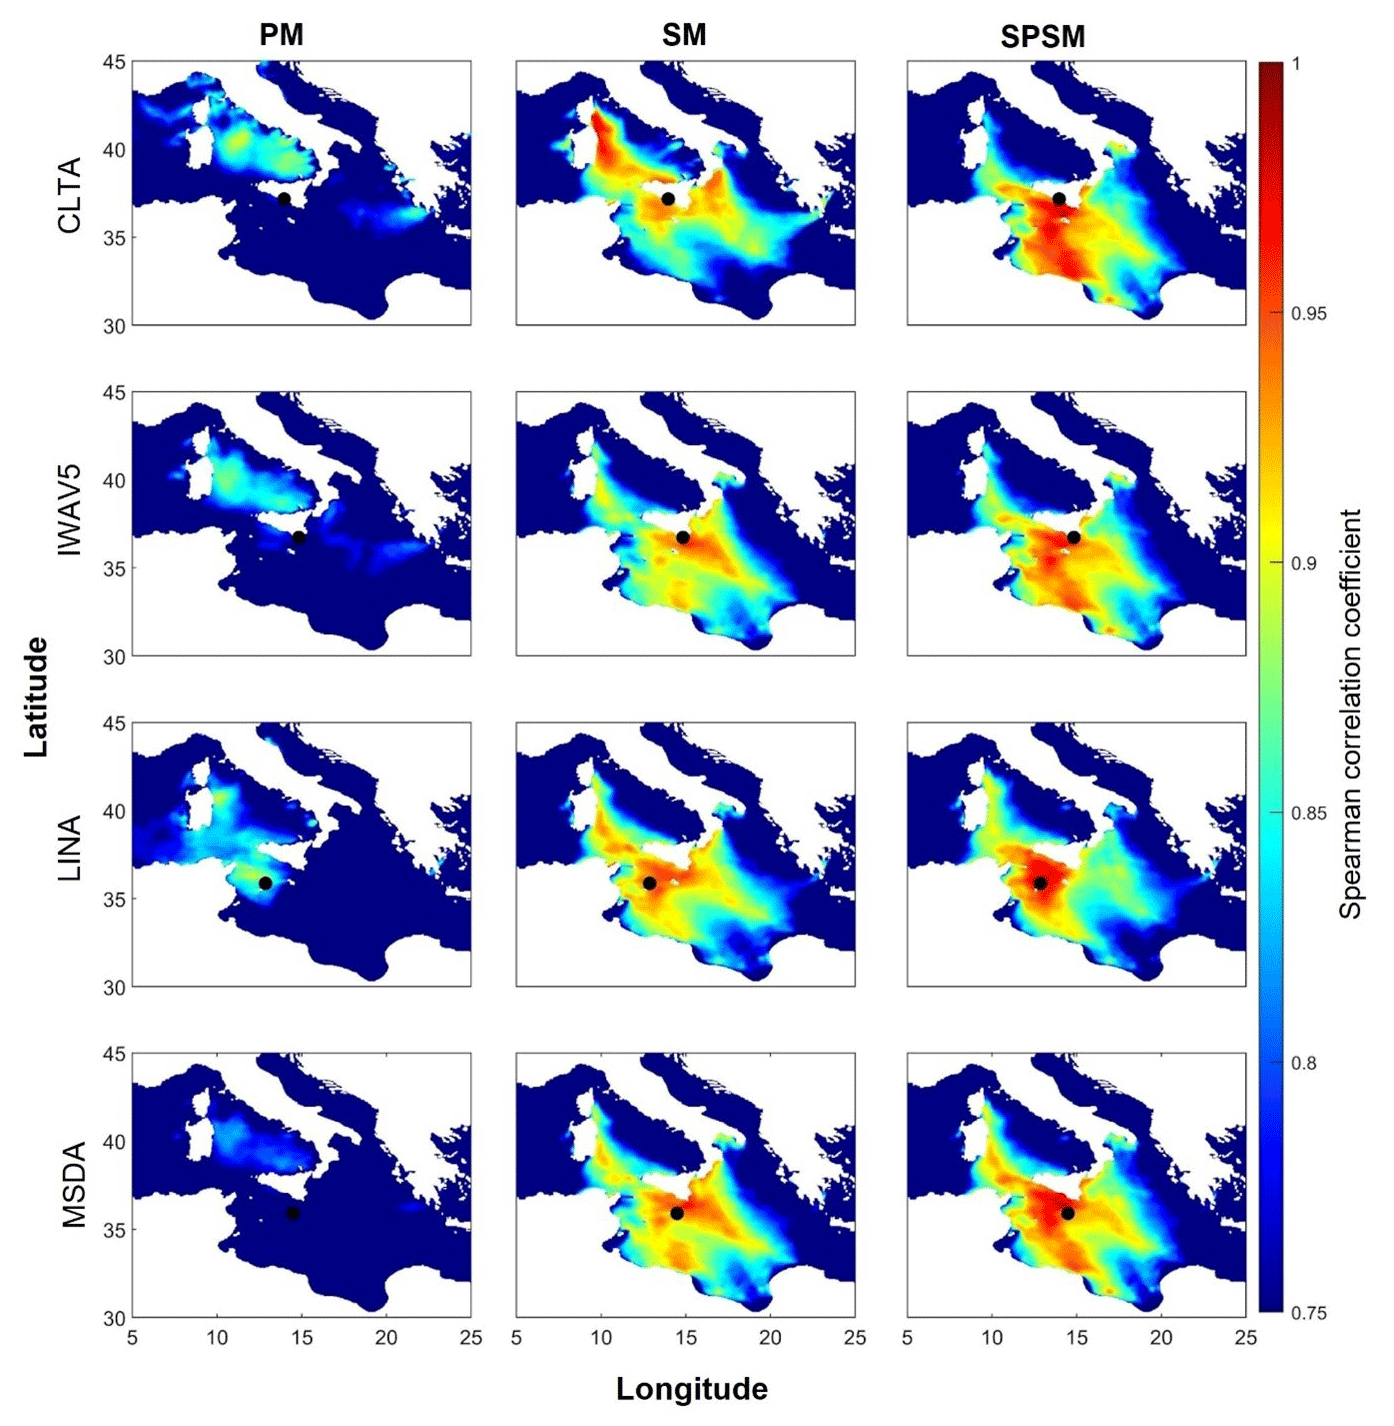
Figure 5Correlation maps obtained for the vertical component of the seismic stations MSDA, LINA, CLTA and IWAV5 for the PM, SM and SPSM frequency bands during the period under investigation. The black dots indicate the position of the seismic station.
3.4 Correlation analysis between microseism amplitude and significant wave height
The calculation of correlation coefficients between the RMS amplitude time series and the significant wave height time series was conducted in accordance with previous studies (e.g., Bromirski, 2001). This calculation was performed for each grid cell of the hindcast maps during the investigated period to obtain information about the spatial variability of the correlation coefficients. This kind of analysis provides information about the location of the main sources of the microseism recorded by the four selected stations. To explore the non-linear relationship between seismic RMS amplitudes and significant wave heights, we followed the approach proposed by Craig et al. (2016) and employed the Spearman correlation coefficient, which is defined as a non-parametric measure of rank correlation (Craig et al., 2016). Correlation maps, gathering together the correlation values obtained in the nodes of the whole Mediterranean Sea, were obtained for the vertical component of each station and the three typical microseism frequency bands (Fig. 5).
3.5 Tracking Helios's position by microseism
Following Borzì et al. (2022), we used two complementary methods to track the position of Helios from a seismic point of view: (i) a grid search method based on the seismic amplitude decay and (ii) array analysis. These methods allowed us to track the evolution over time of the location of the centroid of the seismic sources generated by the sea state variations induced by the cyclone. Such seismic data were compared with the cyclone trajectory which was identified by processing the high rate Meteosat Second Generation (MSG) SEVIRI images. This latter task was accomplished by visually identifying the positions of the cyclone's eye, which was clearly identifiable only between 01:00 and 23:00 of 10 February 2023.
3.5.1 Grid search method
We used the seismic signals recorded by 105 seismic stations (Fig. 2a) to map out the position of Helios during the analyzed period by employing a grid search approach (Fig. 6). The region where we executed the grid search is a bi-dimensional area of 1760×2400 km (minimum longitude: 5∘; maximum longitude: 30∘; minimum latitude: 30∘; maximum latitude: 46∘) with a spacing of 1∘. As shown by several authors who used seismic amplitude decay methods, both to locate microseism sources (Borzì et al., 2022) and seismo-volcanic sources (Battaglia and Aki, 2003; Cannata et al., 2013; Kumagai et al., 2011), the grid spacing is chosen as a compromise between good spatial resolution and reasonable computation time. The microseism source is localized based on the goodness of the linear regression fit (hereafter referred to as R2) computed for each node of the bi-dimensional (2D) grid previously mentioned. Specifically, the source was identified at the centroid position of all the grid nodes where the R2 values deviate by no more than 1 % from the maximum R2 value. With this method, we used an RMS signal window of 4 h and thus we were able to obtain one localization every 4 h. In addition, following Borzì et al. (2022), we applied a method to evaluate the statistical significance of the retrieved maximum R2 value and to test the confidence of the location results. Specifically, we conducted 20 iterations by randomly rearranging the RMS amplitude values among the stations. Then, we calculated the 95th percentile and we obtained a value of 0.27. In accordance with this result, we consider reliable the localizations with R2 values greater than 0.27. To retrieve the errors associated with each localization, the bootstrap technique is used (Johnson, 2001). This technique consists of recalculating each source location 1000 times by randomly resampling the data (amplitude–distance pairs) with repetition.
It must be underlined that the grid search method used in this study shows various limits that in specific cases can invalidate the source locations. In particular, the first limit concerns the fact that in this method we consider the microseism source as a point-like source, while the microseism is produced in a wide area of the Mediterranean Sea. In this scenario, the localization of the point-like source is determined as the barycentric point of the extended source. However, it is important to consider a limitation of this method related to the presence of multiple sources with similar amplitude in the same frequency range. In such cases, the constrained source location shifts toward a position between the actual seismic source locations (Battaglia et al., 2005), resulting in a significant decrease in R2. In our case, we neglect localization showing R2 values smaller than 0.27 to avoid unreliable localization.
3.5.2 Array analysis
In order to track the location of Helios using array techniques, we considered 15 stations belonging to the Mt. Etna seismic permanent network and used them as a roughly circular array (Fig. 2b).
The array response function (ARF) is a good tool to plan the array geometry required to investigate microseism signals or, in this case, to evaluate the performance of a pre-existing array in microseism studies. The ARF, previously obtained by Borzì et al. (2022), exhibits that the roughly circular array has a good response for the PM and SM cases.
In this study, we employed the f–k (frequency–wavenumber) analysis technique on microseism signals (e.g., Rost and Thomas, 2002). This approach involves a spectral domain beam-forming method that utilizes a grid search of slowness to determine the back azimuth and apparent velocity values that maximize the amplitude of the combined array traces. The result of the f–k analysis is the PSD as a function of slowness. In accordance with Borzì et al. (2022), we followed the subsequent processing steps to implement array analysis on microseism data: (1) demeaning and detrending, (2) applying a specific frequency band filter for microseism, (3) segmenting the data into tapered windows of 120 s each, (4) excluding windows containing seismo-volcanic amplitude transients (such as volcano-tectonic earthquakes, long-period events and very-long-period events) identified using the STA/LTA (short-time average/long-time average) technique (e.g., Trnkoczy et al., 2012), and (5) performing f–k analysis for each window by conducting a slowness grid search (ranging from −1 to 1 s km−1 in the east and north components of the slowness vector) with a spacing of 0.05 s km−1. An illustrative example of the outcomes is presented in Fig. 6. (For further details about the two methods used in this work, see Borzì et al., 2022.)
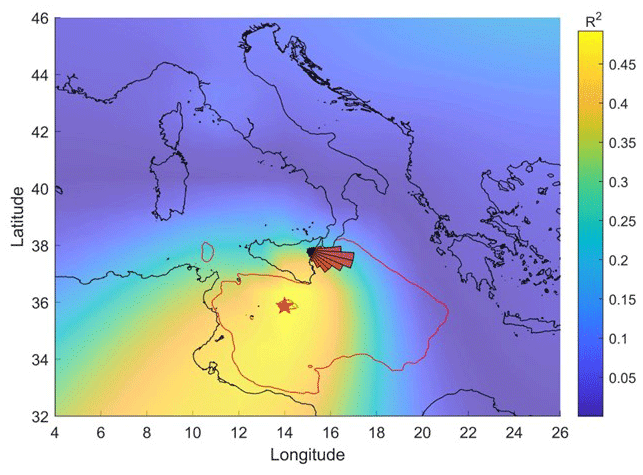
Figure 6Localization of the microseism source for 10 February 2023 at 16:00. The red star indicates the centroid position of all the grid nodes whose R2 values do not differ by more than 1 % from the maximum R2 value obtained with the grid search method, while the rose diagram, located at the center of the summit area of Mt. Etna (see Fig. 2b), shows the distribution of the back azimuth values on the same day. The red contour line represents significant wave heights of 4 m obtained from the Copernicus product MEDSEA_HINDCAST_WAV_ 006_012 during the same time period.
3.6 Seismic signature of medicanes
As a way to obtain the seismic signature and the main spectral characteristics of Helios, we use a method developed by Soubestre et al. (2018). This method was initially developed as a network-based method to detect and classify seismo-volcanic tremors. The proposed method utilizes the coherence of tremor signals within the network, which is determined based on the array covariance matrix. Using this technique, as explained by Soubestre et al. (2018), it is possible to highlight both volcanic tremors and other types of seismic sources such as tectonic earthquakes (local, regional and teleseismic), and oceanic seismic noise (microseism). This method allows the identification of the spatially coherent individual noise source within a specific network, identified as small spectral width, as opposed to other noises, such as local effects, that would generate multiple individual sources. (For further details about the method, see Soubestre et al., 2018.)
In this study, we are interested in detecting the microseism produced by Helios. Since we are interested in such a microseism, we filtered the signal in the band 0.1–1 Hz and resampled it to 25 Hz as a way to reduce the computation time. To compute the covariance matrix we use only the vertical component of the seismic signal and a window length of 60 s. The analyses were performed using the data recorded by a station set comprising both stations installed near the southern Sicilian coast (CLTA and IWAV5) and on the Malta (MSDA) and Linosa (LINA) islands in order to have the microseism source within the selected station set.
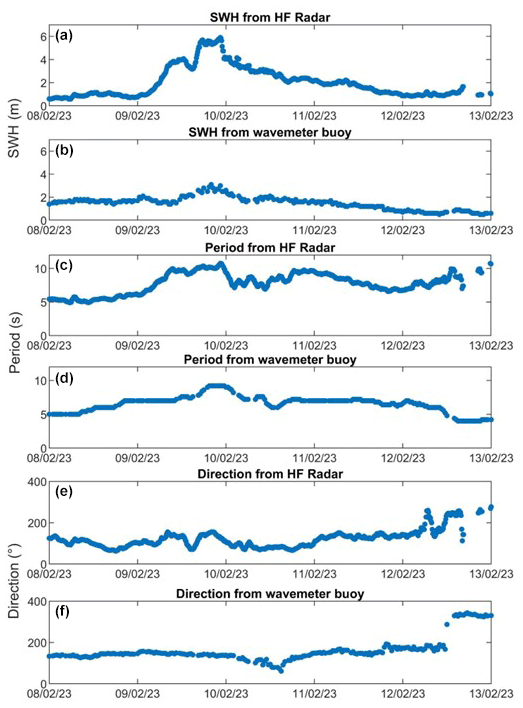
Figure 7Wave features in terms of SWH, period and mean direction time series retrieved by using the HF radar (a, c, e) and Mazara del Vallo buoy (b, d, f) data. (See Fig. 2c for the instrument locations.)
We analyzed the sea state, derived by four independent techniques, and the seismic data recorded by the 105 seismic stations (Fig. 2a) and the 15 Etnean seismic stations (Fig. 2b) during 8–13 February 2023. We chose a period longer than the real lifetime of Helios as a way to include the development, the climax in terms of meteorological events that occurred during 9–10 February and the subsequent loss of intensity.
4.1 Sea state
In Fig. 7, we show the SWH, the mean wave period and the direction time series recorded during 8–13 February 2023 by the buoy of Mazara del Vallo (Fig. 7b, d and f) and the HF radar installed in Marina di Ragusa harbor (Fig. 7a, c and e).
The buoy data indicate that the sea storm reached its maximum significant wave height of 3.1 m at 20:00 on 9 February, with a mean direction of 140∘ indicating that waves were generated by Scirocco wind, which is the main wave direction for the period under investigation and a period that varies from 5 to 9 s. The data from HF radar, installed closer to the
cyclone position than the buoy, show a maximum SWH of about 6 m recorded on 9 February at 22:30. The mean wave direction was approximately 100∘ and the period varied in the range of 5–12 s. Both datasets allowed definition of the time interval of the wave storm which spanned 8–13 February 2023. The higher SWH measured by the HF radar agreed with the shorter distance from the cyclone eye (∼90 km) of this instrument compared with that of the wave buoy (∼190 km).
The spatiotemporal distribution of the SWH in the whole area is shown by the hindcast maps in Fig. 8. Note that the stronger effect of Helios on the sea state of the Malta–Sicily Channel was the increase in SWH during 9–10 February. On 9 February the higher SWH values were recorded mainly in the patch of sea east of Sicily and of the Maltese archipelago, whereas the wave storm invaded the whole Malta–Sicily Channel on 10 February. Finally, on 11 February the wave storm started moving southward, reaching the northern part of the African coasts.
The comparison between SWH-Hind and SWH-HF revealed a good agreement (R2∼0.85), even though an underestimation of the event by the CMEMS model (slope of ∼0.7) was observed (Fig. S6).
4.2 Spectral analysis and RMS spatial distribution
To perform the spectral analysis, we used the 105 seismic stations installed along the Italian, Greek and Maltese coastal areas. In Fig. 3, we plot the spectrograms and the RMS amplitude time series (black lines), obtained by analyzing the vertical component of the seismic signals recorded by four stations installed in Malta (MSDA; Fig. 3a), on Linosa Island (LINA; Fig. 3b), near Pozzallo (IWAV5; Fig. 3c) and in central Italy (CELB; Fig. 3d). We chose these four stations to compare the results obtained from the stations installed near the sub-tropical system (LINA, MSDA and IWAV5) with the result obtained from the more distant station (CELB).
As shown by Borzì et al. (2022), in the spectrograms a great part of the energy is focused in the 0.1–1 Hz band, corresponding with the SM and SPSM bands. In addition, it is evident how the considered stations show a different behavior, in terms of both spectrograms (Fig. 3) and RMS amplitude time series (Figs. 3, S1 and S2), that depended on their position. In particular, spectrograms and RMS amplitude time series obtained from the data recorded by MSDA (Figs. 3a, S1a and S2a), LINA (Figs. 3b, S1b and S2b) and IWAV5 (Figs. 3c, S1c and S2c) stations, installed close to Helios (Figs. 1 and 2), show the maximum PSD and RMS amplitude values during 9–11 February 2023, highlighted by the vertical dashed lines in Fig. 3. On the other hand, the spectrogram and RMS amplitude time series of the station CELB (Figs. 3d, S1d and S2d), installed in the Tyrrhenian area, exhibited the maximum PSD and RMS amplitude values a few days before Helios at the same time as a local storm surge.
To show the space–time distribution of the RMS amplitude, we calculated the daily RMS average for the three main microseism bands (SM in Fig. 4; PM and SPSM in Figs. S3 and S4) during 8–13 February 2023. All three analyzed microseism bands showed a relationship with the position of Helios (indicated by the red star in Figs. 4c, S3c and S4c). In particular, on 10 February 2023, when Helios reached its climax, the maps in Figs. 4c (SM), S3c and S4c (PM and SPSM, respectively) show a cluster of high RMS values for the stations installed near Helios, highlighting a good match between the SM, SPSM, PM and Helios positions.
Comparing the RMS amplitude time series obtained for Helios with those obtained for the medicane Apollo (Borzì et al., 2022), we observed a similar trend for the SM and SPSM bands and a different behavior for the PM band. In particular, during the medicane Apollo, the analysis showed a significant amplitude increase for the SM and SPSM bands while no significant changes for the PM band were observed. Instead, during Helios, the RMS amplitude time series for the PM (Fig. S2), although with two orders of magnitude smaller, showed a trend similar to that of the SM (Fig. 3) and SPSM (Fig. S1) ones. Also the space–time distribution showed a good match between the PM (Fig. S3) and Helios's position (Figs. 1, 4c, S3c and S4c), even though for this band there are stations installed in central Italy that show high RMS amplitude values related to a very local storm surge that occurred at the same time as Helios.
The involvement of the PM band in the case of Helios can be explained by considering the position of this low-pressure system (Fig. 1) and comparing it with the Apollo position. Indeed, the medicane Apollo develops and moves in the Ionian Sea (Fig. 2) in an area with a sea depth greater than 2000 m, while Helios develops and moves largely in the Sicily Channel, a shallower sea that reaches a maximum depth of 500 m b.s.l. and an average depth of 316 m b.s.l. In addition, the average depth between Sicily and Malta is about 65 m b.s.l. As outlined in the literature (Bromirski et al., 2005), the production of the PM is hindered in large water depths due to the attenuation of pressure fluctuations, which generate the signal, as a result of depth-dependent amplitude decay. More specifically, the PM is generated solely in depths less than half of the wavelength (where λ represents the wavelength of the oceanic waves generating the pressure fluctuations). If we consider, for the Catania and Mazara areas, a mean waves period of 6.1 and 5.6 s and a peak waves period of 9.7 and 9 s, respectively (“Agenzia per la Protezione dell'Ambiente e per i Servizi Tecnici Dipartimento Tutela Acque Interne e Marine Servizio Mareografico – Atlante delle onde nei mari italiani”, Corsini et al., 2006), by utilizing the correlation that connects period and wavelength (, where g is acceleration of gravity, i.e., 9.8 m s−2 and T is the period of the waves; Sarpkaya and Isaacson, 1981), then we obtain a wavelength, for this part of the Mediterranean sea, ranging between ∼45 and ∼150 m. Considering these wavelengths, the shallow depth of the Sicily Channel, especially in the Malta Channel where the average depth is about 65 m b.s.l., and the fact that the generation of the PM occurs only for depths less than (Bromirski et al., 2005), we can remark that the generation of the PM is possible in the Sicily Channel, whereas this cannot occur in the Ionian Sea except in limited areas near the coastline. This is evident in our analysis, and in particular in the RMS amplitude time series. Indeed, in the Helios case, which occurred in the Sicily Channel, we note a similar trend between the three analyzed microseism bands (Figs. 3, S1 and S2), while in the case of the medicane Apollo, which developed in the Ionian Sea (Borzì et al., 2022), we observe an RMS amplitude increase only for the SM and SPSM bands, and no significant variations in the PM bands.
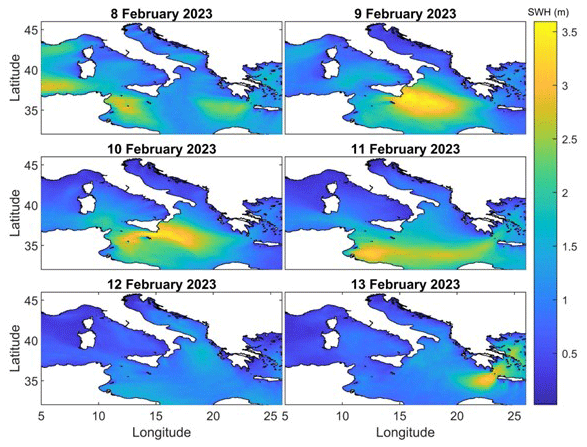
Figure 8Hindcast maps, obtained from the Copernicus product MEDSEA_HINDCAST_WAV_006_012, showing the spatiotemporal variations of SWH during the days taken into account.
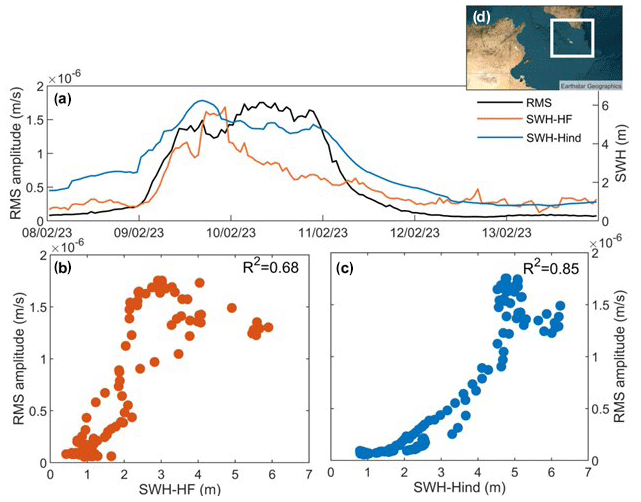
Figure 9Panel (a) shows RMS amplitude time series, recorded at the station IWAV5, and SWH time series retrieved by HF radar (SWH-HF; orange line) and by hindcast data (SWH-Hind; light-blue). Cross-plot showing the relation between SWH-HF and RMS amplitude (b) and between SWH-Hind and RMS amplitude (c). The value of the determination coefficient (R2) is reported in the upper right corner of (b) and (c). In (d) the area of the Sicily Channel used to calculate the SWH-Hind time series is shown (base image source © Earthstar Geographic). (See Fig. 2a and c for the instrument locations.)
4.3 Comparing the RMS amplitude with the SWH
As mentioned before, microseism is a continuous seismic signal linked to the hydrosphere–solid Earth energy transfer and, as demonstrated by several authors (e.g,. Ardhuin et al., 2012; Bromirski et al., 1999, 2005; Cutroneo et al., 2021; Ferretti et al., 2013, 2018), the amplitude of this signal is strictly related to the sea state and in particular to the SWH. To analyze the relationship between microseism and SWH, we plot in Fig. 9a the RMS amplitude time series for the station IWAV5 and the SWH time series derived from both HF radar (SWH-HF) and hindcast maps (SWH-Hind), and in Fig. 5 the results of the correlation analysis between the RMS amplitude time series and the significant wave height. (The position of the seismic stations IWAV5, LINA, MSDA and CLTA, and HF radar, are respectively shown in Fig. 2a and c.) The sea state information provided by the Mazara del Vallo buoy was not taken into account in this analysis because of the long distance between this instrument and the cyclone eye. We chose stations IWAV5, LINA, MSDA and CLTA both because they are some of the nearest stations to the cyclone eye and because these stations were used for the seismic signature analysis. In addition, as it is possible to see in Fig. 3a–c, all the seismic stations installed in the Sicily Channel area show very similar microseism amplitude patterns. The time series of SWH-Hind was obtained by computing the median value of the SWH data within a wide area of the Sicily Channel shown in Fig. 9d. In general, the three datasets exhibit a good agreement among them. In particular, we observe an increase that occurs almost simultaneously for SWH-HF, SWH-Hind and the RMS amplitude. However, from the first hours of 10 February, the SWH-HF started showing a different behavior compared with SWH-Hind. Indeed, the SWH-HF decreased while the SWH-Hind continued to show high values up to the end of 10 February. This difference can be explained by considering that the HF radar provides information about the SWH for a limited area while SWH-Hind gives median information about a wide area of the Sicily Channel. It is interesting to note that the microseism amplitude follows more closely the areal sea state, shown by the SWH-Hind series, than the punctual one, shown by the SWH-HF. We can note this in both a qualitative way in the time series of Fig. 9a and a quantitative way in the cross-plots of Fig. 9b and c. For both the cross-plots we calculated the R2 value to evaluate the goodness of the linear regression and we obtained R2 values equal to 0.68 and 0.85, for the cross-plot RMS amplitude vs SWH-HF and RMS amplitude vs SWH-Hind, respectively. The higher value of R2 for the RMS amplitude – SWH-Hind relationship can be explained by considering that microseism recorded by a seismic station is generated by multiple extended sources distributed on a wide portion of the sea. The correlation analysis confirms a good match between the spatial distributions of SWH and RMS amplitudes recorded by the four aforementioned stations during the period under investigation (Fig. 5). Values of the correlation factor higher than 0.85 were observed for the SM and SPSM bands for the area of the Sicily Channel and Ionian Sea affected by the storm surge due to the cyclone Helios.
4.4 Localization analysis
As concerns the microseism source location, we performed the localization analysis for the PM, SM and SPSM using both the array techniques and the grid search method based on the seismic amplitude decay. Concerning the array techniques, we chose to focus on PM and SM bands since, according to the information from the ARF, we expected reliable localizations only for these two bands, while for the SPSM band spatial aliasing appears. As for the grid search method, we obtained reliable locations only for the SM and SPSM bands, while for the PM band, although we got localizations in agreement with the cyclone position, the associated R2 values turned out to be slightly lower than the threshold from which we can consider the locations reliable.
By the grid search method, we obtained reliable locations from 9 February 2023 at 8:00 to 11 February 2023 at 00:00 (Fig. S7). In agreement with satellite images (Fig. 1), on 9 February 2023, Helios was not yet well developed and did not show the cyclone eye. Indeed, during this day, we are able to locate a storm surge, probably linked to the primitive formation of Helios, that occurred in the Ionian Sea. In particular, our localizations on 9 February from 08:00 to 20:00 indicate the source position near southeastern Sicily in agreement with the hindcast data showing for this area SWH greater than 5 m (Figs. 4b and 7). During the subsequent hours, our localizations (Fig. S7) show a small but continuous shift of the source toward the Malta area (Fig. 6), in agreement with the relatively stable position of the cyclone eye for the first hours of 10 February 2023, retrieved from SEVIRI data (Fig. 1). Successively, the sub-tropical system rapidly loses its strength and runs out completely on 11 February 2023, making landfall against the Libyan coast. The errors associated with the localization show an anti-correlation with the R2 (Fig. S5). In particular, we can observe errors that vary from 535 to 210 km for the longitude and from 245 to 165 km for the latitude. We obtained lower errors during the climax of Helios, when the R2 reached the highest values, and higher errors during the initial and final phases of the phenomenon (Fig. S5; Table 1).
In Table 1 we summarized the main features of the microseism source located by using the grid search method during 9–10 February 2023 and compared these with the results obtained during 01:00–23:00 of 10 February 2023 in terms of the coordinates of the cyclone eye retrieved by SEVIRI data. During the first hours of the cyclone life, the coordinates of the cyclone eye and the microseism source show only a small offset that, as explained in Sect. 3.4.1, may be due to the fact that the point-like microseism source corresponds with the barycentric position of an extended source, and it is expected that the microseism source location could differ from the cyclone eye. During the subsequent hours, as shown in Fig. 1, the cyclone moved southward until the time it made landfall against the Libyan coast. This shift is not visible in the microseism location results, probably due to the lack of seismic stations in Africa which would help locate more accurately seismic sources placed close to the African coastlines. In Fig. S8 we plot the temporal distribution of the R2 values and compare this with the SWH-Hind time series. These two datasets show a good agreement and highlight that the higher R2 values obtained from the grid search method are influenced by the presence of Helios.
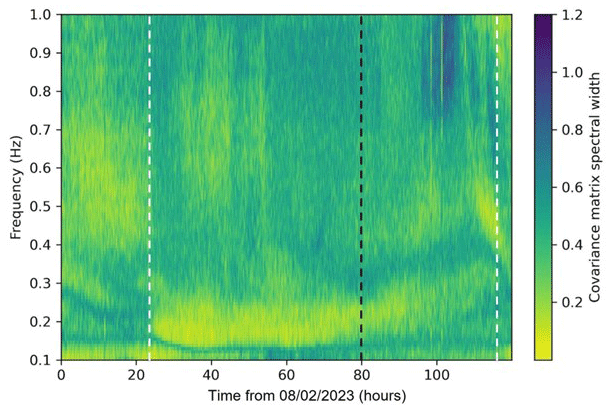
Figure 10Covariance matrix spectral width obtained for 8–12 February 2023 using the stations IWAV5, LINA, MSDA and CLTA. The dashed white lines represent the development and the ending of Helios, while the dashed black line indicates the time when Helios makes landfall against the Libyan coast. (See Fig. 2a for the station locations.
Concerning the array analysis, the result obtained for the PM band shows that for 9–11 February the back azimuth values pointed toward the Ionian Sea (Fig. S9) with apparent velocity values of ∼3.0 km s−1 (Fig. S10). For the same days, the back azimuth values for the SM band pointed toward the same region (Fig. S11), with apparent velocity values of ∼2.0 km s−1 (Fig. S12).
For the PM and the SPSM bands, we obtained reliable locations only by one of the two methods used (array technique for the PM and grid search for the SPSM), while for the SM we obtained reliable locations from both of the aforementioned methods and we could compare the results obtained independently from these two methods. We observed that the grid search method based on the seismic amplitude decay is able to detect both the storm surge that occurred in the Ionian Sea and the subsequent formation of Helios (Fig. S7), and in particular by this method, we localized the cyclone as a point-like source, considered as a barycenter of an extended source. The array technique instead provides back azimuth values pointing toward the Ionian Sea for the entire period of 9–11 February (Fig. S11). From these results, we note that the two methods are influenced by different sources. This different result can be explained based on the spatial station distribution. Indeed, if we consider the grid search method, we use a wide station network including stations installed near Helios (MSDA, CLTA, IWAV5, LINA and other stations), while the Etnean array includes 15 stations clustered in a small area. In addition, the distance between the array center and the Ionian Sea (∼20 km) is smaller than the distance between the array center and the Sicily Channel (∼90 km). During the period taken into account, we have the coexistence of two strength sources, the first in the Ionian Sea (a storm surge with SWH greater than 5 m) and the other, probably the strongest, in the Sicily Channel (Helios), both represented by the red contour line in Fig. 4c. Hence, the coexistence of two sources and the great difference in distance between the array center and the Ionian Sea and the array center and the Sicily Channel does not allow us to locate the Helios with the array technique, which gives us back azimuth values pointing always toward the nearest source.
4.5 Seismic signature
To show the main spectral characteristics of Helios, we used the method developed by Soubestre et al. (2018). From our analysis, the evolution in time of the microseism spectral characteristics between the first 24 h and the following hours is evident (Fig. 10). In particular, with the vertical dashed lines in Fig. 10, we show the time interval when Helios develops, reaches the climax and loses power to run out. The first 24 h are characterized by the lack of a clear predominance of a particular frequency range. Starting from early 9 February 2023 (first vertical dashed white line), we can observe high coherence values clustered on a narrow frequency range between about 0.14 and 0.25 Hz, and this frequency range is constant until the 80 h (vertical dashed black line) corresponding to the morning of 11 February. Successively, the frequency with the highest coherence starts to increase reaching a value of about 0.35 Hz before the exhaustion of the phenomenon. This increase in the frequency could be related to the landfall of Helios against the Libyan coast (see MedCyclones, 2023c). Indeed, as described in the literature (Gerstof et al., 2006; Lin et al., 2017; Sun et al., 2013), there exists a relationship between the frequency, the sea depth and the development of local wave motion near the coastline. In particular, Gerstof et al. (2006) show an increase in the microseism frequency during the two landfalls of Hurricane Katrina. Similar results are shown by Sun et al. (2013), who highlighted an increase in the intensity of the microseism for the SM and SPSM and the frequency increase from the SM band toward the SPSM band during the approaching of the three analyzed typhoons to the Chinese coast. Finally, Lin et al. (2017) show an increase in the microseism frequency during the first landfall of typhoon Megi. Similarly, we obtained an increase in frequency during the time interval when Helios approached the Libyan coastline and made landfall on 11 February (see MedCyclones, 2023c). We were also able to observe the gradual loss of power of the sub-tropical system highlighted by ever-lower coherence values until its disappearance.
Several works have dealt with the relationship between microseism and several meteorological phenomena, considering in particular storm surges (Ardhuin et al., 2019; Cannata et al., 2020; Guerin et al., 2022; Moschella et al., 2020) and different types of cyclones (Borzì et al., 2022; Bromirski, 2001; Bromirski et al., 2005; Gerstoft et al., 2006; Gualtieri et al., 2018; Lin et al., 2017; Retailleau and Gualtieri, 2019, 2021; Zhang et al., 2010) that affect various parts of the world (hurricanes, typhoons, tropical cyclones and medicanes). In this work, we analyzed the relationship between the three main microseism bands (PM, SM and SPSM) and the sub-tropical system Helios that occurred in the Mediterranean Sea during 9–11 February 2023. Although all the meteorological parameters suggest that Helios has not been able to reach the complete medicane characteristics, remaining a rather weak sub-tropical system, the proximity of this cyclone to the southeastern Sicilian and Maltese coastal areas has caused heavy rainfall, strong wind gusts and violent storm surges in these two areas.
To obtain information about the sea state we take into account the data of hindcast maps, wavemeter buoy, HF radar and SEVIRI images. The first three methodologies show an increase in the SWH during the period under investigation, with a climax during 9–10 February 2023, due to the presence of Helios. In particular, the HF radar and the hindcast maps exhibit SWH of about 6 m while the wavemeter buoy shows SWH of about 3 m. This difference is only linked to the position where the two instruments are installed. Indeed, the HF radar is installed about 90 km, and the wavemeter buoy is installed about 190 km, from the cyclone eye. The last method based on SEVIRI images provides information about the location of the cyclone eye that is clearly visible between 01:00 and 23:00 on 10 February 2023.
To analyze this meteorological phenomenon from a seismic point of view, we selected 120 seismic stations installed along the Italian, Maltese and Greek coastal areas: 105 were used in spectral and amplitude analysis in the grid search method, with 4 of these used to obtain the seismic signature of Helios using the method of the covariance matrix, and 15 were employed in array analysis. The results, obtained from the spectral analysis, highlight that the seismic signals, in particular the PM, SM and SPSM bands, are affected by the storm surge and by Helios. This is evident considering that the RMS amplitude time series, the spectrograms and the RMS amplitude space–time distribution, in which it is possible to observe that the amplitude of the microseism signal in the three main bands mentioned above shows a similar trend and it is greater during 9–10 February 2023 for the stations installed close to Sicily Channel (e.g., the stations MSDA, LINA and IWAV5), whereas the stations installed farther from Helios (e.g., CELB) show a different behavior conditioned by local sources. Furthermore, the increase in the RMS amplitude for the PM band can be explained on the basis of the position where Helios develops. Indeed, as explained in the literature (Bromirski et al., 2005), the generation of the PM is limited in the areas where the depth of the sea bottom is smaller than (where λ is the wavelength of the sea waves) as a consequence of the amplitude decay of the pressure fluctuations. The Sicily Channel and in particular the area between Malta and Sicily (Malta Channel), where Helios stood still for the entire 10 February 2023, shows an average depth of about 65 m b.s.l., and considering a wavelength between ∼45 and ∼150 m the generation of the PM for this area is possible.
By comparing SWH recorded by HF radar, SWH retrieved by hindcast data and the RMS amplitude recorded at the station IWAV5, we observe that the RMS amplitude time series shows a trend more similar to that of hindcast data than to that of HF radar data. This could be explained by the fact that the microseism is a seismic signal generated by multiple and extended sources in a large area of the sea and, hence, its amplitude is related to the state of a wide portion of the sea. Also, the correlation analysis confirms a good match between the spatial distributions of significant wave heights and seismic RMS amplitudes.
We used two methods to track the position of Helios during its lifetime and, through the performed analysis, we were able to locate both the storm surge that occurred in the Ionian Sea and Helios. In particular, using the grid search method based on the seismic amplitude decay, we located the storm surge in the Ionian Sea on 9 February 2023 and Helios on the next day, while with the array technique, we located only the storm surge in the Ionian Sea as a consequence of the position of the array closer to the Ionian Sea than to the Sicily Channel. The location obtained both for the storm surge and for Helios during the first hours of its life is in agreement with the real position of the two meteorological phenomena shown by the hindcast maps and satellite images. Successively, Helios moved southward until the time when the cyclone made landfall against the Libyan coast while the microseism source continued to show a stable position near Malta. This difference between the two positions is probably due to the lack of seismic stations in Africa. this gap does not allow us to accurately locate microseism sources placed close to the African coastlines. In addition, using the method of the covariance matrix, we obtained the seismic signature of Helios. In particular, during the development and climax of Helios, we can observe high coherence values clustered on a narrow frequency range between about 0.14 and 0.25 Hz that, as described in the literature, corresponds to the microseism bands (SM and SPSM) most affected by cyclonic activity. This narrow frequency range stays constant until the time Helios makes landfall, which is when we observe an increase in the frequency, to about 0.35 Hz, probably linked to the decrease in the sea depth and the development of local wave motion near the coastline.
Starting from Borzì et al. (2022), this work aims at studying and monitoring Mediterranean cyclones through microseism and its integration with sea state data. It underlines that it is possible to extract information about these meteorological phenomena by an innovative system for the sea state monitoring that includes not only the classical instruments (such as wavemeter buoys, HF radar and geostationary satellites) but also seismometers. In particular, the large number of broadband seismic stations, installed for earthquake and volcanic monitoring, can compensate for the lack of data of the classical instruments mentioned above, more often affected by instrument breakage.
Finally, since we obtained the seismic signature of this particular Mediterranean cyclone, we can compare it with the seismic signature of other Mediterranean events (medicanes and common storms) to identify the similarities and differences in the spectral content of different Mediterranean cyclones and other more common events. The characterization of the seismic signature of these events could be useful in identifying Mediterranean cyclones by old seismograms, and hence to reconstruct the temporal variability (in terms of occurrence rate and intensity) of these extreme meteo-marine events whose evolution seems to be strictly linked to global warming (e.g., Emanuel, 2005; Reguero et al., 2019).
The seismic data, in the miniseed format used in this study, can be downloaded through the ORFEUS-EIDA database (https://doi.org/10.14470/TR560404, GEOFON Data Center, 1993). All the seismic stations used in this study, along with their main features, are reported in Tables S1 and S2. The hindcast data are available online on the Copernicus website (https://doi.org.10.25423/CMCC/MEDSEA_MULTIYEAR_WAV_006_012_MEDWAM3I, Korres et al., 2021; https://doi.org.10.25423/CMCC/MEDSEA_MULTIYEAR_WAV_006_012_CLIM, Korres et al., 2023). The Italian buoy data (Mazara del Vallo) are available on the ISPRA website (https://dati.isprambiente.it/dataset/rmn/, last access: 20 December 2023) and on the MAREOGRAFICO website (https://www.mareografico.it, last access: 20 December 2023). Satellite data are available on the EUMETSAT website (https://navigator.eumetsat.int/product/EO:EUM:DAT:MSG:HRSEVIRI, last access: 20 December 2023). The HF radar data are available on the CALYPSO project website by compiling the form indicated on the web page (https://www.calypsosouth.eu/index.php/welcome/open_page/50/0, last access: 20 December 2023) or by contacting giuseppe.ciraolo@unipa.it or salvatore.aronica@cnr.it.
The supplement related to this article is available online at: https://doi.org/10.5194/os-20-1-2024-supplement.
AMB, AC and FC conceived the idea. AMB analyzed seismic data and VM performed array analysis. CLR, GN, AO and MP analyzed buoy data. SA, DC, GDG, GL, SD, RDP and TL helped perform seismic analysis. FC, GC, SA, IF, GG and GM analyzed HF radar data. AMB and VM wrote the paper. SA, FC, DC, GL and VM dealt with the new seismic installation. GC led one of the projects funding this research, and GS helped to interpret the sea state data. All the authors discussed the results, edited the manuscript and gave consent for this publication under the supervision of AC.
The contact author has declared that none of the authors has any competing interests.
Publisher’s note: Copernicus Publications remains neutral with regard to jurisdictional claims made in the text, published maps, institutional affiliations, or any other geographical representation in this paper. While Copernicus Publications makes every effort to include appropriate place names, the final responsibility lies with the authors.
This article is part of the special issue “Data assimilation techniques and applications in coastal and open seas”. It is a result of the EGU General Assembly 2022, Vienna, Austria, 23–27 May 2022.
The authors are grateful to Vittorio Scribano, the Museo Archeologico di Kamarina, Parco di Kamarina e Cava D'Ispica – Direttore Arch. Domenico Buzzone and the Centro Polifunzionale di Protezione Civile – Dott.ssa Emilia Pluchinotta, for hosting the seismic stations installed in the framework of the i-waveNET project and used in this work (IWAV2, IWAV3, IWAV5). This study has been conducted using E.U. Copernicus Marine Service Information, (https://doi.org/10.25423/cmcc/medsea_multiyear_wav_006_012, Korres et al., 2021). The seismic data, downloaded using the EIDA and ORFEUS web services, belongs to the AC, FR, HC, HL, HP, IV, ML and MN networks. We thank the handling editor, Jiping Xie, and the anonymous reviewers for comments that helped clarify our paper.
The authors were supported by the i-waveNET “Implementation of an innovative system for monitoring the state of the sea in climate change scenarios” project, funded by the Interreg Italia-Malta Programme (https://iwavenet.eu/, last access: 24 October 2023; notice 2/2019 Axis 3; project code C2-3.2-106) and the ARCHIMEDE “MultidisciplinARy approaCH to better define vulnerabIlity and hazard of MEDicanEs along the Ionian coasts of Sicily” project (code P2022MJKMA). We have also been supported by the grant PIACERI, 2020-22 programme: PAROSSISMA project (code 22722132140, principal investigator Marco Viccaro) and programme “fondi di ateneo 2020–2022, Università di Catania, linea Open Access”. Alfio Marco Borzì received support by the PON “Ricerca e Innovazione 2014–2020 Azione IV.5 – Dottorati su tematiche green”. Giorgio Manno is supported by the RETURN Extended Partnership funded by the European Union – Next Generation-EU (National Recovery and Resilience Plan – NRRP, Mission 4, Component 2, Investment 1.3 – D.D. 1243 2/8/2022, PE0000005). The research project “SEISMOSTORM” funded by the BRAIN-be 2 program of the Federal Science Policy (BELSPO) supported Thomas Lecocq and Raphael De Plaen.
This paper was edited by Jiping Xie and reviewed by two anonymous referees.
Androulidakis, Y., Makris, C., Mallios, Z., Pytharoulis, I., Baltikas, V., and Krestenitis, Y.: Storm surges during a Medicane in the Ionian Sea, Proceedings of the Marine and Inland Waters Research Symposium, Marine and Inland Waters Research Symposium 16–19 September 2022, Isbn 978-960-9798-31-0, Porto Heli, Greece, 16–19, 2022.
Ardhuin, F. and Roland, A.: Coastal wave reflection, directional spread, and seismoacoustic noise sources, J. Geophys. Res.-Oceans, 117, C11, https://doi.org/10.1029/2011JC007832, 2012.
Ardhuin, F., Gualtieri, L., and Stutzmann, E.: How ocean waves rock the Earth: Two mechanisms explain microseisms with periods 3 to 300 s, Geophys. Res. Lett., 42.3, 765–772, https://doi.org/10.1002/2014GL062782, 2015.
Ardhuin, F., Stopa, J. E., Chapron, B., Collard, F., Husson, R., Jensen, R. E., Johannessen, J., Mouche, A., Passaro, M., Quartly, G. D., Swail, V., and Young, I.: Observing sea states, Front. Mar. Sci., 124, https://doi.org/10.3389/fmars.2019.00124, 2019.
Battaglia, J. and Aki, K.: Location of seismic events and eruptive fissures on the Piton de la Fournaise volcano using seismic amplitudes, J. Geophys. Res.-Sol. Ea., 108, B8, https://doi.org/10.1029/2002JB002193, 2003.
Battaglia, J., Aki, K., and Ferrazzini, V.: Location of tremor sources and estimation of lava output using tremor source amplitude on the Piton de la Fournaise volcano: 1. Location of tremor sources, J. Volcanol. Geoth. Res., 147, 268–290, https://doi.org/10.1016/j.jvolgeores.2005.04.005, 2005.
Bencivenga, M., Nardone, G., Ruggiero, F., and Calore, D.: The Italian Data Buoy Network, WTI Trans. Eng. Sci., 74, 321–332, 2012.
Borzì, A. M., Minio, V., Cannavò, F., Cavallaro, A., D'Amico, S., Gauci, A., De Plaen, R., Lecocq, T., Nardone, G., Orasi, A., Picone, M., and Cannata, A.: Monitoring extreme meteo-marine events in the Mediterranean area using the microseism (Medicane Apollo case study), Sci. Rep., 12, 21363, https://doi.org/10.1038/s41598-022-25395-9, 2022.
Bouin, M.-N. and Lebeaupin Brossier, C.: Surface processes in the 7 November 2014 medicane from air–sea coupled high-resolution numerical modelling, Atmos. Chem. Phys., 20, 6861–6881, https://doi.org/10.5194/acp-20-6861-2020, 2020.
Bromirski, P. D., Reinhard, E. F., and Graham, N.: Ocean wave height determined from inland seismometer data: Implications for investigating wave climate changes in the NE Pacific, J. Geophys. Res.-Oceans, 104, 20753–20766, https://doi.org/10.1029/1999JC900156, 1999.
Bromirski, P. D.: Vibrations from the “perfect storm”, Geochem. Geophy. Geosy., 2.7, https://doi.org/10.1029/2000GC000119, 2001.
Bromirski, P. D., Duennebier, F. K., and Stephen, R. A.: Mid-ocean microseisms, Geochem. Geophy. Geosy., 6.4, https://doi.org/10.1029/2004GC000768, 2005.
Cannata, A., Di Grazia, G., Aliotta, M., Cassisi, C., Montalto, P., and Patanè, D.: Monitoring seismo-volcanic and infrasonic signals at volcanoes: Mt. Etna case study, Pure Appl. Geophys., 170, 1751–1771, https://doi.org/10.1007/s00024-012-0634-x, 2013.
Cannata, A., Cannavò, F., Moschella, S., Di Grazia, G., Nardone, G., Orasi, A., Picone, M., Ferla, M., and Gresta, S.: Unravelling the relationship between microseisms and spatial distribution of sea wave height by statistical and machine learning approaches, Remote Sens., 12, 761, https://doi.org/10.3390/rs12050761, 2020.
Carrió, D. S., Homar, V., Jansa, A., Romero, R., and Picornell, M. A.: Tropicalization process of the 7 November 2014 Mediterranean cyclone: Numerical sensitivity study, Atmos. Res., 197, 300–312, https://doi.org/10.1016/j.atmosres.2017.07.018, 2017.
Capodici, F., Cosoli, S., Ciraolo, G., Nasello, C., Maltese, A., Poulain, P. M., Drago, A., Azzopardi, J., and Gauci, A.: Validation of HF radar sea surface currents in the Malta-Sicily Channel, Remote Sens. Environ., 225, 65–76, https://doi.org/10.1016/j.rse.2019.02.026, 2019.
Cavicchia, L., von Storch, H., and Gualdi, S.: Mediterranean tropical-like cyclones in present and future climate, J. Climate, 27.19, 7493–7501, https://doi.org/10.1175/JCLI-D-14-00339.1, 2014.
Comellas Prat, A., Federico, S., Torcasio, R. C., D'Adderio, L. P., Dietrich, S., and Panegrossi, G.: Evaluation of the sensitivity of medicane Ianos to model microphysics and initial conditions using satellite measurements, Remote Sens., 13, 4984, https://doi.org/10.3390/rs13244984, 2021.
Corsini, S., Franco, L., Inghilesi, R., and Piscopia, R.: Atlante delle onde nei mari italiani, Università degli studi di Roma Tre http://opac.apat.it/sebina/repository/catalogazione/immagini/pdf/atlante mari 1_60_2_.pdf, last access: 20 Decembe 2023.
Craig, D., Bean, C. J., Lokmer, I., and Möllhoff, M.: Correlation of wavefield-separated ocean-generated microseisms with North Atlantic source regions, B. Seismol. Soc. Am., 106, 1002–1010, 2016.
Cutroneo, L., Ferretti, G., Barani, S., Scafidi, D., De Leo, F., Besio, G., and Capello, M.: Near real-time monitoring of significant sea wave height through microseism recordings: Analysis of an exceptional sea storm event, J. Mar. Sci. Eng., 9, 319, https://doi.org/10.3390/jmse9030319, 2021.
D'Adderio, L. P., Panegrossi, G., Dafis, S., Rysman, J. F., Casella, D., Sanò, P., Fuccello, A., Miglietta, M M., Helios, and Juliette: Two Falsely Acclaimed Medicanes, Atmos. Res., 2023.
Dafis, S., Rysman, J. F., Claud, C., and Flaounas, E.: Remote sensing of deep convection within a tropical-like cyclone over the Mediterranean Sea, Atmos. Sci. Lett., 19, e823, https://doi.org/10.1002/asl.823, 2018.
Davies R.: Cyclone Helios, Malta and Italy, https://www.efas.eu/en/news/cyclone-helios-malta-and-italy-february-2023 (last access: 13 pril 2023), 2023.
Delibera di Giunta – Regione Siciliana https://www2.regione.sicilia.it/deliberegiunta/file/giunta/allegati/N.099_15.02.2023.pdf, last access: 13 April 2023.
Di Muzio, E., Riemer, M., Fink, A. H., and Maier-Gerber, M.: Assessing the predictability of Medicanes in ECMWF ensemble forecasts using an object-based approach, Q. J. Roy. Meteor. Soc., 145, 1202–1217, https://doi.org/10.1002/qj.3489, 2019.
Emanuel, K.: Increasing destructiveness of tropical cyclones over the past 30 years, Nature, 436, 686–688, https://doi.org/10.1038/nature03906, 2005.
Faranda, D., Bourdin, S., Ginesta, M., Krouma, M., Noyelle, R., Pons, F., Yiou, P., and Messori, G.: A climate-change attribution retrospective of some impactful weather extremes of 2021, Weather Clim. Dynam., 3, 1311–1340, https://doi.org/10.5194/wcd-3-1311-2022, 2022.
Ferretti, G., Zunino, A., Scafidi, D., Barani, S., and Spallarossa, D.: On microseisms recorded near the Ligurian coast (Italy) and their relationship with sea wave height, Geophys. J. Int., 194, 524–533, https://doi.org/10.1093/gji/ggt114, 2013.
Ferretti, G., Barani, S., Scafidi, D., Capello, M., Cutroneo, L., Vagge, G., and Besio, G.: Near real-time monitoring of significant sea wave height through microseism recordings: An application in the Ligurian Sea (Italy), Ocean Coast. Manage., 165, 185–194, https://doi.org/10.3390/jmse9030319, 2018.
Flaounas, E., Davolio, S., Raveh-Rubin, S., Pantillon, F., Miglietta, M. M., Gaertner, M. A., Hatzaki, M., Homar, V., Khodayar, S., Korres, G., Kotroni, V., Kushta, J., Reale, M., and Ricard, D.: Mediterranean cyclones: current knowledge and open questions on dynamics, prediction, climatology and impacts, Weather Clim. Dynam., 3, 173–208, https://doi.org/10.5194/wcd-3-173-2022, 2022.
GEOFON Data Center: GEOFON Seismic Network, Deutsches GeoForschungsZentrum GFZ, Other/Seismic Network [data set], https://doi.org/10.14470/TR560404, 1993.
Gerstoft, P., Fehler, M. C., and Sabra, K. G.: When katrina hit california, Geophys. Res. Lett., 33, https://doi.org/10.1029/2006GL027270, 2006.
Gualtieri, L., Camargo, S. J., Pascale, S., Pons, F. M., and Ekström, G.: The persistent signature of tropical cyclones in ambient seismic noise, Earth Planet. Sc. Lett., 484, 287–294, https://doi.org/10.1016/j.epsl.2017.12.026, 2018.
Guerin, G., Rivet, D., Van Den Ende, M. P. A., Stutzmann, E., Sladen, A., and Ampuero, J. P.: Quantifying microseismic noise generation from coastal reflection of gravity waves recorded by seafloor DAS, Geophys. J. Int., 231, 394–407, https://doi.org/10.1093/gji/ggac200, 2022.
Johnson, R. W.: An introduction to the bootstrap, Teaching Statistics, 23, 49–54, 2001.
Hart, R. E.: A cyclone phase space derived from thermal wind and thermal asymmetry, Mon. Weather Rev., 131, 585–616, https://doi.org/10.1175/1520-0493(2003)131<0585:ACPSDF>2.0.CO;2, 2003.
Hasselmann, K.: A statistical analysis of the generation of microseisms, Rev. Geophys., 1.2, 177–210, 1963.
Haubrich, R. A. and McCamy, K.: Microseisms: Coastal and pelagic sources, Rev. Geophys., 7.3, 539–571, 1969.
Kerkmann, J. and Bachmeier, S.: Development of a tropical storm in the Mediterranean Sea (6–9 November 2011), https://www.eumetsat.int/tropical-storm-develops-mediterranean-sea (last access: 15 February 2023), 2011.
Korres, G., Ravdas, M., and Zacharioudaki, A.: Mediterranean Sea Waves Hindcast (CMEMS MED-Waves), Copernicus Monitoring Environment Marine Service (CMEMS) [data set], https://doi.org/10.25423/CMCC/MEDSEA_HINDCAST_WAV_006_012, 2019.
Korres, G., Ravdas, M., Denaxa, D., and Sotiropoulou, M.: Mediterranean Sea Waves Reanalysis INTERIM (CMEMS Med-Waves, MedWAM3I system) (Version 1), Copernicus Monitoring Environment Marine Service (CMEMS) [data set], https://doi.org.10.25423/CMCC/MEDSEA_MULTIYEAR_WAV_006_012_MEDWAM3I, 2021.
Korres, G., Oikonomou, C., Denaxa, D., and Sotiropoulou, M.: Mediterranean Sea Waves Monthly Climatology (CMS Med-Waves, MedWAM3 system) (Version 1), Copernicus Marine Service (CMS)[data set], https://doi.org.10.25423/CMCC/MEDSEA_MULTIYEAR_WAV_006_012_CLIM, 2023.
Kumagai, H., Placios, P., Ruiz, M., Yepes, H., and Kozono, T.: Ascending seismic source during an explosive eruption at Tungurahua volcano, Ecuador, Geophys. Res. Lett., 38, https://doi.org/10.1029/2010GL045944, 2011.
Lagouvardos, K., Karagiannidis, A., Dafis, S., Kalimeris, A., and Kotroni, V.: Ianos – A hurricane in the Mediterranean, B. Am. Meteor. Soc., 103, E1621–E1636, https://doi.org/10.1175/BAMS-D-20-0274.1, 2022.
Lepore, S. and Grad, M.: Analysis of the primary and secondary microseisms in the wavefield of the ambient noise recorded in northern Poland, Acta Geophys., 66, 915–929, 2018.
Lin, J., Lin, J., and Xu, M.: Microseisms generated by super typhoon Megi in the western Pacific Ocean, J. Geophys. Res.-Oceans, 122, 9518–9529, https://doi.org/10.1002/2017JC013310, 2017.
Lionello, P., Conte, D., and Reale, M.: The effect of cyclones crossing the Mediterranean region on sea level anomalies on the Mediterranean Sea coast, Nat. Hazards Earth Syst. Sci., 19, 1541–1564, https://doi.org/10.5194/nhess-19-1541-2019, 2019.
Long, R. M., Barrick, D., Largier, J. L., and Garfield, N.: Wave observations from central California: SeaSonde systems and in situ wave buoys, J. Sensors, 2011, 728936, https://doi.org/10.1155/2011/728936, 2011.
Longuet-Higgins, M. S.: A theory of the origin of microseisms, Philos. T. Roy. Soc. Lond. A, 243.857, 1–35, 1950.
Lorente, P., Lin-Ye, J., García-León, M., Reyes, E., Fernandes, M., Sotillo, M. G., Espino, M., Ruiz, M. I., Gracia, V., Perez, S., Aznar, R., and Alonso-Martirena, A.: On the performance of high frequency radar in the western mediterranean during the record-breaking storm gloria, Front. Mar. Sci., 8, 645762, https://doi.org/10.3389/fmars.2021.645762, 2021.
MedCyclones [@MedCyclones]: A warm-air seclusion has formed south of #Malta According to GFS the warm core will remain shallow today. Indeed, the absence of deep convection close to the center of the cyclone distinguishes it from #Medicanes. Heavy rainfall and snowfall events will continue to affect #Italy, https://twitter.com/medcyclones/status/1623992335104081921?s=20 (last access: 23 May 2023), X, posted: 11:28, 10 February 2023a.
MedCyclones [@MedCyclones]: A nasty warm conveyor belt has covered southern Italy and is associated with a Mediterranean cyclone with a center of minimum MSLP SE of Malta. @meteonetwork weather stations report very high accumulations of rainfall and snow in Sicily on Thu 9/2, https://twitter.com/medcyclones/status/1623795373423620096?s=20 (last access: 23 May 2023), X, posted: 10:26, 9 February 2023b.
MedCyclones [@MedCyclones]: A nasty warm conveyor belt has covered southern Italy and is associated with a Mediterranean cyclone with a center of minimum MSLP SE of Malta. @meteonetwork weather stations report very high accumulations of rainfall and snow in Sicily on Thu 9/2, https://twitter.com/medcyclones/status/1624143740800536591?s=20 (last access: 23 May 2023), X, posted: 10:26, 9 February 2023c.
Miglietta, M. M., Moscatello, A., Conte, D., Mannarini, G., Lacorata, G., and Rotunno, R.: Numerical analysis of a Mediterranean “hurricane” over south-eastern Italy: Sensitivity experiments to sea surface temperature, Atmos. Res., 101, 412–426, https://doi.org/10.1016/j.atmosres.2011.04.006, 2011.
Miglietta, M. M., Laviola, S., Malvaldi, A., Conte, D., Levizzani, V., and Price, C.: Analysis of tropical-like cyclones over the Mediterranean Sea through a combined modeling and satellite approach, Geophys. Res. Lett., 40, 2400–2405, https://doi.org/10.1002/grl.50432, 2013.
Miglietta, M. M. and Rotunno, R.: Development mechanisms for Mediterranean tropical-like cyclones (medicanes), Q. J. Roy. Meteor. Soc., 145, 1444–1460, https://doi.org/10.1002/qj.3503, 2019.
Minio, V., Borzì, A. M., Saitta, S., Alparone, S., Cannata, A., Ciraolo, G., Contraffatto, D., D’Amico, S., Di Grazia, G., Larocca, G., and Cannavò, F.: Towards a monitoring system of the sea state based on microseism and machine learning, Environ. Model. Softw., 167, 105781, 2023.
Moschella, S., Cannata, A., Cannavò, F., Di Grazia, G., Nardone, G., Orasi, A., Picone, M., Ferla, M., and Gresta, S.: Insights into microseism sources by array and machine learning techniques: Ionian and Tyrrhenian sea case of study, Front. Earth Sci., 8, 114, https://doi.org/10.3389/feart.2020.00114, 2020.
Nastos, P. T., Papadimou, K. K., and Matsangouras, I. T.: Mediterranean tropical-like cyclones: Impacts and composite daily means and anomalies of synoptic patterns, Atmos. Res., 208, 156–166, https://doi.org/10.1016/j.atmosres.2017.10.023, 2018.
Oliver, J. and Page, R.: Concurrent storms of long and ultralong period microseisms, B. Seismol. Soc. Am., 53, 15–26, 1963.
Orasi, A., Picone, M., Drago, A., Capodici, F., Gauci, A., Nardone, G., Inghilesi, R., Azzopardi, J., Galea, A., Ciraolo, G., Musilim, J. S., and Alonso-Martinera, A.: HF radar for wind waves measurements in the Malta-Sicily Channel, Measurement, 128, 446–454, https://doi.org/10.1016/j.measurement.2018.06.060, 2018.
Pravia-Sarabia, E., Gómez-Navarro, J. J., Jiménez-Guerrero, P., and Montávez, J. P.: Influence of sea salt aerosols on the development of Mediterranean tropical-like cyclones, Atmos. Chem. Phys., 21, 13353–13368, https://doi.org/10.5194/acp-21-13353-2021, 2021.
Portmann, R., González-Alemán, J. J., Sprenger, M., and Wernli, H.: How an uncertain short-wave perturbation on the North Atlantic wave guide affects the forecast of an intense Mediterranean cyclone (Medicane Zorbas), Weather Clim. Dynam., 1, 597–615, https://doi.org/10.5194/wcd-1-597-2020, 2020.
Reguero, B. G., Losada, I. J., and Méndez, F. J.: A recent increase in global wave power as a consequence of oceanic warming, Nat. Commun., 10, 205, https://doi.org/10.1038/s41467-018-08066-0, 2019.
Retailleau, L. and Gualtieri, L.: Toward high-resolution period-dependent seismic monitoring of tropical cyclones, Geophys. Res. Lett., 46, 1329–1337, https://doi.org/10.1029/2018GL080785, 2019.
Retailleau, L. and Gualtieri, L.: Multi-phase seismic source imprint of tropical cyclones, Nat. Commun., 12, 2064, https://doi.org/10.1038/s41467-021-22231-y, 2021.
Rost, S. and Thomas, C.: Array seismology: Methods and applications, Rev. Ceophys., 40, 2–1, https://doi.org/10.1029/2000RG000100, 2002.
Rumora, I., Jukić, O., Filić, M., and Filjar, R.: A study of GPS positioning error associated with tropospheric delay during Numa Mediterranean cyclone, Int. J. Transp. Traff. Eng., 8, 282–293, https://doi.org/10.7708/ijtte.2018.8(3).03, 2018.
Sarpkaya, T. and Isaacson, M.: Mechanics of wave forces on offshore structures Van Nostrand Reinhold Company, New York, New York, https://doi.org/10.1115/1.3162189, 1981.
Saviano, S., Kalampokis, A., Zambianchi, E., and Uttieri, M.: A year-long assessment of wave measurements retrieved from an HF radar network in the Gulf of Naples (Tyrrhenian Sea, Western Mediterranean Sea), J. Oper. Oceanogr., 12, 1–15, https://doi.org/10.1080/1755876X.2019.1565853, 2019.
Scardino, G., Scicchitano, G., Chirivì, M., Costa, P. J. M., Luparelli, A., and Mastronuzzi, G.: Convolutional Neural Network and Optical Flow for the Assessment ofWave and Tide Parameters from Video Analysis (LEUCOTEA): An Innovative Tool for Coastal Monitoring, Remote Sens., 14, 2994, https://doi.org/10.3390/rs14132994, 2022.
Scicchitano, G., Scardino, G., Monaco, C., Piscitelli, A., Milella, M., De Giosa, F., and Mastronuzzi, G.: Comparing impact effects of common storms and Medicanes along the coast of south-eastern Sicily, Mar. Geol., 439, 106556, https://doi.org/10.1016/j.margeo.2021.106556, 2021.
Shaltout, M. and Omstedt, A.: Recent sea surface temperature trends and future scenarios for the Mediterranean Sea, Oceanologia, 56, 411–443, https://doi.org/10.5697/oc.56-3.411, 2014.
Soubestre, J., Shapiro, N. M., Seydoux, L., De Rosny, J., Droznin, D. V., Droznina, S. Y., Senyukov, S. L., and Gordeev, E. I.: Network-based detection and classification of seismovolcanic tremors: Example from the Klyuchevskoy volcanic group in Kamchatka, J. Geophys. Res.-Sol. Ea., 123, 564–582, https://doi.org/10.1002/2017JB014726, 2018.
Sun, T., Xue, M., Le, K. P., Zhang, Y., and Xu, H.: Signatures of ocean storms on seismic records in South China Sea and East China Sea, Mar. Geophys. Res., 34, 431–448, https://doi.org/10.1007/s11001-013-9204-6, 2013.
Tous, M., and Romero, R.: Meteorological environments associated with medicane development, Int. J. Climatol., 33, 1–14, https://doi.org/10.1002/joc.3428, 2013.
Trnkoczy, A., Bormann, P., Hanka, W., Holcomb, L. G., and Nigbor, R. L.: Site selection, preparation and installation of seismic stations., in: New Manual of Seismological Observatory Practice 2 (NMSOP-2), 1–139, Deutsches GeoForschungsZentrum GFZ, 2012.
Varlas, G., Vervatis, V., Spyrou, C., Papadopoulou, E., Papadopoulos, A., and Katsafados, P.: Investigating the impact of atmosphere–wave–ocean interactions on a Mediterranean tropical-like cyclone, Ocean Model., 153, 101675, https://doi.org/10.1016/j.ocemod.2020.101675, 2020.
Welch, P. D.: The use of Fast Fourier Transform for the estimation of power spectra: a method based on time averaging over short, modified periodograms, IEEE T. Audio Electroacoust., 15, 70–73, https://doi.org/10.1109/TAU.1967.1161901, 1967.
Zhang, J., Gerstoft, P., and Bromirski, P. D.: Pelagic and coastal sources of P-wave microseisms: Generation under tropical cyclones, Geophys. Res. Lett., 37, https://doi.org/10.1029/2010GL044288, 2010.
Zimbo, F., Ingemi, D., and Guidi, G.: The tropical-like cyclone “ianos” in September 2020, Meteorology, 1, 29–44, https://doi.org/10.3390/meteorology1010004, 2022.