the Creative Commons Attribution 4.0 License.
the Creative Commons Attribution 4.0 License.
 | 16 May 2023
Multi-model analysis of the Adriatic dense-water dynamics
Cléa Denamiel
Ivica Janeković
Ivica Vilibić
This study aims to enhance our understanding of the bora-driven dense-water dynamics in the Adriatic Sea using different state-of-the-art modelling approaches during the 2014–2015 period. Practically, we analyse and compare the results of the following four different simulations: the latest reanalysis product for the Mediterranean Sea, a recently evaluated fine-resolution atmosphere–ocean Adriatic Sea climate model, and a long-time-running Adriatic Sea atmosphere–ocean forecast model used in both hindcast and data assimilation (with 4 d cycles) modes. As a first step, we evaluate the resolved physics in each simulation by focusing on the performance of the models. Then, we derive the general conditions in the ocean and the atmosphere during the investigated period. Finally, we analyse in detail the numerical reproduction of the dense-water dynamics as seen by the four simulations. The likely prerequisites for proper modelling of the ocean circulation in the Adriatic basin, including a kilometre-scale atmosphere–ocean approach, non-hydrostatic atmospheric models, fine vertical resolutions in both atmosphere and ocean, and the location and forcing of the open boundary conditions, are thus discussed in the context of the different simulations. In conclusion, a 31-year-long run of the fine-resolution Adriatic Sea climate model is found to be able to outperform most aspects of the reanalysis product, the short-term hindcast, and the data-assimilated simulation in reproducing the dense-water dynamics in the Adriatic Sea.
- Article
(17982 KB) - Full-text XML
-
Supplement
(1101 KB) - BibTeX
- EndNote


The focus of this study is the Adriatic Sea – an elongated semi-enclosed basin located in the northern Mediterranean Sea. The main geomorphological features of the Adriatic Sea (Fig. 1a) include a shallow bathymetry of the northern Adriatic shelf, gradually increasing in depth towards the 280 m deep Jabuka Pit. The middle Adriatic is separated from the ∼ 1200 m deep Southern Adriatic Pit (SAP) by the Palagruža Sill, whereas in the very south, the Otranto Strait connects the Adriatic with the northern Ionian Sea. The Adriatic region is also characterized by an extremely complex eastern coastline, with many islands and large mountain ranges along the entire basin.
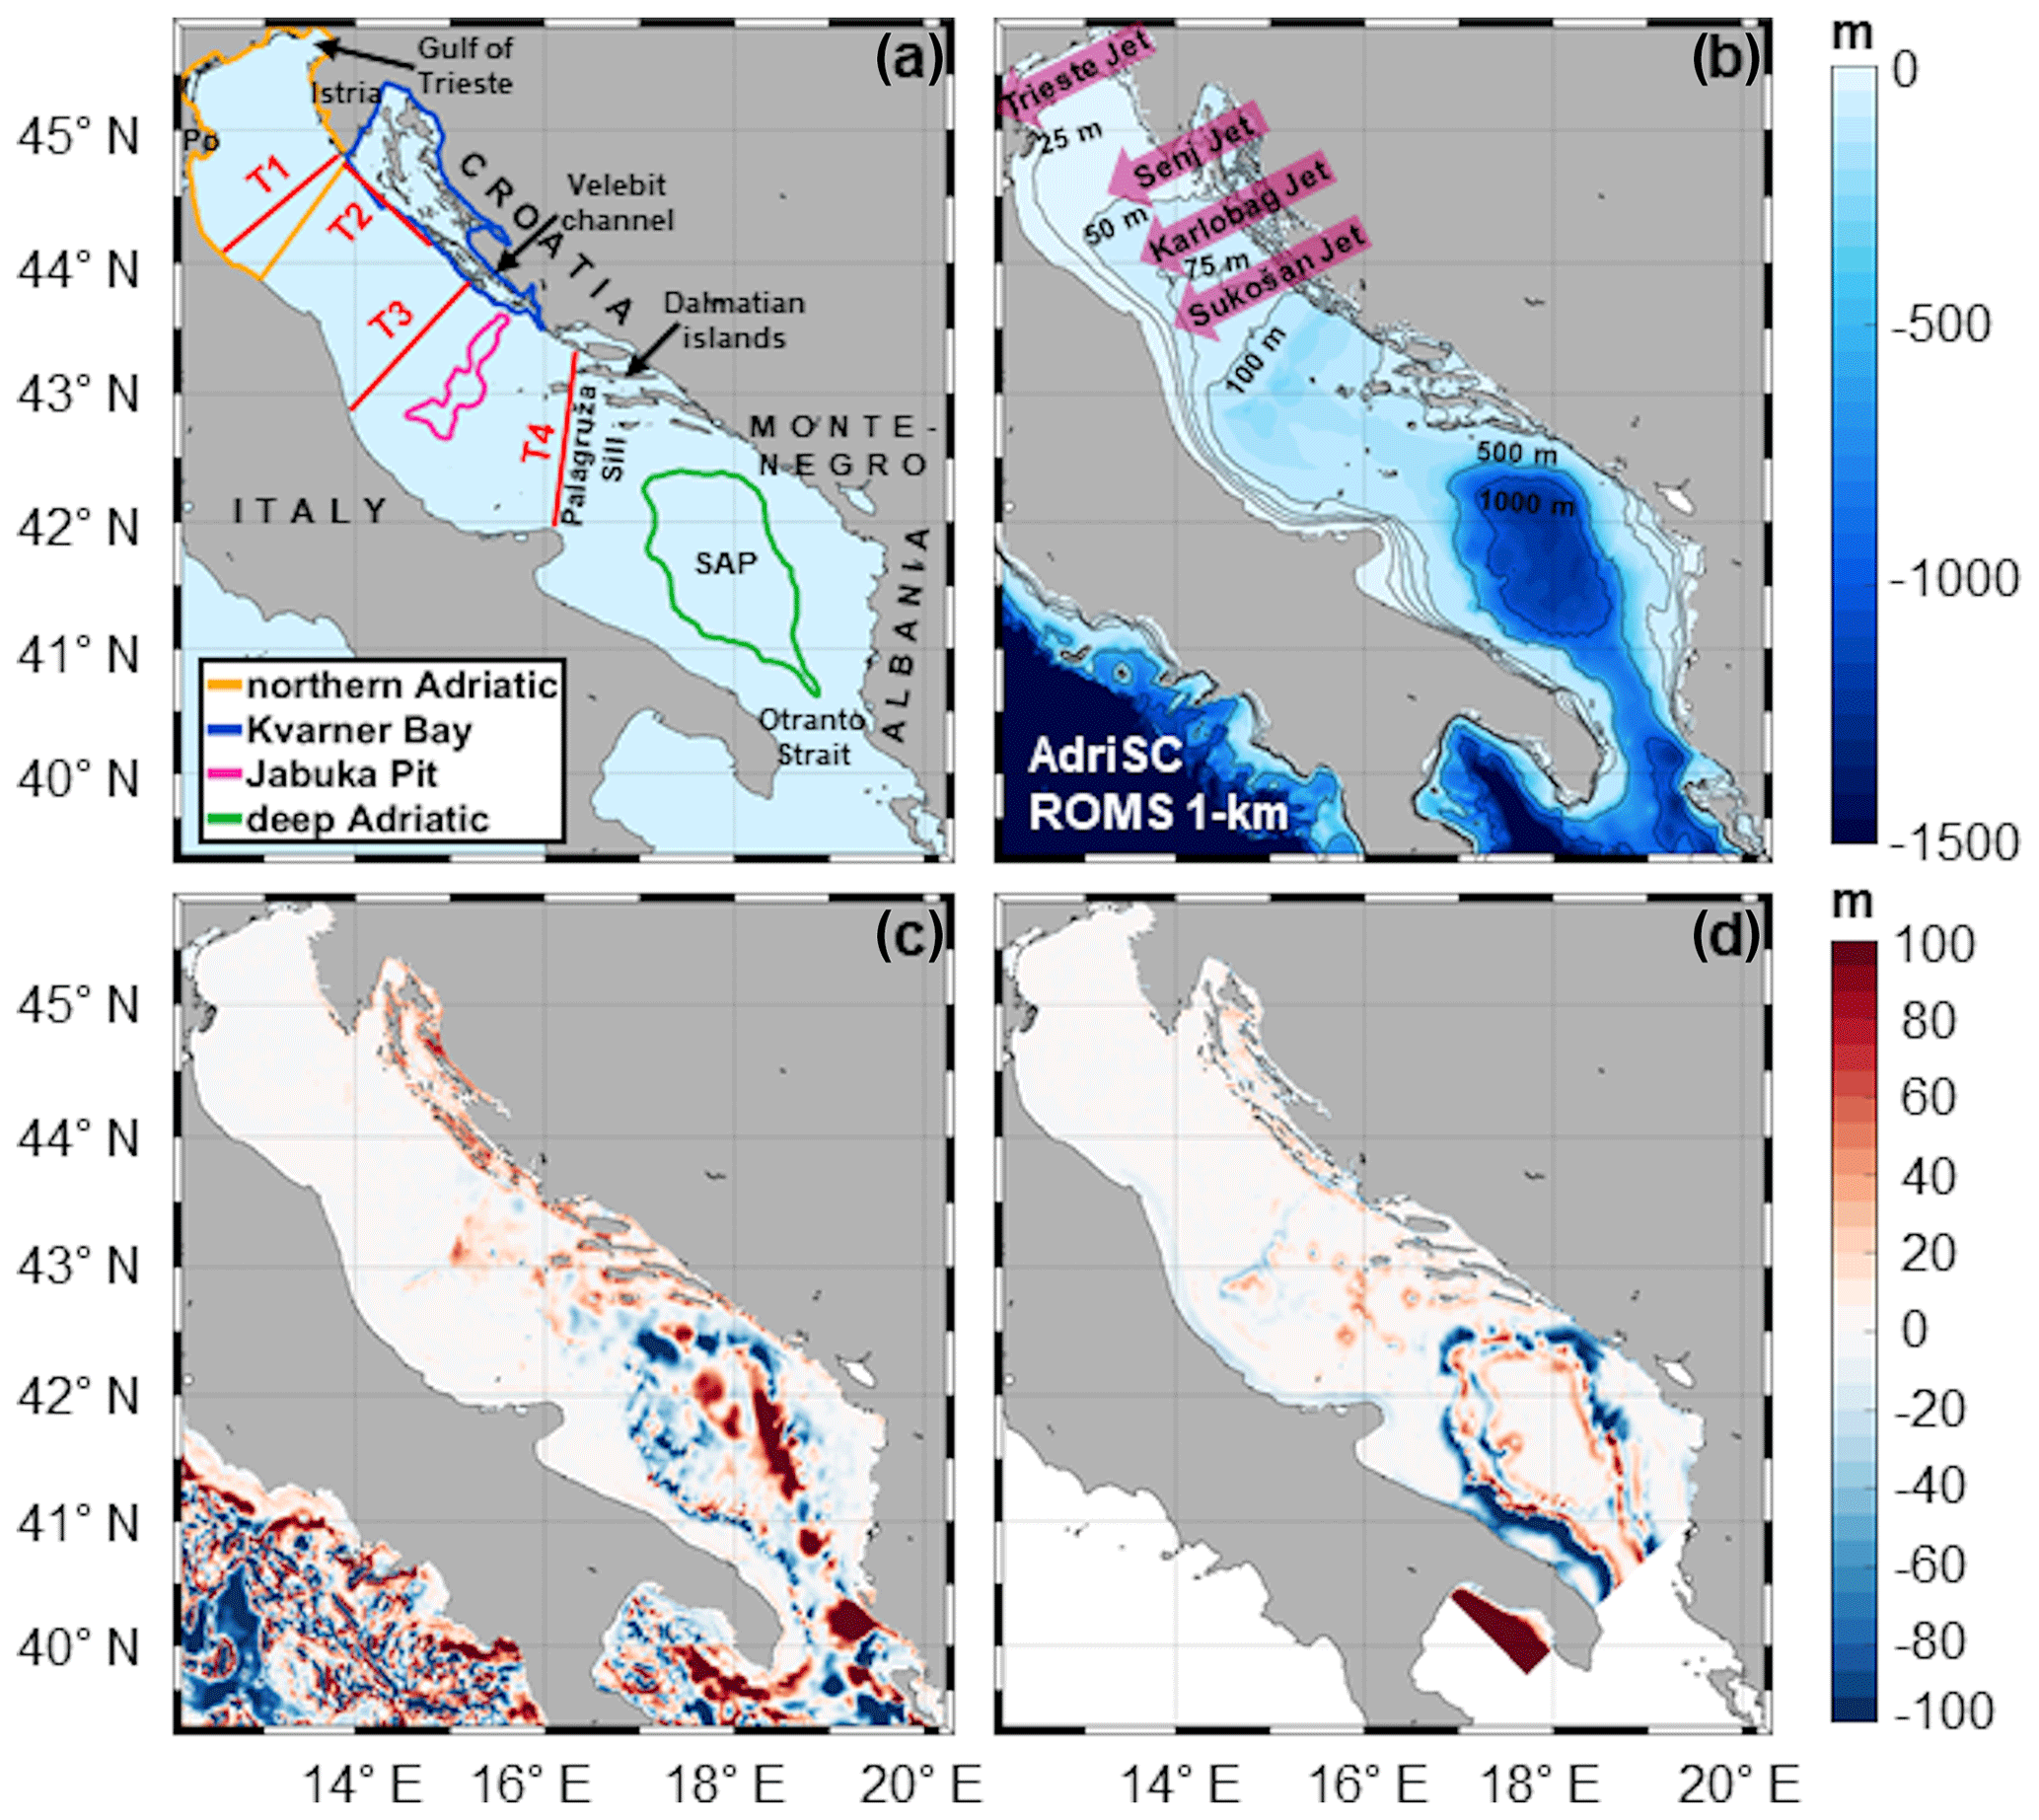
Figure 1(a) Model domains with geographical locations, transects, and subdomains; (b) AdriSC-ROMS 1 km bathymetry; (c) difference between AdriSC-ROMS 1 km and MEDSEA 1 km bathymetry; (d) difference between AdriSC-ROMS 1 km and ROMS 1 km bathymetry.
The thermohaline circulation is one of the main factors influencing the Adriatic Sea dynamics. On the one hand, the river Po in the northern Adriatic drives the outward Western Adriatic Current (WAC) along the western coast. On the other hand, the inward Eastern Adriatic Current (EAC) flows along the eastern side of the Adriatic Sea and transports water masses from the Mediterranean Sea and, in coastal regions, from large rivers located in northern Albania and southern Croatia. Another important driver of the thermohaline circulation is the formation of the densest water mass in the whole Mediterranean Sea, the North Adriatic Dense Water (NAddW; Zore-Armanda, 1963).
NAddW formation is known to occur in winter during severe bora events associated with hurricane-strength gusts up to 50 m s−1 (Belušić and Klaić, 2004). Bora events have a typical duration of about 2 d and up to a week (Belušić et al., 2013; Grisogono and Belušić, 2009; Stiperski et al., 2012). They are strongly influenced by the orography and occur most frequently and most intensely along the northern Velebit mountain range (e.g. Belušić et al., 2007; Gohm et al., 2008; Grubišić, 2004; Klemp and Durran, 1987; Kuzmić et al., 2015; Smith, 1987). Practically, the alternation of major mountain gaps and peaks along the Velebit mountain range results in the formation of gap jets and wakes (e.g. Alpers et al., 2009; Jiang and Doyle, 2005; Signell et al., 2010). The bora jets thus occur in known locations (Fig. 1b). The Trieste jet has the northernmost location, the Senj jet is the most intense and furthest reaching at sea, while the Karlobag and Sukošan jets strongly impact the upper middle Adriatic (Dorman et al., 2007; Pullen et al., 2007; Janeković et al., 2014; Denamiel et al., 2020a, b). Several jets also occur along the eastern coast in the middle and southern Adriatic (Grisogono and Belušić, 2009; Horvath et al., 2009). During the most extreme bora events, the intensity of the upward sea surface heat fluxes – taking out heat from the sea – is largely increased along the jets, inducing negative buoyancy fluxes associated with sea surface cooling at hourly to daily timescales (e.g. Janeković et al., 2014; Denamiel et al., 2021a). This cooling, in addition to the homogenization of the coastal waters during the late autumn and winter seasons, results in the formation of dense waters over the northern Adriatic and the Kvarner Bay (e.g. Janeković et al., 2014; Ličer et al., 2016; Vilibić et al., 2018). Days to weeks after such bora events, a strong thermohaline circulation – mostly driven by bottom density currents – starts in the Adriatic–Ionian basin and generally lasts for months (Orlić et al., 2007). Indeed, the dense waters, generated in the northern Adriatic or within the Kvarner Bay, travel along the Italian coast following the Po River plume (Artegiani and Salusti, 1987; Vilibić and Mihanović, 2013) and either leave the Adriatic basin towards the northern Ionian Sea or are collected within the Jabuka Pit (Marini et al., 2006), the SAP (Querin et al., 2016) but also within the Kvarner Bay, which serves as an area of both generation and deposition of the dense waters. Thus, bora-driven dense-water formation in the northern Adriatic, jointly with the deep waters generated through bora-driven open convection in the SAP (Gačić et al., 2002), has a crucial impact on the Adriatic thermohaline circulation, as well as on biogeochemical properties (Boldrin et al., 2009; Bensi et al., 2013; Gačić et al., 2010; Batistić et al., 2014; Jasprica et al., 2022). Besides the Adriatic Sea, dense-water formation on shelves and its subsequent sinking along shelf breaks (i.e. cascading; Shapiro and Hill, 1997, 2003) have been observed and studied in many other areas of the world ocean and particularly in higher latitudes (Borenas et al., 2002; Shapiro et al., 2003; Wahlin, 2002, 2004; Ivanov et al., 2004; Heggelund et al., 2004; Leredde et al., 2007; Garcia-Quintana et al., 2021).
In the Adriatic, past numerical studies have shown the importance of several factors influencing the modelling of the bora-driven dense-water formation. At first, the atmospheric forcing used as a source of forcing for the ocean models was not capable of properly reproducing the extreme bora events driving this process (Bergamasco et al., 1999; Vested et al., 1998; Beg-Paklar et al., 2001; Zavatarelli et al., 2002; Oddo and Guarnieri, 2011). Indeed, the resolution of the atmospheric model has been found to be one of the most important characteristics known to impact the bora wind speeds due to an improved reproduction of the orography and the enhancement of jet flows in finer grids (Belušić et al., 2017). Also, the importance of the ocean model resolution has been demonstrated through many studies that used kilometre-scale limited-area models to simulate ocean processes driven by extreme conditions in the Adriatic Sea (e.g. Cavaleri et al., 2010, 2018; Ricchi et al., 2016; Carniel et al., 2016; Denamiel et al., 2020b). Further, the influence of the freshwater forcing in the ocean models was found to be crucial in modelling the dense-water formation. In particular, the river runoff climatology used in previous studies (Raicich, 1994) overestimated real river discharges along the eastern Adriatic coast (Zavatarelli and Pinardi, 2002; Chiggiato and Oddo, 2008) and has been replaced by a new climatology which was based on up-to-date observations (Janeković et al., 2014). That significantly improved the reproduction of the dense-water formation, particularly at its secondary source location in the Kvarner Bay (Vilibić et al., 2016, 2018; Mihanović et al., 2018). Other factors such as the choice of open boundary conditions and the parametrization of vertical mixing and diffusion were also found to be important (Benetazzo et al., 2014; Janeković et al., 2014).
The proper representation of the bora-driven dense-water dynamics in the Adriatic Sea is still challenging nowadays, whether it is for research purposes, such as with hindcast simulations and reanalysis products, or for operational purposes, such as with forecast simulations. This is why, recently, data assimilation was explored as an avenue to improve free model simulations, including the dense-water dynamics in the Adriatic Sea (Yaremchuk et al., 2016; Janeković et al., 2020). More particularly, the four-dimensional variational scheme (4D-Var; Courtier et al., 1994; Janeković et al., 2013; Iermano et al., 2015; Sperrevik et al., 2017) was used during the 2014–2015 period when a large number of in situ salinity, temperature, and current observations were available (Janeković et al., 2020). Further, a 31-year (1987–2017) evaluation simulation of the Adriatic Sea and Coast (AdriSC; Denamiel et al., 2019) climate model using kilometre-scale atmosphere–ocean models over the Adriatic basin has also been recently completed and evaluated (Pranić et al., 2021; Denamiel et al., 2021b). These kinds of simulations, also referred to as “control run” in the climate community, produce several-decade-long results forced by reanalysis products (without data assimilation) and are mainly used for evaluation purposes in climate studies. As a free run (i.e. dynamically consistent over decades, contrary to reanalysis products, which depend on the availability of the observations; Thorne and Vose, 2010), the AdriSC evaluation simulation has already provided invaluable information about the till-now-unknown kilometre-scale present trends and variability of the Adriatic Sea (Tojčić et al., 2023).
The aim of this study is thus to compare the currently available modelling strategies used to represent the bora-driven dense-water dynamics in the Adriatic Sea. The approaches considered in the study are as follows: (1) the newest high-resolution physical reanalysis product for the Mediterranean Sea (Escudier et al., 2020, 2021), hereafter referred as MEDSEA, which is generated by a numerical system composed of the Nucleus for European Modelling of the Ocean (NEMO) V3.6 model (Madec et al., 2017) and a three-dimensional variational (3D-Var) data assimilation scheme OceanVAR (Dobricic and Pinardi, 2008) and is forced by the ERA5 reanalysis (Hersbach et al., 2020); (2) the year-long simulations of an atmosphere–ocean Adriatic Sea forecast model (Janeković et al., 2020) composed of ROMS (Regional Ocean Modelling System; Shchepetkin and McWilliams, 2005, 2009) and ALADIN-HR (Aire Limitée Adaptation dynamique Développement InterNational; Tudor et al., 2013, 2015) models used in both hindcast mode (hereafter referred to as ROMS-hind) and with a 4D-Var data assimilation procedure (hereafter referred to as ROMS-full); and (3) the recently evaluated 31-year simulation of the fine-resolution atmosphere–ocean AdriSC climate model, which is based on a modified version of the Coupled Ocean–Atmosphere–Wave–Sediment–Transport (COAWST V3.3) modelling system (Warner et al., 2010). The AdriSC model is composed of the ROMS model (hereafter referred to as AdriSC-ROMS) and the Weather Research and Forecasting (WRF v3.9.1.1; Skamarock et al., 2005) model (hereafter referred to as AdriSC-WRF).
In the following section, the numerical models, as well as the methods used to perform this study, are described. The results of the analyses are presented in Sect. 3 and discussed in detail in Sect. 4. Finally, the main conclusions of the study are summarized in Sect. 5.
2.1 Northern Adriatic Experiment (NAdEx)
The time period investigated in this study includes the Northern Adriatic Experiment (NAdEx) campaign which took place between late autumn 2014 and summer 2015. The aim of the NAdEx campaign was to study the dense-water generation and transport within and off the Kvarner Bay. It consisted of collecting temperature, salinity, and current data using several instruments and observing platforms. To measure the currents, acoustic Doppler current profilers (ADCPs) were deployed at nine locations between late November 2014 and mid-August 2015, while conductivity–temperature–depth (CTD) probes measured salinity and temperature at five of the ADCP locations. Additionally, vertical profiles of temperature and salinity were acquired at 19 CTD stations during two cruises between 3 and 6 December 2014 and between 26 and 29 May 2015. An ocean glider was operated off the Kvarner Bay in a campaign lasting only 3 d – from 24 to 27 February 2015 – while an Arvor-C profiling float was deployed on 19 February 2015 in the northern part of Kvarner Bay and was recovered on 15 March 2015 off the Istria coast. The full description of the NAdEx campaign is provided in Vilibić et al. (2018). During the campaign, three severe bora episodes with gusts above 50 m s−1 in the Velebit channel occurred over the following dates: between 28 December 2014 and 1 January 2015, between 4 and 7 February 2015, and between the 3 and 6 March 2015. The NAdEx campaign was thus able to partially observe the dense-water generation within the Kvarner Bay during the 2014–2015 period.
Due to the unique data set collected during the NAdEx campaign – which has already been used both in data assimilation experiments (Janeković et al., 2020) and in evaluation studies (Vilibić et al., 2018; Pranić et al., 2021) – the 2015 bora events present a unique opportunity to compare the capacity of different models (e.g. reanalysis, hindcast, assimilated simulations, and climate simulations) to reproduce the dense-water dynamics in the Adriatic basin.
2.2 Methods
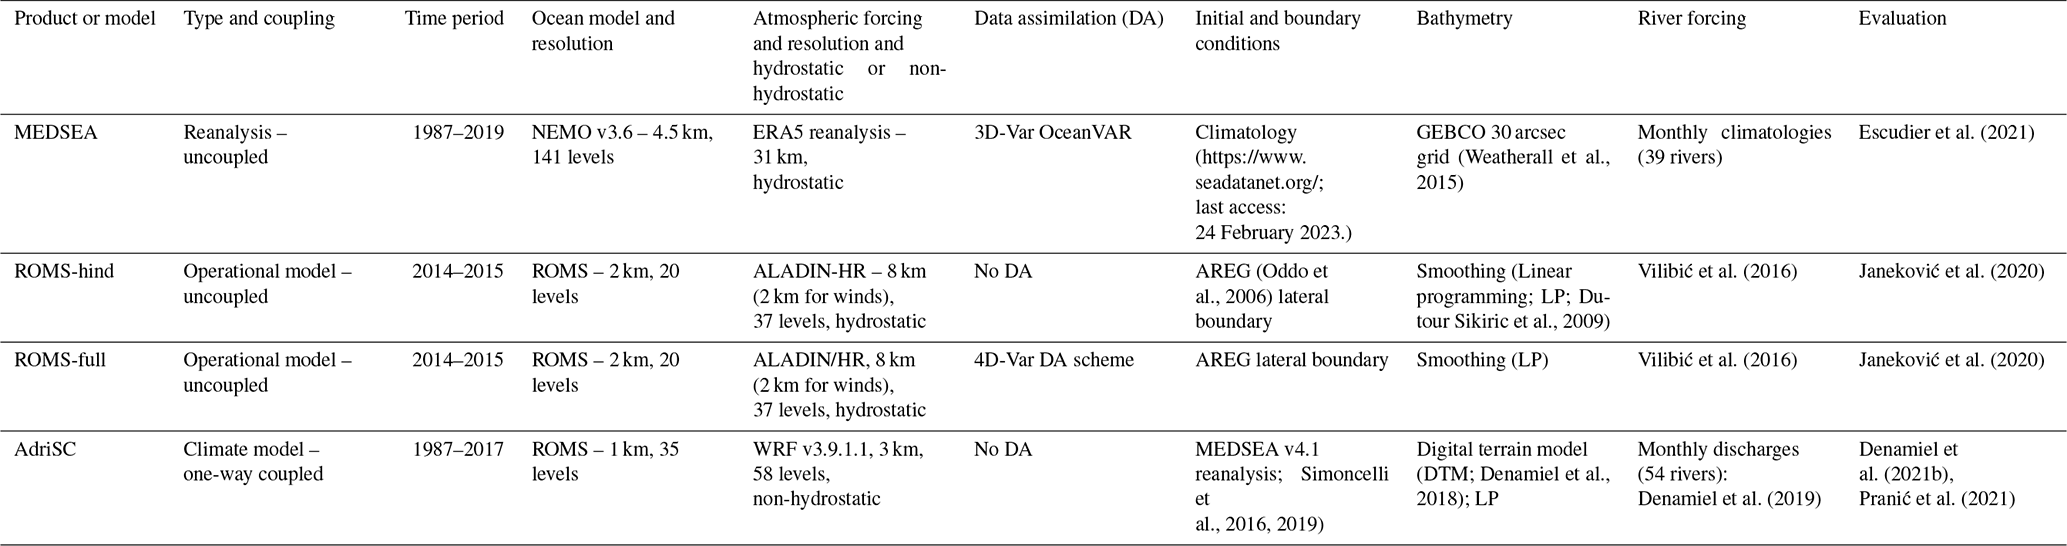
The main features of the numerical models and products used in this study are presented in Table 1. Additional information and a more detailed description of the models are provided in the Supplement (Sect. S2).
In order to compare different simulations, model results with a horizontal grid resolution coarser than 1 km are interpolated to the AdriSC-ROMS 1 km grid using the regridding routines based on the Earth System Modeling Framework (ESMF) software (http://earthsystemmodeling.org/, last access: 2 March 2023). More specifically, the results of the ocean models (MEDSEA, ROMS-hind, and ROMS-full) and the atmospheric models (ERA5, ALADIN-HR-hind, ALADIN-HR-full, and AdriSC-WRF) are all regridded to a horizontal resolution of 1 km. However, model outputs were not interpolated in the vertical.
Hereafter, the bottom potential-density anomalies (PDAs) are calculated using the function available within the NCAR Command Language (NCL) library (Levitus et al., 1994a, b; Dukowicz, 2000; https://www.ncl.ucar.edu/, last access: 14 November 2022), and the upward turbulent heat fluxes are computed as the sum of the latent and sensible heat fluxes based on the formulas provided in Denamiel et al. (2020a, 2021a). To be noted, heat fluxes from the ALADIN-HR-full results are also modified by the 4D-Var data assimilation process. Further, in this study, dense waters are defined as having PDAs equal to or larger than 29.2 kg m−3 based on previous research dealing with dense waters in the Adriatic (e.g. Janeković et al., 2014; Vilibić et al., 2016).
A comparative evaluation of the simulations for the 2014–2015 period is carried out against in situ temperature and salinity observations extracted from the NAdEx campaign (Vilibić et al., 2018), the Palagruža Sill long-term monitoring transect (Institute of Oceanography and Fisheries, Croatia), and the database published by Vilibić (2021) and described in Pranić et al. (2021). The assessment is presented in the form of a Taylor diagram (Taylor, 2001) using multiple statistical parameters (normalized standard deviations and correlations) and probability density functions of the biases (PDFs). Normalized standard deviations are calculated as the ratio of the standard deviation of model results and the standard deviation of observations, while the correlations are the Pearson's linear correlation coefficients.
Table 1The summary of the main features of the products and models used in this study.
The biases are calculated as the differences between the daily results of the simulations and the available observations (i.e. they are daily instantaneous-bias errors). That is, the model results are extracted at the location (i.e. near-neighbour grid point), depth (i.e. linear interpolation from model depths to observation depth), and timing (i.e. approximated to daily average) of the observations. The biases are then obtained as the difference between model results and observations at each point in time, depth, and space. The probability density functions are derived with a kernel-smoothing method (Bowman and Azzalini, 1997) which calculates the probability density estimate based on a normal kernel function and is evaluated at 100 equally spaced points. Also, for each model, the median and the median absolute deviation (MAD) of the biases are calculated.
Additionally, to determine the minimum horizontal resolution necessary to resolve the processes occurring in the Adriatic Sea, the baroclinic Rossby radii are calculated for the whole AdriSC-ROMS 1 km domain. The results are presented as spatial distributions of the median and MAD of the Rossby radius, as well as in the form of a time series of the Rossby radius for the four subdomains (northern Adriatic, Kvarner Bay, Jabuka Pit, and deep Adriatic). In this study, the potential density method described in Chelton et al. (1998) is used to calculate the Brunt–Väisälä frequency and, hence, the first mode of the Rossby radii. This method can result in an underestimation of the Rossby radii if the vertical spacing is not fine enough. As the AdriSC-ROMS model provides results on 35 vertical sigma layers for the entire Adriatic Sea, this underestimation can thus only occur within the SAP area.
Further, to quantify the general conditions in the ocean and atmosphere throughout the whole 2014–2015 period, an analysis of the extremes is performed. For each of the four simulations, the results are presented as spatial distributions of extremes accompanied by the spatial distributions of their associated timing (in days). This includes the spatial distributions of the maximum wind stresses and the maximum upward turbulent heat fluxes in the atmosphere (at the sea surface) and of the maximum PDAs, minimum temperatures, and maximum salinities in the ocean.
In order to better capture the dense-water dynamics, two different temporal analyses of the results are also performed. First, time series of daily surface wind stresses and upward turbulent heat fluxes in the atmosphere and of daily bottom PDAs, temperatures, and salinities in the ocean are presented as the spatial average over different subdomains selected in areas where dense waters are known to be either generated or accumulated. These subdomains are the northern Adriatic and the Kvarner Bay for both atmosphere and ocean, as well as the Jabuka Pit and the deep Adriatic for the ocean only (Fig. 1a). In addition, the daily bottom PDA time series are presented without the mean and the seasonal signal (yearly and half-yearly), which are removed from the series at each point. More specifically, after subtracting the mean and detrending the time series, the seasonal signal is calculated using the least-squares method of a sine function and is subtracted from the series. The final time series without the seasonality are obtained by adding the trend. Lastly, the time evolution of the spatial distributions of the bottom PDAs is presented at selected dates – 1 March, 1 April, 1 May, and 1 June 2015 – and for the whole 2014–2015 period as a movie.
The final analysis quantifies the total daily volume transport of the outflowing dense waters across four transects (T1–T4; Fig. 1a) for all depths. The outward transport is calculated as a double integral of velocities that are normal to the transect over the area of the vertical plane of the transect.
3.1 Comparative evaluation during the 2014–2015 period
A brief comparative evaluation of the four simulations is performed in order to quantify the skills of the ocean models against 18 987 CTD measurements (Fig. 2c). The number of observations depending on the depth is (1) 7698 for the 0–50 m range, (2) 7582 for the 50–200 m range, (3) 2130 for the 200–500 m range, and (4) 1577 for the 500–1200 m range. The observations partially cover the northern Adriatic, the Kvarner Bay, the Palagruža Sill, and the SAP.
A Taylor diagram (Fig. 2a) shows the correlations and standard deviations (normalized) of the modelled and observed temperature and salinity for each simulation. For MEDSEA, the correlations for temperature and salinity of 0.77 and 0.01, respectively, are lowest among all the simulations, while the standard deviations are 1.20 and 0.48, respectively. ROMS-hind and ROMS-full have almost the same correlations (∼ 0.94) for temperature, while the standard deviations are 0.93 and 1.01, respectively. For salinity, the correlations are 0.90 and 0.93, and the standard deviations are 0.84 and 0.89, respectively. The AdriSC-ROMS correlation is 0.92 for temperature and 0.89 for salinity, whereas the standard deviations are 0.99 and 0.64, respectively. Based on the Taylor diagram, MEDSEA demonstrates poorer performance overall than ROMS-hind-full and AdriSC-ROMS, which have similar results.

Figure 2Comparison of the results of the four simulations against CTD observations in the form of (a) a Taylor diagram, (b) probability density functions of the biases between the model results and in situ (b) temperature and (d) salinity observations, and (c) a map with the locations of CTD observations (black dots).
For the temperature biases (Fig. 2b), the ROMS-hind distribution has a median of −0.37, associated with a large peak, and a MAD of ± 0.33 ∘C. The ROMS-full distribution has a smaller peak and a median of −0.29 ± 0.3 ∘C. MEDSEA distribution has a median of 0.00 ± 0.84 ∘C, with a heavier tail of positive biases up to 4.5 ∘C. The AdriSC-ROMS distribution has the lowest peak and a median of −0.04 ± 0.61 ∘C. Therefore, the ROMS simulations systematically underestimate the sea temperature, but the assimilation reduces the biases. Median temperature bias is smaller in AdriSC-ROMS and MEDSEA, but they have the largest MADs due to an overestimation of temperatures in MEDSEA (up to 4.5 ∘C) and both an over- and underestimation of the temperatures between −2 and +2 ∘C in AdriSC-ROMS.
For the salinity biases (Fig. 2d), the ROMS-hind distribution has the lowest peak and a median of −0.16 ± 0.12. The ROMS-full distribution has a larger peak and a median of −0.09 ± 0.09. The MEDSEA distribution has a median of 0.00 ± 0.36, a tail of negative biases down to −2.0, and a heavy tail of positive biases with a secondary peak at approximately 1.0. The AdriSC-ROMS distribution has a slightly larger peak than MEDSEA and a median of 0.02 ± 0.16, with very low probabilities for negative biases below −0.2 but a heavy tail up to around 1.0 and a secondary peak around 0.4. Hence, the ROMS-full and hind simulations both underestimate the observed salinities, but the assimilation reduces the biases. The AdriSC-ROMS model tends to overestimate the salinity, while the MEDSEA results display the largest over- and underestimations of salinities.
Lastly, the comparison of the performance of models with different resolutions may be affected by the double-penalty effect (Crocker et al., 2020), meaning that, in pointwise comparison with observations, the finer-resolution models tend to be penalized more than the models with coarser resolution, and therefore, they can verify worse. When a model has sufficient resolution to reproduce a small-scale feature but simulates it incorrectly, it is penalized twice: once for not simulating the feature where it should have been and once for simulating it where it has not been observed. Contrarily, if a model resolution is not sufficient to reproduce a feature, it will be penalized only once for not reproducing the feature. This might partly explain why the AdriSC-ROMS model presents a larger bias variability in both temperature and salinity than the ROMS-hind and ROMS-full models.
3.2 Analysis of the extremes
To analyse how the different models capture the extremes during the 2014–2015 period, the spatial distributions of daily maximum wind stresses, daily maximum upward turbulent heat fluxes, and their associated timing are presented in Figs. 3 and 4, while the spatial distributions of daily maximum bottom PDAs and their associated timing are presented in Fig. 5. Additionally, the spatial distributions of minimum temperatures and maximum salinities are provided and described in the Supplement (Figs. S1 and S2).
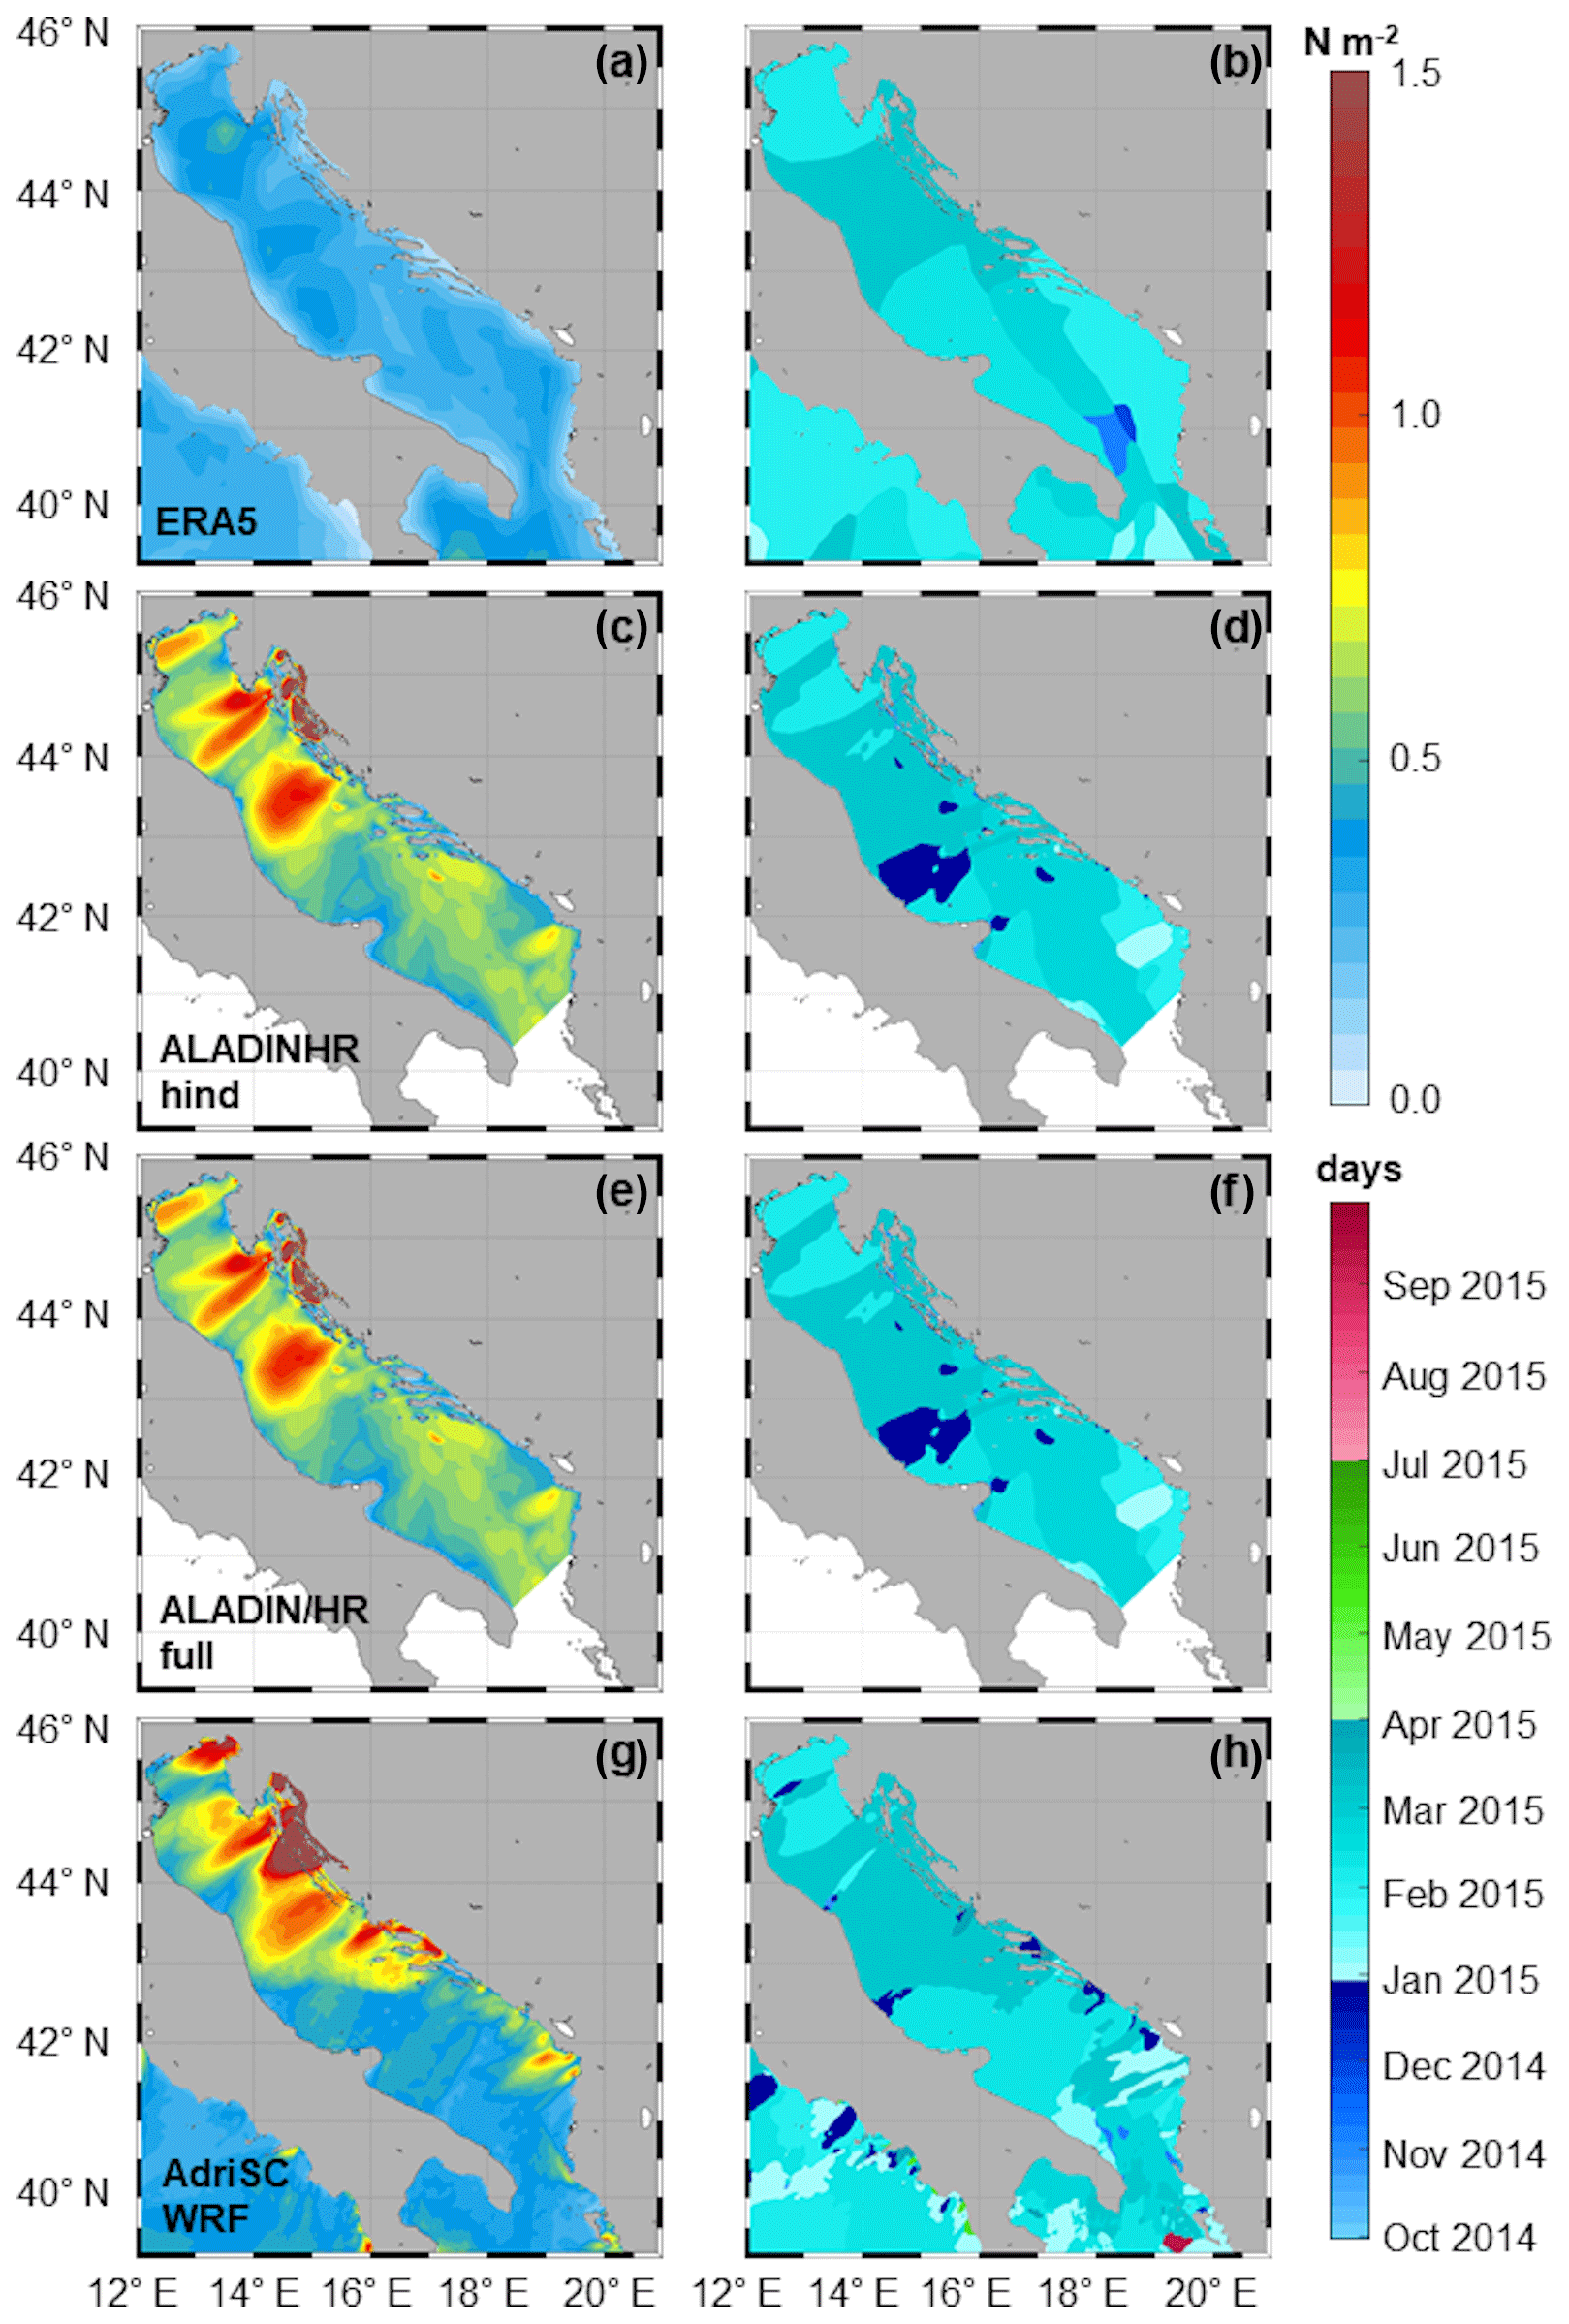
Figure 3Spatial distribution of maximum surface wind stresses and their corresponding timing for (a, b) ERA5, (c, d) ALADIN-HR-hind, (e, f) ALADIN-HR-full, and (g, h) AdriSC-WRF.
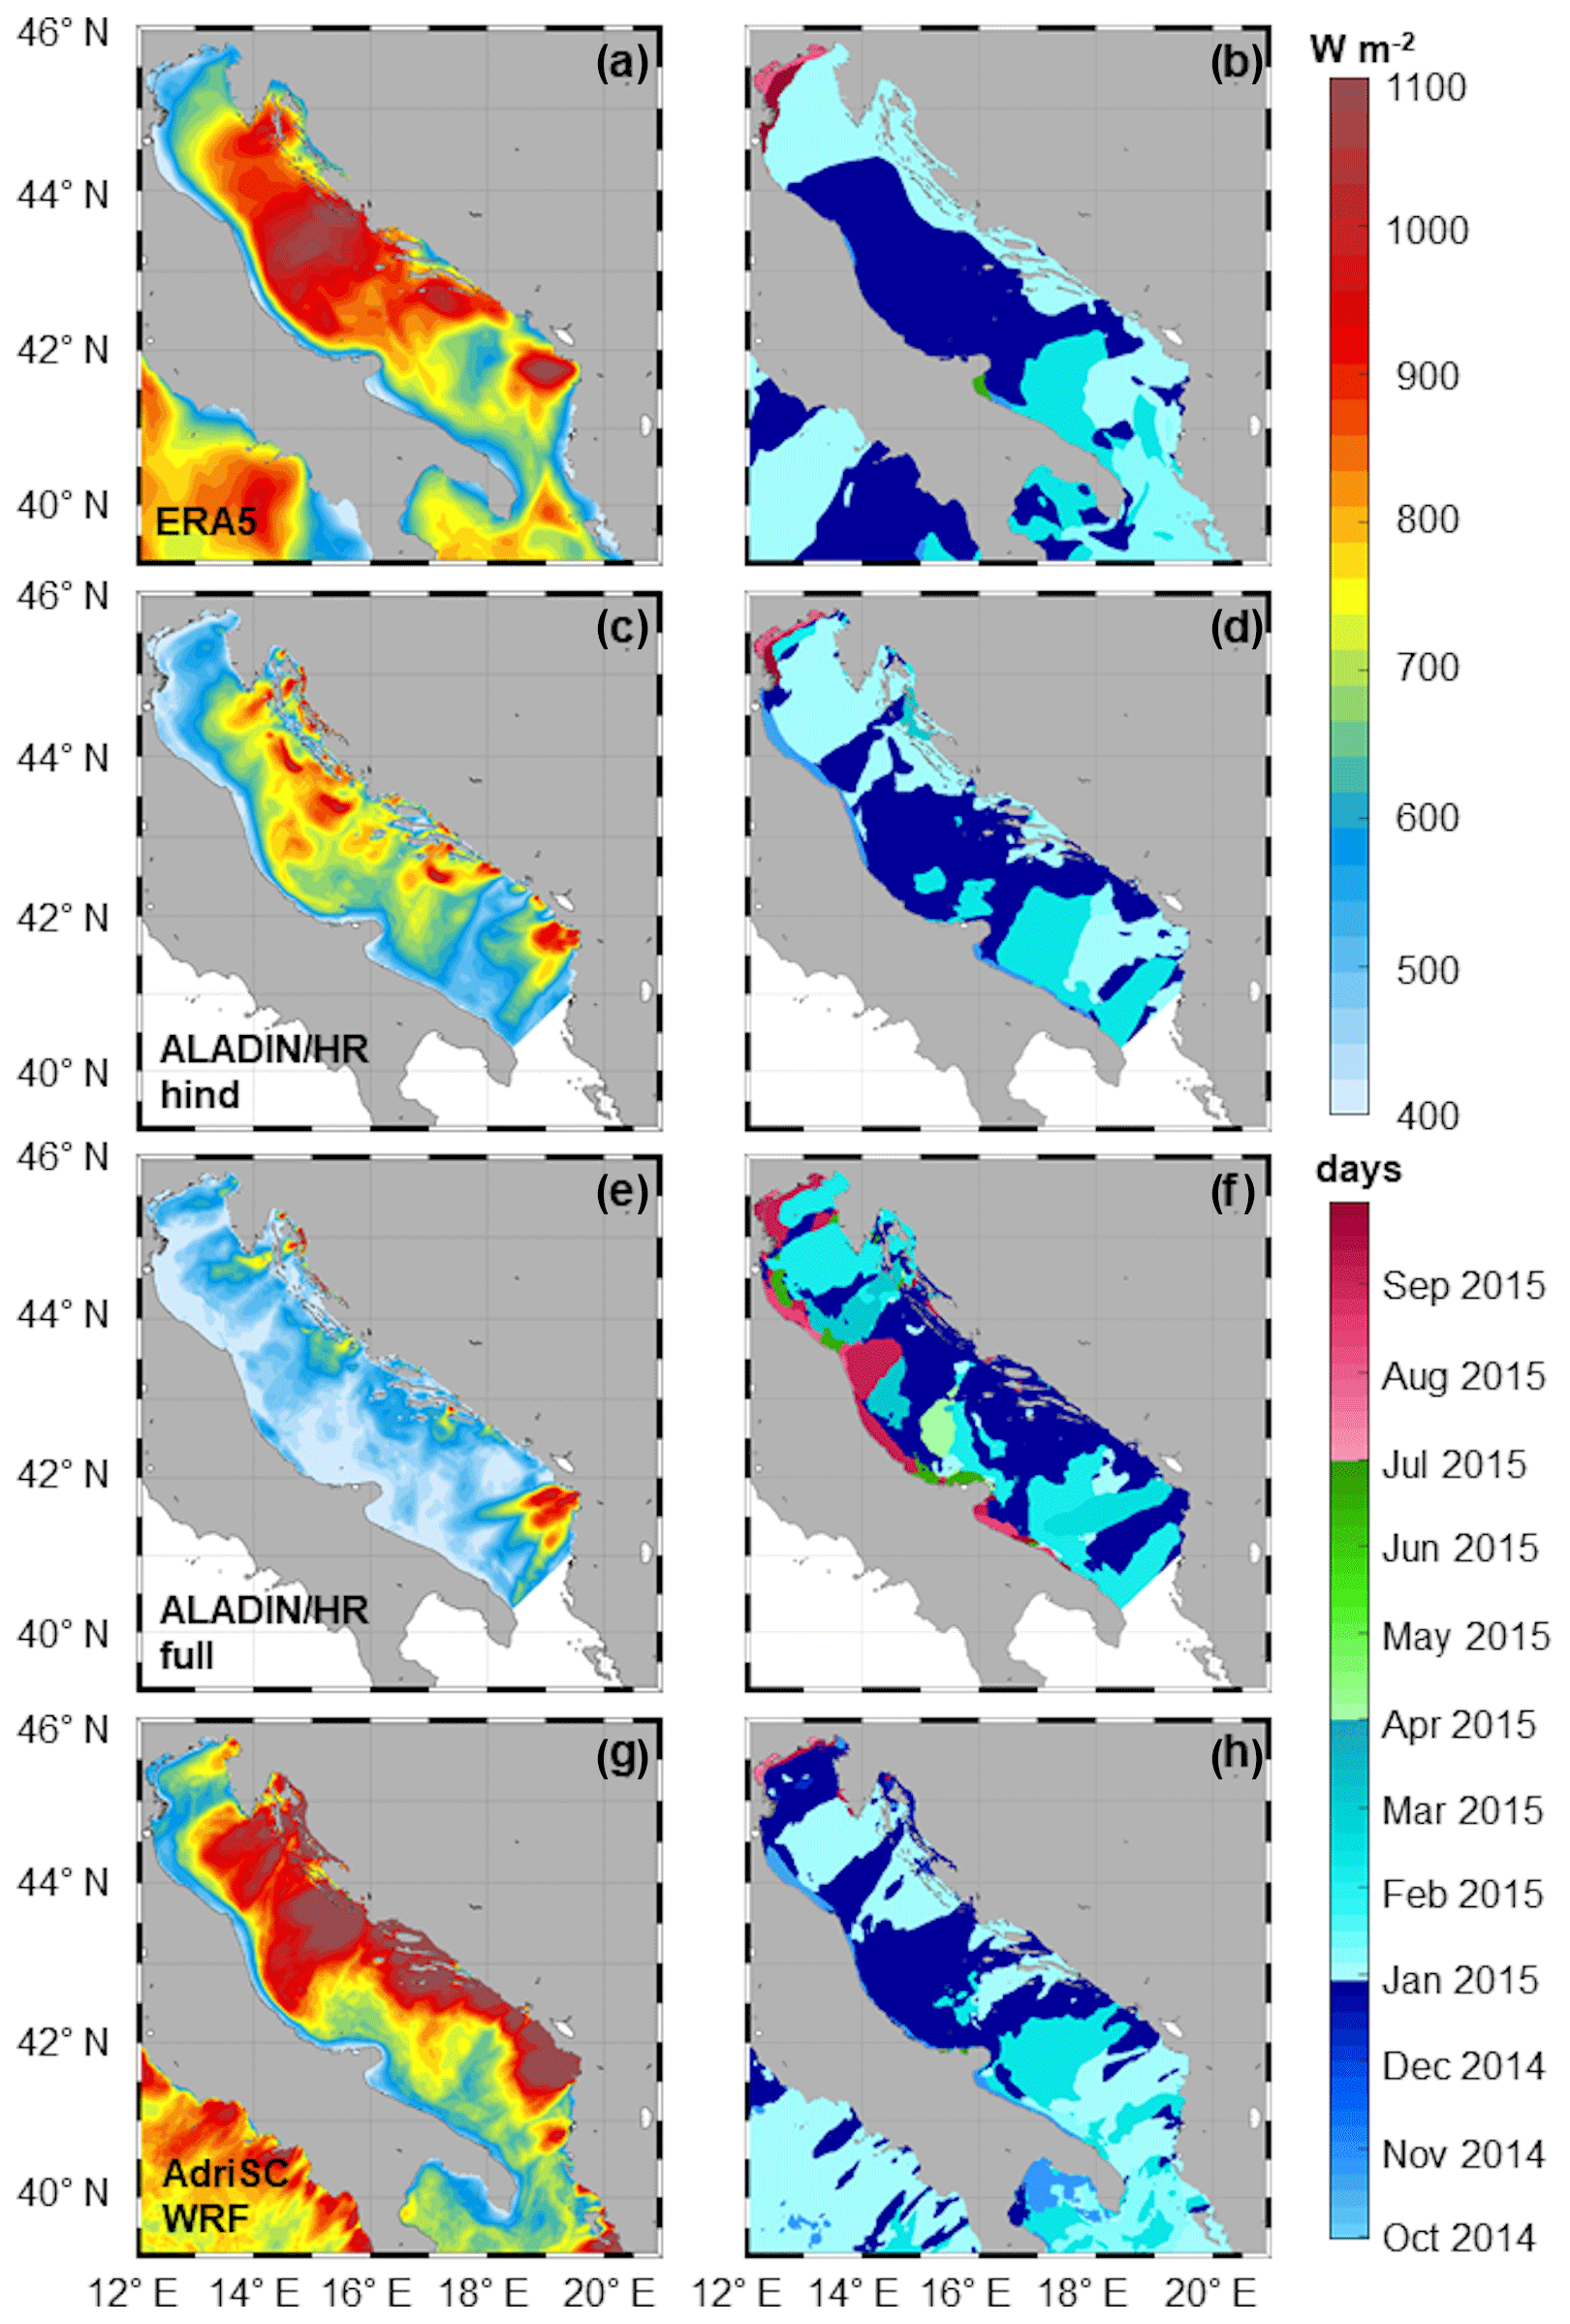
Figure 4Spatial distribution of maximum upward turbulent heat fluxes and their corresponding timing for (a, b) ERA5, (c, d) ALADIN-HR-hind, (e, f) ALADIN-HR-full, and (g, h) AdriSC-WRF.
3.2.1 Wind stresses and upward turbulent heat fluxes
It should be noted that ERA5, which forces the MEDSEA reanalysis, produces very small wind stresses over the whole basin (Fig. 3a), barely reaching 0.4 N m−2 in the northern Adriatic, while ALADIN-HR-hind and ALADIN-HR-full wind stress results (Fig. 3c, e) are extremely similar despite the variational scheme of the assimilation changing the wind stresses (i.e. the differences between the ALADIN-HR-hind and full wind stresses are at least an order of magnitude smaller than their differences in relation to the other atmospheric models). Further, AdriSC-WRF, which is the only kilometre-scale atmospheric model used in this comparison, generates the largest extremes overall for both wind stresses (> 1.5 N m−2; Fig. 3g) and upward turbulent heat fluxes (> 1100 W m−2; Fig. 4g). However, for the upward turbulent fluxes, ERA5 produces maximum heat losses comparable to AdriSC-WRF (Fig. 4a, g), while ALADIN-HR-full maximum heat losses are at least 2 times smaller than in ALADIN-HR-hind (Fig. 4c, e). In fact, ALADIN-HR-full has the smallest maximum heat losses of all simulations and shows a patchy spatial distribution, with the smallest values over the middle of the northern Adriatic, barely reaching 750 W m−2 in February–March. Consequently, both MEDSEA and ALADIN-HR-full are strongly influenced by the assimilation (e.g. sea surface temperature coming from remote sensing products or variational changes of the heat flux forcing, respectively). Another important point is that the turbulent heat fluxes are strongly influenced by the sea surface temperature and the relative humidity, which are in turn influenced by the solar radiation. The maximum heat losses are thus more likely to be found in December 2014–January 2015 – due to a difference in air–sea temperatures of about 3–4 ∘C having a larger contribution to the upward turbulent heat flux calculation than the intensity of the wind stresses (Fairall et al., 1996) – than in early February–March 2015, when the temperature differences are smaller.
In the northern Adriatic, the Trieste jet is seen by both ALADIN-HR models and the AdriSC-WRF, with wind stress maxima reaching 0.8 and 1.3 N m−2, respectively. It is also important to highlight that the Trieste jet produced by both ALADIN-HR models is further extended offshore than in the AdriSC-WRF simulation. For the upward turbulent fluxes, ERA5 and both ALADIN-HR simulations produce a small intensity along the Trieste jet (less than 600 W m−2) between January and March 2015, while AdriSC-WRF reaches 850 W m−2 in December 2014.
The largest values of maximum wind stresses are found in the Kvarner Bay and along the Senj jet for all simulations including ERA5. They reach up to 1.3 N m−2 for both ALADIN-HR and more than 1.5 N m−2 for AdriSC-WRF over a far wider area than the other models. In this region, for the upward turbulent heat fluxes, the maximum values are reached by ERA5 (i.e. 900 W m−2 despite not reproducing the bora jets) and AdriSC-WRF (larger than 1100 W m−2), while ALADIN-HR-hind and ALADIN-HR-full reach 850 W m−2 and barely 750 W m−2, respectively.
In the middle Adriatic, strong wind stresses up to 1.2 N m−2 for both the ALADIN-HR models and the AdriSC-WRF model are produced along the Karlobag and Sukošan jets. However, AdriSC-WRF extends the Karlobag jet to the middle of the Adriatic, with values (up to 1.5 N m−2) several times larger than those achieved with the ALADIN-HR simulations. It also produces some strong wind stresses up to 1.3 N m−2 along the Dalmatian coast, where other bora jets are known to be located. In terms of upward turbulent fluxes, the maximum values are, on average, 900 W m−2 for ERA5, 800 W m−2 for ALADIN/HR-hind, larger than 400 W m−2 for ALADIN/HR-full, and larger than 1100 W m−2 along the eastern Adriatic coast for AdriSC-WRF.
In the southern Adriatic, maximum wind stresses in ALADIN-HR-hind and ALADIN-HR-full reach up to 0.7 N m−2 but are smaller along the coastline. In the AdriSC-WRF simulation, the wind stresses remain relatively small in the southern Adriatic (less than 0.5 N m−2) aside from a small patch of larger values off the southern Montenegrin coast. For the upward turbulent fluxes, the results obtained with ERA5 and AdriSC-WRF are quite similar, with strong intensities along the eastern coast (on average, 900 and 100 W m−2, respectively) and values less than 700 W m−2 offshore.
Overall, for all models, maxima of wind stresses are associated with bora events, while upward turbulent heat fluxes seem to be influenced by the seasonal variations of the sea surface temperature (SST) more than by the wind stresses. In other words, the largest input to the upward turbulent heat fluxes comes from the bora wind, yet a small fraction – which is found to influence maxima of the heat fluxes – comes from SST. That is the reason why maxima of heat fluxes occur mostly during bora episodes in late December–early February (Fig. 4), whereas the maxima of wind stresses occur mostly during bora episodes in early February–early March (Fig. 3). Additionally, the AdriSC-WRF model generates the strongest dynamics with, on average, the strongest wind stresses and the maximum heat cooling, while ERA5 has the weakest wind stresses, and ALADIN/HR-full has the smallest heat loss.
3.2.2 Potential density anomalies
In the northern Adriatic, all simulations produce the highest maximum PDA values during late winter (February–March 2015; Fig. 5b, d, f, h). They reach up to 29.4 kg m−3 on the shelf for MEDSEA; up to 29.6 kg m−3 along the coast but below 29.3 kg m−3 on the shelf for ROMS-hind; up to 29.8 kg m−3 along the coast and, on average, 29.5 kg m−3 on the shelf for ROMS-full; and finally, above 29.8 kg m−3 along the coast and, on average, 29.7 kg m−3 for AdriSC-ROMS (Fig. 5a, c, e, g).
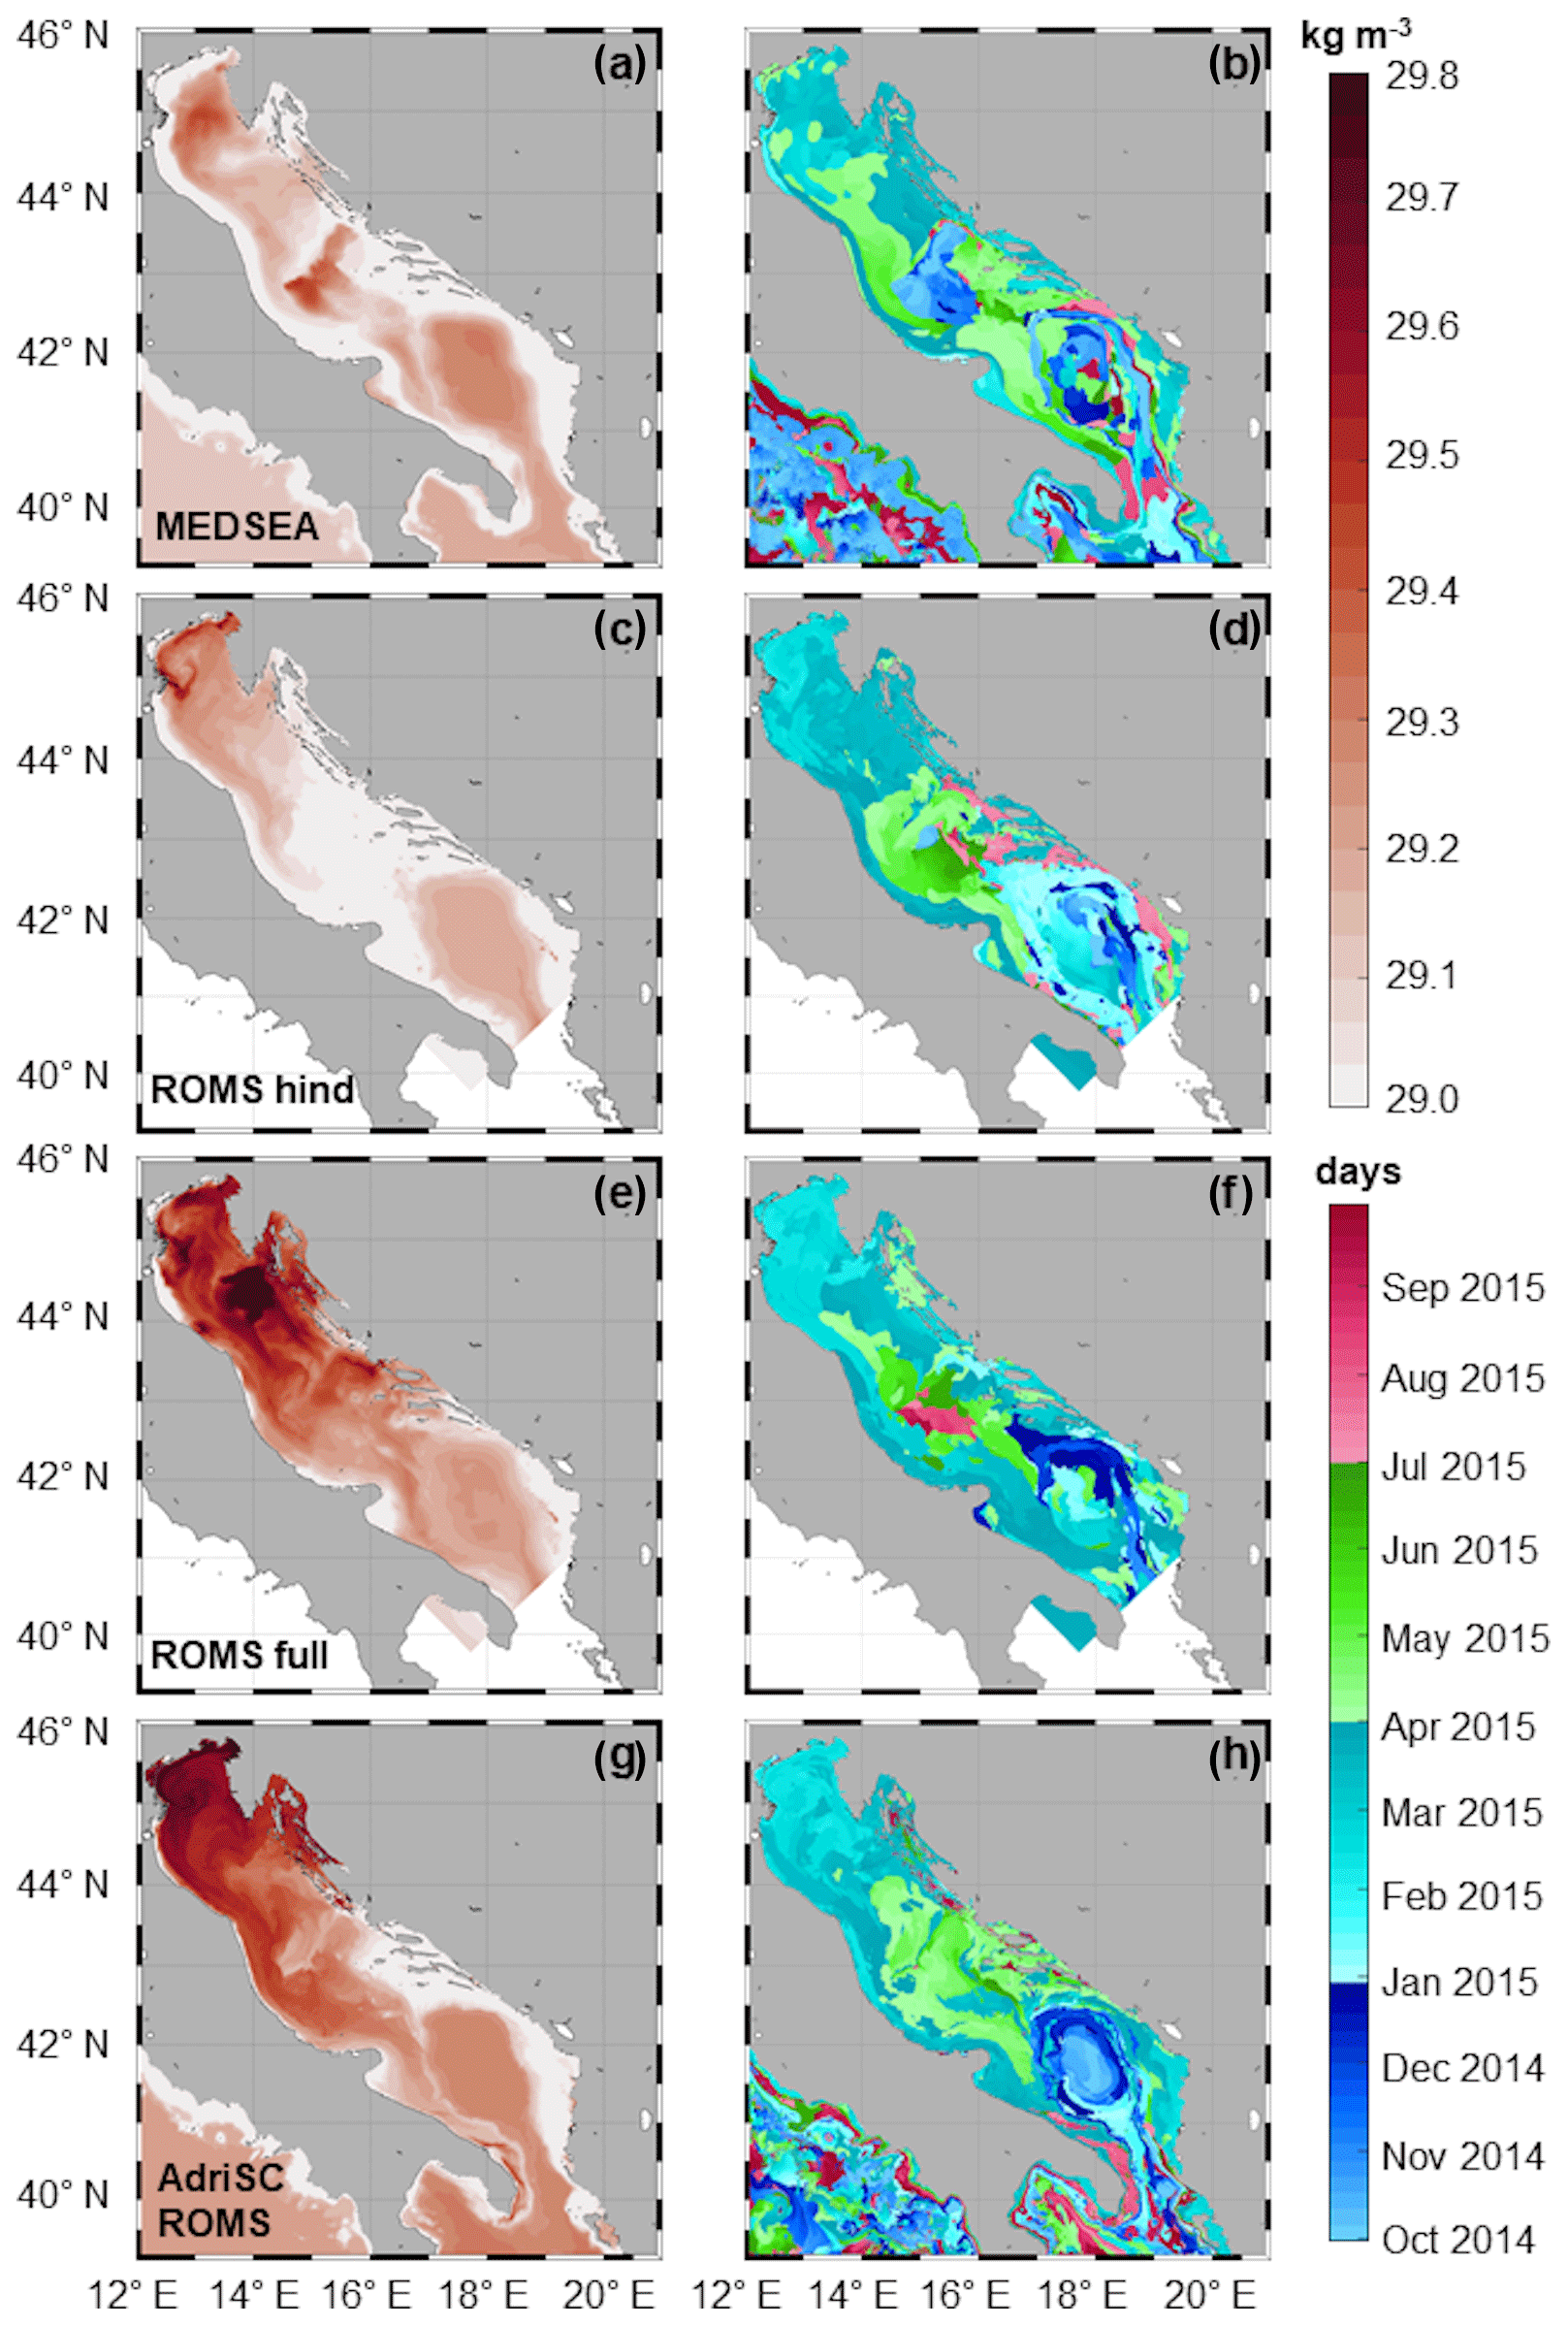
Figure 5Spatial distribution of maximum bottom PDAs and their corresponding timing for (a, b) MEDSEA, (c, d) ROMS-hind, (e, f) ROMS-full, and (g, h) AdriSC-ROMS.
In the Kvarner Bay, both MEDSEA and ROMS-hind have extremely low maximum PDAs (below 29.0 kg m−3), indicating no dense-water formation in this area. In contrast, both ROMS-full and AdriSC-ROMS give high maximum PDAs (up to 29.6 and 29.7 kg m−3, respectively). However, ROMS-full presents patch-like PDA distributions, with maxima occurring partly during winter and partly during spring, while AdriSC-ROMS has more homogeneous values over the whole Kvarner Bay, with maxima occurring mostly in the winter but also in September in a few very small areas. Further, off the Kvarner Bay, ROMS-full produces a large patch of extremely dense waters (> 29.8 kg m−3) which does not seem to be smooth and continuous with the previous data assimilation cycle spatial PDA distributions over the rest of the Adriatic domain. In this case, data assimilation corrects for the initial state of the ocean model at the start of the assimilation cycle as the most cost-effective mechanism for correcting suboptimal atmospheric (hydrostatic and coarser) forcing and ocean model vertical- and horizontal-resolution constraints. This patch occurred in February and is located just southwest from the glider data assimilated in the model, which is the strongest contributor to the data assimilation cost function at this point (Janeković et al., 2020).
In the middle Adriatic, ROMS-hind shows relatively low maximum PDAs (below 29.1 kg m−3), but the other models present some interesting spatial variations. In the Jabuka Pit, which is a known dense-water reservoir, maximum PDAs reach up to 29.5 kg m−3 in MEDSEA during autumn 2014 (i.e. the highest PDA values over the entire basin), up to 29.6 kg m−3 in ROMS-full during spring and summer, and only up to 29.4 kg m−3 in AdriSC-ROMS during spring. Additionally, in ROMS-full and AdriSC-ROMS simulations, the PDA maxima are highest in the western part of the middle Adriatic in late winter and spring, resembling the dense-water outflow that normally peaks up to 2 months after its generation in the northern Adriatic. However, in ROMS-full, some high values of maximum PDAs (about 29.4 kg m−3) are also present along the Dalmatian islands, which is not an area known for the formation or the accumulation of dense waters due to the extensive freshwater discharge of the Neretva River.
In the southern Adriatic, within the SAP and mostly during winter, maximum PDAs reach up to 29.4 kg m−3 in MEDSEA, only 29.2 kg m−3 in ROMS-hind, up to 29.3 kg m−3 in ROMS-full, and up to 29.4 kg m−3 in AdriSC-ROMS. Along the western side of the SAP, where dense waters are known to cascade through canyon systems (Rubino et al., 2012), ROMS-full and AdriSC-ROMS produce some transport of dense waters (> 29.3 kg m−3), mostly in late spring for AdriSC-ROMS and in March for ROMS-full. Additionally, MEDSEA, ROMS-hind, and AdriSC-ROMS present relatively low maximum PDAs (< 29.0 kg m−3) in the coastal area east of the SAP, a shelf strongly influenced by the Albanian rivers (Artegiani et al., 1997), while ROMS-full has higher values reaching up to 29.2 kg m−3.
Overall, in the northern Adriatic and the Kvarner Bay, where the dense waters are generated during strong bora events, MEDSEA and ROMS-hind have smaller maximum PDAs (29.4 and 29.6 kg m−3, respectively) than ROMS-full and AdriSC-ROMS (29.7 and 29.8 kg m−3, respectively). However, in AdriSC-ROMS, extreme dense waters are generated homogeneously over the entire northern Adriatic, while they appear as patches in ROMS-full, in which a maximum is found off the southern tip of Istria, along the Senj jet. This can be explained by the 4D-Var data assimilation 4 d cycling which updates the initial state of the ROMS model. Surprisingly, in the Jabuka Pit – a known collector of the dense waters – the PDAs of ROMS-full are higher than in the AdriSC-ROMS simulation, indicating that either AdriSC-ROMS is far too dissipative or that the impact of assimilation is high in ROMS-full. Finally, in the SAP, maximum bottom PDAs are produced in all simulations, generally during late autumn and early winter (December 2014–January 2015), indicating that northern Adriatic dense waters did not reach the bottom of the SAP by the end of any simulation.
3.3 Dense-water dynamics
3.3.1 Subdomain-averaged time series
To better understand how the different models capture the dense-water dynamics within the Adriatic basin, the daily results are presented as time series spatially averaged over the known sites of generation and collection of dense waters (Figs. 6–8 and Figs. S3 and S4 in the Supplement).
In the northern Adriatic, all models present three prominent peaks of wind stresses (Fig. 6a), capturing the three severe bora events that occur during the NAdEx campaign over the following dates: 28 December 2014–1 January 2015, 3–7 February, and 3–6 March 2015. These dominant wind stress events are also associated with peaks of upward turbulent heat fluxes in all models (Fig. 6c). However, the intensities of the ERA5 wind stress peaks (0.15, 0.3, and 0.2 N m−2) are half those in ALADIN-HR-full, ALADIN-HR-hind, and AdriSC-WRF, which are all similar (peaks at 0.3, 0.6, and 0.5 N m−2). Further, the intensity of the upward turbulent heat flux peaks is often smaller and more spread or shifted over time in ALADIN-HR-full (peaks at 300, 450, and 300 W m−2) than in the other models due to the variational scheme used in the assimilation. It should be noted that the strongest peaks in upward turbulent heat fluxes are always reached by ERA5 and/or AdriSC-WRF (peaks at 600, 400, and 350 W m−2), while ALADIN-HR-hind produced slightly smaller intensities in general (peaks at 500, 350, and 300 W m−2). Concerning the associated bottom PDA time variations (Fig. 7a), it should be first noted that the AdriSC-ROMS PDAs are systematically higher than in the other models by 0.2–0.8 kg m−3 due to higher salinity (differences of about 0.3–0.6; Fig. S4a). Second, for all simulations, the maximum values are obtained between February and March 2015, when the dense-water generation is found to occur (Vilibić et al., 2018). Further, in February 2015, a large increase of bottom PDAs – probably driven by the assimilation of the Arvor-C, towed CTD, and glider data, which influenced two 4 d cycles – is seen in ROMS-full, which reaches values nearly as high as those in AdriSC-ROMS. The PDAs without seasonality show that the peaks of density due to the bora-driven dense-water formation are reproduced in all models (Fig. 8a). The highest increases in density during these peaks are always reached by ROMS-full (0.4, 0.35, and 0.3 kg m−3), and the lowest are reached by MEDSEA (below 0.1 kg m−3 for the three peaks). However, the MEDSEA and AdriSC-ROMS densities already increased before the first bora event by 0.2 kg m−3, which means that, in fact, the highest peak is reached by AdriSC-ROMS after the first bora event and that MEDSEA densities are close to AdriSC-ROMS values. The PDAs without seasonality also clearly show, for all models, a decrease in density during spring and summer when the denser waters are transported from the northern Adriatic towards the south.
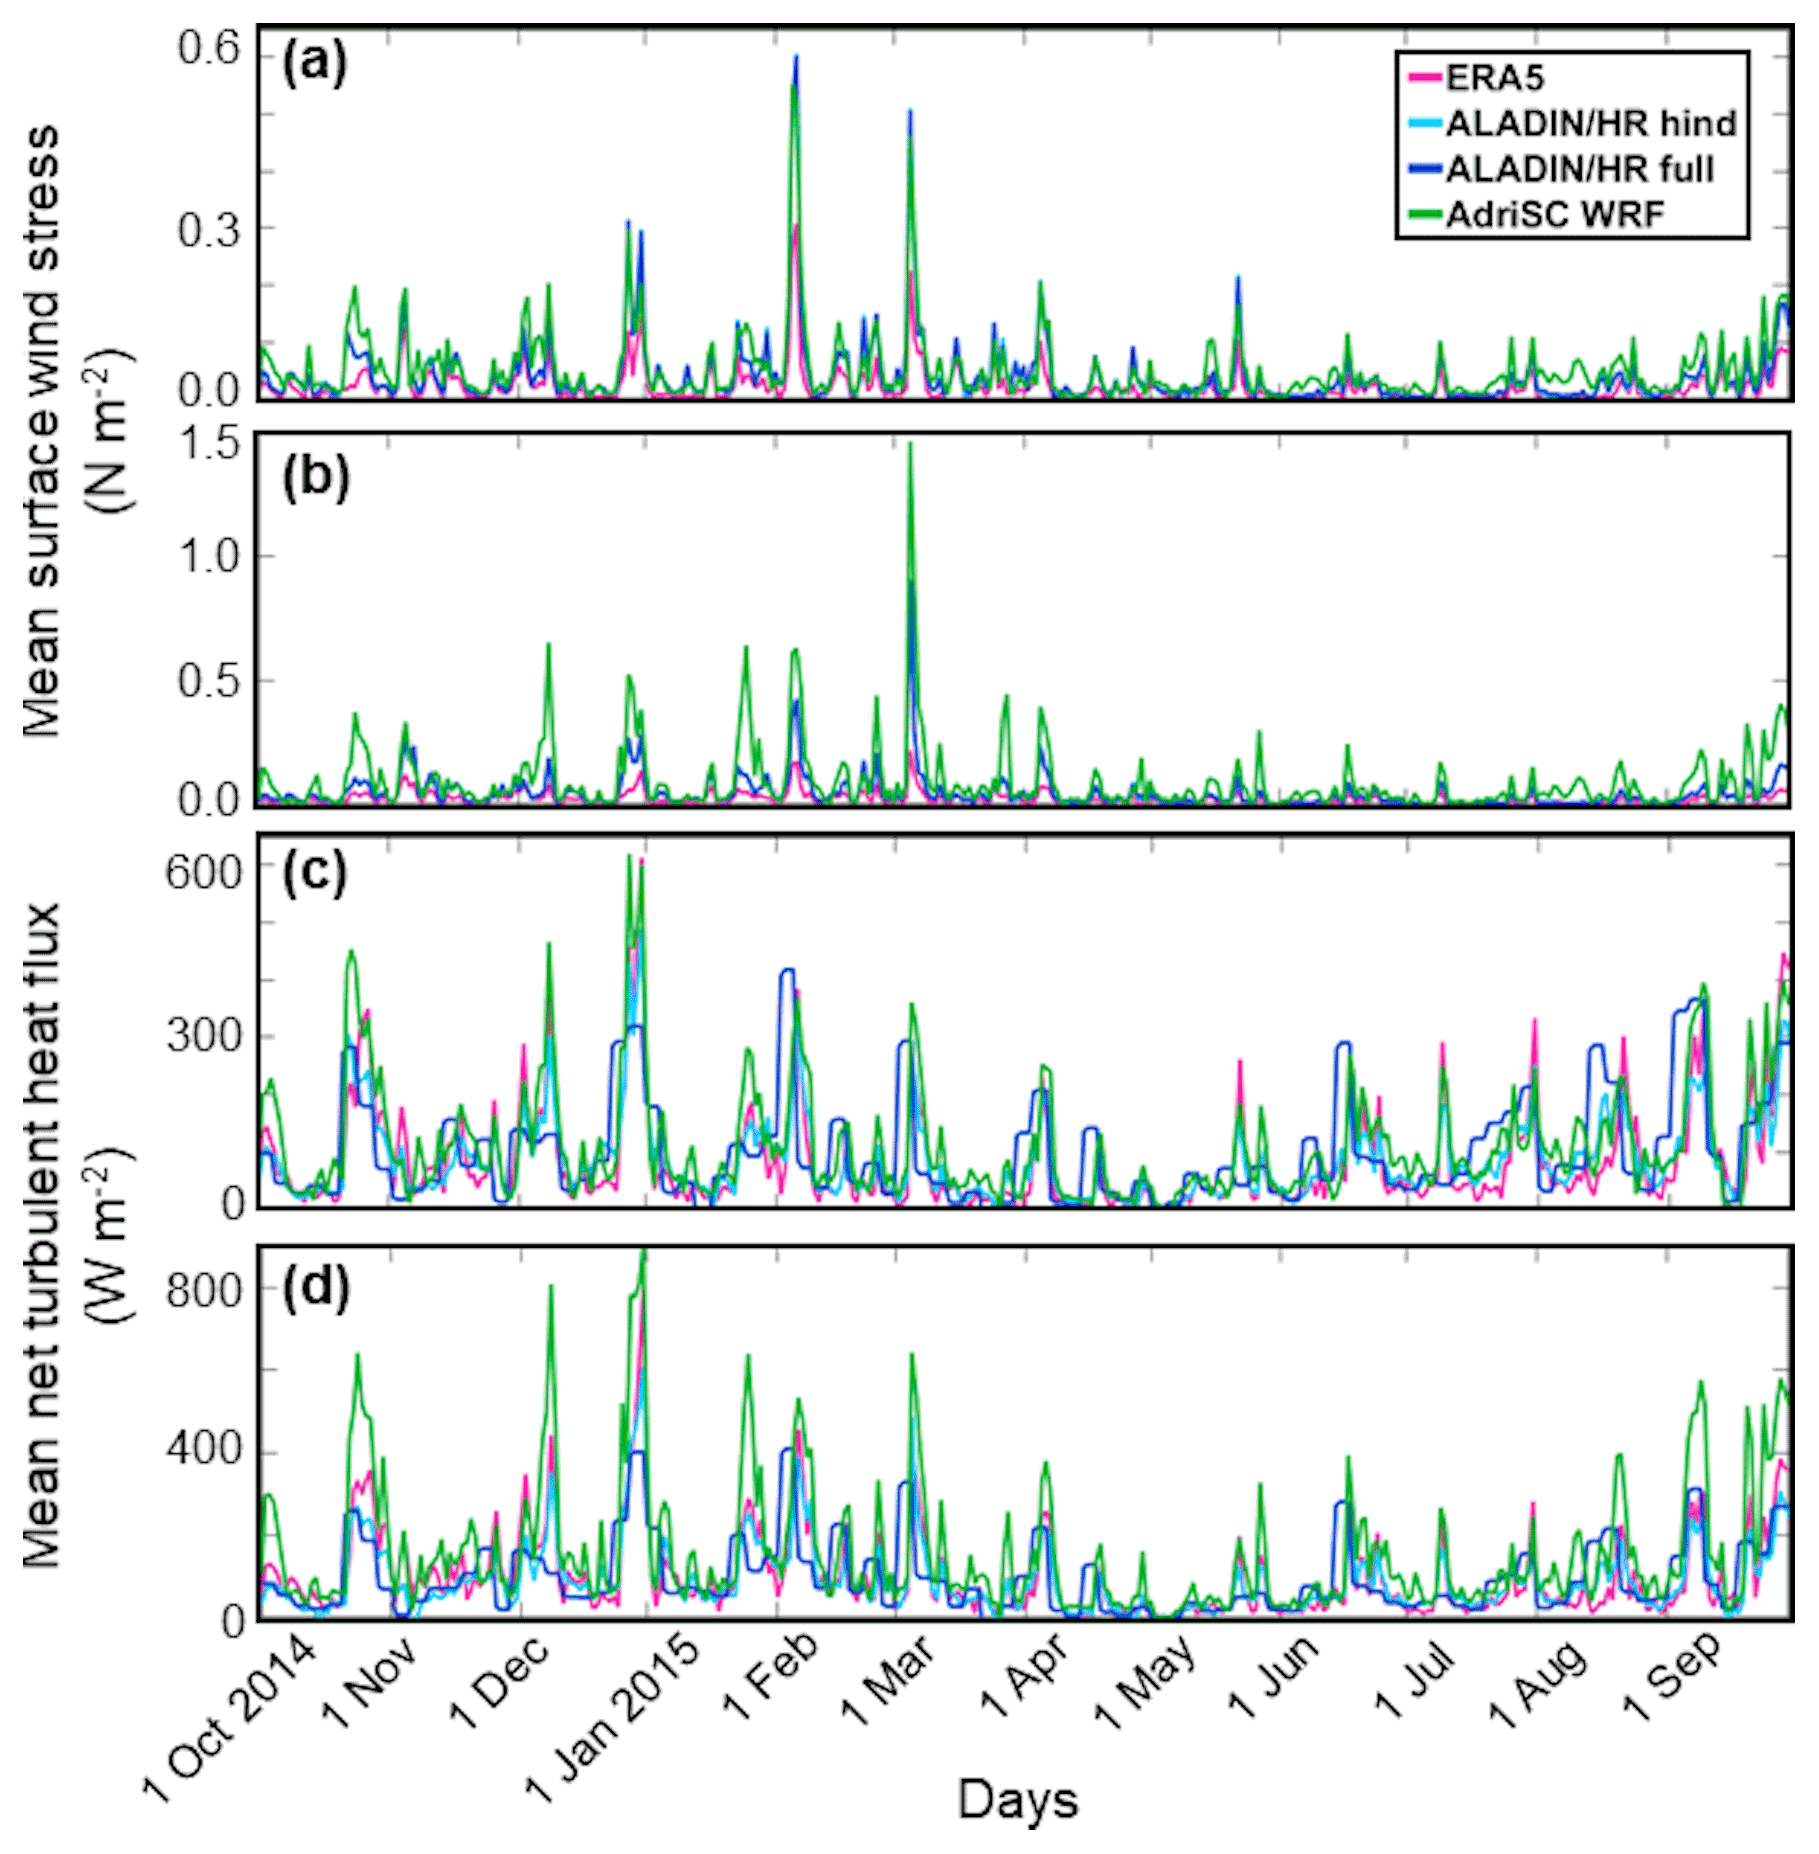
Figure 6Time series of daily wind stresses and upward turbulent heat fluxes averaged over two subdomains, namely (a, c) the northern Adriatic and (b, d) Kvarner Bay, for the 2014–2015 period and for the four simulations.
In the Kvarner Bay, the three bora peaks of wind stresses (Fig. 6c) and the associated upward turbulent heat fluxes (Fig. 6d) are also seen by all models. However, ERA5-computed wind stresses are always extremely low (below 0.2 N m−2), while AdriSC-WRF produces stronger wind stresses (peaks at 0.5, 0.6, and 1.5 N m−2) than ALADIN-HR-full and ALADIN-HR-hind (peaks at 0.25, 0.4, and 0.9 N m−2). The intensity of the upward turbulent heat flux peaks is again always less and more spread or shifted over time in ALADIN-HR-full (peaks at 400, 400, and 300 W m−2) than in the other models (peaks as large as 800, 500, and 600 N m−2). Also, AdriSC-WRF models produce eight wind stress peaks above 0.25 N m−2 between December 2014 and April 2015, while ALADIN-HR-hind and ALADIN-HR-full only surpass this threshold for the three main bora events. That is, the non-hydrostatic kilometre-scale AdriSC-WRF model (at 3 km resolution) is capable of reproducing much higher wind stresses than the hydrostatic ALADIN-HR model (at 8 km resolution dynamically downscaled to 2 km for the winds only) due to the impact of the highly non-linear orographic processes on the dynamics of the bora-driven flows (e.g. Grubišić, 2004; Kuzmić et al., 2015). Next, the upward turbulent heat fluxes are less intense in ERA5 and ALADIN-HR-hind than in AdriSC-WRF, indicating that the cooling rates are smaller, which thus should lead to less generation of dense waters. In terms of bottom PDA analysis (Fig. 7b), similarly to the northern Adriatic subdomain, the AdriSC-ROMS model produces the highest values, while MEDSEA and ROMS-hind generally have the lowest values, with differences up to 0.6 kg m−3 in February–March 2015. This difference is again mostly driven by salinity, which is the lowest in MEDSEA and again the highest in AdriSC-ROMS (Fig. S4). However, salinity is much higher in ROMS-full than in ROMS-hind starting in December 2014, when near-bottom salinity measurements were available continuously in the Kvarner Bay through the NAdEx campaign. Convincingly, these measurements moved the ROMS-full run from ROMS-hind towards the higher measured salinities and closer to the AdriSC-ROMS results. As for the northern Adriatic subdomain, the PDAs without seasonality show three main peaks linked to bora-driven dense-water formation in all the models (Fig. 8b). However, the timing of the ROMS-full peaks, as well as their intensity, is generally different compared to the other models (which all behave quite similarly), particularly after the second and third bora events. This shows the impact of the assimilation of the NAdEx campaign observations within the ROMS-full model.
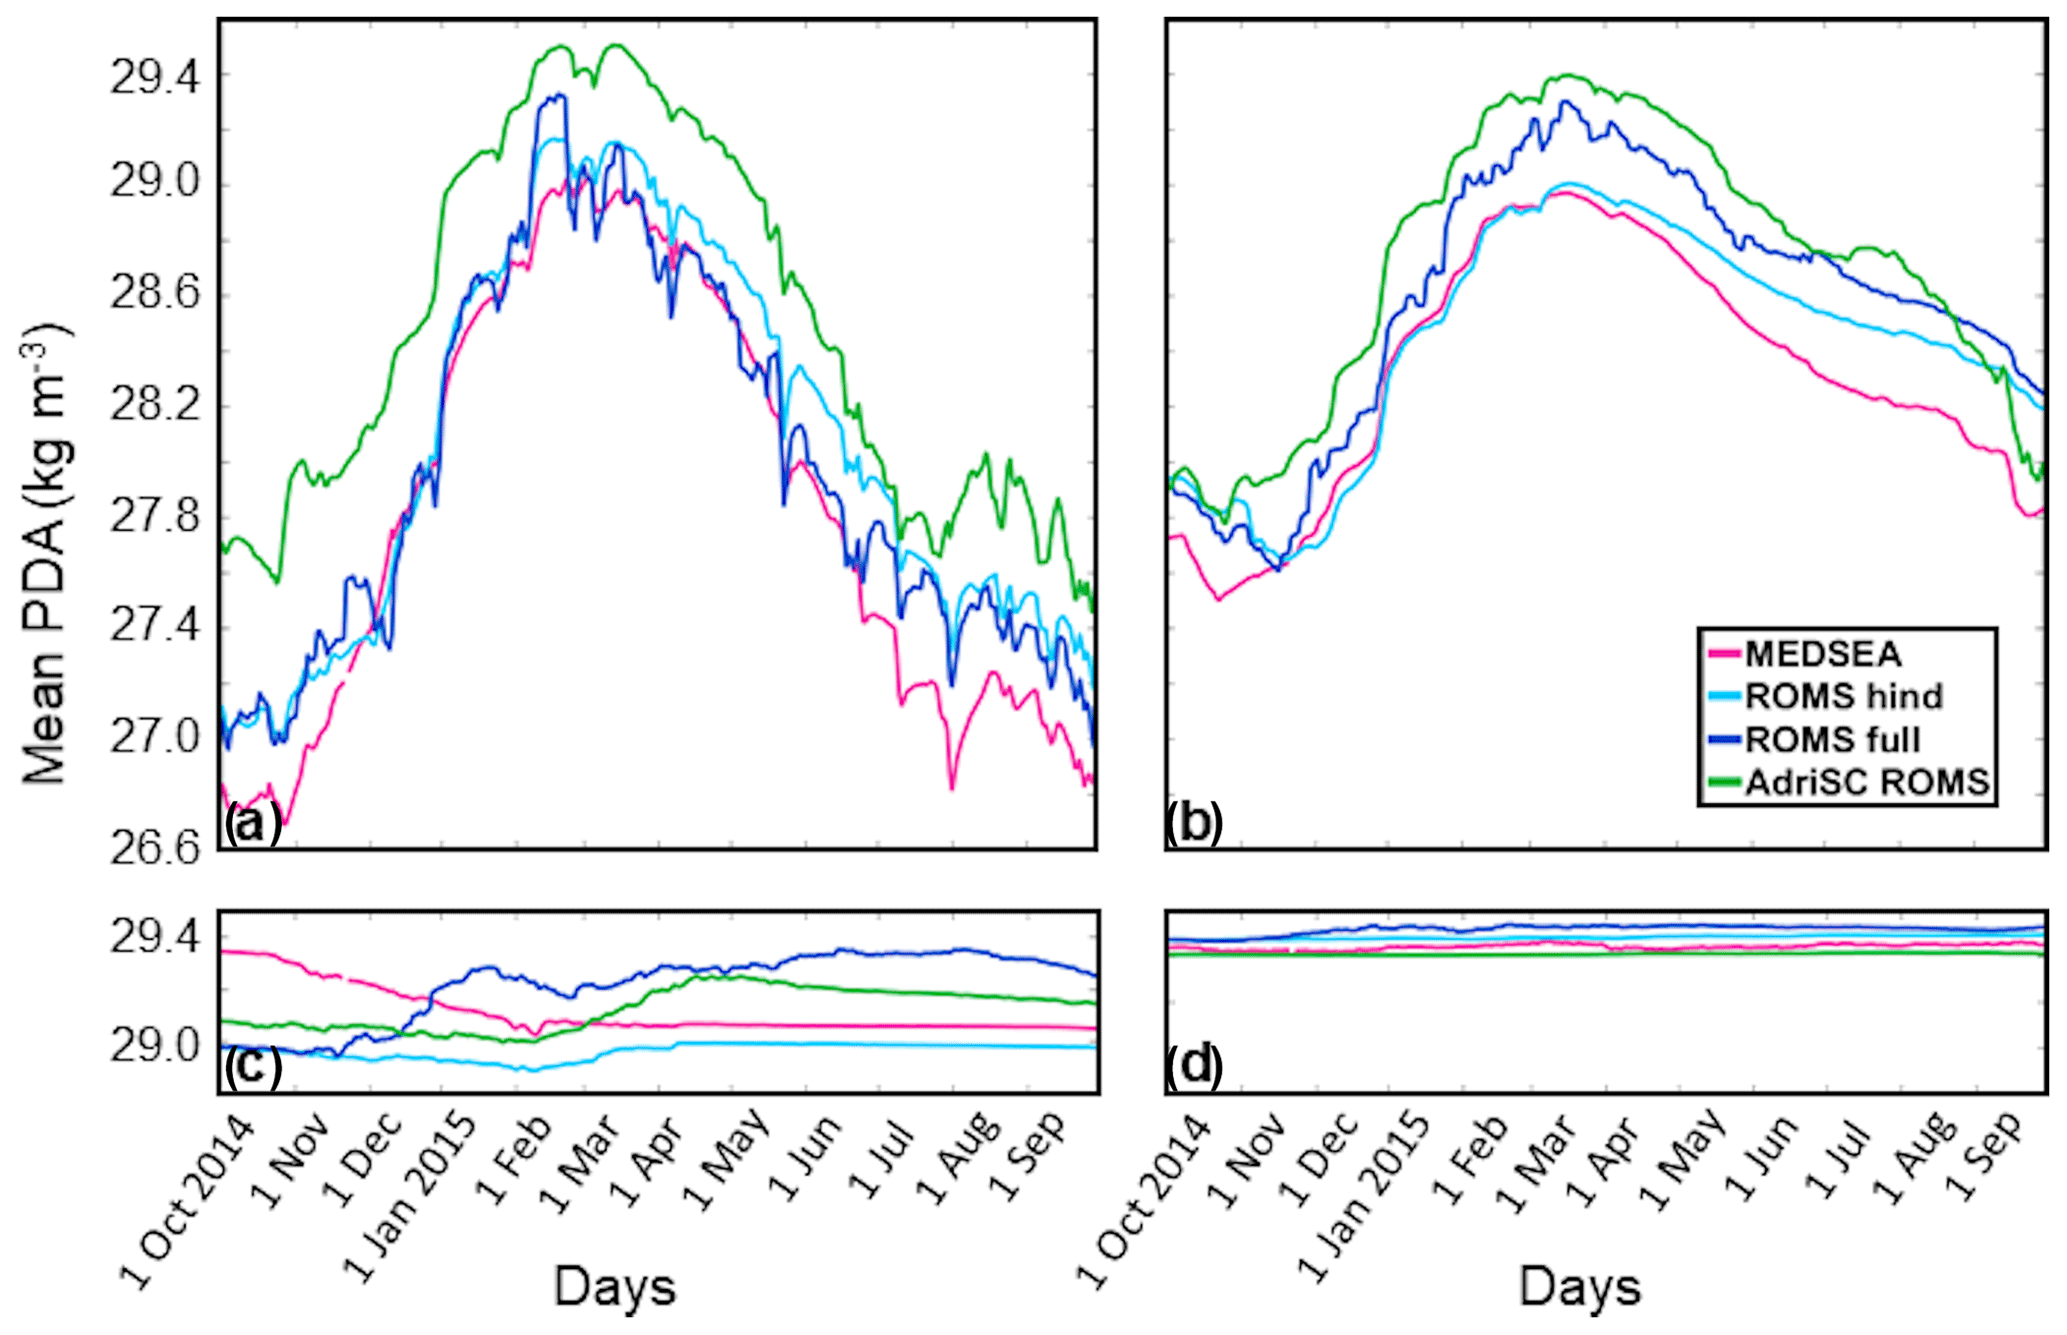
Figure 7Time series of daily bottom PDAs averaged over four subdomains, namely (a) the northern Adriatic, (b) Kvarner Bay, (c) the Jabuka Pit, and (d) the deep Adriatic, for the 2014–2015 period and for the four simulations.
In the Jabuka Pit (Figs. 7c and 8c), bottom PDAs (with and without seasonality) from the two free model runs (AdriSC-ROMS and ROMS-hind) increase from February 2015, when newly generated denser waters from the northern Adriatic start to fill the pit, and peak in late April 2015. However, AdriSC-ROMS PDAs are higher than those of ROMS-hind in terms of both mean values (more than 29.1 kg m−3 vs. less than 29.0 kg m−3) and, in particular, increase rates (0.2 kg m−3 in 2 months vs. less than 0.1 kg m−3 in 2 months) during the known arrival time of dense waters in the Jabuka Pit (i.e. between March and June 2015). Interestingly, ROMS-full shows an earlier increase in PDAs during December 2014 and January 2015, up to 29.3 kg m−3, similarly to the values obtained in AdriSC-ROMS in late April. This increase is probably driven by the availability of measurements at that time. Later, after a small decrease between February and March 2015, ROMS-full PDAs start to slowly increase until summer. Differently to other simulations, MEDSEA starts with high PDA values in autumn (higher by about 0.2–0.3 kg m−3 than other simulations), which then decrease by March down to values slightly higher than those of ROMS-hind and stabilize till September 2015. This shows that no dense-water arrival in the Jabuka Pit is seen by MEDSEA during spring 2015.

Figure 8Time series of daily bottom PDAs without seasonality averaged over four subdomains, namely (a) the northern Adriatic, (b) Kvarner Bay, (c) the Jabuka Pit, and (d) the deep Adriatic, for the 2014–2015 period and for the four simulations.
In the deep Adriatic (Fig. 7d), bottom PDA values are similar in all models, with slightly higher values in ROMS-hind and ROMS-full and smaller values in MEDSEA and AdriSC-ROMS. Further, temporal changes in PDAs are higher in ROMS-full and MEDSEA, as they assimilate deep observations (e.g. by Argo profilers up to 700–800 m) which were available during the whole 2014–2015 period (Kokkini et al., 2020), as can be clearly seen in the PDAs without seasonality (Fig. 8d).
Overall, the analysis of the time series spatially averaged over the subdomains where dense waters are either generated (i.e. the northern Adriatic and Kvarner Bay) or collected (the Jabuka Pit and deep Adriatic) confirms the results obtained for the extreme values. First, the AdriSC climate simulation generates the strongest dynamics of all the models during the bora events with the highest intensities in wind stress, upward turbulent heat flux, and bottom PDA (except in the Jabuka Pit and the deep Adriatic). Second, the MEDSEA model, closely followed by the ROMS-hind model, generates the lowest levels of dense waters during the December 2014–March 2015 period. Finally, the assimilation in ROMS-full, despite reducing the intensity of the upward turbulent fluxes, tends to increase the bottom PDA values in all the subdomains but particularly in the Kvarner Bay and the Jabuka Pit.
3.3.2 Time evolution of the bottom PDA spatial distributions
To better visualize the evolution in time and space of the dense waters, the spatial distributions of the daily bottom PDAs are analysed both at specific dates – i.e. 1 March (Fig. 9), 1 April (Fig. 10), 1 May (Fig. 11), and 1 June 2015 (Fig. 12) – and for the entire duration of the 2014–2015 period as a movie (provided in the Video Supplement). Hereafter, the results are presented chronologically, combining both Figs. 9–12 and the movie.
Before the first bora event of 28 December 2014, dense waters are mostly present in the deep Adriatic with bottom PDA values ranging from 29.2 kg m−3 for ROMS-hind and ROMS-full to more than 29.3 kg m−3 for MEDSEA and AdriSC-ROMS. However, in the Jabuka Pit, MEDSEA shows PDA values up to 29.5 kg m−3 in November 2014, which slowly decrease to 29.2 kg m−3 before the first bora event, whereas ROMS-full produces values below 29.25 kg m−3 around 20 December 2014.
During the first bora event, in AdriSC-ROMS (and not in other models), dense waters (above 29.4 kg m−3) are immediately generated along the coast of the northern Adriatic (i.e. along the Trieste jet). Then, these dense waters are transported towards the Po River delta and the northern Adriatic shelf. Denser waters (above 29.45 kg m−3) are generated and transported in AdriSC-ROMS from the Gulf of Trieste at the end of January and also in the Kvarner Bay in both AdriSC-ROMS (with values up to 29.3 kg m−3) and ROMS-full (with values up to 29.45 kg m−3). Further, in ROMS-full, just before the second bora event, patches of extremely dense waters (above 29.4 kg m−3 and up to more than 29.5 kg m−3) grow in the northern Adriatic shelf and offshore from the Kvarner Bay. At the same time, in AdriSC-ROMS, the dense waters start to be transported from the northern Adriatic shelf towards the western Adriatic coast along the Po River plume.
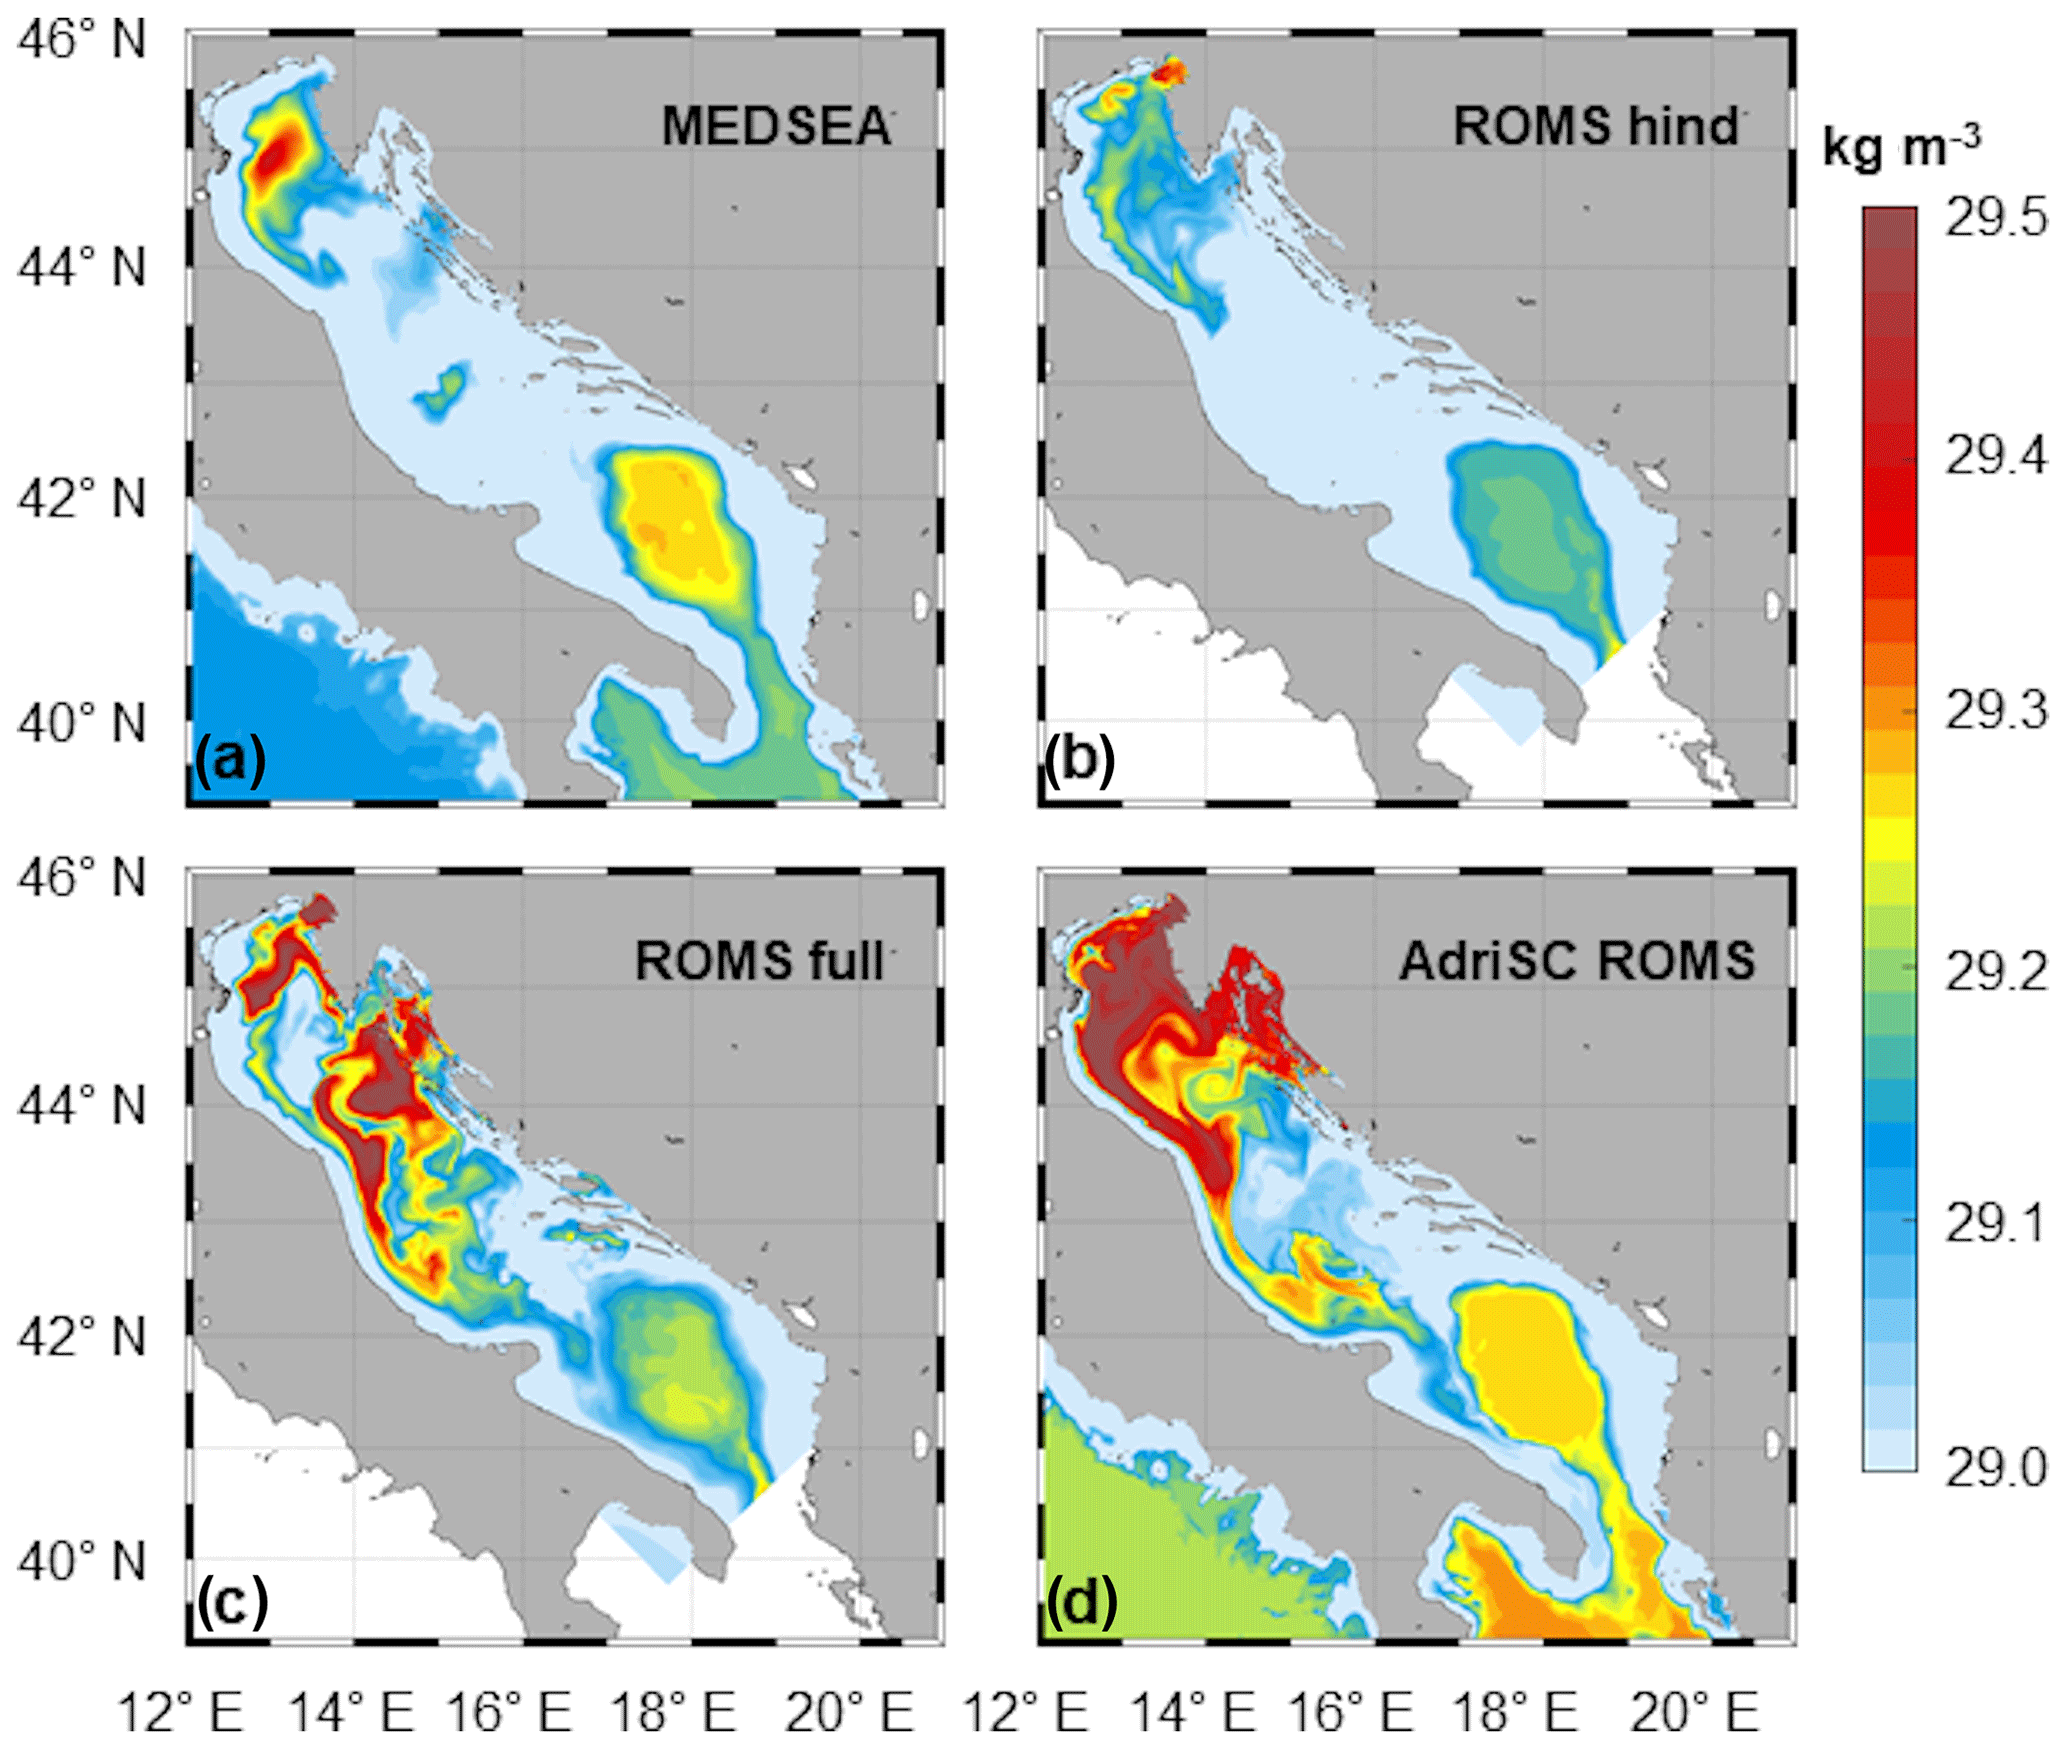
Figure 9Spatial distribution of bottom PDAs on 1 March 2015 for (a) MEDSEA, (b) ROMS-hind, (c) ROMS-full, and (d) AdriSC-ROMS simulations.

Figure 10Spatial distribution of bottom PDAs on 1 April 2015 for (a) MEDSEA, (b) ROMS-hind, (c) ROMS-full, and (d) AdriSC-ROMS simulations.
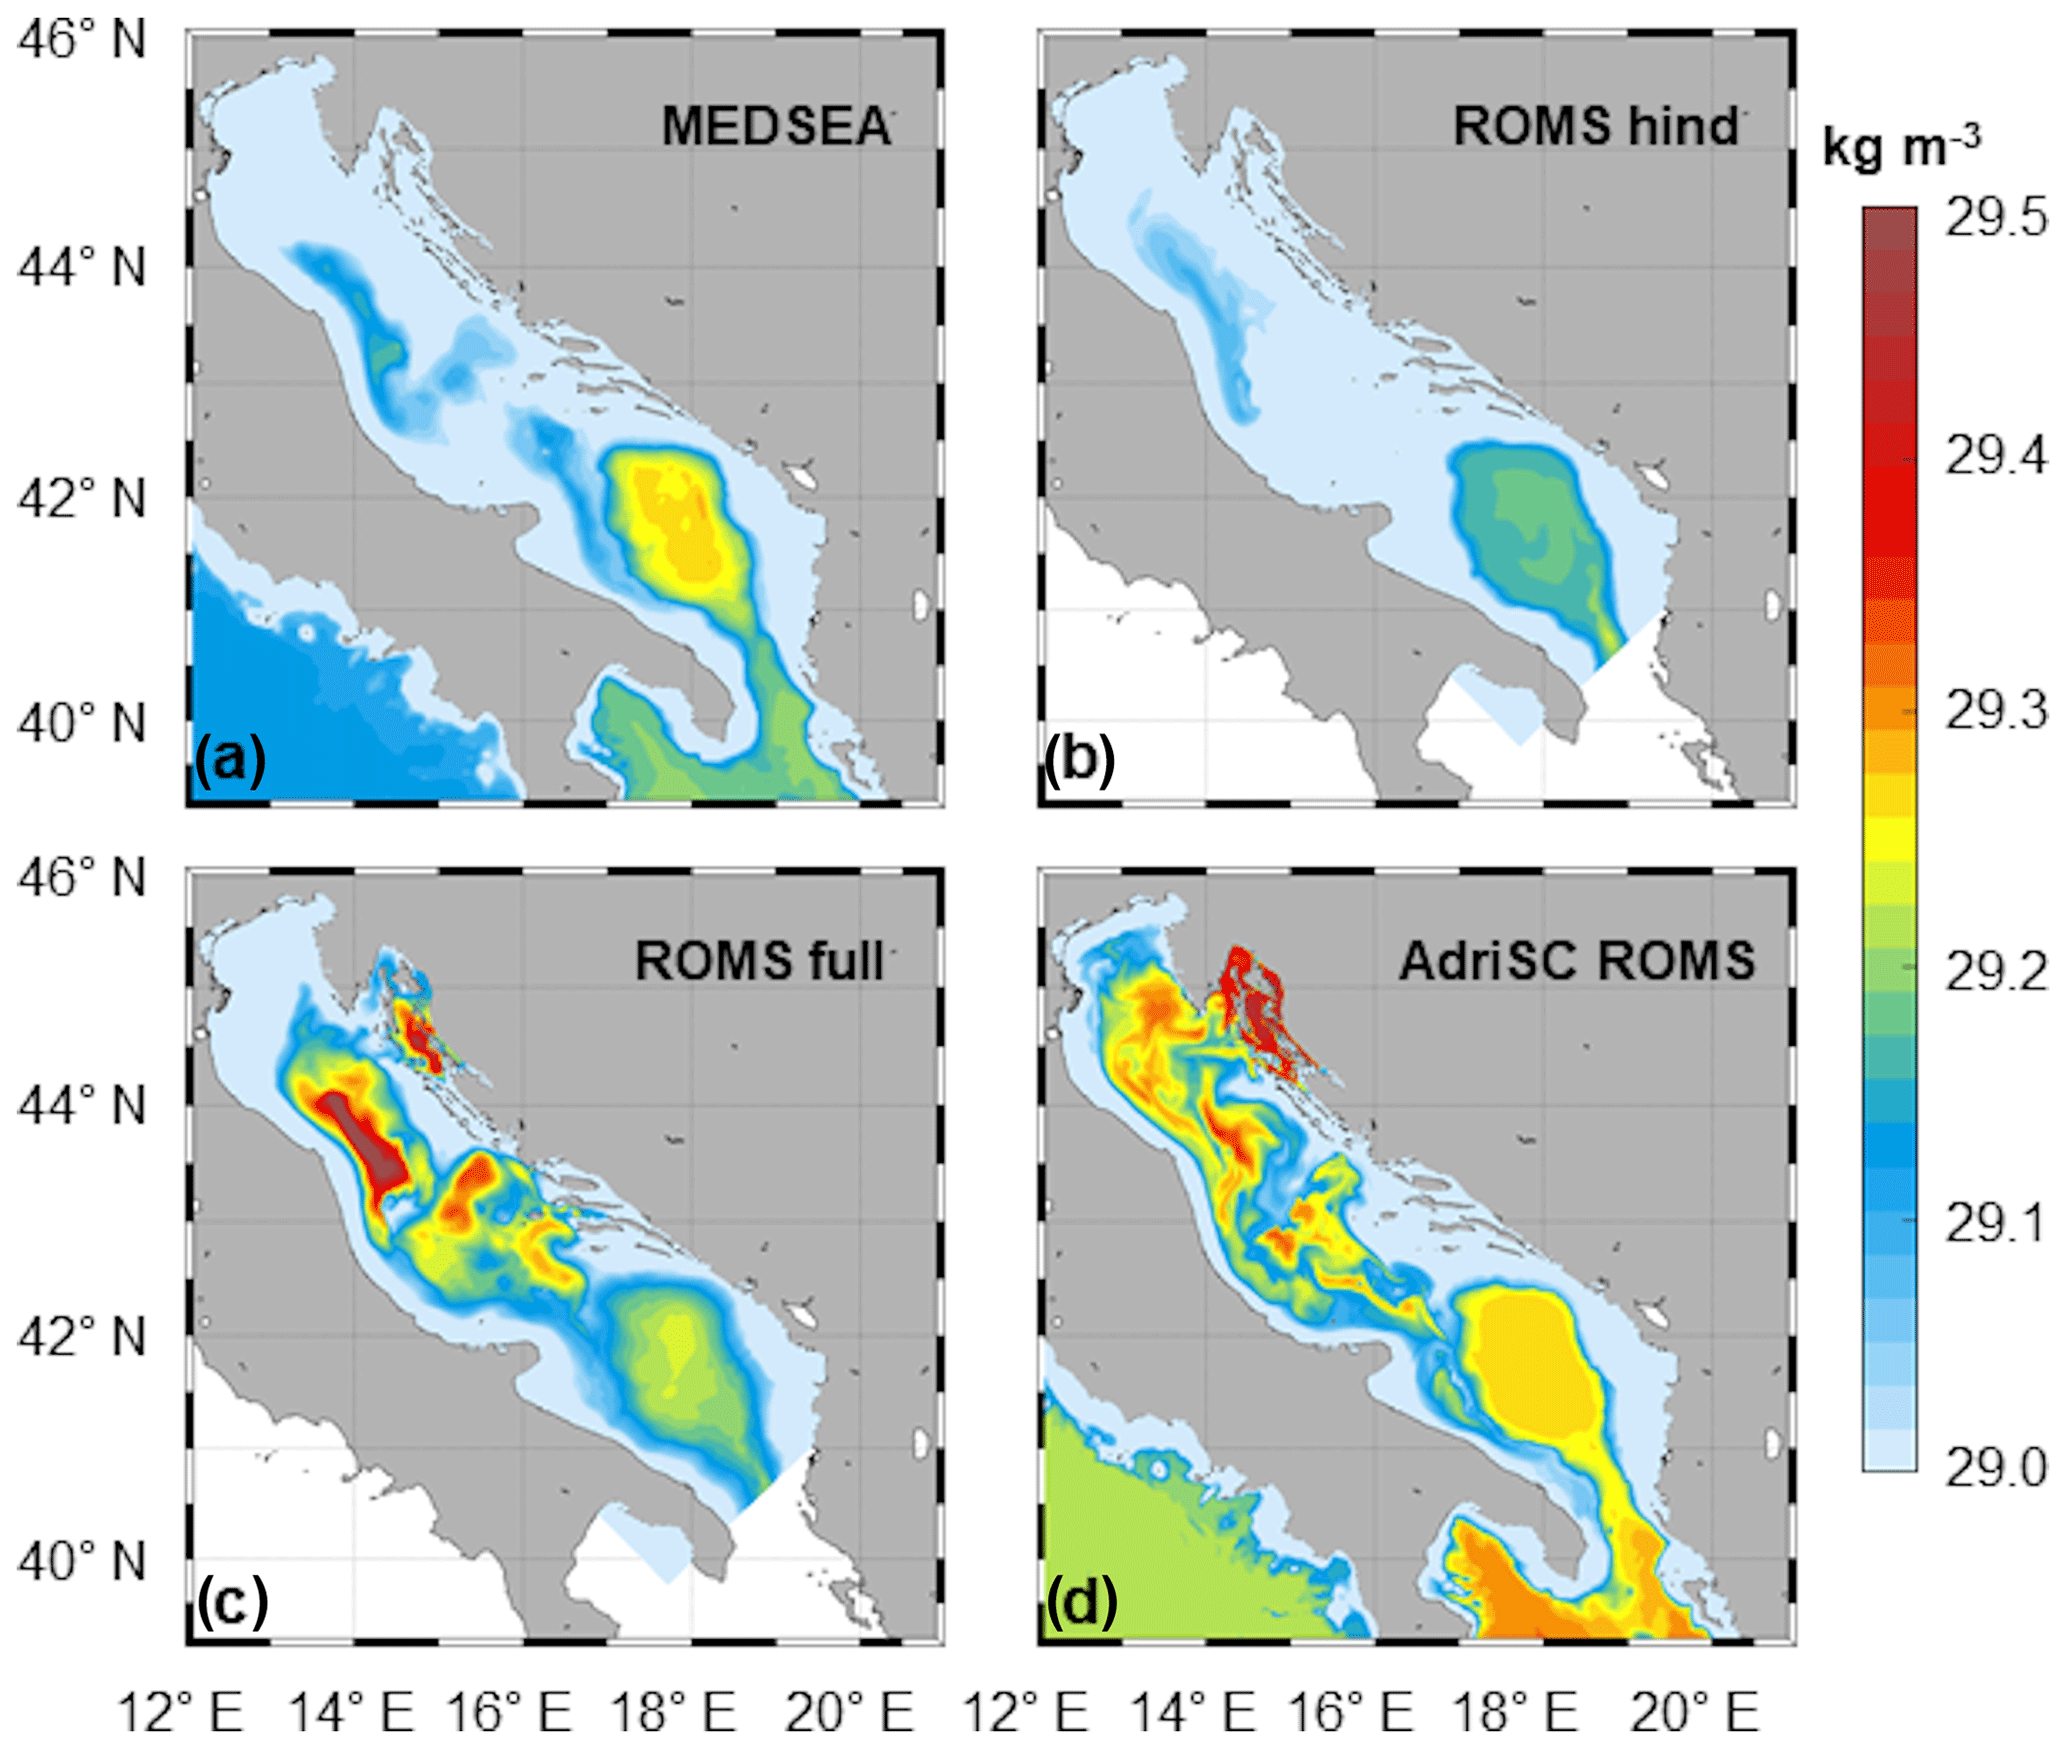
Figure 11Spatial distribution of bottom PDAs on 1 May 2015 for (a) MEDSEA, (b) ROMS-hind, (c) ROMS-full, and (d) AdriSC-ROMS simulations.
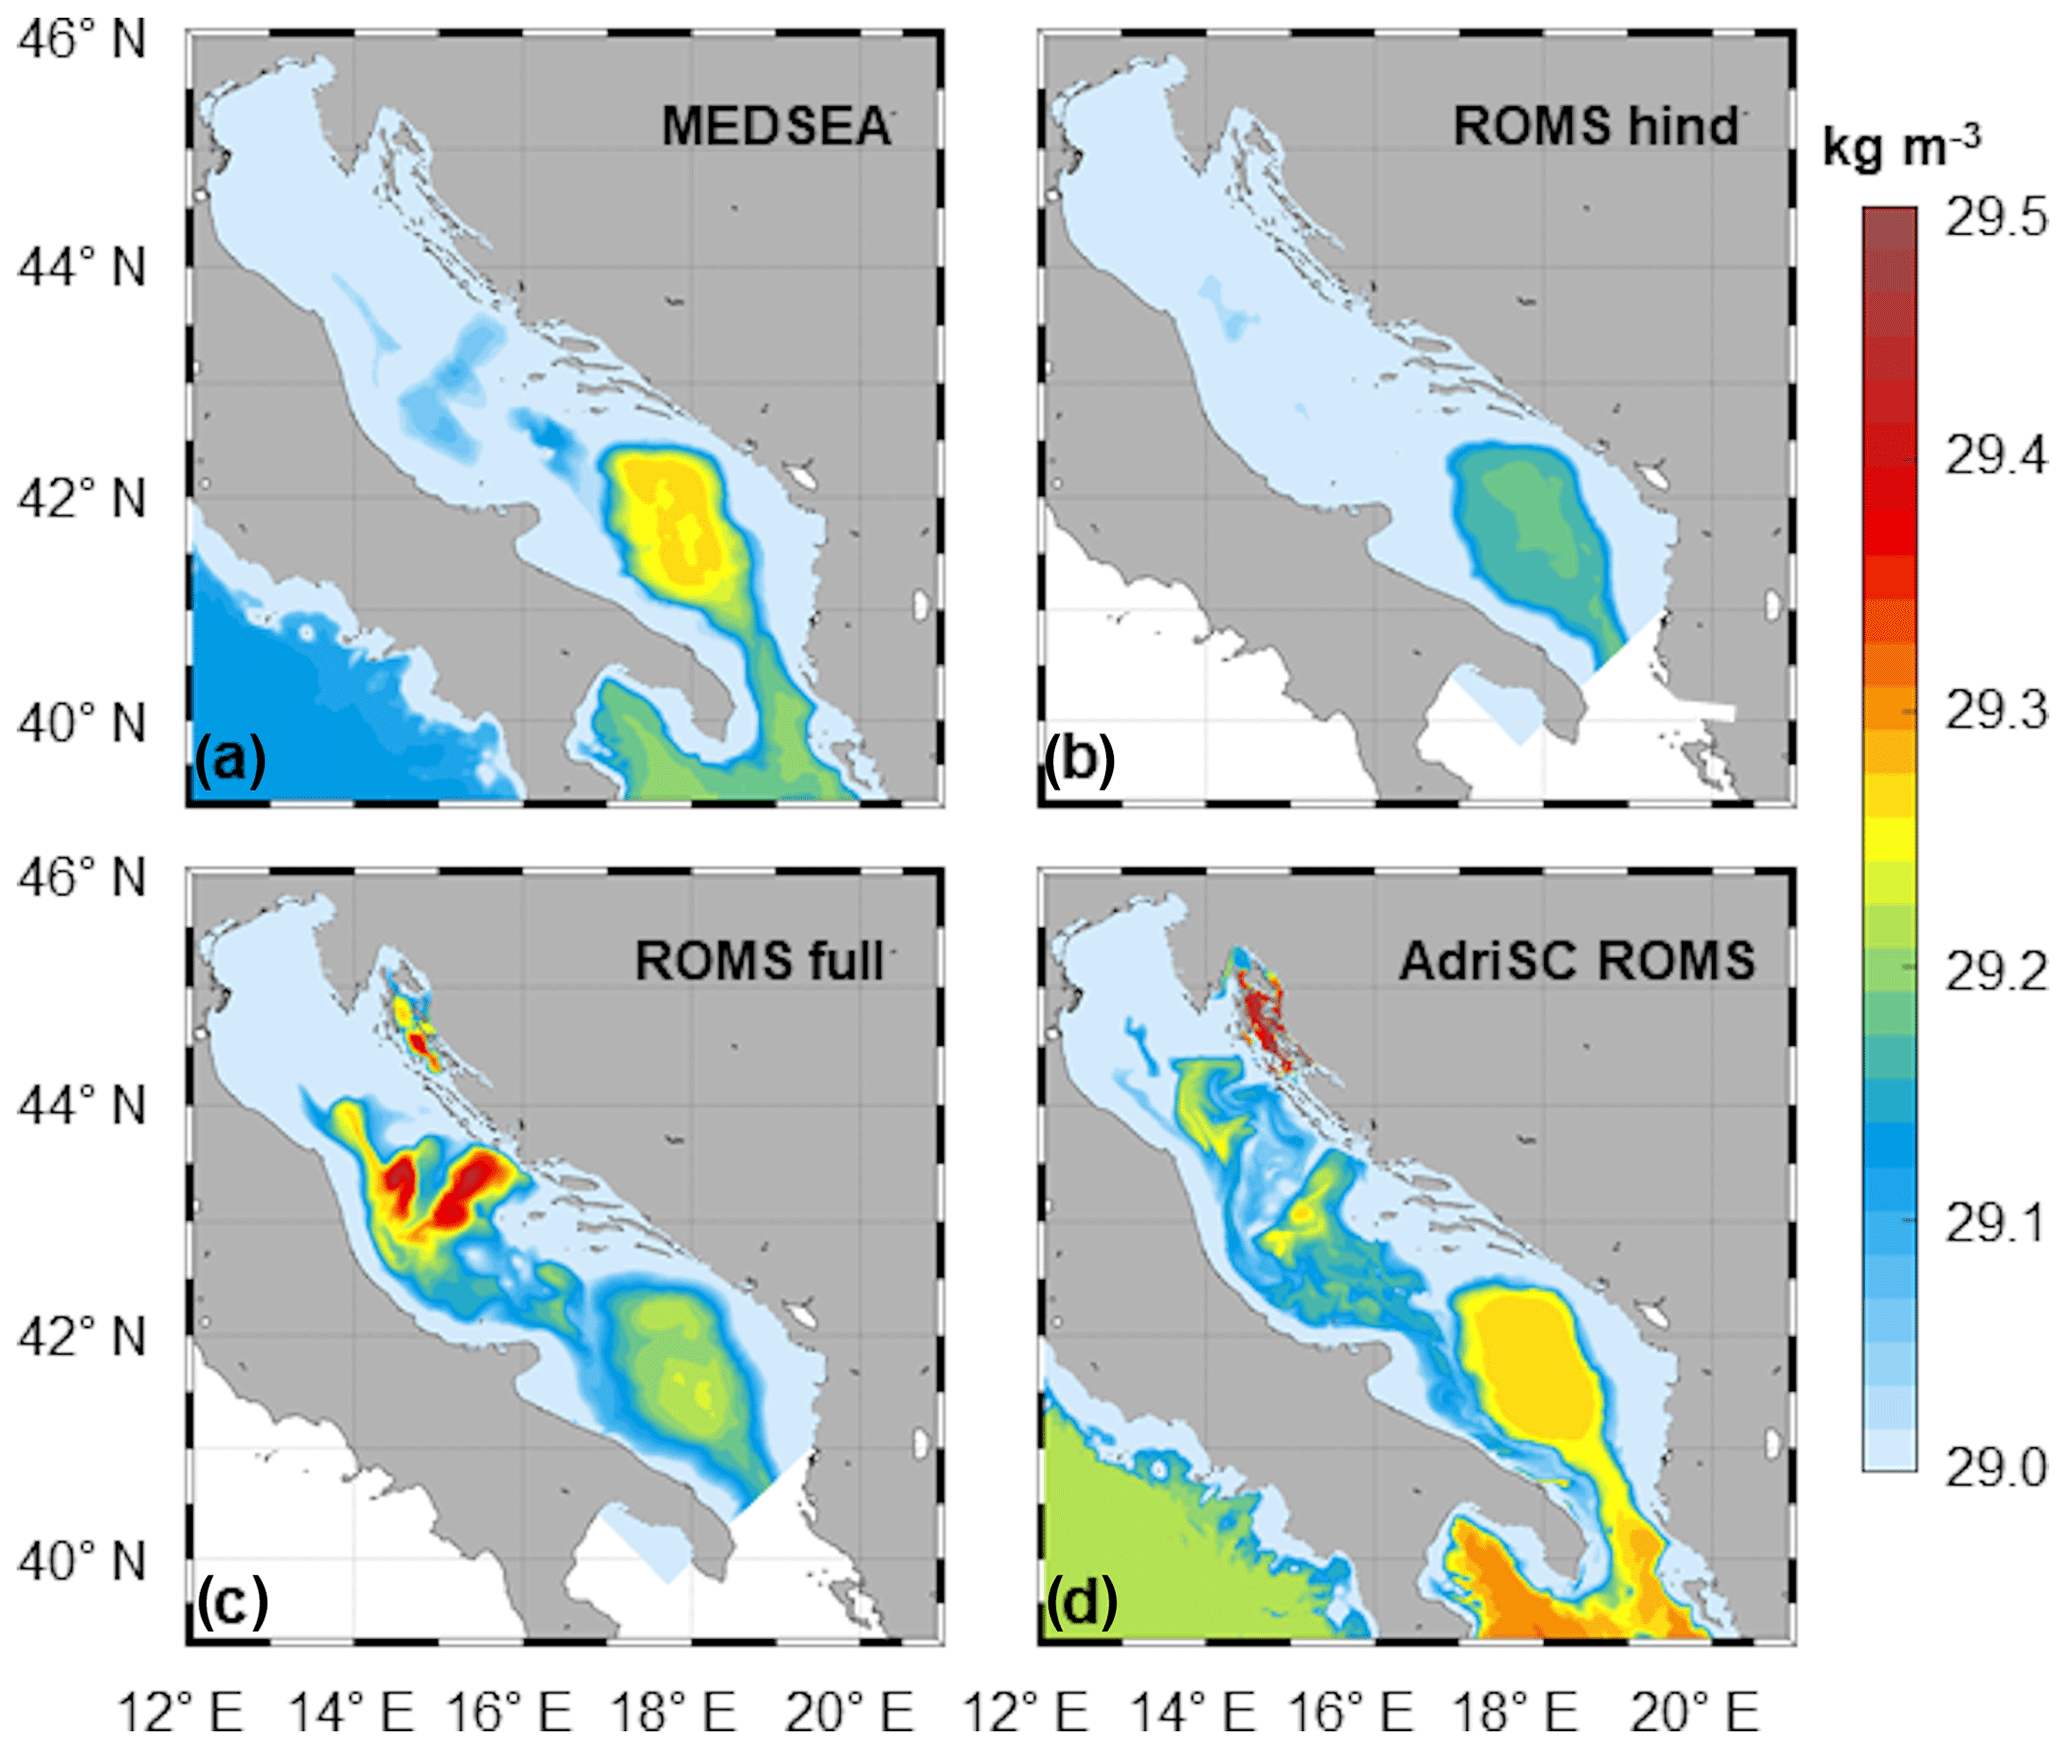
Figure 12Spatial distribution of bottom PDAs on 1 June 2015 for (a) MEDSEA, (b) ROMS-hind, (c) ROMS-full, and (d) AdriSC-ROMS simulations.
Between the second bora event and 3 March 2015 (i.e. third bora event), a larger amount of dense water is generated in the northern Adriatic (along the Trieste jet and in the shelf) by all the models, with PDA surpassing 29.5 kg m−3 in AdriSC-ROMS and in ROMS-hind and ROMS-full and up to 29.4 kg m−3 in MEDSEA. However, it should be noted that MEDSEA only sees dense waters in the northern shelf and not along the Trieste jet. Further, a larger amount of dense waters (above 29.5 kg m−3) are generated within and off the Kvarner Bay and transported along the Po River plume towards the Jabuka Pit and the southern Adriatic in ROMS-full and AdriSC-ROMS. However, due to the availability of assimilated measurements, ROMS-full first generates dense waters off the Kvarner Bay and then within. In contrast, AdriSC-ROMS clearly transports the dense waters generated within the Kvarner Bay towards the west along the bora jets. On 1 March 2015 (Fig. 9), dense waters start to be collected within the Jabuka Pit in both ROMS-full and AdriSC-ROMS, while no dense water is transported that far south in MEDSEA and ROMS-hind.
Between the third bora event and 1 April 2015, for ROMS-full and AdriSC-ROMS, after an initial increase along the bora jets, dense waters (above 29.5 kg m−3) are transported along the western coast from the northern Adriatic and the Kvarner Bay towards the south and are partially collected in the Jabuka Pit. ROMS-hind also shows some dense-water transport (with PDAs barely reaching 29.2 kg m−3) from the northern Adriatic towards the Jabuka Pit. However, in MEDSEA, the dense waters generated in the northern shelf (up to 29.45 kg m−3) seem to slowly dissipate without being transported. On 1 April (Fig. 10), the northern Adriatic dense waters decreased to PDA values below 29.3 kg m−3 in MEDSEA, barely reaching 29.2 kg m−3 in ROMS-hind, mostly below 29.35 kg m−3 in AdriSC-ROMS, and that even totally disappeared in ROMS-full. For ROMS-full and AdriSC-ROMS, dense waters (up to 29.35 and above 29.5 kg m−3, respectively) still remain within the Kvarner Bay.
Between 1 April and 1 May 2015, in ROMS-full and AdriSC-ROMS, continuous transport towards the south results in a larger amount of dense waters being collected in the Jabuka Pit, from where they start to cascade towards the SAP via the deepest parts of the Palagruža Sill (Rubino et al., 2012). It should be noted that the cascading occurs along a narrower and more western path in AdriSC-ROMS than in ROMS-full. On 1 May 2015 (Fig. 11), no dense water is present in the MEDSEA and ROMS-hind models, except within the SAP. Dense waters (PDA above 29.3 kg m−3) remain within the Kvarner Bay, the Jabuka Pit, and along the western coast in ROMS-full and AdriSC-ROMS.
Between 1 May and 1 June 2015, the remaining dense waters are either transported towards the south or, for the most part, collected within the Kvarner Bay and the Jabuka Pit in both ROMS-full and AdriSC-ROMS. The collection of dense waters within the Kvarner Bay (particularly in AdriSC-ROMS, where PDAs are above 29.45 kg m−3 over most of the bay) can be explained by the fact that this area is much deeper than the open northern Adriatic. On 1 June 2015 (Fig. 12), however, the dense waters collected within the Jabuka Pit have much higher PDAs in ROMS-full (above 29.4 kg m−3) than in AdriSC-ROMS (below 29.3 kg m−3) despite AdriSC-ROMS clearly producing a greater amount of dense waters during the three bora events. This can be explained either by AdriSC-ROMS being too dissipative or by the strong impact of the assimilation in ROMS-full.
After 1 June 2015, dense waters remain within the Kvarner Bay till the end of June in ROMS-full and till the end of September in AdriSC-ROMS and within the Jabuka Pit till the end of September, with PDA values above 29.25 kg m−3 in ROMS-full but barely reaching 29.2 kg m−3 in AdriSC-ROMS.
Overall, AdriSC-ROMS generates a larger amount of dense waters than the other models because it has the strongest atmospheric forcing, while MEDSEA and ROMS-hind do not properly reproduce the dense-water dynamics in the Adriatic basin. However, ROMS-full collects a larger amount of dense waters in the Jabuka Pit than all the other models. It can be concluded that AdriSC-ROMS is probably too dissipative during the transport of the dense waters from the northern Adriatic and the Kvarner Bay towards the south. Further, in ROMS-full, the patchy distribution of very dense waters during winter and spring can be explained by the assimilation of data in 4 d cycles, for which CTD measurements – collected at some given sites and for some specific days – played a significant role in adjusting the Adriatic dynamical solutions (Janeković et al., 2020). This demonstrates the importance of the coverage and the long-term availability of the assimilated data. A better representation of the dense-water dynamics within the Adriatic basin in ROMS-hind can thus be envisioned (and is possible, as demonstrated by the results of the AdriSC model) before performing the data assimilation which, for the moment, is incapable of fully compensating for the cumulated weaknesses of the ALADIN-HR and ROMS-hind models.
3.3.3 Daily volume transports along selected transects
To quantify the dense-water outflow across different sections of the northern and middle Adriatic, the volume transports of dense water defined by the PDA threshold of 29.2 kg m−3 through four transects (T1–T4) are presented in Fig. 13. The transport is defined as positive towards the northwest (transects T1, T3, and T4) or the northeast (transect T2). In general, MEDSEA and ROMS-hind transports are the lowest for all transects, which is expected, as their overall PDA values are found to be the lowest of all simulations. With the same argument, the AdriSC-ROMS transport is the highest for all transects, except for T4, where the ROMS-full transport prevails (Fig. 13d).

Figure 13Daily volume transport rates of dense-water outflow with PDA values higher than 29.2 kg m−3 integrated over the transects (a) T1, (b) T2, (c) T3, and (d) T4.
The transports produced by MEDSEA at T1 are mostly very low, peaking at −0.03 Sv in February (Fig. 13a). ROMS-hind transport varies there between −0.07 and −0.01 Sv in February, while the largest absolute values are produced during March, reaching −0.30 Sv. ROMS-full transports at T1 are similar in magnitude to those of ROMS-hind, but the timing is different. In February, the transport reaches −0.20 Sv, whereas in March, the values are smaller, reaching only −0.04 Sv. AdriSC-ROMS transports at T1 are extremely high from February to April compared to the other simulations. The largest southeastward transports are produced in February, with values down to almost −1.00 Sv, while in March and April, they reach −0.80 Sv.
For T2, MEDSEA and ROMS-hind transports are null or almost null for all days, as they do not produce dense waters with PDA values above 29.2 kg m−3 within the Kvarner Bay (Fig. 13b). ROMS-full transports are largest in February and in the first half of March, when intense measurements were carried out in the Kvarner Bay. They peak at −0.20 Sv. AdriSC-ROMS transports are also the highest in February and March, peaking at −0.60 Sv, while the values in April reach −0.20 Sv. AdriSC-ROMS transports indicate that the ratio between dense water originating from the northern Adriatic and the Kvarner Bay is roughly 60:40, which is similar to the transport ratio derived for the massive dense-water generation in winter 2012 (Janeković et al., 2014).
For T3 and T4, both MEDSEA and ROMS-hind transports are null throughout the whole period. ROMS-full transports at T3 vary around −0.05 Sv from the middle of February to the end of May (Fig. 13c), being the highest in the second half of March, reaching −0.20 Sv. Furthermore, the results show some similarities in the behaviour of the ROMS-full and AdriSC-ROMS transports. Interestingly, the dense-water transports at T3 are lagged for about 2 to 3 weeks (depending on the simulation) after the transports at T1 and T2, from which an estimate of bottom density current may be computed (approximately 0.10–0.17 m s−1).
Lastly, ROMS-full transports are extremely large at T4, much larger than in AdriSC-ROMS, peaking during March–April with values reaching −0.90 and −0.70 Sv, respectively. For the rest of the time, the transports are relatively small, bringing into question whether these outbursts of dense water are driven by the assimilated data or by an outflow of dense waters with high densities that are produced by ROMS-full northwest from transect T4 in the Jabuka Pit.
The multi-model analysis performed in this study has demonstrated that reproducing the dense-water dynamics within the Adriatic basin is extremely complex, as the presented models produced different or even divergent results despite all of them having been thoroughly evaluated in previous studies (Escudier et al., 2021; Janeković et al., 2104; Vilibić et al., 2018; Pranić et al., 2021; Denamiel et al., 2021b, 2022). However, it is important to keep in mind that the presented results belong to different model categories. MEDSEA is a reanalysis product covering the full Mediterranean Sea for the 1987–2019 period; ALADIN-HR-ROMS does not cover the full Adriatic Sea and is used, in this study, either in hindcast mode (hind) or in fully assimilated mode with 4 d cycles (full) for the 2014–2015 period; and finally, AdriSC is the evaluation run of a climate model covering the full Adriatic for the 1987–2017 period. This implies that numerical schemes (e.g. discretization, parametrization) and the set-up (e.g. physics, resolution, forcing) used in these models, as well as the type of simulation performed (free run vs. assimilated run), strongly influence the quality of the presented results. As this study only compares state-of-the-art models (ERA5, WRF, and ALADIN in the atmosphere and NEMO and ROMS in the ocean), the differences in numerical schemes will not be discussed hereafter because it is difficult to quantify how they impact the dense-water dynamics, as they vary from model to model. However, the different model set-ups will be analysed with the aim of better understanding their impact on the bora-driven dense-water dynamics in the Adriatic basin.
4.1 Impact of the resolution and the physics on the bora dynamics
First, the ERA5 reanalysis at 25 km resolution has been demonstrated to be incapable of capturing the bora dynamics (Denamiel et al., 2021a). Consequently, in this study, ERA5 wind stresses are 2 to 3 times smaller than the AdriSC-WRF and ALADIN-HR results. However, in both the northern Adriatic and the Kvarner Bay, heat losses calculated from the ERA5-MEDSEA model – via bulk formulae using sea-surface-temperature-assimilating remote sensing products – are comparable to the ALADIN-HR-ROMS-hind model (Fig. 6). These heat losses are still underestimated compared to the AdriSC model, particularly within the Kvarner Bay and the Gulf of Trieste, as well as along all the bora jets (Fig. 3).
Second, the hydrostatic ALADIN-HR model at 8 km resolution – with the wind fields further dynamically downscaled to 2 km – has already been demonstrated to reproduce the basic bora dynamics (Horvath et al., 2009). However, in the Kvarner Bay region, our results show that the ALADIN-HR wind stresses are not as intense and do not cover as wide an area as the non-hydrostatic AdriSC-WRF model. Indeed, the bora cross-flow variability in the Kvarner Bay might occur at a kilometre scale, particularly during deep bora events (Kuzmić et al., 2015), while bora pulsations have a strong sub-kilometre spatial component, posing a challenge for proper quantification in any kilometre-scale atmospheric model. Nevertheless, Denamiel et al. (2021a) have demonstrated that, during 22 bora events, including 2 in 2015, the AdriSC-WRF 3 km model reproduced very well the wind speed observations at Pula, Rijeka, Ogulin, Zavižan, Gospić, and Knin stations (all located in the Kvarner Bay region) above 20 m s−1 despite over predicting them by up to 5 m s−1 below this threshold. Further, the ALADIN-HR-ROMS-hind heat losses are always smaller than those computed by the ERA5-MEDSEA and AdriSC models. It is documented that hydrostatic atmospheric models are not capable of capturing all the details of the bora jets (Klemp and Durran, 1987; Blockley and Lyons, 1994; Grisogono and Belušić, 2009). Consequently, the hydrostatic approximation used in ALADIN-HR constrains its ability to reproduce the finer-scale details of the bora flow (Horvath et al., 2009). Therefore, heat losses in ALADIN-HR-ROMS (hind and full) mostly occur along the Senj Jet but are still weaker than in AdriSC (Fig. 3). Further, quite surprisingly, the 4D-Var data assimilation scheme used in the ROMS-full assimilation reduces the intensity of the turbulent heat fluxes and thus creates a dynamical imbalance between the wind stresses (which are similar in comparison to the differences between the different atmospheric models) and the heat losses forcing the ocean model.
Finally, the evaluations of the AdriSC-WRF model performed both for the climate run over a 31-year period (Denamiel et al., 2021b) and during extreme bora events (Denamiel et al., 2020a, b, 2021a) have demonstrated that a 3 km resolution is appropriate to represent the atmospheric dynamics within the Adriatic basin. Further, the results of the AdriSC-WRF model at 3 km resolution (particularly the intensity of the winds) have been shown to converge towards the results obtained with the higher-resolution AdriSC-WRF-1.5 km model during bora events (Denamiel et al., 2021a). However, only sub-kilometre-scale atmospheric models can properly capture the highly non-linear dynamics of the bora flows (Kuzmić et al., 2015); thus, using a 3 km non-hydrostatic model is still a compromise between accuracy and efficiency. This compromise is particularly important when running multi-year climate simulations, having a tremendous computational cost. This is also highlighted by Vodopivec et al. (2022), who conducted a sensitivity study over a 16-year period using different runoff configurations and different sources of atmospheric forcing and concluded that the atmospheric forcing has a substantial impact on the hydrology and circulation of the Adriatic Sea.
4.2 Impact of the resolution and the bathymetry on the dense-water dynamics
In the ocean models, the resolution will mostly impact the representation of the many islands located along the eastern Adriatic coast, but more importantly, it will impact the representation of the reservoirs that collect the dense waters within the Adriatic basin (i.e. Kvarner Bay, Jabuka Pit, and SAP). To better understand the necessary horizontal resolution needed to reproduce the Adriatic Sea dynamics, the spatial distributions of the median and MAD of the Rossby radii calculated from the AdriSC-ROMS results are presented for the entire model domain in Fig. 14a and b, respectively. In general, the median Rossby radius decreases from open seas towards shallower coastal areas. The largest values are found to be around 10.0 ± 2.0 km in the open northern Ionian Sea. Median Rossby radii are slightly smaller in the SAP, with values around 7.5 ± 1.3 km, while they decreases sharply on the edges of the pit to around 5.0 ± 1.2 km. In the Jabuka Pit, the radii reach around 4.0 ± 1.2 km, whereas in the rest of the middle Adriatic, they reach around 2.5 ± 1.2 km. The deeper part of the Kvarner Bay presents high variability and Rossby radii around 2 ± 1.5 km. The smallest median Rossby radii, as well as the smallest MAD, are calculated for the northern Adriatic around 1.0 ± 0.4 km. Further, the time series of the Rossby radius are presented for the northern Adriatic and Kvarner Bay (Fig. 14c), as well as for the Jabuka Pit and deep Adriatic (Fig. 14d) subdomains. In the northern Adriatic, the radius is 0.5–1.0 km until April 2015 and then increases to around 1.5 km until September, after which it decreases to be below 1 km. For the Kvarner Bay, the values obtained from November 2014 to April 2015 are very small (less than 500 m), after which they gradually increase, peaking in summer at 3.5 km and decreasing again in September. In the Jabuka Pit, there is a decrease from approximately 4 km to extremely small values around 300 m in February 2015, after which there is an increase. The deep Adriatic subdomain shows the same behaviour as the Jabuka Pit but with values that are almost 4 km larger throughout the whole year. The values of the median Rossby radii obtained in the SAP correspond to what was previously found by Kurkin et al. (2020) in their study dedicated to analysing the first Rossby radii in European semi-enclosed basins. Overall, the baroclinic Rossby radii present large variability in the Adriatic Sea, and the results suggest that even sub-kilometre-scale ocean models are needed to simulate the full range of processes in the Adriatic Sea, particularly the dense-water dynamics. However, for climate simulations, a horizontal resolution finer than 1 km is not feasible yet.
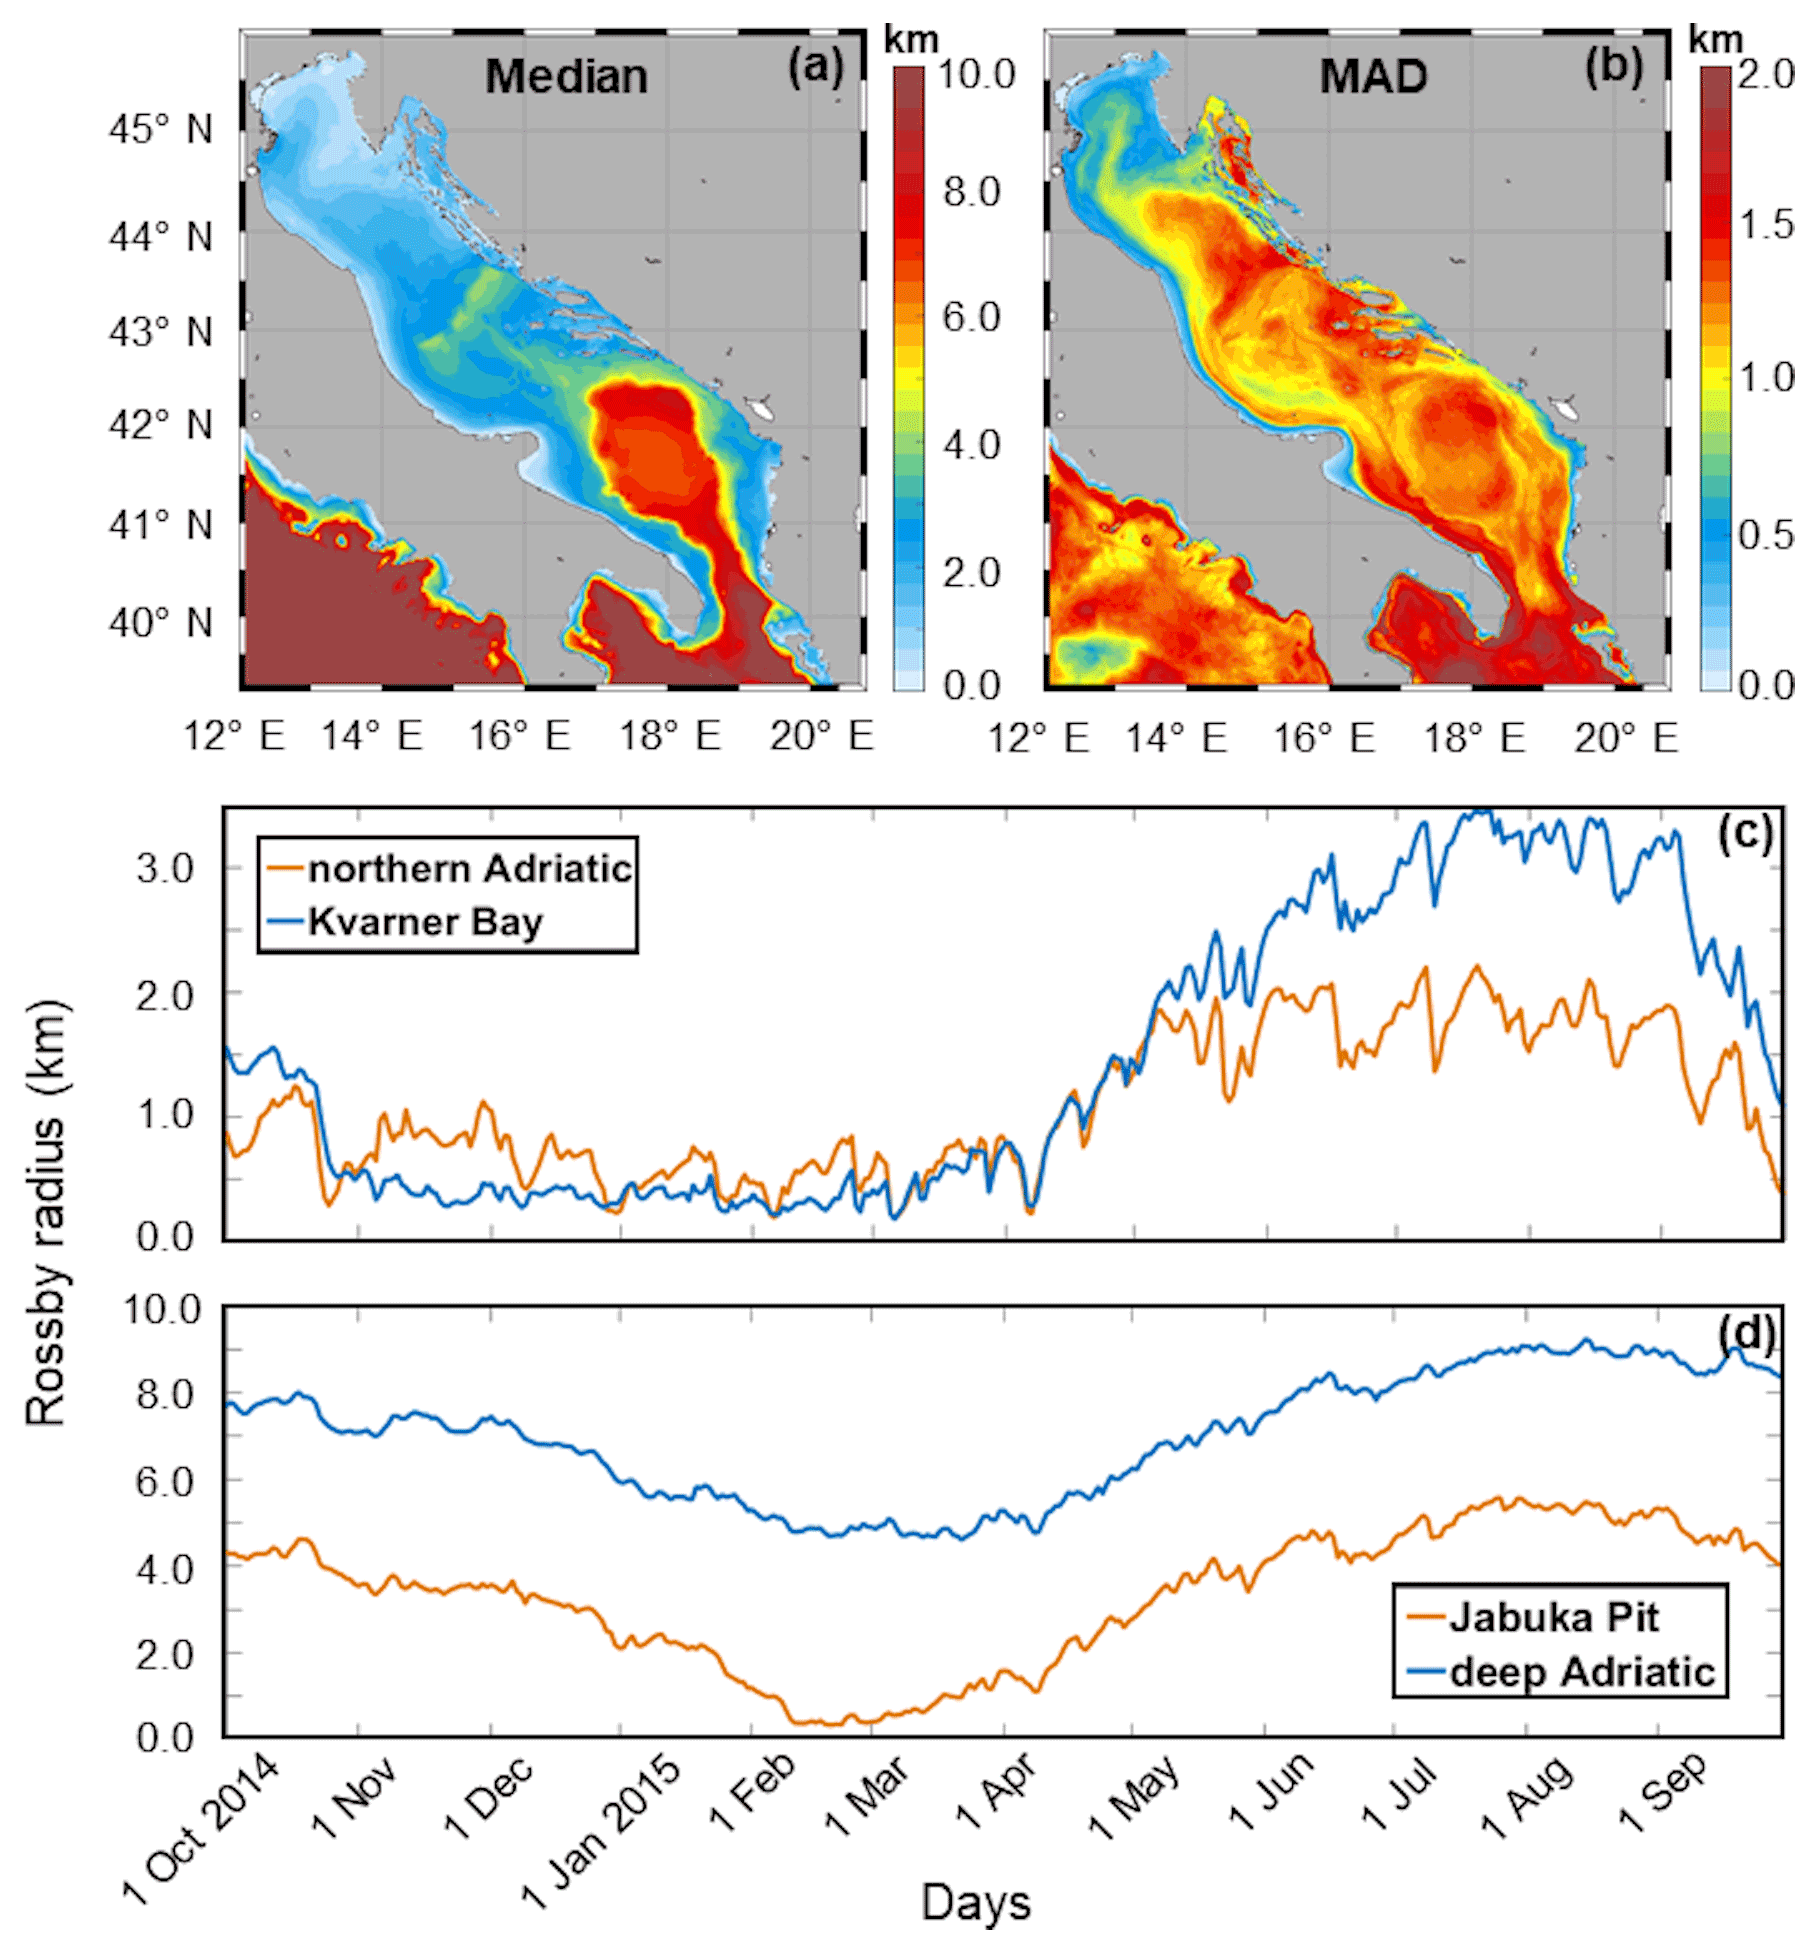
Figure 14Median and MAD of the first baroclinic Rossby radius of deformation for the AdriSC-ROMS domain (a, b) and time series of the Rossby radius for the northern Adriatic and Kvarner Bay (c), as well as for the Jabuka Pit and deep Adriatic subdomain (d).
Further, different digital terrain models (DTMs) have been used to generate the bathymetries of the presented models. In order to evaluate the joint impact of resolution and bathymetry, MEDSEA and ROMS (hind and full) bathymetries are compared to the AdriSC-ROMS model at 1 km resolution (Fig. 1b, c). The MEDSEA model is clearly shallower than AdriSC-ROMS within the Kvarner Bay and the Jabuka Pit (by 60–80 m) but also in the middle of the SAP (by more than 100 m). Consequently, the capacity of the MEDSEA model to naturally collect the dense waters within the known Adriatic reservoirs is decreased compared to the AdriSC-ROMS model and thus relies heavily on the assimilation of the available data. In the ROMS-hind and ROMS-full models, the bathymetry is also generally shallower than in AdriSC-ROMS within the Kvarner Bay and along the canyon system between the Jabuka Pit and the SAP (by 20–40 m). This is particularly important, as it might explain the differences in terms of the paths seen between ROMS-full and AdriSC-ROMS when the dense waters are transported from the Jabuka Pit towards the SAP. However, concerning the Jabuka Pit and the SAP, the alternating positive and negative differences in bathymetry between ROMS (full and hind) and AdriSC-ROMS clearly show some shifts in locations. Whether and how these shifts in location impact the dense-water dynamics is not clear with the results presented in this study.
Finally, it is important to highlight that the AdriSC-ROMS model uses 35 vertical sigma layers, while the ROMS (full and hind) model only has 20 of them. As the bora-driven dense-water dynamics require the proper resolution of both the surface (for the sea temperature cooling) and the bottom (for the dense-water transport) layers, the finer vertical resolution used in AdriSC-ROMS may play a major a role in the overall performance of the model.
4.3 Impact of the salinity forcing on the dense-water generation
Dense-water generation is highly sensitive to the background salinity content provided through either the open boundaries or the direct river outflows imposed on the ocean models.
First, in ROMS-hind, Janeković et al. (2014) quantified an underestimation of salinity by 0.2–0.5 for a simulation of the massive dense-water formation in 2012. After updating the old river climatologies that largely overestimated the discharges, Vilibić et al. (2016) confirmed that even the simulations using the most realistic river representation underestimate the background salinity content within the Adriatic basin. As the AREG model (forcing ROMS-full) is set up with the old river climatologies and has a low salinity content over the entire Adriatic basin, far too much fresh water is inputted through the ROMS-hind open lateral boundary located in the southern Adriatic. Consequently, the ROMS-hind results presented in this study for the 2014–2015 period have low basin-wide salinities and therefore generate dense waters with lower bottom PDA values.
Next, the AdriSC-ROMS model has been thoroughly evaluated over a 31-year period in Pranić et al. (2021). First, in the northern Adriatic, despite a lack of accuracy for salinities under 36, due to the Po River misrepresentation, the AdriSC-ROMS model has been shown to perform well in reproducing dense-water masses. Second, in the Kvarner Bay, AdriSC-ROMS salinities have been demonstrated to be too high, which could lead to a general overestimation of the dense-water bottom PDAs in this region. And finally, in the SAP, the evaluation revealed that the salinities and the densest waters are captured relatively well by the AdriSC-ROMS model.
Additionally, salinities in MEDSEA are closer to the AdriSC-ROMS results in the southern Adriatic (i.e. Jabuka Pit and deep Adriatic subdomains) and to the ROMS-hind results in the northern Adriatic (i.e. northern Adriatic and Kvarner Bay subdomains) during the entire 2014–2015 period (Fig. S4). It can thus be safely assumed that the old river climatologies used in MEDSEA result in low salinities over the northern part of the Adriatic basin and hence lower bottom PDAs during the bora-driven dense-water generation events.
Finally, besides the river discharges, the surface freshwater E–P fluxes (i.e. evaporation–precipitation fluxes) also determine the surface salinity of the northern Adriatic Sea. The E–P fluxes are taken into account in all ocean models presented in this study but are derived from really different atmospheric models. Consequently, the difference in dense-water results can also be influenced by the differences in E–P fluxes.
4.4 Impact of the assimilation on the ocean dynamics
First, in ROMS-full, the 4DVar data assimilation is applied in 4 d cycles, which means that the ocean dynamical properties are not continuously smooth in time between the cycles, as the ROMS-full model adjusts the initial state at the beginning of each cycle. Consequently, despite the large improvement in terms of the ocean fields used to minimize the cost function of the assimilation, the dense-water generation and transport as a continuous process in time is not properly reproduced in ROMS-full. For example, as the salinity is generally underestimated in ROMS-hind, the data assimilation performed in ROMS-full is constantly trying to adjust salinities (and therefore bottom PDAs) to higher values. However, the data availability is highly variable during the investigated period and, for example, is more concentrated in the Kvarner Bay during the February–March 2015 period or along a northern Adriatic transect (Po–Rovinj) surveyed with a monthly or bimonthly frequency. This thus leads to having extremely high bottom PDAs present off the Kvarner Bay before the actual generation of the dense waters within the Kvarner Bay or along the Trieste jet in the ROMS-full model.
Second, MEDSEA, contrarily to ROMS-full, uses a 3D-Var assimilation approach which is known to lose the temporal information contained in the observations through averaging (Janeković et al., 2020). In general, during the 2014–2015 period, MEDSEA assimilates less data than ROMS-full, which benefited from the observations collected during the NAdEx campaign. Consequently, MEDSEA is incapable of adjusting its solution in order to capture the proper dense-water dynamics. For example, in the Jabuka Pit, MEDSEA provides a constant decrease in bottom PDAs from autumn 2014 to winter 2015, which is opposite to all the other models and is probably driven by the availability of the assimilated observations (e.g. Argo data). However, ROMS-full is likely to have assimilated the same observations within the Jabuka Pit but also assimilated Arvor-C and drifter data obtained off the Kvarner Bay during the NAdEx campaign. Further, during the winter, when bora episodes occur, only a small number of SST cloud-free scenes are available for assimilation in ERA5. As a result, MEDSEA, contrary to ROMS-full, is mostly incapable of generating the bora-driven dense waters and hence of transporting and collecting them within the Jabuka Pit.
The aim of this study was to enhance our understanding of the bora-driven dense-water dynamics in the Adriatic Sea using and analysing different state-of-the-art modelling approaches. The main findings of the study can be summarized as follows:
-
In the northern Adriatic and Kvarner Bay, dense-water generation is better captured in ROMS-full and AdriSC-ROMS than in MEDSEA and ROMS-hind, which produce lower volumes of dense waters. The AdriSC model generates the strongest dynamics of all the models during the bora events with the largest intensities in wind stresses, upward turbulent heat fluxes, and bottom PDAs. Also, extreme dense waters are generated continuously in time and over the entire northern Adriatic in AdriSC-ROMS, while they appear as patches in ROMS-full. This is linked to a combination of parameters including the 4 d cycles of the 4D-Var data assimilation method used in ROMS-full and the use of atmosphere–ocean kilometre-scale models in AdriSC. Further, in the AdriSC simulation, due to the higher spatial resolution, the densest waters are collected within the Kvarner Bay, where they stay for the longest amount of time.
-
The transport of dense waters along the western coast is not quantitatively captured by MEDSEA and ROMS-hind. On the other hand, in the Jabuka Pit, ROMS-full collects a larger amount of dense water than all the other models, indicating that AdriSC-ROMS is probably far too dissipative. In the SAP, the results show that the northern Adriatic dense waters did not reach the bottom of the pit by the end of any simulation, classifying the winter of 2015 as moderate in terms of dense-water formation over the northern Adriatic shelf.
-
The impact of the resolution of the atmospheric models is best seen in the ERA5 results, which strongly underestimate the wind stresses. However, the heat losses are comparable between the models but are generally underestimated compared to AdriSC-WRF. Concerning the hydrostatic approximation, the non-hydrostatic model AdriSC-WRF reproduces more intense wind stresses with larger spatial coverage and stronger heat losses than the hydrostatic ALADIN-HR model.
-
As the Rossby radius of deformation is lower than 2 km in most of the domains during winter and spring, when dense waters are generated and spreading, the differences in resolution between the ocean models and bathymetry clearly influence the path and deposition of dense waters. However, it is not clear how this impacts the dense-water dynamics.
-
The ocean models are highly sensitive to the salinity input, which plays an important role in the dense-water generation. In particular, the usage of old river climatologies causes lower salinities in ROMS-hind and MEDSEA and hence lower bottom PDAs, while AdriSC-ROMS reproduces higher salinities and PDAs.
-
Compared to ROMS-hind, the data assimilation in ROMS-full tends to increase the bottom PDA values in all the subdomains but particularly in the Kvarner Bay and the Jabuka Pit. Although assimilation made a large improvement in terms of the ocean fields, the fields reflect initial state adjustments at the beginning of each assimilation cycle and hence do not produce long temporal smooth transitions. In addition, the lack of vertical resolution in the ROMS-full model probably contributes to the improper representation of the dense-water dynamics.
In summary, the reproduction of the dense-water dynamics in the Adriatic Sea requires the use of (1) kilometre- or finer-resolution atmosphere–ocean models and non-hydrostatic atmospheric models, (2) fine vertical resolutions in both atmosphere and ocean, (3) proper forcing of the open boundaries of the models, and finally, (4) appropriate representation of the air–sea interactions (e.g. formulation of the surface wind drag). This study reveals that, if these conditions are fulfilled, models running at long temporal scales can outperform coarse-resolution reanalysis products and assimilated simulations. Nevertheless, in addition to these prerequisites, 4D-Var data assimilation could be used to solve other model problems – such as sea surface temperature drifts, high mixing of the dense waters, etc. – often found in long-term hindcasts and short-term forecasts. However, such an approach would be extremely expensive in terms of the required numerical and observational resources needed to achieve it. This study thus paved the way to a new generation of Adriatic circulation models which now should optimize the accuracy of the results and the usage of the numerical resources.
The code of the COAWST model, as well as the ecFlow pre-processing scripts and the input data needed to re-run the AdriSC climate model in evaluation mode, can be obtained under the Open Science Framework (OSF) data repository (Denamiel, 2021) under the MIT license.
A major part of the observational data set used in this study can be obtained under the Zenodo data repository (Vilibić, 2021) under the Creative Commons by Attribution 4.0 International license. The remaining part of the observational data set is not publicly available, as the data were collected within projects in which they were not publicly disseminated. The data were given for research purposes by the Institute of Oceanography and Fisheries (Croatia) upon request.
The model results used in this study can be obtained under the OSF data repository (Pranić, 2022) under the Creative Commons by Attribution 4.0 International license. This study has been conducted using EU Copernicus Marine Service Information: https://doi.org/10.25423/CMCC/MEDSEA_MULTIYEAR_PHY_006_004_E3R1 (Escudier et al., 2020).
The movie of the daily spatial distribution of bottom PDAs for the 2014–2015 period can be obtained under the OSF data repository (Pranić, 2022) under the Creative Commons by Attribution 4.0 International license.
The supplement related to this article is available online at: https://doi.org/10.5194/os-19-649-2023-supplement.
PP: data curation, formal analysis, investigation, methodology, visualization, and writing – original draft. CD: conceptualization, data curation, investigation, methodology, visualization, resources, software, supervision, and writing – review and editing. IJ: methodology, resources, software, and writing – review and editing. IV: conceptualization, investigation, methodology, supervision, and writing – review and editing.
The contact author has declared that none of the authors has any competing interests.
Publisher’s note: Copernicus Publications remains neutral with regard to jurisdictional claims in published maps and institutional affiliations.
The computing and archive facilities used in this research were provided by the European Centre for Medium-range Weather Forecasts (ECMWF) and the Pawsey Supercomputer Centre, Australia. The contributions of Copernicus and the Euro-Mediterranean Center on Climate Change are acknowledged. A part of the observational data set used in this research was provided by the Institute of Oceanography and Fisheries (Croatia). Comments raised by the editor and two anonymous referees greatly improved the quality of the paper.
This research has been supported by the Croatian Science Foundation project ADIOS (grant no. IP-06-2016-1955) and ADAM-ADRIA (grant no. IP-2013-11-5928).
This paper was edited by John M. Huthnance and reviewed by two anonymous referees.
Alpers, W., Ivanov, A., and Horstman, J.: Observations of Bora Events over the Adriatic Sea and Black Sea by Spaceborne Synthetic Aperture Radar, Mon. Weather Rev., 137, 1150–1161, https://doi.org/10.1175/2008MWR2563.1, 2009.
Artegiani, A. and Salusti, E.: Field observation of the flow of dense water on the bottom of the Adriatic Sea during the winter of 1981, Oceanol. Acta, 10, 387–391, 1987.
Artegiani, A., Bregant, D., Paschini, E., Pinardi, N., Raicich, F., and Russo, A.: The Adriatic Sea general circulation, Part I: Air-sea interactions and water mass structure, J. Phys. Oceanogr., 27, 1492–1514, https://doi.org/10.1175/1520-0485(1997)027<1492:TASGCP>2.0.CO;2, 1997.
Batistić, M., Garić, R., and Molinero, J. C.: Interannual variations in Adriatic Sea zooplankton mirror shifts in circulation regimes in the Ionian Sea, Clim. Res., 61, 231–240, https://doi.org/10.3354/cr01248, 2014.
Beg Paklar, G., Isakov, V., Koračin, D., Kourafalou, V., and Orlić, M.: A case study of bora-driven flow and density changes on the Adriatic shelf (January 1987), Cont. Shelf Res., 21, 1751–1783, https://doi.org/10.1016/S0278-4343(01)00029-2, 2001.
Belušić, D. and Klaić, Z. B.: Estimation of bora wind gusts using a limited area model, Tellus A, 56, 296–307, https://doi.org/10.1111/j.1600-0870.2004.00068.x, 2004.
Belušić, D., Žagar, M., and Grisogono, B.: Numerical simulation of pulsations in the bora wind, Q. J. Roy. Meteorol. Soc., 133, 1371–1388, 2007.
Belušić, D., Hrastinski, M., Večenaj, Ž., and Grisogono, B.: Wind regimes associated with a mountain gap at the northeastern Adriatic coast, J. Appl. Meteorol. Clim., 52, 2089–2105, https://doi.org/10.1175/JAMC-D-12-0306.1, 2013.
Belušić, A., Prtenjak, M. T., Güttler, I., Ban, N., Leutwyler, D., and Schär, C.: Near-surface wind variability over the broader Adriatic region: Insights from an ensemble of regional climate models, Clim. Dynam., 50, 4455–4480, https://doi.org/10.1007/s00382-017-3885-5, 2017.
Benetazzo, A., Bergamasco, A., Bonaldo, D., Falcieri, F. M., Sclavo, M., Langone, L., and Carniel, S.: Response of the Adriatic Sea to an intense cold air outbreak: Dense water dynamics and wave-induced transport, Prog. Oceanogr., 128, 115–138, https://doi.org/10.1016/j.pocean.2014.08.015, 2014.
Bensi, M., Cardin, V., Rubino, A., Notarstefano, G., and Poulain, P.-M.: Effects of winter convection on the deep layer of the Southern Adriatic Sea in 2012, J. Geophys. Res.-Ocean., 118, 6064–6075, https://doi.org/10.1002/2013JC009432, 2013.
Bergamasco, A., Oguz, T., and Malanotte-Rizzoli, P.: Modeling dense water mass formation and winter circulation in the northern and central Adriatic Sea, J. Mar. Syst., 20, 279–300, https://doi.org/10.1016/S0924-7963(98)00087-6, 1999.
Blockley, J. A. and Lyons, T. J.: Airflow over a two-dimensional escarpment, III: Nonhydrostatic flow, Q. J. Roy. Meteorol. Soc., 120, 79–109, https://doi.org/10.1002/qj.49712051507, 1994.
Boldrin, A., Carniel, S., Giani, M., Marini, M., Bernardi Aubry, F., Campanelli, A., Grilli, F., and Russo, A.: Effects of bora wind on physical and biogeochemical properties of stratified waters in the northern Adriatic, J. Geophys. Res.-Ocean., 114, C08S92, https://doi.org/10.1029/2008JC004837, 2009.
Borenas, K. M., Wahlin, A. K., Ambar, I., and Serra, N.: The Mediterranean outflow splitting – a comparison between theoretical models and CANIGO data, Deep-Sea Res. Pt. II, 49, 4195–4205, https://doi.org/10.1016/S0967-0645(02)00150-9, 2002,
Bowman, A. W. and Azzalini, A.: Applied Smoothing Techniques for Data Analysis, New York: Oxford University Press Inc., ISBN 0191545694, 1997.
Carniel, S., Benetazzo, A., Bonaldo, D., Falcieri, F. M., Miglietta, M. M., Ricchi, A., and Sclavo, M.: Scratching beneath the surface while coupling atmosphere, ocean and waves: Analysis of a dense water formation event, Ocean Model., 101, 101–112, https://doi.org/10.1016/j.ocemod.2016.03.007, 2016.
Cavaleri, L., Bertotti, L., Buizza, R., Buzzi, A., Masato, V., Umgiesser, G., and Zampieri, M.: Predictability of extreme meteo-oceanographic events in the Adriatic Sea, Q. J. Roy. Meteorol. Soc., 136, 400–413, https://doi.org/10.1002/qj.567, 2010.
Cavaleri, L., Abdalla, S., Benetazzo, A., Bertotti, L., Bidlot, J.-R., Breivik, Ø., Carniel, S., Jensen, R. E., Portilla-Yandun, Rogers, W. E., Roland, A., Sanchez-Arcilla, A., Smith, J. M., Staneva, J., Toledo, Y., van Vledder, G. P., and van der Westhuysen, A. J.: Wave modelling in coastal and inner seas, Prog. Oceanogr., 167, 164–233, https://doi.org/10.1016/j.pocean.2018.03.010, 2018.
Chelton, D. B., deSzoeke, R. A., Schlax, M. G., El Naggar, K., and Siwertz, N.: Geographical Variability of the First Baroclinic Rossby Radius of Deformation, J. Phys. Oceanogr., 28, 433–460, https://doi.org/10.1175/1520-0485(1998)028<0433:GVOTFB>2.0.CO;2, 1998.
Chiggiato, J. and Oddo, P.: Operational ocean models in the Adriatic Sea: a skill assessment, Ocean Sci., 4, 61–71, https://doi.org/10.5194/os-4-61-2008, 2008.
Courtier, P., Thépaut, J. N., and Hollingsworth, A.: A strategy for operational implementation of 4D-Var, using an incremental approach, Q. J. Roy. Meteorol. Soc., 120, 1367–1387, 1994.
Crocker, R., Maksymczuk, J., Mittermaier, M., Tonani, M., and Pequignet, C.: An approach to the verification of high-resolution ocean models using spatial methods, Ocean Sci., 16, 831–845, https://doi.org/10.5194/os-16-831-2020, 2020.
Denamiel, C.: AdriSC Climate Model: Evaluation Run, OSF [code], https://doi.org/10.17605/OSF.IO/ZB3CM, 2021.
Denamiel, C., Šepić, J., and Vilibić, I.: Impact of geomorphological changes to harbor resonance during meteotsunamis: The Vela Luka Bay Test Case, Pure Appl. Geophys., 175, 3839–3859, https://doi.org/10.1007/s00024-018-1862-5, 2018.
Denamiel, C., Šepić, J., Ivanković, D., and Vilibić, I.: The Adriatic Sea and Coast modelling suite: Evaluation of the meteotsunami forecast component, Ocean Model., 135, 71–93, https://doi.org/10.1016/j.ocemod.2019.02.003, 2019.
Denamiel, C., Tojčić, I., and Vilibić, I.: Far future climate (2060–2100) of the northern Adriatic air–sea heat transfers associated with extreme bora events, Clim. Dynam., 55, 3043–3066, https://doi.org/10.1007/s00382-020-05435-8, 2020a.
Denamiel, C., Pranić, P., Quentin, F., Mihanović, H., and Vilibić, I.: Pseudo-global warming projections of extreme wave storms in complex coastal regions: The case of the Adriatic Sea, Clim. Dynam., 55, 2483–2509, https://doi.org/10.1007/s00382-020-05397-x, 2020b.
Denamiel, C., Tojčić, I., and Vilibić, I.: Balancing accuracy and efficiency of atmospheric models in the northern Adriatic during severe bora events, J. Geophys. Res.-Atmos., 126, e2020JD033516, https://doi.org/10.1029/2020JD033516, 2021a.
Denamiel, C., Pranić, P., Ivanković, D., Tojčić, I., and Vilibić, I.: Performance of the Adriatic Sea and Coast (AdriSC) climate component – a COAWST V3.3-based coupled atmosphere–ocean modelling suite: atmospheric dataset, Geosci. Model Dev., 14, 3995–4017, https://doi.org/10.5194/gmd-14-3995-2021, 2021b.
Denamiel, C., Tojčić, I., Pranić, P., and Vilibić, I.: Modes of the BiOS-driven Adriatic Sea thermohaline variability, Clim. Dynam., 59, 1097–1113, https://doi.org/10.1007/s00382-022-06178-4, 2022.
Dobricic, S. and Pinardi, N.: An oceanographic three-dimensional variational data assimilation scheme, Ocean Model., 22, 89–105, https://doi.org/10.1016/j.ocemod.2008.01.004, 2008.
Dorman, C. E., Carniel, S., Cavaleri, L., Sclavo, M., Chiggiato, J., Doyle, J., Haack, T., Pullen, J., Grbec, B., Vilibić, I., Janeković, I., Lee, C., Malačić, V., Orlić, M., Paschini, E., Russo, A., and Signell, R. P.: Winter 2003 marine atmospheric conditions and the bora over the northern Adriatic, J. Geophys. Res.-Ocean., 112, C03S03, https://doi.org/10.1029/2005JC003134, 2007.
Dukowicz, J. K.: Reduction of pressure and pressure gradient errors in ocean simulations, J. Phys. Oceanogr., 31, 1915–1921, https://doi.org/10.1175/1520-0485(2001)031<1915:RODAPG>2.0.CO;2, 2001.
Dutour Sikirić, M., Janeković, I., and Kuzmić, M.: A new approach to bathymetry smoothing in sigma-coordinate ocean models, Ocean Model., 29, 128–136, https://doi.org/10.1016/j.ocemod.2009.03.009, 2009.
Escudier, R., Clementi, E., Omar, M., Cipollone, A., Pistoia, J., Aydogdu, A., Drudi, M., Grandi, A., Lyubartsev, V., Lecci, R., Cretí, S., Masina, S., Coppini, G., and Pinardi, N.: Mediterranean Sea Physical Reanalysis (CMEMS MED-Currents) (Version 1), Copernicus Monitoring Environment Marine Service (CMEMS) [data set], 10.25423/CMCC/MEDSEA, 2020.
Escudier, R., Clementi, E., Cipollone, A., Pistoia, J., Drudi, M., Grandi, A., Lyubartsev, V., Lecci, R., Aydogdu, A., Delrosso, D., Omar, M., Masina, S., Coppini, G., and Pinardi, N.: A high resolution reanalysis for the Mediterranean Sea, Front. Earth Sci., 9, 2296–6463, https://doi.org/10.3389/feart.2021.702285, 2021.
Fairall, C. W., Bradley, E. F., Rogers, D. P., Edson, J. B., and Young, G. S.: Bulk parameterization of air-sea fluxes for tropical ocean-global atmosphere coupled-ocean atmosphere response experiment, J. Geophys. Res., 101, 3747–3764, https://doi.org/10.1029/95JC03205, 1996.
Gačić, M., Civitarese, G., Miserocchi, S., Cardin, V., Crise, A., and Mauri, E.: The open-ocean convection in the Southern Adriatic: A controlling mechanism of the spring phytoplankton bloom, Cont. Shelf Res., 22, 1897–1908, https://doi.org/10.1016/S0278-4343(02)00050-X, 2002.
Gačić, M., Borzelli, G. E., Civitarese, G., Cardin, V., and Yari, S.: Can internal processes sustain reversals of the ocean upper circulation? The Ionian Sea example, Geophys. Res. Lett., 37, L09608, https://doi.org/10.1029/2010GL043216, 2010.
Garcia-Quintana, Y., Grivault, N., Hu, X., and Myers, P. G.: Dense water formation on the Icelandic shelf and its contribution to the North Icelandic Jet, J. Geophys. Res.-Ocean., 126, e2020JC016951, https://doi.org/10.1029/2020JC016951, 2021
Gohm, A., Mayr, G. J., Fix, A., and Giez, A.: On the onset of bora and the formation of rotors and jumps near a mountain gap, Q. J. Roy. Meteorol. Soc., 134, 21–46, https://doi.org/10.1002/qj.206, 2008.
Grisogono, B. and Belušić, D.: A review of recent advances in understanding the meso- and microscale properties of the severe Bora wind, Tellus A, 61, 1–16, 2009.
Grubišíć, V.: Bora-driven potential vorticity banners over the Adriatic, Q. J. Roy. Meteorol. Soc., 130, 2571–2603, https://doi.org/10.1256/qj.03.71, 2004.
Heggelund, Y., Vikebø, F., Berntsen, J., and Furnes, G.: Hydrostatic and non-hydrostatic studies of gravitational adjustment over a slope, Cont. Shelf Res., 24, 2133–2148, https://doi.org/10.1016/j.csr.2004.07.005, 2004.
Hersbach, H., Bell, B., Berrisford, P., Hirahara, S., Horányi, A., Muñoz-Sabater, J., Nicolas, J., Peubey, C., Radu, R., Schepers, D., Simmons, A., Soci, C., Abdalia, S., Abellan, X., Balsamo, G., Bechtold, P., Biavati, G., Bidlot, J., Bonavita, M., De Chiara, G., Dahlgren, P., Dee, D., Diamantakis, M., Dragani, R., Flemming, J., Forbes, R., Fuentes, M., Geer, A., Haimberger, L., Healy, S., Hogan, R. J., Holm, E., Janiskova, M., Keeley, S., Laloyaux, P., Lopez, P., Lupu, C., Radnoti, G., de Rosnay, P., Rozum, I., Vamborg, F., Villaume, S., and Thepaut, J.-N.: The ERA5 Global Reanalysis, Q. J. Roy. Meteorol. Soc., 146, 1999–2049, https://doi.org/10.1002/qj.3803, 2020.
Horvath, K., Ivatek-Šahdan, S., Ivančan-Picek, B., and Grubišić, V.: Evolution and structure of two severe cyclonic bora events: Contrast between the northern and southern Adriatic, Weather Forecast., 24, 946–964, https://doi.org/10.1175/2009WAF2222174.1, 2009.
Iermano, I., Moore, A. M., and Zambianchi, E.: Impacts of a 4-dimensional variational data assimilation in a coastal ocean model of southern Tyrrhenian Sea, J. Mar. Syst., 154, 157–171, https://doi.org/10.1016/j.jmarsys.2015.09.006, 2015.
Ivanov, V. V., Shapiro, G. I., Huthnance, J. M., Aleynik, D. L., and Golovin, P. N.: Cascades of dense water around the world ocean, Prog. Oceanogr., 60, 47–98, https://doi.org/10.1016/j.pocean.2003.12.002, 2004.
Janeković, I., Powell, B. S., McManus, M. A., and Sevadjian, J.: 4D-Var data assimilation in a nested, coastal ocean model: A Hawaiian case study, J. Geophys. Res.-Ocean., 118, 5022–5035, https://doi.org/10.1002/jgrc.20389, 2013.
Janeković, I., Mihanović, H., Vilibić, I., and Tudor, M.: Extreme cooling and dense water formation estimates in open and coastal regions of the Adriatic Sea during the winter of 2012, J. Geophys. Res.-Ocean., 119, 3200–3218, https://doi.org/10.1002/ 2014JC009865, 2014.
Janeković, I., Mihanović, H., Vilibić, I., Grčić, B., Ivatek-Šahdan, S., Tudor, M., and Djakovac, T.: Using multi-platform 4D-Var data assimilation to improve modeling of Adriatic Sea dynamics, Ocean Model., 146, 1463–5003, https://doi.org/10.1016/j.ocemod.2019.101538, 2020.
Jasprica, N., Čalić, M., Kovačević, V., Bensi, M., Radić, I. D., Garić, R., and Batistić, M.: Phytoplankton distribution related to different winter conditions in 2016 and 2017 in the open southern Adriatic Sea (eastern Mediterranean), J. Mar. Syst., 226, 103665, https://doi.org/10.1016/j.jmarsys.2021.103665, 2022.
Jiang, Q. and Doyle, J. D.: Wave breaking induced surface wakes and jets observed during a bora event, Geophys. Res. Lett., 32, L17807, https://doi.org/10.1029/2005GL022398, 2005.
Klemp, J. B. and Durran, D. R.: Numerical modelling of bora winds, Meteorol. Atmos. Phys., 36, 215–227, https://doi.org/10.1007/BF0104515, 1987.
Kokkini, Z., Mauri, E., Gerin, R., Poulain, P. M., Simoncelli, S., and Notarstefano, G.: On the salinity structure in the South Adriatic as derived from float and glider observations in 2013–2016, Deep-Sea Res. Pt. II, 171, 104625, https://doi.org/10.1016/j.dsr2.2019.07.013, 2020.
Kurkin, A., Kurkina, O., Rybin, A., and Talipova, T.: Comparative analysis of the first baroclinic Rossby radius in the Baltic, Black, Okhotsk, and Mediterranean seas, Russ. J. Earth Sci., 20, ES4008, https://doi.org/10.2205/2020ES000737, 2020.
Kuzmić, M., Grisogono, B., Li, X., and Lehner, S.: Examining deep and shallow Adriatic bora events, Q. J. Roy. Meteorol. Soc., 141, 3434–3438, https://doi.org/10.1002/qj.2578, 2015.
Leredde, Y., Denamiel, C., Brambilla, E., Lauer-Leredde, C., Bouchette, F., and Marsaleix, P.: Hydrodynamics in the Gulf of Aigues-Mortes, NW Mediterranean Sea: In situ and modelling data, Cont. Shelf Res., 27, 2389–2406, https://doi.org/10.1016/j.csr.2007.06.006, 2007.
Levitus, S. and Boyer, T. P.: World Ocean Atlas 1994, Volume 4: Temperature, NOAA Atlas NESDIS 4, US Dept. of Commerce, https://repository.library.noaa.gov/view/noaa/1381 (last access: 26 April 2023), 1994a.
Levitus, S., Burgett, R., and Boyer, T. P.: World Ocean Atlas 1994, Vol. 3, Salinity, NOAA Atlas NESDIS 3, US Dept. Commerce, https://repository.library.noaa.gov/view/noaa/1382 (last access: 26 April 2023), 1994b.
Ličer, M., Smerkol1, P., Fettich, A., Ravdas, M., Papapostolou, A., Mantziafou, A., Strajnar, B., Cedilnik, J., Jeromel, M., Jerman, J., Petan, S., Malačič, V., and Sofianos, S.: Modeling the ocean and atmosphere during an extreme bora event in northern Adriatic using one-way and two-way atmosphere–ocean coupling, Ocean Sci., 12, 71–86, https://doi.org/10.5194/os-12-71-2016, 2016.
Madec, G., Bourdallé-Badie, R., Bouttier, P.-A., Bricaud, C., Bruciaferri, D., Calvert, D., Chanut, J., Clementi, E., Coward, A., Delrosso, D., Ethe, C., Flavoni, S., Graham, T., Harle, J., Iovino, D., Lea, D., Levy, C., Lovato, T., Martin, N., Masson, S., Mocavero, S., Paul, J., Rousset, C., Storkey, D., Storto, A., and Vancoppenolle, M.: NEMO Ocean Engine, Paris, France: Notes du Pôle de modélisation de l'Institut Pierre-Simon Laplace (IPSL), Zenodo, https://doi.org/10.5281/zenodo.1472492, 2017.
Marini, M., Russo, A., Paschini, E., Grilli, F., and Campanelli, A.: Short-term physical and chemical variations in the bottom water of middle Adriatic depressions, Clim. Res., 31, 227–237, 2006.
Mihanović, H., Janeković, I., Vilibić, I., Bensi, M., and Kovačević, V.: Modelling interannual changes in dense water formation on the northern Adriatic Shelf, Pure Appl. Geophys., 175, 4065–4081, https://doi.org/10.1007/s00024-018-1935-5, 2018.
Oddo, P. and Guarnieri, A.: A study of the hydrographic conditions in the Adriatic Sea from numerical modelling and direct observations (2000–2008), Ocean Sci., 7, 549–567, https://doi.org/10.5194/os-7-549-2011, 2011.
Oddo, P., Pinardi, N., Zavatarelli, M., and Coluccelli, A.: The Adriatic basin forecasting system, Acta Adriat., 47, 169–184, 2006.
Orlić, M., Dadić, V., Grbec, B., Leder, N., Marki, A., Matić, F., Mihanović, H., Beg Paklar, G., Pasarić, M., Pasarić, Z., and Vilibić, I.: Wintertime buoyancy forcing, changing seawater properties and two different circulation systems produced in the Adriatic, J. Geophys. Res.-Ocean., 112, C03S07, https://doi.org/10.1029/2005JC003271, 2007.
Pranić, P.: Multi-model analysis of the adriatic dense water dynamics, OSF [data set], https://osf.io/9jvk3/ (last access: 26 April 2023), 2022.
Pranić, P., Denamiel, C., and Vilibić, I.: Performance of the Adriatic Sea and Coast (AdriSC) climate component – a COAWST V3.3-based one-way coupled atmosphere–ocean modelling suite: ocean results, Geosci. Model Dev., 14, 5927–5955, https://doi.org/10.5194/gmd-14-5927-2021, 2021.
Pullen, J., Doyle, J. D., Haack, T., Dorman, C., Signell, R. P., and Lee, C. M.: Bora event variability and the role of air-sea feedback, J. Geophys. Res.-Ocean., 112, C03S18, https://doi.org/10.1029/2006JC003726, 2007.
Querin, S., Bensi, M., Cardin, V., Solidoro, C., Bacer, S., Mariotti, L., Stel, F., and Malačič, V.: Saw-tooth modulation of the deep-water thermohaline properties in the southern Adriatic Sea, J. Geophys. Res.-Ocean., 121, 4585–4600, https://doi.org/10.1002/2015JC011522, 2016.
Raicich, F.: Notes on the flow rates of the Adriatic rivers, Technical Report RF 02/94, CNR, Istituto sperimentale talassografico, Trieste, Italy, 8 pp., 1994.
Ricchi, A., Miglietta, M. M., Falco, P. P., Benetazzo, A., Bonaldo, D., Bergamasco, A., Sclavo, M., and Carniel, S.: On the use of a coupled ocean–atmosphere–wave model during an extreme cold air outbreak over the Adriatic Sea, Atmos. Res., 172/173, 48–65, https://doi.org/10.1016/j.atmosres.2015.12.023, 2016.
Rubino, A., Romanenkov, D., Zanchettin, D., Cardin, V., Hainbucher, D., Bensi, M., Boldrin, A., Langone, L., Miserocchi, S., and Turchetto, M.: On the descent of dense water on a complex canyon system in the southern Adriatic basin, Cont. Shelf Res., 44, 20–29, https://doi.org/10.1016/j.csr.2010.11.009, 2012.
Shapiro, G. I. and Hill, A. E.: Dynamics of dense water cascade at the shelf edge, J. Phys. Oceanogr., 33, 390–406, https://doi.org/10.1175/1520-0485(1997)027<2381:DODWCA>2.0.CO;2, 1997.
Shapiro, G. I. and Hill, A. E.: The alternative density structures of cold/saltwater pools on a sloping bottom: The role of friction, J. Phys. Oceanogr., 27, 2381–2394, https://doi.org/10.1175/1520-0485(2003)033<0390:TADSOC>2.0.CO;2, 2003.
Shapiro, G. I., Huthnance, J. M., and Ivanov, V. V. L.: Dense water cascading off the continental shelf, J. Geophys. Res., 108, 3390, https://doi.org/10.1029/2002JC001610, 2003.
Shchepetkin, A. F. and McWilliams, J. C.: The regional oceanic modeling system: a split-explicit, free-surface, topography-following coordinate ocean model, Ocean Model., 9, 347–404, https://doi.org/10.1016/j.ocemod.2004.08.002, 2005.
Shchepetkin, A. F. and McWilliams, J. C.: Correction and commentary for “Ocean forecasting in terrain-following coordinates: Formulation and skill assessment of the regional ocean modeling system” by Haidvogel et al., J. Comput. Phys. 227, pp. 3595–3624, J. Comp. Phys., 228, 8985–9000, https://doi.org/10.1016/j.jcp.2009.09.002, 2009.
Signell, R. P., Chiggiato, J., Horstmann, J., Doyle, J. D., Pullen, J., and Askari, F.: High-resolution mapping of Bora winds in the northern Adriatic Sea using synthetic aperture radar, J. Geophys. Res., 115, C04020, https://doi.org/10.1029/2009JC005524, 2010.
Simoncelli, S., Masina, S., Axell, L., Liu, Y., Salon, S., Cossarini, G., Bertino, L., Xie, J., Samuelsen, A., Levier, B., Reffray, G., O'Dea, E., McEwan, R., and Kristiansen, T.: MyOcean regional reanalyses: overview of reanalyses systems and main results, Mercator Ocean J. 54: Special issue on main outcomes of the MyOcean2 and MyOcean follow-on projects, https://www.mercator-ocean.fr/wp-content/uploads/2016/03/JournalMO-54.pdf (last access: 24 February 2023), 2016.
Simoncelli, S., Fratianni, C., Pinardi, N., Grandi, A., Drudi, M., Oddo, P., and Dobricic, S.: Mediterranean Sea Physical Reanalysis (CMEMS MED-Physics) (Version 1), Copernicus Monitoring Environment Marine Service (CMEMS) [data set], https://www.cmcc.it/mediterranean-sea-physical-reanalysis-cmems-med-physics (last access: 12 May 2023), 2019.
Skamarock, W. C., Klemp, J. B., Dudhia, J., Gill, D. O., Barker, D. M., Wang, W., and Powers, J. G.: A description of the Advanced Research WRF Version 2, NCAR Technical Note NCAR/TN468 + STR, https://doi.org/10.5065/D6DZ069T, 2005.
Smith, R. B.: Aerial observations of the Yugoslavian Bora, J. Atmos. Sci., 44, 269–297, 1987.
Sperrevik, A. K., Röhrs, J., and Christensen, K. H.: Impact of data assimilation on Eulerian versus Lagrangian estimates of upper ocean transport, J. Geophys. Res.-Ocean., 122, 5445–5457, https://doi.org/10.1002/2016JC012640, 2017.
Stiperski, I., Ivančan-Picek, B., Grubišić, V., and Bajić, A.: Complex bora flow in the lee of Southern Velebit, Q. J. Roy. Meteorol. Soc., 138, 1490–1506, https://doi.org/10.1002/qj.1901, 2021.
Taylor, K.: Summarizing multiple aspects of model performance in a single diagram, J. Geophys. Res., 106, 7183–7192, https://doi.org/10.1029/2000JD900719, 2001.
Thorne, P. W. and Vose, R. S.: Reanalyses suitable for characterizing long-term trends, Bull. Am. Meteorol. Soc., 91, 353–361, https://doi.org/10.1175/2009bams2858.1, 2010.
Tojčić, I., Denamiel, C., and Vilibić, I.: Kilometer-scale trends and variability of the Adriatic present climate (1987–2017), Clim. Dynam., https://doi.org/10.1007/s00382-023-06700-2, 2023.
Tudor, M., Ivatek-Šahdan, S., Stanešić, A., Horvath, K., and Bajić, A.: Forecasting weather in Croatia using ALADIN numerical weather prediction model, in: Climate Change and Regional/Local Responses, edited by: Zhang, Y. and Ray, P., InTech, Rijeka, Croatia, 59–88, https://doi.org/10.5772/55698, 2013.
Tudor, M., Stanešić, A., Ivatek-Šahdan, S., Hrastinski, M., Odak Plenković, I., Horvath, K., Bajić, A., and Kovačić, T.: Operational validation and verification of ALADIN forecast in meteorological and hydrological service of Croatia, Croat. Meteorol. J., 50, 47–70, 2015.
Vested, H. J., Berg, P., and Uhrenholdt, T.: Dense water formation in the northern Adriatic, J. Mar. Syst., 18, 135–160, https://doi.org/10.1016/S0924-7963(98)00009-8, 1998.
Vilibić, I.: Evaluation of the AdriSC Climate Component: Ocean Results, Zenodo [dataset], https://doi.org/10.5281/zenodo.5707773, 2021.
Vilibić, I. and Mihanović, H.: Observing the bottom density current over a shelf using an Argo profiling float, Geophys. Res. Lett., 40, 910–915, https://doi.org/10.1002/grl.50215, 2013.
Vilibić, I., Mihanović, H., Janeković, I., and Šepić, J.: Modelling the formation of dense water in the northern Adriatic: sensitivity studies, Ocean Model., 101, 17–29, https://doi.org/10.1016/j.ocemod.2016.03.001, 2016.
Vilibić, I., Mihanović, H., Janeković, I., Denamiel, C., Poulain, P.-M., Orlić, M., Dunić, N., Dadić, V., Pasarić, M., Muslim, S., Gerin, R., Matić, F., Šepić, J., Mauri, E., Kokkini, Z., Tudor, M., Kovač, Ž., and Džoić, T.: Wintertime dynamics in the coastal north-eastern Adriatic Sea: the NAdEx 2015 experiment, Ocean Sci., 14, 237–258, https://doi.org/10.5194/os-14-237-2018, 2018.
Vodopivec, M., Zaimi, K., and Peliz, Á., J.: The freshwater balance of the Adriatic Sea: A sensitivity study, J. Geophys. Res.-Ocean., 127, e2022JC018870, https://doi.org/10.1029/2022JC018870, 2022.
Yaremchuk, M., Martin, P., Koch, A., and Beattie, C.: Comparison of the adjoint and adjoint-free 4dVar assimilation of the hydrographic and velocity observations in the Adriatic Sea, Ocean Model., 97, 129–140, https://doi.org/10.1016/j.ocemod.2015.10.010, 2016.
Wahlin, A. K.: Topographic steering of dense currents with application to submarine canyons, Deep-Sea Res. Pt. I, 49, 305–320, https://doi.org/10.1016/S0967-0637(01)00058-9, 2002.
Wahlin, A. K.: Downward channeling of dense water in topographic corrugations, Deep-Sea Res. Pt. I, 51, 577–590, https://doi.org/10.1016/j.dsr.2003.11.002, 2004.
Warner, J. C., Armstrong, B., He, R., and Zambon, J. B.: Development of a Coupled Ocean–Atmosphere–Wave–Sediment Transport (COAWST) Modeling System, Ocean Model., 35, 230–244, https://doi.org/10.1016/j.ocemod.2010.07.010, 2010.
Weatherall, P., Marks, K. M., Jakobsson, M., Schmitt, T., Tani, S., Arndt, J. E., Rovere, M., Chayes, D., Ferrini, V., and Wigley, R.: A new digital bathymetric model of the world's oceans, Earth Space Sci., 2, 331–345, https://doi.org/10.1002/2015EA000107, 2015.
Zavatarelli, M., Pinardi, N., Kourafalou, V. H., and Maggiore, A.: Diagnostic and prognostic model studies of the Adriatic Sea general circulation: Seasonal variability, J. Geophys. Res., 107, 3004, https://doi.org/10.1029/2000JC000210, 2002.
Zore-Armanda, M.: Les masses d'eau de la mer Adriatique, Acta Adriat., 10, 5–88, 1963.