the Creative Commons Attribution 4.0 License.
the Creative Commons Attribution 4.0 License.
 | 17 Apr 2023
Intraseasonal variability of the South Vietnam upwelling, South China Sea: influence of atmospheric forcing and ocean intrinsic variability
Thai To Duy
Claude Estournel
The South Vietnam upwelling (SVU) develops off the Vietnamese coast (South China Sea, SCS) during the southwest summer monsoon over four main areas: the northern coastal upwelling (NCU), the southern coastal upwelling (SCU), the offshore upwelling (OFU) and the shelf off the Mekong River mouth (MKU). An ensemble of 10 simulations with perturbed initial conditions were run with the fine-resolution SYMPHONIE model (1 km inshore) to investigate the daily to intraseasonal variability of the SVU and the influence of the ocean intrinsic variability (OIV) during the strong SVU of summer 2018.
The intraseasonal variability is similar for the SCU, MKU and OFU, driven to the first order by the wind variability. The MKU and SCU are induced by stable ocean dynamics (the northeastward then eastward boundary current) and have very little chaotic variability. The OIV has a stronger influence on OFU. In July, OFU mainly develops along the northern flank of the eastward jet. The influence of the OIV is strongest and related to the chaotic variability of the meridional position of the jet. In August, this position is stable and OFU develops mainly in the area of positive wind curl and cyclonic eddies north of the jet. The influence of the OIV, weaker than in July, is related to the organization of this mesoscale circulation. The NCU shows a behavior different from that observed in the other areas. In the heart of summer, a large-scale circulation formed by the eastward jet and eddy dipole is well established with an alongshore current preventing the NCU development. In early and late summer, this circulation is weaker, allowing a mesoscale circulation of strongly chaotic nature to develop in the NCU area. During those periods, the OIV influence on the NCU is very strong and related to the organization of this mesoscale circulation: the NCU is favored (annihilated) by offshore-oriented (alongshore) structures.
- Article
(10870 KB) - Full-text XML
- BibTeX
- EndNote


The summer general circulation in the central South China Sea (SCS) is largely induced by the prevailing southwest monsoon winds (Wang et al., 2004; Wyrtki et al., 1961). It is characterized by the development of an anticyclonic (AC) gyre in the south, a cyclonic (C) gyre in the north (forming an eddy dipole referred to as the ACC dipole) and the South Vietnam upwelling, hereafter referred to as the SVU, off the central Vietnamese coast that develops over four main areas. First, the convergence of two gyres creates an eastward jet departing from the southern part of the central coast of Vietnam between 11 and 12∘ N. This convergence gives rise to an Ekman current-induced coastal upwelling (Dippner et al., 2007; Chen et al., 2012), hereafter referred to as the SCU (southern coast upwelling). Second, Ekman pumping-induced upwelling (OFU hereafter) develops offshore in the area of strong positive wind and surface current vorticity (Liu et al., 2012; Da et al., 2019; Ngo and Hsin, 2021). Third, recent studies have revealed that northern coastal upwelling (NCU hereafter) can develop along the northern part of the central Vietnamese coast (Da et al., 2019; Ngo and Hsin, 2021; To Duy et al., 2022). Lastly, To Duy et al. (2022) showed for the first time that upwelling develops off the Mekong Delta behind the Con Dao islands (see Fig. 1b, MKU hereafter). The SVU participates in the nutrient enrichment of the surface layer, hence it plays an important role in the biological productivity and in the halieutic resources of the region (Bombar et al., 2010; Liu et al., 2012; Loick-Wilde et al., 2017; Lu et al., 2018; Loisel et al., 2017). Some authors also showed that the SVU may influence the functioning of local and regional climate (Xie et al., 2003; Zheng et al., 2016). It is therefore an important issue to understand precisely the functioning and variability of the SVU and its response to long-term changes.

Figure 1(a) Characteristics of the orthogonal curvilinear computational grid (black lines, not all the mesh points are shown for visibility purposes) and bathymetry (colors, meter, GEBCO_2014) used for the VNC configuration of the SYMPHONIE model. Dots show the location of rivers for which we used daily (red), monthly (blue) and yearly climatology (green) discharge values (see To Duy et al., 2022 for more details). (b) Bathymetry (meter) over the SVU region. The four boxes used for the study of the SVU are displayed in yellow; boxTref is highlighted in blue. (c, d) Sea surface temperature (SST, ∘C) averaged over JJAS 2018 computed from the SYMPHONIE ensemble average (c) and from OSTIA reanalysis (d).
The interannual variability of the SVU has been investigated in numerous previous studies. In the SCU, OFU and MKU regions, the interannual variability of summer wind intensity is related to and in phase with the intensity of the summer monsoon, and it is the main driver of the interannual variability of upwelling intensity (Wang et al., 2006; Chen et al., 2014; Li et al., 2014; Da et al., 2019; Ngo and Hsin, 2021; To Duy et al., 2022). El Niño–Southern Oscillation (ENSO) also impacts the upwelling in those regions due to its influence on summer monsoon wind (Wang et al., 2006; Kuo et al., 2004; Loick-Wilde et al., 2017; Da et al., 2019). Some studies (Li et al., 2014; Da et al., 2019) then revealed that ocean intrinsic variability (OIV) influences the interannual variability of the eastward jet and of the OFU. The OIV, as opposed to the forced variability, corresponds to the unpredictable part of ocean variability, not induced by the variability of external forcing factors but by the chaotic behavior of ocean dynamics. Most studies have shown that mesoscale to submesoscale structures are a major source of the OIV (Penduff et al., 201; Sérazin et al., 2016; Waldman et al., 2018; Da et al., 2019). This influence of the OIV is related to the spatial distribution of summer-averaged surface current vorticity associated with eddies: cyclonic (anticyclonic) eddies located in the area of positive wind stress curl enhance (weaken) the Ekman pumping-induced OFU. The interannual variability of the NCU shows a completely different behavior. Ngo and Hsin (2021) and To Duy et al. (2022) concluded that wind conditions favorable to the SCU, MKU and OFU regions were unfavorable to the NCU and vice versa. To Duy et al. (2022) further showed that the influence of wind is weaker for the NCU than for the other areas. In contrast, the influence of circulation, in particular of the spatial organization of the chaotic submesoscale to mesoscale circulation that prevails over the area, was found to be stronger: on a seasonal average, the NCU is inhibited when alongshore currents prevail and enhanced when offshore circulation prevails.
The daily to intraseasonal variability of the SVU was much less studied. Available studies, all based on satellite data, focused on the SCU and OFU. Xie et al. (2007) showed that the upwelling in those areas does not develop smoothly during the summer but shows a strong intraseasonal variability related to the wind variability and Madden–Julian Oscillation (MJO). They suggested that the SVU experiences two to four events of development and decay during the summer, in response to the wind fluctuations. Isoguchi and Kawamura (2006) and Liu et al. (2012) confirmed respectively for the period 2000–2002 and the summer of 2007, that the MJO is a strong driver of the events of southwesterly wind intensification within the season and of the resulting upwelling. They further revealed the effect of tropical storms that can reinforce the southwesterly wind, hence the SVU.
To better understand the functioning and variability of the SVU, it is therefore necessary to investigate in detail the functioning of its daily to intraseasonal variability over its four areas of development (SCU, NCU, OFU and MKU) and to identify the driving factors. Previous studies mentioned above revealed the role of wind for the SCU and OFU, which should be examined for the other areas. The role of the OIV in the interannual variability of the upwelling, related to mesoscale circulation and eddies in the coastal and offshore area, was highlighted for the OFU and suggested for the NCU. It should be examined at the intraseasonal scale and requires an ensemblist approach as used by Waldman et al. (2017a, 2018). Chen et al. (2012) also showed from idealized simulations that tides and river plumes could be involved in the SVU variability; however, to our knowledge, only very few models used for the SVU study included the effect of tides, and none of them investigated their impact.
The present paper focuses on the daily to intraseasonal variability of the SVU over its four areas of development, examining in particular the role of atmospheric forcing, specifically wind, and the role of ocean dynamics and their intrinsic variability. The effect of tides and rivers will be examined in a future study. A fine-resolution realistic model including tides that is already presented and evaluated in To Duy et al. (2022) for the period 2009–2018 is used. Ensemble simulations with perturbed initial conditions are performed to study the summer of 2018 case, which was an exceptionally strong summer of upwelling for the SCU, OFU and MKU (Ngo and Hsin, 2021; To Duy et al., 2022).
The fine-resolution model and ensemble simulations and the definition of study areas, upwelling indicators and OIV indicators are presented in Sect. 2. The intraseasonal variability of the oceanic circulation and of the SVU, including the role of the OIV, are examined respectively in Sect. 3 and Sect. 4. Results are summarized and future work is discussed in Sect. 5.
2.1 The 3-D hydrodynamical ocean model SYMPHONIE
To Duy et al. (2022) built a fine-resolution configuration of the 3-D ocean circulation model SYMPHONIE (Marsaleix et al., 2008, 2019) over the Vietnam coastal region (VNC hereafter for VietNam Coast), based on a horizontal polar grid with a resolution decreasing linearly seaward, from 1 km at the Vietnamese coast to 4.5 km offshore and with 50 vertical levels. They used the GEBCO_2014 dataset released in April 2015 at a 30 s interval (∼ 0.9 km) and available from https://www.gebco.net, last access: 7 April 2023. We use exactly the same configuration here and show the VNC domain in Fig. 1a–b. The atmospheric forcing is computed from the 3-hourly output of the European Center for Medium-Range Weather Forecasts (ECMWF) ∘ atmospheric analysis, distributed on http://www.ecmwf.int, last access: 7 April 2023. Initial and lateral ocean boundary conditions are prescribed from the daily outputs of the global ocean ∘ analysis PSY4QV3R1 distributed by the Copernicus Marine and Environment Monitoring Service (CMEMS) on http://marine.copernicus.eu, last access: 7 April 2023. The implementation of tides follows Pairaud et al. (2008, 2010) and considers the nine main tidal harmonics provided by the 2014 release of the Finite Element Solution (FES) global tidal model (Lyard et al., 2006). Freshwater discharge is provided for 36 river mouths. More details about the model, its configuration and the forcings are provided in To Duy et al. (2022). They performed and evaluated a 10-year simulation over the period 2009–2018, hereafter called LONG, showing that it reproduces realistically the temporal (seasonal to interannual) and spatial variability of the SCS ocean dynamics and water masses. In the LONG simulation, a very strong SVU developed during the summer of 2018, particularly due to strong July–August northeastward wind (To Duy et al., 2022).
2.2 Ensemble simulations
We performed an ensemble of 10 simulations with perturbed initial conditions between 1 January 2017 and 31 December 2018. For that, we used 10 different initial conditions for temperature, salinity, sea surface elevation and currents fields. Most of the OIV develops at mesoscale (Sérazin et al., 2015; Waldman et al., 2018), we therefore only perturbed the mesoscale field following the same methodology as Waldman et al. (2017a, b, 2018). For the 10 simulations of the ensemble, the large-scale state of the initial field is identical, and the small-scale of the initial field state differs. The common large-scale state is equal to the large-scale state of 1 January 2017 of the LONG simulation, computed using a 100 km low-pass filter. For XX going from 9 to 18, the small-scale state of 1 January, 20XX of the LONG simulation is computed using a 100 km high-pass filter. The initial state of member XX of the simulation ensemble is then computed by adding this small-scale state to the common large-scale state.
2.3 Definition of upwelling areas
Figure 1c and d show the sea surface temperature (SST) averaged over June–September (JJAS) 2018 for the ensemble average and for OSTIA (Operational Sea Surface Temperature and Sea Ice Analysis) reanalysis outputs, available at https://podaac-tools.jpl.nasa.gov/drive/files/allData/ghrsst/data/L4/GLOB/UKMO/OSTIA, last access: 7 April 2023. Simulated SST is in good agreement with observations, showing a large area of colder surface water corresponding to the strong SVU that developed during the summer of 2018. In Fig. 1b–d, we show the four boxes used by To Duy et al. (2022) that correspond to the four main areas of the SVU development: boxSC and boxNC for the southern (SCU) and northern (NCU) coastal upwelling, respectively, boxOF for the offshore upwelling (OFU) and boxMK for the upwelling offshore the Mekong delta (MKU).
2.4 Indicators of upwelling intensity
We compute an SST-based index of upwelling intensity following exactly the same methodology as Da et al. (2019) and To Duy et al. (2022). The daily upwelling index UId is computed every day t at each point (x,y) of the study area that verifies SST() <To as
The reference temperature Tref=29.2 ∘C is computed as the SST averaged over JJAS and over boxTref, the area east of the upwelling region that is the least impacted by upwelling (see Fig. 1c–d), in the LONG simulation. The threshold temperature under which upwelling occurs, To=27.6 ∘C, is defined as the optimal upwelling threshold that covers the largest number of upwelling occurrences but avoids the inclusion of cold water that is horizontally advected between upwelling areas.
For each box boxN, the daily intensity of upwelling integrated over boxN is quantified at day t by the daily upwelling index UId,boxN, computed as
where AboxN is the size of boxN.
Lastly, to quantify the intensity of upwelling integrated over boxN and over the summer, we define the summer upwelling index UIJJAS,boxN , computed over JJAS as
where NDJJAS=122 d is the JJAS duration.
2.5 Indicators of OIV impact
Following Waldman et al. (2018), we introduce two indicators to quantify the contribution of the OIV on a given variable X: one at the daily scale and one at the average scale over a given period; X(t,i) at time t and for ensemble member i can be any time-dependent (space-dependent or not) variable characterizing the ocean circulation or upwelling intensity. In the following equation, σi is the ensemble standard deviation (that quantifies the time-dependent intrinsic variability), σt is the temporal standard deviation, mi is the ensemble average and mt is the temporal average.
We quantify the effect of the OIV at the daily scale by computing IVd,, the contribution of intrinsic variability to the total daily variability of X(t,i). For each day of JJAS 2018, it is computed as the ratio between the time-dependent intrinsic variability and the total temporal variability over JJAS 2018:
We quantify the contribution of the OIV at the average scale over a given period by computing the relative intrinsic variability of the temporal mean state of X over the period IVtm. For that, we compute the ratio between the ensemble standard deviation and the ensemble average of the temporal average of X(t,i):
To investigate the effect of the OIV on surface circulation and upwelling, we apply in the following those indicators on the upwelling indices (UId, UId,boxN and UIJJAS,boxN) and on the surface current vorticity.
Figure 2 shows the daily time series of wind stress and of UId,boxN for each upwelling area for each simulation and for the ensemble average, and of IVd (UId,boxN). The southwest summer monsoon wind blows from June–September over the SCS with three main peaks of strong northeastward winds during mid-June, beginning of mid-July and beginning of August, associated with three peaks of the OFU, SCU and MKU regions that will be examined in detail in Sect. 4 (see the daily time series of UId,boxN and wind stress averaged over boxOF, boxSC and boxMK, Fig. 2a, b and c). To study the development of upwelling and the ocean circulation over those areas, we define three periods that fully cover the OFU development (from a value of UId,boxOF = 0 to a maximum value): June (9–18 June, 10 d), July (28 June–18 July, 21 d) and August (1–13 August, 13 d), highlighted in blue in Fig. 2. The development of the OFU, SCU and MKU regions follows a similar chronology and the exact choice of each period did not modify our conclusions, as long as those periods cover the upwelling development and strong monsoon wind periods. For the sake of readability and simplicity, we therefore use the three periods defined above for the diagnostics used to study the OFU, SCU and MKU. For each period, Fig. 3a–d shows the maps of ensemble average of wind stress and wind stress curl, of surface current speed and surface current vorticity averaged over the period and the maps of relative intrinsic variability (IVtm) of surface current vorticity over the period. A high (low) value of IVtm of current vorticity indicates a strong (weak) OIV and a chaotic (stable) circulation. To quantify the strength of the eastward jet, we calculate the ensemble mean of the average surface current speed through the meridional transect at 109.9∘ E, between 9.5 and 12.2∘ N (red line in Fig. 3a) during the three periods.
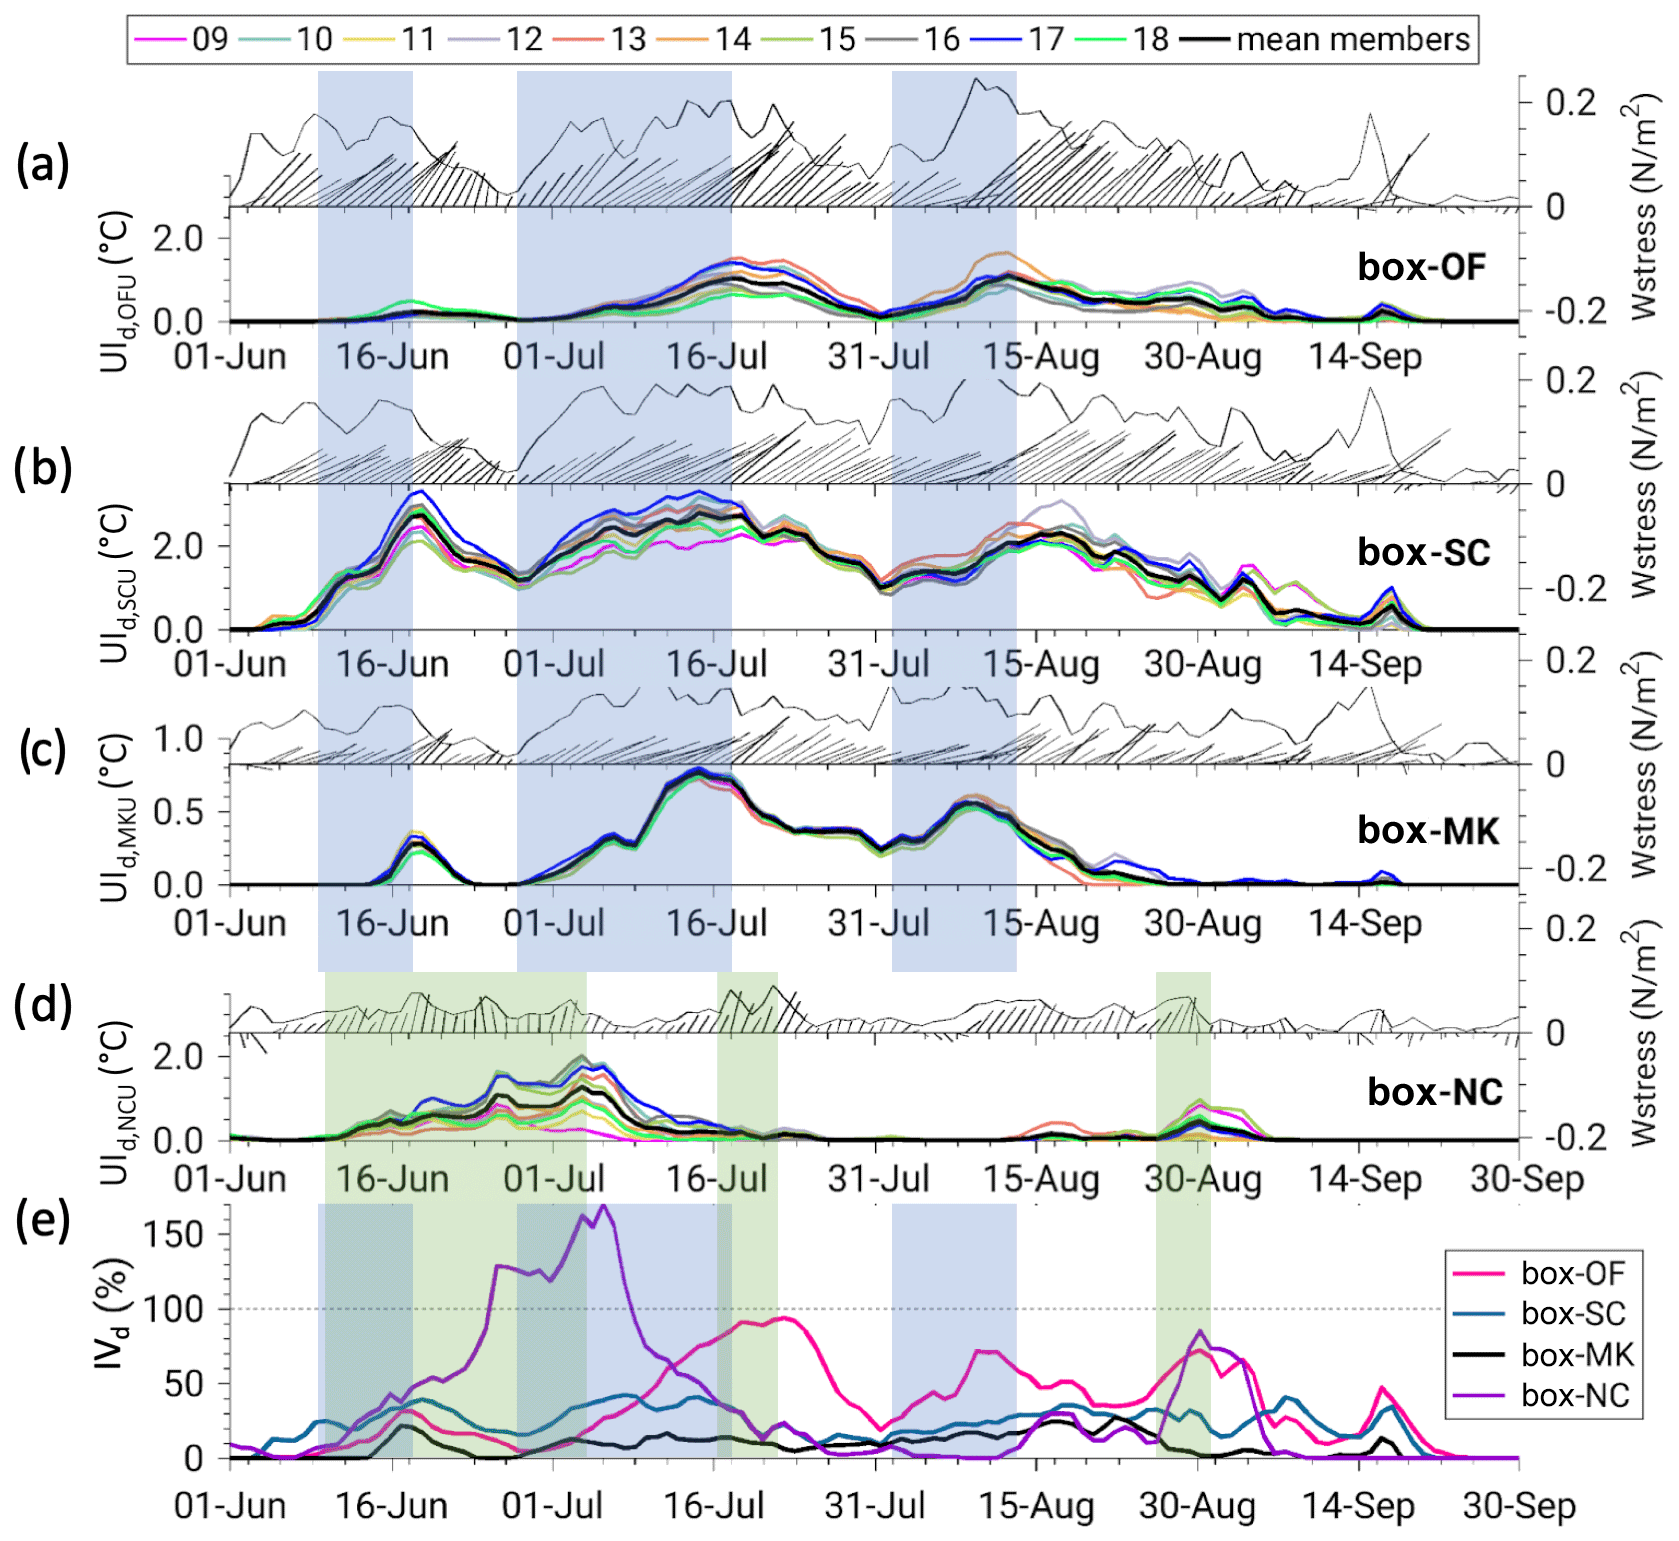
Figure 2(a, b, c, d) Daily time series between 1 June and 30 September 2018 of direction (arrows) and intensity (black line) of spatially averaged wind stress (N m−2) over each upwelling area, and time series of UId,boxN for each simulation (colored lines) and for the ensemble average (black thick line) for each upwelling area (a, boxSC; b, boxOF; c, boxMK; d, boxNC). (e) Daily time series of IVd(UId,boxN) for each upwelling area. Periods covering the OFU, SCU and MKU development are highlighted in blue. Periods used to study the MKU development are highlighted in green.
During the June period, the area of strong positive wind stress curl extends from the coast to ∼ 113∘ E, with a narrow meridional coverage (Fig. 3a). The ACC dipole is not clearly formed (Fig. 3b–c). The weak eastward jet is located in the south with a maximum speed of 0.5–0.7 m s−1 around 10–11∘ N, and a mean speed of 0.51 m s−1. The circulation is stable in the coastal jet area (IVtm of current vorticity < 50 %, Fig. 3d) but much more chaotic over most of the offshore area (IVtm>200 %). During the July period, the area of strong positive wind stress curl is larger than in June (from 10.5 to 13∘ N, extending to 112∘ E). The eastward jet strengthens, with a mean speed of 0.78 m s−1, and is more in the north, with a speed of about 0.8–1.1 m s−1 near 11–12∘ N. The ACC dipole, with an anticyclonic (cyclonic) circulation in the south (north), is more pronounced than in June. The circulation is more stable than in June in the coastal zone and in the cyclonic and anticyclonic areas (IVtm of current vorticity ∼ 100 %). It is less stable in the northeastern region of boxOF, where IVtm exceeds 200 %. During the August period, the area of strong positive wind stress curl has the largest meridional and zonal extent, to 114∘ E. The eastward jet is still stronger, with velocities reaching 1.2–1.5 m s−1 around 10.5–11.5∘ N and a mean speed of up to 0.88 m s−1. The ACC dipole is also stronger, with a well-established and large cyclonic gyre. The surface circulation is more stable compared to June and July, with a larger area of low IVtm of current vorticity (< 100 %) covering boxOF. In September, the summer monsoon and the large-scale jet and ACC circulation begin to weaken (not shown).
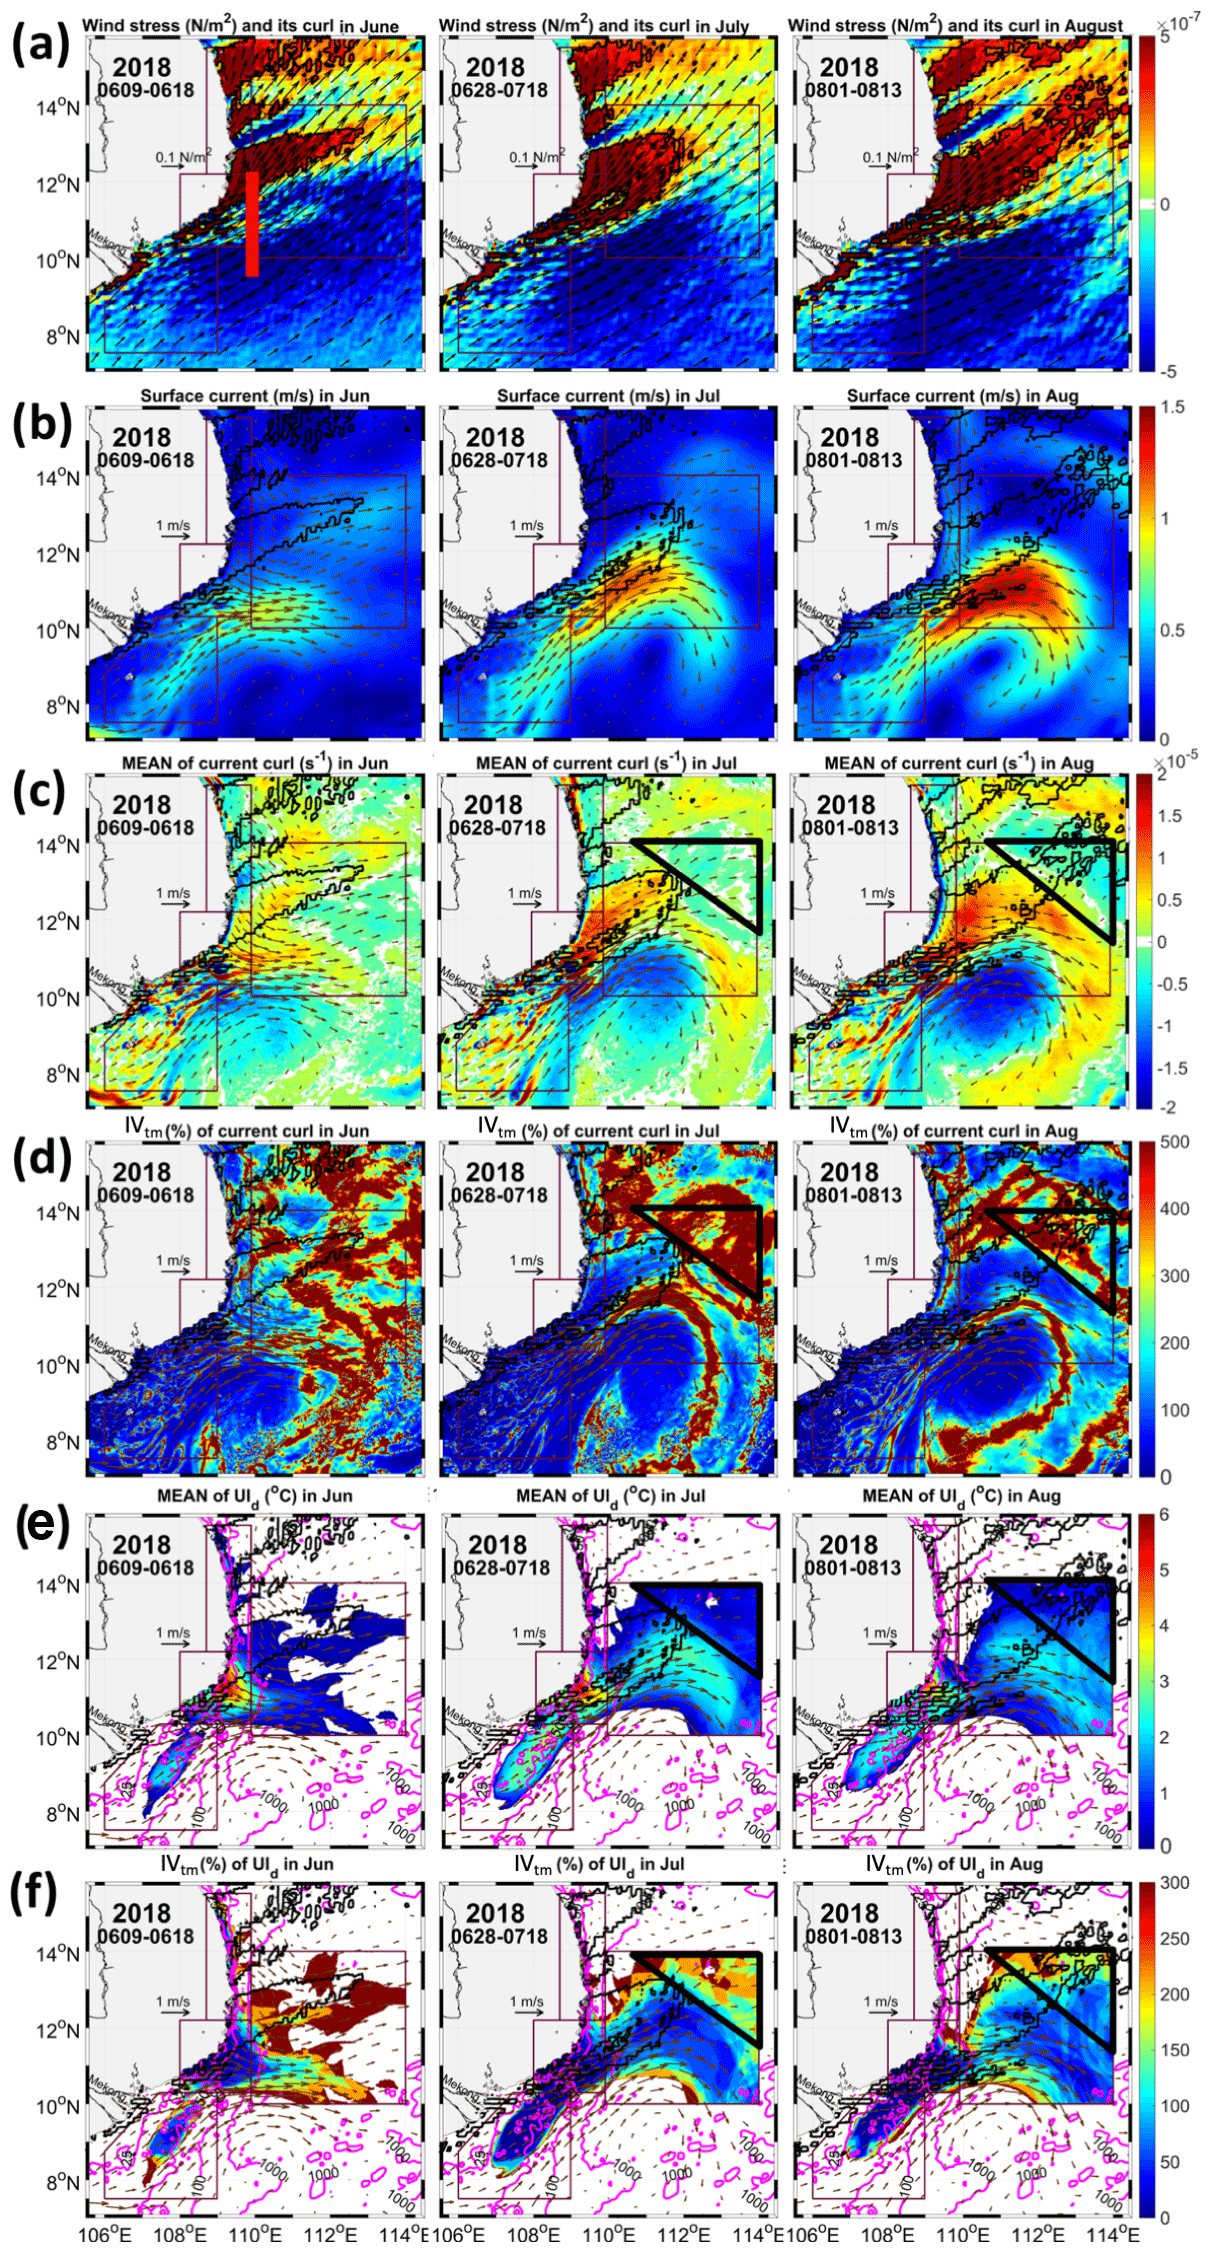
Figure 3Maps of ensemble average of average wind stress (a, arrows, N m−2) and wind stress curl (a, colors, N m−3), average surface current speed (b, m s−1), vorticity (c, s−1) and UId (e, ∘C) on the day of maximum UId,boxOF over each period of the OFU development highlighted in blue in Fig. 2 (left June, middle July and right August), and maps of relative intrinsic variability (IVtm) of average surface current vorticity (d, %) and UId (f, %) over each period. Black lines: 3.10−7 N m−3 iso-contours of average wind stress curl. Red segment (a): meridional transect at 109.9∘ E, 9.5–12.2∘ N used to compute the eastward jet strength. Arrows (b–f): average surface current during each period. Black triangles (c–f): area of large current vorticity north of the eastward jet during the July and August periods. Pink lines (e, f): isobaths (meters).
Here, we examine the upwelling intraseasonal variability and its intrinsic variability for each upwelling area. Table 1 shows the value of yearly upwelling index UIJJAS,boxN of the four areas for each member and for the ensemble average as well as its relative intrinsic variability IVtm (UIJJAS,boxN). It also shows the values of the correlation coefficients between the daily time series of the ensemble mean of UId,boxN and of the wind stress components and intensity. For each period defined in Sect. 3, Fig. 3e–f shows the maps of UId on the day of maximum UId,boxN over each period and the maps of its relative intrinsic variability IVtm (UId).
Table 1For each upwelling area: value of the yearly upwelling index UIJJAS,boxN for each member of the ensemble, of the ensemble mean mi(UIJJAS,boxN) and of IVtm(UIJJAS,boxN), and correlation coefficients between the daily times series of the ensemble mean of the daily upwelling index UId,boxN and of the wind stress eastward and northward components and intensity. Only correlations associated with p values < 0.01 are shown.

4.1 The southern coastal upwelling (SCU)
For SCU, UId,boxSC time series show a similar daily chronology for each member and for the ensemble mean (Fig. 2b). The SCU begins to develop during the first half of June, lasts during the whole summer with a strong intraseasonal variability and disappears during the first half of September. We obtain three peaks of similar intensity, near 19 June, 15 July and 16 August, in phase with the wind forcing over the area: the correlation between the time series of UId,boxSC and the daily averaged wind stress intensity over boxSC is equal to 0.64 (p<0.01, Table 1). The correlation with the wind stress eastward component, i.e., the component nearly parallel to the south coast, that favors the SCU, reaches 0.71 (p<0.01).
Over the summer, IVd (UId,boxSC) varies between 10 % when the SCU is weak and 40 % during periods of strong SCU, showing similar values for the three upwelling peaks (Fig. 2e). The yearly upwelling index UIJJAS,boxSC shows a weak ensemble standard deviation (7 % relative to the mean, Table 1). This intrinsic variability of the SCU summer strength is much weaker than its interannual variability: in the 2009–2018 LONG simulation analyzed by To Duy et al. (2022), UIJJAS,boxSC shows a 53 % interannual standard deviation relative to its interannual mean. The SCU develops in the same area for the 10 members, in the coastal zone of the ACC dipole convergence, as shown by the very low values of IVtm (UId) (< 50 %) over this area (Fig. 3e–f). Higher IVtm (UId) values are obtained at the periphery of this area, along the northern and southern flanks of the eastward jet. They are related to the variability of the meridional position of the jet: a jet located further north (south) induces an SCU further north (south).
The SCU daily to intraseasonal variability is therefore mostly driven by the wind. The OIV is mainly related to the meridional position of the jet which does not vary much, thus affecting the SCU to second order at the intraseasonal scale.
4.2 The Mekong delta shelf upwelling (MKU)
For the MKU, time series of UId,boxMK are almost identical for each member and for the ensemble mean (Fig. 2c). They also show a strong intraseasonal variability, with three peaks of varying intensity following the three wind peaks. The July peak is the strongest, followed by the August peak then the June peak. The daily chronology of MKU also strongly follows the wind chronology, with a correlation of 0.65 (p<0.01) with the wind stress intensity averaged over the MKU and of 0.59 (0.61) with the wind stress eastward (northward) component (Table 1).
The MKU is very weakly influenced by the OIV: IVd (UIJJAS,boxMK) never exceeds 30 % (Fig. 2e) and IVtm (UIJJAS,boxMK) is equal to 6 % (Table 1). Again, this intrinsic variability of the MKU summer strength is negligible compared to its interannual variability: the interannual standard deviation of UIJJAS,boxMK is equal to 85 % in the LONG simulation (To Duy et al., 2022). Spatially, the MKU is also very stable. As shown by To Duy et al. (2022), it develops along the northeastward current, behind the Con Dao islands (Figs. 1, 3e). For the three periods of the MKU development, Fig. 3d–f shows very weak values of IVtm, for both the surface current vorticity and the spatial upwelling index. The circulation is therefore very stable in this area, explaining the spatial stability of the MKU.
The daily chronology and intensity of the MKU are thus mainly driven by the wind, and its position is determined by non-varying factors, presumably bathymetry, that still need to be investigated, and not by chaotic factors like (sub)mesoscale circulation. As a result, the MKU is almost unaffected by the OIV.
4.3 The offshore upwelling (OFU)
Again, the daily chronology of the OFU is very similar for the 10 members and the ensemble mean (Fig. 2a), and it is in phase with the wind chronology (correlation of 0.65, p<0.01 with the daily wind stress intensity over boxOF, Table 1). However, contrary to the SCU, the intensity of the OFU peaks varies throughout the season, though wind stress intensity is similar during those peaks. We obtain two strong peaks (∼ 1.0 ∘C) in the heart of summer on 19 July and 13 August, a moderate peak (∼ 0.6 ∘C) at the end of August and two small peaks (∼ 0.2 ∘C) at the beginning and end of summer, on 18 June and 16 September. IVd (UId,boxOF) also varies a lot seasonally, and is maximum and much stronger than for the SCU and MKU during the OFU peaks (Fig. 2e): it reaches 90 % for the July peak, 70 % during the August peaks and 30 % and 50 % during the small June and September peaks, respectively. On the summer average, IVtm (UIJJAS,boxOF) is equal to 18 % (Table 1), again stronger than for the SCU and MKU but still much lower than the interannual variability (126 %, To Duy et al., 2022). The regional daily wind stress therefore drives the daily to intraseasonal variability of the OFU at the first order. However, the OIV also significantly influences this daily variability, and this influence varies intraseasonally.
To understand the mechanisms that explain the intraseasonal variability of OFU intensity, we examine its functioning during its three main periods of OFU development (June, July and August, highlighted in blue in Fig. 2). Da et al. (2019) and To Duy et al. (2022) showed that the OFU is mainly induced by Ekman pumping and develops in the area of strong positive wind stress curl and current vorticity. The eastward jet and ACC dipole that favor the development of the OFU are much stronger and well established in the heart of summer than at the beginning and end of the summer monsoon (Fig. 3b, c and Part 3). Northeastward wind intensity is stronger in July and August than in June and September (Fig. 2) with a larger area of positive wind curl (Fig. 3a). Moreover, positive current vorticity developing in boxOF in the area of positive wind curl is much stronger in July and August, which further enhances Ekman pumping (Fig. 3e). The intraseasonal variability of OFU peaks is thus explained by the intraseasonal variability of wind and large-scale circulation.
We then examine the mechanisms that explain why the July and August peaks show different intrinsic variability but similar ensemble mean of OFU intensity (Fig. 2a). Figure 4a shows the maps of UId on the day of maximum UId,boxOF over the July OFU development period and the maps of average surface current vorticity during this period for two members of strong OFU (13, maximum UI ∘C; 17, maximum UI ∘C, Fig. 2a) and two members of weak OFU (15, maximum UI ∘C; 18, maximum UI ∘C). In July, the eastward jet is much stronger than in June (Fig. 3b, c and Sect. 3 above). The OFU develops mainly in the area of positive wind stress curl and current vorticity along the northern flank of the jet (Figs. 3c, e and 4). When the position of the eastward jet is located further south than average, as for members 13 and 17, the area of positive current vorticity north of the jet in boxOF coincides with the area of positive wind curl. This combination of positive current vorticity and positive wind curl enhances Ekman pumping-induced upwelling (Fig. 4) and results in a strong OFU covering a large area. This is the opposite when the position of the eastward jet is further north than average (members 15 and 18): the area of positive current vorticity located in the positive wind curl region is smaller, not enhancing the Ekman pumping-induced upwelling (Fig. 4). Figure 3d and f shows strong values of IVtm of current vorticity and upwelling intensity (> 100 %) along the eastward jet and in the northeast area of boxOF. This confirms that OFU intrinsic variability in July is related to the effect of eastward jet meridional position variability on the circulation and on the upwelling that develops along the northern flank of the jet. Figure 4b shows the maps of UId on the day of maximum UId,boxOF over the August OFU development period and the maps of average surface current vorticity and average wind stress curl during this period for two members of strong OFU (14, maximum UI ∘C; 13, maximum UI ∘C, Fig. 2a) and two members of weak OFU (10, maximum UI ∘C; 16, maximum UI ∘C). In August, part of the OFU still develops in the area of positive surface current vorticity along the northern flank of the eastward jet, but to a lesser extent than in July (Figs. 3e, 4). The meridional position of the jet does not vary a lot from one member to another (Fig. 4b), as confirmed by the lower values of IVtm of current vorticity in the jet area (Fig. 3d). The eastward jet is thus stronger and more stable than in July (Fig. 3b,c and Sect. 3) and does not induce a strong intrinsic variability of the OFU. Instead, August OFU mainly develops in the area of positive vorticity north of the jet associated with the cyclonic eddy of the ACC dipole (Figs. 4b, 3e). Variations of zonal position of this eddy explain the variability of OFU intensity. From members 14 to 13, 10 and 16, this eddy is located more and more to the east, i.e., further and further away from the area of strong positive wind stress curl, resulting in a weaker and weaker OFU (Fig. 4b). The variability of circulation in the northern part of boxOF therefore explains OFU intrinsic variability in August. This variability is moreover less than in July: IVtm of the current vorticity and of UId in this northern part (highlighted by the black triangle in Fig. 3d, e, f) is less in August than in July. The more stable jet in August, that results in a smaller intrinsic variability of OFU along the jet, and smaller intrinsic variability of current vorticity in the northern cyclonic part, where the OFU mostly develops, therefore explain the intrinsic variability of the OFU in August and the fact that it is smaller than in July.
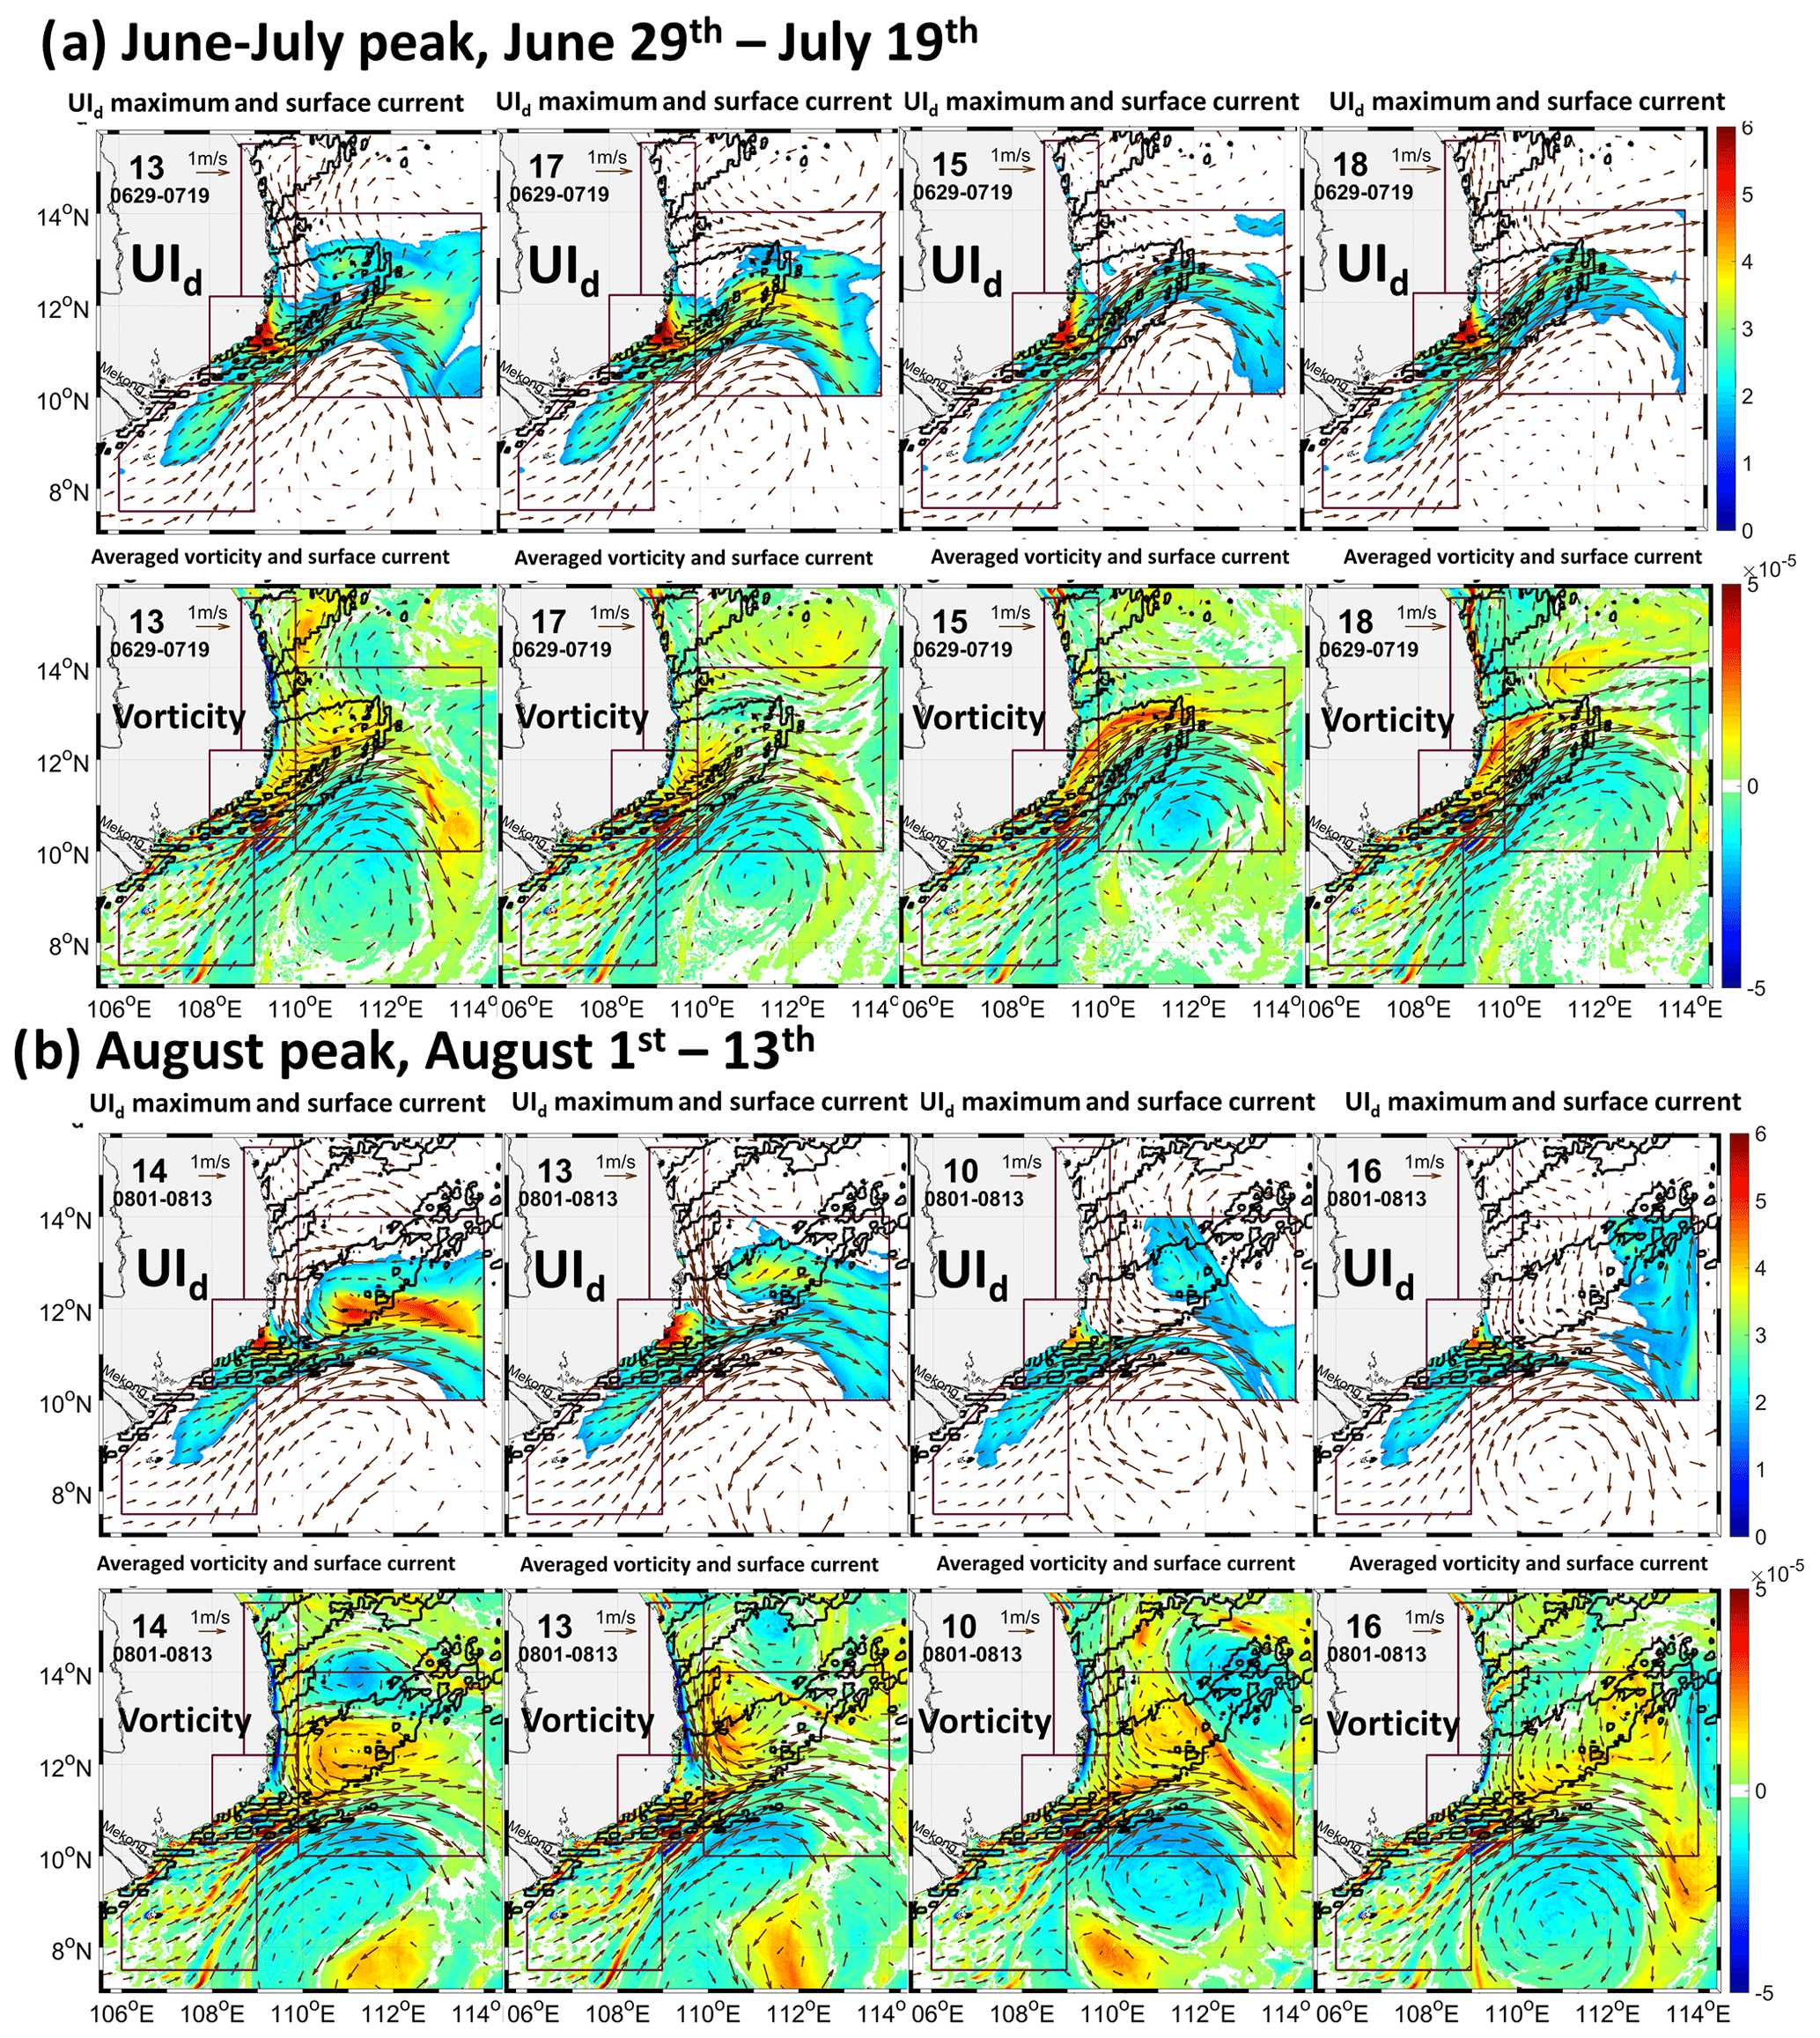
Figure 4Maps of UId (top, ∘C) on the day of maximum UId,boxOF over the periods of OFU development (highlighted in blue in Fig. 2) in (a) July and (b) August, and of average surface current vorticity (bottom, s−1) during each period for two members of strong OFU (members 13 and 17 for July, members 14 and 13 for August, Fig. 2a) and two members of weak OFU (members 15 and 18 for July, members 10 and 16 for August). Black contours: 3.10−7 N m−3 iso-contours of average wind stress curl during each period. Arrows: average surface current (m s−1).
In the OFU, MKU and SCU areas, the effect of intrinsic variability on UId and the surface current vorticity therefore shows similar spatial patterns (Fig. 3d, f) and the influence of the OIV on upwelling is directly linked to the influence of the OIV on the circulation.
4.4 The northern coastal upwelling (NCU)
The 10 members and the ensemble mean simulate the NCU with a strong intraseasonal variability and a similar chronology (Fig. 2d), completely different from the chronology obtained for the three other areas. A strong NCU develops at the beginning of summer (from 10 June to 4 July, reaching ∼ 1.2 ∘C for the ensemble average), and a weak NCU develops at the end of August (26 to 31 August, reaching ∼ 0.2 ∘C). During those periods, highlighted in green in Fig. 2, NCU chronology follows the wind chronology for the 10 members: UId,boxNC peaks correspond to peaks of northward (i.e., alongshore) wind favorable to the NCU, around 18 and 25 June, 2 July and 28–29 August. There is still a significant correlation between the time series of UId,boxNC and the time series of the wind stress northward component over boxNC that favors the Ekman upwelling in this area (0.37, p<0.01, Table 1). It is however much weaker than correlations obtained for the other areas (at least 0.64). Moreover, although northward wind peaks occur during the whole summer (e.g., 17–22 July, highlighted in green in Fig. 2) the NCU does not develop from mid-July to mid-August.
The NCU shows the strongest OIV of the four areas. During the June–July peak, IVd(UId,boxNC) reaches 170 % and is much smaller during the rest of the summer, reaching ∼ 80 % at most during the short late August peak (Fig. 2e). The strong OIV in June explains the strong OIV at the summer scale (Table 1): IVtm(UIJJAS,boxNC) is equal to 37 %, i.e., 2 times larger than for the OFU and ∼ 6 times larger than for the SCU and MKU. It is about half the interannual variability of MKU summer strength (72 % in the LONG simulation; To Duy et al., 2022).
These results suggest that the daily to intraseasonal chronology of upwelling in boxNC is partly driven by wind but to a lesser extent than in the other areas. Therefore, other factors are involved that induce a strong intrinsic variability of the NCU at both the daily and summer scales. To identify those factors, we use the three periods identified above: the period of strong wind over boxNC and strong NCU in June (10 June–4 July), the period of strong wind but no NCU in July (17–22 July) and the period of strong wind and weak NCU at the end of August (26–31 August). In Fig. 5, we show the maps of the ensemble average of average surface current, current vorticity and IVtm of current vorticity over each period, and the maps of UId and IVtm(UId) on the day of maximum UId,boxNC over each period.
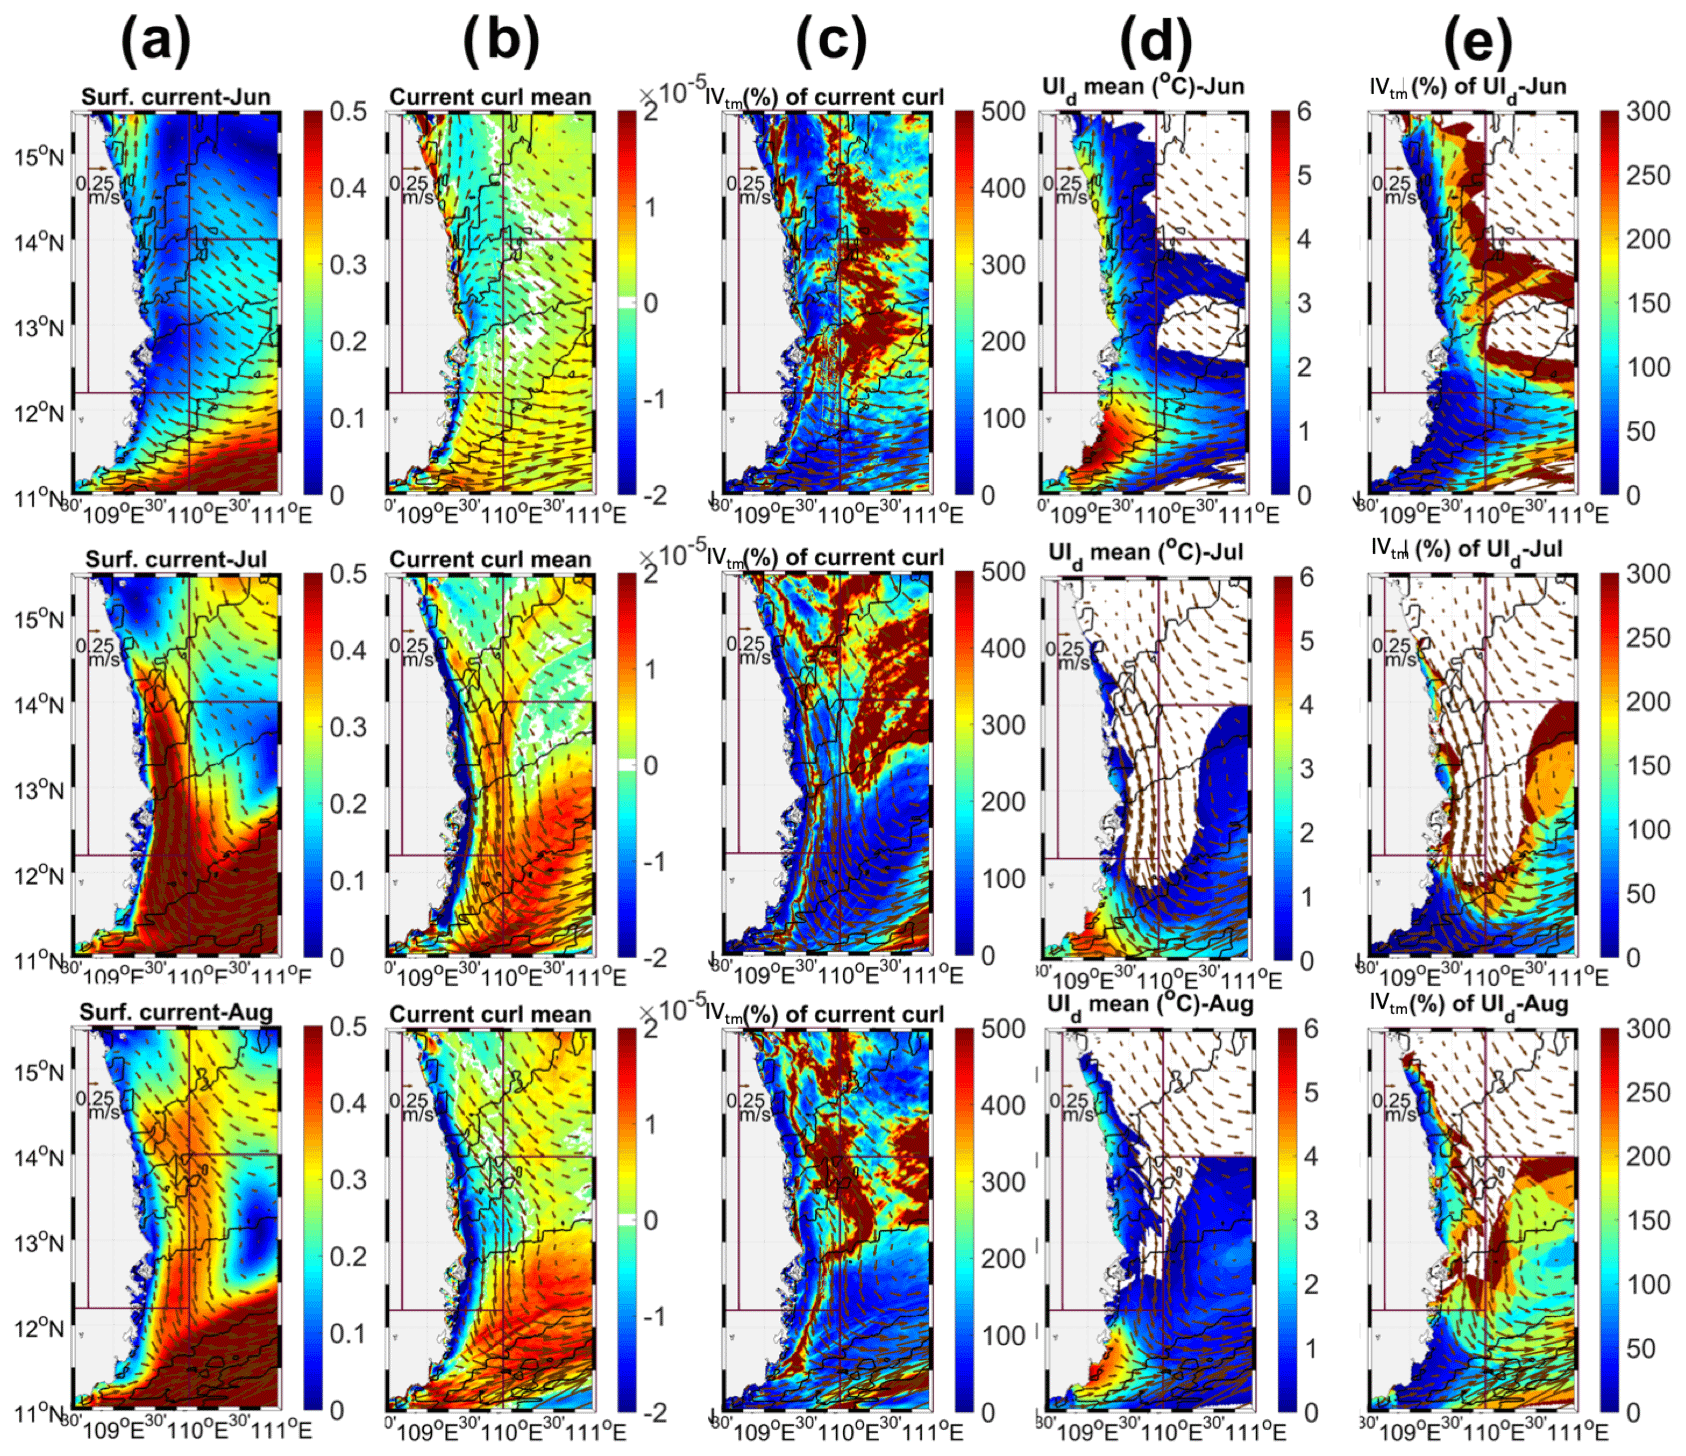
Figure 5Maps of ensemble average of average surface current speed (a, m s−1) and vorticity (b, s−1) over each wind peak period over boxNC (highlighted in green in Fig. 2: first row 10 June–4 July, second row 17–22 July and third row 26–31 August), of UId (d, ∘C) on the day of maximum UId,boxNC over each period and of relative intrinsic variability IVtm of average surface current vorticity (c, %) and UId (e, %) over each period. Black contours: 3.10−7 N m−3 iso-contours of average wind stress curl during each period. Arrows: average surface current (m s−1).
During the June period, ensemble average circulation in and around boxNC is globally offshore oriented. This favors the Ekman transport, hence the development of the NCU. The ensemble spreading of NCU strength is very strong: IVtm(UId) spatially exceeds 300 % in the eastern part of boxNC (Fig. 5e), and IVd(UId,boxNC) reaches 170 % (Fig. 2e). Figure 6 shows the maps of wind speed and curl, current speed and vorticity and UId on the day of maximum UId,boxNC over the June period for two members of strong NCU (10 and 16) and two members of weak NCU (9 and 11). A cyclonic gyre in the north and anticyclonic gyre in the south meet in boxNC for members 10 (between 13 and 14∘ N) and 16 (between 14 and 15∘ N). This induces a convergence and an offshore current resulting in a strong upwelling, following the same mechanism as for the SCU. For members 9 and 11, cyclonic and anticyclonic gyres do not meet in boxNC, but either north or south of boxNC, not inducing offshore oriented current over boxNC. Instead, a weak NCU is induced by a favorable northward alongshore current in the northern part of boxNC (Fig. 6). As already observed at the interannual scale by To Duy et al. (2022) for the interannual variability, mesoscale circulation of strongly chaotic nature in and around boxNC therefore drives the NCU development and explains its high intrinsic variability during the June period. The effect of intrinsic variability on the NCU is not related to the intrinsic variability of current vorticity but of current direction relative to the coast.
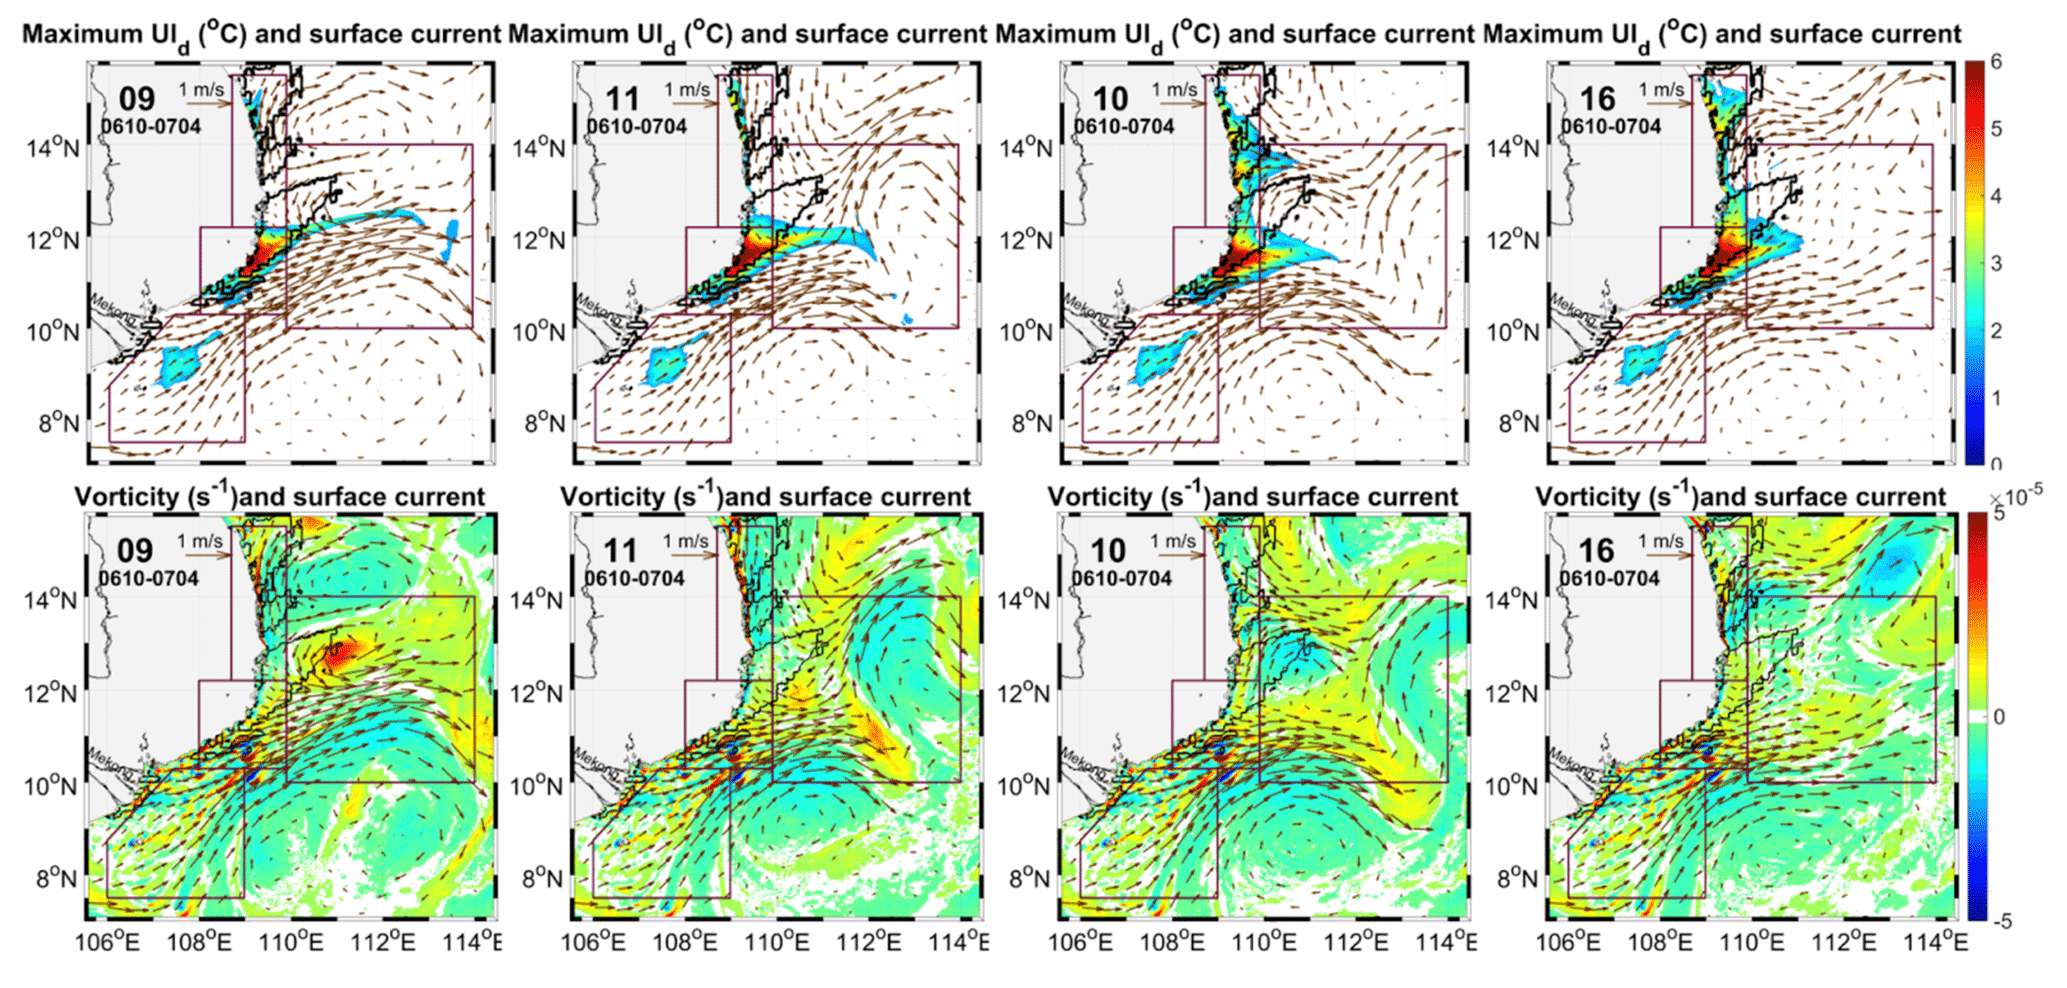
Figure 6Maps of UId (first row, ∘C) on the day of maximum UId,boxNC over the July wind peak period over boxNC (highlighted in green in Fig. 2) and maps of average surface current vorticity (second row, s−1) for two members of weak NCU (9, 11) and two members of strong NCU (10, 16) during the June–July period. Black contours: 3.10−7 N m−3 iso-contours of average wind stress curl during each period. Arrows: average surface current (m s−1).
Between mid-July and mid-August, the large-scale circulation (ACC dipole and eastward jet) is strongly established (see Sect. 3). The western part of the cyclonic eddy covers boxNC and induces a strong southward alongshore current over this region. Close to the coast, this alongshore current is associated with a divergent circulation, hence with a coastward component and a coastal downwelling which inhibits the NCU (see the high negative vorticity in this area during the July period in Fig. 5b). This large-scale ocean circulation is common for the 10 members and systematically prevents the NCU to develop (see the weak IVtm of the current vorticity and the weak upwelling in Fig. 5). This explains the very weak UId,boxNC and IVd(UId,boxNC) during this period (Fig. 2e).
During the August period, the average circulation is similar to the mid-July and mid-August circulation described above (Fig. 5a,b). However, with the weakening of the summer monsoon, the ACC dipole structure progressively weakens, the negative vorticity is less strong and the current is a bit more offshore oriented: the NCU is not as strong as in June, but it can develop easier than in the middle of the summer; IVd(UId,boxNC) consequently increases but stays smaller than in June.
Our results therefore show that the development of the NCU at the intraseasonal scale is first related to the large-scale circulation, which prevents it during the heart of summer and allows it at the beginning and end of summer. Inside those periods of “allowed NCU development”, it is first driven by wind, then by the mesoscale circulation that explains its very strong intrinsic variability.
An ensemble of 10 fine-resolution simulations with perturbed initial conditions was performed and analyzed in this paper to represent and investigate (i) the daily to intraseasonal variability of ocean circulation and of SVU over its different areas of development and (ii) the influence of the OIV.
The ensemble was used to examine the seasonal variability and intrinsic variability of the circulation in the SVU region during summer 2018. In June, the eastward jet is weak and mainly located in the south, the ACC dipole is not formed and the circulation is only stable in the coastal area. In July, the jet is stronger and the ACC dipole is clearly formed. The circulation in the area of positive vorticity north of the jet is more stable. In August, the southwest monsoon wind is at its strongest and has the largest area of influence, inducing an even stronger eastward jet and a pronounced ACC dipole. In August, the circulation is stable over a larger area than in July.
We then examined the seasonal variability and intrinsic variability of the upwelling.
For the SCU, MKU and OFU, the daily chronology and intraseasonal variability of the upwelling are quite similar and mainly driven by the summer monsoon wind, with upwelling maxima in phase with strong southwest wind periods. Their intrinsic variability is much weaker than their interannual variability.
The development of the MKU and SCU is related to ocean circulation processes, respectively the northeastward current and eastward jet, that are spatially quite stable. As a result, the MKU and SCU show a very weak (less than 10 %) intrinsic variability in space and time, both at daily scale and on average over summer. Peaks of the OIV are related to peaks of upwelling intensity. The SCU develops as long as wind conditions are favorable over the area of the ACC dipole convergence that does not vary much spatially. The MKU develops along the northeastward current that flows offshore the Mekong delta and is spatially very stable.
The OFU shows stronger intrinsic variability (18 %), both at daily scale and for the whole summer period and also in space. The seasonal variability of OFU intensity and intrinsic variability are not only driven by the wind but also related to the period of the season. The large-scale circulation (ACC dipole and eastward jet) that enhances the Ekman pumping-induced OFU is weak in June and September, whereas it is strongly established in the heart of summer in July and August. This explains the stronger OFU intensity and OIV during the July–August period. Moreover, for similar OFU intensity, the impact of OIV is weaker in August than in July. In July, OFU mainly develops along the northern flank of the eastward jet. The meridional position of this jet is quite variable, explaining the strong intrinsic variability of the July OFU: a southern (northern) position of the jet induces a larger (smaller) common area between the positive curl of wind stress and current, hence induces a stronger (weaker) upwelling. In August, this position is much more stable. Moreover, the OFU mainly develops in the area of cyclonic activity north of the jet, related to mesoscale eddies of strong chaotic nature. The OFU intensity depends on the zonal position of this cyclonic activity with respect to the wind curl: a cyclonic eddy (not) located in the area of strong positive wind stress curl results in stronger (weaker) OFU. The circulation in this area is moreover more stable than in July, explaining the weaker intrinsic variability in August.
The NCU daily chronology and the intraseasonal variability is completely different from that found in the three other areas, and its intrinsic variability is much larger. At the intraseasonal scale, the development of NCU is driven by the large-scale circulation. During the heart of summer, from mid-July to end of August, the eastward jet and ACC dipole are strongly established, inducing a strong southward alongshore current over boxNC which annihilates the NCU, explaining its very low intensity and intrinsic variability. At the beginning and, to a lesser extent, end of summer, the large-scale ACC dipole structure and associated eastward current are weaker, allowing offshore current to develop. Inside these periods, NCU chronology is driven by the wind but also by the development (or not) of offshore-oriented currents related to the spatial organization of coastal eddies. The NCU shows a strong intrinsic variability related to strong chaotic variability of mesoscale structures with the order of magnitude similar to interannual variability (37 %).
We investigated here the effect of the OIV on the circulation and upwelling in the SVU region, confirming that this chaotic part of ocean variability here is mainly related to the small-scale structures, as previously shown for other areas. Following this study as well as those of Da et al. (2019) and To Duy et al. (2022), we can draw some perspectives on the application of research regarding the predictability of SVU at the intraseasonal to interannual scale. The development of MKU and SCU, which is not affected much by the OIV, could be largely predicted using wind forecasts, provided of course that these forecasts are reliable. At first order, the OFU can be partially predicted from wind forecasts but with uncertainties in its daily to summer integrated magnitude that can vary by a factor of 1.5 to 2 (see Fig. 2 and Table 1). Wind forecasts could identify favorable or unfavorable periods for NCU development. However, favorable periods would be associated with large uncertainty in terms of NCU intensity, given the strong impact of the OIV on NCU during these periods. Further studies are underway to investigate the influence of other factors, including rivers and tides. Chen et al. (2012) indeed suggested that tides could influence the SVU development. Tidal amplitude is particularly strong over the shallow Mekong shelf region (Phan et al., 2019) and moreover, subject to the influence of the Mekong river waters. Both factors may therefore affect SVU development and variability, particularly over the MKU and SVU areas. We further developed an ocean–atmosphere regional coupled model that will allow us to study the impact of upwelling on atmosphere and climate, at local and regional scales, that was studied until now using satellite data and an atmosphere-only model (Xie et al. 2003; Zheng et al., 2016; Yu et al., 2020). The impact of upwelling on the marine ecosystem should also be studied, using for example the dynamical–biogeochemical coupled model developed by Ulses et al. (2016) and Herrmann et al. (2017). Finally, the long-term evolution of the upwelling should be studied, especially since Herrmann et al. (2020, 2022) showed that summer monsoon winds may weaken in response to climate change. Lastly, the upwelling that develops offshore from the Mekong Delta, MKU, was revealed by To Duy et al. (2022) and confirmed by the present study, and the northern coastal upwelling, NCU, was revealed by Da et al. (2019) and confirmed by Ngo and Hsin (2021). Very few in situ observations are available over these two areas, and field campaigns are therefore necessary to better understand their functioning. This study explored the impact of the OIV on the South Vietnam upwelling, but it is more generally of interest for the scientific community working on the functioning and variability of upwellings and on the effect and modeling of the OIV.
The code for the SYMPHONIE model can be downloaded freely from https://sirocco.obs-mip.fr/ocean-models/s-model/download/ and is presented in Marsaleix et al. (2008). Sea surface temperature, currents and wind stress simulated by the ensemble over the summer of 2018 are freely available on https://doi.org/10.5281/zenodo.7504087 (Herrmann et al., 2023).
MH, TDT, and CE designed the experiments and TDT carried them out. MH prepared the paper with contributions from all co-authors.
The contact author has declared that none of the authors has any competing interests.
Publisher’s note: Copernicus Publications remains neutral with regard to jurisdictional claims in published maps and institutional affiliations.
This work is a part of the LOTUS international joint laboratory (lotus.usth.edu.vn). PhD studies of To Duy Thai were funded through an IRD ARTS fellowship and a Bourse d'Excellence from the French Embassy in Vietnam. Numerical simulations were performed using CALMIP HPC facilities (project P13120) and the cluster OCCIGEN from the CINES group (project DARI A0080110098).
The authors warmly thank both reviewers for their constructive comments.
This research has been supported by the Vietnam Academy of Science and Technology (grant no. QTFR02.02/23-24).
This paper was edited by John M. Huthnance and reviewed by Alexei Sentchev and one anonymous referee.
Bombar, D., Dippner, J. W., Doan, H. N., Ngoc, L. N., Liskow, I., Loick-Wilde, N., and Voss, M.: Sources of new nitrogen in the Vietnamese upwelling region of the South China Sea, J. Geophys. Res.-Ocean., 115, 6018, https://doi.org/10.1029/2008JC005154, 2010.
Chen, C. and Wang, G.: Interannual variability of the eastward current in the western South China Sea associated with the summer Asian monsoon, J. Geophys. Res.-Ocean., 119, 5745–5754, https://doi.org/10.1002/2014JC010309, 2014.
Chen, C., Lai, Z., Beardsley, R. C., Xu, Q., Lin, H., and Viet, N. T.: Current separation and upwelling over the southeast shelf of Vietnam in the South China Sea, J. Geophys. Res.-Ocean., 117, 1–16, https://doi.org/10.1029/2011JC007150, 2012.
Da, N. D., Herrmann, M., Morrow, R., Niño, F., Huan, N. M., and Trinh, N. Q.: Contributions of Wind, Ocean Intrinsic Variability, and ENSO to the Interannual Variability of the South Vietnam Upwelling: A Modeling Study, J. Geophys. Res.-Ocean., 124, 6545–6574, https://doi.org/10.1029/2018JC014647, 2019.
Dippner, J. W., Nguyen, K. V., Hein, H., Ohde, T., and Loick, N.: Monsoon-induced upwelling off the Vietnamese coast, Ocean Dynam., 57, 46–62, https://doi.org/10.1007/S10236-006-0091-0, 2007.
Herrmann, M., Auger, P. A., Ulses, C., and Estournel, C.: Long-term monitoring of ocean deep convection using multisensors altimetry and ocean color satellite data, J. Geophys. Res.-Ocean., 122, 1457–1475, https://doi.org/10.1002/2016JC011833, 2017.
Herrmann, M., Ngo-Duc, T., and Trinh-Tuan, L.: Impact of climate change on sea surface wind in Southeast Asia, from climatological average to extreme events: results from a dynamical downscaling, Clim. Dynam. 2020 543, 54, 2101–2134, https://doi.org/10.1007/S00382-019-05103-6, 2020.
Herrmann, M., Nguyen-Duy, T., Ngo-Duc, T., and Tangang, F.: Climate change impact on sea surface winds in Southeast Asia, Int. J. Climatol., 42, 3571–3595, https://doi.org/10.1002/JOC.7433, 2022.
Herrmann, M., To Duy, T., and Estournel, C.: Daily surface temperature and current from a 10 members ensemble simulation of June–September 2018 over the South China Sea, Zenodo [data set], https://doi.org/10.5281/zenodo.7504087, 2023.
Isoguchi, O., and Kawamura, H.: MJO-related summer cooling and phytoplankton blooms in the South China Sea in recent years, Geophys. Res. Lett., 33, L16615, https://doi.org/10.1029/2006GL027046, 2006.
Kuo, N. J., Zheng, Q., and Ho, C. R.: Response of Vietnam coastal upwelling to the 1997–1998 ENSO event observed by multisensor data, Remote Sens. Environ., 89, 106–115, https://doi.org/10.1016/j.rse.2003.10.009, 2004.
Li, Y., Han, W., Wilkin, J. L., Zhang, W. G., Arango, H., Zavala-Garay, J., Levin, J., and Castruccio, F. S.: Interannual variability of the surface summertime eastward jet in the South China Sea, J. Geophys. Res.-Ocean., 119, 7205–7228, https://doi.org/10.1002/2014JC010206, 2014.
Liu, X., Wang, J., Cheng, X., and Du, Y.: Abnormal upwelling and chlorophyll-a concentration off South Vietnam in summer 2007, J. Geophys. Res.-Ocean., 117, 2–11, https://doi.org/10.1029/2012JC008052, 2012.
Loick-Wilde, N., Bombar, D., Doan, H. N., Nguyen, L. N., Nguyen-Thi, A. M., Voss, M., and Dippner, J. W.: Microplankton biomass and diversity in the Vietnamese upwelling area during SW monsoon under normal conditions and after an ENSO event, Prog. Oceanogr., 153, 1–15, https://doi.org/10.1016/j.pocean.2017.04.007, 2017.
Loisel, H., Vantrepotte, V., Ouillon, S., Ngoc, D. D., Herrmann, M., Tran, V., Mériaux, X., Dessailly, D., Jamet, C., Duhaut, T., Nguyen, H. H., and Nguyen, T. V.: Assessment and analysis of the chlorophyll-a concentration variability over the Vietnamese coastal waters from the MERIS ocean color sensor (2002–2012), Remote Sens. Environ., 190, 217–232, https://doi.org/10.1016/j.rse.2016.12.016, 2017.
Lu, W., Oey, L. Y., Liao, E., Zhuang, W., Yan, X. H., and Jiang, Y.: Physical modulation to the biological productivity in the summer Vietnam upwelling system, Ocean Sci., 14, 1303–1320, https://doi.org/10.5194/OS-14-1303-2018, 2018.
Lyard, F., Lefevre, F., Letellier, T., and Francis, O.: Modelling the global ocean tides: modern insights from FES2004, Ocean Dynam., 56, 394–415, https://doi.org/10.1007/S10236-006-0086-X, 2006.
Marsaleix, P., Auclair, F., Floor, J. W., Herrmann, M. J., Estournel, C., Pairaud, I., and Ulses, C.: Energy conservation issues in sigma-coordinate free-surface ocean models, Ocean Model., 20, 61–89, https://doi.org/10.1016/j.ocemod.2007.07.005, 2008 (code available at https://sirocco.obs-mip.fr/ocean-models/s-model/download/, last access: 11 April 2023).
Marsaleix, P., Michaud, H., and Estournel, C.: 3D phase-resolved wave modelling with a non-hydrostatic ocean circulation model, Ocean Model., 136, 28–50, https://doi.org/10.1016/J.OCEMOD.2019.02.002, 2019.
Ngo, M. H. and Hsin, Y. C.: Impacts of Wind and Current on the Interannual Variation of the Summertime Upwelling Off Southern Vietnam in the South China Sea, J. Geophys. Res.-Ocean., 126, e2020JC016892, https://doi.org/10.1029/2020JC016892, 2021.
Pairaud, I., Lyard, F., Auclair, F., Letellier, T., and Marsaleix, P.: Dynamics of the semi-diurnal and quarter-diurnal internal tides in the Bay of Biscay, Part 1: Barotropic tides, Cont. Shelf Res., 28, 1294–1315, https://doi.org/10.1016/J.CSR.2008.03.004, 2008.
Pairaud, I. L., Auclair, F., Marsaleix, P., Lyard, F., and Pichon, A.: Dynamics of the semi-diurnal and quarter-diurnal internal tides in the Bay of Biscay, Part 2: Baroclinic tides, Cont. Shelf Res., 30, 253–269, https://doi.org/10.1016/j.csr.2009.10.008, 2010.
Penduff, T., Juza, M., Barnier, B., Zika, J., Dewar, W. K., Treguier, A. M., Molines, J. M., and Audiffren, N.: Sea level expression of intrinsic and forced ocean variabilities at interannual time scales, J. Clim., 24, 5652–5670, https://doi.org/10.1175/JCLI-D-11-00077.1, 2011.
Phan, H. M., Ye, Q., Reniers, A. J. H. M., and Stive, M. J. F.: Tidal wave propagation along The Mekong deltaic coast, Estuarine, Coast. Shelf Sci., 220, 73–98, https://doi.org/10.1016/j.ecss.2019.01.026, 2019.
Sérazin, G., Meyssignac, B., Penduff, T., Terray, L., Barnier, B., and Molines, J. M.: Quantifying uncertainties on regional sea level change induced by multidecadal intrinsic oceanic variability, Geophys. Res. Lett., 43, 8151–8159, https://doi.org/10.1002/2016GL069273, 2016.
To Duy, T., Herrmann, M., Estournel, C., Marsaleix, P., Duhaut, T., Bui Hong, L., and Trinh Bich, N.: Role of wind, mesoscale dynamics and coastal circulation in the interannual variability of South Vietnam Upwelling, South China Sea. Answers from a high resolution ocean model, Ocean Sci., 18, 1131–1161, https://doi.org/10.5194/os-18-1131-2022, 2022.
Ulses, C., Auger, P. A., Soetaert, K., Marsaleix, P., Diaz, F., Coppola, L., Herrmann, M. J., Kessouri, F., and Estournel, C.: Budget of organic carbon in the North-Western Mediterranean open sea over the period 2004–2008 using 3-D coupled physical-biogeochemical modeling, J. Geophys. Res.-Ocean., 121, 7026–7055, https://doi.org/10.1002/2016JC011818, 2016.
Waldman, R., Somot, S., Herrmann, M., Bosse, A., Caniaux, G., Estournel, C., Houpert, L., Prieur, L., Sevault, F., and Testor, P.: Modeling the intense 2012–2013 dense water formation event in the northwestern Mediterranean Sea: Evaluation with an ensemble simulation approach, J. Geophys. Res.-Ocean., 122, 1297–1324, https://doi.org/10.1002/2016JC012437, 2017a.
Waldman, R., Herrmann, M., Somot, S., Arsouze, T., Benshila, R., Bosse, A., Chanut, J., Giordani, H., Sevault, F., and Testor, P.: Impact of the Mesoscale Dynamics on Ocean Deep Convection: The 2012–2013 Case Study in the Northwestern Mediterranean Sea, J. Geophys. Res.-Ocean., 122, 8813–8840, 2017b.
Waldman, R., Somot, S., Herrmann, M., Sevault, F., and Isachsen, P. E.: On the Chaotic Variability of Deep Convection in the Mediterranean Sea, Geophys. Res. Lett., 45, 2433–2443, https://doi.org/10.1002/2017GL076319, 2018.
Wang, B., LinHo, Zhang, Y., and Lu, M. M.: Definition of South China Sea monsoon onset and commencement of the East Asian summer monsoon, J. Clim., 17, 699–710, https://doi.org/10.1175/2932.1, 2004.
Wang, Y., Fang, G., Wei, Z., Qiao, F., and Chen, H.: Interannual variation of the South China Sea circulation and its relation to El Niño, as seen from a variable grid global ocean model, J. Geophys. Res.-Ocean., 111, 1–15, https://doi.org/10.1029/2005JC003269, 2006.
Wyrtki, K.: Physical oceanography of the South East Asian Waters, UC San Diego: Library – Scripps Digital Collection, https://escholarship.org/uc/item/49n9x3t4 (last access: 7 April 2023), 1961.
Xie, S.-P., Xie, Q., and Wang, D.: Summer Upwelling in the South China Sea and its Role in Regional Climate Variations, J. Geophys. Res., 108, 1–37, https://doi.org/10.1029/2003JC001867, 2003.
Xie, S. P., Chang, C. H., Xi, Q., and Wang, D.: Intraseasonal variability in the summer South China Sea: Wind jet, cold filament, and recirculations, J. Geophys. Res.-Ocean., 112, 1–11, https://doi.org/10.1029/2007JC004238, 2007.
Yu, Y., Wang, Y., Cao, L., Tang, R., and Chai, F.: The ocean-atmosphere interaction over a summer upwelling system in the South China Sea, J. Mar. Syst., 208, 103360, https://doi.org/10.1016/j.jmarsys.2020.103360, 2020.
Zheng, Z. W., Zheng, Q., Kuo, Y. C., Gopalakrishnan, G., Lee, C. Y., Ho, C. R., Kuo, N. J., and Huang, S. J.: Impacts of coastal upwelling off east Vietnam on the regional winds system: An air-sea-land interaction, Dyn. Atmos. Ocean., 76, 105–115, https://doi.org/10.1016/j.dynatmoce.2016.10.002, 2016.