the Creative Commons Attribution 4.0 License.
the Creative Commons Attribution 4.0 License.
 | 17 Apr 2023
Current observed global mean sea level rise and acceleration estimated from satellite altimetry and the associated measurement uncertainty
Adrien Guérou
Benoit Meyssignac
Pierre Prandi
Michaël Ablain
Aurélien Ribes
François Bignalet-Cazalet
We present the latest release of the global mean sea level (GMSL) record produced by the French space agency Centre National d’Etudes Spatiales (CNES) and distributed on the AVISO+ website. This dataset is based on reprocessed along-track data, so-called L2P 21, of the reference missions TOPEX/Poseidon (TP) and Jason-1, Jason-2 and Jason-3. The L2P 21 CNES/AVISO+ GMSL record covers the period January 1993 to December 2021 and is now delivered with an estimate of its measurement uncertainties following the method presented in Ablain et al. (2019). Based on the latest calibration (Cal) and validation (Val) knowledge, we updated the uncertainty budget of the reference altimetry mission measurements and demonstrate that the CNES/AVISO+ GMSL record now achieves stability of performances of ± 0.3 mm yr−1 at the 90 % confidence level (C.L.) for its trend and ±0.05 mm yr−2 (90 % C.L.) for its acceleration over the 29 years of the altimetry record. Thanks to an analysis of the relative contribution of each measurement uncertainty budget contributor, i.e. the altimeter, the radiometer, the orbit determination and the geophysical corrections, we identified the current limiting factors to the GMSL monitoring stability and accuracy. We find that the radiometer wet troposphere correction (WTC) and the high-frequency errors with timescales shorter than 1 year are the major contributors to the GMSL measurement uncertainty over periods of 10 years (30 %–70 %), for both the trend and acceleration estimations. For longer periods of 20 years, the TP data quality is still a limitation, but more interestingly, the International Terrestrial Reference Frame (ITRF) realization uncertainties becomes dominant over all the other sources of uncertainty. Such a finding challenges the altimetry observing system as it is designed today and highlights clear topics of research to be explored in the future to help the altimetry community to improve the GMSL measurement accuracy and stability.
- Article
(5002 KB) - Full-text XML
- BibTeX
- EndNote


Since October 1992 and the launch of TOPEX/Poseidon, radar satellite altimetry has proved its capacity to monitor the small sea level variations induced by the natural climate variability and by the anthropogenic climate change (e.g. Cazenave and Moreira, 2022). An important effort of space agencies and the sea level science community over the last 30 years has continuously improved the satellite altimetry observing system and the associated data record, leading to a sea level record with unprecedented coverage, resolution, accuracy and stability. Now, sea level is currently monitored on a daily basis, from 82∘ S to 82∘ N, with a sampling, a mean resolution of ∼200 km (gridded products; Ballarotta et al., 2019), an accuracy better than ±4 cm for 1 Hz measurements (https://www.aviso.altimetry.fr/fileadmin/documents/calval/validation_report/J2/annual_report_j2_2014.pdf, last access: 28 November 2022; SALP Annual report, 2014) and a stability below ± 0.5 mm yr−1 on decadal timescales (WCRP Global Sea Level Budget Group, 2018; Ablain et al., 2019). This accuracy and stability enable the detection, analysis and attribution of sea level changes in response to the climate variability at the global and regional scale. As time is passing, and the sea level signal that is forced by greenhouse gas (GHG) emissions is unravelling above the internal climate variability, the sea level record also becomes a reference to assess and validate climate model simulations of sea level change in response to GHG emissions (e.g. Nerem et al., 2018). Sea level is also a key variable to constrain ocean reanalysis as it provides a unique estimate of the geostrophic circulation over the whole water column, which is a central piece of information to determine the general ocean circulation. For all these reasons the sea level record retrieved by satellite altimetry has become a reference for scientists to study ocean circulation changes and climate changes and for stakeholders to support their decisions and strategies on adaptation to sea level rise (see Oppenheimer et al., 2019; Fox-Kemper et al., 2021; IPCC, 2019 chap. 4, IPCC, 2022 chap. 9).
To ensure the best possible estimate of current sea level changes, space agencies regularly revisit and update the production of the sea level record from the satellite archive. In addition, since 2009, they have also been providing careful estimates of the associated measurement uncertainty to deliver to users information on the reliability and the accuracy of the sea level estimates.
This work presents the new release of the global mean sea level (GMSL) record and its associated measurement uncertainty from the AVISO+ project of the Centre National d'Etudes Spatiales (CNES). Note that the GMSL signal measured from space that we present here includes all sources of variability, including the forced response to anthropogenic emissions, the forced response to natural forcing (such as the solar activity) and the internal variability in the climate system. However, we do not intend to detect, separate or attribute the sea level signal to these different sources of variability. We only intend to provide the most accurate GMSL time series from satellite instruments along with the instrumental uncertainties. In this sense, the estimate of the 1993–2020 trend and acceleration we propose at the end of the article should not be interpreted as the forced response of GMSL to anthropogenic or natural forcing. They are only metrics of the lowest frequency in the space-based GMSL time series. The associated uncertainties are the measurement uncertainty only and are indicators of the typical level of instrumental uncertainty present in the CNES/AVISO+ GMSL product.
First we present the satellite altimetry data that are used (Sect. 2.1). Then we recall how the GMSL is derived, and we detail the new updates in the GMSL computation since the last release (Sect. 2.2). In Sect. 2.3 we update the GMSL measurement error budget and the GMSL error variance–covariance matrix. We derive in Sect. 3 the estimates of the GMSL anomalies, trends and accelerations since 1992 with their associated measurement uncertainty. We explore in Sect. 4 the sources of uncertainty in the GMSL trends and accelerations on different timescales. We identify the correlated noise at 1 year, the wet troposphere correction (WTC) and the International Terrestrial Reference Frame (ITRF) realization as the major sources of uncertainty on timescales longer than 10 years. On this basis we propose in Sect. 5 directions of research to reduce the measurement uncertainties in the GMSL trends and accelerations.
(Tran et al., 2010)(Tran et al., 2012)(based on Tran et al., 2012)(Nencioli, 2021)(Fernandes and Lázaro, 2016)Carrere et al., 2020(Carrère and Lyard, 2003)(Lyard et al., 2021)(Zaron, 2019; Carrere et al., 2021)(Cartwright and Tayler, 1971; Cartwright and Edden, 1973)(Desai et al., 2015)Table 1Origins and references of the corrections contained in the L2P 21 along-track 1 Hz products. These products are the ones used to compute the current GMSL CNES/AVISO+ record. The terms in italics are the ones updated as compared to the previous version L2P 18.

2.1 Altimetry dataset
The CNES/AVISO+ GMSL record is computed based on the Level-2+ (L2P) CNES/AVISO+ 1 Hz non-time-critical (NTC) along-track data of the altimetry reference missions TOPEX/Poseidon (TP), Jason-1 (J1), Jason-2 (J2) and Jason-3 (J3). The latest reprocessing of these products is used, i.e. version V03_00, hereinafter referred to as L2P 21. The L2P 21 products benefit from reprocessed data of individual missions and homogeneous state-of-the-art geophysical corrections to ensure accurate and stable climate data records (see Legeais et al., 2021, for a comprehensive description of the altimetry dataset production within the Copernicus programme). A complete description of the L2P 21 dataset is given in the Along-track Level-2+ (L2P) SLA products handbook (https://www.aviso.altimetry.fr/fileadmin/documents/data/tools/hdbk_L2P_all_missions_except_S3.pdf, last access: 28 November 2022).
The main improvements brought by the L2P 21 standards, as compared to those of the previous version (Ablain et al., 2016, 2019), are summarized hereafter: a new dynamical atmospheric correction (DAC) solution is used that is based on ERA 5 data and computed with the TUGO model (Carrere et al., 2020). It yields a reduction in the sea surface height (SSH) variance at crossover points of 5 %. A combined mean sea surface (MSS) is also used, now computed with respect to the World Geodetic System (WGS) 84 reference ellipsoid, instead of the TP ellipsoid. It yields a better stability of the sea level anomaly (SLA) variable, especially at high latitudes. The pole tide solution has been improved with a better definition of its mean location (Desai et al., 2015; Ries and Desai, 2017), and an internal tide solution has been added to the calculation of the SLA (Zaron, 2019). Finally, Jason-2 and Jason-3 missions now benefit from the use of their official Geophysical Data Record (GDR) WTC from their respective on-board radiometer instruments.
A summary of the altimetry variables and geophysical corrections contained in the L2P 21 products of the four reference missions is presented in Table 1. Note that the ongoing GDR-F reprocessing of the TOPEX/Poseidon data has not been included in the L2P 21 and that Jason-3 GDR-F data are only used from cycle 171 onwards (October 2020).
2.2 GMSL computation
The L2P 21 GMSL record has been computed following the AVISO+ method (Sect. 2.1 in Henry et al., 2014). In a nutshell, the along-track 1 Hz SLA measurements are first averaged within grid cells of for each orbital cycle (∼10 d). Then, all grid cells within N/S (the TP and Jason's coverage) are spatially averaged for each cycle, with a weighting that accounts for the relative ocean area covered. This gives one GMSL measurement in time. In practice, the weights are a function of the cosine of the latitude and of the ocean-to-land ratio of each grid cell. As compared to Henry et al. (2014), the AVISO+ method now uses grid cell size of in latitude and longitude, respectively. Grid cells around the tropics and coastlines are thus better populated to mitigate trend overestimation in these regions, as noted in an AVISO+ note (see https://www.aviso.altimetry.fr/fileadmin/documents/data/products/indic/msl/MSL_reprocessing_201402.pdf. last access: 28 November 2022; Henry et al., 2014) and confirmed by Scharffenberg and Stammer (2019).
2.2.1 GMSL intermission offsets
The L2P 21 GMSL is currently built from four altimetry missions: TOPEX/Poseidon, Jason-1, Jason-2 and Jason-3. These missions flew successively on the same orbit since 1992 with calibration phases, called “tandem phases”, during which the successive satellites fly less than a minute apart over the same ground track. During tandem phases, consecutive missions observe precisely the same sea level such that the GMSL intermission offset (due to non-correlated instrumental differences) can be accurately estimated and corrected for. These tandem phases generally last from 6 to 12 months and are key to ensuring the long-term continuity and stability of the GMSL record (Dorandeu et al., 2004; Leuliette et al., 2004; Zawadzki and Ablain, 2016).
In practice, the global intermission offsets are computed as the mean difference in the respective GMSL values over a given sub-period (i.e. a given number of cycles) of the tandem phase. In the previous version of the CNES/AVISO+ GMSL record, only 9 cycles within each tandem phase (out of about 20) centred around the switching date from one mission to another were used to compute the intermission offsets. This was different from other groups who used the whole tandem phases (Masters et al., 2012; Henry et al., 2014). Based on an improved estimation method of the GMSL intermission offset uncertainties (detailed hereafter) we show that uncertainties are reduced when using as many measurements as possible. For this reason, the GMSL intermission offsets of the L2P 21 GMSL are now computed based on all available tandem-phase cycles. Table 2 summarizes the different missions we used and the respective periods over which they were used.
Table 2Altimetry missions used to establish the CNES/AVISO+ GMSL record. The periods covered by each mission in the GMSL record are provided in the second column, the corresponding cycles are given in column three, and the tandem-phase cycles used to compute the intermission offsets are given in the last three columns.
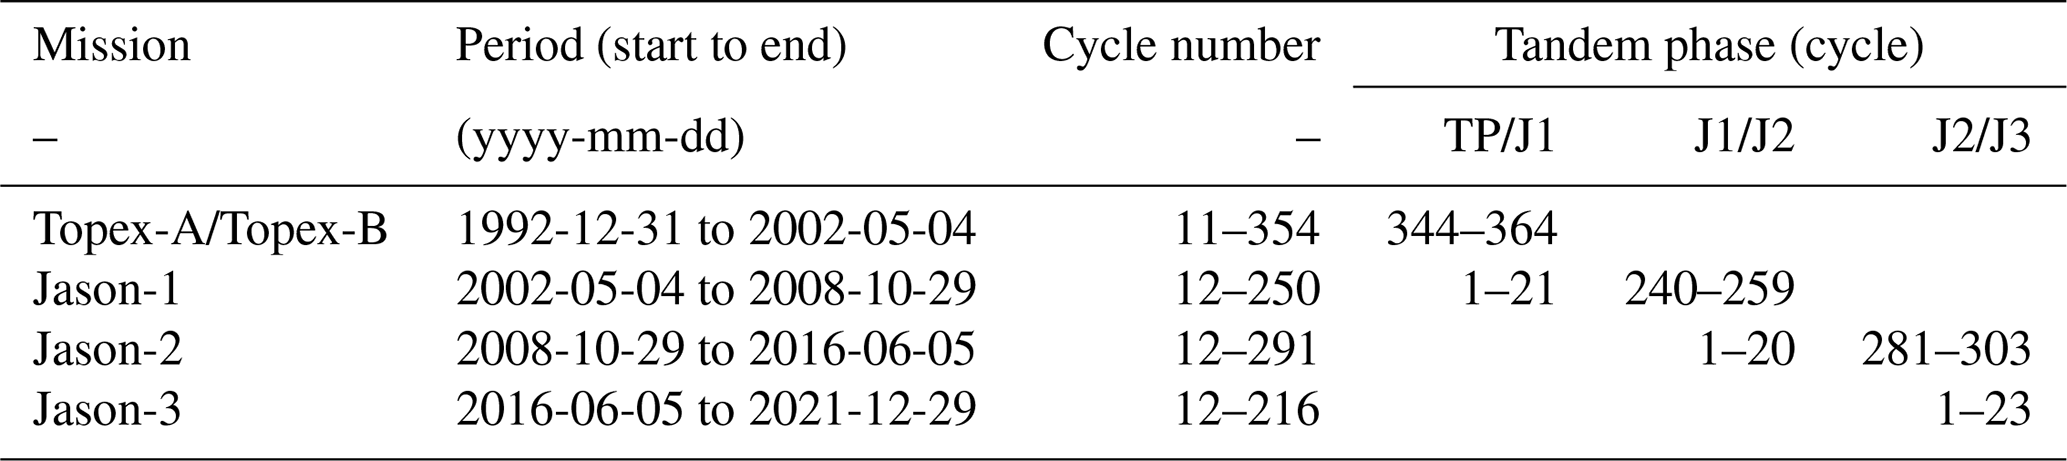
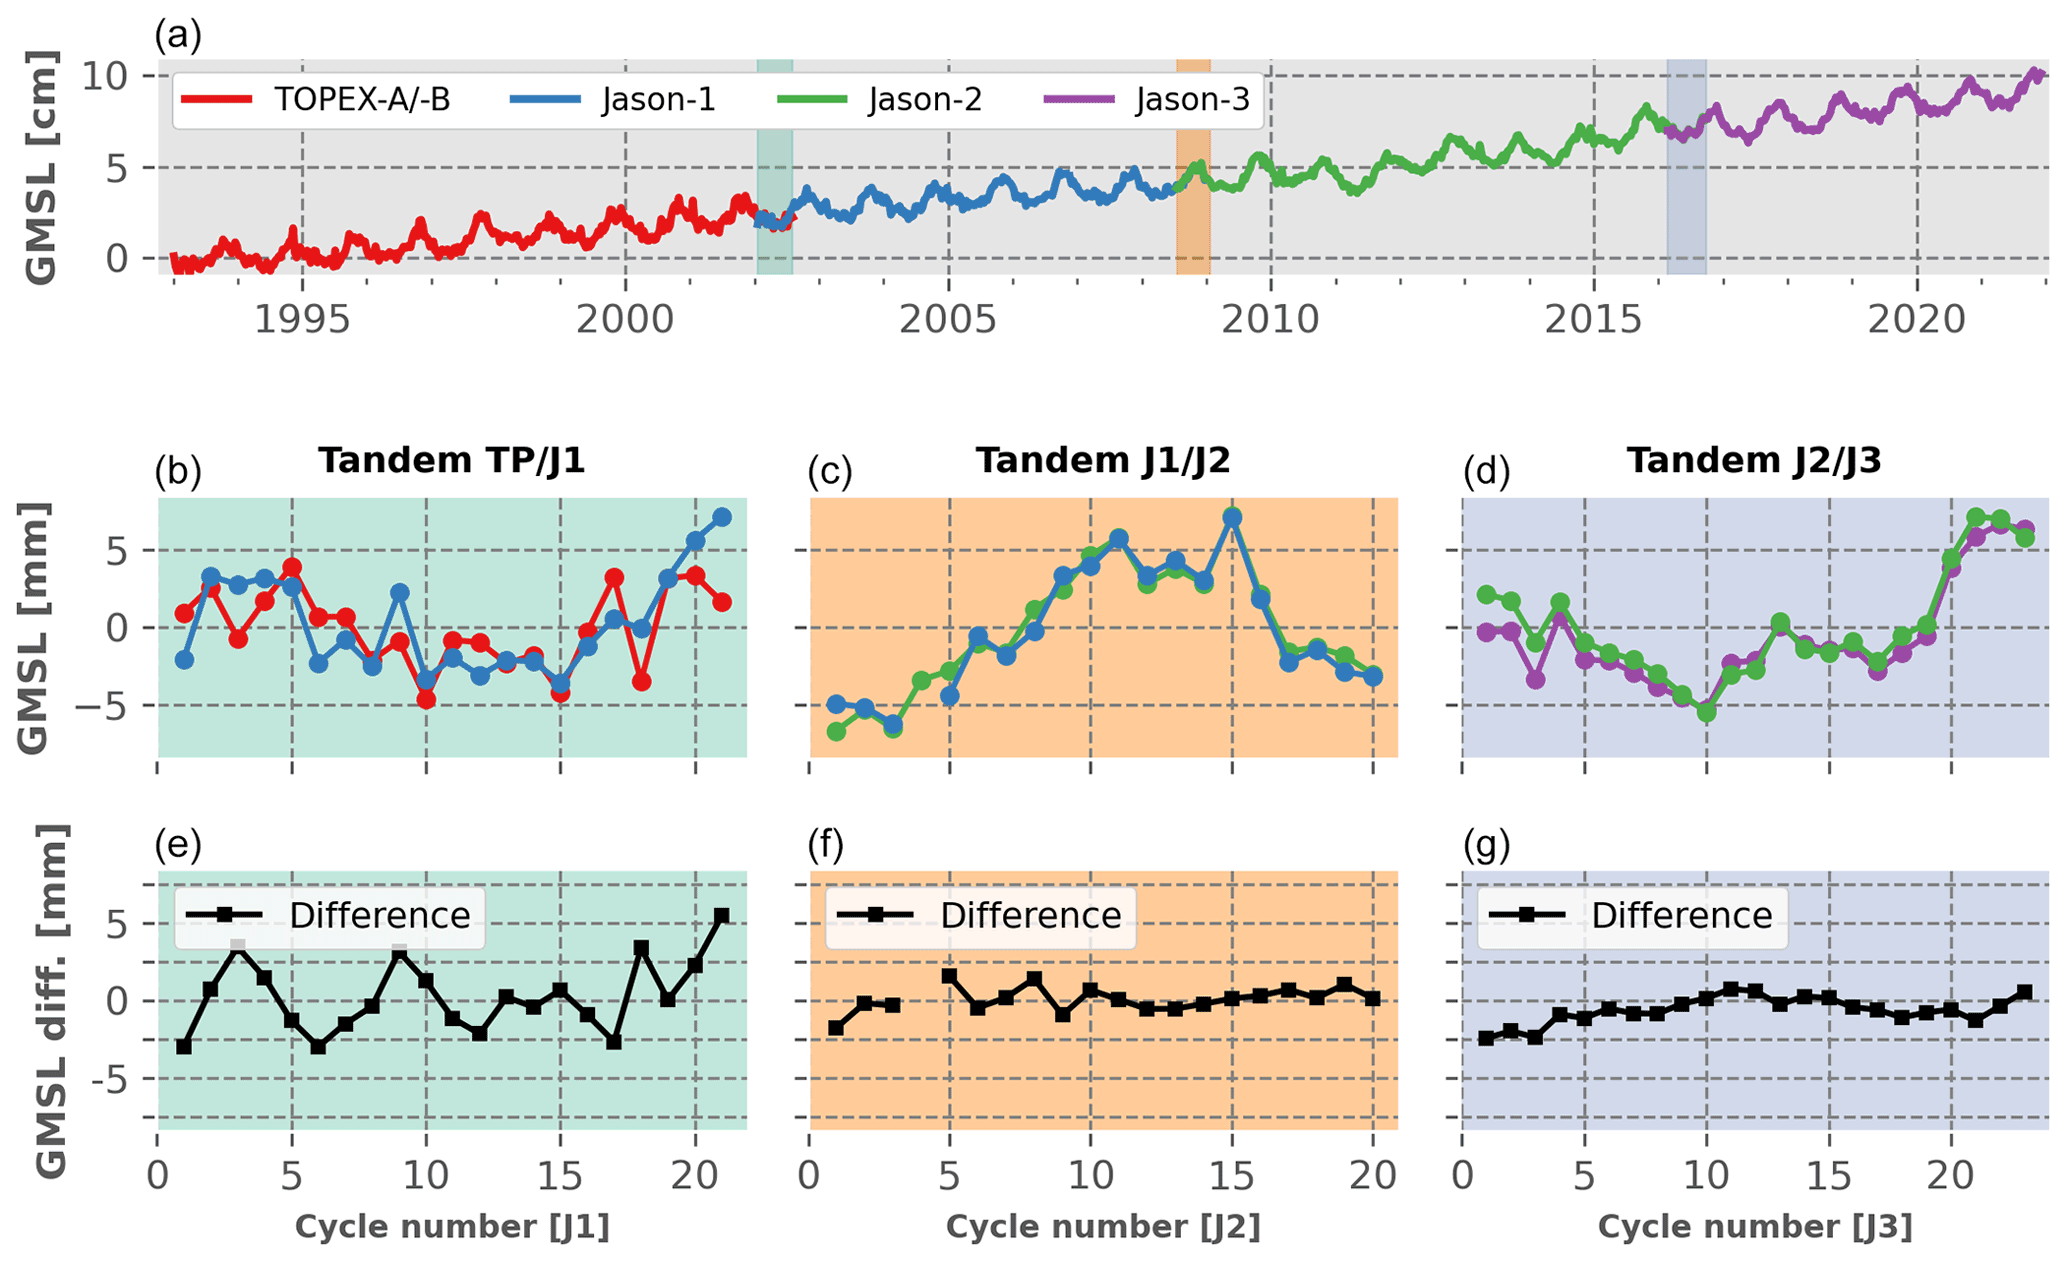
Figure 1GMSL record of the reference missions with a focus on the respective tandem phases. Panel (a) indicates the position in time of the respective tandem phases. Panels (b–d) show zooms on the GMSL records over the tandem phases, and (e–g) show the GMSL record differences between the two respective missions in tandem phase (the mean values of the time series have been removed to ease the comparison between tandem phases).
Figure 1 shows the GMSL time series of the four reference missions with a focus on their tandem phases. The bottom panels of Fig. 1 show that the difference in the GMSL time series over the tandem phases can be approximated, at first order, by a constant. For a specific mission switch, i.e. between J2 and J3 for instance, the intermission offset is thus simply estimated as the mean of the GMSL differences over all the tandem-phase cycles, i.e. the mean of the black curve on the bottom right panel of Fig. 1. As a consequence, statistically speaking, the uncertainty associated with this mean calculation is the uncertainty associated with the estimation of the mean of a population when only a sample of this population is known. In this situation, where the original population variance is unknown (we do not have more measurements than the tandem-phase samples), the Student law can be applied to describe the population's mean, such that
with the mean of the population, the mean of the sample, n the number of independent measurements of the sample, the Student coefficient for of freedom and a confidence level of α, and s the standard deviation of the sample. The uncertainty in the mean estimation is thus given by the second member of Eq. (1), which is in our case the GMSL intermission offset uncertainty we look for. It is important to note that for low values of n (typically lower than 30) Eq. (1) is valid if and only if (a) the sample population follows a normal law, and (b) the measurements are independent from each other.
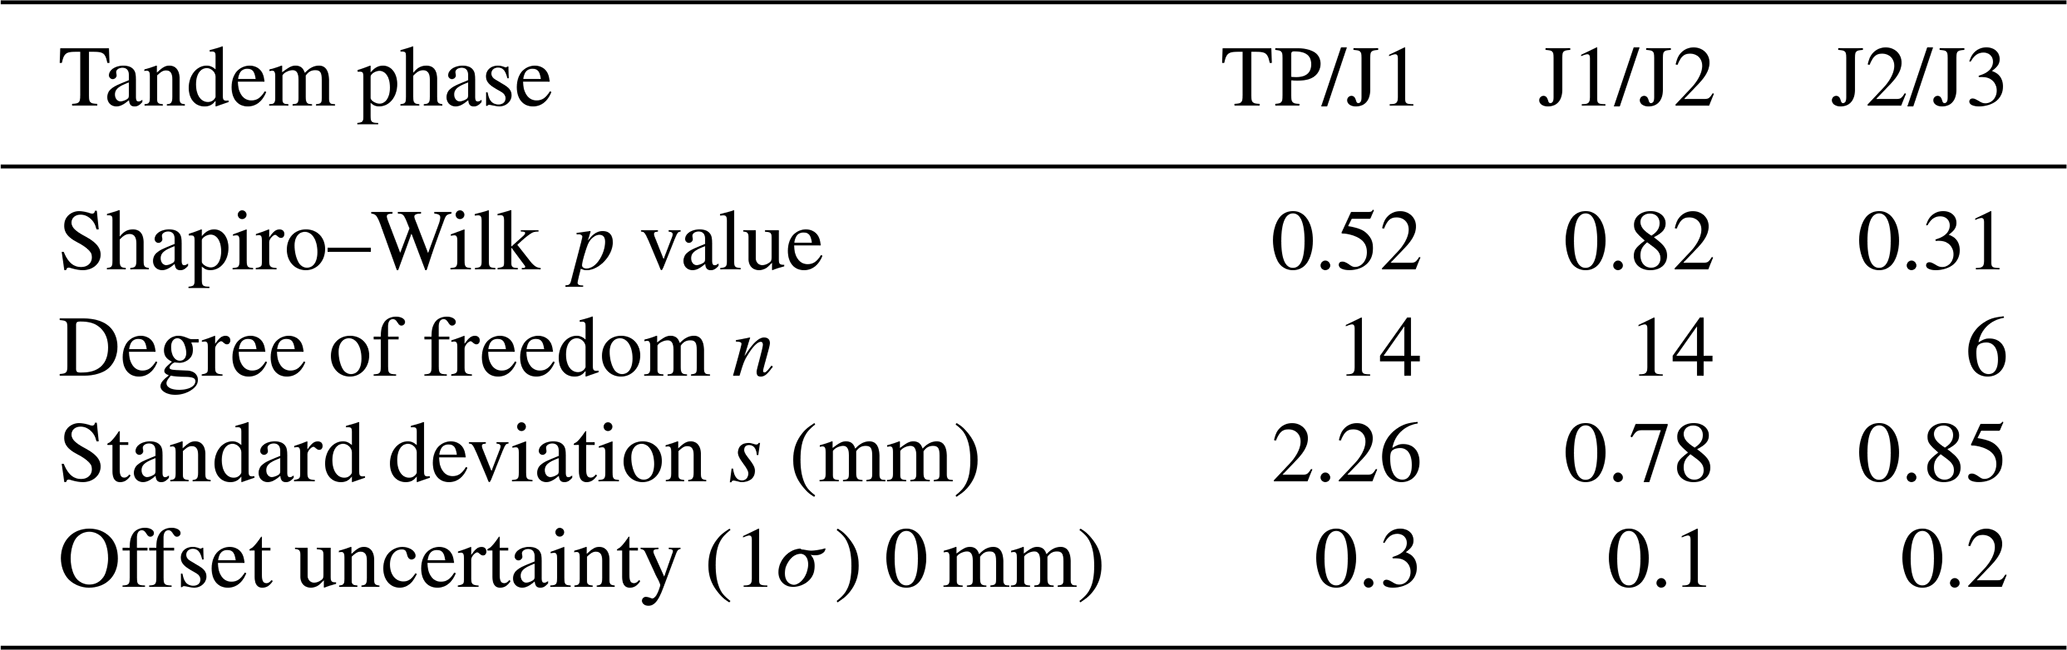
We performed Shapiro–Wilk tests for the three GMSL difference time series over the tandem phases and confirm that their distribution is not clearly non-Gaussian (i.e. p values greater than 0.05). To derive the number of independent measurements, we assumed that all the GMSL difference time series follow auto-regressive processes of the first order (AR1), and thus, the number of independent measurements can be estimated using the following equation (von Storch and Zwiers, 1999):
with ρ1 the auto-correlation of the population at lag 1 and nsample the total number of measurements of the sample. We note that assuming an AR1 process might overestimate the number of independent points and thus underestimate the offset uncertainties in the case where the processes would be of higher orders.
From Eqs. (1) and (2) we thus estimated the GMSL intermission offset uncertainties for the three tandem phases of the reference missions considering a varying number of cycles within each tandem phase. We found that the uncertainties are lowest when using all cycles available because the number of independent point increases. Resulting values are summarized in Table 3, along with their statistical characteristics.
The obtained offset uncertainties are lower than the ones from the previous CNES/AVISO+ GMSL record, i.e. 0.5 mm at 1σ (Zawadzki and Ablain, 2016), mainly due to the use of the whole tandem phase. We thus provide the L2P 21 GMSL record with corrected and adapted intermission offsets and uncertainties for each tandem phase. Note that the offset between the TP-A altimeter and the redundant TP-B altimeter has not been revisited. Values from the previous version of the CNES/AVISO+ GMSL are used that are based on Ablain et al. (2019).
2.2.2 GMSL global corrections
The reference GMSL record available on the AVISO+ website is provided with different optional global corrections that the user may use according to its need.
First, we provide for the first time the empirical correction to account for the TP-A altimeter drift well documented by the community (Valladeau et al., 2012; Watson et al., 2015; Dieng et al., 2017; Beckley et al., 2017; WCRP Global Sea Level Budget Group, 2018). We use the empirical correction proposed by Ablain et al. (2017) that can be approximated by a “V” shape of −1 mm yr−1 over the January 1993 and July 1995 period, and +3 mm yr−1 over the August 1995 and February 1999 period. The associated uncertainties are described in Table 4. Second, a global isostatic adjustment (GIA) correction of +0.3 m yr−1 is available over the entire data record to account for the post-glacial rebound of the earth crust (Spada, 2017). Finally, to get a relative GMSL time series from the L2P 21 GMSL record, as defined in Gregory et al. (2019), we warn the users that an additional correction needs to be applied to account for the deformation of the ocean bottom. This correction is not distributed on the AVISO+ website, but we refer the reader to Frederikse et al. (2017), Lickley et al. (2018) and Hakuba et al. (2021) to find the appropriate values.
For the rest of the paper, we use the reference L2P 21 GMSL record corrected for the TP-A altimeter drift as well as for the GIA correction. The resulting record covers the period from January 1993 to December 2021, hence providing a ∼29-year data record of the GMSL. The dataset is available to download at the following address: https://www.aviso.altimetry.fr/en/data/products/ocean-indicators-products/mean-sea-level/data-acces.html (last access: 28 November 2022).
2.3 GMSL measurement uncertainty budget
The CNES/AVISO+ GMSL record is delivered with an updated estimate of its measurement uncertainties following the method developed in Ablain et al. (2009) and extended in Ablain et al. (2019). This method is based on the construction of an uncertainty budget, as comprehensive as possible, of the GMSL time series itself. The uncertainty budget includes a description of the time covariance of the errors, which allows quantification of the uncertainty envelope of the GMSL time series as well as consistent estimation of its trend and acceleration uncertainties (see Sect. 2.4). Limitations of such an approach are discussed in Sect. 5. In particular, due to some lack of knowledge and the chosen empirical method, some geophysical signals are included in our measurement uncertainty budget that lead to an overestimation of these latter uncertainties.
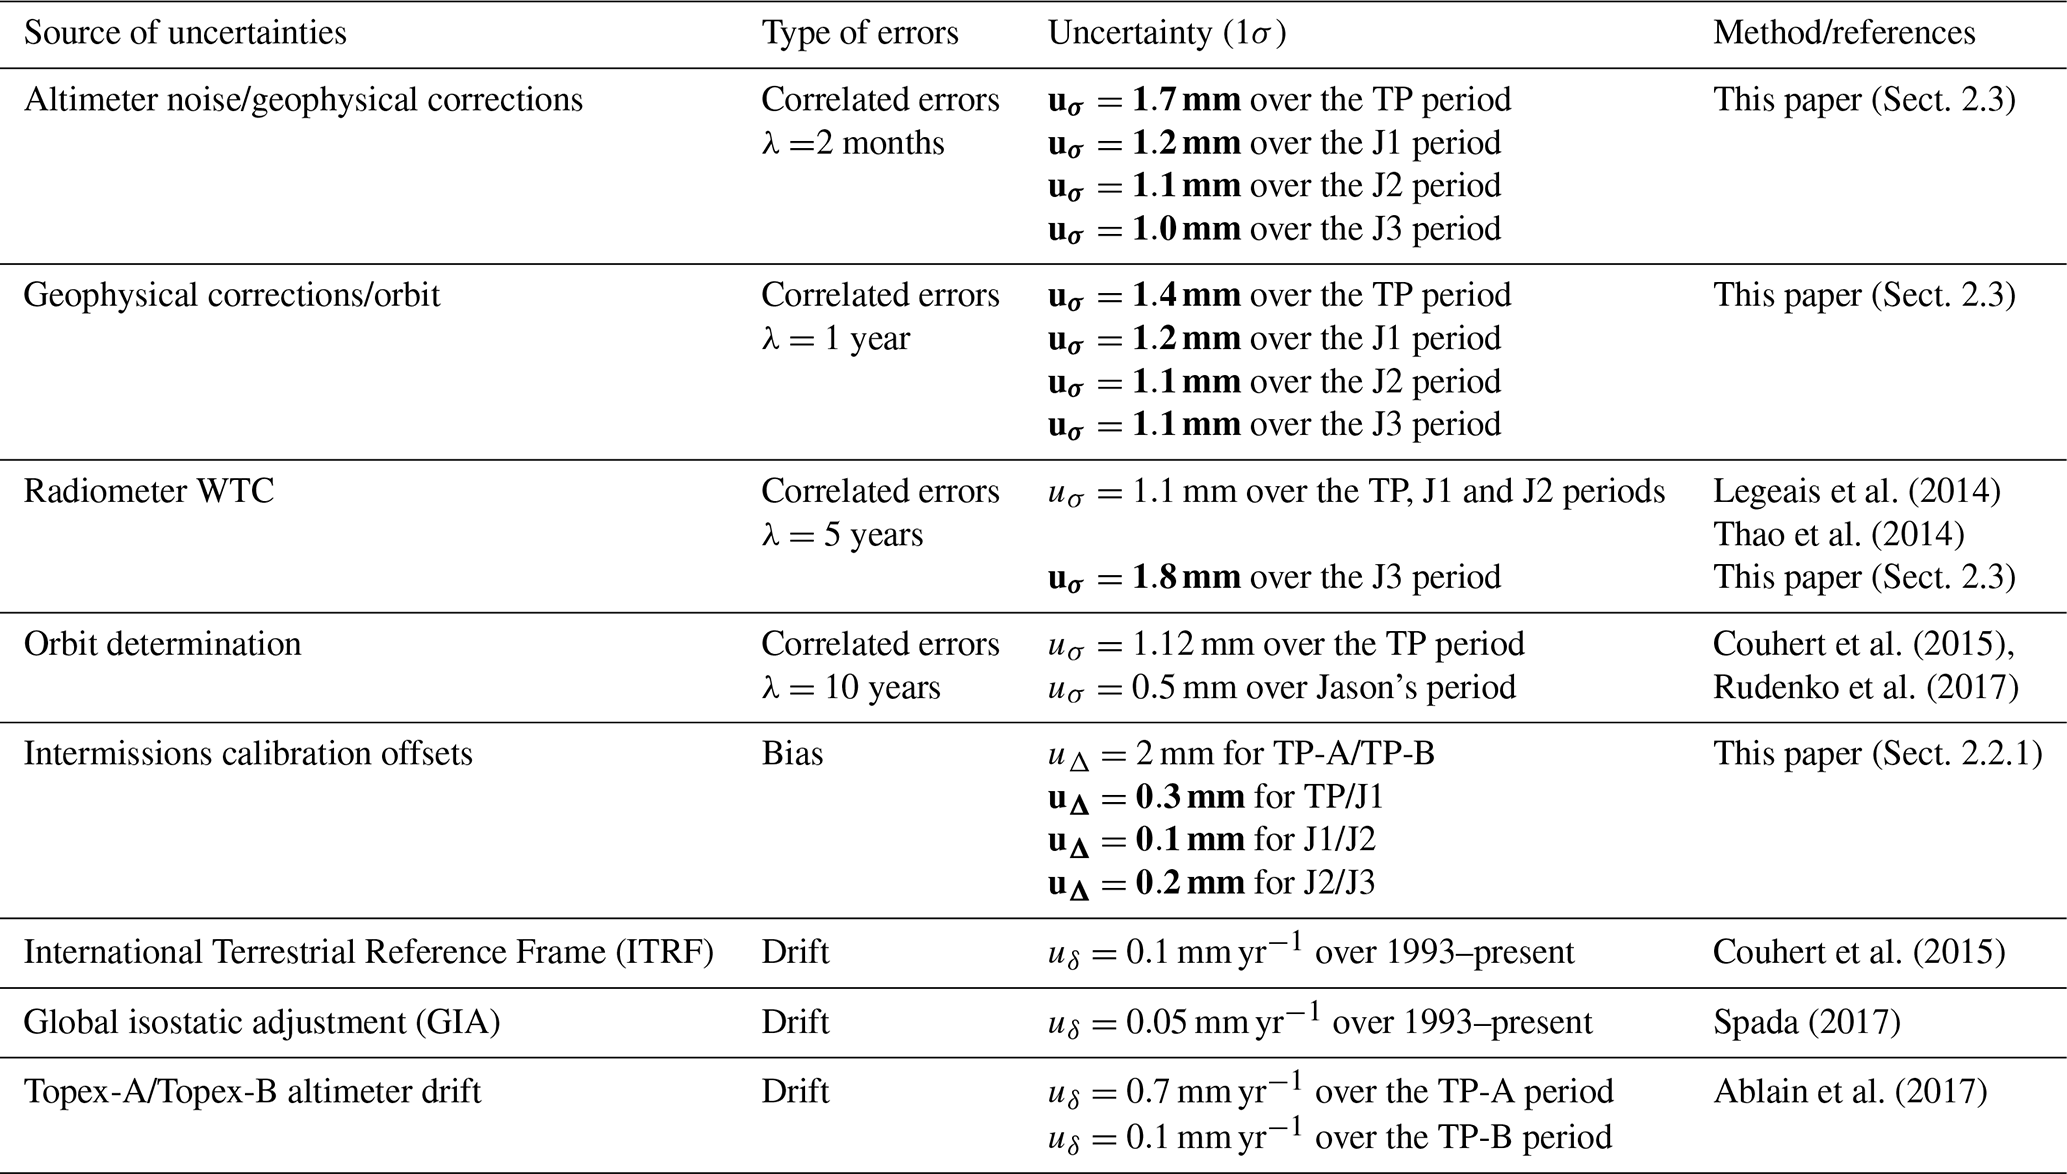
The main differences between the L2P 21 and L2P 18 GMSL version come from the use of new geophysical corrections (i.e. DAC, internal tide, MSS) as well as the use of the WTC from the on-board radiometer instruments of the J2 and J3 missions (see Sect. 2.1). Neither new altimetry missions nor reprocessing of their altimeter data has been used. Therefore, the sources of uncertainties that affect the L2P 21 GMSL record are the same as the ones presented in Ablain et al. (2019). The exact list is provided in Table 4. We recall that all the uncertainties considered are assumed to follow a Gaussian distribution and are independent from one another.
Table 3L2P 21 GMSL intermission offset uncertainties (1σ) as estimated in this paper. The results (bottom line) can be re-estimated with Eq. (1) and the different parameters given here.
However, the level of uncertainty for a few sources of uncertainties needs to be updated and adapted to the new L2P 21 GMSL record. This is the case of the correlated uncertainties at timescales of 2 months and 1 year, which are estimated empirically directly from a filtering of the GMSL time series (Sect. 3 in Ablain et al., 2019). We updated these sources of uncertainties by filtering the L2P 21 GMSL record in the same manner and obtained the values presented in the first two rows of Table 4. As compared to the L2P 18 GMSL, the correlated uncertainties at timescales of 2 months and 1 year of the L2P 21 record are of the same order of magnitude and/or lower. This is mainly due to the improvements of the geophysical corrections contained in the L2P 21 along-track products (see Sect. 2.1). It is important to recall here that this method tends to overestimate the true uncertainties in the GMSL record since it does not exclude any physical signals; i.e. some geophysical signal might be considered to be noise.
We also updated the uncertainty associated with the WTC over the Jason-3 period. Recent work by Barnoud et al. (2021) highlighted a potential long-term drift of the Jason-3 radiometer measurements when compared to SARAL/AltiKa and Sentinel-3A radiometers at cross-over points. The drifts observed are systematically positive (respectively 0.8 and 0.5 m yr−1) and larger than the typical radiometers drift uncertainties expected from altimetry missions, i.e. ±0.2 m yr−1 over a 5-year period (Ablain et al., 2009; Thao et al., 2014; Legeais et al., 2014). We thus decided to update the uncertainty associated with the WTC over the Jason-3 period. We took the most conservative value considering that the drifts observed in Barnoud et al. (2021) are equally due to any radiometers on board the three altimetry missions considered. As detailed in Table 4, we took a value of 0.8 m yr m yr−1 to quantify the WTC uncertainty over the J3 period. In practice, we prescribed a correlated error at a 5-year timescale that creates the same drift uncertainty as a drift error over a 5-year period (as in Ablain et al., 2019).
Legeais et al. (2014)Thao et al. (2014)Couhert et al. (2015)Rudenko et al. (2017)Couhert et al. (2015)Spada (2017)Ablain et al. (2017)Table 4L2P 21 GMSL uncertainty budget given at 1σ. The sources of uncertainties are based on the work of Ablain et al. (2019) and have not been changed. The values in bold are the ones updated as compared to the uncertainty budget of the previous CNES/AVISO+ GMSL record.
Finally, we updated the uncertainties associated with the GMSL intermission offsets as presented in detail in Sect. 2.2.1. As for the intermission offset uncertainty between TP-A and the redundant altimeter TP-B, we use the value of 2 mm at 1σ from Ablain et al. (2019); see Table 4.
2.4 Estimation method of the GMSL trend, acceleration and uncertainties
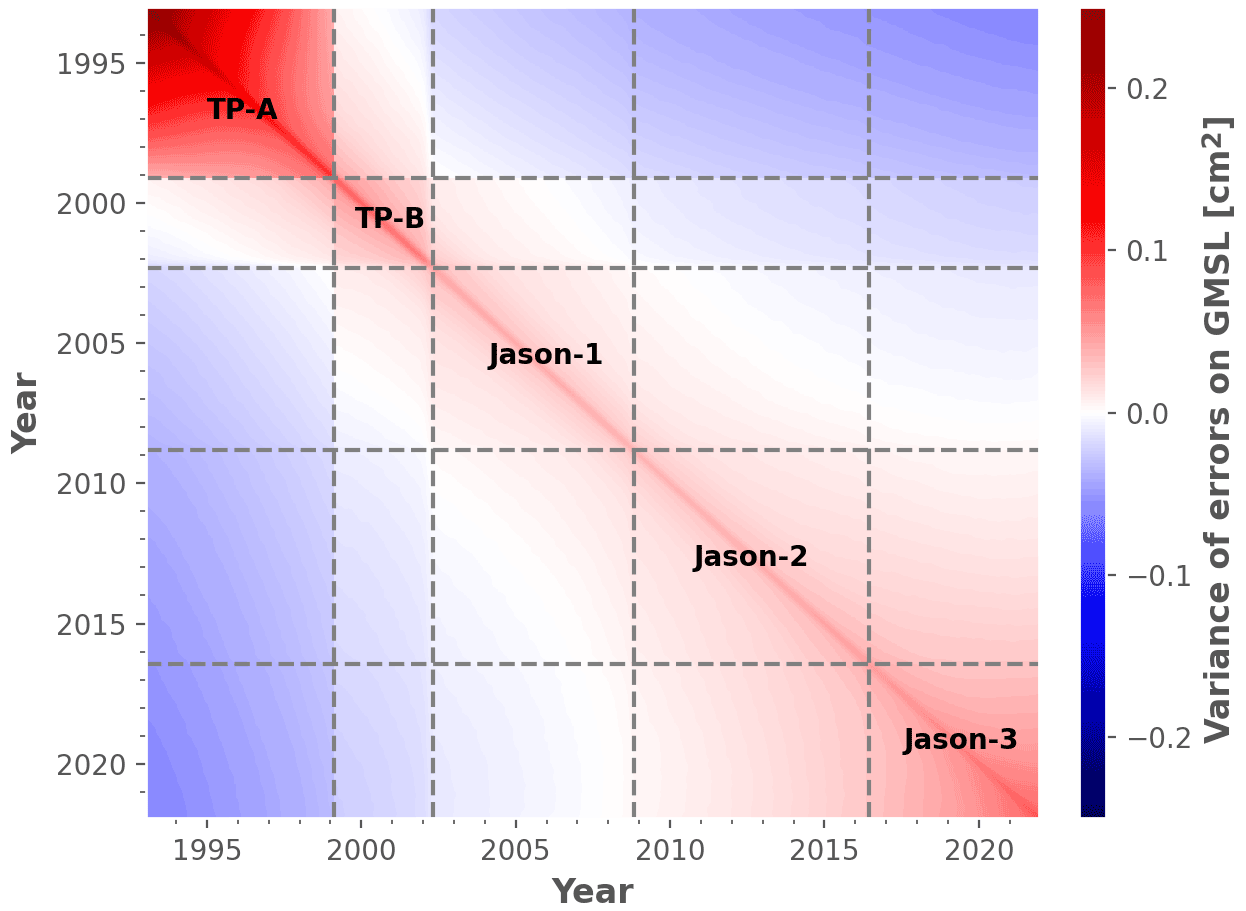
To estimate the sea level rise and acceleration of the L2P 21 GMSL record, we first apply a 2-month low-pass Lanczos filter to the time series. We then fit a quadratic regression model to the filtered time series following an ordinary least square (OLS) approach, as described in Sect. 6 in Ablain et al. (2019). This regression model also contains semi-annual and annual signals that are adjusted simultaneously (i.e. amplitudes and phases) through the OLS estimator. We use the GMSL measurement uncertainty budget established in Sect. 2.3 to construct a variance–covariance matrix (Sect. 4 in Ablain et al., 2019) that we use, through the OLS estimator, to estimate the uncertainty envelope of the GMSL record, as well as its trend and acceleration uncertainties. We highlight here that such a model is not meant to attribute sea level rise to any sources (natural and/or anthropogenic) and cannot be extrapolated to forecast future sea level rise. Figure 2 shows the variance–covariance matrix of the L2P 21 GMSL record.
We recall from Ablain et al. (2019) that the main advantages of using such an OLS estimator for climate variables, as in Ribes et al. (2016) and Hartmann et al. (2013, see Sect. 2. SM.3.1 therein), are that (i) OLS is consistent with previous estimators of GMSL trends as well as estimators of trends in other essential climate variables than GMSL and that (ii) the OLS best estimate does not depend on the estimated variance–covariance matrix. This also means that the uncertainty estimates only depend on the variance–covariance matrix construction. We tested a GLS estimate on a yearly average GMSL time series (for which the variance matrix is invertible) and checked that the result is very close to the OLS estimate. However, we used an OLS estimator rather than a GLS since we are less sensitive to numerical instabilities. To reproduce the variance–covariance matrix and the OLS estimates presented here, we point to Prandi et al. (2021), who published online code based on the same theoretical approach as ours.
This section presents the L2P 21 CNES/AVISO+ GMSL record, its trend and acceleration estimates along with their measurement uncertainties. The analysis is based on the data detailed in Sect. 2.2 that we filtered with a 2-month low-pass filter and from which we removed the semi-annual and annual components (see Sect. 2.4). We recall that corrections for the GIA and TP-A drift have also been applied (see Sect. 2.2.2).
3.1 GMSL record and its measurement uncertainty envelope
Figure 3 shows the L2P 21 GMSL record (red curve) along with its 90 % C.L. uncertainty envelope. The uncertainty envelope is derived by taking the square roots of the diagonal terms of the variance–covariance matrix (see Fig. 2) obtained from the uncertainty budget presented in Sect. 2.3. A direct comparison to the former L2P 18 version is shown in the top panel of Fig. 3. Differences of the order of 1–2 mm can be observed, with an annual and semi-annual signal pattern, mainly due to the changes in geophysical standards (see Sect. 2.1). The larger differences over the TP period (∼2 mm) are consistent with the larger variability in the TP record (see the high-frequency errors in Table 4). A peak of ∼4 mm is also visible in 2013 and corresponds to cycle 174 of Jason-2, where a large number of tracks are flagged as invalid in both GMSL record versions. The GMSL value of this cycle is thus highly sensitive to change in the geophysical standards as the number of points used to get the GMSL average is low. All these differences are well within the 90 % C.L. uncertainty envelope and do not generate any significant changes in decadal GMSL trends and accelerations (see also Sect. 3.2).
In Fig. 4, we show the uncertainty envelopes at the 90 % C.L. level for both the L2P 21 and L2P 18 GMSL records. The general shape of the uncertainty envelope is a parabola centred around the central time of the data record, with the largest uncertainties during the TP period (4–8 mm), smallest uncertainties during the J1 and J2 periods (3–4 mm), and increasing uncertainties at the end of the data record (J3; 4–5 mm). We recall from Ablain et al. (2019) that we obtain minimum GMSL uncertainties in the central period of the time series as it benefits from prior and posterior measurements. It actually corresponds to the date when the errors and their cumulative time correlation are the smallest.
Compared to the L2P 18 uncertainty envelope, Fig. 4 shows that the uncertainty envelope of the L2P 21 GMSL record is smaller by ∼0.5 mm during the J1 period and by ∼0.2 mm during the J2 and J3 periods. This is a direct consequence of the lower uncertainties correlated at 2 months and 1 year measured on the L2P 21 GMSL for these missions (see Table 4). We also note a larger increase in the uncertainty envelope over the J3 period that corresponds to the larger uncertainty in its radiometer WTC (see Sect. 2.3 and Table 4). Finally, we observe changes in the uncertainty envelope at the connection between missions between the two versions of the GMSL records. This is due to a combination of the (i) improvements of the intermission offset uncertainties and (ii) smaller and larger uncertainty differences between two consecutive missions for the correlated errors at 2 months and 1 year.
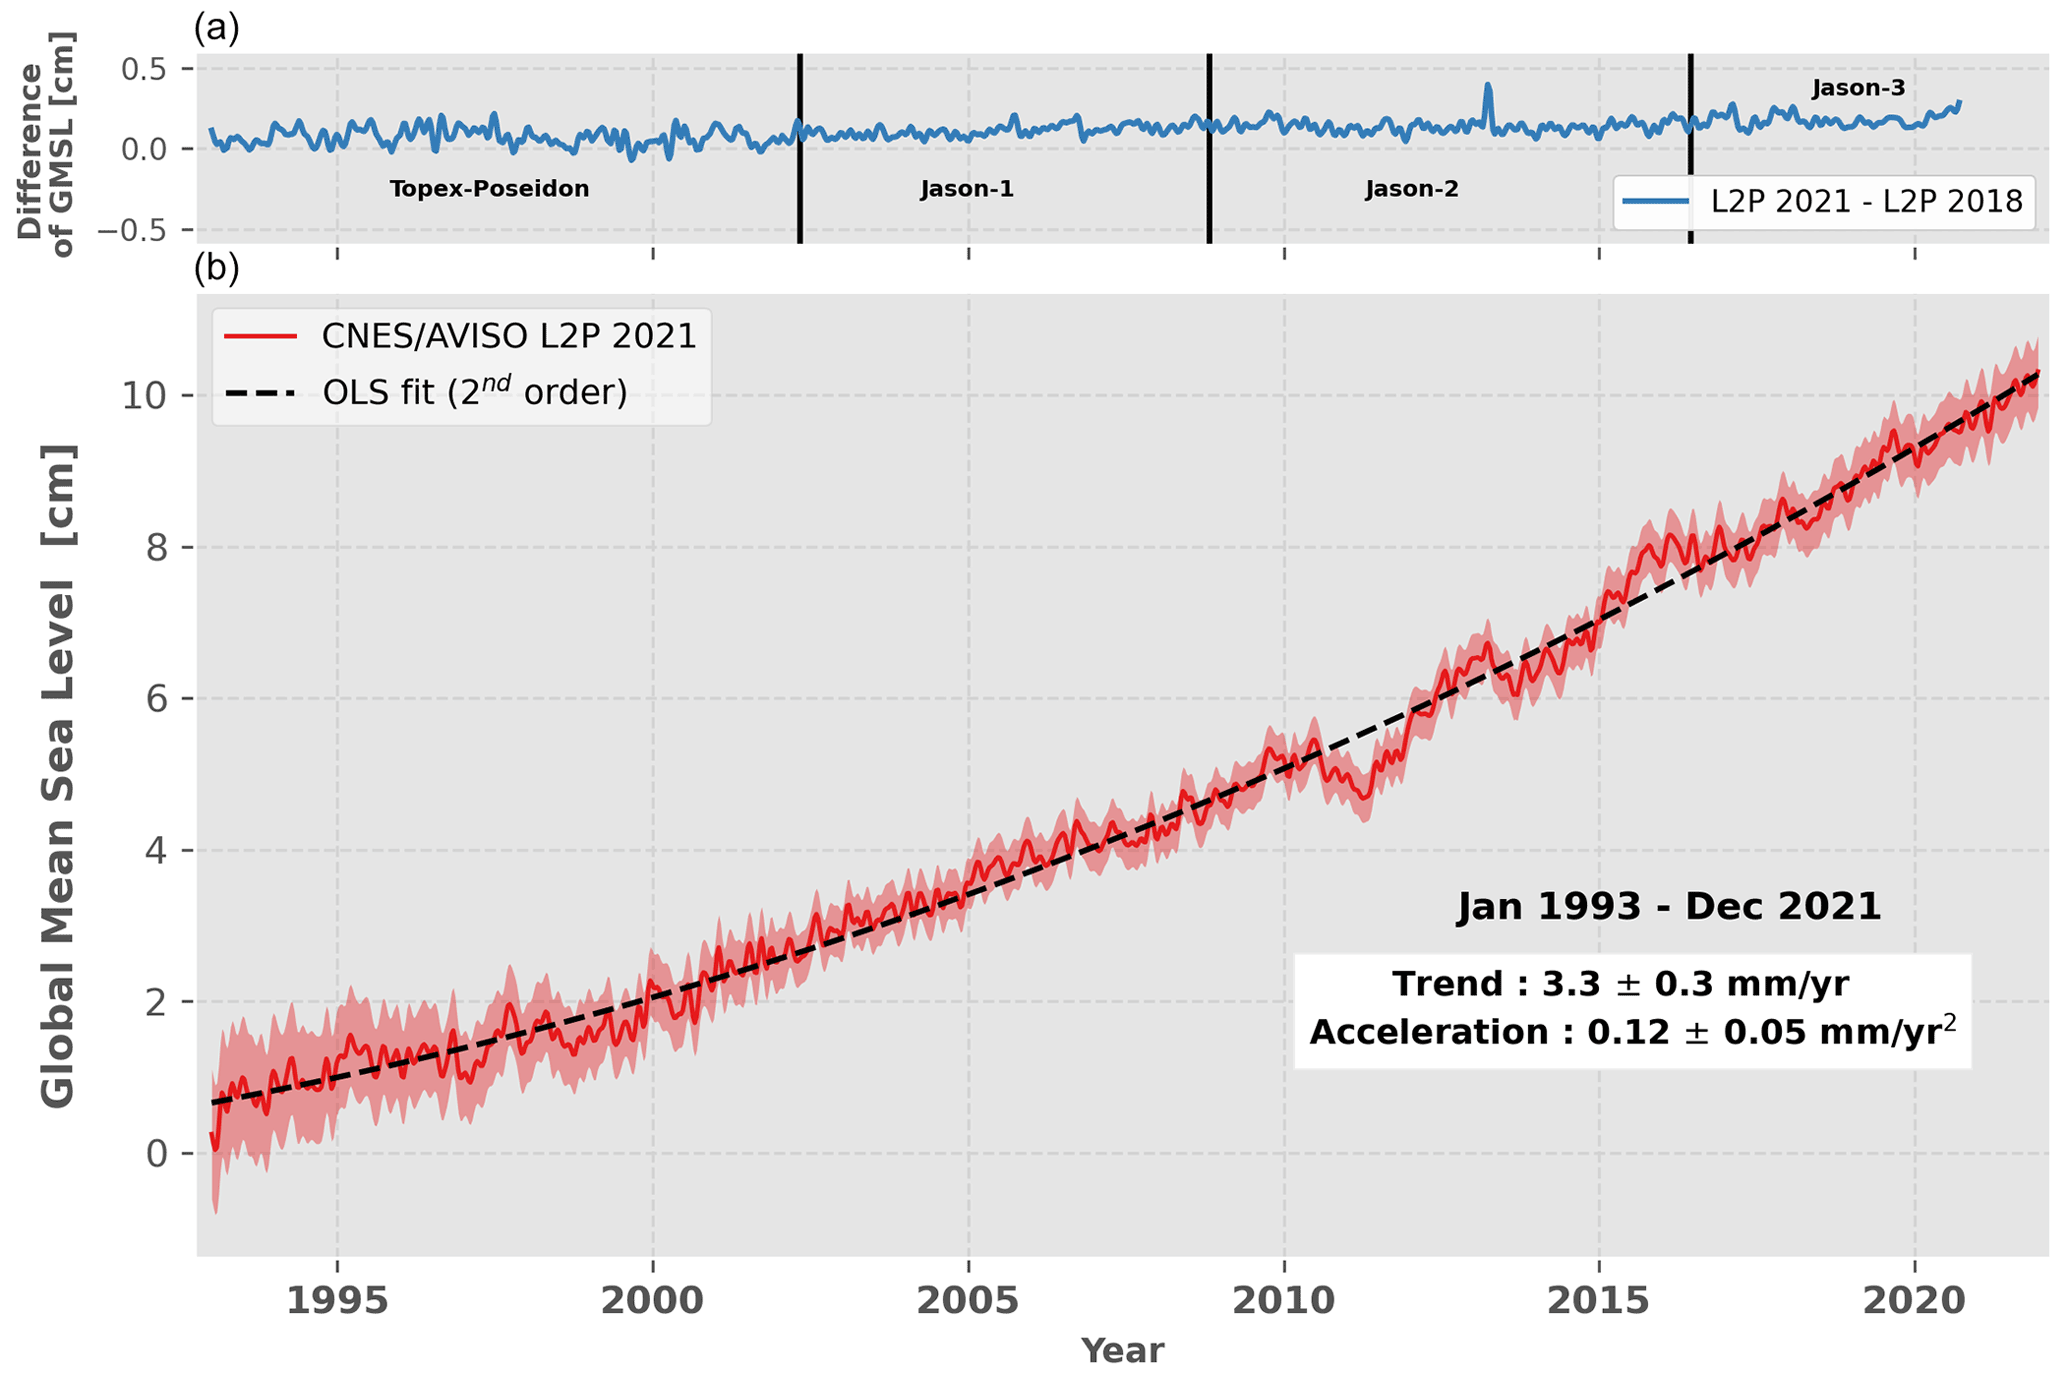
Figure 3(b) CNES/AVISO+ L2P 21 GMSL record and its associated uncertainties. The record has been corrected for TP-A drift as well as for the GIA. Seasonal signals are removed, and the time series is 2-month-filtered. The uncertainty envelope (shaded red area) is given at the 90 % C.L. (1.65σ), as for the trend and acceleration uncertainties indicated in the white box. (a) Comparison of the L2P 21 GMSL record with its previous version, i.e. L2P 18. Vertical dashed lines indicate the dates of switch between altimetry missions.

Figure 4Comparison of the uncertainty envelopes (1.65σ) between the L2P 21 and L2P 18 GMSL records. The values shown correspond to the half-width of the confidence interval. The vertical lines indicate the switches of mission.
Figure 5 shows the comparison between the L2P 21 GMSL record and four other solutions: NASA GSFC v5.1 (https://doi.org/10.5067/GMSLM-TJ151), NOAA STAR, University of Colorado and CSIRO. All solutions agree within the uncertainty envelope (90 % C.L.) of the L2P 21 record. This is also true for the trend and acceleration of all solutions over the period January 1993–December 2021. However, systematic differences appear, especially with the CSIRO solution, as well as larger discrepancies during the TP-A period with all solutions. This is not surprising regarding the different issues affecting this mission and the various corrections chosen by the different groups. Nevertheless, the uncertainty budget developed in this study well captures this variety, giving confidence in its robustness.
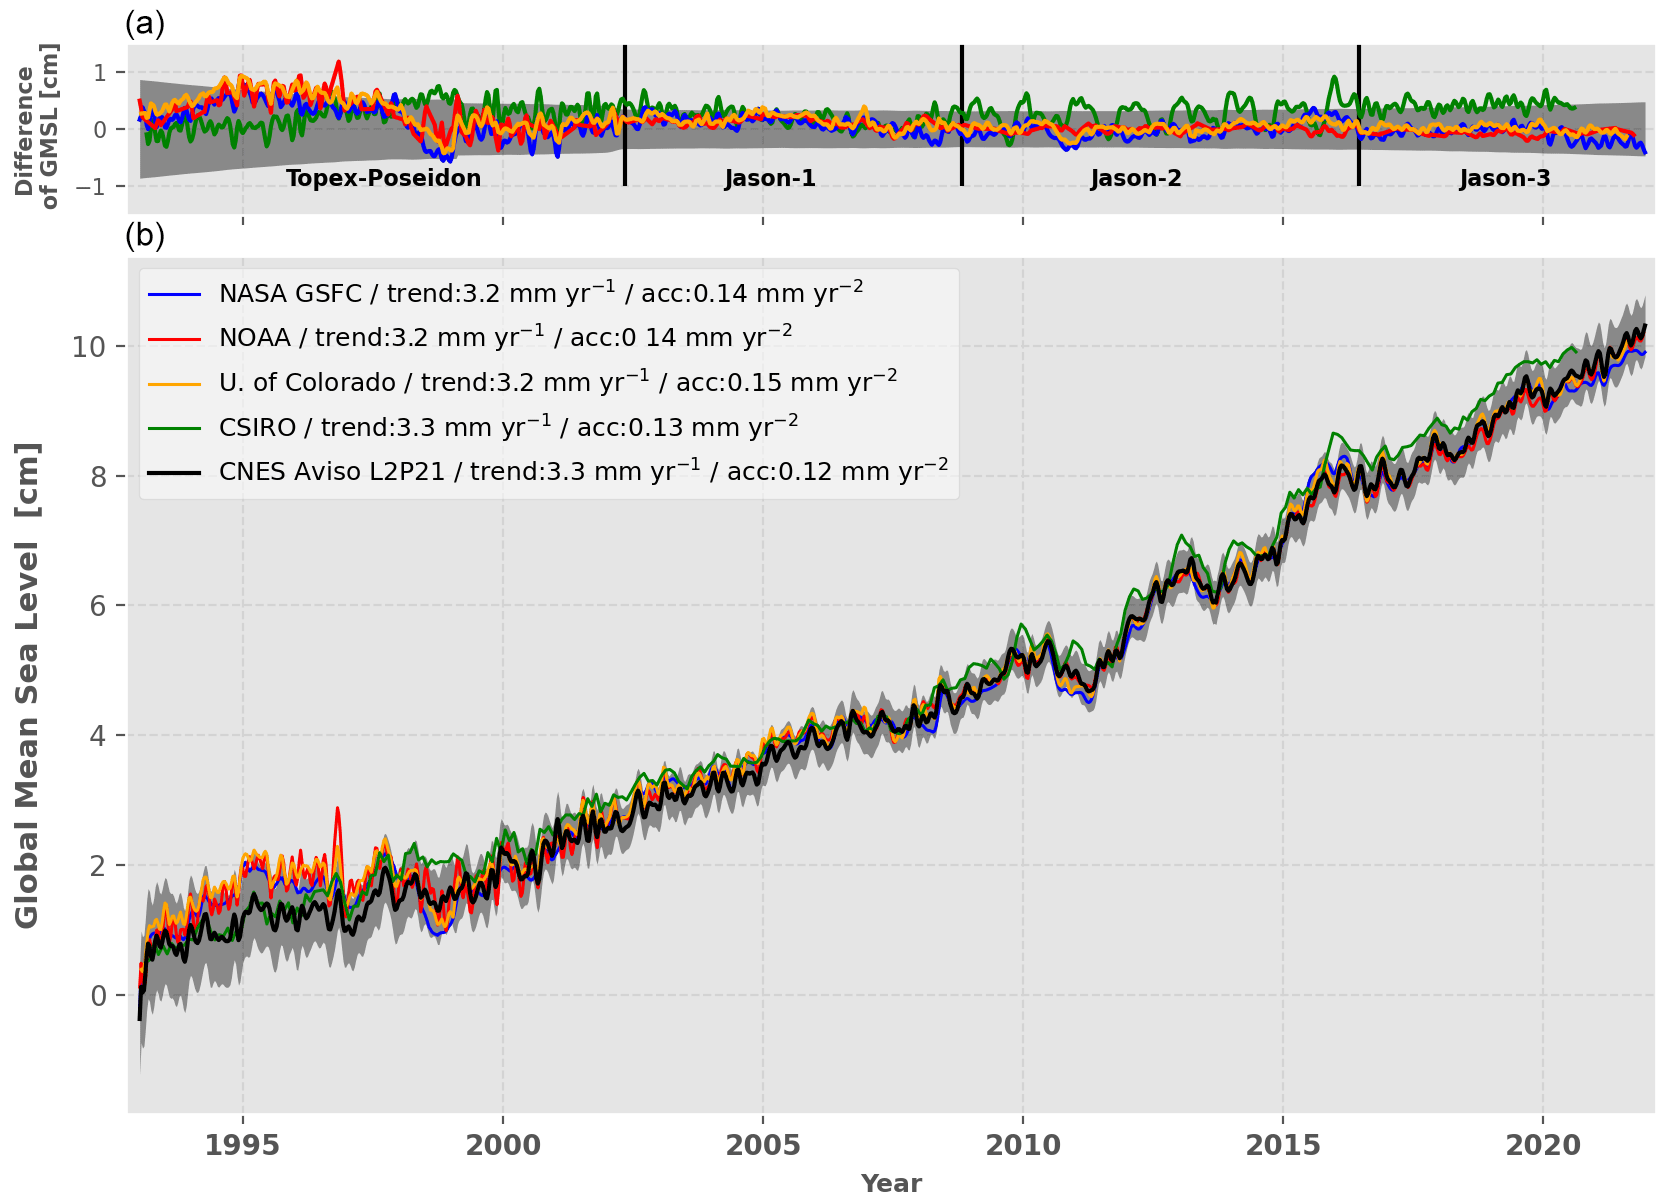
Figure 5(b) Comparison of the CNES/AVISO+ L2P 21 GMSL record with other solutions: NASA GSFC v5.1, NOAA STAR, University of Colorado, CSIRO. All the records have been corrected for TP-A drift as well as for the GIA. Seasonal signals are removed, and the time series are 2-month-filtered. The uncertainty envelope of the CNES/AVISO+ L2P 21 GMSL (shaded grey area) is given at the 90 % C.L. (1.65σ). (a) Difference between the L2P 21 GMSL record and the other respective solutions. Vertical dashed lines indicate the dates of switch between altimetry missions.
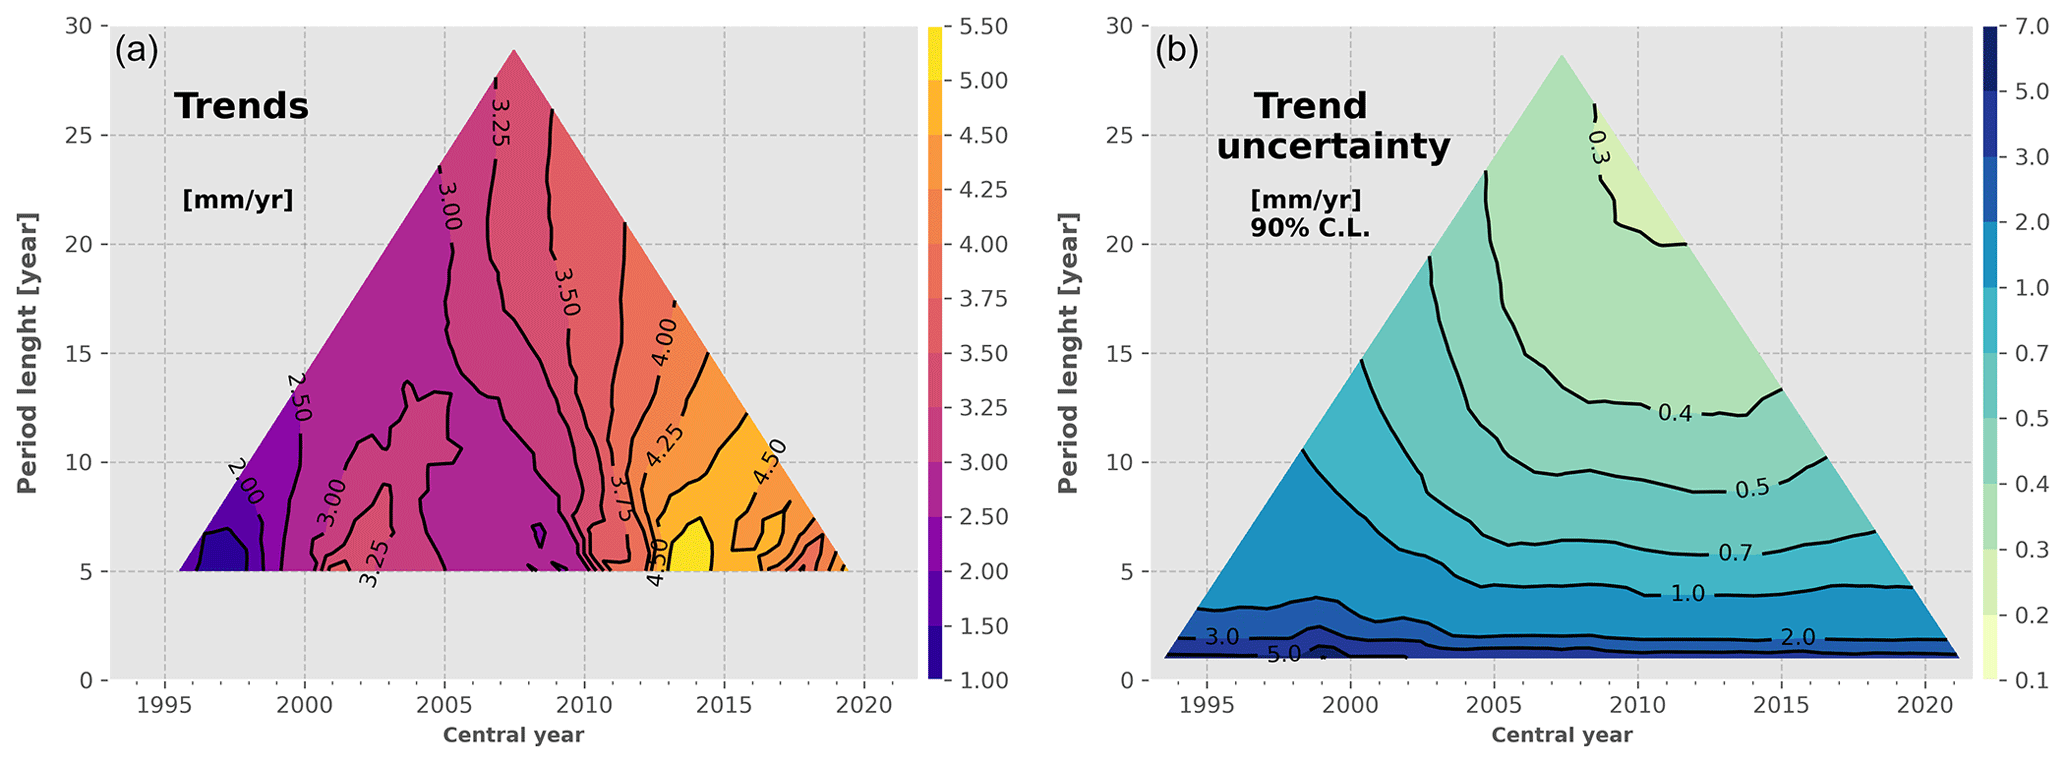
Figure 6GMSL trends (a) and trend uncertainties (b) of the L2P 21 product estimated for all period lengths between 5 years and the total altimetry record (January 1993 to October 2021). Only the significant values (i.e. above uncertainties) are shown. The x axis corresponds to the central year of the considered period (y axis). The uncertainties are shown at the 90 % confidence level.
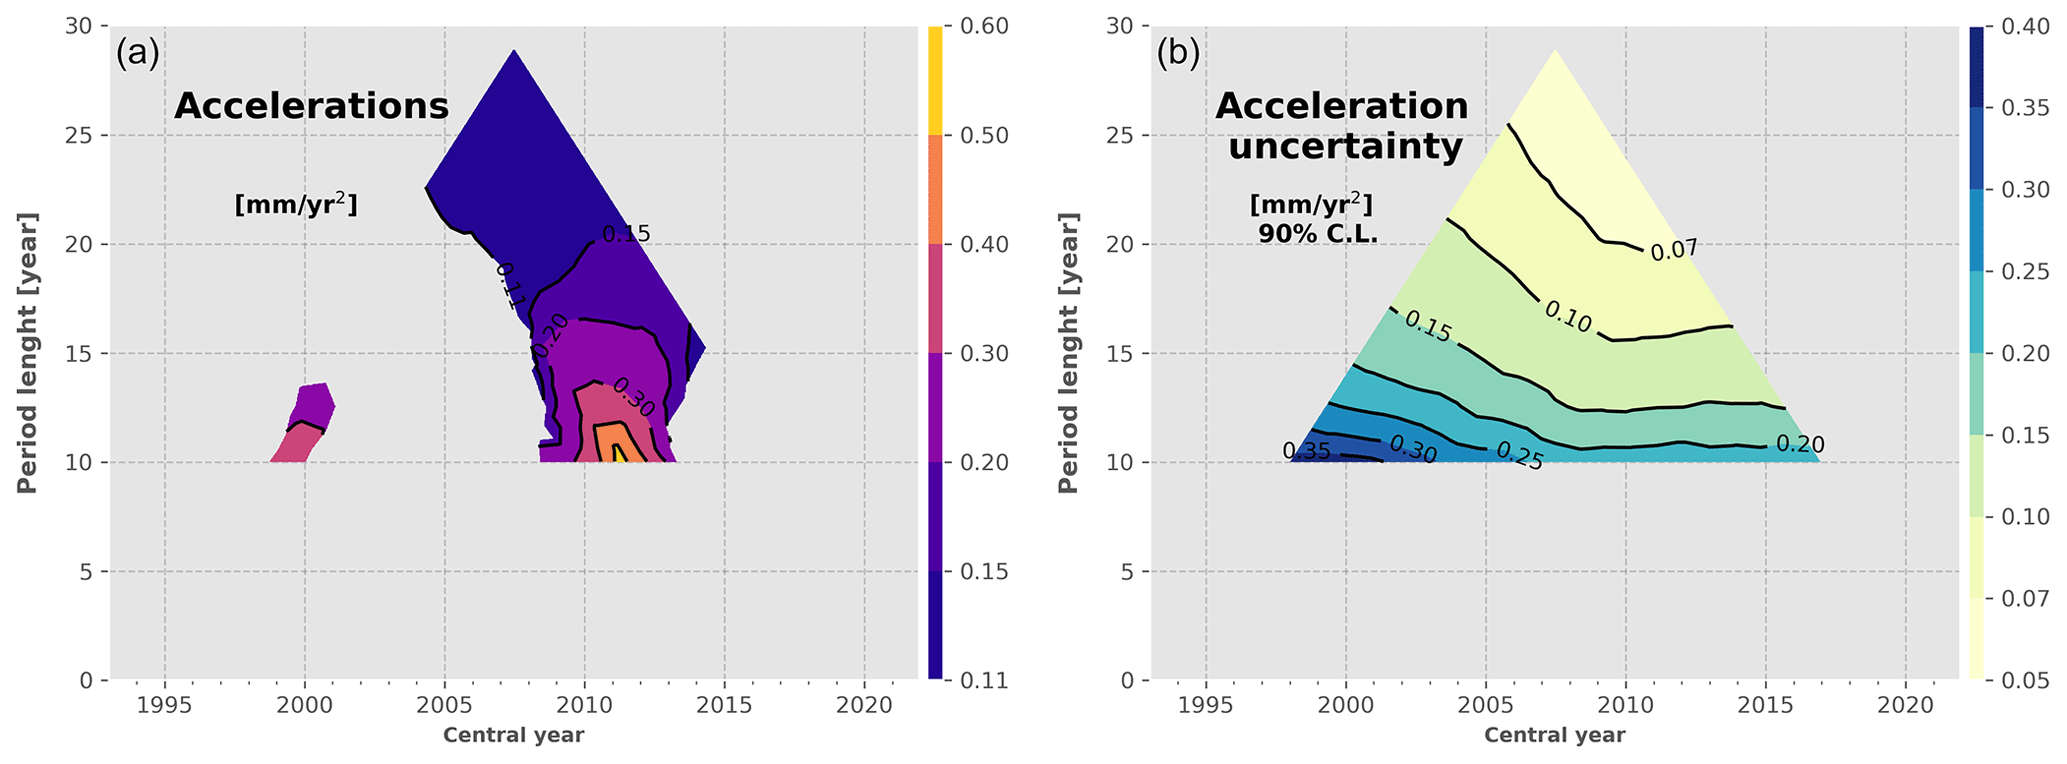
Figure 7GMSL accelerations (a) and acceleration uncertainties (b) of the L2P 21 product estimated for all period lengths between 10 years and the total altimetry record (January 1993 to October 2021). Only the significant values (i.e. above uncertainties) are shown. The x axis corresponds to the central year of the considered period (y axis). The uncertainties are shown at the 90 % confidence level.
3.2 GMSL rise, acceleration and measurement uncertainties
As shown in Fig. 3, we estimate the GMSL rise over the 29 years of the altimetry record, from January 1993 to December 2021, to 3.3 ± 0.3 m yr−1. We estimate the acceleration of the GMSL rise to 0.12 ± 0.05 m yr−2 which confirms previous analysis in the literature demonstrating that the GMSL record is accelerating (Watson et al., 2015; Dieng et al., 2017; Beckley et al., 2017; Nerem et al., 2018; Ablain et al., 2019; Veng and Andersen, 2020). The trend and acceleration estimates of the previous L2P 18 GMSL record, over the period January 1993 to October 2017, also corrected for the TP-A drift, were 3.1 ± 0.4 and 0.12 ± 0.07 m yr−2, respectively (Ablain et al., 2019)
Based on the approach described in Sect. 2.4, we estimated the GMSL rise and acceleration, as well as their uncertainties, for any time span between 1 year and 29 years included in the period covered by the data. The results are shown in Fig. 6 for the trends and in Fig. 7 for the accelerations. The top points of the triangles thus correspond to the total length of the data record. Uncertainty values are given at the 90 % C.L., and only the respective significant values of sea level rise and/or acceleration are shown (e.g. larger than the uncertainties).
Figure 6 shows that the GMSL rise is significant at the 90 % C.L. for any period longer than 5 years. For shorter periods, the GMSL trends are mostly lower than their respective uncertainties, i.e. 1–2 m yr−1. For periods longer than 5 years, the GMSL rise ranges from 2.5 to 5.5 m yr−1, with the largest values centred around 2014 for periods of 5–8 years. Regarding the GMSL trend uncertainties, the diagram shows a similar pattern as in Ablain et al. (2019): the longer the period, the smaller the trend uncertainty, with a steep inflection of the iso-uncertainty lines as the central year gets towards the TP period. This behaviour is due to the large contributions of the TP drift uncertainties and the intermission offsets uncertainty between TP-A and TP-B to the total GMSL uncertainty budget (see Appendix A and Sect. 5 for more details). We also observe a small inflection of the iso-uncertainty lines from 2015 onwards that corresponds to the increase in the uncertainty of the WTC of J3 as compared to other missions. It is interesting to note that the minimum GMSL trend uncertainty is less than 0.3 m yr−1. It is reached for the 24-year period centred in 2010.
On the acceleration, we observe in Fig. 7 that the GMSL acceleration is significant only for some periods longer than 10 years, mostly centred around 2011. When significant, the acceleration ranges from 0.12–0.60 m yr−2. The largest values are reached for the smallest period considered (i.e. 10 years centred around 2011), suggesting that these large acceleration values are caused by the internal variability of the climate system. The uncertainties of the GMSL acceleration range from 0.05–0.35 m yr−2. A small inflection of the iso-uncertainty lines is observed over the TP period that is due to the large uncertainties associated with this mission in our uncertainty budget (see Sect. 2.3), as for the GMSL trend uncertainties.
Accuracy and stability requirements of the GMSL record have been stated in the literature to allow scientific questions on climate change to be answered. The two intergovernmental organizations, the Global Climate Observing System (GCOS) and the Intergovernmental Panel on Climate Change (IPCC), have published their recommendation about the GMSL trend uncertainty stability: 0.3 m yr−1 (90 % C.L.) over 10-year periods. Based on the analysis of the GMSL trend uncertainty presented in Sect. 3.2, we find that the L2P 21 CNES/AVISO+ GMSL record does not meet the requirement. To our knowledge, none of the GMSL records distributed in the literature meet this requirement.
To identify the limiting factors to the GMSL monitoring stability highlighted above, we here investigate the relative contribution of each uncertainty budget contributor to the total GMSL measurement uncertainty budget. The aim is to identify the main contributors and thus be able to suggest key topics of investigations to tame the measurement uncertainties and get closer to the stability requirements.
To do so, we derive for each contributor to the GMSL uncertainty budget presented in Sect. 2.3 the GMSL trend variance induced by the contributor on its own (i.e. as if it were the only source of uncertainty). Since we assumed that each source of uncertainty is independent from one another, the total GMSL trend variance is the sum of each variance contributor. As a consequence, one can obtain the contribution (in percent) of each source of uncertainty to the total GMSL trend uncertainty by simply dividing the GMSL trend variance of the respective contributor by the total GMSL trend variance. We perform this operation for each contributor listed in Table 4 and for all periods of the uncertainty diagram. The results are shown in detail in Appendix A, and we here focus on the 10-year periods (Fig. 8) and 20-year periods (Fig. 9).
Figure 8 shows that the trend requirement (0.3 m yr−1) is not achieved for any of the 10-year periods over the altimetry record, the lowest trend uncertainty being 0.45 m yr−1 for periods centred around 2012. In the first years of the record, the main contributors to this uncertainty level (bottom panel) are the TP drift uncertainties (from 50 % and decreasing) and the intermission offset between TP-A and TP-B (reaching up to 30 % in 2001). For the 10-year periods centred after 2004, the latter two sources contribute to less than a few percent, and three other sources start to account for more than 80 % of the GMSL trend uncertainty: the radiometer WTC and the correlated errors at 2 months and 1 year. The correlated errors at 2 months and 1 year are derived from the variance of the total sea level signal at 2 months and 1 year assuming that at these timescales the signal can be overwhelmed by noise. As such, the exact sources that create the uncertainties at 2 months and 1 year are unknown. Given our conservative method to estimate them, they likely include some actual geophysical signals, and thus, they are likely overestimated. For periods centred after 2008, the radiometer WTC and the uncertainties correlated at 1 year become the major contributors (30 %–40 % each), whereas the contribution of the 2-month correlated errors decreases to ∼10 %. Regarding the systematic drift uncertainties, the GIA uncertainty does not contribute to more than 5 % over the full GMSL record, whereas the ITRF uncertainty contributes up to ∼ 15 % at the end of the altimetry record, as much as the 2-month correlated errors. Finally, the orbit determination uncertainties contribute to less than 5 % and are thus not a major contributor to the sea level trend estimates at the global scale.
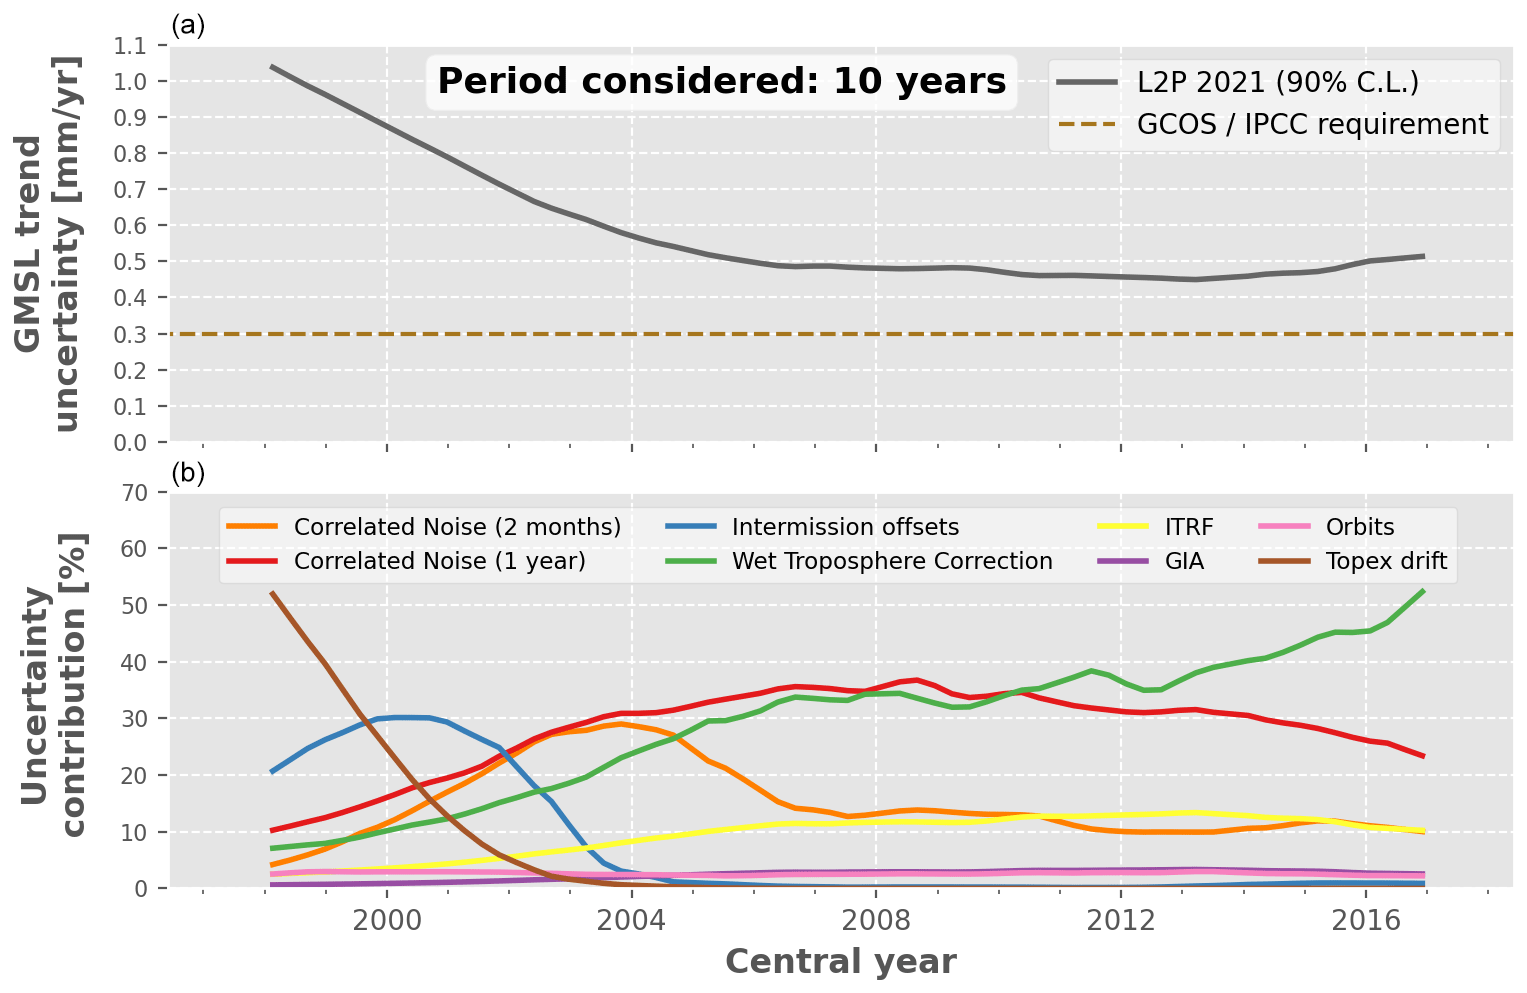
Figure 8Relative contribution of each uncertainty budget contributor to the GMSL trend uncertainty over periods of 10 years. (a) GMSL trend uncertainty in the L2P 21 record. The horizontal dashed brown line shows the GCOS/IPCC requirement for the GMSL trend stability, i.e. 0.3 m yr−1 (90 % C.L.). (b) Relative contribution to the total GMSL trend uncertainty (%) of each uncertainty budget contributor, i.e. the altimeters, the radiometers, the orbit determination and the geophysical corrections.
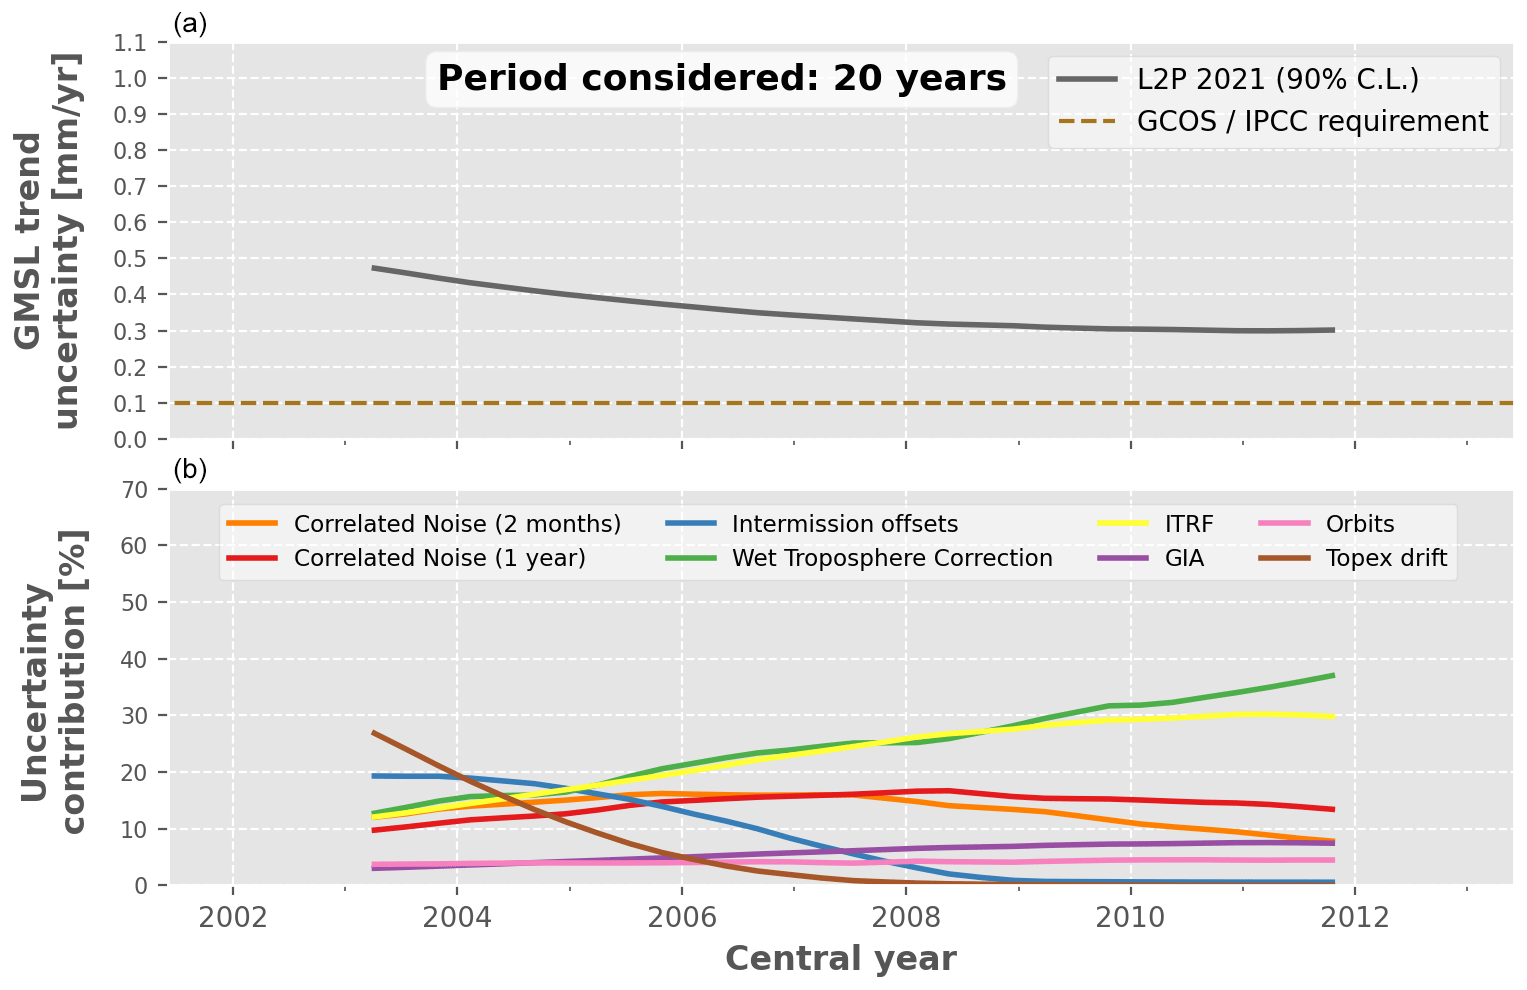
Figure 9Relative contribution of each uncertainty budget contributor to the GMSL trend uncertainty over periods of 20 years. (a) GMSL trend uncertainty in the L2P 21 record. The horizontal dashed brown line shows the GCOS/IPCC requirement for the GMSL trend stability, i.e. 0.1 m yr−1 (90 % C.L.). (b) Relative contribution to the total GMSL trend uncertainty (%) of each uncertainty budget contributor, i.e. the altimeters, the radiometers, the orbit determination and the geophysical corrections.
Figure 9 shows similar analysis for periods of 20 years. We observe that the lowest trend uncertainty achieved for this period length is 0 m yr−1 from 2009–present close to the 10-year requirement. This is because at 20-year timescales most of the time-correlated noise has vanished. As shown in the bottom panel, we find that the two main contributors to the GMSL trend uncertainty over periods of 20 years are the radiometer WTC and the ITRF realization, from 20 %–30 % for periods centred after 2008. About the other contributors, the two types of correlated errors contribute between 10 %–20 %, whereas the uncertainties affecting the TP missions are first dominant for 20-year periods centred between 2003–2005 and then rapidly decrease down to a few percent. Note that the high uncertainty in the intermission offset between TP-A and TP-B (2 mm in 1999; see Table 4) contributes to less than 10 % only for 20-year periods centred after 2007. It highlights the fact that poor-quality tandem phases and/or the lack of it impacts the stability of the GMSL record over long periods. Finally, the uncertainties in the GIA and in the orbit determination do not contribute to more than 10 % for any period.
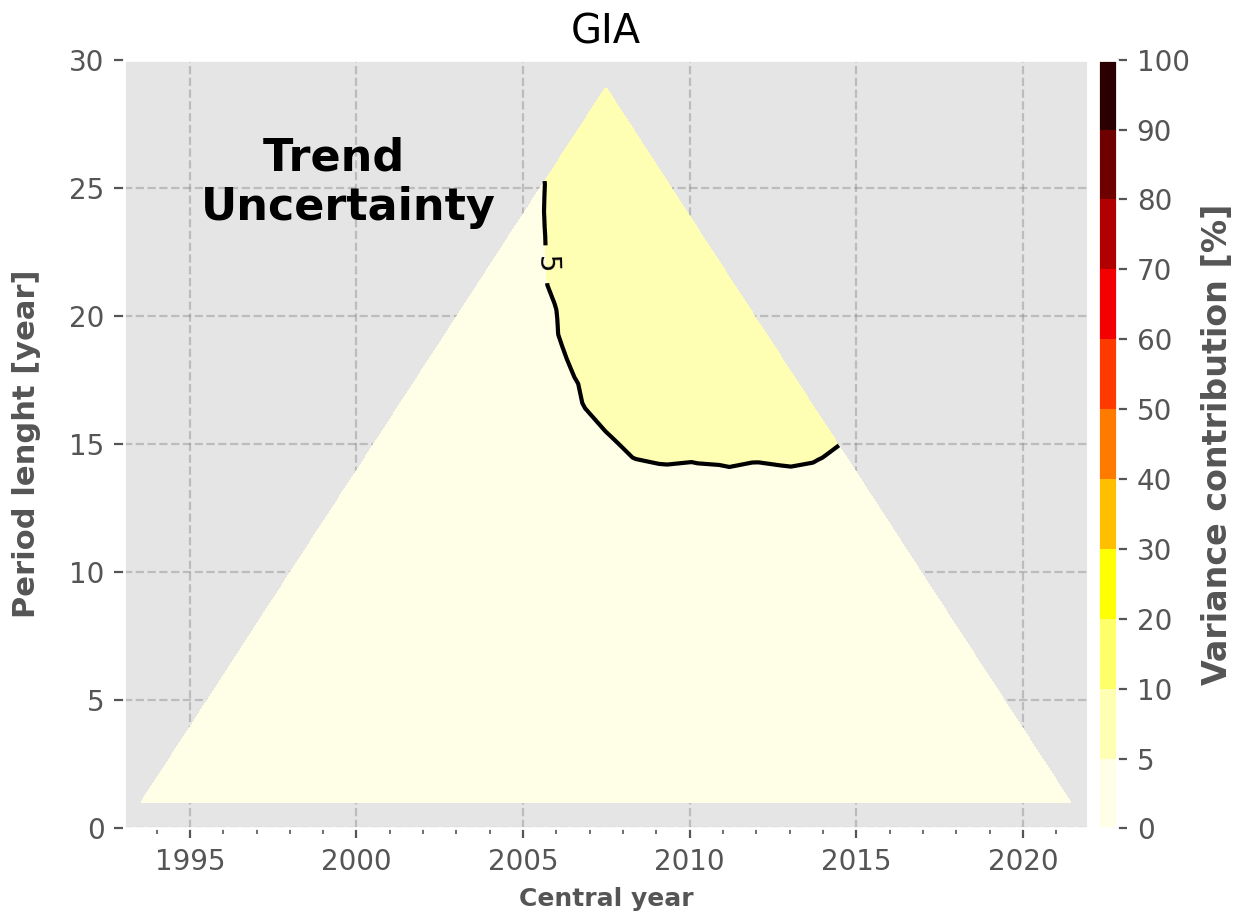
Figures 10 and 11 show the same analysis but for the uncertainties in the GMSL acceleration, for periods of 10 and 20 years, respectively. We find that the 1-year correlated errors are the dominant source of uncertainties (40 %–70 %) for the GMSL acceleration over any 10-year period. Over 20-year periods, the uncertainties in the TP mission are the major contributors before 2006 (60 %–30 %), and the WTC becomes dominant (30 %–50 %) after 2006, mostly due to the related uncertainty increase over the Jason-3 period. Again, it is interesting to note that the large uncertainties in the GMSL offset between TP-A and TP-B contribute significantly to the GMSL acceleration uncertainties. The ITRF and GIA do not contribute to the GMSL acceleration uncertainty over any period. This is logical as we assumed that their uncertainties are linear drift over the full altimetry era, thus not impacting the acceleration (in contrast, the TP altimeter drift uncertainty has an impact since it covers only a fraction of the altimetry era). We note that this linear assumption is certainly wrong for the ITRF, but characterizing the exact type of error affecting it is out of scope for this paper. This is also the case for the orbit uncertainties; however, the latter are small as compared to the other type of uncertainties and do not contribute to more than 5 % of the GMSL acceleration uncertainty over any period.
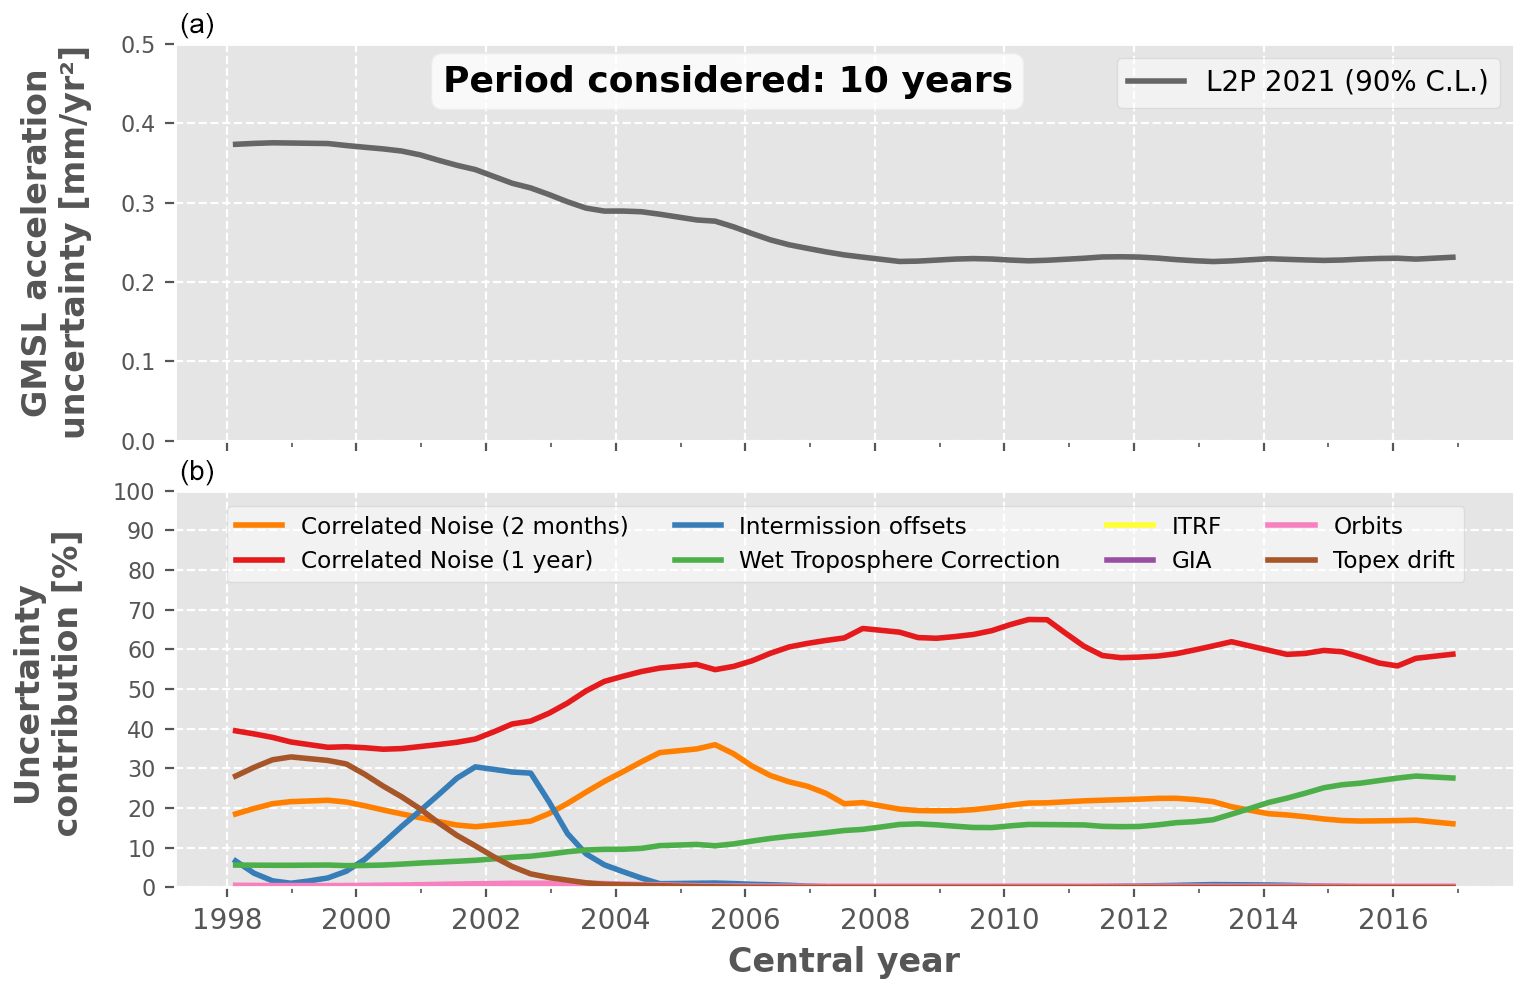
Figure 10Relative contribution of each uncertainty budget contributor to the GMSL acceleration uncertainty over periods of 10 years. (a) GMSL acceleration uncertainty in the L2P 21 record. ((b) Relative contribution to the total GMSL acceleration uncertainty (%) of each uncertainty budget contributor, i.e. the altimeters, the radiometers, the orbit determination and the geophysical corrections.
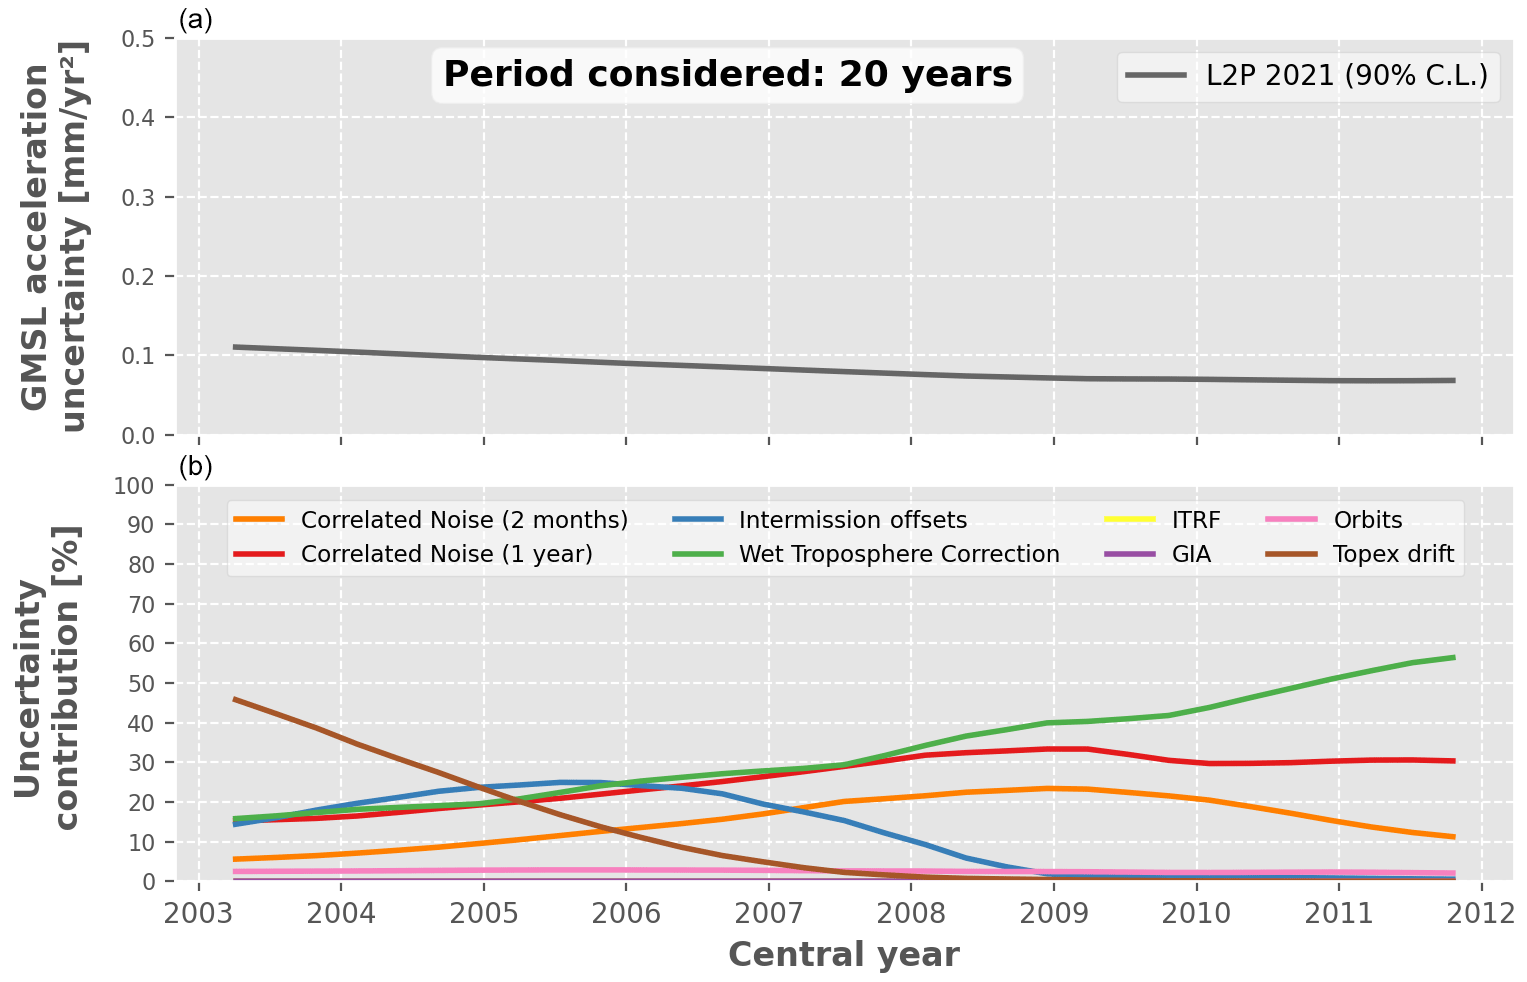
Figure 11Relative contribution of each uncertainty budget contributor to the GMSL acceleration uncertainty over periods of 20 years. (a) GMSL acceleration uncertainty in the L2P 21 record. (b) Relative contribution to the total GMSL acceleration uncertainty (%) of each uncertainty budget contributor, i.e. the altimeters, the radiometers, the orbit determination and the geophysical corrections.
As detailed in Sect. 4, we have found four major contributors to the GMSL trend and acceleration uncertainties: the correlated errors at short timescales (2 months and 1 year), the WTC from radiometers, the TOPEX/Poseidon data quality and the ITRF realizations. In this section we discuss some implications of reducing such uncertainties to meet the GMSL stability requirements stated by the GCOS.
At the beginning of the altimetry era, our analysis shows that significant improvements need to be achieved on the TP data quality. A new reprocessed dataset in GDR-F standards is ongoing and should be publicly released soon. Significant improvements are expected on the stability of the TP-A altimeter as well as on the offset estimation between the two altimeters. Despite the high expectation of the community for such reprocessing, the stability performances of the resulting GMSL will still not be better than it currently is with the last altimetry missions such as Jason-3. Indeed, the other three main uncertainty contributors will still limit the GMSL stability to about ±0.5 mm yr−1 over a 10-year period. More fundamental improvements are thus needed. Based on our analysis, these are of two types: (i) a better characterization and understanding of the sources of uncertainties at short timescales (annual and below) and (ii) strong innovations for the current altimetry observing system and the on-board radiometers as well as better ITRF realization stability.
As we note in Sect. 2.3, the origins of the short timescales uncertainties affecting the GMSL record are currently unknown. To overcome this issue, they are empirically estimated on the measured GMSL. Thus, the short-timescale uncertainties we estimate have mixed origins, i.e. altimeter noise, radiometer noise, geophysical correction uncertainties, etc. More problematically, they also include some geophysical signals. As of today, this is a limitation of our uncertainty budget description. A new ESA project named ASELSU (Assessment Sea Level Rise Stability Uncertainty) is currently addressing this limitation by characterizing and quantifying the stability uncertainties in the Sentinel-6A Michaël Frielich mission with a careful and exhaustive propagation of the instrumental noises to the system uncertainty budget. Such a project aims to give a comprehensive description of the uncertainties in the altimeter instrument, especially from Level 0 to Level 4 data, based on a metrology approach (Mittaz et al., 2019). Thanks to such work, we will be able to pinpoint the exact origins of the GMSL measurement uncertainties at short timescales and separate them from geophysical signal variations. We will thus be able to identify the various improvements needed on the current altimetry observing system to meet the scientific need. Such an approach is also used within the FDR4ALT ESA project on the characterization of the radiometer instrument uncertainties.
Finally, we found that a systematic limit to the GMSL stability measurements appears, which is the realizations of the ITRF. This might be the true limiting factor of the current observing system to the GMSL record stability. Improvements in the uncertainties in such a reference frame represent huge effort from many different scientific communities and governmental organizations. A first step toward this is the publication of a newer version than the ITRF2014 used in this paper: the ITRF2020. Using this new release might help to reduce the associated uncertainties as the time series is longer, seasonal signals are now considered in the local movements, and more data are used to constrain the realization (i.e. Galileo). Nonetheless, the expected uncertainty improvement of a few percent will make the uncertainties associated with the ITRF the major contributor to the GMSL stability uncertainties over periods longer than 20 years (see Meyssignac et al., 2022).
We have presented the latest release of the CNES/AVISO+ GMSL record based on the reprocessed CNES L2P 21 1 Hz along-track data of the reference missions, TOPEX/Poseidon, Jason-1, Jason-2 and Jason-3. This dataset covers the period January 1993 to December 2021, and it is now provided with an estimate of its measurement uncertainties, available online, as well as an empirical correction of the TP-A altimeter drift as proposed in Ablain et al. (2017). The GMSL rise is estimated to be 3.3 ± 0.3 m yr−1 and its acceleration to be a rate of 0.12 ± 0.05 m yr−2. We recalled that these metrics are mentioned only to quantify the lowest frequency present in the space-based GMSL measurements as we intend to provide the most accurate GMSL time series from satellite and not to detect, separate or attribute the sea level signal to any physical sources (anthropogenic and/or natural).
The GMSL measurement uncertainties, based on an updated version of the uncertainty budget, are reduced as compared to the previous CNES/AVISO+ record. This is mostly due to improved instrumental standards and geophysical corrections proposed in the input data products. A few improvements in the method have been presented, such as a new statistical method to estimate the GMSL intermission offsets and its related uncertainties. We showed that the intermission offset uncertainties are reduced when using as many tandem-phase measurements as possible. We also updated the uncertainties associated with the WTC of the Jason-3 radiometer that is suspected to show higher instability than the other radiometers on board the altimetry missions. This impacts the stability of the GMSL measurements at the end of the data record. We recalled that the variance–covariance matrix and the derived uncertainties only represent the instrumental uncertainties and are only indicators of the typical level of instrumental uncertainty present in the CNES/AVISO+ GMSL product.
A major result of this paper is the quantification of the respective contribution to the GMSL measurement uncertainties in the individual uncertainty contributors. We have highlighted the results for different timescales and found that the stability of the GMSL record is limited by four major contributors: the correlated errors at short timescales (2 months and 1 year), the WTC from radiometers, the TOPEX/Poseidon data quality and the ITRF realizations. Whereas two of these sources of uncertainties are well identified and will certainly be relatively easily addressed (i.e. the TP data quality and the WTC stability), the two others clearly set the current limitations of the altimetry observing system (i.e. the ITRF realizations) as well as of our knowledge of the description of its uncertainties (i.e. mixed origins in the description of the annual correlated uncertainties). Our results challenge the altimetry observing system as it is designed today and highlight clear topics of research to be explored in the future to help the altimetry community to improve the GMSL measurement accuracy and stability.
We present here the relative contribution to the GMSL trend variance of each uncertainty budget contributor. The uncertainty contributors are detailed in Table 4, and the way to derive their variance contributions is explained in Sect. 4.
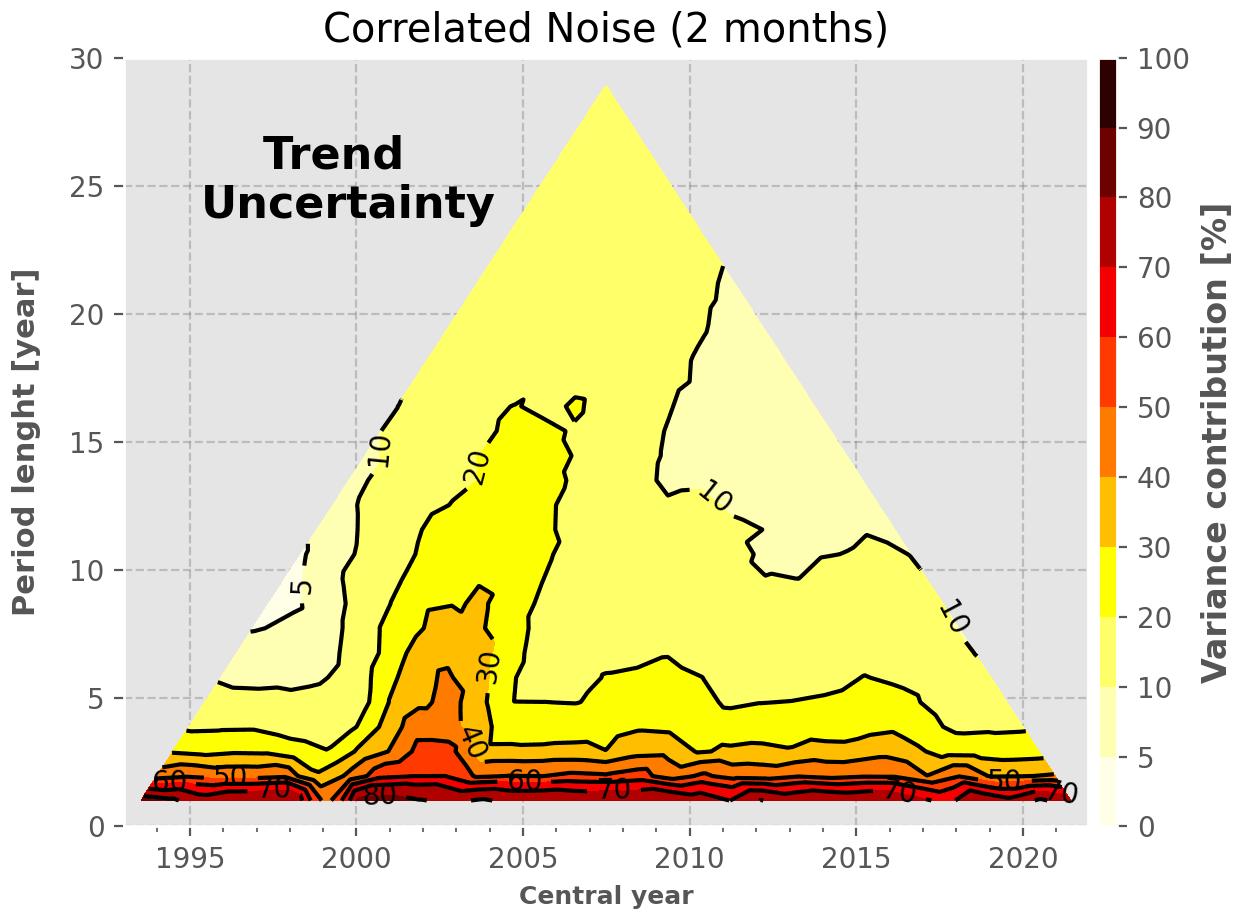
Figure A1Variance contribution to the GMSL trend variance of the high-frequency errors correlated at 2 months.
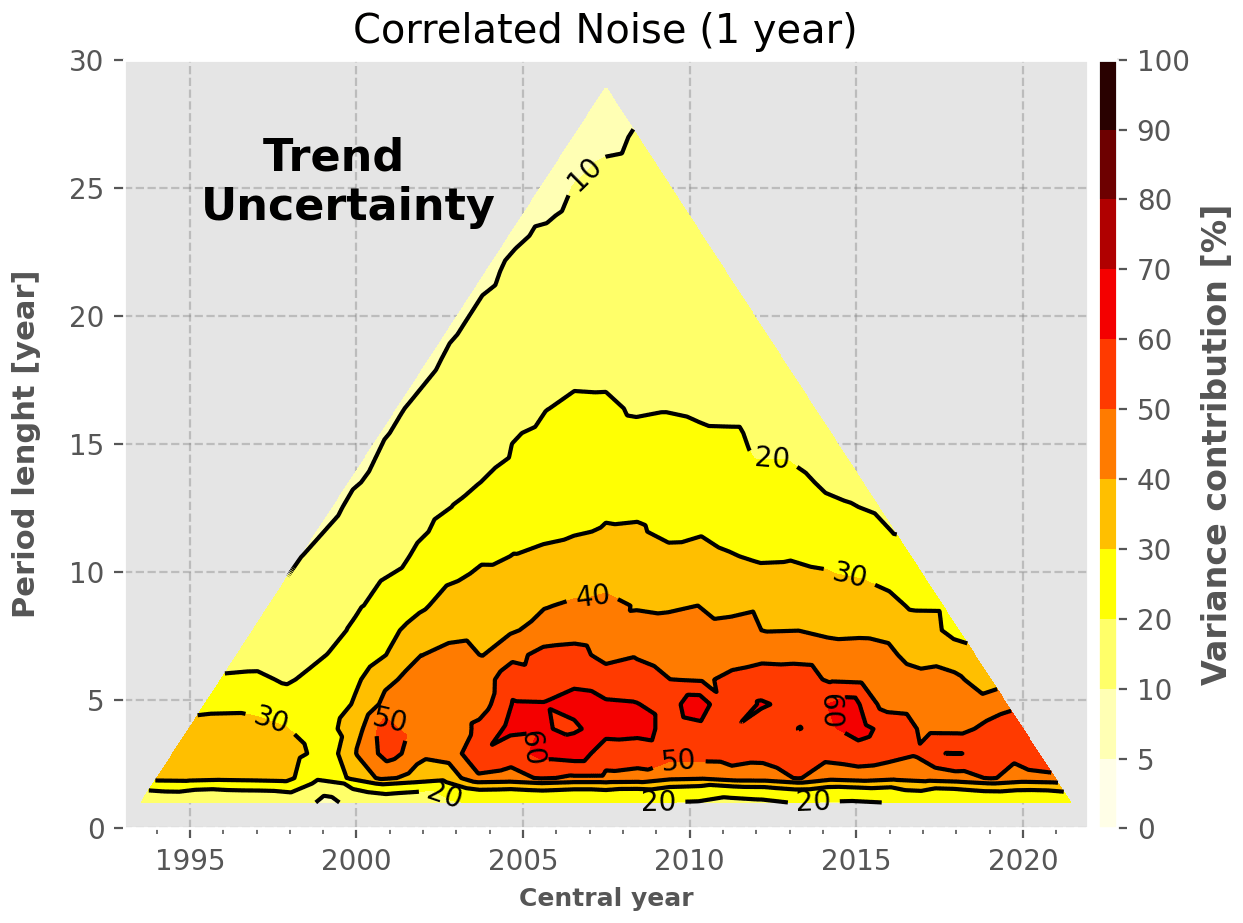
Figure A2Variance contribution to the GMSL trend variance of the high-frequency errors correlated at 1 year.
-
High-frequency correlated errors (2 months). These errors contribute mainly to period lengths shorter than 2 years at a level larger than 40 % of the total GMSL trend variance. It contributes to 10 % and less for periods longer than 10 years with a peak around 2002 that corresponds to the TP-A–TP-B switch.
-
High-frequency correlated errors (1 year). This error contributes mainly to period lengths between 2–7 years at a level of 40 %–60 % of the total GMSL trend variance. It contributes less than 30 % for periods longer than 10 years. The smaller contribution at the beginning of the altimetry era (1993–1999) is due to the presence of the additional TP uncertainties.
-
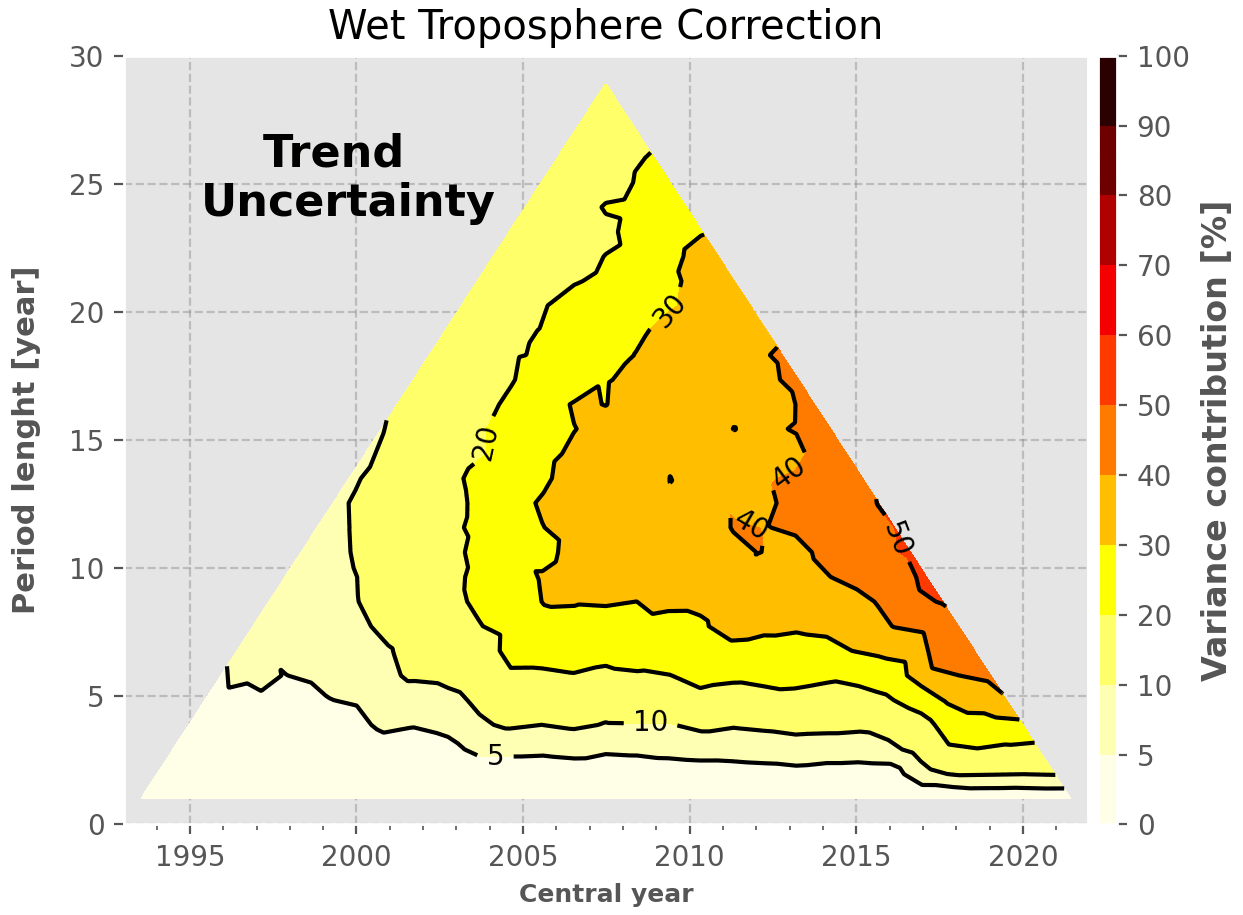
WTC from radiometers. These uncertainties contribute mainly to periods longer than 5 years centred at the end of the altimetry record (after 2007), at a level of 30 %–40 % of the total GMSL trend variance. The shape of the contribution to the uncertainty tree is mainly due to the occurrence of the other sources of errors, i.e. the TP drift before 2002 and the high-frequency correlated noise for any period below 5–8 years. The small increase to 50 % in 2016 for periods of 10 years is due to the larger uncertainties that affect J3 WTC.
-
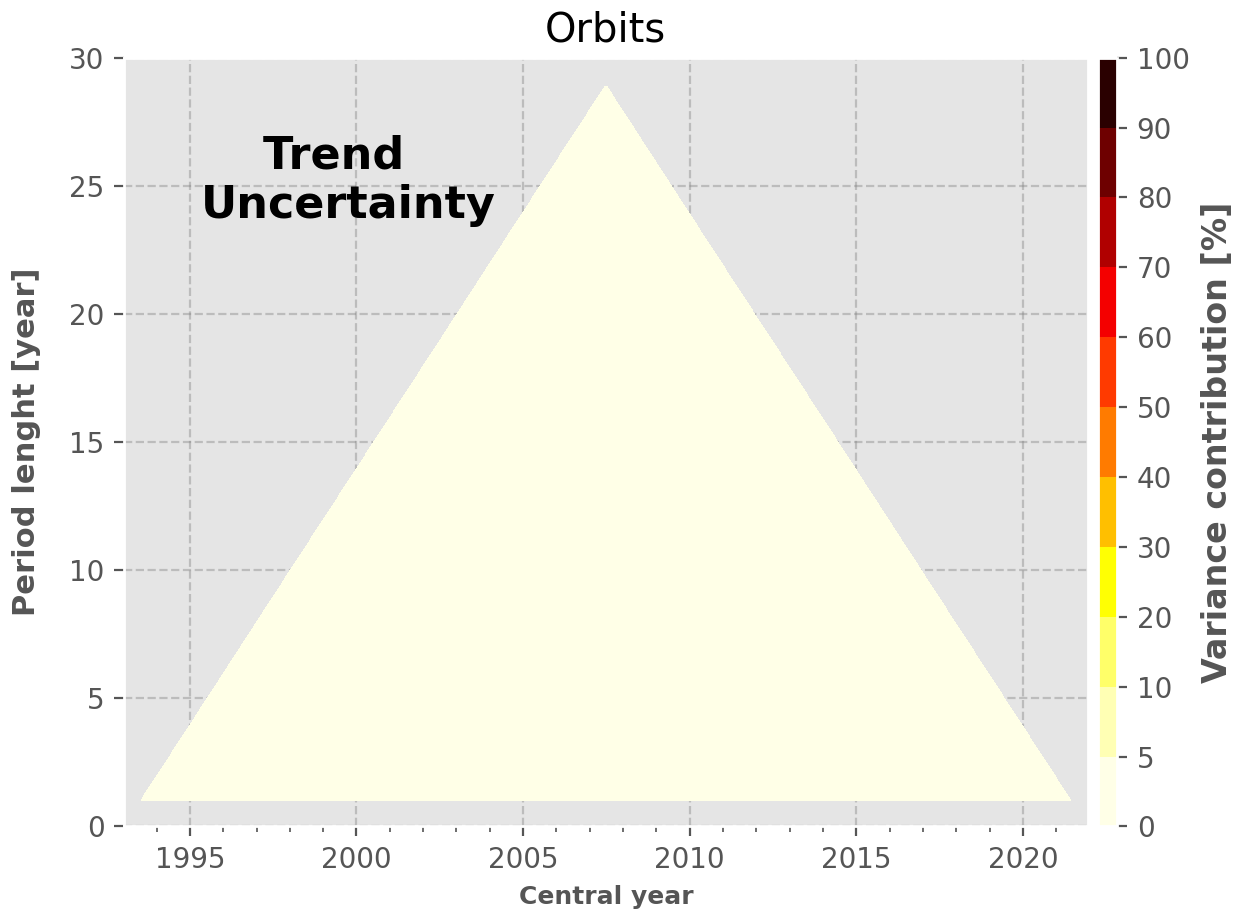
Large frequency errors from the orbit solutions. This source of uncertainty contributes to less than 5 % for all period lengths over the full altimetry record. This result confirms the fact that orbit errors do not contribute significantly at the global scale, as compared to other sources of uncertainties. At the regional scale, they are a major contributor (Prandi et al., 2021).
-
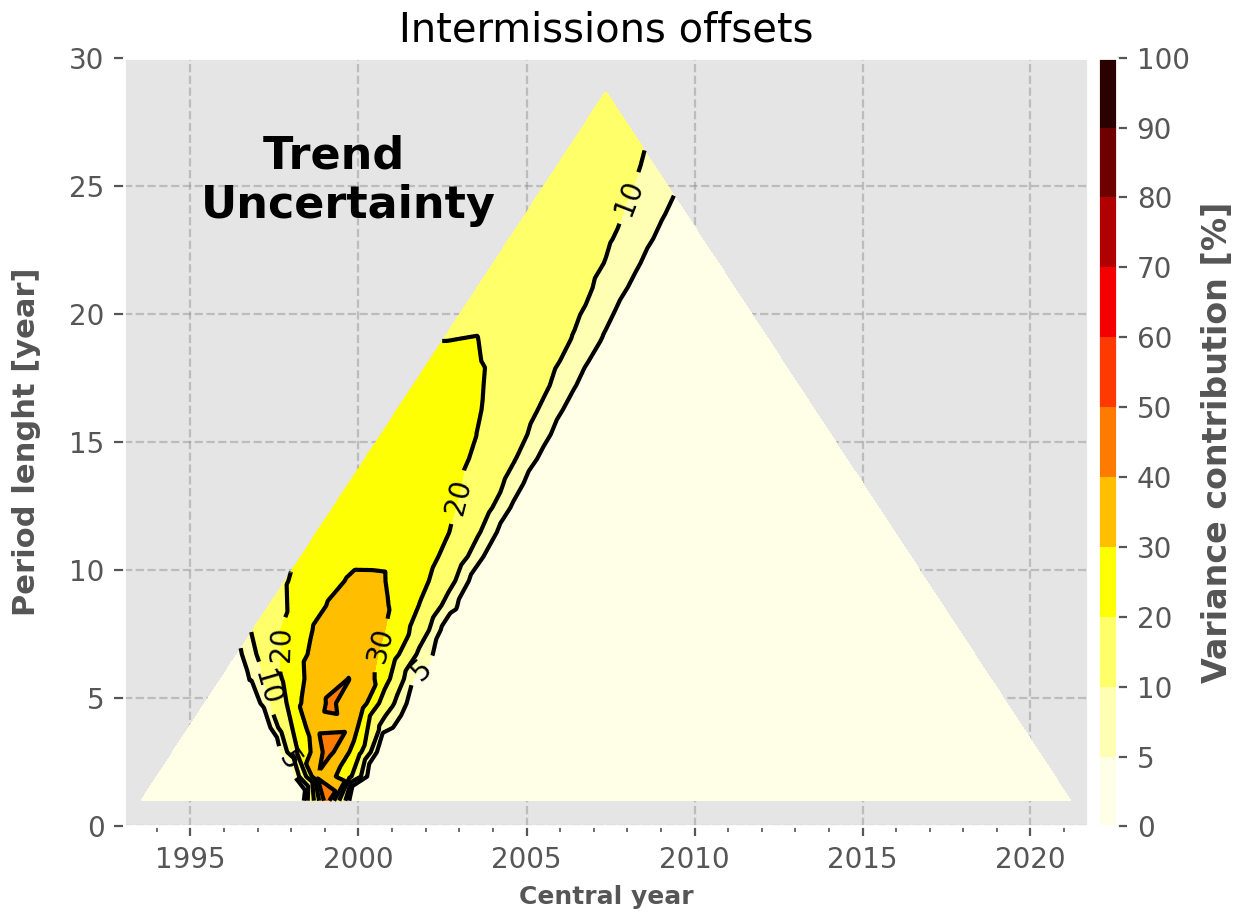
Intermission offsets. The intermission offset uncertainty between TP-A and TP-B is responsible for 30 %–40 % of the GMSL trend variance for periods of 5–10 years centred in the year 1999. The lower uncertainties associated with the other intermission offset contribute to less than 5 % of the GMSL trend variance. This plot illustrates well the advantages of performing tandem phases between altimetry missions.
-
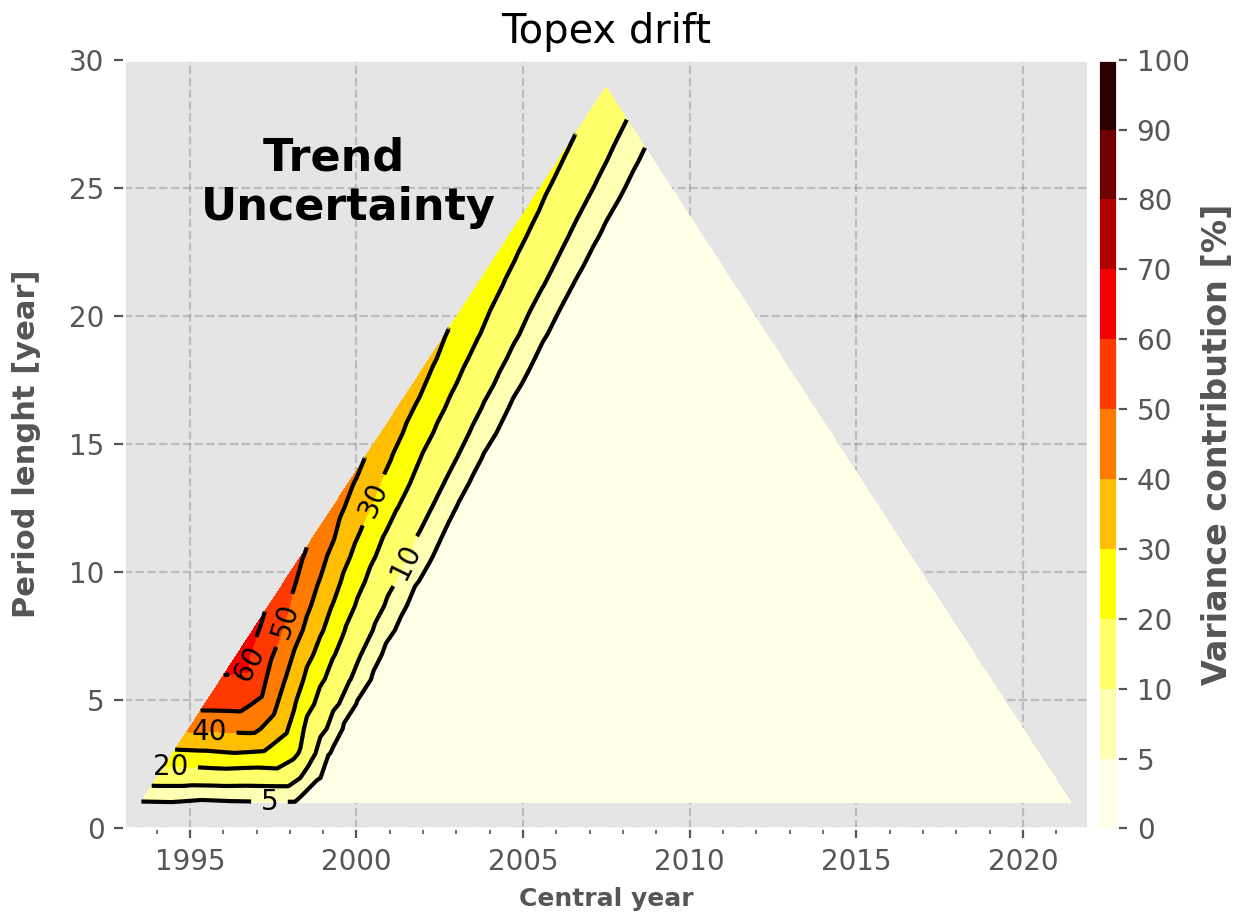
TOPEX/Poseidon drift. This source of uncertainty contributes to 40 %–60 % of the total GMSL trend variance at the beginning of the altimetry time series (before 2000) for periods longer than 5 years. Its contribution follows the left edge of the uncertainty tree and contributes by a large factor (∼20 %) even for 20-year-long and longer periods. It highlights the need for improved TP data quality to reduce the GMSL trend stability uncertainty.
-
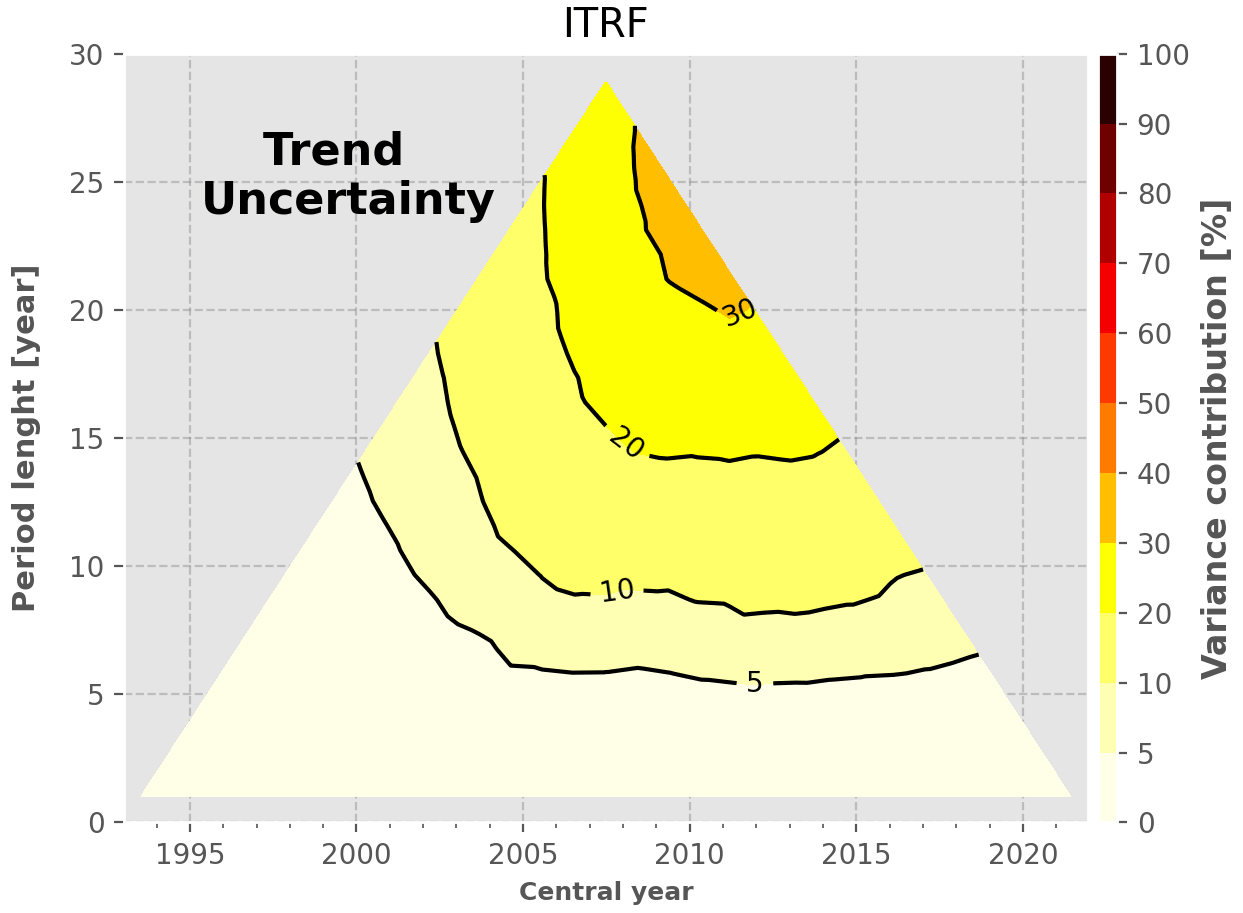
ITRF drift uncertainty. This source of uncertainty is a constant drift (0.1 m yr−1) over the full altimetry era. However, its relative contribution is the most important for period lengths longer than 15 years, centred towards the end of the time series (>20 %). This increase is due to the other contributors' decrease in this part of the diagram. This result highlights a strong limitation to achieving the GMSL stability requirement.
-
GIA drift uncertainty. This source of uncertainty contributes to 5 % and less for all periods considered within the altimetry records. Its impact is negligible at the global scale, whereas it is a major contributor at the regional scale (Prandi et al., 2021).
We present here the relative contribution to the GMSL acceleration variance of each uncertainty budget contributor. The uncertainty contributors are detailed in Table 4, and the way to derive their variance contributions is explained in Sect. 4.
-
High-frequency correlated errors (2 months). These errors contribute mainly to period lengths shorter than 5 years at a level larger than 50 % of the total GMSL trend variance. It still contributes to 10 %–20 % for periods longer than 10 years.
-
High-frequency correlated errors (1 year). These errors contribute to almost any period over the altimetry era to a level of 30 %–60 % of the total GMSL acceleration variance. It is clearly the largest contributor to the GMSL acceleration variance over all other sources of uncertainties.
-
WTC from radiometers. These uncertainties contribute mainly to periods longer than 10 years centred at the end of the altimetry record (after 2010), at a level of 30 %–50 % of the total GMSL acceleration variance. The increase towards periods on the right edge of the uncertainty tree is due to the larger uncertainties that affect J3 WTC.
-
Large frequency errors from the orbit solutions. This source of uncertainty does not contribute to the GMSL acceleration variance at the global scale over the full altimetry record. At the regional scale, it is a major contributor (Prandi et al., 2021).
-
Intermission offsets. The intermission offset uncertainty between TP-A and TP-B is responsible for 10 %–20 % of the GMSL acceleration variance over periods that cover the TP mission. The lower uncertainties associated with the other intermission offset contribute to less than 5 % of the GMSL acceleration variance.
-
TOPEX/Poseidon drift uncertainty. This source of uncertainty contributes to the GMSL acceleration variance up to 30 %–50 % over the left edge of the uncertainty tree. This is due to a change in the drift uncertainty values prescribed to the two altimeters of TP. This is this change in slope, i.e. that can be assimilated as acceleration that makes the contribution high.
-
ITRF drift uncertainty. This source of uncertainty does not contribute to the GMSL acceleration variance. This is expected since the associated uncertainty is a constant drift over the full altimetry era.
-
GIA drift uncertainty. This source of uncertainty does not contribute to the GMSL acceleration variance. This is expected since the associated uncertainty is a constant drift over the full altimetry era.
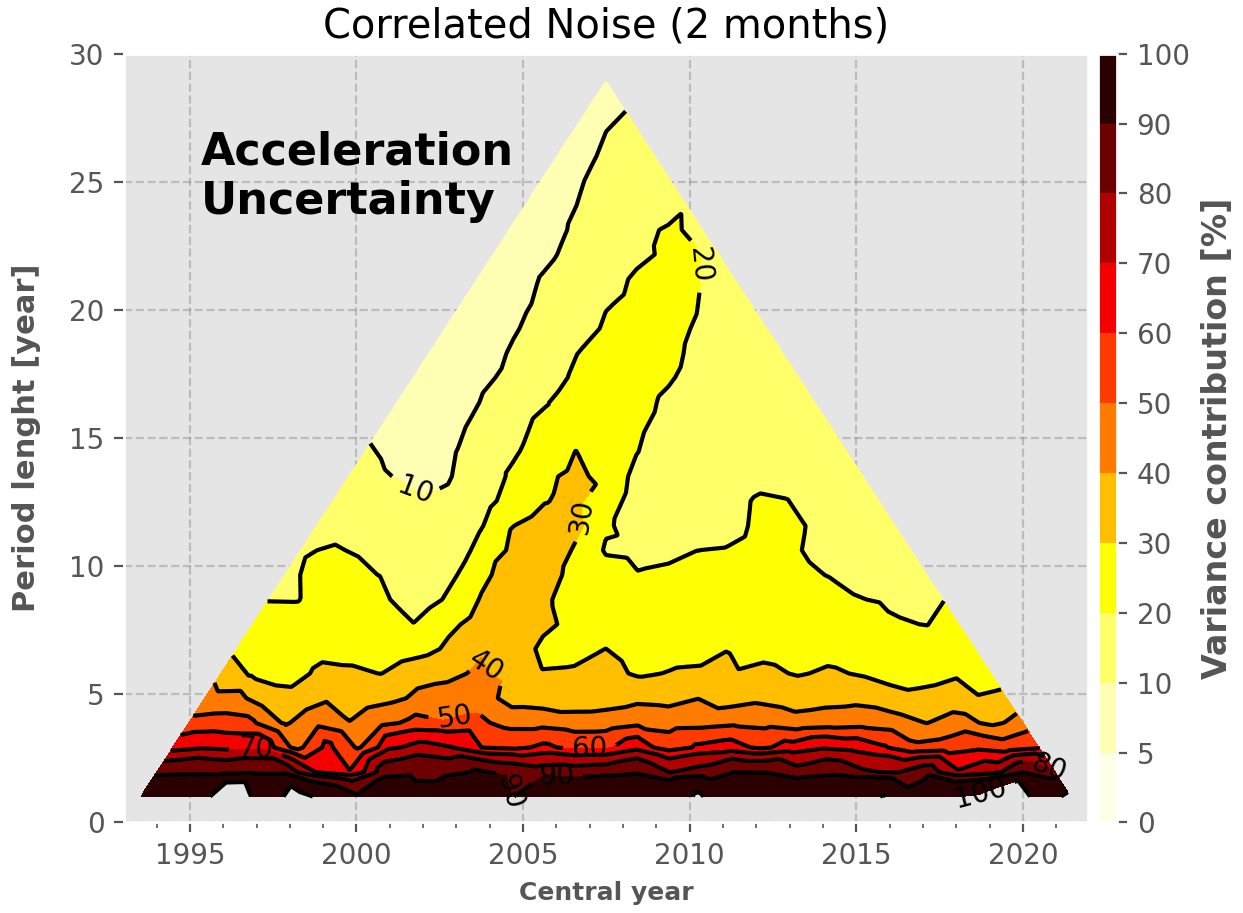
Figure B1Variance contribution to the GMSL acceleration variance of the high-frequency errors correlated at 2 months.
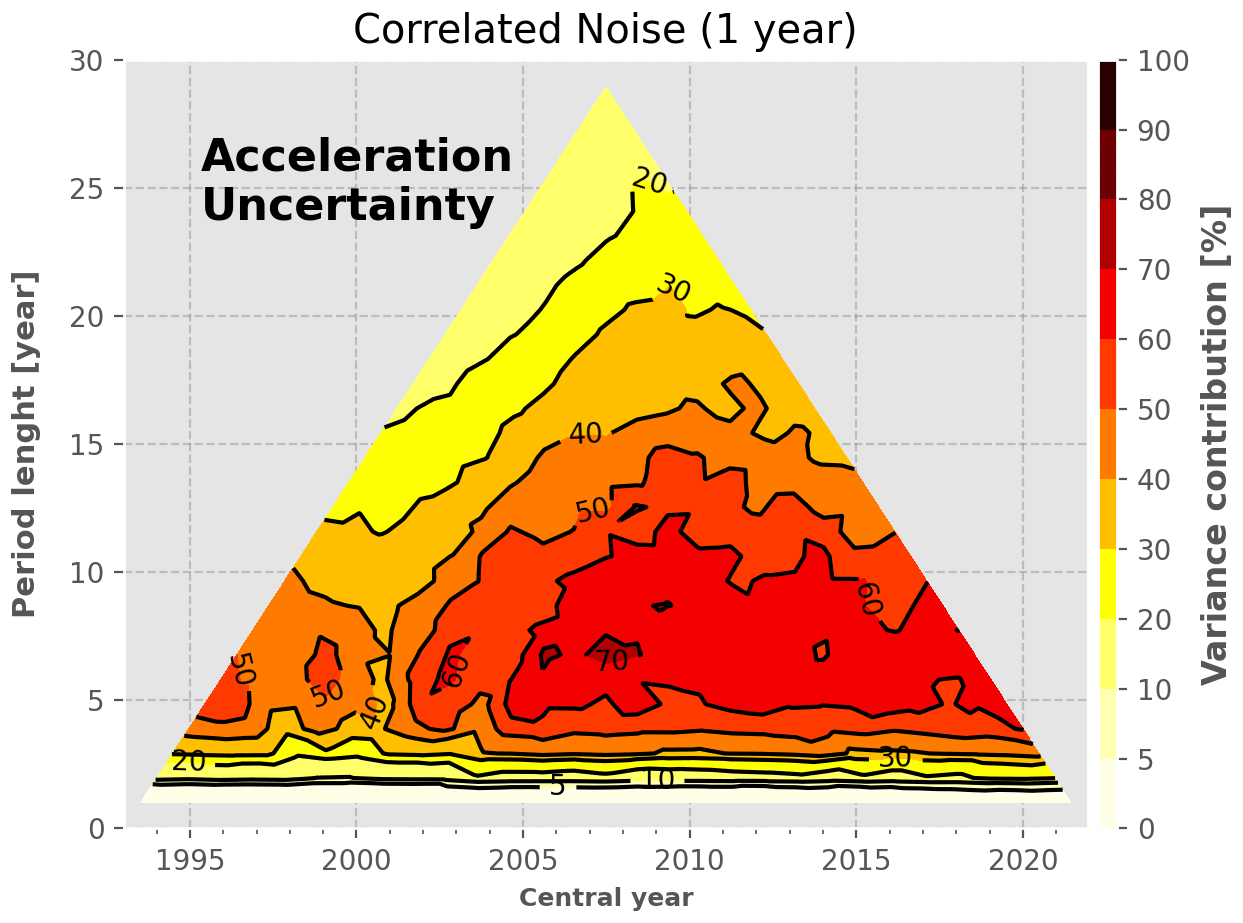
Figure B2Variance contribution to the GMSL acceleration variance of the high-frequency errors correlated at 1 year.
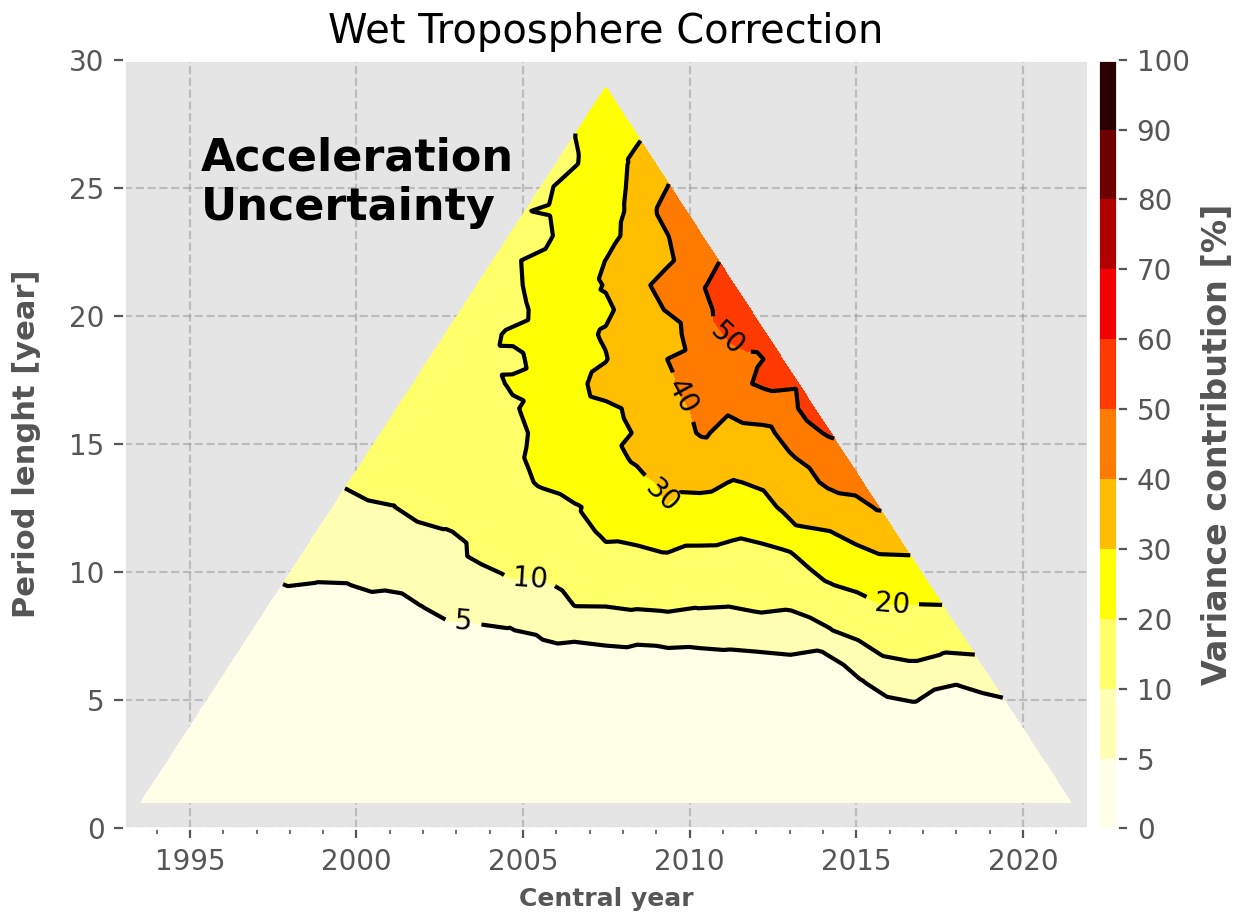
Figure B3Variance contribution to the GMSL acceleration variance of the WTC from radiometers.
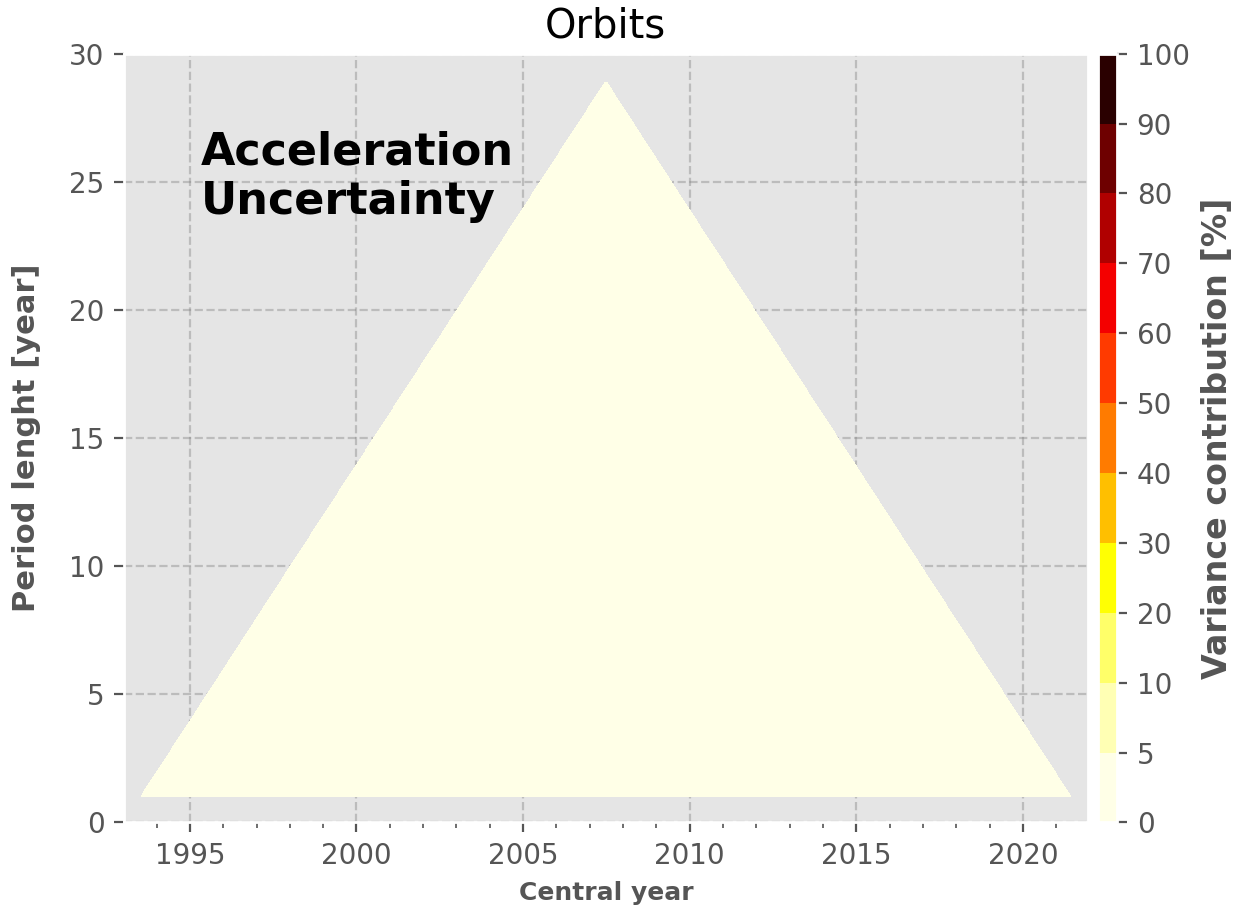
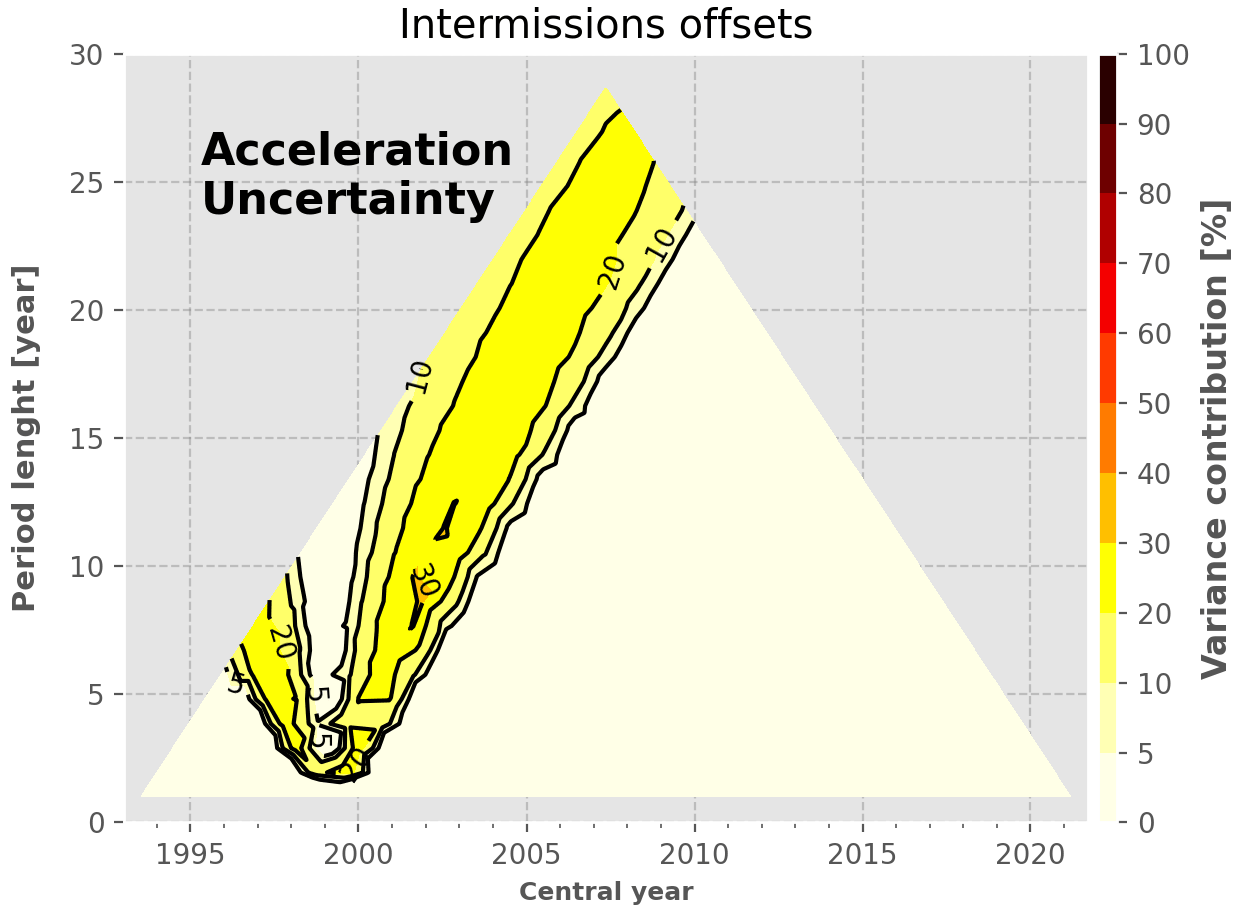
Figure B5Variance contribution to the GMSL acceleration variance of the intermission offsets.
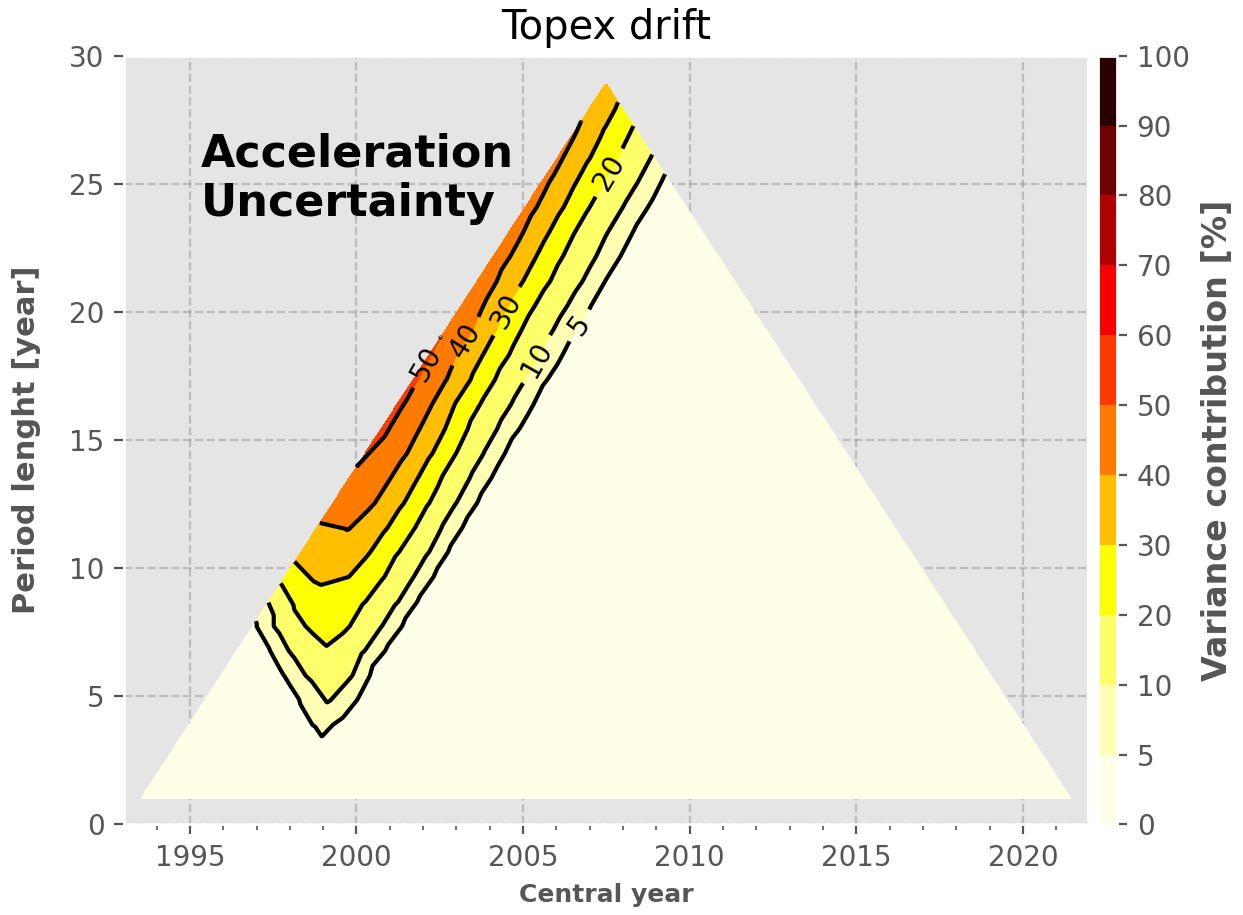
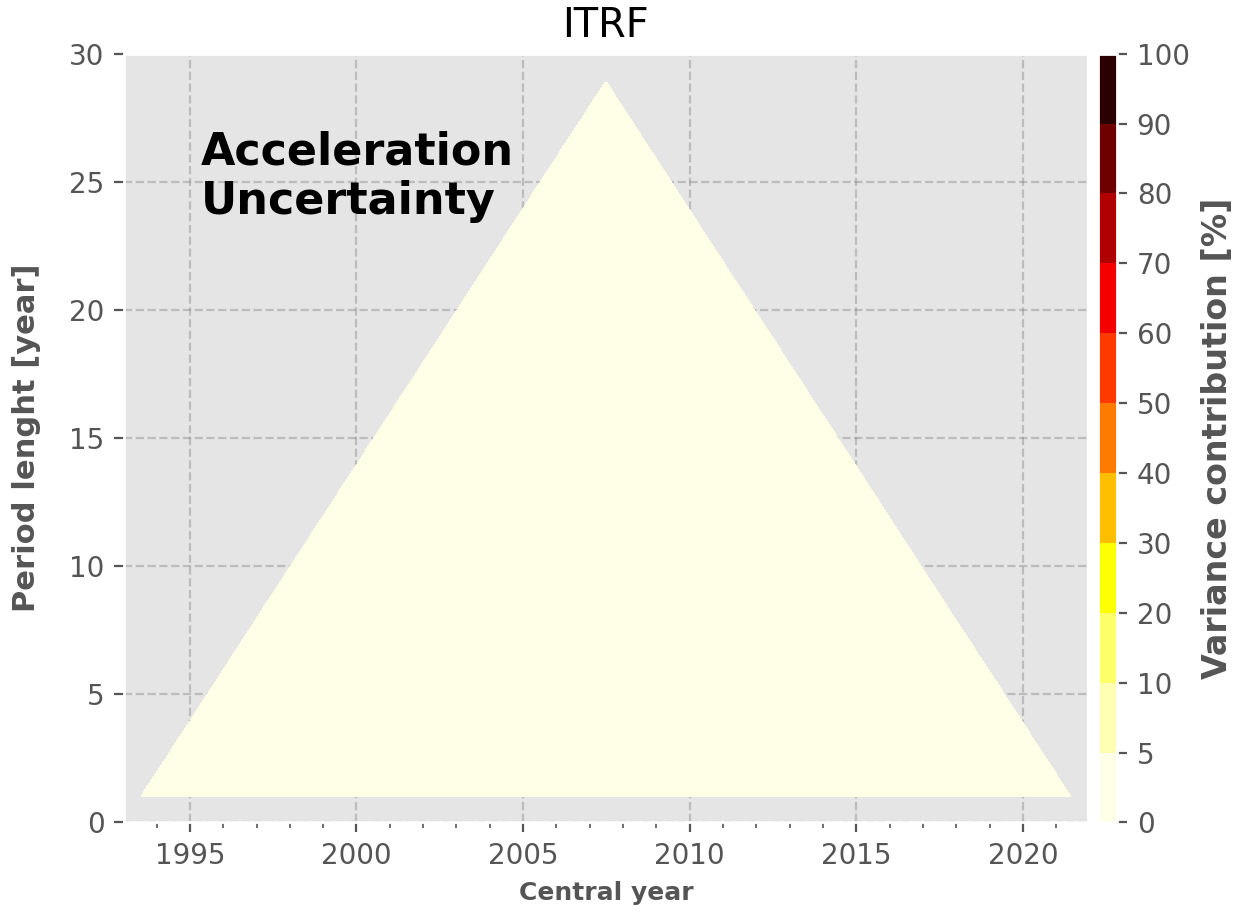
Figure B7Variance contribution to the GMSL acceleration variance of the ITRF drift uncertainty.

Figure B8Variance contribution to the GMSL acceleration variance of the GIA drift uncertainty.
The GMSL dataset described in this paper is available to download at the following address: https://www.aviso.altimetry.fr/en/data/products/ocean-indicators-products/mean-sea-level/data-acces.html (last access: 28 November 2022, CNES/Aviso+, CLS, LEGOS, 2022.
AG led the study, performed the computations and wrote the manuscript with some input from the authors. BM wrote the introduction of the manuscript and contributed to the discussion. AR gave strong support to establishing the statistical approach used in Sect. 2.2.1. MA and PP discussed the results and helped improve the key messages. All authors contributed to revising the manuscript.
The contact author has declared that none of the authors has any competing interests.
Publisher’s note: Copernicus Publications remains neutral with regard to jurisdictional claims in published maps and institutional affiliations.
This research has been supported by the Centre National d'Etudes Spatiales (grant no. SALP).
This paper was edited by Jochen Wollschlaeger and reviewed by Thomas Frederikse and Huseyin Baki Iz.
Ablain, M., Cazenave, A., Valladeau, G., and Guinehut, S.: A new assessment of the error budget of global mean sea level rate estimated by satellite altimetry over 1993–2008, Ocean Science, 5, 193–201, https://doi.org/10.5194/os-5-193-2009, 2009. a, b
Ablain, M., Legeais, J. F., Prandi, P., Marcos, M., Fenoglio-Marc, L., Dieng, H. B., Benveniste, J., and Cazenave, A.: Satellite Altimetry-Based Sea Level at Global and Regional Scales, Surv. Geophys., 38, 7–31, https://doi.org/10.1007/s10712-016-9389-8, 2016. a
Ablain, M., Jugier, R., Zawadzki, L., Taburet, N., Cazenave, A., Meyssignac, B., and Picot, N.: The TOPEX-A drift and impacts on GMSL time series Comparison with Poseïdon, p. 2017, https://meetings.aviso.altimetry.fr/fileadmin/user_upload/tx_ausyclsseminar/files/Poster_OSTST17_GMSL_Drift_TOPEX-A.pdf (last access: 2 November 2022), 2017. a, b, c
Ablain, M., Meyssignac, B., Zawadzki, L., Jugier, R., Ribes, A., Spada, G., Benveniste, J., Cazenave, A., and Picot, N.: Uncertainty in satellite estimates of global mean sea-level changes, trend and acceleration, Earth Syst. Sci. Data, 11, 1189–1202, https://doi.org/10.5194/essd-11-1189-2019, 2019. a, b, c, d, e, f, g, h, i, j, k, l, m, n, o, p, q
Ballarotta, M., Ubelmann, C., Pujol, M.-I., Taburet, G., Fournier, F., Legeais, J.-F., Faugère, Y., Delepoulle, A., Chelton, D., Dibarboure, G., and Picot, N.: On the resolutions of ocean altimetry maps, Ocean Sci., 15, 1091–1109, https://doi.org/10.5194/os-15-1091-2019, 2019. a
Barnoud, A., Pfeffer, J., Guérou, A., Frery, M., Siméon, M., Cazenave, A., Chen, J., Llovel, W., Thierry, V., Legeais, J., and Ablain, M.: Contributions of altimetry and Argo to non‐closure of the global mean sea level budget since 2016, Geophys. Res. Lett., 48 e2021GL092824, https://doi.org/10.1029/2021GL092824, 2021. a, b
Beckley, B. D., Callahan, P. S., Hancock, D. W., Mitchum, G. T., and Ray, R. D.: On the “Cal-Mode” Correction to TOPEX Satellite Altimetry and Its Effect on the Global Mean Sea Level Time Series, J. Geophys. Res.-Oceans, 122, 8371–8384, https://doi.org/10.1002/2017JC013090, 2017. a, b
Carrère, L. and Lyard, F.: Modeling the barotropic response of the global ocean to atmospheric wind and pressure forcing - comparisons with observations, Geophys. Res. Lett., 30, 1997–2000, https://doi.org/10.1029/2002GL016473, 2003. a
Carrere, L., Lievin, M., Kocha, C., Dagneaux, Q., Lyard, F., Allain, D., Faugère, Y., Dibarboure, G., and Picot, N.: Using ERA5 to improve the Dynamic Atmospheric Correction for altimetry, in: OSTST, https://meetings.aviso.altimetry.fr/fileadmin/user_upload/tx_ausyclsseminar/files/DAC_ERA5_carrere_et_al.pdf (29 November 2022), 2020. a, b
Carrere, L., Arbic, B. K., Dushaw, B., Egbert, G., Erofeeva, S., Lyard, F., Ray, R. D., Ubelmann, C., Zaron, E., Zhao, Z., Shriver, J. F., Buijsman, M. C., and Picot, N.: Accuracy assessment of global internal-tide models using satellite altimetry, Ocean Sci., 17, 147–180, https://doi.org/10.5194/os-17-147-2021, 2021. a
Cartwright, D. E. and Edden, A. C.: Corrected Tables of Tidal Harmonics, Geophys. J. Int., 33, 253–264, https://doi.org/10.1111/j.1365-246X.1973.tb03420.x, 1973. a
Cartwright, D. E. and Tayler, R. J.: New Computations of the Tide-generating Potential, Geophys. J. Roy. Astro. Soc., 23, 45–73, https://doi.org/10.1111/j.1365-246X.1971.tb01803.x, 1971. a
Cazenave, A. and Moreira, L.: Contemporary sea-level changes from global to local scales: A review, Philos. T. Roy. Soc. A, 478, 20220049, https://doi.org/10.1098/rspa.2022.0049, 2022. a
CNES/Aviso+, CLS, LEGOS: Global and Regional MSL products, [data set], https://www.aviso.altimetry.fr/en/data/products/ocean-indicators-products/mean-sea-level/data-acces.html, last access: 28 November 2022. a
Couhert, A., Cerri, L., Legeais, J.-F., Ablain, M., Zelensky, N. P., Haines, B. J., Lemoine, F. G., Bertiger, W. I., Desai, S. D., and Otten, M.: Towards the 1 mm/y stability of the radial orbit error at regional scales, Adv. Space Res., 55, 2–23, https://doi.org/10.1016/j.asr.2014.06.041, 2015. a, b
Desai, S., Wahr, J., and Beckley, B.: Revisiting the pole tide for and from satellite altimetry, J. Geodesy, 89, 1233–1243, https://doi.org/10.1007/s00190-015-0848-7, 2015. a, b
Dieng, H. B., Cazenave, A., Meyssignac, B., and Ablain, M.: New estimate of the current rate of sea level rise from a sea level budget approach, Geophys. Res. Lett., 44, 3744–3751, https://doi.org/10.1002/2017GL073308, 2017. a, b
Dorandeu, J., Ablain, M., Faugère, Y., Mertz, F., Soussi, B., and Vincent, P.: Jason-1 global statistical evaluation and performance assessment: Calibration and cross-calibration results, Mar. Geodesy, 27, 345–372, https://doi.org/10.1080/01490410490889094, 2004. a
Fernandes, M. and Lázaro, C.: GPD+ Wet Tropospheric Corrections for CryoSat-2 and GFO Altimetry Missions, Remote Sens., 8, 851, https://doi.org/10.3390/rs8100851, 2016. a
Frederikse, T., Riva, R. E. M., and King, M. A.: Ocean Bottom Deformation Due To Present-Day Mass Redistribution and Its Impact on Sea Level Observations, Geophys. Res. Lett., 44, 12306–12314, https://doi.org/10.1002/2017GL075419, 2017. a
Fox-Kemper, B., Hewitt, H. T., Xiao, C., Adalgeirsdóttir, G., Drijfhout, S. S., Edwards, T. L., Golledge, N. R., Hemer, M., Kopp, R. E., Krinner, G., Mix, A., Notz, D., Nowicki, S., Nurhati, I. S., Ruiz, L., Sallée, J.-B., Slangen, A. B. A., and Yu, Y.: Ocean, Cryosphere and Sea Level Change, in: Climate Change 2021: The Physical Science Basis, Contribution of Working Group I to the Sixth Assessment Report of the Intergovernmental Panel on Climate Change, edited by: Masson-Delmotte, V., Zhai, P., Pirani, A., Connors, S. L., Péan, C., Berger, S., Caud, N., Chen, Y., Goldfarb, L., Gomis, M. I., Huang, M., Leitzell, K., Lonnoy, E., Matthews, J. B. R., Maycock, T. K., Waterfield, T., Yelekçi, O., Yu, R., and Zhou, B., Cambridge University Press, Cambridge, United Kingdom and New York, NY, USA, 1211–1362, https://doi.org/10.1017/9781009157896.011, 2021. a
Gregory, J. M., Griffies, S. M., Hughes, C. W., Lowe, J. A., Church, J. A., Fukimori, I., Gomez, N., Kopp, R. E., Landerer, F., Cozannet, G. L., Ponte, R. M., Stammer, D., Tamisiea, M. E., and van de Wal, R. S.: Concepts and Terminology for Sea Level: Mean, Variability and Change, Both Local and Global, Surv. Geophys., 40, 1251–1289, https://doi.org/10.1007/s10712-019-09525-z, 2019. a
Hakuba, M. Z., Frederikse, T., and Landerer, F. W.: Earth's Energy Imbalance From the Ocean Perspective (2005–2019), Geophys. Res. Lett., 48, e2021GL093624, https://doi.org/10.1029/2021GL093624, 2021. a
Hartmann, D. L., Klein Tank, A. M., Rusticucci, M., Alexander, L. V., Brönnimann, S., Abdul-Rahman Charabi, Y., Dentener, F. J., Adler, R., Allan, R., Allan, R., and Blake, D.: Observations: Atmosphere and Surface Supplementary Material, in: Climate Change 2013: The Physical Science Basis, Contribution of Working Group I to the Fifth Assessment Report of the Intergovernmental Panel on Climate Change, Tech. Rep., http://www.climatechange2013.org (last access: 29 November 2022), 2013. a
Henry, O., Ablain, M., Meyssignac, B., Cazenave, A., Masters, D., Nerem, S., and Garric, G.: Effect of the processing methodology on satellite altimetry-based global mean sea level rise over the Jason-1 operating period, J. Geodesy, 88, 351–361, https://doi.org/10.1007/s00190-013-0687-3, 2014. a, b, c, d
IPCC, 2019: Technical Summary, in: IPCC Special Report on the Ocean and Cryosphere in a Changing Climate, edited by: [Pörtner, H.-O., Roberts, D. C., Masson-Delmotte, V., Zhai, P., Poloczanska, E., Mintenbeck, K., Tignor, M., Alegría, A., Nicolai, M., Okem, A., Petzold, J., Rama, B., Weyer, N. M., Cambridge University Press, Cambridge, UK and New York, NY, USA, 39–69, https://doi.org/10.1017/9781009157964.002, 2019. a
IPCC Working Group III: Climate Change 2022 – Mitigation of Climate Change, https://report.ipcc.ch/ar6/wg3/IPCC_AR6_WGIII_Full_Report.pdf, last access: 20 December 2022. a
Legeais, J.-F., Ablain, M., and Thao, S.: Evaluation of wet troposphere path delays from atmospheric reanalyses and radiometers and their impact on the altimeter sea level, Ocean Sci., 10, 893–905, https://doi.org/10.5194/os-10-893-2014, 2014. a, b
Legeais, J.-F., Meyssignac, B., Faugère, Y., Guerou, A., Ablain, M., Pujol, M.-I., Dufau, C., and Dibarboure, G.: Copernicus Sea Level Space Observations: A Basis for Assessing Mitigation and Developing Adaptation Strategies to Sea Level Rise, Front. Mar. Sci., 8, 704721, https://doi.org/10.3389/fmars.2021.704721, 2021. a
Leuliette, E. W., Nerem, R. S., and Mitchum, G. T.: Calibration of TOPEX/Poseidon and Jason Altimeter Data to Construct a Continuous Record of Mean Sea Level Change, Mar. Geodesy, 27, 79–94, https://doi.org/10.1080/01490410490465193, 2004. a
Lickley, M. J., Hay, C. C., Tamisiea, M. E., and Mitrovica, J. X.: Bias in Estimates of Global Mean Sea Level Change Inferred from Satellite Altimetry, J. Climate, 31, 5263–5271, https://doi.org/10.1175/JCLI-D-18-0024.1, 2018. a
Lyard, F. H., Allain, D. J., Cancet, M., Carrère, L., and Picot, N.: FES2014 global ocean tide atlas: design and performance, Ocean Sci., 17, 615–649, https://doi.org/10.5194/os-17-615-2021, 2021. a
Masters, D., Nerem, R. S., Choe, C., Leuliette, E., Beckley, B., White, N., and Ablain, M.: Comparison of Global Mean Sea Level Time Series from TOPEX/Poseidon, Jason-1, and Jason-2, Mar. Geodesy, 35, 20–41, https://doi.org/10.1080/01490419.2012.717862, 2012. a
Mittaz, J., Merchant, C. J., and Woolliams, E. R.: Applying principles of metrology to historical Earth observations from satellites, Metrologia, 56, 032002, https://doi.org/10.1088/1681-7575/ab1705, 2019. a
Nencioli, F.: Filtering ionospheric correction from altimetry dual-frequencies solution From SLOOP project to integration in L2 products, Tech. Rep., https://www.aviso.altimetry.fr/fileadmin/documents/data/tools/NT-Nencioli_FilteredIonosphericCorrection.pdf (last access: 29 November 2022), 2021. a
Nerem, R. S., Beckley, B. D., Fasullo, J. T., Hamlington, B. D., Masters, D., and Mitchum, G. T.: Climate-change–driven accelerated sea-level rise detected in the altimeter era, P. Natl. Acad. Sci. USA, 115, 2022–2025, https://doi.org/10.1073/pnas.1717312115, 2018. a, b
Oppenheimer, M., Glavovic, B. C., Hinkel, J., van de Wal, R., Magnan, A. K., Abd-Elgawad, A., Cai, R., Cifuentes-Jara, M., DeConto, R. M., Ghosh, T., Hay, J., Isla, F., Marzeion, B., Meyssignac, B., and Sebesvari, Z.: Sea Level Rise and Implications for Low-Lying Islands, Coasts and Communities, in: IPCC Special Report on the Ocean and Cryosphere in a Changing Climate, edited by: Pörtner, H.-O., Roberts, D. C., Masson-Delmotte, V., Zhai, P., Tignor, M., Poloczanska, E., Mintenbeck, K., Alegría, A., Nicolai, M., Okem, A., Petzold, J., Rama, B., and Weyer, N. M., Cambridge University Press, Cambridge, UK and New York, NY, USA, 321–445, https://doi.org/10.1017/9781009157964.006, 2019. a
Prandi, P., Meyssignac, B., Ablain, M., Spada, G., Ribes, A., and Benveniste, J.: Local sea level trends, accelerations and uncertainties over 1993–2019, Sci. Data, 8, 1, https://doi.org/10.1038/s41597-020-00786-7, 2021. a, b, c, d
Ribes, A., Corre, L., Gibelin, A. L., and Dubuisson, B.: Issues in estimating observed change at the local scale – a case study: the recent warming over France, International J. Climatol., 36, 3794–3806, https://doi.org/10.1002/joc.4593, 2016. a
Ries, J. C. and Desai, S.: Update to the conventional model for rotational deformation, in: American Geophysical Union, Fall Meeting 2017, Abstract #G14A-07, 2017. a
Rudenko, S., Neumayer, K.-H., Dettmering, D., Esselborn, S., Schone, T., and Raimondo, J.-C.: Improvements in Precise Orbits of Altimetry Satellites and Their Impact on Mean Sea Level Monitoring, IEEE T. Geosci. Remote, 55, 3382–3395, https://doi.org/10.1109/TGRS.2017.2670061, 2017. a
Scharffenberg, M. G. and Stammer, D.: Time‐Space Sampling‐Related Uncertainties of Altimetric Global Mean Sea Level Estimates, J. Geophys. Res.-Oceans, 124, 7743–7755, https://doi.org/10.1029/2018JC014785, 2019. a
Spada, G.: Glacial Isostatic Adjustment and Contemporary Sea Level Rise: An Overview, Surv. Geophys., 38, 153–185, https://doi.org/10.1007/s10712-016-9379-x, 2017. a, b
Thao, S., Eymard, L., Obligis, E., and Picard, B.: Trend and Variability of the Atmospheric Water Vapor: A Mean Sea Level Issue, J. Atmos. Ocean. Technol., 31, 1881–1901, https://doi.org/10.1175/JTECH-D-13-00157.1, 2014. a, b
Tran, N., Labroue, S., Philipps, S., Bronner, E., and Picot, N.: Overview and Update of the Sea State Bias Corrections for the Jason-2, Jason-1 and TOPEX Missions, Mar. Geodesy, 33, 348–362, https://doi.org/10.1080/01490419.2010.487788, 2010. a
Tran, N., Philipps, S., Poisson, J.-C., Urien, S., Bronner, E., and Picot, N.: OSTST 2012, Venice Splinter : Instrument Processing Impact of GDR-D standards on SSB corrections, Tech. Rep., https://www.aviso.altimetry.fr/fileadmin/documents/OSTST/2012/oral/02_friday_28/01_instr_processing_I/01_IP1_Tran.pdf (last access: 29 November 2022), 2012. a, b
Valladeau, G., Legeais, J. F., Ablain, M., Guinehut, S., and Picot, N.: Comparing Altimetry with Tide Gauges and Argo Profiling Floats for Data Quality Assessment and Mean Sea Level Studies, Mar. Geodesy, 35, 42–60, https://doi.org/10.1080/01490419.2012.718226, 2012. a
Veng, T. and Andersen, O. B.: Consolidating Sea Level Acceleration Estimates from Satellite Altimetry, Adv. Space Res., 68, 1–8, https://doi.org/10.1016/j.asr.2020.01.016, 2020. a
von Storch, H. and Zwiers, F. W.: Statistical Analysis in Climate Research, Cambridge University Press, https://doi.org/10.1017/CBO9780511612336, 1999. a
Watson, C. S., White, N. J., Church, J. A., King, M. A., Burgette, R. J., and Legresy, B.: Unabated global mean sea-level rise over the satellite altimeter era, Nat. Clim. Change, 5, 565–568, https://doi.org/10.1038/nclimate2635, 2015. a, b
WCRP Global Sea Level Budget Group: Global sea-level budget 1993–present, Earth Syst. Sci. Data, 10, 1551–1590, https://doi.org/10.5194/essd-10-1551-2018, 2018. a, b
Zaron, E. D.: Baroclinic Tidal Sea Level from Exact-Repeat Mission Altimetry, J. Phys. Ocean., 49, 193–210, https://doi.org/10.1175/JPO-D-18-0127.1, 2019. a, b
Zawadzki, L. and Ablain, M.: Accuracy of the mean sea level continuous record with future altimetric missions: Jason-3 vs. Sentinel-3a, Ocean Sci., 12, 9–18, https://doi.org/10.5194/os-12-9-2016, 2016. a, b
- Abstract
- Introduction
- Data and methods
- Results
- Contributors to the GMSL measurement uncertainties
- Discussion
- Conclusions
- Appendix A: Variance contributions to the GMSL trend
- Appendix B: Variance contributions to the GMSL acceleration
- Data availability
- Author contributions
- Competing interests
- Disclaimer
- Financial support
- Review statement
- References