the Creative Commons Attribution 4.0 License.
the Creative Commons Attribution 4.0 License.
 | 07 Nov 2023
On the drivers of regime shifts in the Antarctic marginal seas, exemplified by the Weddell Sea
Ralph Timmermann
Özgür Gürses
Hartmut H. Hellmer
Recent studies have found evidence for a potential future tipping point, when the density of Antarctic continental shelf waters, specifically in the southern Weddell Sea, will allow for the onshore flow of warm waters of open ocean origin. A cold-to-warm regime shift in the adjacent ice shelf cavities entails a strong enhancement of ice shelf basal melt rates and could trigger instabilities in the ice sheet. From a suite of numerical experiments, aimed to force such a regime shift on the continental shelf, we identified the density balance between the shelf waters formed by sea ice production and the warmer water at the shelf break as the defining element of a tipping into a warm state. In our experiments, this process is reversible but there is evidence for hysteresis behaviour. Using HadCM3 20th-century output as atmospheric forcing, the resulting state of the Filchner–Ronne cavity depends on the initial state. In contrast, ERA Interim forcing pushes even a warm-initialized cavity into a cold state, i.e. it pushes the system back across the reversal threshold to the cold side. However, it turns out that for forcing data perturbations of a realistic magnitude, a unique and universal recipe for triggering a regime shift in Antarctic marginal seas was not found; instead, various ocean states can lead to an intrusion of off-shelf waters onto the continental shelf and into the cavities. Whether or not any given forcing or perturbation yields a density imbalance and thus allows for the inflow of warm water depends on the complex interplay between bottom topography, mean ocean state, sea ice processes, and atmospheric conditions.
- Article
(7909 KB) - Full-text XML
-
Supplement
(1950 KB) - BibTeX
- EndNote


In the context of climate change, the accurate prediction of future climate evolution for different scenarios and the identification of crucial thresholds depends on a realistic representation of tipping points in the relevant climate components. For the polar environment, these components are the atmosphere, ocean, and cryosphere. A tipping point can trigger an accelerated regime shift that, without thorough knowledge of the interplay of the components involved, cannot be predicted from observations of current trends. Crossing a tipping point not only causes rapid and hard-to-predict changes after the triggering component has crossed an invisible threshold, but these changes also cannot be reversed simply by a return of said triggering components to the other side of the threshold (Lenton et al., 2008; Klose et al., 2020). Typically, a reversal is either impossible or it necessitates a return of the forcing components far beyond the tipping point threshold towards a “reversal threshold”. In between these two thresholds, an area of bi-stability exists where the state of the system – here, the climate – depends on its own previous state (Fig. 1).
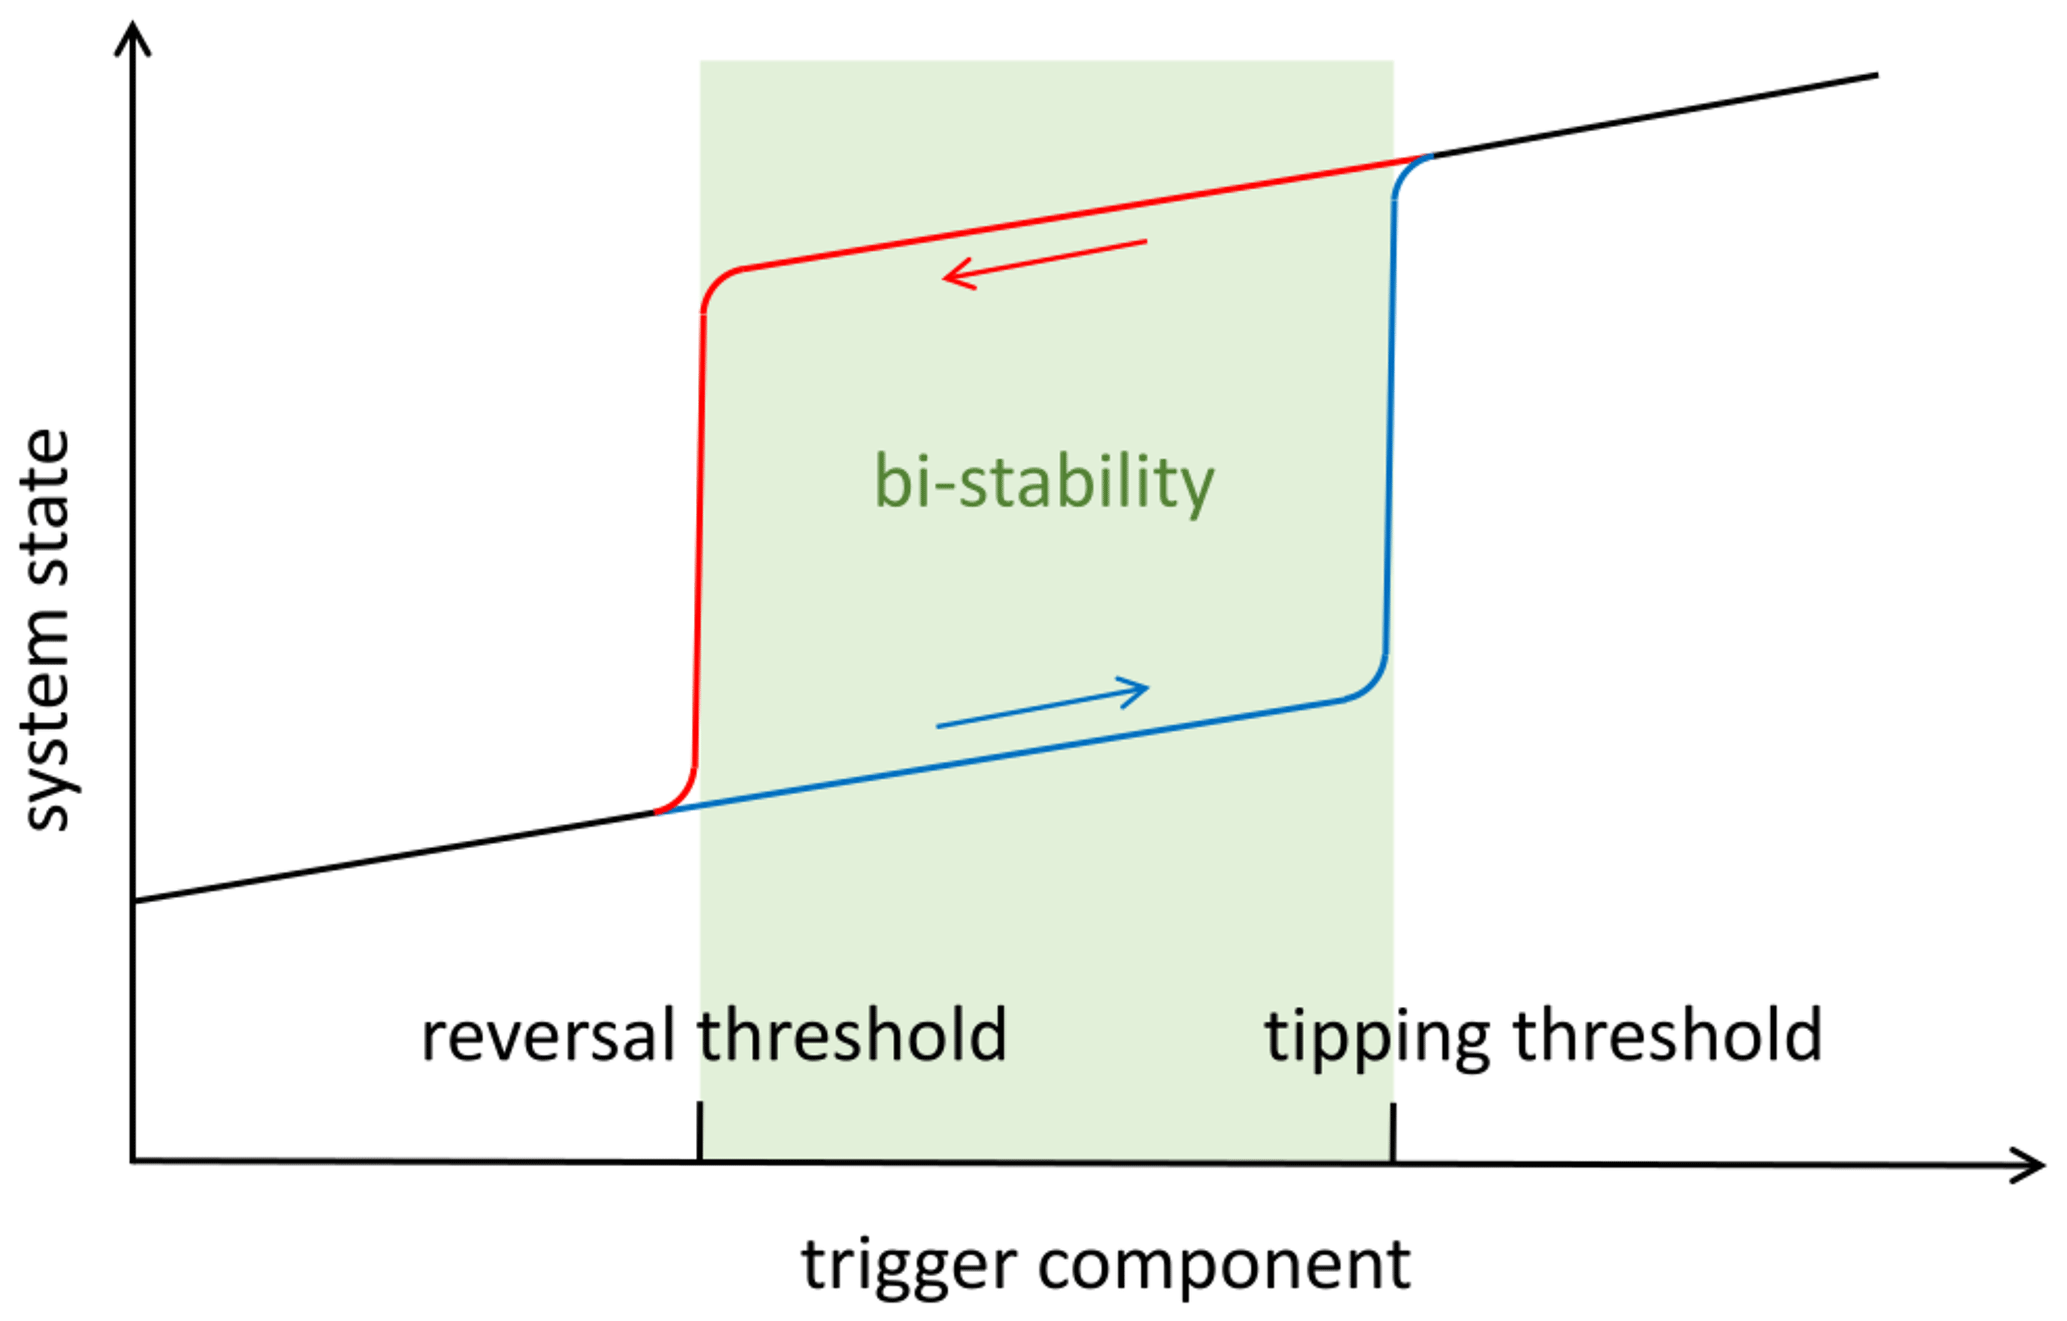
Figure 1Schematic depiction of tipping hysteresis behaviour. The zone of bistability is shaded in green.
One possible regime shift in polar climate is the change in the Antarctic continental shelf from a cold to a warm state. Supported by atmospheric forcing, bottom topography, and/or cavity–shelf–sea interaction (Thoma et al., 2008; Nakayama et al., 2013; Jourdain et al., 2017), the warming can migrate beneath fringing ice shelves (Jenkins et al., 2010) enhancing basal melting and causing instabilities of both the grounding line and the ice shelf-feeding ice sheet (Gladstone et al., 2012; Cornford et al., 2015). For the Filchner–Ronne Ice Shelf (FRIS) in the southern Weddell Sea, such a change has been found in simulations using future climate scenarios (Hellmer et al., 2012; Naughten et al., 2021), and observations of warm water intrusions on the continental shelf and into the Filchner Trough (Darelius et al., 2016; Ryan et al., 2020) seem to support the possibility of such an event in the future. This regime shift, according to Hellmer et al. (2017), is irreversible as long as the meltwater input is high. In an idealized setting, Hazel and Stewart (2020) obtained a hysteresis with bi-stabilities as depicted in Fig. 1 when plotting the cavity state against the controlling variable (meridional winds).
Timmermann and Hellmer (2013) suggest that the decrease in sea ice production and concurrent freshening of shelf waters trigger the regime shift. In addition, Hattermann et al. (2021) emphasize the key role of offshore winds in controlling sea ice formation, shelf water densification, and sub-ice shelf circulation. Several regional models indicate further drivers of a regime shift in the southern Weddell Sea. Daae et al. (2020) identify two necessary conditions for the flow of warm water of open ocean origin into the FRIS cavity: (a) freshening of shelf waters and (b) relaxation of the Antarctic Slope Front (ASF) density gradient, which was enforced in the model by lifting the thermocline by several hundred metres. Naughten et al. (2019) suggest a connection between position and intensity of the Weddell Polynya and the transport of Warm Deep Water (WDW) onto the southern continental shelf caused by density changes at the shelf break. The onshore flow, saltier and thus denser, enhances the sub-ice shelf circulation and melting at the FRIS base. The impact of the polynya is visible until roughly 14 years after cessation of the polynya's deep convection in their simulation. In a perturbation experiment, Bull et al. (2021) find that water mass properties of the slope current in the eastern Weddell Sea have an impact on the onshore flow of warmer waters and thus on FRIS basal melting. The recovery of the cold state after a regime shift takes 5–15 years depending on the slope current characteristics and the strength of perturbation. The findings agree with earlier model results suggesting that sea ice and surface water anomalies near the Greenwich meridian have a strong impact on bottom salinity on the southern and western Weddell Sea continental shelf (Hellmer et al., 2009). But still, the underlying mechanisms leading to a regime shift on the continental shelf are not well understood.
Our study aims to further investigate these mechanisms based on a suite of experiments with varied atmospheric forcing and therefore different ocean states. Our experiments feature a global ocean model domain and therefore also include far-field effects on the Southern Ocean and Weddell Sea states. We are able to identify a decisive criterion (a density difference or balance) for the occurrence of a regime shift, while previously suggested criteria, such as on-shelf salinity or the ASF depth, failed at the task. We also investigated whether we find hysteresis behaviour for the regime shift in our experiments.
In the following, we present the results of a selected number of sensitivity studies with the global Finite Element Sea Ice-Ocean Model (FESOM) in order to (a) force a regime shift on the continental shelves of the Antarctic marginal seas using only manipulations of the atmospheric forcing, a task that proved more difficult than anticipated but which ultimately produced a range of post-shift states as well as a suite of experiments without a regime shift and (b) identify a decisive factor that determines whether (and when) such a regime shift occurs, clearly separating experiments with a regime shift from those with a stably cold continental shelf.
We present our model and methods used in the next section. In Sect. 3.1, we talk about how the regime shift in the Weddell Sea does or does not occur in the different experiments, followed by an examination of the controlling mechanisms in Sect. 3.2. The reversibility of the regime shift is addressed in Sect. 3.3. A discussion of our results and a summarizing section conclude the study.
2.1 Model
The Finite Element Sea Ice-Ocean Model (FESOM) version 1.4 is a primitive-equation hydrostatic ocean model that is solved on a horizontally unstructured mesh (Wang et al., 2014). It contains a dynamic–thermodynamic sea ice model (Danilov et al., 2015). The ice shelf component (Timmermann et al., 2012) has been derived from the Hellmer and Olbers (1989) three-equation model of ice shelf–ocean interaction with a velocity-dependent parameterization of boundary-layer heat and salt fluxes according to Holland and Jenkins (1999). The model has been coupled to an ice sheet model (Timmermann and Goeller, 2017) but we use it with a constant ice shelf geometry and bottom topography derived from RTopo-2 (Schaffer et al., 2016) to reflect the present-day state as realistically as possible.
We use FESOM in a global configuration with a horizontal resolution ranging from 4 km in the southern Weddell and Ross seas and the areas of the Antarctic coastline and ice shelves to ≈120 km at the outer edge of the southern subpolar gyres, increasing to 270 km in the vast mid-latitude ocean basins (Fig. 2). The vertical discretization uses 99 unevenly spaced z levels, starting with 5 m layers at the surface. The model has 12 layers in the uppermost 100 m and 57 layers in the uppermost 1000 m. Temperature and salinity are initialized with the World Ocean Atlas (WOA) 2013 climatography (Locarnini et al., 2013; Zweng et al., 2013). The model is started from rest and spun up for 39 years using ERA Interim forcing (1979–2017; Dee et al., 2011).
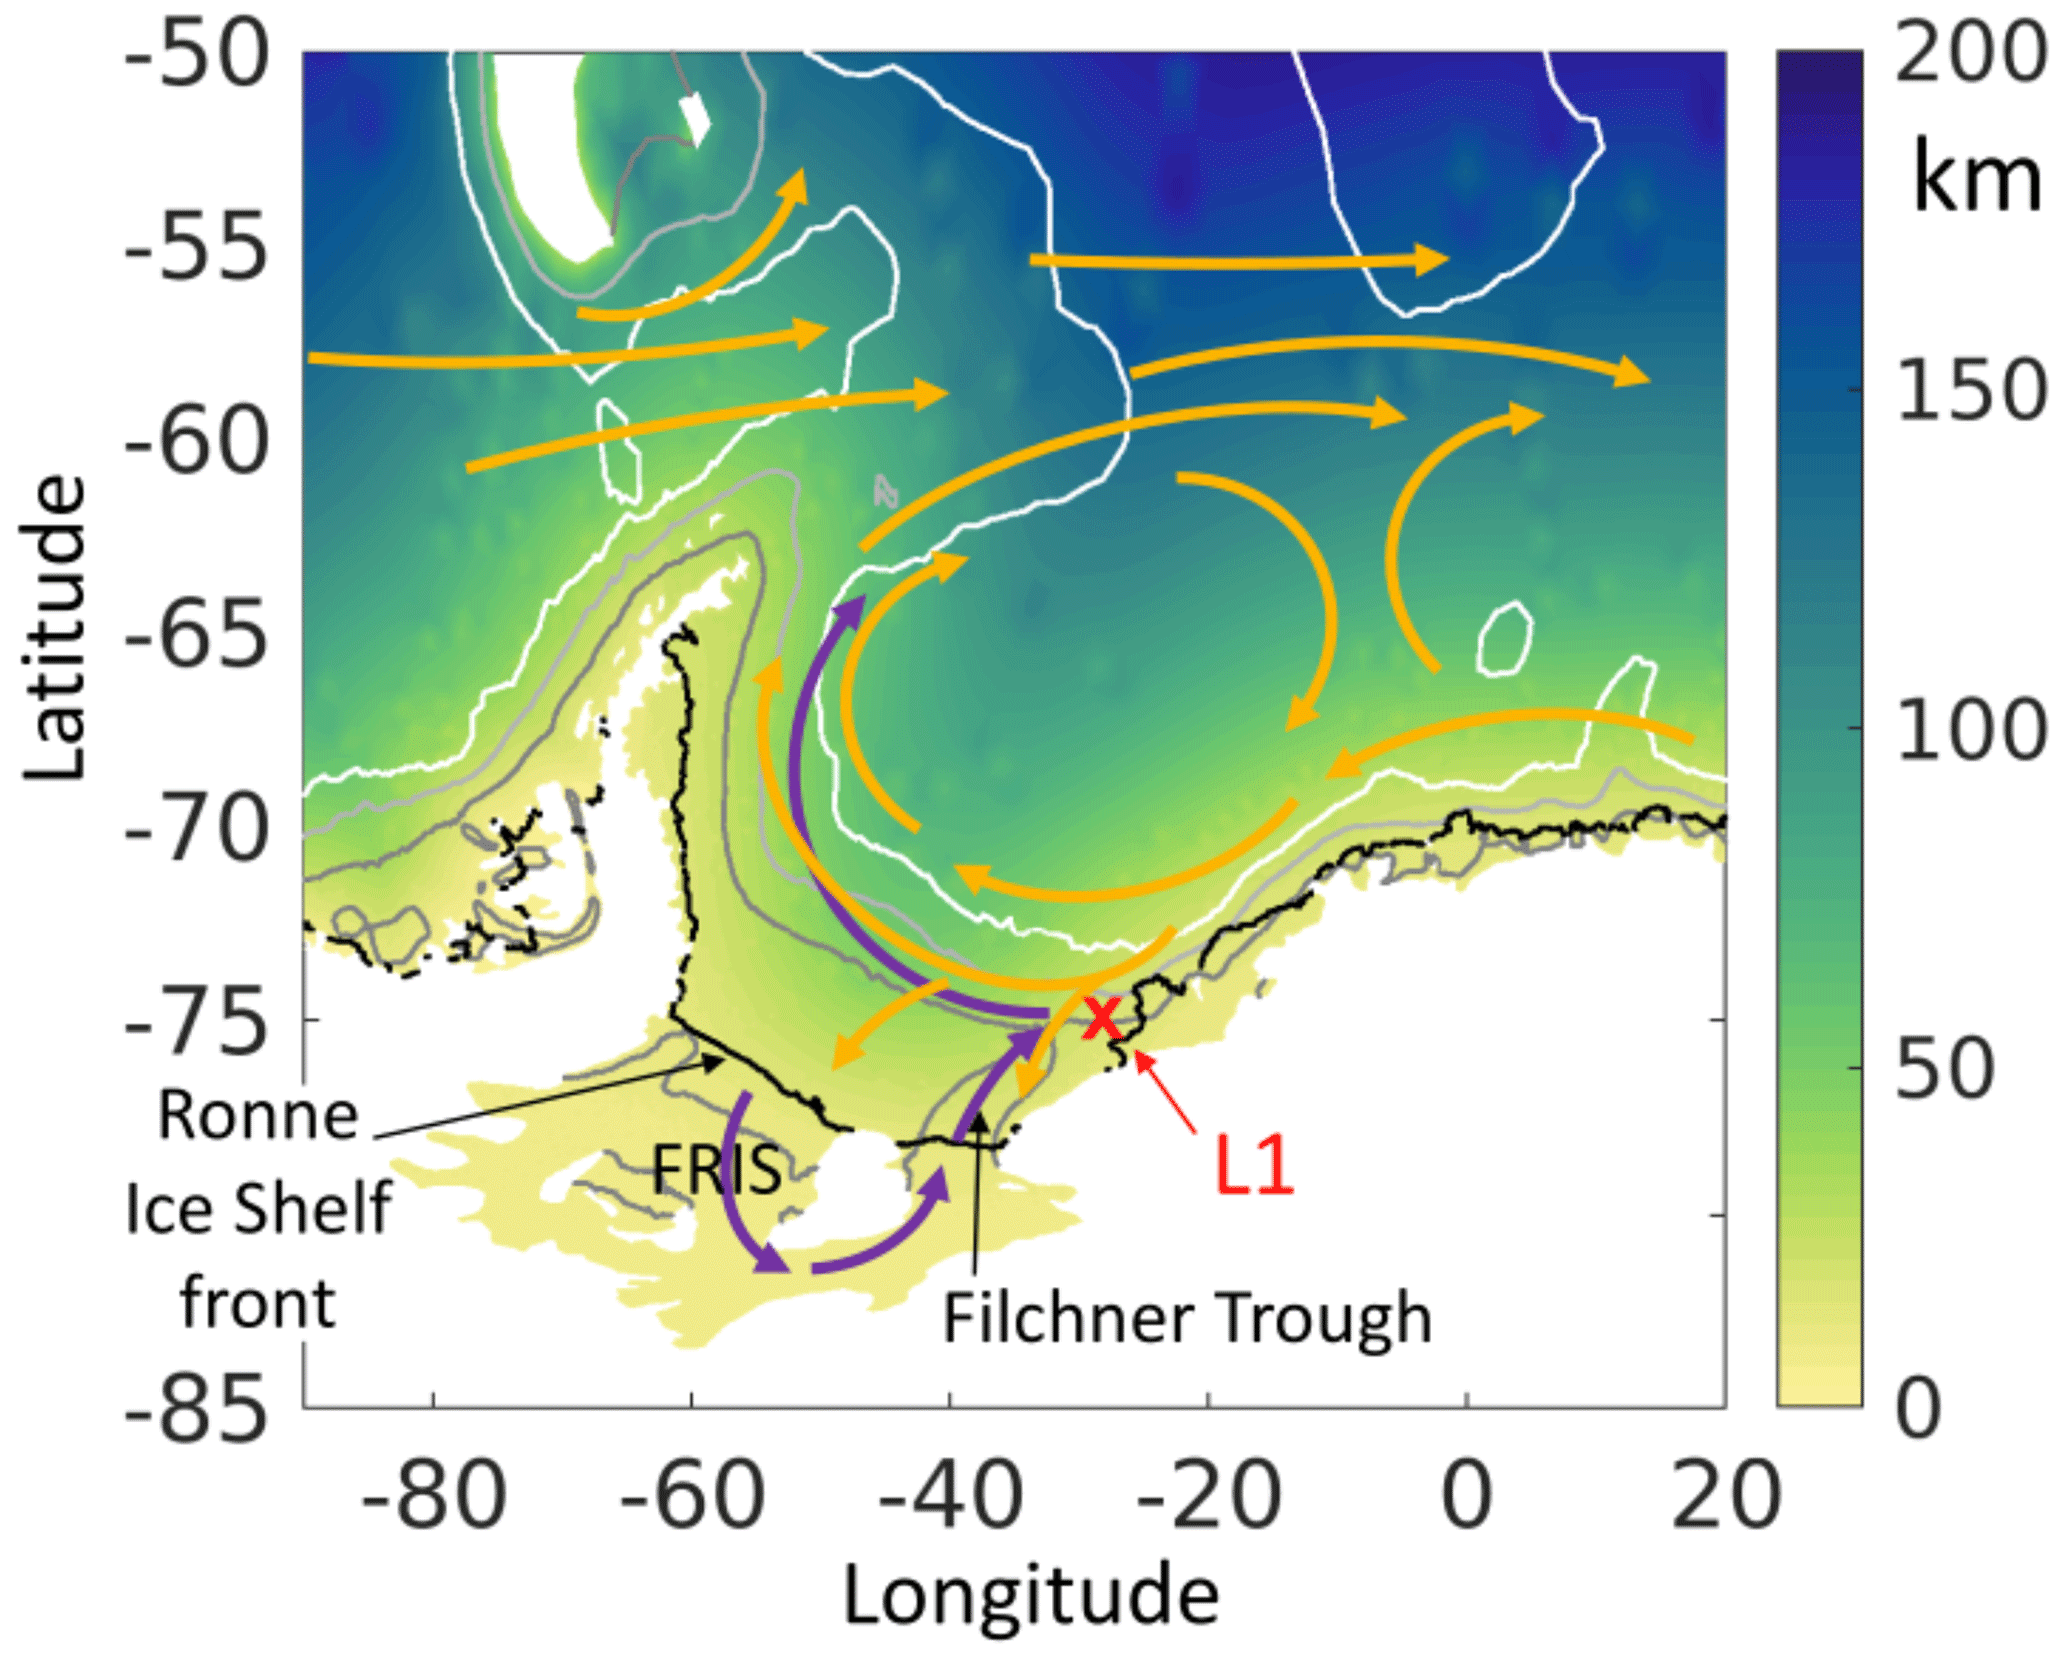
Figure 2Detail view of the Weddell region, part of the global model domain. The grid resolution is shown in colour, with ice shelf fronts (black line), 650 m isobath (dark grey), 2000 m isobath (light grey), and 3500 m isobath (white) added. Location L1 is marked with a red cross. A simplified sketch of the circulation is overlaid with orange (warm) and purple (cold) water pathways. Please note that even the cold high-salinity shelf water (HSSW) flowing into the cavity is a source of heat for the ice shelf despite its temperatures close to the surface freezing point.
2.2 Atmospheric data sets
ERA Interim. A well-established re-analysis data set of the European Centre for Medium-Range Weather Forecasts (ECMWF) (Dee et al., 2011). For the period 1979–2017, we use 10 m zonal wind, 10 m meridional wind, 2 m air temperature, 2 m dew-point temperature, evaporation, precipitation, shortwave radiation, and longwave radiation. Of these, the first four have a temporal resolution of 6 h, the latter four of 12 h. The data set contains 365 d per year and accounts for leap years. This data set was chosen as the basis data set for this study because Štulić et al. (2023) tuned the model with ERA Interim forcing to match observation-based rates of sea ice formation, which play a critical role in controlling warm water intrusions into the FRIS cavity (Timmermann and Hellmer, 2013).
HadCM3. The atmospheric output of a fully coupled climate model of the Met Office Hadley Centre (Collins et al., 2011; Johns et al., 2011). The variables available to us are 10 m zonal and meridional wind, 1.5 m air temperature and specific humidity, evaporation, precipitation, shortwave radiation, and longwave radiation. The data set contains daily fields and uses a universal, idealized year with 360 d. HadCM3 20C represents a historic simulation for the 20th century (1900–1999); HadCM3 21C-A1B covers the 21st century (2000–2099) and is based on the A1B climate scenario of the Special Report of Emissions Scenarios of IPCC (2000). This data set was also used by Hellmer et al. (2012, 2017) and Timmermann and Hellmer (2013) in projection studies, where it led to a regime shift on the Weddell Sea continental shelf. In this study, it serves as the basis for a seasonal anomaly added to the ERA Interim data in some of the sensitivity experiments.
2.3 Experiments
2.3.1 Overview
We conducted an extensive suite of experiments with different perturbations of the atmospheric forcing. The choice of perturbations applied was led by roughly considering potential future trajectories of the climate state over the next century, mostly aiming for moderate rather than overly strong perturbations. A full list of experiments is provided in Table S1 in the Supplement. Among these are modifications of the meridional wind inspired by Hazel and Stewart (2020) and southward shifts in the wind field around Antarctica similar to Spence et al. (2014), which did not lead to regime shifts in our experiments. After 45 experiments with increasingly complicated forcing alterations, none had resulted in a regime shift, suggesting that the Antarctic continental shelves and the FRIS cavity are less vulnerable to such a change within the next century than we expected from previous studies (Hellmer et al., 2012, 2017; Timmermann and Hellmer, 2013). To force a regime shift, we turned to the data set we knew from these studies to trigger the regime shift for the Weddell Sea, although they used sigma-coordinate models: BRIOS (Hellmer et al., 2012, 2017) and FESOM (Timmermann and Hellmer, 2013). Then we introduced abstracting measures to move away from it step-by-step in our forcing perturbations. A comparison of the HadCM3 data with ERA Interim revealed large differences in the seasonal cycle. We therefore focused on modifications of the seasonal signal in our perturbations.
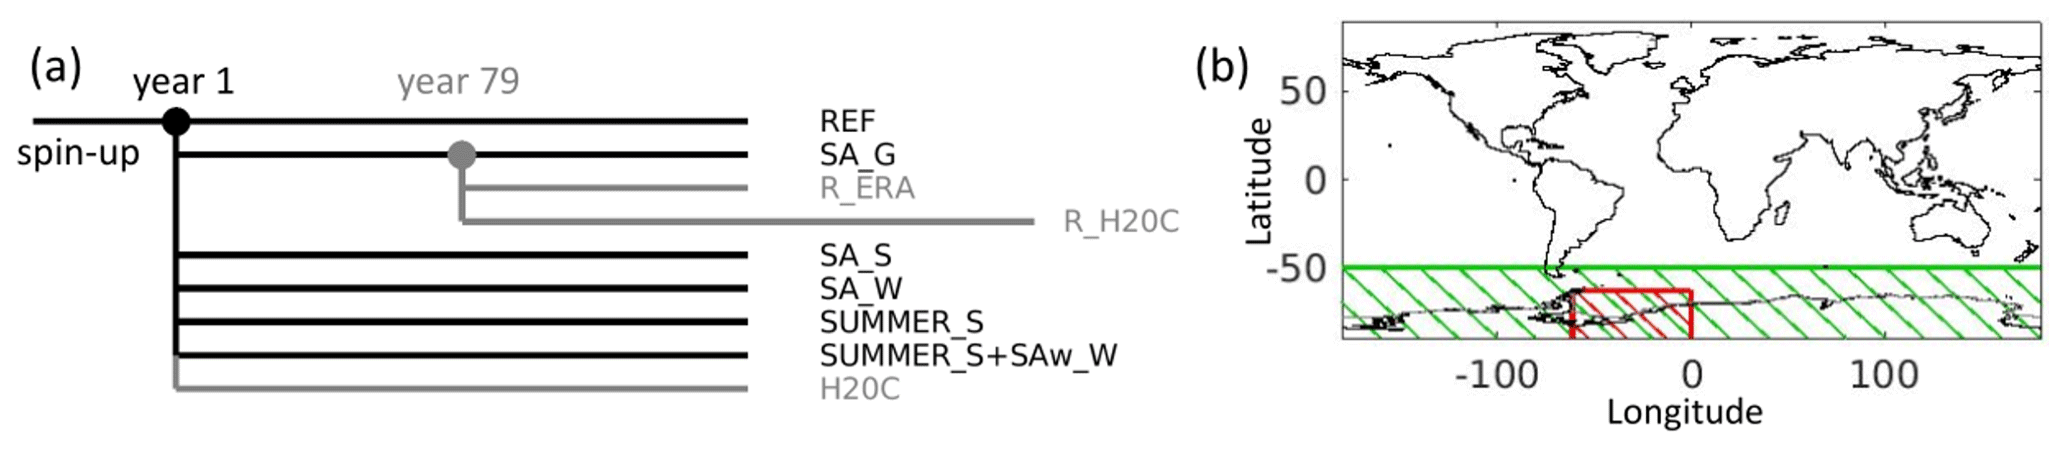
Figure 3(a) A schematic showing the branch-off points and branched-off experiments. (b) The relevant regions of the different forcing applications on a map showing the global domain (_G). The circumpolar southern region (_S) is marked green and the Weddell Sea region (_W) is marked red. Please note that in our simulations ice shelf-covered areas are not affected by atmospheric forcing.
From a total of 75 experiments, of which 15 resulted in a regime shift on the southern Weddell Sea continental shelf, we chose five perturbation experiments to be discussed here since they well cover the overall range of ocean states undergoing regime shifts (or not). The first three experiments provide useful insight into regional versus far-field influences. The other two are closely related but land on different sides of the tipping threshold (Fig. 1) regarding the regime shift on the Weddell Sea continental shelf and exemplarily demonstrate the decisive elements of a regime shift. Three more experiments will be analysed to investigate the reversibility of the regime shift to investigate whether it is indeed a tipping point. Details on the individual experiments follow below.
2.3.2 Reference simulation
REF. A reference/control experiment forced by unaltered ERA Interim data. The years 1979–2017 are repeated four times after a first cycle, which serves as spin-up period for this and all other experiments (see Fig. 3a). Therefore, we count the spin-up as cycle 0 and the following repeats as cycles 1 through 4.
2.3.3 Experiments addressing cause and effect of the cold-to-warm regime shift
Three experiments look into the effects of seasonal anomalies, denoted with “SA”, and two experiments focus on extending the summer season (and making the winter shorter and milder), denoted with “SUMMER”. These five experiments are branched off from REF after the spin-up period (for more information on the effect of the forcing perturbations on the forcing variables, please see Table 1 and Fig. S1 in the Supplement).
SA_G. The seasonal cycle of all ERA Interim variables was altered by adding a seasonal anomaly globally, also affecting the annual mean. The construction of this seasonal anomaly is described in Sect. 2.4 (see also Fig. S2a).
SA_S. The same seasonal anomaly was applied to the forcing data as described for SA_G but only in the region south of 50∘ S (Fig. 3b). North of this line, the ERA Interim forcing remains unaltered.
SA_W. The same seasonal anomaly was applied to the forcing data as described for SA_G but only in the region of the Weddell Sea (south of 63∘ S and between 0 and 61∘ W; Fig. 3b). Outside of this area, the ERA Interim forcing remains unaltered.
SUMMER_S. The duration of the austral summer season is prolonged by running through every day of January three times, while the austral winter months July and August are eliminated (Fig. S2b). This includes all variables, even shortwave radiation, although this may lead to unrealistic results. The alteration is only applied south of 50∘ S (Fig. 3b). North of this line, the ERA Interim forcing is unaltered.
SUMMER_S+SAw_W. Same as SUMMER_S with the exception of the zonal and meridional wind components. A seasonal anomaly is added to both wind components for the Weddell Sea region (Fig. 3b). This seasonal anomaly is abstracted from the anomaly used in SA_W by using a fitted sine curve (with periodicity of 1 year; Fig. S2c) and spatial smoothing.
2.3.4 Experiments addressing reversal behaviour
Three experiments were designed to investigate reversibility of the regime shift. Since the definition of a tipping point includes hysteresis behaviour, these experiments provide a short test of whether a return to the previous regime is possible with the respective reference forcing data sets.
R_ERA. A reversal run using unaltered ERA Interim data, same as in the reference run REF. However, the experiment starts from a post-regime-shift, warm state of the FRIS cavity (branched-off after cycle 2 of SA_G; Fig. 3a).
R_H20C. A reversal run using unaltered HadCM3 20C data. Like R_ERA, it starts from a post-regime-shift, warm state of the FRIS cavity (branched-off after cycle 2 of SA_G; Fig. 3a).
H20C. A run using unaltered HadCM3 20C data (same as R_H20C) but starting from a pre-regime-shift, cold state of the FRIS cavity (branched-off after spin-up (cycle 0 of REF); Fig. 3a). It serves as a reference run for R_H20C.
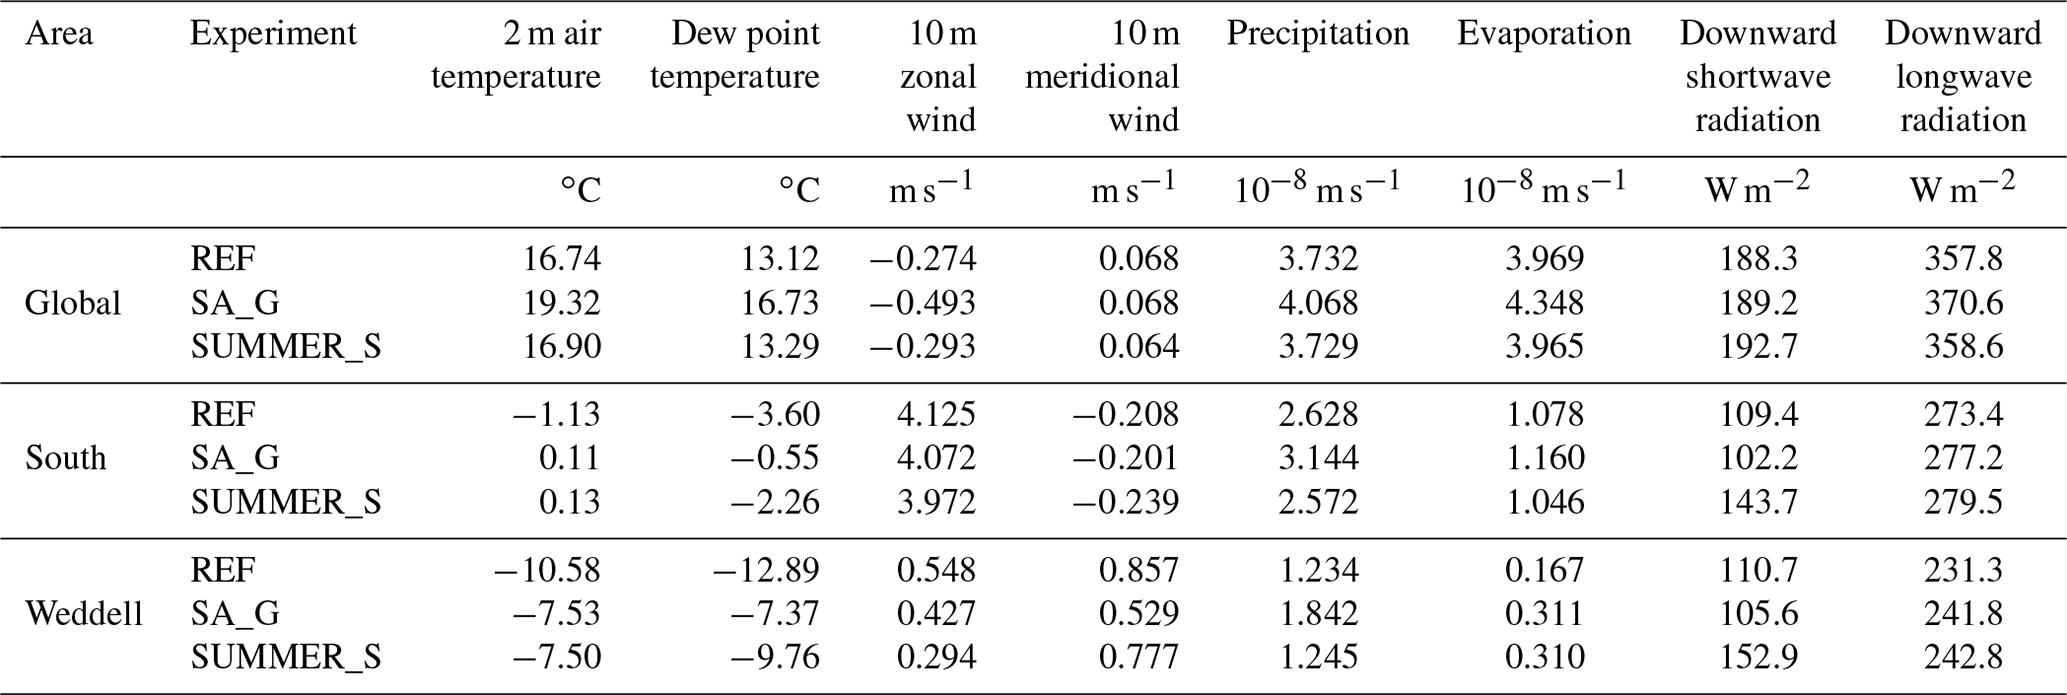
Table 1Regional mean values over the relevant ocean areas of the atmospheric forcing variables averaged over the 39-year forcing cycle.
2.4 Calculation of the seasonal anomaly for the SA_* experiments
The seasonal anomaly that is used in experiments SA_G, SA_S, and SA_W and is the basis for the SAw_W wind field alteration was calculated by subtracting the mean seasonal cycle of ERA Interim for the period 1980–1999 from the mean seasonal cycle of HadCM3 21C-A1B for the period 2070–2089, using a 30 d running mean (see also Fig. S2a). This period in the second half of the 21st century was chosen because previous experiments (Timmermann and Hellmer, 2013) showed the interval to be prone to causing a regime shift on the Weddell Sea continental shelf. To make the data sets compatible, every 60th day of the HadCM3 21C-A1B data was repeated to account for the difference in year length. In leap years, the last day of the year is also repeated.
Additionally, the specific humidity of the HadCM3 21C-A1B data was converted to the dew point temperature before determining the mean seasonal cycle. We used both the relationship between relative humidity Hr and Td using the Clausius–Clapeyron approximation as detailed in Stull (2017):
with water vapour pressure ϵ, saturation water vapour pressure ϵs, an empirical constant ϵ0=6.113 kPa, latent heat L, gas constant for pure water vapour Rv, and reference temperature T0=273.16 K, in addition to the relationship between Hr and Hs (Stull, 2017) combined with an approximation for ϵs as described by Bolton (1980), adapted for absolute temperatures:
with the gas constant for dry air Rd and pressure p assumed to be 101.3 kPa.
The anomaly varies with location and day-of-year and is added to the ERA Interim data. Short-term and interannual variability in the ERA Interim data are maintained in the resulting data set, while annual mean and shape of the seasonal cycle are altered to resemble more closely those of HadCM3 21C-A1B.
Several of our experiments using perturbations of the atmospheric forcing show a regime shift towards a sustained flow of Modified Warm Deep Water (MWDW) onto the continental shelf in the southern Weddell Sea. Of these, SA_G, SA_S, SA_W, and SUMMER_S+SAw_W will be discussed in detail in Sect. 3.1 and 3.2 since they represent the range of regime shifts our experiments yielded and since the first three also allow some deductions regarding global, far-field, and regional influences. SUMMER_S, on the other hand, is added to the analysis as an experiment that does not experience a regime change on the Weddell Sea continental shelf, although showing many of the characteristics that have previously been identified to accompany the regime shift.
Section 3.3 examines the reversibility of the regime shift. There, the experiments R_ERA and R_H20C, branched off from SA_G, are discussed and compared to their respective reference runs, REF and H20C.
3.1 Warm inflow at FRIS
All presented perturbation experiments feature a warming of the Weddell Gyre (Fig. 4). Compared to 1.3 ∘C in REF, at 30∘ W core temperatures of the southern gyre branch reach 2.3 ∘C in SA_G and SA_S, and 1.9 ∘C in SUMMER_S, while SA_W (1.4 ∘C) and SUMMER_S_SAw_W (1.6 ∘C) experience a more moderate warming. The experiments SA_G, SA_S, SA_W, and SUMMER_S+SAw_W all feature a regime shift towards a sustained flow of Modified Warm Deep Water (MWDW) onto the continental shelf in the southern Weddell Sea with respective temperatures of 1.9, 2.0, 0.8, and 0.4 ∘C reaching the ice shelf cavity (Fig. 4). SUMMER_S does not experience a regime shift; it is included here as a counter-example and will play an important role in Sect. 3.2, where we examine the decisive factors for a regime shift.
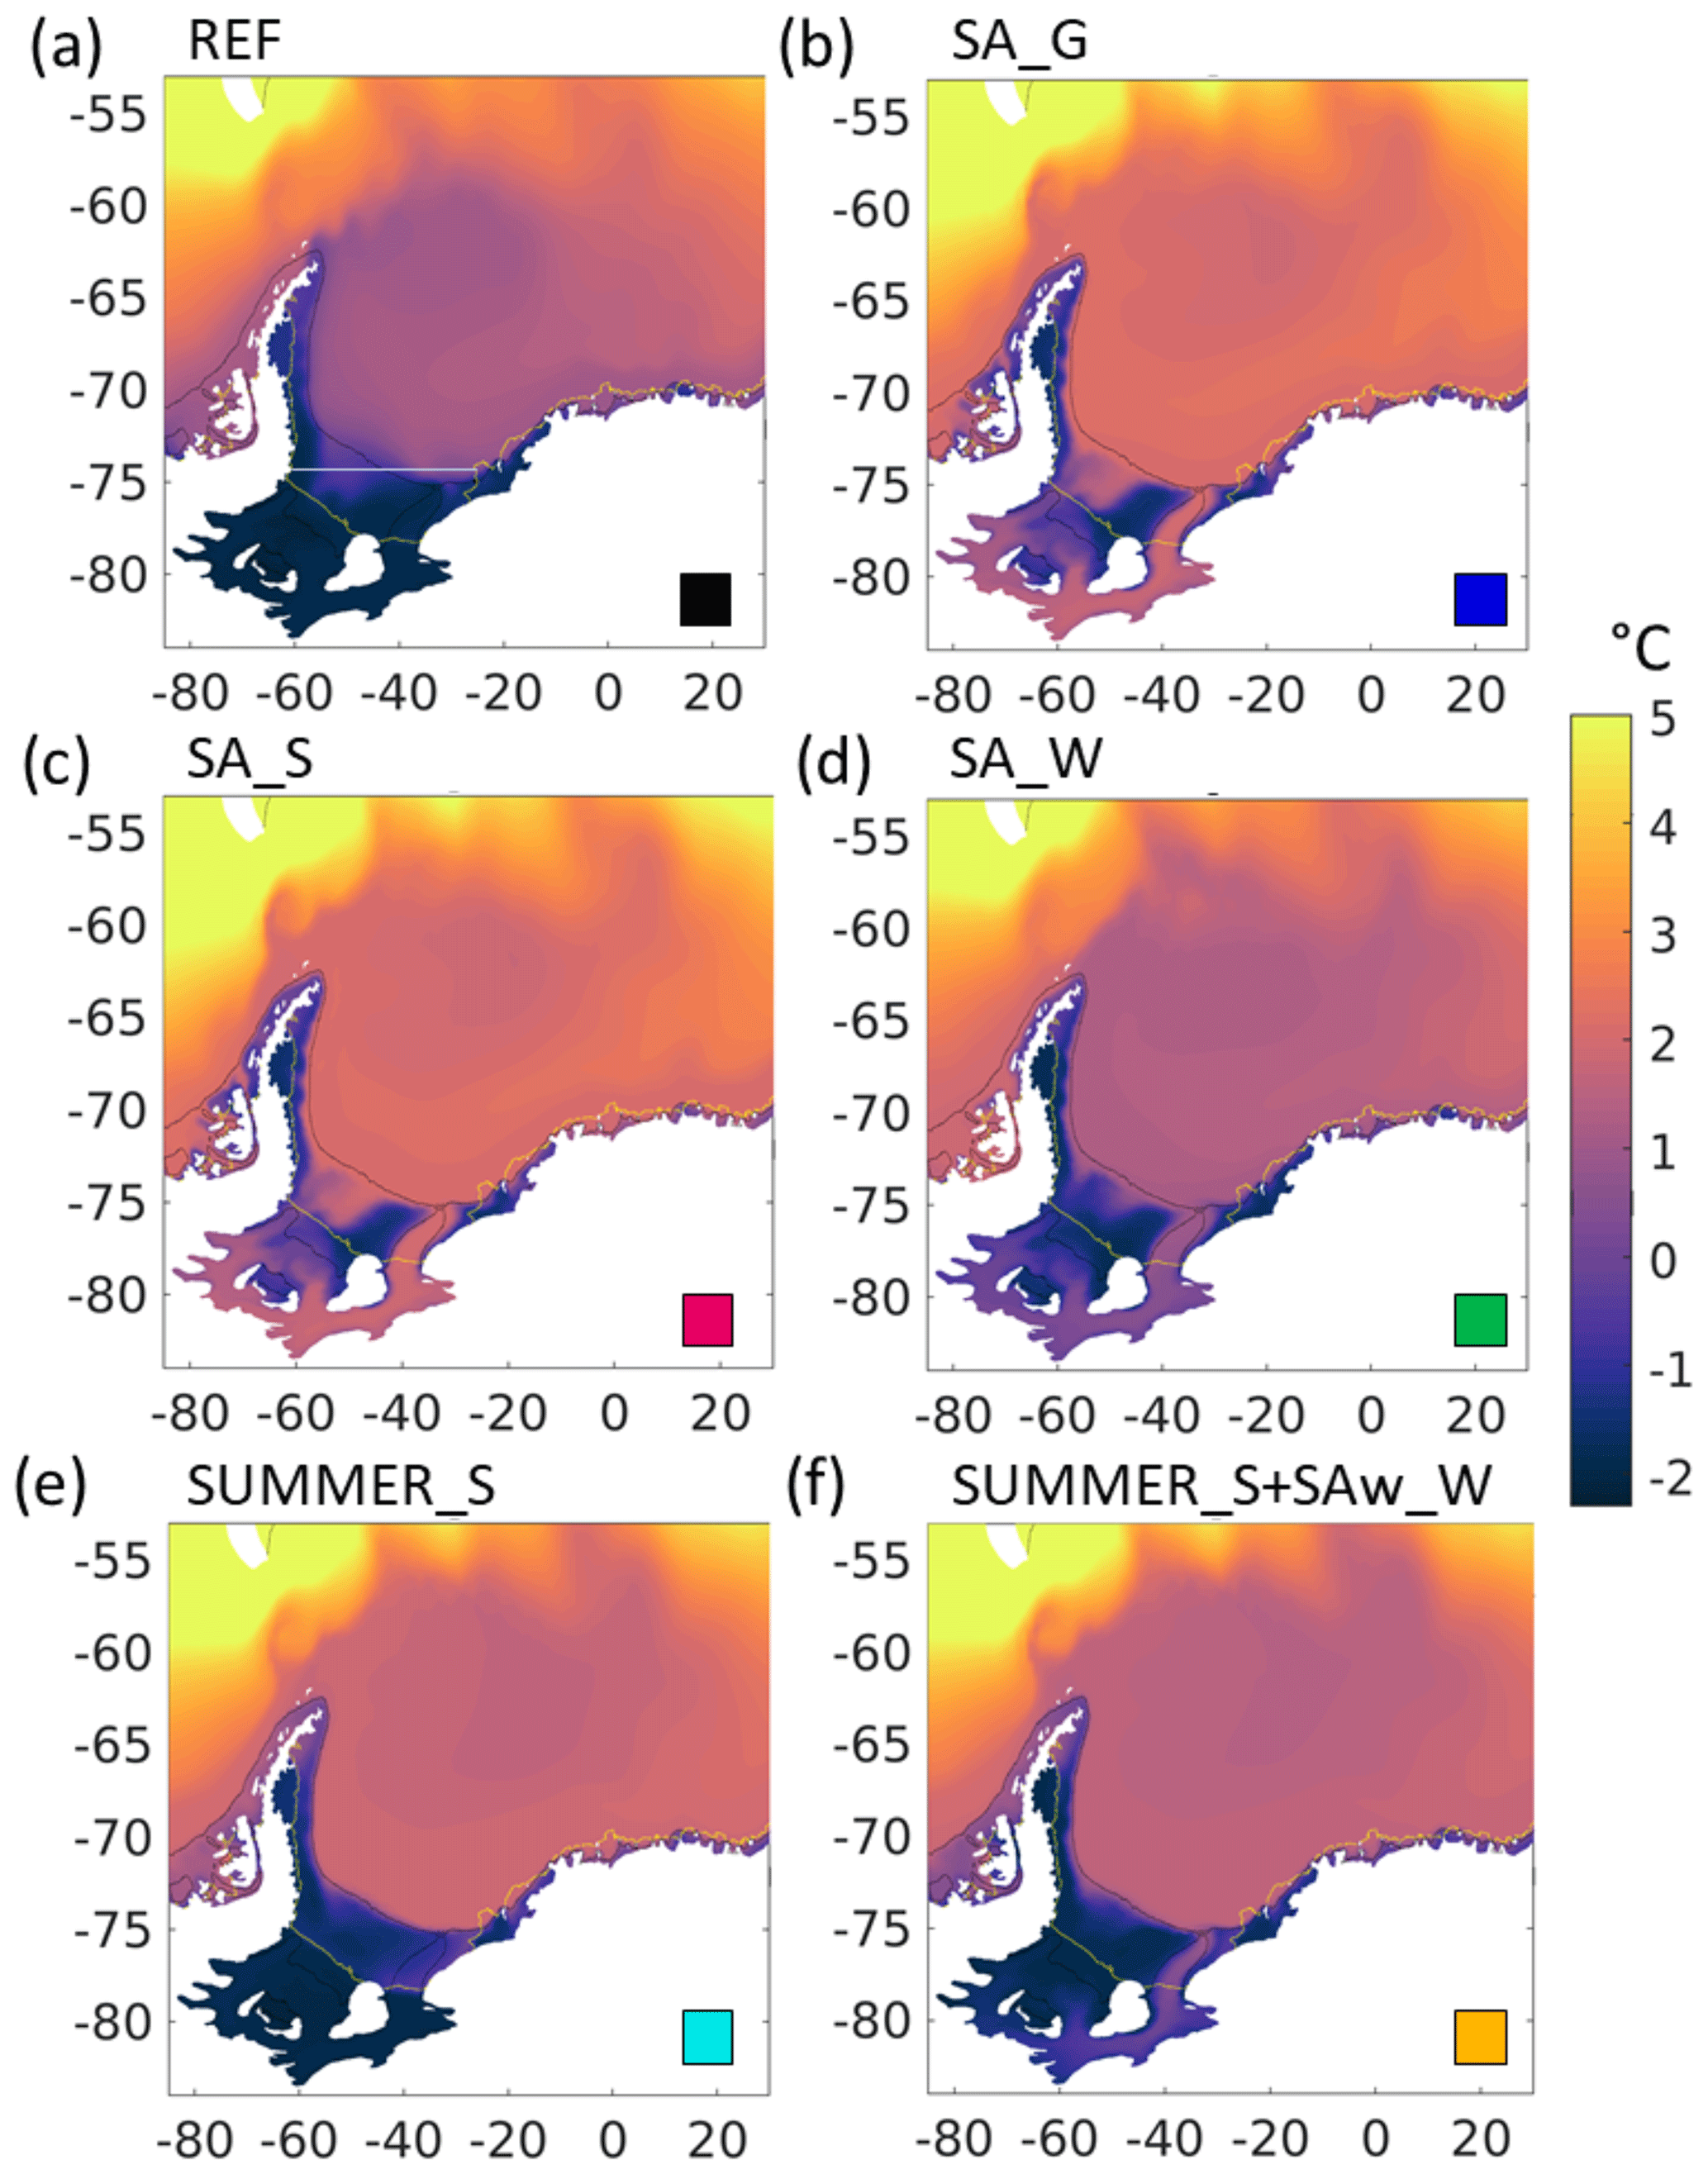
Figure 4Temperature maximum in the water column of the Weddell Sea (mean of years 69–78) for experiments (a) REF, (b) SA_G, (c) SA_S, (d) SA_W, (e) SUMMER_S, and (f) SUMMER_S_SAw_W. On the continental shelf and in the ice shelf cavity, the depicted maximum temperature of the water column is practically the same as the bottom temperature but avoids the possibility of any “hidden” warm water. The coloured squares in the lower right corners are intended for easier recognition of the experiments; the colours re-occur as identifiers for the different experiments in the time series plots. The light blue line in panel (a) marks the northern border of the on-shelf area used for Figs. 5 and 9.
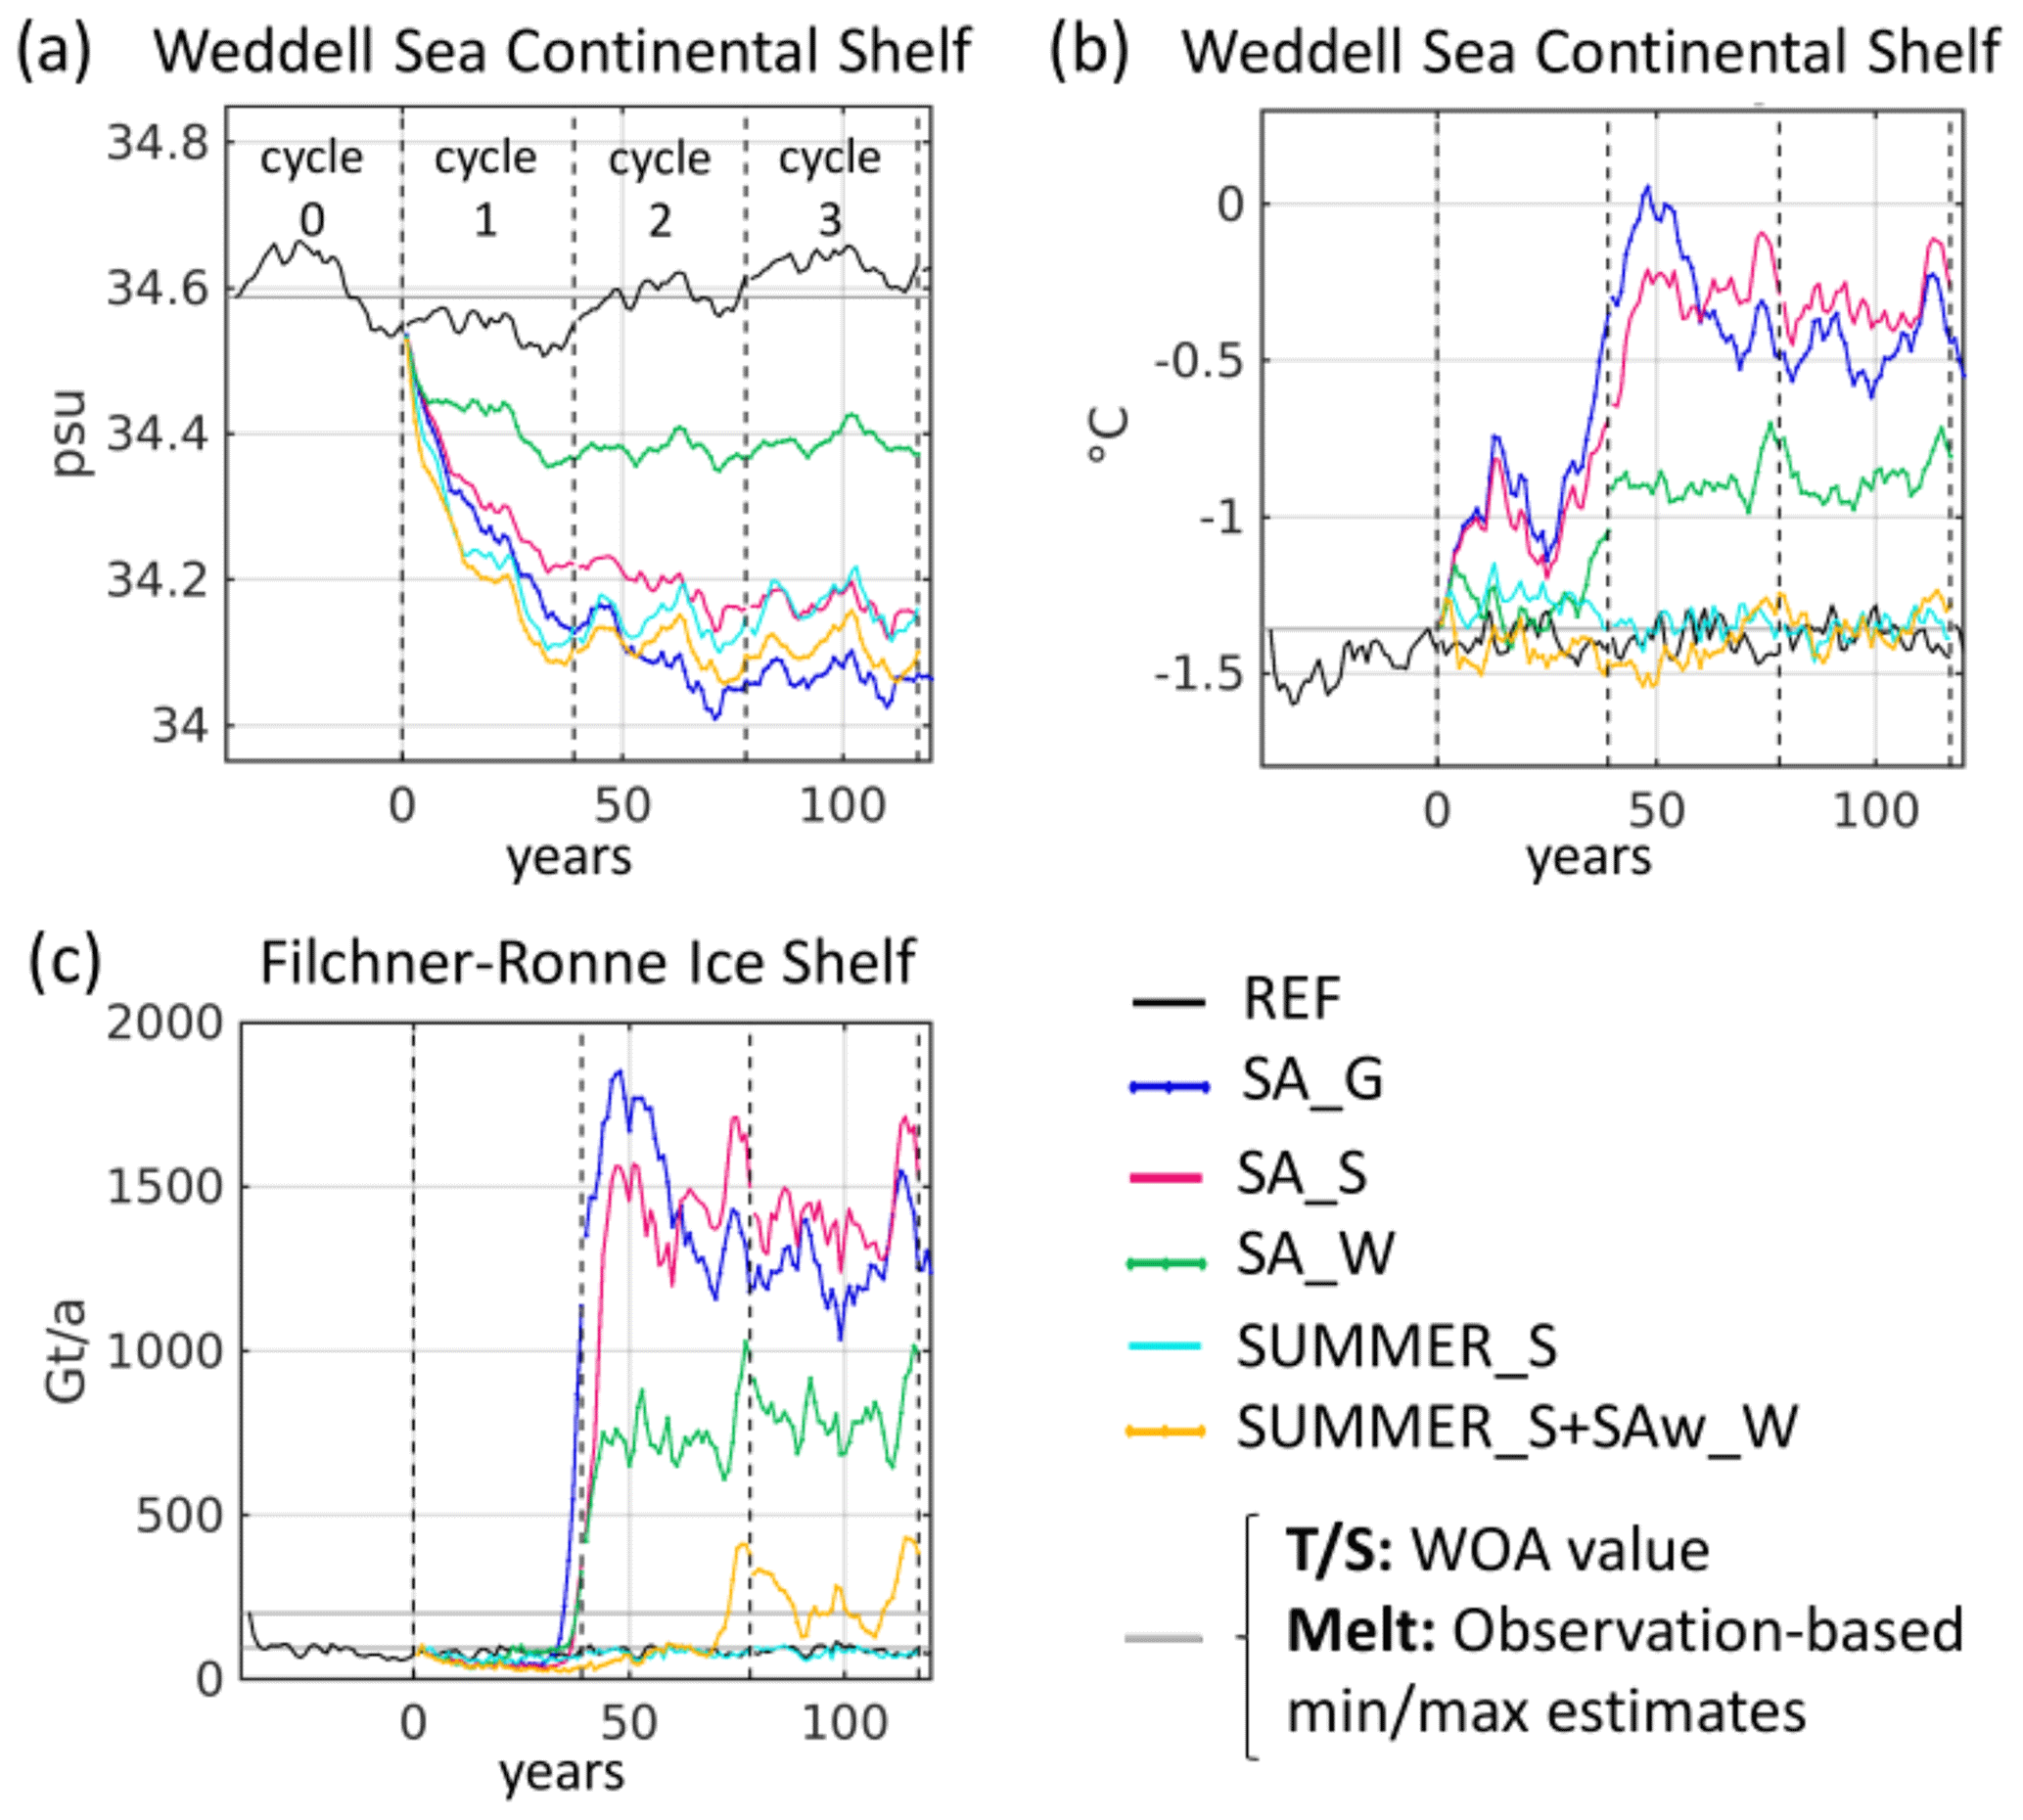
Figure 5(a) Annual mean salinity on the Weddell Sea continental shelf and (b) annual mean temperature of the Weddell Sea continental shelf, both averaged over volume at 200–1000 m depth, south of 74∘ S (see also Fig. 4a), excluding the ice shelf cavities). (c) Area-averaged annual mean FRIS melt rates. The observation-based estimates include studies by Jacobs et al. (1992) Joughin and Padman (2003) and Rignot et al. (2013).
The experiments SA_G, SA_S, and SA_W – all applying a perturbation based on the HadCM3 21C-A1B seasonal anomaly (see Sect. 2.3) – clearly show a freshening and warming of the Weddell Sea continental shelf waters below 200 m (Fig. 5a, b). Between 35 and 40 years after we started to apply the perturbation, FRIS melt rates – so far on the lower end of the range based on observations (Jacobs et al., 1992; Joughin and Padman, 2003; Rignot et al., 2013) – rapidly increase to up to 20 times the melt rates found in REF (Fig. 5c). During the same time interval, the Weddell Sea continental shelf appears to reach a new relatively stable state with a mean temperature increased by 0.5 K in SA_W and approximately 1 K in SA_G and SA_S compared to REF. This temperature is dependent on the heat available in the WDW present at the continental shelf break (not the maximum in the gyre core), and temperature maps (Fig. 4) show that the temperature in the Filchner Trough has reached its maximum in all cases. Salinity in SA_G, SA_S, and SA_W is respectively decreased by approximately 0.2, 0.5, and 0.4 psu compared to REF, which after the spin-up starts with a fresh bias of 0.05 psu compared to the WOA data (Fig. 5a).
Once the new, warm state has been established, fluctuations in the available heat (Fig. 5b) directly impact the melt rate (Fig. 5c). We note that the strong increase in basal melt rates around year 40 is not associated with an accelerated freshening of the water on the continental shelf (compare Fig. 5a and c), so that there is no evidence of a strong feedback of the enhanced meltwater supply on the water mass characteristics on the continental shelf.
Comparing the development of the continental shelf hydrography (Fig. 5a, b) between SA_G and SA_S shows that the influence of forcing anomalies applied to the ocean north of the Antarctic Circumpolar Current (ACC) is comparatively small. Global forcing manipulation (SA_G) triggers a stronger reduction in shelf salinities compared to the circumpolar perturbation (SA_S), and the initial response of shelf temperatures and melt rates in SA_G surpasses that of SA_S alongside with a slightly earlier increase in melt rates (exceeding 200 Gt yr−1 in year 35 vs. year 38). This initial maximum is, however, followed by a short decrease, and after year 62 both temperatures and melt rates remain below the values found in SA_S.
In SA_W, where a perturbation is applied only to the Weddell Sea, the response in both temperature and salinity is about half of what we see in SA_S, where a circumpolar perturbation is applied. The rapid melt rate increase in SA_W occurs at the same time as in SA_S, surpassing 200 Gt yr−1 in year 38. However, the melt rates yielded in the new steady state reflect the same factor ≈2 as found in the on-shelf temperature and salinity changes in SA_S compared to SA_W.
The differences between these three experiments clearly underline the importance of the ACC and the influence of other Antarctic regions for the Weddell Sea. The regime shift on the continental shelf is by no means an event dependent on local changes only but is strongly influenced by far-field processes. The entire Southern Ocean is efficiently shielded from mid-latitude influence by the ACC. However, disruptions and anomalies are carried from one region of the Southern Ocean to the next by the ACC and, in the opposite direction, by the slope/coastal current with an impact on local water mass characteristics. Both air temperature and wind field exert a strong influence on the ocean. Over the ACC, the HadCM3 21C-A1B data feature much higher air temperatures than ERA Interim and the westerlies are stronger in this region (see Table 1 and Fig. S1).
The experiments SUMMER_S and SUMMER_S+SAw_W, despite showing substantial freshening on the continental shelf, do not feature a prominent increase in mean shelf water temperature (Fig. 5a, b). While in SUMMER_S, we also find no substantial rise in FRIS basal melt rates, SUMMER_S+SAw_W features a late, comparatively low increase in FRIS basal melting (≈ factor 3, Fig. 5c), triggered by a narrow inflow of (M)WDW into the Filchner Trough (Fig. 4f). These two experiments defy the expectation that a strong freshening of the continental shelf must necessarily lead to a strong warming as well as that only a strong warming on the continental shelf can provoke a multiplication of the basal melt rate at the adjacent ice shelf. The two SUMMER_* experiments will be discussed in more detail in the following subsection.
3.2 Deciding factors for warm water inflow
The experiment SUMMER_S is included in the suite of featured experiments because it demonstrates what keeps the continental shelf stable, i.e. keep the subsurface waters on the continental shelf cold and prevent the sustained intrusion of WDW/MWDW into the Filchner Trough and the FRIS cavity. At first glance, it seems to bring all necessary ingredients for a regime shift on the Weddell Sea continental shelf: the on-shelf water experiences thorough freshening, there is evidence of warming on the shelf in cycle 1, and both of these changes exceed what is found for SA_W, where a regime shift is triggered.
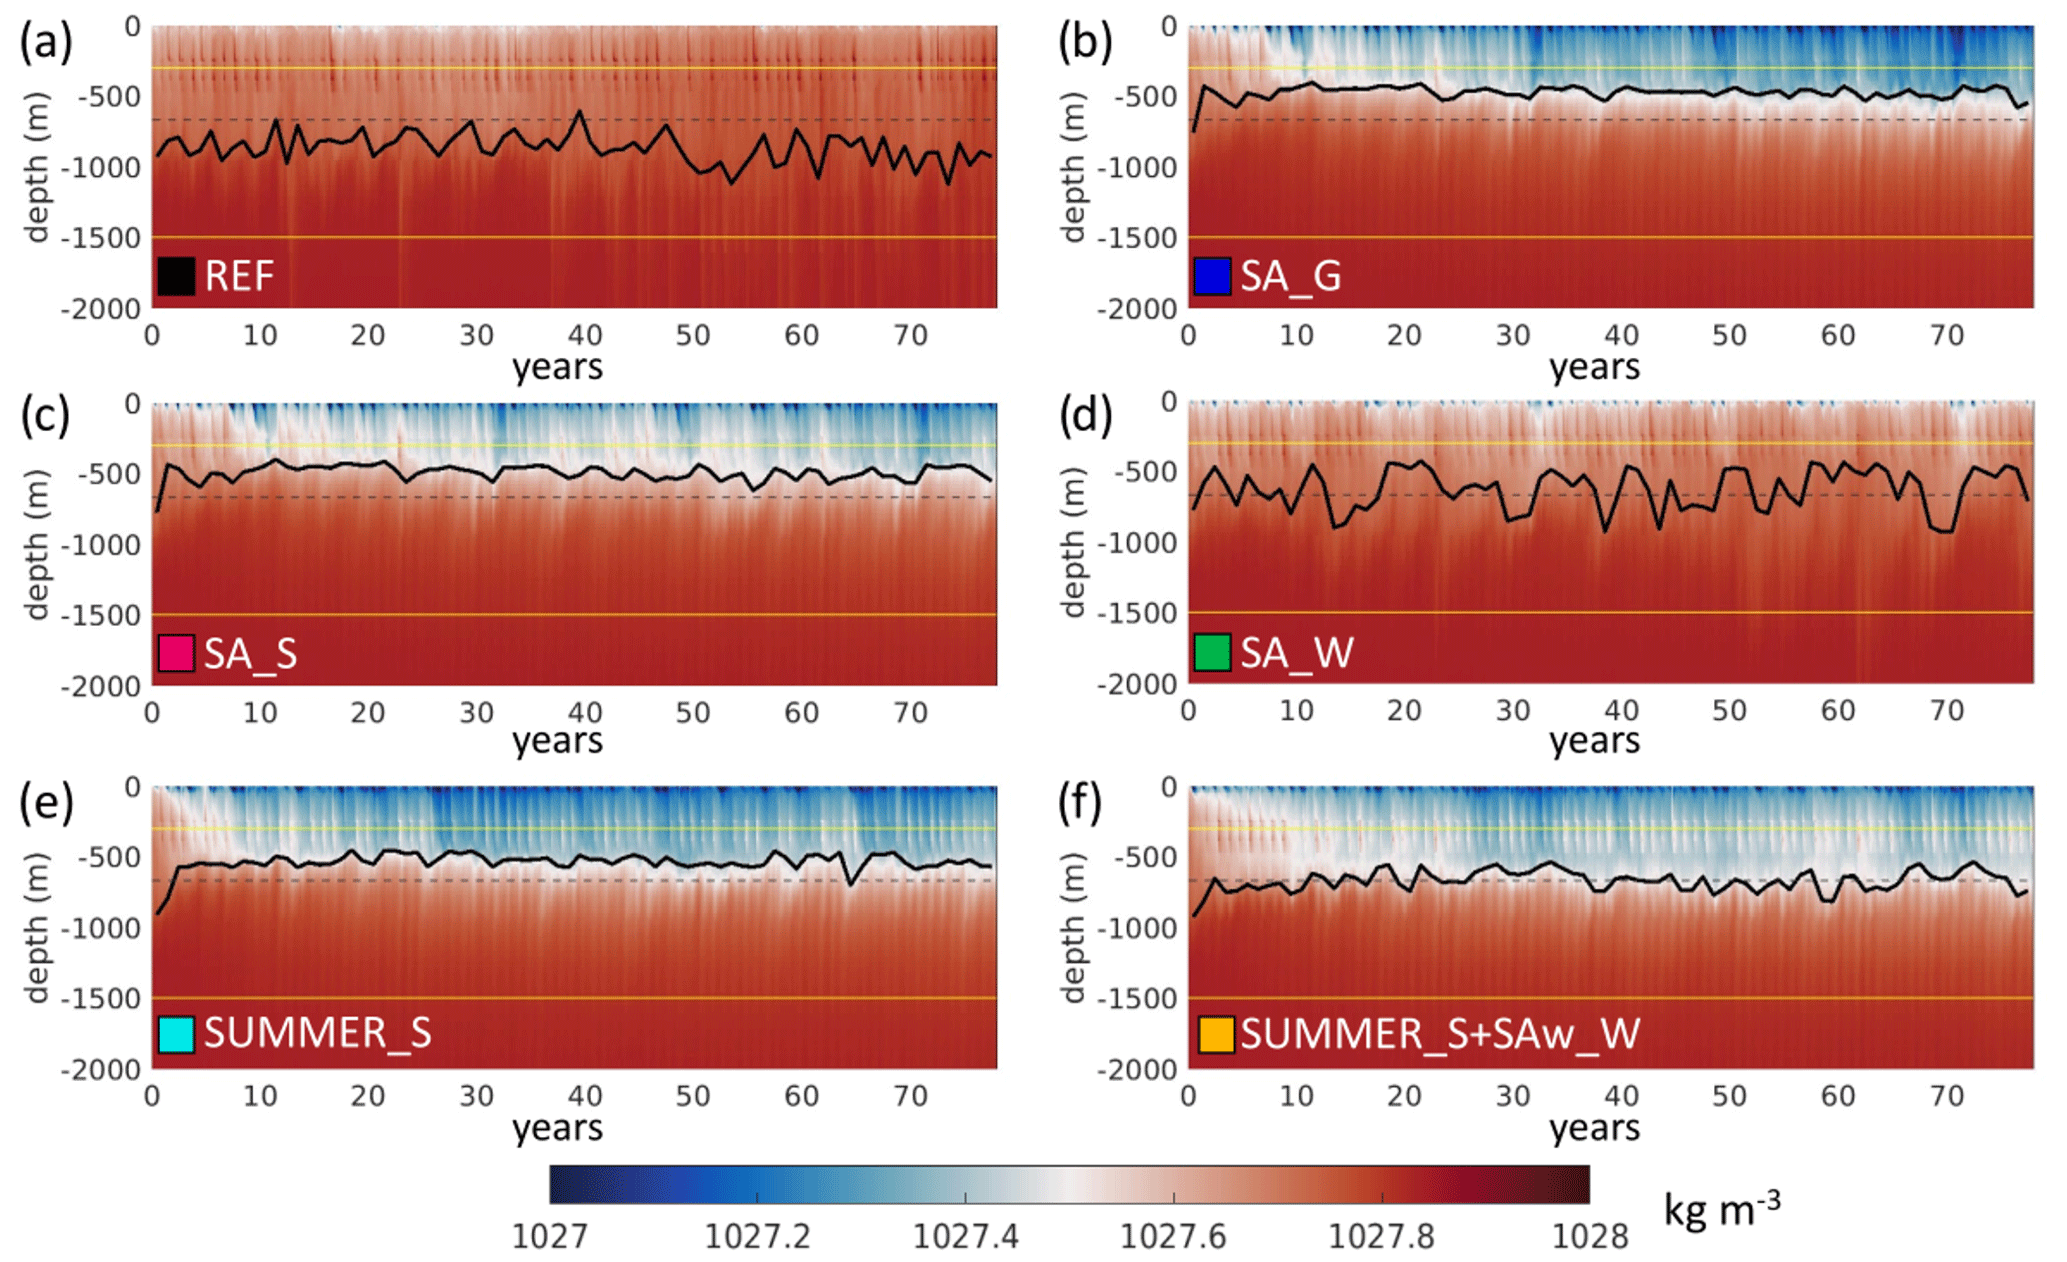
Figure 6ASF depth (solid black line) at continental shelf near L1 in the different experiments. The colour scale shows the bottom density at the cross-section of the continental slope. ASF depth is identified by the strongest vertical temperature gradient at the bottom between the depths of 300 and 1500 m (marked with yellow lines). Additionally, the Filchner Trough sill depth is marked with a dashed black line.
Furthermore, like SA_G and SA_S, SUMMER_S features a quick shoaling of the Antarctic Slope Front (ASF) to depths shallower than the Filchner Trough sill, while the ASF stays below sill depth almost constantly in REF and alternates around it in SA_W and SUMMER_S+SAw_W (Fig. 6). Like the other perturbation experiments, SUMMER_S also exhibits a reduction in ACC transport (Fig. 7a) and an intensification of the Weddell Gyre circulation (Fig. 7b). The weakening of the ACC in SUMMER_S is second only to that in SUMMER_S+SAw_W, and the Weddell Gyre transport (average of 39 Sv in year 30–39) is comparable to SA_G (38 Sv) and SA_S (36 Sv) and distinctively stronger than in REF (29 Sv).
The strengthening of the Weddell Gyre in SUMMER_S is also accompanied by a strong warming of WDW compared to REF (Fig. 4). The much warmer southern branch of the Weddell Gyre and reduced sea ice cover are accompanied by a warm, surface-intensified western branch of the Weddell Gyre that follows the coastline at the tip of the Antarctic Peninsula into the Bellingshausen Sea. In all these characteristics, SUMMER_S is no different from experiments featuring regime shifts (e.g. SA_G and SA_S), but the continental shelf and the ice shelf cavity in SUMMER_S remain protected from the off-shelf changes.
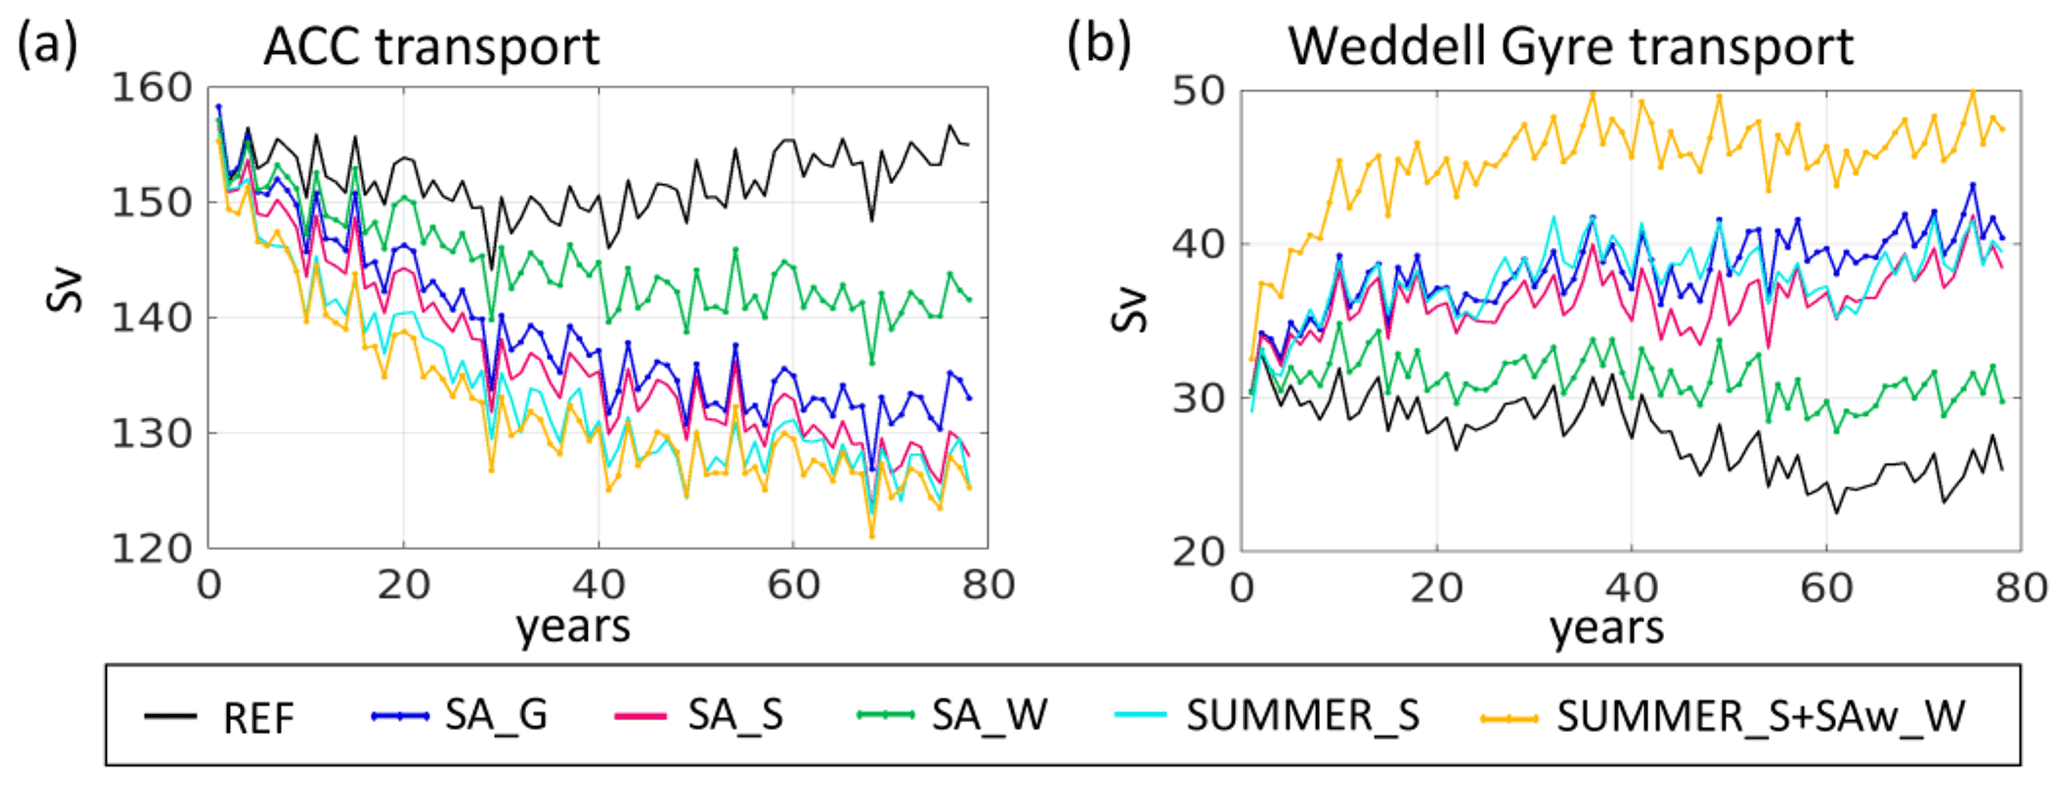
Figure 7(a) ACC transport through Drake Passage and (b) transport of the southern limb of the Weddell Gyre.
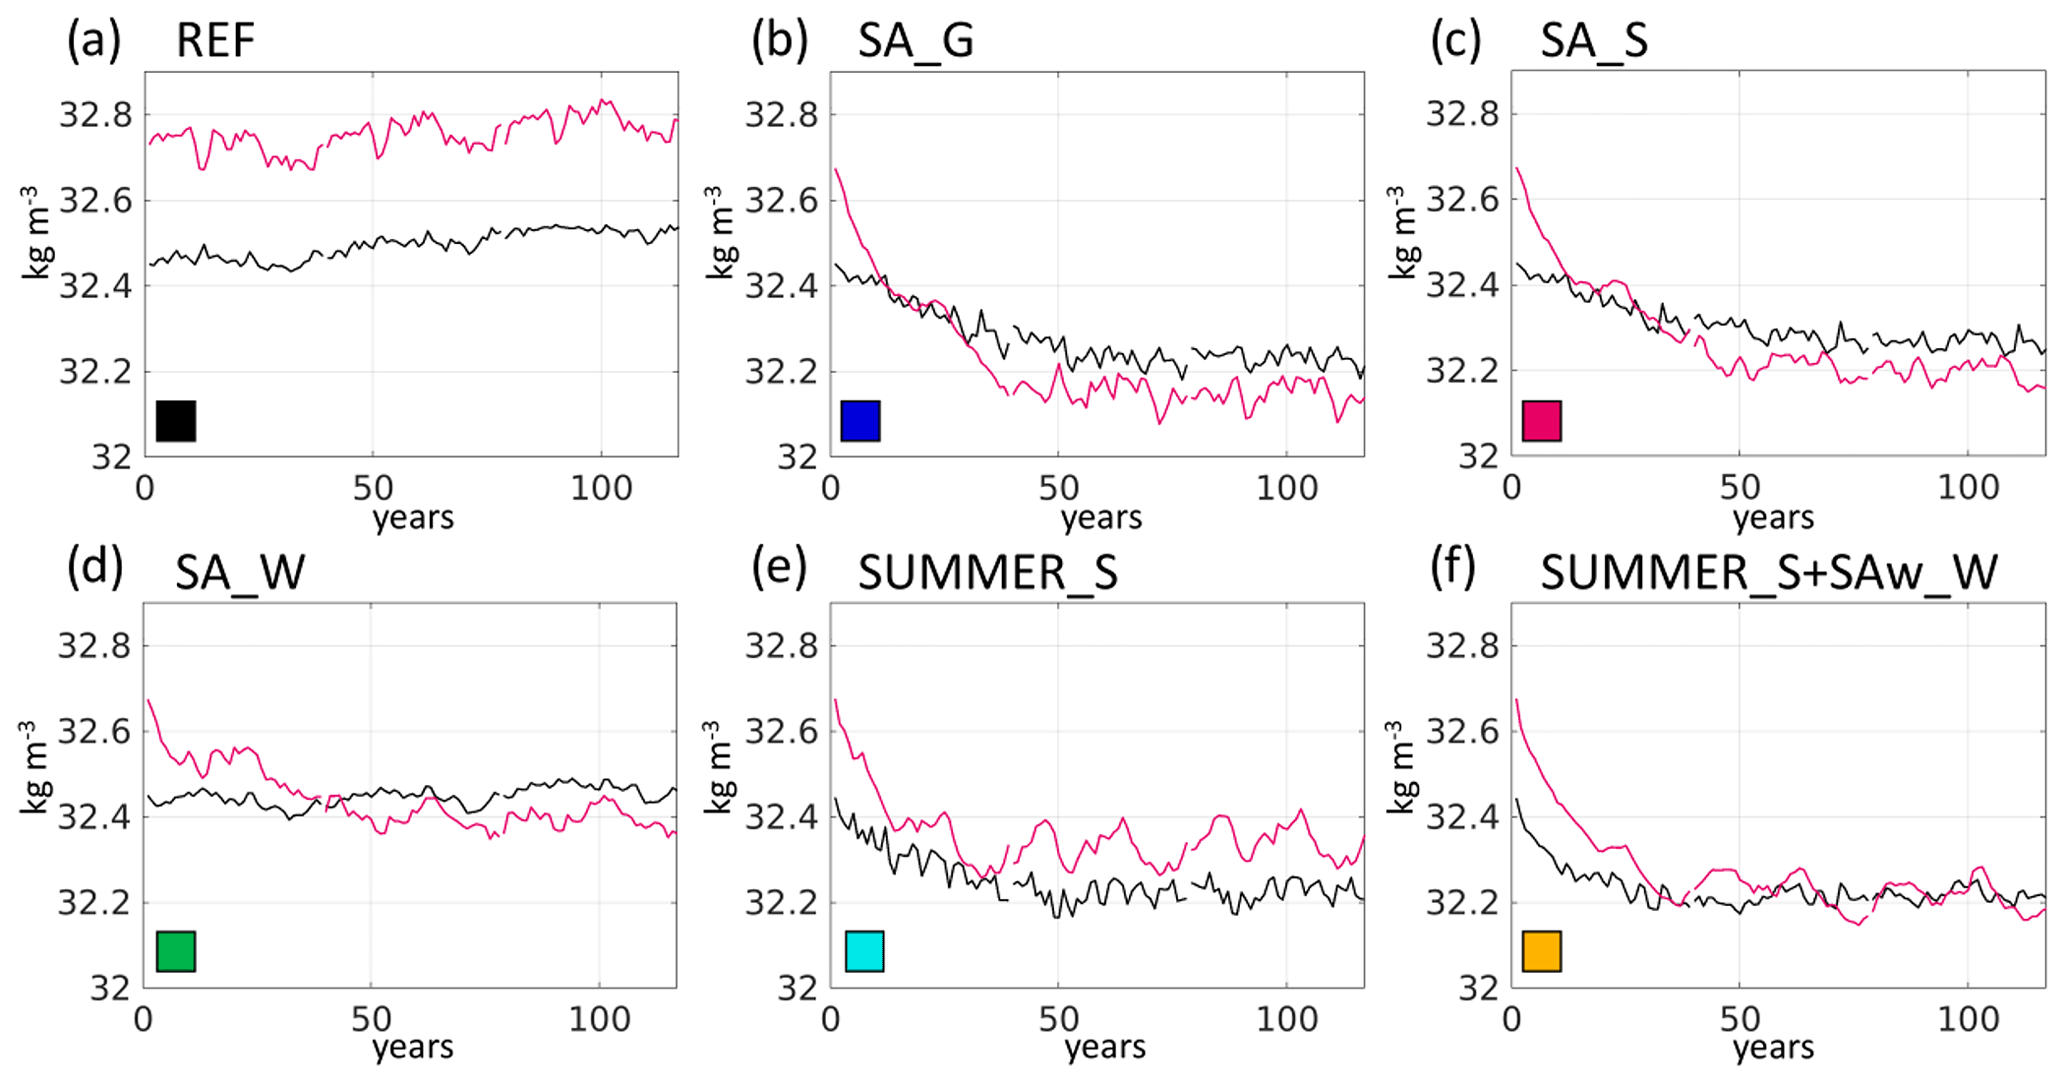
Figure 8Annual mean values of maximum density σ1 (potential density anomaly with reference pressure of 1000 dbar; reference density 1000 kg m−3) along the Ronne Ice Shelf front (red) and bottom density (σ1) at 670 m depth at the continental shelf break at location L1 marked in Fig. 2 (black) for experiments (a) REF, (b) SA_G, (c) SA_S, (d) SA_W, (e) SUMMER_S, and (f) SUMMER_S_SAw_W. The depth of L1 is determined by the z level closest to the Filchner Trough sill depth, which in the model is 640 m, slightly lower than in reality.
The crucial criterion for the warm water to cross the continental shelf and fill the ice shelf cavity turns out to be the balance between the density off-shelf at sill depth and the density of the densest water produced by sea ice formation on the continental shelf. These two water masses are in direct competition for filling up the depths of the ice shelf cavity. In the stable “cold” situation, high-salinity shelf water (HSSW) fills the cavity, while after the regime shift, the warmer WDW/MWDW replaces it. In the Weddell Sea, the most active polynya exists in front of the Ronne Ice Shelf (Haid and Timmermann, 2013), with a seasonal fluctuation in the location of the densest water that is either found on the eastern or the western side of the Ronne Ice Shelf front. We therefore compare the maximum bottom density found along the Ronne Ice Shelf front as a measure of HSSW properties with the bottom density at the shelf break at a position east of (i.e. upstream from) the Filchner Trough sill at 670 m depth (approximate sill depth, location L1 in Fig. 2) as a measure for the properties of the WDW that is a candidate to enter into the Filchner Trough. As seen in Fig. 8a, REF densities for the HSSW in front of the Ronne Ice Shelf are typically 0.3 kg m−3 higher than for the WDW at the shelf break, with a slight positive trend in both time series.
In the perturbation experiments SA_G and SA_S (Fig. 8b, c), the HSSW features a strong density loss in the first 4–5 decades as a reaction to the altered atmospheric forcing. Although WDW density also decreases in these experiments (by between 0.2 and 0.22 kg m−3), at around year 30 it becomes the denser of the two water masses. A direct comparison between these two experiments shows that the WDW density loss is slightly diminished and slowed down by applying the forcing perturbation only to the southern part of the globe. With further restriction of the perturbation area in SA_W (Fig. 8d), the off-shelf density remains relatively stable. It exhibits a slight positive trend but smaller than in REF.
For experiments SA_G, SA_S, and SA_W, the maximum density found on the continental shelf off the Ronne Ice Shelf decreases by 0.3–0.6 kg m−3 (red lines in Fig. 8 b–d), since sea ice formation is strongly reduced by our perturbation of the atmospheric forcing. While SA_G is the experiment with the strongest off-shelf density loss, its on-shelf density decreases even more. Thus, in all cases, the on-shelf density decreases below the off-shelf density after 30–40 years, allowing the warm off-shelf waters to replace the cold waters in the FRIS cavity.
In SUMMER_S (Fig. 8e), the off-shelf density remains below the on-shelf density and although water mass characteristics have changed on-shelf and off-shelf, the continental shelf remains protected by a persisting, albeit more vulnerable, density contrast. It then only takes a change in the regional wind pattern (SUMMER_S+SAw_W) to further inhibit sea ice production and reduce the on-shelf density. The weaker northward winds in HadCM3 21C-A1B (see Table 1 and Fig. S1k) cause a more persistent sea ice cover in the southwestern Weddell Sea, and therefore a decrease in both on-shelf salinity (Fig. 5a) and the maximum density in front of the Ronne Ice Shelf (Fig. 8f). In contrast to SUMMER_S, the SUMMER_S+SAw_W on-shelf density dips, at least temporarily, below the off-shelf density, immediately triggering warm water flow onto the continental shelf and into the cavity via the Filchner Trough.
After year 70 in SUMMER_S+SAw_W, the maxima and minima seen in the FRIS basal mass loss (Fig. 5c) can be clearly associated with the extremes in the maximum density in front of the Ronne Ice Shelf (Fig. 8f). In this case, the density balance is so sensitive that the mean basal melting of FRIS is controlled by sea ice production on the continental shelf. One should note, however, that salinity – the governing control on density in the region – is a product not only of local processes but of the accumulated history of the water parcel (Haid et al., 2015). In the other experiments, once a warm state is established (year 40+), mean FRIS basal melting shows a clear dependence on the mean temperature on the continental shelf (cf. Fig. 5b and c).
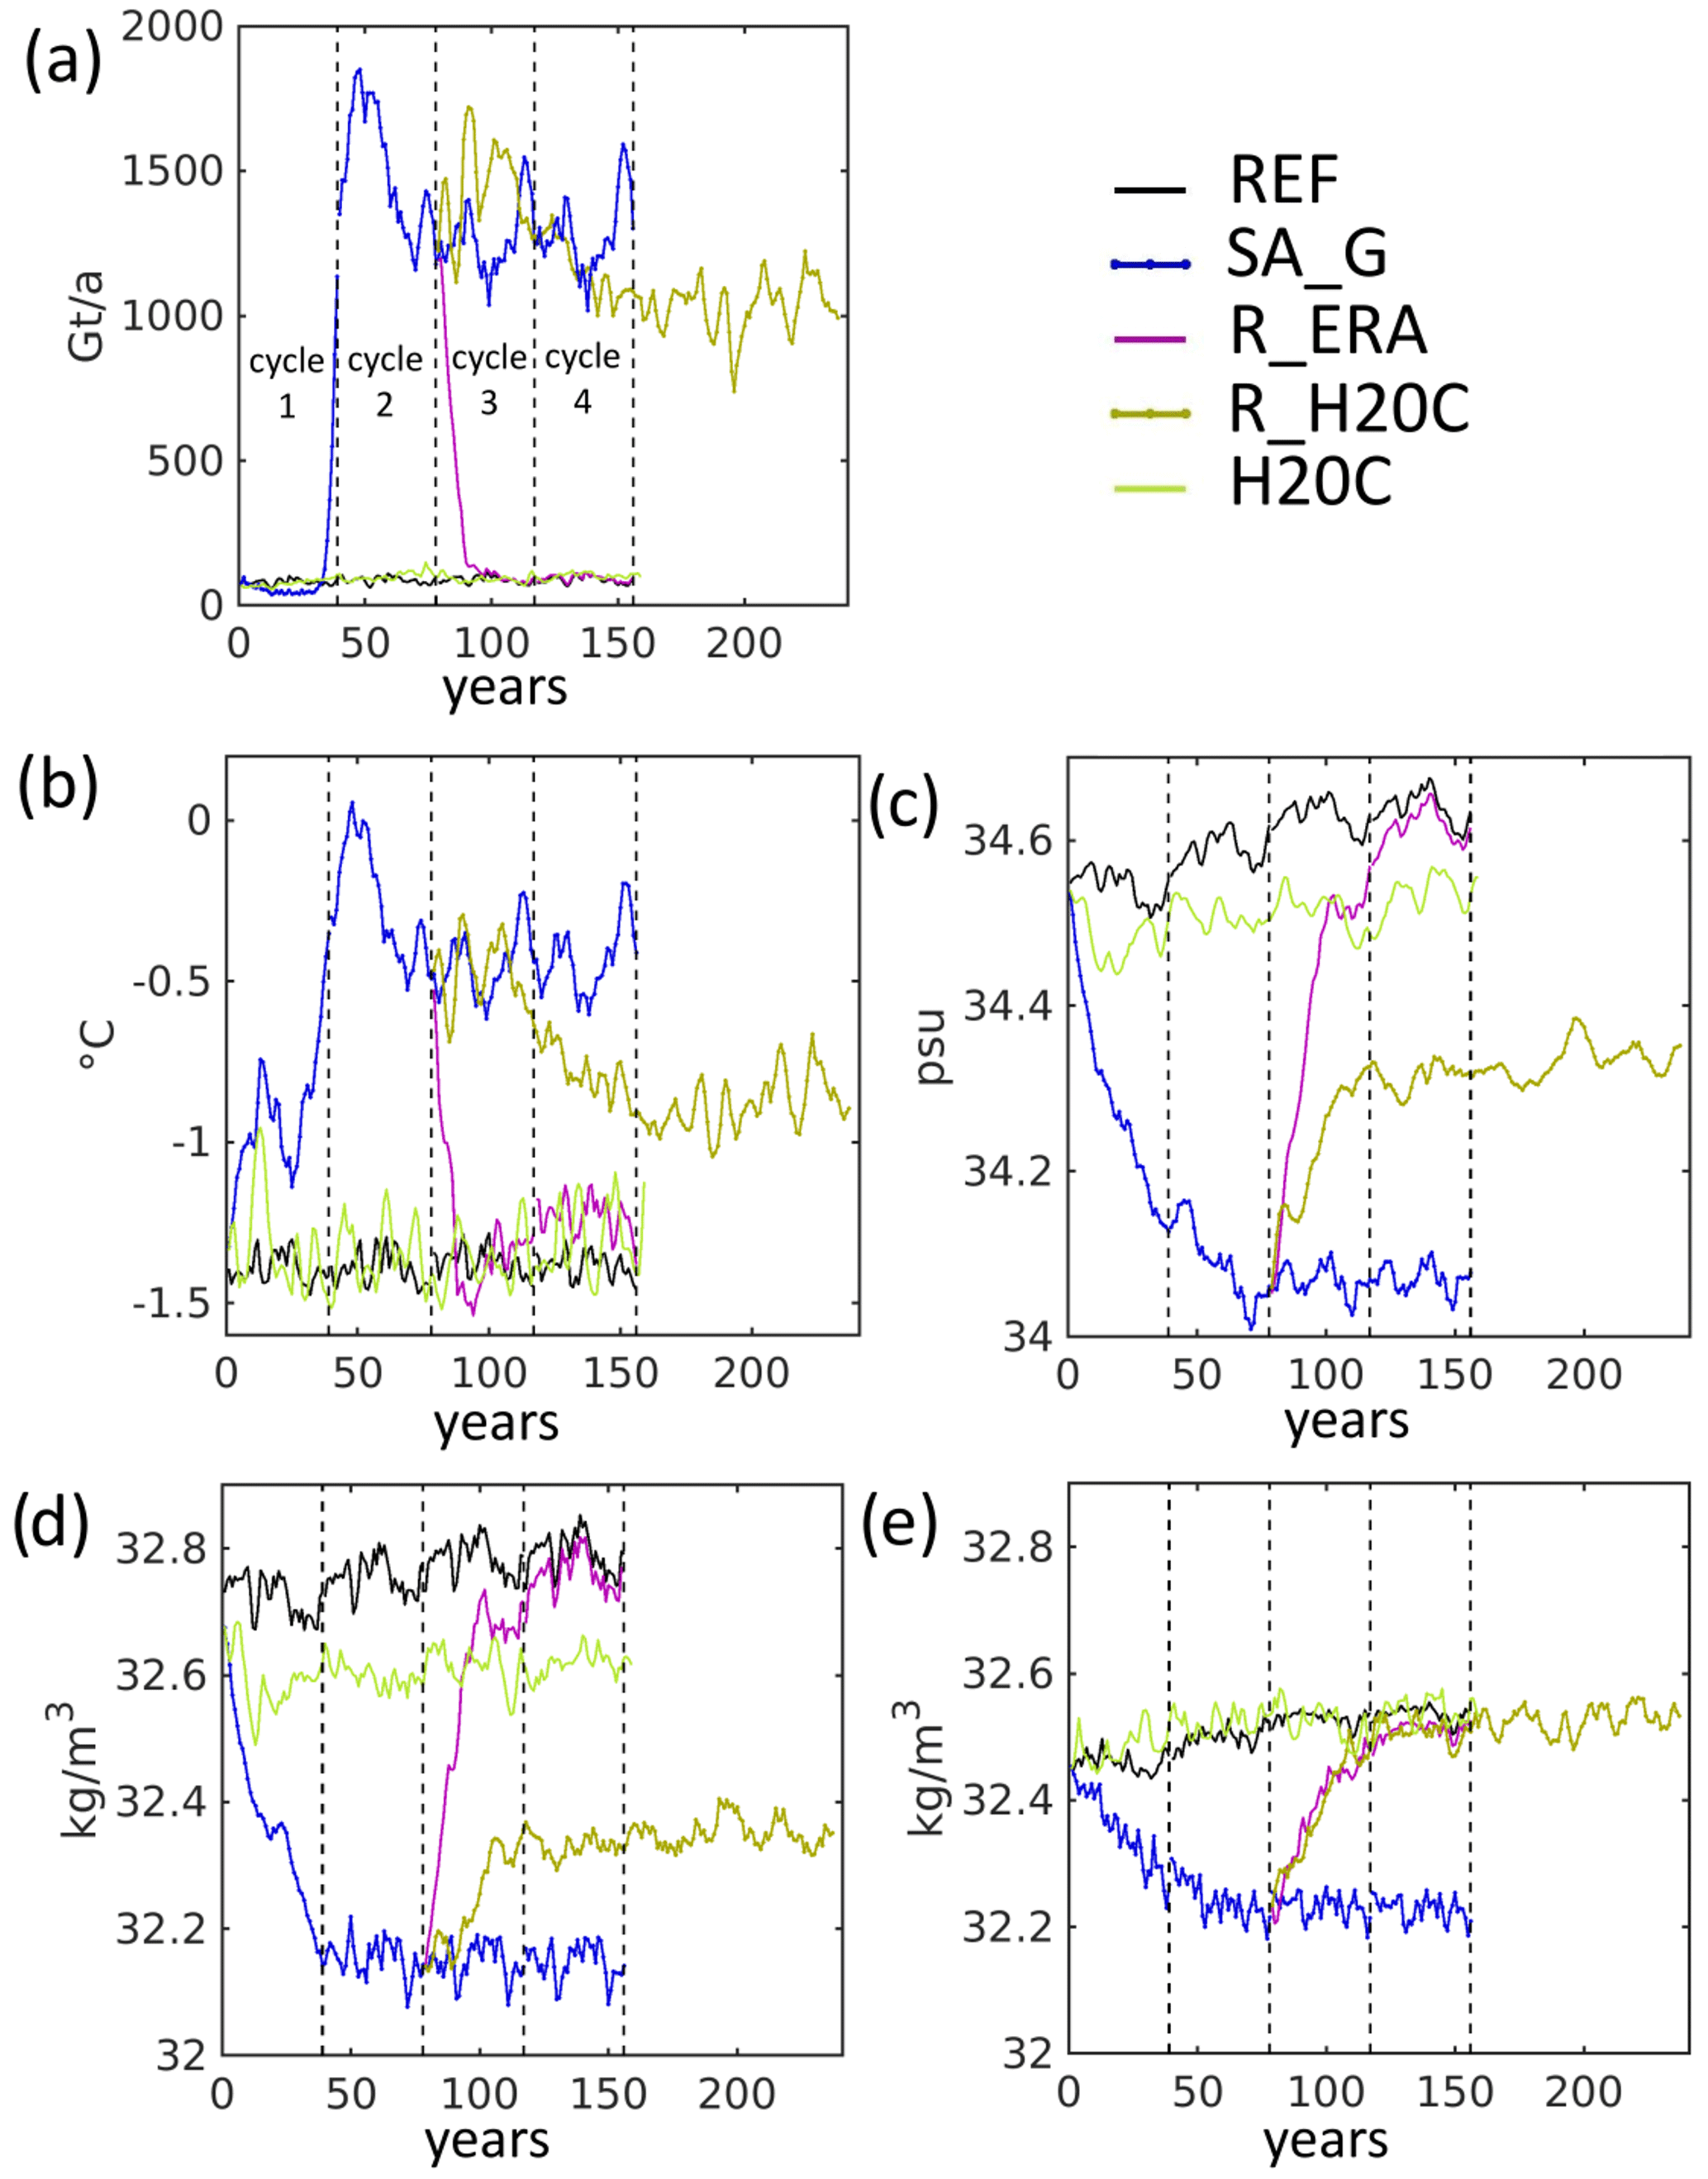
Figure 9Area-averaged annual mean values of (a) FRIS basal mass loss and (b) temperature, and (c) salinity on the Weddell Sea continental shelf, both below a depth of 200 m and south of 74∘ S (see also Fig. 4a) excluding ice shelf cavities. (d) Maximum density at the Ronne Ice Shelf front and (e) bottom density near the Filchner Trough sill (location L1) for the experiments listed in the upper right corner.
3.3 Reversibility and evidence of hysteresis behaviour
In order to fulfil the strict definition of a tipping point, the return from a tipped, warm ocean to the initial, cold state should not be as easy as just reversing forcing conditions back over the tipping threshold. Instead, an additional effort to push the system beyond a reversal threshold should be required. For a tipping point, we expect hysteresis behaviour when switching from one state to the other compared to the reverse (see also Fig. 1).
As a quick test for evidence of the regime shift on the continental shelf actually being a tipping point, we branched off two reversal experiments, R_ERA and R_H20C after cycle 2 of SA_G (see Fig. 5). These experiments thus start with a warm Weddell Sea continental shelf and show its evolution under current and/or previous-century atmospheric conditions.
The results show that an instantaneous return to unaltered ERA Interim forcing (R_ERA) causes a rapid decrease in FRIS basal melt rates (purple line in Fig. 9a), which is linked to a rapid cooling (Fig. 9b) and salinity increase (Fig. 9c) on the continental shelf. As soon as the shelf waters off Ronne Ice Shelf (Fig. 9e) are denser than the waters offshore at sill depth (Fig. 9d), they inevitably intrude into the cavity due to the southward sloping bathymetry. Depending on the volume of dense water produced by sea ice formation, this will diminish or prevent the flow of warm water into the cavity.
Within 2 decades, a thermal state similar to the REF cold state is re-established on the southern Weddell Sea continental shelf (Fig. 9a, b). Basal melt rates and shelf temperatures return to pre-tipping levels even though shelf salinity is still slightly fresher and it takes a few decades to return to its cold-state values (Fig. 9c). Again, the decisive factor is the density balance between the waters influenced by sea ice production on the continental shelf and the off-shelf waters of the Weddell Gyre. The fast increase in on-shelf water density (Fig. 9d) stops the inflow of WDW/MWDW into the cavity, which is replaced in time by cold HSSW.
Using the 20th-century HadCM3 data to force the model starting from a warm state (R_H20C) leads to a gradual reduction in the melt rates (Fig. 9a). The inflow of warm water does not stop, since the density of the shelf water remains below the off-shelf water density. The existing density difference even facilitates a stronger inflow during the next 3 decades. In the long term, however, basal melt rates decrease because of a cooling of WDW/MWDW by 2 K from 1.1 ∘C in SA_G (averaged over years 69–78) to −1.0 ∘C in R_H20C (years 108–117) at location L1 (Fig. 2).
Starting from a cold state and using the same unaltered forcing (20th-century HadCM3 data, experiment H20C), the model stays in a cold state (Fig. 9). The forcing yields a higher long-term mean for the on-shelf temperatures and generally lower salinities than REF. Although the density difference is reduced compared to REF and it features a higher interannual variability, the continental shelf remains stably in a cold state.
We identified a density balance as the decisive and defining factor for a regime shift on the southern Weddell Sea continental shelf. The evolution of the on-shelf salinity, of the ASF depth, or of the ACC or Weddell Gyre transports proved insufficient for a successful differentiation between a stable experiment (SUMMER_S) and a group of experiments undergoing a regime shift (SA_G, SA_S, SA_W, and SUMMER_S+SAw_W). Only the density difference between WDW and dense shelf water reliably allows for such differentiation.
In order to cross the continental shelf and penetrate into the ice shelf cavities, the water at the continental shelf break at sill depth has to literally outweigh the water produced by sea ice formation on the continental shelf (with some inaccuracies due to mixing processes). In a situation with moderate density gradients, this may lead to a protracted period of temporary and especially seasonal onshore flow of WDW, but any process causing the circumpolar waters to freshen less than the shelf waters will eventually tip the density balance in favour of the waters of open-ocean origin. In consequence, the warmer off-shelf waters will replace the cold shelf waters in the cavity and enhance basal melting. We suppose that this continental shelf/shelf break process not only exists in the Weddell Sea but in all other Antarctic marginal seas unless strong local influences (e.g. winds, bottom topography) create an additional barrier at the continental shelf break or on the continental shelf.
In our experiments, the Ross Sea remains stable (see also Figs. S3–S5), while in the Prydz Bay, Circumpolar Deep Water (CDW) gains access to the Amery Ice Shelf cavity even faster than for the regime shift in the Weddell Sea in SA_G, SA_S, SUMMER_S, and SUMMER_S+SAw_W (Figs. S3 and S4). The density time series (Fig. S6) confirm our findings obtained for the Weddell Sea. Our model geometry for the Prydz Bay is subject to large uncertainties, which is why the region serves only as a proof of concept for the density balance and is not presented in the main article.
It is no surprise that water density is crucial for a regime shift that allows WDW to penetrate into the waters above the continental shelf and into fringing ice shelf cavities. Daae et al. (2020) found that a shoaling of the thermocline is important in triggering a warm inflow. In their regional model study, this was achieved by an artificial manipulation of the boundary conditions that also entailed a lifting of the halocline and thus an increase in off-shelf water density at sill depth. However, an increase in salinity at these depths is not a trend we observe around Antarctica (Schmidtko et al., 2014) or expect for the future. Instead, increased ice melt – including sea ice, ice shelves, and icebergs – all around Antarctica causes a freshening of the Southern Ocean, especially in the coastal and slope currents (Strass et al., 2020). In accordance with these expectations for the future, we see freshening on-shelf and off-shelf in all our experiments that apply at least a circumpolar perturbation. The waters generally become warmer and fresher and therefore lighter. Only if the on-shelf density falls below the density of the off-shelf waters at sill depth, the latter will enter the continental shelf and fill up the deep parts of the ice shelf cavities. Our findings are also in accordance with the conceptual model proposed by Hazel and Stewart (2020), where the water mass density determines whether HSSW or WDW floods the ice shelf cavity, but our study includes the evolution of the WDW density.
The Weddell Sea continental shelf has a unique bathymetry which contributes to the vulnerability of its fringing ice shelves. The Filchner Trough with a sill depth of approximately 600 m allows deeper and denser off-shelf waters an easy access path. However, on-shelf salinity is a crucial factor when comparing the vulnerabilities of the Weddell and Ross seas. During the spin-up cycle, our model experiences a slight freshening on the Weddell Sea continental shelf and a salinity increase on the Ross Sea continental shelf. While the latter does indeed feature more saline water than the former, this difference is likely exaggerated in our model, as evidenced by the bias in reference to the WOA data used for initialization (see also Fig. S4a). Since the salinity dominates density on the continental shelves around Antarctica, this creates a much higher density threshold for the Ross Sea and keeps its continental shelf cold in all our experiments. A study by Comeau et al. (2022), where a fresh bias on the Weddell Sea shelf led to an unwanted regime shift, supplies further evidence for the adverse effects of salinity biases in models in this context.
With our model set-up, even for FRIS, it turns out to be difficult to yield a regime change in the cavity by simple or idealized perturbations of atmospheric forcing. As mentioned in Sect. 2.3, we conducted more than 70 experiments with different alterations of the atmospheric forcing. Of these, only a minority resulted in a change in the Weddell Sea to a warm-shelf state. This lack of an “easy recipe” within reasonable bounds reminds us that climate is a complex system with omnipresent non-linearities.
In our “successful” experiments, however, the response was quicker than what Naughten et al. (2021) obtained for an abrupt change in atmospheric forcing, and with smaller changes, particularly in air temperature. However, it should be noted here that the shortwave radiation in our SUMMER_S+SAw_W was certainly enhanced and prolonged beyond realistic measures (as was done in SUMMER_S, which maintained a stably cold continental shelf). The atmospheric forcing used in all our experiments experiencing a regime shift has some relationship to the HadCM3 21C-A1B output and involves changes in all or all but one forcing variables. All manipulations of a single or up to three atmospheric variables failed in inducing sustained warm water flow onto the continental shelf. Although air temperature and wind components were found to be important in the process, a manipulation of only these three variables in the same way as in SA_G was not sufficient to trigger the inflow.
After the regime shift to a warm state on the continental shelf, Hellmer et al. (2017) claim that the increased amount of meltwater leads to a positive feedback on the cavity overturning circulation supporting a sustained inflow and an enhancement of basal melt rates. Therefore, resistance of the system against a reversal is expected. However, the hysteresis behaviour, which is required for the strict definition of a tipping point, is not easy to demonstrate for a regime shift in an Antarctic ice shelf cavity. While Hazel and Stewart (2020) succeeded in mapping out a clear hysteresis curve for FRIS depending on meridional wind modifications (using a regional set-up and thus neglecting far-field influences on the Weddell Gyre), Caillet et al. (2022) could not find evidence of hysteresis in their investigation of a possible past regime shift on the Amundsen Sea continental shelf. Although the evolution of the water mass characteristics on the continental shelf in our experiments provides no direct evidence of the effect of a meltwater feedback (Fig. 5), our experiments clearly show evidence of hysteresis behaviour: depending on the starting state of the continental shelf, two different shelf states are reached for the same forcing data set (HadCM3 20C). In contrast, using ERA Interim data drives the system back from warm to cold very quickly, indicating that the meltwater feedback alone is not sufficient to maintain the warm regime as a new stable state. Based on our findings, we would locate the HadCM3 data for the 20th century, used in runs H20C and R_H20C, in the zone of bi-stability in the simplified scheme of Fig. 1, while placing the ERA Interim forcing to the left of the reversal threshold (both initial states yield the same, cold final state). The forcing used for SA_G is located to the right of the tipping threshold (see also Fig. S7).
Our findings also underline that the range of bi-stability may not be very large and that with our still-limited understanding of the complex system, it can be difficult to find an atmospheric forcing data set that actually falls into this range. It may well be that current and/or previous-century atmospheric conditions fall on the left side of the reversal threshold. Some caution is also advised: the climate system and its regional subsystems follow a complex interplay of a multitude of variables, which makes the 2D schematic a strong simplification of a multi-dimensional problem.
Model studies with FESOM coupled to an ice sheet/ice shelf model (Timmermann and Goeller, 2017) show that enhanced basal melting of FRIS leads to an accelerated ice flow across the grounding line and thus contributes to global sea level rise. The model also demonstrates that the feedback of changing ice shelf geometry on cavity circulation does not cause qualitative differences in the relevant processes of ocean–ice shelf interaction. Compared to uncoupled simulations with constant present-day cavity geometry, the coupled simulations yield a slightly stronger increase in basal melt rates in case of the ocean tipping into a warm state, but again results are not qualitatively different. We can therefore be confident that our results faithfully reflect the essential feedbacks between the different components of our model climate system.
By design, our study can only address regime shifts in the ocean (in the open ocean just as much as in sub-ice cavities); it cannot assess tipping points or instabilities in the ice sheet (e.g. accelerated ice mass flux through the speed-up of ice streams) or coupled oceanic–cryospheric tipping points, like a marine ice sheet instability with irreversible grounding line retreat.
In our modelling study on the change in the ocean state on the Weddell Sea continental shelf, we identify the density balance between the off-shelf water at sill depth and the water produced by sea ice formation on the continental shelf as the decisive factor determining whether the flow of off-shelf water into the deepest part of the continental shelf and the ice shelf cavities below sill depth is possible. Our experiments confirm the possibility of such a regime shift within the next 100 years for the FRIS cavity but not for the Ross Ice Shelf cavity. While the sill depth of the continental shelf certainly is one of the influential differences between the two regions, the higher on-shelf salinity in the Ross Sea in our simulations is more relevant in the context of a cold-to-warm regime shift. In model studies, salinity biases on the Antarctic continental shelf – positive or negative – strongly influence the simulated vulnerability of the shelf to warm water intrusions. In our model, this leads to a larger density difference between the on-shelf waters and the warm CDW and keeps the Ross Sea density balance stable in all our experiments.
We find that the ice shelf cavities may be better protected from the intrusion of warm WDW/CDW than previously expected (e.g. Hellmer et al., 2012). In a realistic future scenario not only will the dense shelf waters linked to sea ice formation undergo changes but also the ACC and CDW/WDW characteristics, and the entire Southern Ocean will be affected by these changes. Both HSSW and WDW are expected to lose density but at different rates since HSSW is primarily influenced by local atmospheric events while the WDW/CDW characteristics depend more on the far field. It is noteworthy, however, that there is not one universal recipe for a regime shift in the Antarctic marginal seas but that such a shift can occur under diverse circumstances and depends on local influences, ranging from bottom topography to atmospheric conditions.
Our results support the assumption that a cold-to-warm regime shift on the Weddell Sea continental shelf is a tipping point with hysteresis behaviour. The zone of bi-stability between the thresholds of tipping and reversal, however, may not be very wide. Present-day atmospheric conditions are potentially on the “cold” side of the bi-stability zone of the hysteresis.
The data contained in the figures as well as the ocean state in the Weddell region for all featured experiments are publicly available under https://doi.org/10.5281/zenodo.8086825 (Part I) (Haid et al., 2023a) and https://doi.org/10.5281/zenodo.8086878 (Part II) (Haid et al., 2023b).
The supplement related to this article is available online at: https://doi.org/10.5194/os-19-1529-2023-supplement.
VH conducted the numeric experiments, analysed and visualized the results, and led the writing process; OG provided the model geometry and read and commented on the article; HHH conceived the idea for the study; RT and HHH contributed to the interpretation of results and to writing the article.
The contact author has declared that none of the authors has any competing interests.
Publisher’s note: Copernicus Publications remains neutral with regard to jurisdictional claims made in the text, published maps, institutional affiliations, or any other geographical representation in this paper. While Copernicus Publications makes every effort to include appropriate place names, the final responsibility lies with the authors.
The work relied heavily on computational resources provided by the North German Supercomputing Alliance (HLRN). We acknowledge the TiPACCs project and thank all its participants. We thank our reviewers and our editor for their work and their helpful comments on the article.
This work is part of the TiPACCs project, which receives funding from the European Union's Horizon 2020 research and innovation programme under grant agreement no. 820575. RT is supported by the Helmholtz Climate Initiative REKLIM (Regional Climate Change), a joint research project of the Helmholtz Association of German research centres (HGF).
The article processing charges for this open-access publication were covered by the Alfred Wegener Institute, Helmholtz Centre for Polar and Marine Research (AWI).
This paper was edited by Karen J. Heywood and reviewed by two anonymous referees.
Bolton, D.: The Computation of Equivalent Potential Temperature, Mon. Weather Rev., 108, 1046–1053, https://doi.org/10.1175/1520-0493(1980)108<1046:TCOEPT>2.0.CO;2, 1980. a
Bull, C. Y. S., Jenkins, A., Jourdain, N. C., Vankova, I., Holland, P. R., Mathiot, P., Hausmann, U., and Sallee, J.-B.: Remote control of Filchner-Ronne Ice Shelf melt rates by the Antarctic Slope Current, J. Geophys. Res., 126, e2020JC016550, https://doi.org/10.1029/2020JC016550, 2021. a
Caillet, J., Jourdain, N. C., Mathiot, P., Hellmer, H. H., and Mouginot, J.: Drivers and reversibility of abrupt ocean state transitions in the Amundsen Sea, Antarctica, Earth and Space Science Open Archive, p. 23, https://doi.org/10.1002/essoar.10511518.1, 2022. a
Collins, M., Booth, B. B. B., Bhaskaran, B., Harris, G. R., Murphy, J. M., Sexton, D. M. H., and Webb, M. J.: Climate model errors, feedbacks and forcings: a comparison of perturbed physics and multi-model ensembles, Clim. Dynam., 36, 1737–1766, https://doi.org/10.1007/s00382-010-0808-0, 2011. a
Comeau, D., Asay-Davis, X. S., Begeman, C. B., Hoffman, M. J., Lin, W., Petersen, M. R., Price, S. F., Roberts, A. F., Van Roekel, L. P., Veneziani, M., Wolfe, J. D., Fyke, J. G., Ringler, T. D., and Turner, A. K.: The DOE E3SM v1.2 Cryosphere Configuration: Description and Simulated Antarctic Ice-Shelf Basal Melting, J. Adv. Model. Earth Sy., 14, e2021MS002468, https://doi.org/10.1029/2021MS002468, 2022. a
Cornford, S. L., Martin, D. F., Payne, A. J., Ng, E. G., Le Brocq, A. M., Gladstone, R. M., Edwards, T. L., Shannon, S. R., Agosta, C., van den Broeke, M. R., Hellmer, H. H., Krinner, G., Ligtenberg, S. R. M., Timmermann, R., and Vaughan, D. G.: Century-scale simulations of the response of the West Antarctic Ice Sheet to a warming climate, The Cryosphere, 9, 1579–1600, https://doi.org/10.5194/tc-9-1579-2015, 2015. a
Daae, K., Hattermann, T., Darelius, E., Mueller, R. D., Naughten, K. A., Timmermann, R., and Hellmer, H. H.: Necessary conditions for warm inflow toward the Filchner Ice Shelf, Weddell Sea, Geophys. Res. Letters, 47, e2020GL089237, https://doi.org/10.1029/2020GL089237, 2020. a, b
Danilov, S., Wang, Q., Timmermann, R., Iakovlev, N., Sidorenko, D., Kimmritz, M., Jung, T., and Schröter, J.: Finite-Element Sea Ice Model (FESIM), version 2, Geosci. Model Dev., 8, 1747–1761, https://doi.org/10.5194/gmd-8-1747-2015, 2015. a
Darelius, E., Fer, I., and Nicholls, K. W.: Observed vulnerability of Filchner-Ronne Ice Shelf to wind-driven inflow of warm deep water, Nat. Commun., 7, 12300, https://doi.org/10.1038/ncomms12300, 2016. a
Dee, D. P., Uppala, S. M., Simmons, A. J., Berrisford, P., Poli, P., Kobayashi, S., Andrae, U., Balmaseda, M. A., Balsamo, G., Bauer, P., Bechtold, P., Beljaars, A. C. M., van de Berg, L., Bidlot, J., Bormann, N., Delsol, C., Dragani, R., Fuentes, M., Geer, A. J., Haimberger, L., Healy, S. B., Hersbach., H, H. E. V., Isaksen, L., Kållberg, P., Köhler, M., Matricardi, M., McNally, A. P., Monge-Sanz, B. M., Morcrette, J.-J., Park, B.-K., Peubey, C., de Rosnay, P., Tavolato, C., Thépaut, J.-J., and Vitar, t. F.: The ERA-interim reanalysis: Configuration and performance of the data assimilation system, Q. J. Roy. Meteor. Soc., 137, 553–597, https://doi.org/10.1002/qj.828, 2011. a, b
Gladstone, R. M., Lee, V., Rougier, J., Payne, A. J., Hellmer, H. H., Le Brocq, A., Shepherd, A., Edwards, T. L., Gregory, J., and Cornford, S. L.: Calibrated prediction of Pine Island Glacier retreat during the 21st and 22nd centuries with a coupled flowline model, Earth Planet. Sc. Lett., 333–334, 191–199, https://doi.org/10.1016/j.epsl.2012.04.022, 2012. a
Haid, V. and Timmermann, R.: Simulated heat flux and sea ice production at coastal polynyas in the southwestern Weddell Sea, J. Geophys. Res., 118, 2640–2652, https://doi.org/10.1002/jgrc.20133, 2013. a
Haid, V., Timmermann, R., Ebner, L., and Heinemann, G.: Atmospheric forcing of coastal polynyas in the south-western Weddell Sea, Antarct. Sci., 27, 388–402, https://doi.org/10.1017/S0954102014000893, 2015. a
Haid, V., Timmermann, R., Gürses, Ö., and Hellmer, H. H.: Data for Haid et al.: On the drivers of regime shifts in Antarctic marginal seas, Part I, Zenodo [data set], https://doi.org/10.5281/zenodo.8086825, 2023a. a
Haid, V., Timmermann, R., Gürses, Ö., and Hellmer, H. H.: Data for Haid et al.: On the drivers of regime shifts in Antarctic marginal seas, Part II, Zenodo [data set], https://doi.org/10.5281/zenodo.8086878, 2023b. a
Hattermann, T., Nicholls, K. W., Hellmer, H. H., Davis, P. E. D., Janout, M. A., Østerhus, S., Schlosser, E., Rohardt, G., and Kanzow, T.: Observed interannual changes beneath Filchner-Ronne Ice Shelf linked to large-scale atmospheric circulation, Nat. Commun., 12, 2961, https://doi.org/10.1038/s41467-021-23131-x, 2021. a
Hazel, J. E. and Stewart, A. L.: Bistability of the Filchner-Ronne Ice Shelf cavity circulation and basal melt, J. Geophys. Res., 124, e2019JC015848, https://doi.org/10.1029/2019JC015848, 2020. a, b, c, d
Hellmer, H. H. and Olbers, D. J.: A two-dimensional model for the thermohaline circulation under an ice shelf, Antarct. Sci., 1, 325–336, 1989. a
Hellmer, H. H., Kauker, F., and Timmermann, R.: Weddell Sea anomalies: Excitation, propagation, and possible consequencs, Geophys. Res. Lett., 36, L12605, https://doi.org/10.1029/2009GL038407, 2009. a
Hellmer, H. H., Kauker, F., Timmermann, R., Determann, J., and Rae, J.: Twenty-first-century warming of a large Antarctic ice-shelf cavity by a redirected coastal current, Nature, 485, 225–228, https://doi.org/10.1038/nature11064, 2012. a, b, c, d, e
Hellmer, H. H., Kauker, F., Timmermann, R., and Hattermann, T.: The fate of the southern Weddell Sea continental shelf in a warming climate, J. Climate, 30, 4337–4350, https://doi.org/10.1175/JCLI-D-16-0420.1, 2017. a, b, c, d, e
Holland, D. M. and Jenkins, A.: Modeling thermodynamic ice-ocean interactions at the base of an ice shelf, J. Phys. Oceanogr., 29, 1787–1800, 1999. a
IPCC: Special Report on Emissions Scenarios: A special report of Working Group III of the Intergovernmental Panel on Climate Change (summary for policymakers), edited by: Nakićenović, N. and Swart R., Cambridge University Press, https://www.ipcc.ch/site/assets/uploads/2018/03/sres-en.pdf (last access: 12 September 2023), 2000. a
Jacobs, S. S., Hellmer, H. H., Doake, C. S. M., Jenkins, A., and Frolich, R. M.: Melting of ice shelves and the mass balance of Antarctica, J. Glaciol., 38, 375–387, 1992. a, b
Jenkins, A., Dutrieux, P., Jacobs, S., McPhail, S., Perrett, J., Webb, A., and White, D.: Observations beneath Pine Island Glacier in West Antarctica and implications for its retreat, Nat. Geosci., 3, 468–472, https://doi.org/10.1038/ngeo890, 2010. a
Johns, T. C., Royer, J.-F., Höschel, I., Huebener, H., Roeckner, E., Manzini, E., May, W., Dufresne, J.-L., Otterå, O. H., Vuuren, D. P., Salas y Melia, D., Giorgetta, M. A., Denvil, S., Yang, S., Fogli, P. G., Körper, J., Tjiputra, J. F., Stehfest, E., and Hewitt, C. D.: Climate change under aggressive mitigation: The ENSEMBLES multi-model experiment, Clim. Dynam., 37, 1975–2003, https://doi.org/10.1007/s00382-011-1005-5, 2011. a
Joughin, I. and Padman, L.: Melting and freezing beneath Filchner-Ronne Ice Shelf, Antarctica, Geophys. Res. Lett., 30, 1477, https://doi.org/10.1029/2003GL016941, 2003. a, b
Jourdain, N. C., Mathiot, P., Merino, N., Durand, G., Le Sommer, J., Spence, P., Dutrieux, P., and Madec, G.: Ocean circulation and sea-ice thinning induced by melting ice shelves in the Amundsen Sea, J. Geophys. Res., 122, 2550–2573, https://doi.org/10.1029/2003GL016941, 2017. a
Klose, A. K., Karle, V., Winkelmann, R., and Donges, J. F.: Emergence of cascading dynamics in interacting tipping elements of ecology and climate, R. Soc. Open Sci., 7, 200599, https://doi.org/10.1098/rsos.200599, 2020. a
Lenton, T. M., Held, H., E., K., Hall, J. W., Lucht, W., Rahmstorf, S., and Schellnhuber, H. J.: Tipping elements in the Earth’s climate system, P. Natl. Acad. Sci. USA, 105, 1786–1793, https://doi.org/10.1073/pnas.0705414105, 2008. a
Locarnini, R. A., Mishonov, A. V., Antonov, J. I., Boyer, T. P., Garcia, H. E., Baranova, O. K., Zweng, M. M., Paver, C. R., Reagan, J. R., Johnson, D. R., Hamilton, M., and Seidov, D.: World Ocean Atlas 2013, Volume 1: Temperature, in: NOAA Atlas NESDIS 73, edited by: Levitus, S. and Mishonov, A., National Oceanographic Data Center (US), Ocean Climate Laboratory, United States, National Environmental Satellite, Data, and Information Service, 40 pp., https://doi.org/10.7289/V55X26VD, 2013. a
Nakayama, Y., Schröder, M., and Hellmer, H. H.: From circumpolar deep water to the glacial meltwater plume on the eastern Amundsen Shelf, Deep-Sea Res., 77, 50–62, https://doi.org/10.1016/j.dsr.2013.04.001, 2013. a
Naughten, K. A., Jenkins, A., Holland, P. R., Mugford, R. I., Nicholls, K. W., and Munday, D. R.: Modeling the Influence of the Weddell Polynya on the Filchner–Ronne Ice Shelf Cavity, J. Climate, 32, 5289–5303, https://doi.org/10.1175/JCLI-D-19-0203.1, 2019. a
Naughten, K. A., De Rydt, J., Rosier, S. H. R., Jenkins, A., Holland, P. R., and Ridley, J. K.: Two-timescale response of a large Antarctic ice shelf to climate change, Nat. Commun., 12, 1991, https://doi.org/10.1038/s41467-021-22259-0, 2021. a, b
Rignot, E., Jacobs, S. S., Mouginot, J., and Scheuchl, B.: Ice shelf melting around Antarctica, Science, 341, 266–270, https://doi.org/10.1126/science.1235798, 2013. a, b
Ryan, S., Hellmer, H. H., Janout, M., Darelius, E., Vignes, L., and Schröder, M.: Exceptionally warm and prolonged flow of Warm Deep Water toward the Filchner‐Ronne Ice Shelf in 2017, Geophys. Res. Lett., 47, e2020GL088119, https://doi.org/10.1029/2020GL088119, 2020. a
Schaffer, J., Timmermann, R., Arndt, J. E., Kristensen, S. S., Mayer, C., Morlighem, M., and Steinhage, D.: A global, high-resolution data set of ice sheet topography, cavity geometry, and ocean bathymetry, Earth Syst. Sci. Data, 8, 543–557, https://doi.org/10.5194/essd-8-543-2016, 2016. a
Schmidtko, S., Heywood, K. J., Thompson, A. F., and Aoki, S.: Multidecadal warming of Antarctic waters, Science, 346, 1227–1231, https://doi.org/10.1126/science.1256117, 2014. a
Spence, P., Griffies, S. M., England, M. H., Hogg, A. M. C., Saenko, O. A., and Jourdain, N. C.: Rapid subsurface warming and circulation changes of Antarctic coastal waters by poleward shifting winds, Geophys. Res. Lett., 41, 4601–4610, https://doi.org/10.1002/2014GL060613, 2014. a
Strass, V. H., Rohardt, G., Kanzow, T., Hoppema, M., and Boebel, O.: Multidecadal Warming and Density Loss in the Deep Weddell Sea, Antarctica, J. Climate, 33, 9863–9881, https://doi.org/10.1175/JCLI-D-20-0271.1, 2020. a
Stull, R.: Practical Meteorology: An Algebra-based Survey of Atmospheric Science – version 1.02b, Univ. of British Columbia, ISBN 978-0-88865-283-6, 2017. a, b
Thoma, M., Jenkins, A., Holland, D., and Jacobs, S. S.: Modelling Circumpolar Deep Water intrusions on the Amundsen Sea continental shelf, Antarctica, Geophys. Res. Letters, 35, L18602, https://doi.org/10.1029/2008GL034939, 2008. a
Timmermann, R. and Goeller, S.: Response to Filchner–Ronne Ice Shelf cavity warming in a coupled ocean–ice sheet model – Part 1: The ocean perspective, Ocean Sci., 13, 765–776, https://doi.org/10.5194/os-13-765-2017, 2017. a, b
Timmermann, R. and Hellmer, H. H.: Southern Ocean warming and increased ice shelf basal melting in the twenty-first and twenty-second centuries based on coupled ice-ocean finite-element modelling, Ocean Dynam., 63, 1011–1026, https://doi.org/10.1007/s10236-013-0642-0, 2013. a, b, c, d, e, f
Timmermann, R., Wang, Q., and Hellmer, H. H.: Ice shelf basal melting in a global finite-element sea ice/ice shelf/ocean model, Ann. Glaciol., 53, 303–314, https://doi.org/10.3189/2012AoG60A156, 2012. a
Štulić, L., Timmermann, R., Paul, S., Zentek, R., Heinemann, G., and Kanzow, T.: Southern Weddell Sea surface freshwater flux modulated by icescape and atmospheric forcing, EGUsphere [preprint], https://doi.org/10.5194/egusphere-2023-690, 2023. a
Wang, Q., Danilov, S., Sidorenko, D., Timmermann, R., Wekerle, C., Wang, X., Jung, T., and Schröter, J.: The Finite Element Sea Ice-Ocean Model (FESOM) v.1.4: formulation of an ocean general circulation model, Geosci. Model Dev., 7, 663–693, https://doi.org/10.5194/gmd-7-663-2014, 2014. a
Zweng, M. M., Reagan, J. R., Antonov, J. I., Locarnini, R. A., Mishonov, A. V., Boyer, T. P., Garcia, H. E., Baranova, O. K., Johnson, D. R., Seidov, D., and Biddle, M. M.: World Ocean Atlas 2013, Volume 2: Salinity, in: NOAA Atlas NESDIS 74, edited by: Levitus, S. and Mishonov, A., National Oceanographic Data Center (US), Ocean Climate Laboratory, United States, National Environmental Satellite, Data, and Information Service, 39 pp., https://doi.org/10.7289/V5251G4D, 2013. a