the Creative Commons Attribution 4.0 License.
the Creative Commons Attribution 4.0 License.
 | 06 Sep 2023
Coastal and regional marine heatwaves and cold spells in the northeastern Atlantic
Coline Poppeschi
Sandra Plecha
Guillaume Charria
Ana Russo
The latest Intergovernmental Panel on Climate Change (IPCC) report describes an increase in the number and intensity of marine heatwaves (MHWs) and a decrease in marine cold spells (MCSs) in the global ocean. However, these reported changes are not uniform on a regional to local basis, and it remains unknown if coastal areas follow the open-ocean trends. Surface ocean temperature measurements collected by satellites (from 1982–2022) and 13 coastal buoys (from 1990–2022) are analyzed in the northeastern Atlantic and three subregions: the English Channel, Bay of Brest and Bay of Biscay. The activity metric, combining the number of events, intensity, duration and spatial extent, is used to evaluate the magnitude of these extreme events. The results from in situ and satellite datasets for each of the studied regions are quite in agreement, although the satellite dataset underestimates the amplitude of activity for both MHWs and MCSs. This supports the applicability of the method to both in situ and satellite data, albeit with caution on the amplitude of these events. Also, this localized study in European coastal northeastern Atlantic water highlights that similar changes are being seen in coastal and open oceans regarding extreme events of temperature, with MHWs being more frequent and longer and extending over larger areas, while the opposite is seen for MCSs. These trends can be explained by changes in both the mean of and variance in sea-surface temperature. In addition, the pace of evolution and dynamics of marine extreme events differ among the subregions. Among the three studied subregions, the English Channel is the region experiencing the strongest increase in summer MHW activity over the last 4 decades. Summer MHWs were very active in the English Channel in 2022 due to long events, in the Bay of Biscay in 2018 due to intense events and in the Bay of Brest in 2017 due to a high occurrence of events. Winter MCSs were the largest in 1987 and 1986 due to long and intense events in the English Channel. Finally, our findings suggest that at an interannual timescale, the positive North Atlantic Oscillation favors the generation of strong summer MHWs in the northeastern Atlantic, while low-pressure conditions over northern Europe and a high off the Iberian Peninsula in winter dominate for MCSs. A preliminary analysis of air–sea heat fluxes suggests that, in this region, reduced cloud coverage is a key parameter for the generation of summer MHWs, while strong winds and increased cloud coverage are important for the generation of winter MCSs.
- Article
(7084 KB) - Full-text XML
-
Supplement
(4543 KB) - BibTeX
- EndNote


Heatwaves and cold spells are extreme events in which there is a strong anomaly in temperature for a certain period which can occur at a regional spatial scale. This type of phenomenon can occur both in the atmosphere and in the ocean, with remarkable consequences for both terrestrial and marine ecosystems (Ruthrof et al., 2018). In the case of marine events (hereafter referred to as marine heatwaves, MHWs, or marine cold spells, MCSs), severe large-scale biodiversity losses may occur such as species extinction, habitat destruction, and abrupt changes in the geographical distribution and structure of communities as well as the nutrient cycle (Frölicher and Laufkötter, 2018; Ruthrof et al., 2018; Smale et al., 2019). Additionally, a decrease in the density of marine algae forests and coral bleaching (Wernberg et al., 2016; Smale et al., 2019) have also been reported.
The frequency, duration and intensity of these extreme phenomena affecting ocean systems have been increasing in recent decades (among others, Lima and Wethey, 2012; Oliver et al., 2018; Frölicher et al., 2018; Plecha and Soares, 2020; Simon et al., 2022). As a result of global and regional warming heavily influenced by anthropogenic factors, the intensity and annual number of MHWs will continue to accelerate globally (Oliver et al., 2019; Plecha et al., 2021). Conversely, as oceans warm, MCSs are diminishing (Schlegel et al., 2021; Simon et al., 2022) and are expected to continue to decline in the future (Yao et al., 2022). However, these changes are not uniform regionally, and it remains unknown if coastal areas follow the open-ocean trends.
This paper focuses on the coastal and regional northeastern Atlantic and three subregions (English Channel, Bay of Brest and Bay of Biscay) as these zones are important for socio-economic activities (e.g., fishery; Guo et al., 2022) and have contrasting dynamical environments. Plecha et al. (2021) studied MHW annual features in the whole northern Atlantic using low-resolution satellite data at 1∘ × 1∘ over the period 1971–2000. They show that in the Bay of Biscay, the mean frequency is about 12 events per year and is characterized by ∼ 12 d of mean duration and 0.4 ∘C of mean intensity. Marin et al. (2021) did a global analysis of MHWs in coastal areas over the period 1992–2016 based on a multi-satellite product at a resolution from 0.25∘ × 0.25∘ to 0.05∘ × 0.05∘. They found that, in the Bay of Biscay and English Channel from 1992–2016, MHWs occurred on average three times per year, lasting about 20 d with a mean intensity of 1.5 ∘C. Here we focus on these regions at the seasonal timescale, such as summer MHWs and winter MCSs, using a satellite product at 0.25∘ × 0.25∘.
Long-term ocean warming is an important driver of the increase in MHWs (Frölicher et al., 2018) and the diminishing of MCSs (Schlegel et al., 2021; Wang et al., 2022) but does not explain shorter variabilities in these events or their interannual variability. These marine extreme events are also driven by other local and remote processes acting across a large range of spatial and temporal scales (Holbrook et al., 2019; Schlegel et al., 2021). Modes of atmospheric circulation variability can induce anomalous sea-surface temperature (SST) through modification of air–sea heat fluxes and/or displacement due to ocean current advection (Deser et al., 2010), which, for extreme cases, can lead to MHWs or MCSs.
Interannual summer atmospheric variability in the northern Atlantic–European sector has been shown to be predominantly led by the Summer North Atlantic Oscillation (SNAO) pattern. The SNAO is identified as strong high-pressure anomalies dominating northern Europe and weaker low pressure over Greenland and the Iberian Peninsula, which explains about 20 % of the variance using sea-level pressure (Hurrell et al., 2003). The SNAO is recognized as at a more northerly location and smaller spatial scale than the winter NAO pattern. During the positive phase of the SNAO, northern Europe experiences drier, warmer and reduced-cloudiness conditions, and the Bay of Biscay, the English Channel, and the North and Baltic seas undergo warmer SST (Folland et al., 2009). The East Atlantic (EA) pattern is also identified as a dominant mode of northern Atlantic atmospheric variability (Barnston and Livezey, 1987), which is particularly important for the northwestern Iberian Peninsula climate in all seasons (Lorenzo et al., 2008). It is a north–south dipole that spans the entire northern Atlantic Ocean, with centers southeastward of the NAO pattern (winter and summer).
Although there is strong evidence of the influence of large-scale features, no consensus exists on atmospheric patterns associated with summer MHWs in the Bay of Biscay and the English Channel. On the one hand, Holbrook et al. (2019) identify the Bay of Biscay as a region for which there is a significant increase in annual MHW days during a positive phase of the NAO, based on a linearly detrended SST with satellite data and the NAO index. On the other hand, Izquierdo et al. (2022a) suggest, based on the analysis of two in situ buoys in the coastal south of the Bay of Biscay, that the incidence, duration and intensity of spring–summer MHWs are higher during the positive phase of the EA. However, for each of these two studies, only one climate index out of the numerous modes of summer atmospheric variability in the northern Atlantic–European sector was considered.
MCSs have also been reported to occur as a response to atmospheric forcing through anomalous winds and air–sea heat fluxes, especially in coastal regions where cold-air outbreaks over shallow water can cause rapid chilling of water (Crisp, 1964; Schlegel et al., 2021). But to the best of our knowledge, no study has been published focusing on the connection between MCSs and atmospheric circulation in the Bay of Biscay and the English Channel.
At a more regional scale, Guinaldo et al. (2023) linked the 2022 MHW off France to anomalies of above-average solar radiation, below-average cloud coverage and negative wind speed, also showing the importance of hydrodynamic conditions such as the tide that allow for turbulent vertical mixing. This explains why the Mediterranean Sea with weak tidal ranges presents a more pronounced response to MHWs (Darmaraki et al., 2019; Simon et al., 2022). Other studies have been carried out in terms of the processes and detection of MHWs in the Bay of Biscay but only along the Spanish Cantabrian coast. Namely, Izquierdo et al. (2022b) found a steady increase in SST from 1998 to 2019, which was reflected in MHW occurrence and a consequent matchup to report population shifts in coastal macroalgae. In a second study, Izquierdo et al. (2022a) compared MHWs with satellite data and found a 6-fold increase in their incidences in the last 4 decades, with half of this increase related to climate change.
Several studies focus on the impact of MHWs or MCSs on biological systems, covering the areas of the Bay of Biscay, the English Channel or the Spanish Cantabrian coast, reaching as far back as the 1960s. These studies analyzed the atmospheric cold spells of winter 1962–1963 on the English coast and the impact on marine animal mortality such as that of Pecten maximus (Crisp, 1964) or migration of species such as flounder (Sims et al., 2004). In the English Channel, Gómez and Souissi (2008) made the link between the MCS of 2005 and the absence of the spring bloom of Phaeocystis. A delay in the initiation of the phytoplankton bloom caused by the presence of MCSs at the end of winter in the Bay of Brest and in the Bay of Vilaine (in the northern part of the Bay of Biscay) is observed by Poppeschi et al. (2022). The impact of MHWs on biology is even more studied than the cold counterpart. Gómez and Souissi (2008) show the link between the heatwave of 2003 in the English Channel and the abundance of dinoflagellates. Joint and Smale (2017) demonstrate a link between MHWs and microbial activity assemblage in the English Channel which controls biogeochemical cycles in the ocean. The MHW of 2018 in the English Channel is present in the literature for its mortality mass impact on mussels (Seuront et al., 2019), link to fucoids (Mieszkowska et al., 2020) or harmful phytoplankton blooms (Brown et al., 2022). Predictions at the atmospheric scale point to an increase in the future of heatwaves in the Bay of Biscay (Chust et al., 2011) and a decrease in marine fauna (Wethey and Woodin, 2022).
In this context, we aim to describe and explain the evolutions of the MHWs over summer and MCSs over winter activity in the northeastern Atlantic and to investigate the regional variability in three subregions: the English Channel, the Bay of Brest and the Bay of Biscay. The analysis will rely on both in situ and satellite data to address MHW and MCS activity, aiming to evaluate the impact of such events in coastal regions and in the open ocean. This approach will allow us to evaluate the potential use of in situ measurements to detect, characterize and understand such extreme events. In the last section of this paper, we focus on the influence of the interannual atmospheric mode of variability involved in the occurrence of MHWs and MCSs in the northeastern Atlantic by finding the atmospheric circulation occurring in phase with most of the strongest events.
2.1 Satellite and reanalysis data
The global SST data used in this study result from a combination of different observational platforms, including satellites, ships, buoys and Argo floats, provided by the National Oceanic and Atmospheric Administration (hereafter OISST, optimum interpolation sea-surface temperature; Reynolds et al., 2007; Huang et al., 2020). The satellite products have a daily temporal coverage for the 1982–2022 period and are interpolated to a regular global grid of 0.25∘ spatial resolution. Monthly geopotential height at 500 hPa (z500), surface net shortwave radiation flux, surface net longwave radiation flux, surface sensible heat flux and latent radiation heat flux data were obtained from the European Center for Medium-Range Weather Forecasts (ECMWF) reanalysis data (ERA5) at a spatial resolution of 0.25∘ × 0.25∘ (Hersbach et al., 2020).
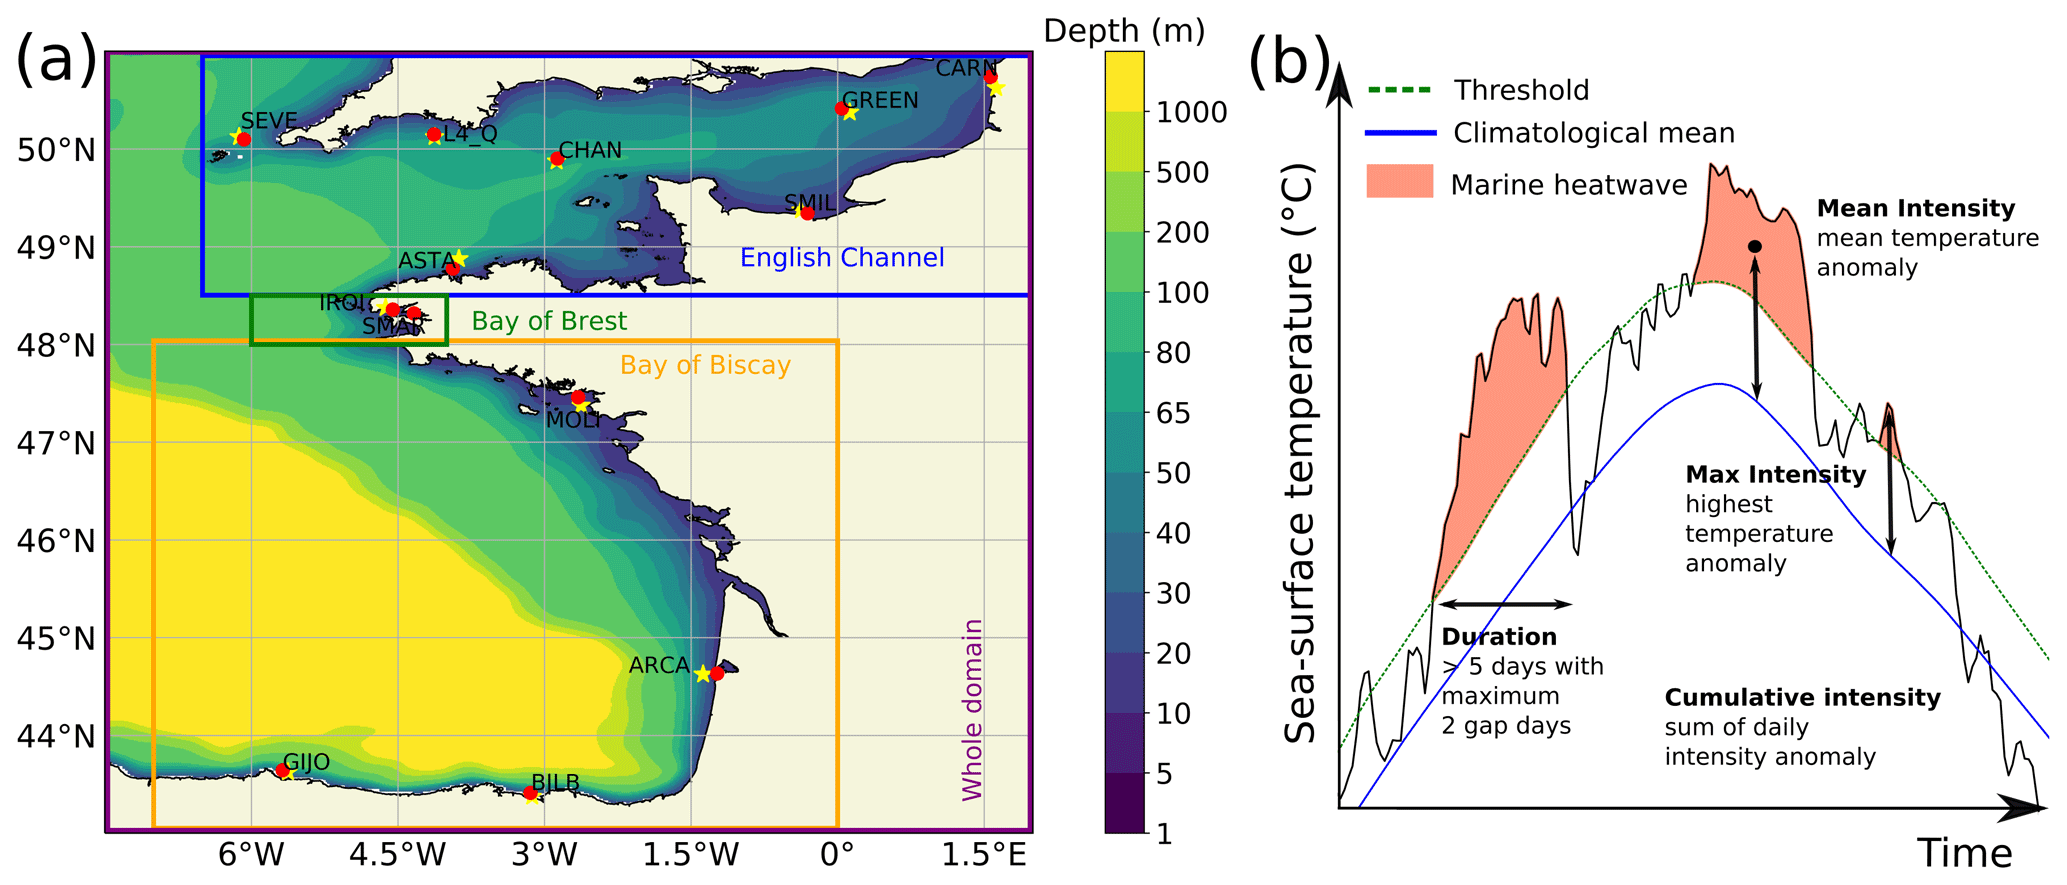
Figure 1(a) Map of the study area including the whole domain (northeastern Atlantic) (purple box) as well as the three subregions which are the English Channel (blue box), the Bay of Brest (green box) and the Bay of Biscay (orange box). The buoys are represented by red dots, and the closest satellite points are represented by yellow stars. (b) Schematic of MHW detection and properties as defined by Hobday et al. (2016).
2.2 Buoy data
The in situ SST data are from autonomous coastal buoys that take continuous high-frequency measurements from 10 min to 1 h (Fig. 1a). These buoys are from different European organizations, detailed below and in Table S1 in the Supplement, covering the coastal areas of the English Channel, the Bay of Brest and the Bay of Biscay.
The national observation infrastructure network (Coastal OceAn observing SysTem – High Frequency, COAST-HF; http://www.coast-hf.fr, last access: 2 January 2023) operates 14 buoys taking measurements of several physical and biogeochemical parameters all around French coasts, among which, 7 buoys are used here and are located in the English Channel (Carnot, CARN, https://doi.org/10.17882/39754; Smile, SMIL, https://doi.org/10.17882/53689; Astan, ASTA), in the Bay of Brest (Iroise, IROI, https://doi.org/10.17882/74004; Smart, SMAR, https://doi.org/10.17882/86020) and in the Bay of Biscay (Molit, MOLI, https://doi.org/10.17882/46529; Arcachon, ARCA). The Met Office (https://www.metoffice.gov.uk, last access: 2 January 2023) manages several buoys and also offshore sites. The buoys used here are located in the English Channel, on the southern coast of England, at Seven Stones (SEVE), Channel (CHAN) and Greenwich (GREEN). The Western Channel Observatory (WCO; https://www.westernchannelobservatory.org.uk, last access: 4 April 2023), situated within the western English Channel, operates two oceanographic moorings. The station L4_Q located near the city of Plymouth, approximately 7 km offshore, is used here. Puertos del Estado (http://www.puertos.es, last access: 2 January 2023) operated two buoys along the Spanish coast: Bilbao (BILB) and Gijón (GIJO), located in the Cantabrian Sea; both of them are used here.
2.3 Detection of MHWs and MCSs
To detect marine temperature extreme anomalies, we use the definition of Hobday et al. (2016). First, a climatology over 40 years, from 1982 to 2022, is calculated from the satellite product. Then, we apply the 90th percentile to summers (JJAS, June–July–August–September) for MHW and the 10th to winters (DJFM, December–January–February–March) for MCS. Finally, an MHW (MCS) is detected if values are above (below) the threshold for at least 5 d. For in situ data, the same detection method is applied considering the climatology calculated from the satellite product. Only seasons (summer or winter) with more than 80 % of available data are analyzed.
To characterize MHWs and MCSs, we analyze parameters such as the number of events, the duration, the spatial extent and the cumulative intensity, defined as in Hobday et al. (2016) (Fig. 1b). We also explore an integrated indicator of these different parameters characterizing the marine temperature extreme events (MHWs and MCSs), called activity and defined by Simon et al. (2022). This indicator estimates for each grid point the cumulative combination of the mean intensity, the duration and the affected area of each extreme event within a selective time range (for example JJAS). This activity index accounts explicitly for the area, as in most SST products a grid cell area differs from one latitude to another and marine thermal events can expand over large areas. The activity is calculated for each grid point. It sums the product of the mean intensity, duration within the selected time range and area of each detected event occurring within the selected time range. The activity is written as follows:
where EE ∈ TimeRange denotes the extreme event (EE) that occurs within the selected time range, the mean intensity of EE (in ∘C) is the mean temperature anomaly with respect to the climatology of the event, duration EE ∩ TimeRange (in days) is the duration of the event that remains within the considered time range and areaEE (in km2) is the area affected by the discrete event within a predefined domain. Time series involving the activity metric for a domain are calculated as the mean of every grid cell considered. The activity for each station is computed in ∘C d without considering the area influenced by the events, as it can not be estimated from single localized stations.
This method of detection and characterization of marine thermal extreme events is performed over the whole domain of this study, referred to as the northeastern Atlantic (43–51∘ N, 8∘ W–2∘ E), and at each station where in situ observations are available. As illustrated in Fig. 1, three different subregions will be analyzed in detail, namely (i) the English Channel (48.5–51∘ N, 6.5∘ W–2∘ E), (ii) the Bay of Brest (48–48.5∘ N, 6–4∘ W) and (iii) the Bay of Biscay (43–48∘ N, 7–0∘ W). This will allow us to explore these regions separately and highlight regional patterns. Those three subregions can be associated with three contrasting hydrodynamical regimes: macrotidal (English Channel), semi-enclosed bay (Bay of Brest) and mesotidal (Bay of Biscay; Charria et al., 2013).
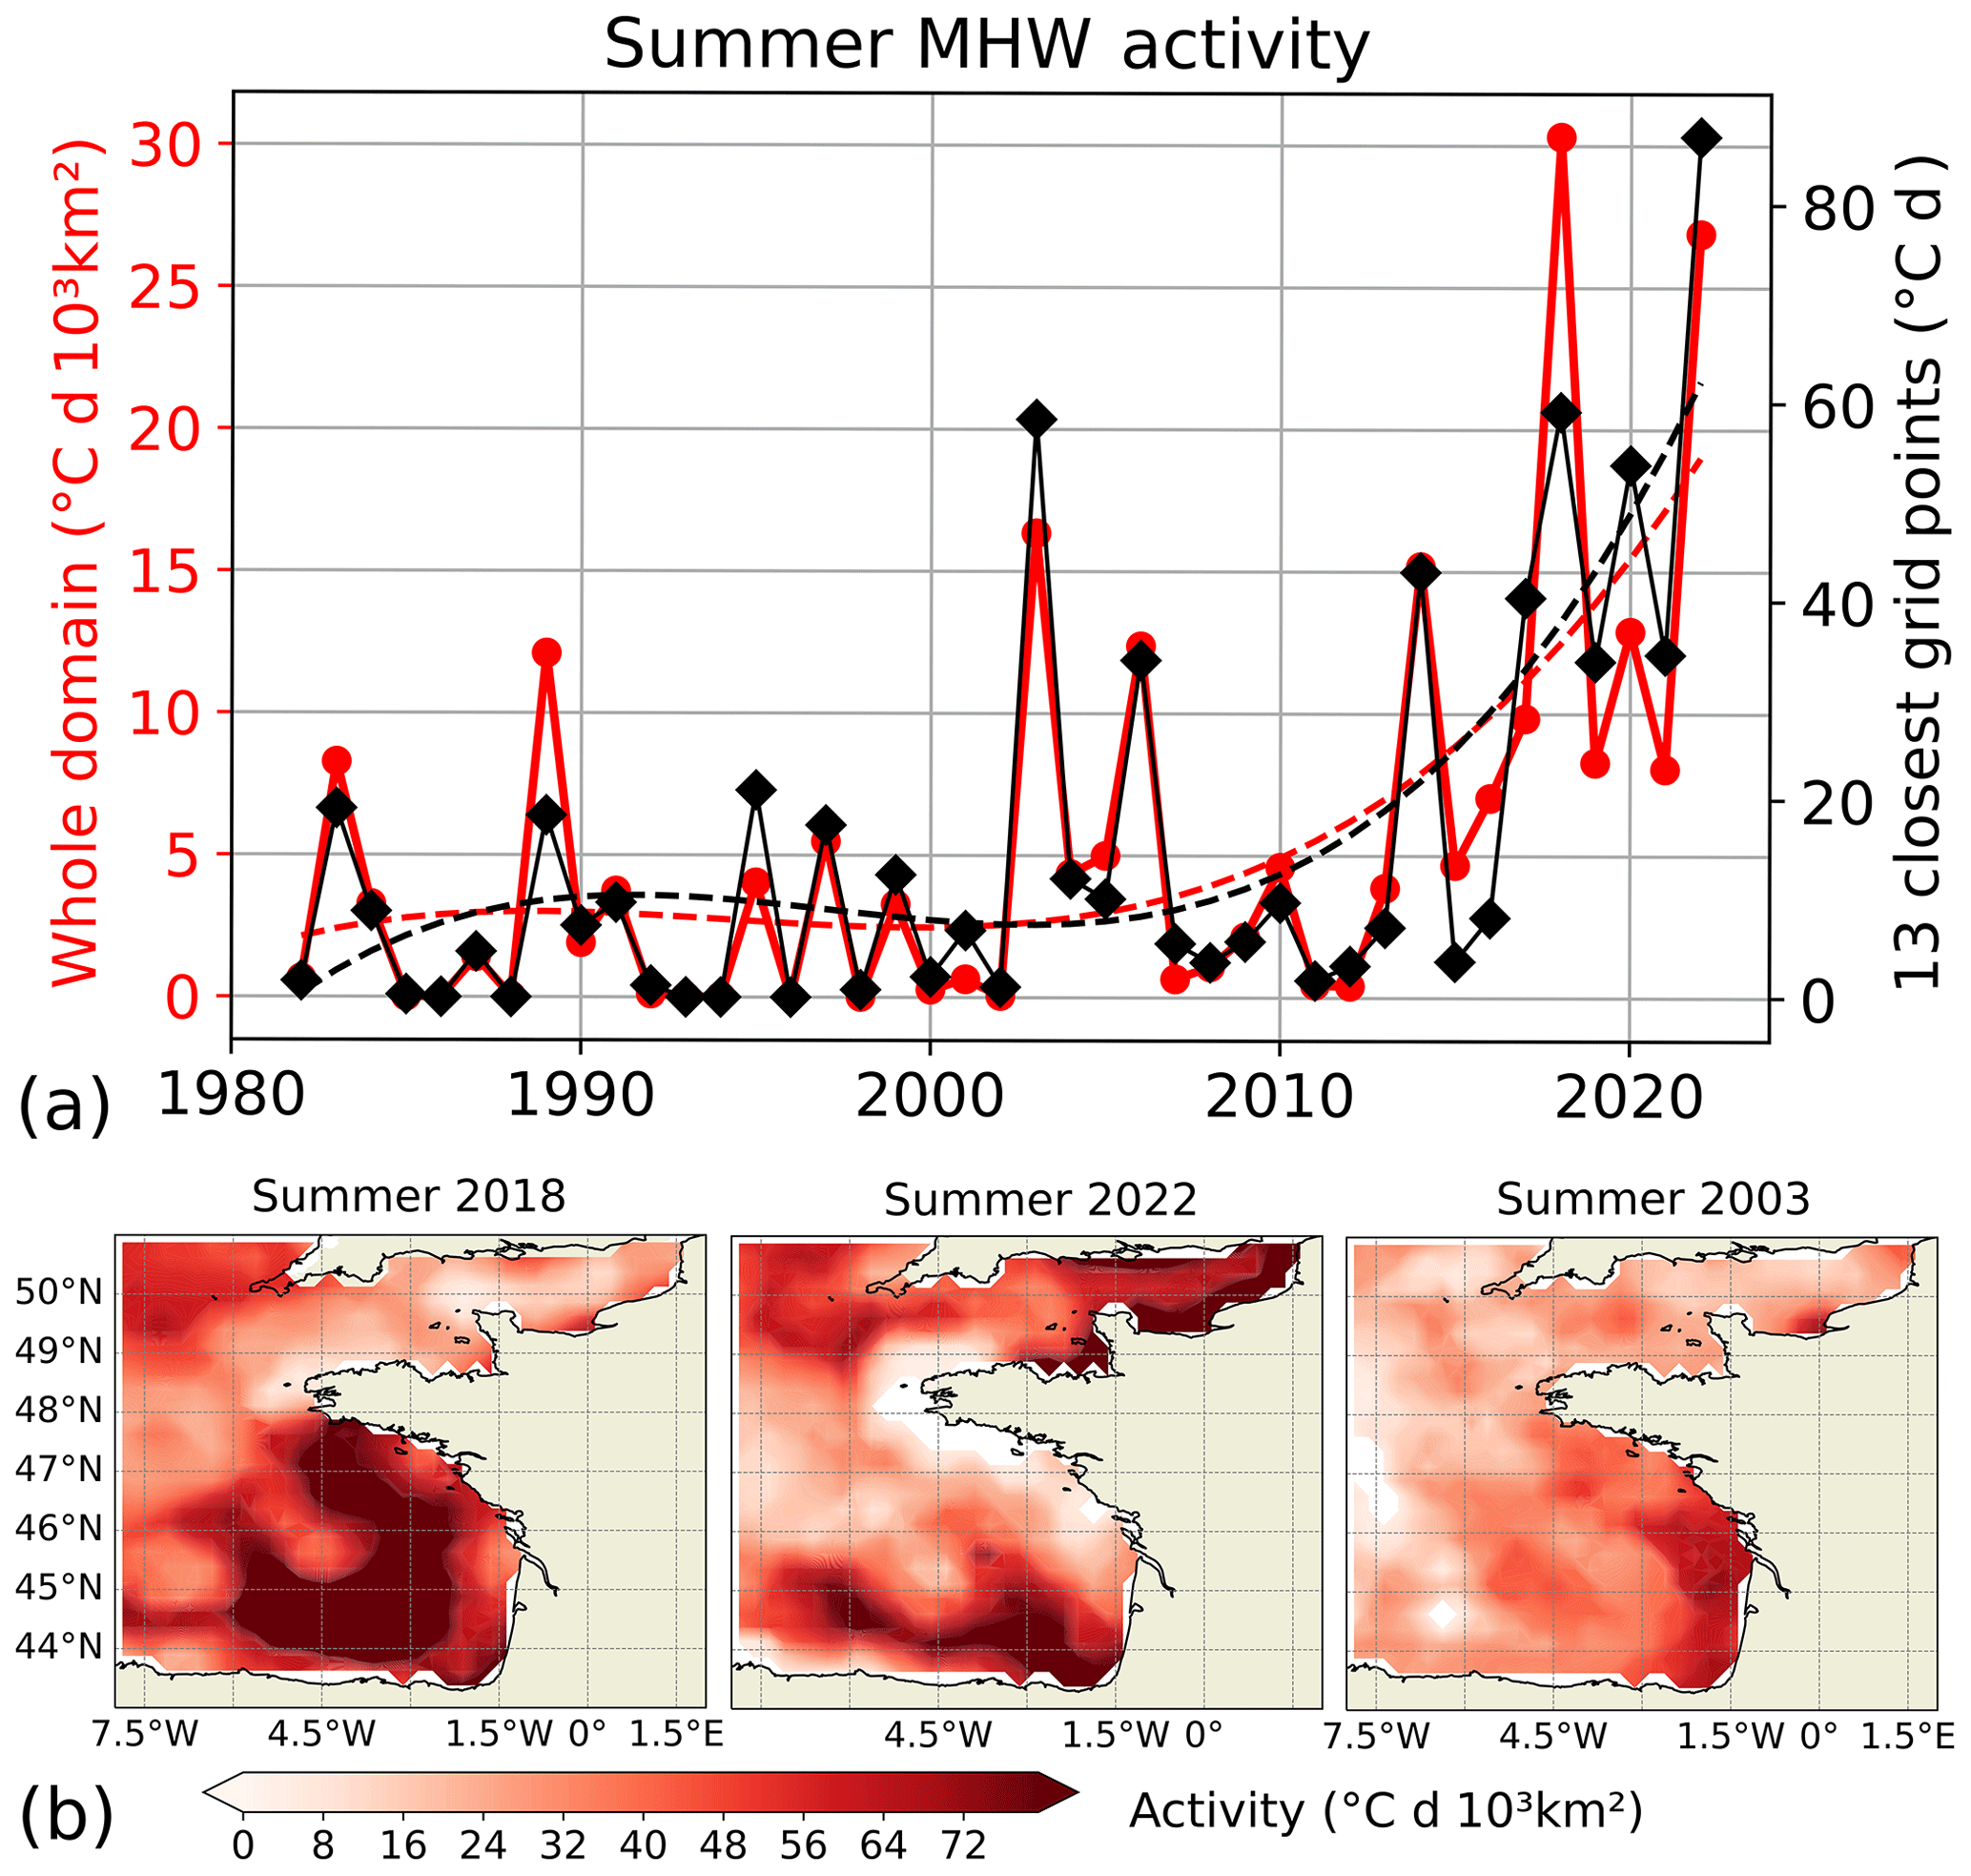
Figure 2(a) Times series of summer (JJAS) MHW mean activity in the northeastern Atlantic from the satellite product (red curves with circle marks) and for the average of the 13 grid cells closest to the buoys from the satellite product (black curves with diamond marks). Dashed lines represent the regression of a third-order polynomial of the solid line with the same color. (b) Summer (JJAS) activity (first row; in ∘C d 103 km2) for the top three summers in terms of activity in the northeastern Atlantic (from left to right).
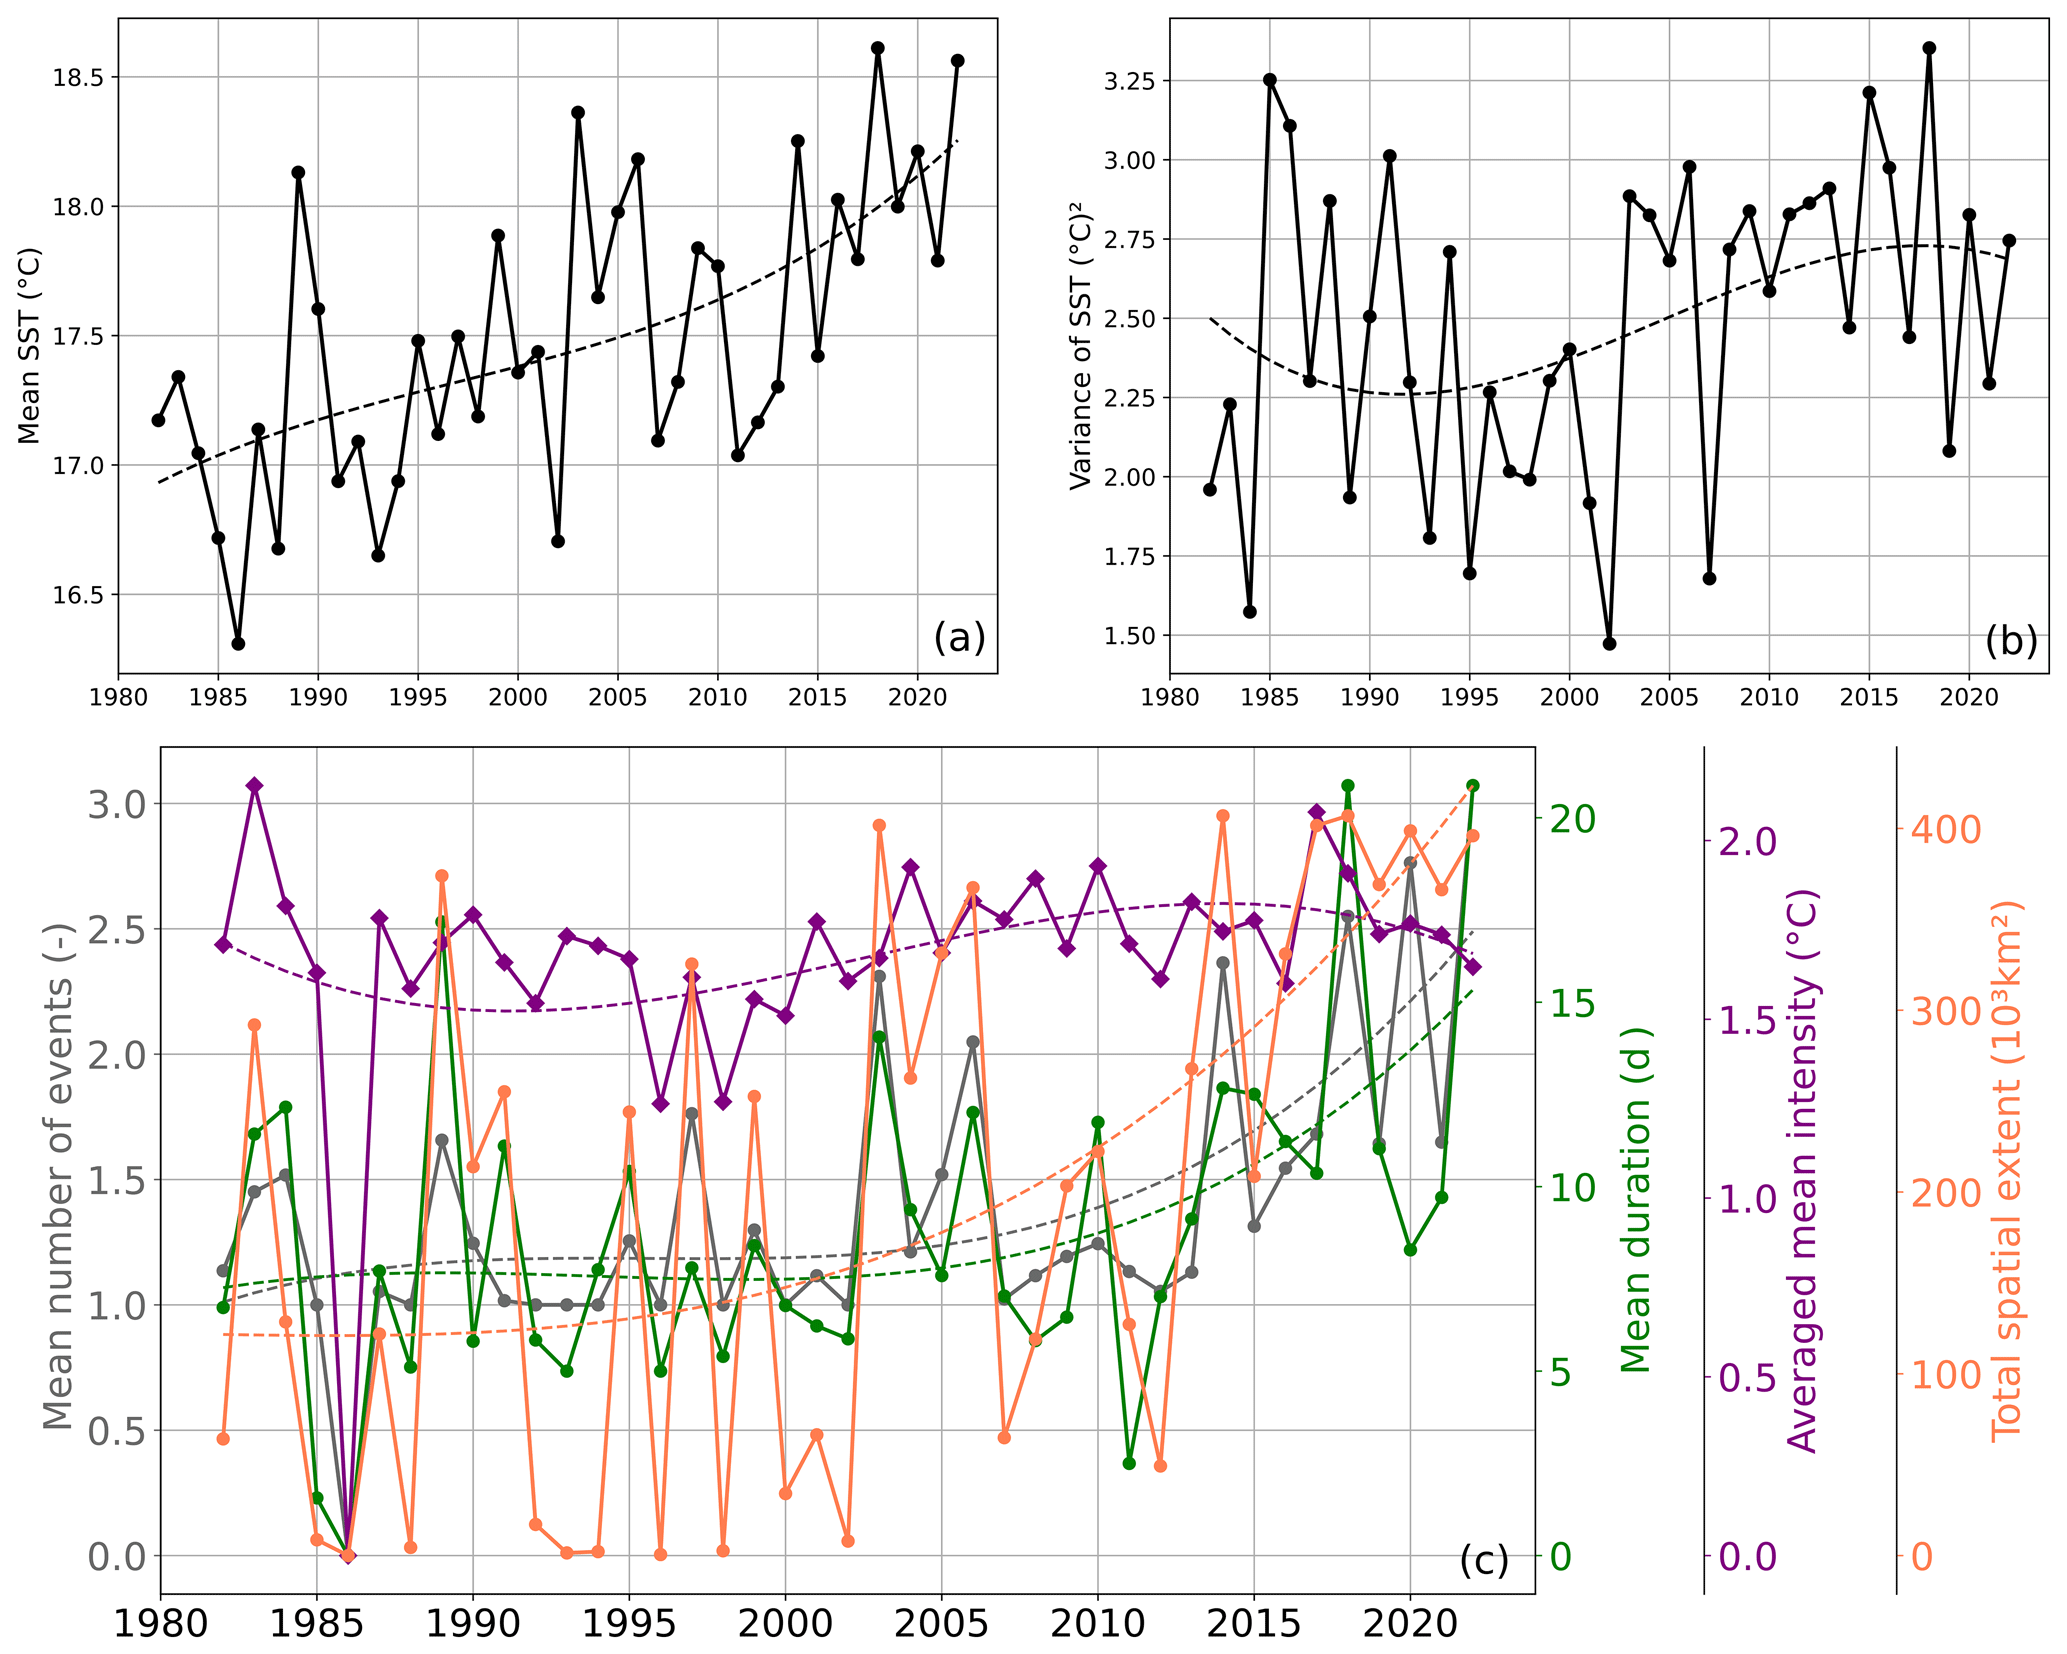
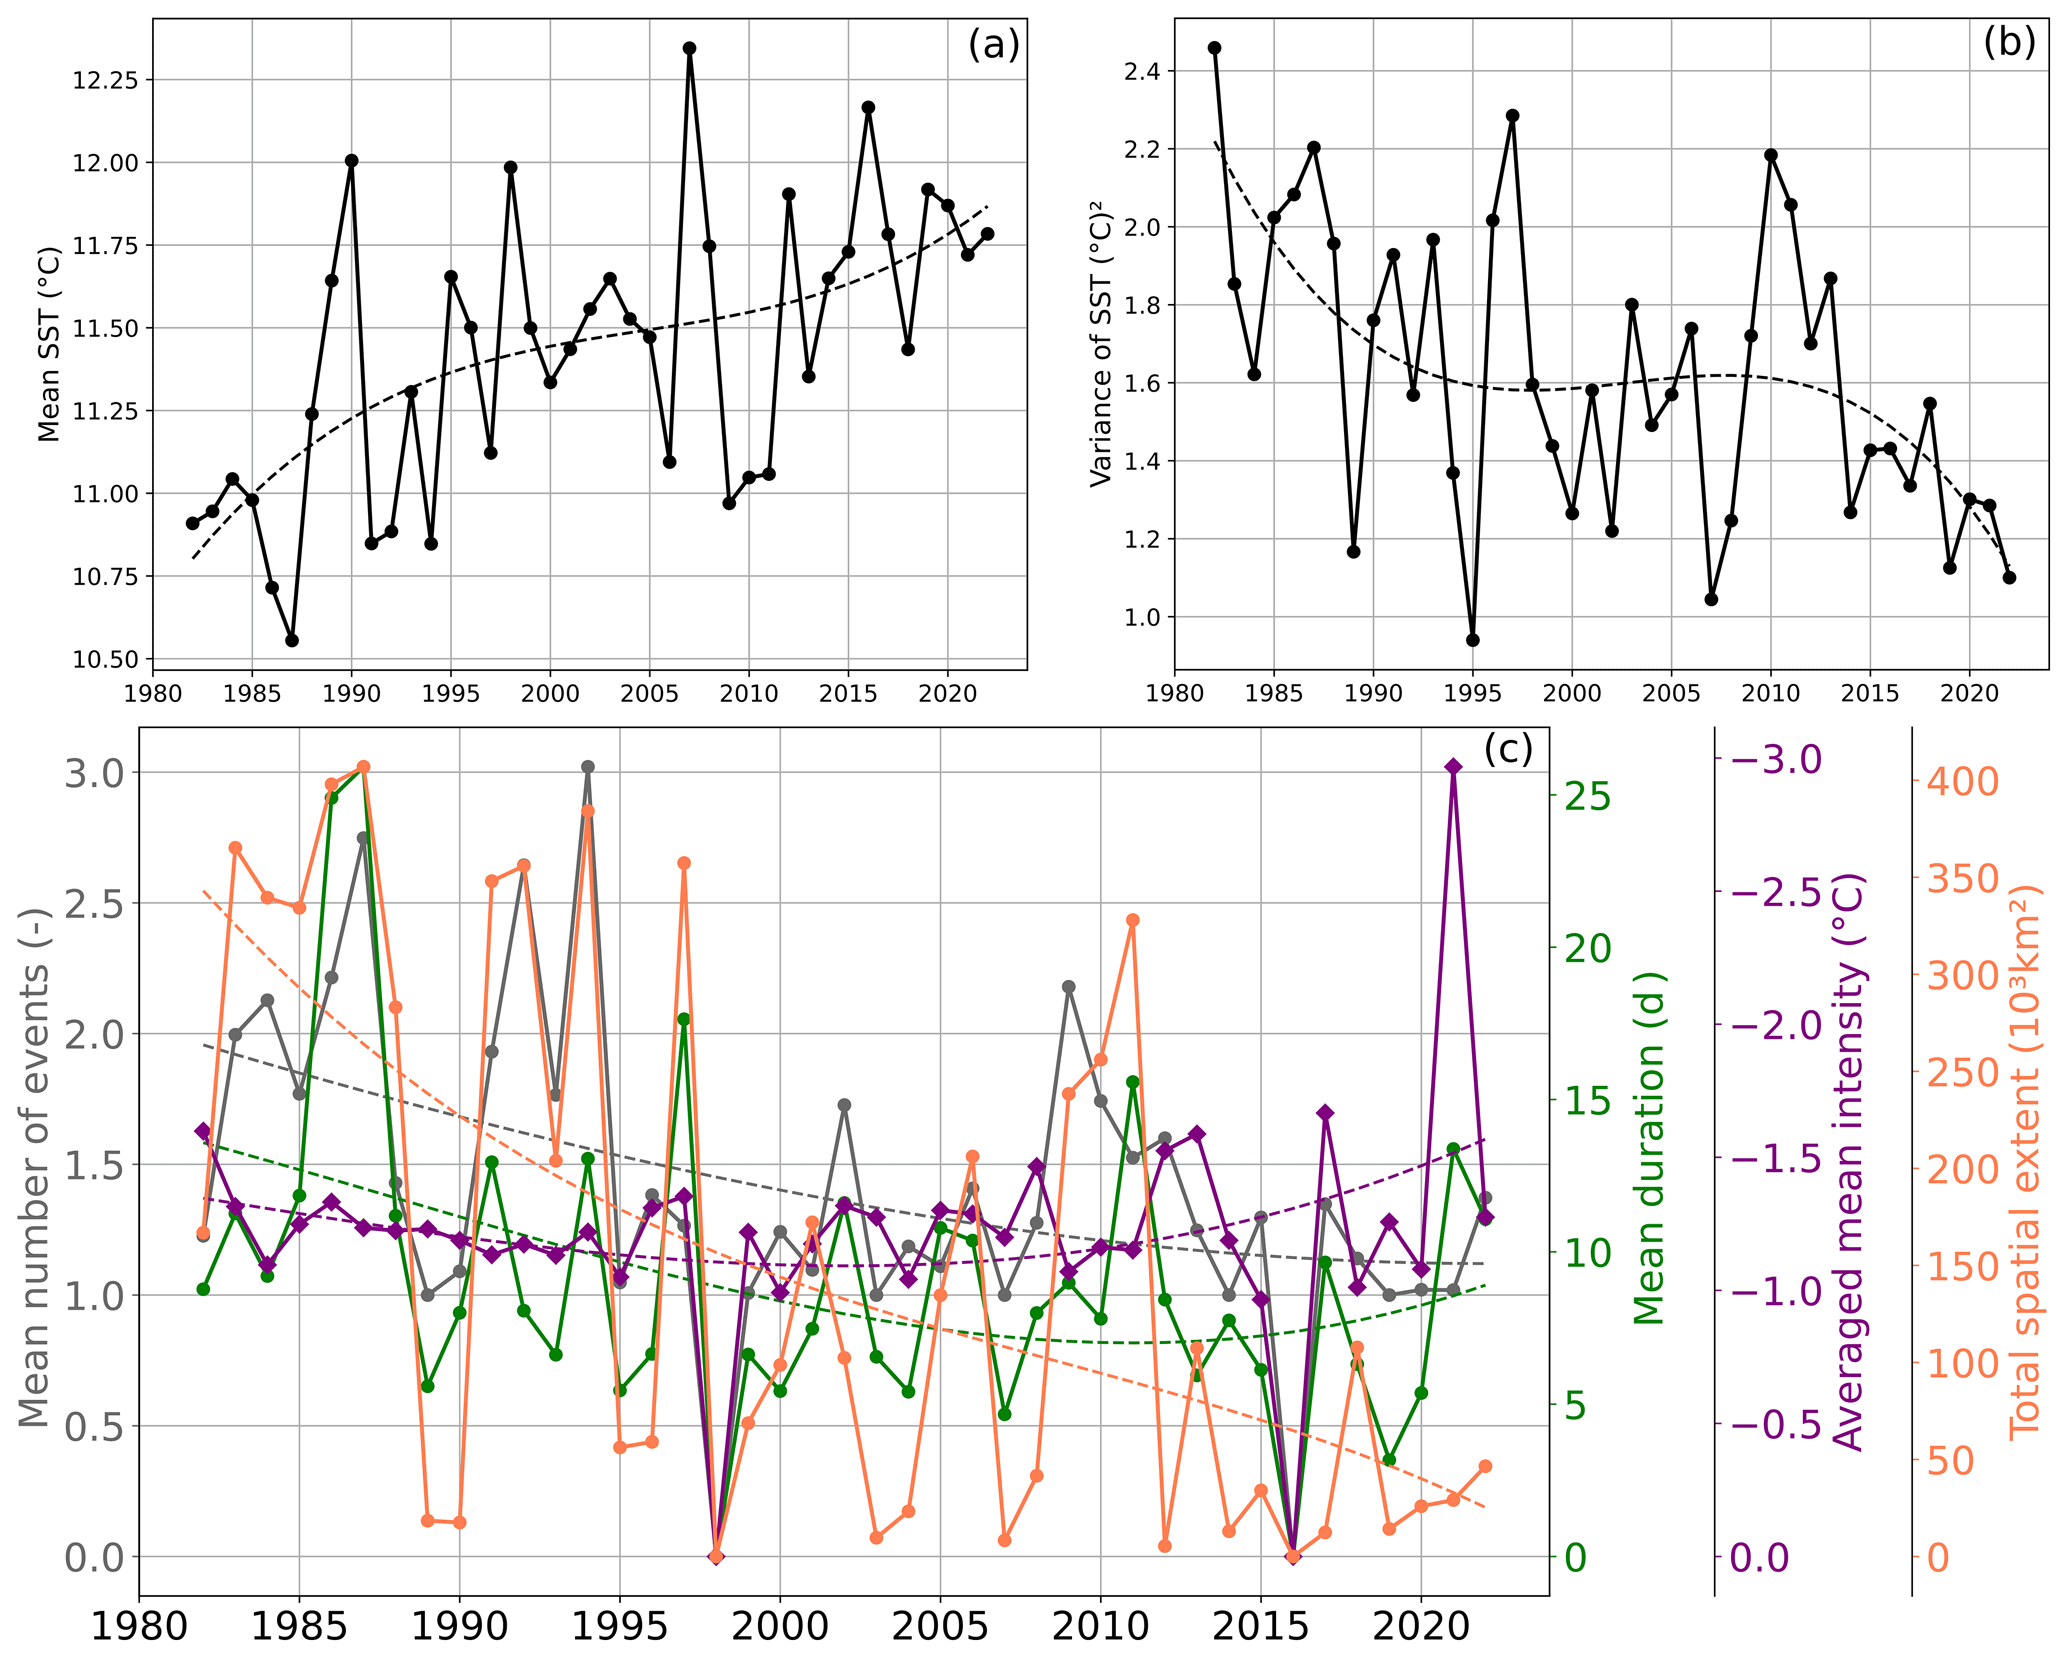
Figure 3Time series of the (a) mean and (b) variance of SST (black curve) of summers (JJAS) over the northeastern Atlantic for the period 1982–2022. The SST variance is calculated for each year over the respective domain and measures the spread of the spatial distribution. (c) Mean properties of summer (JJAS) MHWs in the northeastern Atlantic. The mean number of events (grey curve with circle marks) is the number of events within the summer averaged over the domain (without considering cells with no event). The mean duration (green curve with circle marks) is the average duration of every event within the summer and domain. The averaged mean intensity (purple curve with diamond marks) is the average of the mean intensity of every event within the period and domain. The total spatial extent (orange curve with circle marks) is the sum of each grid cell area where one or more events occur. If more than one MHW occurs in the same cell, only one grid cell area is taken into account. Dashed lines represent the regression of a third-order polynomial of the solid line with the same color.
3.1 Evolution of marine heatwave activity
3.1.1 An integrated regional view
MHWs were detected over the northeastern Atlantic. The activity index (Fig. 2a) highlights two main periods in the MHW dynamics. Before 2003, MHW activity remained moderate to weak with activity generally lower than 5 ∘C d 103 km2 corresponding to 1.2 mean occurrences per summer with a mean duration limited to 8 d (Fig. 3). Only summer 1989 displayed strong MHW activity (exceeding 10 ∘C d 103 km2) before 2000. From 2003 onward, the activity increased to over 30 ∘C d 103 km2 for summers 2018 and 2022 associated with more than 2.5 mean occurrences lasting around 20 d. The mean intensity remains quasi-steady during the whole period. The interannual variability and trend of the summer MHW activity for the whole domain is similar to the ones obtained for the average activity of the 13 grid cells closest to the buoy locations (black lines of Fig. 2), suggesting that, at 1 order of magnitude, coastal and open-ocean regions follow the same evolution.
The three most active summers are 2018, 2022 and 2003 (Fig. 2a). During 2018 (Fig. 2b), the maximum activity is located in the Bay of Biscay over the outer continental shelf and the continental slope from the southern part of the bay. These events also extend to the north to southern Brittany and are limited by the Ushant tidal front (Le Boyer et al., 2009; Müller et al., 2010). Regions of minimum activity during 2018 are west of French Brittany in the Ushant front region, where tides are efficiently mixing the water column. Similarly, the activity remains weak in the English Channel, as it is a macrotidal region. In terms of duration, longer events are observed in the southern part of the Bay of Biscay, exceeding 30 d (Fig. S1 in the Supplement). The 2022 summer is the second most active year for the whole domain, with over 25 ∘C d 103 km2, and also the strongest in terms of marine activity over coastal regions as shown by the maximum value of the average activity near the 13 buoys considered (Fig. 2a). Spatially, the English Channel and the north of Spain record the strongest MHW activity, while the French Brittany coast has no occurrence over this year (Fig. 2b). In the English Channel, the mean duration of the summer 2022 events was around 35 d (Fig. S2 in the Supplement), with localized events lasting more than 50 d (Fig. S1). In northern Spain, the duration of the events was around 20 d; however, they occurred very frequently over the summer with strong mean MHW intensities of around 2 ∘C (Fig. S1). In 2003 (Fig. 2c), the MHW activity spatial distribution was different than in 2018 and 2022. The activity is larger over the inner continental shelf along western French coasts in the Bay of Biscay. This region is under the influence of significant river plumes along this coast (Adour, Gironde and Loire rivers). During this year, river discharge could have induced stratification (inducing faster warming of the surface mixed layer in regions of freshwater influence; Oh et al., 2023), and warmer waters from rivers suggest that observed MHWs were sustained by an atmospheric event more centered over lands. During this summer, the number of events is larger in the western English Channel, but the events are shorter and less intense than in the Bay of Biscay. These top three active summers highlight the interannual spatial variability in MHW activity. The detailed mean features (number of events, duration and mean intensity) of summer MHWs over the period 1982–2022 in the northeastern Atlantic, English Channel, Bay of Brest and Bay of Biscay are documented in Table S2 in the Supplement.
The mean SST has been increasing over the 40 years with an approximately linear trend, showing a mean warming of nearly 1.5 ∘C for the whole domain since 1982 (Fig. 3). Regionally, it is observed that the increase in the mean SST is almost yearly constant for the Bay of Biscay region and quadratic for the English Channel and Bay of Brest, where a plateau is observed around 1995–2010 (Fig. S2).
The SST variance is calculated for each year over the respective domain and measures the spread of the spatial distribution. Over the northeastern Atlantic, 1985–2002 and the 5 most recent years are characterized by a decline in the SST variance, while around 1992–2017 an increase in the SST variance is observed. This interannual trend is similar to the ones observed for the events' intensity, with the exception of the English Channel showing a direct relationship between the SST variance and the mean intensity of the MHW events. In the English Channel, Bay of Brest and Bay of Biscay, the mean SST is warming and the variance is increasing. This estimation suggests that they both contribute to the changes in the respective MHW activity (Fig. S2).

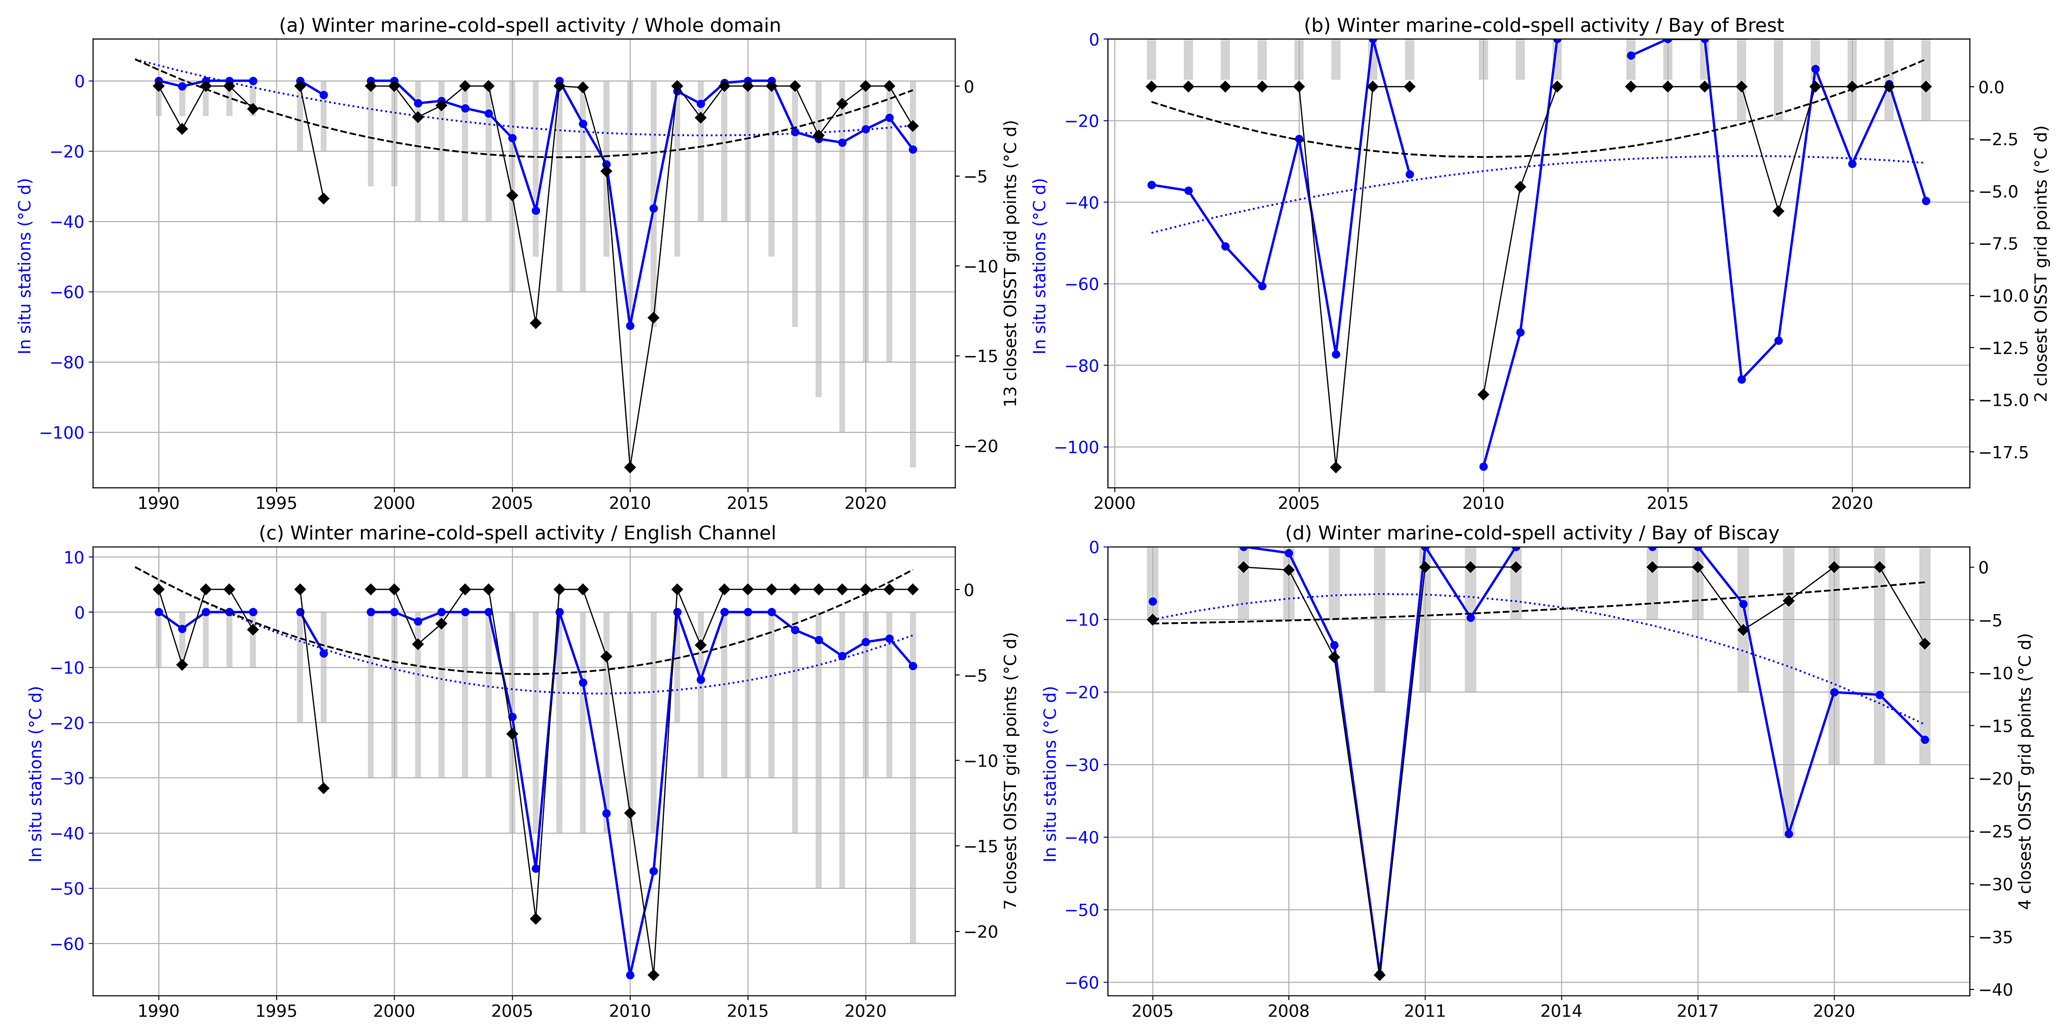
Figure 4Time series of summer (JJAS) MHW mean activity (a) in the whole domain (northeastern Atlantic) and (b–d) in three subregions: (b) the Bay of Brest, (c) the English Channel and (d) the Bay of Biscay. The red curve with circle marks represents the activity based on in situ observations. The black curve with diamond marks represents the activity based on satellite dataset for the closest non-masked points with in situ stations when in situ data exist. Dashed lines represent the regression of a third-order polynomial of the solid line with the same color. Grey bars are proportional to the number of considered in situ time series. MHW activity from in situ time series with less than 80 % of observation during the analyzed season is not computed.
Contributing to this recent increase in the northeastern Atlantic is primarily the sharp trend of the events' spatial extent (∼ 180 to 400 ∘C d 103 km2), followed by the rise in the number of events (1.2 to 2.5) and also their duration (7 to 15 d; Fig. 3). One should note that, for the same number of events, the events' spatial extent can differ depending on their spatial repartition, as in the events' spatial extent only one grid cell area is taken into account when more than one event occurs on the same grid. Furthermore, over the most recent years the mean number of events, their mean duration and the total spatial extent reached the maximum recorded values. Since 2017, the total spatial extent over the northeastern Atlantic has recorded consecutive high values, exceeding 360 × 103 km2. The summers of 2018, 2020 and 2022 recorded on average more than 2.5 events for almost all subregions, with events lasting on average more than 20 d in 2018 (Bay of Biscay) and 2022 (English Channel; Fig. S2). Among the three studied subregions, the English Channel is the region experiencing the strongest increase in summer MHW activity over the last 4 decades (see trend in Fig. S3). The longest mean duration is seen in the English Channel (35 d in summer 2022), the highest mean number of events occurred in the Bay of Brest (2.7 in summer 2020) and the highest mean intensity is present in the Bay of Biscay (2.2 ∘C in 2017; Fig. S2).
3.1.2 Coastal MHW activity
The spatial heterogeneity of the MHW occurrence and activity can influence the impact of MHWs along the coastline. We now explore MHW activity detected along the coast from in situ observations compared with remotely sensed observations. Figure 4 shows the activity detected for the whole northeastern Atlantic domain and in the three subregions where long-term in situ observations exist. To compare in situ and satellite data, for each station, time series based on satellite data consider only years where in situ data exist (see Table S1 for the starting date) and exceed 80 % of available data for the considered season. Linked with the whole domain activity (Fig. 4a), we observe an increase in the MHW activity in the three subregions (Fig. 4b–d). Similar evolutions are observed when the satellite product or coastal buoys are considered. In the Bay of Brest, we also observe a similar increase but with larger activity in in situ observation as the intensity of extreme events is underestimated by the satellite in this semi-enclosed bay. The use of in situ observation limits the length of the analyzed time series. However, we can observe larger activity in recent years from both datasets. For most cases, the most active years are detected with in situ observations and satellite data.
Considering coastal stations over the observed periods, we see a more pronounced increase in MHW activity from 2010. The English Channel and the Bay of Biscay in situ stations highlight the year 2022 as the most active year exceeding 140 ∘C d. In the Bay of Brest, the impact of the 2022 MHWs is less pronounced, in agreement with satellite observation (Fig. 2b), due to tidally driven vertical mixing.
When we compare MHW activity estimated from in situ stations and satellite products, values are generally larger from in situ stations. Those differences are explained by the underestimation of extreme temperatures in coastal regions in remotely sensed products.
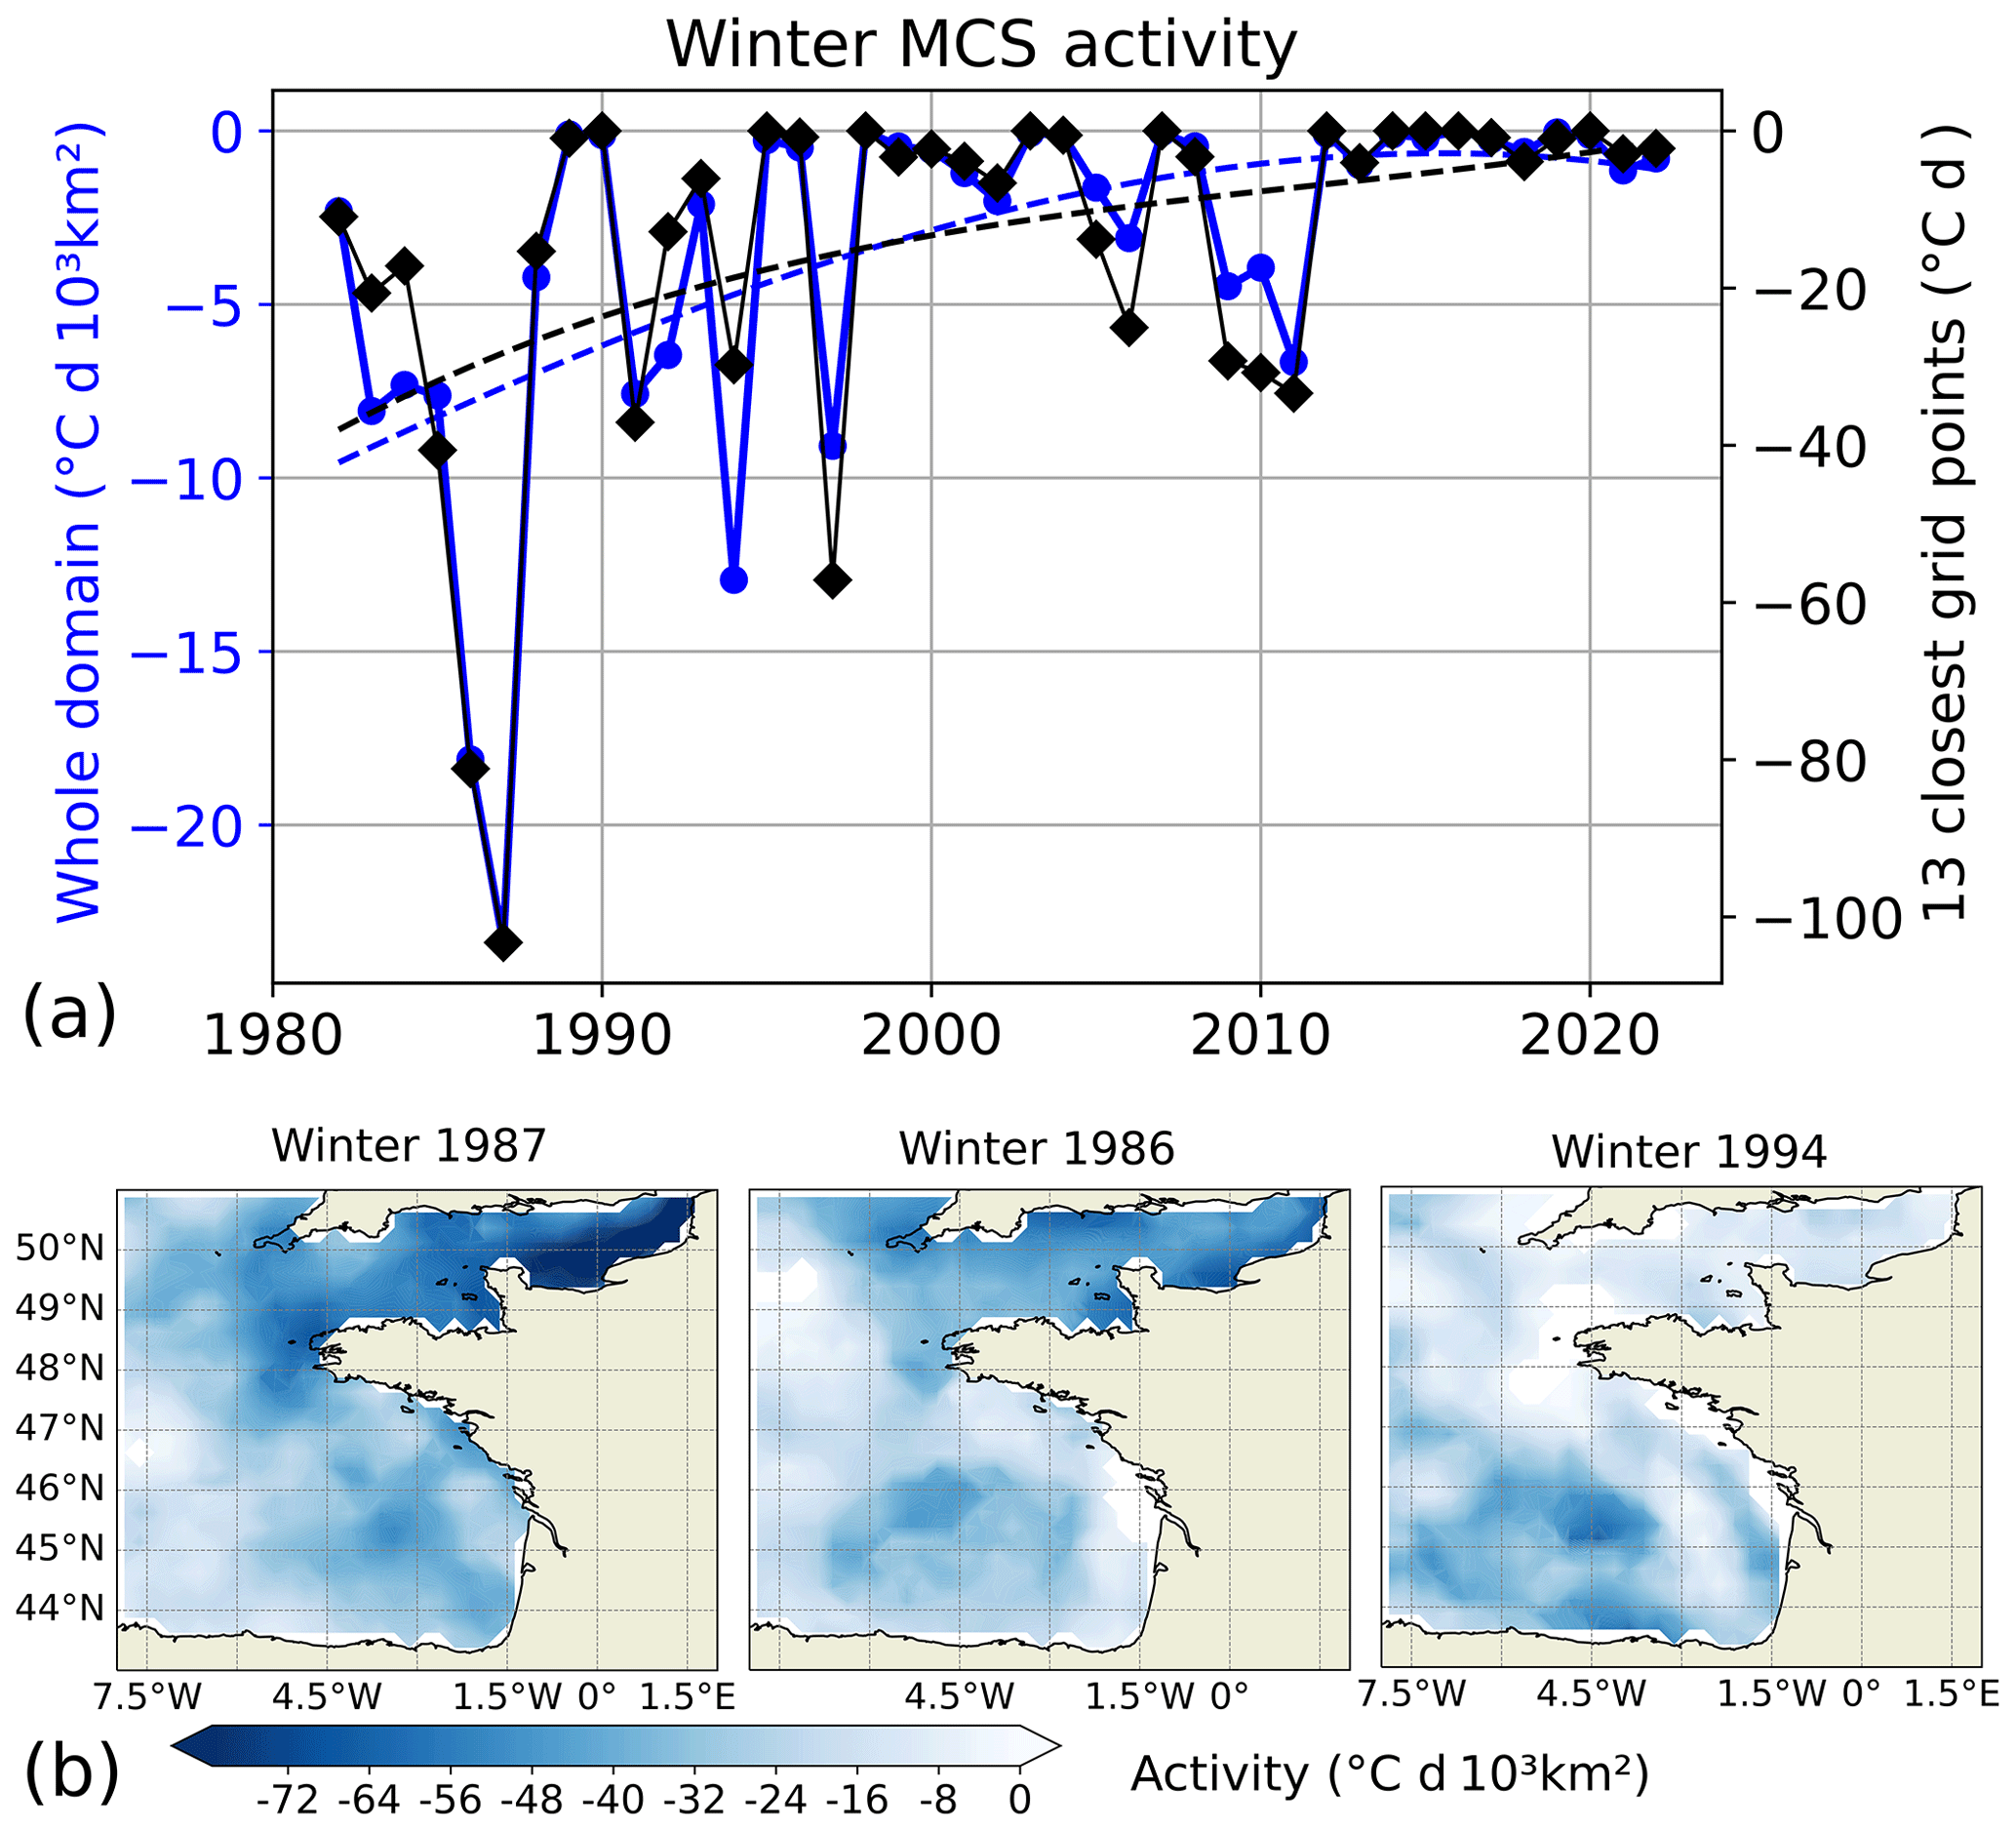
Figure 5Same as Fig. 2 but for MCSs in winter (DJFM).
3.2 Evolution of marine-cold-spell activity
3.2.1 An integrated regional view
Figure 5 depicts winter MCS evolution for the whole domain over the last 4 decades (1982–2022). MCS activities decrease linearly during the first half of the period, showing almost no occurrence after 2000 with the exception of 2006 and 2009 to 2011. A similar evolution is seen by considering the average of the 13 grid points closest to each in situ station.
The three most active MCSs occur in winter 1987 (−24 ∘C d 103 km2), 1986 (−18 ∘C d 103 km2) and 1994 (−13 ∘C d 103 km2). In the two coldest winters, MCSs were dominant in the English Channel, especially off the northern French coast in winter 1987. These two winters are characterized by a few (∼ 1 event; Fig. S4 in the Supplement) long (∼ 50 d) and intense (∼ −2.5 ∘C anomalous SST) events. This region is subject to high turbulent mixing generated by the tidal current, which could favor cold conditions. By contrast to these two winters (1987 and 1986), winter 1994 featured strong MCS activity in the center of the Bay of Biscay, due to numerous (∼ 5 events) but moderately intense (∼ −1.3 ∘C) and relatively short (20 d) events. The three winters of 2009–2011 present very localized extremely cold conditions along the coastal Armorican shelf and additionally in the English Channel for 2011 (not shown). The detailed mean features (number of events, duration and mean intensity) of winter MCSs over the period 1982–2022 in the northeastern Atlantic, English Channel, Bay of Brest and Bay of Biscay are documented in Table S3 in the Supplement.
The mean and variance evolution of SST, as well as the mean evolution of MCS properties (occurrence, duration, mean intensity and spatial extent), is presented over the whole domain (Fig. 6) and separately for the English Channel, the Bay of Brest and the Bay of Biscay (Fig. S5 in the Supplement). Over the whole northeastern Atlantic domain, the SST mean increases and spatial dispersion (variance) decreases, with both showing a plateau around 1995–2010, following the English Channel and the Bay of Biscay evolution. On the contrary, a steady increase in the mean SST and a nearly constant variance of SST are seen in the Bay of Brest.
The warmer winter seen over the whole domain and for the three subregions is consistent with the decrease in the extremely cold conditions, depicted by the mean MCS activity. The decrease in the mean MCS activity is controlled by the strong decrease in spatial extent (350 × 103 to 50 × 103 km2), the moderate decrease in the number of events (2 to 1.2 events) and the small decrease in duration (13 to 9 d). The mean intensity does not show any trend (∼ −1.5 ∘C).
The decrease in spatial dispersion (variance) of SST over the whole domain indicates a more uniform evolution which is explained by a dominant warming trend that is stronger for colder areas. Indeed, the relatively cold English Channel's temperature increased by 1.5 ∘C (from 9 to 10.5 ∘C), and the relatively warmer Bay of Biscay increased by 0.8 ∘C (from 11.8 to 12.6 ∘C) over the 1982–2022 period. When considering the three subregions individually, localized enough to be under a similar trend, the variance also decreases (Fig. S5). The decrease in variance is more pronounced for the English Channel than for the Bay of Brest and Bay of Biscay. Therefore, a first estimate shows that the mean SST warming and the variance changes both contribute to the changes in MCS activity in the English Channel, Bay of Brest and Bay of Biscay.
MCS activity generally follows the SST evolution, albeit with small differences. Indeed, winter 1991 and 1994 have a similar mean SST (10.8 ∘C), but the MCS activity is 3 times higher in 1994 than in 1991, driven by a higher number of events (three instead of two events with similar duration, mean intensity and spatial extent).
Even if changes in winter occur in the Bay of Brest and Bay of Biscay, more drastic changes are seen in the English Channel over the period 1982–2022 (see trend in Fig. S6 in the Supplement). In the English Channel, the trend of MCSs shows, at the beginning of the period, a mean occurrence of two events per winter, lasting 15 d with a mean intensity of −1.5 ∘C over an area of 100 × 103 km2, followed by a sharp decline ending with no detected MCSs in the last 4 years (2019–2022). In the Bay of Brest over the same period, MCS properties decrease from 1.5 events during 15 d at a mean intensity of −1.4 ∘C over 11 × 103 km2 to 0.5 events during 8 d at a mean intensity of −0.8 ∘C over 0.5 × 10³ km2. Exceptional long events occurred in winter 1987 with a mean duration of 55 d. In the Bay of Biscay, the MCSs decline in occurrence (from two to one event), duration (from 11 to 9 d) and spatial extent (170 × 103 to 40 × 103 km2), while the mean intensity rises from −1.3 to −1.5 ∘C. The increase is explained by winter 2021; without these events, the mean intensity would have been nearly constant around −1.3 ∘C. Indeed, winter 2021 shows little activity but the highest mean intensity (−3 ∘C over the whole domain), which is explained by a localized event in the coastal area off southwestern France with a maximum intensity of −5.6 ∘C. Apart from a very intense and localized event in the coastal area off southwestern France in winter 2021 and a very long event in the Bay of Brest in winter 1987, severe MCSs occurred predominantly in the English Channel (winter 1987 and 1986).
3.2.2 Coastal MCS activity
Figure 7 shows the time series of MCS activity for in situ data and satellite data considering the same missing data as each in situ station data point. Along the coasts, MCS activity as determined by local buoys remains weaker than MHW activity as defined using satellite data. As for the MHWs, MCS intensity is underestimated in satellite observations, but evolutions are similar. From in situ observations from coastal stations, 2 years can be highlighted due to their intense MCSs: 2006 and 2010 (Fig. 7). The year 2010 is the most intense, in terms of MCSs. The mean activity reaches −100 ∘C d in the Bay of Brest and around −60 ∘C d in the Bay of Biscay and the English Channel. In 2006, the activity was also important compared with other years: around −80 ∘C d in the Bay of Brest and around −50 ∘C d in the English Channel. This extreme year 2006 was also unique with a peak in MHW activity during the summer (Fig. 4). Before the year 2000, 2 other years reveal intense MCS activity in the coastal English Channel: 1997 and 1991 (from the most intense to the less active winter).
We do not detect a significant trend in the interannual evolution of MCS activity along the coasts. For the Bay of Biscay and the Bay of Brest, it can be directly connected to the lack of observation before 2000 when the largest MCS occurs. In the English Channel, the lack of observation also explains the lack of a clear trend. Indeed, only one time series was available before 1995, and this station (Greenwich, GREEN) does not detect important MCS activity before 2000.
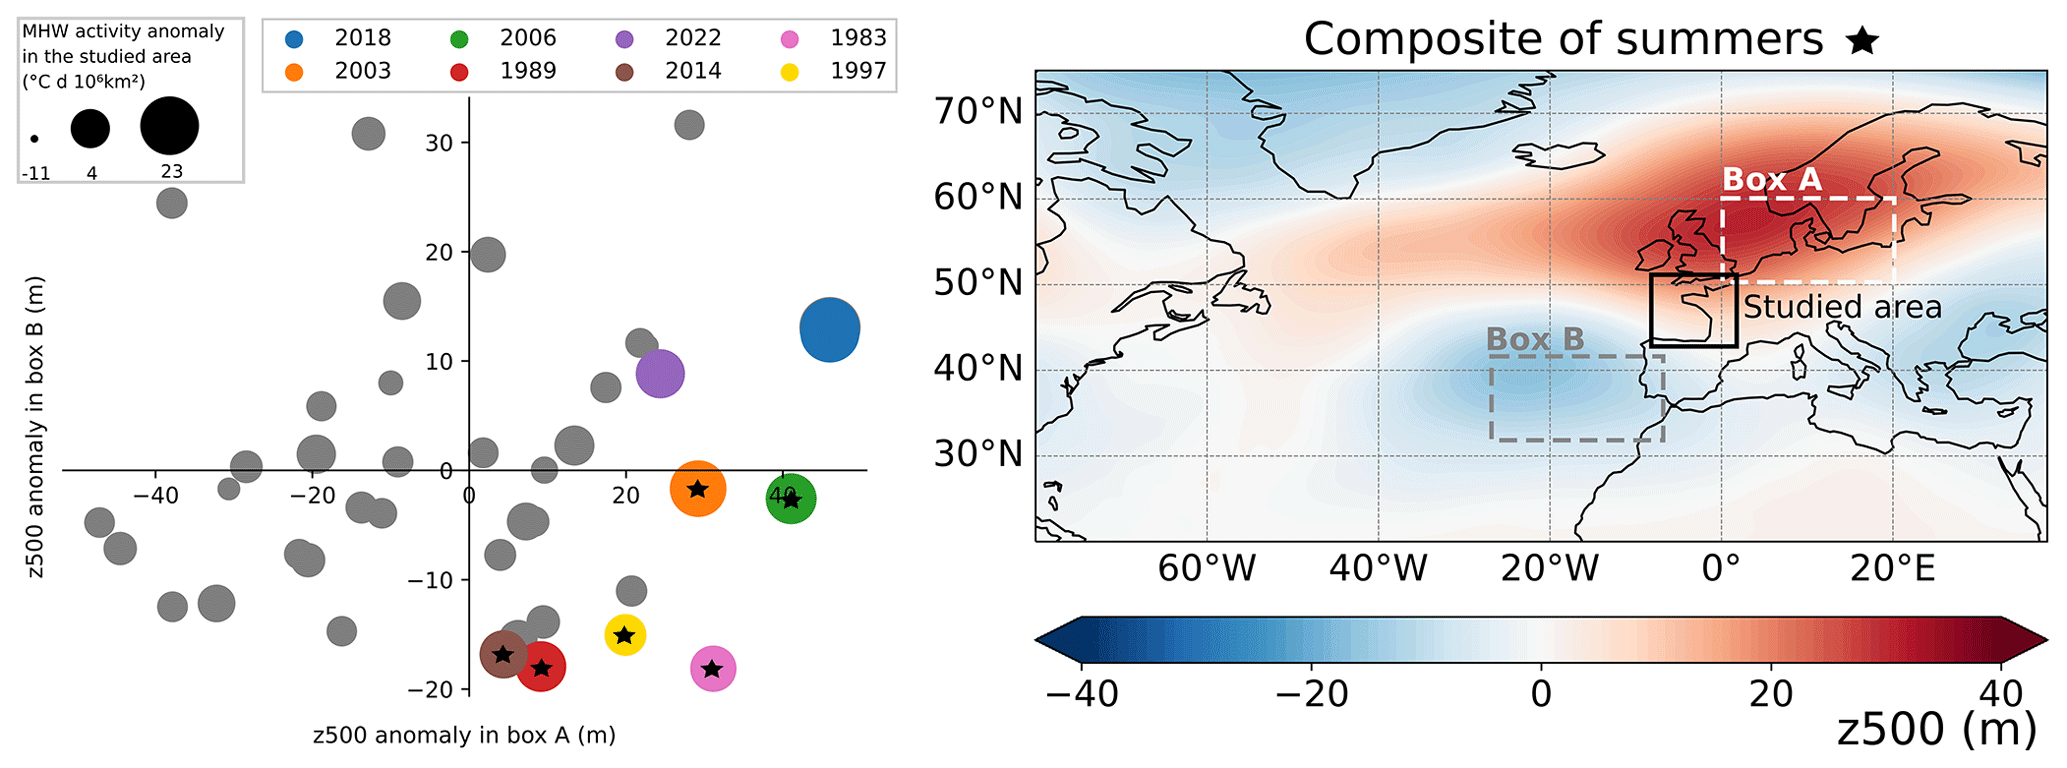
Figure 8(a) Scatterplot of anomalous summer (JJAS) geopotential height at 500 hPa (z500; in m) in box A versus the anomalous geopotential height at 500 hPa in box B with respect to the summer period 1982–2022. The size of the marker is proportional to the anomalous summer (JJAS) MHW total activity, calculated as the sum of all grid point activity in the studied area (in ∘C d 106 km2) with respect to the trend (dashed red curve in Fig. 2a). Markers are in color when this value exceeds 4 , and the stars are indicated when markers in color are in the lower-right “cluster” of the graph. (b) Composite of summers (JJAS) marked with stars in the left panel of the anomalous geopotential height at 500 hPa (m) with respect to the summer period 1982–2022. Box A is the domain 50–60∘ N, 0–20∘ E, and box B is the domain 31–41∘ N, 33–13∘ W.
3.3 Associated atmospheric patterns
Apart from the long-term trend of increasing SST, we also see high interannual variability, which is potentially connected with atmospheric forcing modes (Holbrook et al., 2019; Izquierdo et al., 2022a). Figure 8 presents the atmospheric circulation in the northern Atlantic associated with strong interannual MHWs in the Bay of Biscay and the English Channel. For each summer of the 1982–2022 period, the MHW total activity anomaly in the studied area box (northeastern Atlantic) with respect to the third-order long-term trend (dashed red curve in Fig. 2a) was computed. This anomaly represents the detrended or interannual MHW activity. Eight summers were identified as having high interannual activities (anomalous total activity exceeding a threshold of 4 , colored marker in Fig. 8a). The years 2018 (23 ), 2003 (17 ) and 2006 (12 ) are the three strongest summers. Six out of these eight summers (all except 2018 and 2022) have an anomalous geopotential height at 500 hPa, which is positive over northern Europe (box A in Fig. 8) and negative west of the Iberian Peninsula (box B in Fig. 8). The composite of the anomalous geopotential height at 500 hPa for these six summers shows a positive summer NAO-like pattern in the northern Atlantic–European sector, with a high over the Nordic seas and two lows over the Iberian Peninsula and Greenland. This overall result is not sensitive to small displacements of boxes (a few degrees of latitude and longitude; not shown).
Summer (JJAS) 2018 has the strongest anomalous MHW activity in the northeastern Atlantic but, differently from the next six summers in the ranking of detrended MHW activity, does not present a decrease in the geopotential height at 500 hPa west of the Iberian Peninsula (box B). A broad high-pressure system in the northern Atlantic–European sector is seen (including box A), except in the eastern Mediterranean and to 60∘ N, where a low occurs (Fig. S7 in the Supplement). This response in box B for summer 2018 is primarily due to late-summer (August and September) atmospheric circulation (Fig. S7). These months make a minor contribution to MHW total activity for the whole summer (JJAS; Fig. S8 in the Supplement). When considering the month of June, with 2018 MHW peaks (Fig. S8), the northern Atlantic shows a positive summer NAO regime, similar to the next six summers' highest MHW activity. This analysis demonstrates that MHWs in the northeastern Atlantic are closely associated with a high-pressure system over northern Europe, as well as a low off the Iberian Peninsula, resembling the positive phase of the summer NAO. By performing this analysis with SST instead of MHW activity, we obtain similar results, albeit with a less extended high over northern Europe (Fig. S9 in the Supplement).
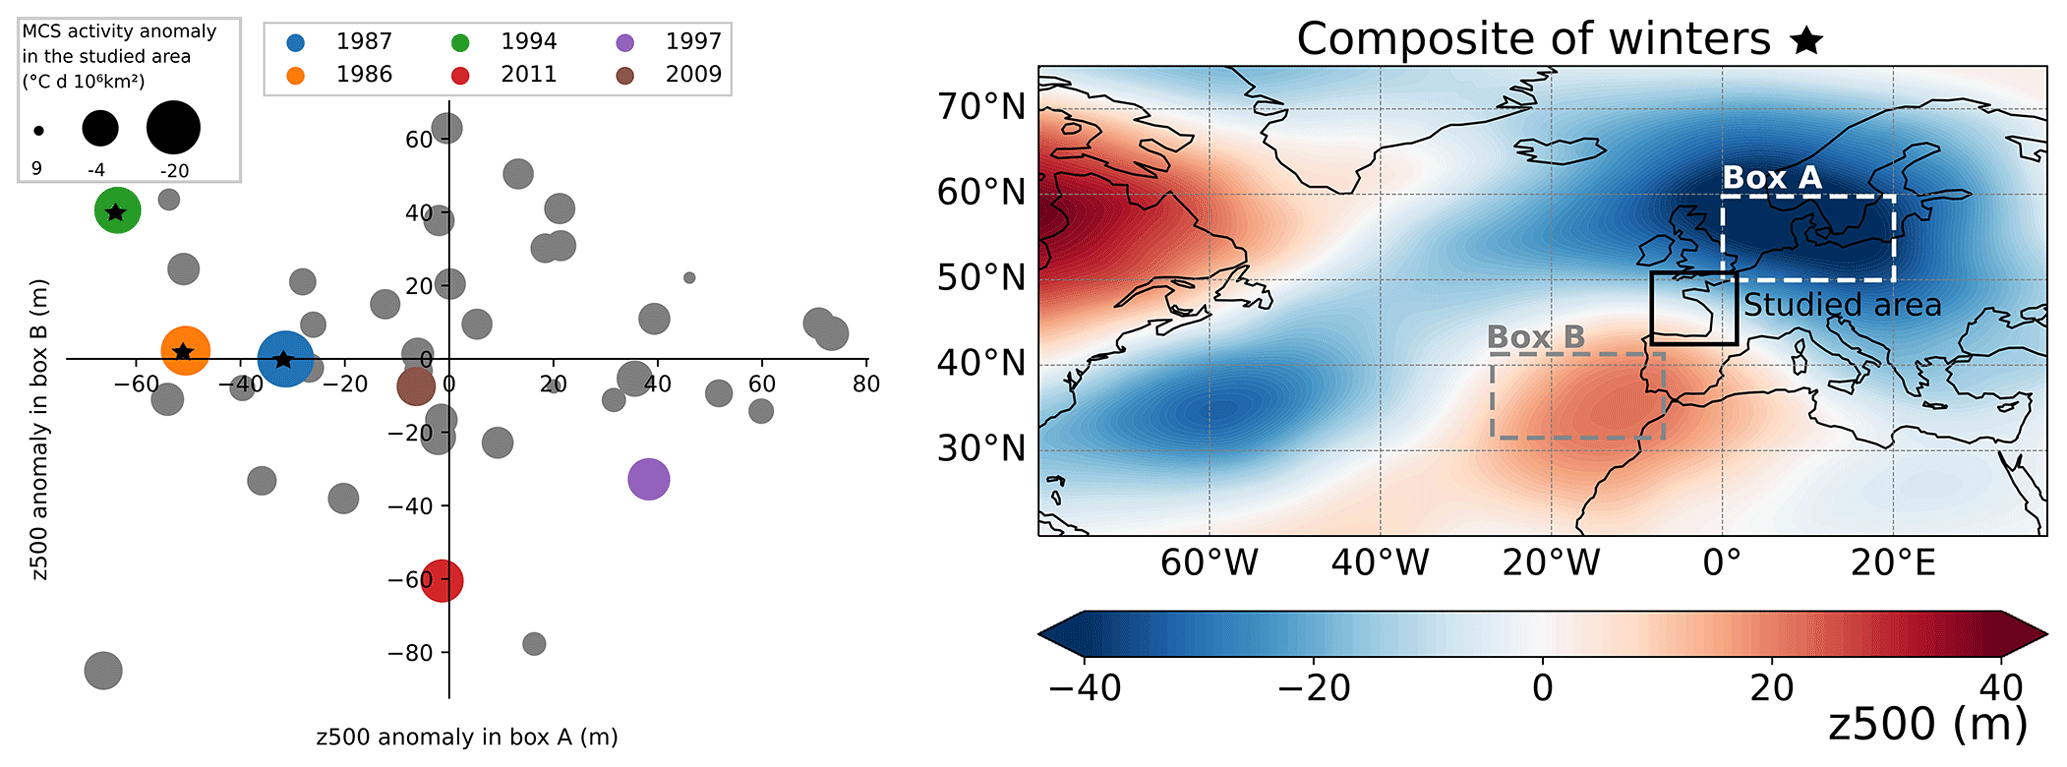
Figure 9Same as Fig. 8 but for MCSs in winter (DJFM). MCS anomalies are calculated with respect to the third-order trend (dashed blue curve in Fig. 5a). Markers are in color when this value is below −4 , and stars are indicated when markers in color are in the upper-left section of the graph.
Regarding MCSs, the three highest detrended MCS activities are winter 1987 (−20 ), 1986 (−13 ) and 1994 (−10 ; Fig. 9). These three most active winters are in the same “cluster”, with anomalous 500 hPa geopotential height negative over northern Europe and positive west of the Iberian Peninsula. A composite of the anomalous geopotential height at 500 hPa for these three winters shows in the northern Atlantic–European sector a broad and strong low in northern Europe, a weaker low-pressure system sitting in the northwestern Atlantic, and two highs off the Iberian Peninsula and over the Hudson Bay. This analysis suggests that extreme MCSs in the northeastern Atlantic might be closely associated with a low over northern Europe and a high off the Iberian Peninsula. By performing this analysis with SST instead of the MCS activity (Fig. S10 in the Supplement), the results are sparse, showing only winter 1986 as having a strong anomalous cold SST linked to an anomalous geopotential height at 500 hPa over northern Europe and positive west of the Iberian Peninsula.
When comparing the anomalous geopotential height conditions for the most intense summer MHWs and winter MCSs, we see that the geopotential height conditions are opposite, although the amplitude is stronger for winter, consistent with stronger climatology (Folland et al., 2009). However, while summer MHWs are associated with a positive summer NAO, winter MCSs are not associated with a negative winter NAO pattern.
To investigate potential drivers of these events, we have considered the different components of air–sea heat flux anomalies concomitant with MHWs and MCSs. For the eight most severe interannual summer MHWs (see marker in color Fig. 8) and the six most severe interannual winter MCSs (see marker in color Fig. 9), the anomalous (i) shortwave radiation flux, (ii) surface net longwave radiation flux, (iii) surface sensible heat flux and (iv) latent heat flux are depicted, respectively, in Figs. S11 and S12 in the Supplement. The interannual (or detrended) summer MHWs are predominantly driven by high shortwave radiation flux, except for years 1983 and 1997, which only show an important positive downward latent heat flux. The other air–sea fluxes make a smaller contribution. The interannual winter MCSs seem to be mostly driven by high sensible heat flux and low shortwave radiation flux. This suggests that, in this region, a decrease in cloud cover is a key parameter for the generation of summer MHWs, while strong winds and an increase in cloud cover are important for the apparition of winter MCSs. Further analysis needs to be done to quantitatively attribute the contribution of each air–sea heat flux component.
In the northeastern Atlantic, an increase in the MHW activity and a decrease in MCS activity were observed. Interannual changes confirm that general large-scale trends (Oliver et al., 2018; Schlegel et al., 2021) are also observed in regions where the coastal hydrodynamics could limit the impact due to active vertical mixing processes (e.g., barotropic and internal tides, wind-driven mixing in shallow waters).
The most active summer MHWs analyzed over the northeastern Atlantic and in the period 1982–2022 occurred in the Bay of Biscay (2018), and the most active winter MCSs occurred in the English Channel (1987). This is consistent with Schlegel et al. (2021), who found that the maximum intensity of MHWs dominates MCSs in the Bay of Biscay and vice versa in the English Channel. Along the coasts, the maximum of MHW activity is detected in 2022 in the English Channel, which might be related to the summer European heatwaves recorded (ECMWF, 2022; Savu, 2022; Guinaldo et al., 2023).
In the Bay of Biscay, we see a linear warming rate in summer since the beginning of the studied period. This is in accordance with DeCastro et al. (2009), who show a steady linear warming rate since the 1970s, based on data from 1854–2006. Mean SST together with the SST variance increase may explain the increase in MHWs. This increase in MHWs is consistent with Izquierdo et al. (2022a), who determined more precisely an equal contribution of each of these two factors for the southern coast of the Bay of Biscay. This is specific to this region (as well as for the Bay of Brest and the English Channel), as for most of the other regions of the world, the mean warming and not the SST variability changes contributes to the increase in MHW features (Alexander et al., 2018; Oliver et al., 2021). In addition, we found a positive trend for the MHW activity parameter using both satellite data and the four buoys in the Bay of Biscay and for the duration and occurrence using satellite data. The trends are quasi-similar considering only the two buoys on the southern coast of the Bay of Biscay (GIJO and BILB) and the two on the western coast of the Bay of Biscay (ARCA and MOLI; not shown) and are marked by the high activity present in the more recent summers. This evolution in the occurrence and duration of MHWs was not seen in Izquierdo et al. (2022b) using two buoys in the southern coastal Bay of Biscay over the period 1998–2018, which could be explained by local processes or the studied season (March to August).
The results from in situ and satellite datasets for each of the studied regions are quite in agreement, although the satellite underestimates the amplitude of activity for both MHWs and MCSs. Conversely, Izquierdo et al. (2022a) found an overestimation of the MHWs using satellites compared to in situ data in the coastal upwelling region south of the Bay of Biscay, which might be related to local processes. The satellite's coarse resolution mostly (i) smoothes small-scale and short events and (ii) interpolates with offshore regions, having greater thermal inertia (Marin et al., 2021), which can lead to the overestimation of the duration of events and the underestimation of the intensity. However, we show that coastal in situ stations distributed along the northeastern Atlantic coasts allow for the detection of large-scale evolutions of MHW and MCS activity. Analyzed locally, they can also inform about evolutions related to local hydrodynamics.
Internal variability in winter MCSs is related to low pressure over northern Europe and high pressure west of the Iberian Peninsula for three (1987, 1986 and 1994) out of the six most intense events. Among other strong interannual MCSs, winter 2011 does not present this pattern but could have been generated by a cold-air outbreak brought by a ridge over Greenland (Norris et al., 2013). A relation at an interannual timescale could exist between MCSs (Fig. 7, top right) and extreme low-salinity events (Poppeschi et al., 2021) in winter in the Bay of Brest, as, using the same in situ buoys (COAST-HF Iroise from 2000–2018), two out of the four most severe low-salinity events are concomitant with MCSs (winter 2001 and 2007). These extreme events could be both influenced by intense mid-latitude depressions, but river discharges are also an important driver in this region. Unlike MHWs (Fig. 2), extremely cold conditions occurred several winters in a row: three in 2009–2011 and two in 1986–1987. This might be explained by the re-emergence of cold water originating from the previous winter, as for the 2013–2016 northern Atlantic cold blob (Duchez et al., 2016a; Josey et al., 2018; Schlegel et al., 2021).
Summer 2018 presents the most active MHWs in the northeastern Atlantic for the period 1982–2022, consistent with the reported warmer SST the same summer (+1 to +3 ∘C above the long-term climatology) in the proximity of the United Kingdom (McCarthy et al., 2019). Over land, this summer was also recorded as the hottest in the United Kingdom since 1884 (McCarthy et al., 2019) and one of the hottest over northwestern Europe (Met Office, 2018; Météo-France, 2018). On top of the underlying warming climate forcing (Vogel et al., 2019; Yiou et al., 2020), these extreme continental warm conditions in 2018 have been previously reported as a consequence of the positive summer NAO anomalies combined with elevated SST (McCarthy et al., 2019) or combined with stationary Rossby waves in synoptic anomalies (Drouard et al., 2019; Kornhuber et al., 2019). More generally, the positive phase of the summer NAO is associated with warm anomalies from the west of the United Kingdom to the Baltic (Folland et al., 2009). Our findings for MHWs corroborate the continental counterpart as extremely warm conditions in the Bay of Biscay and the English Channel are likely associated with positive summer NAO, consistent with the result of Holbrook et al. (2019).
Depending on the region and the event, MHWs can be associated with anomalous air–sea heat fluxes which can include high shortwave fluxes, due to less cloud cover and greater insolation, high sensible heat fluxes when the surface air is warm, and/or low latent heat loss from the ocean due to weak winds (Oliver et al., 2021). In the English Channel and the Bay of Biscay, Guinaldo et al. (2023) linked summer 2022 sea-surface temperature to abnormally high shortwave radiation in the Bay of Biscay and English Channel. In this study, a similar conclusion is found by considering the eight most severe interannual MHWs in the northeastern Atlantic (which includes the English Channel and the Bay of Biscay and summer 2022). Abnormally high shortwave radiation is likely associated with reduced cloudiness, and Folland et al. (2009) have found that during the positive index phase of the summer NAO, northwestern Europe experiences significantly reduced cloudiness. This is consistent with our suggestion that the positive phase of the summer NAO favors the generation of summer MHWs in the northeastern Atlantic through reduced cloudiness. MCSs in the English Channel are associated with high sensible heat fluxes, consistent with reported MCSs often driven by strong winds in shallow waters, enabling a rapid cooling of the surface water (Crisp, 1964; Schlegel et al., 2021). We also found a possible role of weaker shortwave radiation, which might be related to increased cloud coverage.
In the future and under increasing greenhouse gas concentrations, climate models predict a continued warming of the ocean surface in the Bay of Biscay and the English Channel (Fox-Kemper et al., 2021) and a trend toward a positive summer NAO pattern (Faranda et al., 2019). Both of these effects imply the long-term likelihood of increased MHWs in the northeastern Atlantic, but the extent of the long-term and the interannual variability in the contributions remains to be shown. Also, the role of large-scale ocean circulation features, such as the shelf edge current (Alheit et al., 2019) or Iberian Poleward Current (Charria et al., 2013) and upper-ocean preconditioning (Josey et al., 2018), and the importance of remote large-scale climate modes of variability, such as the Indian Ocean Dipole (Holbrook et al., 2019), in amplifying or suppressing MHW occurrences in the Bay of Biscay and English Channel would need specific investigation. Along the coasts, the role of main river inflow at the land–sea continuum can also lead to specific answers on the coastal ocean to future climate evolutions.
The activity index, a combination of the properties of marine extreme events, shows a positive trend for summer MHWs in the northeastern Atlantic (since 2000 and more pronounced since 2010) and in the three subregions, the English Channel, the Bay of Brest and the Bay of Biscay, for both in situ and satellite data. This is explained by an increase in both the mean and variance of SST. Conversely, a decrease in MCS activity was detected, with almost no events after 2000, more clearly shown with the satellite data due to the longer time series (40 years) compared with the in situ data (20 to 30 years). These changes are fast for the three subregions, with the English Channel being the subregion with the most drastic growth.
In the northeastern Atlantic, MHWs are more frequent and longer and extend over larger areas, while the opposite is seen for MCSs. For both MHWs and MCSs, the mean intensity shows only weak changes over the last 4 decades.
Moreover, we found that the satellite dataset used is in good accordance with in situ data in the northeastern Atlantic, except for the fact that satellites underestimate the amplitude of both hot summer and cold winter marine extreme events in the coastal areas. The implemented in situ stations appear to be a well-designed observing system to detect the long-term evolution of MHW and MCS activity and to document local features related to coastal hydrodynamics.
MHW activity is particularly high in 2018 and 2022 through two different situations. The year 2018 is characterized by a large extent of MHWs in the Bay of Biscay with long events in the south of the bay and intense events over the Armorican shelf. Summer 2022 features long MHWs mainly in the English Channel. MCS activity is the highest in 1986 and 1987 due to long and intense events in the English Channel.
Our findings show that summers with strong MHW activity due to internal variability (after removing the trend) in the northeastern Atlantic have often been associated with a ridge over the North Sea and a trough west of the Iberian Peninsula; the opposite situation is seen for MCSs. In the case of MHWs, the wide atmospheric pattern resembles the positive phase of the summer NAO. This preliminary analysis of air–sea heat fluxes suggests that in the northeastern Atlantic interannual (or detrended) summer MHWs are predominantly driven by high shortwave radiation flux and interannual winter MCSs are driven by high sensible heat flux and low shortwave radiation. This suggests that, in this region, decreased cloud cover is a key parameter for the generation of summer MHWs, while strong winds and increased cloud cover are important for the apparition of winter MCSs. We caution the reader that the proposed connection does not necessarily indicate causal links but that these relations can provide indications of drivers.
Despite contrasting hydrodynamical regimes (mesotidal and macrotidal) and circulation (shallow water under freshwater influence, shelf circulation, active submesoscale), the northeastern Atlantic region displays similar changes in MHW and MCS activity between coastal and open-ocean regions. Those changes need to be anticipated to mitigate the impacts on coastal ecosystems.
All datasets included in the present study are accessible from the following publicly available repositories. Satellite dataset OISST is available on ftp://ftp2.psl.noaa.gov/Datasets/noaa.oisst.v2.highres/, last access: 24 January 2023 and ERA5 reanalyses on https://www.ecmwf.int/en/forecasts/dataset/ecmwf-reanalysis-v5, last access: 25 August 2023. Buoy in situ datasets are available on http://data.coriolis-cotier.org, last access: 2 January 2023 for COAST-HF data, https://www.westernchannelobservatory.org.uk, last access: 4 April 2023 for the Western Channel Observatory, and https://emodnet.ec.europa.eu, last access: 2 January 2023 for other datasets.
The supplement related to this article is available online at: https://doi.org/10.5194/os-19-1339-2023-supplement.
All authors contributed to the conception and design of the study. AS performed the calculations and designed the figures involving the satellite dataset, and GC and CP did so for the in situ dataset. All authors contributed to the discussion, writing and review of the manuscript.
The contact author has declared that none of the authors has any competing interests.
Publisher's note: Copernicus Publications remains neutral with regard to jurisdictional claims in published maps and institutional affiliations.
We thank Oregan Segalen for fruitful discussions. We thank Tim Smyth for providing data from the Western Channel Observatory. We acknowledge the COAST-HF (http://www.coast-hf.fr, last access: 2 January 2023) national observing network component of the ILICO national research infrastructure. Additionally, we express our gratitude to the two reviewers and editor for their valuable feedback, which has greatly contributed to improving the quality of our work. Coline Poppeschi and Guillaume Charria acknowledge the support of the regional project (Contrat de Plan État-Région) ObsOcean/ROEC-ILICO and the regional COXTCLIM project funded by the Loire-Brittany Water Agency, the region of Brittany and Ifremer.
This research has been supported by the Fundação para a Ciência e a Tecnologia, I.P./MCTES, through national funds (PIDDAC; grant no. UIDB/50019/2020) to Instituto Dom Luiz and through project ROADMAP (grant no. JPIOCEANS/0001/2019).
This paper was edited by Bernadette Sloyan and reviewed by two anonymous referees.
Alexander, M. A., Scott, J. D., Friedland, K. D., Mills, K. E., Nye, J. A., Pershing, A. J., and Thomas, A. C.: Projected sea surface temperatures over the 21st century: Changes in the mean, variability and extremes for large marine ecosystem regions of Northern Oceans, Elementa: Science of the Anthropocene, 6, https://doi.org/10.1525/elementa.191, 2018.
Alheit, J., Gröger, J., Licandro, P., McQuinn, I. H., Pohlmann, T., and Tsikliras, A. C.: What happened in the mid-1990s? The coupled ocean-atmosphere processes behind climate-induced ecosystem changes in the Northeast Atlantic and the Mediterranean, Deep-Sea Res. Pt. II, 159, 130–142, https://doi.org/10.1016/j.dsr2.2018.11.011, 2019.
Barnston, A. G. and Livezey, R. E.: Classification, seasonality and persistence of low-frequency atmospheric circulation patterns, Mon. Weather Rev., 115, 1083–1126, https://doi.org/10.1175/1520-0493(1987)115<1083:CSAPOL>2.0.CO;2, 1987.
Brown Ross, A., Lilley, M. K. S., Shutler, J., Widdicombe, C., Rooks, P., McEvoy, A., Torres, R., Artioli, Y., Rawle, G., Homyard, J., Tyler, C. R., and Lowe, C.: Harmful Algal Blooms and their impacts on shellfish mariculture follow regionally distinct patterns of water circulation in the western English Channel during the 2018 heatwave, Harmful Algae, 111, 102166, https://doi.org/10.1016/j.hal.2021.102166, 2022.
Charria, G., Lazure, P., Le Cann, B., Serpette, A., Reverdin, G., Louazel, S., Batifoulier, F., Dumas, F., Pichon, A., and Morel, Y.: Surface layer circulation derived from Lagrangian drifters in the Bay of Biscay, J. Marine Syst., 109, 60–76, https://doi.org/10.1016/j.jmarsys.2011.09.015, 2013.
Chust, G., Borja, Á., Caballero, A., Irigoien, X., Sáenz, J., Moncho, R., Marcos, M., Liria, P., Hidalgo, J., Valle, M., and Valencia, V.: Climate change impacts on coastal and pelagic environments in the southeastern Bay of Biscay, Clim. Res., 48, 307–332, https://doi.org/10.3354/cr00914, 2011.
Crisp, D. J.: The Effects of the Severe Winter of 1962–63 on Marine Life in Britain, J. Anim. Ecol., 33, 165–210, https://www.jstor.org/stable/2355 (last access: 20 January 2022), 1964.
Darmaraki, S., Somot, S., Sevault, F., and Nabat, P.: Past Variability of Mediterranean Sea Marine Heatwaves, Geophys. Res. Lett., 46, 9813–9823, https://doi.org/10.1029/2019GL082933, 2019.
DeCastro, M., Gómez-Gesteira, M., Alvarez, I., and Gesteira, J. L. G.: Present warming within the context of cooling–warming cycles observed since 1854 in the Bay of Biscay, Cont. Shelf Res., 29, 1053–1059, https://doi.org/10.1016/j.csr.2008.11.016, 2009.
Deser, C., Alexander, M. A., Xie, S. P., and Phillips, A. S.: Sea surface temperature variability: Patterns and mechanisms, Annu. Rev. Mar. Sci., 2, 115–143, 2010.
Drouard, M., Kornhuber, K., and Woollings, T.: Disentangling dynamic contributions to summer 2018 anomalous weather over Europe, Geophys. Res. Lett., 46, 12537–12546, https://doi.org/10.1029/2019GL084601, 2019.
Duchez, A., Frajka-Williams, E., Josey, S. A., Evans, D. G., Grist, J. P., Marsh, R., McCarthy, G. D., Sinha, B., Inglis Berry, D., and Hirschi, J. J.: Drivers of exceptionally cold North Atlantic Ocean temperatures and their link to the 2015 European heat wave, Environ. Res. Lett., 11, 074004, https://doi.org/10.1088/1748-9326/11/7/074004, 2016.
ECMWF: Update on European heatwave of July 2022, ecmwf, https://www.ecmwf.int/en/about/media-centre/focus/2022/update-european-heatwave-july-2022 (last access: 25 August 2023), 2022.
Faranda, D., Alvarez-Castro, M. C., Messori, G., Rodrigues, D., and Yiou, P.: The hammam effect or how a warm ocean enhances large scale atmospheric predictability, Nat. Commun., 10, 1–7, https://doi.org/10.1038/s41467-019-09305-8, 2019.
Folland, C. K., Knight, J., Linderholm, H. W., Fereday, D., Ineson, S., and Hurrell, J. W.: The summer North Atlantic Oscillation: past, present, and future, J. Climate, 22, 1082–1103, 2009.
Fox-Kemper, B., Hewitt, H. T., Xiao, C. , Aðalgeirsdóttir, G., Drijfhout, S. S., Edwards, T. L., Golledge, N. R., Hemer, M., Kopp, R. E., Krinner, G., Mix, A., Notz, D., Nowicki, S., Nurhati, I. S., Ruiz, L., Sallée, J.-B., Slangen, A. B. A., and Yu, Y.: Ocean, Cryosphere and Sea Level Change, in: Climate Change 2021: The Physical Science Basis. Contribution of Working Group I to the Sixth Assessment Report of the Intergovernmental Panel on Climate Change, edited by: Masson-Delmotte, V., Zhai, P., Pirani, A., Connors, S. L., Péan, C., Berger, S., Caud, N., Chen, Y., Goldfarb, L., Gomis, M. I., Huang, M., Leitzell, K., Lonnoy, E., Matthews, J. B. R. , Maycock, T. K., Waterfield, T., Yelekçi, O., Yu, R., and Zhou, B., Cambridge University Press, Cambridge, United Kingdom and New York, NY, USA, 1211–1362, https://doi.org/10.1017/9781009157896.011, 2021.
Frölicher, T. and Laufkötter, C.: Emerging risks from marine heat waves, Nat. Commun., 9, 2015–2018, https://doi.org/10.1038/s41467-018-03163-6 , 2018.
Frölicher, T. L., Fischer, E. M., and Gruber, N.: Marine heatwaves under global warming, Nature, 560, 360–364, https://doi.org/10.1038/s41586-018-0383-9, 2018.
Gómez, F. and Souissi, S.: The impact of the 2003 summer heat wave and the 2005 late cold wave on the phytoplankton in the north-eastern English Channel, C. R. Biol., 331, 678–685, https://doi.org/10.1016/j.crvi.2008.06.005, 2008.
Guinaldo, T., Saux Picart, S., and Roquet, H.: Response of the sea surface temperature to heatwaves during the France 2022 meteorological summer, EGUsphere [preprint], https://doi.org/10.5194/egusphere-2022-1119, 2022.
Guo, X., Gao, Y., Zhang, S., Wu, L., Chang, P., Cai, W., Zscheischler, J., Ruby Leung, L., Small, J., Danabasoglu, G., Thompson, L., and Gao, H.: Threat by marine heatwaves to adaptive large marine ecosystems in an eddy-resolving model, Nat. Clim. Change, 12, 179–186, 2022.
Hersbach, H., Bell, B., Berrisford, P., Hirahara, S., Horányi, A., Muñoz-Sabater, J., Nicolas, J., Peubey, C., Radu, R., Schepers, D., Simmons, A., Soci, C., Abdalla, S., Abellan, X., Balsamo, G., Bechtold, P., Biavati, G., Bidlot, J., Bonavita, M., De Chiara, G., Dahlgren, P., Dee, D., Diamantakis, M., Dragani, R., Flemming, J., Forbes, R., Fuentes, M., Geer, A., Haimberger, L., Healy, S., Hogan, R. J., Hólm, E., Janisková, M., Keeley, S., Laloyaux, P., Lopez, P., Lupu, C., Radnoti, G., de Rosnay, P., Rozum, I., Vamborg, F., Villaume, S., and Thépaut, J. N.: The ERA5 global reanalysis, Q. J. Roy. Meteor. Soc., 146, https://doi.org/10.1002/qj.3803, 1999–2049, 2020.
Hobday, A. J., Alexander, L. V., Perkins, S. E., Smale, D. A., Straub, S. C., Oliver, E. C. J., Benthuysen, J. A., Burrows, M. T., Donat, M. G., Feng, M., Holbrook, N. J., Moore, P. J., Scannell, H. A., Sen Gupta, A., and Wernberg, T.:. A hierarchical approach to defining marine heatwaves, Prog. Oceanogr., 141, 227–238, https://doi.org/10.1016/j.pocean.2015.12.014, 2016.
Holbrook, N. J., Scannell, H. A., Sen Gupta, A., Benthuysen, J. A., Feng, M., Oliver, E. C., Alexander, L., Burrows, M., Donat, M., Hobday, A., Moore, P., Perkins-Kirkpatrick, S., Smale, D., Straub, S., and Wernberg, T.: A global assessment of marine heatwaves and their drivers, Nat. Commun., 10, 1–13, https://doi.org/10.1038/s41467-019-10206-z, 2019.
Huang, B., Liu, C., Banzon, V., Freeman, E., Graham, G., Hankins, B., Smith, T., and Zhang, H.-M.: Improvements of the Daily Optimum Interpolation Sea Surface Temperature (DOISST) Version 2.1, J. Climate, 34, 2923–2939, https://doi.org/10.1175/JCLI-D-20-0166.1, 2020.
Hurrell, J. W., Kushnir, Y., Ottersen, G., and Visbeck, M.: An overview of the North Atlantic oscillation, in: Geophysical Monograph Series, edited by: Geophysical Monograph Series, American Geophysical Union, 134, 1–36, https://doi.org/10.1029/134GM01, 2003.
Izquierdo, P., Rico, J. M., Taboada, F. G., González-Gil, R., and Arrontes, J.: Characterization of marine heatwaves in the Cantabrian Sea, SW Bay of Biscay, Estuar. Coast. Shelf S., 274, https://doi.org/10.1016/j.ecss.2022.107923, 2022a.
Izquierdo, P., Taboada, F. G., González-Gil, R., Arrontes, J., and Rico, J. M.: Alongshore upwelling modulates the intensity of marine heatwaves in a temperate coastal sea, Sci. Total Environ., 835, 155478, https://doi.org/10.1016/j.scitotenv.2022.155478, 2022b.
Joint, I. and Smale, D. A.: Marine heatwaves and optimal temperatures for microbial assemblage activity, FEMS Microbiol. Ecol., 93, 1–9, https://doi.org/10.1093/femsec/fiw243, 2017.
Josey, S. A., Hirschi, J.-M., Sinha, B., Duchez, A., Grist, J. P., Marsh, R.: The recent Atlantic cold anomaly: Causes, consequences, and related phenomena, Annu. Rev. Mar. Sci., 10 , 475–501, 2018.
Kornhuber, K., Osprey, S., Coumou, D., Petri, S., Petoukhov, V., Rahmstorf, S., and Gray, L.: Extreme weather events in early summer 2018 connected by a recurrent hemispheric wave-7 pattern, Environ. Res. Lett., 14, 054002, https://doi.org/10.1088/1748-9326/ab13bf, 2019.
Le Boyer, A., Cambon, G., Daniault, N., Herbette, S., Le Cann, B., Marie, L., and Morin, P.: Observations of the Ushant tidal front in September 2007, Cont. Shelf Res., 29, 1026–1037, 2009.
Lima, F. P. and Wethey, D. S.: Three decades of high-resolution coastal sea surface temperatures reveal more than warming, Nat. Commun., 3, 704, 2012.
Lorenzo, M. N., Taboada, J. J., and Gimeno, L.: Links between circulation weather types and teleconnection patterns and their influence on precipitation patterns in Galicia (NW Spain), Int. J. Climatol., 28, 1493–1505, https://doi.org/10.1002/joc.1646, 2008.
Marin, M., Feng, M., Phillips, H. E., and Bindoff, N. L.: A global, multiproduct analysis of coastal marine heatwaves: Distribution, characteristics, and long-term trends, J. Geophys. Res.-Oceans, 126, e2020JC016708, https://doi.org/10.1029/2020JC016708, 2021.
McCarthy, M., Christidis, N., Dunstone, N., Fereday, D., Kay, G., Klein-Tank, A., Lowe, J., Petch, J., Scaife, A., and Stott, P.: Drivers of the UK summer heatwave of 2018, Weather, 74, 390–396, https://doi.org/10.1002/wea.3628, 2019.
Met Office: Summer 2018, Met Office, https://www.metoffice.gov.uk/binaries/content/assets/metofficegovuk/pdf/weather/learn-about/uk-past-events/interesting/2018/summer-2018---met-office.pdf (last access: 7 July 2023), 2018.
Météo-France: Bilan climatique de l'été 2018, Météo-France, https://meteofrance.fr/sites/meteofrance.fr/files/files/editorial/Bilan-climatique-annee2018.pdf (last access: 7 July 2023), 2018.
Mieszkowska, N., Burrows, M., and Sugden, H.: Impacts of climate change on intertidal habitats, relevant to the coastal and marine environment around the UK, MCCIP Science Review, 2020, 256–271, https://doi.org/10.14465/2020.arc12.ith, 2020.
Müller, H., Blanke, B., Dumas, F., and Mariette, V.: Identification of typical scenarios for the surface Lagrangian residual circulation in the Iroise Sea. J. Geophys. Res.-Oceans, 115, C7, https://doi.org/10.1029/2009JC005834, 2010.
Norris, J., Vaughan, G., and Schultz, D. M.: Snowbands over the English Channel and Irish Sea during cold-air outbreaks, Q. J. Roy. Meteor. Soc., 139, 1747–1761, https://doi.org/10.1002/qj.2079, 2013.
Oh, H., Kim, G. U., Chu, J. E., Lee, K., and Jeong, J. Y.: The record-breaking 2022 long-lasting marine heatwaves in the East China Sea, Environ. Res. Lett., 18, 064015, https://doi.org/10.1088/1748-9326/acd267, 2023.
Oliver, E. C., Donat, M. G., Burrows, M. T., Moore, P. J., Smale, D. A., Alexander, L. V., Benthuysen, J. A., Feng, M., Sen Gupta, A., Hobday, A. J., Holbrook, N. J., Perkins-Kirkpatrick, S. E., Scannell, H. A., Strauband, S. C., and Wernberg, T.: Longer and more frequent marine heatwaves over the past century, Nat. Commun., 9, 1–12, https://doi.org/10.1038/s41467-018-03732-9, 2018.
Oliver, E. C. J., Burrows, M. T., Donat, M. G., Sen Gupta, A., Alexander, L. V., Perkins-Kirkpatrick, S. E., Benthuysen, J. A., Hobday, A. J., Holbrook, N. J., Moore, P. J., Thomsen, M. S., Wernberg, T., and Smale, D. A.: Projected Marine Heatwaves in the 21st Century and the Potential for Ecological Impact, Frontiers in Marine Science, 6, 1–12, https://doi.org/10.3389/fmars.2019.00734, 2019.
Oliver, E. C., Benthuysen, J. A., Darmaraki, S., Donat, M. G., Hobday, A. J., Holbrook, N. J., Schlegel, R. W., and Sen Gupta, A.: Marine heatwaves, Ann. Rev. Mar. Sci., 13, 313–342, 2021.
Plecha, S. and Soares, P. M. M.: Global marine heatwave events using the new CMIP6 multi-model ensemble: from shortcomings in present climate to future projections, Environ. Res. Lett., 15, 124058, https://doi.org/10.1088/1748-9326/abc847, 2020.
Plecha, S. M., Soares, P. M. M., Silva-Fernandes, S. M., and Cabos, W.: On the uncertainty of future projections of Marine Heatwave events in the North Atlantic Ocean, Clim. Dynam., 56, 2027–2056, https://doi.org/10.1007/s00382-020-05529-3, 2021.
Poppeschi, C., Charria, G., Goberville, E., Rimmelin-Maury, P., Barrier, N., Petton, S., Unterberger, M., Grossteffan, E., Repecaud, M., Quemener, L., Theetten, S., Le Roux, J.-F., and Tréguer, P.: Unraveling salinity extreme events in coastal environments: A winter focus on the bay of brest, Frontiers in Marine Science, 8, 705403, https://doi.org/10.3389/fmars.2021.705403, 2021.
Poppeschi, C., Charria, G., Daniel, A., Verney, R., Rimmelin-Maury, P., Retho, M., Goberville, E., Grossteffan, E., and Plus, M.: Interannual variability of the initiation of the phytoplankton growing period in two French coastal ecosystems, Biogeosciences, 19, 5667–5687, https://doi.org/10.5194/bg-19-5667-2022, 2022.
Reynolds, R. W., Smith, T. M., Liu, C., Chelton, D. B., Casey, K. S., and Schlax, M. G.: Daily high-resolution-blended analyses for sea surface temperature, J. Climate, 20, 5473–5496, 2007.
Ruthrof, K. X., Breshears, D. D., Fontaine, J. B., Froend, R. H., Matusick, G., Kala, J., Miller, B. P., Mitchell, P. J., Wilson, S. K., van Keulen, M., Enright, N. J., Law, D. J., Wernberg, T., and Hardy, G. E. S. J.: Subcontinental heat wave triggers terrestrial and marine, multi-taxa responses, Sci. Rep.-UK, 8, 1–9, https://doi.org/10.1038/s41598-018-31236-5, 2018.
Savu, A.: Temperature Highs, Climate Change Salience, and Eco-Anxiety: Early Evidence from the 2022 United Kingdom Heatwave, SSRN, https://doi.org/10.2139/ssrn.4294843, 2022.
Seuront, L., Nicastro, K. R., Zardi, G. I., and Goberville, E.: Decreased thermal tolerance under recurrent heat stress conditions explains summer mass mortality of the blue mussel Mytilus edulis, Sci. Rep.-UK, 9, 1–14, https://doi.org/10.1038/s41598-019-53580-w, 2019.
Schlegel, R. W., Darmaraki, S., Benthuysen, J. A., Filbee-Dexter, K., and Oliver, E. C. J.: Marine cold-spells, Prog. Oceanogr., 198, 102684, https://doi.org/10.1016/j.pocean.2021.102684, 2021.
Simon, A., Plecha, S. M., Russo, A., Teles-Machado, A., Donat, M. G., Auger, P. A., and Trigo, R. M.: Hot and cold marine extreme events in the Mediterranean over the period 1982–2021, Frontiers in Marine Science, 9, 1–12, https://doi.org/10.3389/fmars.2022.892201, 2022.
Sims, D. W., Wearmouth, V. J., Genner, M. J., Southward, A. J., and Hawkins, S. J.: Low-temperature-driven early spawning migration of a temperate marine fish, J. Anim. Ecol., 73, 333–341, 2004.
Smale, D. A., Wernberg, T., Oliver, E. C. J., Thomsen, M., Harvey, B. P., Straub, S. C., Burrows, M. T., Alexander, L. V., Benthuysen, J. A., Donat, M. G., Feng, M., Hobday, A. J., Holbrook, N. J., Perkins-Kirkpatrick, S. E., Scannell, H. A., Sen Gupta, A., Payne, B. L., and Moore, P. J.: Marine heatwaves threaten global biodiversity and the provision of ecosystem services, Nat. Clim. Change, 9, 306–312, https://doi.org/10.1038/s41558-019-0412-1, 2019.
Wang, Y., Kajtar, J. B., Alexander, L. V., Pilo, G. S., and Holbrook, N. J.: Understanding the changing nature of marine cold-spells, Geophys. Res. Lett., 49, e2021GL097002, https://doi.org/10.1029/2021GL097002, 2022.
Wethey, D. S. and Woodin, S. A.: Climate change and Arenicola marina: Heat waves and the southern limit of an ecosystem engineer, Estuar. Coast. Shelf S., 276, 108015, https://doi.org/10.1016/j.ecss.2022.108015, 2022.
Wernberg, T., Bennett, S., Babcock, R. C., De Bettignies, T., Cure, K., Depczynski, M., Dufois, F., Fromont, J., Fulton, C. J., Hovey, R. K., Harvey, E. S., Holmes, T. H., Kendrick, G. A., Radford, B., Santana-Garcon, J., Saunders, B. J., Smale, D. A., Thomsen, M. S., Tuckett, C. A., Tuya, F., Vanderklift, M. A., and Wilson, S.: Climate-driven regime shift of a temperate marine ecosystem, Science, 353, 169–172, https://doi.org/10.1126/science.aad8745, 2016.
Vogel, M. M., Zscheischler, J., Wartenburger, R., Dee, D., and Seneviratne, S. I.: Concurrent 2018 hot extremes across Northern Hemisphere due to human-induced climate change, Earths Future, 7, 692–703, https://doi.org/10.1029/2019EF001189, 2019.
Yao, Y., Wang, C., and Fu, Y.: Global Marine Heatwaves and Cold-Spells in Present Climate to Future Projections, Earths Future, 10, e2022EF002787, https://doi.org/10.1029/2022EF002787, 2022.
Yiou, P., Cattiaux, J., Faranda, D., Kadygrov, N., Jézéquel, A., Naveau, P., Ribes, A., Robin, Y., Thao, S., Oldenborgh, G. J., and Vrac, M.: Analyses of the Northern European summer heatwave of 2018, B. Am. Meteorol. Soc., 101, S35-S40, https://doi.org/10.1175/BAMS-D-19-0170.1, 2020.