the Creative Commons Attribution 4.0 License.
the Creative Commons Attribution 4.0 License.
 | 06 Jul 2023
Consistent picture of the horizontal circulation of the Atlantic Ocean over 3 decades
Verónica Caínzos
M. Dolores Pérez-Hernández
Daniel Santana-Toscano
Cristina Arumí-Planas
Alonso Hernández-Guerra
The circulation in the Atlantic Ocean is marked by the complex system of pathways of the Atlantic Meridional Overturning Circulation (AMOC). These currents change meridionally due to the interaction with nearby water masses. Hydrographic data provide the opportunity to characterize these currents for the whole water column with high-resolution data over the last 30 years. Moreover, inverse methods enable the quantification of absolute zonal transports across these sections, determining the strength of each current at a certain latitude in terms of mass, heat, and freshwater, as well as their transport-weighted temperature and salinity. Generally, no changes can be found among decades for each of the currents in terms of transport or their properties. In the South Atlantic, the circulation describes the subtropical gyre affected by several recirculations. There are nearly 61 Sv entering from the Southern and Indian oceans at 45∘ S. The South Atlantic subtropical gyre exports 17.0 ± 1.2 Sv and around 1 PW northward via the North Brazil Current, as well as −55 Sv southward at 45∘ S into the Antarctic Circumpolar Current. In the North Atlantic, most of the transport is advected northward via the western boundary currents, which reduce their strength as they take part in convection processes in the subpolar North Atlantic, also reflected in the northward progress of mass and heat transport. Deep layers carry waters southward along the western boundary, maintaining similar values of mass and heat transport until the separation into an eastern branch crossing the mid-Atlantic Ridge in the South Atlantic. Abyssal waters originating in the Southern Ocean are distributed along the South Atlantic mainly through its western subbasin, flowing northward up to 24.5∘ N, subjected to an increasing trend in their temperature with time.
- Article
(15054 KB) - Full-text XML
- BibTeX
- EndNote


The Atlantic Ocean is connected by its meridional overturning circulation (AMOC), which can be considered two overturning cells that meet at deep layers. The upper cell consists of upper warm, saline waters that are transported northward, eventually get colder, fresher, and denser, and travel southward in deep layers. This cell is balanced by the lower cell of the AMOC, in which the southward deep layers are returned northward by the abyssal layers (Caínzos et al., 2022; Kersalé et al., 2020). This proves to be a remarkable characteristic of the Atlantic Ocean, since it maintains a net northward transport of heat across all latitudes, contrasting with the southward heat transport appearing in other oceans in the subtropical gyre of the Southern Hemisphere (Ganachaud and Wunsch, 2003; Jayne and Marotzke, 2001; Forget and Ferreira, 2019).
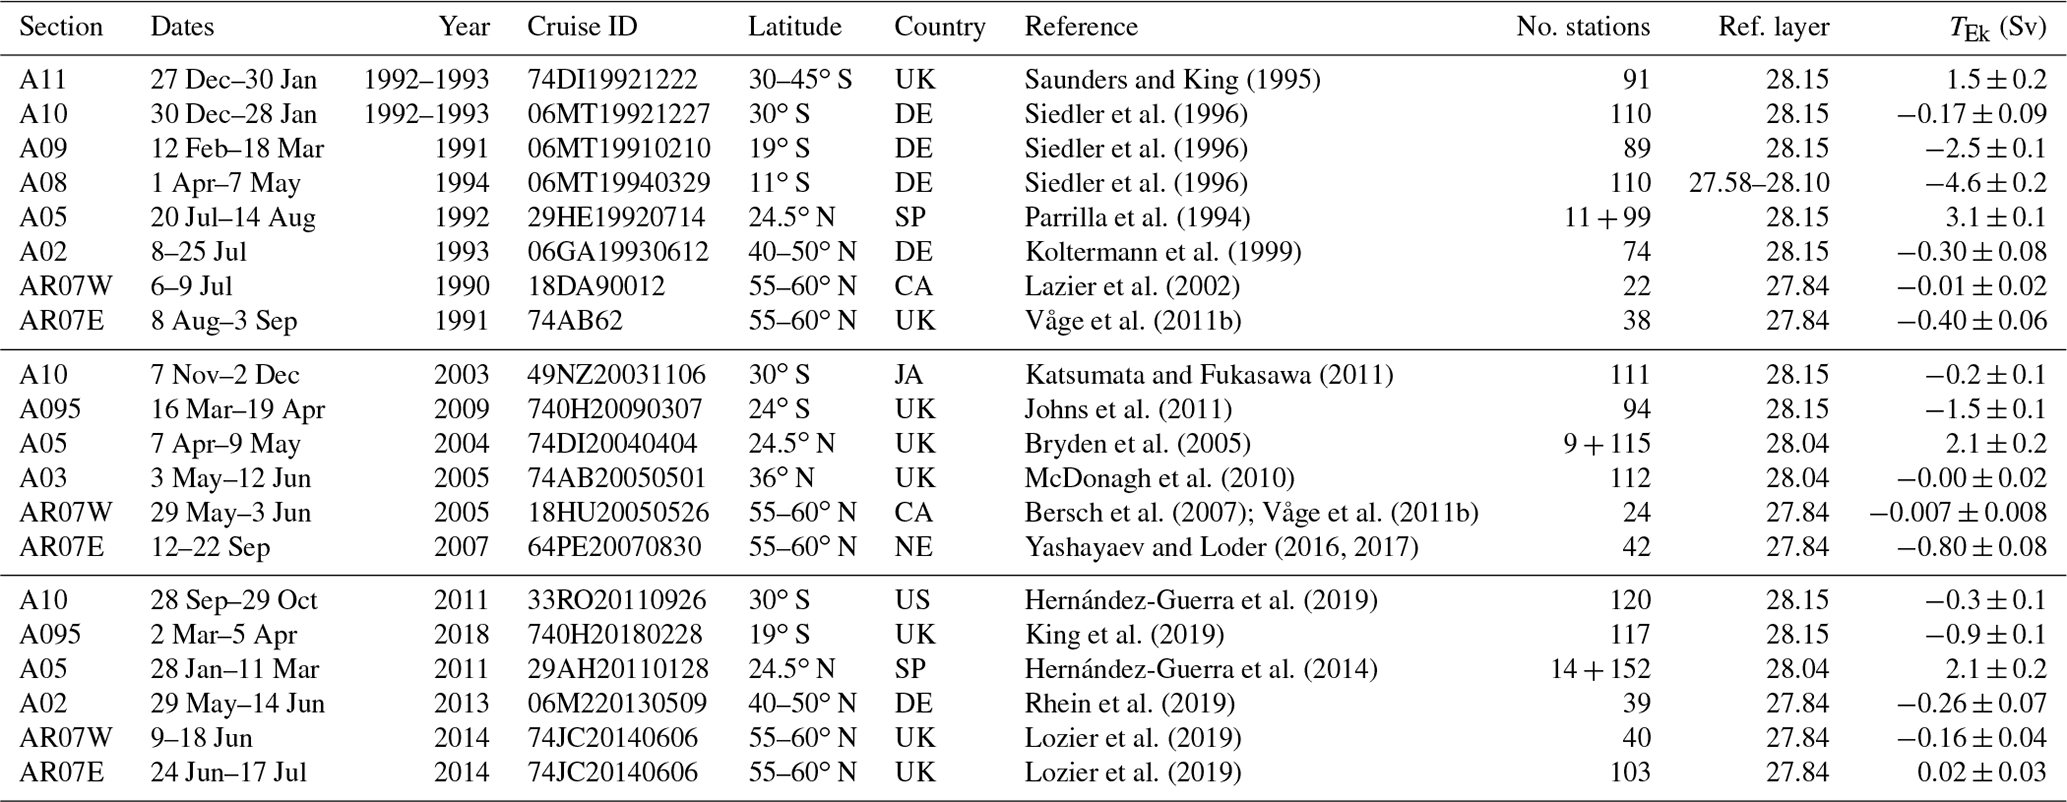
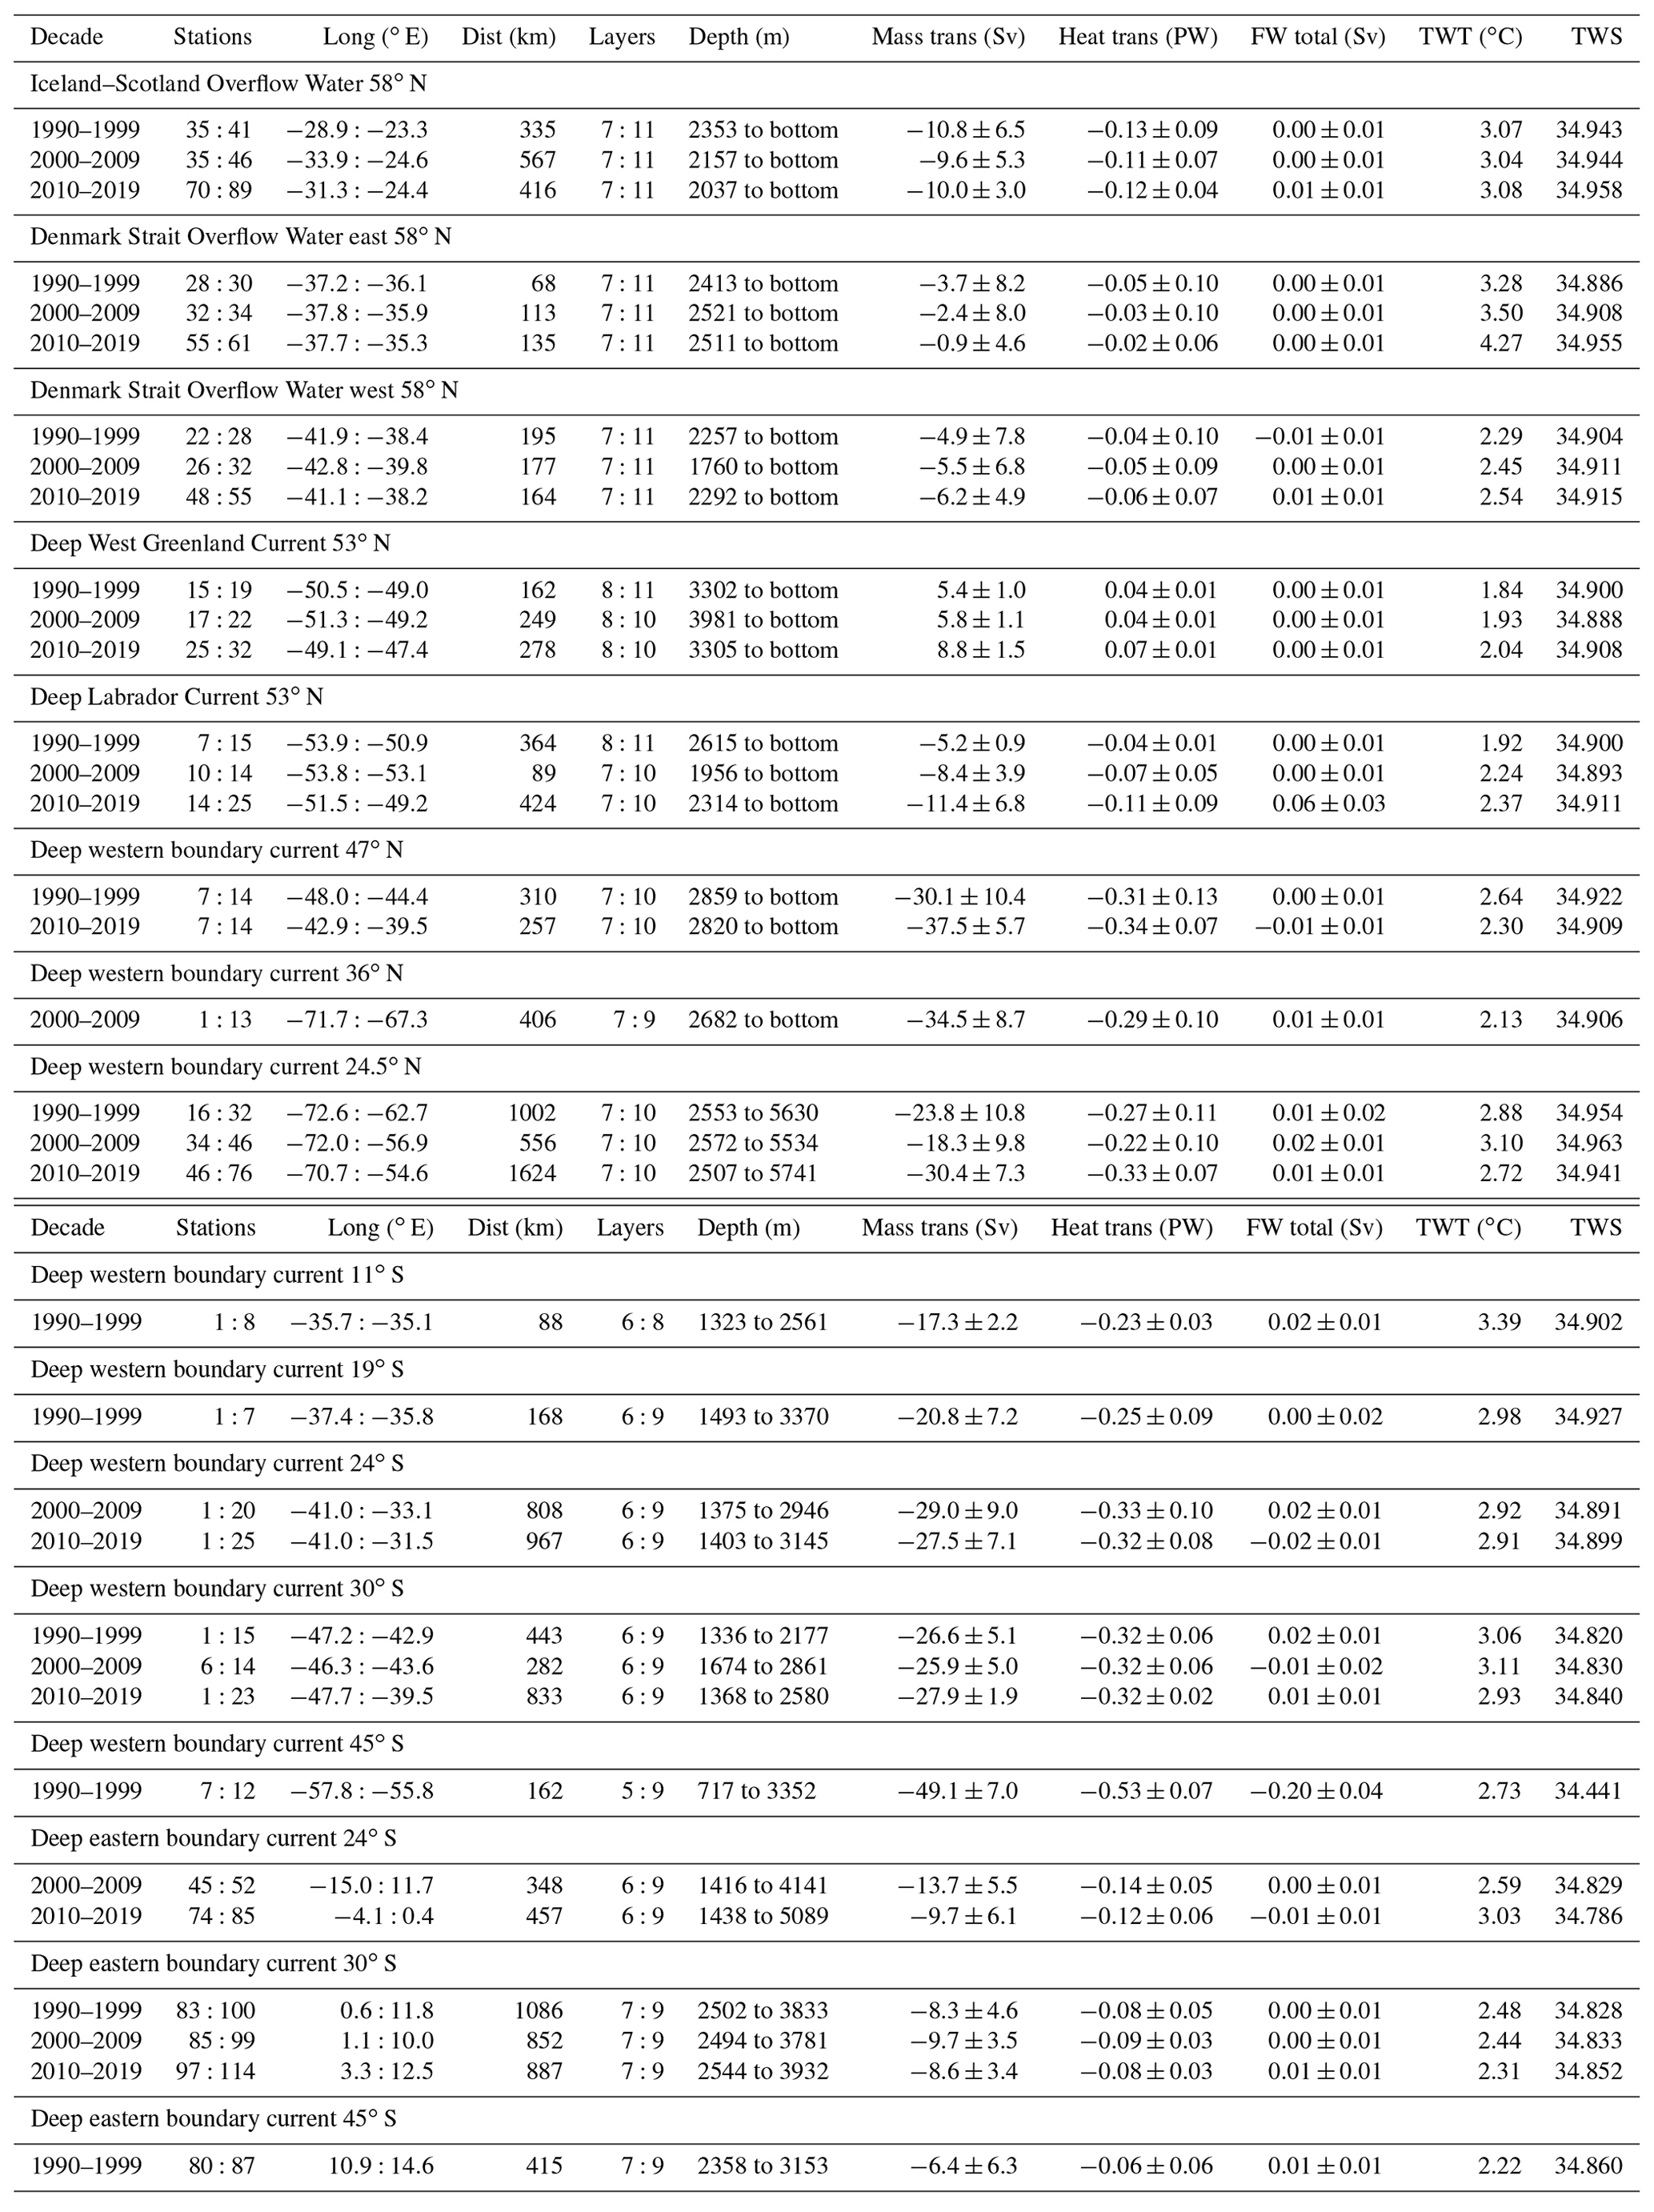
Table 1Zonal sections used for each decade, including the reference layer where no motion is assumed. The Ekman transport is computed for the time of the cruise using the corresponding wind stress NCEP–NCAR product.
The complex system of currents making up the AMOC has often been oversimplified, despite the multiple pathways connecting its different elements (Bower et al., 2019). Lagrangian studies have provided very useful insights on ocean currents, firstly on the surface and then for the full water column, mapping the spatial structure of the ocean circulation as they naturally drift (Bower et al., 2019; Davis et al., 1992). However, most of these measurements are currently limited to the topmost 2000 m since this is the maximum depth of the Argo profiles. In the future, deep Argo profilers could provide a continuous quantification of the ocean below 2000 m (Foppert et al., 2021; Johnson et al., 2015, 2019). Moreover, data from mooring arrays at key locations have provided continuous measurements over the last years and could be useful to quantify currents at these chosen latitudes (Lozier et al., 2017; Cunningham et al., 2007; Johns et al., 2011; Kanzow et al., 2006; Hummels et al., 2015; Meinen et al., 2013; Kersalé et al., 2020). A combination of these international arrays has evolved into synthetic observational time series of the AMOC (McCarthy et al., 2020). However, with the earlier starting date of these arrays being the 2000s, the time series are sometimes too short to study variability and lack the necessary spatial resolution to fully resolve the structure or variability of currents. Therefore, ship-based observing systems are the only current alternative to study the full water column of the ocean at periodic intervals that allow us to expand back into the 1990s.
Repeat hydrographic sections have been made available since the 1950s with the efforts of the International Geophysical Year. Near the end of the twentieth century, continuous basin-scale measurements were emphasized under the World Ocean Circulation Experiment (WOCE) and, later, the Global Ocean Ship-Based Hydrographic Investigations Program (GO-SHIP; Talley et al., 2016). Full-depth water column, high-resolution measurements of temperature and salinity enable the computation of geostrophic velocity for each hydrographic station pair relative to an assumed level of no motion. Inverse modelling provides a useful tool in computing the absolute geostrophic velocity (Wunsch, 1996). Moreover, it enables the estimation of meridional property transports from high-resolution hydrographic data, accompanied by uncertainties obtained along the inverse solutions (Ganachaud and Wunsch, 2003; Macdonald and Wunsch, 1996; Fu et al., 2020; Lumpkin and Speer, 2007).
Ganachaud and Wunsch (2000) have previously provided a globally consistent circulation scheme using WOCE sections for the global ocean using inverse modelling. Furthermore, they also described the regional aspects of that circulation (Ganachaud and Wunsch, 2003). Their suggested circulation in the Atlantic Ocean agrees with estimates from other global and regional studies spanning the previous 30 years. Their solutions rely on the assumption that large-scale quantities are close to the time mean. The remaining uncertainties are dominated by oceanic variability in the density and other properties, which mainly originated from a lack of measurements and large seasonality.
Caínzos et al. (2022) have published updated estimations of the AMOC, heat, and freshwater transports across the Atlantic Ocean using WOCE and GO-SHIP sections for the last 30 years. The solutions were obtained using inverse models, one for each of the last 3 decades – 1990–1999, 2000–2009, and 2010–2019. For that study, the authors focused on the possible changes of the AMOC at each latitude available in each model. The results show no changes in the AMOC for all sections analysed over the whole Atlantic for the last 30 years for mass, heat, or freshwater.
In this study, we will describe the horizontal circulation in each section and try to quantify the strength of surface, deep, and abyssal currents in the Atlantic Ocean as well as their changes over the last 3 decades. Additionally, we have also investigated the changes in heat and freshwater content as well as their transformation across latitudes. Throughout the text, we first describe the hydrographic data and the methodology applied to them in Sect. 2. We then describe the properties of the currents present for all latitudes in Sect. 3, dividing them into surface, deep, and bottom currents. These currents are discussed in this study following the direction of their flow, from their origin to their destination, to be able to compare how they might change on their way. However, the currents in the figures are depicted from north to south.
2.1 Hydrographic data
We have compiled zonal hydrographic sections for the last 3 decades (1990–1999, 2000–2009, 2010–2019) as part of WOCE and GO-SHIP. The selected sections span the whole Atlantic basin, from 45∘ S to 53∘ N + 58∘ N in the first decade and from 30∘ S to 53∘ N + 58∘ N for the last 2 decades (Fig. 1). Deviations of some stations from the nominal latitude appear mostly over the western and eastern boundaries and over the platform, correcting the track line to a perpendicular angle to the main current. Only three sections appear in all 3 decades: 30∘ S, 24.5∘ N and the northernmost sections (at an average latitude of 55∘ N) divided into the western (53∘ N) and eastern (58∘ N) basins. Table 1 summarizes the chosen sections and their characteristics, as well as the period when data were collected. Vertical sections for temperature and salinity for each cruise are available in the Supporting Information of Caínzos et al. (2022).
We have identified the main water masses in these sections and defined a reference level of no motion located at the interface between the southward-flowing North Atlantic Deep Water (NADW) and the northward Antarctic Bottom Water (AABW), following Caínzos et al. (2022), Hernández-Guerra et al. (2019), and McDonagh and King (2005). This neutral density (γn) reference layer is used in the thermal wind equation to estimate geostrophic velocities and transports. The value of the reference layer for each section is specified in Table 1. If any pair of stations fail to reach this value of neutral density, then the deepest common level is used instead of the reference layer. This usually happens over the continental slope, and the velocity in the triangular section below this level is taken to be constant and equal to the velocity at the lowest common level.
The water column is divided into 11 layers defined by isolines of the same neutral density selected according to the presence of different water masses (Hernández-Guerra et al., 2019; Talley, 2008). The Ekman transport is estimated using the National Center for Environmental Prediction and National Center for Atmospheric Research (NCEP–NCAR) surface winds. We compute the Ekman transport for the time of the cruise and include it in the first layer of each section. If outcropping is found at the surface, we measure the percentage of each layer at the surface and then associate these different weights with the Ekman transport for each outcropping layer.
2.2 Inverse model
Applying geostrophy to each pair of hydrographic stations, we obtain relative velocities referenced to a supposed level of no motion. However, in truth this reference level has a velocity different from zero. Inverse models have been widely used to determine the unknown geostrophic reference velocities for each hydrographic station pair. The most basic constraints applied to inverse models are based on the continuity equation in mass, heat, and/or salinity content (Wunsch, 1978, 1996). The inverse model equations are represented in matrix form as
where A is an M×N matrix, N is the total number of unknowns, M is the number of transport constraints (or equations), b is a column vector of length N containing the unknowns of the system, and n is a column vector of length M that includes the noise of each constraint. Y is a column vector of length M with the initial transports and externally imposed mass transports.
The inverse model used here is the same as in Caínzos et al. (2022). For each decade, the inverse model links boxes between adjacent sections from south to north. For a single box, we have conserved mass and salinity content. Mass is conserved for the whole box for all station pairs of both sections and considers the Ekman corrections for each section. Moreover, to define the continuity of mass transport for each single layer, conservation of each layer was imposed between the two sections, with Ekman correction in the outcropping layers. Regional constraints, based on direct current measurements and topographic features, are applied to each section, despite having different station pairs and neutral density layers affected. In addition to mass conservation, we have also constrained the salinity content of each single section. Using salinity allows for changes in freshwater across the section while still conserving mass. The system of unknowns includes the velocities at the reference level and the adjustment of the Ekman transport in the first layer. The same model configuration is used for each model so that differences in the model solution are attributable to changes in circulation. Further in-depth descriptions of the reference level, a priori estimates and uncertainties, and sensitivity tests applied to these inverse models appear in the Supporting Information of Caínzos et al. (2022).
The Gauss–Markov estimator is applied to solve this highly underdetermined system of equations (Wunsch, 1996) with a minimum error variance solution from the initial estimates of the unknowns – the velocities at the reference level (b) and the adjustments to the Ekman transport (ΔTEk). To solve it, we first need a priori estimates and uncertainties that give an initial approximation to the actual value. Despite obtaining similar results, this study provides smaller uncertainties than other global inverse solutions (Ganachaud, 2003a) and decadal studies (Fu et al., 2020). This was achieved by using physical constraints with a simpler model with only the velocities at the reference level and the Ekman adjustments as unknowns.
However, we have to be aware that there are some limitations associated with inverse modelling of hydrographic data, as inverse models with single-section snapshots are presumably subject to aliasing (Frajka-Williams et al., 2019; Wunsch and Heimbach, 2006). Therefore, each inverse solution could be interpreted as representative of a relatively short time interval (Fu et al., 2020) or could give information on monthly variations of the AMOC (Bryden et al., 2005b). Ganachaud (2003a) refer to their estimates as time-average transoceanic transports with realistic uncertainties, although they acknowledge the temporal sampling problem inherent to the discrete sampling of hydrographic data. Therefore, the validity of hydrographic data to reconstruct climatological estimates is an open debate.
Moreover, inverse models are able to resolve the circulation satisfactorily in most regions, except at subpolar latitudes where the barotropic component of the current is strong and the velocity at the reference level from the inverse model does not take into account this barotropic velocity (Álvarez et al., 2002). Therefore, mass transports in these regions can be underestimated. This issue could be resolved with the use of lowered and shipboard acoustic Doppler current profiler (LADCP and SADCP) direct velocity measurements capturing this barotropic component, but these data are not often available (Hernández-Guerra and Talley, 2016; Casanova-Masjoan et al., 2018; Lherminier et al., 2007, 2010; Holliday et al., 2018; Arumí-Planas et al., 2023). As a result, all uncertainties quoted are formal results that depend on the limited assumptions imposed on the inverse model and should not be regarded as strictly limiting the total strength of these time mean currents.
2.3 Adjusted transports
Using the results from the inverse model we can obtain the absolute velocity, considering adding the adjustments to the velocities at the reference level (b) to the geostrophic velocity between each pair of stations, vr. The adjusted mass transport (TM) can be computed by integrating the absolute velocity over an area A defined by a certain horizontal and vertical extension:
where ρ is the density. Heat transport (TH) can be computed as
where cp is the heat capacity of seawater and θ is the potential temperature.
The freshwater flux (FW) has been estimated as the freshwater divergence, which represents the difference between the total freshwater flux and the volume flux through the Bering Strait (Caínzos et al., 2022; McDonagh et al., 2015; Bryden et al., 2011):
where is the interbasin mass transport, i.e. across the Bering Strait (−0.8 Sv), S′ is the salinity anomaly, and S0 is the area-weighted section average.
The longitudinal extension of each current has been defined based on the eastward accumulated horizontal mass transport, defining the chosen station pairs with a consistent slope in the accumulated horizontal mass transport. The vertical extension is ascribed with the net mass transport integrated over the chosen station pairs with the same flow direction. In this study, we have focused on the main currents, restricted to certain longitudinal and vertical regions. Therefore, no mass transport balance can be obtained only from these main features of the circulation. The mass balance within a transoceanic section could be obtained after accounting for the transport over the ocean interior.
This study uses a combination of hydrographic sections taken over the course of 30 years to describe the intricate network of currents that make up the AMOC throughout the Atlantic basin. With the results from the inverse models, we can measure the main important currents that flow along the Atlantic Ocean. Here we assess their transport in terms of mass (Fig. 2), heat (Fig. 3), and freshwater transport (Fig. 4).
3.1 Boundary and surface currents
3.1.1 Malvinas Current
The Malvinas Current (MC) is a cold and nutrient-enriched current originating from the northernmost branch of the northward Antarctic Circumpolar Current (ACC) known as the Subantarctic Front that enters the South Atlantic as part of the cold and fresher water route (Bower et al., 2019). It keeps flowing along the continental shelf of Argentina, colliding at ∼ 39∘ S with the warmer and saltier southward Brazil Current (BrC), and then both currents turn offshore (Artana et al., 2018; Legeckis and Gordon, 1982; Garzoli, 1993; Vivier and Provost, 1999a; Goni et al., 1996). The MC is observed as a northward transport of 37.2 ± 2.0 Sv at 45∘ S over the platform and slope of the 1990–1999 inverse solutions (Fig. 2), extending 109 km from the coast to 58.6∘ W (Fig. 5l, m and Table 2). The current, extending from the surface up to 1200 m, flows more intensely along the layer between 27.23 and 27.58 kg m−3 (∼ 650 m), carrying 19.2 ± 1.5 Sv, representing over 50 % of its total strength. The MC transports 0.54 ± 0.02 PW of heat (Fig. 3) and 0.07 ± 0.01 Sv of freshwater equatorward (Fig. 4), carrying waters with mean transport-weighted (TW) salinity of 34.265 and temperature of 3.66 ∘C.
The mass transport estimation coincides with the 24-year mean transport of 37.1 ± 2.6 Sv at 41∘ S from in situ current velocity and satellite altimetry from Artana et al. (2018). They have also found no significant trend in the MC transport, with larger annual standard deviations mainly associated with smaller mean transports. Earlier estimations using direct velocity measurements at the same location also agree with these results, manifesting the high variability of the MC: 41.5 Sv with a standard deviation of 12 Sv for December 1993 to June 1995 (Vivier and Provost, 1999b) and 34.3 Sv for December 2001 to February 2003 (Spadone and Provost, 2009). Other estimations from inverse solutions using hydrographic data have found slightly larger results (45 ± 7 Sv by Maamaatuaiahutapu et al., 1998; 42.7 ± 6.5 Sv by McDonagh and King, 2005). Further south, at 51∘ S, the Subantarctic Front has also shown large interannual variability, carrying 32.6 Sv in 1999 but 17.9 Sv in 2010 (Pérez-Hernández et al., 2017), the former being consistent with our MC estimates.
This section is subjected to the presence of fronts designated by large-scale features of the ACC (Figs. 2, 3 and 4; Orsi et al., 1995; Sokolov and Rintoul, 2009). The subtropical front marks the northernmost presence of subantarctic waters and can be found at 45∘ S (Smythe-Wright et al., 1998), extending over 463 km between 15.0 and 10.1∘ W (Fig. 5m and Table 2) and occupying a large part of the barotropic water column (up to ∼ 3000 m deep). Across this front, there is a net southward mass transport of −55.5 ± 5.6 Sv, effectively removing −1.09 ± 0.07 PW of heat and −0.14 ± 0.03 Sv of freshwater from the South Atlantic.
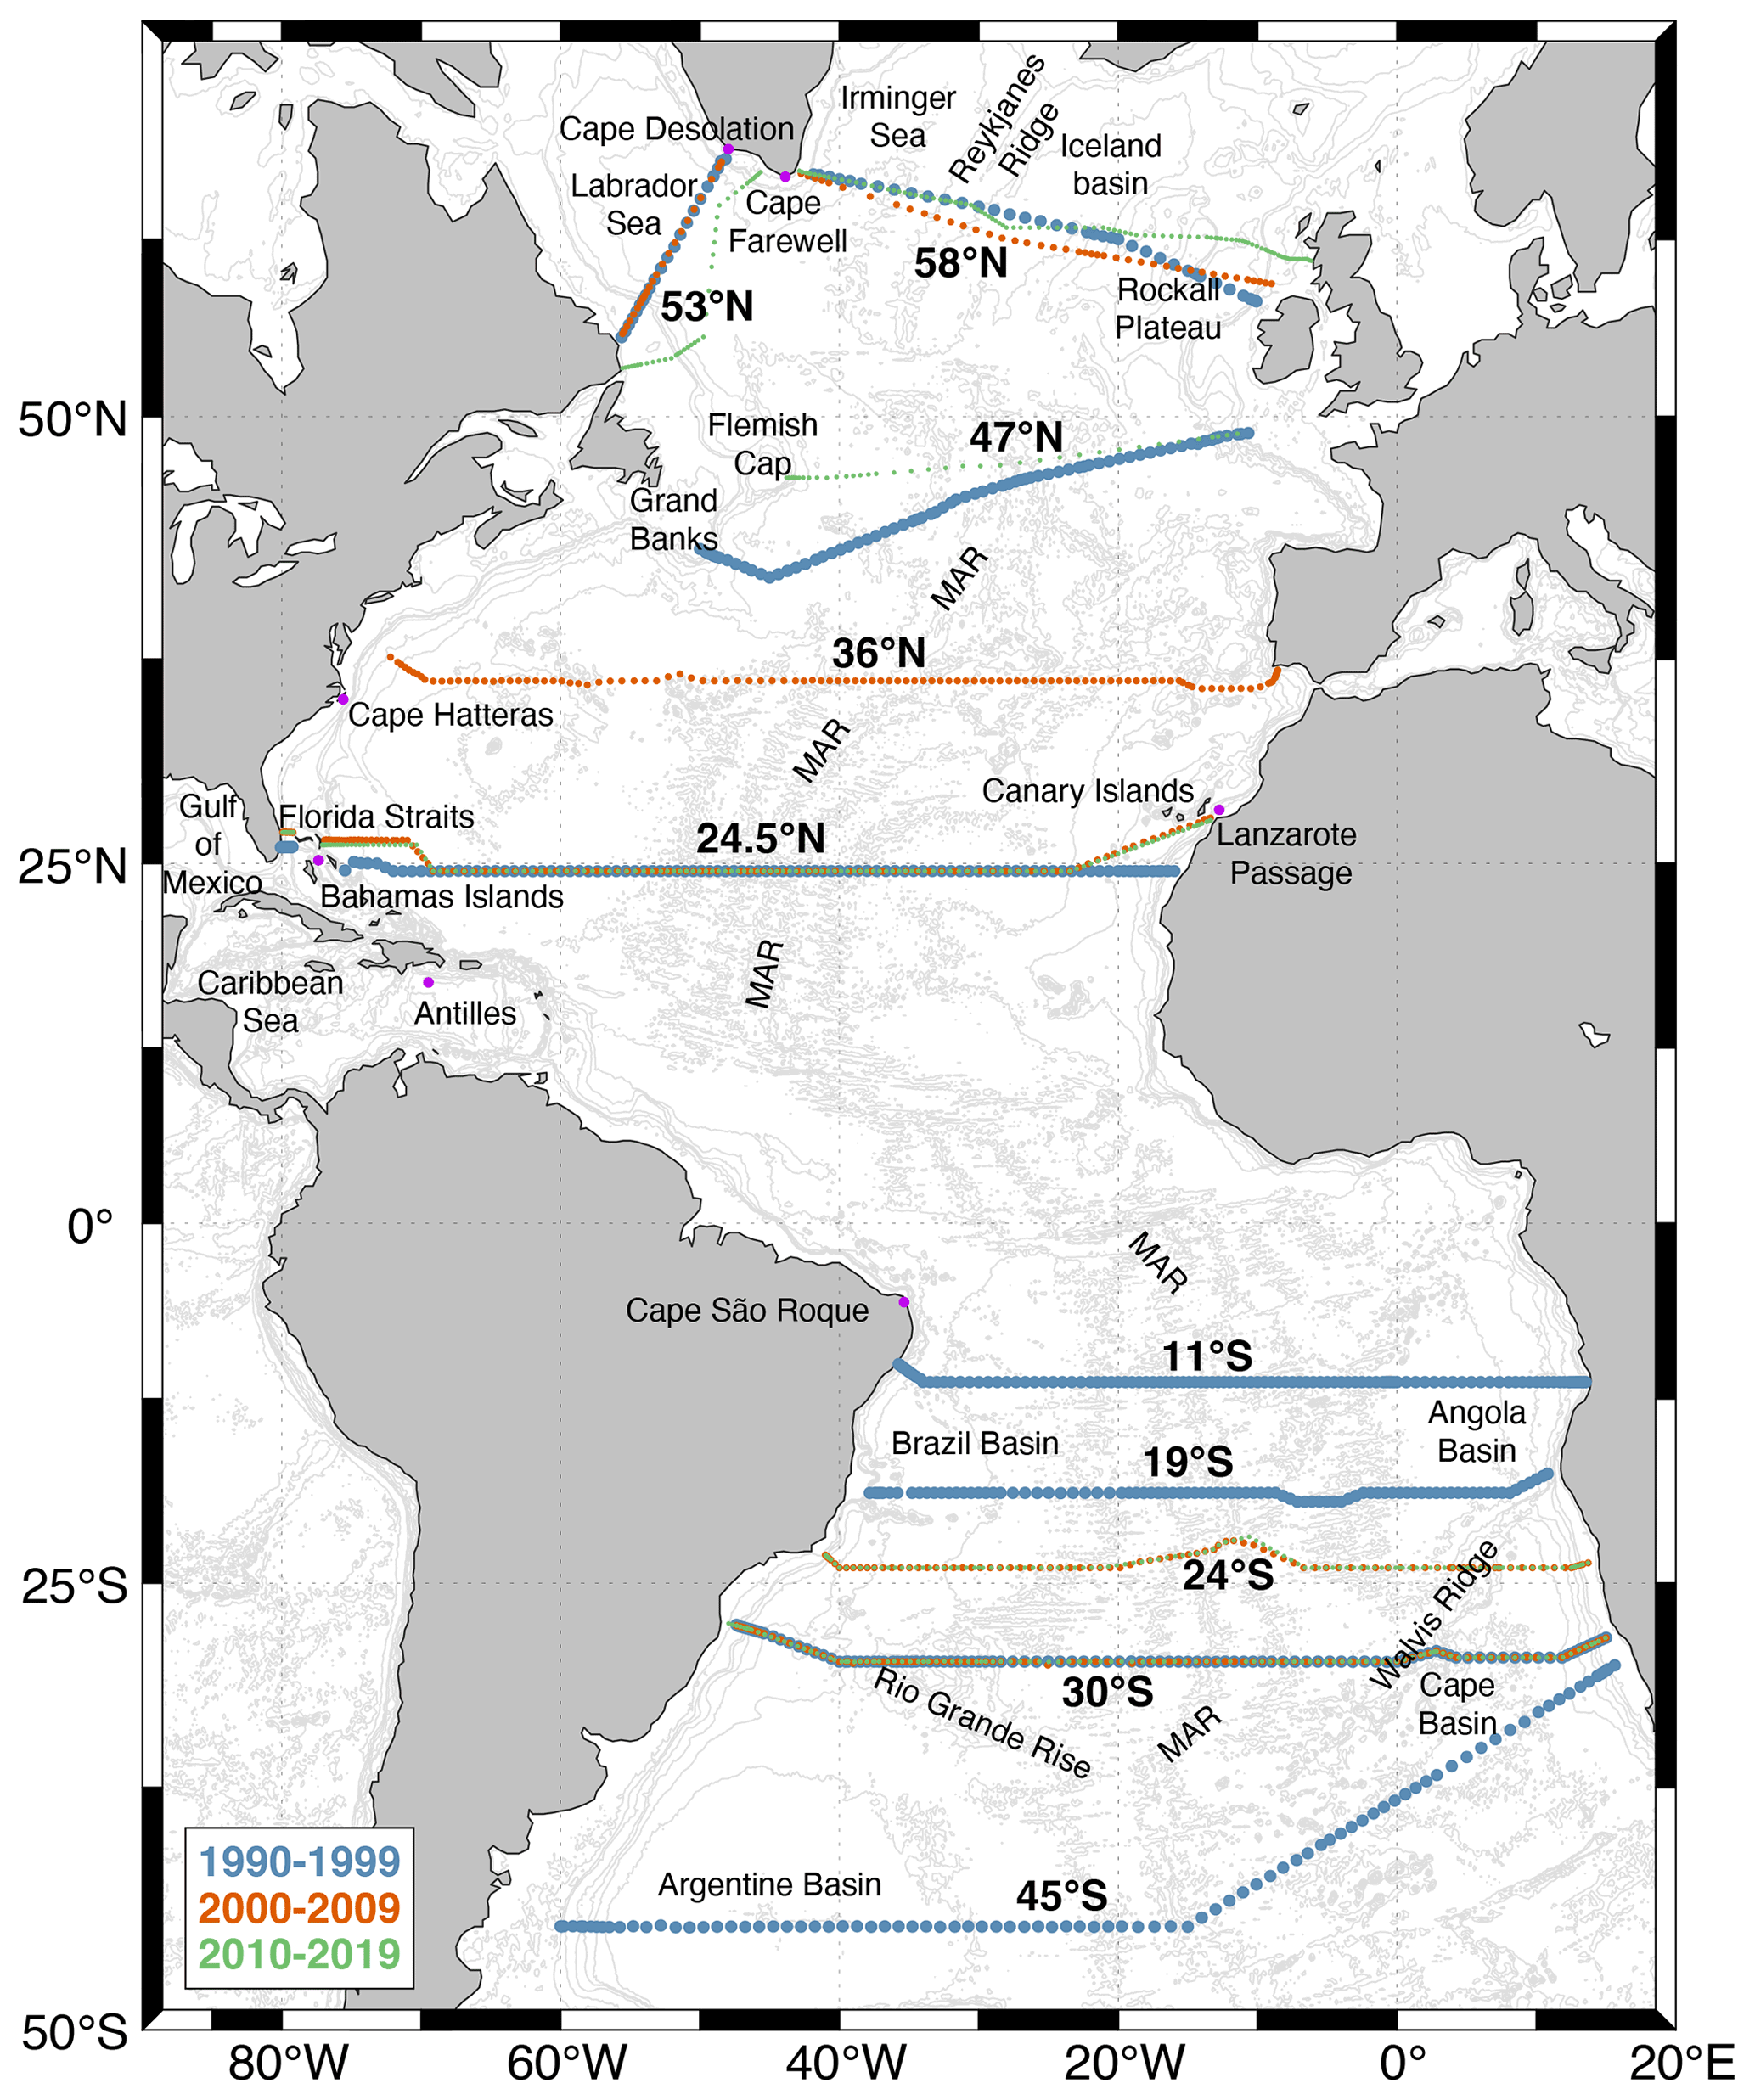
Figure 1Map of the zonal sections in each decade for the inverse model. Each section is accompanied by its nominal latitude, with colours representing the combination of cruises used for each decade: blue for 1990–1999, orange for 2000–2009, and green for 2010–2019. The main geographical features are included in the figure.
3.1.2 Brazil Current
The westward South Equatorial Current bifurcates when it reaches the continental shelf off Cape São Roque (Fig. 1), dividing into the northward-flowing North Brazil Current (NBrC) and the southward western boundary Brazil Current (BrC), carrying warm subtropical water (Stramma et al., 1990).
At 19∘ S (Fig. 5c, d and Table 2), the BrC transports −19.7 ± 1.3 Sv of water southward (Fig. 2) in an approximate barotropic pattern up to 27.84 kg m−3, spanning down to roughly 1500 m depth and extending 37 km from the coast to 37.1∘ W. The heat transport carried out by this current is −0.79 ± 0.05 PW (Fig. 3) while maintaining a northward flux of 0.06 ± 0.03 Sv of freshwater (Fig. 4) for the 1990–1999 solutions. The BrC at this latitude is followed up by a narrow recirculation between 36.7 and 36.4∘ W over a similar depth range, transporting 19.3 ± 2.1 Sv of mass transport, 0.67 ± 0.08 PW of heat transport, and 0.06 ± 0.04 Sv of freshwater flux northward.
The BrC at 24∘ S (Fig. 5f, g and Table 2) is manifested as a narrow current with a recirculation of almost the same magnitude, followed by another southward-flowing current occupying a larger horizontal extension toward the ocean interior. The BrC occupies a longitudinal extent of 25 km from the coast to 40.8∘ W in 2000–2009 and 47 km from the coast to 40.6∘ W in 2010–2019. The vertical extension of the BrC at 24∘ S is reduced, reaching the γn interface of 27.00 kg m−3 (depth of ∼ 500 m). The transports decrease compared to 19∘ S for mass (−4.7 ± 0.4 and −12.0 ± 0.7 Sv; Fig. 2) and heat (−0.39 ± 0.02 and −0.88 ± 0.04 PW; Fig. 3), with no significant changes in the northward flux of freshwater (0.04 ± 0.01 and 0.16 ± 0.01 Sv; Fig. 4) for both the solutions of models including data from 2000–2009 and 2010–2019, respectively. These southward transports of mass are consistent with the results of −9.6, −8.6, and −7.3 ± 0.9 Sv from Stramma (1989), Garzoli et al. (2013), and Arumí-Planas et al. (2023), respectively, although a previous inverse solution at this latitude found slightly lower values (−5.8 ± 0.1 Sv, Evans et al., 2017). At this latitude a recirculation appears 136 and 43 km eastward of the BrC, reaching depths of ∼ 700 m. This current recirculates a large part of the BrC transport, with 8.9 ± 1.4 and 10.5 ± 0.9 Sv of northward mass transport for each decade, 0.57 ± 0.09 and 0.70 ± 0.05 PW of heat transport, and southward freshwater fluxes (−0.03 ± 0.03 and −0.07 ± 0.02 Sv).
The Brazil Current at 30∘ S gets broader, extending 443 km from the coast to 42.9∘ W, from 282 km from 46.3 to 43.6∘ W, and 122 km from the coast to 46.5∘ W in each decade. Moreover, the BrC deepens its lower interface (27.23 kg m−3), reaching slightly larger depths for the inverse solutions containing sections from 1990–1999 and 2000–2009, as well as a similar depth for those within 2010–2019 (678, 735, and 505 m). The BrC at this latitude presents similar structures for the first 2 decades (Fig. 5i, j and Table 2), with a decreasing southward transport among each cruise and a sharp decrease for the last one (−26.7 ± 1.6, −22.2 ± 1.5, and −9.5 ± 0.7 Sv for the 1990–1999, 2000–2009, and 2010–2019 solutions, respectively; Fig. 2). Similar tendencies appear for both heat transport (−1.63 ± 0.09, −1.31 ± 0.08, and −0.64 ± 0.04 PW; Fig. 3) and freshwater flux (0.16 ± 0.02, 0.09 ± 0.02, and 0.05 ± 0.01 Sv; Fig. 4). At this latitude, the strengthening of the BrC is counteracted by a recirculation occurring eastward of the BrC, redirecting over half of the current northward (16.4 ± 1.9, 15.9 ± 2.0, and 13.2 ± 1.4 Sv of mass transport, 0.85 ± 0.07, 0.80 ± 0.08, and 0.76 ± 0.07 PW of heat transport, and −0.16 ± 0.03, −0.14 ± 0.03, and −0.06 ± 0.02 Sv of freshwater). The combination of BrC and its recirculation increased from 24∘ S to this latitude, agreeing with the estimations of Peterson and Stramma (1991) that indicate an intensification of 5 % per 100 km south of 24∘ S. This southward intensification has been corroborated by results from hydrography (Stramma, 1989; Garzoli et al., 2013) and a combination of Argo floats and satellite altimetry (Schmid and Majumder, 2018). At a latitude close to 27∘ S, the northern branch of the intermediate circulation moves westward from the eastern boundary until it encounters the South American continental margin. At this point, the intermediate flow breaks into two branches, one veering equatorward and flowing against the BrC north of 27∘ S, which may result in the reduced BrC at 24∘ S, and the other feeding the BrC with a stronger net southward transport in intermediate layers at 30∘ S (Legeais et al., 2013; Boebel et al., 1999; Valla et al., 2018).
The BrC at 19∘ S presents TW temperatures of 10.21 ∘C and salinities of 35.113, which increases on its way southward to 24∘ S (21.03 and 18.64 ∘C for the 2000–2009 and 2010–2019 decades and 36.340 and 36.066). The values for the recirculation at 24∘ S are slightly reduced compared with BrC (16.17 and 16.69 ∘C and 35.617 and 35.785). Properties at 30∘ S appear to decrease among the first decades for both TW temperature (15.47 and 14.96 ∘C) and TW salinity (35.611 and 35.558), with an increase for the last decade in both TW temperature and salinity (16.99 ∘C and 35.900, respectively). The recirculation at 30∘ S presents values lower than those of the BrC at the same latitude (TW temperatures of 13.09, 12.75, and 14.54 ∘C and TW salinities of 35.300, 35.248, and 35.271).
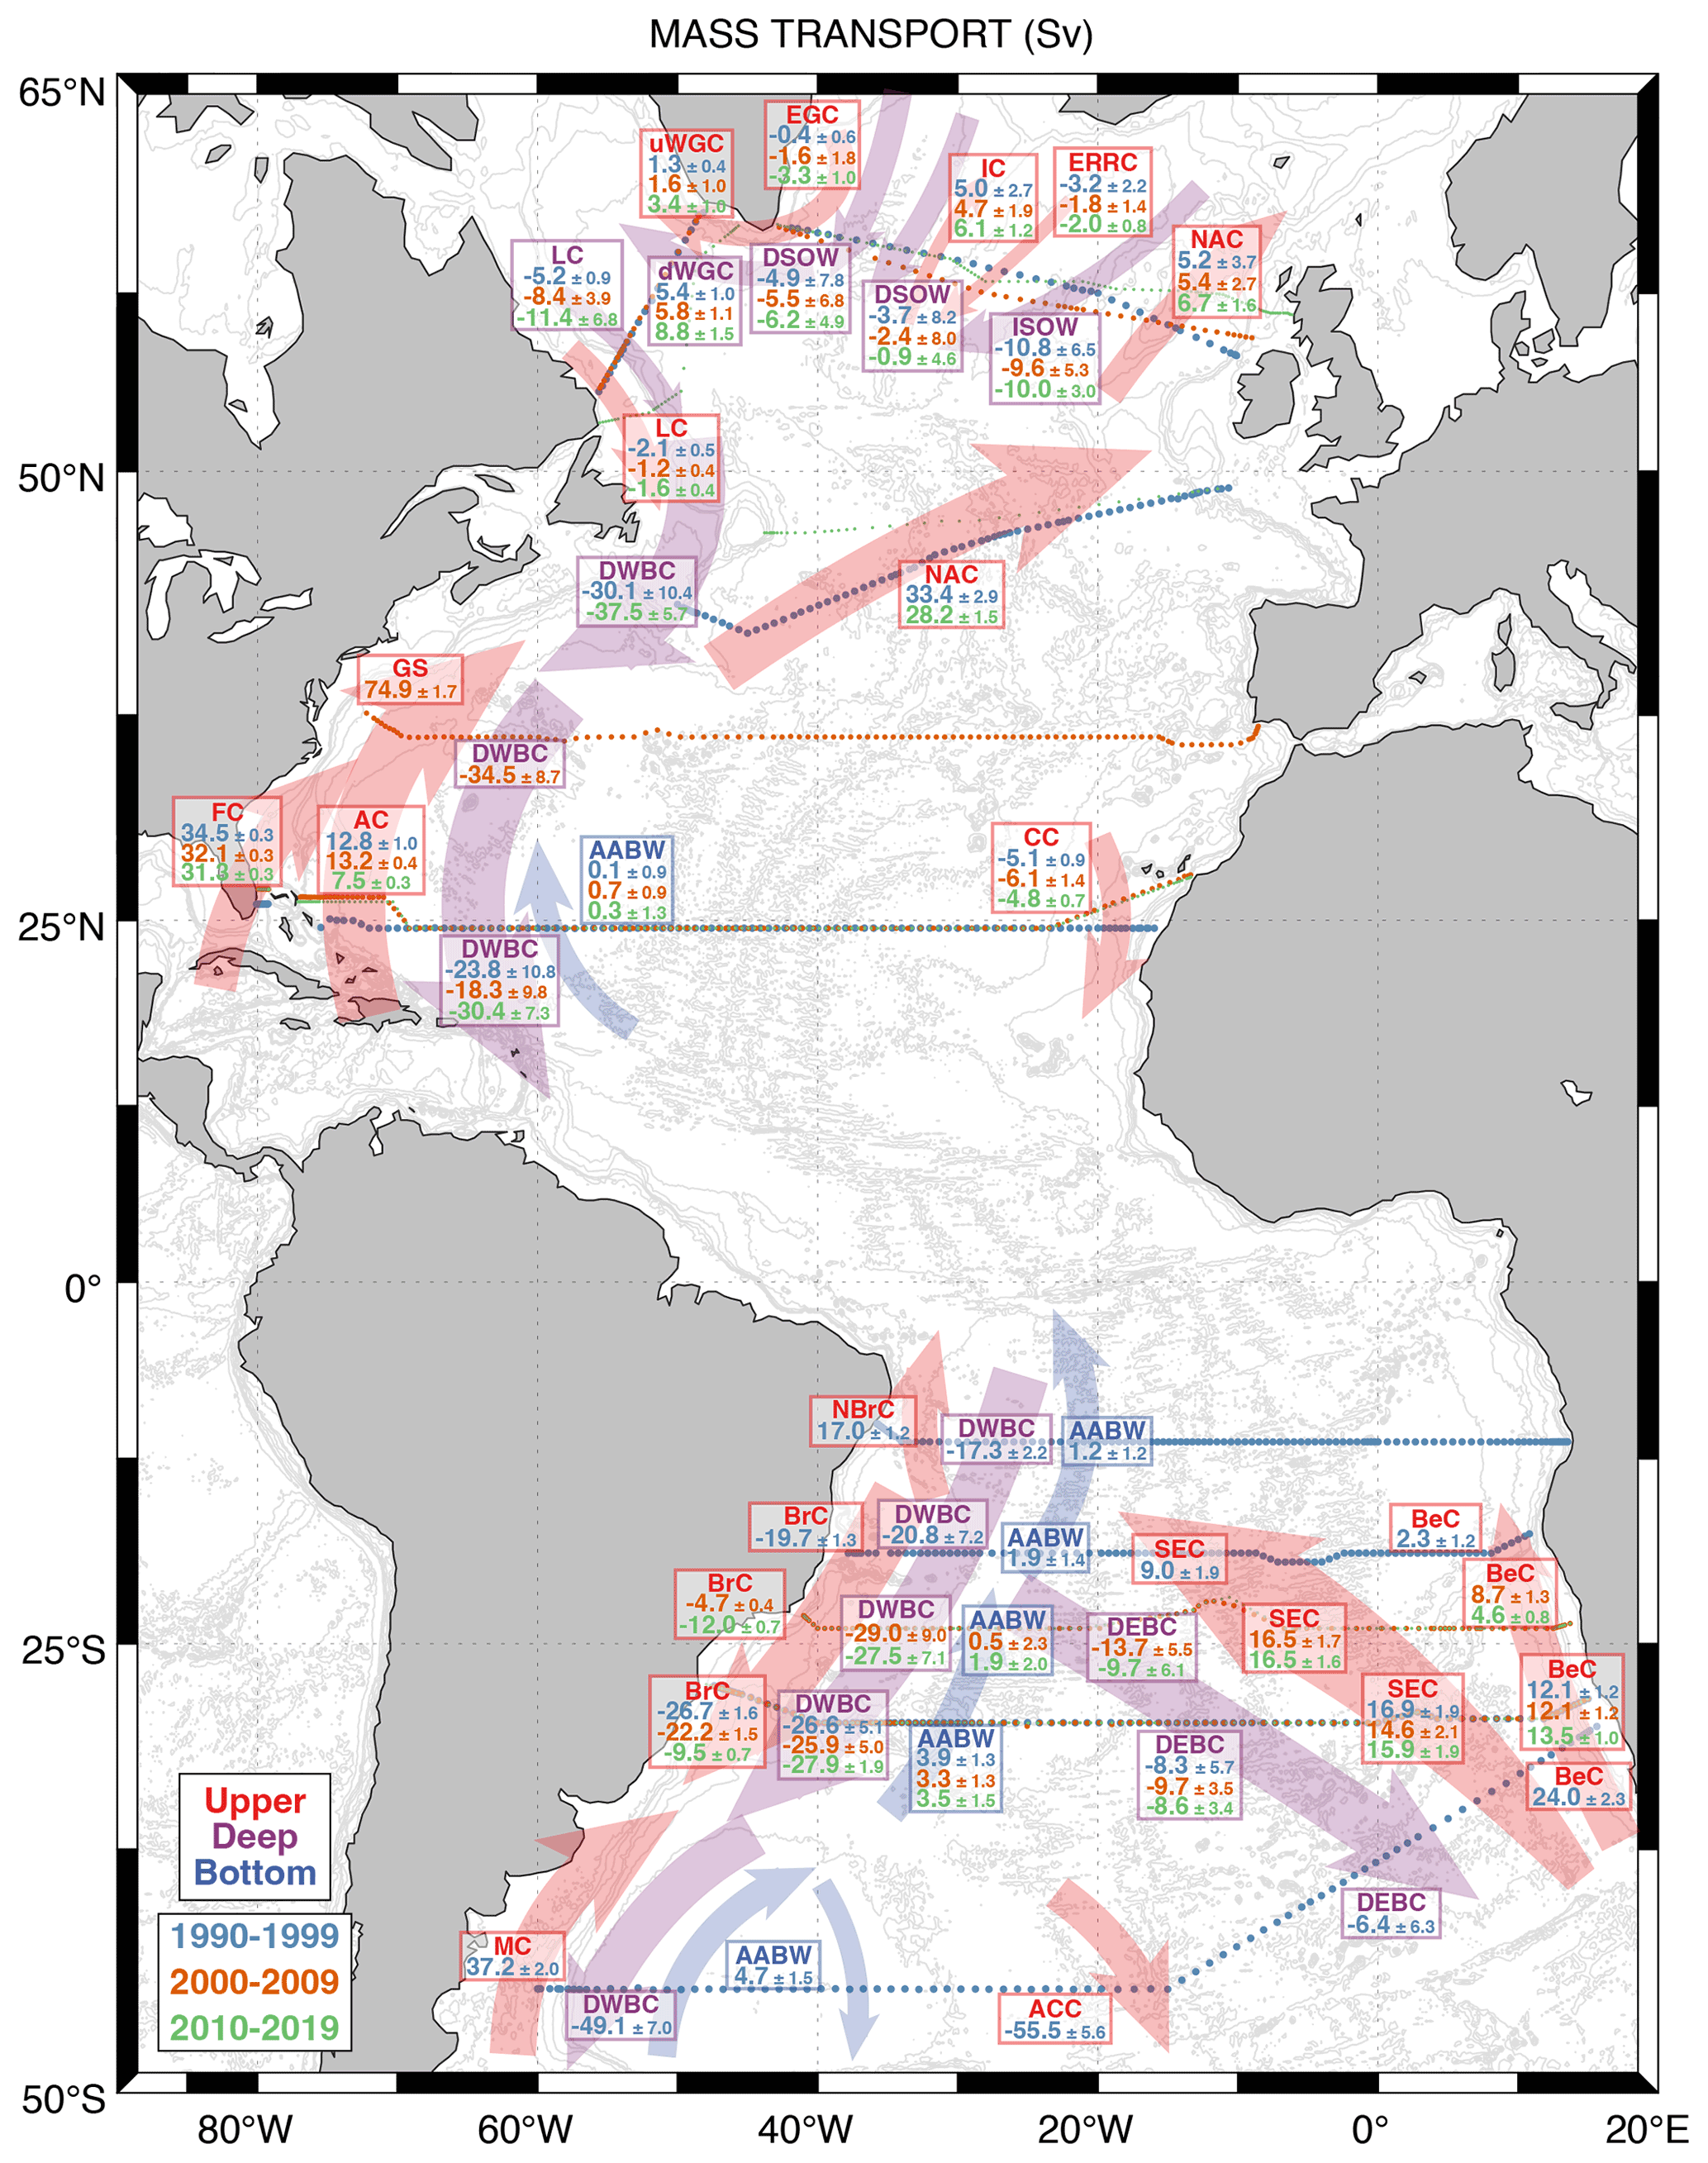
Figure 2Circulation in the upper, deep, and abyssal layers in the Atlantic Ocean for mass transport (Sv). The background arrows represent the circulation of the main currents in the text: red for surface layers, purple for deep, and blue for abyssal. At each section, the mass transports (in Sv) for each current appear in a box, with values in blue for the solutions for the 1990–1999 model, orange for 2000–2009 model solutions, and green for 2010–2019 model solutions. Surface currents include the Antilles Current (AC), Benguela Current (BeC), Antarctic Circumpolar Current (ACC), Brazil Current (BrC), Canary Current (CC), East Greenland Current (EGC), East Reykjanes Ridge Current (ERRC), Florida Current (FC), Gulf Stream (GS), Irminger Current (IC), Labrador Current (LC), Malvinas Current (MC), North Atlantic Current (NAC), North Brazil Current (NBrC), South Equatorial Current (SEC), and upper West Greenland Current (uWGC). Deep currents are comprised of the deep eastern boundary current (DEBC), the deep West Greenland Current (dWGC), the deep western boundary current (DWBC), Denmark Strait Overflow Water (DSOW), Iceland–Scotland Overflow Water (ISOW), and the Labrador Current (LC). Abyssal layers are configured by the distribution of Antarctic Bottom Water (AABW).
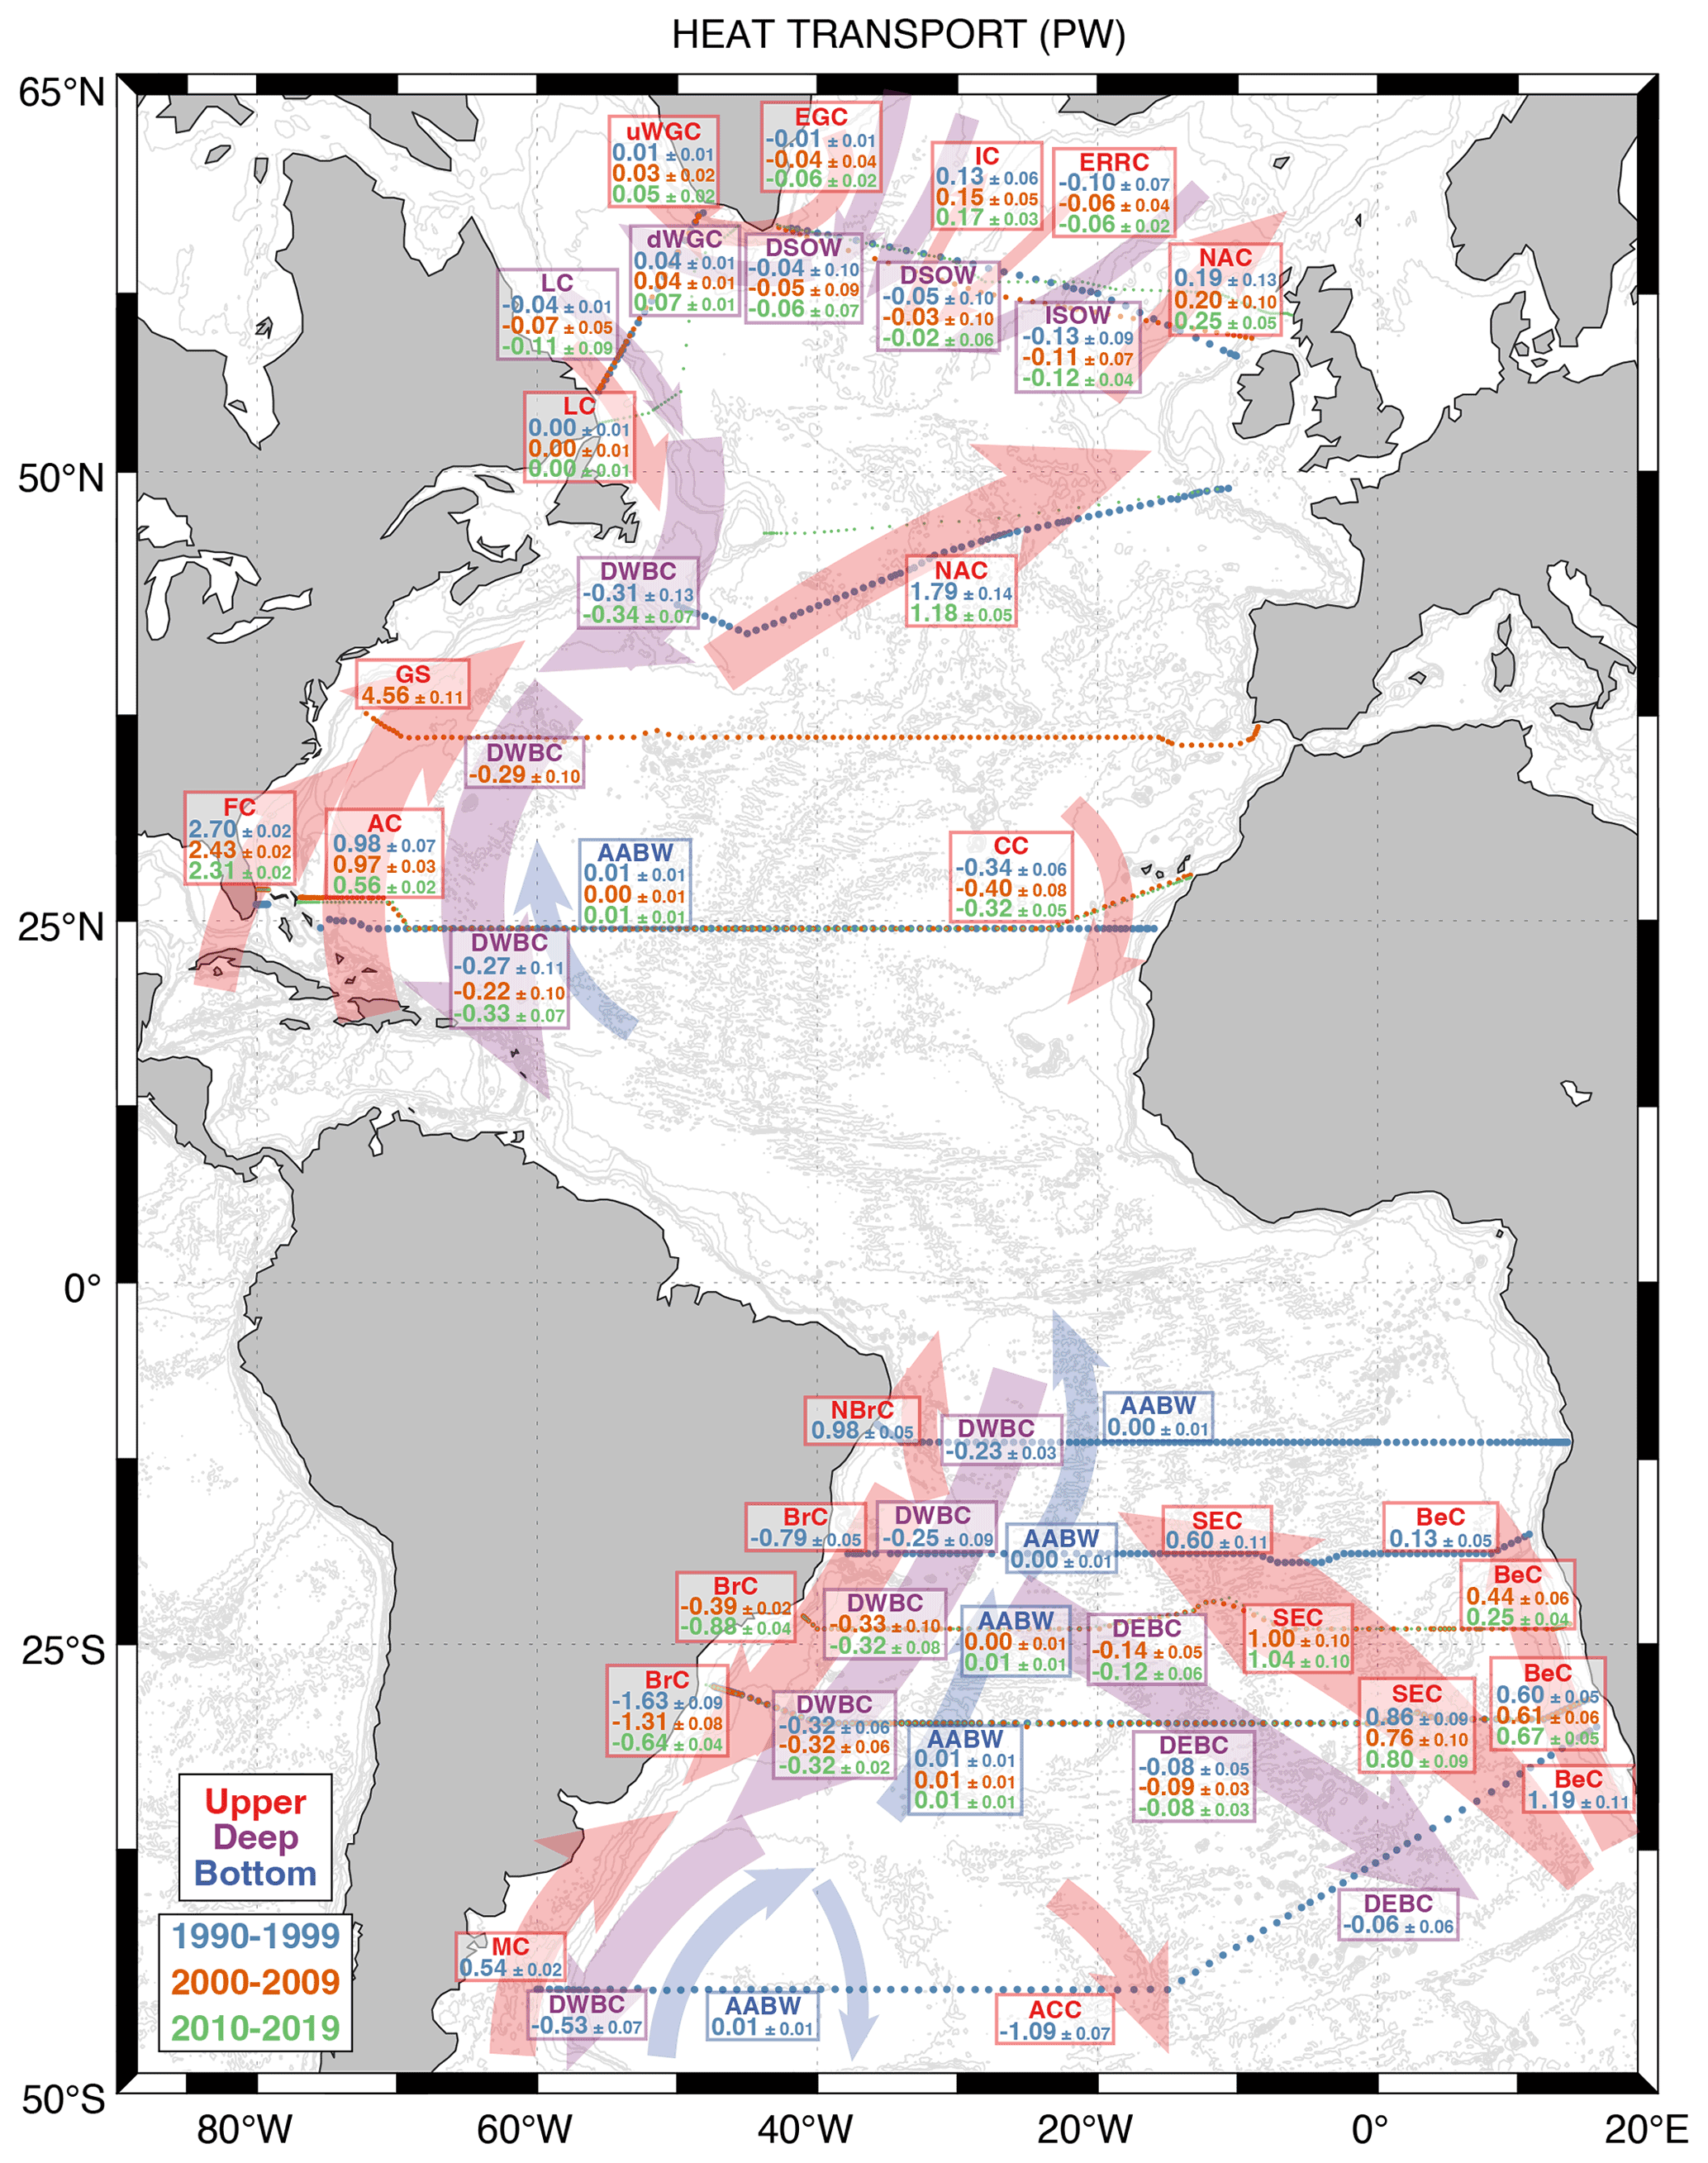
Figure 3Same as Fig. 2 but for heat transport (PW).
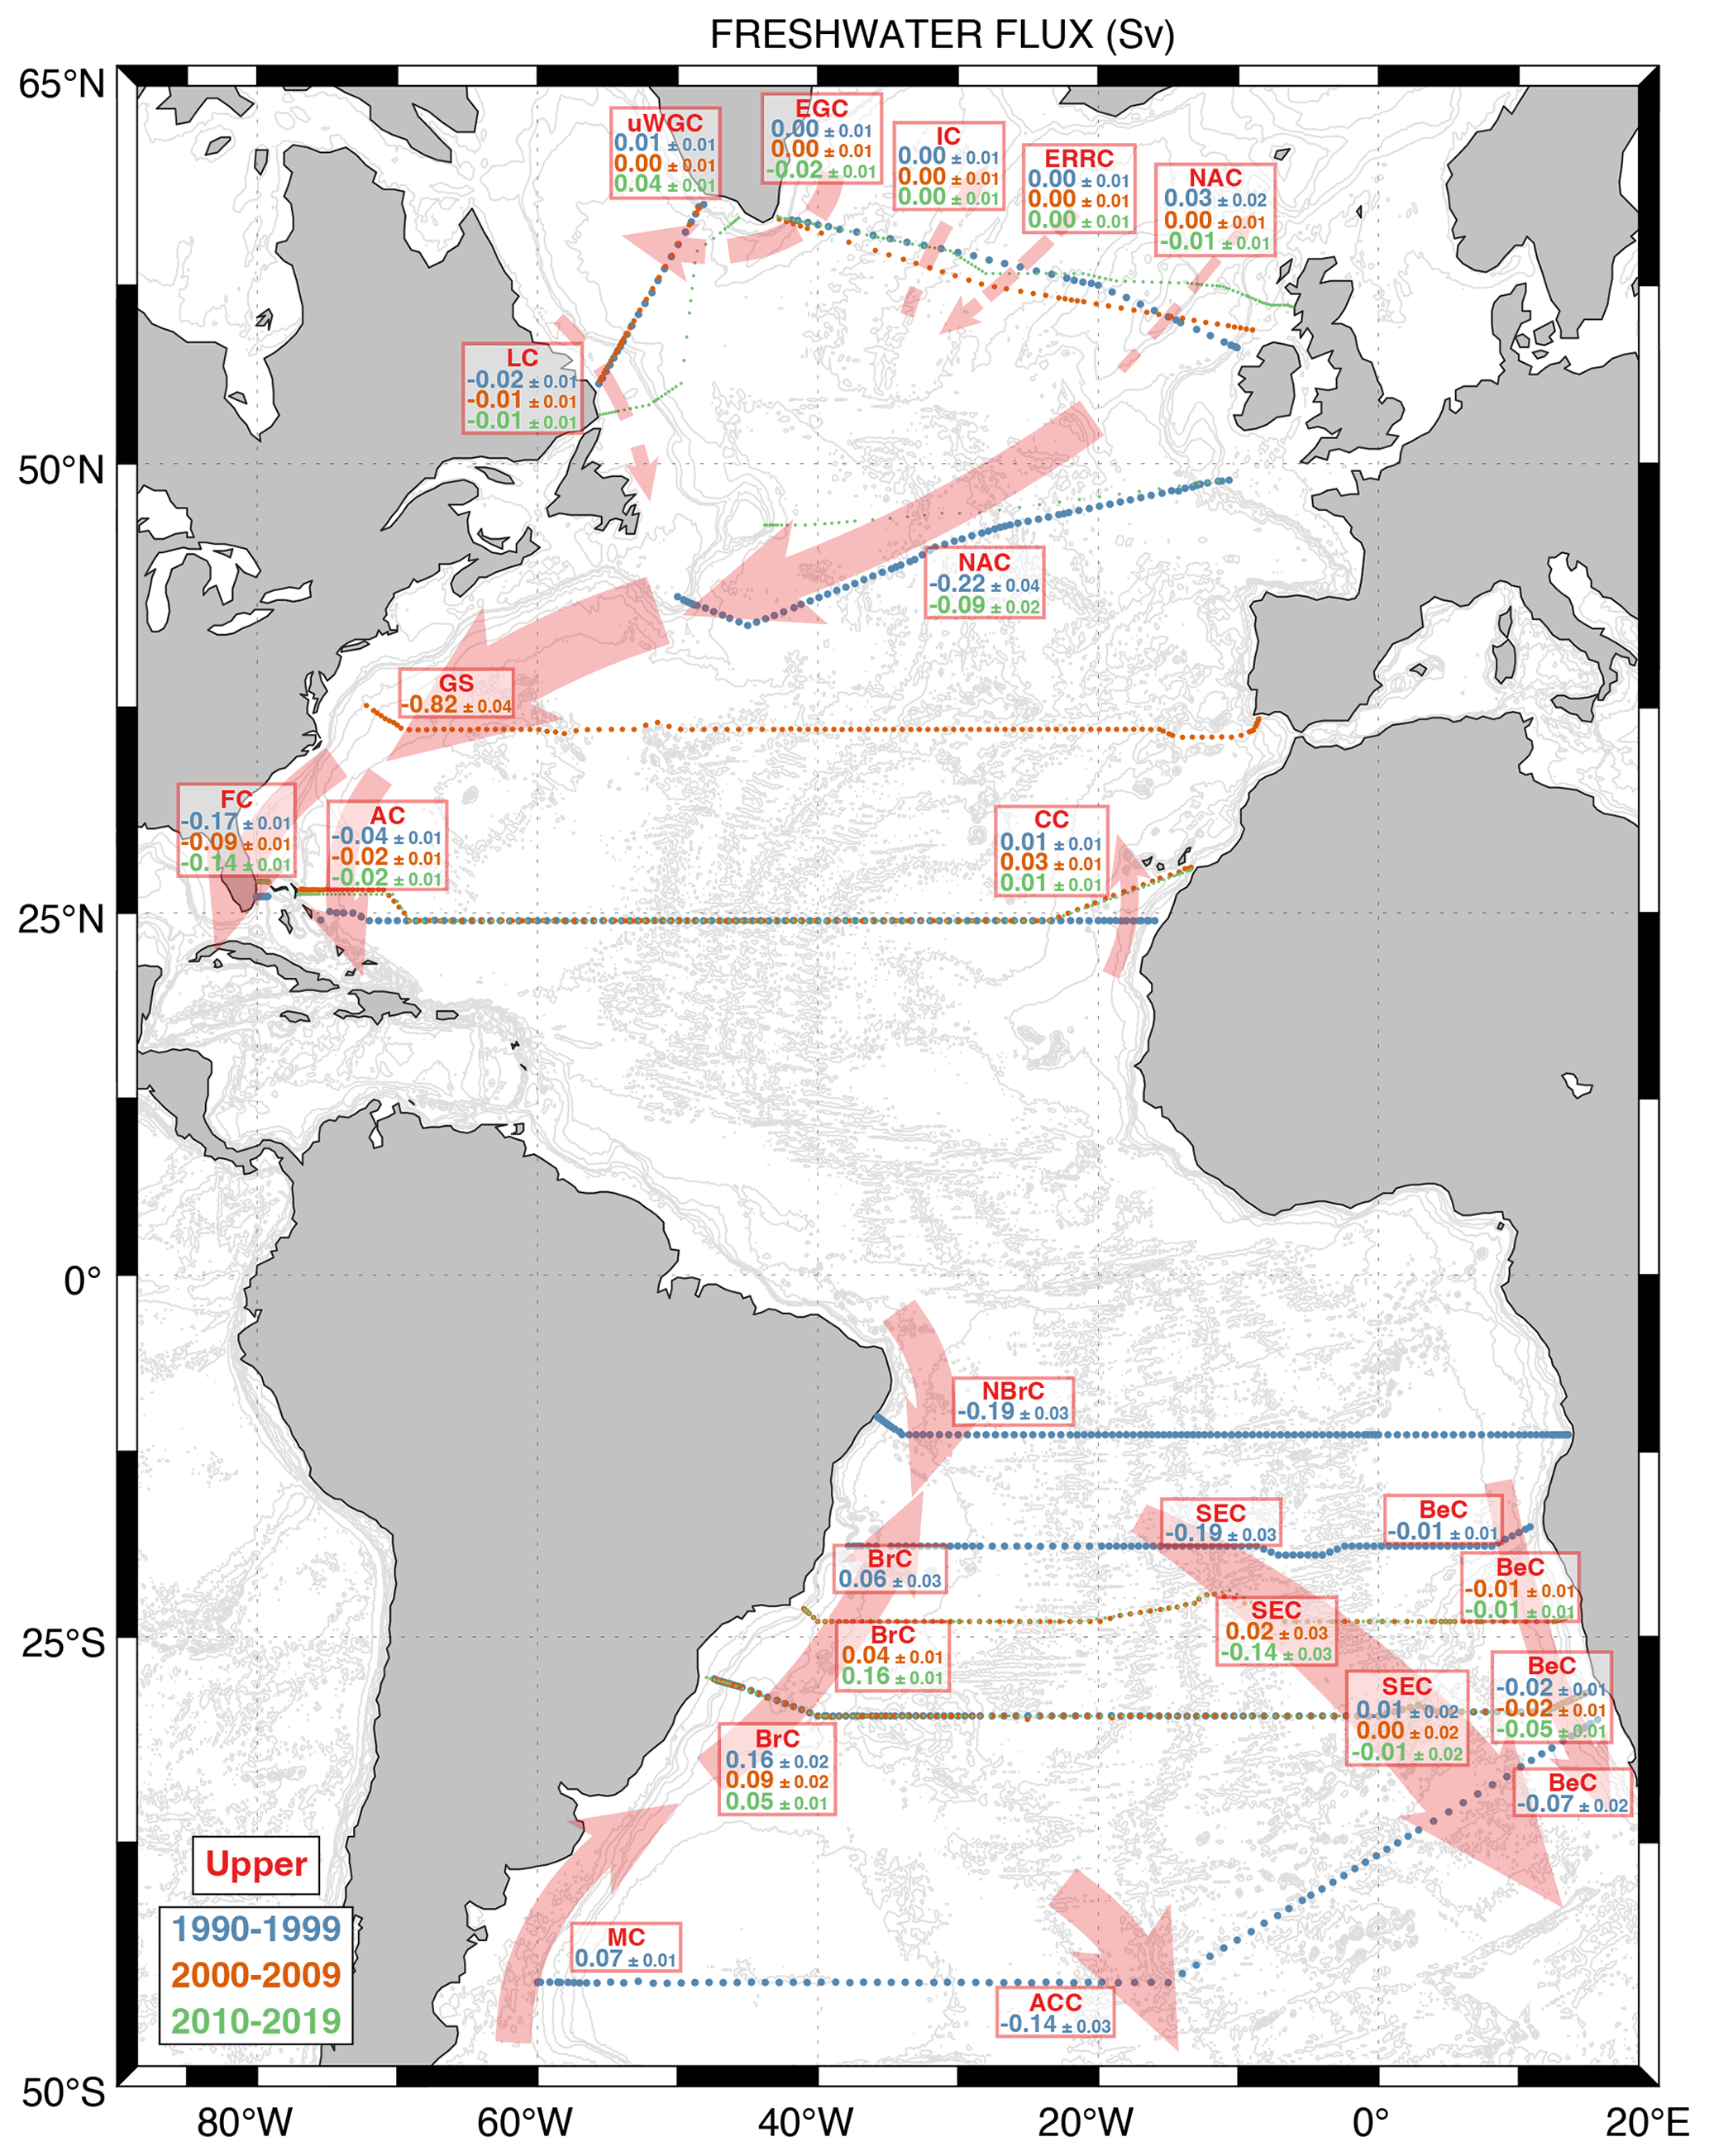
Figure 4Same as Fig. 2 but for freshwater transport (Sv) in upper layers.
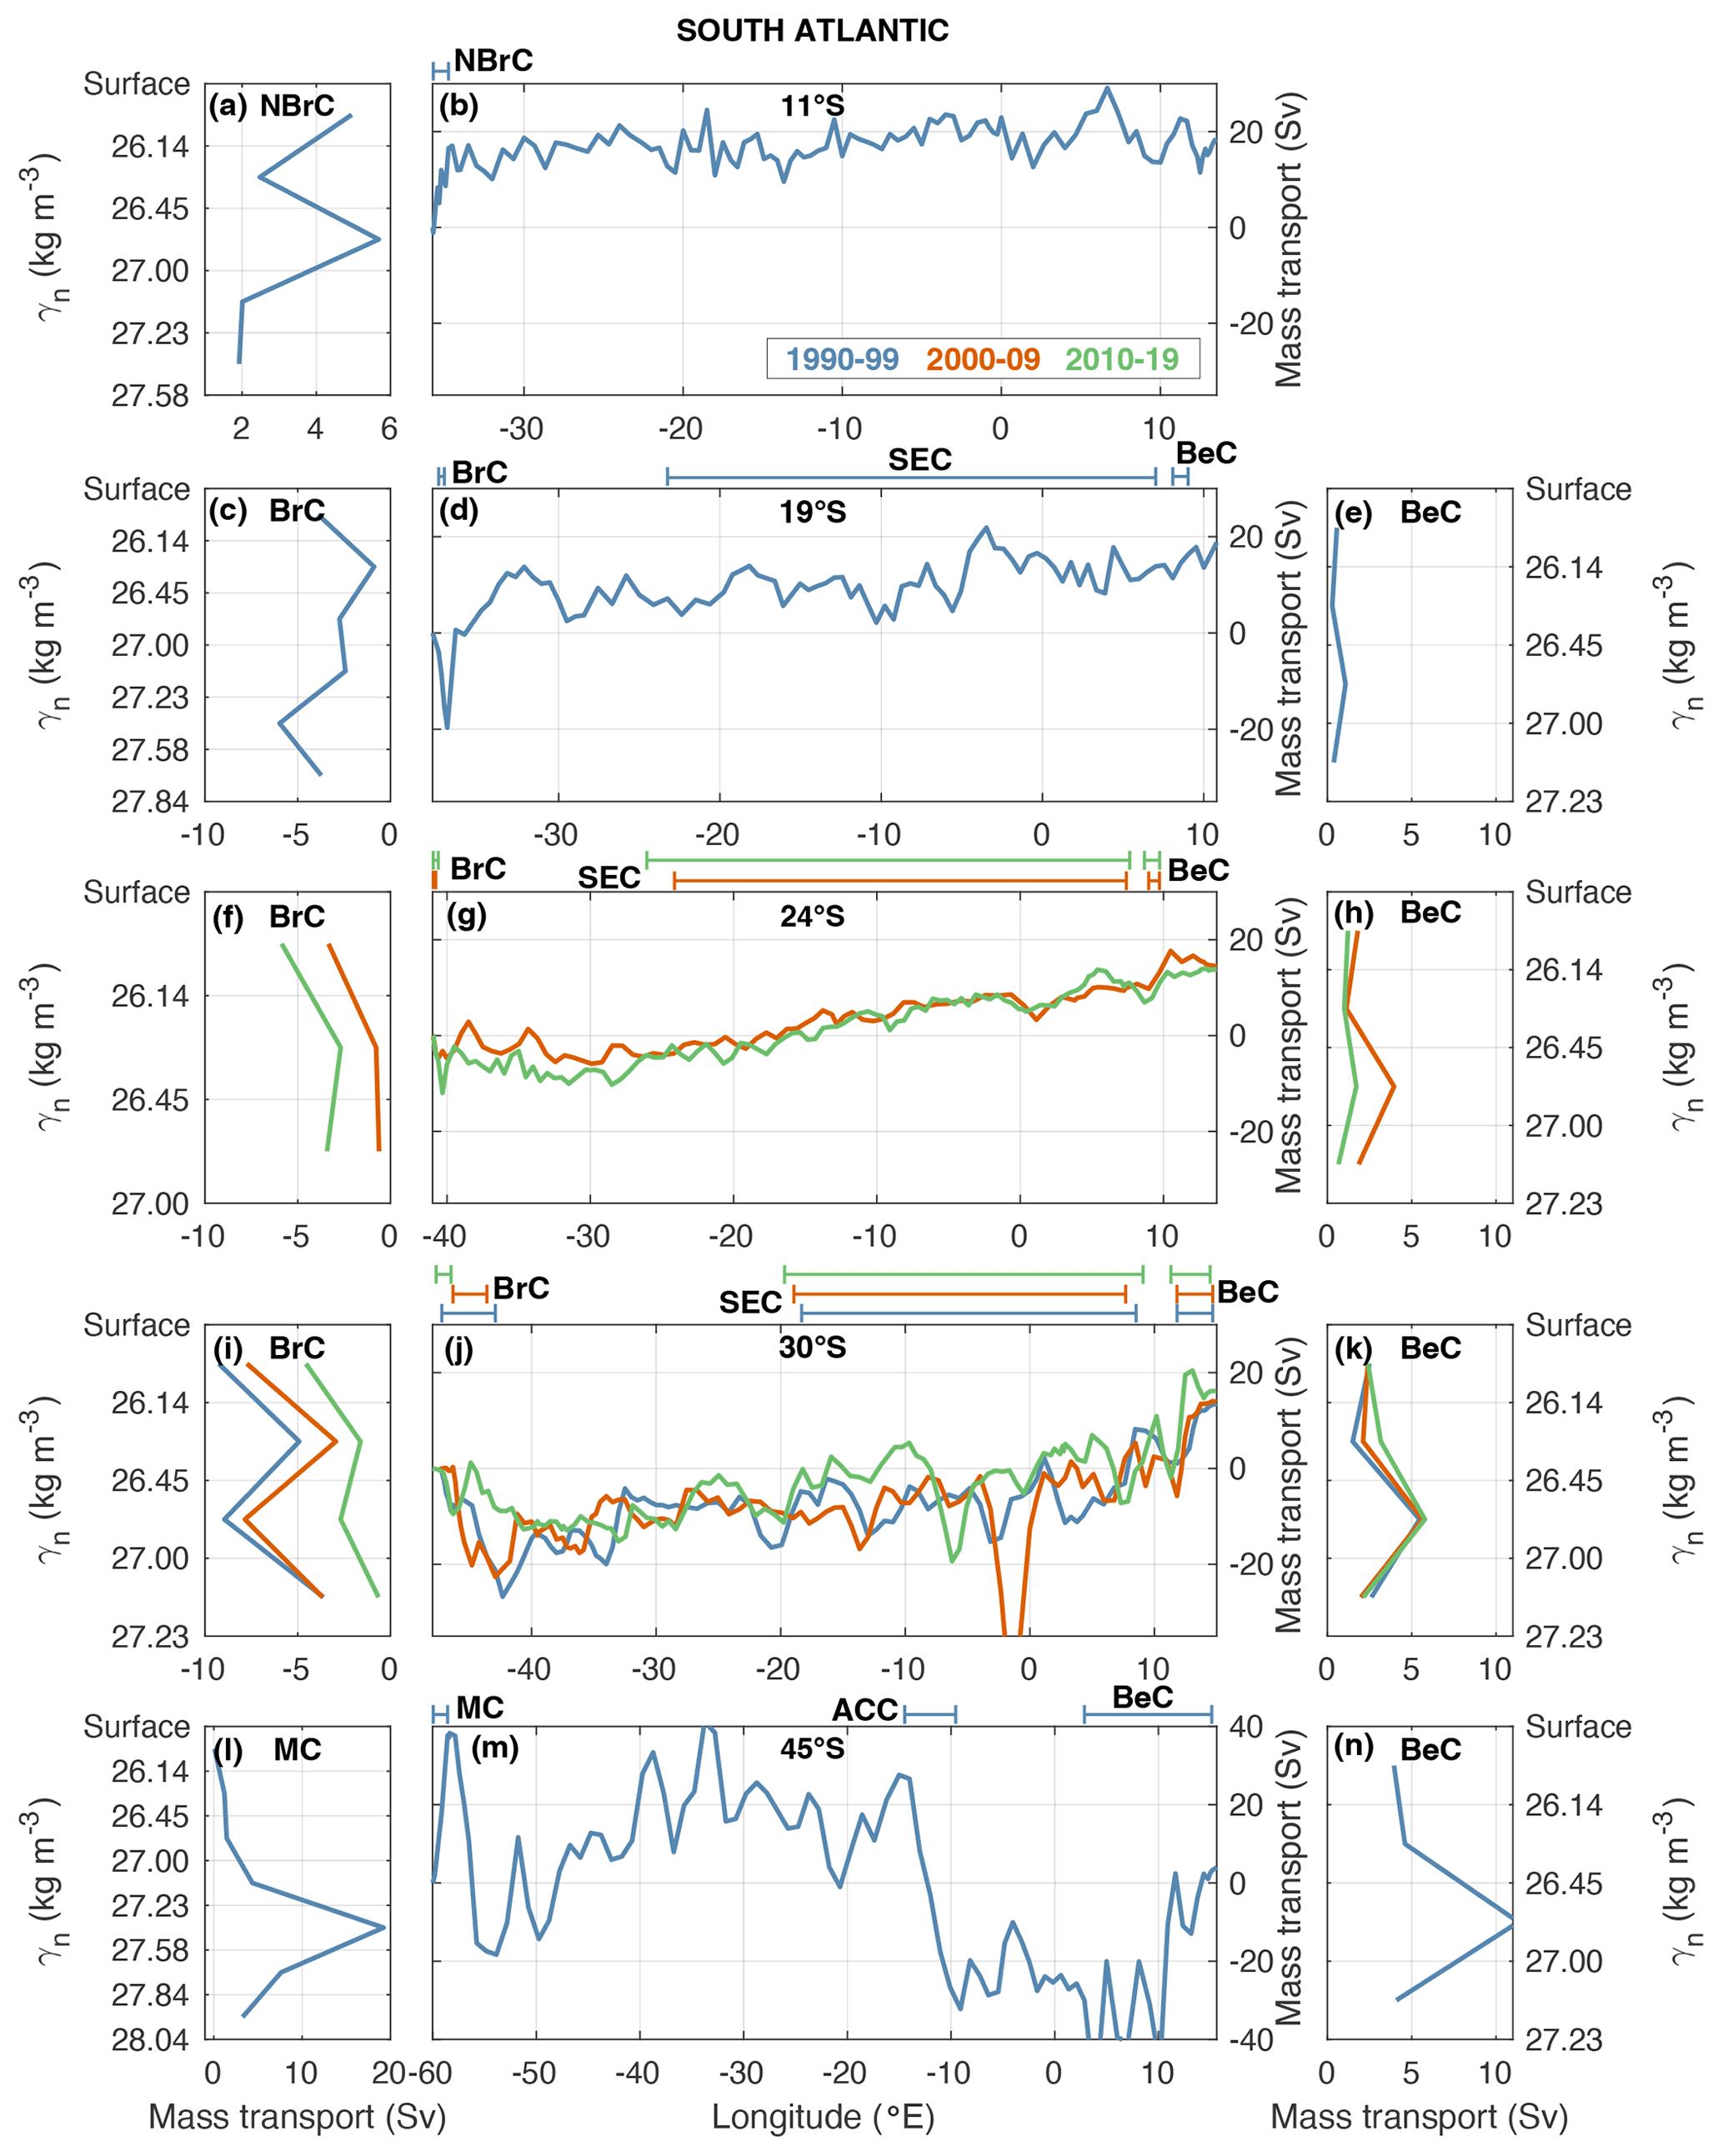
Figure 5South Atlantic currents for different latitudes and decades. Net mass transport (Sv) per layer defined between neutral density interfaces for the North Brazil Current (NBrC) at 11∘ S (a), the Brazil Current (BrC) at 19∘ S (c), 24∘ S (f), and 30∘ S (i), the Benguela Current (BeC) system at 19∘ S (e), 24∘ S (h), 30∘ S (k), and 45∘ S (n) and the Malvinas Current (MC) at 45∘ S (l). The transport per layer is computed using the stations and layers specified in Table 2. The longitudinal ranges of the currents at each latitude appear on the top of the middle panel. Different colours denote the use of the model solutions in blue for 1990–1999, orange for 2000–2009, and green for 2010–2019. The middle panels show the eastward accumulated horizontal mass transport (Sv) for upper layers for the 11∘ S (b), 19∘ S (d), 24∘ S (g), 30∘ S (j), and 45∘ S (m) sections.
3.1.3 Benguela Current System
The northward Benguela Current (BeC) system is the relatively strong eastern boundary current of the South Atlantic subtropical gyre, with a varying longitudinal extension (Wedepohl et al., 2000). The BeC can be first identified at Cape Agulhas (located at 34.8∘ S, 20.0∘ E) for the 45∘ S section (Fig. 5m, n and Table 2), extending from 2.9∘ E to the coast over 1335 km in the horizontal and 650 m in the vertical, up to a γn of 27.23 kg m−3. The BeC reaches the southern tip of the African continent transporting 24.0 ± 2.3 Sv of mass, 1.19 ± 0.11 PW of heat, and −0.07 ± 0.02 Sv of freshwater (Figs. 2, 3, and 4). At this latitude, the BeC carries water with TW temperatures of 12.53 ∘C and TW salinities of 35.057.
The BeC at 30∘ S (Fig. 5j, k and Table 2) occupies narrower extensions (∼ 310 km) from ∼ 11.5∘ E to the coast, influencing the first 500 m of the water column, maintaining the same γn lower interface of 27.23 kg m−3. The BeC carries similar mass transports of 12.1 ± 1.2, 12.1 ± 1.2, and 13.5 ± 1.0 Sv for all three cruises included in the solutions for the 1990–1999, 2000–2009, and 2010–2019 decades, respectively, accompanied by 0.60 ± 0.05, 0.61 ± 0.06, and 0.67 ± 0.05 PW of heat transport. The freshwater flux carried southward by the BeC appears to increase for the last decade (−0.02 ± 0.01, −0.02 ± 0.01, and −0.05 ± 0.01 Sv). Garzoli et al. (1996) studied the time evolution of the BeC at 30∘ S and found large variability for the transport and velocity records due to the passage of Agulhas rings, with a mean transport of 16 Sv, comparable to our estimations.
At 24∘ S the BeC extends over ∼ 90 km, from ∼ 8.9∘ E to the coast (Fig. 5g, h and Table 2), maintaining similar vertical structures from the surface up to ∼ 550 m deep for γn of 27.23 kg m−3. However, different transports appear (8.7 ± 1.3 and 4.6 ± 0.8 Sv for mass; 0.44 ± 0.06 and 0.25 ± 0.04 PW for heat) that are significantly weaker than those at 30∘ S.
Our results from 30 and 24∘ S show the strong variability of the Benguela Current, with no clear pattern (Figs. 2, 3, and 4). At 19∘ S, the BeC presents the same narrow extension as at 24∘ S (113 km) from 8.1∘ E to the coast, while reaching in the vertical from the surface up to 500 m (Fig. 5d, e and Table 2). There is a slight reduction at 19∘ S, reaching values of 2.3 ± 1.2 Sv for mass transport, 0.13 ± 0.05 PW of heat transport, and null freshwater flux, with no continuity north of 19∘ S.
The BeC is fed by subtropical thermocline waters from the Indian and South Atlantic oceans, as well as saline, low-oxygen tropical Atlantic water and cooler, fresher subantarctic water (Garzoli and Gordon, 1996; Garzoli et al., 1996). Model studies have found that around most of the transport entering the South Atlantic via the Agulhas leakage carries waters from the Indonesian Throughflow and the south of Australia (Durgadoo et al., 2017). Thus, the BeC at 30∘ S advects waters with TW temperatures of 12.66, 12.75, and 12.66 ∘C and TW salinities of 34.998, 35.071, and 35.102 for each decade, respectively. Similar values are maintained for the 24∘ S sections, with TW temperatures of 12.69 and 13.94 ∘C and TW salinities of 35.019 and 35.096 for the last 2 decades. Both TW temperature and salinity increase for waters of the BeC, reaching 19∘ S (14.06 ∘C and 35.262, respectively).
3.1.4 South Equatorial Current
The South Equatorial Current (SEC) is a broad current flowing westward toward the Brazilian shelf, where it bifurcates at Cape São Roque (Fig. 1), with one branch heading north as the North Brazil Current (NBrC) and the other weaker one heading southward as the BrC.
The SEC at 30∘ S occupies the first ∼ 700 m of the water column at depths above 27.23 kg m−3, occupying large extensions of ∼ 2700 km between 18.4∘ W and 8.5∘ E for the cruise included in the 1990–1999 solution, 19.0∘ W and 7.6∘ E for the cruise in 2000–2009, and 19.8∘ W and 9.0∘ E for the recent cruise included in the solution for 2010–2019 (Fig. 5j and Table 2). The SEC net northward transports of mass (16.9 ± 1.9, 14.6 ± 2.1, and 15.9 ± 1.9 Sv; Fig. 2) and heat (0.86 ± 0.09, 0.76 ± 0.10, and 0.80 ± 0.09 PW; Fig. 3) show similar values among realizations, with null values for the freshwater flux.
At 24∘ S the SEC becomes slightly shallower, with depths of ∼ 625 m for the 27.23 kg m−3 γn interface. However, on its way northwestward, it expands horizontally, occupying longitudinal extensions of ∼ 3300 km between 24.2∘ W and 7.4∘ E for the cruise within 2000–2009 and 26.1∘ W and 7.6∘ E for the one within 2010–2019 (Fig. 5g and Table 2). The transports associated with the SEC are similar to those at 30∘ S, with stable values of 16.5 ± 1.7 and 16.5 ± 1.6 Sv for mass transport and 1.00 ± 0.10 and 1.04 ± 0.10 PW for heat transport (Figs. 2 and 3). The values at 19∘ S show the SEC reaching depths of ∼ 515 m for the same 27.23 kg m−3 lower interface, while maintaining a similar horizontal extent (∼ 3200 km) over longitudes 23.2∘ W and 7.0∘ E (Fig. 5d and Table 2). The mass transport at this latitude decreases significantly (9.0 ± 1.9 Sv), accompanied by a reduction in heat transport (0.60 ± 0.11 PW).
The salinities present in the South Atlantic are subject to the intense surface evaporation in the region between 8 and 25∘ S. The SEC starts carrying waters at 30∘ S with TW temperatures of 12.85, 13.22, and 12.70 ∘C and TW salinities of 35.060, 35.142, and 35.179. Those properties increase on its way northwestward, reaching TW temperatures at 24∘ S of 15.35 and 15.94 ∘C and TW salinities of 35.451 and 35.537 for the last 2 decades. At 19∘ S, the SEC carries waters with TW temperature of 16.90 ∘C and TW salinity of 35.644.
3.1.5 North Brazil Current
The northward North Brazil Current (NBrC) carries warm water from the South Atlantic along the coast of Brazil, across the Equator, and into the Northern Hemisphere, acting as a conduit for cross-equatorial transport of upper-ocean waters as part of the AMOC. This northward branch of the SEC can be found at 11∘ S (Fig. 5a, b and Table 2), sampled in the 1990–1999 decade, extending from the coast to 34.7∘ W over 130 km. Its vertical structure presents two maximums in the circulation, with a surface layer from the surface to 26.14 kg m−3 (∼ 203 m) and a subsurface layer from 26.45 to 27.00 kg m−3 (∼ 400 to ∼ 500 m), carrying 5.0 ± 0.4 and 5.7 ± 0.3 Sv, respectively. The total equatorward transport is 17.0 ± 1.2 Sv of mass and 0.98 ± 0.05 PW of heat, associated with a southward freshwater flux of −0.19 ± 0.03 Sv (Figs. 2, 3, and 4). The strong current estimated agrees with the 15-month mean value of 16 ± 2 Sv obtained by Garzoli (2004) from Inverted EchoSounders (IESs) and is slightly lower than the Argo-based solutions of Tuchen et al. (2022) of 21.8 Sv. The NBrC presents higher TW temperatures (14.59 ∘C) and salinities (35.509) than the ones found at 19∘ S for the BrC.
3.1.6 Florida Current
The Florida Current (FC) stretches over ∼ 70 km from the Florida Straits up to Cape Hatteras (Fig. 1), mainly sourced from the Loop Current coming from the Gulf of Mexico (Maul and Vukovich, 1993) and, to a lesser extent, from the Antilles Current (AC), transporting warm waters northward (Fig. 6h and Table 2) in a water column ∼ 600 m deep. The FC shows different values of mass transport across time (34.5 ± 0.3, 32.1 ± 0.3, and 31.3 ± 0.3 Sv for the cruises within 1990–1999, 2000–2009, and 2010–2019 decades, respectively; Fig. 2), also manifested in its heat transport (2.70 ± 0.02, 2.43 ± 0.02, and 2.31 ± 0.02 PW; Fig. 3), combined with TW temperature (19.84, 19.16, and 18.65 ∘C). The freshwater flux associated with the FC, although not as important as the heat transport, also presents relatively high southward values (−0.17 ± 0.01, −0.09 ± 0.01, and −0.14 ± 0.01 Sv; Fig. 4), associated with quite stable values of TW salinity (36.120, 36.201, and 36.098), with differences of less than 0.1.
Our results can be compared with the nearly continuous monitoring of the FC transport since 1982 at 27∘ N from submarine cable measurements, which yields an average transport of 31.8 ± 0.1 Sv (Piecuch, 2020), with decadal values of 32.5 ± 1.2 Sv for 1990–1999, 32.4 ± 1.0 Sv for 2000–2009, and 31.9 ± 0.6 Sv for 2010–2019 for the 95 % percentile. These results agree with the FC transports estimated from the inverse models, although the value for the cruise carried out during 1990–1999 is slightly larger. Its mean seasonal cycle has a 3.3 Sv annual periodicity, with maxima in mid-July and minima in mid-January (Atkinson et al., 2010), linking its variability to the North Atlantic Oscillation (Baringer and Larsen, 2001) coupled with a long-term weakening (Piecuch, 2020).
3.1.7 Antilles Current
At the western coast of the subtropical North Atlantic, the Antilles Current (AC) flows northward and then northwestward around the Bahamas (Fig. 1) before joining the FC and Gulf Stream (GS). The AC at 24∘ N occupies the first ∼ 700 m of the water column, from the surface to 27.23 kg m−3, but presents different longitudinal extensions among cruises (125 km from Cape Hatteras to 74.3∘ W in 1990–1999 and ∼ 38 km from Cape Hatteras to 76.4 and 76.7∘ W in 2000–2009 and 2010–2019, respectively).
The values of mass transport for the AC show similar values for the first two cruises and a sharp decrease for the most recent estimation (12.8 ± 1.0, 13.2 ± 0.4, and 7.5 ± 0.3 Sv), with a similar pattern for its heat transport (0.98 ± 0.07, 0.97 ± 0.03, and 0.56 ± 0.02 PW), as shown in Fig. 6g–h and Table 2. The decreasing values in heat transport can be attributed to a combination of a reduction in mass transport and in TW temperature (18.59, 18.23, and 18.05 ∘C). The freshwater flux of the AC presents low values (−0.04 ± 0.01, −0.02 ± 0.01, and −0.02 ± 0.01 Sv), associated with similar TW salinities among decades (36.258, 36.377, and 36.359).
Our results show relatively strong values for the AC (Figs. 2 and 3), similar to the values obtained by Hernández-Guerra et al. (2014). However, historical estimations place the average AC transport in a range of 2–12 Sv (Lee et al., 1996; Olson et al., 1984; Schmitz et al., 1992; Schmitz and McCartney, 1993). More recently, a combination of different observation systems at 26.5∘ N from 2005–2015 shows a relatively weak AC of 4.7 Sv with a daily standard deviation of 7.5 Sv (Meinen et al., 2019), with transports varying between −15 and 25 Sv (Johns et al., 2008), despite presenting a rather weak seasonal component (Meinen et al., 2019).
3.1.8 Canary Current
The Canary Current (CC) is the relatively weak eastern boundary current of the North Atlantic subtropical gyre, linking the Azores Current with the North Equatorial Current (Pérez-Hernández et al., 2013; Casanova-Masjoan et al., 2020b; Comas-Rodríguez et al., 2011). The CC flows along the first ∼ 750 m of the water column (Pérez-Hernández et al., 2013; Hernández-Guerra et al., 2017; Casanova-Masjoan et al., 2020b) from the surface to 27.23 kg m−3 and with a width over ∼ 270 km (Fig. 6h, i and Table 2). The different geographical position of the stations at this boundary for the cruise carried out during 1990–1999 prevents obtaining values directly comparable to the other estimates. At these latitudes there is a point of inflection in the accumulated mass transport denoting the start of the CC, from non-significant values to negative mass transport. This current transports −5.1 ± 0.9, −6.1 ± 1.4, and −4.8 ± 0.7 Sv of mass (Fig. 2), −0.34 ± 0.06, −0.40 ± 0.08, and −0.32 ± 0.05 PW of heat (Fig. 3), and 0.01 ± 0.01, 0.03 ± 0.01, and 0.01 ± 0.01 Sv of freshwater southward (Fig. 4). Moreover, this current carries waters with TW temperatures lower than its western counterpart (16.57, 16.59, and 16.86 ∘C) and similar high TW salinities (36.283, 36.313, and 36.372).
The CC has an average transport of −3.0 ± 1.0 Sv with a seasonal amplitude of 1.4 ± 0.7 Sv (Machín et al., 2006; Pérez-Hernández et al., 2023). The CC varies seasonally not only in intensity but also in position, migrating from its easternmost location in spring to its westernmost point in fall. Our estimations are nearly double the results obtained by Hernández-Guerra et al. (2014) for the same cruises of 2.1 ± 0.9 Sv for 1992 and 2.3 ± 1.1 Sv for 2011 between the eastern boundary and 20∘ W, a well as the 2.9 ± 0.8 Sv of Machin et al. (2006). Nevertheless, most of the previous CC observations have taken place in fall when the transports have been observed to be as high as −6.2 ± 0.6 Sv with a northward recirculation in the Lanzarote Passage (Pérez-Hernández et al., 2013; Hernández-Guerra et al., 2017).
East of the CC, the Lanzarote Passage presents a unique dynamic, with its own pattern of variability that has been related to the seasonal amplitude of the AMOC (Pérez-Hernández et al., 2015; Vélez-Belchí et al., 2017; Pérez-Hernández et al., 2023). Our results for the cruises carried out during 2000–2009 and 2010–2019 have found −1.0 ± 0.6 and −1.8 ± 0.6 Sv over ∼ 70 km, respectively, carrying waters with similar TW temperature and salinity. These values correspond to the spring–summer estimates for the Lanzarote Passage flow of −0.81 ± 1.48 Sv estimated with 9 years of mooring data (Casanova-Masjoan et al., 2020b; Fraile-Nuez et al., 2010).
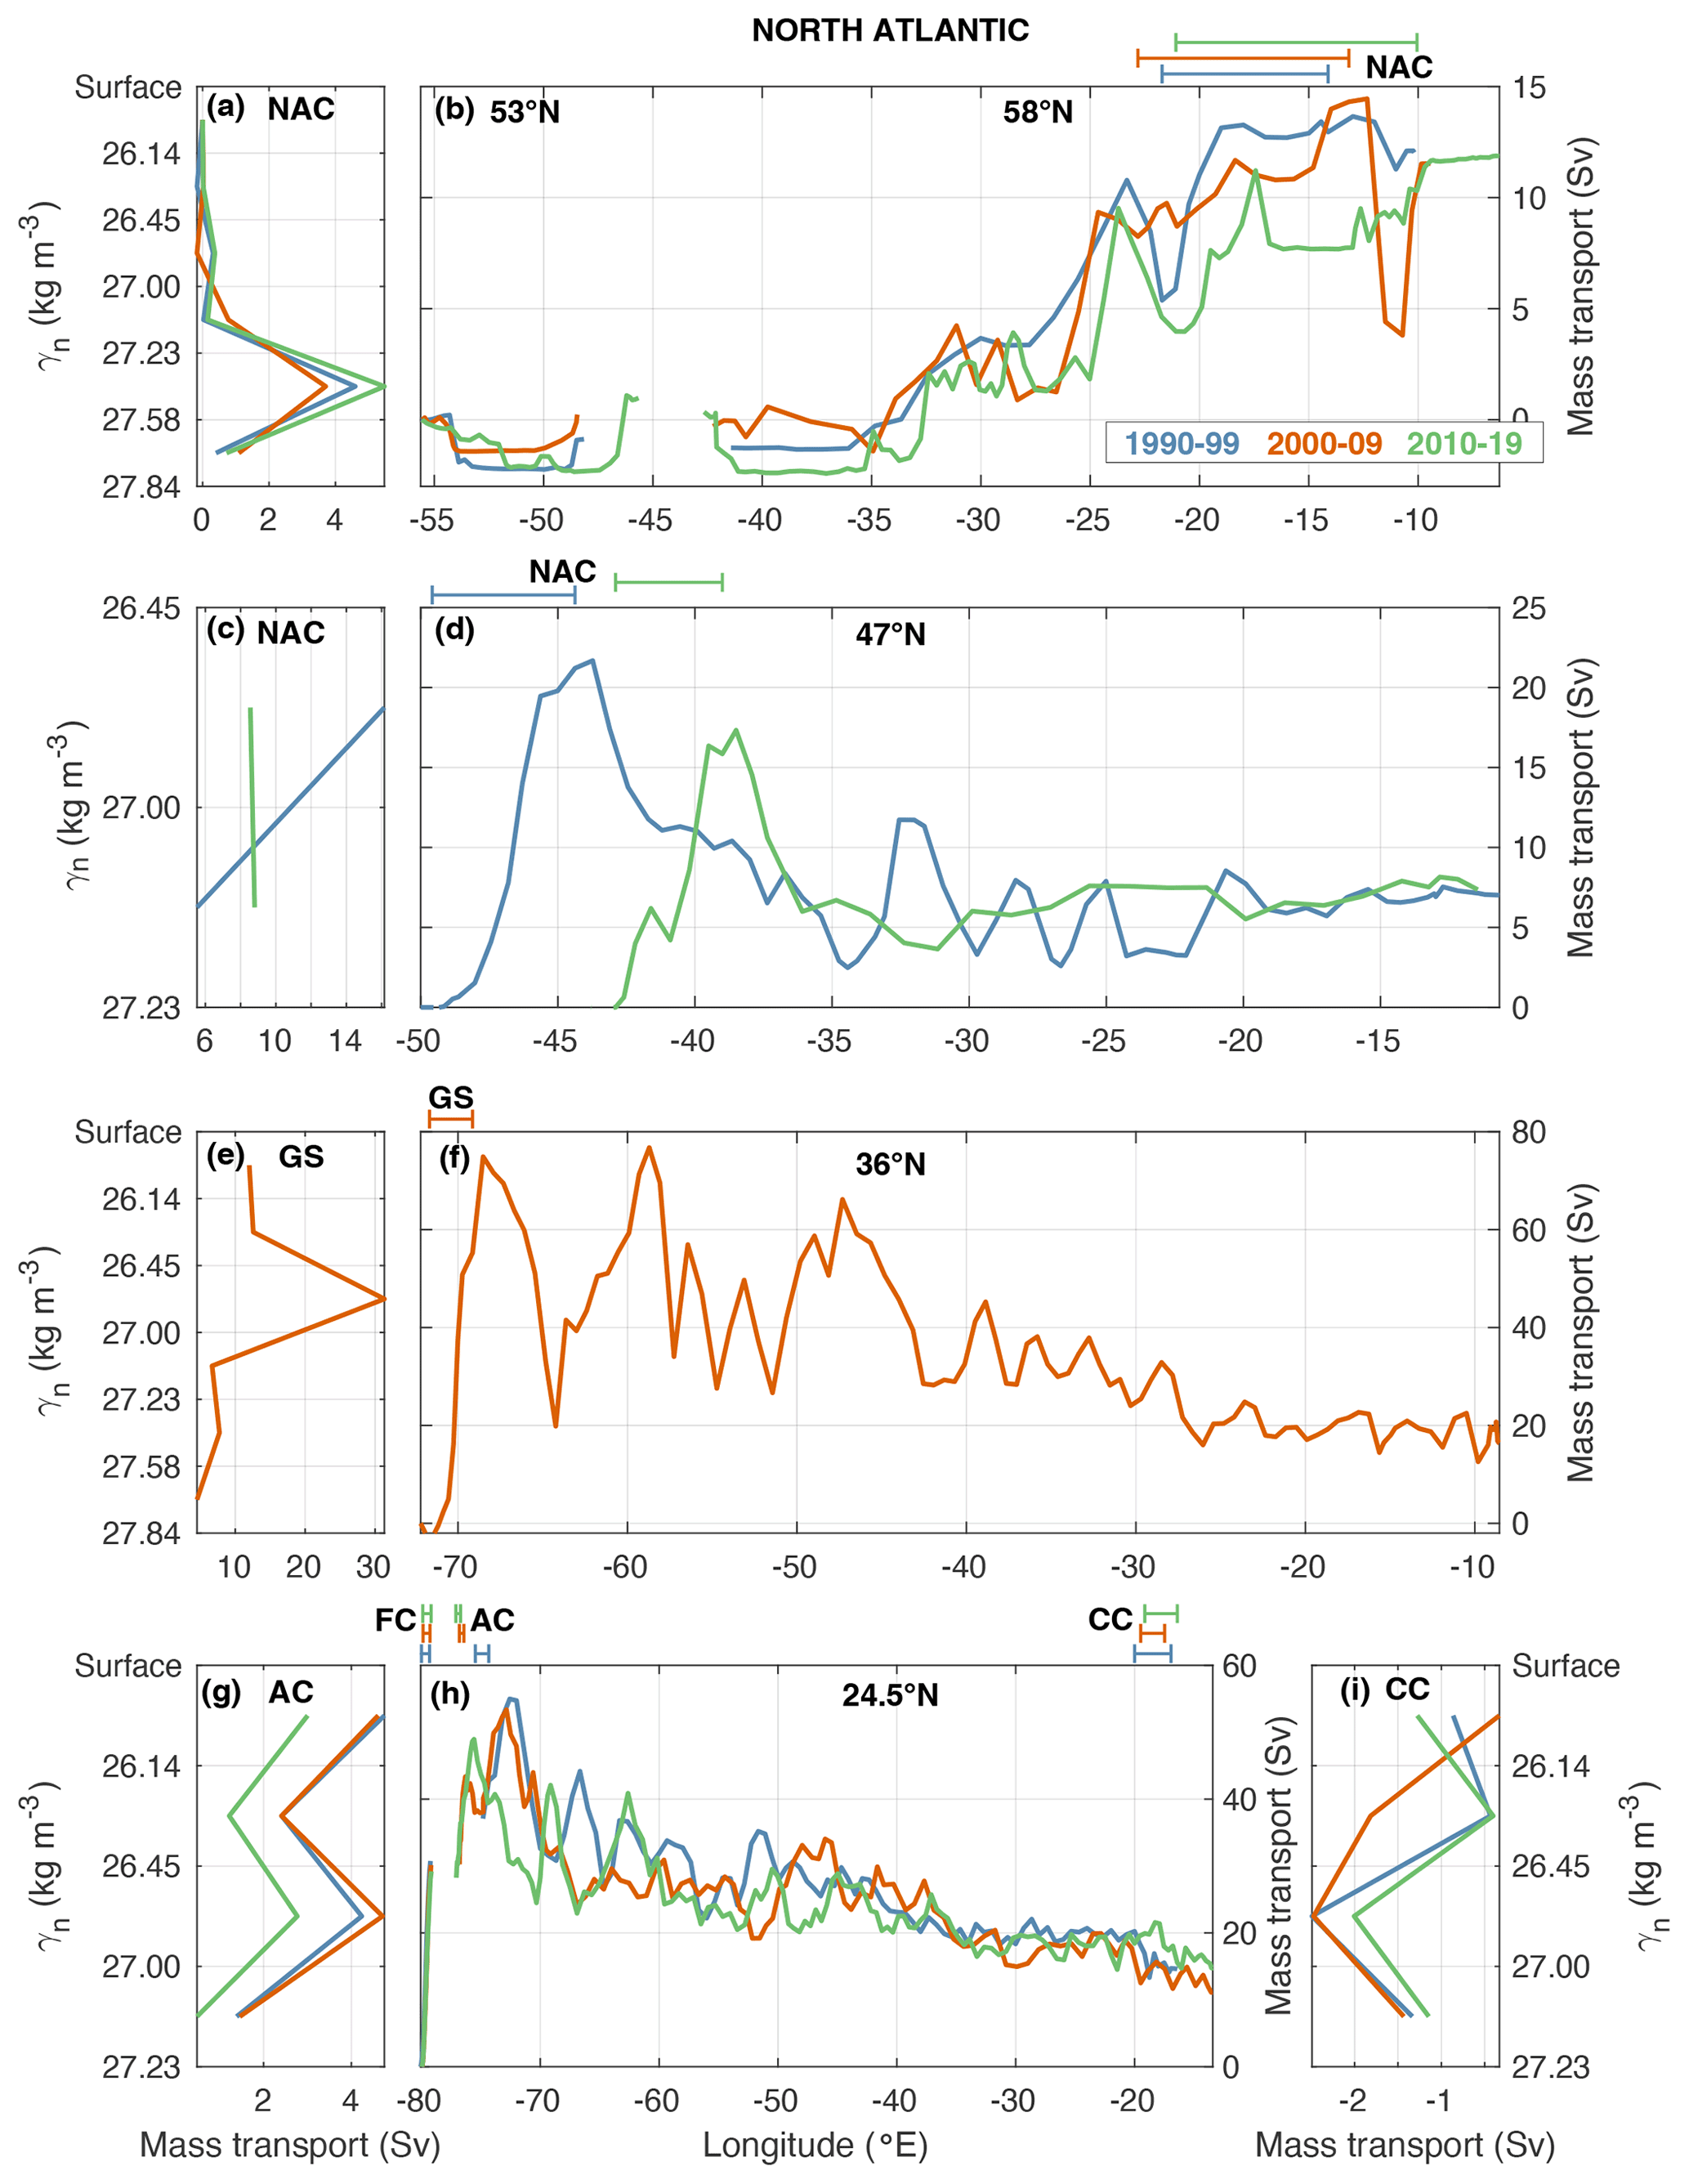
Figure 6Surface currents in the North Atlantic for different latitudes and decades. Net mass transport (Sv) per layer defined between neutral density interfaces for the northward North Atlantic Current (NAC) at 47∘ N (a) and 53∘ N + 58∘ N (c), Gulf Stream (GS) at 36∘ N (e), Antilles Current (AC) at 24.5∘ N (g), and southward Canary Current (CC) at 24.5∘ N (i). The transport per layer is computed using the stations and layers specified in Table 2. The longitudinal ranges of the currents at each latitude appear on the top of the middle panel. Different colours denote the use of the model solutions in blue for 1990–1999, orange for 2000–2009, and green for 2010–2019. The right panels show the eastward accumulated horizontal mass transport (Sv) for upper layers for the 58∘ N (b), 47∘ N (d), 36∘ N (f), and 24.5∘ N (h) sections.
3.1.9 Gulf Stream
The strong Gulf Stream (GS) brings warm water from the Gulf of Mexico into the North Atlantic subtropical gyre including water from the FC and AC (Figs. 2 and 3). After the GS turns offshore from the continental shelf at Cape Hatteras, the mass transport carried by the GS nearly doubles at a rate of 8 Sv every 100 km, with large variations in space and time (Johns et al., 1995; Hogg and Johns, 1995; Frankignoul et al., 2001). The section at 36∘ N sampled during the 2000–2009 decade can detect its strength along the coast, occupying the first ∼ 900 m of the water column (up to 27.84 kg m−3) and with a horizontal extension over ∼ 250 km from 71.7 to 69.1∘ W. The GS has a strong northward transport of 74.9 ± 1.7 Sv for mass and 4.56 ± 0.11 PW for heat, as well as a strong southward freshwater flux of −0.82 ± 0.04 Sv (Fig. 6e, f and Table 2). McDonagh et al. (2010) found similar values of 67.2 ± 17.2 Sv for the GS transport at 36∘ N, and Rossby et al. (2014) detected no significant trends in the strength of the GS surface transport over the last 20 years using direct measurements. Almost half of the northward transport associated with the GS is recirculated southward, up to 64.8∘ W (387 km east to the east of the GS). This recirculation of the GS brings southward −35.4 ± 8.7 Sv of mass transport and −2.29 ± 0.18 PW of heat transport, with an opposing freshwater flux of 0.19 ± 0.05 Sv.
The GS presents high TW temperature (15.42 ∘C), but not as high as for the FC and AC, and a similar value of TW salinity (36.014) compared with FC and AC.
3.1.10 North Atlantic Current
The North Atlantic Current (NAC) is a variable wind-driven body of warm water covering a large part of the eastern subpolar North Atlantic (SPNA) on its way to the Nordic Seas. The NAC represents the bulk of the GS after its branch point and subsequent separation from the coast (Fig. 2). The NAC at 47∘ N is located between 49.6 and 44.4∘ W for the 1990–1999 cruise and between 42.9 and 39.0∘ W for the 2010–2019 cruise due to the difference in the geometry of the two cruises, reaching similar depths of 838 and 982 m from 26.45 to 27.23 kg m−3, respectively. The mass transports for NAC at 47∘ N are consistent with those of the net GS system after considering its recirculation, the small contribution that recirculates within the subtropical gyre (see Canary Current), and the −1.9 ± 2.3 Sv and −1.3 ± 2.1 Sv that sink between the 24 and 47∘ N sections for each decade, respectively (Caínzos et al., 2022). Thus, the NAC transports 33.4 ± 2.9 and 28.2 ± 1.5 Sv in the solutions for the 1990–1999 and 2010–2019 decades, respectively (Fig. 6c, d and Table 2). The main mass transport is subsuperficial with a mass transport of 21.7 ± 2.0 and 17.3 ± 0.8 Sv in the layer between 26.45 (∼ 200 m) and 27.23 kg m−3 (∼ 400 m) in 1990–1999 and 2010–2019, respectively. Meinen and Watts (2000), using current meter moorings and IES, attributed a much higher value of 146 ± 13 Sv to the NAC at 42∘ N for the whole water column, located close to our hydrographic section at 47∘ N carried out during 1990–1999. A more recent study combining altimetry and Argo data reconstructed the transports of NAC from 1993–2016 between 40 and 53∘ N, attributing values between 35 and 50 Sv along 47∘ N between 45 and 37∘ W (Stendardo et al., 2020). Our estimations for heat transport are lower than those of the GS (1.79 ± 0.14 and 1.18 ± 0.05 PW, respectively) due to the reduction in the TW temperature (13.53 and 10.59 ∘C) on its way northward. The freshwater flux has also been reduced (−0.22 ± 0.04 and −0.09 ± 0.02 Sv), resulting from the lower values in TW salinity (35.722 and 35.368).
The NAC flows northeastward and reaches the section at 58∘ N (Figs. 6a, b, 7f and Table 2). At this latitude, the NAC extends longitudinally between 21.7 and 14.1∘ W, 22.8 and 13.2∘ W, and 21.1 and 10.1∘ W for each of the three cruises within the 1990–1999, 2000–2009, and 2010–2019 decades, respectively, with a vertical extension from the surface to 27.84 kg m−3 (∼ 1000 m). The strength of the current has been largely reduced at this point, with net mass transports of 5.2 ± 3.7, 5.4 ± 2.7, and 6.7 ± 1.6 Sv (Fig. 2) and heat transport of 0.19 ± 0.13, 0.20 ± 0.10, and 0.25 ± 0.05 PW (Fig. 3). This corresponds to a 20 to 25 Sv reduction in the transport of the NAC crossing the SPNA, with nearly one-fifth corresponding to a sink at these latitudes (3.8 ± 3.1 Sv between 47 and 55∘ N, 4.8 ± 2.7 Sv between 36 and 55∘ N, and 4.0 ± 2.4 Sv between 47 and 55∘ N; Caínzos et al., 2022).
Stendardo et al. (2020) found an average value of 2.5 Sv for the NAC at this latitude, which is slightly lower than our estimations. Moreover, recent glider sections from July 2014 to August 2016 along 58∘ N from 21 to 15∘ W (Houpert et al., 2018) over the Rockall Trough branch have provided a year mean absolute geostrophic mass transport of 5.1 ± 1.0 Sv, with 6.7 ± 0.9 Sv for summer and 2.8 ± 1.7 Sv for winter, comparable to our estimations at 58∘ N.
The freshwater flux at this latitude is almost negligible (0.03 ± 0.02, 0.00 ± 0.01, and −0.01 ± 0.01 Sv). Both TW temperature and salinities have become colder and fresher, with quite stable values for both properties (9.12, 9.27, and 9.29 ∘C for the TW temperature and 35.290, 35.347, and 35.292 for the TW salinity).
3.1.11 East Reykjanes Ridge Current, Irminger Current, and East Greenland Current
The surface currents on the eastern part of the northernmost section, at the nominal latitude of 58∘ N, are an important link between the Arctic Ocean and the North Atlantic Ocean via their upper circulation (Fig. 1). Within the Iceland Basin, the NAC flows cyclonically, turning southwestward and flowing along the Reykjanes Ridge flank as the East Reykjanes Ridge Current (ERRC), which then turns anticyclonically around and across the ridge (Pollard et al., 2004). Thus, upon entering the Irminger Sea, the Irminger Current (IC) flows northward along the western flank of the Reykjanes Ridge, carrying warm, saline Atlantic waters. Petit et al. (2019) have described the along-stream evolutions of the structure and properties of the ERRC and IC. They found interconnections between the two flows governed by the complex bathymetry of ridges and basins.
The ERRC runs along the eastern side of the Reykjanes Ridge and Iceland over ∼ 80 km, exporting waters southward in the upper layers up to 27.84 kg m−3 (∼ 1000 m deep), with relatively high values of TW temperature and salinity (Fig. 7e, g and Table 2). We have found low values of mass transport for the southward-flowing ERRC (−3.2 ± 2.2, −1.8 ± 1.4, and −2.0 ± 0.8 Sv for each cruise; Fig. 2). Using repeated ship-based measurements along the Greenland–Portugal OVIDE line, Daniault et al. (2016) have estimated the decadal mean circulation for the North Atlantic over 2002–2012, with values for the ERRC transport slightly larger than ours (−4.1 ± 0.6 Sv). The associated heat transport is quite small (−0.10 ± 0.07, −0.06 ± 0.04, and −0.06 ± 0.02 PW; Fig. 3), and the freshwater flux is null (0.00 ± 0.01 Sv for all cases; Fig. 4). The TW temperatures (8.14, 8.45, and 7.79 ∘C) and salinities (35.131, 35.070, and 35.082) are slightly lower than those of NAC.
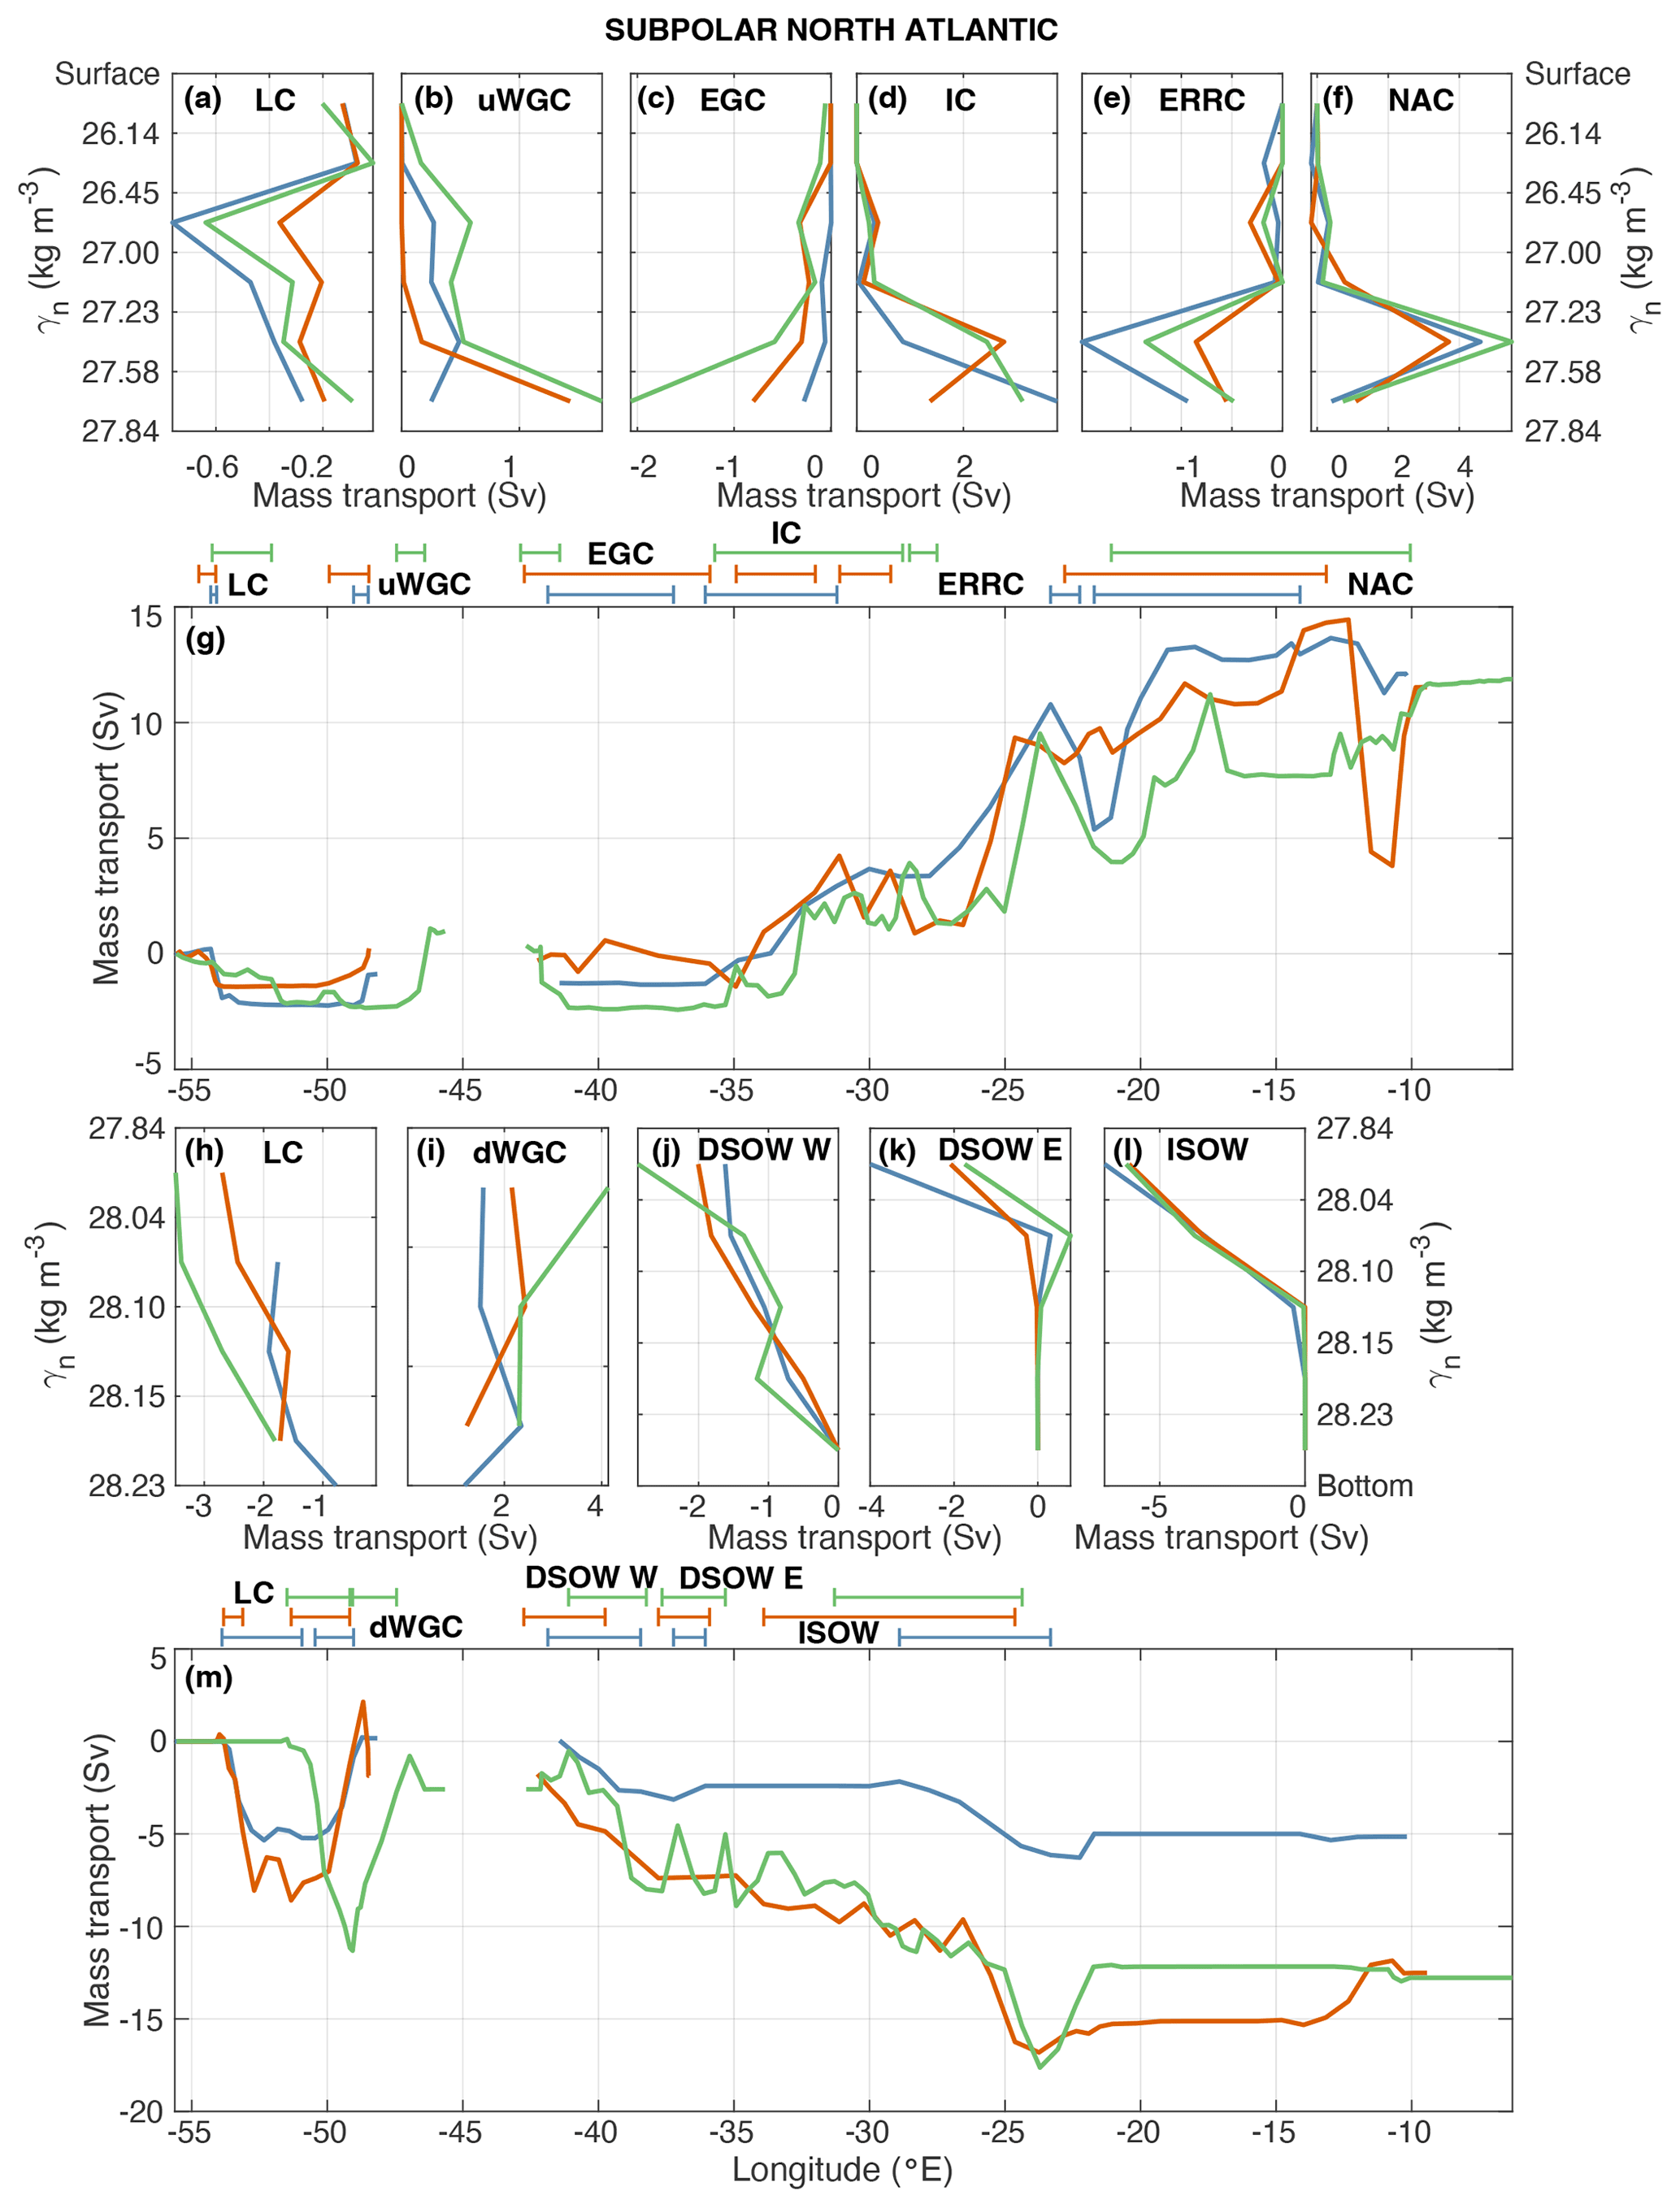
Figure 7Upper and deep currents in the subpolar North Atlantic at 53∘ N + 58∘ N for the 3 decades. Net mass transport (Sv) per layer is defined between neutral density interfaces at 53∘ N + 58∘ N for upper layers: upper Labrador Current (LC; a), upper West Greenland Current (uWGC; b), East Greenland Current (EGC; c), Irminger Current (IC; d), East Reykjanes Ridge Current (ERRC; e), and North Atlantic Current (NAC; f). It is also defined for deep layers: deep Labrador Current (LC; h), deep West Greenland Current (dWGC; i), west and east Denmark Strait Overflow Water (DSOW; j and k), and Iceland–Scotland Overflow Water (ISOW; l). The transport per layer is computed using the stations and layers specified in Tables 2 and 3. The longitudinal ranges of the currents at each latitude appear on the top of the middle panel. Different colours denote the use of the model solutions in blue for 1990–1999, orange for 2000–2009, and green for 2010–2019. The panels below the vertical net transport show the eastward accumulated horizontal mass transport (Sv) at 53∘ N + 58∘ N for upper (g) and deep (m) layers.
On the other side of the Reykjanes Ridge, the ∼ 300 km wide IC transports waters from the SPNA toward the Arctic Ocean in the upper ∼ 700 m, with a shallowing of the 27.84 kg m−3 isopycnal (Fig. 7d, g and Table 2). The northward transport of mass (5.0 ± 2.7, 4.7 ± 1.9, and 6.1 ± 1.2 Sv; Fig. 2) agrees with the result obtained by Daniault et al. (2016; 4.8 ± 1.1 Sv) and Sarafanov et al. (2012; 5.6 ± 0.4 Sv). Casanova-Masjoan et al. (2020a) obtained 3.04 ± 0.23 Sv for the Irminger Current around Iceland, 2.24 ± 0.23 Sv of which flows north as part of the North Icelandic Irminger Current (NIIC). However, other studies have attributed IC transports in the range of 9–12 Sv (Våge et al., 2011b; Lherminier et al., 2010; Bacon, 1997). There is also a northward transport of heat (0.13 ± 0.06, 0.15 ± 0.05, and 0.17 ± 0.03 PW), although with null values for the freshwater flux. The values of TW temperature (6.37, 8.12, and 6.91 ∘C) and salinity (34.991, 35.105, and 35.019) are, again, slightly lower than those from the ERRC.
Flowing southward along the eastern coast of Greenland, the East Greenland Current (EGC) exports cold and freshwater from the Arctic into the SPNA (Fig. 7c, g and Table 2). The values of net southward mass transport are small but strengthen with time (−0.4 ± 0.6, −1.6 ± 1.8, and −3.3 ± 1.0 Sv; Fig. 2), with almost null heat transports (−0.01 ± 0.01, −0.04 ± 0.04, and −0.06 ± 0.02 PW; Fig. 3) and null freshwater flux (Fig. 4). We have found variable transports for the EGC, relatively weaker than previous estimations (−3.8 ± 0.3 Sv from Daniault et al., 2016; −5.4 ± 0.7 from Sarafanov et al., 2012; −3.5 ± 0.5 Sv from le Bras et al., 2018). The TW temperatures (5.94, 6.60, and 4.42 ∘C) and salinities (34.938, 34.826, and 34.560) show the lower values found in the upper layers of the 58∘ N section.
3.1.12 Upper West Greenland Current and upper Labrador Current
The EGC turns northwest at the southern tip of Greenland, entering the Labrador Sea and originating the upper West Greenland Current (uWGC) at 53∘ N. The uWGC varies horizontally, ranging from the coast to 49.0∘ W (67 km), 49.9∘ W (164 km), and 47.4∘ W (75 km) for each decade, as well as vertically (from the surface to 262, 1232, and 788 m). The waters entering the Labrador Sea have a small but variable net transport for mass (1.3 ± 0.4, 1.6 ± 1.0, and 3.4 ± 1.0 Sv; Fig. 2), with an intensification for the last cruise studied (Fig. 7b, g and Table 2). These values are lower than the average transports of uWGC estimated previously: 3.8 ± 0.9 Sv (Myers et al., 2007) at Cape Farewell; 3.2 ± 2.3 and 5.5 ± 3.9 Sv at Cape Farewell and Cape Desolation, respectively (Myers et al., 2009), and 4.6 Sv at both Cape Farewell and Cape Desolation (Gou et al., 2022). More recent estimations have placed the upper transport via the eastern basin of the Labrador Sea at 11.1 ± 5.0 Sv (Pacini et al., 2020). The values for heat (0.01 ± 0.01, 0.03 ± 0.02, and 0.05 ± 0.02 PW; Fig. 3) and freshwater (0.01 ± 0.01, 0.00 ± 0.01, and 0.04 ± 0.01 Sv; Fig. 4) transports are negligible except for the last estimate. These values can reflect the mean value obtained from 7 decades of high-resolution coupled ice–ocean model results, with mean annual fluxes between 99 and 162 mSv (Florindo-López et al., 2020). The TW temperatures (2.74, 4.62, and 3.57 ∘C) and salinities (34.126, 34.857, and 34.332) have yet again become colder and fresher.
The net export of the water formed in the Labrador Sea is through its southwestern border, as part of the Labrador Current (LC). The net transport can be divided into the upper and deep layer, setting the interface at a neutral density of 27.84 kg m−3, up to a depth of ∼ 400 m. The upper LC extends from 54.3 to 54.1∘ W, 54.8 to 54.1∘ W, and 54.2 to 52.1∘ W, occupying 26, 80, and 151 km. The upper layers of the LC transport out of the Labrador basin −2.1 ± .05, −1.2 ± 0.4, and −1.6 ± 0.4 Sv of mass transport (Fig. 2), with null values for either heat or freshwater flux (Fig. 7a, g and Table 2). This southward export is lower than estimations from mooring data (−6.3 ± 0.2 Sv 10-year mean by Fischer et al., 2010; −8.3 ± 0.5 Sv 17-year mean by Zantopp et al., 2017) and hydrographic sections (−6.3 Sv mean over 1996–2003 by Li and Lozier, 2018). The TW temperatures in this upper layer are very cold (0.45, 0.98, and 0.22 ∘C), associated with low salinities (33.569, 33.630, and 33.455).
3.2 Deep currents
3.2.1 Iceland–Scotland Overflow Water and Denmark Strait Overflow Water
The deep layers of the east part of the northernmost section (at 58∘ N) constitute the overflow waters, divided into the Iceland–Scotland Overflow Water (ISOW) and the Denmark Strait Overflow Water (DSOW). The ISOW flows between the Scottish and Icelandic platforms, exporting water from the Arctic into the Atlantic from ∼ 2100 m to the bottom of the water column. The longitudinal extension of the ISOW is similar for all decades (335 km from 28.9 to 23.3∘ W, 567 km from 33.9 to 24.6∘ W, and 416 km from 31.3 to 24.4∘ W for the cruises carried out during 1990–1999, 2000–2009, and 2010–2019, respectively; Fig. 7l, m and Table 3). There is a net southward transport of −10.8 ± 6.5, −9.6 ± 5.3, and −10.0 ± 3.0 Sv of mass across those longitudes (Fig. 2), accompanied by a southward transport of heat (−0.13 ± 0.09, −0.11 ± 0.07, and −0.12 ± 0.04 PW; Fig. 3). Our results can be overestimated due to the low values of southward transport for both EGC and ERRC. Previous estimations for ISOW are considerably weaker than our results. García-Ibáñez et al. (2015) built an inverse model for the SPNA, discussing the contributions from source water masses and estimating for deep layers −1.4 ± 1.0 Sv of ISOW being exported out of the eastern North Atlantic. Moreover, using an array of current meters deployed as part of OSNAP, Johns et al. (2021) have determined a mean southward flow of ISOW along the eastern flank of the Reykjanes Ridge of −5.3 ± 0.4 Sv between 2014 and 2018. The TW temperatures (3.07, 3.04, and 3.08 ∘C) and salinities (34.943, 34.944, and 34.958) are quite stable among decades.
The DSOW has been divided into two main paths, flowing along the boundaries of the Irminger Sea. The DSOW flowing at the western side of the Reykjanes Ridge (eastern boundary of Irminger Sea) extends ∼ 110 km between 37.2 and 36.1∘ W, 37.8 and 35.9∘ W, and 37.7 and 35.3∘ W for each inverse solution, respectively (Fig. 7k, m and Table 3). This path of the DSOW exports between ∼ 2500 m and the bottom layers −3.7 ± 8.2, −2.4 ± 8.0, and −0.9 ± 4.6 Sv of mass transport per decade (Fig. 2), with low associated heat transports (−0.05 ± 0.10, −0.03 ± 0.10, and −0.02 ± 0.06 PW; Fig. 3). The TW temperatures are slightly higher than those of ISOW (3.28, 3.50, and 4.27 ∘C), but with lower salinities except for the last estimate (34.886, 34.908, and 34.955).
The western branch of the DSOW extends over ∼ 180 km from the coast and from ∼ 2000 m to the bottom of the water column. This current flowing along the western boundary of the Irminger Sea (Fig. 7j, m and Table 3) has a slightly stronger export of water southwards (−4.9 ± 7.8, −5.5 ± 6.8, and −6.2 ± 4.9 Sv; Fig. 2), with similarly low values of heat transport (−0.04 ± 0.10, −0.05 ± 0.09, and −0.06 ± 0.07 PW; Fig. 3) and null freshwater flux (Fig. 4). The TW temperatures (2.29, 2.45, and 2.54 ∘C) are lower than on the western boundary of the Irminger Sea, while maintaining similar TW salinities (34.904, 34.911, and 34.915).
The combined values for both paths of DSOW exceed the year-long mean total volume transport of DSOW upstream of our section. Hydrographic sections over different summers at the Denmark Strait yielded −4.9 ± 0.5 Sv southward (Brearley et al., 2012), while mooring arrays at the northern part of the Denmark Strait estimated −3.54 ± 0.16 Sv (Harden et al., 2016), similar to results from downstream of the sill (3.4 Sv with a standard deviation of 1.4 Sv, Jochumsen et al., 2012). This increase in DSOW southward of the Denmark Strait may respond to the entrainment of water from the Irminger Current, nearly doubling the volume transport carried by the DSOW (Koszalka et al., 2013; Dickson et al., 2008).
3.2.2 Deep West Greenland Current and deep Labrador Current
Analogously to the uWGC, there is a northward deep transport entering the Labrador Sea via its eastern boundary, the deep West Greenland Current (dWGC) occupying ∼ 220 km from the coast to the interior of the Labrador Sea and flowing along the lower part of the water column (from ∼ 3500 m to the bottom). This current carries into the Labrador basin 5.4 ± 1.0, 5.8 ± 1.1, and 8.8 ± 1.5 Sv of mass transport (Fig. 2) for the cruises within 1990–1999, 2000–2009, and 2010–2019, respectively (Fig. 7i, m and Table 3). This last value is comparable with the 8.3 ± 2.8 Sv found by Pacini et al. (2020) using high-resolution moorings from 2014–2018 deployed as part of OSNAP. The increase in transport for the last estimate is also evident for heat transport (0.04 ± 0.01, 0.04 ± 0.01, and 0.07 ± 0.01 PW; Fig. 3), with null freshwater flux (Fig. 4). The dWGC is slightly colder (TW temperatures of 1.84, 1.93, and 2.04 ∘C) and saltier (TW salinities of 34.900, 34.888, and 34.908) than the uWGC, with lower temperature and salt content than the western branch of the DSOW.
Deep layers export most of the LC out of the Labrador Sea through its western boundary. It is a relatively narrow current, extending over 364, 89, and 424 km, with its upper vertical interface ranging from 2615, 1956, and 2314 m deep to the bottom for each decade. This outflow of mass transport increases with time (−5.2 ± 0.9, −8.4 ± 3.9, and −11.4 ± 6.8 Sv; Fig. 2), although not significantly, due to the high variability associated with the deep LC, expressed as large values of uncertainties around half of the mean value (Fig. 7h, m and Table 3). However, other studies have found stronger deep-water transports: 26 ± 5 Sv from 2 years of direct current observations and a moored current meter array (Fischer et al., 2004), updated to 30 ± 3 Sv for the 10-year mean (Fischer et al., 2010) and an average of 30.2 ± 6.6 Sv over the past 17 years from moorings and shipboard station data (Zantopp et al., 2017). These differences may arise due to the strong barotropic component observed for this current that inverse solutions fail to resolve. Heat is also exported out of the Labrador Sea via deep layers, with values of -0.04 ± 0.01, −0.07 ± 0.05, and −0.11 ± 0.09 PW for each decade (Fig. 3), respectively. Freshwater fluxes remain almost negligible. The TW temperatures and salinities are warmer (1.92, 2.24, 2.37 ∘C) and saltier (34.900, 34.893, and 34.911) than for upper layers, with values similar to those of the western DSOW.
3.2.3 Deep western boundary current
The deep western boundary current (DWBC) mainly follows the western border of the Atlantic Ocean. The DWBC at 47∘ N lies below the neutral density of 27.84 kg m−3 (∼ 2800 m to the bottom) and occupies a similar longitudinal extension as the upper northward NAC (∼ 280 km) (Fig. 8a, b and Table 3). The DWBC flows southward at 47∘ N with a mass transport of similar magnitude (−30.1 ± 10.4 and −37.5 ± 5.7 Sv for the cruises carried out during 1990–1999 and 2010–2019, respectively; Fig. 2). These values for the DWBC exceed the −17.5 Sv estimated by Fischer et al. (2015) at the Grand Banks with ADCP velocities. The DWBC at this latitude also transports a southward heat transport (−0.31 ± 0.13 and −0.34 ± 0.07 PW; Fig. 3) with null values of freshwater flux. The DWBC presents TW temperatures of 2.64 and 2.30 ∘C and TW salinities of 34.922 and 34.909.
The DWBC at 36∘ N (Fig. 8c, d and Table 3) gets wider, occupying 406 km from the coast to 67.3∘ W while flowing along similar depth levels (from ∼ 2682 m to the bottom). The net mass transport of −34.5 ± 8.7 Sv is southward (Fig. 2), similar to the estimate for the 2000–2009 decade at 47∘ N, associated with −0.29 ± 0.10 PW of heat transport (Fig. 3), in agreement with the 10-year mean of −29.59 ± 2.08 Sv from the mooring line W. The values for the TW properties are quite similar to those at 47∘ N (2.13 ∘C for TW temperature and 34.906 for TW salinity).
The presence of Antarctic Bottom Water (AABW) at 24.5∘ N constitutes a deep boundary for the vertical extension of the DWBC that is therefore restricted to neutral densities between 27.84 and 28.23 kg m−3 (from ∼ 2500 to ∼ 5500 m deep). At this latitude, we find even wider (and varying) horizontal extensions of the DWBC, ranging between 1062, 601, and 1663 km for each decade, from the coast to 62.7, 56.9, and 54.6∘ W (Fig. 8e, f and Table 3). The strength of the DWBC has decreased when it reaches this latitude, with mass transports of −23.8 ± 10.8, −18.3 ± 9.8, and −30.4 ± 7.3 Sv for each cruise, respectively (Fig. 2). These values, with their relatively large uncertainties, coincide with the IES-derived transport from Meinen et al. (2004; −25 ± 9 Sv) and with the mooring array estimations from Johns et al. (2008; −26.5 Sv), as well as inverse solutions using hydrography from Hernández-Guerra et al. (2014; −22.1 ± 4.2 for the 1992 cruise and −20.1 ± 3.7 Sv for the 2011 cruise). The heat transport is also reduced (−0.27 ± 0.11, −0.22 ± 0.10, and −0.33 ± 0.07 PW; Fig. 3), while the freshwater remains negligible. The TW properties become warmer (2.88, 3.10, and 2.72 ∘C) and saltier (34.954, 34.963, and 34.941) on its way south. West of the DWBC there is a recirculation that carries water northward at deep layers, previously estimated to be around 13 Sv using current meter moorings (Bryden et al., 2005a) and 8 Sv from conductivity–temperature–depth (CTD) and LADCP profiles (Biló and Johns, 2020), despite the poorly defined zonal extent of the circulation.
The distribution of AABW into the South Atlantic constitutes a deep boundary for the vertical extension of the DWBC that is shifted upwards between neutral densities of 27.58 and 28.15 kg m−3. At 11∘ S for the cruise carried out during the 1990–1999 decade, the DWBC flows as a narrow jet along the coast up to 35.1∘ W (∼ 88 km wide), extending from ∼ 1323 to ∼ 2561 m in the water column (Fig. 8g, h and Table 3). This deep southward flow transports −17.3 ± 2.2 Sv of mass (Fig. 2), −0.23 ± 0.03 PW of heat (Fig. 3), and 0.02 ± 0.01 Sv of freshwater (Fig. 4). Hummels et al. (2015) found similar values of DWBC transport from shipboard and moored observations (−17.5 ± 1.7 Sv), while previous studies using hydrographic sections and ADCP velocity measurements have obtained much stronger southward transports (−35.5 ± 14.7 Sv; Schott et al., 2005). While the TW temperature increases on its way south (3.39 ∘C), the DWBC becomes fresher (TW salinity of 34.902).
The DWBC at 19∘ S for the cruise contained in the 1990–1999 solution extended horizontally to a width of 168 km (from the coast to 35.8∘ W) and deepened (between 1493 and 3370 m). The deep current at this latitude increased its southward mass transport to −20.8 ± 7.2 Sv (Figs. 2, 8i, j and Table 3), as well as heat (−0.25 ± 0.09 PW; Fig. 3). The water mass became colder but saltier, with a TW temperature of 2.98 ∘C and TW salinity of 34.927.
On its way southward, the DWBC gets wider until reaching values of 808 and 967 km at 24∘ S for the cruises carried out during 2000–2009 and 2010–2019, respectively, while occupying similar vertical depths (from ∼ 1400 to ∼ 3000 m) (Fig. 8k, l and Table 3). At 24∘ S, the DWBC transports −29.0 ± 9.0 and −27.5 ± 7.1 Sv of mass southward for the cruises within the 2000–2009 and 2010–2019 models (Fig. 2), respectively, with a more intense DWBC than in other inverse solutions (Arumí-Planas et al., 2023). This deep transport has increased with respect to 19∘ S, not only in mass but also in heat (−0.33 ± 0.10 and −0.32 ± 0.08 PW; Fig. 3), with an almost null freshwater flux (0.02 ± 0.01 and −0.02 ± 0.01 Sv; Fig. 4). At this latitude, the DWBC gets colder but also fresher, with TW temperatures of 2.92 and 2.91 ∘C and TW salinities of 34.891 and 34.786.
When the DWBC reaches 30∘ S, its location presents certain variability, ranging 443, 282, and 833 km wide and between depths of 1336 and 2177 m, 1674 and 2861 m, and 1368 and 2580 m in 1990–1999, 2000–2009, and 2010–2019, respectively (Fig. 8n, o and Table 3). However, the strength of the southward deep current is quite similar to the values at 24∘ S, and they are quite stable among decades. The net mass transports of the DWBC at 30∘ S are −26.6 ± 5.1, −25.9 ± 5.0, and −27.9 ± 1.9 Sv for each cruise (Fig. 2), significantly higher than previous estimations of −16.1 ± 5.1 Sv using hydrography (Hernández-Guerra et al., 2019). The heat transports associated with the DWBC at this latitude remain similar with time (−0.32 ± 0.06, −0.32 ± 0.06, and −0.32 ± 0.02 PW; Fig. 3), with almost null freshwater fluxes (0.02 ± 0.01, −0.01 ± 0.02, and 0.01 ± 0.01 Sv; Fig. 4). The TW temperatures have increased (3.06, 3.11, and 2.93 ∘C), while reducing the values of the TW salinities (34.820, 34.830, and 34.840).
The southernmost section of our study, at 45∘ S, manifests the presence of a narrow DWBC (162 km) from 57.8 to 55.8∘ W (Fig. 8q, r and Table 3), occupying a significantly larger part of the water column (∼ 717 to ∼ 3352 m). There is a strong DWBC transport of −49.1 ± 7.0 Sv for mass, −0.53 ± 0.07 PW for heat, and −0.20 ± 0.04 Sv for freshwater. The DWBC at this latitude has gotten colder (TW temperature of 2.73 ∘C) and fresher (TW salinity of 34.265).
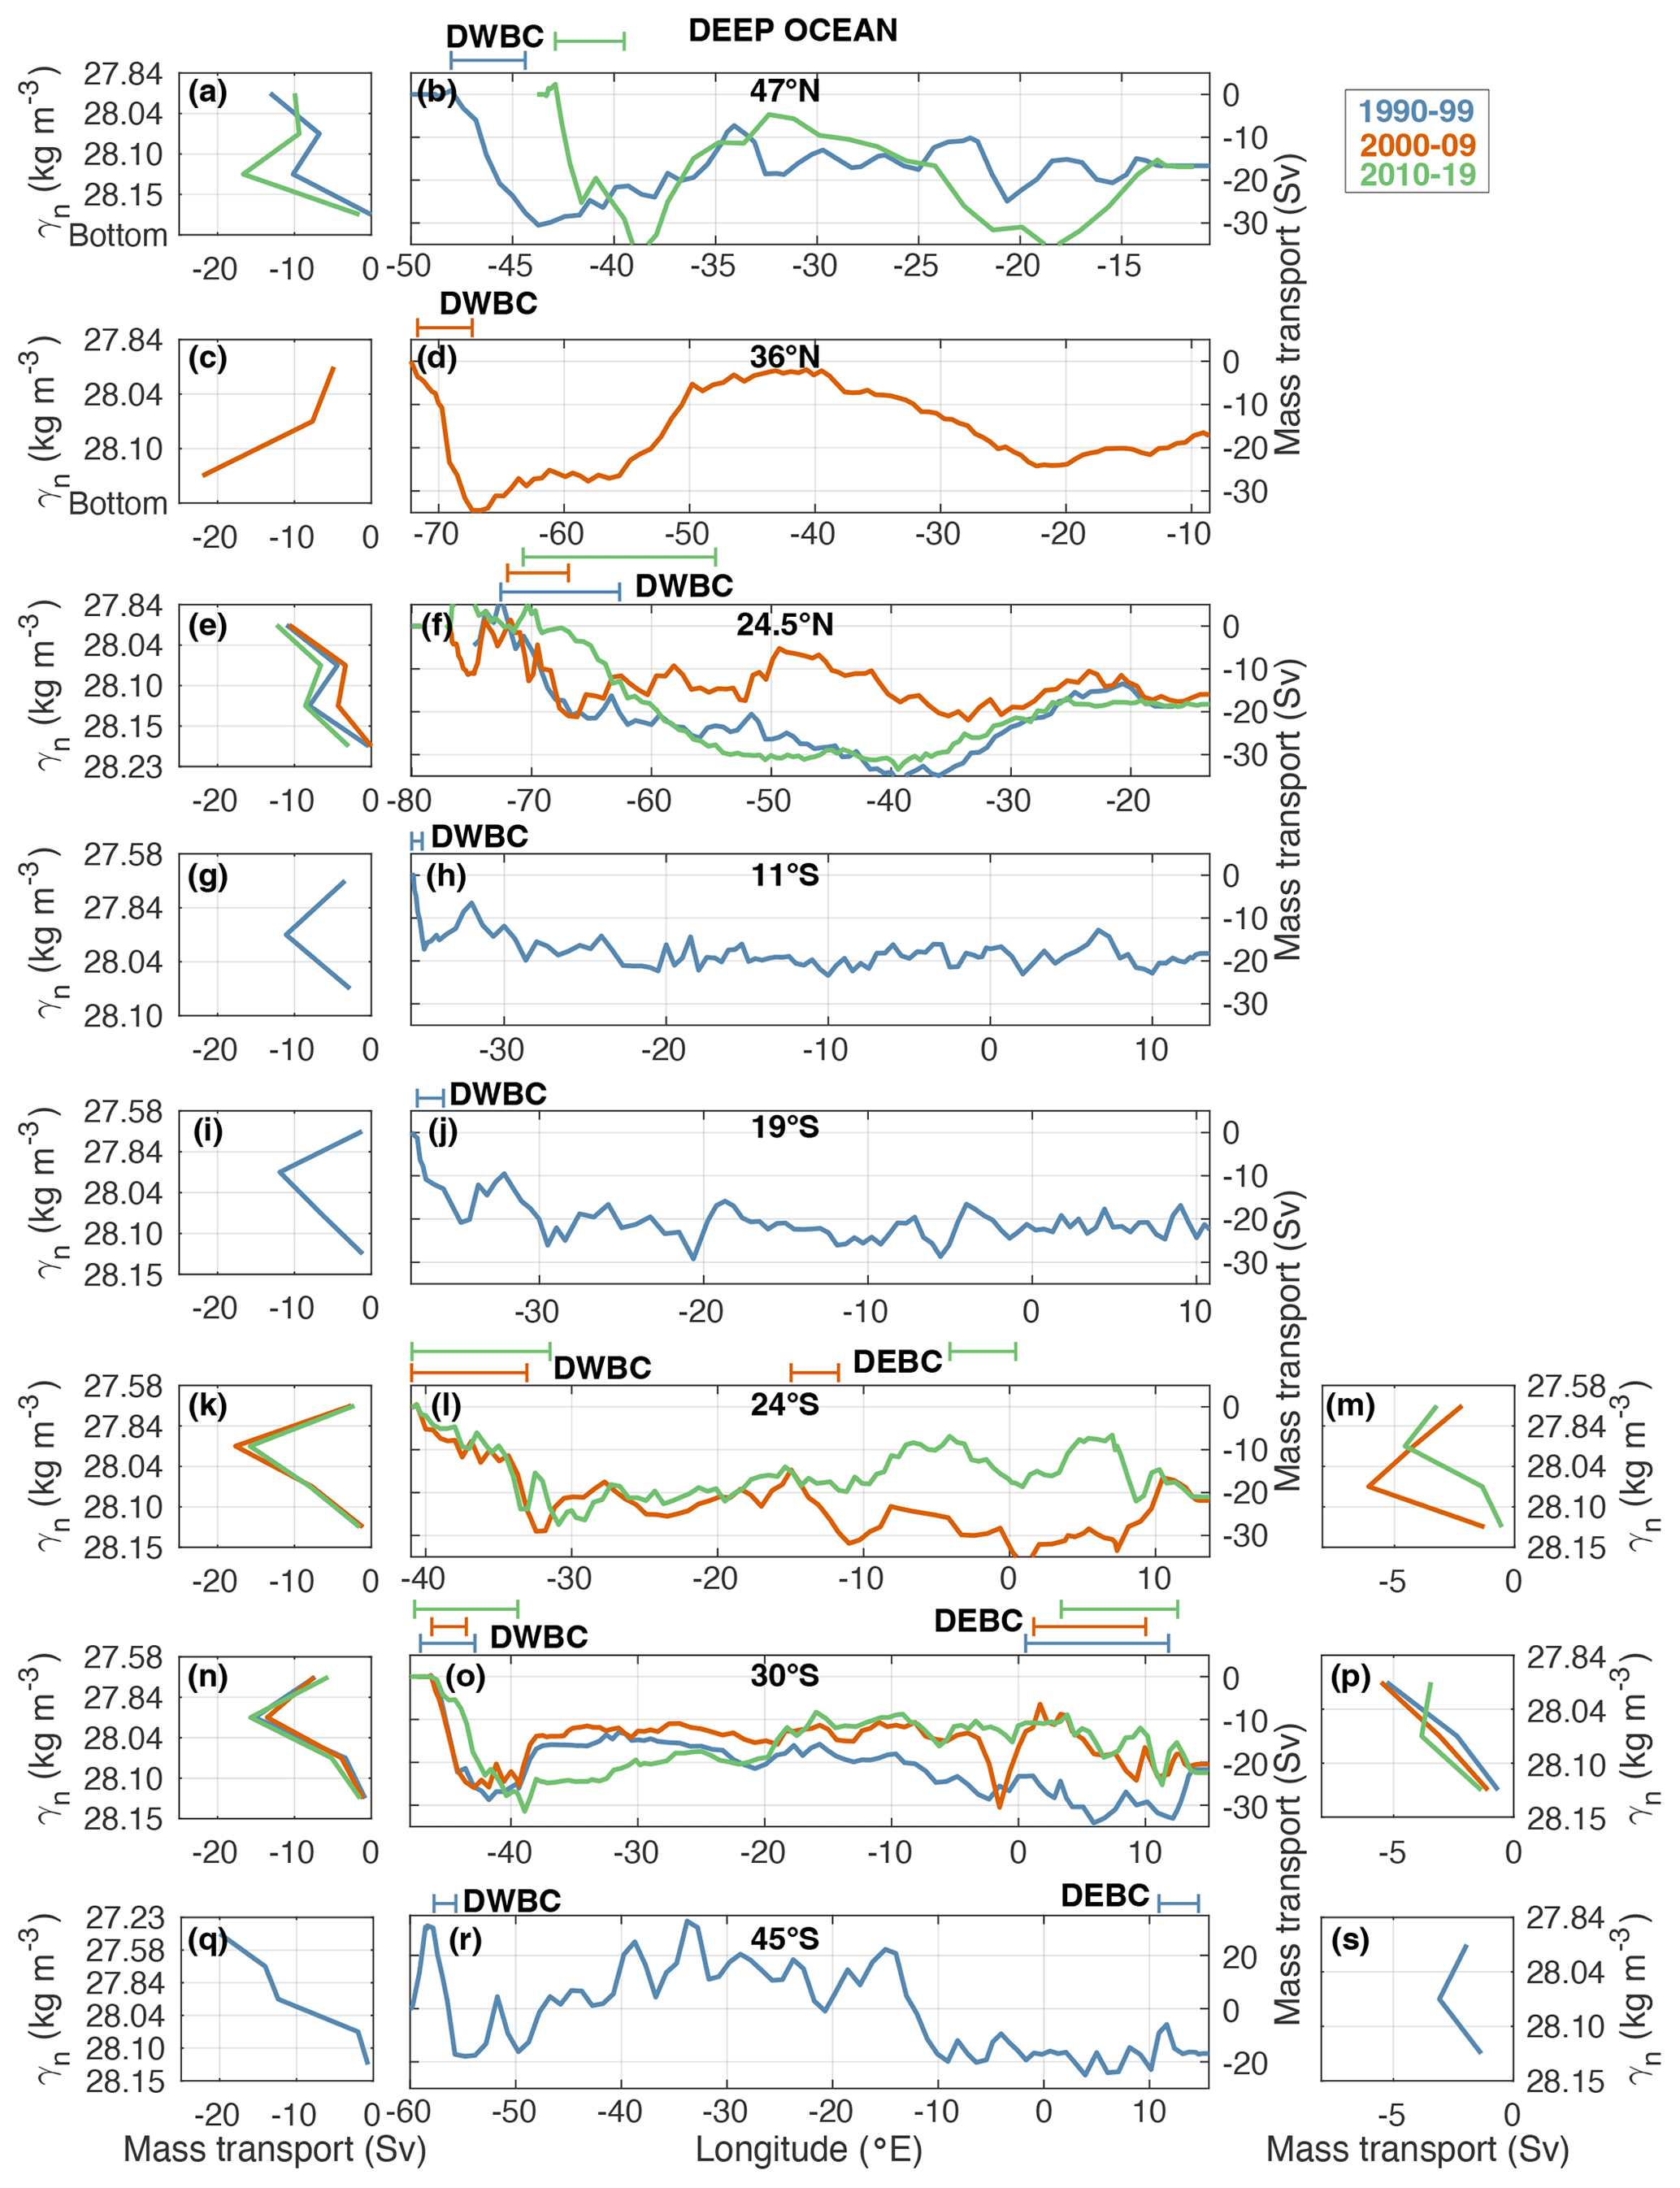
Figure 8Deep boundary currents of the Atlantic for different latitudes and decades. Net mass transport (Sv) per layer is defined between neutral density interfaces for the deep western boundary current (DWBC) at 47∘ N (a), 36∘ N (c), 24.5∘ N (e), 11∘ S (g), 19∘ S (i), 24∘ S (k), 30∘ S (n), and 45∘ S (q) and for the deep eastern boundary current (DEBC) at 24∘ S (m), 30∘ S (p), and 45∘ S (s). The transport per layer is computed using the stations and layers specified in Table 3. The longitudinal ranges of the currents at each latitude appear on the top of the middle panel. Different colours denote the use of the model solutions in blue for 1990–1999, orange for 2000–2009, and green for 2010–2019. The middle panels show the eastward accumulated horizontal mass transport (Sv) for deep layers for the 47∘ N (b), 36∘ N (d), 24.5∘ N (f), 11∘ S (h), 19∘ S (j), 24∘ S (l), 30∘ S (o), and 45∘ S (r) sections.
3.2.4 Deep eastern boundary current
The change in the orientation of the Brazilian coast after Cape São Roque (Fig. 1) results in a division of the main DWBC that originates an eastern branch that crosses the mid-Atlantic Ridge (MAR). In our hydrographic sections, the separate branch of the DWBC lies on the eastern side of the MAR at 24∘ S, and it has been denominated the deep eastern boundary current (DEBC; Arhan et al., 2003; Bower et al., 2019; Garzoli et al., 2015; Stramma and England, 1999).
The DEBC at 24∘ S covers a horizontal range of ∼ 420 km and a vertical range between ∼ 1400 and ∼ 4100 m for the cruise carried out during the 2000–2009 decade and ∼ 1400 and ∼ 5100 m for the one during the 2010–2019 decade. The mass transport carried out by the DEBC at 24∘ S for both cruises is quite variable, with net mass transports of −13.7 ± 5.5 and -9.7 ± 6.1 Sv, respectively (Figs. 2, 8l, m and Table 3), not significantly different than the estimation from Arumí-Planas et al. (2023) of −16.3 ± 4.7 Sv. The heat transport values are quite similar (−0.14 ± 0.05 and −0.12 ± 0.06 PW; Fig. 3) despite the variable mass transports due to the differences in the TW temperatures (2.59 and 3.03 ∘C). The TW salinities have values of 34.829 and 34.786 with a null value of freshwater flux.
At 30∘ S the DEBC occupies a smaller part of the water column, between ∼ 2500 and ∼ 3800 m deep, with a horizontal extension ∼ 900 km wide (Fig. 8o, p and Table 3). This southward flow exhibits similar values of mass transport among decades (−8.3 ± 4.6, −9.7 ± 3.5, and −8.6 ± 3.4 Sv for each of the three cruises carried out within the 1990–1999, 2000–2009, and 2010–2019 decades, respectively; Fig. 2), reproduced for heat transport (−0.08 ± 0.05, −0.09 ± 0.03, and −0.08 ± 0.03 PW; Fig. 3). Hernández-Guerra et al. (2019) found similar values for the 2003 and 2011 cruises (−8.2 ± 5.6 and −12.7 ± 5.5 Sv, respectively), comparable with the IES reconstruction of −12 Sv from Kersalé et al. (2019). The values for the TW properties remain quite stable in time for both temperature (2.48, 2.44, and 2.31 ∘C) and salinity (34.828, 34.833, and 34.852).
The 45∘ S section exhibits the presence of a narrower (415 km) DEBC for the 1990–1999 solution, from 10.9 to 14.6∘ E (Fig. 8r, s and Table 3). There is a reduction in the southward transport of mass (−6.4 ± 6.3 Sv; Fig. 2) and heat (−0.06 ± 0.06 PW; Fig. 3) compared with the values at 30∘ S, carrying waters with TW temperature of 2.22 ∘C and TW salinity of 34.860.
3.3 Bottom currents
3.3.1 Antarctic Bottom Water
The Antarctic Bottom Water (AABW) originates in the Southern Ocean and reaches the Atlantic Ocean as the densest water mass, being distributed along the ocean bottom on its way northward. At 45∘ S, the AABW enters the Atlantic Ocean west of the MAR between 57.4 and 17.4∘ W, from ∼ 3800 m to the bottom for the cruise carried out during the 1990–1999 decade, introducing a net mass transport of 4.7 ± 1.7 Sv (Fig. 2) of cold (TW temperature of 0.41 ∘C) and relatively fresh (TW salinity of 34.697) water (Fig. 9 m, n and Table 4). No heat or freshwater transport is associated with the AABW. Previous studies using the same hydrographic section have found similar net inputs from the AABW at the Argentine Basin (5.6 ± 1.0 Sv by McDonagh and King, 2005, and 5.6 ± 0.9 Sv by Naveira Garabato et al., 2014). East of the MAR, there is another contribution from the Southern Ocean to the South Atlantic basin (Fig. 9n, o and Table 4). However, including its recirculation, the net transport yields a southward −0.9 ± 1.6 Sv of water slightly warmer and saltier (TW temperature of 1.18 ∘C and TW salinity of 34.777). Therefore, the total net transport of bottom waters at 45∘ S introduces 3.8 ± 1.7 Sv into the Atlantic basin.
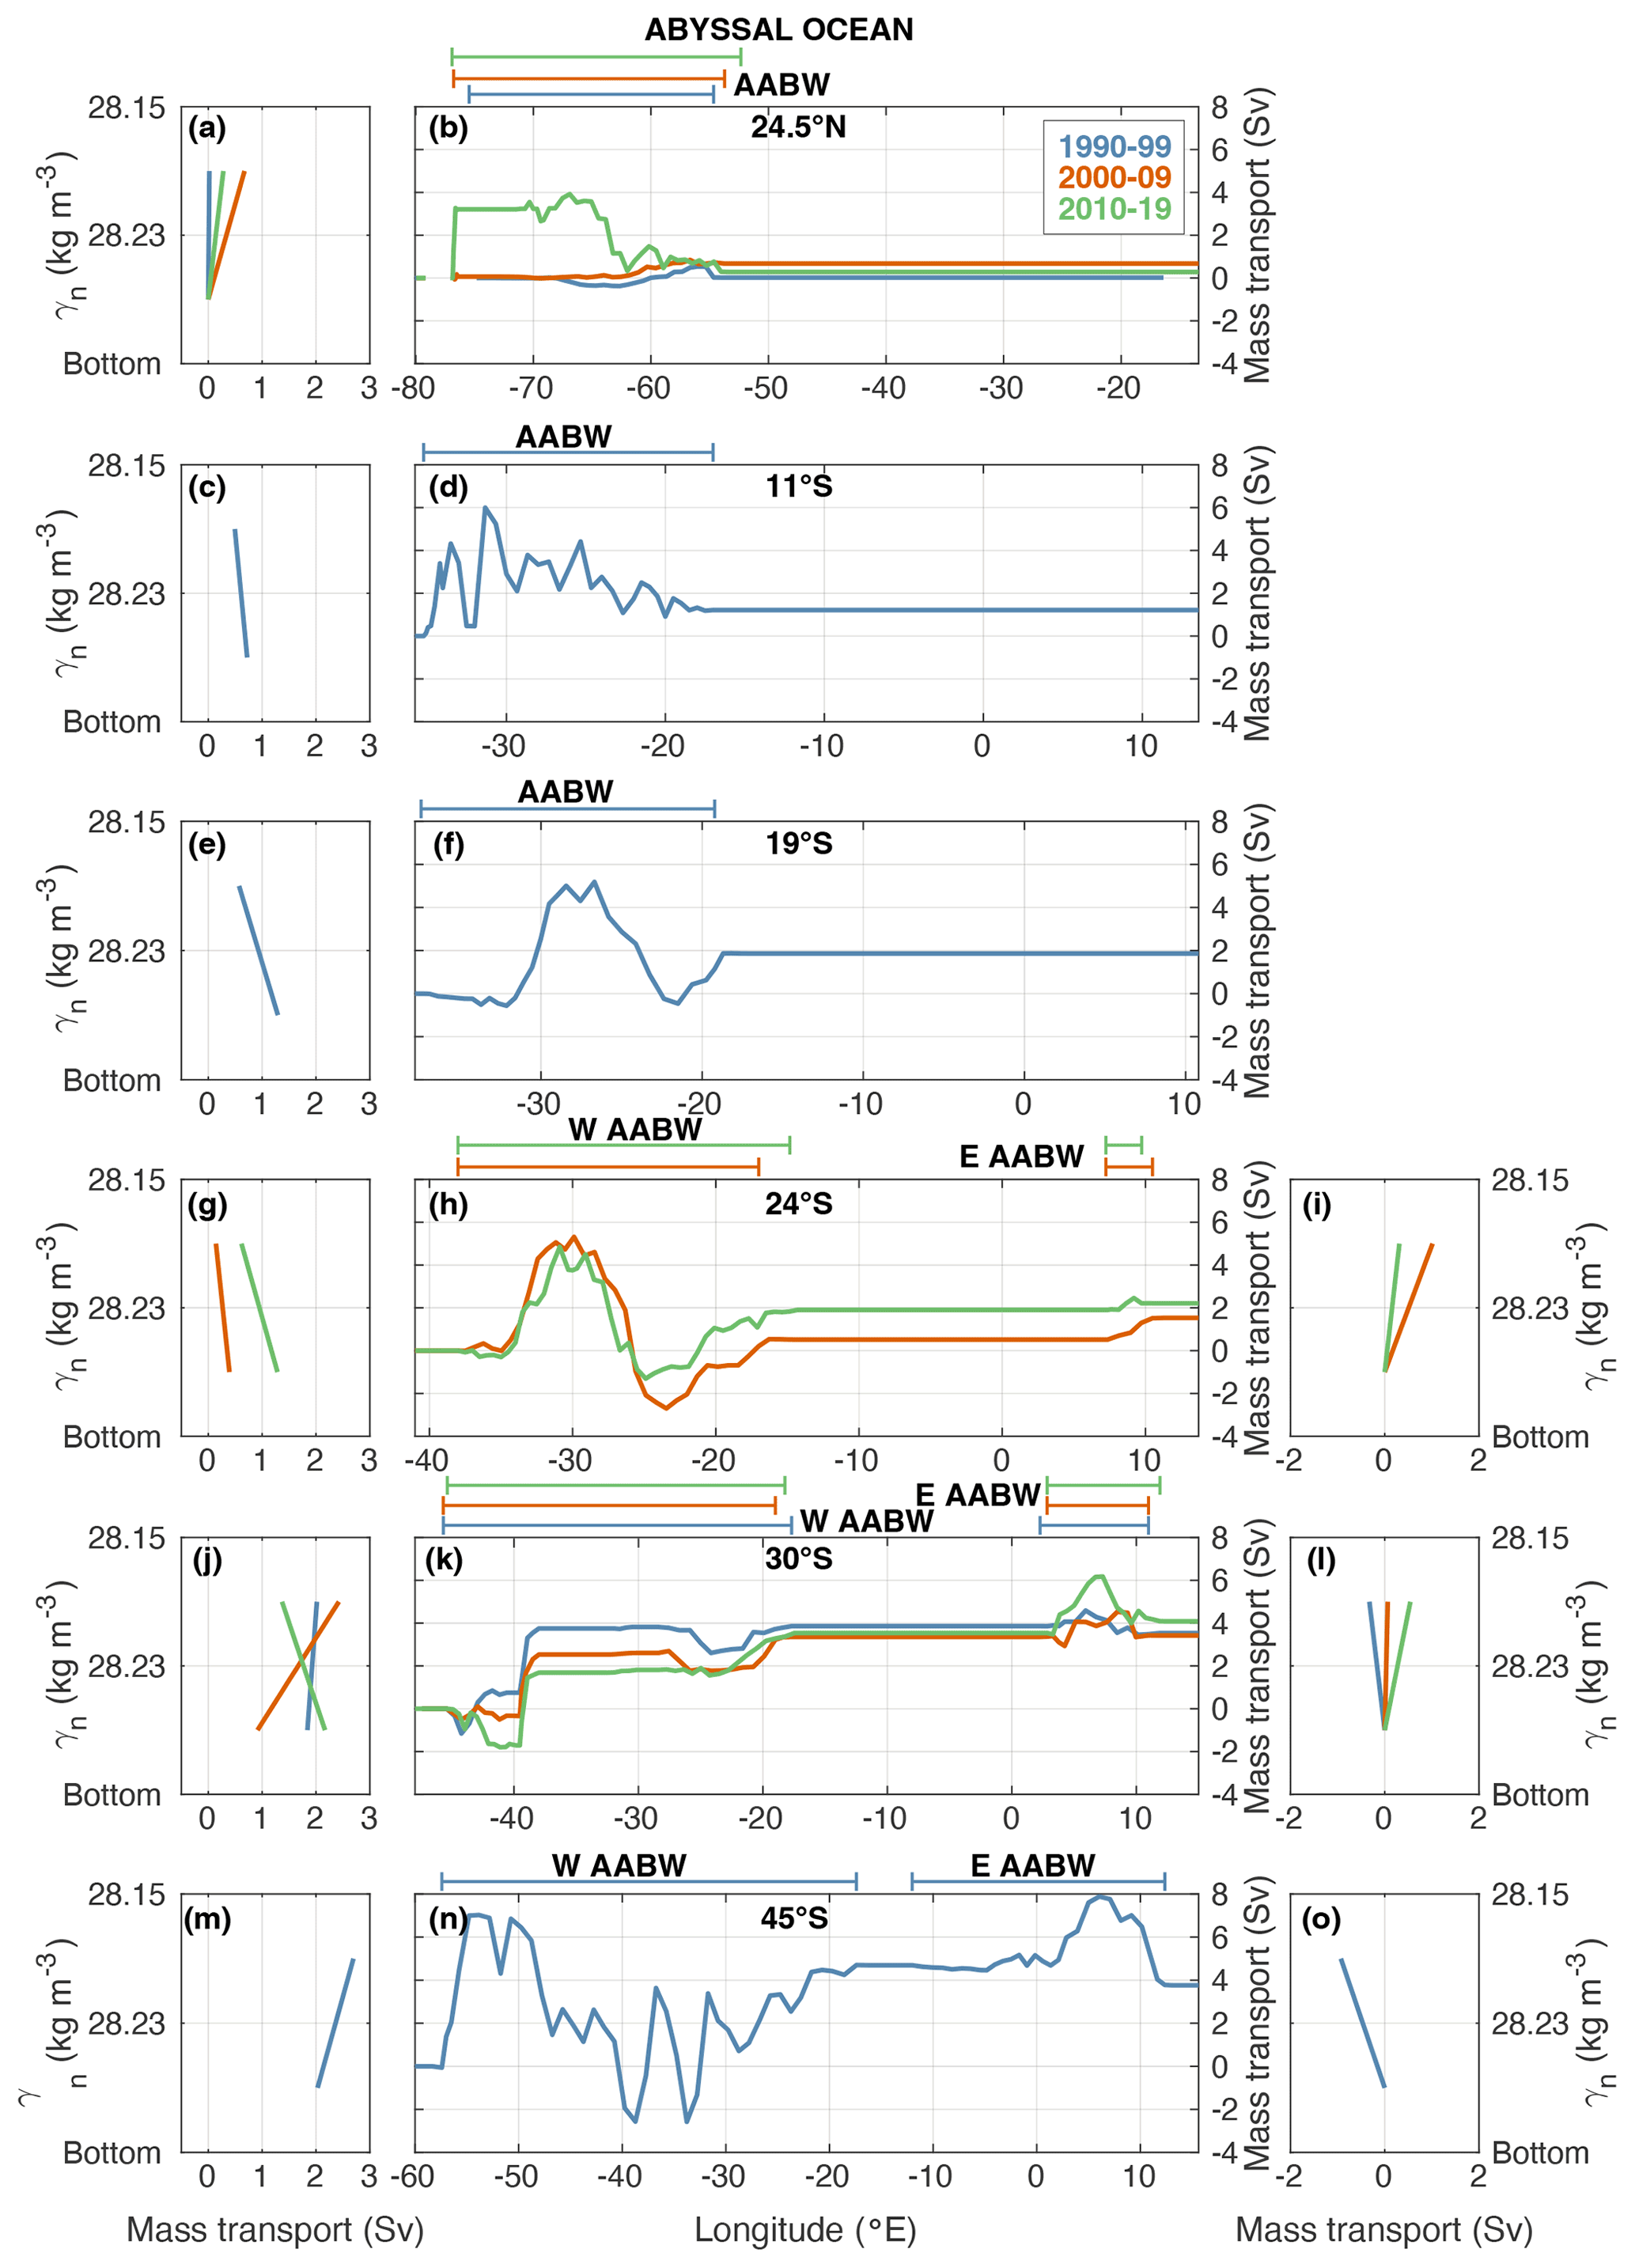
Figure 9Abyssal currents in the Atlantic for different latitudes and decades. Net mass transport (Sv) per layer defined between neutral density interfaces for the Antarctic Bottom Water (AABW) west of the MAR at 24.5∘ N (a), 11∘ S (c), 19∘ S (e), 24∘ S (g), 30∘ S (j), and 45∘ S (m), as well as east of the MAR at 24∘ S (i), 30∘ S (l), and 45∘ S (o). The transport per layer is computed using the stations and layers specified in Table 4. The longitudinal ranges of the currents at each latitude appear on the top of the middle panel. Different colours denote the use of the model solutions in blue for 1990–1999, orange for 2000–2009, and green for 2010–2019. The middle panels show the eastward accumulated horizontal mass transport (Sv) for upper layers for the 24.5∘ N (b), 11∘ S (d), 19∘ S (f), 24∘ S (h), 30∘ S (k), and 45∘ S (n) sections.
Table 4Characteristics of each abyssal layer current found at every section.
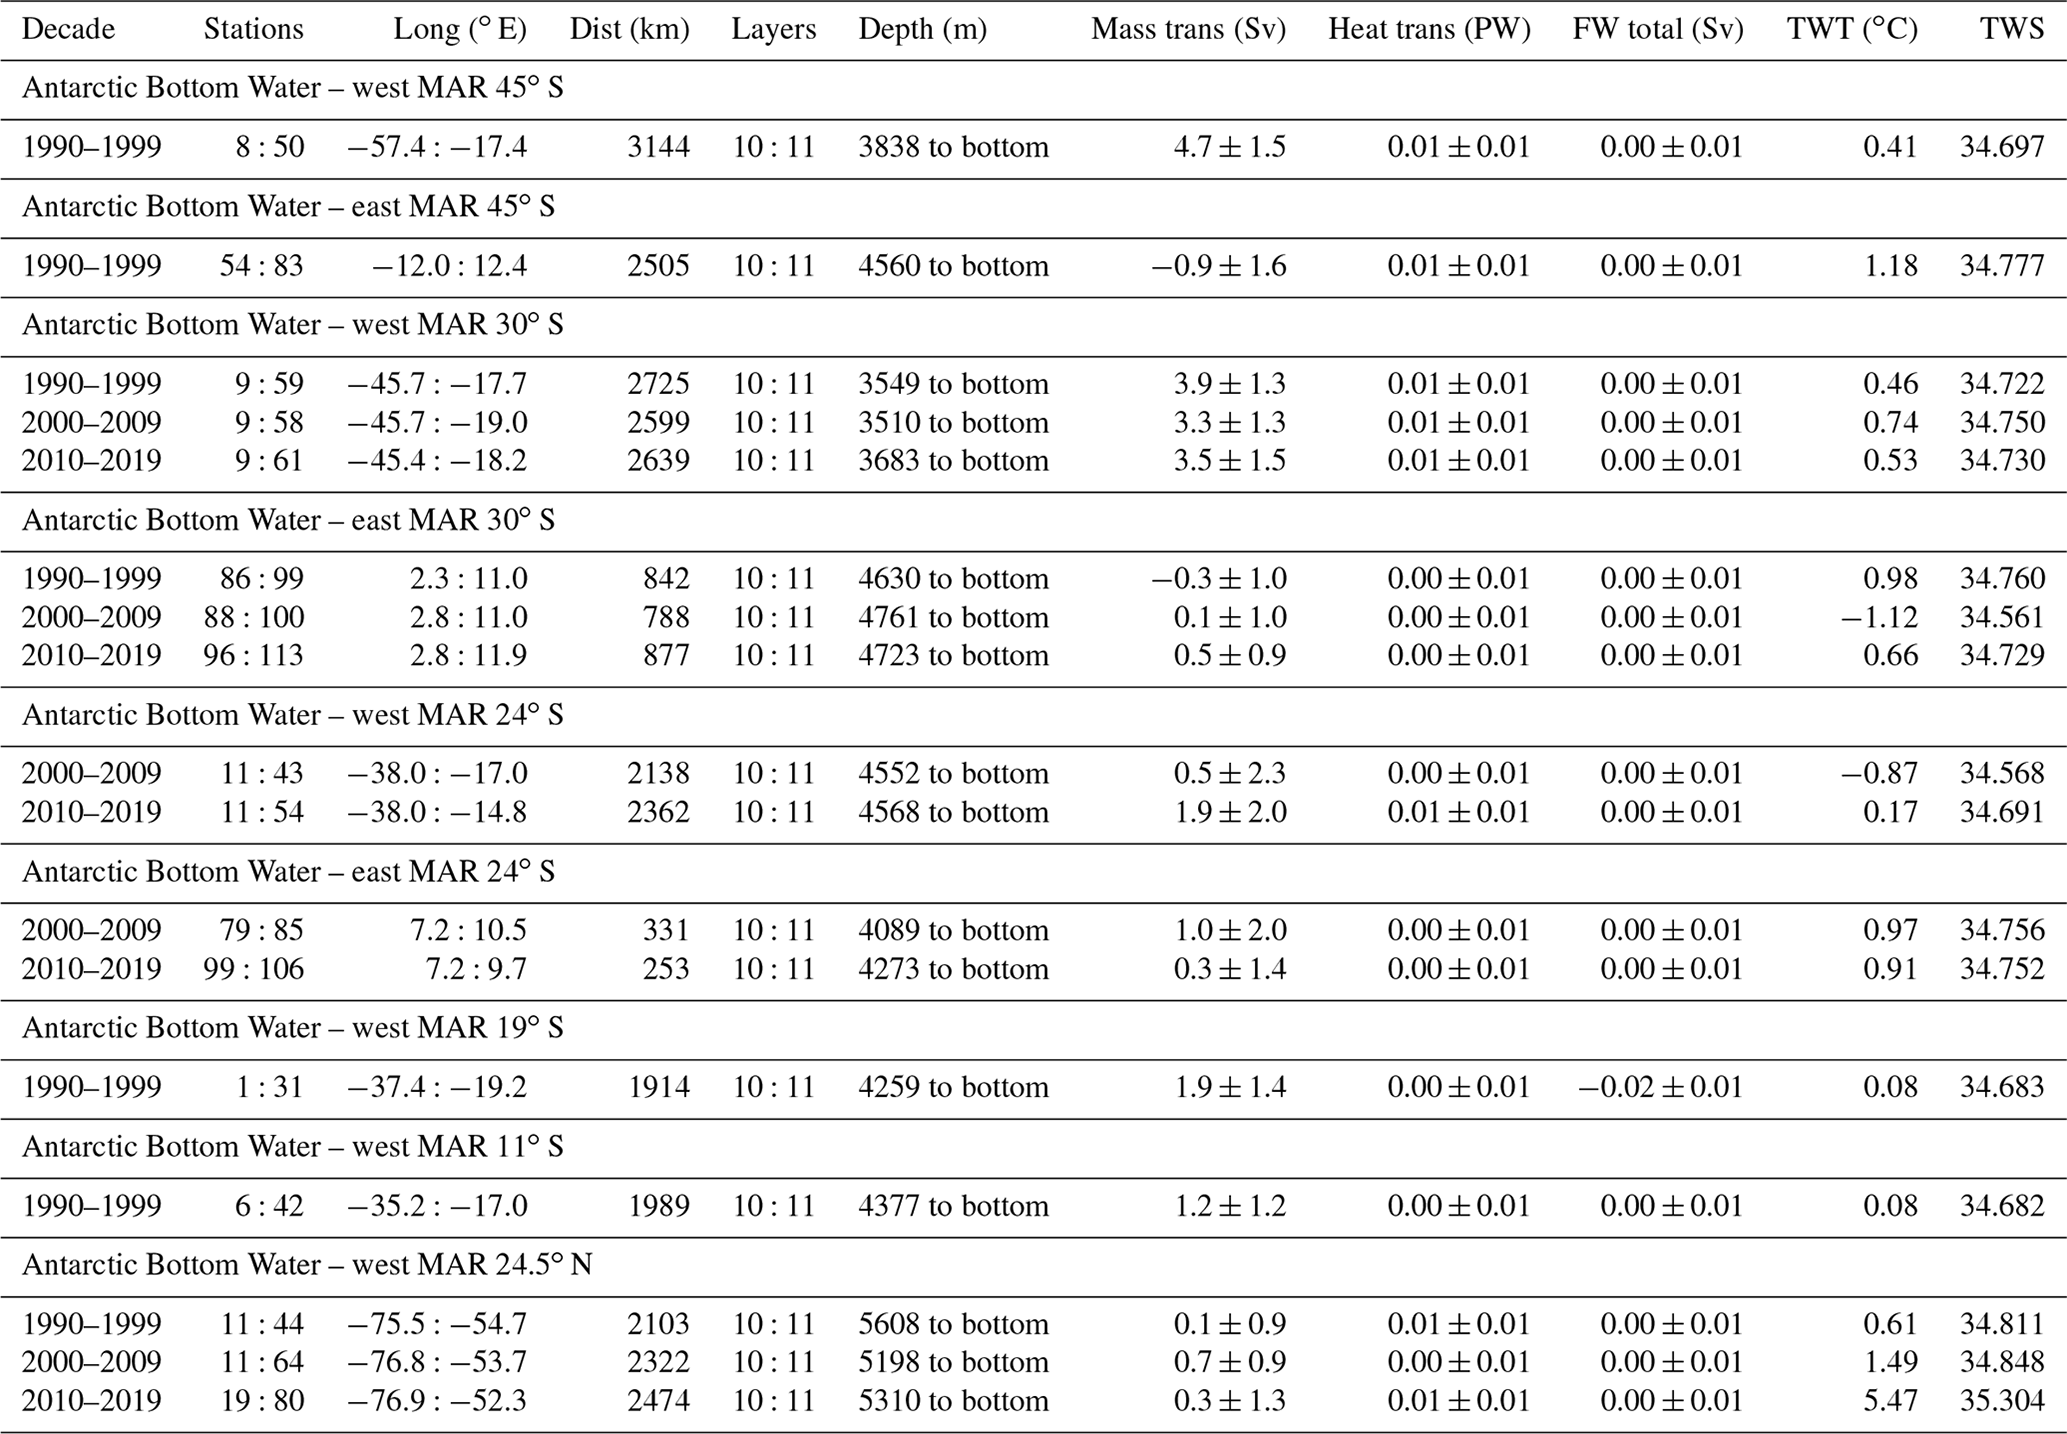
The AABW continues its way to the north and reaches 30∘ S west of the MAR between 45.7 and 17.7∘ W, 45.7 and 19.0∘ W, and 45.4 and 18.2∘ W for the cruises solved within the 1990–1999, 2000–2009, and 2010–2019 models, respectively (Fig. 9j, k and Table 4), occupying the water column at depths below ∼ 3500 m. The net strength of the western AABW has been reduced at this point, with quite stable values in time for mass transport (3.9 ± 1.3, 3.3 ± 1.3, and 3.5 ± 1.5 Sv; Fig. 2). The TW temperatures (0.46, 0.71, and 0.55 ∘C) and salinities (34.722, 34.750, and 34.730) of this water mass at this latitude west of the MAR have increased after being mixed with the water masses above while flowing northward, with markedly higher values for the cruise obtained during the 2000–2009 period. The eastern AABW yields non-significant values for the mass transport in any decade (−0.3 ± 1.0, 0.1 ± 1.0, and 0.5 ± 0.9 Sv; Fig. 9k, l and Table 4) due to the blockage of northward-flowing AABW by the Walvis Ridge (Fig. 1). As a result, the net total transport across bottom layers is dominated by the western subbasin (3.5 ± 1.2, 3.4 ± 1.4, and 4.1 ± 1.5 Sv). Results from previous studies attribute similar albeit slightly stronger AABW northward transports at 30∘ S, with 5.4 ± 1.4 Sv (McDonagh and King, 2005) and 5.2 ± 1.1 Sv (Naveira Garabato et al., 2014) for the 1992–1993 cruise and 6.5 ± 1.9 and 8.3 ± 2.1 Sv for the 2003 and 2011 cruises, respectively (Hernández-Guerra et al., 2019).
The AABW at 24∘ S occupies smaller horizontal extensions west of the MAR, from 38.0 to 17.0∘ W (2138 km) and from 38.0 to 14.8∘ W (2362 km) for the cruises carried out during the 2000–2009 and 2010–2019 decades, respectively (Fig. 9g, h and Table 4). At this latitude, the upper level of the AABW has deepened to ∼ 4550 m. The values for the last two estimates at 24∘ S show weaker AABW mass transports west of the MAR (0.5 ± 2.3 and 1.9 ± 2.0 Sv; Fig. 2). The eastern basin shows values similar to the western basin, with inputs of 1.0 ± 2.0 and 0.3 ± 1.4 Sv (Fig. 9 h, i and Table 4). The total AABW transports (1.5 ± 1.4 and 2.2 ± 1.5 Sv) yield lower results than other inverse solutions for the 2009 cruise (2.6 ± 0.5 Sv; Evans et al., 2017) and 2018 cruise (6.6 ± 1.6 Sv; Arumí-Planas et al., 2023).
Following its way northward along the South American coast, the AABW at 19∘ S can be found between 37.4 and 19.2∘ W (1914 km wide) in the horizontal and between ∼ 4260 m and the bottom of the ocean (Fig. 9e, f and Table 4). At this latitude, no eastern contribution can be found and the AABW is restricted west of the MAR. The AABW at 19∘ S shows values of mass transport (1.9 ± 1.4 Sv; Fig. 2) for the first estimate similar to the total values at 24∘ S for the cruises obtained during the following decades: 2000–2009 and 2010–2019.
The AABW at 11∘ S appears between 35.2 and 17.0∘ W, occupying ∼ 1900 km in the horizontal and in the vertical from 4377 m to the bottom of the water column (Fig. 9c, d and Table 4). The strength of the AABW flow at 11∘ S remains mainly unchanged (1.2 ± 1.2 Sv of mass transport; Fig. 2). Using a combination of shipboard measurements and mooring arrays, Schott et al. (2005) estimated a mean northward transport of 2.7 ± 2.9 Sv over 2000–2004, which yields similarly non-significant values.
The last section where we can observe the presence of the AABW is 24.5∘ N, with relatively large horizontal extensions (75.5 to 54.7∘ W, 76.8 to 53.7∘ W, and 76.9 to 52.3∘ W of 2103, 2322, and 2474 km wide, respectively) and very small mass transports (0.1 ± 0.9, 0.7 ± 0.9, and 0.3 ± 1.3 Sv; Fig. 2) for the cruises carried out during 1990–1999, 2000–2009, and 2010–2019 (Fig. 9a, b and Table 4). Comparable non-significant northward mass transports are obtained by Hernández-Guerra et al. (2014) for 1992 (1.4 ± 1.8 Sv) and 2011 (1.1 ± 1.8 Sv). The combination of shipboard measurements and the RAPID mooring array yields similar weak AABW transports, with mean values of 1.0 Sv (McCarthy et al., 2015) and stronger ranges of 2.2–3.7 Sv (Frajka-Williams et al., 2011).
The complex system of currents throughout the Atlantic basin that constitute the AMOC has been described in this study using repeated hydrographic sections over the last 30 years. Inverse methods enable quantifying not only the AMOC, but also the strength and properties associated with the most significant currents flowing along the Atlantic Ocean, accompanied by their transports of mass, heat, and freshwater for different vertical and horizontal ranges. All uncertainties quoted are formal results that depend on the limited assumptions imposed on the inverse model and should not be regarded as strictly limiting the total strength of these time mean currents.
Surface currents in the subtropical basins of the Atlantic Ocean describe the wind-driven gyre circulation, with stronger poleward western boundary currents compensated for by equatorward flow in the ocean interior and weaker eastern boundary currents occupying a larger longitudinal extension (Fig. 2). Nearly 61 Sv of upper waters from surface, thermocline, and intermediate layers enter the Atlantic basin from the Southern and Indian oceans at the southern boundary of our study area. The cold and freshwater route of the MC (37.2 ± 2.0 Sv) carries more water than the eastern warm and salty water route connecting the Atlantic with the Indian Ocean (24.0 ± 2.3 Sv). However, the flow of the MC retroflects and again joins the ACC east of 20∘ W together with a contribution from the South Atlantic subtropical gyre (−55.5 ± 5.6 Sv). The input from the Indian Ocean is divided into two nearly steady branches at 30∘ S, the SEC (15.8 ± 3.4 Sv on average for the whole period) and the BeC (12.5 ± 2.0 Sv on average for the whole period). Mass transports for both currents decrease on their way northward to 19∘ S, lowering to 2.3 ± 1.2 Sv and 9.0 ± 1.9 Sv, respectively. The complex system of currents of the South Atlantic subtropical gyre is oversimplified in Fig. 2. All this together suggests not only a northward flow of the BeC and SEC, but also a large east-to-west contribution towards the BrC (ca. 2 to 7 Sv) between 24 and 30∘ S. In this location a widening of the SEC is also observed (Fig. 2). In the solutions for the cruises obtained during the 2000–2009 decade, this east-to-west contribution seems to be feeding the southward transport of the BrC at 30∘ S, while the circulation is harder to infer for the other periods. The 11∘ S section marks the end of the South Atlantic subtropical gyre where the NBrC transports 17.0 ± 1.2 Sv northward. Nearly half of the transport of this current finds its source on the northwestward SEC (9.0 ± 1.9 Sv).
In the Northern Hemisphere, both the FC and the AC carry warm waters northward from the equatorial area. These currents decreased their transport ca. 4 Sv in the last estimate. The FC transport increases by 29.6 ± 1.8 Sv from 24 to 36∘ N (Fig. 2). At 36∘ N, the GS carries 74.9 ± 1.7 Sv, −35.4 ± 3.0 Sv of which recirculates southward. The GS at this latitude feeds both the North Atlantic subtropical and subpolar gyres. A nearly steady transport of 5.3 ± 1.8 Sv (average transport for the 3 decades) recirculates southward on the CC, closing the subtropical loop. Between 24 and 55∘ N, there is a sink to deeper layers of over 5 Sv, with the remaining transport flowing northward on the NAC contributing to the SPNA (Caínzos et al., 2022). Part of this flow enters the Arctic basin through the Iceland–Scotland Ridge, about 2 Sv of which recirculates through the gyre and a rough average of 5.3 ± 3.5 Sv contributes to the NIIC. The EGC connects the Arctic basin surface waters with those within the SPNA. Interestingly, both the EGC and its downstream continuations on the Labrador Sea (uWGC and LC) show increasing transports that double from the first to the last cruise. This behaviour supports the observations of an “Atlantification” of the Arctic basin (Polyakov et al., 2017, 2020). The low values found for the ERRC and EGC transports as well as the overestimations of the ISOW can be explained by the inability of the inverse model to reproduce currents with a strong barotropic component.
The southward flow in deep layers enters the Atlantic basin at the northernmost section via the ISOW and DSOW (Fig. 2). The stable ISOW (10.1 ± 8.9 Sv on average) carries relatively more water southward than the combined pathways of the DSOW (8.6 ± 11.3, 7.9 ± 1.05, and 7.1 ± 6.7 Sv). The net DSOW shows decreasing values, but the large uncertainties mask any possible significant trend. Deep currents in the Labrador basin flow cyclonically, with a null net transport out of the Labrador Sea for the first decade and over 2.5 Sv for the 2000–2009 and 2010–2019 decades.
On its way south, deep layers show the continuity of the DWBC throughout the basin (Fig. 2). At 47∘ N, the DWBC conveys an average transport of 33.8 ± 11.9 Sv southward after turning westward at the Flemish Cap (Fig. 1). The DWBC maintains similar strength at 36∘ N and is then reduced at 24∘ N, where different values appear for each decade. There is a reduction in the estimation for the cruise obtained in 2000–2009, followed by a recovery in the last cruise included in the 2010–2019 period. The DWBC reaches 11∘ S carrying −17.3 ± 2.2 Sv southward, increasing its transport by 17 % as it approaches 19∘ S. South of this latitude, the DWBC separates into a western branch flowing along the western boundary and an eastern branch that crosses the MAR towards the eastern basin (Fig. 2). At 24∘ S, the DWBC has increased to an average value of −28.3 ± 11.4 Sv, similar to the mean transport at 30∘ S (−26.8 ± 7.4 Sv) This increase could be associated with an upward vertical flux from abyssal to deep layers between 24∘ S and 24∘ N for the cruises included in the 2000–2009 and 2010–2019 decades of 0.8 and 1.9 Sv, respectively. The export of deep transport through the western basin at 45∘ S rises by almost 50 % to −49.1 ± 7.0 Sv. The eastern branch, the DEBC, suffers a reduction in its strength on its way south. From a mean value of −11.7 ± 8.2 Sv at 24∘ S, the DEBC is reduced to −8.9 ± 7.5 Sv at 30∘ S by 24 %. The net export at 45∘ S via the eastern basin results in −6.4 ± 6.3 Sv (after a 28 % reduction), corresponding to 12 % of the total deep outflow at the southern boundary of the Atlantic.
Abyssal layers are mainly confined to the South Atlantic, with a stronger net northward input via the western basin (Fig. 2). East of the MAR, the northward transport of AABW is recirculated, describing a clockwise gyre in abyssal layers up to 24∘ S. On the western basin, the AABW flows northward, from 4.7 ± 1.5 Sv at 45∘ S to a mean value of 3.6 ± 2.4 Sv at 30∘ S, decreasing by 23 %. West of the MAR at 24∘ S, the AABW exhibits different values in different decades with a significant reduction compared to the estimates at 30∘ S. The northward mass transport of 1.2 ± 1.2 Sv at 11∘ S reaches 24∘ N with almost negligible values (0.4 ± 1.8 Sv on average). AABW is not detected north of 24∘ N. We found no significant changes in transport. However, we can observe a warming trend with time in the TWT, not accompanied by freshening of the abyssal waters. Recent publications have found evidence of this increase in AABW temperature with steady and significant rates around 0.02 ∘C per decade using different datasets and periods of time (Chidichimo et al., 2023; Johnson et al., 2020; Meinen et al., 2020; Campos et al., 2021; Zenk and Morozov, 2007; Herrford et al., 2017).
The heat transport introduced in the South Atlantic by the warm and salty water route of the Agulhas leakage is 1.19 ± 0.11 PW, distributed along the eastern basin. This heat transport is divided into the contributions for the BeC and SEC, both reducing its heat transport northward (Fig. 3). The cold and freshwater route, instead, only transports 0.54 ± 0.02 PW northward, with a southward heat transport toward the Southern Ocean via the ACC of −1.09 ± 0.07 PW. The BrC carries heat between 19 and 30∘ S along the western boundary, with higher values at 30∘ S. As a result, the South Atlantic exports roughly 1 PW to the Northern Hemisphere carried by the NBrC. The northward transport of heat in upper layers of the North Atlantic is mainly achieved by the strong heat transported by the FC (2.48 ± 0.03 PW on average) that increases to 4.56 ± 0.11 PW in the GS at 36∘ N. The convection processes in the SPNA result in a decrease in heat transport to 1.79 ± 0.14 and 1.18 ± 0.05 PW for the NAC at 47∘ N. In deep layers, the DWBC carries roughly −0.3 PW southward, starting at 47∘ N from the Grand Banks throughout the North Atlantic and the South Atlantic up to 24∘ S (Fig. 3). The DWBC continues carrying around −0.3 PW southward along the western boundary until 45∘ S, where the net transport of heat via deep layers increases to −0.53 ± 0.07 PW due to the strong values of the MC. At 24∘ S, the DEBC carries almost half of the estimate for the DWBC, introducing an average of −0.13 ± 0.08 PW into the eastern subbasin. This heat transport is reduced southward, with a net export at the southernmost boundary of −0.06 ± 0.06 PW.
The freshwater flux is confined to upper layers (Fig. 4), with a transport into the South Atlantic via the MC of 0.07 ± 0.01 Sv, counteracted by the −0.07 ± 0.02 Sv of the BeC. However, the ACC exports double these values towards the Southern Ocean. The BrC carries freshwater northward, while the BeC shows, northward of 45∘ S, non-significant values of freshwater flux along the eastern boundary. In the South Atlantic, the overturning component of the freshwater flux (the baroclinic transport due to the zonally averaged vertical–meridional circulation) has been identified as a possible indicator of the stability of the AMOC (Dijkstra, 2007; Weijer et al., 2019; Rahmstorf, 1996). Assessing and monitoring the freshwater budget in the South Atlantic are important in determining whether the Atlantic Ocean behaves with a monostable or bistable regime. The negative or positive sign of this overturning freshwater flux (either due to a southward or northward transport of freshwater in the southern boundary of the Atlantic Ocean, respectively) provides information on the net precipitation or evaporation (respectively) over the basin.
In the North Atlantic, there is mainly a southward freshwater flux along the eastern basin. In general, we cannot find any pattern of change in strength of the currents with time, with similar estimations obtained for the different decades. No changes in TW properties have been observed either.
| AABW | Antarctic Bottom Water |
| AC | Antilles Current |
| ACC | Antarctic Circumpolar Current |
| AMOC | Atlantic Meridional Overturning Circulation |
| BeC | Benguela Current system |
| BrC | Brazil Current |
| CC | Canary Current |
| DEBC | Deep eastern boundary current |
| DSOW | Denmark Strait Overflow Water |
| DWBC | Deep western boundary current |
| dWGC | Deep West Greenland Current |
| EGC | East Greenland Current |
| ERRC | East Reykjanes Ridge Current |
| FC | Florida Current |
| GO-SHIP | Global Ocean Ship-Based Hydrographic Investigations Program |
| GS | Gulf Stream |
| IC | Irminger Current |
| IES | Inverted EchoSounder |
| ISOW | Iceland–Scotland Overflow Water |
| LC | Labrador Current |
| MAR | Mid-Atlantic Ridge |
| MC | Malvinas Current |
| NAC | North Atlantic Current |
| NADW | North Atlantic Deep Water |
| NBrC | North Brazil Current |
| NCEP–NCAR | National Center for Environmental Prediction and National Center for Atmospheric Research |
| NIIC | North Icelandic Irminger Current |
| OSNAP | Overturning in the Subpolar North Atlantic Program |
| OVIDE | Observatoire de la Variabilité Interannuelle à DEcennale |
| RAPID | Rapid Climate Change-Meridional Overturning Circulation and Heatflux Array |
| SEC | South Equatorial Current |
| SPNA | Subpolar North Atlantic |
| TW | Transport-weighted |
| uWGC | Upper West Greenland Current |
| WOCE | World Ocean Circulation Experiment |
Hydrographic data were collected from the CCHDO website (https://cchdo.ucsd.edu, last access: 23 February 2023) in the framework of the International WOCE and GO-SHIP projects. The Florida Current cable and section data are made freely available on the Atlantic Oceanographic and Meteorological Laboratory web page (https://www.aoml.noaa.gov/phod/floridacurrent/, last access: 22 May 2023) and are funded by the DOC-NOAA Climate Program Office – Ocean Observing and Monitoring Division. Florida Current daily mean transport from the year 2000 until the present is available at https://www.aoml.noaa.gov/phod/floridacurrent/data_access.php, last access: 22 May 2023 and historical data from 1982 to 1998 at https://www.aoml.noaa.gov/phod/floridacurrent/historical_data.php, last access: 22 May 2023; we have used the used data from 1990 to 1998. The daily mean u and v wind components of NCEP–NCAR reanalysis winds were collected from https://psl.noaa.gov/data/gridded/data.ncep.reanalysis.pressure.html (Kalnay et al., 1996). Results from the inverse solutions can be provided upon request.
VC and AHG conceptualized the study, and VC and MDPH completed the formal analysis and methodology. VC, AHG, and MDPH wrote the original draft and later completed its review and editing with CAP and DST.
The contact author has declared that none of the authors has any competing interests.
Publisher's note: Copernicus Publications remains neutral with regard to jurisdictional claims in published maps and institutional affiliations.
This article is a publication of the Unidad Océano y Clima from the Universidad de Las Palmas de Gran Canaria, an R&D&I CSIC associate unit. This work has been completed as part of Verónica Caínzos's work at IOCAG in the doctoral programme in Oceanography and Global Change. We thank the chief scientists and teams that collected all the data for the zonal sections: Peter M. Saunders, Thomas J. Müller, Gerold Siedler, Gregorio Parrilla, Alexander Sy, John Lazier, Manfred Bersch, Yasushi Yoshikawa, Brian King, Stuart A. Cunningham, Glen Harrison, Geert-Jan Brummer, Molly O. Baringer, Alison Macdonald, Dagmar Kieke, and N. Penny Holliday.
This study was supported by the SAGA project (RTI2018-100844-B-C31) funded by the Ministerio de Ciencia, Innovación y Universidades of the Spanish Government. Verónica Caínzos and Cristina Arumí-Planas acknowledge the Agencia Canaria de Investigación, Innovación y Sociedad de la Información (ACIISI) grant programme “Apoyo al personal investigador en formación” under grants TESIS2019010015 and TESIS2021010028, respectively. Daniel Santana-Toscano acknowledges the Ministerio de Universidades grant programme “Formación de Profesorado Universitario” under grant FPU20/02211.
This paper was edited by Anne Marie Treguier and reviewed by two anonymous referees.
Álvarez, M., Bryden, H. L., Pérez, F. F., Ríos, A. F., and Rosón, G.: Physical and biogeochemical fluxes and net budgets in the subpolar and temperate North Atlantic, J. Mar. Res., 60, 191–226, 2002.
Arhan, M., Mercier, H., and Park, Y. H.: On the deep water circulation of the eastern South Atlantic Ocean, Deep-Sea Res. Pt. I, 50, 889–916, https://doi.org/10.1016/S0967-0637(03)00072-4, 2003.
Artana, C., Ferrari, R., Koenig, Z., Sennéchael, N., Saraceno, M., Piola, A. R., and Provost, C.: Malvinas current volume transport at 41∘ S: A 24 yearlong time series consistent with mooring data from 3 decades and satellite altimetry, J. Geophys. Res.-Ocean., 123, 378–398, https://doi.org/10.1002/2017JC013600, 2018.
Arumí-Planas, C., Pérez-Hernández, M. D., Pelegrí, J. L., Vélez-Belchí, P., Emelianov, M., Caínzos, V., Cana, L., Firing, Y. L., García-Weil, L., Santana-Toscano, D., and Hernández-Guerra, A.: The South Atlantic Circulation Between 34.5∘ S, 24∘ S and Above the Mid-Atlantic Ridge From an Inverse Box Model, J. Geophys. Res.-Ocean., 128, 1–21, https://doi.org/10.1029/2022JC019614, 2023.
Atkinson, C. P., Bryden, H. L., Hirschi, J. J.-M., and Kanzow, T.: On the seasonal cycles and variability of Florida Straits, Ekman and Sverdrup transports at 26∘ N in the Atlantic Ocean, Ocean Sci., 6, 837–859, https://doi.org/10.5194/os-6-837-2010, 2010.
Bacon, S.: Circulation and fluxes in the North Atlantic between Greenland and Ireland, J. Phys. Oceanogr., 27, 1420–1435, https://doi.org/10.1175/1520-0485(1997)027<1420:cafitn>2.0.co;2, 1997.
Baringer, M. O. N. and Larsen, J. C.: Sixteen years of Florida Current Transport at 27∘ N, Geophys. Res. Lett., 28, 3179–3182, https://doi.org/10.1029/2001GL013246, 2001.
Bersch, M., Yashayaev, I., and Koltermann, K. P.: Recent changes of the thermohaline circulation in the subpolar North Atlantic, Ocean Dynam., 57, 223–235, https://doi.org/10.1007/s10236-007-0104-7, 2007.
Biló, T. C. and Johns, W. E.: The Deep Western Boundary Current and Adjacent Interior Circulation at 24∘–30∘ N: Mean Structure and Mesoscale Variability, J. Phys. Oceanogr., 50, 2735–2758, https://doi.org/10.1175/JPO-D-20-0094.1, 2020.
Boebel, O., Davis, R. E., Ollitrault, M., Peterson, R. G., Richardson, P. L., Schmid, C., and Zenk, W.: The intermediate depth circulation of the western South Atlantic, Geophys. Res. Lett., 26, 3329–3332, https://doi.org/10.1029/1999GL002355, 1999.
Bower, A., Lozier, S., Biastoch, A., Drouin, K., Foukal, N., Furey, H., Lankhorst, M., Rühs, S., and Zou, S.: Lagrangian Views of the Pathways of the Atlantic Meridional Overturning Circulation, J. Geophys. Res.-Ocean., 124, 5313–5335, https://doi.org/10.1029/2019JC015014, 2019.
Brearley, J. A., Pickart, R. S., Valdimarsson, H., Jonsson, S., Schmitt, R. W., and Haine, T. W. N.: The East Greenland boundary current system south of Denmark Strait, Deep-Sea Res. Pt. I, 63, 1–19, https://doi.org/10.1016/j.dsr.2012.01.001, 2012.
Bryden, H. L., Johns, W. E., and Saunders, P. M.: Deep western boundary current east of Abaco: Mean structure and transport, J. Mar. Res., 63, 35–57, https://doi.org/10.1357/0022240053693806, 2005a.
Bryden, H. L., Longworth, H. R., and Cunningham, S. A.: Slowing of the Atlantic meridional overturning circulation at 25∘ N, Nature, 438, 655–657, https://doi.org/10.1038/nature04385, 2005b.
Bryden, H. L., King, B. A., and McCarthy, G. D.: South Atlantic overturning circulation at 24∘ S, J. Mar. Res., 69, 39–56, https://doi.org/10.1357/002224011798147633, 2011.
Caínzos, V., Hernández-Guerra, A., McCarthy, G. D., McDonagh, E. L., Cubas Armas, M., and Pérez-Hernández, M. D.: Thirty Years of GOSHIP and WOCE Data: Atlantic Overturning of Mass, Heat, and Freshwater Transport, Geophys. Res. Lett., 49, e2021GL096527, https://doi.org/10.1029/2021GL096527, 2022.
Campos, E. J. D., van Caspel, M. C., Zenk, W., Morozov, E. G., Frey, D. I., Piola, A. R., Meinen, C. S., Sato, O. T., Perez, R. C., and Dong, S.: Warming Trend in Antarctic Bottom Water in the Vema Channel in the South Atlantic, Geophys. Res. Lett., 48, 1–7, https://doi.org/10.1029/2021GL094709, 2021.
Casanova-Masjoan, M., Joyce, T. M., Pérez-Hernández, M. D., Vélez-Belchí, P., and Hernández-Guerra, A.: Changes across 66∘ W, the Caribbean Sea and the Western boundaries of the North Atlantic Subtropical Gyre, Prog. Oceanogr., 168, 296–309, https://doi.org/10.1016/j.pocean.2018.09.013, 2018.
Casanova-Masjoan, M., Pérez-Hernández, M. D., Pickart, R. S., Valdimarsson, H., Ólafsdóttir, S. R., Macrander, A., Grisolía-Santos, D., Torres, D. J., Jónsson, S., Våge, K., Lin, P., and Hernández-Guerra, A.: Along-Stream, Seasonal, and Interannual Variability of the North Icelandic Irminger Current and East Icelandic Current Around Iceland, J. Geophys. Res.-Ocean., 125, 1–24, https://doi.org/10.1029/2020JC016283, 2020a.
Casanova-Masjoan, M., Pérez-Hernández, M. D., Vélez-Belchí, P., Cana, L., and Hernández-Guerra, A.: Variability of the Canary Current diagnosed by inverse box models, J. Geophys. Res.-Ocean., 125, e2020JC016199, https://doi.org/10.1029/2020JC016199, 2020b.
Chidichimo, M. P., Perez, R. C., Speich, S., Kersalé, M., Sprintall, J., Dong, S., Lamont, T., Sato, O. T., Chereskin, T. K., Hummels, R., and Schmid, C.: Energetic overturning flows, dynamic interocean exchanges, and ocean warming observed in the South Atlantic, Commun. Earth Environ., 4, 10, https://doi.org/10.1038/s43247-022-00644-x, 2023.
Comas-Rodríguez, I., Hernández-Guerra, A., Fraile-Nuez, E., Martínez-Marrero, A., Benítez-Barrios, V. M., Pérez-Hernández, M. D., and Vélez-Belchí, P.: The Azores Current System from a meridional section at 24.5∘ W, J. Geophys. Res., 116, C09021, https://doi.org/10.1029/2011JC007129, 2011.
Cunningham, S. A., Kanzow, T., Rayner, D., Baringer, M. O., Johns, W. E., Marotzke, J., Longworth, H. R., Grant, E. M., Hirschi, J. J. M., Beal, L. M., Meinen, C. S., and Bryden, H. L.: Temporal variability of the Atlantic meridional overturning circulation at 26.5∘ N, Science, 317, 935–938, https://doi.org/10.1126/science.1141304, 2007.
Daniault, N., Mercier, H., Lherminier, P., Sarafanov, A., Falina, A., Zunino, P., Pérez, F. F., Ríos, A. F., Ferron, B., Huck, T., Thierry, V., and Gladyshev, S.: The northern North Atlantic Ocean mean circulation in the early 21st century, Prog. Oceanogr., 146, 142–158, https://doi.org/10.1016/j.pocean.2016.06.007, 2016.
Davis, R. E., Regier, L. A., Dufour, J., and Webb, D. C.: The Autonomous Lagrangian Circulation Explorer (ALACE), J. Atmos. Ocean. Technol., 9, 264–285, https://doi.org/10.1175/1520-0426(1992)009<0264:TALCE>2.0.CO;2, 1992.
Dickson, B., Dye, S., Jónsson, S., Köhl, A., Macrander, A., Marnela, M., Meincke, J., Olsen, S., Rudels, B., Valdimarsson, H., and Voet, G.: The Overflow Flux West of Iceland: Variability, Origins and Forcing, in: Arctic–Subarctic Ocean Fluxes, Springer Netherlands, Dordrecht, 443–474, https://doi.org/10.1007/978-1-4020-6774-7_20, 2008.
Dijkstra, H. A.: Characterization of the multiple equilibria regime in a global ocean model, Tellus A, 59, 695–705, https://doi.org/10.1111/j.1600-0870.2007.00267.x, 2007.
Durgadoo, J. v., Rühs, S., Biastoch, A., and Böning, C. W. B.: Indian Ocean sources of Agulhas leakage, J. Geophys. Res.-Ocean., 122, 3481–3499, https://doi.org/10.1002/2016JC012676, 2017.
Evans, G. R., McDonagh, E. L., King, B. A., Bryden, H. L., Bakker, D. C. E., Brown, P. J., Schuster, U., Speer, K. G., and Heuven, S. M. A. C. van: South Atlantic interbasin exchanges of mass, heat, salt and anthropogenic carbon, Prog. Oceanogr., 151, 62–82, https://doi.org/10.1016/j.pocean.2016.11.005, 2017.
Fischer, J., Schott, F. A., and Dengler, M.: Boundary Circulation at the Exit of the Labrador Sea, J. Phys. Oceanogr., 34, 1548–1570, https://doi.org/10.1175/1520-0485(2004)034<1548:BCATEO>2.0.CO;2, 2004.
Fischer, J., Visbeck, M., Zantopp, R., and Nunes, N.: Interannual to decadal variability of outflow from the Labrador Sea, Geophys. Res. Lett., 37, L24610, https://doi.org/10.1029/2010GL045321, 2010.
Fischer, J., Karstensen, J., Zantopp, R., Visbeck, M., Biastoch, A., Behrens, E., Böning, C. W., Quadfasel, D., Jochumsen, K., Valdimarsson, H., Jónsson, S., Bacon, S., Holliday, N. P., Dye, S., Rhein, M., and Mertens, C.: Intra-seasonal variability of the DWBC in the western subpolar North Atlantic, Prog. Oceanogr., 132, 233–249, https://doi.org/10.1016/j.pocean.2014.04.002, 2015.
Florindo-López, C., Bacon, S., Aksenov, Y., Chafik, L., Colbourne, E., and Holliday, N. P.: Arctic Ocean and Hudson Bay freshwater exports: new estimates from seven decades of hydrographic surveys on the Labrador Shelf, J. Clim., 33, 8849–8868, https://doi.org/10.1175/JCLI-D-19-0083.1, 2020.
Foppert, A., Rintoul, S. R., Purkey, S. G., Zilberman, N., Kobayashi, T., Sallèe, J., Wijk, E. M., and Wallace, L. O.: Deep Argo Reveals Bottom Water Properties and Pathways in the Australian-Antarctic Basin, J. Geophys. Res.-Ocean., 126, 1–18, https://doi.org/10.1029/2021JC017935, 2021.
Forget, G. and Ferreira, D.: Global ocean heat transport dominated by heat export from the tropical Pacific, Nat. Geosci., 12, 351–354, https://doi.org/10.1038/s41561-019-0333-7, 2019.
Fraile-Nuez, E., Machín, F., Vélez-Belchí, P., López-Laatzen, F., Borges, R., Benítez-Barrios, V. M., and Hernández-Guerra, A.: Nine years of mass transport data in the eastern boundary of the North Atlantic Subtropical Gyre, J. Geophys. Res., 115, C09009, https://doi.org/10.1029/2010JC006161, 2010.
Frajka-Williams, E., Cunningham, S. A., Bryden, H. L., and King, B. A.: Variability of Antarctic Bottom Water at 24.5∘ N in the Atlantic, J. Geophys. Res., 116, C11026, https://doi.org/10.1029/2011JC007168, 2011.
Frajka-Williams, E., Ansorge, I. J., Baehr, J., Bryden, H. L., Chidichimo, M. P., Cunningham, S. A., Danabasoglu, G., Dong, S., Donohue, K. A., Elipot, S., Heimbach, P., Holliday, N. P., Hummels, R., Jackson, L. C., Karstensen, J., Lankhorst, M., Le Bras, I. A., Lozier, M. S., McDonagh, E. L., Meinen, C. S., Mercier, H., Moat, B. I., Perez, R. C., Piecuch, C. G., Rhein, M., Srokosz, M. A., Trenberth, K. E., Bacon, S., Forget, G., Goni, G., Kieke, D., Koelling, J., Lamont, T., McCarthy, G. D., Mertens, C., Send, U., Smeed, D. A., Speich, S., van den Berg, M., Volkov, D., and Wilson, C.: Atlantic Meridional Overturning Circulation: Observed Transport and Variability, Front. Mar. Sci., 6, 260, https://doi.org/10.3389/fmars.2019.00260, 2019.
Frankignoul, C., de Coëtlogon, G., Joyce, T. M., and Dong, S.: Gulf Stream Variability and Ocean–Atmosphere Interactions, J. Phys. Oceanogr., 31, 3516–3529, https://doi.org/10.1175/1520-0485(2002)031<3516:GSVAOA>2.0.CO;2, 2001.
Fu, Y., Li, F., Karstensen, J., and Wang, C.: A stable Atlantic Meridional Overturning Circulation in a changing North Atlantic Ocean since the 1990s, Sci. Adv., 6, eabc7836, https://doi.org/10.1126/sciadv.abc7836, 2020.
Ganachaud, A. S.: Error budget of inverse box models: The North Atlantic, J. Atmos. Ocean. Technol., 20, 1641–1655, https://doi.org/10.1175/1520-0426(2003)020<1641:EBOIBM>2.0.CO;2, 2003a.
Ganachaud, A. S.: Large-scale mass transports, water mass formation, and diffusivities estimated from World Ocean Circulation Experiment (WOCE) hydrographic data, J. Geophys. Res., 108, 3213, https://doi.org/10.1029/2002jc001565, 2003b.
Ganachaud, A. S. and Wunsch, C.: Improved estimates of global ocean circulation, heat transport and mixing from hydrographic data, Nature, 408, 453–456, 2000.
Ganachaud, A. S. and Wunsch, C.: Large-scale ocean heat and freshwater transports during the World Ocean Circulation Experiment, J. Clim., 16, 696–705, https://doi.org/10.1175/1520-0442(2003)016<0696:LSOHAF>2.0.CO;2, 2003.
García-Ibáñez, M. I., Pardo, P. C., Carracedo, L. I., Mercier, H., Lherminier, P., Ríos, A. F., and Pérez, F. F.: Structure, transports and transformations of the water masses in the Atlantic Subpolar Gyre, Prog. Oceanogr., 135, 18–36, https://doi.org/10.1016/j.pocean.2015.03.009, 2015.
Garzoli, S. L.: Geostrophic velocity and transport variability in the Brazil-Malvinas Confluence, Deep-Sea Res. Pt. I, 40, 1379–1403, https://doi.org/10.1016/0967-0637(93)90118-M, 1993.
Garzoli, S. L.: North Brazil Current retroflection and transports, J. Geophys. Res., 109, C01013, https://doi.org/10.1029/2003JC001775, 2004.
Garzoli, S. L. and Gordon, A. L.: Origins and variability of the Benguela Current, J. Geophys. Res.-Ocean., 101, 897–906, https://doi.org/10.1029/95JC03221, 1996.
Garzoli, S. L., Gordon, A. L., Kamenkovich, V., Pillsbury, D., and Duncombe-Rae, C.: Variability and sources of the southeastern Atlantic circulation, J. Mar. Res., 54, 1039–1071, https://doi.org/10.1357/0022240963213763, 1996.
Garzoli, S. L., Baringer, M. O., Dong, S., Perez, R. C., and Yao, Q.: South Atlantic meridional fluxes, Deep-Sea Res. Pt. I, 71, 21–32, https://doi.org/10.1016/j.dsr.2012.09.003, 2013.
Garzoli, S. L., Dong, S., Fine, R., Meinen, C. S., Perez, R. C., Schmid, C., van Sebille, E., and Yao, Q.: The fate of the Deep Western Boundary Current in the South Atlantic, Deep-Sea Res. Pt. I, 103, 125–136, https://doi.org/10.1016/j.dsr.2015.05.008, 2015.
Goni, G., Kamholz, S., Garzoli, S., and Olson, D.: Dynamics of the Brazil-Malvinas Confluence based on inverted echo sounders and altimetry, J. Geophys. Res.-Ocean., 101, 16273–16289, https://doi.org/10.1029/96JC01146, 1996.
Gou, R., Pennelly, C., and Myers, P. G.: The Changing Behavior of the West Greenland Current System in a Very High-Resolution Model, J. Geophys. Res.-Ocean., 127, 1–15, https://doi.org/10.1029/2022JC018404, 2022.
Harden, B. E., Pickart, R. S., Valdimarsson, H., Våge, K., de Steur, L., Richards, C., Bahr, F., Torres, D., Børve, E., Jónsson, S., Macrander, A., Østerhus, S., Håvik, L., and Hattermann, T.: Upstream sources of the Denmark Strait Overflow: Observations from a high-resolution mooring array, Deep-Sea Res. Pt. I, 112, 94–112, https://doi.org/10.1016/j.dsr.2016.02.007, 2016.
Hernández-Guerra, A. and Talley, L. D.: Meridional overturning transports at 30∘ S in the Indian and Pacific Oceans in 2002–2003 and 2009, Prog. Oceanogr., 146, 89–120, https://doi.org/10.1016/j.pocean.2016.06.005, 2016.
Hernández-Guerra, A., Pelegrí, J. L., Fraile-Nuez, E., Benítez-Barrios, V. M., Emelianov, M., Pérez-Hernández, M. D., and Vélez-Belchí, P.: Meridional overturning transports at 7.5N and 24.5N in the Atlantic Ocean during 1992–93 and 2010–11, Prog. Oceanogr., 128, 98–114, https://doi.org/10.1016/j.pocean.2014.08.016, 2014.
Hernández-Guerra, A., Espino-Falcón, E., Vélez-Belchí, P., Dolores Pérez-Hernández, M., Martínez-Marrero, A., and Cana, L.: Recirculation of the Canary Current in fall 2014, J. Mar. Syst., 174, 25–39, https://doi.org/10.1016/j.jmarsys.2017.04.002, 2017.
Hernández-Guerra, A., Talley, L. D., Pelegrí, J. L., Vélez-Belchí, P., Baringer, M. O., Macdonald, A. M., and McDonagh, E. L.: The upper, deep, abyssal and overturning circulation in the Atlantic Ocean at 30∘ S in 2003 and 2011, Prog. Oceanogr., 176, 102136, https://doi.org/10.1016/j.pocean.2019.102136, 2019.
Herrford, J., Brandt, P., and Zenk, W.: Property changes of deep and bottom waters in the Western Tropical Atlantic, Deep-Sea Res. Pt. I, 124, 103–125, https://doi.org/10.1016/j.dsr.2017.04.007, 2017.
Hogg, N. G. and Johns, W. E.: Western boundary currents, Rev. Geophys., 33, 1311–1334, https://doi.org/10.1029/95RG00491, 1995.
Holliday, N. P., Bacon, S., Cunningham, S. A., Gary, S. F., Karstensen, J., King, B. A., Li, F., and Mcdonagh, E. L.: Subpolar North Atlantic Overturning and Gyre-Scale Circulation in the Summers of 2014 and 2016, J. Geophys. Res.-Ocean., 123, 4538–4559, https://doi.org/10.1029/2018JC013841, 2018.
Houpert, L., Inall, M. E., Dumont, E., Gary, S., Johnson, C., Porter, M., Johns, W. E., and Cunningham, S. A.: Structure and transport of the North Atlantic Current in the Eastern Subpolar Gyre from sustained glider observations, J. Geophys. Res.-Ocean., 123, 6019–6038, https://doi.org/10.1029/2018JC014162, 2018.
Hummels, R., Brandt, P., Dengler, M., Fischer, J., Araujo, M., Veleda, D., and Durgadoo, J. V.: Interannual to decadal changes in the western boundary circulation in the Atlantic at 11∘ S, Geophys. Res. Lett., 42, 7615–7622, https://doi.org/10.1002/2015GL065254, 2015.
Jayne, S. R. and Marotzke, J.: The dynamics of ocean heat transport variability, Rev. Geophys., 39, 385–411, https://doi.org/10.1029/2000RG000084, 2001.
Jochumsen, K., Quadfasel, D., Valdimarsson, H., and Jónsson, S.: Variability of the Denmark Strait overflow: Moored time series from 1996–2011, J. Geophys. Res.-Ocean., 117, C12003, https://doi.org/10.1029/2012JC008244, 2012.
Johns, W. E., Shay, T. J., Bane, J. M., and Watts, D. R.: Gulf Stream structure, transport, and recirculation near 68∘ W, J. Geophys. Res., 100, 817–838, https://doi.org/10.1029/94JC02497, 1995.
Johns, W. E., Beal, L. M., Baringer, M. O., Molina, J. R., Cunningham, S. A., Kanzow, T., and Rayner, D.: Variability of Shallow and Deep Western Boundary Currents off the Bahamas during 2004–05: Results from the 26∘ N RAPID–MOC Array, J. Phys. Oceanogr., 38, 605–623, https://doi.org/10.1175/2007jpo3791.1, 2008.
Johns, W. E., Baringer, M. O., Beal, L. M., Cunningham, S. A., Kanzow, T., Bryden, H. L., Hirschi, J. J. M., Marotzke, J., Meinen, C. S., Shaw, B., and Curry, R.: Continuous, array-based estimates of Atlantic Ocean heat transport at 26.5∘ N, J. Clim., 24, 2429–2449, https://doi.org/10.1175/2010JCLI3997.1, 2011.
Johns, W. E., Devana, M., Houk, A., and Zou, S.: Moored Observations of the Iceland-Scotland Overflow Plume Along the Eastern Flank of the Reykjanes Ridge, J. Geophys. Res.-Ocean., 126, 1–26, https://doi.org/10.1029/2021JC017524, 2021.
Johnson, G. C., Lyman, J. M., and Purkey, S. G.: Informing Deep Argo Array Design Using Argo and Full-Depth Hydrographic Section Data, J. Atmos. Ocean. Technol., 32, 2187–2198, https://doi.org/10.1175/JTECH-D-15-0139.1, 2015.
Johnson, G. C., Purkey, S. G., Zilberman, N. V., and Roemmich, D.: Deep Argo Quantifies Bottom Water Warming Rates in the Southwest Pacific Basin, Geophys. Res. Lett., 46, 2662–2669, https://doi.org/10.1029/2018GL081685, 2019.
Johnson, G. C., Cadot, C., Lyman, J. M., McTaggart, K. E., and Steffen, E. L.: Antarctic Bottom Water Warming in the Brazil Basin: 1990s Through 2020, From WOCE to Deep Argo, Geophys. Res. Lett., 47, e2020GL089191, https://doi.org/10.1029/2020GL089191, 2020.
Kalnay, E., Kanamitsu, M., Kistler, R., Collins, W., Deaven, D., Gandin, L., Iredell, M., Saha, S., White, G., Woollen, J., Zhu, Y., Leetmaa, A., Reynolds, R., Chelliah, M., Ebisuzaki, W., Higgins, W., Janowiak, J., Mo, K. C., Ropelewski, C., Wang, J., Jenne, R., and Joseph, D.: The NCEP/NCAR 40-year Reanalysis Project, Bull. Am. Meteorol. Soc., 77, 437–471, https://doi.org/10.1175/1520-0477(1996)077<0437:TNYRP>2.0.CO;2, 1996.
Kanzow, T., Send, U., Zenk, W., Chave, A. D., and Rhein, M.: Monitoring the integrated deep meridional flow in the tropical North Atlantic: Long-term performance of a geostrophic array, Deep-Sea Res. Pt. I, 53, 528–546, https://doi.org/10.1016/j.dsr.2005.12.007, 2006.
Katsumata, K. and Fukasawa, M.: Changes in meridional fluxes and water properties in the Southern Hemisphere subtropical oceans between 1992/1995 and 2003/2004, Prog. Oceanogr., 89, 61–91, https://doi.org/10.1016/j.pocean.2010.12.008, 2011.
Kersalé, M., Perez, R. C., Speich, S., Meinen, C. S., Lamont, T., le Hénaff, M., van den Berg, M. A., Majumder, S., Ansorge, I. J., Dong, S., Schmid, C., Terre, T., and Garzoli, S. L.: Shallow and Deep Eastern Boundary Currents in the South Atlantic at 34.5∘ S: Mean Structure and Variability, J. Geophys. Res.-Ocean., 124, 1634–1659, https://doi.org/10.1029/2018JC014554, 2019.
Kersalé, M., Meinen, C. S., Perez, R. C., le Hénaff, M., Valla, D., Lamont, T., Sato, O. T., Dong, S., Terre, T., van Caspel, M., Chidichimo, M. P., van den Berg, M., Speich, S., Piola, A. R., Campos, E. J. D., Ansorge, I., Volkov, D. L., Lumpkin, R., and Garzoli, S. L.: Highly variable upper and abyssal overturning cells in the South Atlantic, Sci. Adv., 6, eaba7573, https://doi.org/10.1126/sciadv.aba7573, 2020.
King, B. A., Sanchez-Franks, A., and Firing, Y. L.: RRS James Cook Cruise JC159 28 February–11 April 2018. Hydrographic sections from the Brazil to the Benguela Current across 24S in the Atlantic, National Oceanography Centre Cruise Report, Southampton, UK, 193 pp., https://nora.nerc.ac.uk/id/eprint/525098 (last access: 4 July 2023), 2019.
Koltermann, K. P., Sokov, A. v., Tereschenkov, V. P., Dobroliubov, S. A., Lorbacher, K., and Sy, A.: Decadal changes in the thermohaline circulation of the North Atlantic, Deep-Sea Res. Pt. II, 46, 109–138, https://doi.org/10.1016/S0967-0645(98)00115-5, 1999.
Koszalka, I. M., Haine, T. W. N., and Magaldi, M. G.: Fates and Travel Times of Denmark Strait Overflow Water in the Irminger Basin, J. Phys. Oceanogr., 43, 2611–2628, https://doi.org/10.1175/JPO-D-13-023.1, 2013.
Lazier, J., Hendry, R., Clarke, A., Yashayaev, I., and Rhines, P.: Convection and restratification in the Labrador Sea, 1990–2000, Deep-Sea Res. Pt. I, 49, 1819–1835, https://doi.org/10.1016/S0967-0637(02)00064-X, 2002.
le Bras, I. A., Straneo, F., Holte, J., and Holliday, N. P.: Seasonality of Freshwater in the East Greenland Current System From 2014 to 2016, J. Geophys. Res.-Ocean., 123, 8828–8848, https://doi.org/10.1029/2018JC014511, 2018.
Lee, T. N., Johns, W. E., Zantopp, R. J., and Fillenbaum, E. R.: Moored Observations of Western Boundary Current Variability and Thermohaline Circulation at 26.5∘ in the Subtropical North Atlantic, J. Phys. Oceanogr., 26, 962–983, https://doi.org/10.1175/1520-0485(1996)026<0962:MOOWBC>2.0.CO;2, 1996.
Legeais, J.-F., Ollitrault, M., and Arhan, M.: Lagrangian observations in the Intermediate Western Boundary Current of the South Atlantic, Deep-Sea Res. Pt. II, 85, 109–126, https://doi.org/10.1016/j.dsr2.2012.07.028, 2013.
Legeckis, R. and Gordon, A. L.: Satellite observations of the Brazil and Falkland currents – 1975, 1976 and 1978, Deep-Sea Res. Pt. A, 29, 375–401, https://doi.org/10.1016/0198-0149(82)90101-7, 1982.
Lherminier, P., Mercier, H., Gourcuff, C., Alvarez, M., Bacon, S., and Kermabon, C.: Transports across the 2002 Greenland-Portugal Ovide section and comparison with 1997, J. Geophys. Res., 112, C07003, https://doi.org/10.1029/2006JC003716, 2007.
Lherminier, P., Mercier, H., Huck, T., Gourcuff, C., Pérez, F. F., Morin, P., Sarafanov, A., and Falina, A.: The Atlantic Meridional Overturning Circulation and the subpolar gyre observed at the A25-OVIDE section in June 2002 and 2004, Deep-Sea Res. Pt. I, 57, 1374–1391, https://doi.org/10.1016/j.dsr.2010.07.009, 2010.
Li, F. and Lozier, M. S.: On the linkage between Labrador Sea Water volume and overturning circulation in the Labrador Sea: A case study on proxies, J. Clim., 31, 5225–5241, https://doi.org/10.1175/JCLI-D-17-0692.1, 2018.
Lozier, M. S., Bacon, S., Bower, A. S., Cunningham, S. A., de Jong, M. F., Steur, L. de, DeYoung, B., Fischer, J., Gary, S. F., Greenan, B. J. W., Heimbach, P., Holliday, N. P., Houpert, L., Inall, M. E., Johns, W. E., Johnson, H. L., Karstensen, J., Li, F., Lin, X., Mackay, N., and Zika, J. D.: Overturning in the Subpolar North Atlantic Program: A New International Ocean Observing System, Bull. Am. Meteorol. Soc., 98, 737–752, https://doi.org/10.1175/bams-d-16-0057.1, 2017.
Lozier, M. S., Li, F., Bacon, S., Bahr, F., Bower, A. S., Cunningham, S. A., d Jong, M. F., de Steur, L., DeYoung, B., Fischer, J., Gary, S. F., Greenan, B. J. W., Holliday, N. P., Houk, A., Houpert, L., Inall, M. E., Johns, W. E., Johnson, H. L., Johnson, C., Karstensen, J., Koman, G., le Bras, I. A., Lin, X., Mackay, N., Marshall, D. P., Mercier, H., Oltmanns, M., Pickart, R. S., Ramsey, A. L., Rayner, D., Straneo, F., Thierry, V., Torres, D. J., Williams, R. G., Wilson, C., Yang, J., Yashayaev, I., and Zhao, J.: A sea change in our view of overturning in the subpolar North Atlantic, Science, 363, 516–521, https://doi.org/10.1126/science.aau6592, 2019.
Lumpkin, R. and Speer, K. G.: Global Ocean Meridional Overturning, J. Phys. Oceanogr., 37, 2550–2562, https://doi.org/10.1175/jpo3130.1, 2007.
Maamaatuaiahutapu, K., Garçon, V., Provost, C., and Mercier, H.: Transports of the Brazil and Malvinas Currents at their confluence, J. Mar. Res., 56, 417–438, https://doi.org/10.1357/002224098321822366, 1998.
Macdonald, A. M. and Wunsch, C.: An estimate of global ocean circulation and heat fluxes, Nature, 382, 436–439, 1996.
Machín, F., Hernández-Guerra, A., and Pelegrí, J. L.: Mass fluxes in the Canary Basin, Prog. Oceanogr., 70, 416–447, https://doi.org/10.1016/j.pocean.2006.03.019, 2006.
Maul, G. A. and Vukovich, F. M.: The Relationship between Variations in the Gulf of Mexico Loop Current and Straits of Florida Volume Transport, J. Phys. Oceanogr., 23, 785–796, https://doi.org/10.1175/1520-0485(1993)023<0785:TRBVIT>2.0.CO;2, 1993.
McCarthy, G. D., Smeed, D. A., Johns, W. E., Frajka-Williams, E., Moat, B. I., Rayner, D., Baringer, M. O., Meinen, C. S., Collins, J., and Bryden, H. L.: Measuring the Atlantic Meridional Overturning Circulation at 26∘ N, Prog. Oceanogr., 130, 91–111, https://doi.org/10.1016/j.pocean.2014.10.006, 2015.
McCarthy, G. D., Brown, P. J., Flagg, C. N., Goni, G., Houpert, L., Hughes, C. W., Hummels, R., Inall, M., Jochumsen, K., Larsen, K. M. H., Lherminier, P., Meinen, C. S., Moat, B. I., Rayner, D., Rhein, M., Roessler, A., Schmid, C., and Smeed, D. A.: Sustainable Observations of the AMOC: Methodology and Technology, Rev. Geophys., 58, 1–34, https://doi.org/10.1029/2019RG000654, 2020.
McDonagh, E. L. and King, B. A.: Oceanic fluxes in the South Atlantic, J. Phys. Oceanogr., 35, 109–122, https://doi.org/10.1175/JPO-2666.1, 2005.
McDonagh, E. L., McLeod, P., King, B. A., Bryden, H. L., and Valdés, S. T.: Circulation, Heat, and Freshwater Transport at 36∘ N in the Atlantic, J. Phys. Oceanogr., 40, 2661–2678, https://doi.org/10.1175/2010JPO4176.1, 2010.
McDonagh, E. L., King, B. A., Bryden, H. L., Courtois, P., Szuts, Z., Baringer, M. O., Cunningham, S. A., Atkinson, C., and McCarthy, G.: Continuous estimate of Atlantic oceanic freshwater flux at 26.5∘ N, J. Clim., 28, 8888–8906, 2015.
Meinen, C. S. and Watts, D. R.: Vertical structure and transport on a transect across the North Atlantic Current near 42∘ N: Time series and mean, J. Geophys. Res.-Ocean., 105, 21869–21891, https://doi.org/10.1029/2000JC900097, 2000.
Meinen, C. S., Garzoli, S. L., Johns, W. E., and Baringer, M. O.: Transport variability of the Deep Western Boundary Current and the Antilles Current off Abaco Island, Bahamas, Deep-Sea Res. Pt. I, 51, 1397–1415, https://doi.org/10.1016/j.dsr.2004.07.007, 2004.
Meinen, C. S., Speich, S., Perez, R. C., Dong, S., Piola, A. R., Garzoli, S. L., Baringer, M. O., Gladyshev, S., and Campos, E. J. D.: Temporal variability of the meridional overturning circulation at 34.5∘ S: Results from two pilot boundary arrays in the South Atlantic, J. Geophys. Res.-Ocean., 118, 6461–6478, https://doi.org/10.1002/2013JC009228, 2013.
Meinen, C. S., Johns, W. E., Moat, B. I., Smith, R. H., Johns, E. M., Rayner, D., Frajka-Williams, E., Garcia, R. F., and Garzoli, S. L.: Structure and Variability of the Antilles Current at 26.5∘ N, J. Geophys. Res.-Ocean., 124, 3700–3723, https://doi.org/10.1029/2018JC014836, 2019.
Meinen, C. S., Perez, R. C., Dong, S., Piola, A. R., and Campos, E.: Observed Ocean Bottom Temperature Variability at Four Sites in the Northwestern Argentine Basin: Evidence of Decadal Deep/Abyssal Warming Amidst Hourly to Interannual Variability During 2009–2019, Geophys. Res. Lett., 47, e2020GL089093, https://doi.org/10.1029/2020GL089093, 2020.
Myers, P. G., Kulan, N., and Ribergaard, M. H.: Irminger Water variability in the West Greenland Current, Geophys. Res. Lett., 34, L17601, https://doi.org/10.1029/2007GL030419, 2007.
Myers, P. G., Donnelly, C., and Ribergaard, M. H.: Structure and variability of the West Greenland Current in Summer derived from 6 repeat standard sections, Prog. Oceanogr., 80, 93–112, https://doi.org/10.1016/j.pocean.2008.12.003, 2009.
Naveira Garabato, A. C., Williams, A. P., and Bacon, S.: The three-dimensional overturning circulation of the Southern Ocean during the WOCE era, Prog. Oceanogr., 120, 41–78, https://doi.org/10.1016/j.pocean.2013.07.018, 2014.
Olson, D. B., Schott, F. A., Zantopp, R. J., and Leaman, K. D.: The Mean Circulation East of the Bahamas as Determined from a Recent Measurement Program and Historical XBT Data, J. Phys. Oceanogr., 14, 1470–1487, https://doi.org/10.1175/1520-0485(1984)014<1470:TMCEOT>2.0.CO;2, 1984.
Orsi, A. H., Whitworth, T., and Nowlin, W. D.: On the meridional extent and fronts of the Antarctic Circumpolar Current, Deep-Sea Res. Pt. I, 42, 641–673, https://doi.org/10.1016/0967-0637(95)00021-W, 1995.
Pacini, A., Pickart, R. S., Bahr, F., Torres, D. J., Ramsey, A. L., Holte, J., Karstensen, J., Oltmanns, M., Straneo, F., le Bras, I. A., Moore, G. W. K., and Femke de Jong, M.: Mean Conditions and Seasonality of the West Greenland Boundary Current System near Cape Farewell, J. Phys. Oceanogr., 50, 2849–2871, https://doi.org/10.1175/JPO-D-20-0086.1, 2020.
Parrilla, G., Lavín, A., Bryden, H. L., García, M., and Millard, R.: Rising temperatures in the subtropical North Atlantic Ocean over the past 35 years, Nature, 369, 48–51, https://doi.org/10.1038/369048a0, 1994.
Pérez-Hernández, M. D., Hernández-Guerra, A., Fraile-Nuez, E., Comas-Rodríguez, I., Benítez-Barrios, V. M., Domínguez-Yanes, J. F., Vélez-Belchí, P., and De Armas, D.: The source of the Canary current in fall 2009, J. Geophys. Res.-Ocean., 118, 2874–2891, https://doi.org/10.1002/jgrc.20227, 2013.
Pérez-Hernández, M. D., McCarthy, G. D., Vélez-Belchí, P., Smeed, D. A., Fraile-Nuez, E., and Hernández-Guerra, A.: The Canary Basin contribution to the seasonal cycle of the Atlantic Meridional Overturning Circulation at 26∘ N, J. Geophys. Res.-Ocean., 120, 7237–7252, https://doi.org/10.1002/2015JC010969, 2015.
Pérez-Hernández, M. D., Hernández-Guerra, A., Comas-Rodríguez, I., Benítez-Barrios, V. M., Fraile-Nuez, E., Pelegrí, J. L., and Naveira Garabato, A. C.: Differences between 1999 and 2010 across the Falkland Plateau: fronts and water masses, Ocean Sci., 13, 577–587, https://doi.org/10.5194/os-13-577-2017, 2017.
Pérez-Hernández, M. D., Hernández-Guerra, A., Cana-Cascallar, L., Arumí-Planas, C., Caínzos, V., González-Santana, A. J., Gutiérrez-Guerra, M. Á., Martínez-Marrero, A., Mosquera Giménez, Á., Presas Navarro, C., Santana-Toscano, D., and Vélez-Belchí, P.: The Seasonal Cycle of the Eastern Boundary Currents of the North Atlantic Subtropical Gyre, J. Geophys. Res.-Ocean., 128, e2022JC019487, https://doi.org/10.1029/2022JC019487, 2023.
Peterson, R. G. and Stramma, L.: Upper-level circulation in the South Atlantic Ocean, Prog. Oceanogr., 26, 1–73, https://doi.org/10.1016/0079-6611(91)90006-8, 1991.
Petit, T., Mercier, H., and Thierry, V.: New Insight Into the Formation and Evolution of the East Reykjanes Ridge Current and Irminger Current, J. Geophys. Res.-Ocean., 124, 9171–9189, https://doi.org/10.1029/2019JC015546, 2019.
Piecuch, C. G.: Likely weakening of the Florida Current during the past century revealed by sea-level observations, Nat. Commun., 11, 3973, https://doi.org/10.1038/s41467-020-17761-w, 2020.
Pollard, R. T., Read, J. F., Holliday, N. P., and Leach, H.: Water masses and circulation pathways through the Iceland Basin during Vivaldi 1996, J. Geophys. Res., 109, C04004, https://doi.org/10.1029/2003JC002067, 2004.
Polyakov, I. v., Pnyushkov, A. v., Alkire, M. B., Ashik, I. M., Baumann, T. M., Carmack, E. C., Goszczko, I., Guthrie, J., Ivanov, V. v., Kanzow, T., Krishfield, R., Kwok, R., Sundfjord, A., Morison, J., Rember, R., and Yulin, A.: Greater role for Atlantic inflows on sea-ice loss in the Eurasian Basin of the Arctic Ocean, Science, 356, 285–291, https://doi.org/10.1126/science.aai8204, 2017.
Polyakov, I. v., Rippeth, T. P., Fer, I., Alkire, M. B., Baumann, T. M., Carmack, E. C., Ingvaldsen, R., Ivanov, V. v., Janout, M., Lind, S., Padman, L., Pnyushkov, A. v., and Rember, R.: Weakening of Cold Halocline Layer Exposes Sea Ice to Oceanic Heat in the Eastern Arctic Ocean, J. Clim., 33, 8107–8123, https://doi.org/10.1175/JCLI-D-19-0976.1, 2020.
Rahmstorf, S.: On the freshwater forcing and transport of the Atlantic thermohaline circulation, Clim. Dynam., 12, 799–811, https://doi.org/10.1007/s003820050144, 1996.
Rhein, M., Mertens, C., and Roessler, A.: Observed Transport Decline at 47∘ N, Western Atlantic, J. Geophys. Res.-Ocean., 124, 4875–4890, https://doi.org/10.1029/2019jc014993, 2019.
Rossby, T., Flagg, C. N., Donohue, K., Sanchez-Franks, A., and Lillibridge, J.: On the long-term stability of Gulf Stream transport based on 20 years of direct measurements, Geophys. Res. Lett., 41, 114–120, https://doi.org/10.1002/2013GL058636, 2014.
Sarafanov, A., Falina, A., Mercier, H., Sokov, A., Lherminier, P., Gourcuff, C., Gladyshev, S., Gaillard, F., and Daniault, N.: Mean full-depth summer circulation and transports at the northern periphery of the Atlantic Ocean in the 2000s, J. Geophys. Res.-Ocean., 117, C01014, https://doi.org/10.1029/2011JC007572, 2012.
Saunders, P. M. and King, B. A.: Oceanic fluxes on the WOCE A11 section, J. Phys. Oceanogr., 25, 1942–1958, 1995.
Schmid, C. and Majumder, S.: Transport variability of the Brazil Current from observations and a data assimilation model, Ocean Sci., 14, 417–436, https://doi.org/10.5194/os-14-417-2018, 2018.
Schmitz, W. J. and McCartney, M. S.: On the North Atlantic circulation, Rev. Geophys., 31, 29–49, 1993.
Schmitz, W. J., Thompson, J. D., and Luyten, J. R.: The Sverdrup circulation for the Atlantic along 24∘ N, J. Geophys. Res., 97, 7251, https://doi.org/10.1029/92JC00417, 1992.
Schott, F. A., Dengler, M., Zantopp, R., Stramma, L., Fischer, J., and Brandt, P.: The Shallow and Deep Western Boundary Circulation of the South Atlantic at 5∘–11∘ S, J. Phys. Oceanogr., 35, 2031–2053, https://doi.org/10.1175/jpo2813.1, 2005.
Siedler, G., Müller, T. J., R.Onken, Arhan, M., Mercier, H., King, B. A., and Saunders, P. M.: The Zonal WOCE Sections in the South Atlantic, in: The South Atlantic: present and past circulation, edited by: Wefer, G., Berger, W. H., Siedler, G., and Webb, D. J., Springer-Verlag, Berlin, 83–104, https://doi.org/10.1007/978-3-642-80353-6_5, 1996.
Smythe-Wright, D., Chapman, P., Rae, C. D., Shannon, L. V., and Boswell, S. M.: Characteristics of the South Atlantic subtropical frontal zone between 15∘ W and 5∘ E, Deep-Sea Res. Pt. I, 45, 167–192, https://doi.org/10.1016/S0967-0637(97)00068-X, 1998.
Sokolov, S. and Rintoul, S. R.: Circumpolar structure and distribution of the Antarctic Circumpolar Current fronts: 1. Mean circumpolar paths, J. Geophys. Res., 114, C11018, https://doi.org/10.1029/2008JC005108, 2009.
Spadone, A. and Provost, C.: Variations in the Malvinas Current volume transport since October 1992, J. Geophys. Res., 114, C02002, https://doi.org/10.1029/2008JC004882, 2009.
Stendardo, I., Rhein, M., and Steinfeldt, R.: The North Atlantic Current and its Volume and Freshwater Transports in the Subpolar North Atlantic, Time Period 1993–2016, J. Geophys. Res.-Ocean., 125, e2020JC016065, https://doi.org/10.1029/2020JC016065, 2020.
Stramma, L.: The Brazil current transport south of 23∘ S, Deep-Sea Res. Pt. A, 36, 639–646, https://doi.org/10.1016/0198-0149(89)90012-5, 1989.
Stramma, L. and England, M.: On the water masses and mean circulation of the South Atlantic Ocean, J. Geophys. Res.-Ocean., 104, 20863–20883, https://doi.org/10.1029/1999JC900139, 1999.
Stramma, L., Ikeda, Y., and Peterson, R. G.: Geostrophic transport in the Brazil current region north of 20∘ S, Deep-Sea Res. Pt. A, 37, 1875–1886, https://doi.org/10.1016/0198-0149(90)90083-8, 1990.
Talley, L. D.: Freshwater transport estimates and the global overturning circulation: Shallow, deep and throughflow components, Prog. Oceanogr., 78, 257–303, https://doi.org/10.1016/j.pocean.2008.05.001, 2008.
Talley, L. D., Feely, R. A., Sloyan, B. M., Wanninkhof, R., Baringer, M. O., Bullister, J. L., Carlson, C. A., Doney, S. C., Fine, R. A., Firing, E., Gruber, N., Hansell, D. A., Ishii, M., Johnson, G. C., Katsumata, K., Key, R. M., Kramp, M., Langdon, C., Macdonald, A. M., Mathis, J. T., McDonagh, E. L., Mecking, S., Millero, F. J., Mordy, C. W., Nakano, T., Sabine, C. L., Smethie, W. M., Swift, J. H., Tanhua, T., Thurnherr, A. M., Warner, M. J., and Zhang, J.-Z.: Changes in ocean heat, carbon content, and ventilation: A review of the first decade of GO-SHIP global repeat hydrography, Ann. Rev. Mar. Sci., 8, 185–215, https://doi.org/10.1146/annurev-marine-052915-100829, 2016.
Tuchen, F. P., Brandt, P., Lübbecke, J. F., and Hummels, R.: Transports and Pathways of the Tropical AMOC Return Flow From Argo Data and Shipboard Velocity Measurements, J. Geophys. Res.-Ocean., 127, e2021JC018115, https://doi.org/10.1029/2021JC018115, 2022.
Våge, K., Pickart, R. S., Spall, M. A., Valdimarsson, H., Jónsson, S., Torres, D. J., Østerhus, S., and Eldevik, T.: Significant role of the North Icelandic Jet in the formation of Denmark Strait overflow water, Nat. Geosci., 4, 723–727, https://doi.org/10.1038/ngeo1234, 2011a.
Våge, K., Pickart, R. S., Sarafanov, A., Knutsen, Ø., Mercier, H., Lherminier, P., van Aken, H. M., Meincke, J., Quadfasel, D., and Bacon, S.: The Irminger Gyre: Circulation, convection, and interannual variability, Deep-Sea Res. Pt. I, 58, 590–614, https://doi.org/10.1016/j.dsr.2011.03.001, 2011b.
Valla, D., Piola, A. R., Meinen, C. S., and Campos, E.: Strong Mixing and Recirculation in the Northwestern Argentine Basin, J. Geophys. Res.-Ocean., 123, 4624–4648, https://doi.org/10.1029/2018JC013907, 2018.
Vélez-Belchí, P., Pérez-Hernández, M. D., Casanova-Masjoan, M., Cana, L., and Hernández-Guerra, A.: On the seasonal variability of the Canary Current and the Atlantic Meridional Overturning Circulation, J. Geophys. Res.-Ocean., 122, 4518–4538, https://doi.org/10.1002/2017JC012774, 2017.
Vivier, F. and Provost, C.: Direct velocity measurements in the Malvinas Current, J. Geophys. Res.-Ocean., 104, 21083–21103, https://doi.org/10.1029/1999JC900163, 1999a.
Vivier, F. and Provost, C.: Volume transport of the Malvinas Current: Can the flow be monitored by TOPEX/POSEIDON?, J. Geophys. Res.-Ocean., 104, 21105–21122, https://doi.org/10.1029/1999JC900056, 1999b.
Wedepohl, P. M., Lutjeharms, J. R. E., and Meeuwis, M.: Surface drift in the South-East Atlantic Ocean, South Afr. J. Mar. Sci., 22, 71–79, https://doi.org/10.2989/025776100784125672, 2000.
Weijer, W., Cheng, W., Drijfhout, S. S., Fedorov, A. V., Hu, A., Jackson, L. C., Liu, W., McDonagh, E. L., Mecking, J. V., and Zhang, J.: Stability of the Atlantic Meridional Overturning Circulation: A Review and Synthesis, J. Geophys. Res.-Ocean., 124, 5336–5375, https://doi.org/10.1029/2019JC015083, 2019.
Wunsch, C.: The North Atlantic General Circulation West of 50∘ W Determined by Inverse Methods, Rev. Geophys. Space Phys., 16, 583–620, 1978.
Wunsch, C.: The Ocean Circulation Inverse Problem, Cambridge University Press, Cambridge, USA, 464 pp., https://doi.org/10.1017/CBO9780511629570, 1996.
Wunsch, C. and Heimbach, P.: Estimated Decadal Changes in the North Atlantic Meridional Overturning Circulation and Heat Flux 1993–2004, J. Phys. Oceanogr., 36, 2012–2024, https://doi.org/10.1175/JPO2957.1, 2006.
Yashayaev, I. and Loder, J. W.: Recurrent replenishment of Labrador Sea Water and associated decadal-scale variability, J. Geophys. Res.-Ocean., 121, 8095–8114, https://doi.org/10.1002/2016JC012046, 2016.
Yashayaev, I. and Loder, J. W.: Further intensification of deep convection in the Labrador Sea in 2016, Geophys. Res. Lett., 44, 1429–1438, https://doi.org/10.1002/2016GL071668, 2017.
Zantopp, R., Fischer, J., Visbeck, M., and Karstensen, J.: From interannual to decadal: 17 years of boundary current transports at the exit of the Labrador Sea, J. Geophys. Res.-Ocean., 122, 1724–1748, https://doi.org/10.1002/2016JC012271, 2017.
Zenk, W. and Morozov, E.: Decadal warming of the coldest Antarctic Bottom Water flow through the Vema Channel, Geophys. Res. Lett., 34, L14607, https://doi.org/10.1029/2007GL030340, 2007.