the Creative Commons Attribution 4.0 License.
the Creative Commons Attribution 4.0 License.
 | 07 Apr 2022
Inherent optical properties of dissolved and particulate matter in an Arctic fjord (Storfjorden, Svalbard) in early summer
Børge Hamre
Håkon Sandven
Rüdiger Röttgers
Piotr Kowalczuk
Monika Zablocka
Mats A. Granskog
There have been considerable efforts to understand the hydrography of Storfjorden (Svalbard). A recurring winter polynya with large sea ice production makes it an important region of dense water formation at the scale of the Arctic Ocean. In addition, this fjord is seasonally influenced by freshwater inputs from sea ice melt and the surrounding islands of the Svalbard archipelago, which impacts the hydrography. However, the understanding of factors controlling the optical properties of the waters in Storfjorden are lacking and are crucial for the development of more accurate regional bio-optical models. Here, we present results from the first detailed optical field survey of Storfjorden conducted in early summer of 2020. Our observations are based on spectrometric analysis of water samples and in situ vertical profiles with an absorption and attenuation meter, a fluorometer, and a conductivity, temperature, and depth (CTD) sensor. In addition to the expected seasonal contribution from phytoplankton, we find that in early summer waters in Storfjorden are optically complex with a significant contribution from coloured dissolved organic matter (CDOM, 33 %–64 % of the non-water absorption at 443 nm) despite relatively low CDOM concentrations and in the nearshore or near the seabed from non-algal particles (up to 61 % of the non-water absorption at 550 nm). In surface waters, the spatial variability of light attenuation was mainly controlled by inorganic suspended matter originating from river runoff. A distinct subsurface maximum of light attenuation was largely driven by a subsurface phytoplankton bloom, controlled by stratification resulting from sea ice melt. Lastly, the cold dense bottom waters of Storfjorden from winter sea ice production periodically overflows the sill at the mouth of the fjord and can thus reach the Fram Strait. It contained elevated levels of both non-algal particles and dissolved organic matter, which are likely caused by the dense flows of the nepheloid layer interacting with the sea bed.
- Article
(10098 KB) - Full-text XML
- BibTeX
- EndNote


Located in the northern Barents Sea, Storfjorden, the largest fjord in the Svalbard archipelago, is influenced by two major water masses (Skogseth et al., 2005b), namely warm Atlantic water (AW) from the Norwegian Atlantic Current and cold Arctic water (ArW), which is AW-cooled along the traverse around Svalbard, entering the fjord from the north and east with the East Spitsbergen Current (ESC). The recurring winter polynya in Storfjorden (Skogseth et al., 2005a) is considered an important “ice factory” and winter sea ice formation here supports the production of about 5 %–10 % of the dense water formed in the whole Arctic Ocean (Smedsrud et al., 2006). This is related to subsequent release of salty brine from sea ice to the underlying relatively shallow waters, which creates favourable conditions for the formation of cold, salty brine-enriched shelf waters (BSWs) of high density (Skogseth et al., 2005b). While these phenomena are well documented, mainly from hydrographical surveys, knowledge of the inherent optical properties (IOPs) of waters in Storfjorden is lacking, which holds back the development of regional bio-optical models.
At a larger scale, over the Arctic Ocean, the largest recent reduction in the extent of sea ice in winter has been found to take place in the Barents Sea (Onarheim et al., 2018). While typically the Barents Sea is completely ice-free in summer and early to late autumn, a reduced winter/spring ice cover can have a significant impact on the light climate and the phenology of associated ice algae and phytoplankton (Leu et al., 2011). Recent studies have shown a northward progression of the polar front with associated changes to the seasonal plankton bloom and the sea ice reduction in the Barents Sea (Neukermans et al., 2018; Oziel et al., 2017). As sea ice continues to retreat, understanding the evolution of the optical properties of the water column, and in particular IOPs, is crucial for a better understanding of the potential changes in phytoplankton dynamics.
The two complementary ways of getting IOP observations in oceanic waters are (i) passive multispectral satellite imagery in the visible, often referred to as “ocean colour” imagery and (ii) field-based measurements. While the former enables improved spatial and temporal coverage of the IOP dynamics, it is especially difficult to operate in polar regions (International Ocean Colour Coordinating Group (IOCCG), 2015). Despite their limited availability, field observations thus remain the main source of information regarding IOPs in the Arctic. They also constitute a unique way of capturing the complex vertical structure of the optical properties in Arctic waters, the knowledge of which is essential for the remote sensing of stratified waters (Lee et al., 2020). In addition, increasing the number of observations through new surveys is critical for strengthening the statistical characterization of the parameters used when building regional bio-optical models (Kostakis et al., 2020), both for calibration and validation of ocean colour satellite products (Orkney et al., 2020) and for getting an accurate representation of optical properties in numerical models.
While we are not aware of any existing optical surveys in Storfjorden, there have been a few studies examining the optical characteristics of waters in the Barents Sea proper (Aas and Berge, 1976; Aas and Høkedal, 1996; Falk-Petersen et al., 2000; Hancke et al., 2014; Hovland et al., 2014; Kostakis et al., 2020; Orkney et al., 2020). Further, a number of other studies have been conducted in the region of AW inflow west and north of Spitsbergen (Kowalczuk et al., 2019; Makarewicz et al., 2018; Pavlov et al., 2015, 2017). All these studies point toward a significant contribution of phytoplankton to light attenuation in the open Barents Sea both north and south of the polar front, since the concentration of coloured dissolved organic matter (CDOM) in water masses of AW origin is relatively low, compared to “true” polar waters with a distinct higher CDOM signal (Pavlov et al., 2015). The cold ArW entering the Barents Sea from the north (Loeng, 1991), and located north of the polar front, is also low-CDOM water (Hancke et al., 2014), likely modified AW that has been cooled and somewhat freshened on its traverse around Svalbard, since similar low-CDOM ArW is found north of Spitsbergen (Kowalczuk et al., 2017; Pavlov et al., 2015). By contrast, true polar waters carry a distinct terrestrial CDOM signal from Arctic river runoff, with much higher CDOM levels as found in the East Greenland Current at the same latitude as Storfjorden (Granskog et al., 2012; Pavlov et al., 2015). Local runoff and meltwaters from land and glaciers are potential sources of optically active constituents, both particulate and dissolved, as evidenced in several Spitsbergen fjords (Halbach et al., 2019; McGovern et al., 2020; Pavlov et al., 2019; Sagan and Darecki, 2018), where turbidity induced by particles from river runoff and glacial meltwaters often control the light climate and thus productivity instead of phytoplankton or CDOM (Halbach et al., 2019).
Given the complex dynamics in Storfjorden and the vicinity of the surrounding land masses, we surmise that factors affecting light attenuation in Storfjorden are likely driven by a complex interplay of the local circulation and dynamics and biological production in the fjord and are, to some degree, influenced seasonally by local runoff as in Spitsbergen fjords. Further, the dense BSW formed in winter may also carry some higher turbidity (Bensi et al., 2019) when these dense waters flow along the seafloor to their density-determined depths. In order to assess these assumptions, we present the first survey of the IOPs in Storfjorden shortly after sea ice has disappeared, since access to the fjord is very challenging in the ice season due to very dynamic ice conditions. Based on our field observations, we present a detailed characterization of the three types of optically active substances, namely phytoplankton, CDOM, and non-algal particles. We provide new insight on the factors controlling light attenuation in this fjord in early summer as well as on the relative contribution and origin of these substances.
The field work took place between 20–30 June 2020 during an expedition on the Norwegian coast guard vessel KV Svalbard that was undertaken as part of the Useful Arctic Knowledge Research School, hereafter UAK2020 (Sagen et al., 2020).
2.1 Sea surface conditions and sampling stations
At the time of the UAK2020 expedition there was no (or very few remnants of) sea ice in the fjord, and based on operational ice charts (https://cryo.met.no, last access: December 2020) the sea ice had completely disappeared from the fjord only some days before the expedition reached the area. The layout of the sampling programme was made to cover a section from the southern part of the fjord (Storfjordrenna) to the northernmost inner part of the fjord, crossing a prominent sill (sill depth about 120 m while the bottom depth of the deepest part of the inner fjord is ∼180 m). In addition, a section at the latitude of the sill was conducted across the fjord. Optical measurements and sampling were undertaken at the stations shown in Fig. 1, while extra hydrographical casts were conducted in addition to these stations (positions not shown). This study only focuses on the south–north transect for the sake of brevity, but the entire optical dataset is available (Petit et al., 2022).
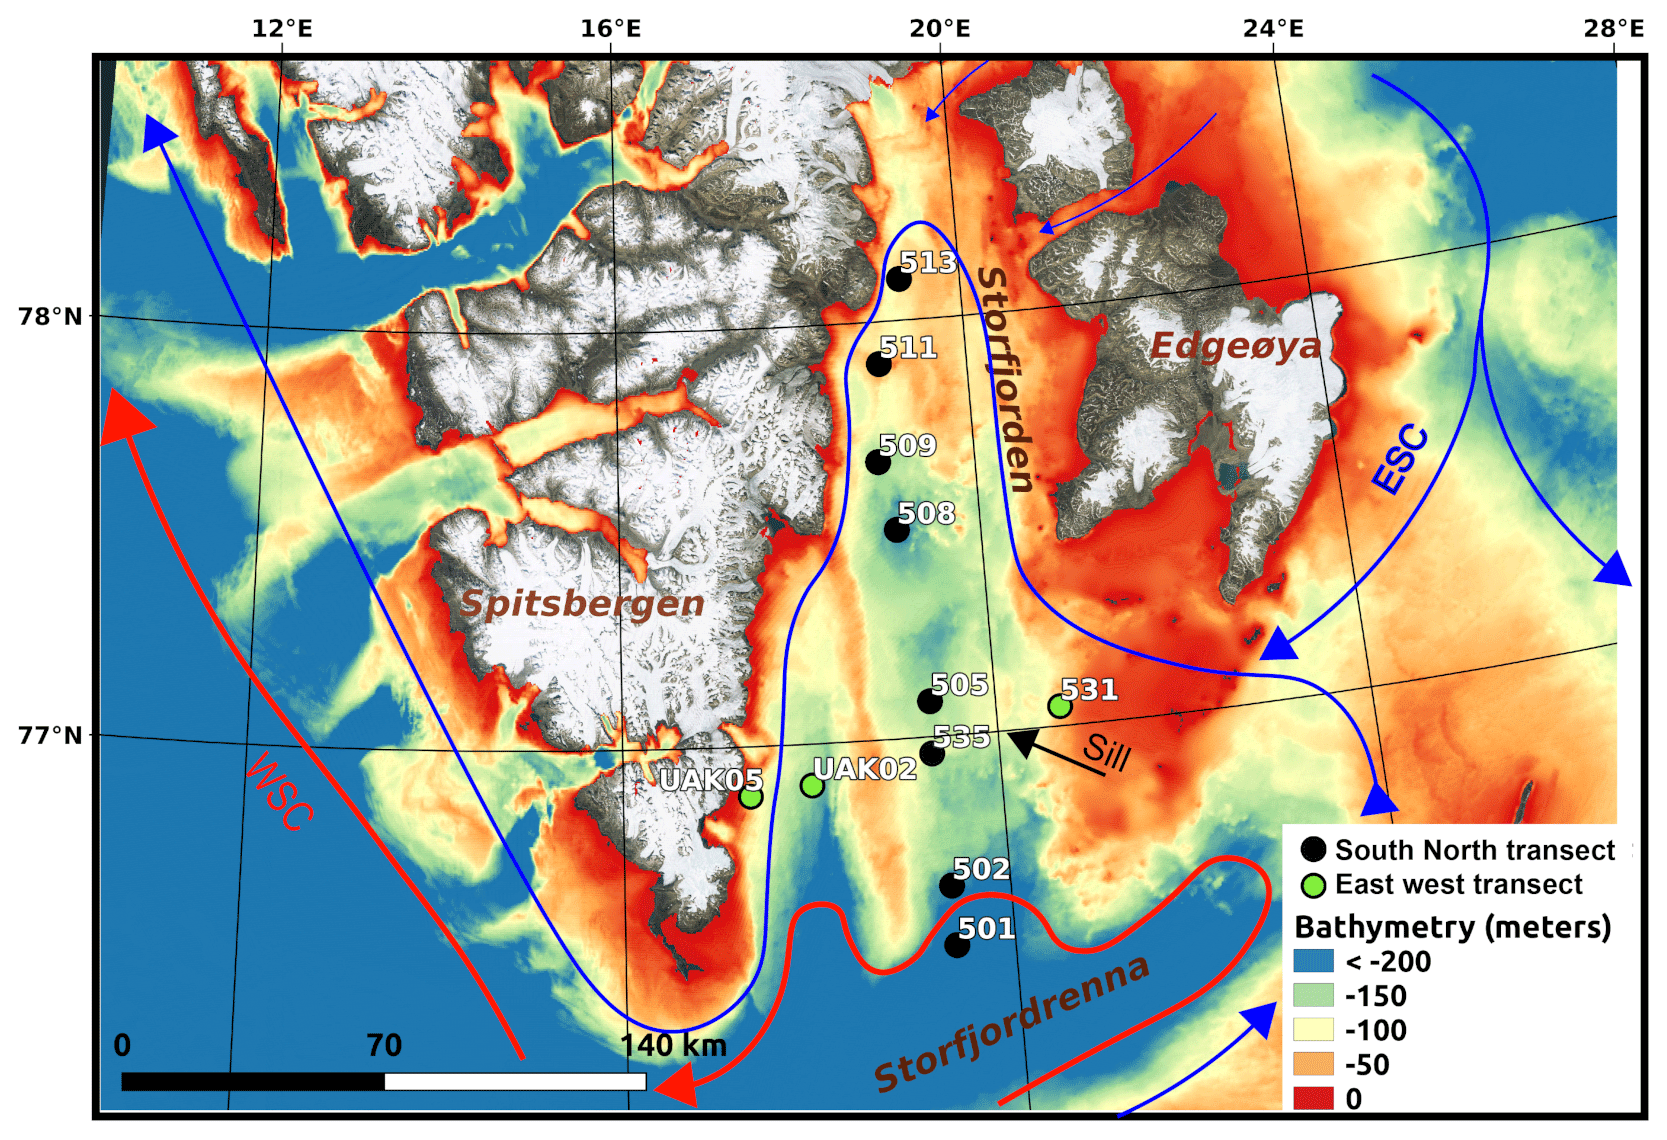
Figure 1Stations visited for optical measurements during the UAK2020 cruise in Storfjorden (Svalbard) along with bathymetry shown between 0–200 m (red to blue colours). This included seven stations along a south–north transect (marked black), from deep (>250 m) waters at the entrance of the fjord to a shallow (<50 m) area in the inner fjord. Four stations across the fjord entrance (along an east–west transect, marked green) were located at the latitude of the sill. Bathymetry is from GEBCO. The directions of the two main surface currents are given as arrows. The Svalbard land part comes from Bing aerial images (© Microsoft). The map projection is UTM33N.
2.2 In situ measurements and sampling procedures
Vertical profiles of IOPs (absorption a and attenuation c), fluorescence, together with conductivity (salinity, Sp, in practical salinity scale), temperature, and depth (pressure) were measured at all stations from the surface down to close to the bottom using an instrument package consisting of a 25 cm pathlength attenuation and absorption meter (ac-s, WET Labs Inc., USA), a fluorometer measuring fluorescence by dissolved organic matter (WetStar FDOM, Wet Labs Inc., USA), and an SBE37 SIP conductivity–temperature–depth (CTD) probe (Sea-Bird Electronics, USA). All these instruments were calibrated by the manufacturer in 2018 and had not been used since then. The data from all three instruments were stored by a DH4 data logger (WET Labs Inc., USA). Since there was no real-time pressure reading from the optical instrument package, the maximum depth for each cast had to be estimated using wire length. Thus, the actual distance to the bottom (from echo depth from the ship's echo sounder) varied from cast to cast. The battery failed at the two northernmost stations, and only one profile down to half the bottom depth could be achieved at station 513.
Total absorption (a) and attenuation (c) were obtained from the two tubes of the ac-s with a sampling frequency of 4 Hz. The processing steps involved (i) blank subtraction, (ii) salinity and temperature correction, and (iii) scattering correction of the absorption and attenuation channels. The blanks were measured by injecting ultra-pure water successively inside each channel using a peristaltic pump with constant flow of 0.6 L min−1. This was done once before and three times during the cruise to track any potential drift of the instrument. No evidence for any drift was found but we experienced more variability of the blank performed during the cruise and thus decided to use the blanks measured in the laboratory before the cruise in all the data processing. Salinity and temperature values were taken from the CTD data, which had a sampling frequency of ∼0.5 Hz, and the correction was applied following Van Zee et al. (2005). Scattering correction was performed using the flate method proposed by Röttgers et al. (2013). This correction assumes spectral invariance of the volume scattering function (VSF). It makes use of an empirical law for estimating the true absorption at 715 nm, from the 715 nm a channel of the ac-s. This value is then used to correct the whole spectrum. The rationale behind the use of a flat method instead of a proportional one is that with the latter the spectral shapes of the corrected spectra were less realistic and very low absorption spectra resulted in some (unrealistic) negative values.
FDOM was measured using a WET Labs WETStar fluorometer, with three excitation–emission pairs as follows: channel 1 (FDOM1, nm), which represents marine ultraviolet humic-like and marine humic-like material; channel 2 (FDOM2, nm), which represents terrestrial humic-like material; and channel 3 (FDOM3, nm) representing protein-like tryptophan-type material resulting from the presence of phytoplankton (for details, see Makarewicz et al., 2018). Fluorescence intensities acquired from the WETStar fluorometer are reported here in background-corrected raw counts (RCs). The background values were estimated in a lab with a dark environment by creating a flow of ultra-pure water into the sensor tube with a peristaltic pump.
Water was collected on a separate cast using a rosette with seven 4 L Niskin bottles with an SBE 19plus CTD (Sea-Bird Electronics, USA) giving real-time information about depth, temperature, and salinity. Water samples were collected to determine oxygen isotope ratio (δ18O), CDOM, and particulate matter (total, algal, and non-algal) absorption. The samples were collected at 10, 20, and 50 m and near bottom depths.
Water samples for CDOM were collected by gravity filtration through pre-rinsed 0.2 µm Millipore Opticap XL filter capsules connected to the Niskin with silicon tubing as described in Makarewicz et al. (2018). The samples were stored in 20 mL pre-combusted amber glass vials in the dark at +4 ∘C until analysis. CDOM samples were analysed on board within days of collection.
Samples for particulate absorption measurements were collected on 25 mm filters (Whatman GF/F, nominal pore size 0.7 µm) as described by Röttgers and Gehnke (2012). Special care was taken to keep a low vacuum during filtration to avoid algae cell breakage. The filtered volume was adjusted systematically following two criteria: (i) colour of the filter and (ii) filtering speed for anticipating potential clogging. Samples were immediately flash-frozen at −196 ∘C and stored in liquid nitrogen during the cruise and were later stored at −80 ∘C until analysis.
Samples for δ18O were collected into 20 mL polyethylene bottles, filled completely to avoid any headspace, and closed carefully, and the caps were sealed with parafilm. Samples were shipped to the Jan Veizer Stable Isotope Laboratory (University of Ottawa, Canada) for determination of the oxygen isotope ratio on a Finnigan MAT Delta plus XP + Gasbench. A precise amount of 0.6 mL of water was pipetted into Exetainer vials. No catalyst was required. The vials were flushed and filled with a gas mixture of 2 % CO2 in helium. The flushed vials were left at room temperature for a minimum of 5 d. The CO2 gas was analysed automatically in continuous flow. The results were normalized to VSMOW (Vienna Standard Mean Ocean Water) standard using three calibrated internal standards spanning most of the natural range. The precision of the analysis was ±0.15 ‰.
2.3 Laboratory methods
Spectral CDOM absorption coefficients were measured on board using a liquid waveguide capillary cell (LWCC) system following the IOCCG protocol (Mannino et al., 2019). This system included a DH-mini deuterium/tungsten source (Ocean Optics), a 1 m long LWCC, and a Flame-T spectrometer covering the UV–NIR (250–800 nm). The LWCC was cleaned with methanol at the beginning and end of each day. For each sample, intensity measurements in digital counts of the dark current IDC, reference purified water Iref, and sample water IS were performed successively, and this was repeated three times. The apparent absorption coefficient (in m−1) was then determined at each wavelength by averaging the three aapp spectra, each computed as follows:
with l=1.00 m as the optical path length. The apparent absorption coefficient of a 100 mg L−1 pre-burnt HPLC-grade NaCl solution aNaCl (in m−1) was measured with the same protocol. The salinity correction applied was as follows:
with Sp the practical salinity of the sample. It should be noted that the salinity-normalized apparent NaCl absorption was obtained by dividing aNaCl by 91 instead of 100 for taking into account the fact that seawater comprises salts other than NaCl. This number has been determined empirically (personal communication with Rüdiger Röttgers, 2020).

Figure 2Comparison of total particulate absorption coefficient ap(λ) as derived from the QFT-Perkin (A) and the QFT-ICAM (B) methods for the stations 501 (a) and 509 (b). These indicate minimal difference between the two methods for the overlapping wavelength range.
The particulate absorption coefficient was quantified for each sample filter by two independent methods of the quantitative filter techniques (QFTs) using integrating spheres large enough for placing the filters inside them. The first one (Röttgers and Gehnke, 2012, hereafter QFT-Perkin) uses a commercial laboratory UV–Vis–NIR spectrophotometer (Lambda 950, Perkin Elmer, USA), while the latter (Röttgers et al., 2016, hereafter QFT-ICAM) uses a custom-made portable integrating cavity absorption meter. In both cases, the optical density of the sample filters, ODS,was measured against the optical density of a wet reference blank filter ODref, taking a dry filter as the reference in both cases. The particulate absorption ap (m−1) was then determined as
where A (m2) is the filter patch area, β=4.5 (Röttgers and Gehnke, 2012) is the path length amplification factor, and V (m3) the volume of water filtered. The particulate absorption coefficient was measured between 350–750 and 390–850 nm with the QFT-Perkin and QFT-ICAM, respectively. The custom-made QFT-ICAM showed very good agreement with the QFT-Perkin method (Fig. 2). Non-algal particle (NAP) absorption aNAP (m−1) was measured with the QFT-ICAM method using the same filters after bleaching them with a 1 % NaOCl solution for 1–3 min. The bleach was removed by oxidation using a 10 % H2O2 solution, with the filters stored and measured 1 d later. The phytoplankton absorption aphy (in m−1) was computed as the difference between total and NAP absorption (.
2.4 Satellite data
Clear-sky conditions prevailed during the days of the cruise, and thus, as background information to this study, we included a qualitative analysis of a Sentinel-2 image taken on 22 June 2020 over Storfjorden. The Sentinel-2 mission, launched by the European Space Agency (ESA) under the Copernicus programme, is a constellation of two satellites launched in 2015 and 2017, respectively. Each of them encompasses a multispectral imager (MSI) capturing light in 13 spectral bands from 443 nm in the visible to 2190 nm in the short-wave infrared. Compared to existing satellite missions like Sentinel-3 OLCI, it has a higher spatial resolution (10–60 m depending on the band), which makes it suitable for catching the high spatial variability typically encountered in coastal environments.
The Sentinel-2 satellite data were downloaded from the Copernicus Open Access Hub via the sentinelsat python package in geo-corrected top-of-the-atmosphere (TOA) spectral radiance (L1C product). An atmospheric correction algorithm based on Acolite (Vanhellemont and Ruddick, 2016) was used for converting the TOA data into a bottom-of-the-atmosphere (BOA) reflectance. The algorithm was implemented using the python package Py6S (Wilson, 2013). This solution uses the state-of-the-art 6S vector radiative transfer model (Vermote et al., 1997) for estimating and removing the contribution of atmospheric gases and aerosols to the remote-sensing signal. The gas (aerosol) model was set to subarctic summer (maritime), and a manual value of 0.1 was set for the aerosol optical thickness at 440 nm (aiming at BOA reflectance of around 0 in the near-infrared in areas with low turbidity). There was no swell and no wind at the time of acquisition as well as favourable solar-sensor geometry, and we thus did not have to apply any sunglint removal strategy. The algorithm of Nechad et al. (2010) was used for estimating the turbidity and enhancing the visual analysis of the surface water. It has been shown to be robust to various environmental conditions (Dogliotti et al., 2015). Considering the very low concentration of phytoplankton in surface waters, both noticeable from our observations (see Sect. 3.) and expected due to the stratification-related summer nutrient depletion of the upper layer (Tremblay et al., 2015), we did not apply any chlorophyll a retrieval algorithm to the satellite data.
3.1 Inputs from the shore
An assessment of the impact of terrestrial runoff on the optical properties of surface water on 22 June 2020 was done using Sentinel-2 bottom-of-the-atmosphere reflectance (Fig. 3a) and turbidity (Fig. 3b). As expected from the season (late June) and associated land snow and glacier melt, significant turbidity plumes were observed nearshore with turbidity >3.5 FNU (red colour in Fig. 3b), while it was <0.8 FNU (blue colour in Fig. 3b) in the central parts of the fjord where sampling effort was concentrated. Along the main south–north transect, only the stations 509, 511, and 513, all sampled on 26 June (4 d after the satellite acquisition), seem to be close enough for being potentially impacted by the coastal inputs of particles and coloured dissolved organic matter. This confirms the similar assertion made from the analysis of the δ18O data (see Sect. 3.2).

Figure 3Satellite products derived from a Sentinel-2 acquisition on 22 June 2020: (a) false colour composite of the red (665 nm), green (560 nm), and blue (492 nm) channels of the bottom-of-the-atmosphere (BOA) reflectance, with values shown between 0–0.07, (b) turbidity map derived from the BOA reflectance with the land part for illustration (Bing aerial image © Microsoft). The position of the sampling stations is indicated in black (south–north transect) and green (east to west transect).
3.2 Hydrographic setting in Storfjorden in early summer
Section plots of salinity and temperature for the south–north transect are presented in panels a and b of Fig. 4. A surface layer of fresher (Sp∼33) and warmer (T>2 ∘C) water was found down to about 20 m depth, followed by a strong density gradient between 20–30 m depth. These section plots also highlight very dense and cold (Sp>35.2 and ∘C) bottom waters for the stations north of the sill (at depths >125 m) but also south of the sill at the bottom. At the southernmost station in Storfjordrenna there are warmer temperatures down to 125 m depth, indicative of warmer AW from the West Spitsbergen Current (WSC) entering the Storfjordrenna. In addition, dense, cold BSW was present at the bottom, likely a result of an overflow of BSW over the sill from Storfjorden proper. δ18O values (Fig. 4c) were positive and ranged from 0.2 ‰–1 ‰, which indicates contribution from sea ice melt at the surface and limited impact from runoff along the main south–north transect in the middle of the fjord (e.g. station 535). Only a few northern stations (stations 509 and 511) with the lowest δ18O values at the very surface compared to other stations show signs that local runoff could have reached the offshore location of the sampling stations.
This situation appears typical for the fjord in summer (Fossile et al., 2020), with a rather shallow fresher and warmer, well-stratified surface layer present over the entire fjord and near-freezing, salty, brine-enriched waters at the bottom of the fjord. The surface layer was shallower than later in summer (see Fossile et al., 2020), likely because the sea ice had just disappeared, which has limited the time for mixing and deepening of the surface layer. Below sill depth we find evidence for the presence of BSW in the fjord from winter sea ice production.
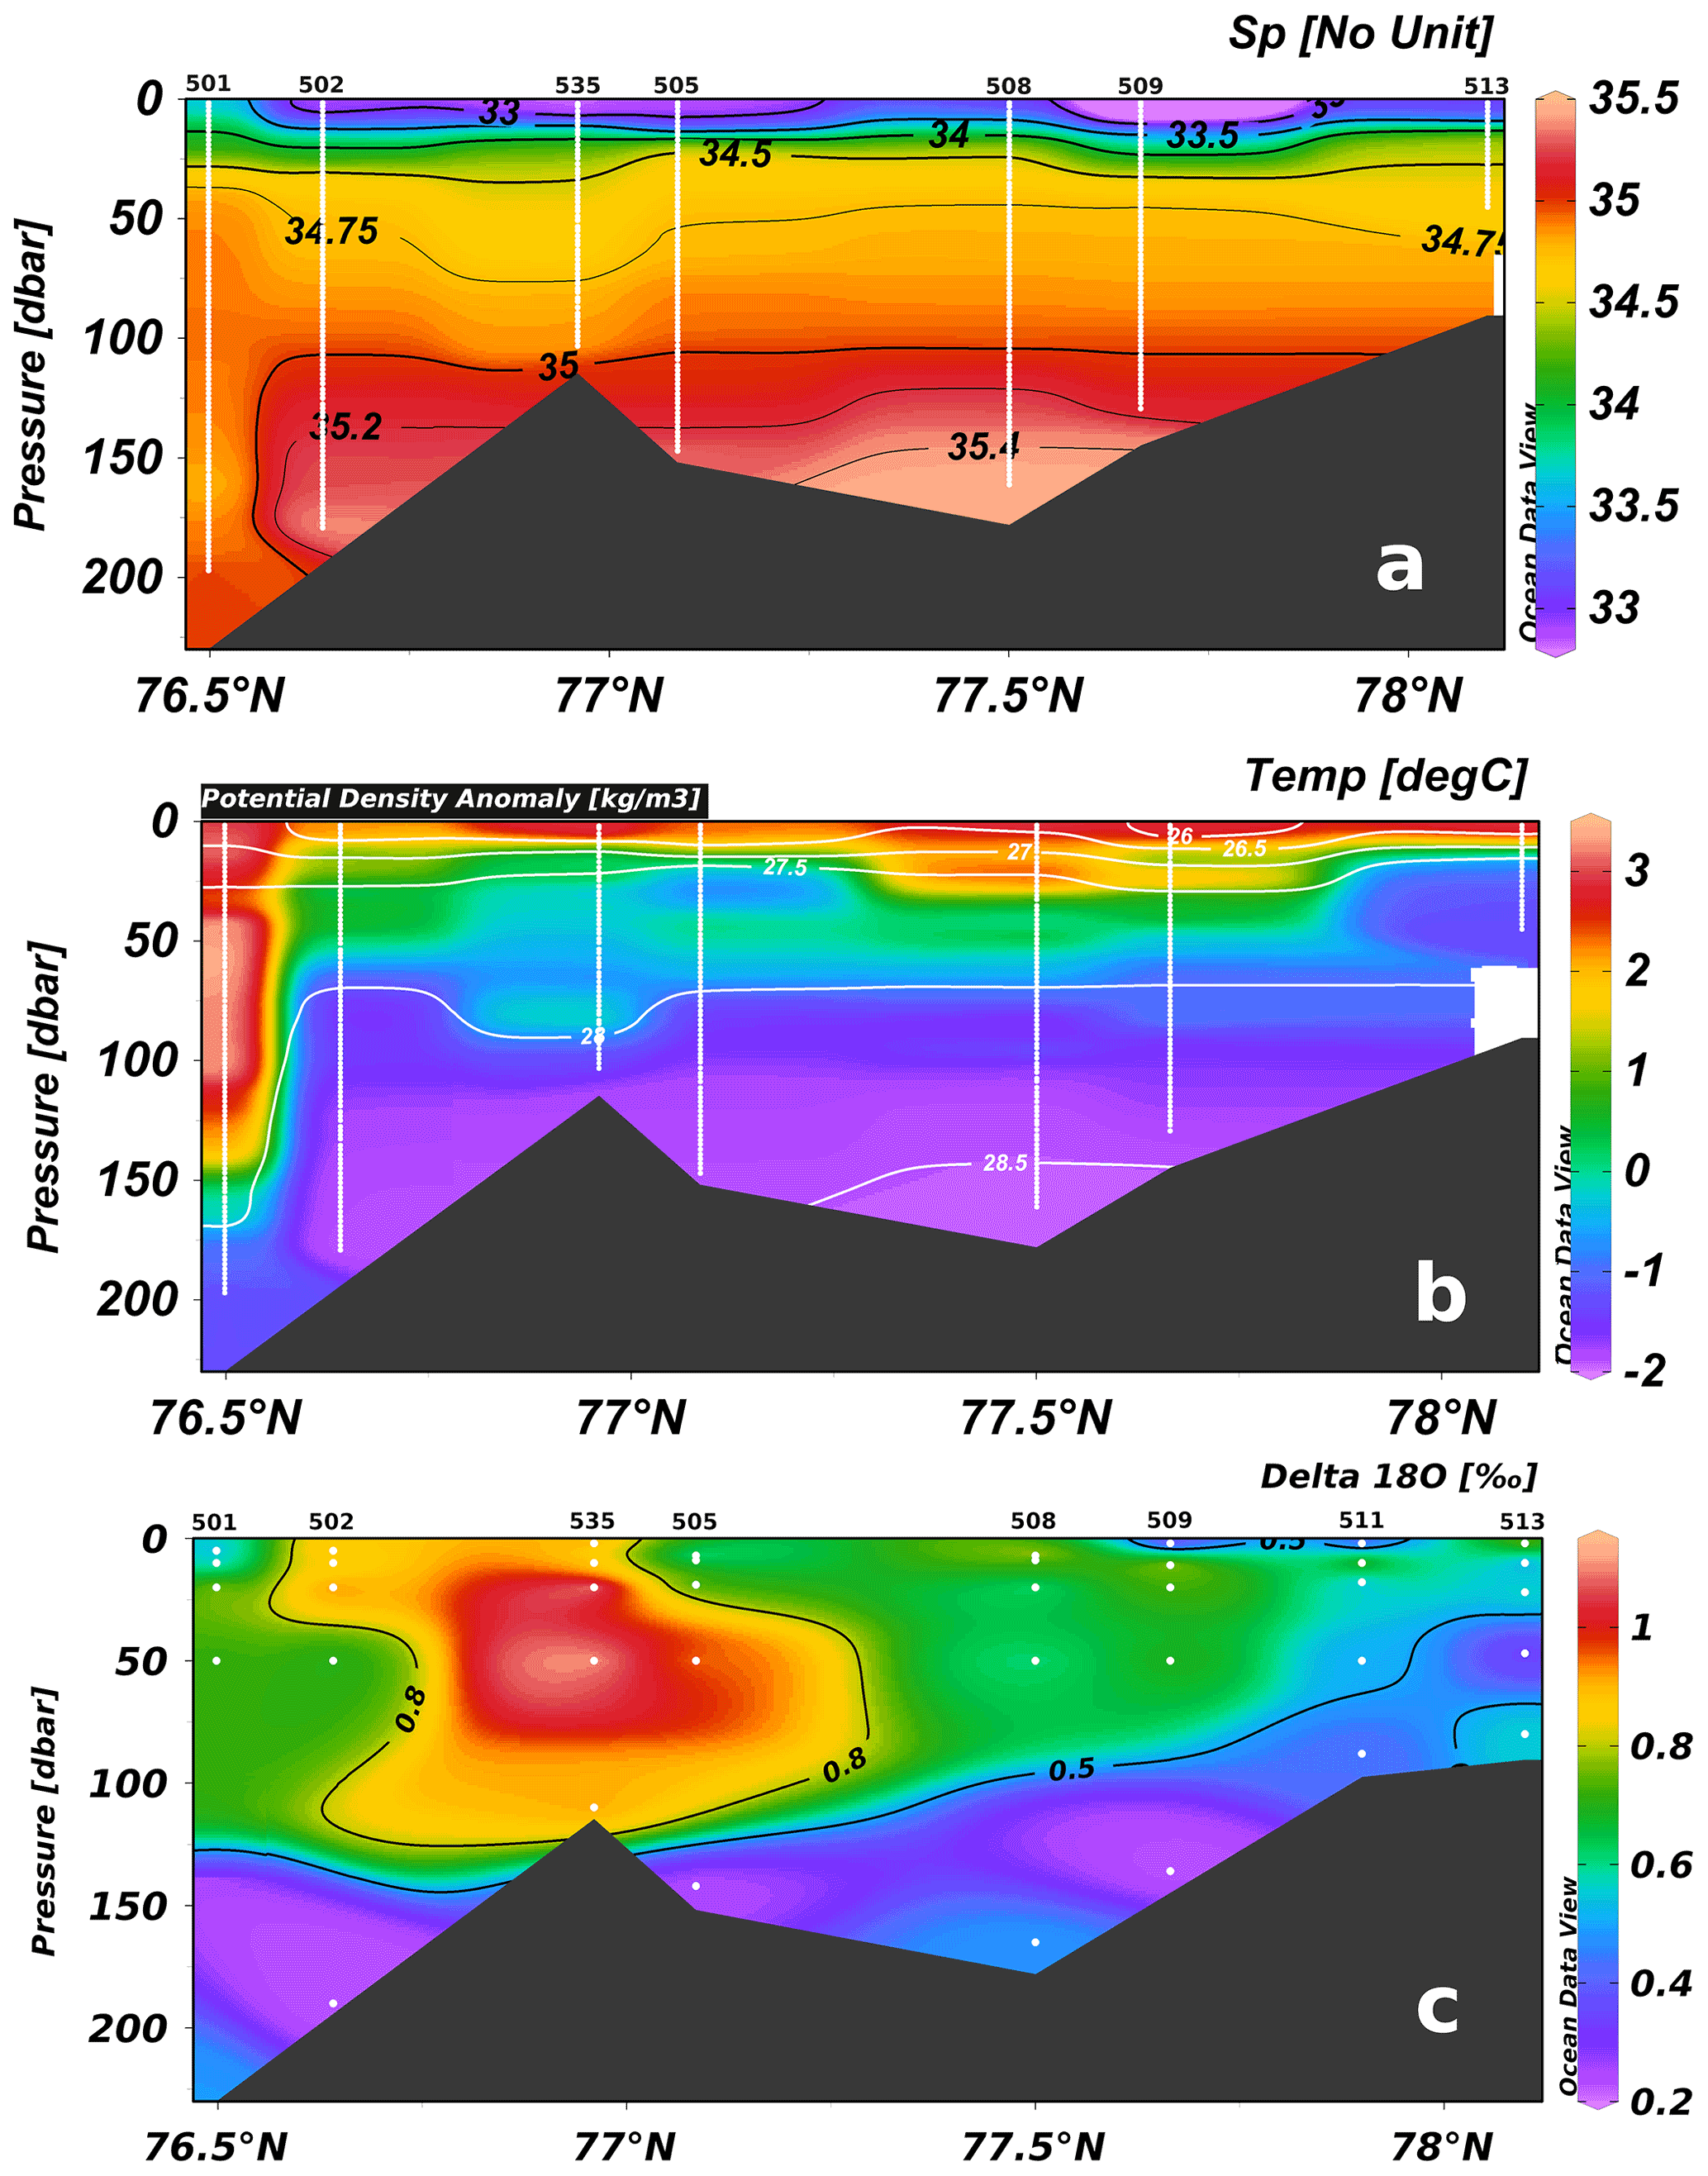
Figure 4Section plots of (a) practical salinity, (b) temperature with white isolines of potential density anomaly and (c) oxygen isotope ratio (δ18O) from water samples along south–north transect (See Fig. 1), from the Storfjordrenna to the inner fjord. White lines in (a) and (b) indicate the location and depth of the CTD data, and in (c) white dots indicate the location of the water samples. Plots are made with Ocean Data View (Schlitzer, Reiner, Ocean Data View, https://odv.awi.de/, last access: 30 January 2022).
3.3 Observed inherent optical properties in relation to hydrography
In situ observations of the attenuation coefficient at 440 nm, c(440) (Fig. 5b), which is the sum of absorption and scattering coefficients and varies with CDOM, phytoplankton, and non-algal particle concentration, show how IOPs are related to the stratification and water masses in the fjord and/or to the inputs from land. The ratio between the scattering and absorption at 440 nm, (Fig. 5a), gives some indication of the nature of the IOPs, with very high values corresponding to strong scatterers like mineral particles, and lower values obtained when the IOPs are dominated by CDOM or phytoplankton.
There are distinct subsurface maxima of attenuation (∼1.5 m−1 at 440 nm) with a very high scattering-to-absorption ratio (>11) for the northernmost station 513. This could be linked to land inputs visible in the satellite data (Fig. 3). Indeed, particles coming from land are typically strong scatterers, especially the mineral ones due to their high refractive index. The presence of such particles in the water would then increase the scattering-to-absorption ratio observed in the areas of the fjord influenced by runoff. For most of the other stations we can see distinct subsurface maxima in c(440) between 25–50 m depth with showing lower values (5–7). This may be linked to the presence of phytoplankton as phytoplankton cells, which contain a lot of water, are weaker scatterers compared to other types of particles present in seawater. AW in Storfjordrenna and waters at intermediate depth in the fjord show the lowest attenuation (∼0.25 m−1 at 440 nm), and here also the contribution from scattering is lowest with a scattering-to-absorption ratio of ∼5. We found elevated scattering relative to absorption at the very bottom at several stations, mostly next to the sill. Apart from station 513, we also observed widespread highly scattering particles in the surface layer (often with low concentration, as deduced from concomitant low c(440)). They could potentially result from very small (fine grain size) non-algal particles melted out from sea ice (Bélanger et al., 2013; Granskog et al., 2015) or, as suggested very recently in Davies et al. (2021), by some large non-mineral particles such as fish eggs or zooplankton. The ratio of the scattering to absorption coefficient (Fig. 5a) was generally very high in Storfjorden: there was up to 11 times more scattering than absorption at 440 nm (which corresponds to a single-scattering albedo of 0.92). A similar increase in scattering was also observed west and north of Spitsbergen in surface layers affected by sea ice melt (Granskog et al., 2015).
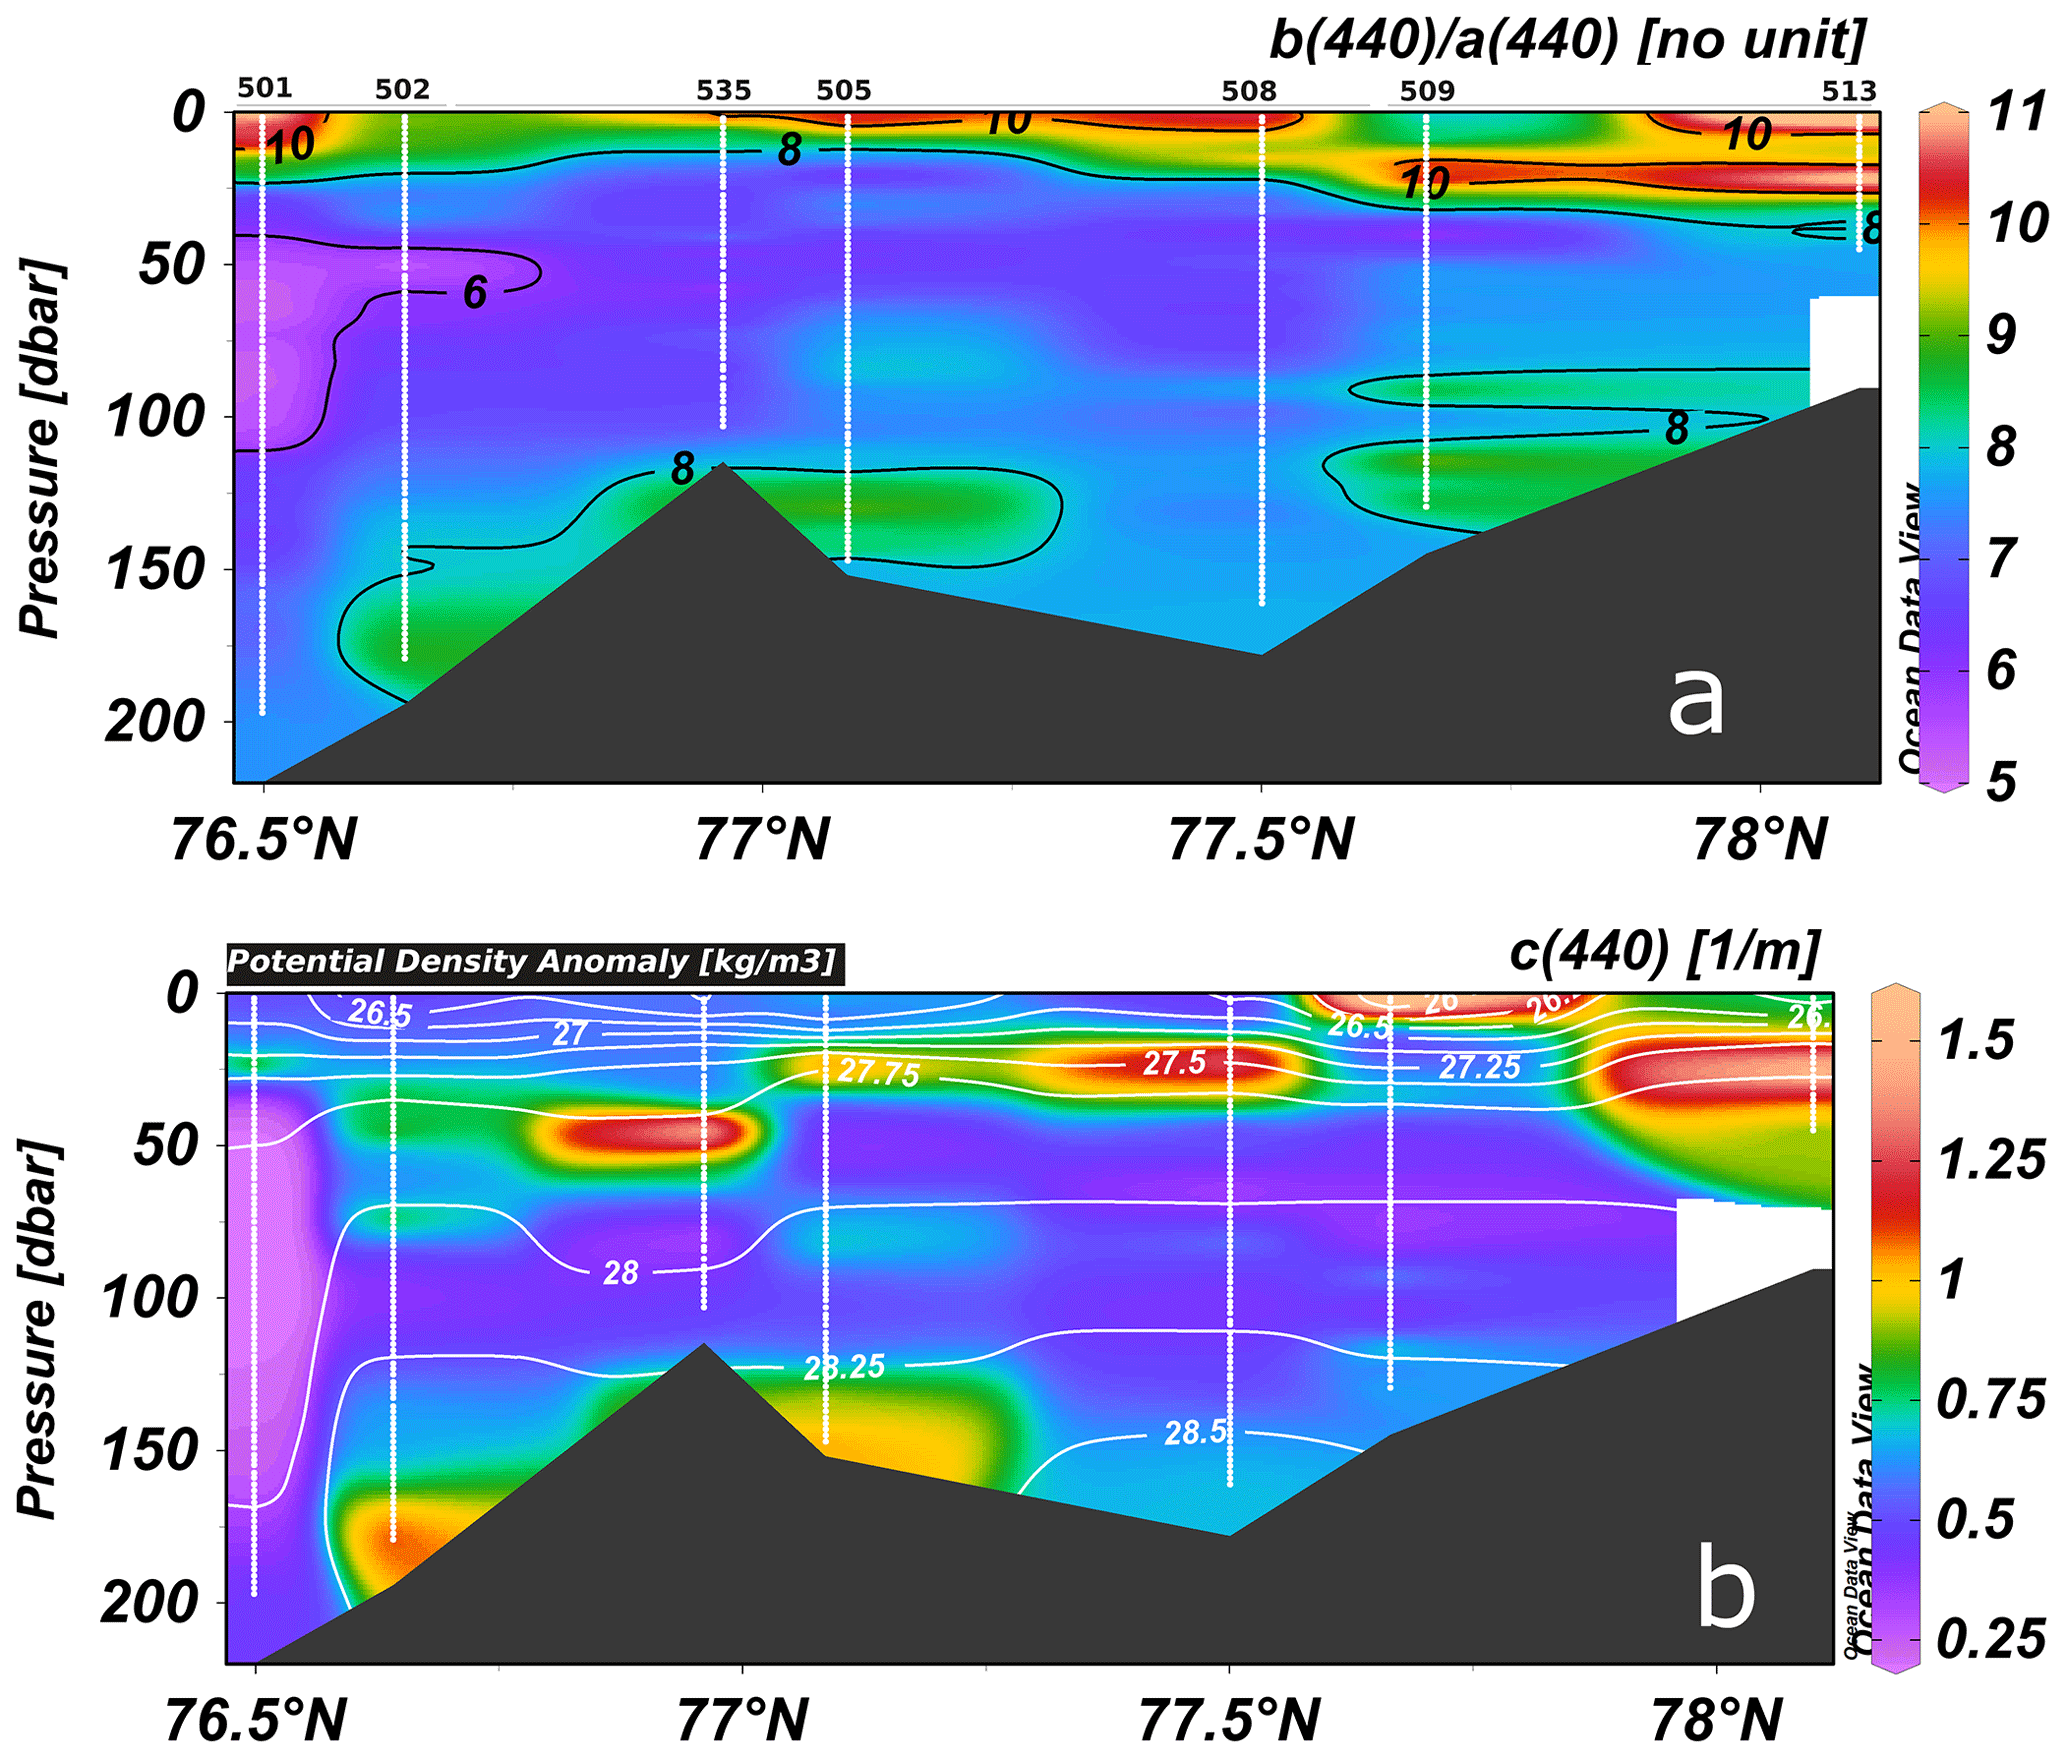
Figure 5Section plots of (a) ratio of scattering to absorption at 440 nm and (b) total attenuation coefficient at 440 nm with white contours of potential density anomaly from in situ ac-s data for the south–north transect (see Fig. 1). Plots are made with Ocean Data View (Schlitzer, Reiner, Ocean Data View, https://odv.awi.de/, last access: 30 January 2022).
3.4 Characteristics of CDOM and FDOM
The concentration of CDOM, here quantified in Fig. 6a by its absorption coefficient at 440 nm aCDOM(440), shows values within the range 0.02–0.05 m−1, which are levels typical for AW in the WSC (aCDOM(443): 0.016–0.51 m−1; Kowalczuk et al., 2019) and in the Barents Sea proper (aCDOM(443): 0.035–0.162 m−1; Hancke et al., 2014). Although the resolution of water samples was low, some distinct patterns appear. The very surface layer seems to have the lowest CDOM, which is likely linked to dilution from recent melting of low-CDOM sea ice (Granskog et al., 2015; Mascarenhas and Zielinski, 2019; Kowalczuk et al., 2017). This reveals an opposite trend compared to what is usually found in estuaries where water does not freeze (Bowers and Brett, 2008) or when riverine discharge dominates the freshwater budget (Pavlov et al., 2016), with lower salinity then corresponding to increased CDOM level. However, there was elevated CDOM absorption at the very bottom at several stations, linked with the dense and cold BSW. The spectral slope of absorption by CDOM has been found to be a proxy of some of its characteristics like the source/origin, molecular weight, or photodegradation of dissolved organic matter (Hayase and Tsubota, 1985; Granskog, 2012; Helms et al., 2008). It is however recognized that this indicator is influenced by the spectral range and numerical method used in the computation of the slope (Helms et al., 2008), as well as by the mixing of water masses with distinct CDOM optical properties (Stedmon and Markager, 2003), making a direct comparison between studies often difficult. The spectral slope in the 350–550 nm range, S350–550, was here in the range of 0.013–0.0167 nm−1. This matched very well with observations east of Storfjorden in the Barents Sea proper (Hancke et al., 2014) but was lower compared to spectral slope values in AW in the WSC (Makarewicz et al., 2018). The lowest spectral slope values were observed at the southern end of the transect and corresponded to inflowing AW water. Higher values of the nm−1 were observed in the bottom waters (Fig. 6b), linked with cold and dense BSW, indicating a different type of CDOM that might have, e.g., lower molecular weight.
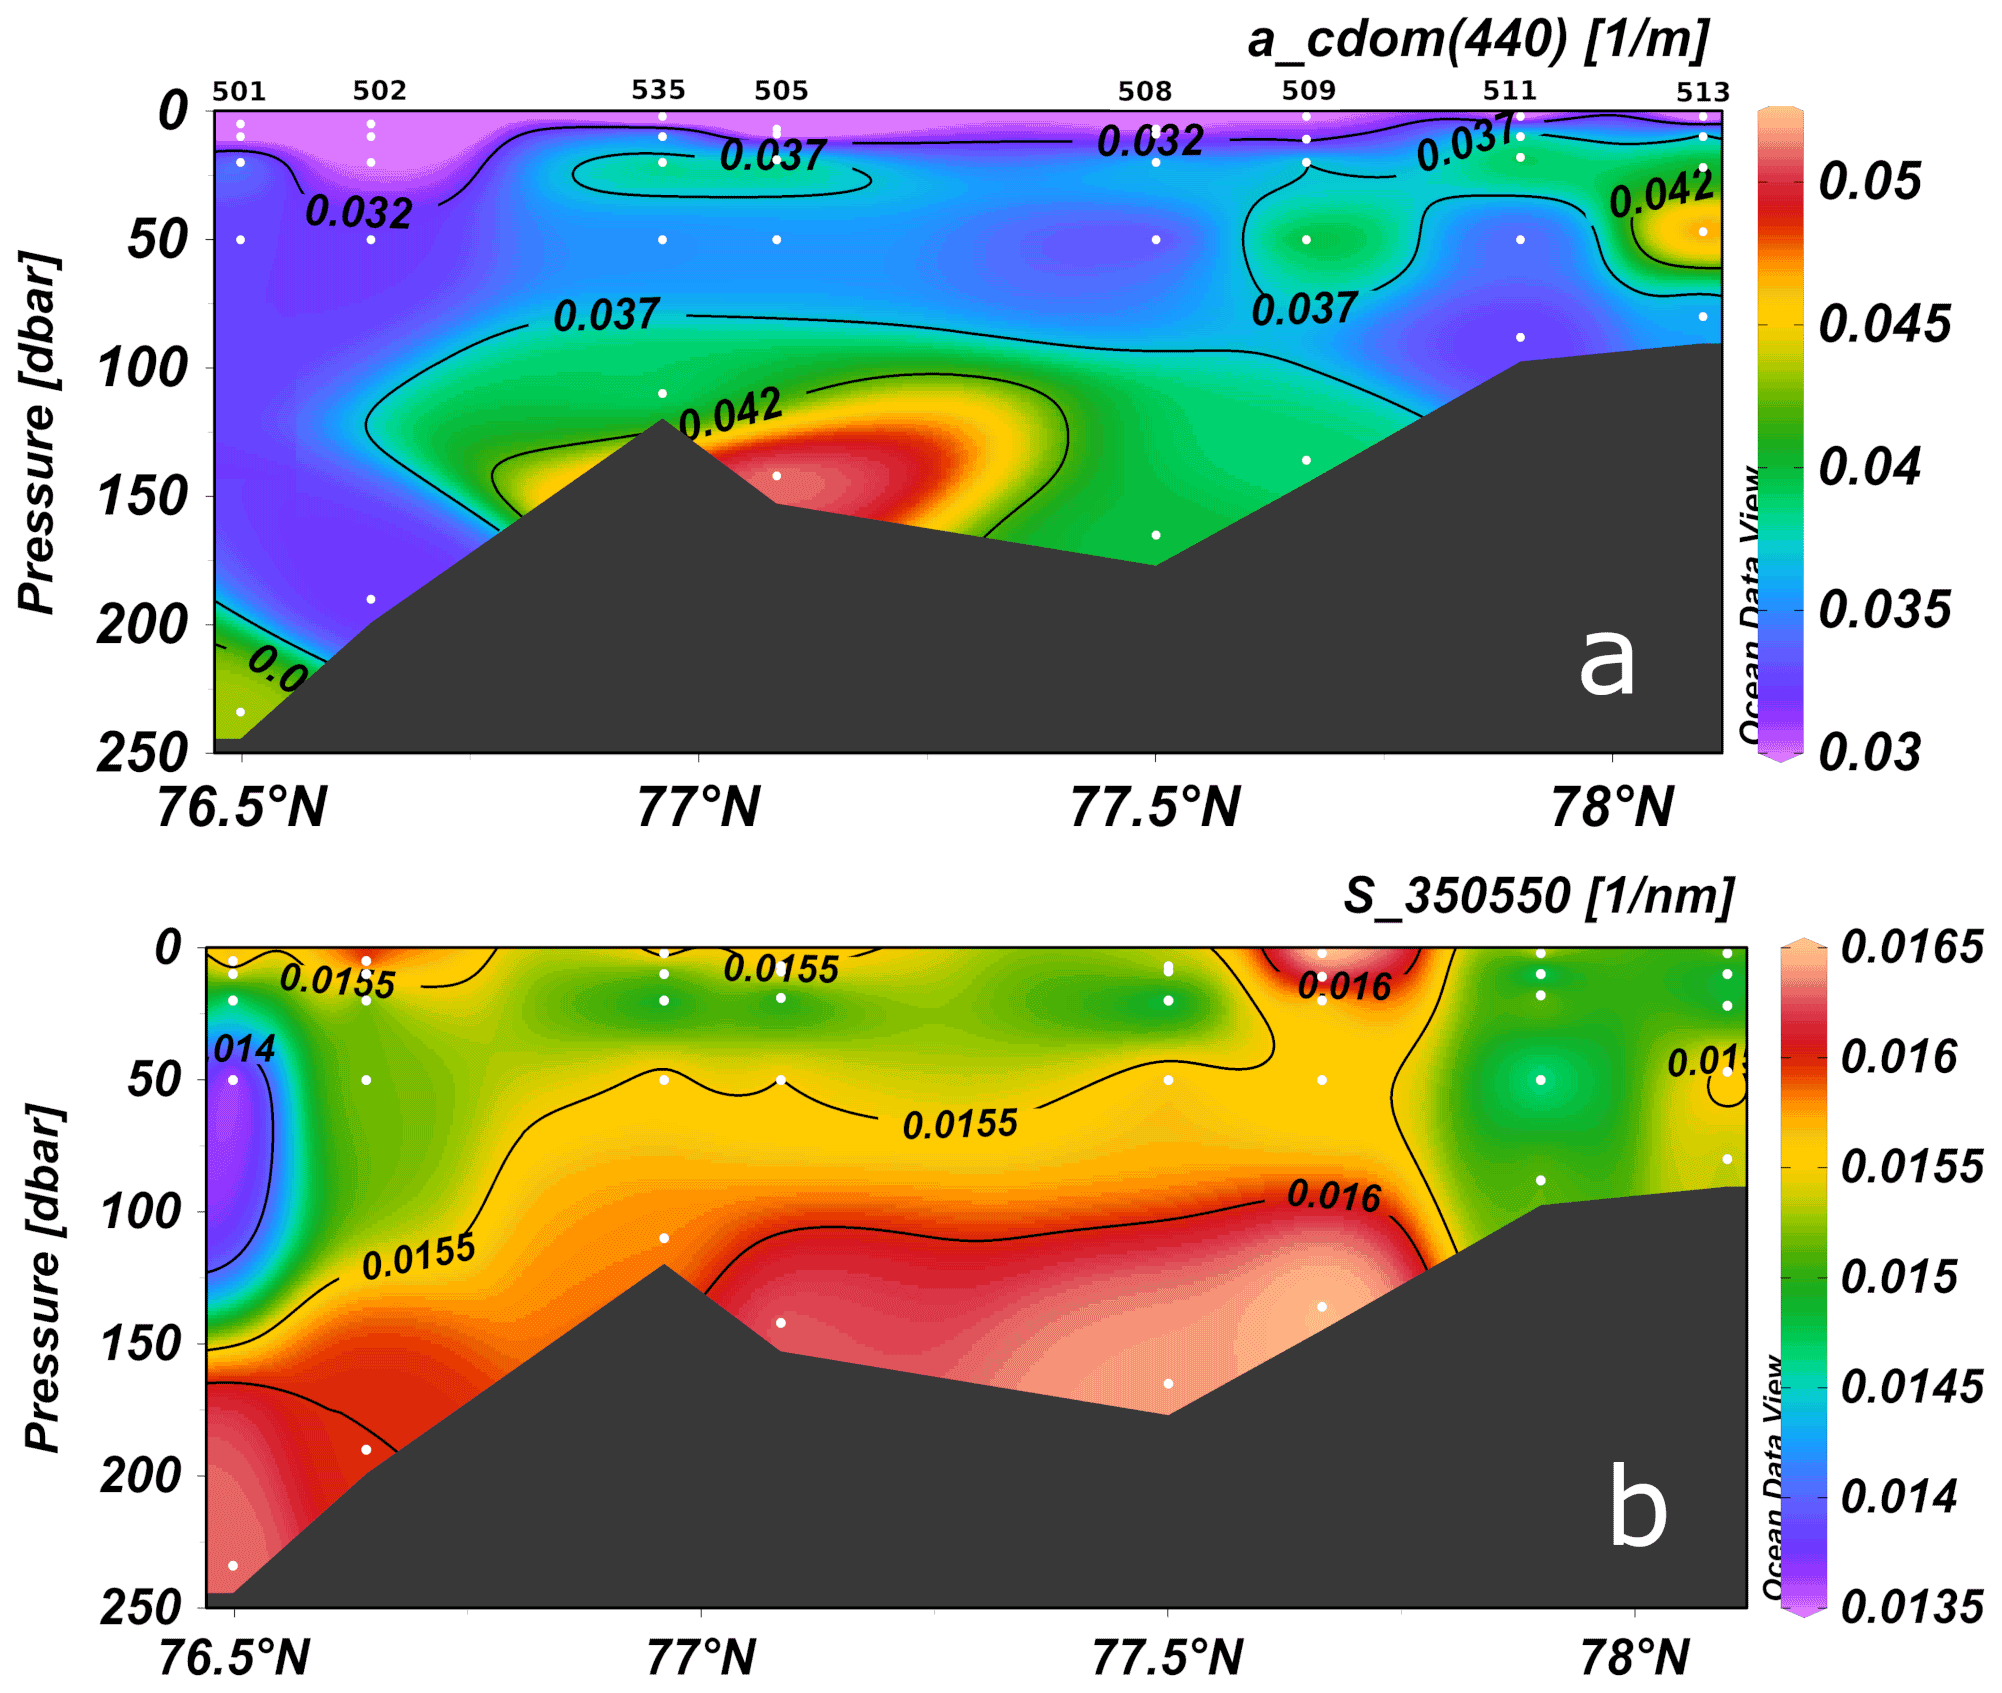
Figure 6Section plots of (a) CDOM absorption at 440 nm and (b) the spectral slope of CDOM absorption in the wavelength range 350 to 550 nm from water samples. Data locations shown with white dots. Plots are made with Ocean Data View (Schlitzer, Reiner, Ocean Data View, https://odv.awi.de/, last access: 30 January 2022).
The fluorescence originating from three pairs of excitation–emission gave more insights about the origin of the dissolved organic matter and processes regulating distribution of different dissolved organic matter (DOM) fractions in the water column. As already observed for AW in the WSC (Makarewicz et al., 2018) we found overall low values of humic-like FDOM in Storfjorden (Fig. 7a, b). The FDOM1 and FDOM2 fluorescence intensities were ∼1.5 higher at the core of Storfjorden compared to the southernmost part of the transect in the presence of AW. The surface, low-salinity layer was characterized by the lowest FDOM1 and FDOM2, linked to the same dilution-based phenomenon as observed for CDOM, while they showed the highest values near the bottom, especially north of the sill. These high values are likely linked to the accumulation of BSW with humic-like DOM fraction originating from brine release (Müller et al., 2013). On the other hand, the tryptophan-like compound (Fig. 7c) shows a higher dynamic range and distinct patterns with a subsurface maximum linked to the density gradient visible in Fig. 5 (white isolines). This is linked to the subsurface chlorophyll maxima (SCM) that we observed (see Sect. 3.), which are common in stratified Arctic waters (Ardyna et al., 2013). Fluorescence by tryptophan-like compounds was also found by Makarewicz et al. (2018) to be tightly related to chlorophyll a concentration in the AW. The variation in (F)DOM in the fjord is thus largely linked to biological activity in the surface waters and tends to demonstrate low variability of the other (humic-like) sources of DOM in Storfjorden, which in turn points to a limited contribution of DOM from land runoff to the fjord's DOM pool.
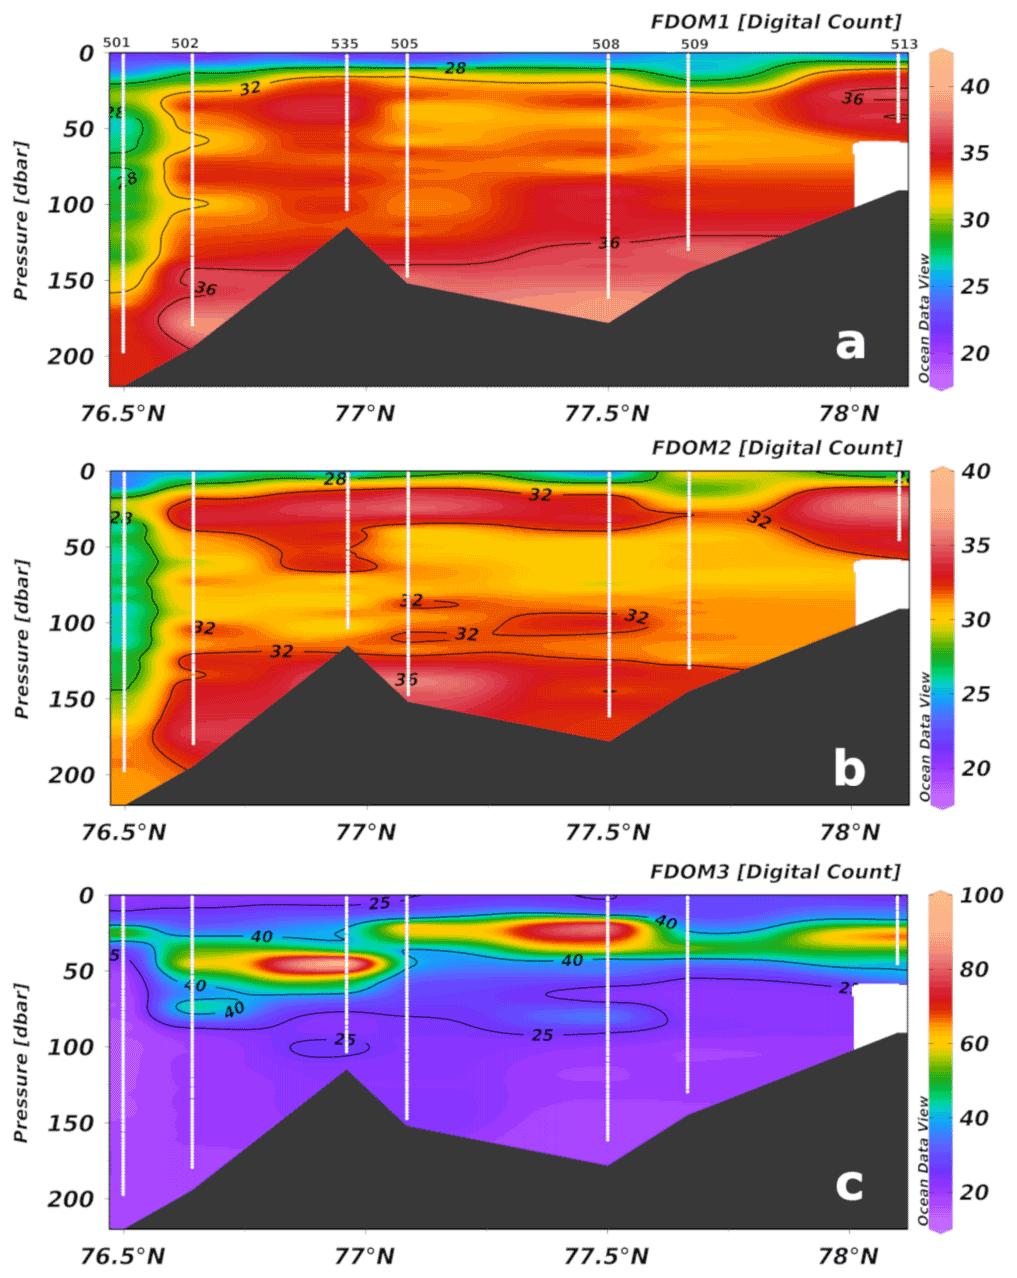
Figure 7Section plots of FDOM (a) channel 1 (marine humic-like material), (b) channel 2 (terrestrial humic-like material), and (c) channel 3 (tryptophan-like material) from the in situ cast. Data locations shown with white dots. Plots are made with Ocean Data View (Schlitzer, Reiner, Ocean Data View, https://odv.awi.de/, last access: 30 January 2022).
3.5 Characteristics of particulate matter
In situ spectral absorption measurements also indicated that the subsurface maxima in tryptophan-like FDOM, scattering, and absorption were linked to phytoplankton biomass. The absorption line height at 676 nm (aLH(676), Roesler and Barnard, 2013) was computed from in situ ac-s absorption at 650, 676, and 715 nm as a proxy for phytoplankton biomass. It was computed as follows:
The section plot of aLH(676) (Fig. 8a) confirmed that the subsurface maxima in tryptophan-like FDOM (FDOM3) and attenuation at 440 nm were due to increase in phytoplankton concentration for the central (maximum aLH(676) around 25 m depth at station 505) and southern (max. aLH(676) around 50 m depth at station 502) part of the fjord. This subsurface layer of increased phytoplankton abundance was interfacing the frontal zone between inflowing AW and ArW. This is likely due to nutrient limitation in surface waters and light limitation in the deeper zone.
Sample-based values of aphy(440) and aNAP(440) (Fig. 8b, c) ranged between 0.025–0.2 and 0.008–0.55 m−1, respectively. These values and their distribution with depth were in a similar range as reported in WSC waters by Kowalczuk et al. (2017, 2019), further pointing to the presence of AW. Although the depths of subsurface chlorophyll a maxima were not sampled (since in situ data were not available to guide the water sampling), the sample-based phytoplankton absorption at 440 nm (Fig. 8b) indicates increased absorption by phytoplankton in the subsurface and at deeper depth in the southern fjord compared to the central part of the fjord.
The surface waters of Storfjorden were characterized by very low phytoplankton absorption. This is also clearly visible from the spectral absorption of particles shown for stations 501 and 508 (Fig. 9); here the typical absorption peaks for chlorophyll are evident only at subsurface depths. Slight increase in surface non-algal particle absorption was only observed for the northern station 509 and, to a lesser extent, at station 511 (Fig. 8b). This implies overall limited influence of absorbing particles from land runoff along the south–north transect.
Non-algal particle absorption from the water samples (Fig. 8c) showed elevated values for the bottommost samples in the BSW (with nearly no phytoplankton absorption), suggesting that there are turbid, near-bottom flows dominated by inorganic material, likely resuspension of bottom sediments. This increase in aNAP(440) is most likely due to mineral particles deposited on the seabed and resuspended due to water flows typically encountered in the nepheloid layer. This increase may also partly originate from both incomplete mineralization of settled phytoplankton particles or be an effect of the adsorption of the CDOM fraction to resuspended particles. Yamashita et al. (2021) has described the effect of enrichment in bottom water flowing over the productive shelf of the Sea of Okhotsk with allochthonous FDOM contained within sediments pore waters. This effect could also be present in Storfjorden, supported by our observation of a significant decline in the local aLH(676) (phytoplankton biomass proxy) maximum with depth (Fig. 7c).
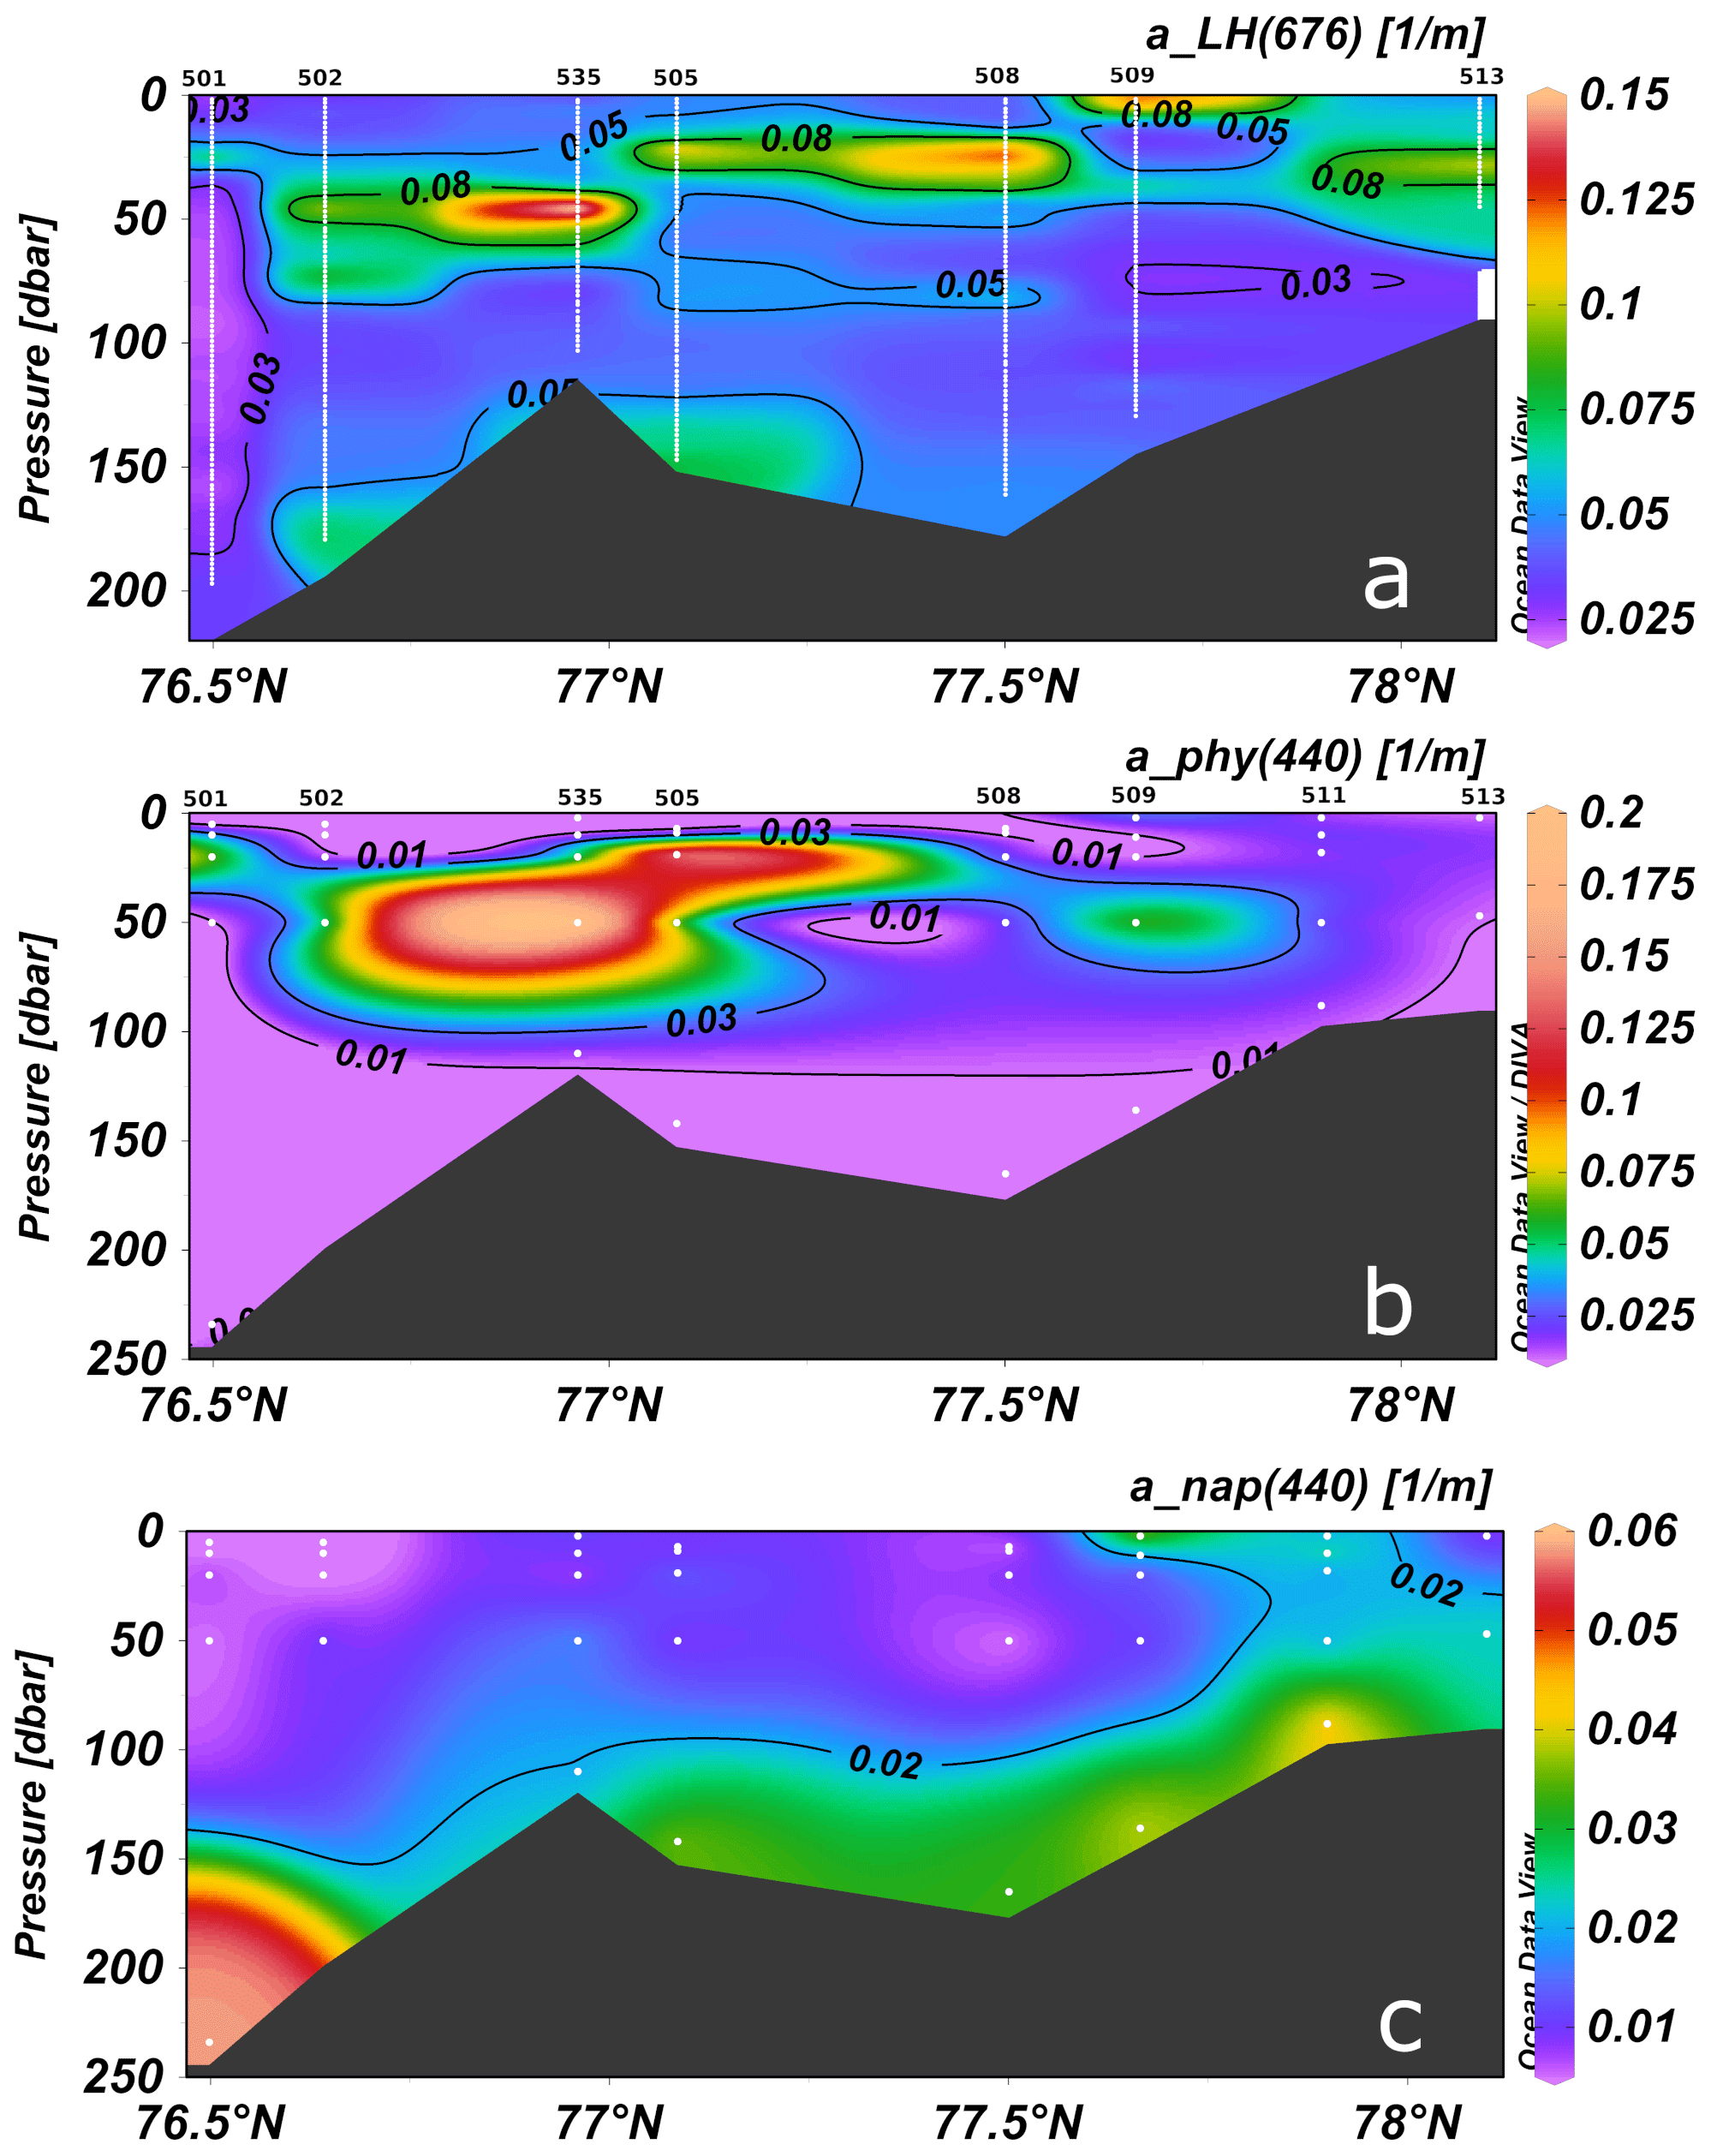
Figure 8Section plots of (a) absorption line height at 676 nm (aLH(676)) (data from the ac-s), (b) absorption by phytoplankton (data from the water samples), and (c) absorption by non-algal particles (NAPs) (data from the water samples) all at 440 nm. White points indicate sample locations. Plots are made with Ocean Data View (Schlitzer, Reiner, Ocean Data View, https://odv.awi.de/, last access: 30 January 2022).
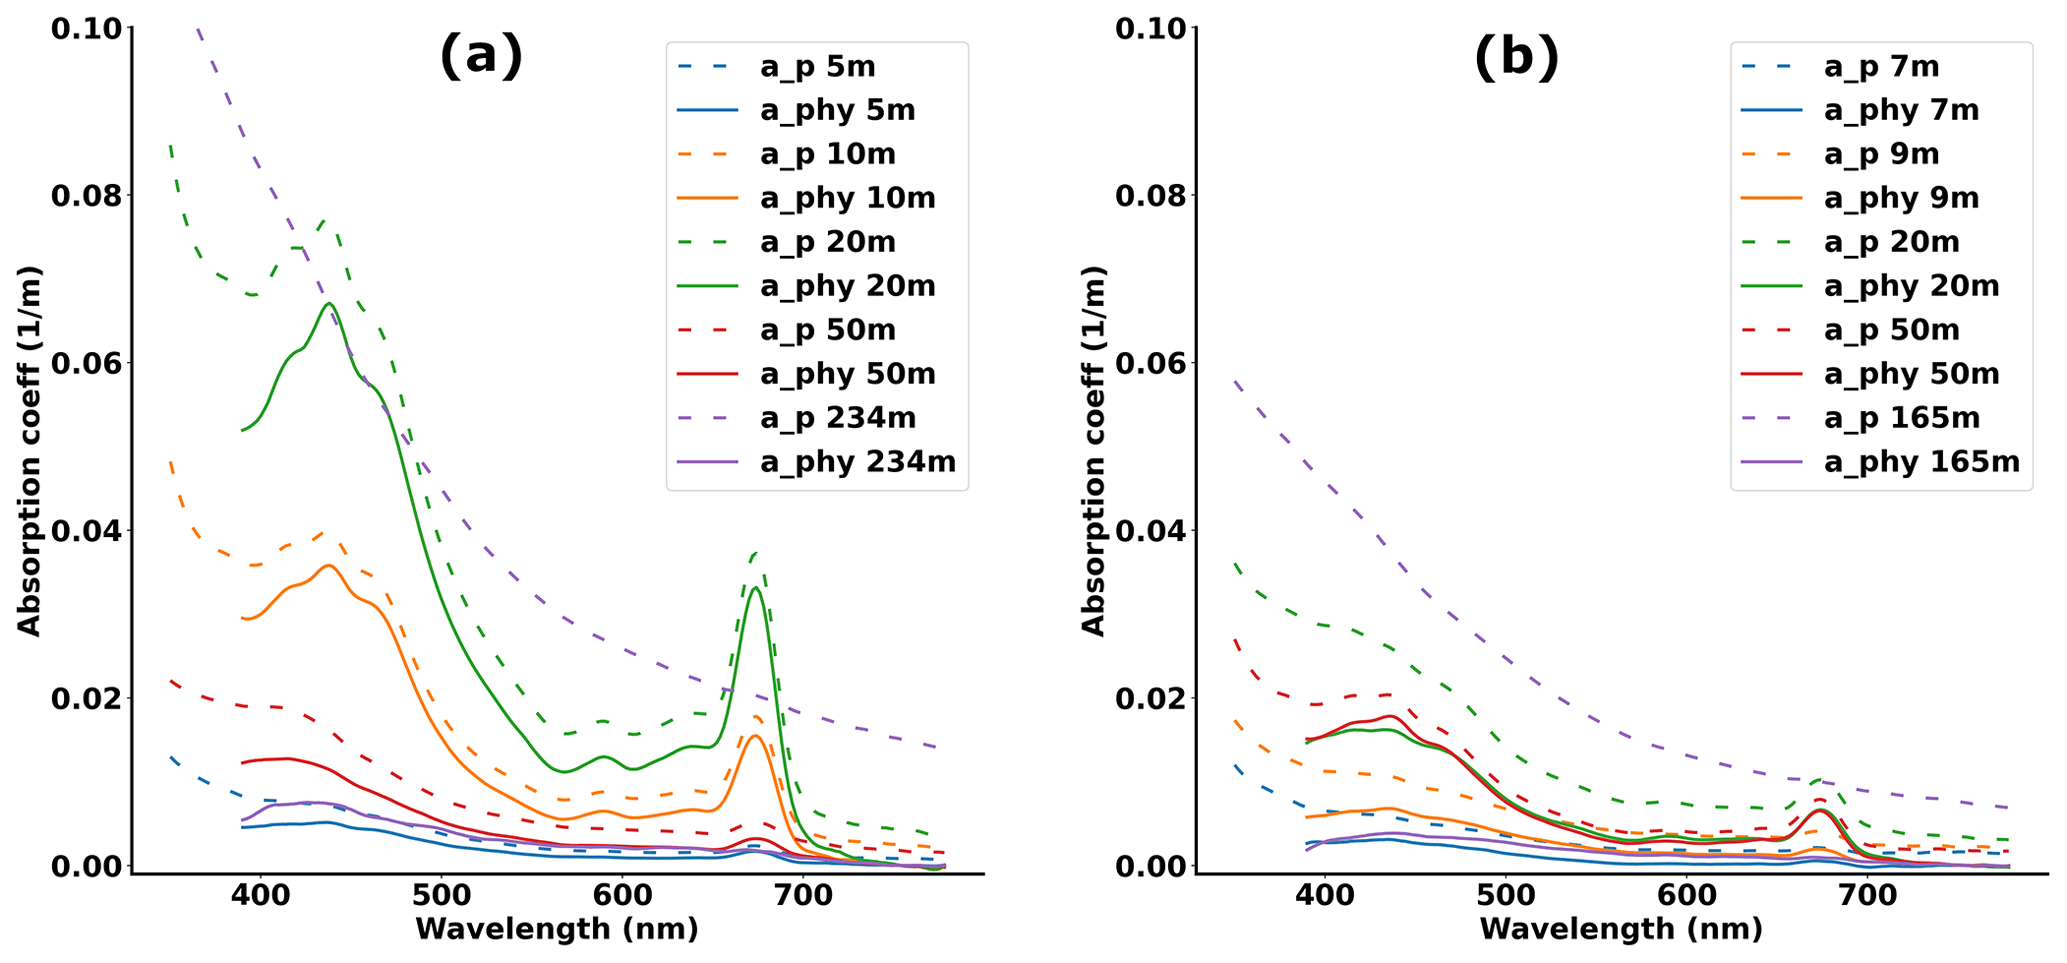
Figure 9Comparison of total particulate ap (dashed line) and phytoplankton aphy (solid line) absorption in Storfjordrenna at station 501 (a) and in the fjord north of the sill at station 508 (b) with depth.
3.6 Relative contribution of the optically active constituents
Understanding the relative contribution of the optically active constituents, namely phytoplankton, CDOM, and non-algal particles, in determining the optical characteristics of seawater is of particular importance for any radiative transfer modelling or optical remote-sensing application of a specific area. Considering the optical complexity found in Storfjorden, we decided to conduct a separate analysis for the surface (0–15 m) water, subsurface (15–60 m) water, and dense bottom (<20 m from the bottom, stations 505, 508, and 509) waters. In addition, we further separated the surface and subsurface into two groups: (i) northern stations 509, 511, and 513, which are potentially land-influenced, and (ii) southern offshore stations 501, 502, 505, 535, and 508, which are less influenced by land runoff. For each of the five resulting cases, an absorption budget (excluding water itself) was calculated based on the water sample data (Fig. 10) and an attenuation budget (excluding water itself) was computed based on the in situ ac-s data (Fig. 11). A corresponding table with averages of relevant optical properties for each of the five cases is presented in Table 1.
Table 1Average values of the main water IOPs for the five cases corresponding to northern surface (NSurf), southern surface (SSurf), northern subsurface (NSub), southern subsurface (SSub), and dense bottom water (Bott). The number of samples n is given for the water-sample-based quantities and does not apply to , which comes from the ac-s data.
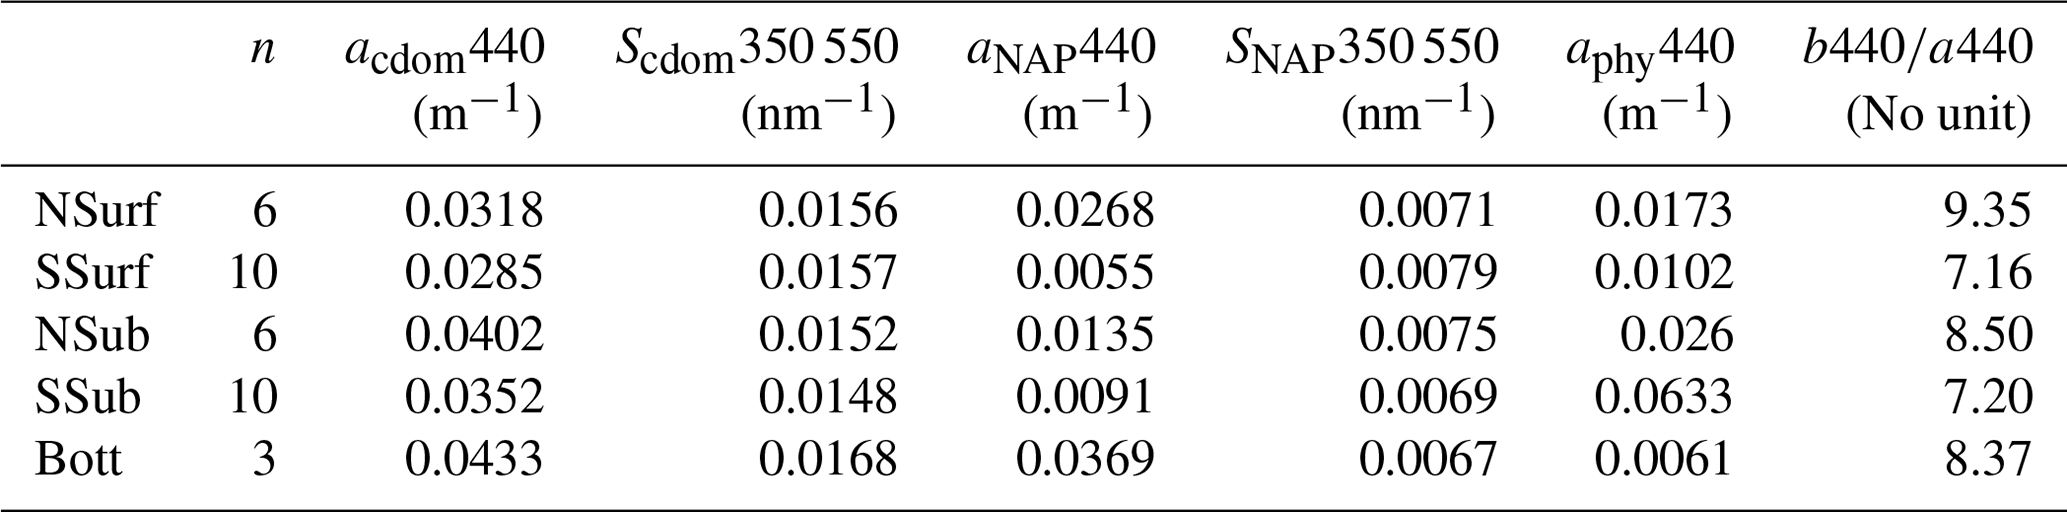
The non-water IOPs in Storfjorden were driven by non-algal particles and CDOM for the northern surface water, by CDOM for the southern surface waters, by phytoplankton in the subsurface waters, and by non-algal particles and CDOM for the dense bottom water. The variability in attenuation was driven by the variability of scattering (Fig. 11, light blue), which was highest at the northern stations (average of 9.35 and 8.50 for the surface and subsurface categories, respectively) followed by the dense bottom layer (average of 8.37), and the lowest values were found for the southern stations (average of 7.16 and 7.20 for the surface and subsurface categories, respectively). This correlates very well with the importance of non-algal particle absorption as shown by the beige curves in Fig. 10, with values ranging from 0.0055 m−1 for southern surface water to 0.0369 m−1 for the bottom dense water. The green curves confirm the evidence of a subsurface algae bloom with the highest phytoplankton contribution for the subsurface layer (max. 0.063 m−1) and the lowest for the bottom water (0.006 m−1). The CDOM had the most stable contribution across the five different categories, with average values of aCDOM440 ranging between 0.028–0.043 m−1.
Table 2Relative contributions (in %) of the phytoplankton, CDOM, and non-algal particles (NAPs) to the absorption budgets at 443, 550, and 670 nm for the five cases corresponding to northern surface (NSurf), southern surface (SSurf), northern subsurface (NSub), southern subsurface (SSub), and dense bottom water (Bott). Bold numbers indicate the constituent dominating the absorption for a given case and wavelength.
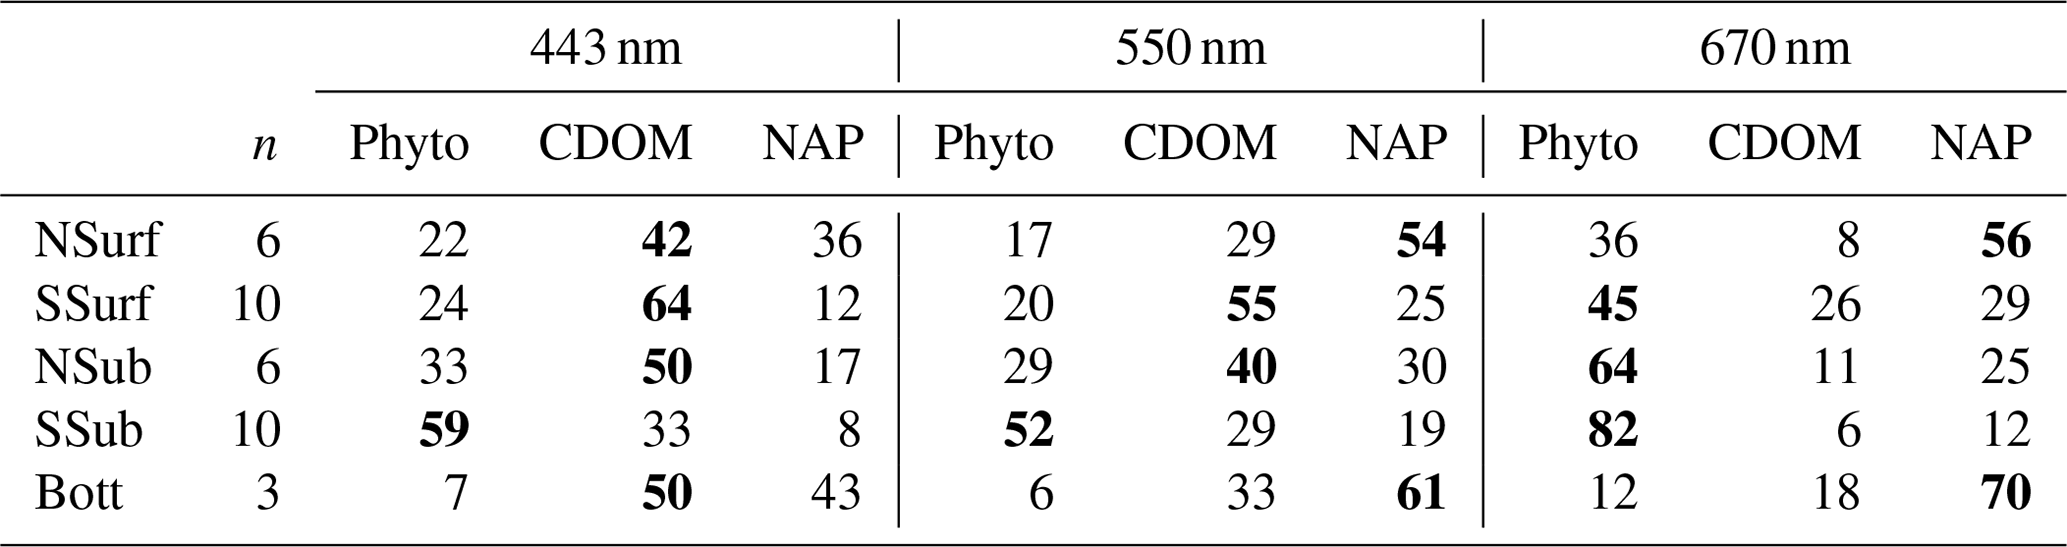
Relative contributions of the three optically active constituents to the non-water absorption are presented in Table 2 for three specific wavelengths (443, 550, and 670 nm). For phytoplankton, a minimum (maximum) contribution of 6 % (82 %) was found for the bottom water at 550 nm (the southern subsurface water at 670 nm). The CDOM contribution ranged from 6 % for southern subsurface water at 670 nm to 64 % for southern surface water at 443 nm. Non-algal particle contribution to the non-water absorption had values ranging between 8 % for the southern subsurface water at 443 nm to 70 % for bottom water at 670 nm. As it could also be assessed qualitatively from Fig. 10, this also highlights the strong dependence of the absorption budget to the wavelength of the radiation, the CDOM contribution dramatically decreasing with increasing wavelength. The relative CDOM contribution was thus higher than what has been found in the AW in the WSC with an average CDOM contribution of 42 % at 412 nm (Kowalczuk et al., 2019) as well as in AW north of Spitsbergen with a CDOM contribution of 43 % at 443 nm (Kowalczuk et al., 2017). However, it remains significantly lower than what has been found in the central and eastern Arctic (Gonçalves-Araujo et al., 2018) with 85 % of the non-water water absorption attributed to CDOM at 443 nm.
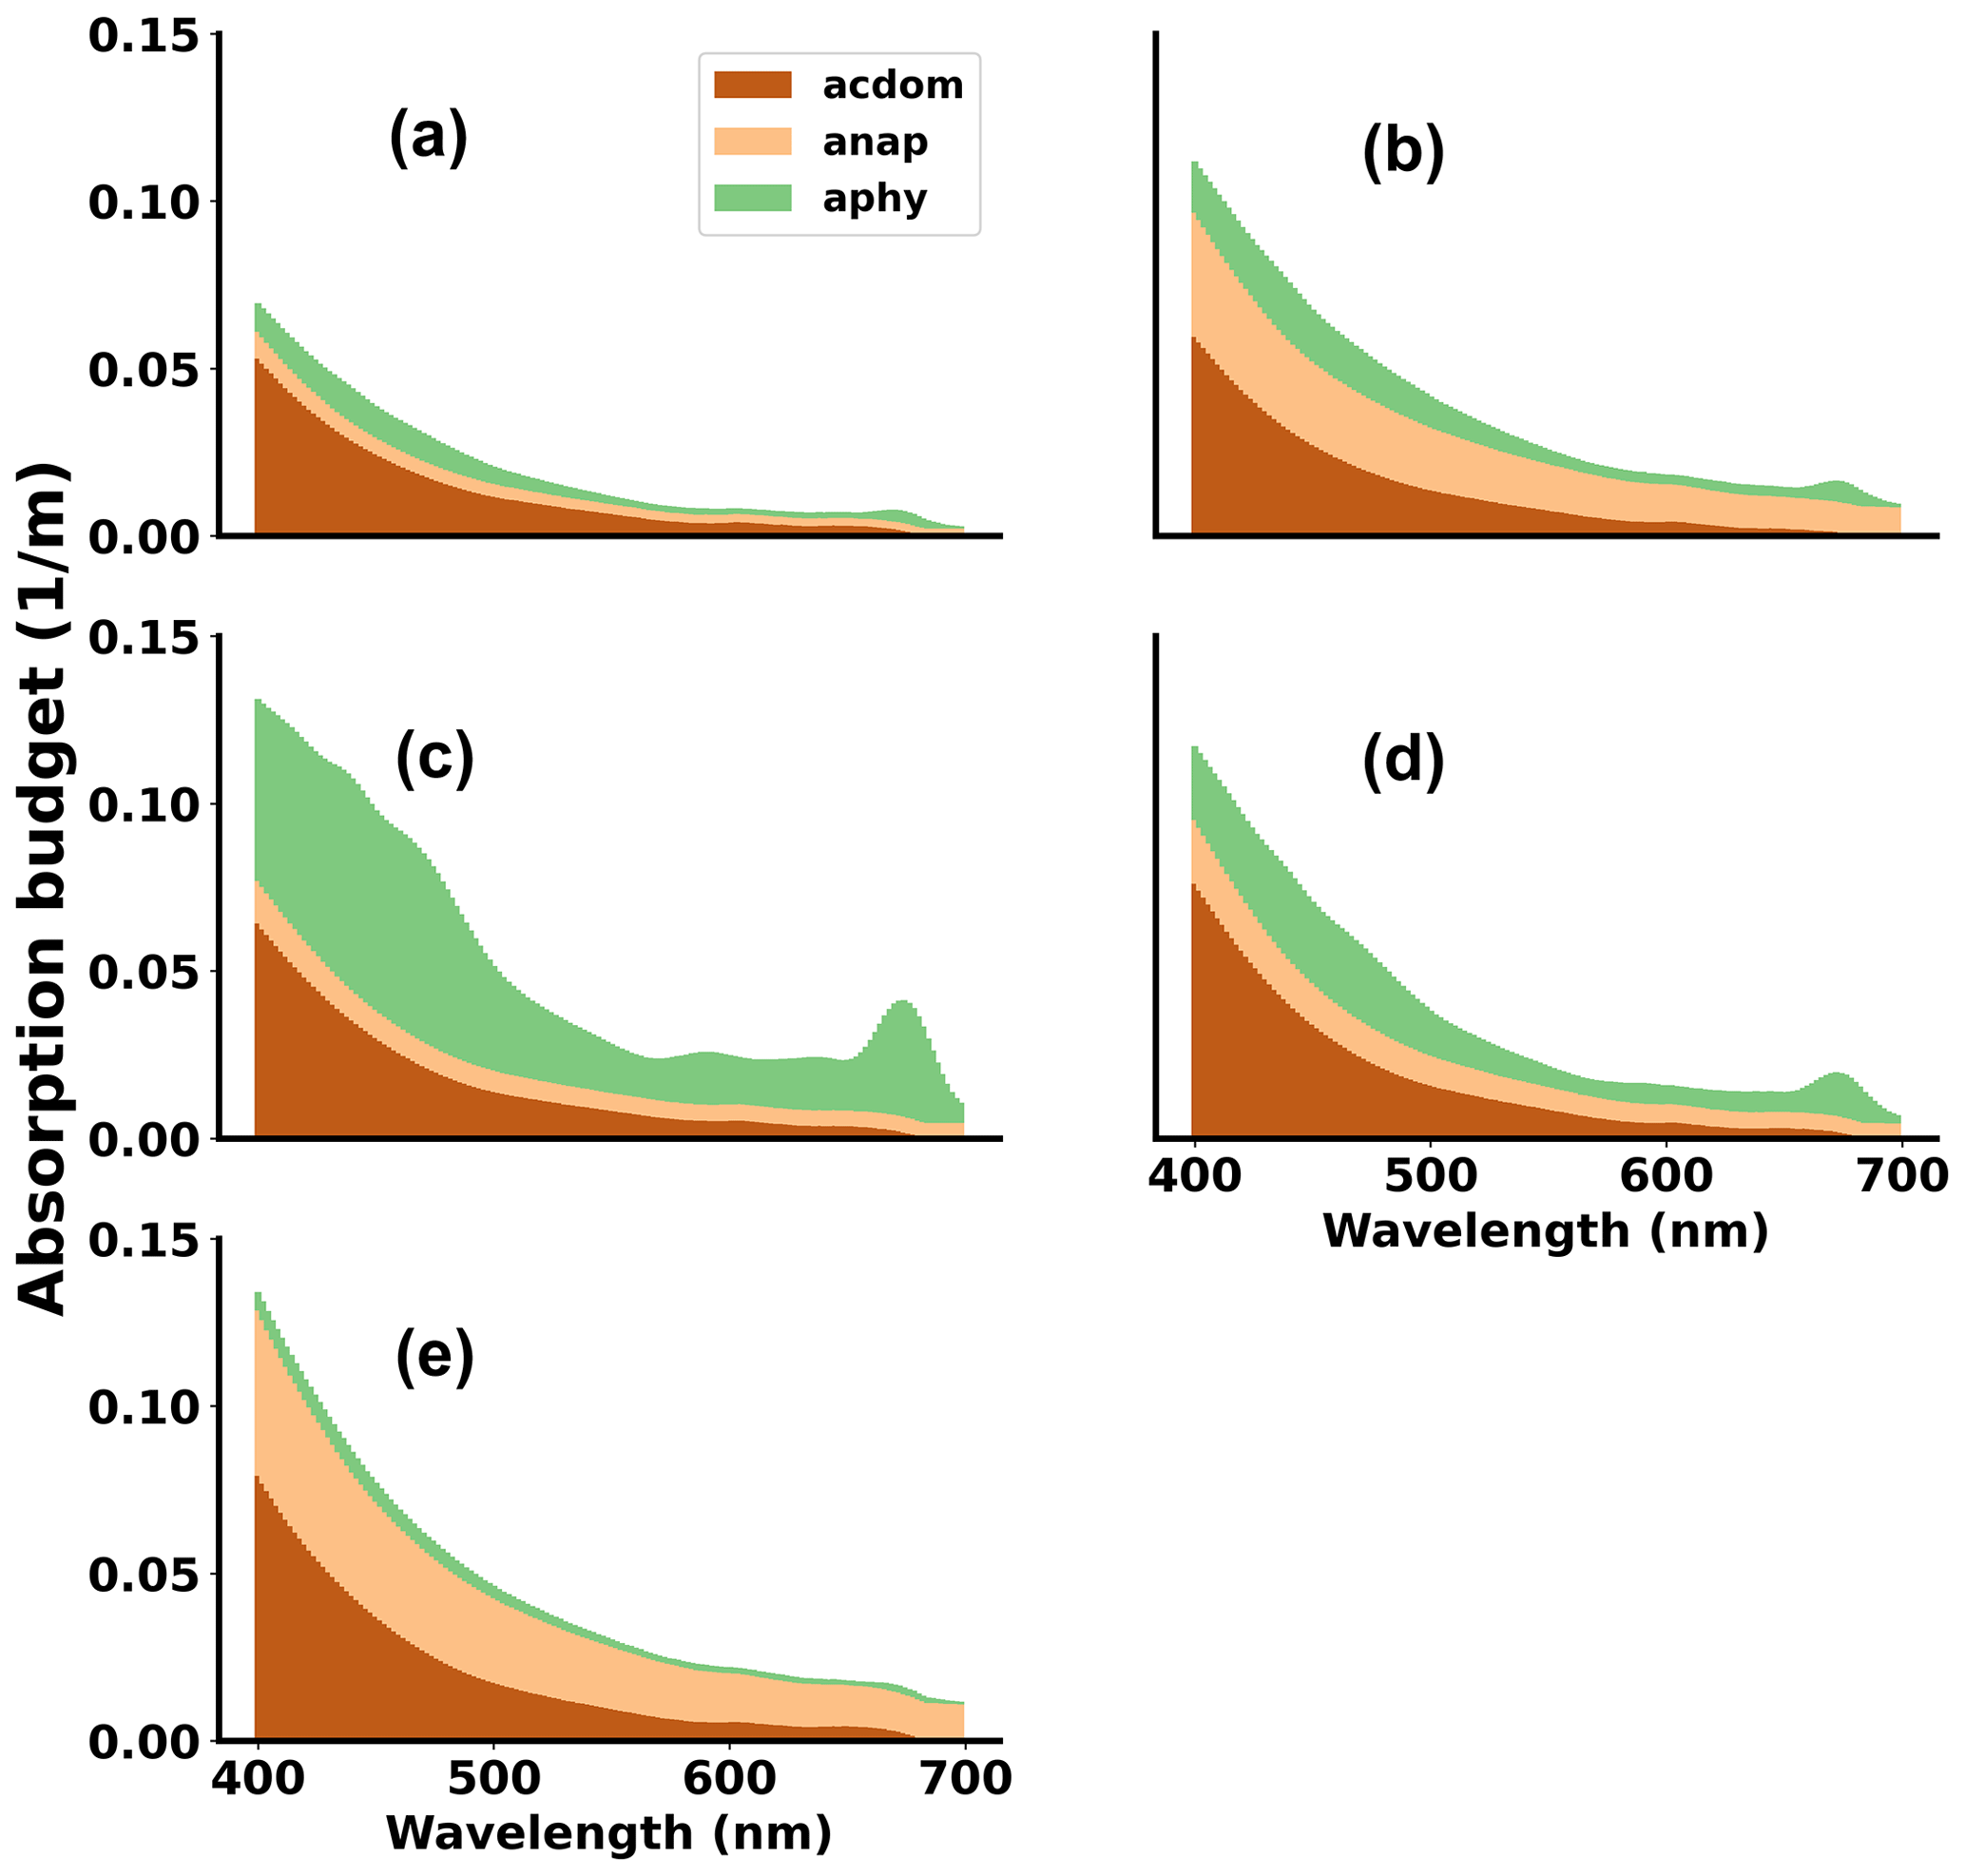
Figure 10Absorption budget for five typical cases, corresponding to (a) northern surface (NSurf), (b) southern surface (SSurf), (c) northern subsurface (NSub), (d) southern subsurface (SSub), and (e) dense bottom water (Bott). Surface (subsurface) water is defined as <15 m (15–60 m) water depth. The dense bottom water corresponds to the layer trapped by the sill at stations 505, 508, and 509.
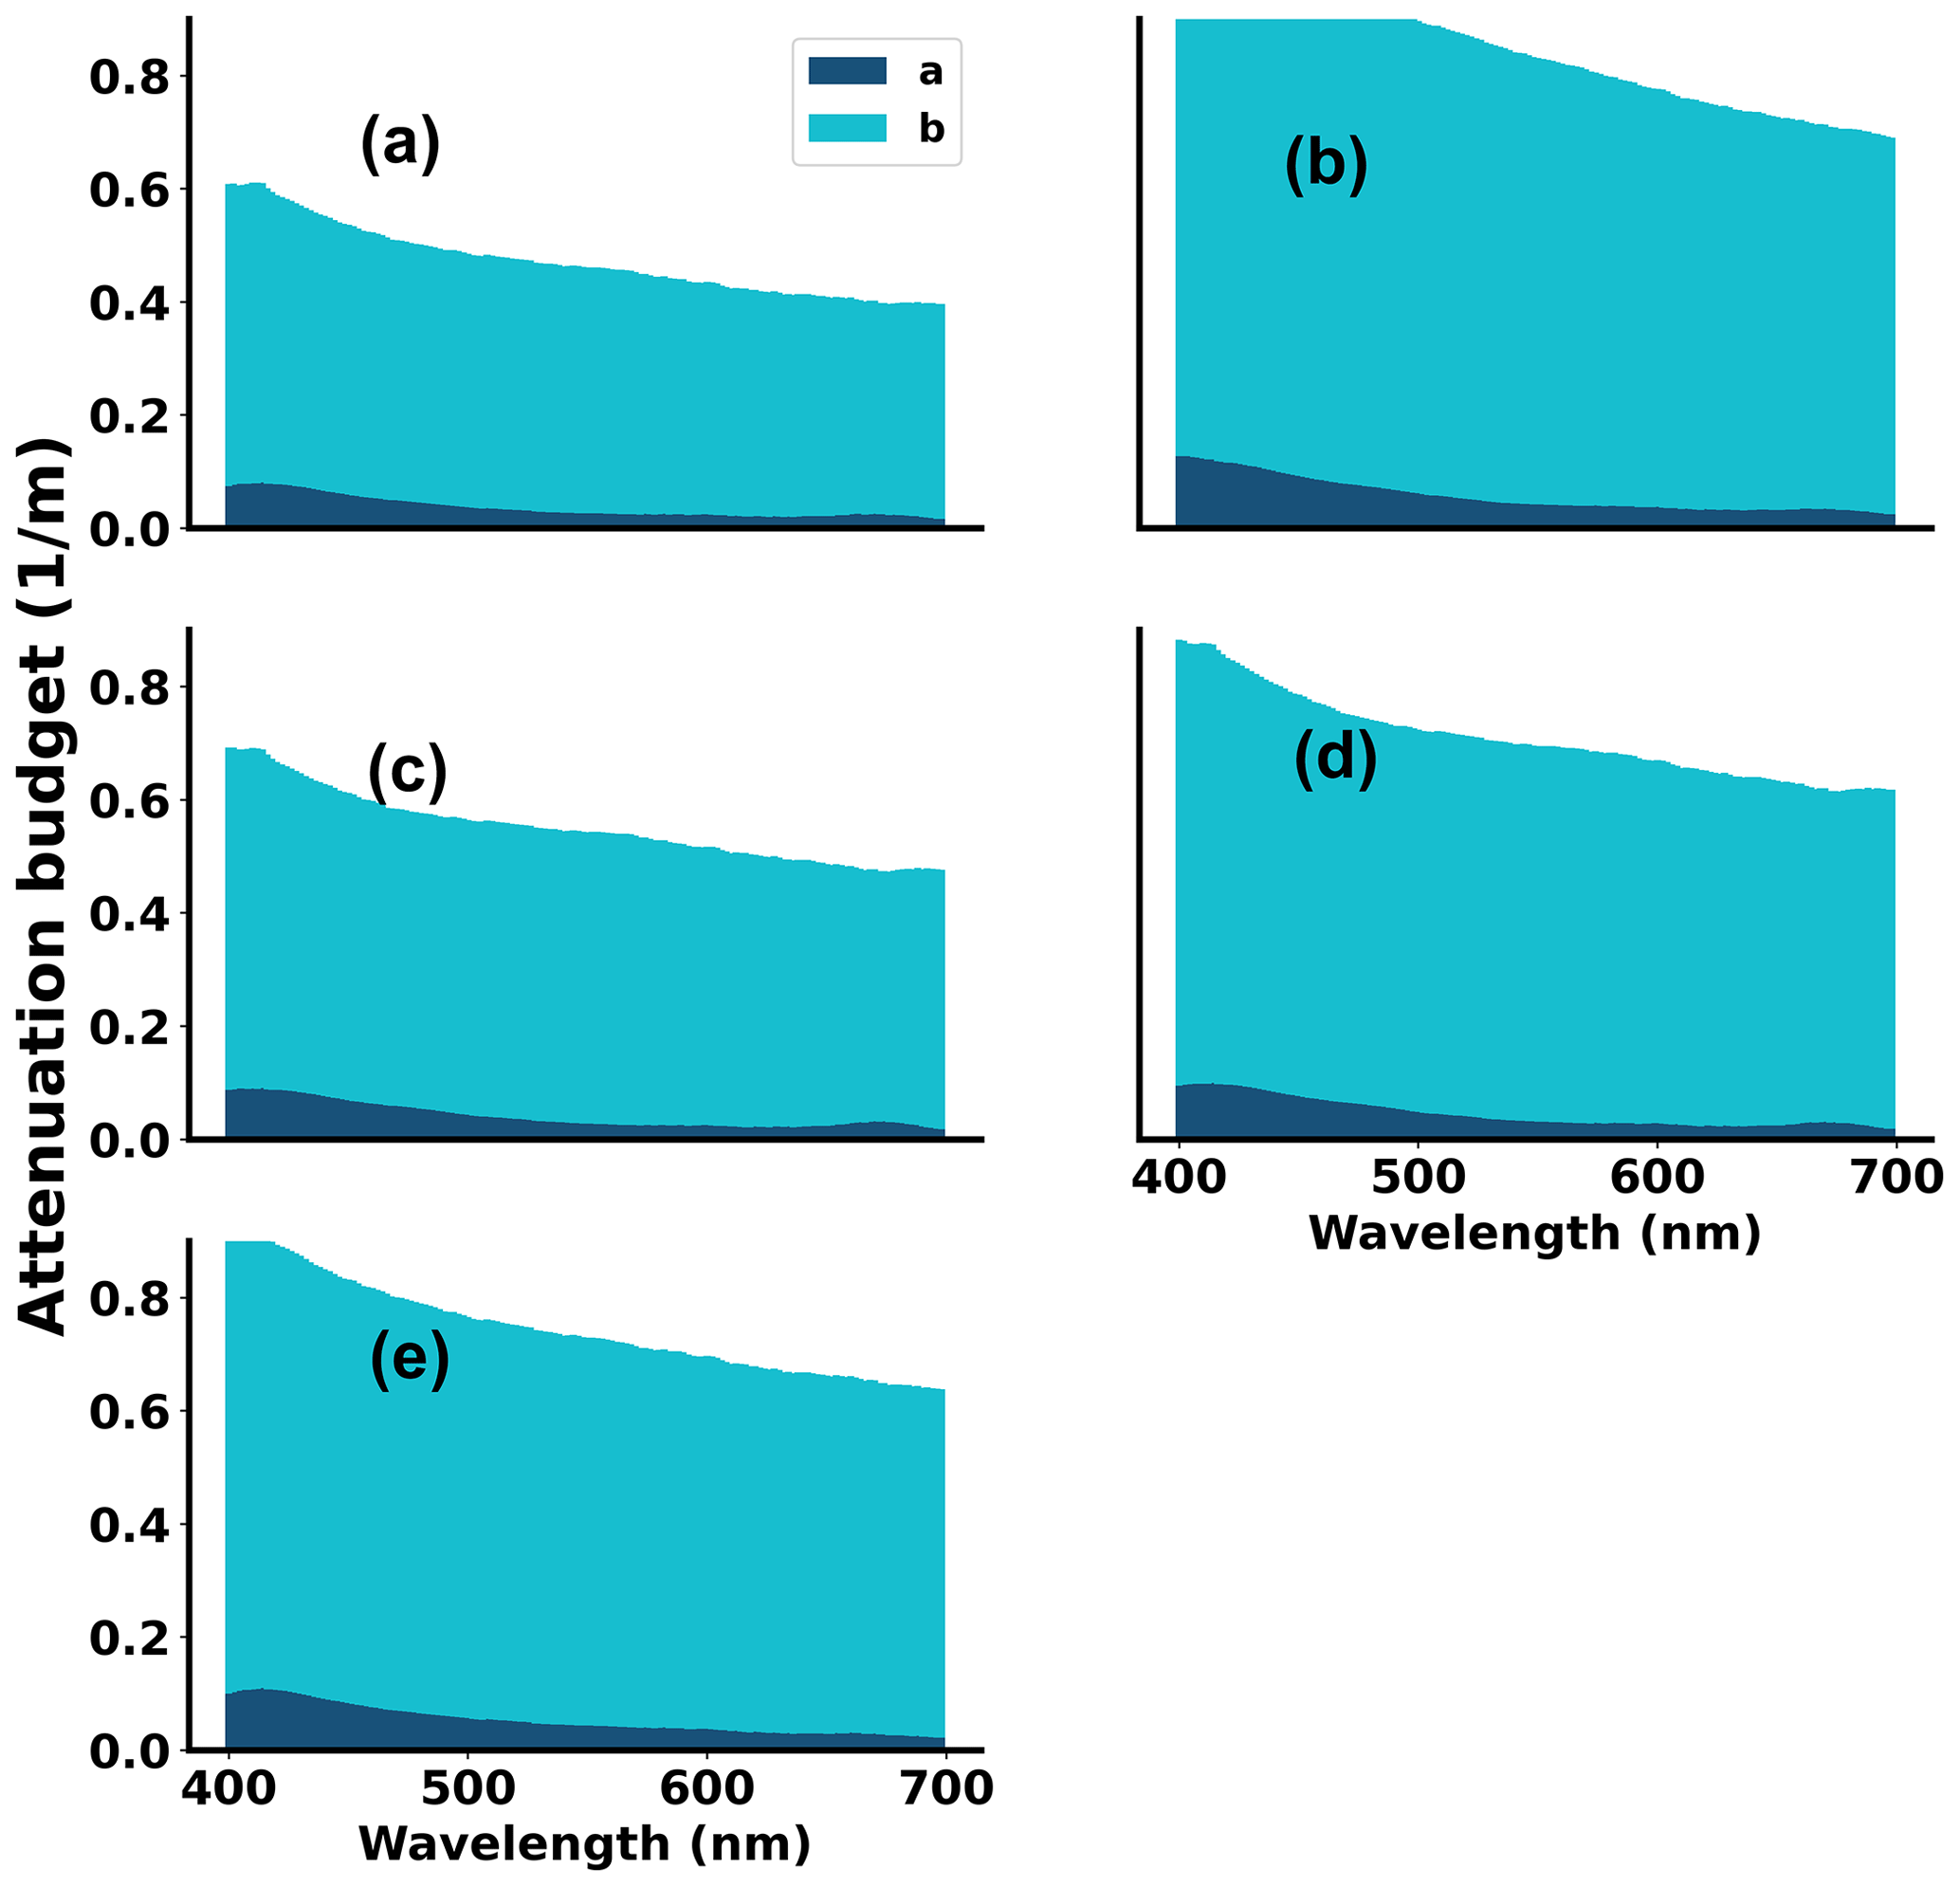
Figure 11Attenuation budget for five typical cases, corresponding to (a) northern surface (NSurf), (b) southern surface (SSurf), (c) northern subsurface (NSub), (d) southern subsurface (SSub), and (e) dense bottom water (Bott). Surface (subsurface) water is defined as <15 m (15–60 m) water depth. The dense bottom water corresponds to the layer trapped by the sill at stations 505, 508, and 509. Dark blue corresponds to absorption and light blue to scattering.
This first study of the inherent optical properties (IOPs) in Storfjorden (Svalbard) highlighted its optical complexity that we linked to the variable influence from sea ice melt (summer surface stratification) and formation (dense cold bottom waters), runoff from nearby land, and local phytoplankton productivity. As observed earlier in the Barents Sea proper and Atlantic waters (AWs) west and north of Spitsbergen, the contribution of CDOM to the absorption budget varied quite little. Also, the contribution from humic-like FDOM was low and invariable, which indicated limited terrestrial contribution to the DOM pool in the fjord. Conversely, tryptophan-like FDOM closely followed the spatial and vertical distributions of optical proxies for chlorophyll a concentration. Nevertheless, in surface waters not influenced by land runoff, CDOM was the main contributor to the non-water light absorption, despite its relatively low concentrations in AW, since stratification resulted in a subsurface phytoplankton bloom with a maximum magnitude of between 25–50 m depth. We surmise that in shallow nearshore waters with more direct input from land runoff, the contribution from turbid plumes and non-algal particles is much larger during spring freshet and was partly found in our dataset as an increased and non-negligible level of non-algal particle absorption as well as very high scattering-to-absorption ratios. The dense and cold bottom water, originating from winter sea ice formation and brine rejection, was found to contain higher levels of dissolved organic and non-algal particulate matter. Its transport across the sill needs further attention to better understand the potential implications regarding the bottom waters of the adjacent basins and material transports. The statistics obtained on the different IOPs and on their relative contribution to the light absorption can be used, in conjunction with the ones from previous studies in nearby areas, for improved regional parameterizations of bio-optical models used in the field of remote sensing or climate modelling.
| Acronym/ | Definition |
| abbreviation | |
| a | Light absorption in m−1 |
| ArW | Arctic water |
| AW | Atlantic water |
| b | Light scattering in m−1 |
| BSW | Brine-enriched shelf water |
| c | Light attenuation in m−1 |
| CDOM | Chromophoric dissolved organic matter |
| CTD | Conductivity, temperature and depth sensor |
| ESC | East Spitsbergen Current |
| FDOM | Fluorescent dissolved organic matter |
| IOP | Inherent optical properties |
| NAPs | Non-algal particles |
| OD | Optical density |
| VSF | Volume scattering function |
| WSC | West Spitsbergen Current |
The hydrographic and optical data (Petit et al., 2022) are available at https://doi.org/10.21334/npolar.2022.e6974f73.
BH and MAG designed the study. HS and TP conducted the sample collection and cast profiling. RR and TP performed the sample analysis. TP, MAG, and RR conducted the data analysis. TP and MAG wrote a first draft of the paper. All authors contributed to editing the paper.
The contact author has declared that neither they nor their co-authors have any competing interests.
Publisher’s note: Copernicus Publications remains neutral with regard to jurisdictional claims in published maps and institutional affiliations.
Many thanks to Hanne Sagen for supporting our participation in the UAK2020 cruise. We acknowledge the support from the KV Svalbard crew, students, and other participants of UAK2020, especially Nil Eryilmaz (UiB), Malin Lund (UiB), and Emilia Botnen van den Bergh (HVL) for their enthusiastic help with water filtrations. We also warmly thank Murat Ardelan (NTNU) for lending us the LWCC system used for this study. IOPAN contribution was funded by the NCN-POLS project MOPAR no. 2020/37/K/ST10/03254 funded through the EEA Norway Grants. We thank two anonymous reviewers for constructive comments that helped us to improve the paper.
This research has been supported by the Research Council of Norway through the Nansen Legacy project (RCN project no. 276730).
This paper was edited by Oliver Zielinski and reviewed by two anonymous referees.
Aas, E. and Berge, G.: Irradiance observations in the Norwegian and Barents Seas. Institute report series (Universitetet i Oslo, Institutt for geofysikk), https://www.duo.uio.no/bitstream/handle/10852/61611/1/Aas-Berge-1976-Rep-23.pdf (last access: 30 January 2022), 1976.
Aas, E. and Høkedal, J.: Penetration of ultraviolet B, blue and quanta irradiance into Svalbard waters, Polar Res., 15, 127–138, https://doi.org/10.3402/polar.v15i2.6642, 1996.
Ardyna, M., Babin, M., Gosselin, M., Devred, E., Bélanger, S., Matsuoka, A., and Tremblay, J.-É.: Parameterization of vertical chlorophyll a in the Arctic Ocean: impact of the subsurface chlorophyll maximum on regional, seasonal, and annual primary production estimates, Biogeosciences, 10, 4383–4404, https://doi.org/10.5194/bg-10-4383-2013, 2013.
Bélanger, S., Cizmeli, S. A., Ehn, J., Matsuoka, A., Doxaran, D., Hooker, S., and Babin, M.: Light absorption and partitioning in Arctic Ocean surface waters: impact of multiyear ice melting, Biogeosciences, 10, 6433–6452, https://doi.org/10.5194/bg-10-6433-2013, 2013.
Bensi, M., Kovačević, V., Langone, L., Aliani, S., Ursella, L., Goszczko, I., Soltwedel, T., Skogseth, R., Nilsen, F., and Deponte, D.: Deep flow variability offshore south-west Svalbard (Fram Strait), Water, 11, 683, https://doi.org/10.3390/w11040683, 2019.
Bowers, D. G. and Brett, H. L.: The relationship between CDOM and salinity in estuaries: An analytical and graphical solution, J. Mar. Syst., 73, 1–7, https://doi.org/10.1016/j.jmarsys.2007.07.001, 2008.
Davies, E. J., Basedow, S. L., and McKee, D.: The hidden influence of large particles on ocean colour, Sci. Rep., 11, 1–9, https://doi.org/10.1038/s41598-021-83610-5, 2021.
Dogliotti, A. I., Ruddick, K. G., Nechad, B., Doxaran, D., and Knaeps, E.: A single algorithm to retrieve turbidity from remotely-sensed data in all coastal and estuarine waters, Remote Sens. Environ., 156, 157–168, https://doi.org/10.1016/j.rse.2014.09.020, 2015.
Falk-Petersen, S., Hop, H., Budgell, W.P., Hegseth, E.N., Korsnes, R., Løyning, T. B., Ørbæk, J. B., Kawamura, T., and Shirasawa, K.: Physical and ecological processes in the marginal ice zone of the northern Barents Sea during the summer melt period, J. Mar. Syst., 27, 131–159, https://doi.org/10.1016/S0924-7963(00)00064-6, 2000.
Fossile, E., Nardelli, M. P., Jouini, A., Lansard, B., Pusceddu, A., Moccia, D., Michel, E., Péron, O., Howa, H., and Mojtahid, M.: Benthic foraminifera as tracers of brine production in the Storfjorden “sea ice factory”, Biogeosciences, 17, 1933–1953, https://doi.org/10.5194/bg-17-1933-2020, 2020.
Gonçalves-Araujo, R., Rabe, B., Peeken, I., and Bracher, A.: High colored dissolved organic matter (CDOM) absorption in surface waters of the central-eastern Arctic Ocean: Implications for biogeochemistry and ocean color algorithms, PLoS One, 13, e0190838, https://doi.org/10.1371/journal.pone.0190838, 2018.
Granskog, M. A.: Changes in spectral slopes of colored dissolved organic matter absorption with mixing and removal in a terrestrially dominated marine system (Hudson Bay, Canada), Mar. Chem., 134, 10–17, https://doi.org/10.1016/j.marchem.2012.02.008, 2012.
Granskog, M. A., Stedmon, C. A., Dodd, P. A., Amon, R. M., Pavlov, A. K., de Steur, L., and Hansen, E.: Characteristics of colored dissolved organic matter (CDOM) in the Arctic outflow in the Fram Strait: Assessing the changes and fate of terrigenous CDOM in the Arctic Ocean, J. Geophys. Res.-Oceans, 117, https://doi.org/10.1029/2012JC008075, 2012.
Granskog, M. A., Pavlov, A. K., Sagan, S., Kowalczuk, P., Raczkowska, A., and Stedmon, C. A.: Effect of sea-ice melt on inherent optical properties and vertical distribution of solar radiant heating in Arctic surface waters, J. Geophys. Res.-Oceans, 120, 7028–7039, https://doi.org/10.1002/2015JC011087, 2015.
Halbach, L., Vihtakari, M., Duarte, P., Everett, A., Granskog, M. A., Hop, H., Kauko, H. M., Kristiansen, S., Myhre, P. I., and Pavlov, A. K.: Tidewater glaciers and bedrock characteristics control the phytoplankton growth environment in a fjord in the arctic, Front. Mar. Sci., 6, 254, https://doi.org/10.3389/fmars.2019.00254, 2019.
Hancke, K., Hovland, E. K., Volent, Z., Pettersen, R., Johnsen, G., Moline, M., and Sakshaug, E., Optical properties of CDOM across the Polar Front in the Barents Sea: Origin, distribution and significance, J. Mar. Syst., 130, 219–227, https://doi.org/10.1016/j.jmarsys.2012.06.006, 2014.
Hayase, K. and Tsubota, H.: Sedimentary humic acid and fulvic acid as fluorescent organic materials, Geochim. Cosmochim. Ac., 49, 159–163, https://doi.org/10.1016/0016-7037(85)90200-5, 1985.
Helms, J. R., Stubbins, A., Ritchie, J. D., Minor, E. C., Kieber, D. J., and Mopper, K.: Absorption spectral slopes and slope ratios as indicators of molecular weight, source, and photobleaching of chromophoric dissolved organic matter, Limnol. Oceanogr., 53, 955–969, https://doi.org/10.4319/lo.2008.53.3.0955, 2008.
Hovland, E. K., Hancke, K., Alver, M. O., Drinkwater, K., Høkedal, J., Johnsen, G., Moline, M., and Sakshaug, E.: Optical impact of an Emiliania huxleyi bloom in the frontal region of the Barents Sea, J. Mar. Syst., 130, 228–240, https://doi.org/10.1016/j.jmarsys.2012.07.002, 2014.
International Ocean Colour Coordinating Group (IOCCG): Ocean Colour Remote Sensing in Polar Seas, https://doi.org/10.25607/OBP-107, 2015.
Kostakis, I., Röttgers, R., Orkney, A., Bouman, H.A., Porter, M., Cottier, F., Berge, J., and McKee, D.: Development of a bio-optical model for the Barents Sea to quantitatively link glider and satellite observations, Philos. T. Roy. Soc. A, 378, 20190367, https://doi.org/10.1098/rsta.2019.0367, 2020.
Kowalczuk, P., Meler, J., Kauko, H.M., Pavlov, A.K., Zabłocka, M., Peeken, I., Dybwad, C., Castellani, G., and Granskog, M. A.: Bio-optical properties of Arctic drift ice and surface waters north of Svalbard from winter to spring, J. Geophys. Res.-Oceans, 122, 4634–4660, https://doi.org/10.1002/2016JC012589, 2017.
Kowalczuk, P., Sagan, S., Makarewicz, A., Meler, J., Borzycka, K., Zabłocka, M., Zdun, A., Konik, M., Darecki, M., and Granskog, M. A.: Bio-optical properties of surface waters in the Atlantic Water inflow region off Spitsbergen (Arctic Ocean), J. Geophys. Res.-Oceans, 124, 1964–1987, https://doi.org/10.1029/2018JC014529, 2019.
Lee, Z., Shang, S., Wang, Y., Wei, J., and Ishizaka, J.: Nature of optical products inverted semianalytically from remote sensing reflectance of stratified waters, Limnol. Oceanogr. 65, 387–400. https://doi.org/10.1002/lno.11307, 2020.
Leu, E., Søreide, J. E., Hessen, D. O., Falk-Petersen, S., and Berge, J.: Consequences of changing sea-ice cover for primary and secondary producers in the European Arctic shelf seas: timing, quantity, and quality, Prog. Oceanogr., 90, 18–32, https://doi.org/10.1016/j.pocean.2011.02.004, 2011.
Loeng, H.: Features of the physical oceanographic conditions of the Barents Sea, Polar Res., 10, 5–18, https://doi.org/10.3402/polar.v10i1.6723, 1991.
Makarewicz, A., Kowalczuk, P., Sagan, S., Granskog, M. A., Pavlov, A. K., Zdun, A., Borzycka, K., and Zabłocka, M.: Characteristics of chromophoric and fluorescent dissolved organic matter in the Nordic Seas, Ocean Sci., 14, 543–562, https://doi.org/10.5194/os-14-543-2018, 2018.
Mannino, A., Novak, M. G., Nelson, N. B., Belz, M., Berthon, J.-F., Blough, N. V., Boss, E., Bricaud, A., Chaves, J., Del Castillo, C., Del Vecchio, R., D'Sa, E. J., Freeman, S., Matsuoka, A., Miller, R. L., Neeley, A. R., Röttgers, R., Tzortziou, M., and Werdell, P. J.: Measurement protocol of absorption by chromophoric dissolved organic matter (CDOM) and other dissolved materials, In Inherent Optical Property Measurements and Protocols: Absorption Coefficient, IOCCG Ocean Optics and Biogeochemistry Protocols for Satellite Ocean Colour Sensor Validation, IOCCG, https://ioccg.org/wp-content/uploads/2019/10/cdom_abs_protocol_public_draft-19oct-2019-sm.pdf (last access: 30 January 2022), 2019.
Mascarenhas, V. J. and Zielinski, O.: Hydrography-Driven Optical Domains in the Vaigat-Disko Bay and Godthabsfjord: Effects of Glacial Meltwater Discharge, Front. Mar. Sci., 6, 335, https://doi.org/10.3389/fmars.2019.00335, 2019.
McGovern, M., Pavlov, A. K., Deininger, A., Granskog, M., Leu, E. S., Søreide, J., and Poste, A.: Terrestrial Inputs Drive Seasonality in Organic Matter and Nutrient Biogeochemistry in a High Arctic Fjord System (Isfjorden, Svalbard), Front. Mar. Sci., 7, 2296–7745, https://doi.org/10.3389/fmars.2020.542563, 2020.
Müller, S., Vähätalo, A. V., Stedmon, C.A., Granskog, M. A., Norman, L., Aslam, S. N., Underwood, G. J. C., Dieckmann, G. S., and Thomas, D. N.: Selective incorporation of dissolved organic matter (DOM) during sea ice formation, Mar. Chem., 155, 148–157, https://doi.org/10.1016/j.marchem.2013.06.008, 2013.
Nechad, B., Ruddick, K. G., and Park, Y.: Calibration and validation of a generic multisensor algorithm for mapping of total suspended matter in turbid waters, Remote Sens. Environ., 114, 854–866, https://doi.org/10.1016/j.rse.2009.11.022, 2010.
Neukermans, G., Oziel, L., and Babin, M.: Increased intrusion of warming Atlantic water leads to rapid expansion of temperate phytoplankton in the Arctic, Global Change Biol., 24, 2545–2553, https://doi.org/10.1111/gcb.14075, 2018.
Onarheim, I. H., Eldevik, T., Smedsrud, L. H., and Stroeve, J. C.: Seasonal and regional manifestation of Arctic sea ice loss, J. Climate, 31, 4917–4932, https://doi.org/10.1175/JCLI-D-17-0427.1, 2018.
Orkney, A., Platt, T., Narayanaswamy, B. E., Kostakis, I., and Bouman, H. A.: Bio-optical evidence for increasing Phaeocystis dominance in the Barents Sea, Philos. T. Roy. Soc. A, 378, 20190357, https://doi.org/10.1098/rsta.2019.0357, 2020.
Oziel, L., Neukermans, G., Ardyna, M., Lancelot, C., Tison, J.-L., Wassmann, P., Sirven, J., Ruiz-Pino, D., and Gascard, J.-C.: Role for Atlantic inflows and sea ice loss on shifting phytoplankton blooms in the Barents Sea, J. Geophys. Res.-Oceans, 122, 5121–5139, https://doi.org/10.1002/2016JC012582, 2017.
Pavlov, A. K., Granskog, M. A., Stedmon, C. A., Ivanov, B. V., Hudson, S. R., and Falk-Petersen, S.: Contrasting optical properties of surface waters across the Fram Strait and its potential biological implications, J. Mar. Syst., 143, 62–72, https://doi.org/10.1016/j.jmarsys.2014.11.001, 2015.
Pavlov, A. K., Stedmon, C. A., Semushin, A. V., Martma, T., Ivanov, B. V., Kowalczuk, P., Granskog, M. A.: Linkages between the circulation and distribution of dissolved organic matter in the White Sea, Arctic Ocean, Cont. Shelf Res., 119, 1–13, https://doi.org/10.1016/j.csr.2016.03.004, 2016.
Pavlov, A. K., Taskjelle, T., Kauko, H. M., Hamre, B., Hudson, S. R., Assmy, P., Duarte, P., Fernández-Méndez, M., Mundy, C. J., and Granskog, M. A.: Altered inherent optical properties and estimates of the underwater light field during an A rctic under-ice bloom of P haeocystis pouchetii, J. Geophys. Res.-Oceans, 122, 4939–4961, https://doi.org/10.1002/2016JC012471, 2017.
Pavlov, A. K., Leu, E., Hanelt, D., Bartsch, I., Karsten, U., Hudson, S. R., Gallet, J.-C., Cottier, F., Cohen, J. H., and Berge, J.: The underwater light climate in Kongsfjorden and its ecological implications, in: The Ecosystem of Kongsfjorden, Svalbard, Springer, 137–170, 2019.
Petit, T., Granskog, M. A., Hamre, B., Kowalczuk, P., and Röttgers, R.: Inherent optical properties of waters in Storfjorden (Svalbard) in summer 2020, Norwegian Polar Institute [data set], https://doi.org/10.21334/npolar.2022.e6974f73, 2022.
Roesler, C. S. and Barnard, A. H.: Optical proxy for phytoplankton biomass in the absence of photophysiology: Rethinking the absorption line height, Meth. Oceanogr., 7, 79–94, https://doi.org/10.1016/j.mio.2013.12.003, 2013.
Röttgers, R. and Gehnke, S.: Measurement of light absorption by aquatic particles: improvement of the quantitative filter technique by use of an integrating sphere approach, Appl. Opt., 51, 1336–1351, https://doi.org/10.1364/AO.51.001336, 2012.
Röttgers, R., McKee, D., and Woźniak, S. B.: Evaluation of scatter corrections for ac-9 absorption measurements in coastal waters, Meth. Oceanogr., 7, 21–39, https://doi.org/10.1016/j.mio.2013.11.001, 2013.
Röttgers, R., Doxaran, D., and Dupouy, C.: Quantitative filter technique measurements of spectral light absorption by aquatic particles using a portable integrating cavity absorption meter (QFT-ICAM), Opt. Expr., 24, 1–20, https://doi.org/10.1364/OE.24.0000A1, 2016.
Sagan, S. and Darecki, M.: Inherent optical properties and particulate matter distribution in summer season in waters of Hornsund and Kongsfjordenen, Spitsbergen, Oceanologia 60, 65–75, https://doi.org/10.1016/j.oceano.2017.07.006, 2018.
Sagen, H., Botnen Van den Bergh, E., Klockmann, F., Råheim Økland, H., Knutsen, J., Tesdal Galtung, K., Lunde, M., Helleve, M., Eryilmaz, N., and Sandven Sagen, T.: CTD data collected in Storfjorden, Svalbard, during the UAK 2020, https://doi.org/10.21335/nmdc-nersc-758932911, 2020.
Skogseth, R., Fer, I., and Haugan, P. M.: Dense-Water Production and Overflow from an Arctic Coastal Polynya in Storfjorden, in: The Nordic Seas: An Integrated Perspective, American Geophysical Union (AGU), 73–88, https://doi.org/10.1029/158GM07, 2005a.
Skogseth, R., Haugan, P. M., and Jakobsson, M.: Watermass transformations in Storfjorden, Cont. Shelf Res., 25, 667–695, https://doi.org/10.1016/j.csr.2004.10.005, 2005b.
Smedsrud, L. H., Budgell, W. P., Jenkins, A. D., and Ådlandsvik, B.: Fine-scale sea-ice modelling of the Storfjorden polynya, Svalbard, Ann. Glaciol., 44, 73–79, https://doi.org/10.3189/172756406781811295, 2006.
Stedmon, C. A. and Markager, S.: Behaviour of the optical properties of coloured dissolved organic matter under conservative mixing, Estuar. Coast. Shelf Sci., 57, 973–979, https://doi.org/10.1016/S0272-7714(03)00003-9, 2003.
Tremblay, J.-É., Anderson, L. G., Matrai, P., Coupel, P., Bélanger, S., Michel, C., and Reigstad, M.: Global and regional drivers of nutrient supply, primary production and CO2 drawdown in the changing Arctic Ocean, Prog. Oceanogr., 139, 171–196, https://doi.org/10.1016/j.pocean.2015.08.009, 2015.
Van Zee, H., Hankins, D., deLespinasse, C., Bricaud, A., and Zaneveld, R.: ac-9 and ac-s Protocol Document (Revision J), 2005.
Vanhellemont, Q. and Ruddick, K.: Acolite for Sentinel-2: Aquatic applications of MSI imagery, in: Proceedings of the 2016 ESA Living Planet Symposium, Prague, Czech Republic, 9–13, 2016.
Vermote, E. F., Tanré, D., Deuze, J. L., Herman, M., and Morcette, J.-J.: Second simulation of the satellite signal in the solar spectrum, 6S: An overview, IEEE T. Geosci. Remote, 35, 675–686, https://doi.org/10.1109/36.581987, 1997.
Wilson, R. T.: Py6S: A Python interface to the 6S radiative transfer model, Comput. Geosci., 51, 166 pp., https://doi.org/10.1016/j.cageo.2012.08.002, 2013.
Yamashita, Y., Tosaka, T., Bamba, R., Kamezaki, R., Goto, S., Nishioka, J., Yasuda, I., Hirawake, T., Oida, J., and Obata, H.: Widespread distribution of allochthonous fluorescent dissolved organic matter in the intermediate water of the North Pacific, Prog. Oceanogr., 191, 102510, https://doi.org/10.1016/j.pocean.2020.102510, 2021.