the Creative Commons Attribution 4.0 License.
the Creative Commons Attribution 4.0 License.
 | 28 Mar 2022
Forecasting hurricane-forced significant wave heights using a long short-term memory network in the Caribbean Sea
Brandon J. Bethel
Wenjin Sun
Changming Dong
Dongxia Wang
A long short-term memory (LSTM) neural network is proposed to predict hurricane-forced significant wave heights (SWHs) in the Caribbean Sea (CS) based on a dataset of 20 CS, Gulf of Mexico, and western Atlantic hurricane events collected from 10 buoys from 2010–2020. SWH nowcasting and forecasting are initiated using LSTM on 0, 3, 6, 9, and 12 h horizons. Through examining study cases Hurricanes Dorian (2019), Sandy (2012), and Igor (2010), results illustrate that the model is well suited to forecast hurricane-forced wave heights much more rapidly at a significantly cheaper computational cost compared to numerical wave models, with much less required expertise. Forecasts are highly accurate with regards to observations. For example, Hurricane Dorian nowcasts had correlation (R), root mean square error (RMSE), and mean absolute percentage error (MAPE) values of 0.99, 0.16 m, and 2.6 %, respectively. Similarly, on the 3, 6, 9, and 12 h forecasts, results produced R (RMSE; MAPE) values of 0.95 (0.51 m; 7.99 %), 0.92 (0.74 m; 10.83 %), 0.85 (1 m; 13.13 %), and 0.84 (1.24 m; 14.82 %), respectively. In general, the model can provide accurate predictions within 12 h (R≥0.8) and errors can be maintained at under 1 m within 6 h of forecast lead time. However, the model also consistently overpredicted the maximum observed SWHs. From a comparison of LSTM with a third-generation wave model, Simulating Waves Nearshore (SWAN), it was determined that when using Hurricane Dorian as a case example, nowcasts were far more accurate with regards to the observations. This demonstrates that LSTM can be used to supplement, but perhaps not replace, computationally expensive numerical wave models for forecasting extreme wave heights. As such, addressing the fundamental problem of phase shifting and other errors in LSTM or other data-driven forecasting should receive greater scrutiny from Small Island Developing States. To improve models results, additional research should be geared towards improving single-point LSTM neural network training datasets by considering hurricane track and identifying the hurricane quadrant in which buoy observations are made.
- Article
(2840 KB) - Full-text XML
-
Supplement
(333 KB) - BibTeX
- EndNote


Ordinarily, momentum and mechanical energy are transferred to the ocean's surface from the overlying atmosphere, giving rise to the ubiquitous surface gravity waves. Under forcing by tropical cyclones (TCs), these waves become extreme and pose significant risks to coastal communities. As such, the study of TC-induced extreme significant wave heights (SWHs) is at the current forefront of research and is traditionally accomplished by using an array of numerical models (Shao et al., 2019; Chao et al., 2020; Hu et al., 2020). However, although hindcasting, nowcasting, and forecasting (Alina et al., 2019; Cecilio and Dillenburg, 2020) can be performed using these models, they are all disadvantaged in that they all require large investments in high-performance computing resources, technical and scientific expertise, and crucially, time. For the Small Island Developing States (SIDS) and coastal communities of the Caribbean Sea (CS) which have yet to significantly invest in numerical modeling capabilities, other computationally cost-effective measures are required for wave height predictions. Consequently, alternatives are high priority. Recent research into methodologies based on artificial intelligence (AI) has shown that these techniques are highly effective at forecasting wave properties with minor computational expense, even under TC-forced states (Qiao and Myers, 2020, 2022).
Demonstrating, Chen et al. (2021) constructed a random forest (RF) supervised learning classifier to generate a surrogate for the Simulating Waves Nearshore (SWAN) third-generation numerical model and reduced the required computational time by a factor of 100. Wu et al. (2020) considered a physics-based machine learning model in conjunction with an artificial neural network for predictions of SWH and peak wave period for which wind forcing and initial wave boundary conditions are considered inputs. Campos et al. (2021) used RF to select wind and wave variables to enhance wave forecasts. They found that RF was able to select the best forecast only in very short ranges using inputs of SWH, wave direction, and period. However, variable selection for longer forecasts (5 d and above) was much less certain. Huang and Dong (2021) improved upon the short-term prediction of SWH by decomposing deterministic and stochastic components using a complete ensemble empirical-mode decomposition (CEEMD) algorithm and recurrence quantification analysis. A similar study by Zhou et al. (2021a) demonstrated that combining EMD and the long short-term memory (LSTM) network could also reduce SWH forecasting errors in the CS.
These methods are also effective under TC conditions. Important for the present study, Chen et al. (2020) applied a machine learning method to perform probabilistic forecasting of typhoon-forced coastal wave heights and found that the model could, based on wave height data and an array of typhoon characteristics, generate the predicted confidence interval that enclosed observed wave heights. Meng et al. (2021) considered introducing a deep learning method for long-term predictions of TC-forced nearshore wave heights. The bidirectional gated recurrent unit network was identified as an effective model for real-time and 24 h ahead predictions. Wei and Cheng (2020) developed a two-step wind–wave prediction model to predict wind speed and wave height under typhoon conditions and compared results with a one-step approach. It was determined that deep recurrent neural networks could be used for forecasting in either case, but the two-step approach was more effective. Zhou et al. (2021b) used the convolutional LSTM (ConvLSTM) network to predict TC-induced SWHs in the South China Sea and found that up to a 12 h forecast horizon, the correlation between forecasted values and observations could reach 0.94.
Recently, Bethel et al. (2021a) used LSTM to eliminate gaps in either surface wind speed or SWH by using one variable as a predictand to forecast its counterpart. While mean states were the focus of that study, one hurricane was used to demonstrate the methodology's effectiveness under extreme states. This study continues along that path to generate an LSTM-based forecast model exclusively for hurricane-forced SWHs in the CS using a set of input variables. This is deemed important for assessing and mitigating the risk of catastrophic losses of life and economic productivity due to hurricanes as seen most recently with the 1 September 2019 landfall of Hurricane Dorian in The Bahamas.
The remainder of this paper is structured as follows. Section 2 describes the data and methodology employed. Section 3 presents the main findings of this study. Sections 4 and 5 provide a discussion and the conclusion, respectively.
2.1 Observational data
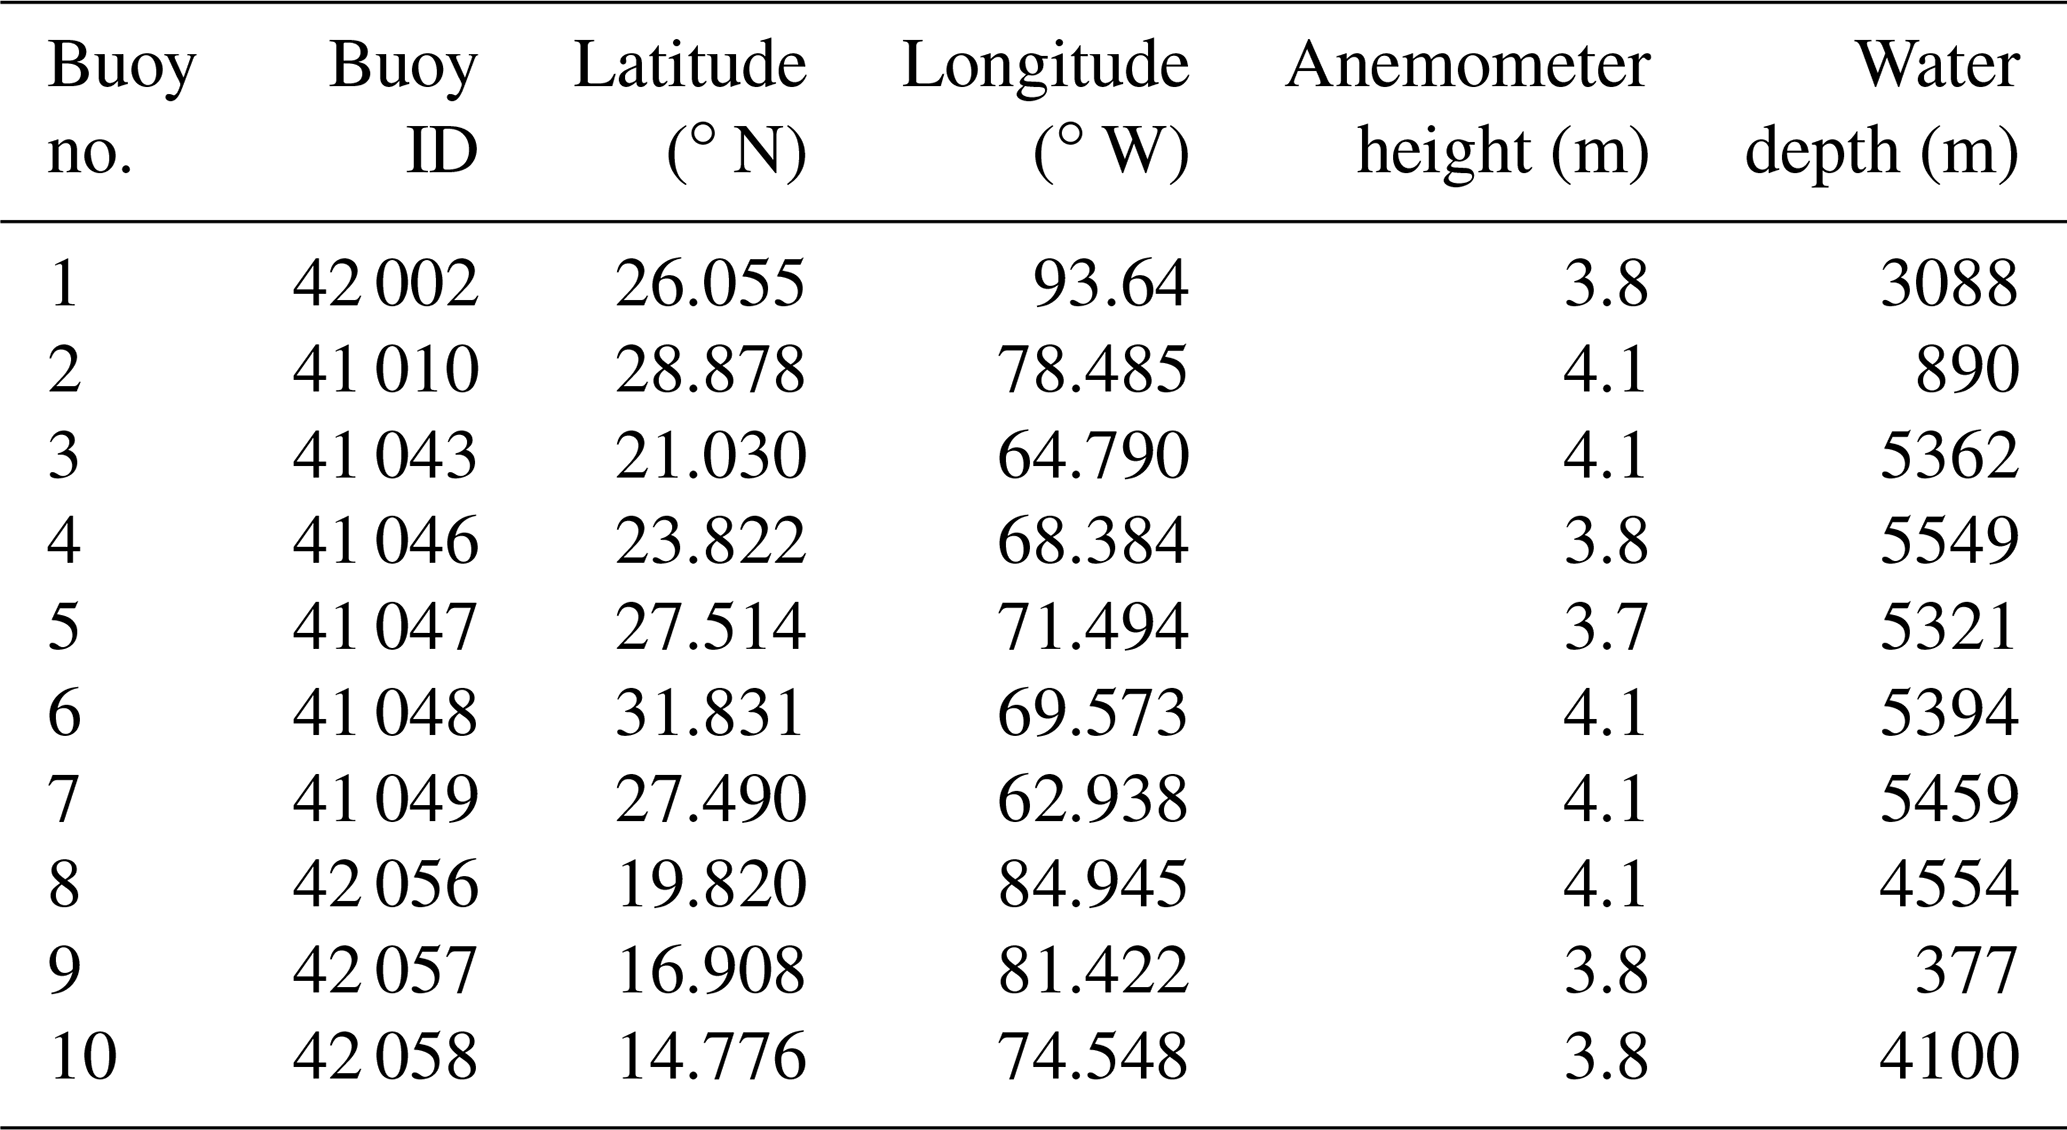
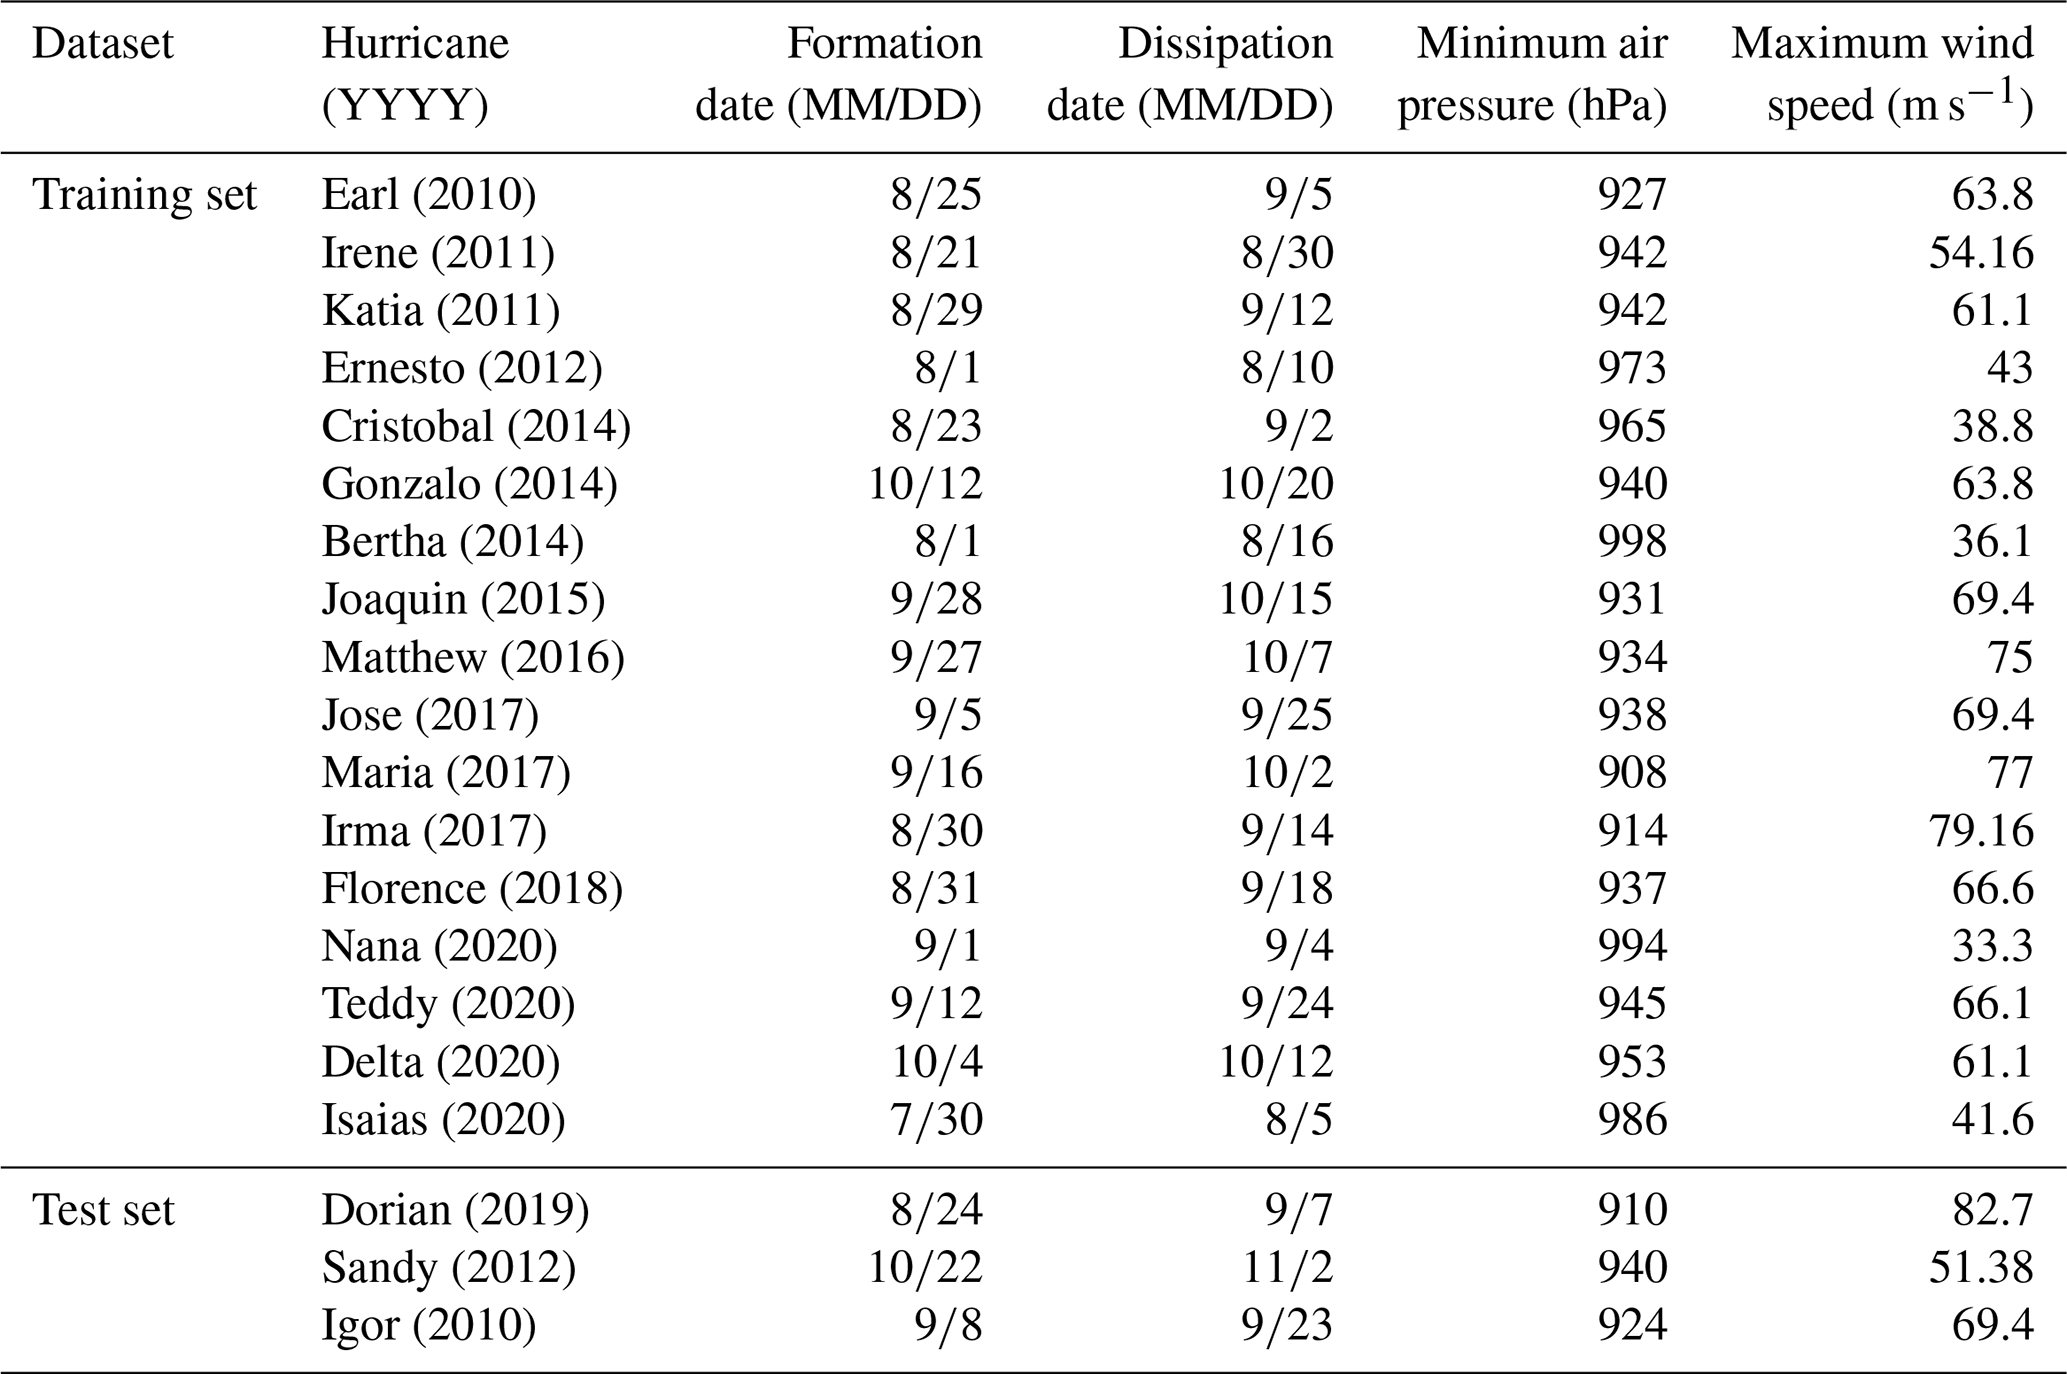
This study employs 10 buoys located throughout the CS, Gulf of Mexico, and western Atlantic Ocean (Fig. 1; Table 1) that are owned and operated by the National Data Buoy Center (NDBC; https://www.ndbc.noaa.gov/, last access: 10 July 2021). Acquired variables include observations of surface wind speed and SWH. Gaps in buoy observations were processed using the insertion of WaveWatch III reanalysis data acquired from the Pacific Islands Ocean Observing System (https://coastwatch.pfeg.noaa.gov/, last access: 10 July 2021). A total of 20 hurricanes identified from 2010–2020 were used and split into LSTM training and test datasets (Table 2). Hurricane statistics were acquired from the hurricane database maintained by the National Hurricane Center (https://www.nhc.noaa.gov/, last access: 10 July 2021).
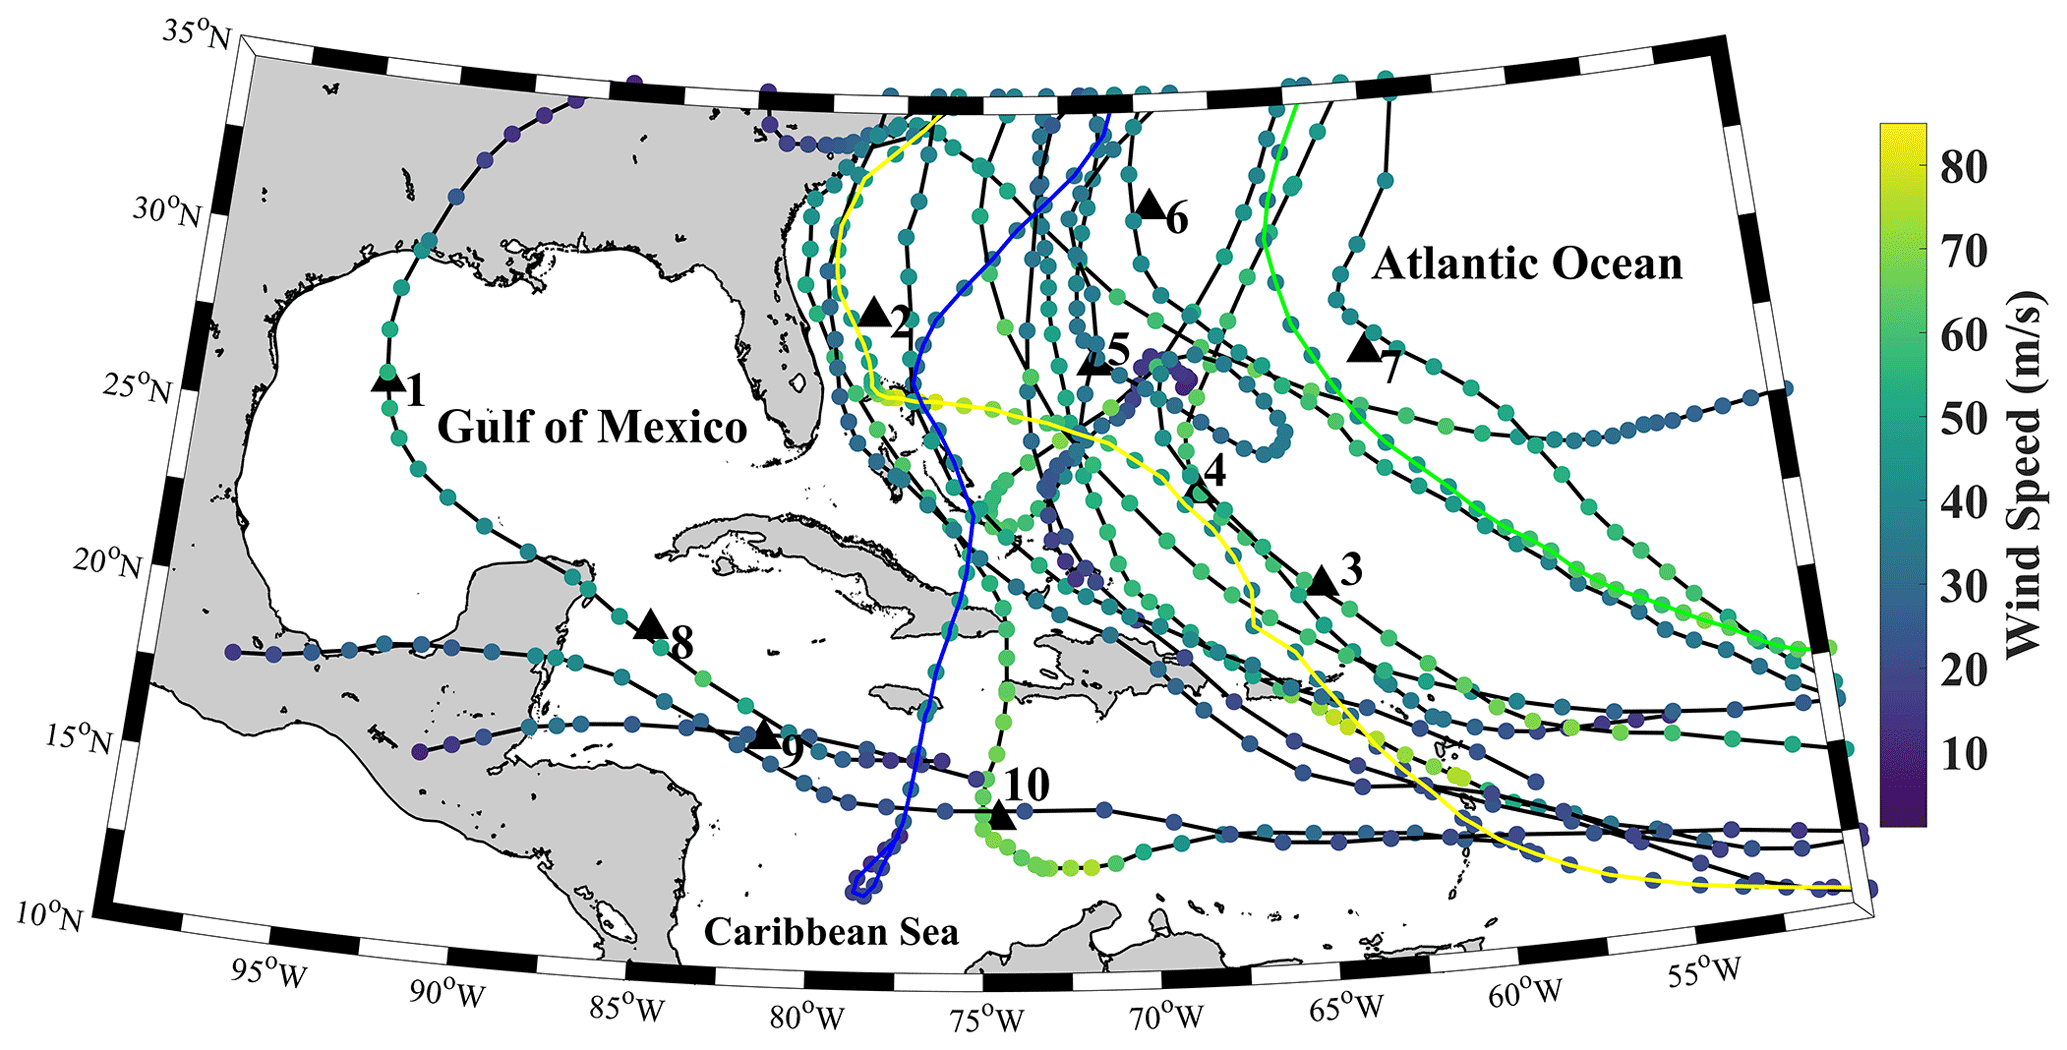
Figure 1Geographic map of the Caribbean Sea, Gulf of Mexico, and western Atlantic Ocean with the best tracks of each studied hurricane and National Data Buoy Center (NDBC) buoy locations (black triangles). Best tracks from model training hurricanes are given in black, while the test best tracks are given in yellow, blue, and green for Hurricanes Dorian, Sandy, and Igor, respectively. Numbered from 1–10, the NDBC buoys employed are buoys 42 002, 41 010, 41 043, 41 046, 41 047, 41 048, 41 049, 42 056, 42 057, and 42 058, respectively.
Table 1List of National Data Buoy Center buoys and their statistics.
In some cases (e.g., Earl, 2010; Igor, 2010; Dorian, 2019; Delta, 2020), the same hurricane was observed multiple times along its track. To increase the total length of the LSTM training and test sets, these data segments were arranged into a single time series. Additionally, cases such as Hurricane Humberto (2019) were explicitly excluded as swell contamination of the wave field could potentially lead to poor forecasts despite its classification as a major hurricane, large effects on the marine environment (Avila-Alonso et al., 2021), and damage to the British overseas territory of Bermuda. Indeed, when a recently developed empirical wind–wave model for the CS was applied to Hurricane Humberto (2019) by Bethel et al. (2021b), observations of wind speed were a very poor predictor of the wave height, and thus, given that surface wind speed and SWH are being used jointly here, worsening of LSTM predictions using Hurricane Humberto (2019) in the training dataset is natural. Unfortunately, it may not be possible to know a priori the existence of swell that may interfere with linear wind–wave relationships, and this is a disadvantage of the current model.
Table 2Formation and dissipation dates, minimum air pressures, and maximum wind speeds of the 20 hurricanes used in this study.
3.1 The long short-term memory network
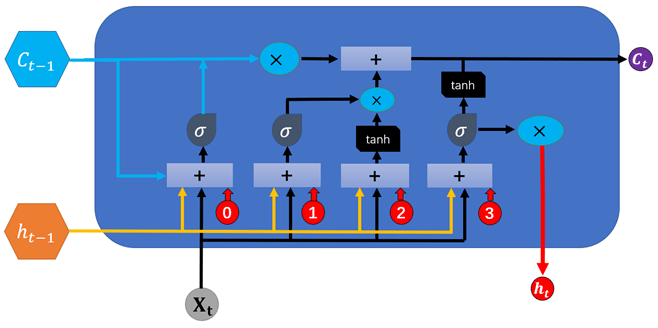
Originally developed by Hochreiter and Schmidhuber (1997), the LSTM network belongs to a class of recurrent neural networks (RNNs). Along with its variants, LSTM has been widely used in forecasting and data reconstruction studies (Kim et al., 2020; Bethel et al., 2021; Gao et al., 2021; Hu et al., 2021; Jörges et al., 2021). It has also been coupled with other machine learning tools, neural networks, and numerical models (Choi and Lee, 2018; Ali and Prasad, 2019; Fan et al., 2020; Guan, 2020). LSTMs have an advantage over traditional feed-forward neural networks and other RNNs in that they can selectively remember patterns in data. This is achieved by a series of forget (ft), input (it), and output (ot) gates. Data passing through these gates are processed using the sigmoid function (σ) and the Hadamard product operator (σ; Yu et al., 2019). Each gate may be computed as follows.
Here, W is each layer's assigned weight, xt is the input time step t, b is the bias, c is the cell state, and tanh is a hyperbolic tangent function.
In sequence, the forget gate is used to delete past information, with decisions on which information should be deleted defined as the value obtained from estimating the sigmoid following receiving ht−1 and xt. The sigmoid function output ranges from 0 to 1 so that if the value is 0, information on the previous state is completely deleted, and if 1, information is completely preserved. The input gate saves current information and is processed alongside ht−1 and xt before being applied to the sigmoid function. The resulting information is then processed with the hyperbolic function and Hadamard product operator before being sent out of the input gate. The strength and direction of information storage in the current cell are represented by it and gt, which respectively range from 0 to 1 and −1 to 1.
LSTM is set up with four layers that correspond to a time step of four. The recursive linear unit (ReLu) was used as the activation function to maximize the model's ability to capture nonlinearities. The adaptive moment estimation (Adam) optimizer is used to compute adaptive learning rates. The number of epochs was set to 100 and the batch size set to three. Throughout each experiment, the operating parameters were held constant. These settings were chosen after experiments (not shown) as they produced the best results while avoiding overfitting. Similar settings can be found in Bethel et al. (2021a) and Zhou et al. (2021a, b). The data were partitioned along a split into training and validation datasets. For clarification, here, and only here, the word “dataset” should be interpreted as a given test hurricane (the test set hurricanes in Table 2). A general model is trained using the training set hurricanes in Table 2, but the model is specified to a given test set hurricane using 70 % of its time series, and the remaining 30 % is used to validate the forecast.
3.2 Wind speed extrapolation
As seen in Table 1, no buoy measured wind speed at the standard 10 m height, and thus wind speeds were adjusted to this height using the logarithmic wind profile:
where Ux is the wind speed measured at a given buoy's anemometer height, x is a given buoy's anemometer height, and Z0 is the roughness length (0.0002; Golbazi and Archer, 2019).
3.2.1 Performance indicators
Three commonly used statistical metrics are used to assess forecast efficacy: correlation coefficient (R), root mean square error (RMSE), and mean absolute percentage error (MAPE). Their equations are as follows.
Here, xi and are the observed and forecasted SWH (m), respectively. Ni is the total number of observations, and the overbar denotes averages.
4.1 Time series analysis
To evaluate forecast efficacy, time series of the observed and LSTM-forecasted, hurricane-forced SWHs for Hurricanes Dorian, Sandy, and Igor are given in Figs. 3–5, respectively. Due to the lack of nearshore buoy observations within The Bahamas, no observations were made when Hurricane Dorian made landfall on Abaco island on 1 September 2019. NDBC buoy 41 010 nevertheless observed the growth of SWH under the influence of the hurricane several hundred kilometers away. In Fig. 3, the time series of observed SWH is compared with the nowcast (0 h, Fig. 3a; 3, 6, 9, and 12 h forecasts, Fig. 3b–e, respectively). In Fig. 3a, it can be observed that there is an extremely tight fit between the forecasts and observations of SWHs forced by Hurricane Dorian at the start of wave growth from ∼3.5 m to just under 7 m. However, at closer inspection, it can also be seen there are periods (e.g., at 42 h after 15:00 UTC 1 September) during which the LSTM nowcast is unable to capture the extremely fine details. This is because in addition to errors introduced by LSTM's computations, there are also far too few examples of high-frequency components of the signal that the model could learn from and reproduce. Even following preprocessing using empirical-mode decomposition, high-frequency components of original SWH signals remain a challenge for LSTM (Zhou et al., 2021a). Nevertheless, this represents a discrepancy of far less than 1 m and is thus of very little importance when considering estimates of the wave state. When forecasts are performed on a 3 h horizon, however, discrepancies between observations and the forecast grow significantly larger; at different times, forecasted SWHs both underestimate and overestimate the observations. This phenomenon is especially noticeable at the 40 and 50 h marks after 15:00 UTC on 1 September. At the 40 h mark, SWHs were observed by buoy 41 010 at approximately 5.5 m, but LSTM predicted a height of only approximately 4.2 m. The difference between the two clearly exceeds 1 m.

Figure 3Time series of Hurricane Dorian observed and LSTM-forecasted SWH (m) at the (a) 0, (b) 3, (c) 6, (d) 9, and (e) 12 h horizons measured at buoy 41 010.
As total wave energy (P) is extremely sensitive to SWH (i.e., , where Hs is the SWH and Tp is the wave period), even minor underestimations of the wave height would lead to radically different energy output. Similarly, at the 50 h mark, SWH was measured at approximately 5.6 m, but LSTM forecasted a wave height of approximately 6.5 m. This overestimation would produce the same radically different energy output as the observations. The same phenomenon can still be observed for the 6, 9, and 12 h forecast horizons respectively presented in Fig. 6c–e, but at a significantly exacerbated scale. In each case, at the tail end of the forecasts (35 + h after 15:00 UTC 1 September), the distance between the observations and forecasts widened as the maximum wave height increased.
Identical to Hurricane Dorian, nowcasts of Hurricane Sandy were most efficient at reproducing the observations (Fig. 4a). Interestingly, though there are some slight differences, LSTM was still able to capture fine-scale increases or decreases in SWH. As the forecast horizon is extended to 3 h in Fig. 4b, however, those fine-scale details were increasingly missed, though the general wave growth and decay trends were captured. In Fig. 4c for the 6 h forecast horizon and before the 40 h mark after 20:00 UTC on 10 September, LSTM nearly consistently underestimated wave heights. Following this point at the peak of the storm, LSTM virtually captured the observed SWH, although fine-scale details were completely missed. During the wave height decay stage, LSTM-forecasted wave heights overestimated the observations, but this discrepancy hovered at ∼0.5 m and were therefore not as extreme as the discrepancies seen during Hurricane Dorian at the same 6 h forecast horizon (Fig. 3c). In Fig. 4d and e where the 9 and 12 h forecast horizons are compared with observations, the differences between them is significantly larger than as compared to the 0 h nowcast or the 3 and 6 h forecast horizons of Fig. 4a–c.

At its most extreme, the difference between the forecasted (∼6 m) and observed (∼9 m) SWH reached a staggering 3 m at the 32 h mark after 20:00 UTC on 24 October. However, 8 h later at the peak of the storm, LSTM was once again able to predict the observed SWHs more adequately. Although LSTM was able to capture the general decrease, it largely overestimated the SWH as wave heights began to decrease with the passing of the storm. This overestimation was measured at approximately 2 m at the 90 h mark after 20:00 UTC on 24 October.
Although Hurricanes Dorian and Sandy, like Hurricane Igor, were extremely powerful systems, Igor spent most of its time in the Atlantic Ocean far away from any landmasses. Perhaps, then, the maximum wave height was allowed to grow to just under 11 m as an extremely long, uninterrupted fetch and duration would have been conducive for this wave growth. This is, of course, tempered by wind energy transfer rates and energy saturation of the wave field (Liu et al., 2008; Hwang and Fan, 2017; Babanin et al., 2019), in addition to balancing and decay by dissipative forces (Allahdadi et al., 2019; Rollano et al., 2019; Tamizi et al., 2021). In Fig. 5, similar to the previous two examples, the LSTM nowcast (Fig. 5a) produced exceptionally accurate results for Hurricane Igor (2010) with regards to the observations.
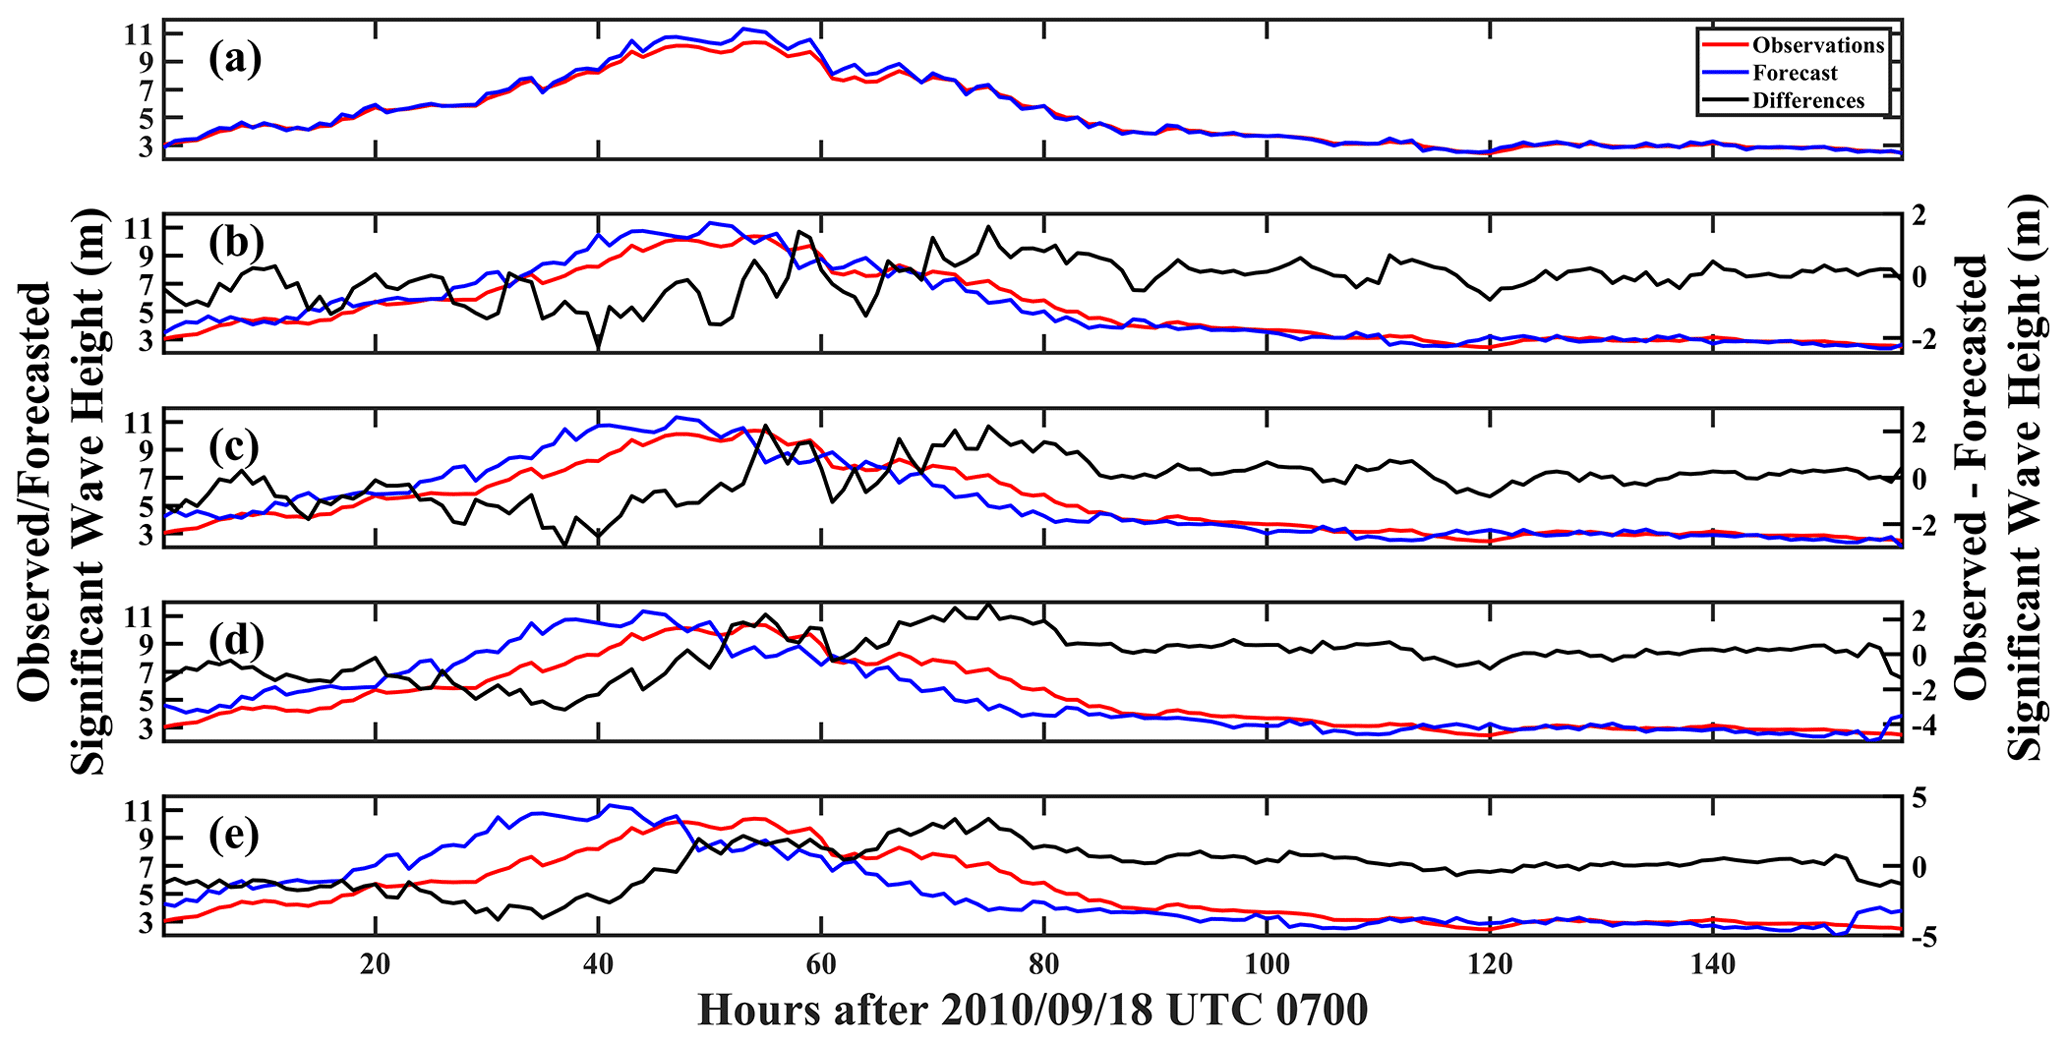
This is even true at the peak of the storm at the 50 h mark after 07:00 UTC on 18 September when wave heights reached a maximum of just under 10 m. As the forecast horizon increased, however, the same pattern of forecast quality deterioration could be observed: in Fig. 5b at the 3 h horizon. Although LSTM was able to capture the general trend throughout the time series, LSTM's predictions were slightly out of phase with the observations in its estimation of the point at which the storm generated its maximum wave height (50 h after 07:00 UTC on 18 September). This phenomenon becomes increasingly apparent in the 6 h (Fig. 5c), 9 h (Fig. 6d), and 12 h (Fig. 5e) forecast horizons. Nevertheless, at the tail end of the time series, regardless of the forecast horizon, LSTM produced highly accurate predictions of SWH under forcing by Hurricane Igor (2010).
As the problem is most noticeable here, the problem of LSTM phase shifting during its time series forecasting will be discussed. From Fig. 3, it should be clear that there are lags in forecasts compared to the observation for Hurricane Igor. This is also observable, but to a much smaller degree, in Fig. 4 for Hurricane Sandy. Consequently, autocorrelations between time series were estimated and with lag results are presented in Fig. 6. Hurricane Dorian is not shown as its lags were all 0 for each forecast horizon. There, it can be observed that for Hurricane Sandy, the lags increased from 0 h at the nowcast (0 h) and 3 h forecast to 1 h at the 6 h forecast and continued to increase to 4 h at the 12 h forecast. Similarly, for Hurricane Igor, there was also no lag between the time series from the nowcast (0 h) and 3 h forecast, but over time, lags gradually increased from 2 h at the 6 h forecast horizon to up to 7 h at the 12 h forecast horizon. This occurs because the further in time predictions are made, errors at each time step build upon the previous prediction error, thus shifting forecast values.
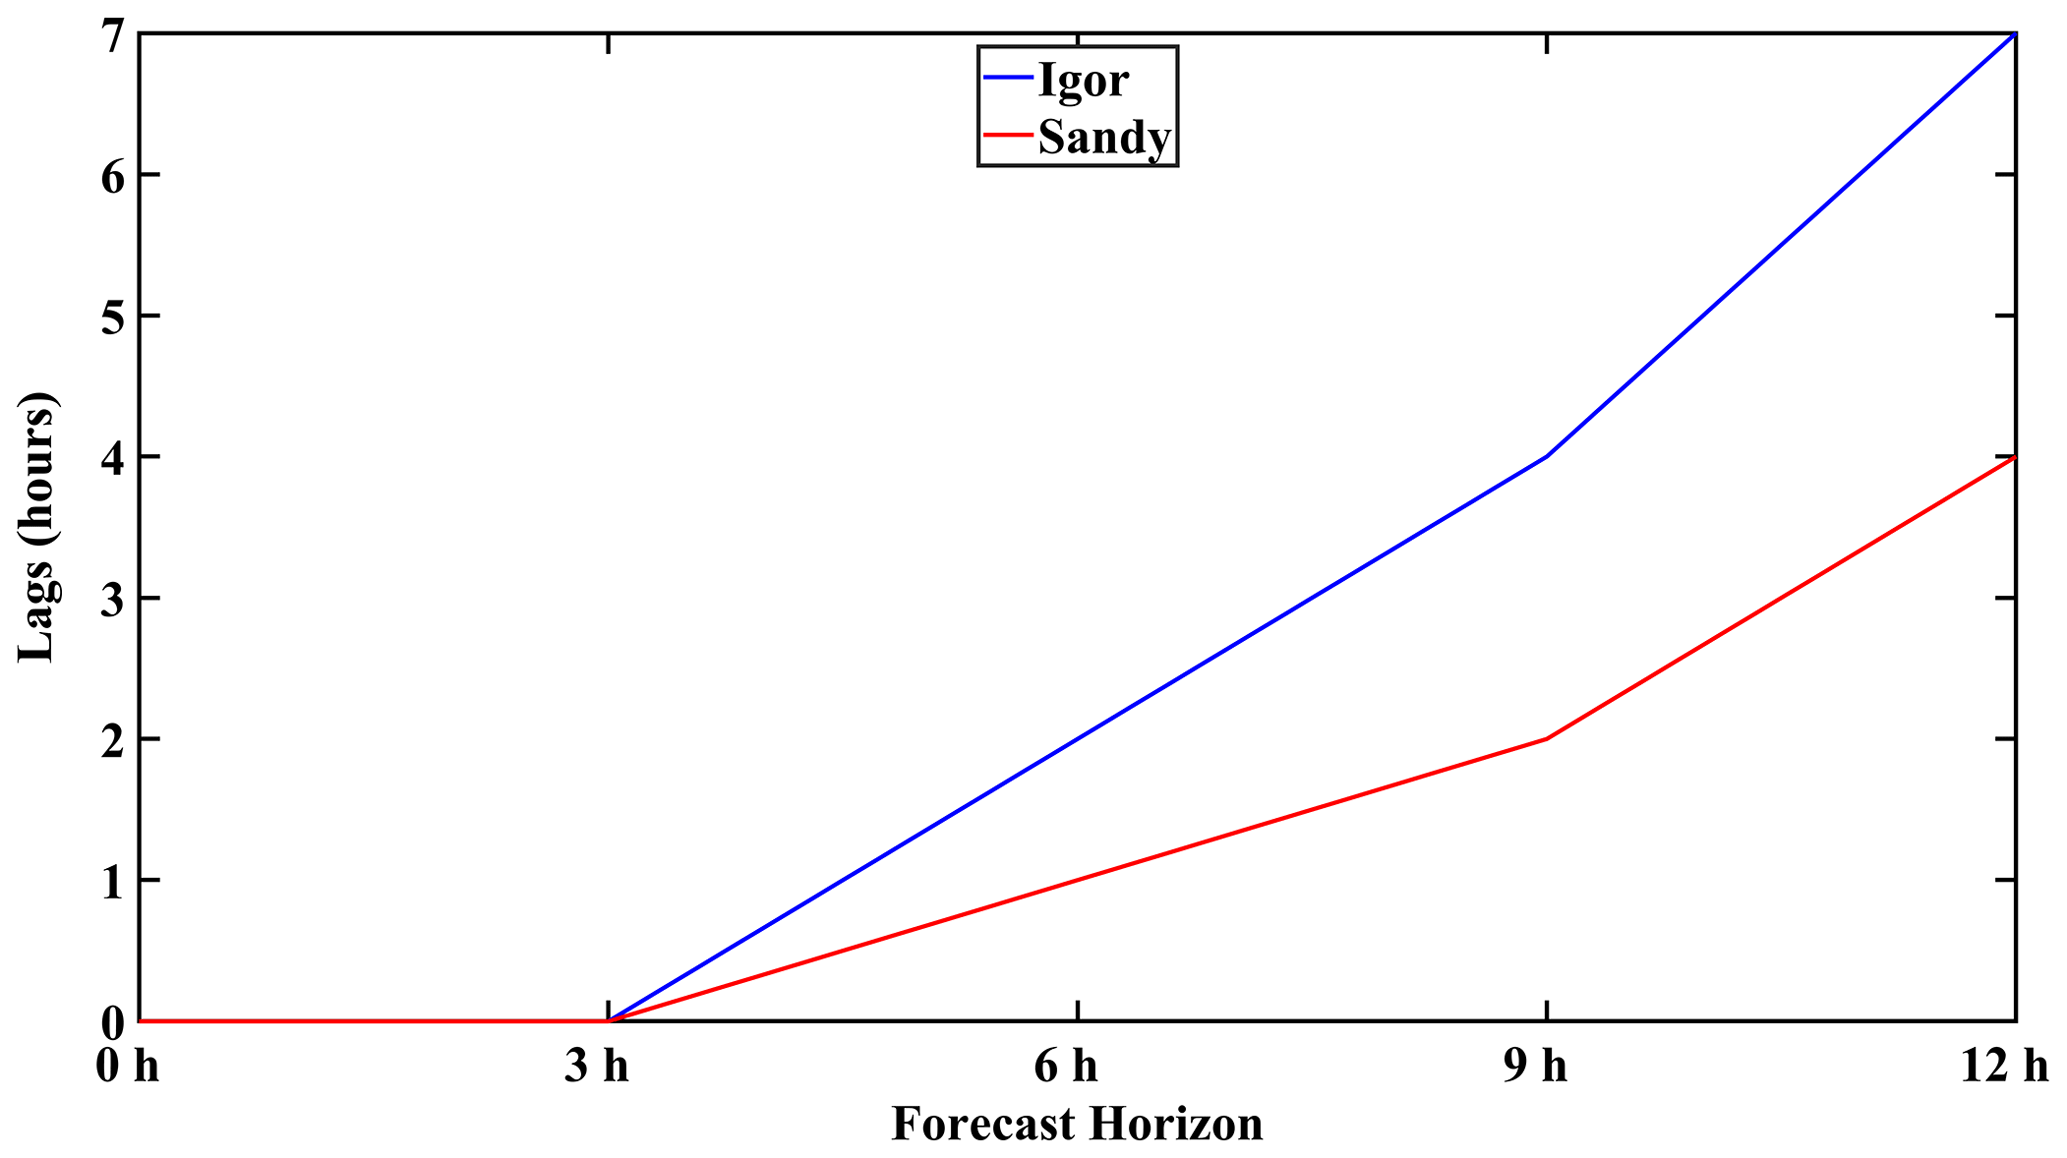
Figure 6Estimated lags due to phase shifting of forecasted time series for Igor (blue) and Sandy (red).
Curiously, the problem of phase shifting and increasing lags over forecast horizon time may also be related to the length of the time series for a given hurricane event. During experiments, it was noted that as the number of wave height events recorded by a buoy during a hurricane increased, the severity of phase shifting also increased alongside observed lags. Data-driven methods such as LSTM, while they can learn and reproduce the relationships of a variety of climate variables and are therefore suitable for forecasting, are prone to phase shift errors, oscillations, and failures (Kaji et al., 2020; Morgenstern et al., 2021). Hurricane Igor possessed the longest time series, and as such, its phase shift errors were most severe, leading to the largest lags between SWH forecast and observation time series. Unfortunately, this and other errors are inherent to LSTM and may require additional experimentation in modifying the input time series as Morgenstern et al. (2021) noted that structural changes to LSTM by the usage of encoder–encoder architectures or offsetting the start of forecasts to the forecast horizon of interest produced no noticeable positive change. While phase shifts and lags represent rather large disadvantages for this model as it will not be able to accurately predict the timing of, for example, maximum wave heights, this appears to only be a problem at extended forecast horizons (i.e., 6 h and beyond). Nevertheless, the lags are all well within 12 h, and thus, although this model should not be depended upon to the exclusion of other forecasting methods, it can still give several hours of advance warning to coastal communities and regional governments to make minor changes to hurricane protection plans.
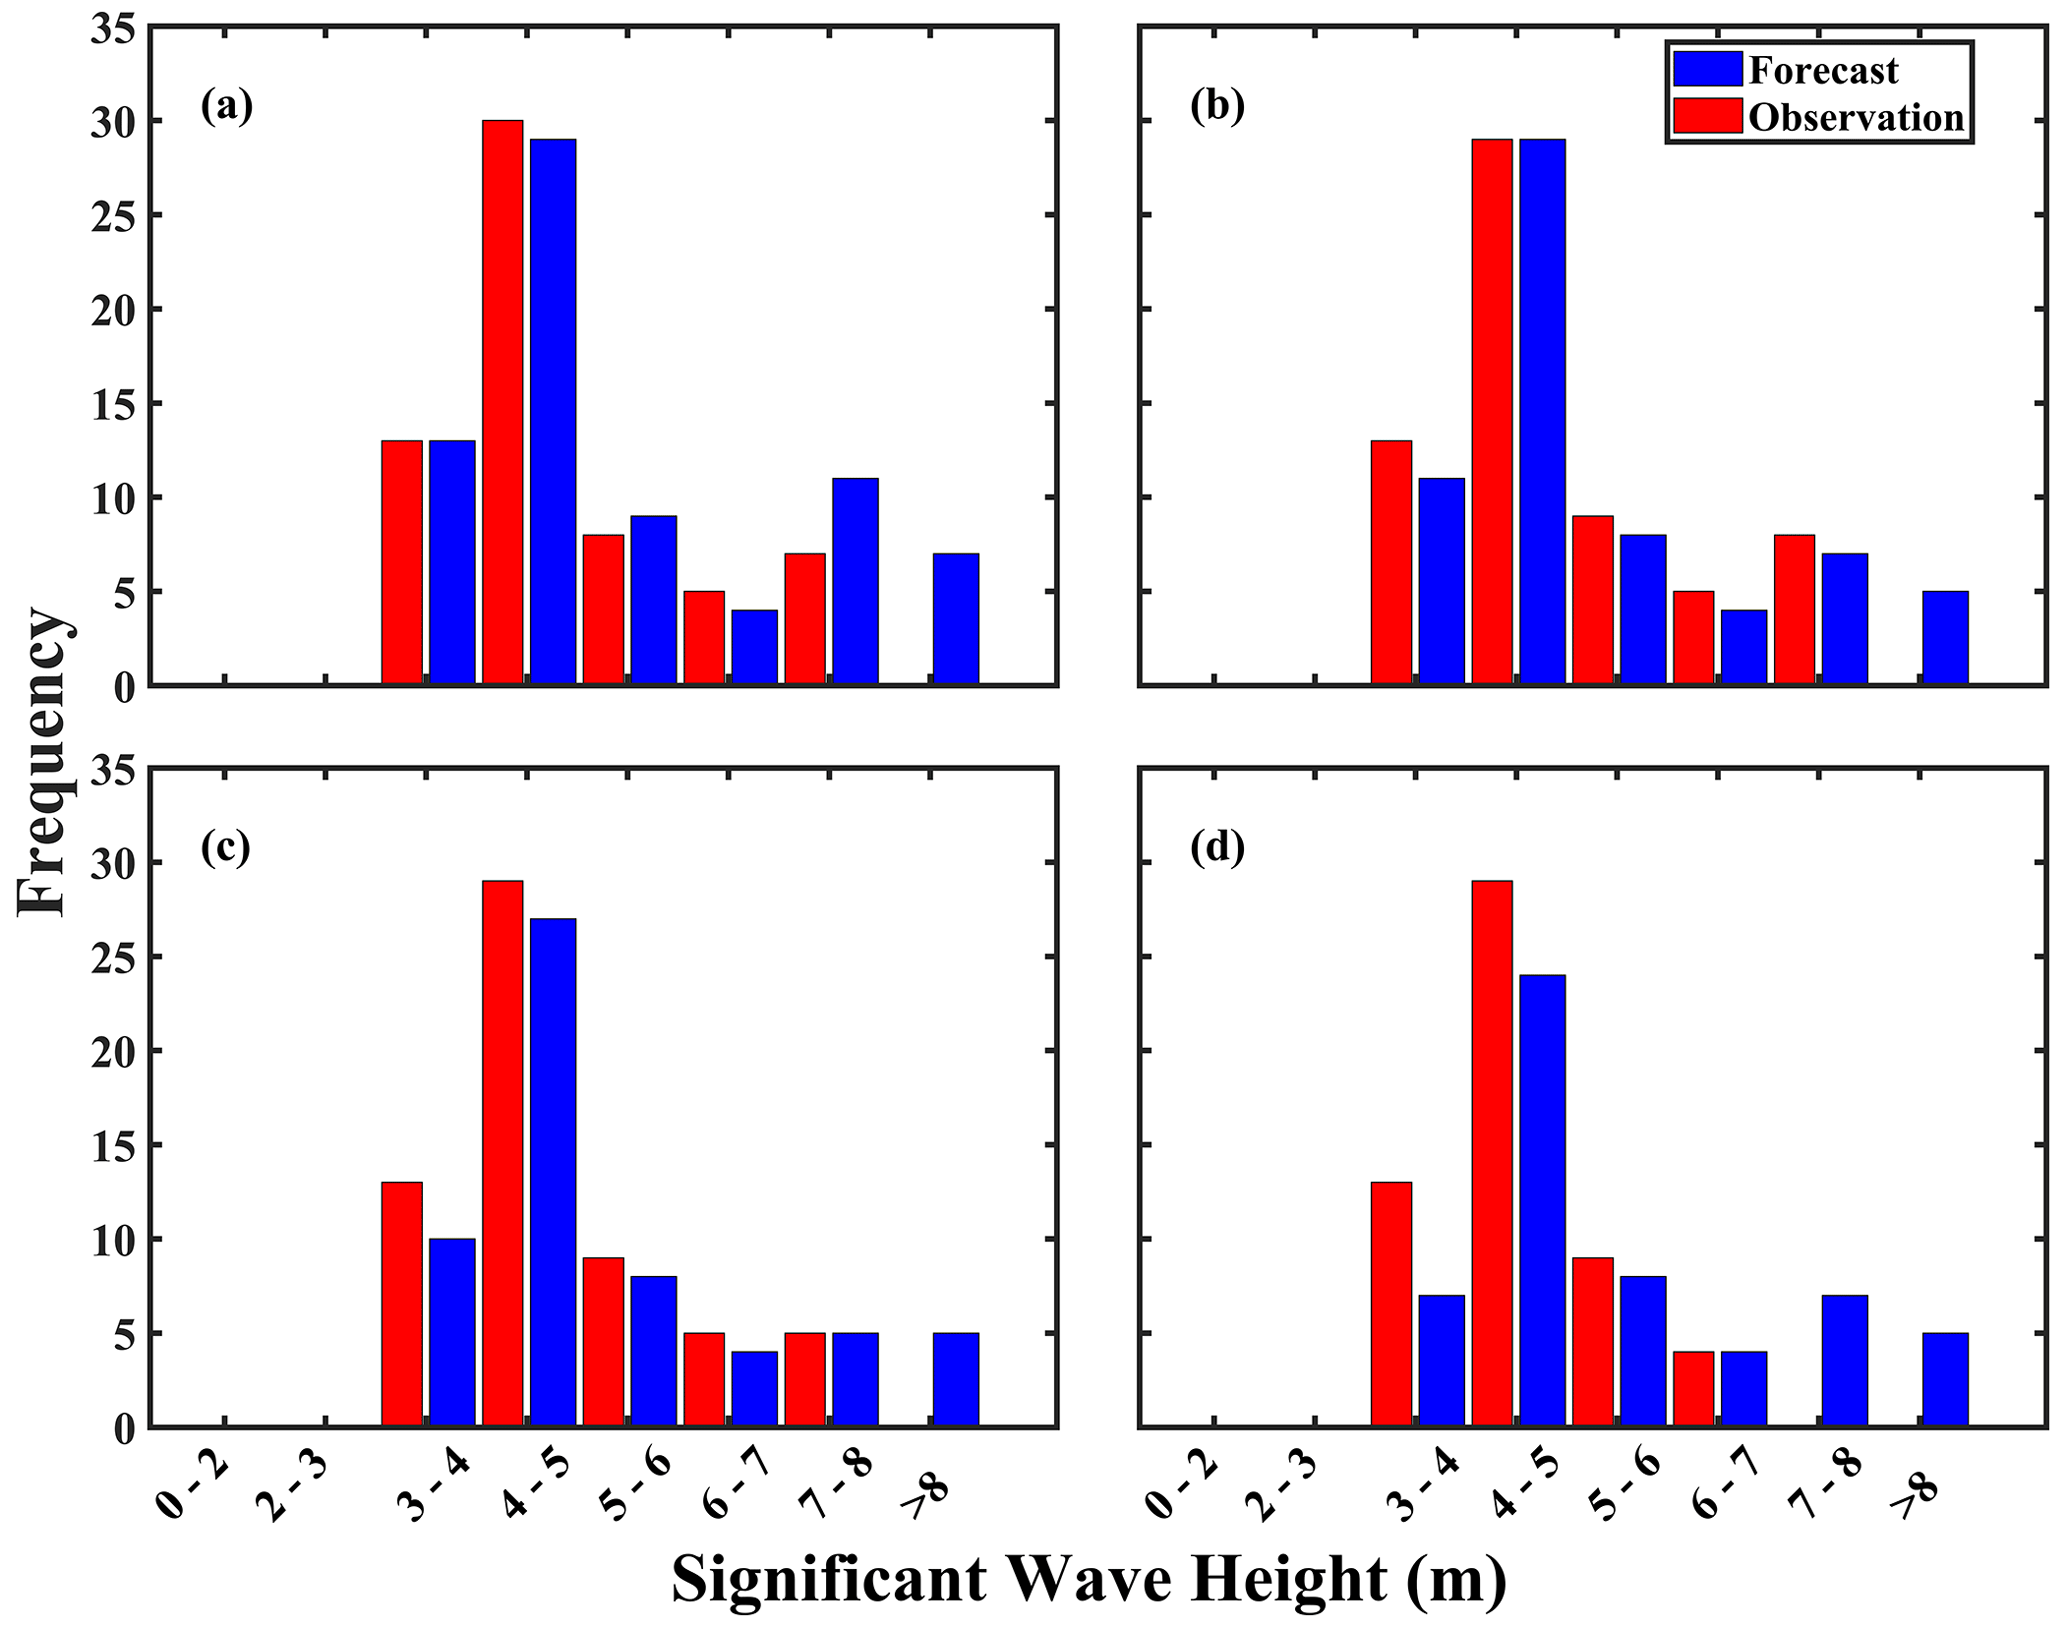
Figure 7Histograms of Hurricane Dorian observed (red) vs. forecasted (blue) SWH (m) at the (a) 0, (b) 3, (c) 6, and (d) 12 h forecast horizons. Results for the 9 h forecast are presented in Fig. S1.
4.2 Histogram analysis
Precise and not merely accurate estimates of hurricane-forced SWHs have the potential to enhance risk assessments and mitigation strategies as these systems make landfall or approach offshore structures (Hatzikyriakou and Lin, 2017; Marsooli and Lin, 2018; Masoomi et al., 2018; Guo et al., 2020; Song et al., 2020). This first section investigates the distribution of forecasted SWHs in comparison with observations for hurricanes Dorian, Sandy, and Igor. In Fig. 7, histograms of observed and forecasted SWHs under forcing by Hurricane Dorian are presented. In Fig. 7a, it can be observed that for the 0 h SWH nowcast, the model nearly exactly matched observations at the 3–4 m bin but minutely underestimated the observations at the subsequent 4–5 m bin. Alternating overestimations and underestimations occurred for the 5–6 and 6–7 m bins, but unfortunately, overestimations were most severe at the >8 m bin. There were no observed occurrences of wave heights over 8 m, but the model incorrectly predicted their existence.
In Fig. 7b, there is relatively good agreement between the forecasted and observed SWHs, but discrepancies between them become increasingly apparent. Though at the 0 h forecast in Fig. 7a forecasted and observed SWHs exactly matched, LSTM underestimated the frequency of 3–4 m wave heights but exactly matched the frequency of slightly higher (4–5 m) waves. LSTM underestimations continued through the 6–8 m bins, but again, the model overestimated the frequency of waves higher than 8 m. This trend remains consistent at the 6 and 9 h forecasts in Figs. 7c and S1, but at the 12 h forecast in Fig. 7d, excluding the 6–7 and >8 m bins wherein LSTM respectively exactly matched and overestimated the observations, underestimations of the frequency of other wave heights occurred at all other bins.
Likewise, Fig. 8 presents histograms of observed and nowcasted or forecasted SWHs as forced by Hurricane Sandy. In Fig. 4a, while the maximum wave heights forced by Hurricane Sandy (∼9 m) exceeded those of Hurricane Dorian (∼ 8 m), LSTM was still able to adequately predict the wave height distribution. However, alternating patterns of underestimations and overestimations of the frequency of wave heights can still be observed. In Fig. 8a, the 0 h nowcast underestimated the observations from the 2–3 m up to the 4–5 m bins before abruptly overestimating all remaining bins, with >8 m being the most severe case.
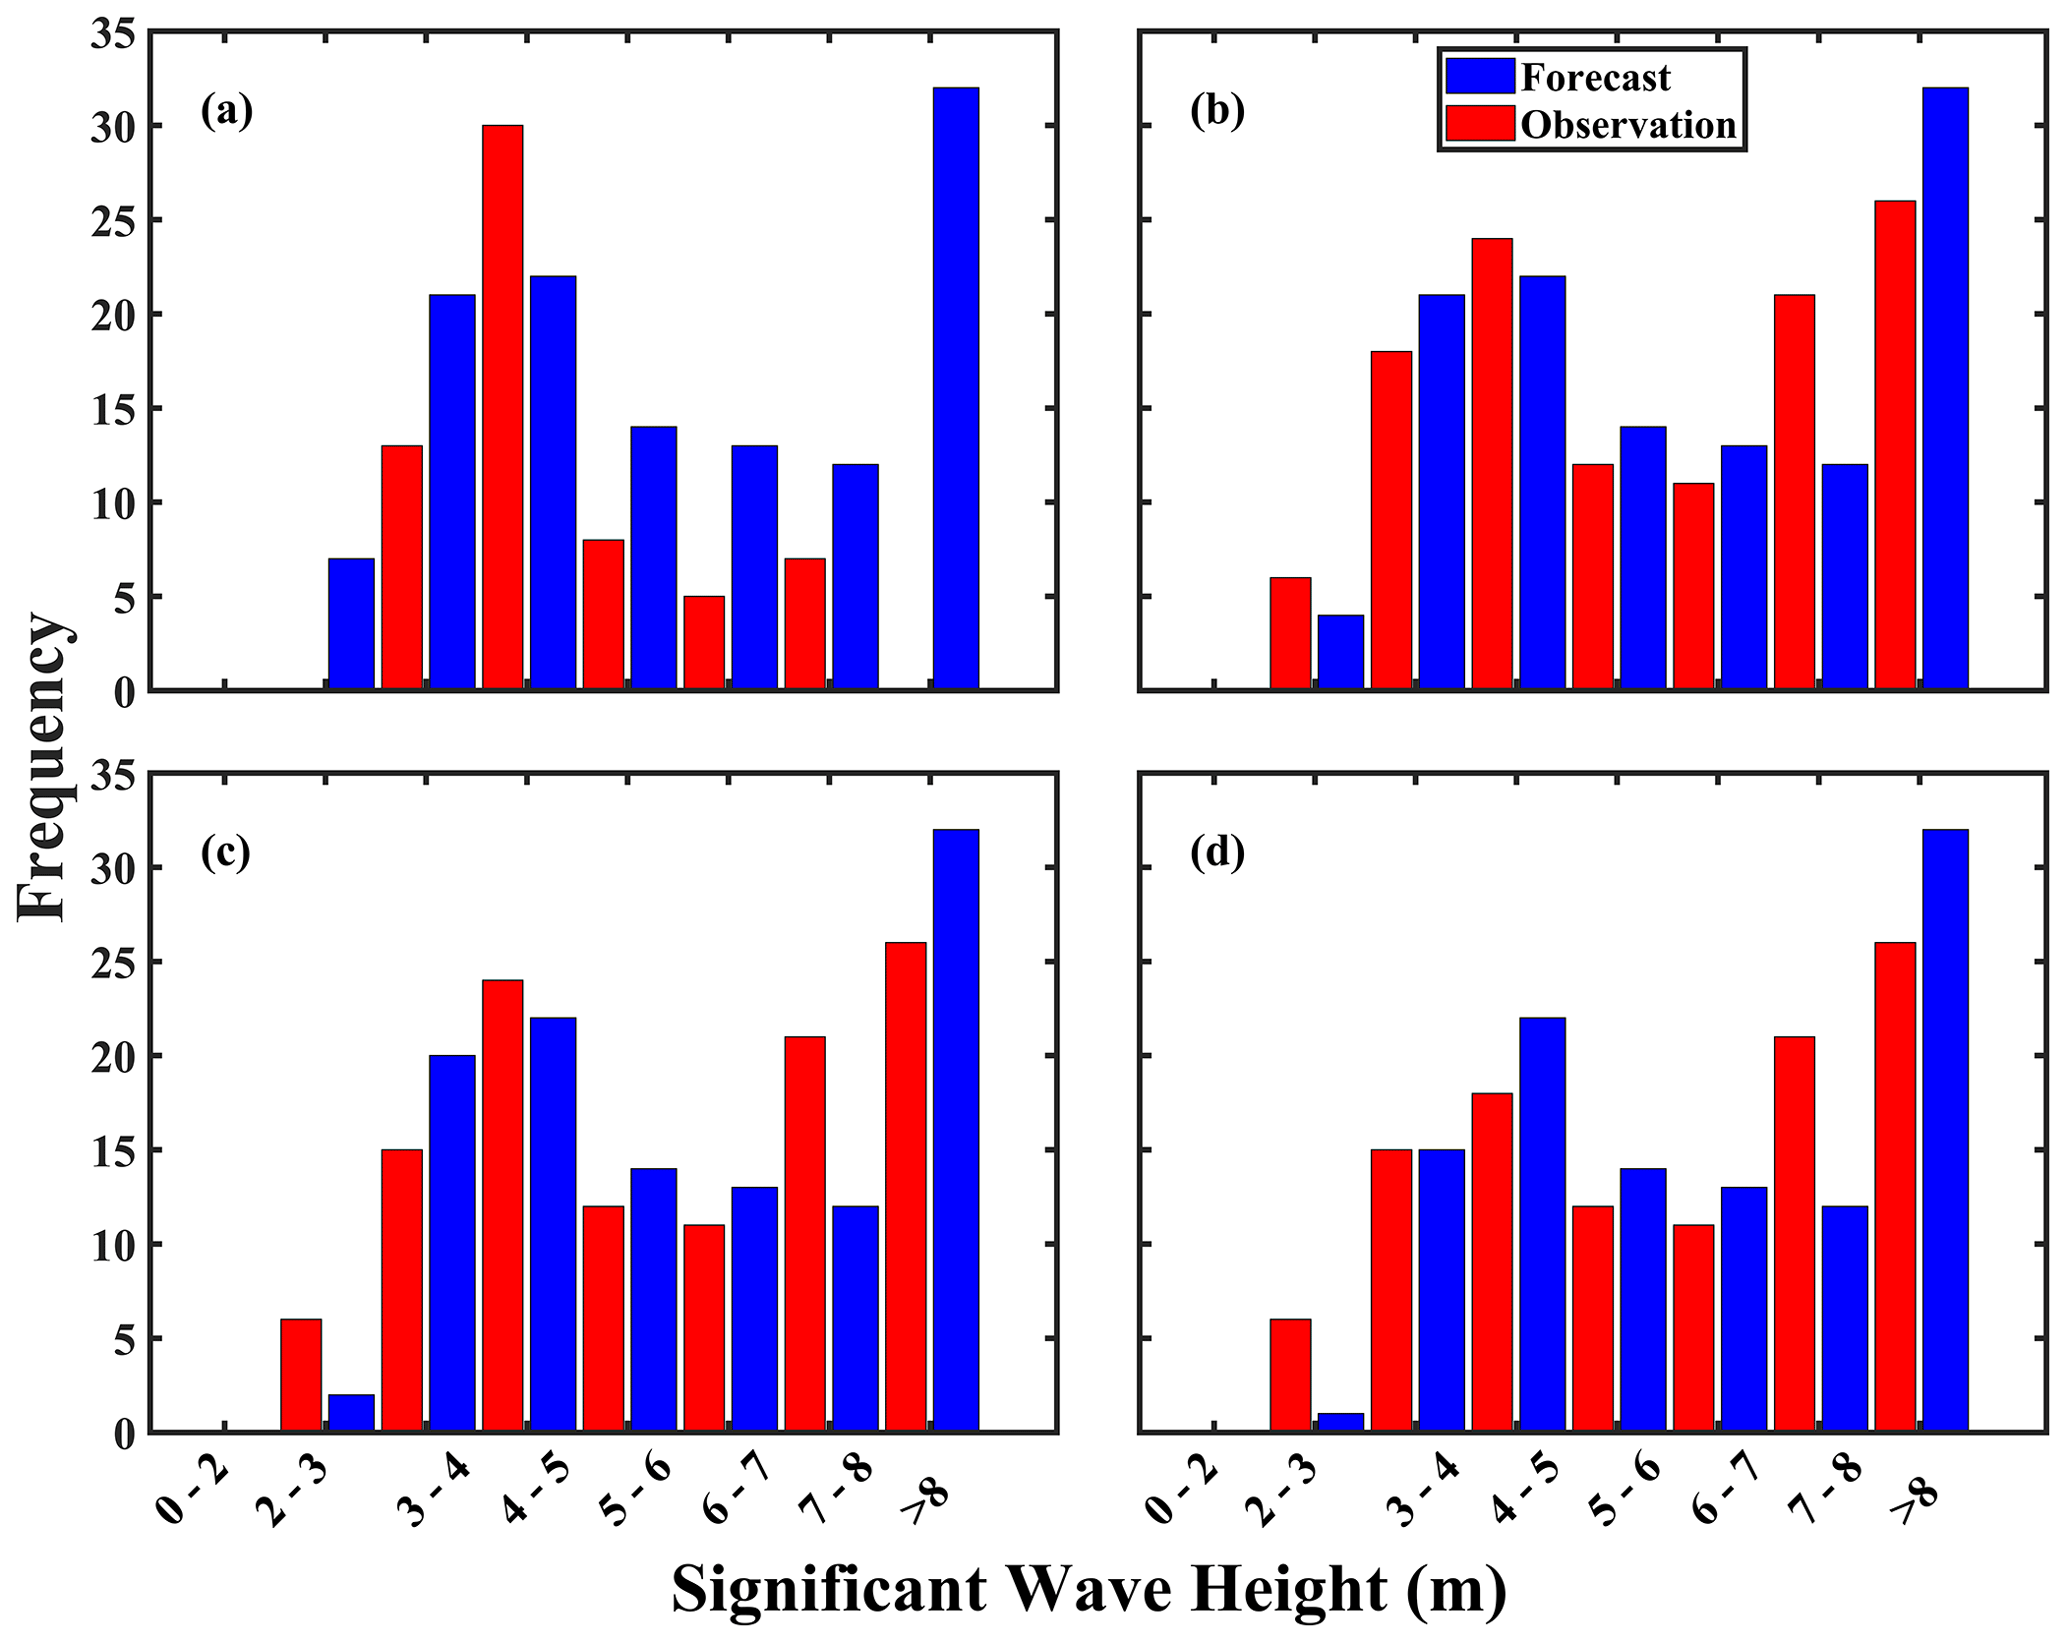
Figure 8Same as Fig. 7, but for Hurricane Sandy. Results for the 9 h forecast are presented in Fig. S3.
In Fig. 8b at the 3 h forecast horizon, results are largely improved over the 0 h nowcast, but underestimations throughout most of the wave height bins continue. The exception to this remains the overestimation of the frequency of the highest (i.e., >8 m) wave heights. The case remains the same for Figs. 8c–d and S3 at the 6, 9, and 12 h forecast horizons.
Results for Hurricane Igor are presented in Fig. 9. Here, Igor produced SWHs that exceeded either Hurricane Dorian or Sandy, but interestingly, regardless of the forecast horizon, LSTM was able efficiently (but still imperfectly) forecast the wave height distribution, even at wave heights up to 9–10 m. However, identical to the previous hurricane cases, the frequency of maximum wave height predictions greater than 10 m is overestimated. Throughout the forecast horizons, naturally, the 0 h forecast produced the best results (Fig. 9a). Deterioration of the forecasted wave height frequency and magnitude increased steadily from the 3, 6, 9, and 12 h forecast horizons as shown in Figs. 9b–d and S6.
Consistent features of the model are its apparent underestimations and overestimation of both the frequency of wave heights and their magnitudes (Figs. S2, S4, and S6). Specifically, the model can underestimate wave heights anywhere by m in the cases of Dorian (Fig. S2) and Sandy (Fig. S6) but also overestimate heights by 2–3.5 m. With regards to Igor, this phenomenon is even more severe with underestimations ranging from m and overestimations reaching ∼4 m. With regards to the overestimations, this may indicate that the training dataset contains too many examples of very high wave heights, which thus necessitates the inclusion of less powerful hurricanes for model training. Though counterintuitive, this is deemed required as wave growth under hurricane forcing is not merely a function of the maximum wind speed. Indeed, an array of factors which include, but are certainly not limited to, the specific tracks, translation speed and environment (e.g., obstacles reducing fetch and duration), or modulating factors (e.g., surface currents) all have an impact on wave growth, maintenance, and decay (Drost et al., 2017; Zhang and Oey, 2018; Hegermiller et al., 2019). Thus, if less powerful hurricanes are considered in the training dataset as a control (i.e., minimizing the maximum wind speeds available to grow surface waves, regardless of environment or surface-wave-modulating factors), the probability of preferentially populating the training set with large waves can be decreased. An added benefit would be the inclusion of low wave heights to aid in minimizing underestimation errors.
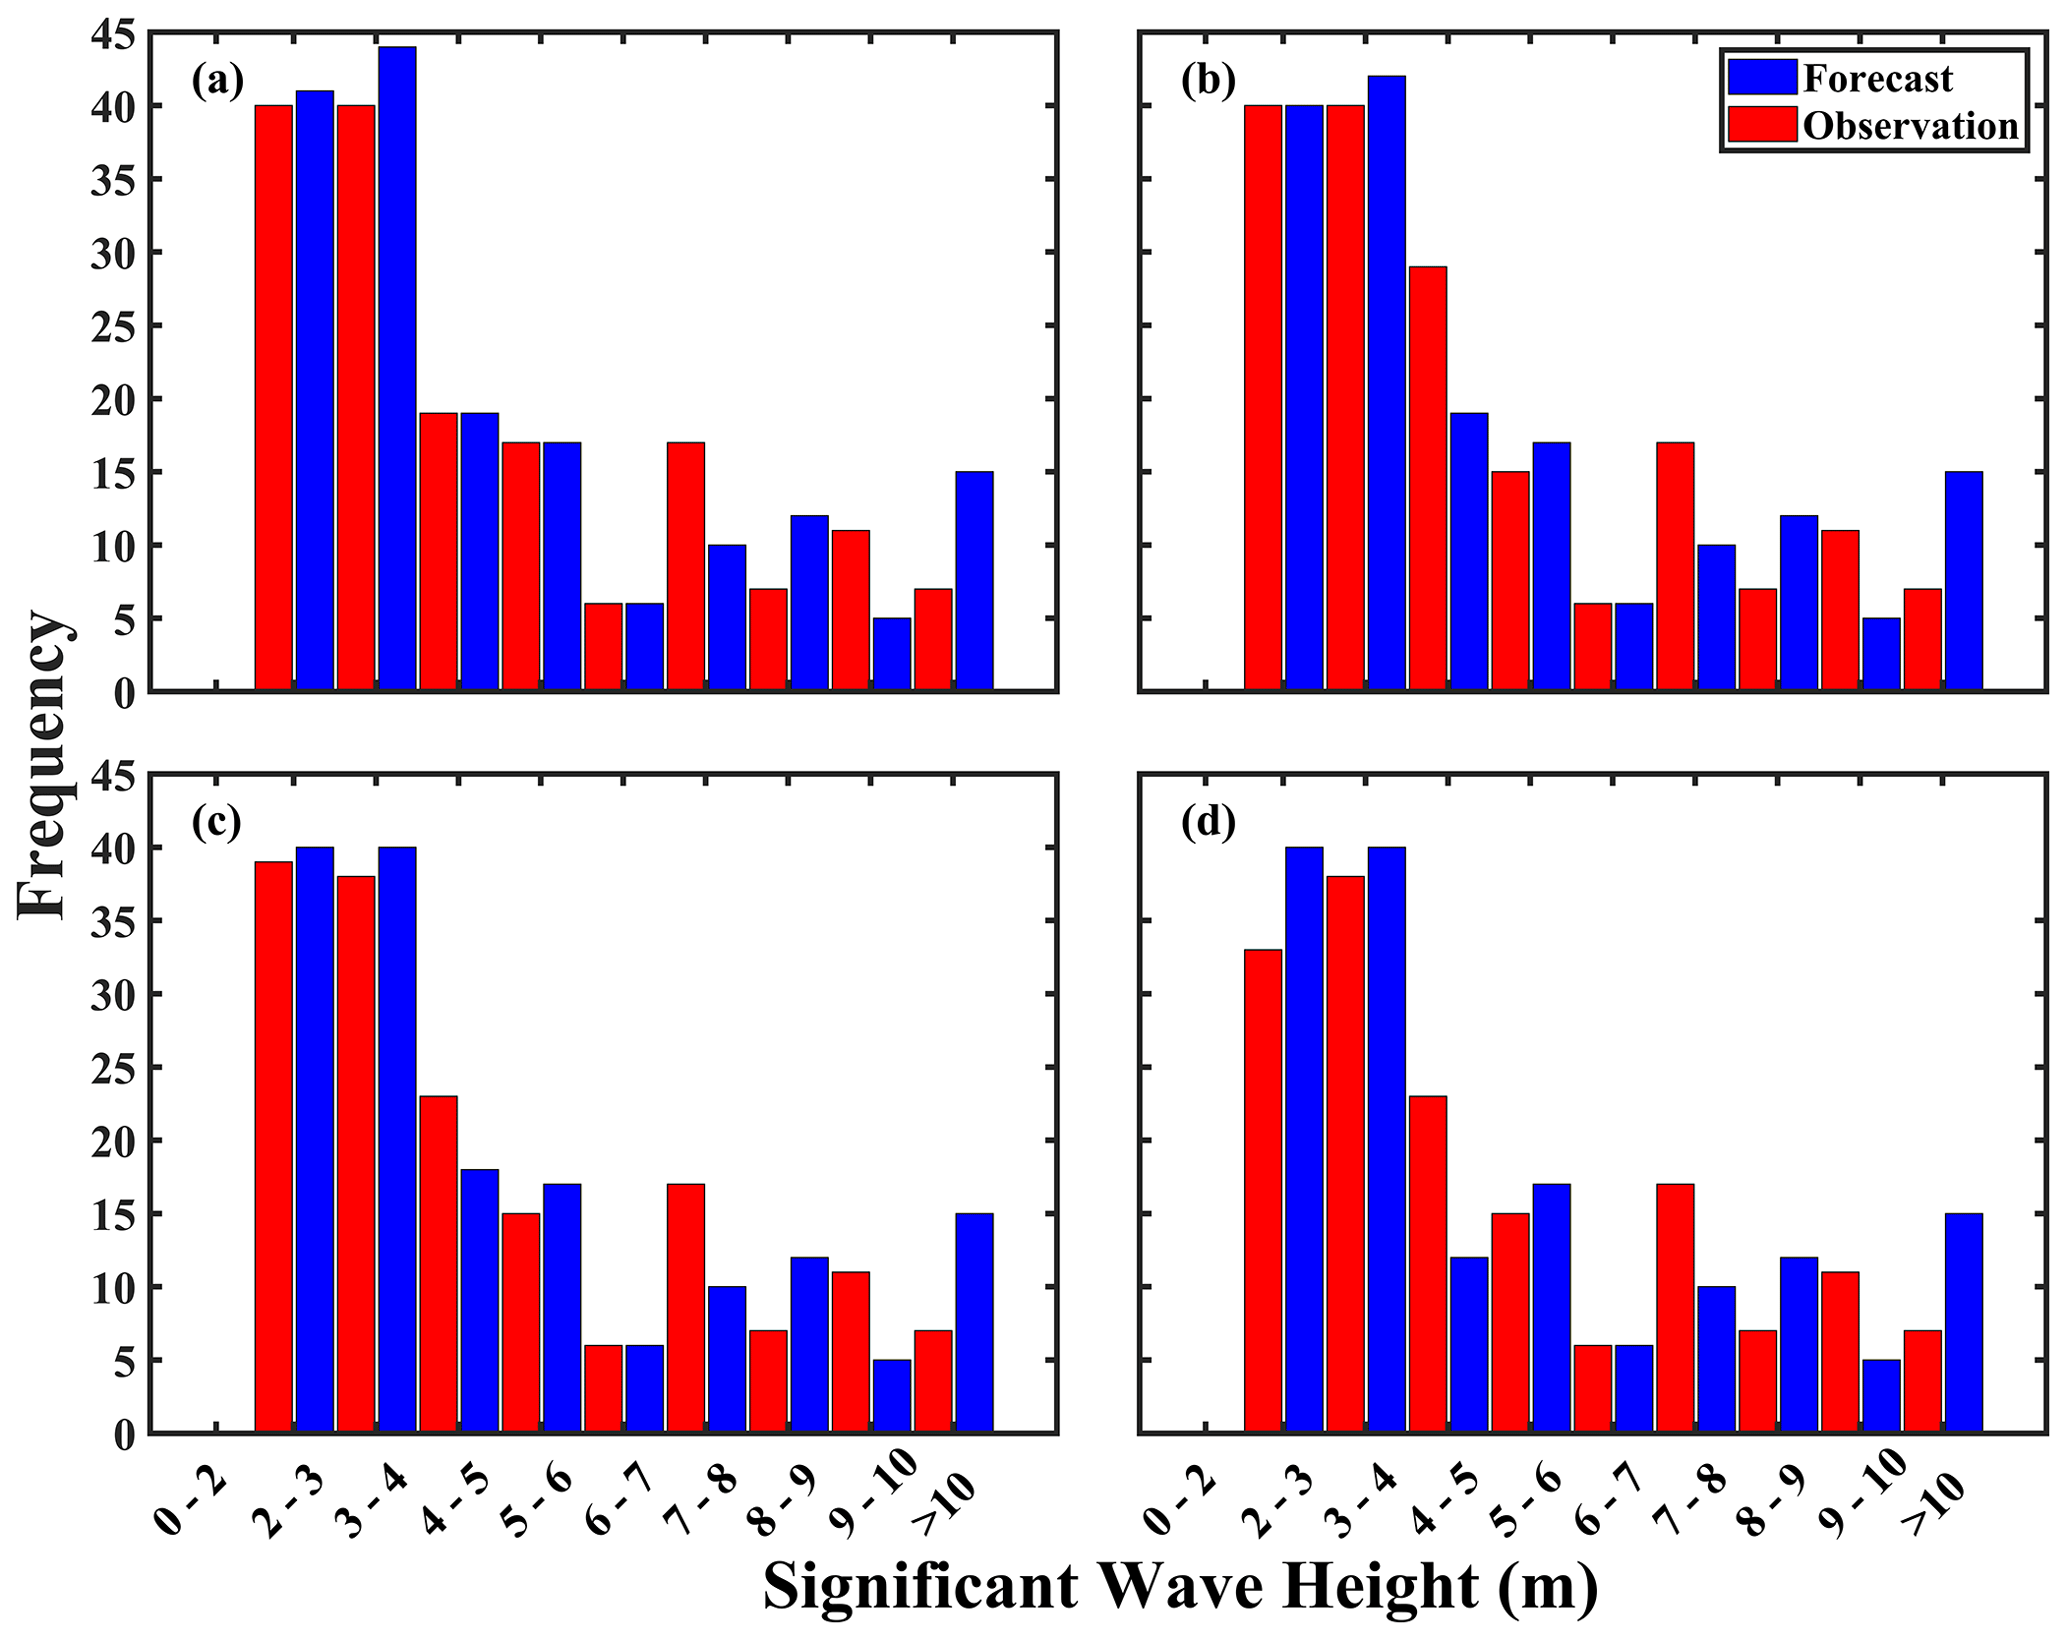
Figure 9Same as Fig. 7, but for Hurricane Igor (2010). Results for the 9 h forecast are presented in Fig. S4.
4.2.1 Total model performance
Overall forecast quality can be assessed through the statistical metrics of R, RMSE, and MAPE, with results for each hurricane illustrated graphically in Fig. 10. The full range of statistics is available in Table 3. In Fig. 10, it can be observed that regardless of hurricane, model forecast effectiveness (R) hovered near a perfect 1 but naturally deteriorated over time. By the 3 h horizon, the three cases diverged from one another in reflectance of each hurricane's characteristics. By the 12 h horizon, the model was able to maintain accuracies above 0.8 in the majority of cases, which demonstrates that the model remained highly effective at predictions over a 12 h time frame. Errors are also minimal: within a 6 h forecast, RMSEs in all cases can be maintained under 1 m, but this increases to just under 1.6 m after a further 6 h. Thus, it is suggested that short-range 0–6 h forecasts be prioritized over 12 h when precision rather than accuracy is required. Moreover, out of the hurricane cases, Hurricane Sandy's R performance decreased more rapidly than either Hurricane Dorian or Igor. This may be related to the hurricane's track through the central Caribbean Sea (Fig. 1). There, both the Caribbean low-level jet (CLLJ) and Caribbean Current flow in the atmosphere and ocean, respectively.
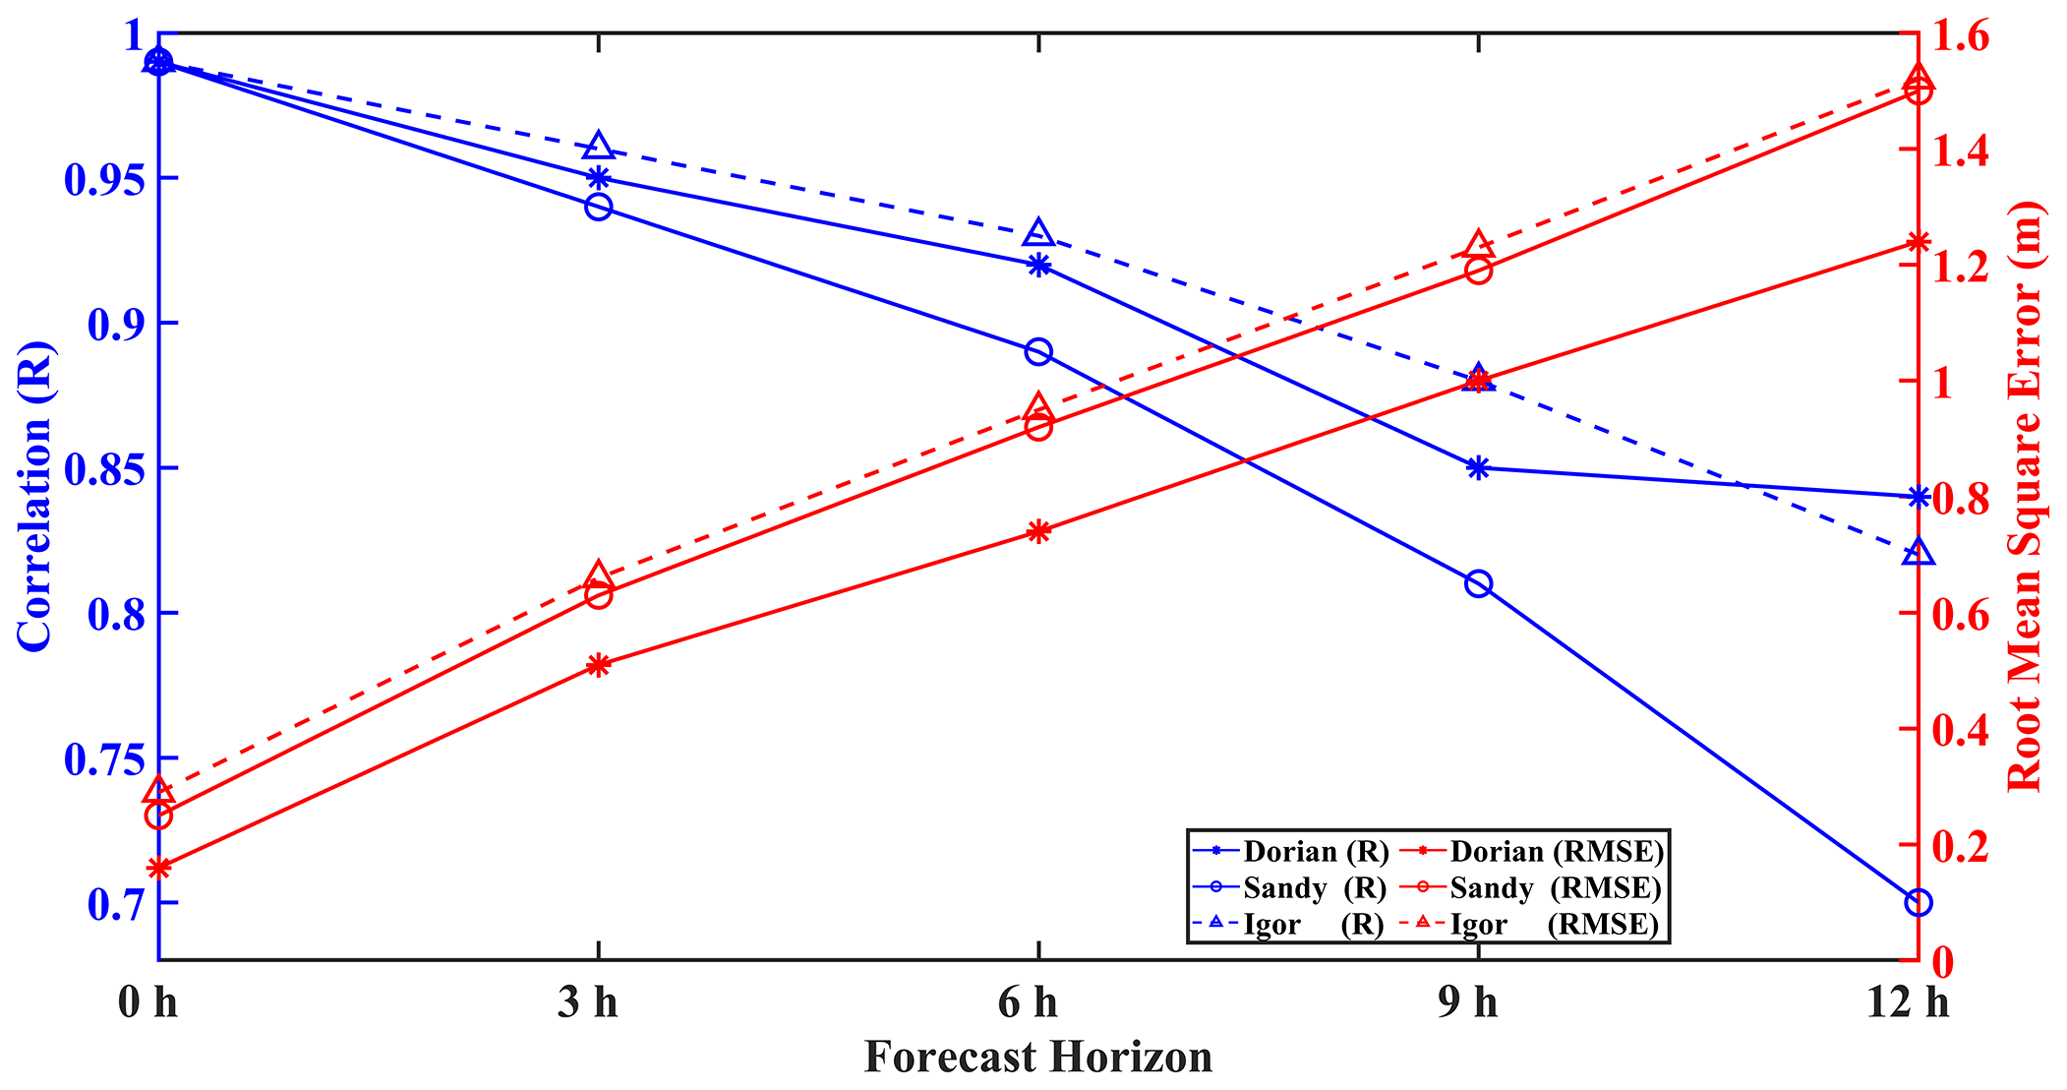
Figure 10LSTM model forecast performance in terms of R (blue) and RMSE (red) compared with the observations for Hurricanes Dorian, Sandy, and Igor.
It is thought that rather than Sandy's induced wave properties being affected by CLLJ, which would have its normal zonal (with the main axis at 15∘ N) flows disrupted by the hurricane itself, the Caribbean Current would undoubtedly have changed hurricane-induced wave properties. Wave–current interactions have been widely demonstrated to change surface wave properties in a variety of scenarios including, but not limited to, tidal flows (Hopkins et al., 2015), large-scale current structures such as the Loop Current, and eddies (Romero et al., 2017), as well as hurricane-induced wave interactions with large-scale currents (Sun et al., 2018; Hegermiller, et al., 2019), which is relevant for this discussion,. Unfortunately, as NDBC buoy 42 058 that measured the passing of Sandy does not possess surface current information, this hypothesis cannot be tested using the available dataset, nor can possible wave–current effects on hurricane wave field prediction be quantified. The rapid decrease in R observed for Sandy could possibly be related to surface-current-induced changes in the wave field not accounted for by the dual usage of wind speed and wave height as LSTM predictors for the wave height predictand.
In Fig. 11, the MAPE for each of the hurricanes is given. There, it can be observed that Hurricane Dorian had MAPE values of 2.6 % at the 0 h nowcast and values of 7.99 %, 10.83 %, 13.13 %, and 14.82 %, respectively, at the 3, 6, 9, and 12 h forecast horizons. By contrast, Hurricane Sandy (Igor) had MAPE values of 3.41 % (3.36 %), 9.15 % (9.53 %), 13.34 % (13.78 %), 17.55 % (17.70 %), and 22.08 % (21.88 %) at the 0, 3, 6, 9, and 12 h forecast horizons. Both Hurricanes Sandy and Igor had MAPE values approximately 67 % higher than that of Hurricane Dorian at the 12 h horizon.
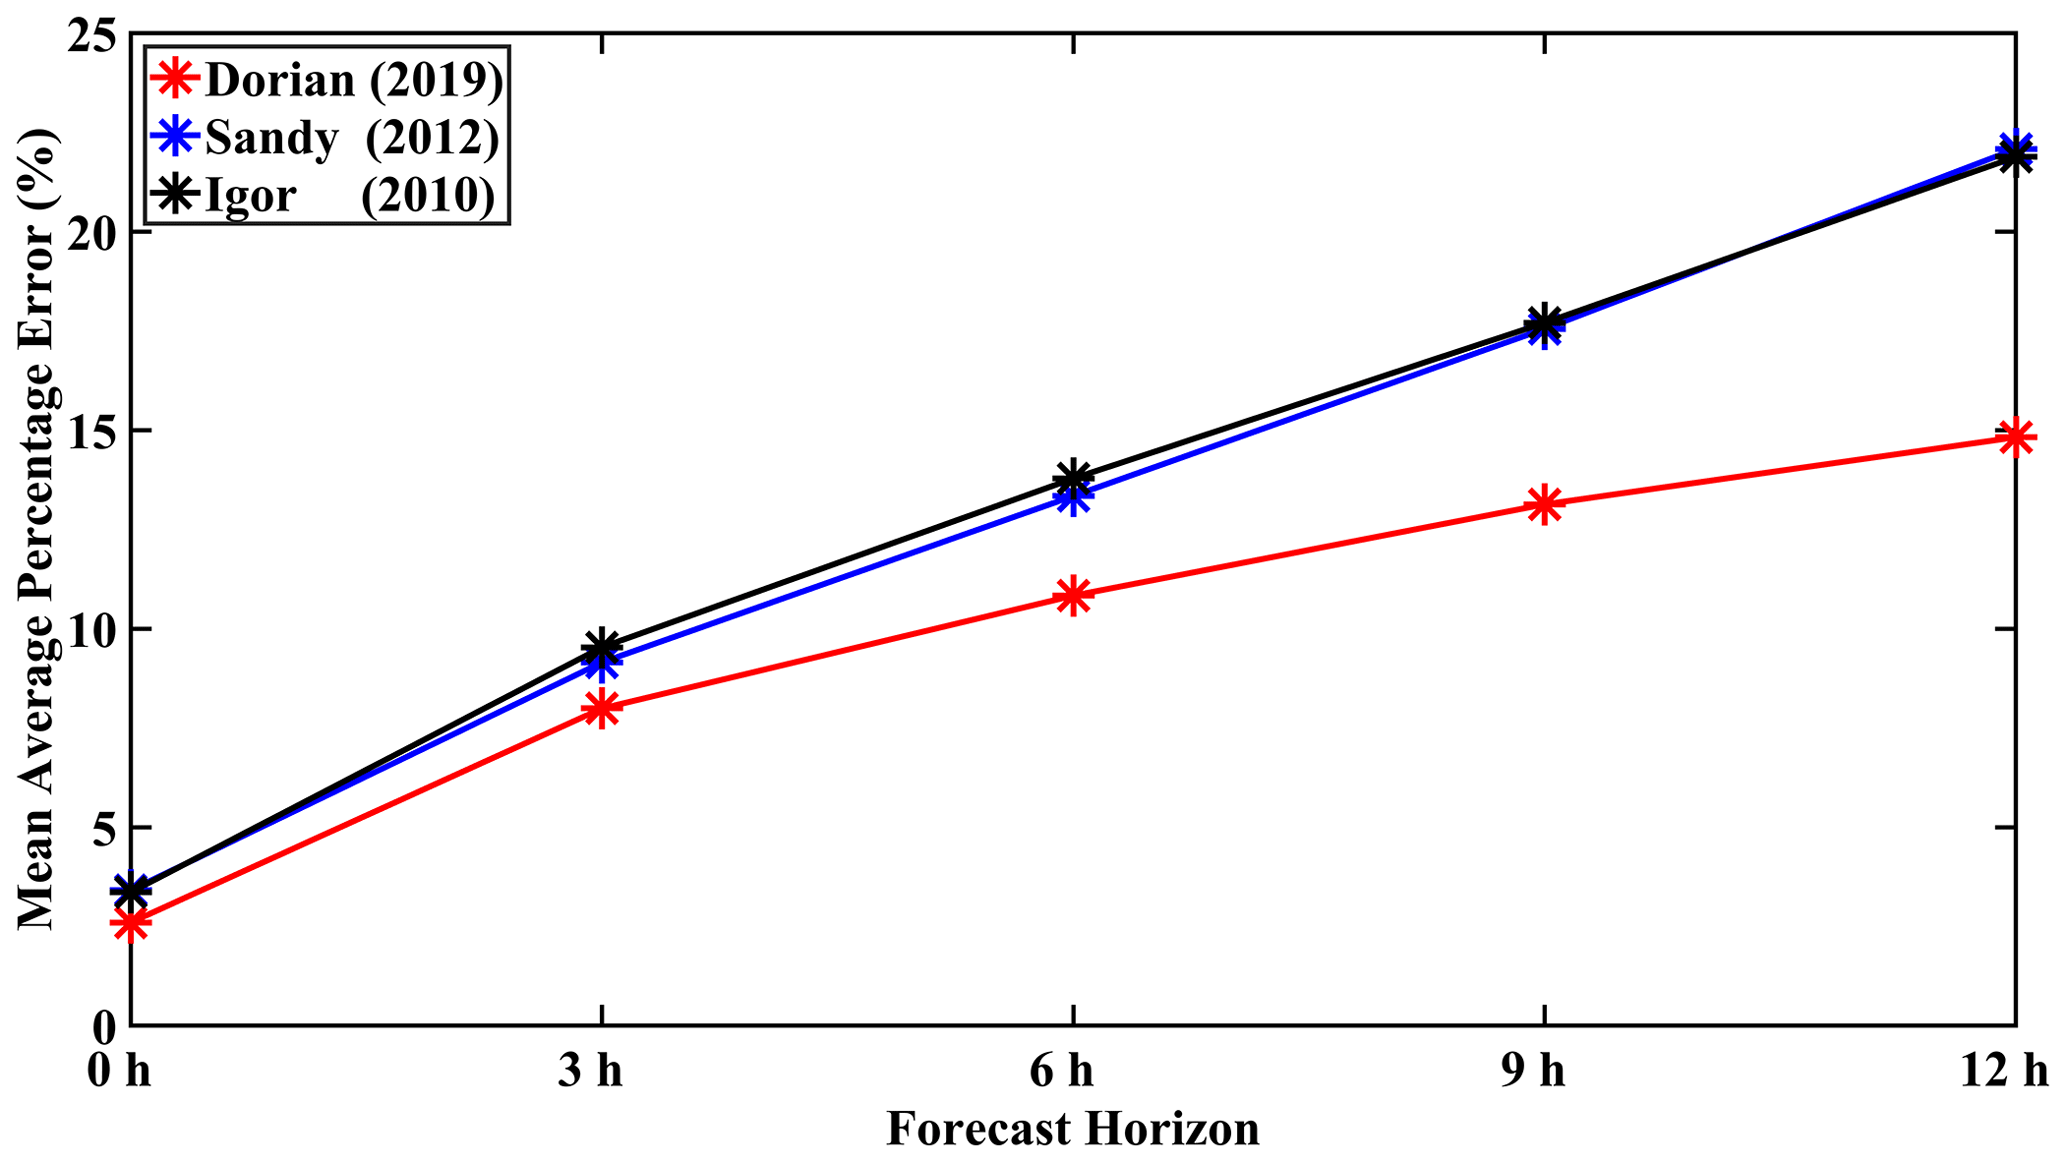
Figure 11Mean average percentage error (%) for Hurricanes Dorian (red), Sandy (blue), and Igor (black).
The difference in MAPE, in addition to the R and RMSE, may be due to the nature of Hurricane Dorian's time series of wave heights as the system approached NDBC buoy 41 010 (Figs. 1 and 3). Unlike Sandy or Igor for which wave heights gradually grew to a peak and then declined, Hurricane Dorian's profile was far more gradual, allowing LSTM to learn a comparatively much simpler pattern for forecasting. Indeed, unique to Hurricane Dorian, waves induced by the system were only observed after they would have affected and been affected by The Bahamas' continental shelf and its northern islands. As is well understood, islands induce extensive modulation of the oceanic wave field. The presence of islands may cause modifications to wave spectra, reductions in wave heights, and triggering of wave diffraction (Cao et al., 2018; Björkqvist et al., 2019; Passaro et al., 2021; Violante-Carvalho et al., 2021). Additionally, as seen for Hurricane Joaquin (2015) by Sahoo et al. (2018), nonlinear wave setup and set-down processes occurred when the system interacted with The Bahamas' varying coastal bathymetry, slope, and arching coastlines; these, in conjunction with Hurricane Dorian's inherent properties (i.e., its extremely slow translation speed of ∼1.4–2 m s−1), may have all played varying roles in the significantly lower variability in the pattern of wave growth at NDBC buoy 41 010.
Table 3LSTM forecast performance for Hurricanes Dorian, Sandy, and Igor.

4.3 LSTM model comparison
Under the influence of climate change, TCs are widely expected to occur more frequently and with greater ferocity (Chen et al., 2020; Kossin et al., 2020; Geiger et al., 2021). For the CS, the most recent and striking example of this phenomenon occurred during the 1 September 2019 landfall of Hurricane Dorian in The Bahamas (Zegarra et al., 2020), for which, in addition to damage caused by extremely strong winds and storm surge, hurricane-forced SWHs more than likely added to the damage. Thus, predicting these and other hurricane-forced wave events is of extreme importance, but for Caribbean and other SIDS around the world, these predictions should be of the highest accuracy and, where possible, precise, timely, and with minimum required computational expense and expertise (Bethel et al., 2021b). In Fig. 12, a comparison is made between the LSTM-nowcasted (0 h) SWH from Fig. 3a with SWAN simulations of the same period of time (for model description, see Bethel et al., 2021a) and the observations. Top left and bottom right insets present the position and wind speed of Hurricane Dorian at the start and end of the time series, respectively.
Primarily, the most significant feature in the comparison between SWAN-simulated and LSTM-nowcasted SWHs is that, with regards to the observations, LSTM nowcasts are far more accurate at reproducing the time series than SWAN. At the start of the time series (up to ∼30 h after 15:00 UTC on 1 September 2019), the discrepancy between the LSTM nowcast and observations is minimal, while SWAN simulations suggest wave heights of just under 2 m, though observations are just over 3 m. This is remarkable, as at that time, the storm was briefly stalled over The Bahamas but waves radiating out could still grow the SWH kilometers away at NDBC buoy 41 010. With wind speeds reaching and exceeding 80 m s−1, wave heights were just over twice the climatological mean. Following training by past hurricanes, LSTM nowcasts of Hurricane Dorian were very efficient at recreating the observed time series, but at this juncture, SWAN was very notably unable to do so. This may be potentially caused by the usage of low-spatial-resolution () WaveWatch III reanalysis to fill in gaps in buoy data (the “observations”), thus leading to wide deviations from the SWAN-simulated SWH that possesses a significantly higher spatial resolution (). This phenomenon, however, should not be used to suggest that SWAN simulations are inaccurate. Indeed, after the 30 h mark following 15:00 UTC on 1 September, as Hurricane Dorian had migrated away from The Bahamas and decreased in intensity, SWAN's capability to simulate SWHs dramatically increased, just as wave heights began to increase when the system's distance (and maximum wind speeds) from buoy 41 010 decreased. Though SWAN nevertheless overestimated wave height observations from 30–50 h after the start of the time series. Again, LSTM did a much better job at recreating the observations, but interestingly, after this point, LSTM and SWAN exactly match one another, though they both overestimate the observations. This is a common feature between the data- and physics-driven approaches at this time, and to resolve them, two different approaches are required. Firstly, as previously identified, the LSTM data-driven approach would require a few more examples of weaker storms to provide lower wave heights in the training dataset, and this may have a beneficial effect on minimizing overestimations. The physics-based SWAN model, by contrast, could be improved by advancing model-guiding physics (e.g., Aydoğan and Ayat, 2021), a better representation of the wind field (Christakos et al., 2020), or online coupling with an atmospheric model such as the Weather Research and Forecasting (WRF) model (Lim Kam Sian et al., 2020). It should be readily noted at this point that improving physics-based models require far greater computational resources and expertise than optimizing training sets for data-driven methods such as LSTM.
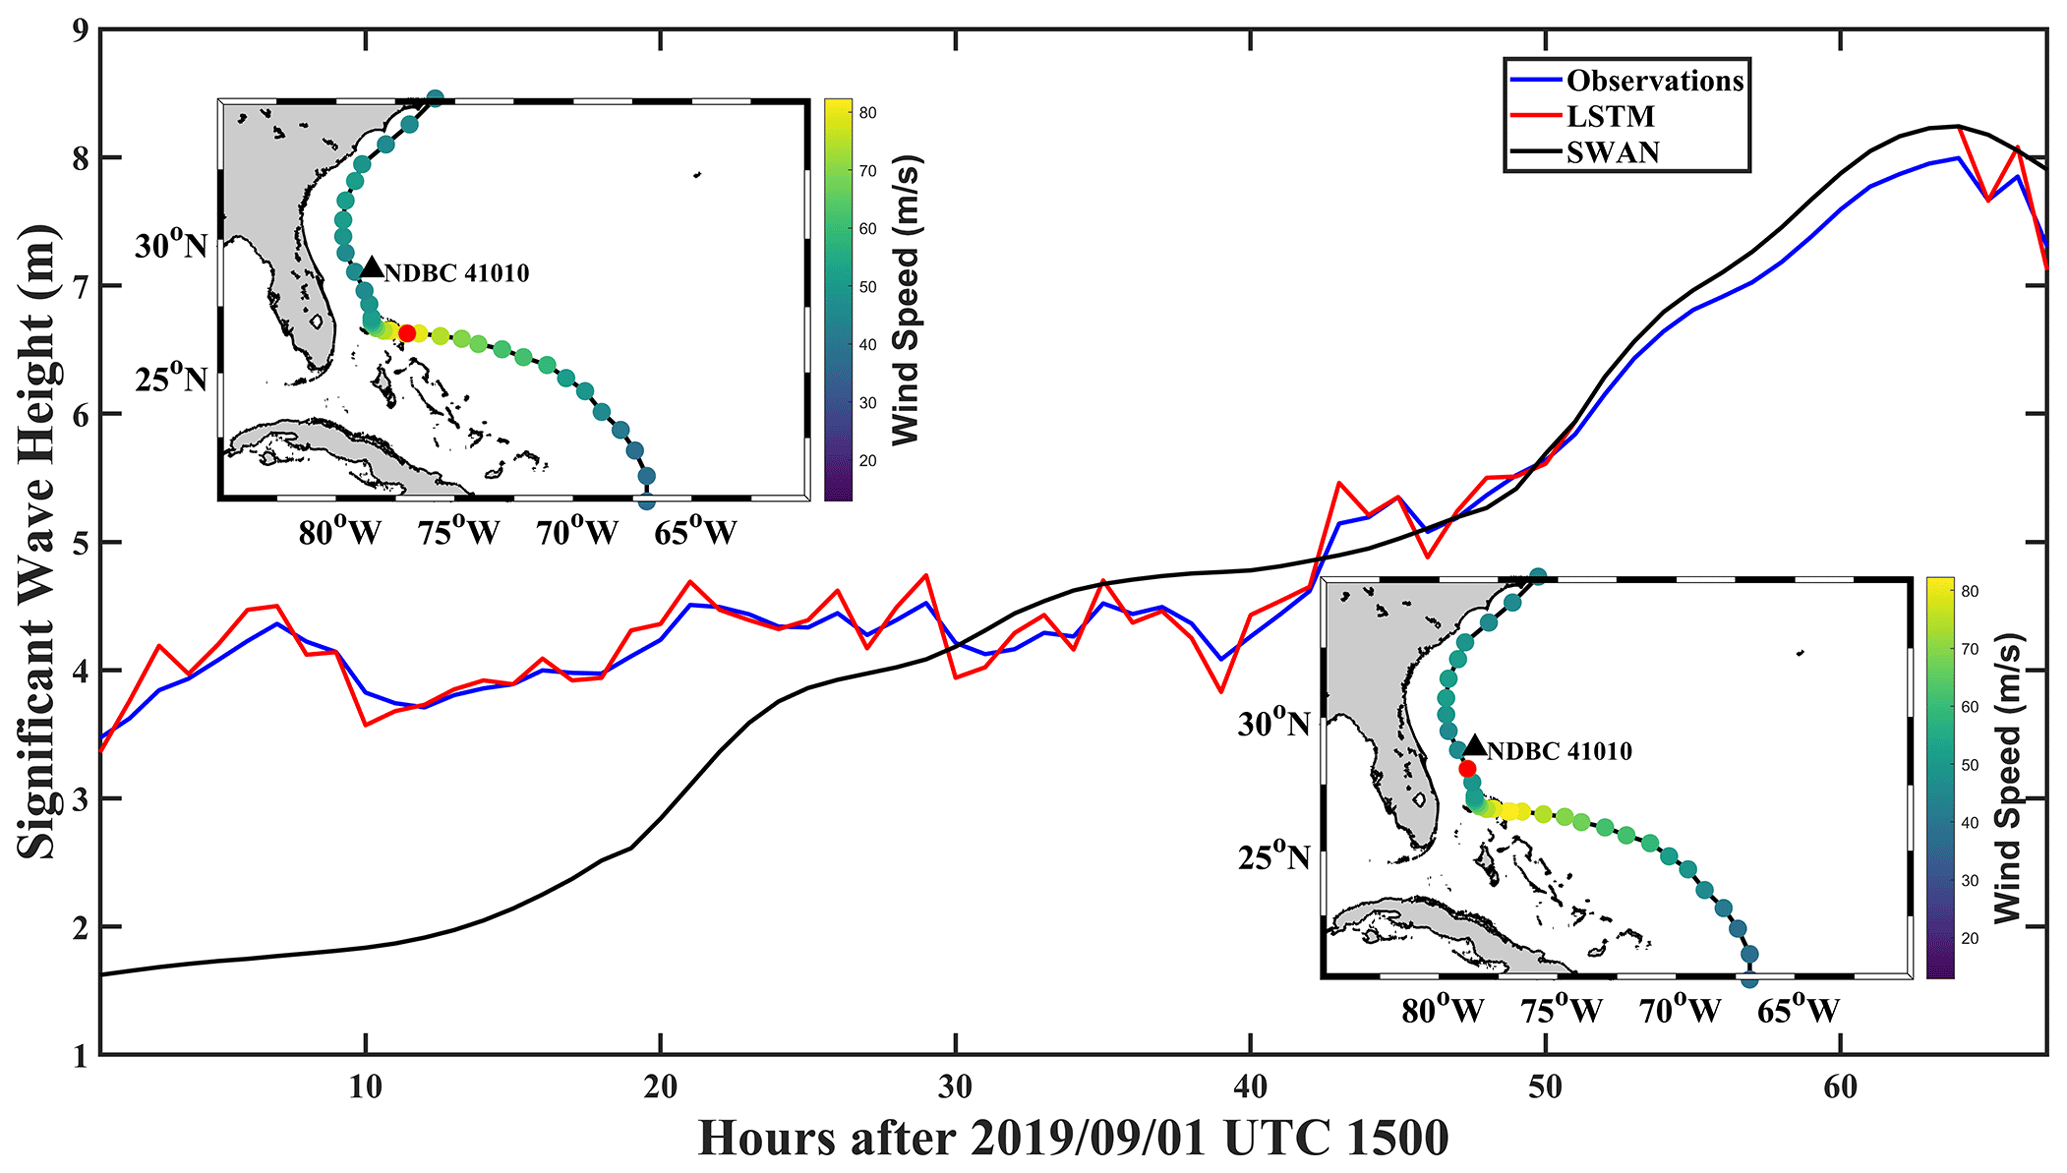
Figure 12Comparison of SWH observations (blue), LSTM nowcast (red), and SWAN simulations (black) during (top left inset) and after (bottom right inset) Hurricane Dorian's landfall in The Bahamas. Red dots indicate the location of Hurricane Dorian in either case.
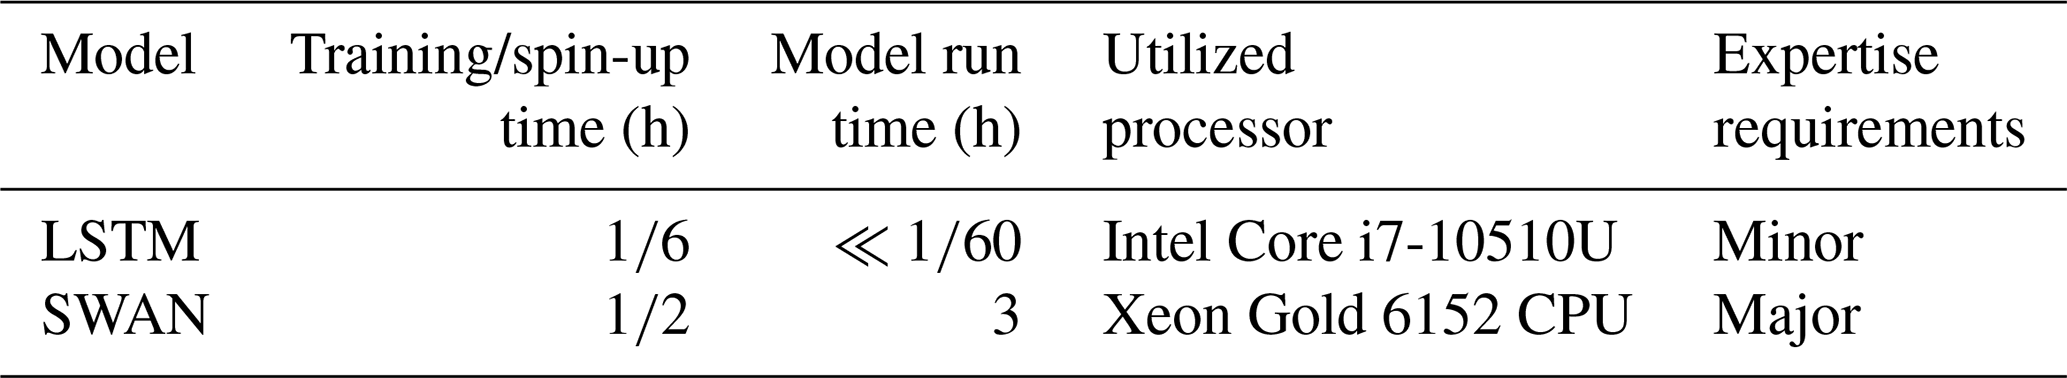
Demonstrating, a comparative analysis between LSTM and SWAN for SWH modeling is presented from the perspectives of required model training, spin-up, and run times, in addition to their system and expertise requirements (Table 4). It can be noted that model training for LSTM took approximately 10 min, while for SWAN, model spin-up took just over half an hour. From there, LSTM forecasts took under a second to complete in a personal-computer-based Python-language integrated development environment (PyCharm), while the full run of SWAN took 3 h on two Xeon Gold 6152 CPU processors using a modest 56 cores. The SWAN run must also be understood in the context of the time and expertise needed for preprocessing (i.e., preparing input wind fields, bathymetry, and boundary conditions), in addition to considerations of further modeler skill and experience for processing and postprocess. Though SWAN allows real-world physics to be considered and can thus provide a far greater array of variables to a high degree of accuracy with regards to observations, the CS and other SIDS around the world largely do not have either the required computational resources or human resources to use these and other numerical models. Data-driven methods such as LSTM should therefore be used to supplement existing forecasting tools considering their ease of use, accuracy, and low expertise and computational resource requirements.
This study presented a 1D case, but the work here is easily extended to a 2D case as shown by Zhou et al. (2021b). Therein, a ConvLSTM model was used on a GeForce RTX 2080 Ti graphics card for hurricane-forced SWH training and forecasting. Very high accuracies with regards to a WaveWatch III baseline were achieved. Crucially, the ConvLSTM model training took only 2 h and forecasting took just under 20 s, which easily outperforms SWAN (here) in terms of speed and could thus be a viable alternative to the pure usage of numerical wave models under both mean and extreme (i.e., TC-forced) wave conditions.
Forecasting hurricane activity and its properties remains a daunting task for the scientific community, but great strides have been made in the development of statistical–probabilistic methods, numerical models, and, as presented in this study, AI techniques. The results of this study are in strong agreement with those observed by Meng et al. (2021) and Wei (2021) that each found that AI was highly effective at predicting hurricane-induced SWHs. However, although contemporary applications of AI in the forecasting of both mean and extreme (i.e., TC-forced) wave states have relied traditionally on singular inputs of SWH (Ali and Prasad, 2019; Zhao and Wang, 2018; Zhou et al., 2021a, b), a growing body of literature has demonstrated that the addition of other variables such as wind speed (as done here), wind direction, and other variables improves forecast effectiveness (Kaloop et al., 2020; Zubier, 2020; Raj and Brown, 2021; Wang et al., 2021). Uncertainties in variable selection have also stimulated research into how to best identify predictors for the SWH or other predictands (Li and Liu, 2020; Li et al., 2021). These results nevertheless remain consistent with the findings of Chen and Wang (2020) wherein the introduction of meteorological data could improve wave forecasts, but longer forecast horizons led to underestimations of extreme wave heights.
Moreover, discrepancies in forecasting outcomes between hurricanes in this study are slight but noticeable. This may reflect differences in LSTM training and test hurricane properties. These include hurricane wind field, translation speed, approach angle, and track, which have been demonstrated to be essential factors in governing wave evolution (Zhang and Oey, 2018; Zhang and Li, 2019; Wang et al., 2020). For example, as a hurricane translated through the study area, wave properties in any of the four quadrants could have been measured by the chance intersection of the hurricane and its observing buoy (Zhang and Oey, 2018; Tamizi and Young, 2020; Tian et al., 2020; Collins et al., 2021). Thus, the model may have learned too much information from a particular quadrant. Consequently, when encountering a different quadrant in a forecasted hurricane, its results would naturally be poorer than if the model was trained solely on SWHs from quadrant A in training sets and forecasted quadrant A in the test set. Further experimentation would be required to identify the difference, if any, and magnitude of using data from a particular quadrant for a hurricane in the prediction of a different quadrant for a future hurricane. Another variable to consider, especially in the case of hurricanes in the CS given its numerous islands, is the morphology of the islands as they can have a strong influence on local ocean dynamics (Cheriton et al., 2021). For those hurricanes that made landfall in The Bahamas, additional consideration should be given to the nonlinear interactions that hurricane waves and storm surge have on the archipelago's narrow and steep carbonate shelf as well as its variability due to elongated coastlines (Sahoo et al., 2019). These can perhaps be dealt with by the special application of a combination of a high-order spectral method with Krylov subspace techniques as pioneered by Köllisch et al. (2018). Another set of examples comes from Puerto Rico and the US Virgin Islands (Joyce et al., 2019), as well as the shallow continental shelf between India and Sri Lanka (Sahoo et al., 2021). Consequently, training and test datasets certainly contain data from any of a hurricane's four quadrants or, in the case of Hurricanes Joaquin (2015) and Dorian, data recorded along The Bahamas' vulnerable, easternmost, Atlantic Ocean facing islands. In these terms, the effect of training data selection on overall forecast quality has yet to be quantified and should be assessed. Following this, fine-scale LSTM-based hurricane-forced SWH forecast models for a given CS country or territory could potentially benefit from increased discrimination in selecting hurricane training data.
Accompanying increased scrutiny in building LSTM training datasets to improve predictions, the usage of physics-based, informed, and/or infused versions of LSTM and other artificial intelligence and machine learning algorithms (Karniadakis et al., 2021; Zhang et al., 2021) may help to bridge the gap in forecasting efficacy between physics-based third-generation numerical wave models such as WaveWatch III or SWAN. Crucially, this will ensure that forecasting remains significantly computationally cheaper than the sole usage of wave models. These methods have been successfully applied to solving differential equations in engineering (Niaki et al., 2021; Zobeiry and Humfeld, 2021), analyzing blood flow (Arzani et al., 2021), and chaotic systems (Khodkar and Hassanzadeh, 2021). Relevant for the current discussion, these methods are also finding use in weather and climate modeling (Kashinath et al., 2021). Considering the large physical complexities in wave evolution under TC forcing (Tamizi et al., 2021) and the many nonlinearities that govern crucial processes (Yim et al., 2017; Constantin, 2018; Sharifineyestani and Tahvildari, 2021), incorporating physics-informed or knowledge-guided machine learning should improve and lengthen forecast efficacy and horizons, respectively.
Precise, computationally cheap, and rapid SWH forecasting under hurricane forcing is of immense value to safeguard lives, property, and economic development in coastal communities, especially SIDS. This study used surface wind speed and SWH forced by 17 hurricanes as input to the LSTM neural network to nowcast and forecast SWHs in the CS. Three hurricanes, Dorian (2019), Sandy (2012), and Igor (2010), were used as test cases. Results illustrated that the model was highly accurate at reproducing observed hurricane-forced wave height distributions in terms of both magnitude and frequency. However, there were discrepancies between observations and predictions. This was most easily observable from the comparison of observed and forecasted SWH time series for the three test cases.
In all cases, although the nowcasts naturally produced the best results, instances of slight underestimations and overestimations could nevertheless be observed for many fine-scale details. These underestimations and overestimations became more severe with increasing forecast horizon length. It has been demonstrated that wave height nowcasting (i.e., a forecast horizon of 0 h) is very effective; in the test cases of Hurricanes Dorian (2019), Sandy (2012), and Igor (2010), R (RMSE) was measured at 0.99 (0.16 m), 0.99 (0.25 m), and 0.99 (0.29 m), respectively. Corresponding values of MAPE for Dorian, Sandy, and Igor were measured at 2.6 %, 3.14 %, and 3.36 %, respectively. For forecast horizons of 3, 6, 9, and 12 h, with regards to observations, Dorian predictions produced R (RMSE; MAPE) values of 0.95 (0.51 m; 7.99 %), 0.92 (0.74 m; 10.83 %), 0.85 (1 m; 13.13 %), and 0.84 (1.24 m; 14.82 %), respectively. Similarly, with regards to observations, Sandy predictions produced R (RMSE; MAPE) values of 0.94 (0.63 m; 9.15 %), 0.89 (0.92 m; 13.34 %), 0.81 (1.19 m; 17.55 %), and 0.70 (1.51 m; 22.08 %), respectively. Igor predictions produced R (RMSE; MAPE) values of 0.96 (0.66 m; 9.53 %), 0.93 (0.95 m; 13.78 %), 0.88 (1.23 m; 17.70 %), and 0.82 (1.52 m; 21.88 %), respectively. In general, the model can provide forecasts with errors of 1 m within 6 h of lead time and an accuracy of greater than 80 % up to 12 h.
LSTM forecasts were also compared with a widely used third-generation model, SWAN, in terms of model accuracy, computational expense, and difficulty of usage. Using Hurricane Dorian as an example, the data-driven LSTM model was, over the short-range nowcast, far more accurate than SWAN. This is a trend widely observed in the literature (see Reikard and Rogers, 2011, for an excellent treatment on the subject). SWAN nevertheless was capable of simulating observed SWHs at the peak of the storm and achieved parity here with LSTM for a brief period of time, demonstrating that within narrow windows, LSTM can provide accurate estimations of hurricane-forced wave fields, but crucially at a much faster pace and cheaper computational costs. Despite this, the study is limited in four significant ways.
Firstly, identical to Meng et al. (2021), this study focused on forecasting hurricane-forced SWHs rather than mean states. Although a large number of hurricanes occurred over the study period, only a minority of these hurricanes were observed by buoys. Thus, the LSTM training datasets were severely limited in hurricane cases. This would have a significant effect on reducing forecast horizons and overall forecasting efficacy. A significantly expanded array of observational platforms in the Caribbean (i.e., both in situ buoys and remote sensing high-frequency coastal radars) would increase the likelihood of crucial hurricane wind–wave properties being observed at sufficiently high resolutions to make future research such as this possible. Secondly, and perhaps more importantly, as TCs and their properties rapidly evolve in space and time (Leroux et al., 2018; Bhalachandran et al., 2019; Chen et al., 2021), they naturally have great implications for the properties of waves they excite (Haryanto et al., 2021). If these properties change rapidly enough, LSTM alone would be unable to capture their characteristics. A recent study by Zhou et al. (2021b) demonstrated that an integrated EMD–LSTM model is more effective at forecasting rapidly evolving and large wave heights, but whether this remains true for hurricane-forced waves remains to be seen. Future research should investigate the efficacy of the EMD–LSTM model in forecasting hurricane-forced wave heights, and a ConvLSTM model fed with high-resolution wave data should be employed for two-dimensional hurricane-forced SWH. Thirdly, the selection of training and test sets would have an extremely strong impact on forecasting results. Specifically, Hurricanes Dorian, Sandy, and Igor were are all far more powerful than hurricanes within the training set. These were chosen as it is expected that due to climate change, hurricanes will not only become more frequent, but also more intense. The present method demonstrates that the model overestimates the highest SWHs of even those systems and should continue to be effective if hurricanes become even more extreme (and thus, the degree by which the current model overestimates maximum SWHs should decrease). However, if future systems are weaker than the test set (as it is now), the problem of overestimation would be exacerbated. Thus, a second model that is trained with hurricanes even weaker than the training set would be prudent and run in parallel to ensure both scenarios are considered in future disaster aversion strategies. Fourthly, LSTM phase shifting of forecasted time series and resultant lags, seen most notably in Hurricanes Sandy and Igor, are a problem that needs to be rectified before the model can be used in real-world, operational TC wave forecasting applications. Extensive research into the mathematical principles underlying LSTM should be conducted by SIDS in the CS and around the world to realize low-cost but high-accuracy forecasts.
Buoy datasets are provided by the National Data Buoy Center and can be accessed at https://www.ndbc.noaa.gov/ (last access: 10 July 2021) (National Data Buoy Center, 1971). Hurricane statistics can be acquired from the National Hurricane Center at http://www.nhc.noaa.gov/data/hurdat/hurdat2-format-atlantic.pdf (last access: 10 July 2021) (Landsea et al., 2015). WaveWatch III reanalysis data as provided by the Pacific Islands Observing System can be acquired at https://coastwatch.pfeg.noaa.gov/ (last access: 10 July 2021) (Cheung, 2013).
The supplement related to this article is available online at: https://doi.org/10.5194/os-18-419-2022-supplement.
BJB, WS, CD, and DW designed the experiments and BJB carried them out. BJB developed the model code and performed the simulations. BJB prepared the paper with contributions from all co-authors.
The contact author has declared that neither they nor their co-authors have any competing interests.
Publisher's note: Copernicus Publications remains neutral with regard to jurisdictional claims in published maps and institutional affiliations.
The National Data Buoy Center is greatly thanked for the continued maintenance of its buoy array in the Caribbean and for ensuring the public accessibility of its data. The National Hurricane Center is thanked for providing the hurricane statistics, and the Pacific Islands Ocean Observing System is thanked for providing WaveWatch III reanalysis data.
This research has been supported by the Southern Marine Science and Engineering Guangdong Laboratory (Guangzhou) (grant no. SML2020SP007) and the National Key Research and Development Program of China (grant nos. 2017YFA0604100, 2016YFC1402004, and 2017YFC1404200).
This paper was edited by Andrew Moore and reviewed by two anonymous referees.
Ali, M. and Prasad, R.: SWH forecasting via an extreme learning machine model integrated with improved complete ensemble empirical mode decomposition, Renew. Sustain. Energy Rev., 104, 281–295, https://doi.org/10.1016/j.rser.2019.01.014, 2019.
Alina, A. I., Rusu, L., and Catalin, A.: Nearshore Wave Dynamics at Mangalia Beach Simulated by Spectral Models, J. Mar. Sci. Eng., 7, 206, https://doi.org/10.3390/jmse7070206, 2019.
Allahdadi, M. N., He, R., and Neary, V. S.: Predicting ocean waves along the US east coast during energetic winter storms: sensitivity to whitecapping parameterizations, Ocean Sci., 15, 691–715, https://doi.org/10.5194/os-15-691-2019, 2019.
Arzani, A., Wang, J., and D'Souza, R. M.: Uncovering near-wall blood flow from sparse data with physics-informed neural networks, Phys. Fluids, 33, 071905, https://doi.org/10.1063/5.0055600, 2021.
Avila-Alonso, D., Baetens, J. M., Cardenas, R., and De Baets, B.: Oceanic response to the consecutive Hurricanes Dorian and Humberto (2019) in the Sargasso Sea, Nat. Hazards Earth Syst. Sci., 21, 837–859, https://doi.org/10.5194/nhess-21-837-2021, 2021.
Aydoğan, B. and Ayat, B.: Performance evaluation of SWAN ST6 physics forced by ERA5 wind fields for wave prediction in an enclosed basin, Ocean Eng., 240, 109936, https://doi.org/10.1016/j.oceaneng.2021.109936, 2021.
Babanin, A. V., Rogers, W. E., and de Camargo, R.: Waves and Swells in High Wind and Extreme Fetches, Measurements in the Southern Ocean, Front. Mar. Sci., 6, 361, https://doi.org/10.3389/fmars.2019.00361, 2019.
Bethel, B. J., Dong, C., Zhou, S., and Cao, Y.: Bidirectional Modeling of Surface Winds and Significant Wave Heights in the Caribbean Sea, J. Mar. Sci. Eng., 9, 547, https://doi.org/10.3390/jmse9050547, 2021a.
Bethel, B. J., Dong, C., and Wang, J.: An Empirical Wind-Wave Model for Hurricane-forced Wind Waves in the Caribbean Sea, Earth Space Sci., 8, e2021EA001956, https://doi.org/10.1029/2021EA001956, 2021b.
Bhalachandran, S., Nadimpalli, R., Osuri, K.K., Marks Jr., F.D., Gopalakrishnan, S., Subramanian, S., Mohanty, U. C., and Niyogi, D.: On the processes influencing rapid intensity changes of tropical cyclones over the Bay of Bengal, Sci. Rep., 9, 3382, https://doi.org/10.1038/s41598-019-40332-z, 2019.
Björkqvist, J.-V., Pettersson, H., and Kahma, K. K.: The wave spectrum in archipelagos, Ocean Sci., 15, 1469–1487, https://doi.org/10.5194/os-15-1469-2019, 2019.
Cao, Y., Dong, C., Uchiyama, Y., Wang, J., and Yin, X.: Multiple-Scale Variations of Wind-Generated Waves in the Southern California Bight, J. Geophys. Res.-Oceans, 123, 9340–9356, https://doi.org/10.1029/2018JC014505, 2018.
Campos, R. M., Costa, M. O., Almeida, F., and Guedes Soares, C.: Operational Wave Forecast Selection in the Atlantic Ocean Using Random Forests, J. Mar. Sci. Eng., 9, 298, https://doi.org/10.3390/jmse9030298, 2021.
Cecilio, R. O. and Dillenburg, S. R.: An ocean wind-wave climatology for the Southern Brazilian Shelf, Part 1: Problem presentation and model validation, Dyn. Atmos. Oceans, 89, 101101, https://doi.org/10.1016/j.dynatmoce.2019.101101, 2020.
Chao, Y., Huang, H., Wang, D., Liu, Y., and Guo, Z.: The Characteristics of Storm Wave Behavior and Its Effect on Cage Culture Using the ADCIRC+SWAN Model in Houshui Bay, China, J. Ocean Univ. China, 19, 307–319, https://doi.org/10.1007/s11802-020-3941-3, 2020.
Chen, J, Wang, Z., Tam, C., Lau, N., Lau, D. D., and Mok, H.: Impacts of climate change on tropical cyclones and induced storm surges in the Pearl River Delta region using pseudo-global-warming method, Sci. Rep., 10, 1965, https://doi.org/10.1038/s41598-020-58824-8, 2020.
Chen, T.: Probabilistic forecasting of coastal wave height during typhoon warning period using machine learning methods, Hydroinformatics, 21, 343–358, https://doi.org/10.2166/hydro.2019.115, 2019.
Chen, S. and Wang, Y.: Improving Coastal Ocean Wave Height Forecasting during Typhoons by using Local Meteorological and Neighboring Wave Data in Support Vector Regression Models, J. Mar. Sci. Eng., 8, 149, https://doi.org/10.3390/jmse8030149, 2020.
Chen, J., Pillai, A. C., Johanning, L., and Ashton, I.: Using machine learning to derive spatial wave data: A case study for a marine energy site, Environ. Model. Softw., 142, 105066, https://doi.org/10.1016/j.envsoft.2021.105066, 2021.
Chen, Y., Gao, S., Li, X., and Shen, X.: Key Environmental Factors for Rapid Intensification of the South China Sea Tropical Cyclones, Front. Earth Sci., 8, 609727, https://doi.org/10.3389/feart.2020.609727, 2021.
Cheriton, O. M., Storlazzi, C. D., Rosenberger, K. J., Sherman, C. E., and Schmidt, W. E.: Rapid observations of ocean dynamics and stratification along a steep island coast during Hurricane María, Sci. Adv., 7, eabf1552, https://doi.org/10.1126/sciadv.abf1552, 2021.
Cheung, K. F.: WaveWatch III (WW3) Samoa Regional Wave Model, 1 January – 31 December, 2019, Distributed by the Pacific Islands Ocean Observing System (PacIOOS) [data set], https://coastwatch.pfeg.noaa.gov/ (last access: 10 July 2021), 2013.
Choi, J. K. and Lee, B.: Combining LSTM Network Ensemble via Adaptive Weighting for Improved Time Series Forecasting, Math. Probl. Eng., 2018, 2470171, https://doi.org/10.1155/2018/2470171, 2018.
Collins, C., Hesser, T., Rogowski, P., and Merrifield, S.: Altimeter Observations of Tropical Cyclone-generated Sea States: Spatial Analysis and Operational Hindcast Evaluation, J. Mar. Sci. Eng., 9, 216, https://doi.org/10.3390/jmse9020216, 2021.
Constantin, A.: Nonlinear water waves: introduction and overview, Philos. T. Roy. Soc. A, 376, L20170310, https://doi.org/10.1098/rsta.2017.0310, 2018.
Christakos, K., Furevik, B. R., Aarnes, O. J., Breivik, Ø., Tuomi, L., and Byrkjedal, Ø.: The importance of wind forcing in fjord wave modelling, Ocean Dyn., 70, 57–75, https://doi.org/10.1007/s10236-019-01323-w, 2020.
Drost, E., Lowe, R., Ivey, G., Jones, N. L., and Pequignet, C.: The Effects of Tropical Cyclone Characteristics on the Surface Wave Fields in Australia's North West Region, Cont. Shelf Res., 139, 35–53, https://doi.org/10.1016/j.csr.2017.03.006, 2017.
Fan, S., Xiao, N., and Dong, S.: A novel model to predict SWH based on long short-term memory network, Ocean Eng., 205, 107298, https://doi.org/10.1016/j.oceaneng.2020.107298, 2020.
Gao, S., Huang, J., Liu, G., Bi, F., and Bai, Z.: A forecasting model for wave heights based on a long short-term memory neural network, Acta Oceanol. Sin., 40, 62–69, https://doi.org/10.1007/s13131-020-1680-3, 2021.
Geiger, T., Gütshow, J., Bresch, D. N., Emmanuel, K., and Frieler, K.: Double benefit of limiting global warming for tropical cyclone exposure, Nat. Clim. Change, 11, 861–866, https://doi.org/10.1038/s41558-021-01157-9, 2021.
Golbazi, M. and Archer, C. L.: Methods to Estimate Surface Roughness for Offshore Wind Energy, Adv. Meteorol., 2019, 1–15, https://doi.org/10.1155/2019/5695481, 2019.
Guan, X.: Wave height prediction based on CNN-LSTM, 2020 2nd International Conference on Machine Learning, Big Data and Business Intelligence (MLBDBI), 23–25 October 2020, Taiyuan, China, https://doi.org/10.1109/MLBDBI51377.2020.00009, 2020.
Guo, Y., Hou, Y., Liu, Z., and Du, M.: Risk Prediction of Coastal Hazards Induced by Typhoon: A Case Study in the Coastal Region of Shenzhen, China, Remote Sens., 12, 1731, https://doi.org/10.3390/rs12111731, 2020.
Hatzikyriakou, A. and Lin, N.: Simulating storm surge waves for structural vulnerability estimation and flood hazard mapping, Nat. Hazard, 89, 939–962, https://doi.org/10.1007/s11069-017-3001-5, 2017.
Haryanto, Y. D., Riama, N. F., Purnama, D. R., and Sigalingging, A. D.: The Effect of the Difference in Intensity and Track of Tropical Cyclone on Significant Wave Height and Wave Direction in the Southeast Indian Ocean, World Sci. J., 2021, 5492048, https://doi.org/10.1155/2021/5492048, 2021.
Hegermiller, C. A., Warner, J. C., Olabarreita, M., and Sherwood, C. R.: Wave-Current Interaction between Hurricane Matthew Wave Fields and the Gulf Stream, J. Phys. Oceanogr., 49, 2283–2900, https://doi.org/10.1175/JPO-D-19-0124.1, 2019.
Hochreiter, S. and Schmidhuber, J.: Long Short-term Memory, Neural Comput., 9, 1735–1780, https://doi.org/10.1162/neco.1997.9.8.1735, 1997.
Hopkins, J., Elgar, S., and Raubenheimer, B.: Observations and model simulations of wave-current interaction on the inner shelf, J. Geophys. Res.-Oceans, 121, 198–208, https://doi.org/10.1002/2015JC010788, 2015.
Hu, Y., Shao, W., Wei, Y., and Zuo, J.: Analysis of Typhoon-Induced Waves along Typhoon Tracks in the Western North Pacific Ocean, 1998–2017, J. Mar. Sci. Eng., 8, 521, https://doi.org/10.3390/jmse8070521, 2020.
Hu, H., van der Westhuysen, A. J., Chu, P., and Fujisaki-Manome, A.: Predicting Lake Erie wave heights and periods using XGBoost and LSTM, Ocean Model., 164, 101832, https://doi.org/10.1016/j.ocemod.2021.101832, 2021.
Huang, W. and Dong, S.: Improved short-term prediction of SWH by decomposing deterministic and stochastic components, Renew. Energy, 177, 743–758, https://doi.org/10.1016/j.renene.2021.06.008, 2021.
Hwang, P. A. and Fan, Y.: Effective Fetch and Duration of Tropical Cyclone Wind Fields Estimated from Simultaneous Wind and Wave Measurements: Surface Wave and Air-Sea Exchange Computation, J. Phys. Ocean., 47, 447–470, https://doi.org/10.1175/JPO-D-16-0180.1, 2017.
Jörges, C., Berbenbrink, C., and Stumpe, B.: Prediction and reconstruction of ocean wave heights based on bathymetric data using LSTM neural networks, Ocean Eng., 232, 109046, https://doi.org/10.1016/j.oceaneng.2021.109046, 2021.
Joyce, B. R., Gonzalez-Lopez, J., Van der Westhuysen, A. J., Yang, D., Pringle, J., Westerink, J. J., and Cox, A. T.: U.S. IOOS Coastal and Ocean Modeling Testbed: Hurricane-Induced Winds, Waves, and Surge for Deep Ocean, Reef-Fringed Islands in the Caribbean, J. Geophys. Res.-Oceans, 124, 2876–2907, https://doi.org/10.1029/2018JC014687, 2019.
Kaji, D., Watanabe, K., and Kobayashi, M.: Multi-Decoder RNN Autoencoder Based on Variational Bayes Method, 2020 International Joint Conference on Neural Networks (IJCNN), 19–24 July 2020, 1–8, https://doi.org/10.1109/IJCNN48605.2020.9206686, 2020.
Kaloop, M. R., Beshr, A. A. A., Zarzoura, F., Ban, W. H., and Hu, J. W.: Predicting lake wave height based on regression classification and multi input-single output soft computing models, Arab. J. Geosci., 13, 591, https://doi.org/10.1007/s12517-020-05498-1, 2020.
Karniadakis, G. E., Kevrekidis, I. G., Lu, L., Perdikaris, P., Wang, S., and Yang, L.: Physics-informed machine learning, Nat. Rev. Phys., 3, 422–440, https://doi.org/10.1038/s42254-021-00314-5, 2021.
Kashinath, K., Mustafa, M., and Albert, A.: Physicsinformed machine learning: case studies for weather and climate modelling, Philos. T. Roy. Soc. A, 379, 20200093, https://doi.org/10.1098/rsta.2020.0093, 2021.
Khodkar, M. A. and Hassanzadeh, P.: A data-driven, physics-informed framework for forecasting the spatiotemporal evolution of chaotic dynamics with nonlinearities modeled as exogenous forcing, J. Comput. Phys., 440, 110412, https://doi.org/10.1016/j.jcp.2021.110412, 2021.
Kim, K., Lee, J., Roh, M., Han, K., and Lee, G.: Prediction of Ocean Weather Based on Denoising AutoEncoder and Convolutional LSTM, J. Mar. Sci. Eng., 8, 805, https://doi.org/10.3390/jmse8100805, 2020.
Köllisch, N., Behrendt, J., Klein, M., and Hoffmann, N.: Nonlinear real time prediction of ocean surface waves, Ocean Eng., 157, 387–400, https://doi.org/10.1016/j.oceaneng.2018.03.048, 2018.
Kossin, J. P., Knapp, K. R., Olander, T. L., and Velden, C. S.: Global increase in major tropical cyclone exceedance probability over the past four decades, P. Natl. Acad. Sci. USA, 117, 11975–11980, https://doi.org/10.1073/pnas.1920849117, 2020.
Landsea, C., Franklin, J., and Beven, J.: The revised Atlantic hurricane database (HURDAT2), National Hurricane Center [data set], http://www.nhc.noaa.gov/data/hurdat/hurdat2-format-atlantic.pdf, (last access: 10 July 2021), 2015.
Leroux, D., Wood, K., Elsberry, R. L., Cayanan, E. O., Hendricks, E., Kucas, M., Otto, P., Rogers, R., Sampson, B., and Yu, Z.: Recent Advances in Research and Forecasting of Tropical Cyclone Track, Intensity, and Structure at Landfall, Tropic. Cyclone Res. Rev., 7, 85–105, https://doi.org/10.6057/2018TCRR02.02, 2018.
Li, M. and Liu, K.: Probabilistic Prediction of SWH Using Dynamic Bayesian Network and Information Flow, Water, 12, 2075, https://doi.org/10.3390/w12082075, 2020.
Li, M., Zhang, R., and Liu, K.: A New Marine Disaster Assessment Model Combining Bayesian Network with Information Diffusion, J. Mar. Sci. Eng., 9, 640, https://doi.org/10.3390/jmse9060640, 2021.
Lim Kam Sian, K. T. C., Dong, C., Liu, H., Wu, R., and Zhang, R.: Effects of Model Coupling on Typhoon Kalmaegi (2014) Simulation in the South China Sea, Atmosphere, 11, 432, https://doi.org/10.3390/atmos11040432, 2020.
Liu, L. L., Wang, W., and Huang, R. X.: The Mechanical Energy Input to the Ocean Induced by Tropical Cyclones, J. Phys. Ocean., 38, 1253–1266, https://doi.org/10.1175/2007JPO3786.1, 2008.
Marsooli, R. and Lin, N.: Numerical Modeling of Historical Storm Tides and Waves and Their Interactions Along the U.S. East and Gulf Coasts, J. Geophys. Res.-Oceans, 123, 3844–3874, https://doi.org/10.1029/2017JC013434, 2018.
Masoomi, H., van de Lindt, J. W., Ameri, M. R., Do, T., and Webb, B.: Combined Wind-Wave-Surge Hurricane-Induced Damage Prediction for Buildings, J. Struct. Eng., 145, 04018227, https://doi.org/10.1061/(ASCE)ST.1943-541X.0002241, 2018.
Meng, F., Song, T., Xu, D., Xie, P., and Li, Y.: Forecasting tropical cyclone wave height using bidirectional gated recurrent unit, Ocean Eng., 234, 108795, https://doi.org/10.1016/j.oceaneng.2021.108795, 2021.
Morgenstern, T., Pahner, S., Mietrach, R., and Shütze, N.: Flood forecasting in small catchments using deep learning LSTM networks, EGU General Assembly, EGU21-15072, https://doi.org/10.5194/egusphere-egu21-15072, 2021.
National Data Buoy Center: Meteorological and oceanographic data collected from the National Data Buoy Center Coastal-Marine Automated Network (C-MAN) and moored (weather) buoys, Moored Buoys, NOAA National Centers for Environmental Information [data set], https://www.ndbc.noaa.gov/ (last access: 10 July 2021), 1971.
Niaki, S. A., Haghighat, E., Campbell, T., Poursartip, A., and Vaziri, R.: Physics-informed neural network for modelling the thermochemical curing process of composite-tool systems during manufacture, Comput. Methods Appl. Mech. Eng., 384, 113959, https://doi.org/10.1016/j.cma.2021.113959, 2021.
Passaro, M., Hemer, M. A., Quartly, G. D., Scwatke, C., Dettmering, D., and Seitz, F.: Global coastal attenuation of wind-waves observed with radar altimetry, Nat. Commun., 12, 3812, https://doi.org/10.1038/s41467-021-23982-4, 2021.
Qiao, C. and Myers, A. T.: Modeling Spatio-Temporal Characteristics of Metocean Conditions During Hurricanes Using Deep Neural Networks, ASME, 2020 39th International Conference on Ocean, Offshore and Arctic Engineering, 3–7 August, https://doi.org/10.1115/OMAE2020-18989, 2020.
Qiao, C. and Myers, A. T.: Surrogate modeling of time-dependent 80 metocean conditions during hurricanes, Nat. Hazards, 110, 1545–1563, https://doi.org/10.1007/s11069-021-05002-2, 2022.
Raj, N. and Brown, J.: An EEMD-BiLSTM Algorithm Integrated with Boruta Random Forest Optimiser for SWH Forecasting along Coastal Areas of Queensland, Australia, Remote Sens., 13, 1456, https://doi.org/10.3390/rs13081456, 2021.
Reikard, G. and Rogers, W. E.: Forecasting ocean waves: Comparing a physics-based model with statistical methods, Coast. Eng., 58, 409–416, https://doi.org/10.1016/j.coastaleng.2010.12.001, 2011.
Rollano, F. T., Brown, A., and Ellenson, A.: Breaking waves in deep water: measurements and modeling of energy dissipation, Ocean Dynam., 69, 1165–1179, https://doi.org/10.1007/s10236-019-01301-2, 2019.
Romero, L., Lenain, L., and Melville, W. K.: Observations of Surface Wave-Current Interaction, J. Phys. Ocean., 47, 615–632, https://doi.org/10.1175/JPO-D-16-0108.1, 2017.
Sahoo, B., Jose, F., and Bhaskaran, P. K.: Hydrodynamic response of Bahamas archipelago to storm surge and hurricane generated waves – A case study for Hurricane Joaquin, Ocean Eng., 184, 227–238, https://doi.org/10.1016/j.oceaneng.2019.05.026, 2019.
Sahoo, B., Sahoo, T., and Bhaskaran, P. K.: Wave-current-surge interaction in a changing climate over a shallow continental shelf region, Reg. Stud. Mar. Sci., 46, 101910, https://doi.org/10.1016/j.rsma.2021.101910, 2021.
Shao, Z., Liang, B., Li, H., Li, P., and Lee, D.: Extreme significant wave height of tropical cyclone waves in the South China Sea, Nat. Hazards Earth Syst. Sci., 19, 2067–2077, https://doi.org/10.5194/nhess-19-2067-2019, 2019.
Sharifineyestani, E. and Tahvildari, N.: Nonlinear Wave Evolution in Interaction with Currents and Viscoleastic Muds, J. Mar. Sci. Eng., 9, 529, https://doi.org/10.3390/jmse9050529, 2021.
Song, H., Kuang, C., Gu, J., Zou, Q., Liang, H., Sun, X., and Ma, Z.: Nonlinear tide-surge-wave interaction at a shallow coast with large scale sequential harbor constructions, Estuar. Coast. Shelf Sci., 233, 106543, https://doi.org/10.1016/j.ecss.2019.106543, 2020.
Sun, Y., Perrie, W., and Toulany, B.: Simulation of Wave-Current Interactions Under Hurricane Conditions Using an Unstructured-Grid Model: Impacts on Ocean Waves, J. Geophys. Res.-Oceans, 123, 3739–3760, https://doi.org/10.1029/2017JC012939, 2018.
Tamizi, A. and Young, I. R.: The Spatial Distribution of Ocean Waves in Tropical Cyclones, J. Phys. Ocean., 50, 2123–2139, https://doi.org/10.1175/JPO-D-20-0020.1, 2020.
Tamizi, A., Alves, J., and Young, I. R.: The Physics of Ocean Wave Evolution within Tropical Cyclones, J. Phys. Ocean, 51, 2373–2388, https://doi.org/10.1175/JPO-D-21-0005.1, 2021.
Tian, D., Zhang, H., Zhang, W., Zhou, F., Sun, X., Zhou, Y., and Ke, D.: Wave Glider Observations of Surface Waves During Three Tropical Cyclones in the South China Sea, Water, 12, 1331, https://doi.org/10.3390/w12051331, 2020.
Violante-Carvalho, N., Arruda, W. Z., Carvalho, L. M., Rogers, W. E., and Passaro, M.: Diffraction of irregular ocean waves measured by altimeter in the lee of islands, Remote Sens. Environ., 265, 112653, https://doi.org/10.1016/j.rse.2021.112653, 2021.
Wang, X., Yao, C., Gao, G., Jiang, H., Xu, D., Chen, G., and Zhang, Z.: Simulating tropical cyclone waves in the East China Sea with an event-based, parametric-adjusted model, J. Ocean., 76, 439–457, https://doi.org/10.1007/s10872-020-00555-5, 2020.
Wang, J., Wang, Y., and Yang, J.: Forecasting of SWH Based on Gated Recurrent unit Network in the Taiwan Strait and Its Adjacent Waters, Water, 13, 86, https://doi.org/10.3390/w13010086, 2021.
Wei, C. and Cheng, J.: Nearshore two-step typhoon wind-wave prediction using deep recurrent neural networks, Hydroinformatics, 22, 346–367, https://doi.org/10.2166/hydro.2019.084, 2020.
Wei, Z.: Forecasting wind waves in the US Atlantic Coast using an artificial neural network model: Towards an AI-based storm forecast system, Ocean Eng., 237, 109646, https://doi.org/10.1016/j.oceaneng.2021.109646, 2021.
Wu, M., Stefanakos, C., and Gao, Z.: Multi-Step-Ahead Forecasting of Wave Conditions Based on a Physics-Based Machine Learning (PBML) Model for Marine Operations, J. Mar. Sci. Eng., 8, 992, https://doi.org/10.3390/jmse8120992, 2020.
Yim, S. C., Osborne, A. R., and Mohtat, A.: Nonlinear Ocean Wave Models and Laboratory Simulation of High Seastates and Rogue Waves. Proceedings of the ASME 2017 International Conference on Ocean, Offshore and Arctic Engineering, OMAE2017, 25–30 June 2017, Trondheim, Norway, https://doi.org/10.1115/OMAE2017-62706, 2017.
Yu, Y., Si, X., Hu, C., and Zhang, J.: A Review of Recurrent Neural Networks: LSTM Cells and Networks, Neural Comput., 31, 1235–1270, https://doi.org/10.1162/neco_a_01199, 2019.
Zegarra, M. A., Schmid, J. P., Palomino, L., and Seminario, B.: Impact of Hurricane Dorian in the Bahamas: A View from the Sky, Washington, D.C.: Inter-American Development Bank, https://doi.org/10.18235/0002163, 2020.
Zhang, L. and Oey, L.: An Observational Analysis of Ocean Surface Waves in Tropical Cyclones in the Western North Pacific Ocean, J. Geophys. Res.-Oceans, 124, 184–195, https://doi.org/10.1029/2018JC014517, 2018.
Zhang, C. and Li, C.: Effects of hurricane forward speed and approach angle on storm surges: an idealized numerical experiment, Acta. Oceanol. Sin., 38, 48–56, https://doi.org/10.1007/s13131-018-1081-z, 2019.
Zhang, Z., Rai, R., Chowdhury, S., and Doermann, D.: MIDPhyNet: Memorized Infusion of Decomposed Physics in Neural Networks to Model Dynamic Systems, Neurocomputing, 428, 116–129, https://doi.org/10.1016/j.neucom.2020.11.042, 2020.
Zhao, K. and Wang, J.: SWH forecasting based on the hybrid EMD-SVM method, Ind. J. Geo Mar. Sci., 48, 1957–1962, 2018.
Zhang, L. and Oey, L.: An Observational Analysis of Ocean Surface Waves in Tropical Cyclones in the Western North Pacific Ocean, J. Geophys. Res.-Oceans, 124, 184–195, 2018.
Zhou, S., Bethel, B. J., Sun, W., Zhao, Y., Xie, W., and Dong, C.: Improving SWH Forecasts Using a Joint Empirical Mode Decomposition-Long Short-Term Memory Network, J. Mar. Sci. Eng., 9, 744, https://doi.org/10.3390/jmse9070744, 2021a.
Zhou, S., Xie, W., Lu, Y., Wang, Y., Zhou, Y., Hui, N., and Dong, C.: ConvLSTM-Based Wave Forecasts in the South and East China Seas, Front. Mar. Sci., 8, 680079, https://doi.org/10.3389/fmars.2021.680079, 2021b.
Zobeiry, N. and Humfeld, K. D.: A physics-informed machine learning approach for solving heat transfer equation in advanced manufacturing and engineering applications, Eng. Appl., 101, 104232, https://doi.org/10.1016/j.engappai.2021.104232, 2021.
Zubier, K.: Using an Artificial Neural Network for Wave Height Forecasting in the Red Sea, Ind. J. Geo Mar. Sci., 49, 184–191, 2020.