the Creative Commons Attribution 4.0 License.
the Creative Commons Attribution 4.0 License.
 | 20 Oct 2022
Detecting the most effective cleanup locations using network theory to reduce marine plastic debris: a case study in the Galapagos Marine Reserve
Quinten Bohte
Alexander Forryan
Alberto C. Naveira Garabato
Andy Donnelly
Erik van Sebille
The Galapagos Marine Reserve was established in 1986 to ensure protection of the islands' unique biodiversity. Unfortunately, the islands are polluted by marine plastic debris and the island authorities face the challenge to effectively remove plastic from its shorelines owing to limited resources. To optimize efforts, we have developed a methodology to identify the most effective cleanup locations on the Galapagos Islands using network theory. A network is constructed from a Lagrangian simulation describing the flow of macroplastic between the various islands within the Galapagos Marine Reserve, where the nodes represent locations along the coastline and the edges the likelihood of plastic leaving one location and beaching at another. We have found four network centralities that provide the best coastline ranking to optimize the cleanup effort based on various impact metrics. Locations with a high retention rate are particularly favorable for cleanup. The results indicate that using the most effective centrality for finding cleanup locations is a good strategy for heavily polluted regions if the distribution of marine plastic debris on the coastlines is unknown and limited cleanup resources are available.
- Article
(4489 KB) - Full-text XML
- BibTeX
- EndNote


Marine plastic debris is abundant in the global ocean (Browne et al., 2015; Lebreton et al., 2019) and is likely to increase in the coming decades if waste-management systems across the globe do not improve (Lebreton and Andrady, 2019; Lau et al., 2020). Although the spatial distribution of plastic in the ocean is strongly heterogeneous (Law et al., 2010; Goldstein et al., 2013; Buhl-Mortensen and Buhl-Mortensen, 2017; Kaandorp et al., 2022), both model simulations and observations indicate that land-based mismanaged waste is trapped in coastal zones and that in particular positively buoyant plastic is most likely to be found on or near coastlines (e.g., Lebreton et al., 2019; Onink et al., 2021; Morales-Caselles et al., 2021). This implies that beach cleanups can be a highly effective mitigation measure to minimize the negative impact of plastic pollution on marine coastal ecosystems (e.g., Haarr et al., 2019; Kaandorp et al., 2022). Furthermore, beaches are more accessible and cheaper to clean than the open ocean or the seabed and targeting specifically macroplastic items (>0.5 cm) will prevent the formation on the shorelines of microplastic, which is more difficult to remove (e.g., Andrady, 2011; Kataoka and Hinata, 2015; Ryan et al., 2020; Jones et al., 2021).
As beach cleanups often rely on the availability of professionals and willingness of volunteers, the location and timing of the cleanup activities do not always correspond with the location where cleanups would have most impact (Critchell et al., 2015; Nelms et al., 2017). Kaandorp et al. (2022) explained litter quantities observed along the Dutch North Sea coast by combining a large data set from beach cleanups with hydrodynamic data and virtual particle pathways. Doing so, they were able to give recommendations for optimizing cleanup efforts in the Netherlands. Unfortunately, using this data-driven approach to find effective cleanup locations is only possible if a large and consistent monitoring data set is available, which is often not the case (e.g., Canals et al., 2020; Morales-Caselles et al., 2021).
Here, we propose a different approach to developing a cleanup efficacy framework when the source and sink distribution of plastic are unknown. We use a network that is constructed from a transition matrix describing the flow of macroplastic between different coastlines. In particular, the network analyses used in ecology to study the connectivity of species between spatially separated habitats (Kininmonth et al., 2010; Jönsson and Watson, 2016; O'Malley et al., 2021) bears many parallels with the connectivity of potential macroplastic sources and sinks between various coastlines. The residence time of macroplastic at the shoreline is not infinite and beached macroplastic can resuspend (e.g., Kataoka et al., 2015). Dispersed by the ocean currents, locally littered or beached macroplastic can therefore spread from one coastal site to another, just as, for example, larvae disperse from one habitat to another (Pata and Yñiguez, 2021). The ecological connectivity is often used to determine which regions are in need of conservation to increase the resilience against anthropogenic disturbances (Chamberlain et al., 2021). Similarly, a network based on coastline connectivity of beached and resuspended macroplastic has the potential to find important cleanup locations on land. If the source distribution of macroplastic is unknown, the connectivity can still be used to derive which regions are likely to accumulate macroplastic and from which regions macroplastic is likely to spread to other coastlines, within the limits of the macroplastic flow model accuracy.
One way of finding the most effective cleanup location is to implement sinks in the modeled network and compute the amount of macroplastic removed from the system. Searching for the optimal sink locations is often computationally unfeasible as it would require too many iterations to test all possible sink combinations (Sherman and van Sebille, 2016). Instead of using a brute-force method, it is also possible to rank the possible sink locations by importance based on specific network centralities (see for the equivalent in conservation efforts of habitats, e.g., Watson et al., 2011; Treml et al., 2008; Pata and Yñiguez, 2021). However, depending on the management objective, it is not always straightforward to determine which centrality leads to the desired ranking that has the highest impact.
In this paper, we construct a network based on the flow of macroplastic (>0.5 cm) between the coastlines of various islands within the Galapagos Marine Reserve (Fig. 1). The marine reserve and the Galapagos Islands are a UNESCO World Heritage Site and host a unique biodiversity (e.g., Denkinger and Vinueza, 2014). The islands face increasing levels of pollution, mainly from remote sources (van Sebille et al., 2019; Escobar-Camacho et al., 2021), where over 8 t of plastic are removed from the coastlines of the Galapagos Islands each year (estimate from unpublished coastal cleanup data). Recent observations have identified 27 Galapagos marine vertebrates at high risk by exposure to microplastic contamination (Jones et al., 2021).
Although monitoring efforts to measure macroplastic abundance along the Galapagos coastlines are increasing, the macroplastic distribution is still largely unknown owing to limited resources. Conservation efforts will therefore strongly benefit from identifying key locations for cleanup. Previous studies have shown that a strong inter-island genetic connectivity exists within the Galapagos Marine Reserve, mainly due to seed dispersal by ocean currents (e.g., Fajardo et al., 2019; Arjona et al., 2020). Thus, it is likely that also macroplastic may have high residence timescales within the marine reserve owing to ocean transport processes between the islands. Therefore, the connectivity between the coastlines of the Galapagos Islands provides an ideal case study to investigate the use of centrality theory to find optimal cleanup locations.
In this paper we aim to identify which centralities provide the best ranking to optimize cleanup efficacy at coastlines of the Galapagos Islands. The resulting cleanup efficacy framework can be extended to include various macroplastic transport and beaching processes to increase the accuracy of cleanup locations and can be applied to other regions across the globe.

Figure 1Map of the main islands in the Galapagos Marine Reserve. All port locations are indicated by diamond markers and virtual particle pathways (blue lines) show all existing connections via ocean currents using the MITgcm model simulation from Puerto Ayora (blue diamond) to other coastlines.
In order to set up the network of macroplastic connectivity between the Galapagos Islands, virtual particles are released from all island coastlines. The pathways of the particles are constructed using a Lagrangian tracking tool (Sect. 2.1) where the arrival of particles at the coastline is parameterized by a beaching parameterization (Sect. 2.2). From these pathways, a transition matrix is constructed that provides the likelihood that two coastlines are connected (Sect. 2.3). It is then possible to find the optimal cleanup locations using various coastline rankings based on centrality measures (Sect. 2.4). To test the impact of these rankings, three metrics are proposed in Sect. 2.5 that optimize for maximum removal of particles and minimal distribution of particles on land.
2.1 Lagrangian particle simulation
The transition matrix used for the network analysis is constructed from a Lagrangian simulation of macroplastic transport between the Galapagos Islands. In this paper we only consider positively buoyant macroplastic (>0.5 cm) as larger pieces of plastic are the targets of the beach cleanup (see Sect. 1). As such, we used the two-dimensional daily-mean surface velocity fields from the regional MITgcm model described in detail by Forryan et al. (2021). The model has a horizontal resolution of 4 km and is forced at the three open boundaries (north, south and west) by the temperature, salinity and velocity fields of the ORCA0083-N01 ∘ NEMO model (Forryan et al., 2021; Webb et al., 2020). Surface forcing from ERA-Interim at 6-hourly resolution was applied and the simulation years 2008–2012 were used for the particle tracking. The model is able to capture the main surface circulation and variability observed near the Galapagos Islands and is therefore well suited to investigate the MPD connectivity between the islands (Forryan et al., 2021).
Virtual particles were released daily throughout the 5 years of the model simulation at every coastal grid point of the ten islands that are resolved by the MITgcm model (see Fig. 1). A coastal grid point is defined as the model grid point that shares one or more corners with a land grid point. The particles are advected for 60 d through fourth-order Runge–Kutta integration in the Parcels Lagrangian framework (Delandmeter and van Sebille, 2019) with an hourly output frequency. A 2-month timescale has proven sufficient to connect any two coastal grid points within the marine reserve. In total, 707 400 particle trajectories (1800 d × 393 coastal grid points) were used to construct the transition matrix. An analysis with only half the number of particles leads to similar results and conclusions as presented in this paper, which indicates that the total number of released particles used is sufficient for our analysis.
As the timescale to travel from one coastline to another is at most 2 months, processes that impact the vertical movement of macroplastic, such as fragmentation processes and biofouling, are not included, as these typically have a much longer timescale (e.g., Andrady, 2011; Song et al., 2017; Gerritse et al., 2020; Kaandorp et al., 2020; Lobelle et al., 2021). Further, we have chosen not to include any artificial Lagrangian diffusion as the mesoscale variability is largely resolved by the flow fields. We also did not take into account effects of wind drag on floating plastic or the role of Stokes drift. Although these effects likely play a role for macroplastic transport in the marine reserve, it is unclear how they should be parameterized as there are only a few observations from floats near the Galapagos Islands available for validation (van Sebille et al., 2019). The aim of this paper is to investigate the use of network centralities for effective cleanup strategies; a methodology that is independent of the transition matrix used. We have therefore chosen to solely use the Eulerian surface flow for constructing the network, but the method can be easily extended to incorporate more realistic macroplastic dynamics (e.g., Moulton et al., 2023). We address the implications of this choice in Sect. 4.
2.2 Beaching parameterization
To construct the transition matrix we compute the likelihood that a particle entering the ocean from one location will beach at another location (or at the same location). We are only interested in the particle arrival as this would provide information on whether a cleanup is needed. We therefore consider the beaching processes and not the resuspension process for the construction of the transition matrix in Sect. 2.3.
As the horizontal model resolution is only 4 km, the beaching process is parameterized using the same method as described by Onink et al. (2021): if a particle reaches a coastal grid point, a beaching probability pB to determine whether the particle is beached is calculated as: , where dt is the integration time step of the Lagrangian simulation (1 h) and λB the beaching timescale. Although observations for the validation of this parameterization are limited, analysis by Pawlowicz et al. (2019) of a set of beached drifters in the Salish Sea showed that this parameterization provides reasonable estimates for the beaching location. The choice for the beaching timescale, however, is uncertain and so far, values of λB=1–100 d have been used (e.g., Kaandorp et al., 2020, 2022; Onink et al., 2021). It seems that mainly quantitative analyses such as mass budgets are sensitive to the choice of the beaching timescale, but that beaching patterns are qualitatively robust against the choice for λB. In this paper we use a range of plausible beaching timescales, λB∈ [1, 2, 5, 10, 26, 35] d to test the sensitivity of our transition matrix on the choice of λB. We have decided not to test for λB>35 d as our advection timescale is only 60 d.
2.3 The transition matrix and corresponding network
Combining the Lagrangian simulation (Sect. 2.1) and the beaching parameterization (Sect. 2.2) we construct a transition matrix that provides the likelihood that a particle travels from a source coastal grid point nso (hereinafter a source node) and beaches at a sink coastal grid point nsi (hereinafter a sink node, Fig. 2a). To ease interpretation, all nodes are grouped per island (from east to west) and ranked in a clockwise direction starting at the northernmost node of each island.
Between Isla Isabela and Isla Fernandina a narrow strait exists (the Bolivar Channel, see Fig. 1), which is only one ocean grid point wide in the hydrodynamic model. As the beaching parameterization can only provide information on beaching within one grid point from land, the channel is chosen as a separate source/sink location.
The transition matrix is then translated to a directed network, where each node represents a coastal grid point and the edge weight pso,si the probability that a particle travels from nso to nsi. Note that using this method, only connections exist between two nodes if the travel time is below the maximum particle advection time of 60 d. As mentioned before, increasing the advection time does not change the conclusions drawn in this paper. As such, we are not concerned about the time scale, but purely on whether a connection between two nodes exists.
The directed network is constructed using the range of beaching timescales introduced in Sect. 2.2. A larger beaching timescale reduces the likelihood of pathways between the nodes (Fig. 2b), but the connectivity pattern itself seems insensitive to changes in λB. Therefore, for the remainder of this paper we present results using λB=5 d, where 42 % of the particles beach.
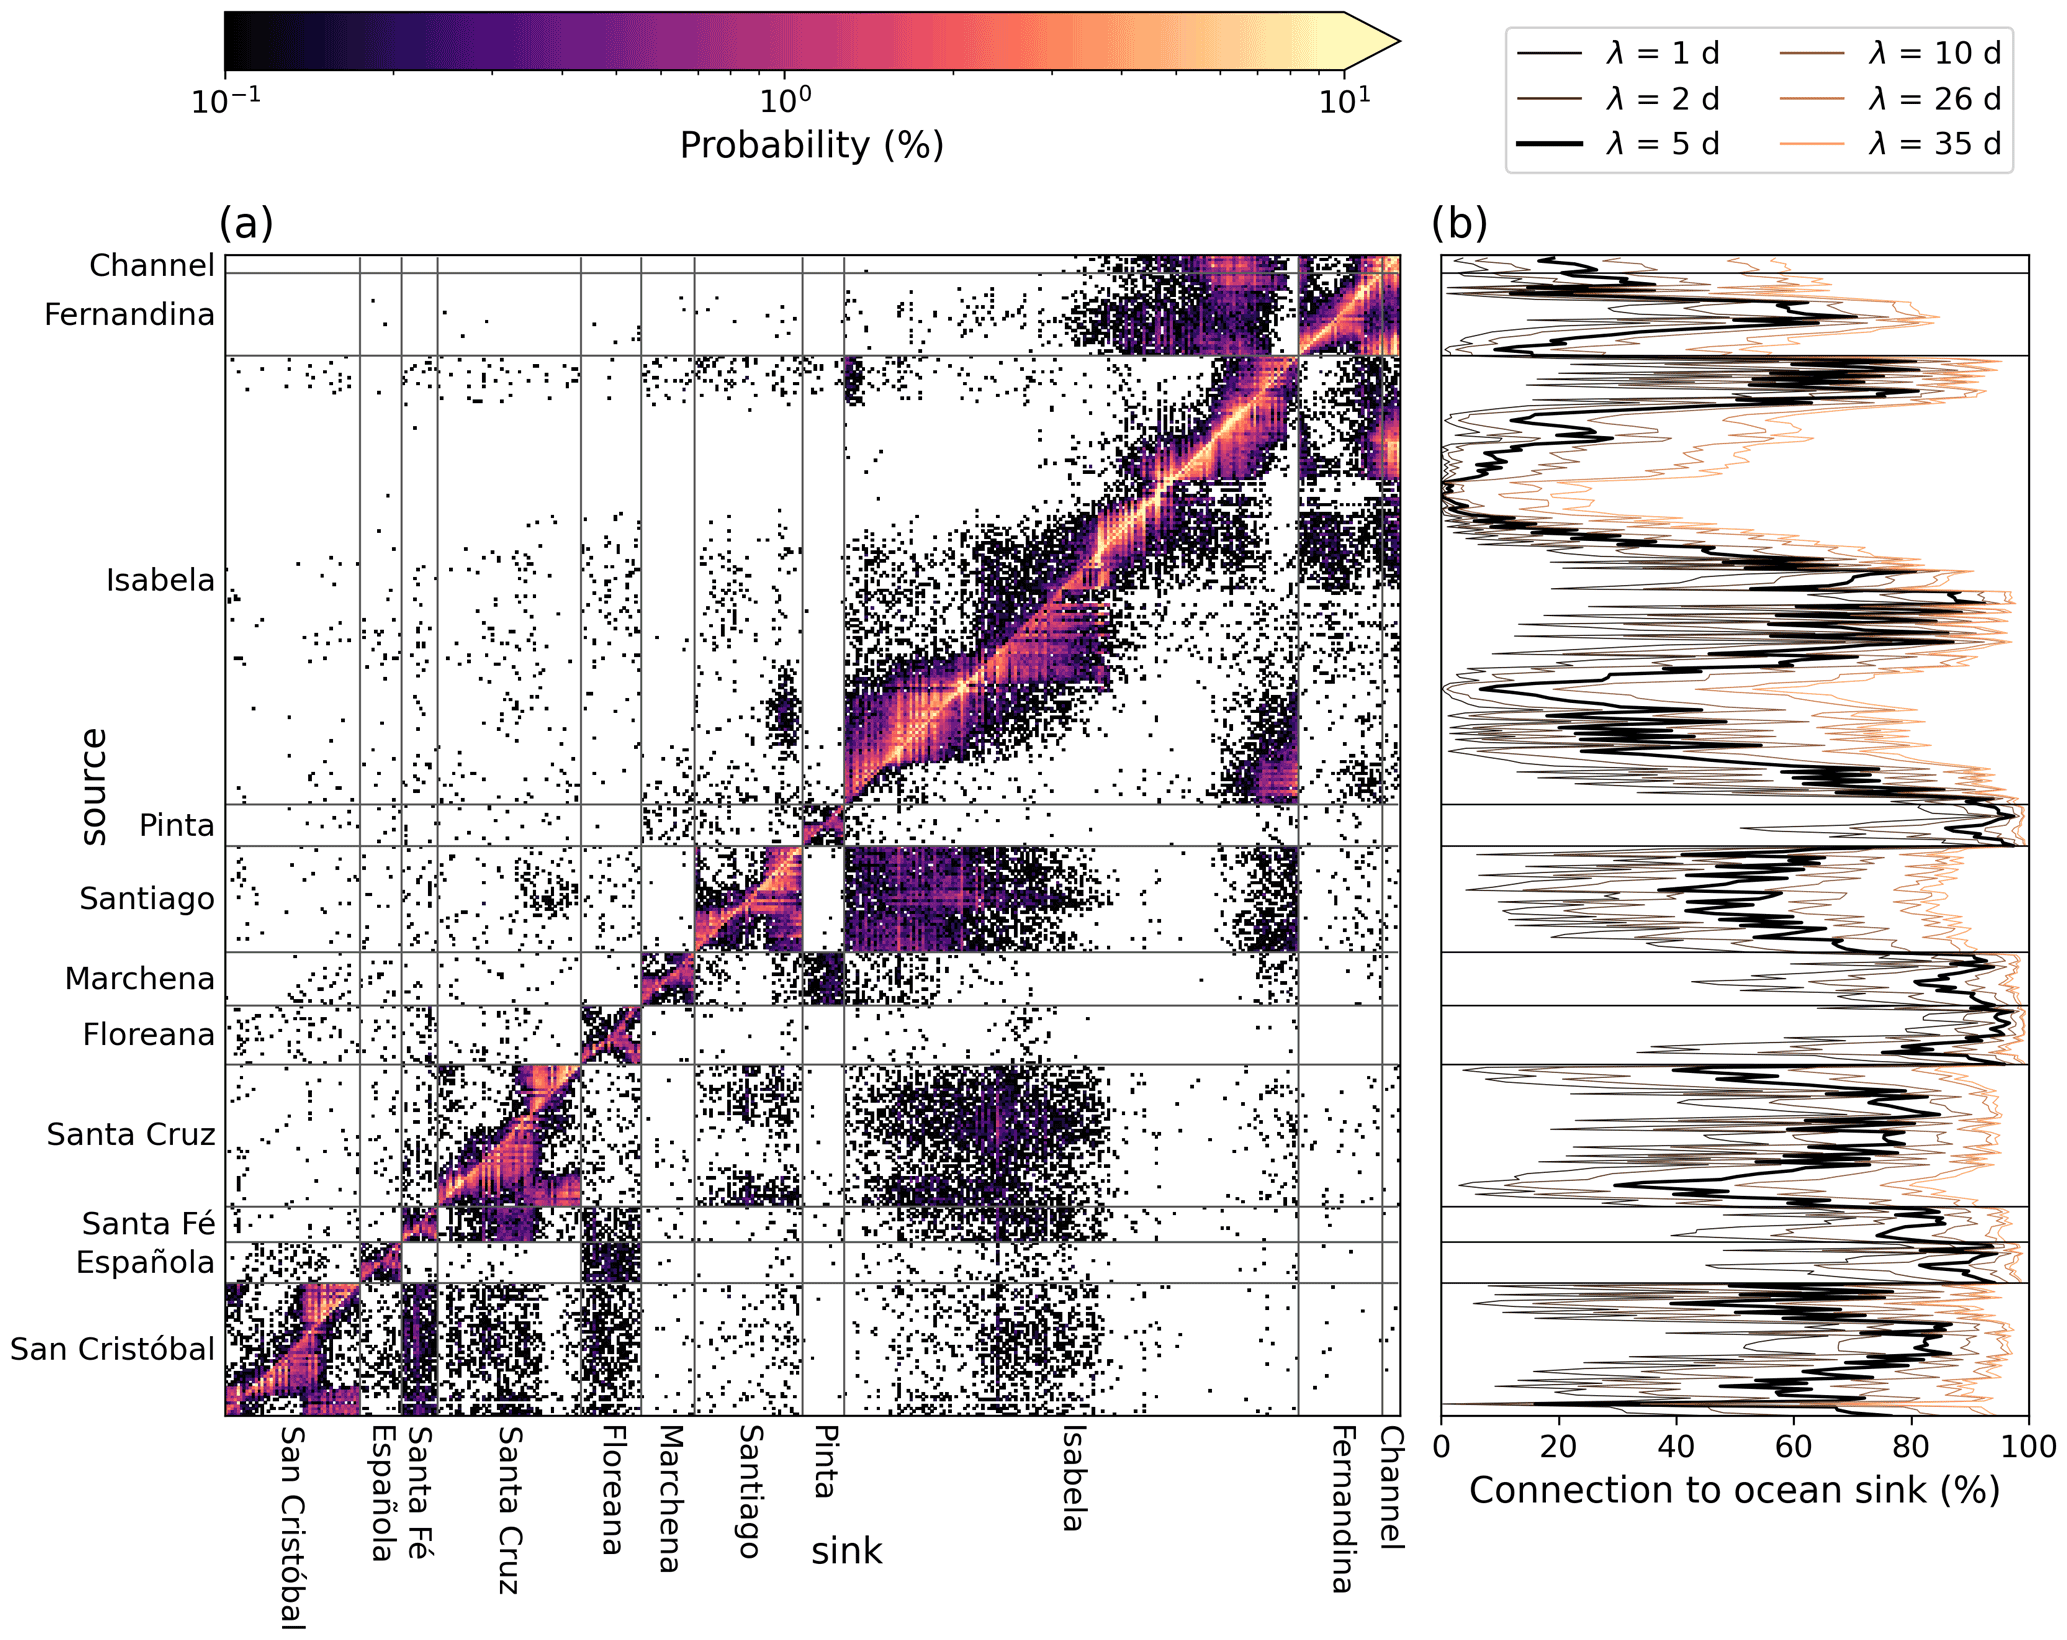
Figure 2The transition matrix (a) giving the probability that a particle starting at a source coastal node (y-axis) arrives at a sink coastal node (x-axis) for λB=5 d, and the probability (b) that a particle starting at a source coastal node is not beaching within 60 d and therefore “lost” to the ocean, including the sensitivity of this loss to changes in the beaching timescale (colored lines) compared with the reference simulation (black line). The different islands are delimited by horizontal and vertical gray lines.
2.4 Network centralities to identify effective cleanup locations
To identify which locations should be cleaned first to reach maximum impact, a ranking of all coastline nodes is established based on various network centralities, where nodes with a higher centrality value are cleaned first. Whenever relevant, the NetworkX package version 2.5.1 is used to calculate the centrality from the network constructed in Sect. 2.3 (Hagberg et al., 2008). We chose ten centralities for which the description and motivation is provided below.
-
The Retention Rate (retention) indicates the percentage of particles for which the sink node is the same as their source node (pso=si). Nodes with a Retention Rate equal to one have no outgoing edges, but may have incoming edges, and represent regions where particles are very unlikely to leave.
-
The Loss Rate (loss) is the percentage of particles that are lost to the ocean, i.e., the edge weight of the edge that connects each node to the ocean (pso,ocean, Fig. 2b). Nodes with a Loss Rate equal to one have no outgoing edges to coastline nodes, but may have incoming edges. These nodes may represent regions that should be cleaned rather fast to avoid loss to the open ocean where removal is more difficult.
-
The remote Beaching Rate (beaching) is the percentage of particles that have a coastline sink node that is different from their source node and is given by
Prioritizing nodes with a high remote beaching rate for cleanup may have a non-local impact by preventing the spread of particles to other locations.
-
The Source-Sink Index (SSIsink and SSIsource) is given by
where Pin and Pout give the total edge weight of all incoming and outgoing edges respectively. Positive SSI values (SSIsink) indicate that a node is a net sink, whereas negative SSI values (SSIsource) indicate that a node is a net source (Pata and Yñiguez, 2021). Comparing the impact of these two centralities will give an insight into whether removal at a net source or at a net sink is more important.
-
We use the Sink Diversity (SiD) and Source Diversity (SoD) as described by Pata and Yñiguez (2021) to identify nodes that have outgoing edges to many different sinks with a high edge weight (high SiD) or to identify nodes that have strong incoming edges from many different sources (high SoD). The index is computed from a modified Shannon's diversity index (Holstein et al., 2014) using
and
where pi and pj are the weights of each outgoing and incoming edge normalized by the sum of all outgoing and incoming edge weights at each source and sink node.
-
The Pagerank Centrality (PR) is calculated to quantify the importance of each node proportional to the importance of its neighbors. To calculate this importance, often the eigenvector centrality is used (e.g., Watson et al., 2011; McAdam and van Sebille, 2018), but pagerank centrality is more appropriate to use in the case of directed networks (Newman, 2018) as it can give more importance to incoming edges than to outgoing edges. As it is a priori not clear whether an incoming edge or an outgoing edge is more important for finding effective cleanup locations, the pagerank centrality is calculated from both the original directed network (PRin) and its transpose (PRout).
-
Lastly, we use the Betweenness Centrality (betweenness), which, instead of considering the in- and out-degree of the various nodes, gives more importance to nodes that lie on shortest paths between other nodes. In other words, the betweenness centrality could help to find regions where it is likely that large amounts of particles pass by. This centrality has been used before to find effective cleanup locations along the shorelines of South Korea by Jeon et al. (2015). However, in contrast to their method, we define the shortest path based on the most likely path instead of the shortest distance or travel time as we want to optimize for maximal removal of particles, not for, e.g., minimal residence time of particles in the ocean. By simply rewriting the edge weight probability pso,si as , regular shortest path algorithms can be applied to calculate the betweenness centrality, but now based on the most likely path (e.g., Ser-Giacomi et al., 2015; O'Malley et al., 2021).
2.5 Impact metrics
As a management objective we define the most effective cleanup locations as regions where cleanups minimize the macroplastic distribution on land and maximize the total amount of macroplastic removed. Furthermore, as there are only limited resources available for cleanup, we need to take into account how much of the coastline can be cleaned, and how often, to reach a specific macroplastic distribution.
The particle distribution on coastlines at a time t* can be calculated by multiplying the previous distribution with the transition matrix as . Note that the time t* does not represent an actual time as the travel time for specific pathways is variable and we did not include any residence time scales for particles on shorelines. It does however provide an indication for how often specific locations should be cleaned until there are no more particles arriving from other locations.
We initialize the system with a homogeneous particle distribution before cleanup starts. Then, using the node rankings from the various centralities, the outgoing edges of the cleanup target nodes are removed. This method bears similarities with the percolation process in network theory used to study clusters (Newman, 2018). However, in this paper we leave the incoming edges intact. After every iteration, the incoming particles at the target cleanup node are removed from the system until a steady state is reached, which provides a means of quantifying the cleanup impact.
To ensure that we perform sufficient iterations to reach a steady state, we calculated the change in particle number on land between two iterations. We then define to have reached a steady state when this change is less than 0.1 % of the total number of particles.
Three impact metrics are used to evaluate the efficacy of the different centrality node rankings. The benefit metric indicates the difference (in %) between the total number of particles removed and the number of particles removed if all non-removed particles were directly lost to the ocean after the first iteration. The Left Behind on Land metric gives the percentage of particles that are still on land when a steady state is reached. Then finally, the iteration metric provides an estimate of how often the calculation for the next particle distribution is performed to reach a steady state.
For a given percentage of coastline that is cleaned, the most effective centrality node ranking would maximize the benefit metric (total number of particles removed) and minimize the Left Behind on Land and iteration metrics (minimal particle distribution on land and only a little repeated cleaning needed).
3.1 Source and sink distribution of buoyant macroplastic connectivity
The transition matrix and corresponding network constructed in Sect. 2.3 provide a first indication of the connectivity structure (i.e., the network topology) of the macroplastic flow between the coastlines of the Galapagos Islands (Fig. 2a). The network is characterized by short source-sink distances, as the highest probabilities in the transition matrix are found along the diagonal. Although the network is relatively sparse, the number of strongly connected components in this network is equal to one, which means that there always exists a pathway connecting any two nodes in the network. Furthermore, most connections between nodes are weak (i.e., pathways with low probability) and only a few are strong (i.e., pathways with a high probability). Therefore, the distribution of all pathway probabilities (i.e., the edge weights) is relatively linear in a log-log plot (not shown) indicating that the macroplastic connectivity can be classified as a small-world network (e.g., Watts and Strogatz, 1998; Amaral et al., 2000; Kininmonth et al., 2010; Watson et al., 2011).

Figure 3Source (a) and sink (c) distribution of macroplastic connectivity between the Galapagos Islands, specifying the relative connectivity to/from another island (green), to/from the same island (yellow), to/from the same location (brown) and to the ocean (blue). The total percentage of particles arriving at each location (node) is shown in (b).
The ocean is the largest sink for particles leaving the islands (Fig. 3a) when using a beaching timescale of λB=5 d (note that the total percentage lost to the ocean decreases for smaller beaching timescales, Fig. 2b). The amount lost to the ocean, and therefore also the connectivity to other island coastlines, is however strongly spatially variable. Small islands show a stronger connectivity to the ocean than larger islands (Fig. 3a). The larger islands show interesting spatial connectivity variability. At the islands of San Cristóbal, Santa Cruz and Fernandina, the largest sink to the ocean is found at southern locations, whereas Santiago Island loses most particles to the ocean in the north and the sink distribution of Isabela Island shows a large loss to the ocean both in the north and in the south. This is most likely a result of the relative orientation of the islands with respect to the ocean circulation pattern.
The circulation pattern near the Galapagos Marine Reserve is mainly dominated by the westward South Equatorial Current in the east, and by upwelling of the Equatorial Undercurrent waters in the west (Chavez and Brusca, 1991; Liu et al., 2014; Forryan et al., 2021). Indeed, the island-to-island connectivity is mainly in a westward direction (Fig. 2a) and in general, more particles arrive at islands downstream than upstream (Fig. 3b). Also, the source distribution (Fig. 3c) reveals that particles arriving at Isabela Island are more likely to come from other islands (>20 %) than the particles arriving at San Cristóbal Island (2.0 %).
For some of the islands (San Cristóbal, Santiago and Fernandina), more particles beach at the western shorelines than at the eastern shorelines (Fig. 3b). This might seem contradictory to previous work, which suggests that most macroplastic arrives at the eastern shorelines owing to the prevailing ocean current direction (e.g., van Sebille et al., 2019; Jones et al., 2021). However, here, the initial distribution is homogeneous and therefore more representative of potential local sources of macroplastic instead of remote (i.e., sources from outside the marine reserve). Apparently, without an influx of remotely sourced macroplastic, the local dynamics leads to accumulation at the western coastlines at these islands.
San Cristóbal Island and Santa Cruz Island display a very similar sink distribution pattern (Fig. 3a). The particles seem to travel from one node to another in a clockwise direction at the eastern flank and a counter-clockwise direction at the western flank of the islands. They follow the shoreline, until they reach a “take-off” node, i.e., the location where the particles are most likely to leave the island. The negative correlation between the likelihood of beaching at another island and the likelihood of staying close to the source is also visible in Fig. 3a. This indicates that the connectivity between the nodes that belong to the same island is fundamentally different from the island-to-island connectivity. This is most likely a result of predominantly low velocities close to the shorelines in combination with the beaching parameterization that is applied only close to shore. The “take-off” locations might be interesting targets for cleanup strategies as they seem to be accumulation points for particles originating from the same island, and at the same time display a strong out-flux of particles to the ocean and to other islands.
3.2 Impact of cleanup based on the coastline node rankings
The visual representation of the source and sink distribution of macroplastic connectivity already provides some insight into potential cleanup locations. However, a more quantitative analysis can be performed by iteratively removing the outgoing edges from specific nodes (i.e., the cleanup target locations) and assessing the impact as described in Sect. 2.5. Which outgoing edge to remove first is determined by the ranking of the coastline nodes given by various centralities (see Sect. 2.4).
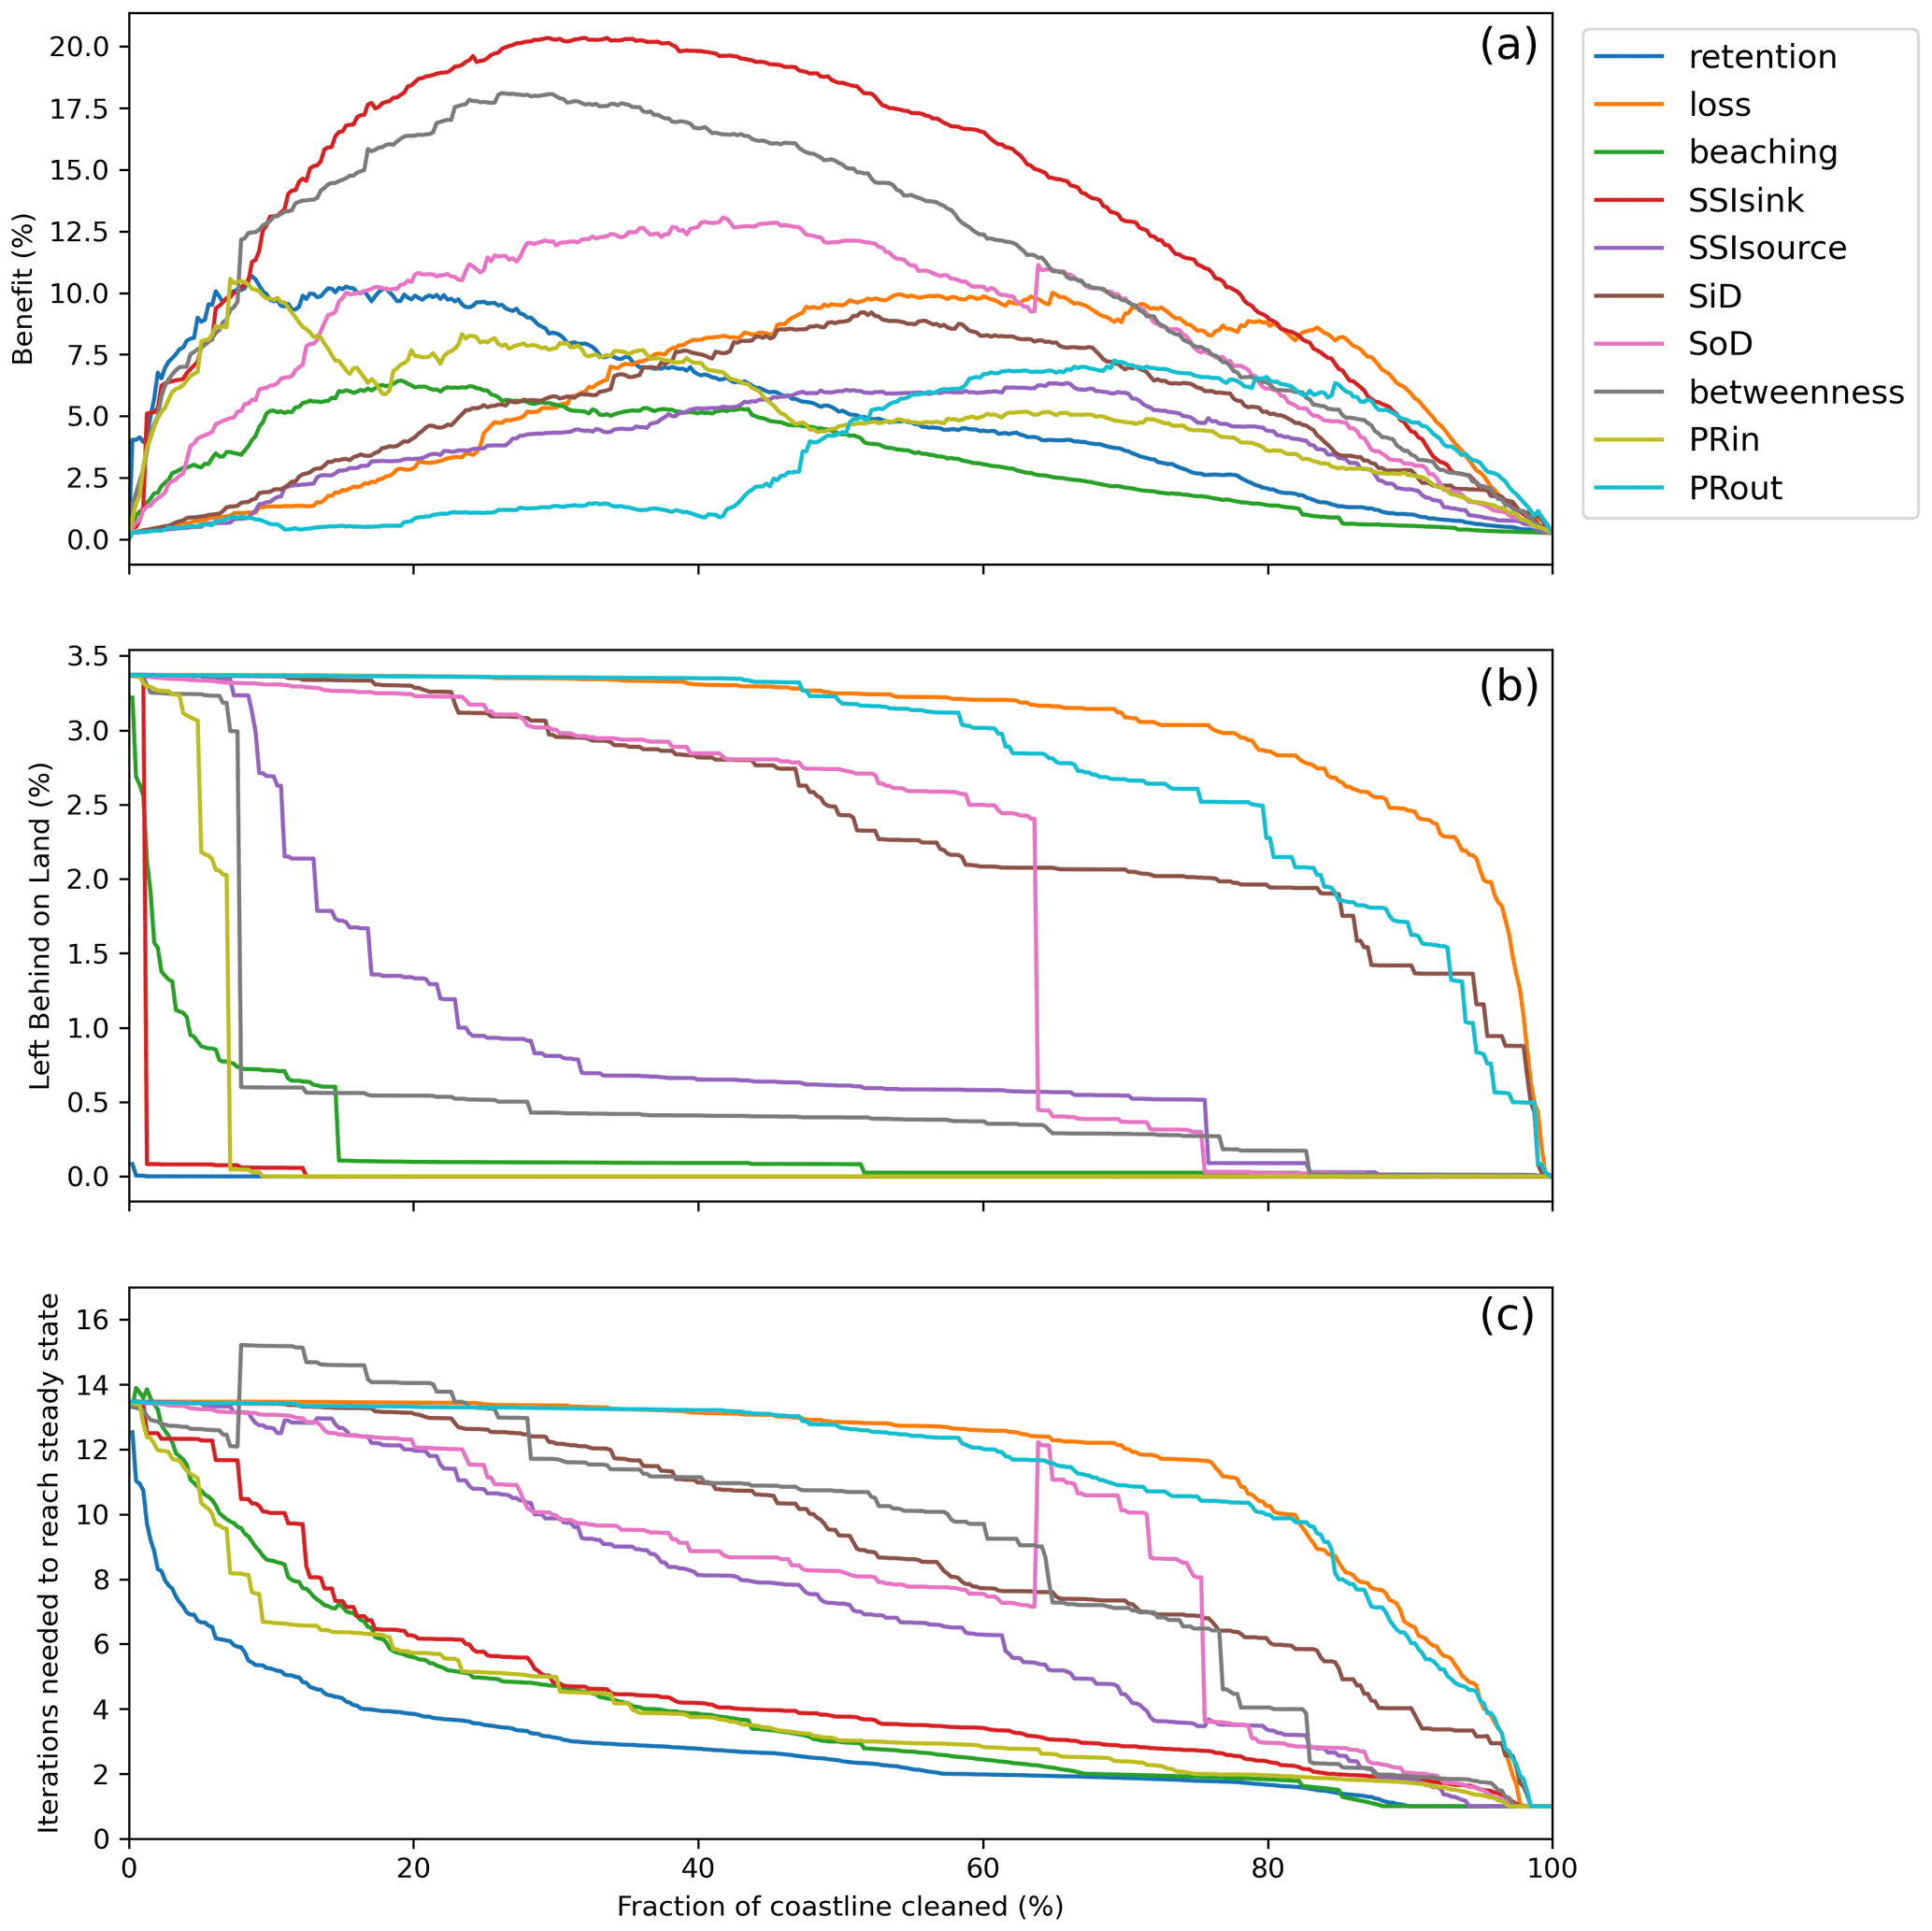
Figure 4A comparison of the impact metrics described in Sect. 2.5 as a function of the fraction of coastline nodes cleaned for all centrality rankings (colored lines). The benefit metric (a) measures the difference (in %) between the total number of particles removed and the number of particles removed if there had been zero connectivity between the different nodes. The Left Behind on Land metric (b) indicates how many particles are still on land after a steady state is reached. The Iterations metric (c) shows how many iterations were needed to reach a steady state and provides an indication of how often one should clean.
The impact metrics reveal that the cleanup efficacy is strongly dependent on the order in which the coastline nodes are cleaned. As expected, but important to note, is that, owing to the connections between the different potential cleanup locations, there is always a positive benefit from cleaning only a fraction of the coastline (Fig. 4a). For example, cleaning 30 % of the coastline based on the SSIsink ranking can lead to a reduction of >50 % of the total number of particles present in the system (red line in Fig. 4a). This means that the cleanup effort can indeed be optimized using limited resources.
Which centrality to use for the most efficient cleanup strategy, however, depends on how much of the coastline can be cleaned. Overall, the SSIsink seems to provide the highest benefit (red line in Fig. 4a). However, for low cleanup effort (<10 % of the coastline), the betweenness centrality (gray line), the retention rate (blue line) and the pagerank centrality favoring incoming edges (PRin, yellow line) lead to similar benefit rates. For high cleanup effort (>90 % of the coastline) the loss rate seems to outperform the SSIsink regarding the benefit rate. Interestingly, the particles that would not be removed are still on land when using a cleanup strategy based on the loss rate, instead of being lost to the ocean if the SSIsink ranking is used for the cleanup strategy (Fig. 4b). This demonstrates that depending on the management objective and the cleanup capacity different centralities might be of importance.
Owing to the remoteness of the Galapagos Islands, we would be mainly interested in a cleanup with limited effort and we will therefore focus on efforts that would be able to clean up to 10 % of the coastline. Furthermore, as described in Sect. 2.5, we not only want to optimize our cleaning efforts to reduce the overall amount of macroplastic but also to minimize the amount of macroplastic left on land and the number of iterations needed to reach a steady state.

Figure 5The benefit of all centrality node rankings as a function of (a) how much of the initial plastic distribution is left on land and (b) how often the matrix multiplication needs to be performed to reach a steady state. The impact metrics are calculated for when 5 % (diamond marker) and 10 % (star marker) of the coastline would be cleaned.
Using these objectives, the retention rate seems to provide the most effective cleanup strategy for small (5 %) cleanup effort (blue diamond marker in Fig. 5). Targeting regions with a high retention rate would lead to the cleanest coastlines, with the least amount of repeated cleaning and with the highest benefit. This would indicate that the dynamics that keeps macroplastic at the same location is more important for effective cleanup efforts than the arrival of macroplastic from other locations.
For slightly higher cleanup effort (10 %) we again find that the node rankings based on the betweenness (gray marker), the SSIsink (red marker) and the PRin (yellow marker) centralities become important. Apart from the betweenness centrality, these node rankings, together with the retention rate, have in common that they give more importance to incoming edges than to outgoing edges. This is an interesting finding as this implies that it might be more effective to clean at a sink than at a source for the overall macroplastic removal.
3.3 Sensitivity to initial macroplastic distribution
So far, we have assumed a uniform initial distribution of particles to evaluate the impact of the various node rankings. As mentioned in the introduction, we are interested in finding a cleanup strategy that can be used when the distribution of macroplastic is unknown. Therefore, we also test the impact of the node rankings against a random distribution of particles across the coastline nodes. We have tested the impact sensitivity to a fully random initial distribution, where clean nodes (particle weight = 0) are randomly chosen and polluted nodes have a particle weight between 0 and 1. In addition, we also tested the impact sensitivity to a random Gaussian initial distribution with varying correlation spatial scales. The latter distribution might be more realistic, as it is plausible that macroplastic distributions along the coastlines are correlated at spatial scales larger than the node size (4 km).
Logically, the potential total particle “mass” removed is sensitive to how much of the coastline is initially polluted. However, we note that the relative efficacy of the node rankings based on the various centralities stays the same. For example, if 10 % of the coastline could be cleaned, targeting those coastline nodes with a high SSIsink centrality or betweenness centrality would most likely lead to a higher number of particles removed than targeting nodes based on other centralities, regardless of the initial distribution (not shown). Theoretically, this would even mean that by measuring the amount of waste cleaned at these locations, one could infer how much pollution is present in total. Note, however, that using this method we do not consider any new sources of macroplastic during the cleanup event, neither from land nor from remote sources. The resuspension time scale for macroplastic to return to the ocean is also not included in this study. Therefore, for long resuspension time scales the total number of particles may change before a steady state can be reached.
By using a random initial particle distribution, one can also derive the cleanup impact if one were to target the most polluted coastlines (i.e., if the initial distribution were known). This impact can then be compared with the cleanup impact when using the centrality ranking. Figure 6 provides an example of this comparison when the cleanup effort is 10 % and the SSIsink centrality is used to identify cleanup locations. The comparison is done by computing the difference (the advantage) between the benefit metrics (Sect. 2.5) of the two coastline rankings (Fig. 6). If the advantage is positive, targeting coastline nodes with a high SSIsink centrality has a stronger impact than targeting nodes with the highest particle weight.
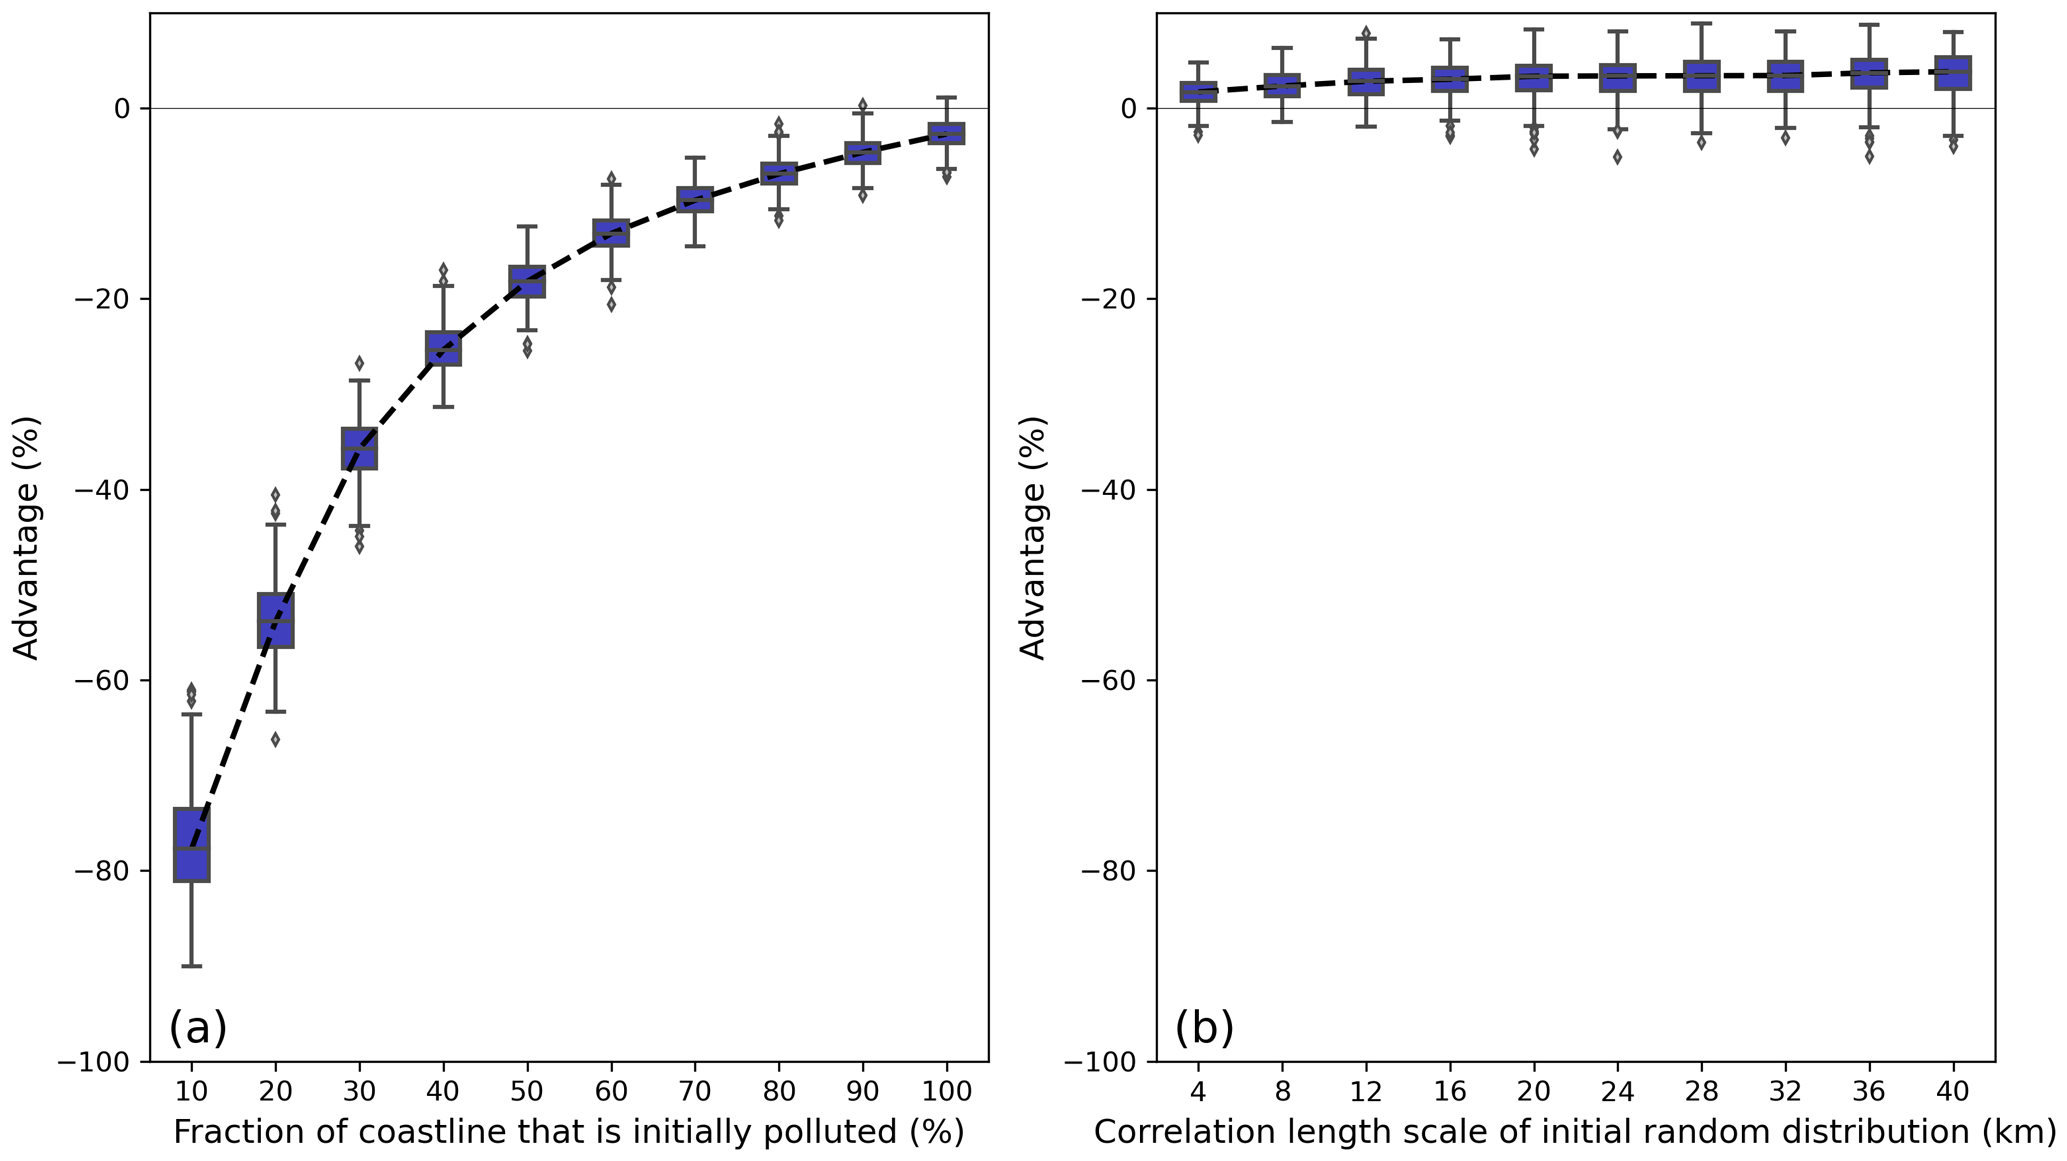
Figure 6The difference between the benefit when using the SSIsink centrality ranking and the benefit if the initial distribution of particles is known. The benefit difference (advantage, in %) is plotted as (a) a function of how clean the coastline is initially (in %) using a purely random distributed particle weight and (b) a function of the correlation length scale used to initialize the random initial distributed particle weight. For both calculations, a cleanup effort of 10 % is applied and each calculation is repeated 500 times. Outliers are shown with diamond markers.
As expected, targeting nodes with the highest particle weight will almost always have a higher impact than using the node ranking based on the centralities. However, there are two important takeaways from this comparison. First, a higher fraction of polluted coastline nodes (Fig. 6a) leads to less importance of knowing the exact particle distribution. Even when targeting locations with a high particle weight, the total removed particle mass is limited by the cleanup effort and the difference with targeting locations with a high centrality ranking is minimal. Second, if there are no clean nodes, the cleanup effort is limited (<10 %), and the macroplastic distribution is correlated at a spatial scale >4 km (Fig. 6b); knowing the particle distribution for cleanup strategies has in most cases no longer any advantage compared with using the SSIsink centrality ranking.
3.4 Optimal cleanup locations
Finally, the 10 % highest ranked coastline nodes given by the various centralities are shown in Fig. 7. The coastline locations indicated by the first three centralities (the Retention Rate, the Loss Rate and the Beaching Rate, Fig. 7a–c) could have already been inferred from the sink distribution shown in Fig. 3a. Indeed, the smallest islands lose most particles to the ocean (Fig. 7b) and Isabela Island retains most particles (Fig. 7a) and has the highest likelihood of a particle sink on land (Fig. 7c). The impact of the westward South Equatorial Current is most notable for coastline nodes with a high Source and Sink Diversity (Fig. 7f, g) and a high Pagerank Centrality (Fig. 7i, j).

Figure 7 (a–j) The 10 % highest ranked coastline nodes by the centralities discussed in Sect. 2.4. The coastline locations determined by the Retention Rate (a), the SSIsink centrality (d), the betweenness centrality (h) and the PRin centrality (i) are recommended cleanup locations for the Galapagos Islands management that potentially have high impact (Sect. 3.2).
Interestingly, the mean westward flow does not lead to net sinks in downstream regions or net sources in upstream regions (Fig. 7d, e). However, these net sinks and sources do seem to be related to the orientation of the islands with respect to the mean flow. The SSIsink centrality reveals that the southern region of San Cristóbal Island and Santa Cruz Island and the northern and southern region of Isabela Island are strong net sinks (Fig. 7d). These locations correspond to the “take-off” locations discussed in Sect. 3.1. As the SSIsink centrality ranking has a high impact (Sect. 3.2), these “take-off” locations are indeed effective cleanup targets as hypothesized.
From the impact assessment of Sect. 3.2 we can conclude that locations with a high Retention Rate (Fig. 7a), SSIsink (Fig. 7d), betweenness centrality (Fig. 7h) and PRin centrality (Fig. 7i) are the most effective cleanup locations. Where the locations based on the Retention Rate and the PRin centrality are confined to specific areas on Isabela Island, the locations based on the betweenness centrality and SSIsink are more scattered across the islands. The solution to finding the most effective cleanup locations on the Galapagos Islands can therefore be optimized based on additional management objectives, such as how easily accessible effective cleanup locations are and objectives related to the local environmental impact of macroplastic.
In this paper we have identified which centralities are useful for optimizing beach cleanup efficacy for macroplastic removal based on macroplastic flow connectivity between the coastlines of the Galapagos Islands. We have identified four centralities, the SSIsink centrality, the Retention Rate, the PRin centrality and the betweenness centrality (see for definition Sect. 2.4) that perform well. We have shown that using the most effective centrality for finding cleanup locations is a good strategy if the distribution of macroplastic on coastlines is unknown, in particular, if only limited cleanup resources are available and the coastlines are strongly polluted. This means that the cleanup management can focus on repeated cleaning at a few key locations instead of needing to travel to different locations each time.
Owing to the increasing tourism on the Galapagos Islands (Escobar-Camacho et al., 2021) and the waste management challenges the islands face (e.g., Mestanza-Ramón et al., 2020; Wang et al., 2021), it is important to not only unravel the waste streams on the islands and the mainland, but also to understand the waste streams in the ocean if the waste is not properly managed. The effective cleanup locations presented in Fig. 7a, d, h, i therefore do not only indicate regions where a cleanup can be effective but they also represent locations where good local waste management is very important.
There are however several limitations to the methodology presented in this paper. As we did not include any resuspension time scales, it is not possible to give recommendations on how often or how long specific locations should be cleaned for. Estimates of resuspension time scales could be incorporated in the iteration process to calculate the impact of the centralities of interest (Sect. 2.5). However, observations of typical resuspension time scales are rare (e.g., Kataoka et al., 2015; Hinata et al., 2017) and, just as for the beaching time scale, the resuspension time scale depends on the geomorphology of the coastline (e.g., Brennan et al., 2018; Weideman et al., 2020). In addition, local atmospheric conditions can play an important role for both beaching and resuspension of macroplastic. The presented methodology for assessing the removal impact is based on an explicit connectivity network where the edge weights are constant between iterations. As not only the resuspension and beaching timescales are likely to vary in time but also the probability of pathways between the various nodes, it would be interesting to extend the impact assessment methodology to allow for a time-varying connectivity network. Furthermore, recent studies suggest that using implicit connectivity might provide further insight as well (Ser-Giacomi et al., 2021).
We did not include the effect of wind and waves on the movement of macroplastic through the marine reserve and neglected the impact of tides. Furthermore, coastal processes such as rip currents and wind shadow are not included in the macroplastic flow model and likely play an important role for beaching (Moulton et al., 2023). These limitations could to some extent be removed if observational data sets are improved for both flow patterns of macroplastic through the reserve and estimates of macroplastic retention rate on coastlines of the Galapagos Islands. These would enable us to validate and adjust the connectivity matrix constructed in this paper. At this stage, it is important to note that the proposed cleanup targets on the Galapagos Islands highlighted in Fig. 7 are purely indicative and would benefit from a validation, for example, through organizing a campaign that measures the non-local impact of cleanup activities.
Finally, we want to stress that the network centralities are only useful if one can assess their impact. This paper presents a means of doing so, but also shows that the impact itself, and therefore the most successful centralities, depends on the management objectives posed. One could also optimize the cleanup strategy by combining different centrality rankings to further increase the impact, in particular, when available cleanup resources are limited. The next step would be to apply the connectivity method described in this paper to other regions across the globe. It would be interesting to see whether other island nations show a similar network structure and whether the same centralities lead to effective cleanup locations. This would mean that the optimal centrality measure is independent of local ocean dynamics and could potentially be used for cleanup strategies globally to reduce marine plastic debris.
Code and data used to conduct the experiment and to create all of the figures are available at https://doi.org/10.24416/UU01-QVIGJM (Ypma et al., 2022).
SLY and QB designed and conducted the study, the MITgcm velocity data were created by AF and ACNG. All authors contributed to the discussion of the analysis and the final manuscript.
The contact author has declared that none of the authors has any competing interests.
Publisher’s note: Copernicus Publications remains neutral with regard to jurisdictional claims in published maps and institutional affiliations.
We would like to thank Noam Vogt-Vincent and three anonymous reviewers whose comments improved our manuscript. We further acknowledge the support from the Galapagos National Park Directorate administration and marine plastics cleanup team.
Funding was provided to Stefanie L. Ypma by the Galapagos Conservation Trust and Evolution Education Trust, Pathways to Sustainability and the K.F. Hein Fonds. Alexander Forryan and Alberto C. Naveira Garabato acknowledge the support of the Royal Society (CHL/R1/180428).
This paper was edited by Anne Marie Tréguier and reviewed by three anonymous referees.
Amaral, L. A. N., Scala, A., Barthélémy, M., and Stanley, H. E.: Classes of Small-World Networks, P. Natl. Acad. Sci. USA, 97, 11149–11152, 2000. a
Andrady, A. L.: Microplastics in the Marine Environment, Mar. Pollut. Bull., 62, 1596–1605, https://doi.org/10.1016/j.marpolbul.2011.05.030, 2011. a, b
Arjona, Y., Fernández-López, J., Navascués, M., Alvarez, N., Nogales, M., and Vargas, P.: Linking Seascape with Landscape Genetics: Oceanic Currents Favour Colonization across the Galápagos Islands by a Coastal Plant, J. Biogeogr., 47, 2622–2633, https://doi.org/10.1111/jbi.13967, 2020. a
Brennan, E., Wilcox, C., and Hardesty, B. D.: Connecting Flux, Deposition and Resuspension in Coastal Debris Surveys, Sci. Total Environ., 644, 1019–1026, https://doi.org/10.1016/j.scitotenv.2018.06.352, 2018. a
Browne, M. A., Chapman, M. G., Thompson, R. C., Amaral Zettler, L. A., Jambeck, J., and Mallos, N. J.: Spatial and Temporal Patterns of Stranded Intertidal Marine Debris: Is There a Picture of Global Change?, Environ. Sci. Technol., 49, 7082–7094, https://doi.org/10.1021/es5060572, 2015. a
Buhl-Mortensen, L. and Buhl-Mortensen, P.: Marine Litter in the Nordic Seas: Distribution Composition and Abundance, Mar. Pollut. Bull., 125, 260–270, https://doi.org/10.1016/j.marpolbul.2017.08.048, 2017. a
Canals, M., Pham, C. K., Bergmann, M., Gutow, L., Hanke, G., van Sebille, E., Angiolillo, M., Buhl-Mortensen, L., Cau, A., Ioakeimidis, C., Kammann, U., Lundsten, L., Papatheodorou, G., Purser, A., Sanchez-Vidal, A., Schulz, M., Vinci, M., Chiba, S., Galgani, F., Langenkämper, D., Möller, T., Nattkemper, T. W., Ruiz, M., Suikkanen, S., Woodall, L., Fakiris, E., Jack, M. E. M., and Giorgetti, A.: The Quest for Seafloor Macrolitter: A Critical Review of Background Knowledge, Current Methods and Future Prospects, Environ. Res. Lett., https://doi.org/10.1088/1748-9326/abc6d4, 2020. a
Chamberlain, D. A., Possingham, H. P., and Phinn, S. R.: Decision-Making with Ecological Process for Coastal and Marine Planning: Current Literature and Future Directions, Aquat. Ecol., 56, https://doi.org/10.1007/s10452-021-09896-9, 2021. a
Chavez, F. P. and Brusca, R. C.: The Galápagos Islands and Their Relation to Oceanographic Processes in the Tropical Pacific, in: Galápagos Marine Invertebrates: Taxonomy, Biogeography, and Evolution in Darwin's Islands, edited by: James, M. J., Topics in Geobiology, Springer US, Boston, MA, 9–33, https://doi.org/10.1007/978-1-4899-0646-5_2, 1991. a
Critchell, K., Grech, A., Schlaefer, J., Andutta, F. P., Lambrechts, J., Wolanski, E., and Hamann, M.: Modelling the Fate of Marine Debris along a Complex Shoreline: Lessons from the Great Barrier Reef, Estuar. Coast. Shelf Sci., 167, 414–426, https://doi.org/10.1016/j.ecss.2015.10.018, 2015. a
Delandmeter, P. and van Sebille, E.: The Parcels v2.0 Lagrangian framework: new field interpolation schemes, Geosci. Model Dev., 12, 3571–3584, https://doi.org/10.5194/gmd-12-3571-2019, 2019. a
Denkinger, J. and Vinueza, L., eds.: The Galapagos Marine Reserve: A Dynamic Social-Ecological System, Social and Ecological Interactions in the Galapagos Islands, Springer International Publishing, Cham, https://doi.org/10.1007/978-3-319-02769-2, 2014. a
Escobar-Camacho, D., Rosero, P., Castrejón, M., Mena, C. F., and Cuesta, F.: Oceanic Islands and Climate: Using a Multi-Criteria Model of Drivers of Change to Select Key Conservation Areas in Galapagos, Reg. Environ. Change, 21, 47, https://doi.org/10.1007/s10113-021-01768-0, 2021. a, b
Fajardo, J., Mateo, R. G., Vargas, P., Fernández-Alonso, J. L., Gómez-Rubio, V., Felicísimo, Á. M., and Muñoz, J.: The Role of Abiotic Mechanisms of Long-Distance Dispersal in the American Origin of the Galápagos Flora, Glob. Ecol. Biogeogr., 28, 1610–1620, https://doi.org/10.1111/geb.12977, 2019. a
Forryan, A., Naveira Garabato, A. C., Vic, C., Nurser, A. J. G., and Hearn, A. R.: Galápagos Upwelling Driven by Localized Wind-Front Interactions, Sci. Rep., 11, 1277, https://doi.org/10.1038/s41598-020-80609-2, 2021. a, b, c, d
Gerritse, J., Leslie, H. A., de Tender, C. A., Devriese, L. I., and Vethaak, A. D.: Fragmentation of Plastic Objects in a Laboratory Seawater Microcosm, Sci. Rep., 10, 10945, https://doi.org/10.1038/s41598-020-67927-1, 2020. a
Goldstein, M. C., Titmus, A. J., and Ford, M.: Scales of Spatial Heterogeneity of Plastic Marine Debris in the Northeast Pacific Ocean, PLOS ONE, 8, e80020, https://doi.org/10.1371/journal.pone.0080020, 2013. a
Haarr, M. L., Westerveld, L., Fabres, J., Iversen, K. R., and Busch, K. E. T.: A Novel GIS-based Tool for Predicting Coastal Litter Accumulation and Optimising Coastal Cleanup Actions, Mar. Pollut. Bull., 139, 117–126, https://doi.org/10.1016/j.marpolbul.2018.12.025, 2019. a
Hagberg, A. A., Schult, D. A., and Swart, P. J.: Exploring Network Structure, Dynamics, and Function Using NetworkX, p. 5, 2008. a
Hinata, H., Mori, K., Ohno, K., Miyao, Y., and Kataoka, T.: An Estimation of the Average Residence Times and Onshore-Offshore Diffusivities of Beached Microplastics Based on the Population Decay of Tagged Meso- and Macrolitter, Mar. Pollut. Bull., 122, 17–26, https://doi.org/10.1016/j.marpolbul.2017.05.012, 2017. a
Holstein, D. M., Paris, C. B., and Mumby, P. J.: Consistency and Inconsistency in Multispecies Population Network Dynamics of Coral Reef Ecosystems, Mar. Ecol. Prog. Ser., 499, 1–18, https://doi.org/10.3354/meps10647, 2014. a
Jeon, Y. S., Hong, M. J., Park, M. K., and Choi, Y.-S.: Path Prediction and Suggestion of Efficient Collection Points for Marine Plastic Debris Based on Betweenness Centrality Analysis, J. Korean Soc. Environ. Eng., 37, 426–431, https://doi.org/10.4491/KSEE.2015.37.7.426, 2015. a
Jones, J. S., Porter, A., Muñoz-Pérez, J. P., Alarcón-Ruales, D., Galloway, T. S., Godley, B. J., Santillo, D., Vagg, J., and Lewis, C.: Plastic Contamination of a Galapagos Island (Ecuador) and the Relative Risks to Native Marine Species, Sci. Total Environ., 789, 147704, https://doi.org/10.1016/j.scitotenv.2021.147704, 2021. a, b, c
Jönsson, B. F. and Watson, J. R.: The Timescales of Global Surface-Ocean Connectivity, Nat. Commun., 7, 11239, https://doi.org/10.1038/ncomms11239, 2016. a
Kaandorp, M. L. A., Dijkstra, H. A., and van Sebille, E.: Closing the Mediterranean Marine Floating Plastic Mass Budget: Inverse Modeling of Sources and Sinks, Environ. Sci. Technol., 54, 11980–11989, https://doi.org/10.1021/acs.est.0c01984, 2020. a, b
Kaandorp, M. L. A., Ypma, S. L., Boonstra, M., Dijkstra, H. A., and van Sebille, E.: Using machine learning and beach cleanup data to explain litter quantities along the Dutch North Sea coast, Ocean Sci., 18, 269–293, https://doi.org/10.5194/os-18-269-2022, 2022. a, b, c, d
Kataoka, T. and Hinata, H.: Evaluation of Beach Cleanup Effects Using Linear System Analysis, Mar. Pollut. Bull., 91, 73–81, https://doi.org/10.1016/j.marpolbul.2014.12.026, 2015. a
Kataoka, T., Hinata, H., and Kato, S.: Backwash Process of Marine Macroplastics from a Beach by Nearshore Currents around a Submerged Breakwater, Mar. Pollut. Bull., 101, 539–548, https://doi.org/10.1016/j.marpolbul.2015.10.060, 2015. a, b
Kininmonth, S. J., De'ath, G., and Possingham, H. P.: Graph Theoretic Topology of the Great but Small Barrier Reef World, Theor. Ecol., 3, 75–88, https://doi.org/10.1007/s12080-009-0055-3, 2010. a, b
Lau, W. W. Y., Shiran, Y., Bailey, R. M., Cook, E., Stuchtey, M. R., Koskella, J., Velis, C. A., Godfrey, L., Boucher, J., Murphy, M. B., Thompson, R. C., Jankowska, E., Castillo, A. C., Pilditch, T. D., Dixon, B., Koerselman, L., Kosior, E., Favoino, E., Gutberlet, J., Baulch, S., Atreya, M. E., Fischer, D., He, K. K., Petit, M. M., Sumaila, U. R., Neil, E., Bernhofen, M. V., Lawrence, K., and Palardy, J. E.: Evaluating Scenarios toward Zero Plastic Pollution, Science, 369, 1455–1461, https://doi.org/10.1126/science.aba9475, 2020. a
Law, K. L., Morét-Ferguson, S., Maximenko, N. A., Proskurowski, G., Peacock, E. E., Hafner, J., and Reddy, C. M.: Plastic Accumulation in the North Atlantic Subtropical Gyre, Science, 329, 1185–1188, https://doi.org/10.1126/science.1192321, 2010. a
Lebreton, L. and Andrady, A.: Future Scenarios of Global Plastic Waste Generation and Disposal, Palgrave Commun., 5, 6, https://doi.org/10.1057/s41599-018-0212-7, 2019. a
Lebreton, L., Egger, M., and Slat, B.: A Global Mass Budget for Positively Buoyant Macroplastic Debris in the Ocean, Sci. Rep., 9, 12922, https://doi.org/10.1038/s41598-019-49413-5, 2019. a, b
Liu, Y., Xie, L., Morrison, J. M., Kamykowski, D., and Sweet, W. V.: Ocean Circulation and Water Mass Characteristics around the Galápagos Archipelago Simulated by a Multiscale Nested Ocean Circulation Model, Int. J. Ocean., 2014, e198686, https://doi.org/10.1155/2014/198686, 2014. a
Lobelle, D., Kooi, M., Koelmans, A. A., Laufkötter, C., Jongedijk, C. E., Kehl, C., and van Sebille, E.: Global Modeled Sinking Characteristics of Biofouled Microplastic, J. Geophys. Res.-Oceans, 126, e2020JC017098, https://doi.org/10.1029/2020JC017098, 2021. a
McAdam, R. and van Sebille, E.: Surface Connectivity and Interocean Exchanges From Drifter-Based Transition Matrices: Drifter-based interocean exchange, J. Geophys. Res.-Oceans,, 123, 514–532, https://doi.org/10.1002/2017JC013363, 2018. a
Mestanza-Ramón, C., Chica-Ruiz, J. A., Anfuso, G., Mooser, A., Botero, C. M., and Pranzini, E.: Tourism in Continental Ecuador and the Galapagos Islands: An Integrated Coastal Zone Management (ICZM) Perspective, Water, 12, 1647, https://doi.org/10.3390/w12061647, 2020. a
Morales-Caselles, C., Viejo, J., Martí, E., González-Fernández, D., Pragnell-Raasch, H., González-Gordillo, J. I., Montero, E., Arroyo, G. M., Hanke, G., Salvo, V. S., Basurko, O. C., Mallos, N., Lebreton, L., Echevarría, F., van Emmerik, T., Duarte, C. M., Gálvez, J. A., van Sebille, E., Galgani, F., García, C. M., Ross, P. S., Bartual, A., Ioakeimidis, C., Markalain, G., Isobe, A., and Cózar, A.: An Inshore–Offshore Sorting System Revealed from Global Classification of Ocean Litter, Nat. Sustain., 4, 484–493, https://doi.org/10.1038/s41893-021-00720-8, 2021. a, b
Moulton, M., Suanda, S. H., Garwood, J. C., Kumar, N., Fewings, M. R., and Pringle, J. M.: Exchange of Plankton, Pollutants, and Particles Across the Nearshore Region, Annu. Rev. Mar. Sci., 15, https://doi.org/10.1146/annurev-marine-032122-115057, 2023. a, b
Nelms, S., Coombes, C., Foster, L., Galloway, T., Godley, B., Lindeque, P., and Witt, M.: Marine Anthropogenic Litter on British Beaches: A 10-Year Nationwide Assessment Using Citizen Science Data, Sci. Total Environ., 579, 1399–1409, https://doi.org/10.1016/j.scitotenv.2016.11.137, 2017. a
Newman, M. E. J.: Networks, Oxford University Press, Oxford, United Kingdom; New York, NY, United States of America, second edition edn., ISBN: 978-0-19-880509-0, 2018. a, b
O'Malley, M., Sykulski, A. M., Laso-Jadart, R., and Madoui, M.-A.: Estimating the Travel Time and the Most Likely Path from Lagrangian Drifters, J. Atmos. Ocean. Tech., 38, 1059–1073, https://doi.org/10.1175/JTECH-D-20-0134.1, 2021. a, b
Onink, V., Jongedijk, C. E., Hoffman, M. J., van Sebille, E., and Laufkötter, C.: Global Simulations of Marine Plastic Transport Show Plastic Trapping in Coastal Zones, Environ. Res. Lett., 16, 064053, https://doi.org/10.1088/1748-9326/abecbd, 2021. a, b, c
Pata, P. R. and Yñiguez, A. T.: Spatial Planning Insights for Philippine Coral Reef Conservation Using Larval Connectivity Networks, Front. Mar. Sci., 8, https://doi.org/10.3389/fmars.2021.719691, 2021. a, b, c, d
Pawlowicz, R., Hannah, C., and Rosenberger, A.: Lagrangian Observations of Estuarine Residence Times, Dispersion, and Trapping in the Salish Sea, Estuarine, Coast. Shelf Sci., 225, 106246, https://doi.org/10.1016/j.ecss.2019.106246, 2019. a
Ryan, P. G., Weideman, E. A., Perold, V., and Moloney, C. L.: Toward Balancing the Budget: Surface Macro-Plastics Dominate the Mass of Particulate Pollution Stranded on Beaches, Front. Mar. Sci., 7, https://doi.org/10.3389/fmars.2020.575395, 2020. a
Ser-Giacomi, E., Vasile, R., Hernández-García, E., and López, C.: Most Probable Paths in Temporal Weighted Networks: An Application to Ocean Transport, Phys. Rev. E, 92, 012818, https://doi.org/10.1103/PhysRevE.92.012818, 2015. a
Ser-Giacomi, E., Legrand, T., Hernández-Carrasco, I., and Rossi, V.: Explicit and Implicit Network Connectivity: Analytical Formulation and Application to Transport Processes, Phys. Rev. E, 103, 042309, https://doi.org/10.1103/PhysRevE.103.042309, 2021. a
Sherman, P. and van Sebille, E.: Modeling Marine Surface Microplastic Transport to Assess Optimal Removal Locations, Environ. Res. Lett., 11, 014006, https://doi.org/10.1088/1748-9326/11/1/014006, 2016. a
Song, Y. K., Hong, S. H., Jang, M., Han, G. M., Jung, S. W., and Shim, W. J.: Combined Effects of UV Exposure Duration and Mechanical Abrasion on Microplastic Fragmentation by Polymer Type, Environ. Sci. Technol., 51, 4368–4376, https://doi.org/10.1021/acs.est.6b06155, 2017. a
Treml, E. A., Halpin, P. N., Urban, D. L., and Pratson, L. F.: Modeling Population Connectivity by Ocean Currents, a Graph-Theoretic Approach for Marine Conservation, Landscape Ecol., 23, 19–36, https://doi.org/10.1007/s10980-007-9138-y, 2008. a
van Sebille, E., Delandmeter, P., Schofield, J., Hardesty, B. D., Jones, J., and Donnelly, A.: Basin-scale sources and pathways of microplastic that ends up in the Galápagos Archipelago, Ocean Sci., 15, 1341–1349, https://doi.org/10.5194/os-15-1341-2019, 2019. a, b, c
Wang, K. C. M., Lee, K. E., and Mokhtar, M.: Solid Waste Management in Small Tourism Islands: An Evolutionary Governance Approach, Sustainability, 13, 5896, https://doi.org/10.3390/su13115896, 2021. a
Watson, J. R., Siegel, D. A., Kendall, B. E., Mitarai, S., Rassweiller, A., and Gaines, S. D.: Identifying Critical Regions in Small-World Marine Metapopulations, P. Natl. Acad. Sci. USA, 108, 907–913, 2011. a, b, c
Watts, D. J. and Strogatz, S. H.: Collective Dynamics of “Small-World” Networks, Nature, 393, 440–442, https://doi.org/10.1038/30918, 1998. a
Webb, D. J., Coward, A. C., and Snaith, H. M.: A comparison of ocean model data and satellite observations of features affecting the growth of the North Equatorial Counter Current during the strong 1997–1998 El Niño, Ocean Sci., 16, 565–574, https://doi.org/10.5194/os-16-565-2020, 2020. a
Weideman, E. A., Perold, V., Omardien, A., Smyth, L. K., and Ryan, P. G.: Quantifying Temporal Trends in Anthropogenic Litter in a Rocky Intertidal Habitat, Mar. Pollut. Bull., 160, 111543, https://doi.org/10.1016/j.marpolbul.2020.111543, 2020. a
Ypma, S. L., Bohte, Q., Forryan, A., Naveira Garabato, A., and van Sebille, E.: Code and data for the Galapagos macroplastic connectivity analysis, Utrecht University [code, data], https://doi.org/10.24416/UU01-QVIGJM, 2022. a