the Creative Commons Attribution 4.0 License.
the Creative Commons Attribution 4.0 License.
 | 14 Sep 2022
An update on dissolved methane distribution in the subtropical North Atlantic Ocean
Lukas Marx
Sarah Reynolds
Thierry Cariou
Edward Mawji
Cedric Boulart
Methane (CH4) is a potent greenhouse gas and plays a significant role in recent increasing global temperatures. The oceans are a natural source of methane contributing to atmospheric methane concentrations, yet our understanding of the oceanic methane cycle is poorly constrained. Accumulating evidence indicates that a significant part of oceanic CH4 is produced in oxygenated surface waters as a by-product of phytoplanktonic activity. This study focused on the subtropical North Atlantic Ocean (26∘ N, 80′ W and 26∘ N, 18′ W) where the distribution of dissolved CH4 concentrations and associated air–sea fluxes during winter 2020 were investigated. Water samples from 64 stations were collected from the upper water column up to depths of 400 m. The upper oxic mixed layer was oversaturated in dissolved CH4 with concentrations ranging 3–7 nmol L−1, with the highest concentrations of 7–10 nmol L−1 found to the east of the transect, consistent with other subtropical regions of the world's oceans. The high anomalies of dissolved CH4 were found to be associated with phosphate-depleted waters and regions where the abundance of the ubiquitous picocyanobacteria Synechococcus and Prochlorococcus were elevated. Although other phytoplanktonic phyla cannot be excluded, this suggests that cyanobacteria contribute to the release of CH4 in this region. The calculation of air–sea fluxes further confirmed the subtropical North Atlantic Ocean as a source of CH4. This study provides evidence to corroborate the key role that picocyanobacteria play in helping to explain the oversaturation of CH4 found in surface mixed layer of the open ocean, otherwise known as the “ocean methane paradox”.
- Article
(6922 KB) - Full-text XML
- BibTeX
- EndNote


Since the industrial revolution, the average global temperature has increased at the fastest rate in recorded history, primarily driven by growing emissions of greenhouse gases (GHGs). Among them, methane (CH4) is considered the second-largest contributor to Earth warming after carbon dioxide (CO2), with an atmospheric concentration of 1866 ppb (IPCC, 2021). Over the last 50 years, CH4 concentrations have increased by 20 % (Karl et al., 2008; Rhee et al., 2009) – and are expected to rise further by approximately 2 % yr−1 (Dang and Li, 2018).
Oceans were generally considered to be a minor contributor to the total global CH4 budget, yet recent calculations indicate that oceans could emit 6 to 17 Tg CH4 yr−1, i.e., 1 % to 10 % of the total natural emissions (Weber et al., 2019). This large variability reflects the great uncertainty in the contribution of natural sources due to a lack of data and understanding of the sources and controls of oceanic CH4 emissions.
The marine flux of CH4 results from the balance between production and oxidation processes; for instance, the microbial anaerobic oxidation of CH4 (AOM) in sediments significantly decreases CH4 fluxes to the atmosphere, thus representing an important carbon sink in the ocean (Oppo et al., 2020). In fact, the marine methane release is dominated by shallow coastal environments including estuaries (up to 75 %; Weber et al., 2019). In marine sediments CH4 can be released via microbial anaerobic methanogenesis as a consequence of the degradation of organic matter; it accumulates in the sediment, eventually forming gas hydrates, which may then be released into the overlying water column. Under the influence of pressure and temperature CH4 diffuses out of the sediment and ebullition carries CH4 to the atmosphere (Weber et al., 2019).
In open oxygenated waters, the primary mechanism controlling the CH4 emissions is aerobic methanotrophy that converts CH4 into CO2 (Weber et al., 2019). However, this process could be overcome by in situ production of CH4 in upper oxic waters that can significantly contribute to marine CH4 fluxes to the atmosphere. Typical CH4 depth distribution in the open ocean indicates a general oversaturation in the mixed layer (Reeburgh, 2007). In the surface waters of the Pacific Ocean (Weller et al., 2013), the Indian Ocean (Bui et al., 2018) and the Atlantic Ocean, values of 2–5 nmol L−1 and a maximum of 10 nmol L−1 were measured near the surface (Scranton and Brewer, 1977). These observations make the global ocean a net source of CH4 to the atmosphere with a weighted supersaturation of 120 % (Kock and Bange, 2007). Exemptions are the Southern Ocean and the central Arctic Ocean, where surface waters are undersaturated in CH4, either due to extensive upwelling supplying CH4-depleted water to the surface (Bui et al., 2018) or the limitation of air–sea exchanges by ice cover (Weber et al., 2019).
The oversaturation of the surface mixed layer, commonly known as the “ocean methane paradox” (OMP), was explained by the result of methanogenic activity from Archaea living within anaerobic cavities of zooplankton guts and anaerobic micro-environments inside sinking particles of organic matter (Reeburgh, 2007). Initially, only microbes from the Archaea domain were thought to have the capability of producing CH4 under strict anaerobic conditions. Although one cannot exclude this process to explain the methane paradox (Schmale et al., 2018) (Stawiarski et al., 2019), an increasing number of studies have revealed relationships between CH4 anomalies in surface waters and the presence of certain phytoplanktonic groups such as coccolithophores (Lenhart et al., 2016a) and cyanobacteria (Bižić et al., 2020)
Cyanobacteria are ubiquitous to every aqueous environment on Earth in both illuminated and dark water bodies (Percival, 2014). In the open ocean, small-sized picophytoplankton of the genera Prochlorococcus spp. and Synechococcus spp. account for ∼ 80 % of the total phytoplanktonic chlorophyll a (Hickman et al., 2010) and could represent up to 8.5 % and 16.7 % of the ocean net primary production (ONPP), respectively (Flombaum et al., 2013). Generally, nutrient limitation sets the upper limit for primary production and the distribution of Prochlorococcus and Synechococcus; the oligotrophic subtropical North Atlantic is in fact nitrogen–phosphorus (N–P) co-limited (Harvey et al., 2013), and hence cyanobacteria need to acquire these nutrients from alternative sources. New nitrogen to the surface ocean is introduced via biological nitrogen fixation by diazotrophs, which can supply up to 163.2 Tg of new nitrogen per year globally (Wang et al., 2019). With regard to P, Prochlorococcus and Synechococcus mostly depend on the remineralization of dissolved organic phosphorus (DOP) via hydrolytic enzymes (e.g., alkaline phosphatase; Muñoz-Marín et al., 2020). Additionally, evidence is mounting that cyanobacteria are major sources of semi-labile dissolved organic matter (DOM) phosphonates (Repeta et al., 2016). The bacterial degradation of methylphosphonates (MPn) releases CH4, and therefore cyanobacteria are thought to play a key role in the global marine CH4 flux. In situ production of CH4 is a repercussion from different metabolic pathways, including the conversion of methylated substrates, and is induced by environmental stress (e.g., nutrient supply and variations in temperature, salinity and light attenuation). As such, CH4 may be the by-product of the methylphosphonate remineralization in phosphate-stressed surface waters, i.e., the MPn way (Karl et al., 2008; Bižić et al 2020). Due to the strong depletion of inorganic phosphorus in oligotrophic areas in the Atlantic and the Pacific Ocean, cyanobacteria use the organic phosphonates as a P source (Feingersch et al., 2012), leading to the release of methyl groups in the water that are rapidly converted into CH4 (Beversdorf et al., 2010). In contrast, nitrate availability might control CH4 production in phosphate-replete surface waters. While in P-limited waters cyanobacteria use methylphosphonate as a nutrient source and hence release CH4, in N-limited waters, CH4 may result from the breakdown of DMSP (dimethylsulfoniopropionate), a subsequent demethylation of DMS (dimethyl sulfide) and inherently the oxidation of dissolved methyl groups (Florez-Leiva et al., 2013). Other environmental parameters, such as variations in temperature or light attenuation, may also influence CH4 formation, although data are lacking to fully understand the metabolic pathways leading to CH4 production.
In the current context of climate change and warming ocean waters, we are likely to expect a shift in the community of primary producers towards smaller-sized cyanobacteria such as Prochlorococcus and Synechococcus (van de Waal and Litchman, 2020), with a concurrent decrease in total biomass in the open ocean (Marinov et al., 2010). Yet, with accumulating evidence on the importance of the cyanobacterial contribution to CH4 production and given the important role of CH4 as a potent GHG, it is crucial to intensify the monitoring and investigating of CH4 production and fluxes in surface oceanic waters in order to feed a global database (Bange et al., 2009). There is a lack of data to comprehend the current and future role of the Earth's oceans and primary production in relation to the global CH4 budget.
In the present paper, we provide an update on the dissolved CH4 concentrations and air–sea fluxes of CH4 in surface waters of the subtropical North Atlantic Ocean as part of the JC191 hydrographical cruise (RRS James Cook, January–March 2020). Furthermore, we present data on the distribution of the two dominant cyanobacteria, Prochlorococcus and Synechococcus, to highlight the contribution of the planktonic community to the CH4 flux. More specifically, our objectives were to confirm the presence of CH4 anomalies in surface waters and the associated air–sea fluxes, as well as to propose possible mechanisms and sources controlling the CH4 distribution by examining the relationships between physicochemical and biological parameters.
2.1 Water sampling and analysis for dissolved gas concentrations
Seawater samples were collected during the JC191 hydrographical cruise (as part of the GO-SHIP program, PI A. Sanchez-Franks; Sanchez-Franks, 2020) on board the RRS James Cook between January and March 2020 along a west–east transect in the subtropical North Atlantic from Fort Lauderdale (Florida), USA, to Santa Cruz de Tenerife, Spain, on the nominal 24∘ N parallel. 64 profiles (out of 135 stations occupied by CTD – conductivity, temperature, depth – casts in total) from the surface to 400 m depth (or full depth for the shallower continental margin stations) were sampled (Fig. 1).
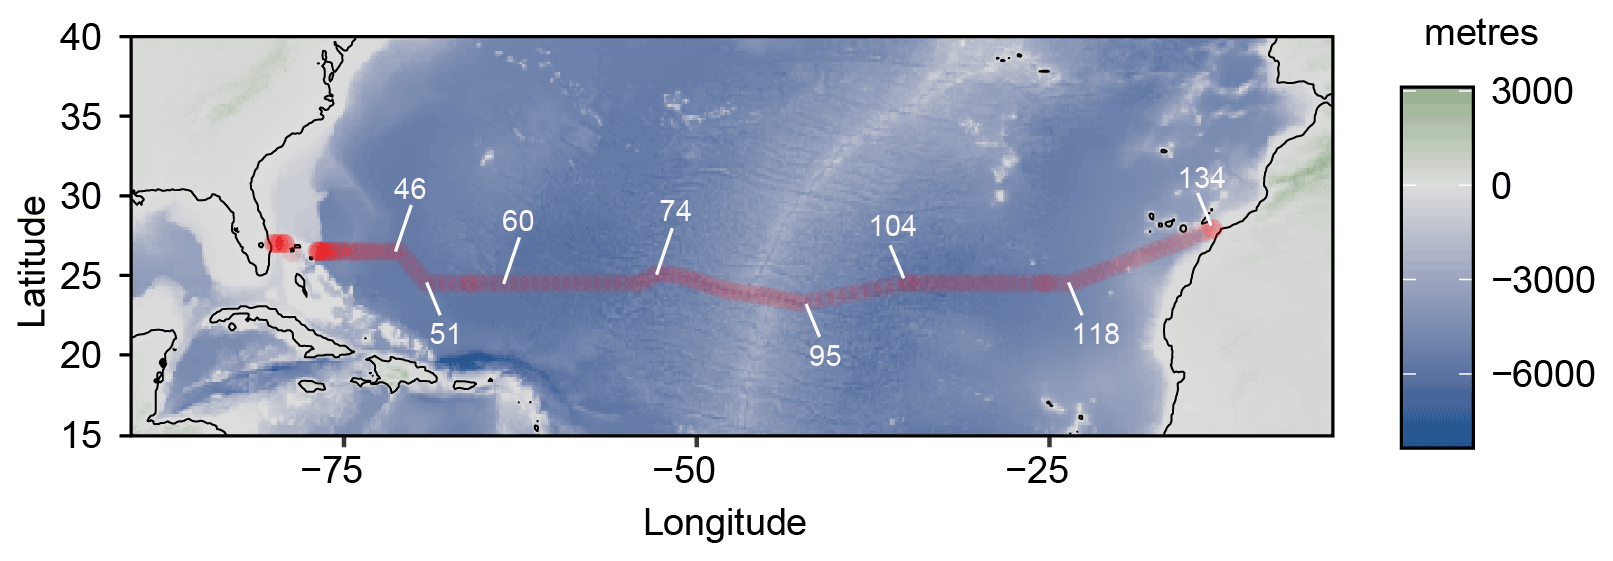
Figure 1Cruise track of the JC191 24N expedition from Fort Lauderdale (Florida), USA, to Santa Cruz de Tenerife, Spain (January–March 2020). White numbers indicate some of the total 135 CTD stations.
Water samples for dissolved CH4 measurements were collected into 20 mL headspace vials using a 24-Niskin-bottle rosette equipped with a SBE911+ CTD, an AquaTracka III fluorometer (Chelsea Technologies) and a dissolved oxygen sensor (Sea-Bird SBE 43). Dissolved gas samples were poisoned with Hg(Cl)2, then fitted with Teflon stopcocks and crimp-sealed under exclusion of any air bubbles. Samples were immediately stored at 4 ∘C after sampling until analysis onshore at the Station Biologique de Roscoff.
Gas extraction and analyses were performed using a Shimadzu headspace sampler (HS-20) connected to a gas chromatograph (Shimadzu GC-2030) fitted with a barrier discharge ionization detector (BID) and a 30 m SH-Rt-MSieve 5A column. With this setup, headspace extraction is entirely automated with pressurization of the sample up to 2 bar, heating at 90 ∘C and equilibration for 7 min. An aliquot of the gas sample was transferred to a 1 mL injection loop, maintained at 150 ∘C and injected into a 50 ∘C heated column. Calibrations were made by injecting a known volume of standard gas (Messer®, 1000, 500 and 100 ppm ± 1 ppm CH4 in helium and 500 ppb H2 in helium). All analyses were made in duplicate, and results are given as averaged values. The detection threshold of this method is 0.2 nmol for dissolved CH4, and variation between duplicates was 5 %.
2.2 Inorganic nutrient analysis
Samples for inorganic nutrient analysis (NO, NO, NH, PO) were collected unfiltered into sterile 15 ml centrifuge tubes (rinsed three times with water from the same Niskin). Samples were analyzed directly from the collection tubes within 1–8 h and measured from the lowest to the highest concentration (surface to deep) to reduce any carryover effects. Nutrients were analyzed on board using a four-channel Seal Analytical AA3 segmented flow autoanalyzer following GO-SHIP protocols (Becker et al., 2020). In order to test the accuracy and precision of the analyses, certified reference materials (CRMs) from KANSO Technos Co. (lots lot CD, CJ, CI and lot BW) were measured in triplicate in every run.
2.3 Cyanobacteria sampling and analysis
38 of the stations occupied during JC191 were sampled at six depths in the upper water column (max. sampling depth 375 m) following the live fluorescence profiles to determine the prevailing community of primary producers (unpublished data, Marx 2020). Bulk water samples (5 L) were collected from Niskin bottles, from which subsamples for the flow cytometric determination of Prochlorococcus and Synechococcus abundances were collected. 4 mL of sample water was immediately fixed with 40 mL glutaraldehyde solution (50 %) and stored at 4 ∘C until transferred to a low-temperature freezer (−80 ∘C) after 12 h.
Samples were analyzed at the University of Portsmouth on a CyFlow Cube 8 (Sysmex) flow cytometer immediately after defrosting and at a flow rate of 1 µL s−1. The distinction between Prochlorococcus and Synechococcus was achieved by gating each group according to its fluorescence signals (red and orange fluorescence) against the size fractionation (forward and side scatter). For each of the stations sampled, the mixed layer depth (MLD, defined as the depth at which temperature decreased by 1 ∘C from the surface) was determined, and the integrated average in abundance above said MLD was calculated.
2.4 Statistical analyses
In order to determine the biological and physicochemical parameters that influence the distribution of dissolved methane in surface waters, a principal component analysis (PCA) was applied. This statistical tool simplifies the underlying structure of the multivariate dataset by converting a large number of variables into a smaller number of variables, i.e., components (PCs), with a minimum loss of information. Each PC is associated with an eigenvalue that indicates the variation in the data. Here, the PCA computes a singular value decomposition of the data matrix and does not incorporate the eigenvalue of the covariance matrix to maintain numerical accuracy. Then, factor loadings were calculated, with a high factor loading indicating a significant correlation between variables. Additionally, Kendall rank correlations were computed to evaluate associations between two variables (e.g., methane concentrations and fluorescence or phytoplankton abundances). All statistics were performed with RStudio and the R “stats package” (R Core Team, 2013).
2.5 Flux calculation
The flux of air–sea CH4 was calculated following established methods (Kelley and Jeffrey, 2002; Wanninkhof, 2014):
where F is the CH4 flux (mol m−2 d−1) from seawater to air, with k as a gas transfer coefficient under consideration of wind speed, Cw as the average CH4 concentration measured in surface water and Ca as the equilibrated seawater–air CH4 concentration. Wind speed data were obtained from on-ship measurements throughout the cruise transect, and the concentration of CH4 in the air was assumed to be 1.9 ppm (based on NOAA, Global Monitoring Laboratory https://gml.noaa.gov/ccgg/trends_ch4/, last access: 28 August 2022). The gas transfer coefficient k was calculated following
where <U2> represents the average neutral stability of winds at 10 m height squared, and Sc indicates the Schmidt number, taking into account the kinematic viscosity of water and the molecular diffusion coefficient of the gas. From inverse modeling using CCMP winds and the Modular Ocean Model–General Circulation Model (MOM3 GCM), a value of 0.251 was obtained. Sc was calculated as
with coefficients A, B, C, D and E obtained from a least square fourth-order polynomial fit (Wanninkhof, 2014).
3.1 Spatial distribution of physicochemical parameters
CH4 concentrations in surface waters of the subtropical North Atlantic along the 24∘N transect were distributed nonuniformly between 3 and 10 nmol L−1, i.e., systematically above saturation of ∼ 2.7 nmol L−1. The lowest concentrations of CH4 of 3–4 nmol L−1 were found in the central gyre system above the mid-Atlantic ridge (∼ 45∘ W), with increasing values of 8–10 nmol L−1 in both western and eastern boundaries closer to the continental shelf (Fig. 2a).
Chlorophyll a (Chl a, Fig. 2b) from real-time fluorescence profiles exhibits the highest concentrations near both the western and eastern shore systems and the lowest concentrations in surface waters throughout the central gyre system (<0.1 µg L−1, Fig. 2). A deep chlorophyll maximum (DCM) was observed between 100 and 130 m water depth and was consistently above the mixed layer depth (MLD). Concentrations of Chl a increase towards the Mauritanian upwelling off the North African coast to above 0.4 µg L−1, indicating higher primary production due to enhanced nutrient supply. Accordingly, light transmission is decreased due to higher content of suspended particles in the water column (Fig. 2h). Furthermore, fluorescence aligns with patterns of dissolved oxygen in the water column of this transect. The surface waters in the subtropical North Atlantic are well oxygenated with concentrations above 200 µmol kg−1 in the top 100 m of the water column, subsequently decreasing with depth. Increased concentrations of dissolved oxygen are observed towards the eastern boundary following enhanced lateral transport from the coastal upwelling (Fig. 2e).
Nitrate and phosphate concentrations were low (<0.1, <0.01 µmol kg−1, respectively) in surface waters throughout the transect with nutriclines >200 m depth, shallowing (<150 m in eastern basin and <100 m in eastern boundary) towards the eastern boundary due to coastal upwelling off the eastern North African coast and associated enhanced mixing of deep, nutrient-enriched waters into surface waters (Fig. 2c and d).
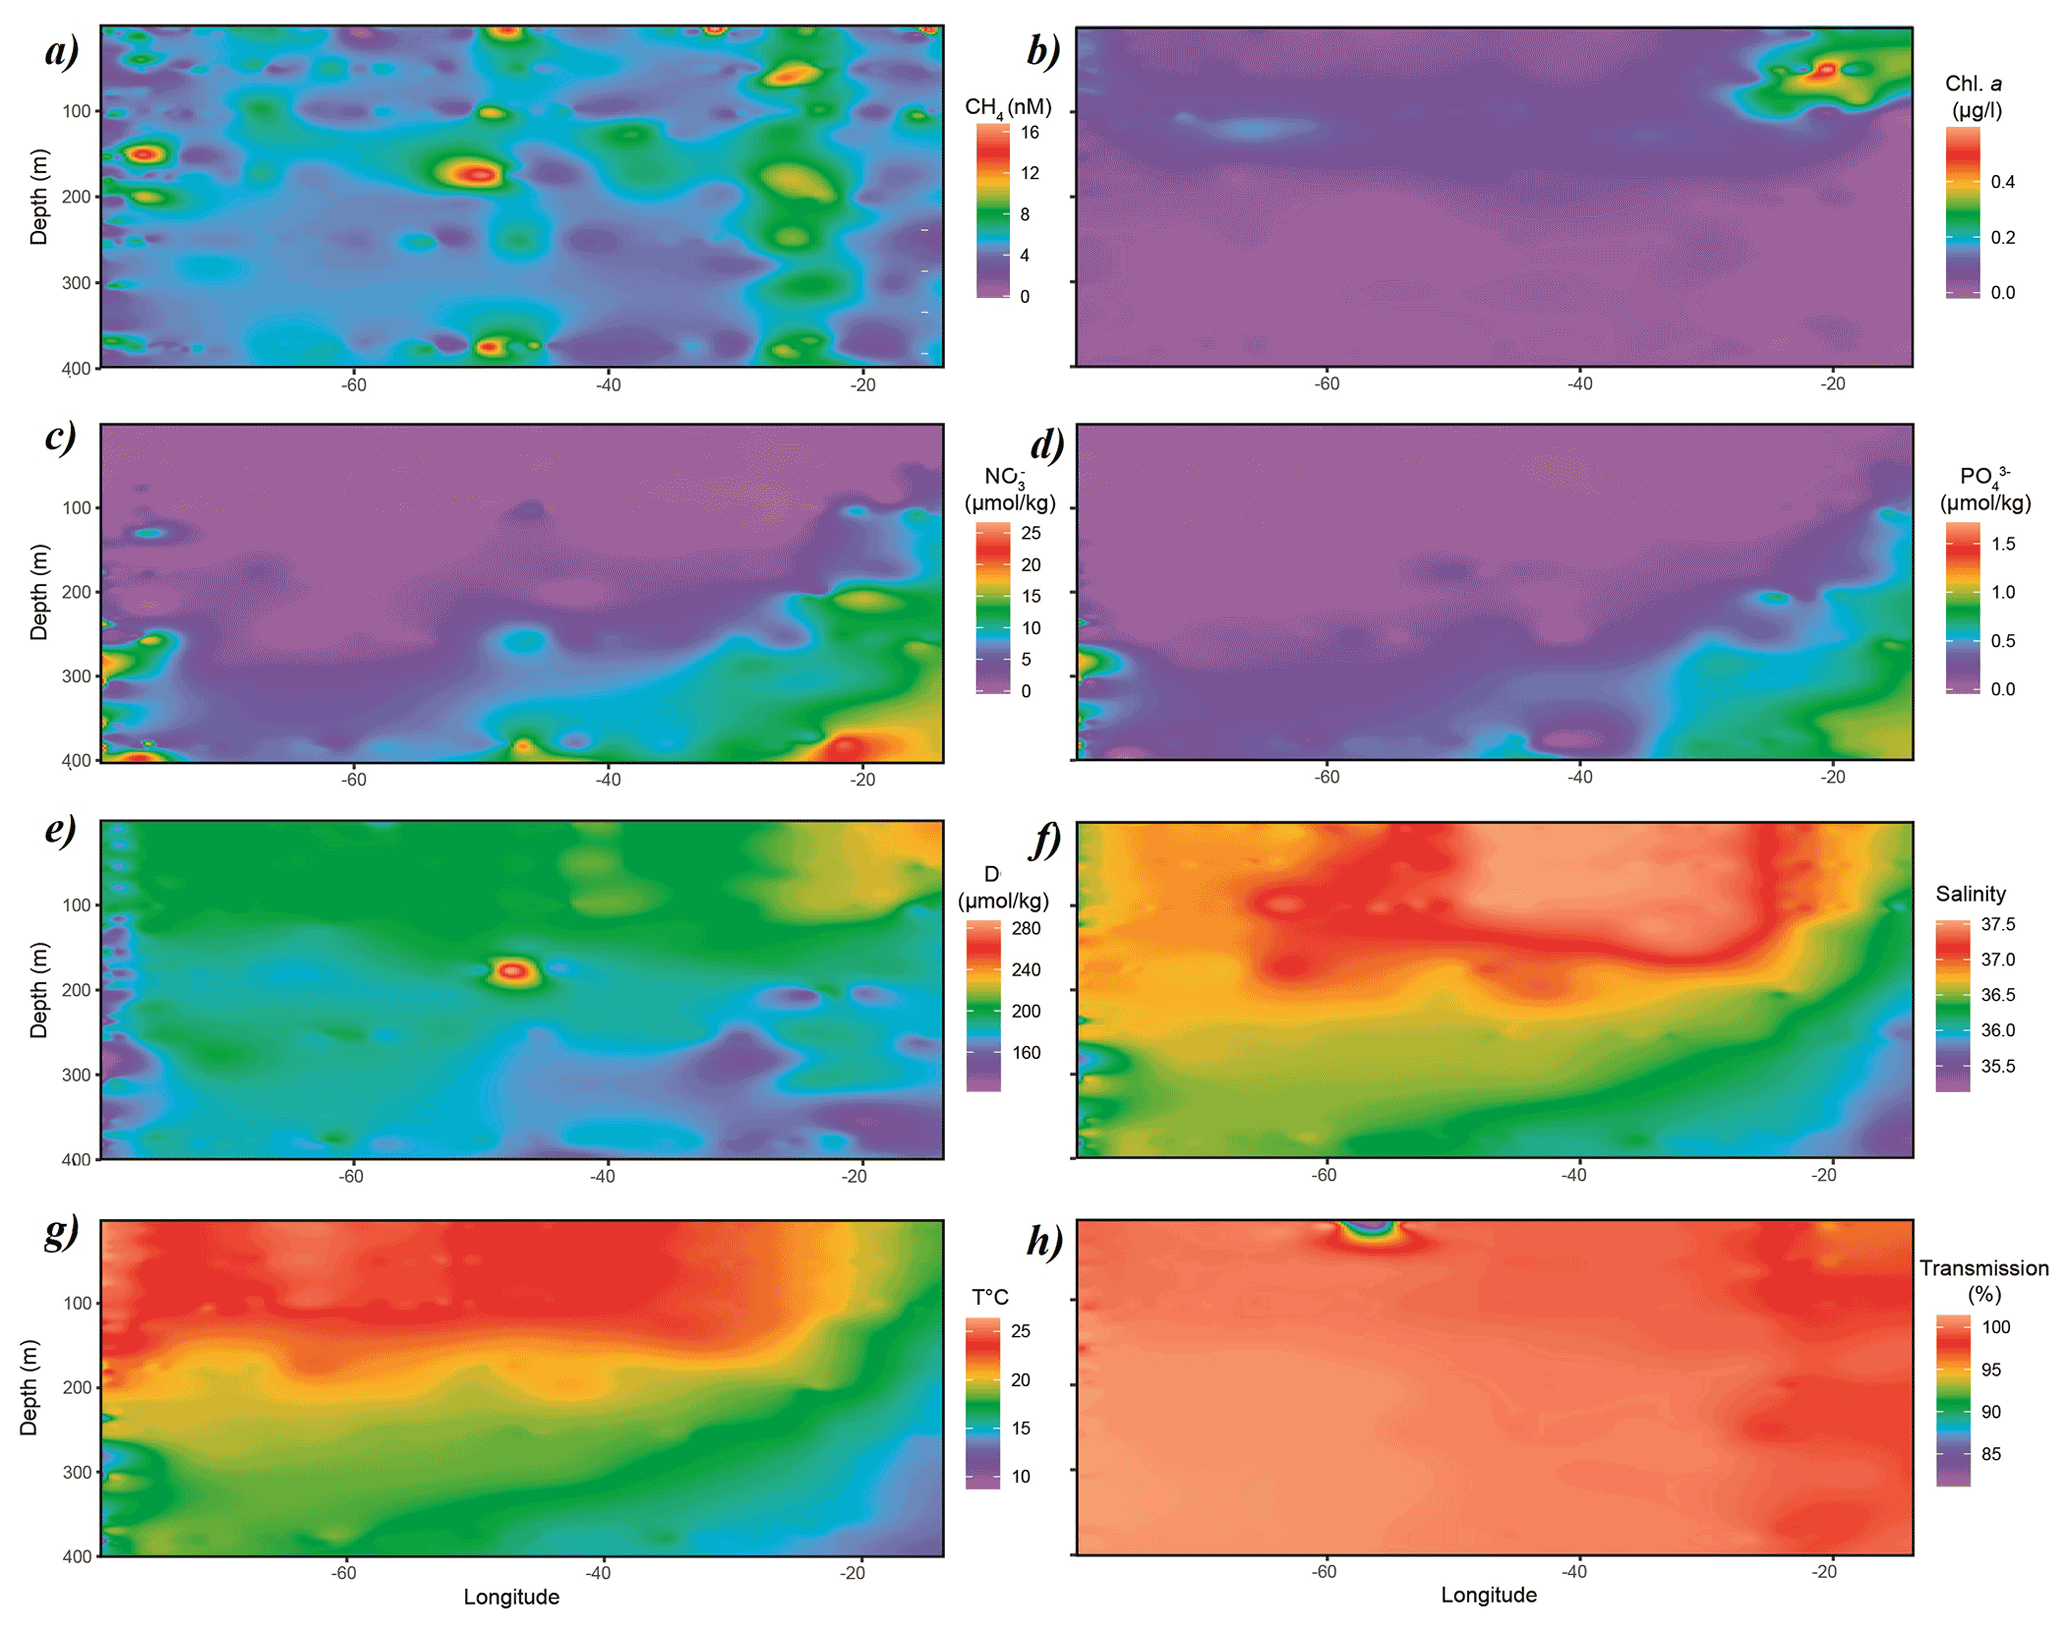
Figure 2Distribution of (a) CH4, (b) Chl a, (c) NO3, (d) PO4, (e) dissolved oxygen, (f) salinity, (g) temperature and (h) transmission along the cruise track. Chl a, dissolved oxygen, salinity, temperature and transmission data originate from sensors attached to the CTD. CH4, NO3 and PO4 were measured analytically. Some of the data were taken from CCHDO (Sanchez-Franks, 2020).
3.2 Sea-to-air methane flux
At most stations, air–sea CH4 flux was 1–2 µmol m−2 d−1, with maximum values of 5 µmol m−2 d−1 in the area of 24∘ N 25∘ W (Fig. 3). Only one station (∼ 40∘ W) had a negative CH4 flux, which indicates a sink of CH4. The overall average flux across the subtropical North Atlantic was 1.9 µmol m−2 d−1. However, it should be noted that the air–sea flux of CH4 is dependent on the wind speed and can be locally different, varying depending on specific weather conditions.

Figure 3Sea-to-air CH4 flux (µmol m−2 d−1) along the cruise track of JC191. Dots indicate stations occupied by CTD casts.
Although the sea-to-air flux of CH4 presented here broadly agrees with similar values of 1.6 µmol m−2 d−1 measured in the oligotrophic North Pacific, it can differ substantially both temporarily and spatially. For instance, the sea-to-air flux of CH4 in the Sargasso Sea, also partly encompassed in the transect of JC191, fluctuates between 1.6 and 4.4 µmol m−2 d−1 depending on the season and weather conditions (Holmes et al., 2014). Furthermore, the base ecosystem can impact the sea-to-air flux of CH4 if compared to other oceanic regions such as Belgian coastal zones with 1–160 µmol CH4 m−2 d−1 (Borges et al., 2016), Red Sea mangroves with 13.3 µmol CH4 m−2 d−1 (Sea et al., 2018), or surveys in the East China Sea (6.5–7.4 µmol m−2 d−1, Ye et al., 2015) and the Gulf of Mexico (0.38 µmol m−2 d−1, Kelley and Jeffrey, 2002).
4.1 Methane distribution in surface waters of the subtropical North Atlantic Ocean
Our data across the subtropical North Atlantic Ocean unambiguously indicate an oversaturation in CH4 of the surface layer (400 m) of 110 % to 370 %, which is in agreement with previous observations describing concentrations varying between 2 and 5 nmol L−1 and maximum values of 10 nmol L−1 (Scranton and Brewer, 1977; Conrad and Seiler, 1988; Forster et al., 2009; de la Paz et al., 2015; Leonte et al., 2020). This is also in line with previous observations describing the upper layer in subtropical areas of the global ocean as a source of CH4 to the atmosphere (Reeburgh, 2007; Dang and Li, 2018) and also in some regions of the Arctic Ocean (Kitidis et al., 2010; Kudo et al., 2018). To date, only the Southern Ocean is undersaturated in CH4, although this is limited by the scarcity of data collected, highlighting the need for increased surveying to be complemented (Bui et al., 2018).
The distribution of dissolved CH4 was variable across the subtropical North Atlantic, with higher concentrations in the eastern basin (65–80∘ W) and the western basin (15–30∘ W) and the lowest concentrations measured in the central gyre system of the transect (30–65∘ W) (Fig. 2). The vertical distribution of CH4 appears to be associated with fluorescence; the highest concentrations of CH4 were found at ∼ 100 m depth, where fluorescence and dissolved oxygen are highest and nutrients levels lowest, which is in agreement with previous findings (Kudo et al., 2018).
PCA was applied to the datasets collected to identify which environmental parameters (nutrients, fluorescence, dissolved oxygen, temperature, salinity, depth, transmission) are related to or influence the distribution of CH4 along the transect. 54 % of the variability could be explained by the first component, which is primarily controlled by depth (Fig. 4). CH4 is mainly associated with oxygenated surface waters, characterized by low concentrations of nutrients and a higher fluorescence. However, the weak contribution of CH4 to the first two components may be due to the heterogeneity of its distribution. To fully understand the relationship between the different parameters controlling the distribution of CH4, we therefore separated the transect into three main regions, i.e., (i) the western basin, (ii) the central gyre system and (iii) the eastern basin. The PCA applied to the regionalized dataset (Fig. 5) revealed that CH4 is clearly associated with the abundance of primary producers in surface waters (<100 m) in the western basin, while in the central gyre and eastern basin CH4 concentrations were also influenced either by in situ physical processes such as mixing or mesoscale eddies (Kudo et al., 2018) or by external inputs such as the Mauritanian upwelling that supplies CH4-enriched waters to the upper layer (Conrad and Seiler, 1988).
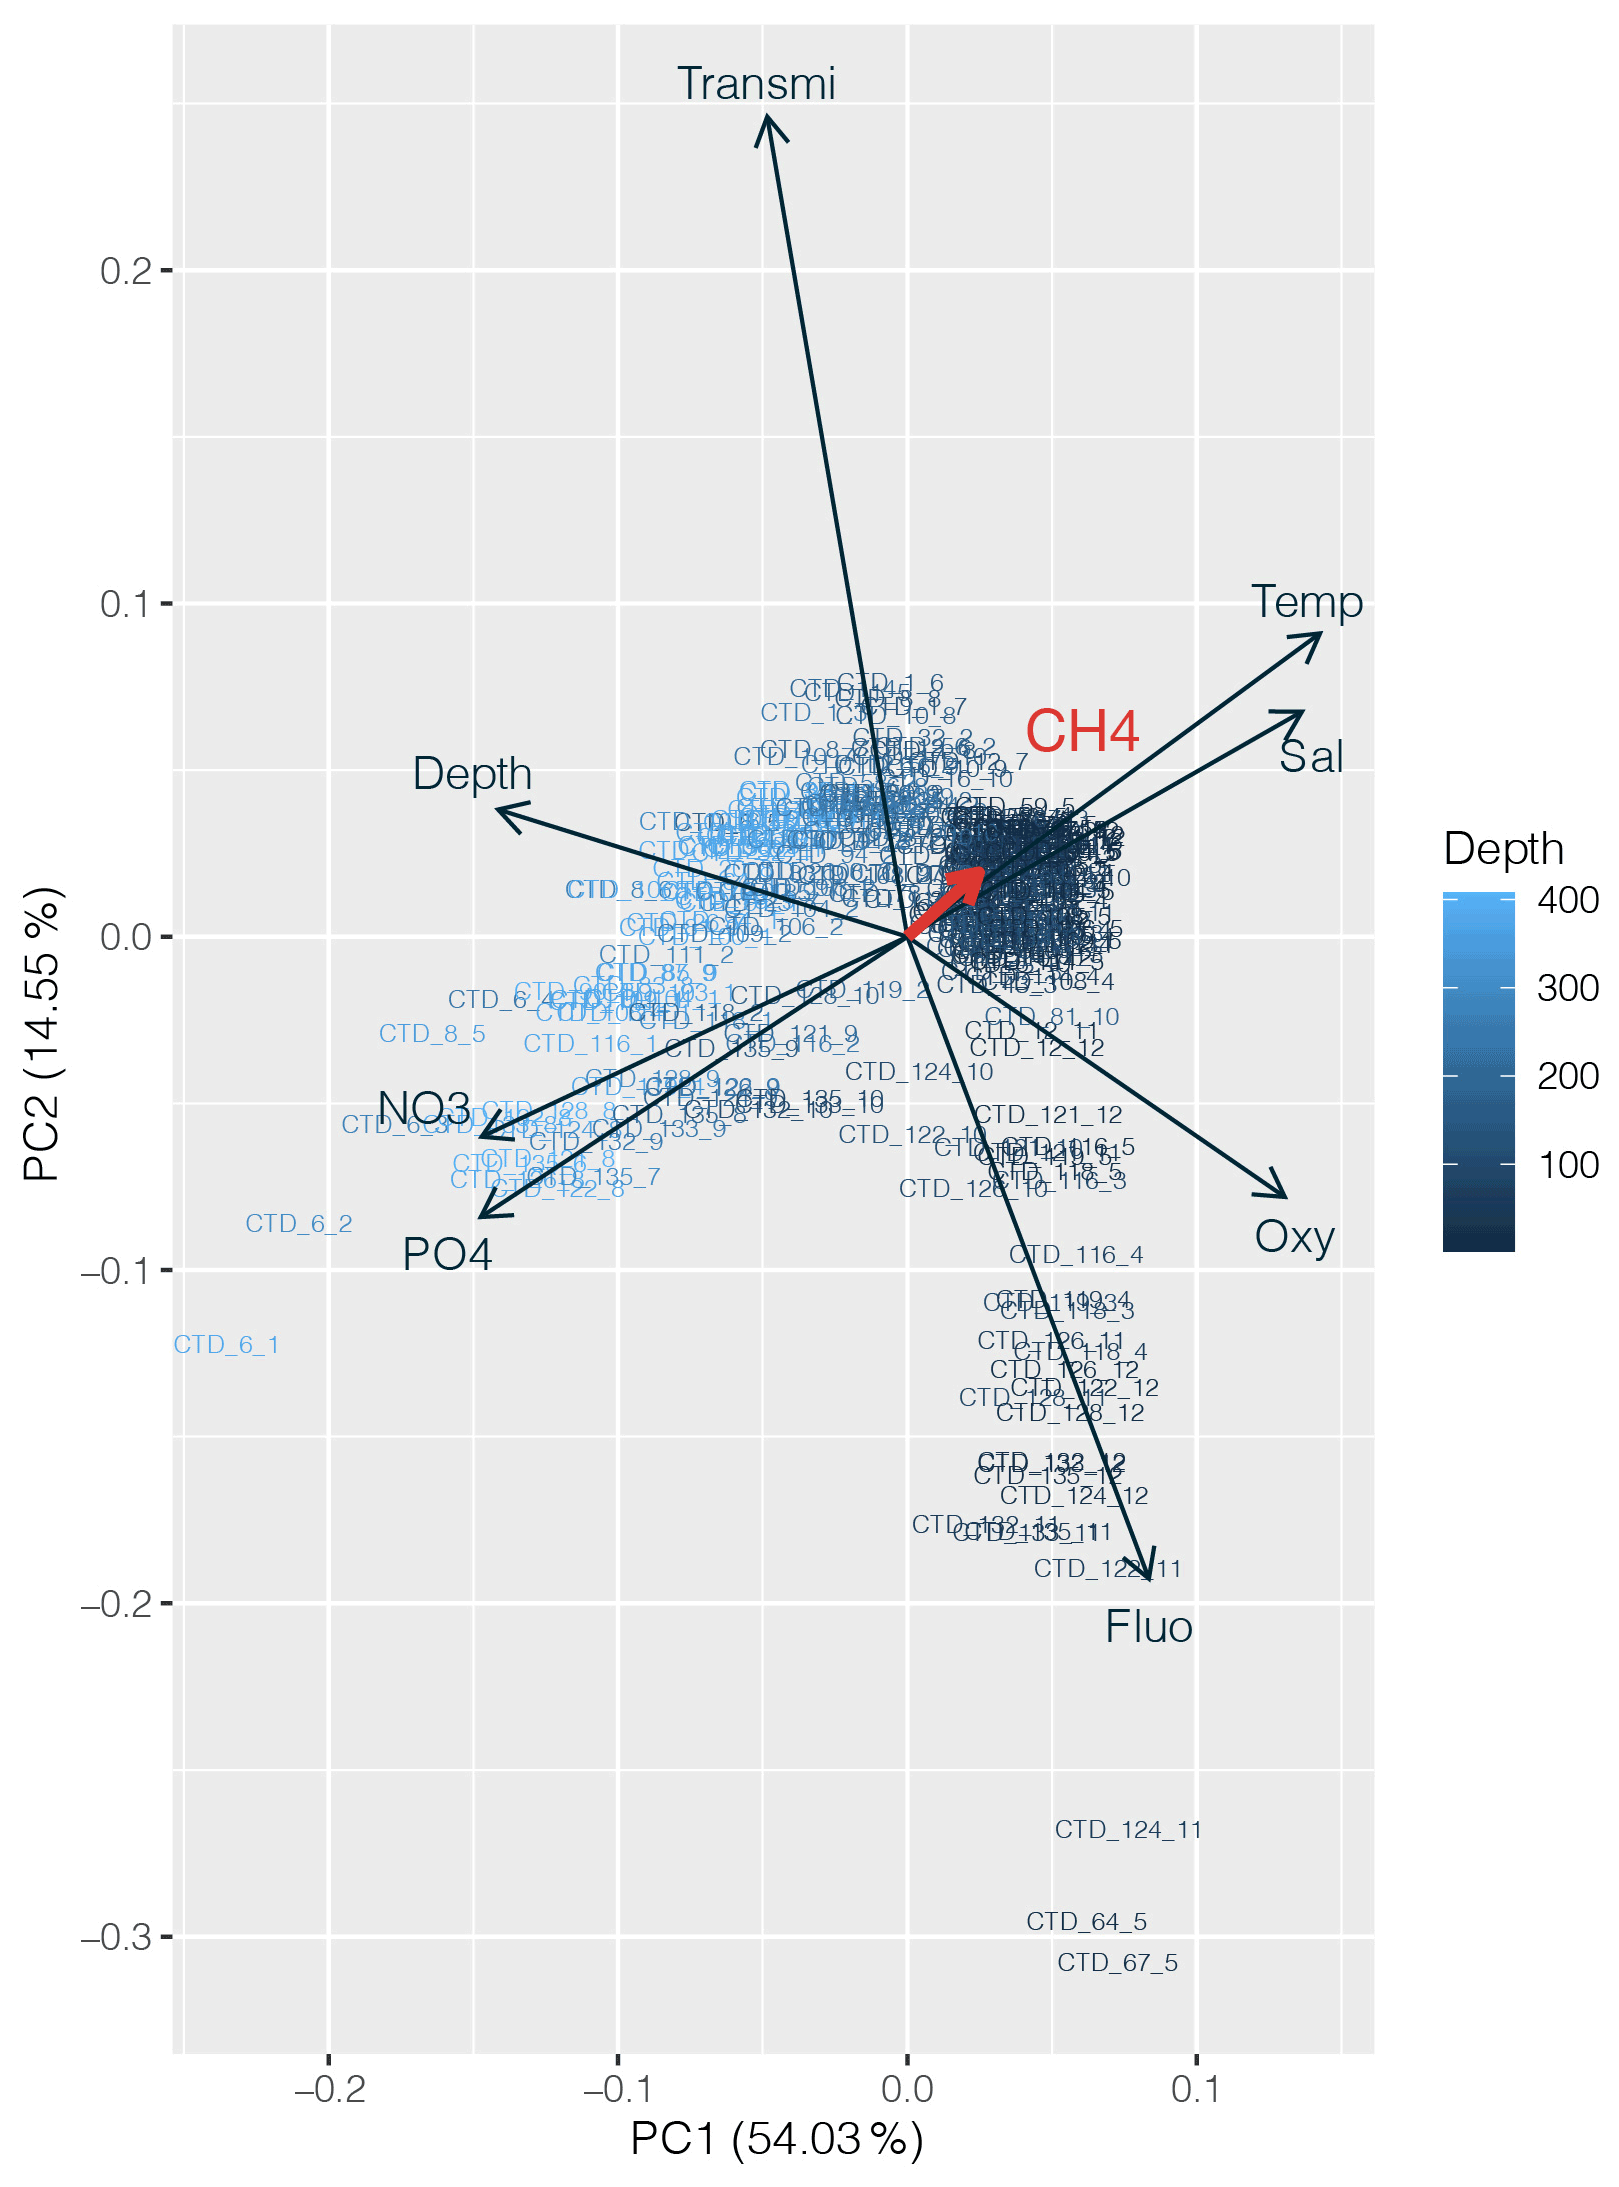
Figure 4Principal component analysis (PCA) between dissolved CH4 concentrations (in red) and other physicochemical parameters (nutrients, depth, fluorescence, temperature, salinity and turbidity). Numbers on the x and y axes indicate the factor loadings of each variable of each principal component (PC). The percentages show the explained variability in the dataset by each PC.
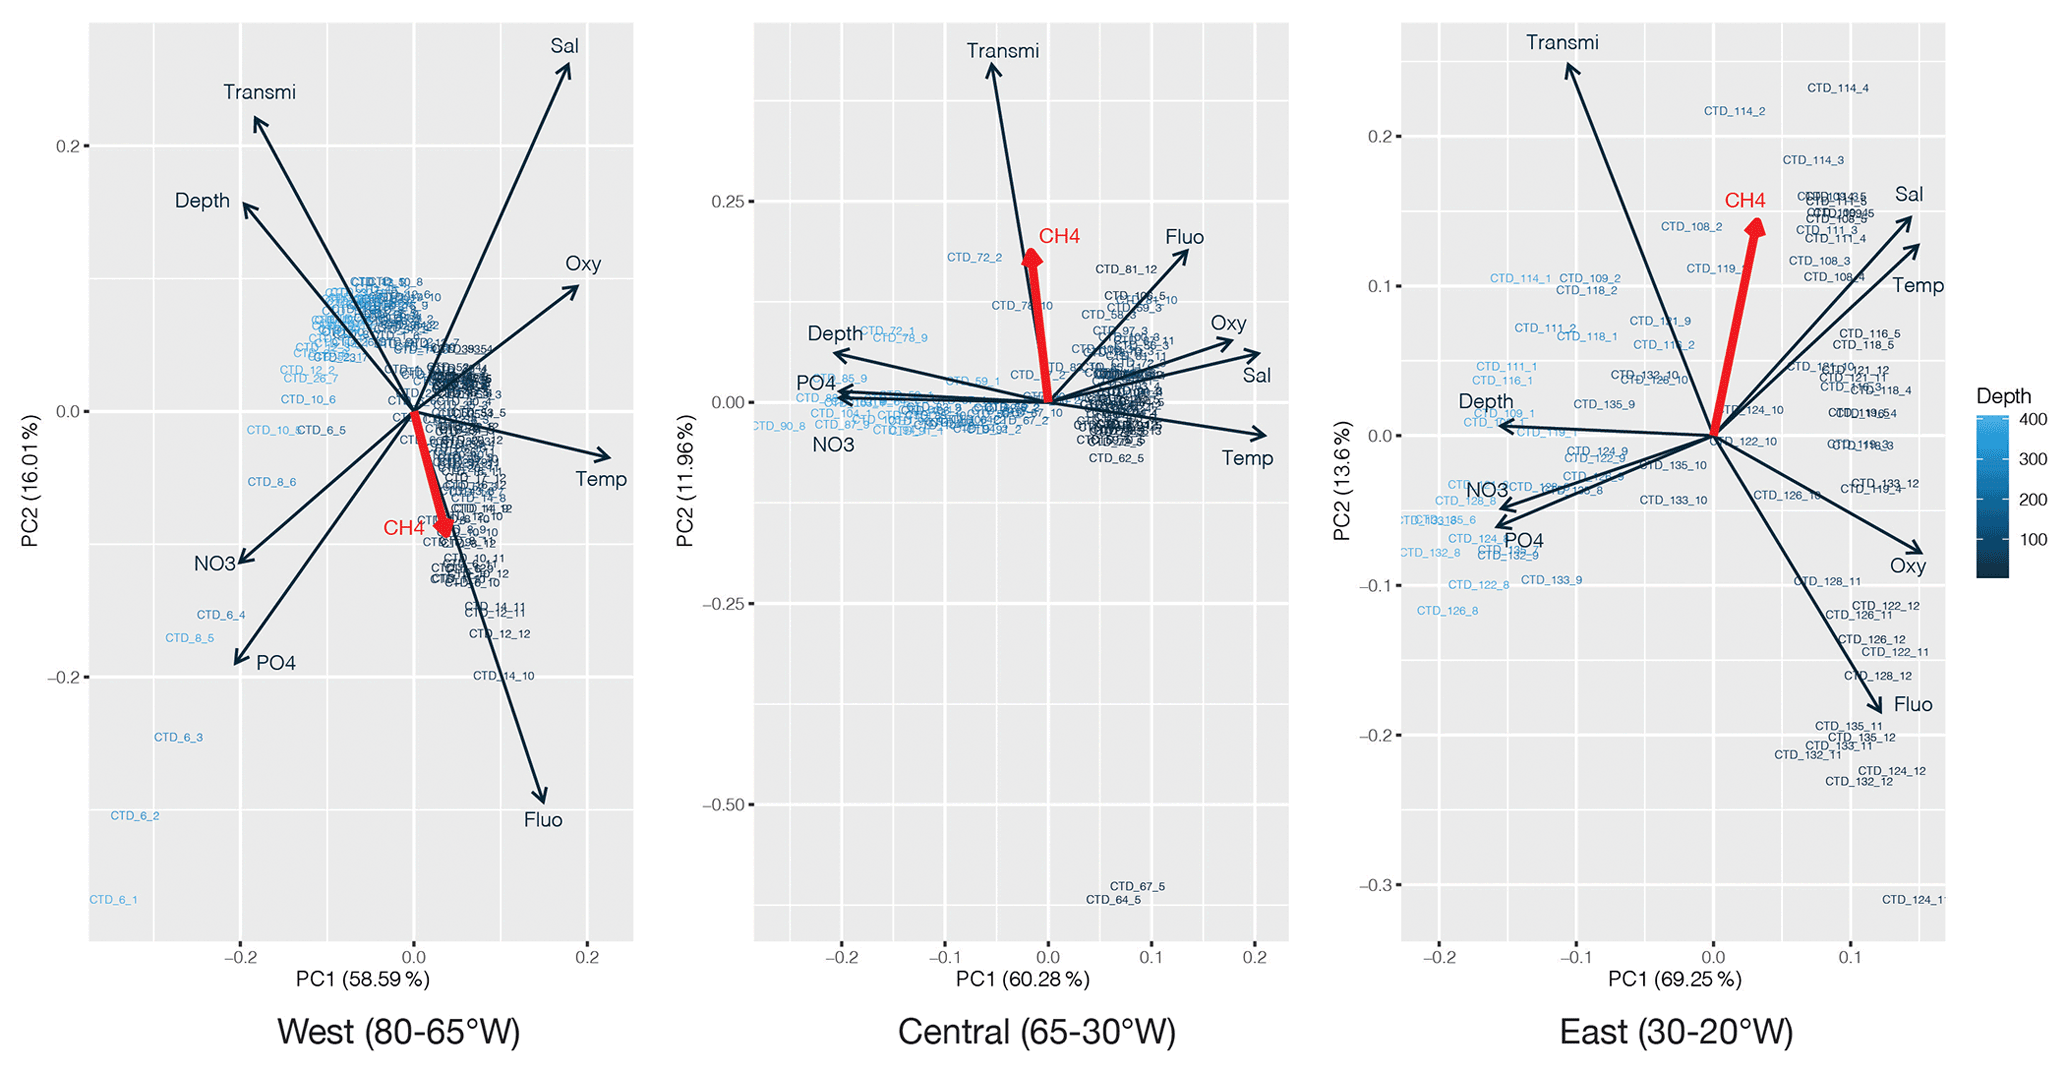
Figure 5Principal component analysis of the regionalized dataset: west (80–65∘ W), central (65–30∘ W) and east (30–20∘ W). Numbers on the x and y axes indicate the factor loadings of each variable of each principal component (PC). The percentages show the explained variability in the dataset by each PC. CH4 is highlighted in red.
Although CH4 appeared to have a uniform vertical distribution (Fig. 2), selected profiles of CH4, Chl a, phosphate and dissolved oxygen from two areas of interest, CTD 50 (69.5∘ W, 24.9∘ N) and CTD 122 (20.8∘ W, 25.45∘ N), showed that the highest concentration of CH4 in fact corresponds to the maxima of Chl a and dissolved oxygen and the lowest concentrations of phosphate (Fig. 6). The correlation between CH4 and Chl a (Kendall rank correlation test, r2=p<0.05) further suggests that the primary producers play a role in the production of CH4.
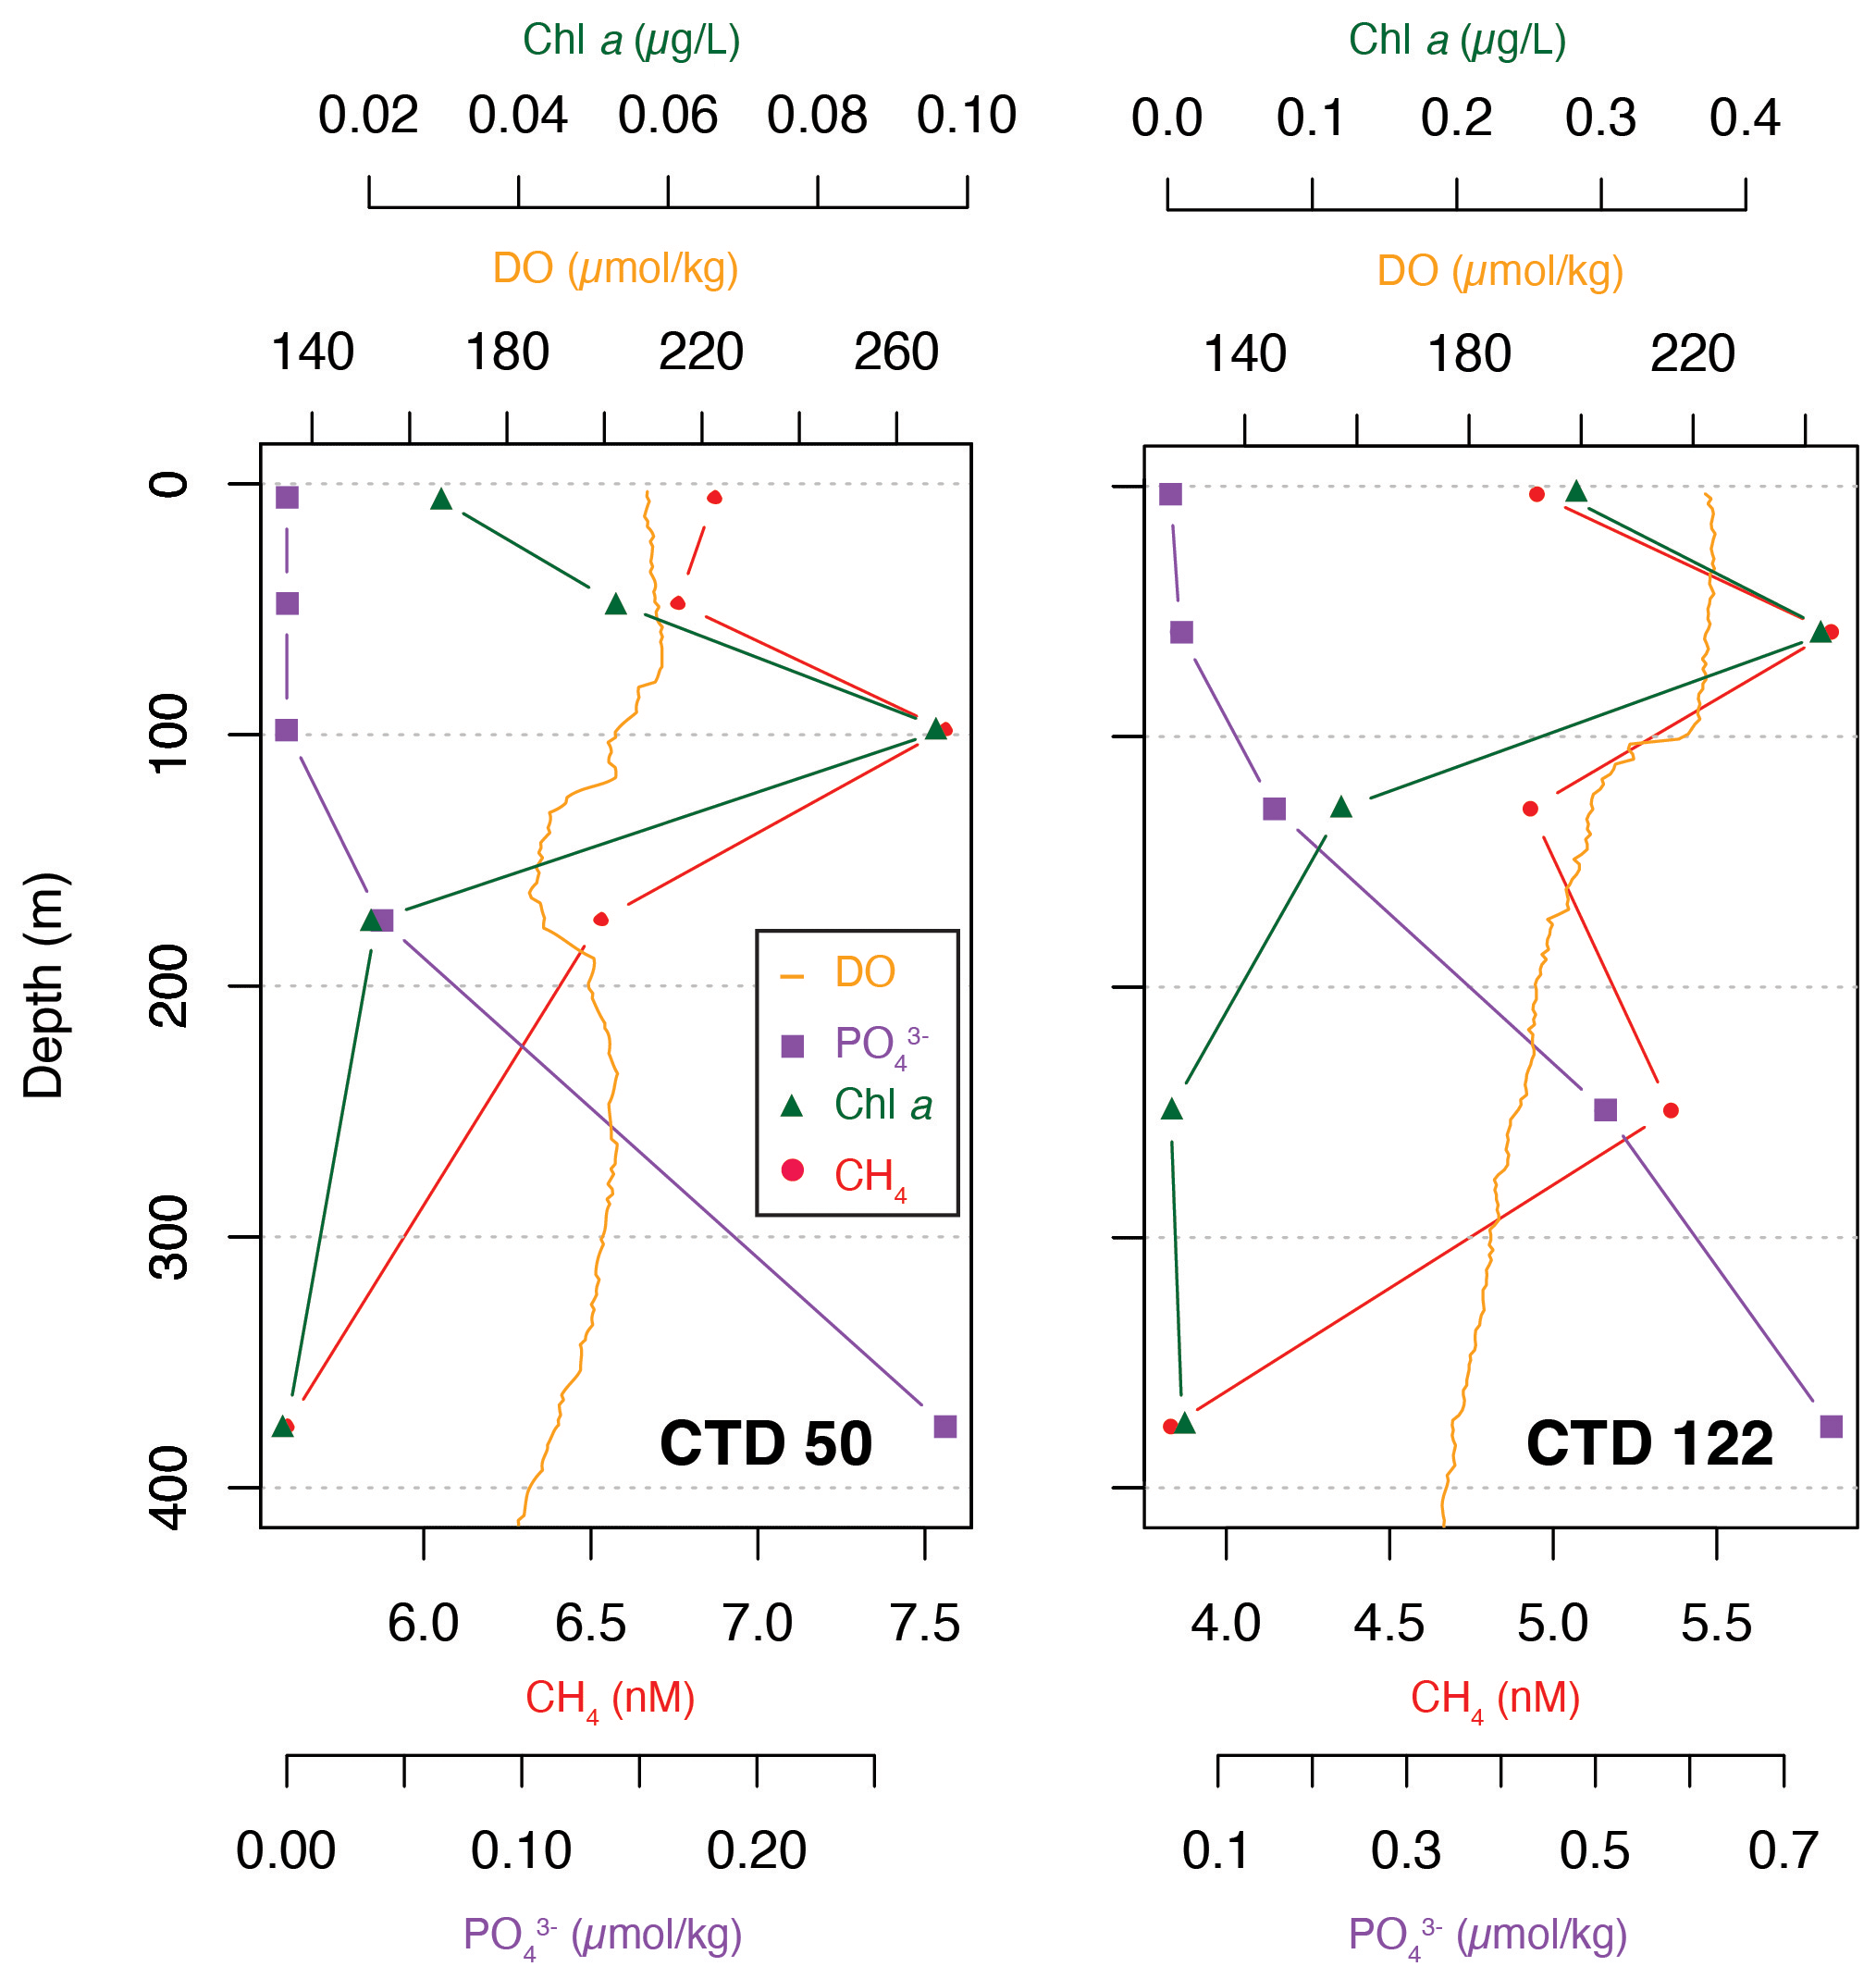
Figure 6Selected data from CTD 50 (69.5∘ W, 24.9∘ N) and CTD 122 (20.8∘ W, 25.45∘ N) for CH4 (red circles), Chl a (green triangles), phosphate (purple squares) and dissolved oxygen (orange).
At station 50, the relationship between CH4, Chl a and phosphate appears to be linear, e.g., CH4 concentration decreasing as Chl a decreases and phosphate increases, while at station 122 the CH4 concentration showed a nonlinear pattern. It is not clear why CH4 concentrations are variable, but zooplankton grazing could potentially have a substantial impact (Simon et al., 2012). A possible influence of gas seeps on the CH4 concentration is negligible as gas seeps only influence CH4 concentrations in the immediate water column 100 to 150 m above the seeps (Leonte et al., 2020). Below 250 m water depth, CH4 concentrations decrease, corresponding to an increase in phosphate and minimal Chl a concentrations, again suggesting the influence of primary producers (Brown et al., 2014).
4.2 Methane production linked to primary production
Autotrophic cyanobacteria Prochlorococcus and Synechococcus represent a major constituent of primary production in the subtropical North Atlantic; their distribution, however, differs greatly (Flombaum et al., 2013). Whereas Synechococcus solely occupies surface waters up to depths of ∼ 100 m, Prochlorococcus occupies the whole water column, with deep-water maxima just above MLD, and are therefore responsible for fluorescence maxima at 100 to 130 m. The longitudinal distribution also differs between the two taxa: the distribution of Synechococcus is limited to coastal, nutrient-richer waters (Fig. 7), whereas Prochlorococcus dominates the community throughout the transect (Fig. 8).
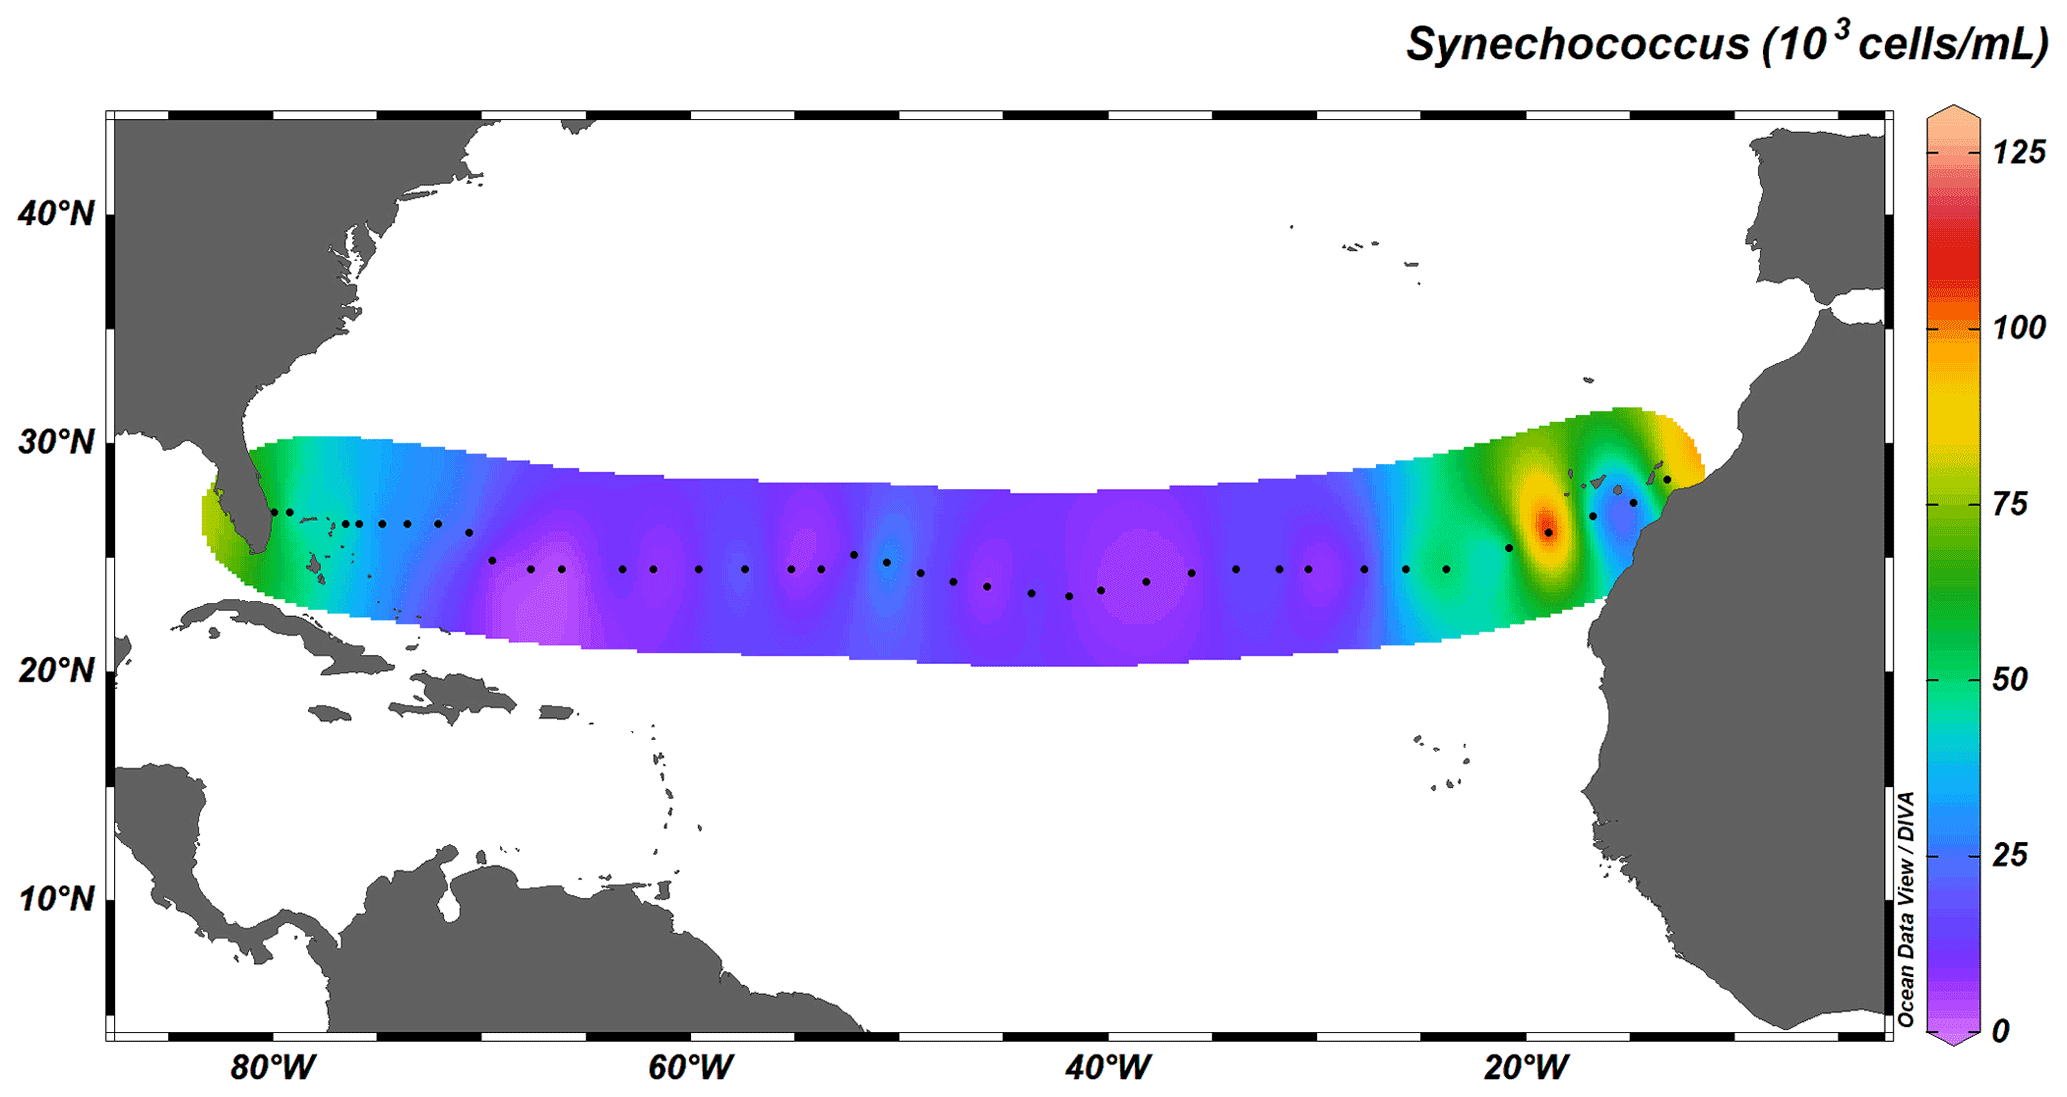
Figure 7Depth-integrated abundance of Synechococcus (in 103 cells mL−1) above MLD. Black dots represent the 38 out of the total 135 stations sampled for cyanobacterial abundance.

Figure 8Depth-integrated abundance of Prochlorococcus (in 103 cells mL−1) above MLD. Black dots represent the 38 out of the total 135 stations sampled for cyanobacterial abundance.
CH4 distribution across the subtropical North Atlantic suggests that the influence of the cyanobacterial community is present; the highest CH4 concentrations were found (1) at DCM in the central gyre system, where Prochlorococcus is the predominant genus, and (2) at the gyre boundaries, where higher abundances of both Prochlorococcus and Synechococcus were found. A PCA applied to the dataset including abundances of both cyanobacteria strengthens the conclusion that CH4 production appears to be associated with primary production (Fig. 9).
The bordering Gulf Stream to the west and the Canary Stream to the east provide a resupply of nutrients (Williams et al., 2011) and therefore support a greater abundance of cyanobacteria; the Canary Stream also presents a pathway for the horizontal transfer of organic matter from the North African coast to the open ocean. Previous studies confirm high OM production in the eastern subtropical North Atlantic as a result of the high rates of primary production fueled by the Mauritanian upwelling (Reynolds et al., 2014). The transmission data (Fig. 2h) suggest the export of organic matter throughout the eastern basin, which could contain MPn and thus a potential source of CH4. Elevated CH4 concentrations are mainly limited to the highly productive boundary systems, whilst the central gyre, which lacks a sufficient resupply of bioavailable nutrients due to its downwelling nature, results in a decreased abundance of both Prochlorococcus and Synechococcus and hence decreased CH4 concentrations (Fig. 2a). In this especially P-limited region, alternative nutrient sources such as the degradation of DOM to access organic phosphorus compounds become increasingly important in order for the cyanobacteria to meet their nutrient needs. The degradation of dissolved organic phosphorus via alkaline phosphatases (AP) such as phoA or phoX and the overexpression of the phosphate binding protein (pstS) have been believed to be the main adaptations to P stress (Luo et al., 2009; Cox and Saito, 2013; Sebastian and Ammerman, 2009). Recently, however, evidence was brought forth that some strains of Prochlorococcus can also oxidize MPn and other higher phosphonate compounds while releasing formate and potentially CH4 as a by-product (Sosa et al., 2019a). Phosphonates are notably abundant and enriched in DOM (Sosa et al., 2019b), and their degradation releases considerable amounts of CH4. Prochlorococcus and Synechococcus are the most abundant primary producers in the oligotrophic ocean and as such produce considerable amounts of semi-labile DOM; both can synthesize phosphoenolpyruvate mutases (pepM), and therefore the DOM produced carries an enriched pool of MPn (Repeta et al., 2016; Sosa et al., 2019a). However, the metabolism of MPn is heavily regulated by bioavailable phosphate, and thus the metabolic pathway of pepM might be heavily downregulated in the subtropical North Atlantic, whereas under replete conditions, i.e., in the North Pacific, Prochlorococcus can allocate up to 40 % of its internal P quota to phosphonate synthesis (Acker et al., 2022). Yet, the trait to produce phosphonates is located on genomic islands, is subject to horizontal gene transfer and can be frequently exchanged among marine microbial communities. Hence, proteobacteria such Pelagibacter spp. in the SAR11 clade also obtain pepM and are able to produce phosphonates (Acker et al., 2022). Similarly, the trait of phosphonate consumption is subject to horizontal gene transfer, and high-light strains of Prochlorococcus carry both production and consumption traits. They can therefore also utilize MPn as an alternative P source (Acker et al., 2022). The demethylation of MPn is mostly attributed as occurring under P-limiting conditions, such as in oligotrophic oceanic regions. Further, most MPn oxidation and subsequent release of CH4 are due to bacterial degradation of DOM and the breakdown of highly energetic carbon–phosphorus bonds via C–P lyases, which are encoded by the phn operon, with transport systems including phnC, phnD, phonE and phnJ responsible for the cleavage of the C–P bond (Sosa et al., 2020). C–P lyases are abundant among Pelagibacter spp. and other alpha and gamma proteobacteria and can be found in ∼ 50 % of organisms in the North Atlantic, where DOP concentrations are 4-fold lower with respect to the North Pacific (Sosa et al., 2020). Carini et al. (2014) estimated a potential production of 0.01–0.05 nM CH4 d−1 by Pelagibacterales via C–P cleavage within the MPn pathway (Carini et al., 2014). However, due to complex biogeochemical and physical processes involved, in situ production of CH4 is difficult to assess, and quantifying the individual contribution of primary producers to CH4 production was not the primary scope of the work presented. Here, the focus was to link the distribution of CH4 in the subtropical North Atlantic to two vastly abundant cyanobacteria as exemplary primary producers, Prochlorococcus and Synechococcus, in order to draw conclusions which might explain the ocean methane paradox. Many mechanisms and precursors of oceanic in situ production of CH4 remain unknown, and it is unclear whether cyanobacteria such as Prochlorococcus or Synechococcus are responsible for the release of CH4, mainly via the degradation of MPn or indirectly by producing semi-labile DOM containing MPn cleaved by the bacterial community. Furthermore, recent laboratory-based studies also confirmed that planktonic organisms produce CH4 per se under high light intensities; Prochlorococcus showed higher potential in CH4 production than Synechococcus, with 0.8–110 and 0.01–0.6 pmol CH4 per 106 cells per hour, respectively. Larger cyanobacteria such as Microcystis spp. exceeded this by up to 0.51 ± 0.26 µmol g−1 h−1 (Bižić et al., 2020).
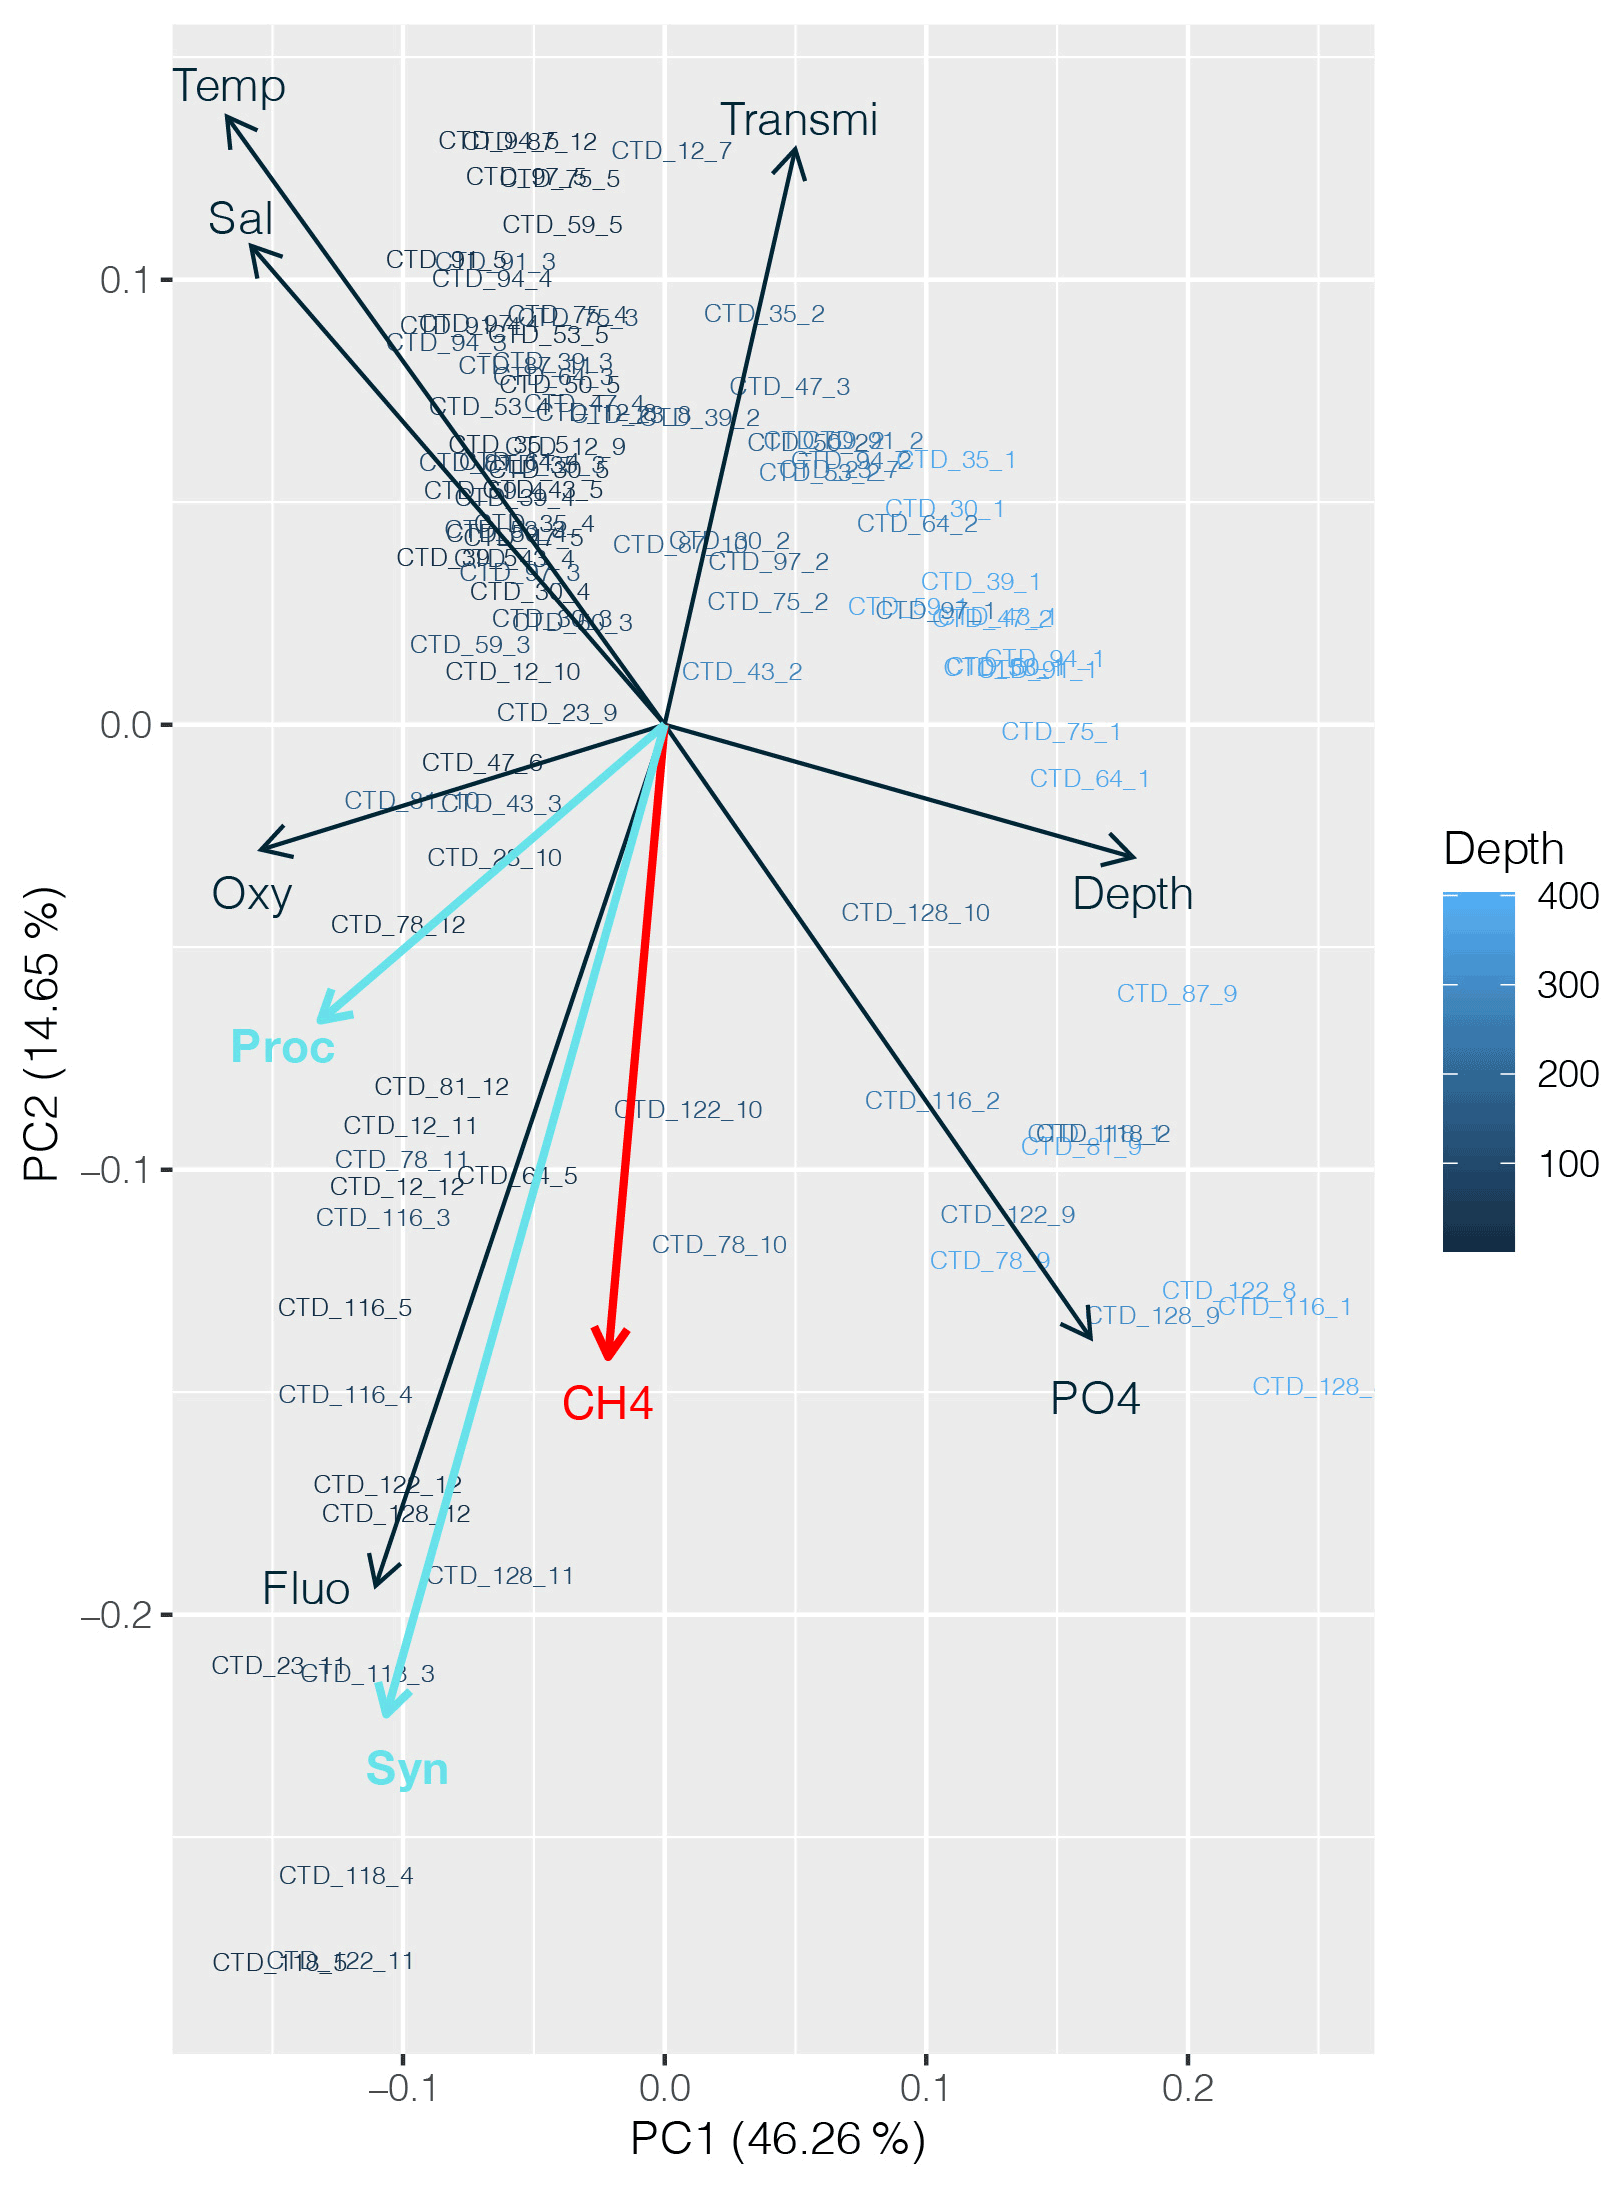
Figure 9Principal component analysis (PCA) between dissolved CH4 concentrations (red), Prochlorococcus and Synechococcus abundances (light blue), and other physicochemical parameters (nutrients, depth, fluorescence, temperature, salinity and turbidity). Numbers on the x and y axes indicate the factor loadings of each variable of each principal component (PC). The percentages show the explained variability in the dataset by each PC.
Nonetheless, Prochlorococcus alone produces ∼ 22 nM CH4 d−1 and therefore substantially contributes to the supersaturation of oligotrophic oceanic regions (typically between 7 and 25 nM) as well as to the oversaturated state measured here (up to 10 nM) in the subtropical North Atlantic (Bižić et al., 2020). Cyanobacteria can greatly influence and potentially control CH4 production in the marine environment, although other marine organisms such as different bacterial clades or coccolithophores are believed to also contribute to overall CH4 production. Nitrogen-fixing diazotrophs such as Trichodesmium spp. or Rhodopseudomonas palustris may contribute to an even higher degree (Bižić-Ionescu et al., 2018; Zheng et al., 2018), and, although spatially limited with Trichodesmium spp. dominating the western basin and Hemilaulus associated Richelia symbionts more so in the eastern basin (Luo et al., 2009), they are also abundant throughout the subtropical North Atlantic. Trichodesmium has higher nutrient requirements and can therefore outcompete cyanobacteria in uptake of inorganic nutrients and degradation of alternative sources; yet, energy-intensive diazotrophic nitrogen fixation is controlled by micronutrients such as iron (Macovei et al., 2019) and primarily occurs in the western basin, an area of high iron input by aeolian plumes originating from the Saharan desert (Ratten et al., 2015; Reynolds et al., 2014). Lastly, coccolithophores such as the ubiquitously abundant Emiliania huxleyi can also produce CH4 (between 0.7 and 3.1±0.4 CH4 per gram POC per day; Lenhart et al., 2016b) from OM degradation and are believed to increase in abundance in the subtropical North Atlantic with increasing CO2 concentrations at the air–sea interface due to further anthropogenic perturbation of the atmospheric CO2 budget (Krumhardt et al., 2015).
Nonetheless, the data presented here suggest that the cyanobacterial community most likely plays a significant key role in the CH4 flux in surface waters and the degradation of MPn from semi-labile DOM, helping to explain the methane paradox and hence the sea–air flux of CH4 (Sosa et al., 2019a). Further investigation needs to focus on gathering in situ data and should also include future scenarios, considering future climate and whole-ecosystem community responses to consequences of altered climate conditions. The base ecosystem, specifically in P-limited regions, is ever changing, and highly adapted and horizontal transfer of genomic traits of P acquisition via various genomic pathways might become inherently important. Further work should also be considered in regards to mesocosm incubation studies with in situ communities of natural composition to improve our understanding of the various processes and interactions involved in oceanic CH4 production linked to primary producers to explain the ocean methane paradox.
Our study demonstrates that the subtropical North Atlantic Ocean does indeed act as a source of CH4 to the atmosphere, most likely controlled by cyanobacteria, which are the dominant primary producers in the surface waters. Yet, anomalies found at depths below 200 m could also be attributed to the degradation of sinking organic material. The concentrations of dissolved CH4 in this study were considerably higher near shelf regions and in the eastern boundary under the influence of the Mauritanian upwelling. The accumulation of organic matter and nutrients in these areas provides favorable conditions for both aerobic and anaerobic CH4 production. It is expected that with increasing stratification and subsequent reduction in nutrient supply to the surface oligotrophic North Atlantic Ocean, the prevailing P limitation will be further exacerbated, whereas coastal and shelf regions with increasing anthropogenic inputs of nutrients could experience more frequent cyanobacterial blooms, which will in turn enhance CH4 production (Dang and Li, 2018).
All data are available from the authors upon request.
AK carried out dissolved gas sample collection, measurements and data analysis and drafted the final paper. LM carried out phytoplanktonic sample collection, measurements and data analysis and drafted the final paper. SR helped in preparation of the cruise, measurements and data analysis and supervised biological part of the survey. TC carried out nutrient sample collection, measurements and data analysis. EM carried out nutrient sample collection, measurements and data analysis. CB helped to plan and prepare for the cruise as well as result evaluation and provided overall project supervision. All authors contributed equally to the paper writing and made substantial input to the final version.
The contact author has declared that none of the authors has any competing interests.
Publisher's note: Copernicus Publications remains neutral with regard to jurisdictional claims in published maps and institutional affiliations.
The authors gratefully acknowledge the PI of the JC191 cruise, Alejandra Sanchez-Franks (National Oceanography Centre, UK), for the great scientific support and for providing cruise data. This work would not have been possible without the support and help of the captain and crew of RRS James Cook. The authors would also like to acknowledge Eric Mace (Station Biologique de Roscoff), the CNRS technician, for his technical support in the preparation of the cruise.
Ship time was funded by NERC as part of the Climate Linked Atlantic Sector Science (CLASS) research program and as a UK contribution to the Global Ocean Ship-based Hydrographic Investigations Program (GO-SHIP). A. Kolomijeca's participation in the cruise and dissolved gas analyses was funded by the Region Bretagne SAD “FULMAR” project, the Foundation Air Liquide SMIS-4M project and the CNRS (LEFE Memestra). The participation of Lukas Marx and Sarah Reynolds was funded by the University of Portsmouth PhD bursary scheme and the UK NERC National Capability program CLASS (Climate Linked Atlantic Sector Science) ECR fellowship.
This paper was edited by Xinping Hu and reviewed by Leonard Ernst and one anonymous referee.
Acker, M., Hogle, S. L., Berube, P. M., Hackl, T., Coe, A., Stepanauskas, R., Chisholm, S. W., and Repeta, D. J.: Phosphonate production by marine microbes: Exploring new sources and potential function, P. Natl. Acad. Sci. USA, 119, e2113386119, https://doi.org/10.1073/pnas.2113386119, 2022.
Bange, H. W., Bell, F. T. G., Cornejo, B. M., and Freing, C. A.: MEMENTO: A proposal to develop a database of marine nitrous oxide and methane measurements MEMENTO: a proposal to develop a database of marine nitrous oxide and methane measurements, Environ. Chem., 6, 195–197, https://doi.org/10.1071/EN09033, 2009.
Becker, S., Aoyama, M., Woodward, E. M. S., Bakker, K., Coverly, S., Mahaffey, C., and Tanhua, T.: GO-SHIP Repeat Hydrography Nutrient Manual: The Precise and Accurate Determination of Dissolved Inorganic Nutrients in Seawater, Using Continuous Flow Analysis Methods, Front. Mar. Sci., 7, 908, https://doi.org/10.3389/fmars.2020.581790, 2020
Beversdorf, L. J., White, A. E., Björkman, K. M., Letelier, R. M., and Karl, D. M.: Phosphonate metabolism by Trichodesmium IMS101 and the production of greenhouse gases, Limnol. Oceanogr., 55, 1768–1778, https://doi.org/10.4319/lo.2010.55.4.1768, 2010.
Bižić-Ionescu, M., Klintzsch, T., Ionescu, D., Hindiyeh, M. Y., Günthel, M., Muro-Pastor, A. M., Eckert, W., Keppler, F., and Grossart, H. P.: Widespread formation of methane by Cyanobacteria in aquatic and terrestrial environments, Sci. Adv., 6, 398958, https://doi.org/10.1101/398958, 2018.
Bižić, M., Klintzsch, T., Ionescu, D., Hindiyeh, M. Y., Günthel, M., Muro-Pastor, A. M., Eckert, W., Urich, T., Keppler, F., and Grossart, H. P.: Aquatic and terrestrial cyanobacteria produce methane, Sci. Adv., 6, 1–10, https://doi.org/10.1126/sciadv.aax5343, 2020.
Borges, A. V., Champenois, W., Gypens, N., Delille, B., and Harlay, J.: Massive marine methane emissions from near-shore shallow coastal areas, Sci. Rep., 6, 2–9, https://doi.org/10.1038/srep27908, 2016.
Brown, I. J., Torres, R., and Rees, A. P.: Dynamics of Atmospheres and Oceans The origin of sub-surface source waters define the sea – air flux of methane in the Mauritanian Upwelling, NW Africa, Dynam. Atmos. Ocean., 67, 39–46, https://doi.org/10.1016/j.dynatmoce.2014.06.001, 2014.
Bui, O. T. N., Kameyama, S., Yoshikawa-Inoue, H., Ishii, M., Sasano, D., Uchida, H., and Tsunogai, U.: Estimates of methane emissions from the Southern Ocean from quasi-continuous underway measurements of the partial pressure of methane in surface seawater during the 2012/13 austral summer, Tellus B, 70, 1–15, https://doi.org/10.1080/16000889.2018.1478594, 2018.
Carini, P., White, A., Campbell, E., and Giovannoni, S. J.: Methane production by phosphate-starved SAR11 chemoheterotrophic marine bacteria, Nat. Commun., 5, 4346, https://doi.org/10.1038/ncomms5346, 2014.
Conrad, R. and Seiler, W.: Methane and hydrogen in seawater (Atlantic Ocean), Deep-Sea Res. Pt. A, 35, 1903–1917, https://doi.org/10.1016/0198-0149(88)90116-1, 1988.
Cox, A. D. and Saito, M. A.: Proteomic responses of oceanic Synechococcus WH8102 to phosphate and zinc scarcity and cadmium additions, Front. Microbiol., 4, 387, https://doi.org/10.3389/FMICB.2013.00387, 2013.
Dang, H. and Li, J.: Climate tipping-point potential and paradoxical production of methane in a changing ocean, Sci. China Earth Sci., 61, 1714–1727, https://doi.org/10.1007/s11430-017-9265-y, 2018.
de la Paz, M., Huertas, I. E., Flecha, S., Ríos, A. F., and Pérez, F. F.: Nitrous oxide and methane in Atlantic and Mediterranean waters in the Strait of Gibraltar: Air-sea fluxes and inter-basin exchange, Prog. Oceanogr., 138, 18–31, https://doi.org/10.1016/j.pocean.2015.09.009, 2015.
Feingersch, R., Philosof, A., Mejuch, T., Glaser, F., Alalouf, O., Shoham, Y., and Béjà, O.: Potential for phosphite and phosphonate utilization by Prochlorococcus, ISME J., 6, 827–834, https://doi.org/10.1038/ismej.2011.149, 2012.
Flombaum, P., Gallegos, J. L., Gordillo, R. A., Rincón, J., Zabala, L. L., Jiao, N., Karl, D. M., Li, W. K. W., Lomas, M. W., Veneziano, D., Vera, C. S., Vrugt, J. A., and Martiny, A. C.: Present and future global distributions of the marine Cyanobacteria Prochlorococcus and Synechococcus, P. Natl. Acad. Sci. USA, 110, 9824–9829, https://doi.org/10.1073/pnas.1307701110, 2013.
Florez-Leiva, L., Damm, E., and Farías, L.: Methane production induced by dimethylsulfide in surface water of an upwelling ecosystem, Prog. Oceanogr., 112/113, 38–48, https://doi.org/10.1016/j.pocean.2013.03.005, 2013.
Forster, G., Upstill-Goddard, R. C., Gist, N., Robinson, C., Uher, G., and Woodward, E. M. S.: Nitrous oxide and methane in the Atlantic Ocean between 50∘ N and 52∘ S: Latitudinal distribution and sea-to-air flux, Deep-Sea Res. Pt. II, 56, 964–976, https://doi.org/10.1016/j.dsr2.2008.12.002, 2009.
Harvey, B. P., Gwynn-Jones, D., and Moore, P. J.: Meta-analysis reveals complex marine biological responses to the interactive effects of ocean acidification and warming, Ecol. Evol., 3, 1016–30, https://doi.org/10.1002/ece3.516, 2013.
Hickman, A. E., Dutkiewicz, S., Williams, R. G., and Follows, M. J.: Modelling the effects of chromatic adaptation on phytoplankton community structure in the oligotrophic ocean, Mar. Ecol. Prog. Ser., 406, 1–17, https://doi.org/10.3354/MEPS08588, 2010.
Holmes, M. E., Elizabeth, M., Sansone, J., Rust, M., and Popp, N.: Methane production, consumption, and air-sea exchange in the open ocean: An Evaluation based on carbon isotopic ratios Methane production, consumption, and air-sea exchange in the open ocean: An evaluation based on carbon isotopic ratios and via the, Global Biogeochem. Cy., 14, 1–10, https://doi.org/10.1029/1999GB001209, 2014.
Karl, D. M., Beversdorf, L., Björkman, K. M., Church, M. J., Martinez, A., and Delong, E. F.: Aerobic production of methane in the sea, Nat. Geosci., 1, 473–478, https://doi.org/10.1038/ngeo234, 2008.
Kelley, C. A. and Jeffrey, W. H.: Dissolved methane concentration profiles and air-sea fluxes from 41∘ S to 27∘ N, Global Biogeochem. Cy., 16, 13-1–13-6, https://doi.org/10.1029/2001gb001809, 2002.
Kitidis, V., Upstill-Goddard, R. C., and Anderson, L. G.: Methane and nitrous oxide in surface water along the North-West Passage, Arctic Ocean, Mar. Chem., 121, 80–86, https://doi.org/10.1016/j.marchem.2010.03.006, 2010.
Kock, A. and Bange, H. W.: Methane Measurements in Selected Ocean Areas: Eastern Tropical North Atlantic Ocean and Southwestern Labrador Sea, IFM-GEOMAR, Leibniz-Institut für Meereswissenschaften, PhD thesis, Diploma, 107, 2007.
Krumhardt, K. M., Lovenduski, N. S., Freeman, N. M., and Bates, N. R.: Apparent increase in coccolithophore abundance in the subtropical North Atlantic from 1990 to 2014, Biogeosciences, 13, 1163–1177, https://doi.org/10.5194/bg-13-1163-2016, 2016.
Kudo, K., Yamada, K., Toyoda, S., Yoshida, N., Sasano, D., Kosugi, N., Ishii, M., Yoshikawa, H., Murata, A., Uchida, H., and Nishino, S.: Spatial distribution of dissolved methane and its source in the western Arctic Ocean, J. Oceanogr., 74, 305–317, 2018.
Lenhart, K., Klintzsch, T., Langer, G., Nehrke, G., Bunge, M., Schnell, S., and Keppler, F.: Evidence for methane production by the marine algae Emiliania huxleyi, Biogeosciences, 13, 3163–3174, https://doi.org/10.5194/bg-13-3163-2016, 2016a.
Lenhart, K., Klintzsch, T., Langer, G., Nehrke, G., Bunge, M., Schnell, S., and Keppler, F.: Evidence for methane production by the marine algae Emiliania huxleyi, Biogeosciences, 13, 3163–3174, https://doi.org/10.5194/bg-13-3163-2016, 2016b.
Luo, H., Benner, R., Long, R. A., and Hu, J.: Subcellular localization of marine bacterial alkaline phosphatases, P. Natl. Acad. Sci. USA, 106, 21219–21223, https://doi.org/10.1073/PNAS.0907586106, 2009.
Macovei, V. A., Torres-Valdés, S., Hartman, S. E., Schuster, U., Moore, C. M., Brown, P. J., Hydes, D. J., and Sanders, R. J.: Temporal Variability in the Nutrient Biogeochemistry of the Surface North Atlantic: 15 Years of Ship of Opportunity Data, Global Biogeochem. Cy., 33, 1674–1692, https://doi.org/10.1029/2018GB006132, 2019.
Marinov, I., Doney, S. C., and Lima, I. D.: Response of ocean phytoplankton community structure to climate change over the 21st century: partitioning the effects of nutrients, temperature and light, Biogeosciences, 7, 3941–3959, https://doi.org/10.5194/bg-7-3941-2010, 2010.
Leonte, M., Ruppel, C. D., Ruiz-Angulo, A., and Kessler, J. D.: Surface Methane Concentrations Along the Mid-Atlantic Bight Driven by Aerobic Subsurface Production Rather Than Seafloor Gas Seeps, JGR Ocean, 125, https://doi.org/10.1029/2019JC015989, 2020.
Muñoz-Marín, M. C., Gómez-Baena, G., López-Lozano, A., Moreno-Cabezuelo, J. A., Díez, J., and García-Fernández, J. M.: Mixotrophy in marine picocyanobacteria: use of organic compounds by Prochlorococcus and Synechococcus, ISME J., 14, 1065–1073, https://doi.org/10.1038/s41396-020-0603-9, 2020.
Oppo, D., De Siena, L., and Kemp, D. B.: A record of seafloor methane seepage across the last 150 million years, Sci. Rep., 10, 1–12, https://doi.org/10.1038/s41598-020-59431-3, 2020.
Percival, S. L.: Microbiology of Waterborne Diseases: Microbiological Aspects and Risks, Enhanced Credo edition, 2nd Edn., Boston Massachusetts London England: Credo Reference Academic Press, http://www.credoreference.com/book/estmiwadi (last access: 8 September 2022), 2014.
R Core Team: Foundation for Statistical Computing, Vienna, A. I. 3-900051-07-0, http://www.r-project.org/index.html (last access: 8 September 2022), 2013.
Ratten, J. M., LaRoche, J., Desai, D. K., Shelley, R. U., Landing, W. M., Boyle, E., Cutter, G. A., and Langlois, R. J.: Sources of iron and phosphate affect the distribution of diazotrophs in the North Atlantic, Deep-Sea Res. Pt. II, 116, 332–341, https://doi.org/10.1016/J.DSR2.2014.11.012, 2015.
Reeburgh, W. S.: Oceanic methane biogeochemistry, Chem. Rev., 107, 486–513, https://doi.org/10.1021/cr050362v, 2007.
Repeta, D. J., Ferrón, S., Sosa, O. A., Johnson, C. G., Repeta, L. D., Acker, M., Delong, E. F., and Karl, D. M.: Marine methane paradox explained by bacterial degradation of dissolved organic matter, Nat. Geosci., 9, 884–887, https://doi.org/10.1038/ngeo2837, 2016.
Reynolds, S., Mahaffey, C., Roussenov, V., and Williams, R. G.: Evidence for production and lateral transport of dissolved organic phosphorus in the eastern subtropical North Atlantic, Global Biogeochem. Cy., 28, 805–824, https://doi.org/10.1002/2013GB004801, 2014.
Rhee, T. S., Kettle, A. J., and Andreae, M. O.: Methane and nitrous oxide emissions from the ocean: A reassessment using basin-wide observations in the Atlantic, J. Geophys. Res.-Atmos., 114, D12304, https://doi.org/10.1029/2008JD011662, 2009.
Sanchez-Franks, A.: CRUISE REPORT: A05 Highlights National Oceanography Centre Cruise Report No. 70 RRS James Cook Cruise JC191 19 January–1 March 2020 Hydrographic sections from the Florida Straits to the Canaries Current across 24∘ N in the Atlantic Ocean, 44, https://cchdo.ucsd.edu/data/16095/740H20200119_do.pdf (last access: 8 September 2022), 2020.
Schmale, O., Wäge, J., Mohrholz, V., Wasmund, N., Gräwe, U., Rehder, G., Labrenz, M., and Loick-Wilde, N.: The contribution of zooplankton to methane supersaturation in the oxygenated upper waters of the central Baltic Sea, Limnol. Oceanogr., 63, 412–430, https://doi.org/10.1002/LNO.10640, 2018.
Scranton, M. I. and Brewer, P. G.: Occurrence of methane in the near-surface waters of the western subtropical North-Atlantic, Deep-Sea Res., 24, 127–138, https://doi.org/10.1016/0146-6291(77)90548-3, 1977.
Sea, M. A., Garcias-Bonet, N., Saderne, V., and Duarte, C. M.: Carbon dioxide and methane fluxes at the air–sea interface of Red Sea mangroves, Biogeosciences, 15, 5365–5375, https://doi.org/10.5194/bg-15-5365-2018, 2018.
Sebastian, M. and Ammerman, J. W.: The alkaline phosphatase PhoX is more widely distributed in marine bacteria than the classical PhoA, ISME J., 35, 563–572, https://doi.org/10.1038/ismej.2009.10, 2009.
Simon, E., Samuelsen, A., Bertino, L., and Dumont, D.: Estimation of positive sum-to-one constrained zooplankton grazing preferences with the DEnKF: A twin experiment, Ocean Sci., 8, 587–602, https://doi.org/10.5194/os-8-587-2012, 2012.
Sosa, O. A., Casey, J. R., and Karl, D. M.: Methylphosphonate Oxidation in Prochlorococcus Strain MIT9301 Supports Phosphate Acquisition, Formate Excretion, and Carbon Assimilation into Purines, Appl. Environ. Microbiol., 85, e00289-19, https://doi.org/10.1128/AEM.00289-19, 2019a.
Sosa, O. A., Repeta, D. J., DeLong, E. F., Ashkezari, M. D., and Karl, D. M.: Phosphate-limited ocean regions select for bacterial populations enriched in the carbon–phosphorus lyase pathway for phosphonate degradation, Environ. Microbiol., 21, 2402–2414, https://doi.org/10.1111/1462-2920.14628, 2019b.
Sosa, O. A., Burrell, T. J., Wilson, S. T., Foreman, R. K., Karl, D. M., and Repeta, D. J.: Phosphonate cycling supports methane and ethylene supersaturation in the phosphate-depleted western North Atlantic Ocean, Limnol. Oceanogr., 65, 2443–2459, https://doi.org/10.1002/LNO.11463, 2020.
Stawiarski, B., Otto, S., Thiel, V., Gräwe, U., Loick-Wilde, N., Wittenborn, A. K., Schloemer, S., Wäge, J., Rehder, G., Labrenz, M., Wasmund, N., and Schmale, O.: Controls on zooplankton methane production in the central Baltic Sea, Biogeosciences, 16, 1–16, https://doi.org/10.5194/bg-16-1-2019, 2019.
van de Waal, D. B. and Litchman, E.: Multiple global change stressor effects on phytoplankton nutrient acquisition in a future ocean, Philos. T. R. Soc. B, 375, 32200734, https://doi.org/10.1098/RSTB.2019.0706, 2020.
Wang, W. L., Moore, J. K., Martiny, A. C., and Primeau, F. W.: Convergent estimates of marine nitrogen fixation, Nature, 566, 205–211, https://doi.org/10.1038/s41586-019-0911-2, 2019.
Wanninkhof, R.: Relationship between wind speed and gas exchange over the ocean revisited, Limnol. Oceanogr. Method., 12, 351–362, https://doi.org/10.4319/lom.2014.12.351, 2014.
Weber, T., Wiseman, N. A., and Kock, A.: Global ocean methane emissions dominated by shallow coastal waters, Nat. Commun., 10, 1–10, https://doi.org/10.1038/s41467-019-12541-7, 2019.
Weller, D. I., Law, C. S., Marriner, A., Nodder, S. D., Chang, F. H., Stephens, J. A., Wilhelm, S. W., Boyd, P. W., and Sutton, P. J. H.: Progress in Oceanography Temporal variation of dissolved methane in a subtropical mesoscale eddy during a phytoplankton bloom in the southwest Pacific Ocean, Prog. Oceanogr., 116, 193–206, https://doi.org/10.1016/j.pocean.2013.07.008, 2013.
Williams, R. G., McDonagh, E., Roussenov, V. M., Torres-Valdes, S., King, B., Sanders, R., and Hansell, D. A.: Nutrient streams in the North Atlantic: Advective pathways of inorganic and dissolved organic nutrients, Global Biogeochem. Cy., 25, 17333467, https://doi.org/10.1029/2010GB003853, 2011.
Ye, W., Zhang, G., Zhu, Z., Huang, D., Han, Y., and Wang, L.: Methane Distribution and Sea-to-Air Flux in the East China Sea During the Summer of 2013: Impact of Hypoxia Deep-Sea Research II Methane distribution and sea-to-air flux in the East China Sea during the summer of 2013: Impact of hypoxia, Deep-Sea Res. Pt. II, 124, 74–83, https://doi.org/10.1016/j.dsr2.2015.01.008, 2015.
Zheng, Y., Harris, D. F., Yu, Z., Fu, Y., Poudel, S., Ledbetter, R. N., Fixen, K. R., Yang, Z. Y., Boyd, E. S., Lidstrom, M. E., Seefeldt, L. C., and Harwood, C. S.: A pathway for biological methane production using bacterial iron-only nitrogenase, Nat. Microbiol., 3, 281–286, https://doi.org/10.1038/s41564-017-0091-5, 2018.