the Creative Commons Attribution 4.0 License.
the Creative Commons Attribution 4.0 License.
 | 08 Aug 2022
Kinematics of surface currents at the northern margin of the Gulf of Cádiz
Luciano de Oliveira Júnior
Paulo Relvas
Erwan Garel
The subtidal surface water circulation at the northern margin of the Gulf of Cádiz, at the southern extremity of the Iberian upwelling system, is described based on validated hourly high-frequency radar measurements from 2016 to 2020. Statistical analyses (mean, standard deviation, eccentricity and empirical orthogonal functions) are applied to the dataset, which is completed with ADCP time series from multiple moorings at five inner-shelf stations and ERA5 wind. Off the shelf, the main circulation pattern consists of a slope current, best developed in summer when north-westerlies dominate, in particular at the most exposed western region. Mechanisms other than upwelling must contribute to this flow in order to explain its seasonal persistence. The slope circulation reverses for regional wind events with an east component > 10 m s−1, approximately. On the shelf, currents are mainly alongshore and balanced. The circulation is generally continuous along the coast, except for weak (< 0.1 m s−1, broadly) poleward flows. In the latter case, the flow tends to remain equatorward near Cape Santa Maria. In winter, coastal poleward flows often extend over the entire margin and are mainly wind-driven. In summer, these flows generally consist of coastal counter currents (CCCs) with the poleward direction opposed to that of the slope current. The CCCs are associated with significant cyclonic recirculation, strongest to the west, where a transient eddy is shortly observed for weak wind stress. This circulation develops after periods of strong north-westerlies, supporting that CCCs result from the imbalance of a regional alongshore pressure gradient.
- Article
(18129 KB) - Full-text XML
- BibTeX
- EndNote


The northern margin of the Gulf of Cádiz (NMGoC), along the southwest coast of the Iberian Peninsula, is characterised by a complex water circulation related to its geographic setting. The region is bounded in the west by the Portuguese branch of the Canary Current Upwelling System and, in the east, by the Strait of Gibraltar where important water exchange and mixing occur between Atlantic and Mediterranean waters (García-Lafuente et al., 2011; Price et al., 1993). The water circulation at the NMGoC is influenced by these remote forcings together with regional wind conditions, producing coastal upwelling and associated mesoscale structures (Criado-Aldeanueva et al., 2006; García-Lafuente et al., 2006; Peliz et al., 2007; Relvas and Barton, 2002; Sánchez et al., 2007; Sánchez and Relvas, 2003). Understanding the main circulation patterns is essential to support the management of socio-economic activities and of the marine ecosystem. In particular, fisheries and coastal tourism have a considerable weight in the region (Ortega et al., 2013), and some spots on the shelf have been recognised as biodiversity sanctuaries (Boavida et al., 2016). The offshore region is also a busy maritime route (Nunes et al., 2020) for large tankers that pose a risk regarding hazardous substance spills. However, available studies about the coastal and shelf circulation are supported by relatively few direct observations, mostly in spring and summer, and provide an incomplete description of the general circulation pattern and its seasonal variability.
The large-scale surface circulation at the NMGoC has been mainly assessed from sea surface temperature (SST) satellite imagery (Fiúza et al., 1982; Folkard et al., 1997; Relvas and Barton, 2002; Stevenson, 1977; Vargas et al., 2003) and CTD measurements (Criado-Aldeanueva et al., 2006; Garcia et al., 2002; Sánchez and Relvas, 2003). These data limit the scope of investigation to water masses having a significant temperature contrast and to geostrophic flows. In situ velocity measurements were obtained from a few cross-shelf ADCP transects (Cravo et al., 2013; García-Lafuente et al., 2006; García Lafuente and Ruiz, 2007; Relvas and Barton, 2005) and seabed moorings lasting a week to months at the eastern part of the inner-shelf (Criado-Aldeanueva et al., 2009; de Oliveira Júnior et al., 2021; Garel et al., 2016; Prieto et al., 2009; Sánchez et al., 2006). In addition, numerical models have been developed to investigate the wind-driven coastal circulation (Teles-Machado et al., 2007) and the hydrodynamic effects in the region of the water exchange with the Mediterranean Sea (Kida et al., 2008; Peliz et al., 2013, 2009, 2007).
From the above studies, the subtidal inner-shelf (or coastal) circulation is generally described as being dominated by alongshore flows with opposed direction and contrasted temperature in summer, with variations up to 2 ∘C d−1 (Garel et al., 2016). Cold equatorward flows (EFs, broadly eastward) are generally associated with upwelling events (Fiúza et al., 1982; Relvas and Barton, 2005, 2002) while warm poleward flows (PFs, broadly westward), often referred to as coastal counter currents (CCCs), develop when upwelling-favourable winds relax or reverse (de Oliveira Júnior et al., 2021; Garel et al., 2016; Relvas and Barton, 2002; Sánchez et al., 2006; Teles-Machado et al., 2007). Observations from ADCP moorings at the eastern inner shelf indicate that the coastal flow is highly polarised, switching semi-weekly between equatorward and poleward without a clearly predominant direction during the year (de Oliveira Júnior et al., 2021; Garel et al., 2016). Cross-shelf transects further suggest that in spring and summer the CCCs constitute the northern branches of cyclonic cells that occupy the whole margin (García-Lafuente et al., 2006). At the southern boundary of the shelf, over the shelf slope, the upper layer circulation is dominated by a permanent strong eastward current (Criado-Aldeanueva et al., 2006; García-Lafuente et al., 2006; García Lafuente and Ruiz, 2007; Peliz et al., 2009, 2007; Relvas and Barton, 2005, 2002; Sánchez and Relvas, 2003), associated with a cold SST signal in summer which is typical of upwelling events (Fiúza, 1983; Folkard et al., 1997; Relvas and Barton, 2002; Vargas et al., 2003). This feature has been termed a “slope current”, not in the sense of being JEBAR driven (Simpson and Sharples, 2012) but that it is somehow constrained by the slope bathymetry (Peliz et al., 2009, 2007; Relvas and Barton, 2002; Sánchez and Relvas, 2003).
To contribute to the knowledge of the water circulation at the NMGoC, the present study addresses the kinematics of surface currents based on 4.5 years (February 2016–October 2020) of hourly measurements from the South Iberian High Frequency Radar (HFR) system. The analysis allows the establishment of the main circulation patterns and its variability. Special attention is paid to the distribution and seasonality of the coastal and slope flows and to their linkage through cross-shore recirculation in relation to wind conditions. The results provide a detailed characterisation of the surface circulation at the NMGoC and some insights into their driving processes.
2.1 Geographical setting
The NMGoC lies along the southern Atlantic coast of Portugal and Spain. It extends from Cape São Vicente (CSV), where the coastline orientation changes from meridional to zonal at the southwest of Portugal, to the Strait of Gibraltar in the east (Fig. 1). The margin consists of two distinct physiographic regions separated by Cape Santa Maria (CSM) where the shelf is the narrowest (5 km wide): a western bight, characterised by a relatively narrow shelf (< 30 km) with a steep slope, and an eastern bight where the shelf is comparatively wider (> 40 km) and the slope is gentler (Fig. 1). The shelf break is at about 200 m in depth. The few rivers flowing into the NMGoC are mainly located to the east (e.g. the Guadiana, Tinto–Odiel and Guadalquivir in the study area; Fig. 1) and feature a low freshwater discharge throughout the year due to the semi-arid regional climate and to strong river flow regulation by dams (Díez-Minguito et al., 2012; Garel and D'Alimonte, 2017).
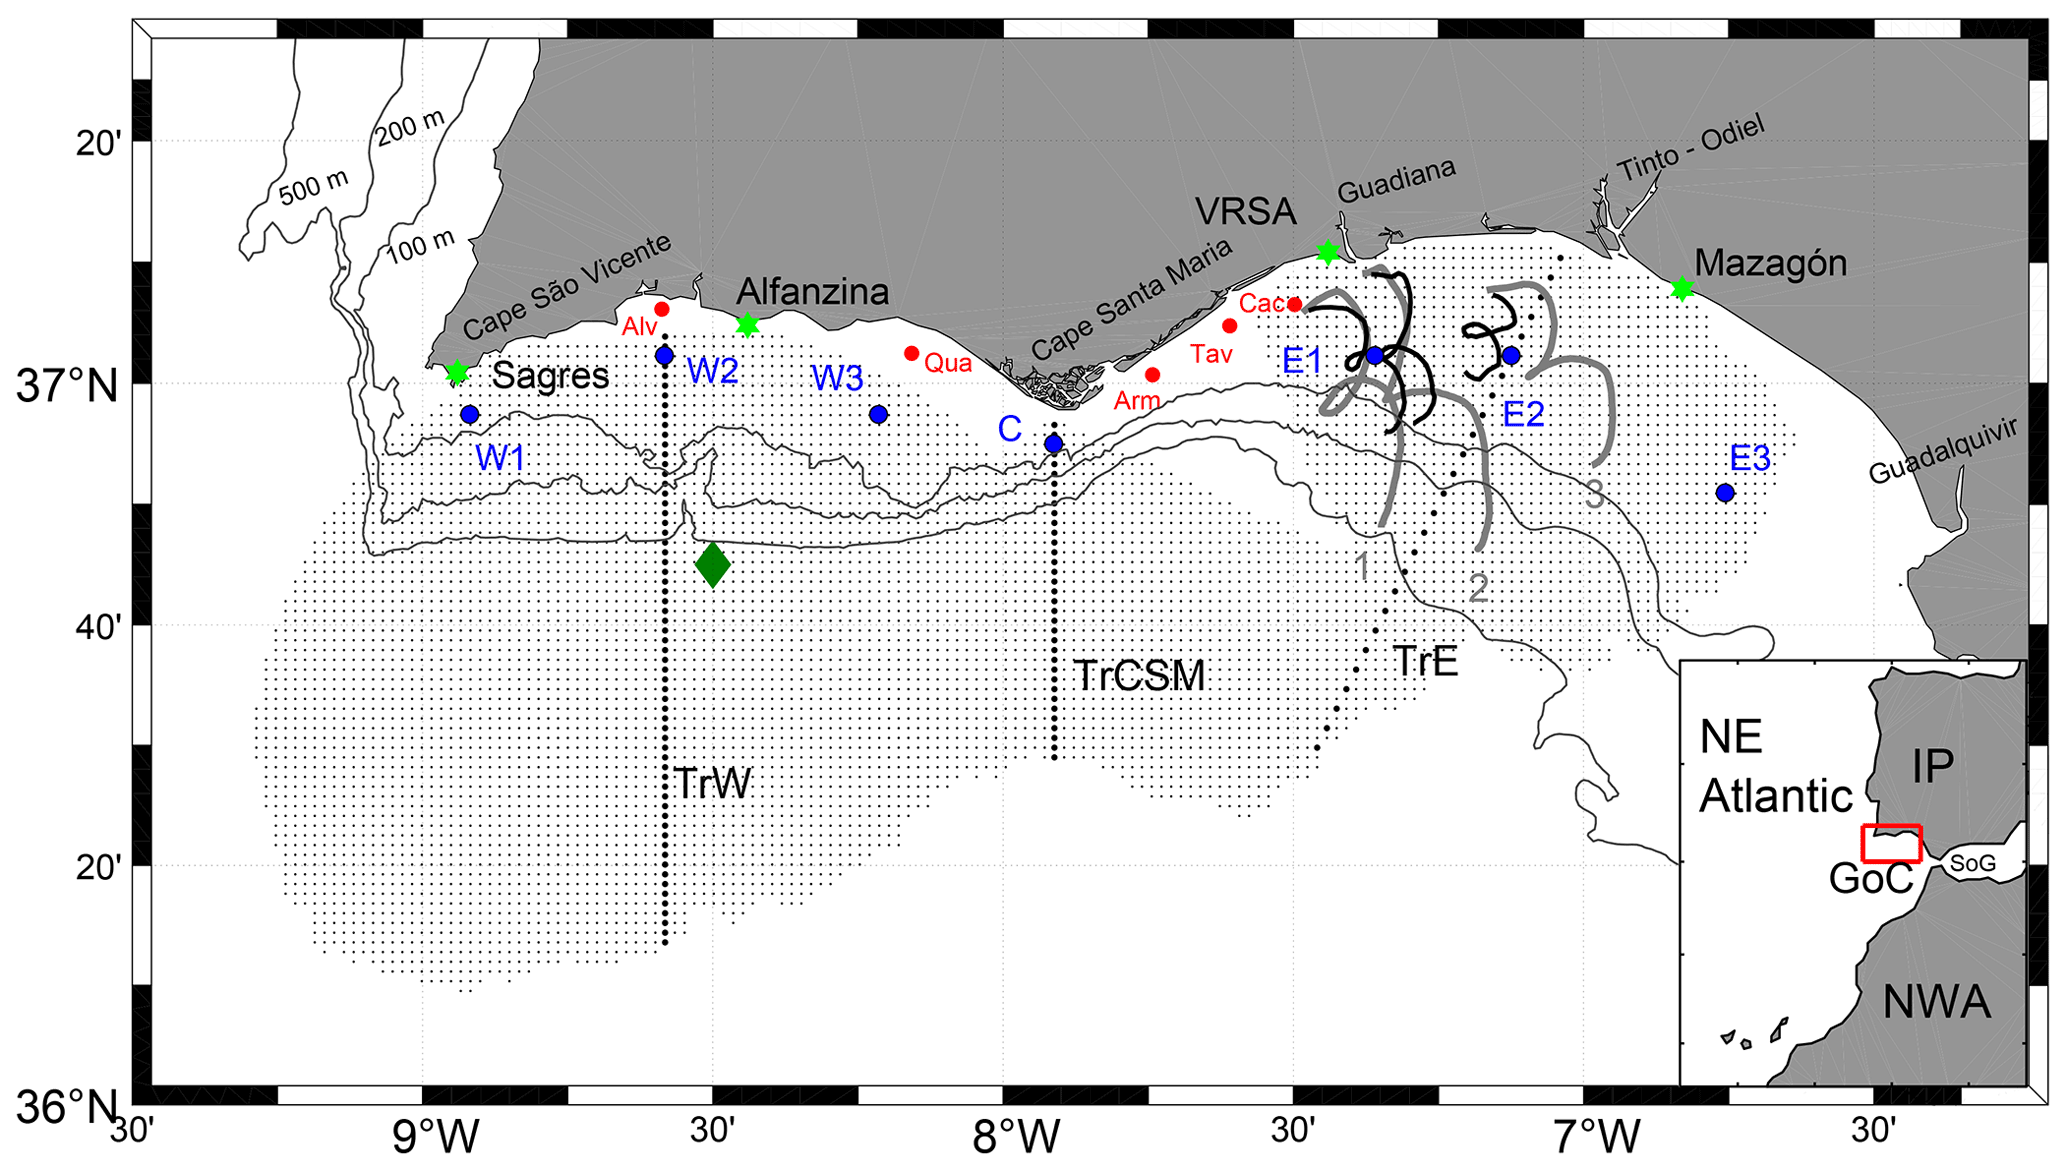
Figure 1Study area with location of the HFR antennas (green stars, with VRSA: Vila Real de Santo António), ADCP mooring (red dots, with Alv: Alvor; Qua: Quarteira; Arm: Armona; Tav: Tavira; Cac: Cacela), HFR grid nodes with ≥ 60 % of measurements (thin black dots) along with the transects (TrW, TrCSM and TrE indicated as thick black dots) and grid nodes (W1, W2, W3, C, E1, E2, E3, thick blue dots) analysed in the study. The thick grey and black lines represent the drifters' trajectories and corresponding PVD from HFR data, respectively (see Sect. 4). The dark green diamond indicates the point where wind from ERA5 reanalysis was extracted (Sect. 6.1). The isobaths of 100, 200 and 500 m are represented as thin black lines. For general location, see inset (IP: Iberian Peninsula; NWA: northwest of Africa; GoC: Gulf of Cádiz; SoG: Strait of Gibraltar).
2.2 Circulation patterns
Coastal upwelling generally occurs from April to September along the west coast of Portugal due to the predominance of northerlies (Alvarez et al., 2008; Fiúza et al., 1982). As the coastline sharply changes its orientation, northerlies rotate anticlockwise around CSV due to a low-pressure cell centred over the Iberian Peninsula and to orographic constraints induced by the presence of a coastal mountain range (Fiúza, 1983; Relvas and Barton, 2002). The westerly component of the rotated wind may promote coastal upwelling along the NMGoC until 7∘15′ W approximately, being generally more pronounced at the capes (CSV and CSM) (Criado-Aldeanueva et al., 2006; Relvas and Barton, 2002). These events generally last for a few days only; for example the NMGoC has been described as a region with episodic upwelling events rather than a typical upwelling region (such as western Iberia) where upwelling persists during a substantial part of the year, at least (Garel et al., 2016).
The equatorward upwelling jet over the western Portugal shelf tends to follow the coast around CSV and to merge with locally upwelled water at the NMGoC (Relvas and Barton, 2005, 2002; Sánchez and Relvas, 2003). There, the flow typically corresponds to a band of cold SST along the shelf and its slope (Fiúza, 1983; Folkard et al., 1997; Relvas and Barton, 2005; Stevenson, 1977; Vargas et al., 2003) where eastward extension is promoted by favourable (westerly) wind (Criado-Aldeanueva et al., 2006; Vargas et al., 2003). Velocity measurements have confirmed that this cold water band is associated with eastward currents, having relatively strong near-surface velocities (> 0.25 m s−1) along the slope (Cravo et al., 2013; García-Lafuente et al., 2006; Peliz et al., 2009; Relvas and Barton, 2005). Over the western bight, this current has been observed up to 300 m in depth and to extend significantly offshore from the slope in summer (García-Lafuente et al., 2006). At CSM, the slope current approaches close to the coastline due to the narrowness of the shelf (Cravo et al., 2013; Criado-Aldeanueva et al., 2006). Over the eastern bight, the flow has been reported during all seasons and veers anticyclonically following the slope orientation (Fig. 1; Criado-Aldeanueva et al., 2009, 2006; Fiúza, 1983; Garcia et al., 2002; Peliz et al., 2009, 2007; Relvas and Barton, 2002; Sánchez and Relvas, 2003). Measurements from ADCP moorings suggest that, at a sub-monthly scale, these flows reverse predominantly in winter and are wind-driven (Criado-Aldeanueva et al., 2009). In addition, numerical model results support that the Mediterranean inflow–outflow coupling contributes significantly to the development of the slope current through an entrainment process (Peliz et al., 2009, 2007). These authors proposed naming this current the Gulf of Cádiz Current (GCC).
Over the inner shelf, the polarised alongshore subtidal circulation (de Oliveira Júnior et al., 2021; Garel et al., 2016) is well-evidenced on SST images from spring to autumn due to strong thermal contrast (Fiúza, 1983; Folkard et al., 1997; Relvas and Barton, 2002). The upwelled cold water is frequently displaced offshore by a narrow band of warm water, about 10–20 km wide, leaning along the coast. This warm water signal originates from the region of the Guadalquivir mouth (Fig. 1) and propagates westward depending on the strength and duration of easterlies, rarely reaching the west coast north of CSV (Fiúza, 1983; Relvas and Barton, 2002). The corresponding PFs (so-called CCCs) are produced by the imbalance of an alongshore pressure gradient during the relaxation (or reverse) of upwelling-favourable winds (de Oliveira Júnior et al., 2021; García-Lafuente et al., 2006; Garel et al., 2016; Relvas and Barton, 2002) and are enhanced by easterlies (Teles-Machado et al., 2007). ADCP measurements at the eastern inner shelf show that EFs and PFs occur equally along the year, reversing direction every 4 d on average (de Oliveira Júnior et al., 2021; Garel et al., 2016). Cross-shelf ADCP transects (García-Lafuente et al., 2006) and a spring–summer climatological analysis of the geostrophic surface circulation based on historical (1900–1998) CTD data (Sánchez and Relvas, 2003) suggest the existence of two cyclonic cells centred over the eastern and western bights, connecting the slope and coastal flows.
3.1 HFR, ADCP and drifter datasets
The study area is equipped with four CODAR medium-range SeaSonde HFR antennas located in Sagres, Alfazina, Vila Real de Santo António (VRSA) and Mazagón (Fig. 1, green stars), as a result of a collaboration between Puertos del Estado (Spain) and Instituto Hidrográfico (Portugal). The system operates at 13.5 MHz, providing hourly radial surface velocities with spatial resolution of approximately 1.5 km up to 60 km from the coast (CMEMS Service Evolution, 2017). Each antenna measures the velocity towards or away from it; thus, at least two antennas are required to compute the total velocities (zonal and meridional components) through least-squares fitting (Lipa and Barrick, 1983; Paduan and Washburn, 2013). In regions where the radials from two antennas make an angle ≤ 20∘, the orthogonal velocity component cannot be estimated accurately (Chapman et al., 1997; Paduan and Washburn, 2013) and is estimated from adjacent valid measurements (i.e. with radial angle > 20∘; CODAR, 2004a, b).
The first pair of HFR antennas, at VRSA and Mazagón, was installed in 2013 covering an area restricted to the eastern bight. Alfazina station started operating in November 2014, extending the spatial coverage westward of CSM (up to 8∘20′ W). In February 2016, the last antenna was installed in Sagres, and full coverage of the western shelf was achieved (Fig. 1). The dataset analysed in this study corresponds to the period with the largest coverage, from February 2016 to October 2020. Earlier data were used for validation.
ADCP records were obtained at five mooring stations along the coast (Armona, Cacela, Tavira, Alvor and Quarteira) at water depths of 20–23 m (for location, see red stars in Fig. 1). A total of 30 deployments, lasting 0.4 to 6 months each, were performed between 2008 and 2019 using Workhorse 600 kHz and Sentinel V 500 kHz ADCPs from TRDI (Fig. 2). For each deployment, the instrument was installed inside a cubic concrete artificial reef unit (1.4 m side) lying on the bottom, with the sensor head slightly rising out. Velocities were recorded along the water column within cells of 0.5–1 m in thickness (depending on the deployment) with a sampling interval of 60 min, at maximum. The standard deviation (SD) of the horizontal velocity resulting from the ADCP setup (number of pings per ensemble, cell size, etc.) was generally less than 0.03 m s−1.
Three Metocean iSPHERE drifters were deployed by Instituto Hidrográfico on 10 May 2013 at 2–8 km from the eastern bight shore, between 7∘ W and 7∘30′ W (Fig. 1). The drifters weighed 13.15 kg with a diameter of 34 cm. They have no drogue, making the drift relatively sensible to wind conditions. The drifters' position was recorded every 10 min by an internal GPS.

Figure 2ADCP deployments per month (x axis) between 2008 and 2019 (y axis) at Armona (black), Cacela (red), Tavira (green), Alvor (blue) and Quarteira (orange) stations.
3.2 Processing
ADCP data quality was ensured by independent validation of each ensemble following the procedure described in Garel et al. (2016). In particular, the upper cells affected by the surface boundary were removed based on the signal intensity. For this study, only validated near-surface cells (generally within the first 2–4 m from the surface) were considered.
The HFR maps with low spatial coverage (< 50 %) were removed from the time series. Subsequently, periods with infrequent consecutive maps were also discarded, resulting in data gaps ranging from 2 up to 144 d (see blanks in Fig. 3a). The zonal and meridional surface velocity components were linearly interpolated at grid nodes with time gaps ≤ 6 h. This threshold assures that no excessive interpolation is performed (as the flow generally does not change drastically during such time intervals). It was checked that other interpolation choices do not affect the results.
The HFR and ADCP velocity components were low-pass filtered with a Butterworth filter with a 40 h cut-off period. The resulting subtidal (or sub-inertial) zonal (u, positive eastward) and meridional (v, positive northward) velocities are considered hereafter, unless indicated. For HFR data, the mean, SD ellipses and eccentricity (, where a and b are the length of semi-major and semi-minor axes of an ellipse respectively) maps were produced for the region having at least 60 % of records at each grid node (Fig. 3b). This threshold allows consideration of a large area with few temporal gaps. For instance, the hourly velocity maps cover at least 80 % of the selected area during 90 % of the period 2016–2020 (Fig. 3a). The analysis was performed considering both the whole time series and seasons (defined for simplicity as winter: 1 December–28 February; spring: 1 March–31 May; summer: 1 June–31 August; and autumn: 1 September–30 November).

Figure 3(a) Temporal distribution of the spatial coverage area considering grid nodes having at least 60 % of records. (b) Percentage of data at each grid node with indication of the 60 % and 75 % isocontours (thick black lines). The isobaths of 100, 200 and 500 m are represented as thin black lines.
In order to describe the surface current main variability patterns, an empirical orthogonal function (EOF) analysis was applied to the subtidal HFR data following the techniques described in Kaihatu et al. (1998) and Kundu and Allen (1976). The current field V(x,t), where t is the time and x is the coordinate, is expressed as a complex scalar , where . The dataset V is then decomposed in terms of k spatial and k temporal coefficients (Φk and ak respectively, where k is an integer that ranges from 1 to the total number of grid nodes):
The spatial and temporal coefficients are complex numbers and are typically represented by their amplitude and phase. Furthermore, the complex eigenfunctions Φk can be decomposed according to the velocity components as .
Since EOF requires the dataset to be free of gaps, the velocity components were interpolated using the Data Interpolating Empirical Orthogonal Functions (DINEOF) method presented in Beckers and Rixen (2003), which is widely used for filling gaps of satellite-derived products (Alvera-Azcárate et al., 2005) and is suitable to the case of HFR data (e.g. Hernández-Carrasco et al., 2018; Kokkini et al., 2014). The DINEOF methodology was performed using unfiltered data, for maps having at least 75 % of spatial coverage (against 60 % for the mean and SD) to avoid excessive interpolation. The technique consists in subtracting the mean values from each time series and substituting the missing values with zero. Then, an EOF analysis is applied to the demeaned matrix in order to reconstruct the time series based on EOF modes with the highest variability. This procedure is performed iteratively, substituting the originally missing values with the estimated ones. The number of iterations and the number of modes to be retained are defined based on statistical convergence (achieved through cross-validation). The final step consists in summing the mean value back to each time series, which have then no gap.
The variability of the flow from the coastal region to the off-shelf region (i.e. the region offshore the 200 m isobath, hereafter) was evaluated along transects at the western bight, CSM and eastern bight (TrW, TrCSM and TrE, respectively; thick dotted lines in Fig. 1). Each transect is approximately perpendicular to the shelf break, which roughly corresponds to the coastline orientation: TrW and TrCSM are N–S, while TrE is NE–SW. The flow is represented by its alongshore (Val) and cross-shore (Vcr) components, corresponding to u and v, respectively, for TrW and TrCSM, and to u and v rotated 30∘ clockwise from east for TrE. The width (i.e. offshore extent from the coast) of EFs and PFs along the transects was quantified considering flows with Val of the same sign at the two most landward nodes, after smoothing out small velocity fluctuations with a five-node moving average.
The propagation of EFs and PFs along the coast was evaluated considering Val at three grid nodes located at a depth of 40 m (W2, C and E3 in Fig. 1). At these nodes, Val was obtained based on the angle of maximum variance, which closely corresponds to the nearby coastline orientation, as previously reported at inner-shelf mooring stations (de Oliveira Júnior et al., 2021; Garel et al., 2016; Prieto et al., 2009).
ADCP time series at Alvor, Tavira and Cacela stations were compared with HFR velocities at the nearest grid nodes to estimate the quality of HFR data near the coast. The selected nodes were located less than 1 km for Cacela and Tavira (which are both within the HFR coverage area) and at 4 km southward for Alvor. The other stations were not considered as Armona is well outside the HFR coverage area (see Fig. 1), and Quarteira records (in 2014–2015; Fig. 2) do not overlap with HFR ones.
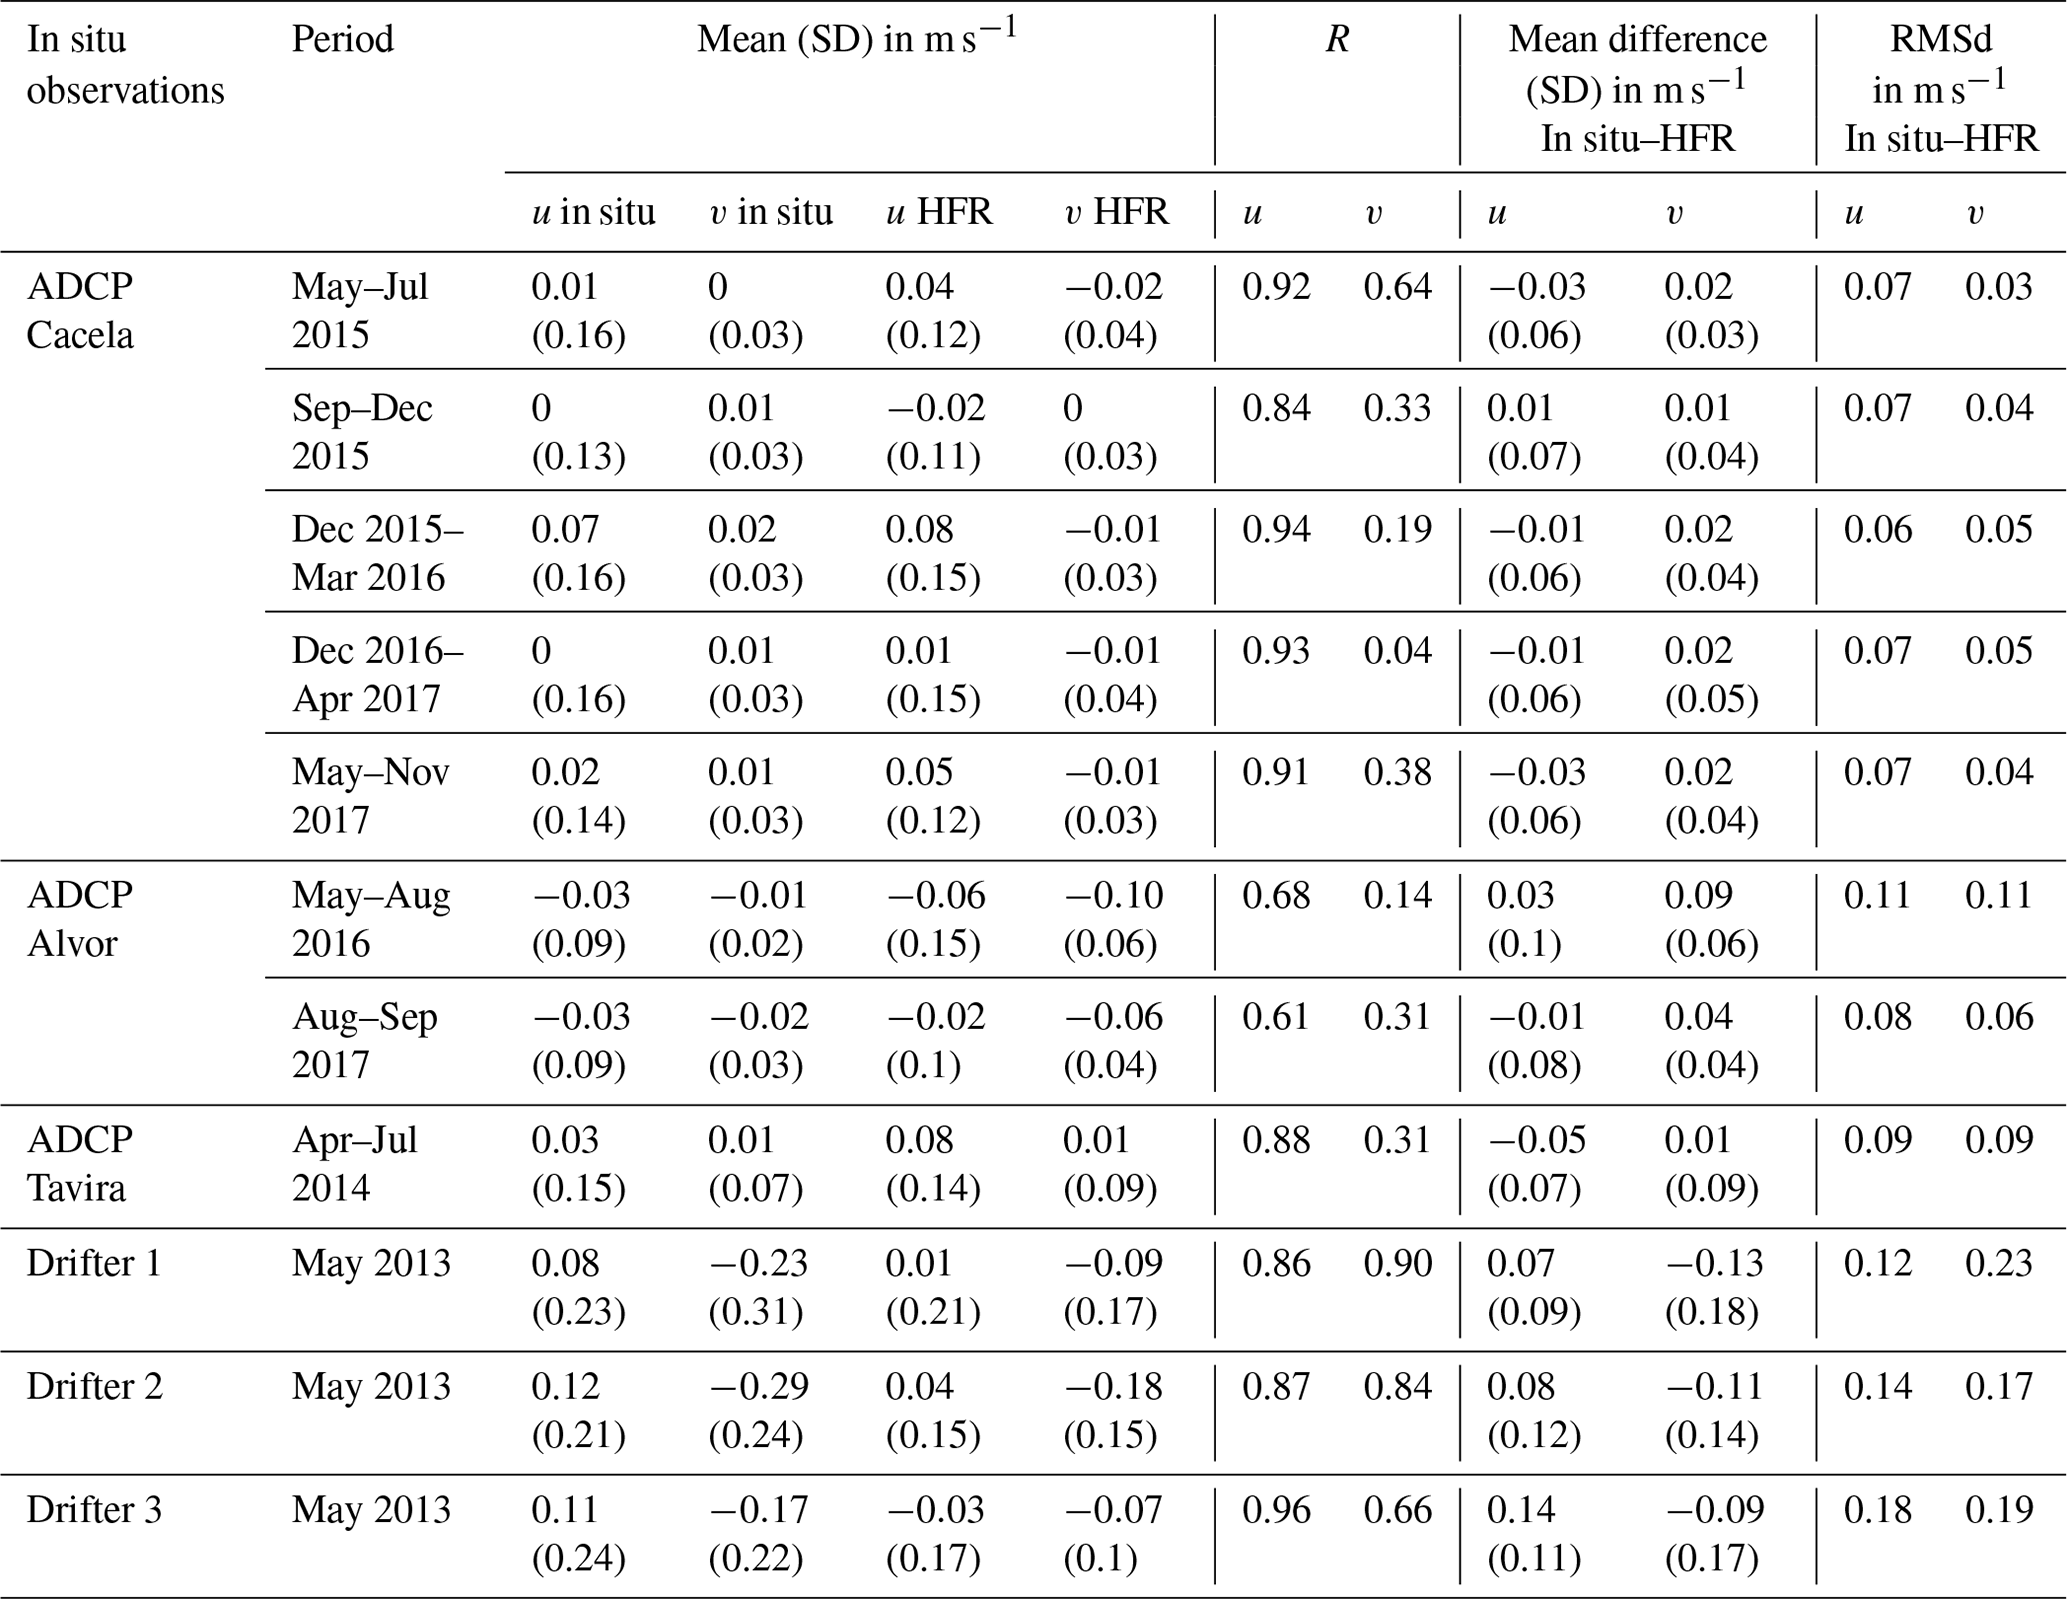
The mean ADCP velocity of the flow components is generally close to 0, while the SD of u is 1 order of magnitude larger than v, confirming that the coastal flow is mainly alongshore and polarised (Table 1). The HFR velocities feature similar characteristics, except at the Alvor grid node (where the mean of v is larger than the mean of u) possibly due to the distance between the HFR node and ADCP station. The deployment at Cacela from December 2016 to April 2017 illustrates the good correspondence between HFR and ADCP records and the predominance of the u flow component (Fig. 4). Overall, the Spearman correlation coefficient (R) between HFR and ADCP is very good (0.92) for u and poor for the weak v component (Table 1). The mean of the differences and the root mean square of the differences (RMSd) between HFR and ADCP velocities are small (≤ 0.09 and ≤ 0.11 m s−1 respectively). Large differences up to 0.3 m s−1 (Fig. 4a) are episodically observed. Such differences are expected due to the distinct depth of HFR and ADCP measurements. ADCPs upper measurements are at 2–4 m below the surface, while the radars measure the surface layer (< 0.5 m below surface), which is more likely affected by wind drag. Moreover, HFR and ADCP systems have distinct measurement methods (e.g. in terms of horizontal position, footprint, sampling duration and averaging). Despite these inherent differences between both equipment, the correlations between HFR and ADCP velocities support the good quality of the HFR measurements, in particular near the coast. Furthermore, the present skill scores are similar to those obtained at regions with flow velocities similar to the ones at the NMGoC (Lorente et al., 2015).

Figure 4Comparison of the flow velocity (m s−1) recorded by an ADCP at Cacela station (red lines) with the velocity at the nearest HFR grid node (black lines) from December 2016 to April 2017: (a) eastward component u and (b) northward component v.
On the shelf, drifter's trajectories were qualitatively compared with HFR trajectories obtained from a progressive vector diagram (PVD) of unfiltered velocities. For statistical comparisons with unfiltered HFR data at the nearest node, the drifter's pseudo-Eulerian velocities were derived from the distance between pairs of successive drifters' positions, subsampled at the HFR time, divided by the time interval (1 h).
The trajectories of the three drifters presented a general southward displacement of 31–45 km affected by clockwise inertial rotation (Fig. 1, grey lines). Such overall drift was fairly reproduced by the PVDs in all three cases (Fig. 1, black lines), although they remained closer to the shore than the drifters (in particular when compared with drifter 3). The skill scores between the drifter-derived and HFR flow components is poorer than for HFR-ADCP data (Table 1). Discrepancies between HFR and drifter pseudo-Eulerian velocities are inherent to their distinct acquisition techniques (e.g. spatial averaging of Eulerian records for HFR against Lagrangian measurements at a point for the drifters and subsequent transformation to pseudo-Eulerian velocities), along with the potential wind drag effect on the emerged part of the drifters. Nevertheless, the results are within the range of what has been reported as satisfactory in other studies comparing HFR currents with various types of drifters (Kaplan et al., 2005; Paduan and Rosenfeld, 1996; Solabarrieta et al., 2014).
Table 1Validation statistics between HFR and in situ (i.e. ADCP, drifter) measurements of the u and v flow components.
5.1 Mean circulation
HFR mean velocities are broadly oriented southeastward over the study area (Fig. 5a). This direction generally corresponds to the main variability of the SD (see the elongated ellipses with northwest–southeast orientation in Fig. 5b), indicating the predominance of southeastward currents through time. At off-shelf regions where the current direction varies importantly, in particular between 8∘10′ W and 8∘20′ W and between 7∘15′ W and 7∘30′ W (see rounded ellipses and areas with dark blue colours in Fig. 5b), the mean currents remain southeastward. West of 8∘45′ W, mean currents are towards the south and southwest but vary principally along the northwest–southeast direction. This region is also characterised by strong velocities (see the large SD ellipses in Fig. 5b). It is noted that some rays emanating from the HFR antennas feature regions with lower eccentricity than the surroundings, suggesting a slight underestimation of one of the flow components.
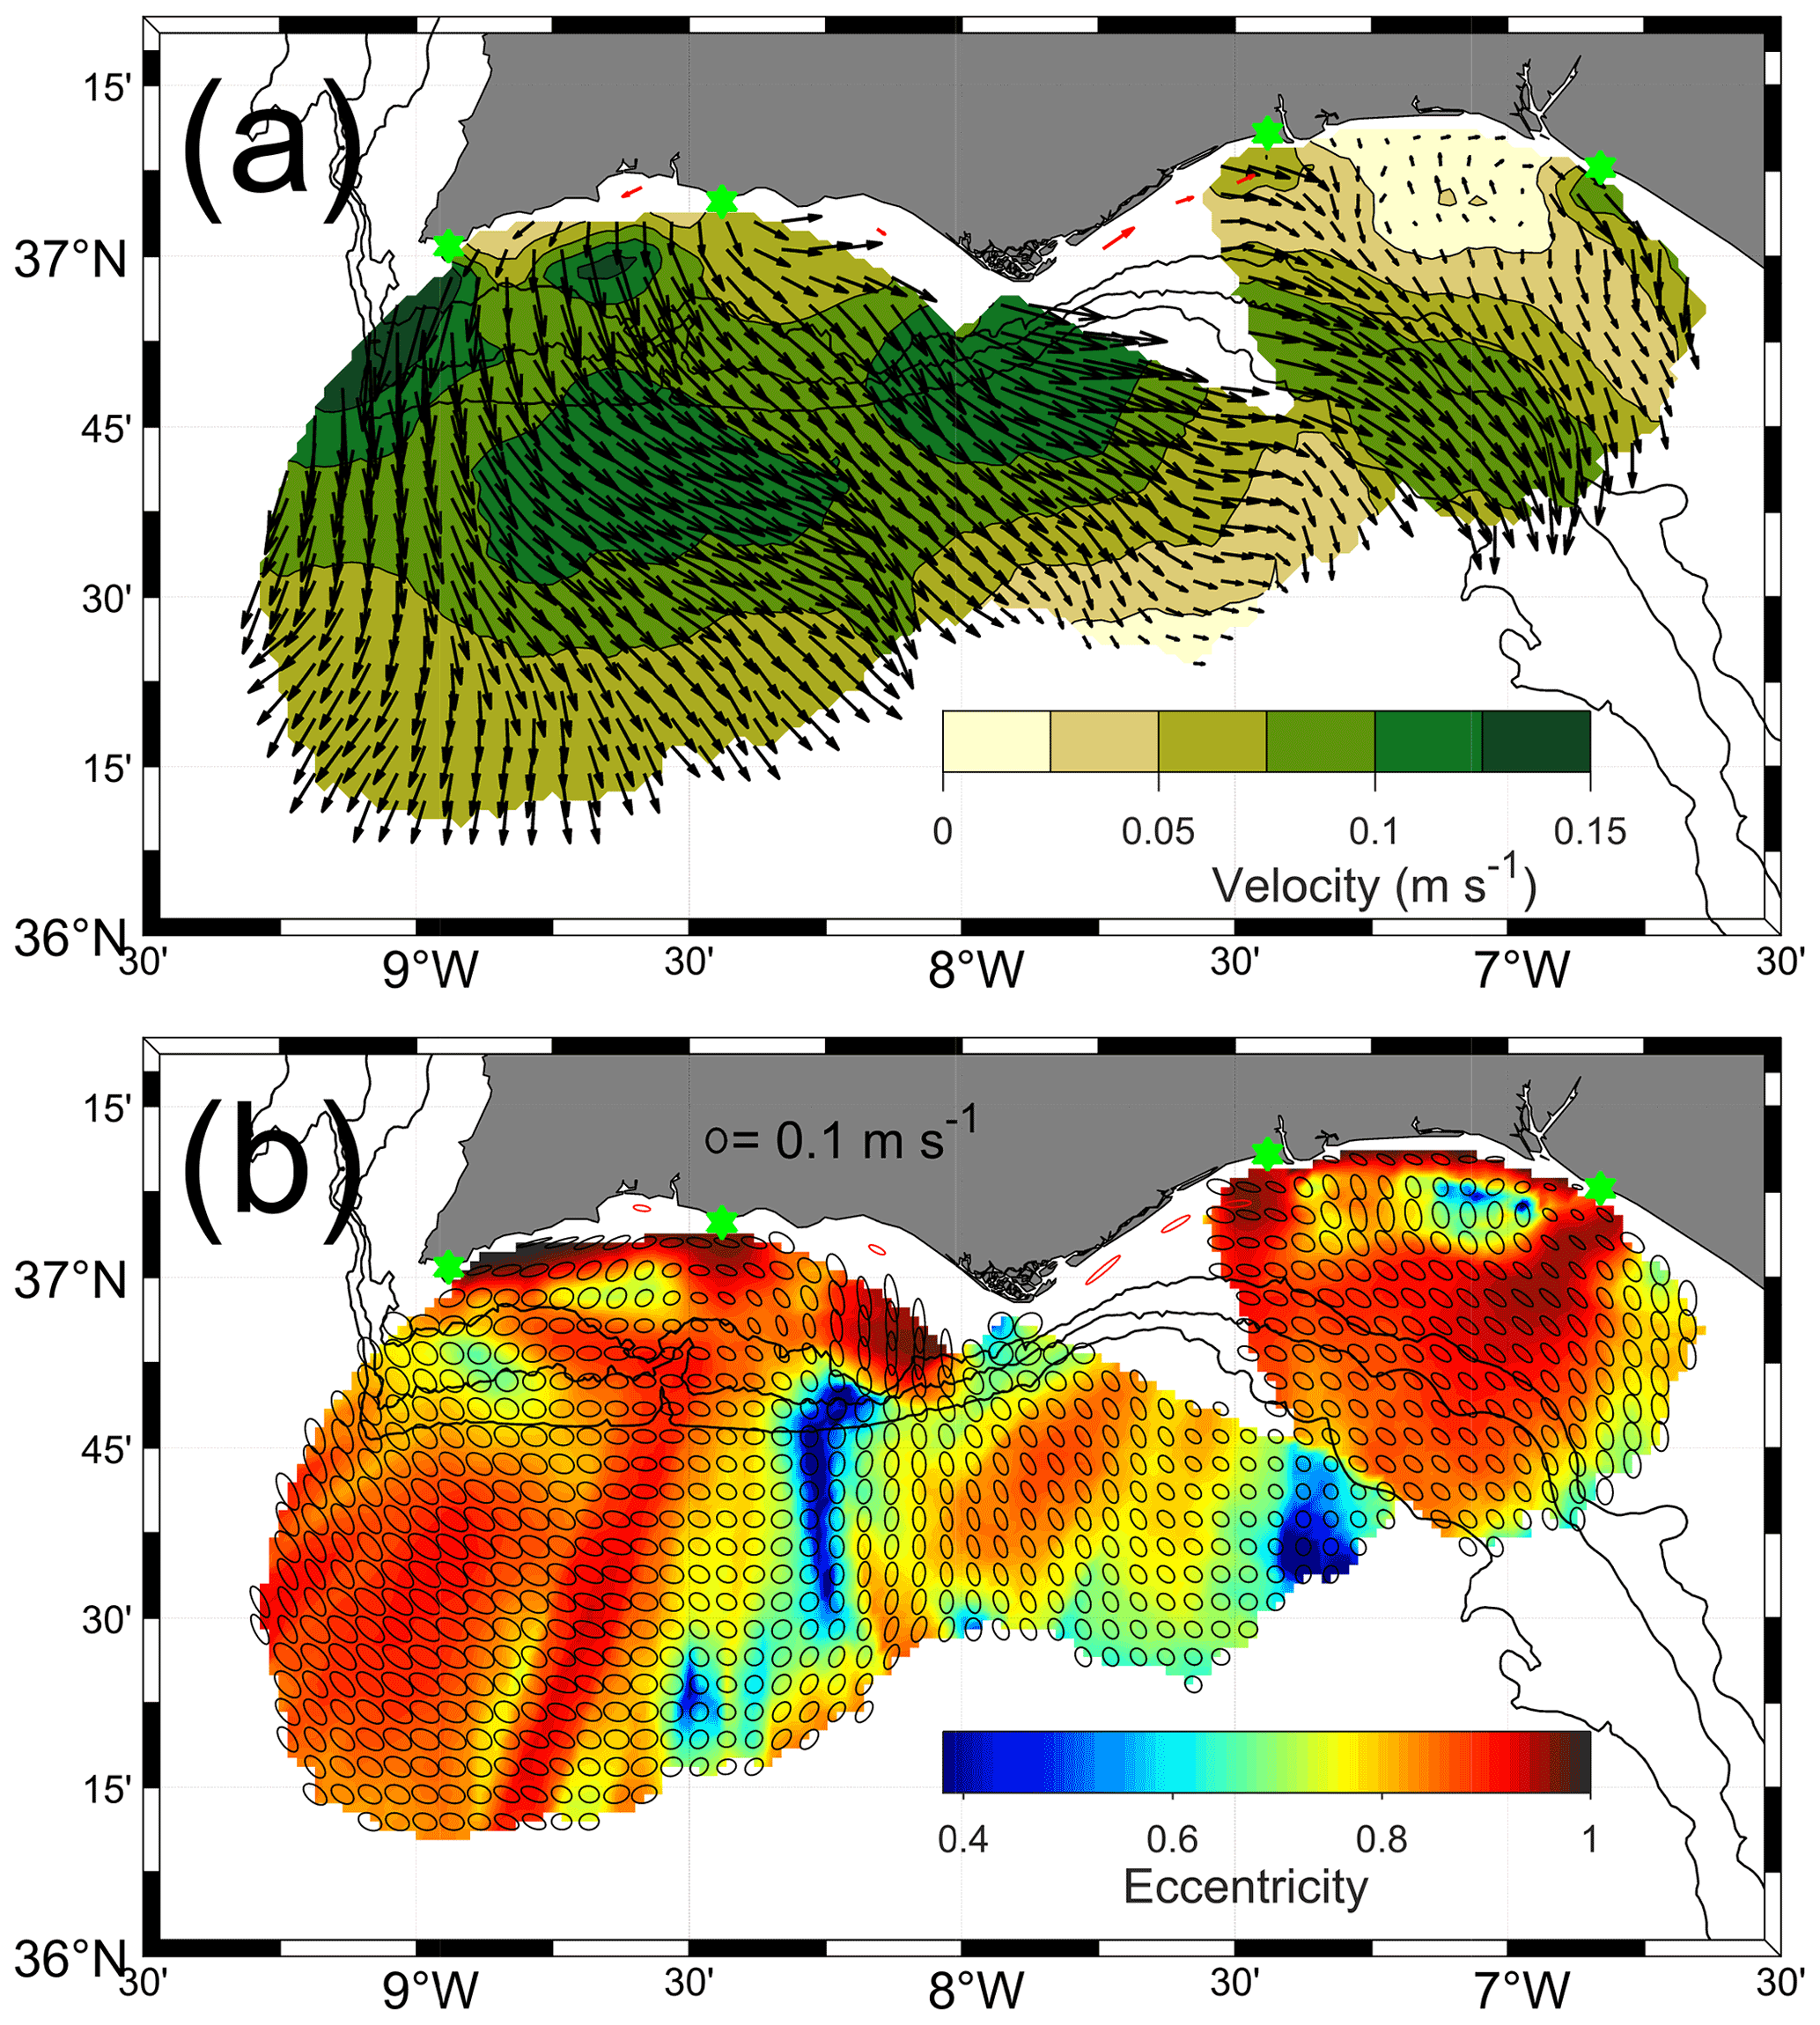
Figure 5Mean HFR surface velocities (a) and SD ellipses and eccentricity (b) for the period February 2016–October 2020. For clarity, the ellipses and arrows are represented every three grid nodes. The mean velocity and SD ellipses of ADCP data for the deployment periods and stations indicated in Fig. 2 are shown in red. The locations of the HFR antennas are indicated with green stars.
The main feature revealed in the mean flow is a zonal band with strong velocities (from 0.075 up to 0.15 m s−1), elongating east–west across the whole study area (between 36∘30′ N and 36∘55′ N, broadly). This region of intensified mean currents (RIMC, hereafter) includes the shelf slope. At the western bight, the RIMC is broader and presents greater velocities than at the eastern bight; the southeastward mean currents are oblique with respect to the (east–west) shelf break orientation. The mean flow at the RIMC rotates cyclonically near CSV and is aligned with the shelf slope isobaths at the eastern bight due to the predominance of along-slope currents, as indicated by the SD ellipse orientations.
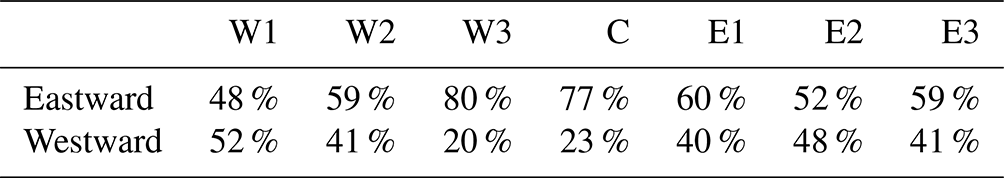
A well-defined region of high eccentricity values is observed near the coast (dark red in Fig. 5b), except in front of CSM. These elongated SD ellipses result from the dominance of alongshore currents. The eccentricity is close to a value of 1 at coastal regions where the grid nodes and antennas are aligned (e.g. near CSV), due to an underestimation of the orthogonal velocity component (which does not challenge the observed overall predominance of alongshore flows). The mean coastal flow velocity is generally > 0.05 m s−1 and equatorward, being poleward only near CSV (Fig. 5a). This pattern is consistent with the mean ADCP velocities, which are all alongshore and equatorward, except at Alvor station where it is poleward (see red arrows and red ellipses in Fig. 5). However, considering the u component at the seven selected nodes on the shelf (for location, see Fig. 1), the relative occurrence of EFs and PFs is balanced, except near CSM and its western flank (Table 2). The strongest mean velocities are observed at the capes (about 0.10 m s−1 at CSM and 0.15 m s−1 at CSV) and also near 8∘40′ W over the mid-shelf where the flow is offshore (southward). Finally, the shelf between the Guadiana and Tinto–Odiel river mouths is characterised by variable flow directions with balanced magnitude, resulting in the weakest mean flow in the study area (< 0.025 m s−1 with SD = 0.15 m s−1). In detail, the SD ellipses are elongated alongshore near the coast and along the slope at the shelf break but feature a significant cross-shelf component in between.
Table 2Percentage of occurrence between the eastern (u) component of eastward and westward flows at the selected nodes.
5.2 Seasonal variability
The overall mean current direction and SD patterns (Fig. 5) remain similar for all seasons, including the coastal alongshore flow delineated by low eccentricity values (Fig. 6). Seasonality is mainly observed in terms of velocity magnitude at the RIMC over the western bight (Fig. 6a–d). There, the RIMC evolves from a narrow (zonal) band with relatively weak mean currents in winter to a wide band (extending significantly off-shelf) of strong mean velocities (up to 0.2 m s−1) in summer. Spring corresponds to an intermediate situation between winter and summer. In autumn, mean currents are the weakest (generally < 0.075 m s−1), and the RIMC is poorly expressed.
Over the shelf, the mean currents are dominantly towards the SE in winter and spring (Fig. 6a, b). In summer and autumn, they describe a cyclonic pattern from CSV (southwestward) to CSM (southeastward; Fig. 6c, d). The shelf region with strong southward velocity near 8∘40′ W (Fig. 5) is best defined in summer. For all seasons, the largest variability on the shelf (SD > 0.2 m s−1) corresponds to EFs at the western flank of CSM (Fig. 6e–h). By contrast, the mean currents over the east margin (including the RIMC) have a relatively constant magnitude and direction for all seasons. It is noted that the cross-shelf component is enhanced at the eastern limit of the study area.
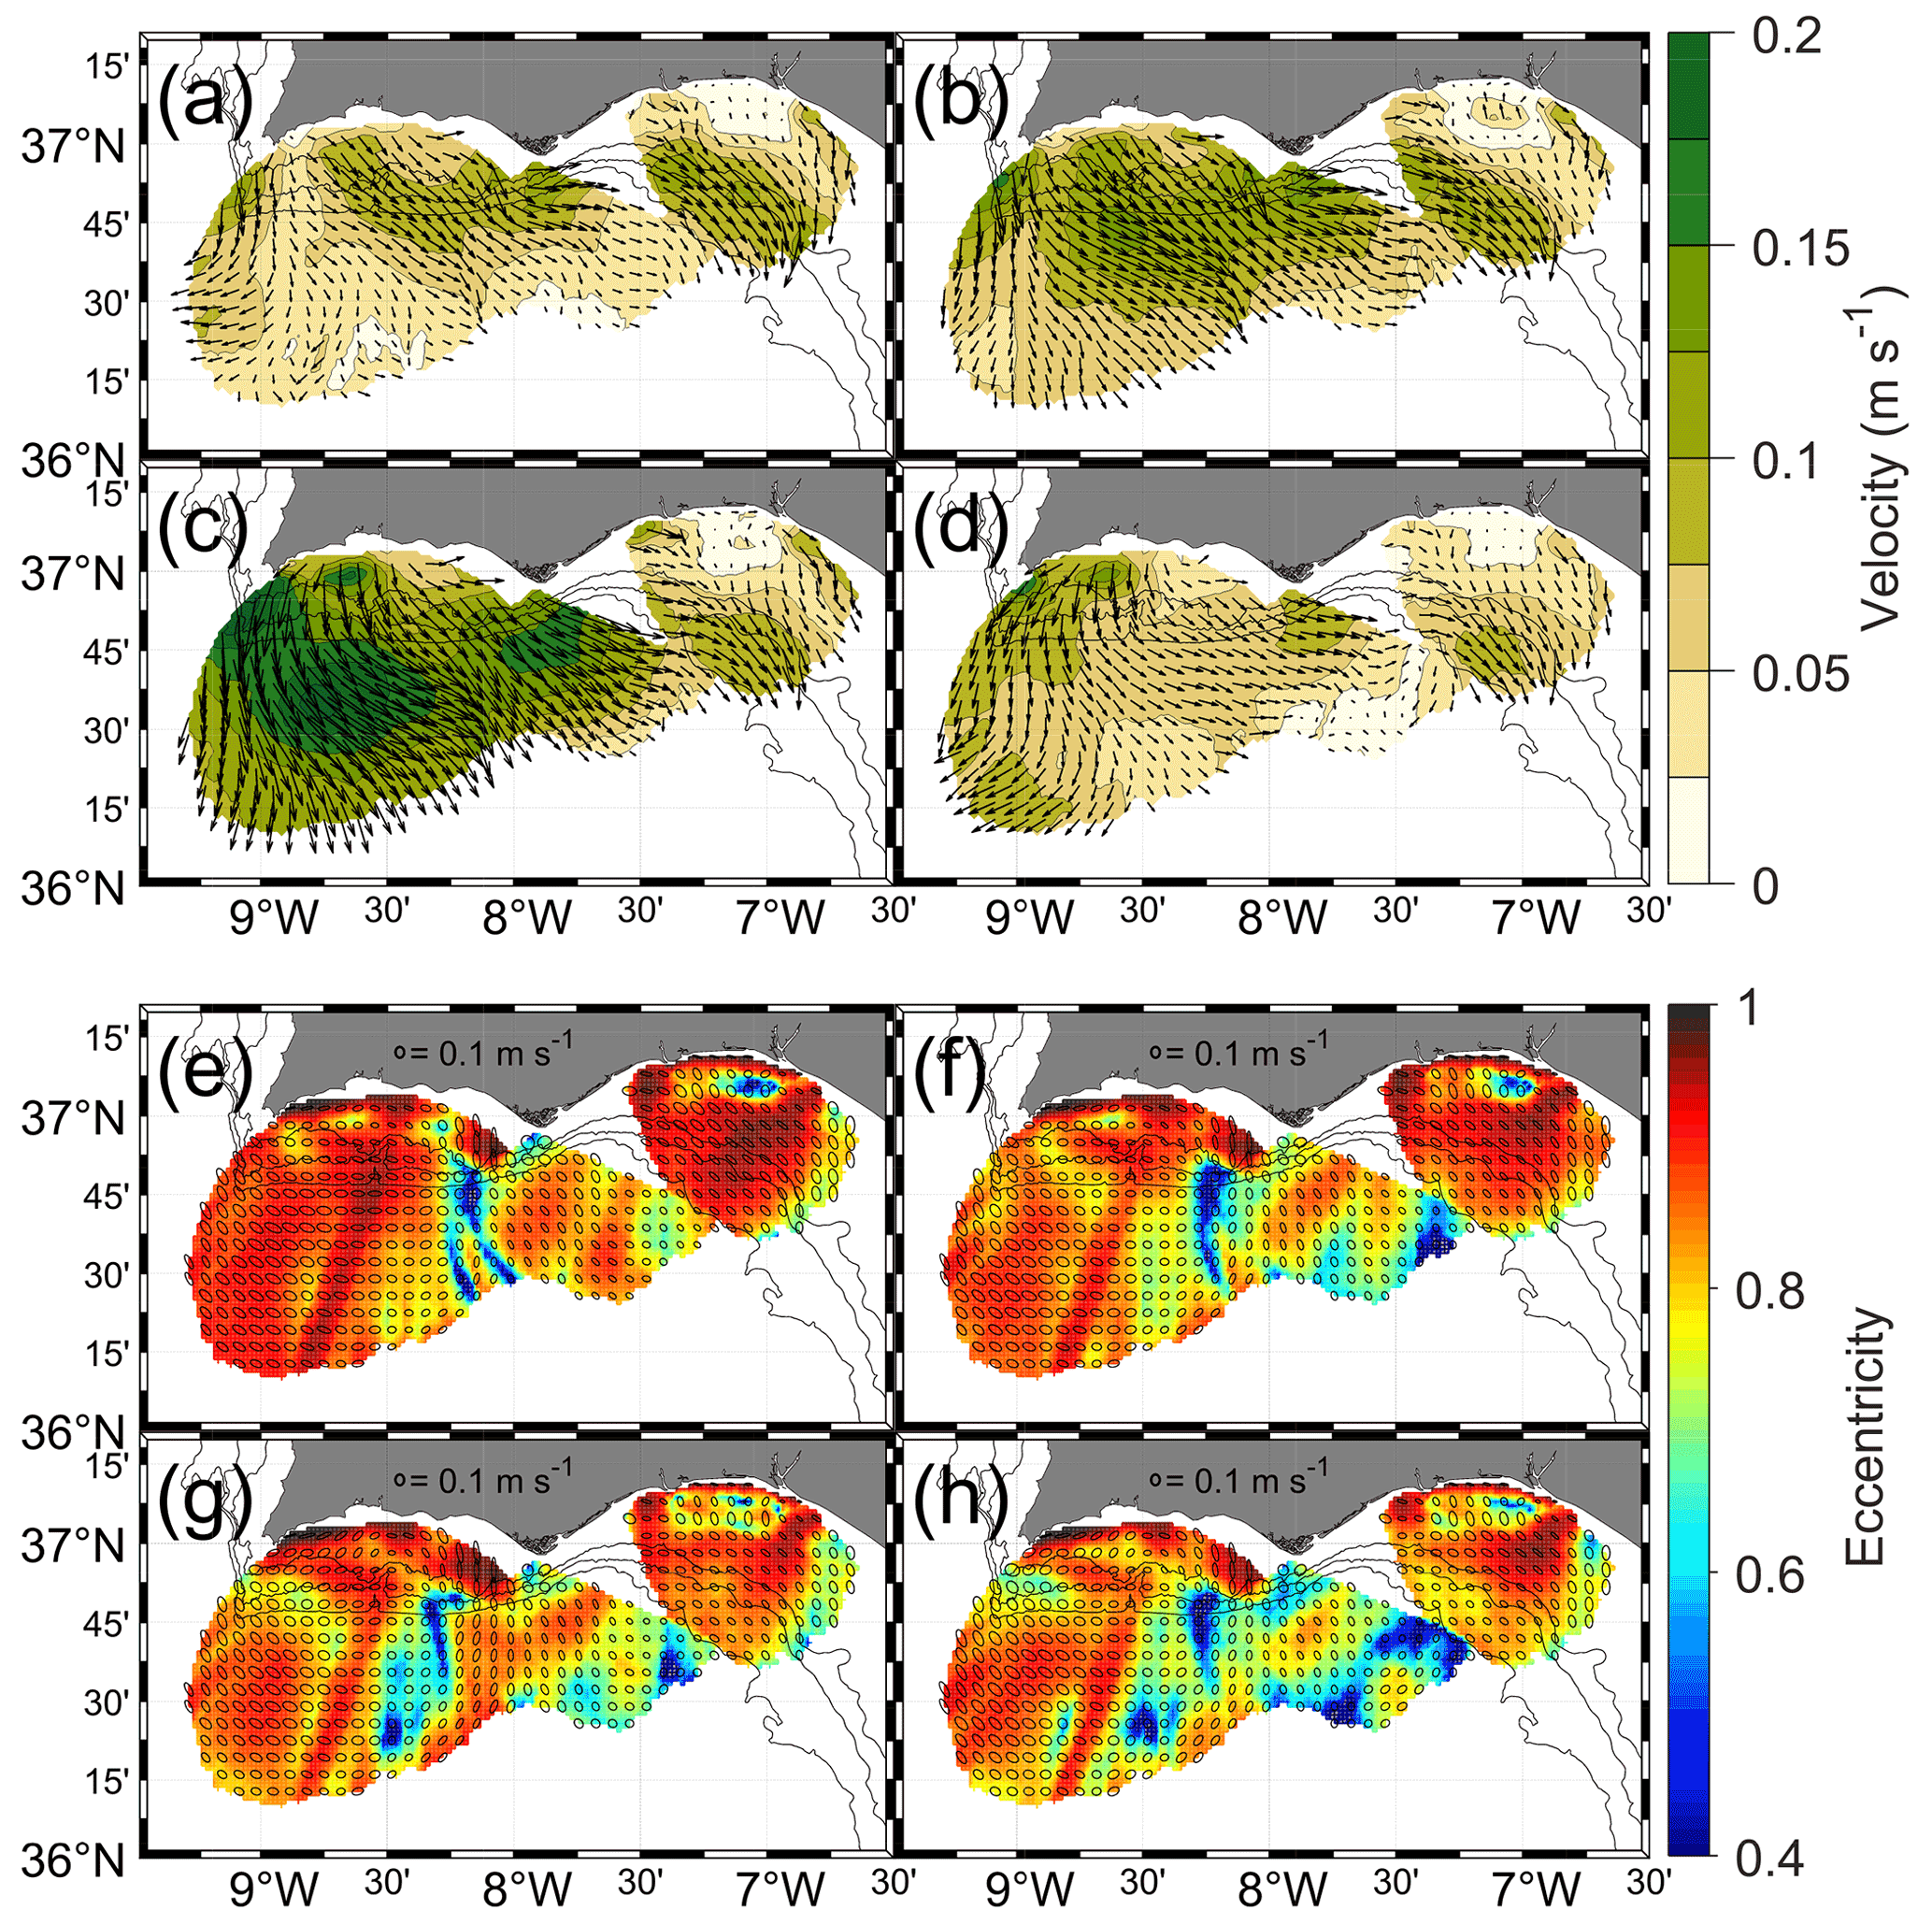
Figure 6Seasonal mean HFR currents and standard deviation with eccentricity as colour maps in (a, e) winter, (b, f) spring, (c, g) summer and (d, h) autumn for the period February 2016–October 2020. For clarity, the ellipses and arrows are represented every four grid nodes.
5.3 Main circulation patterns
Modes 1 and 2 of the complex EOF analysis account for 59 % of the data variability (47 % and 12 %, respectively). The other modes explain no more than 6 % each. The dominant spatial pattern described by mode 1 corresponds to EFs over the inner-shelf and southeastward flows offshore having maximum amplitude south of CSV (Fig. 7a). Exceptions to this general pattern occur west of CSM (southward shelf flows) and from the Guadiana to the Tinto and Odiel river mouths (cyclonic rotation of the coastal flow). Mode 1 circulation is relatively constant through time, as its phase is generally close to 0 (Fig. 7c). For example, it is between −25 and 25∘ 47 % of the time, in particular in spring and summer (70 %); at that time, the amplitude is also the highest (as illustrated by the low-pass-filtered time series in Fig. 7d), denoting a more vigorous circulation than in autumn and winter. Reversals of spatial mode 1 occur during any season but are relatively rare, the phase being between 155 and 205∘ 9 % of the time, only (Fig. 7c, d).
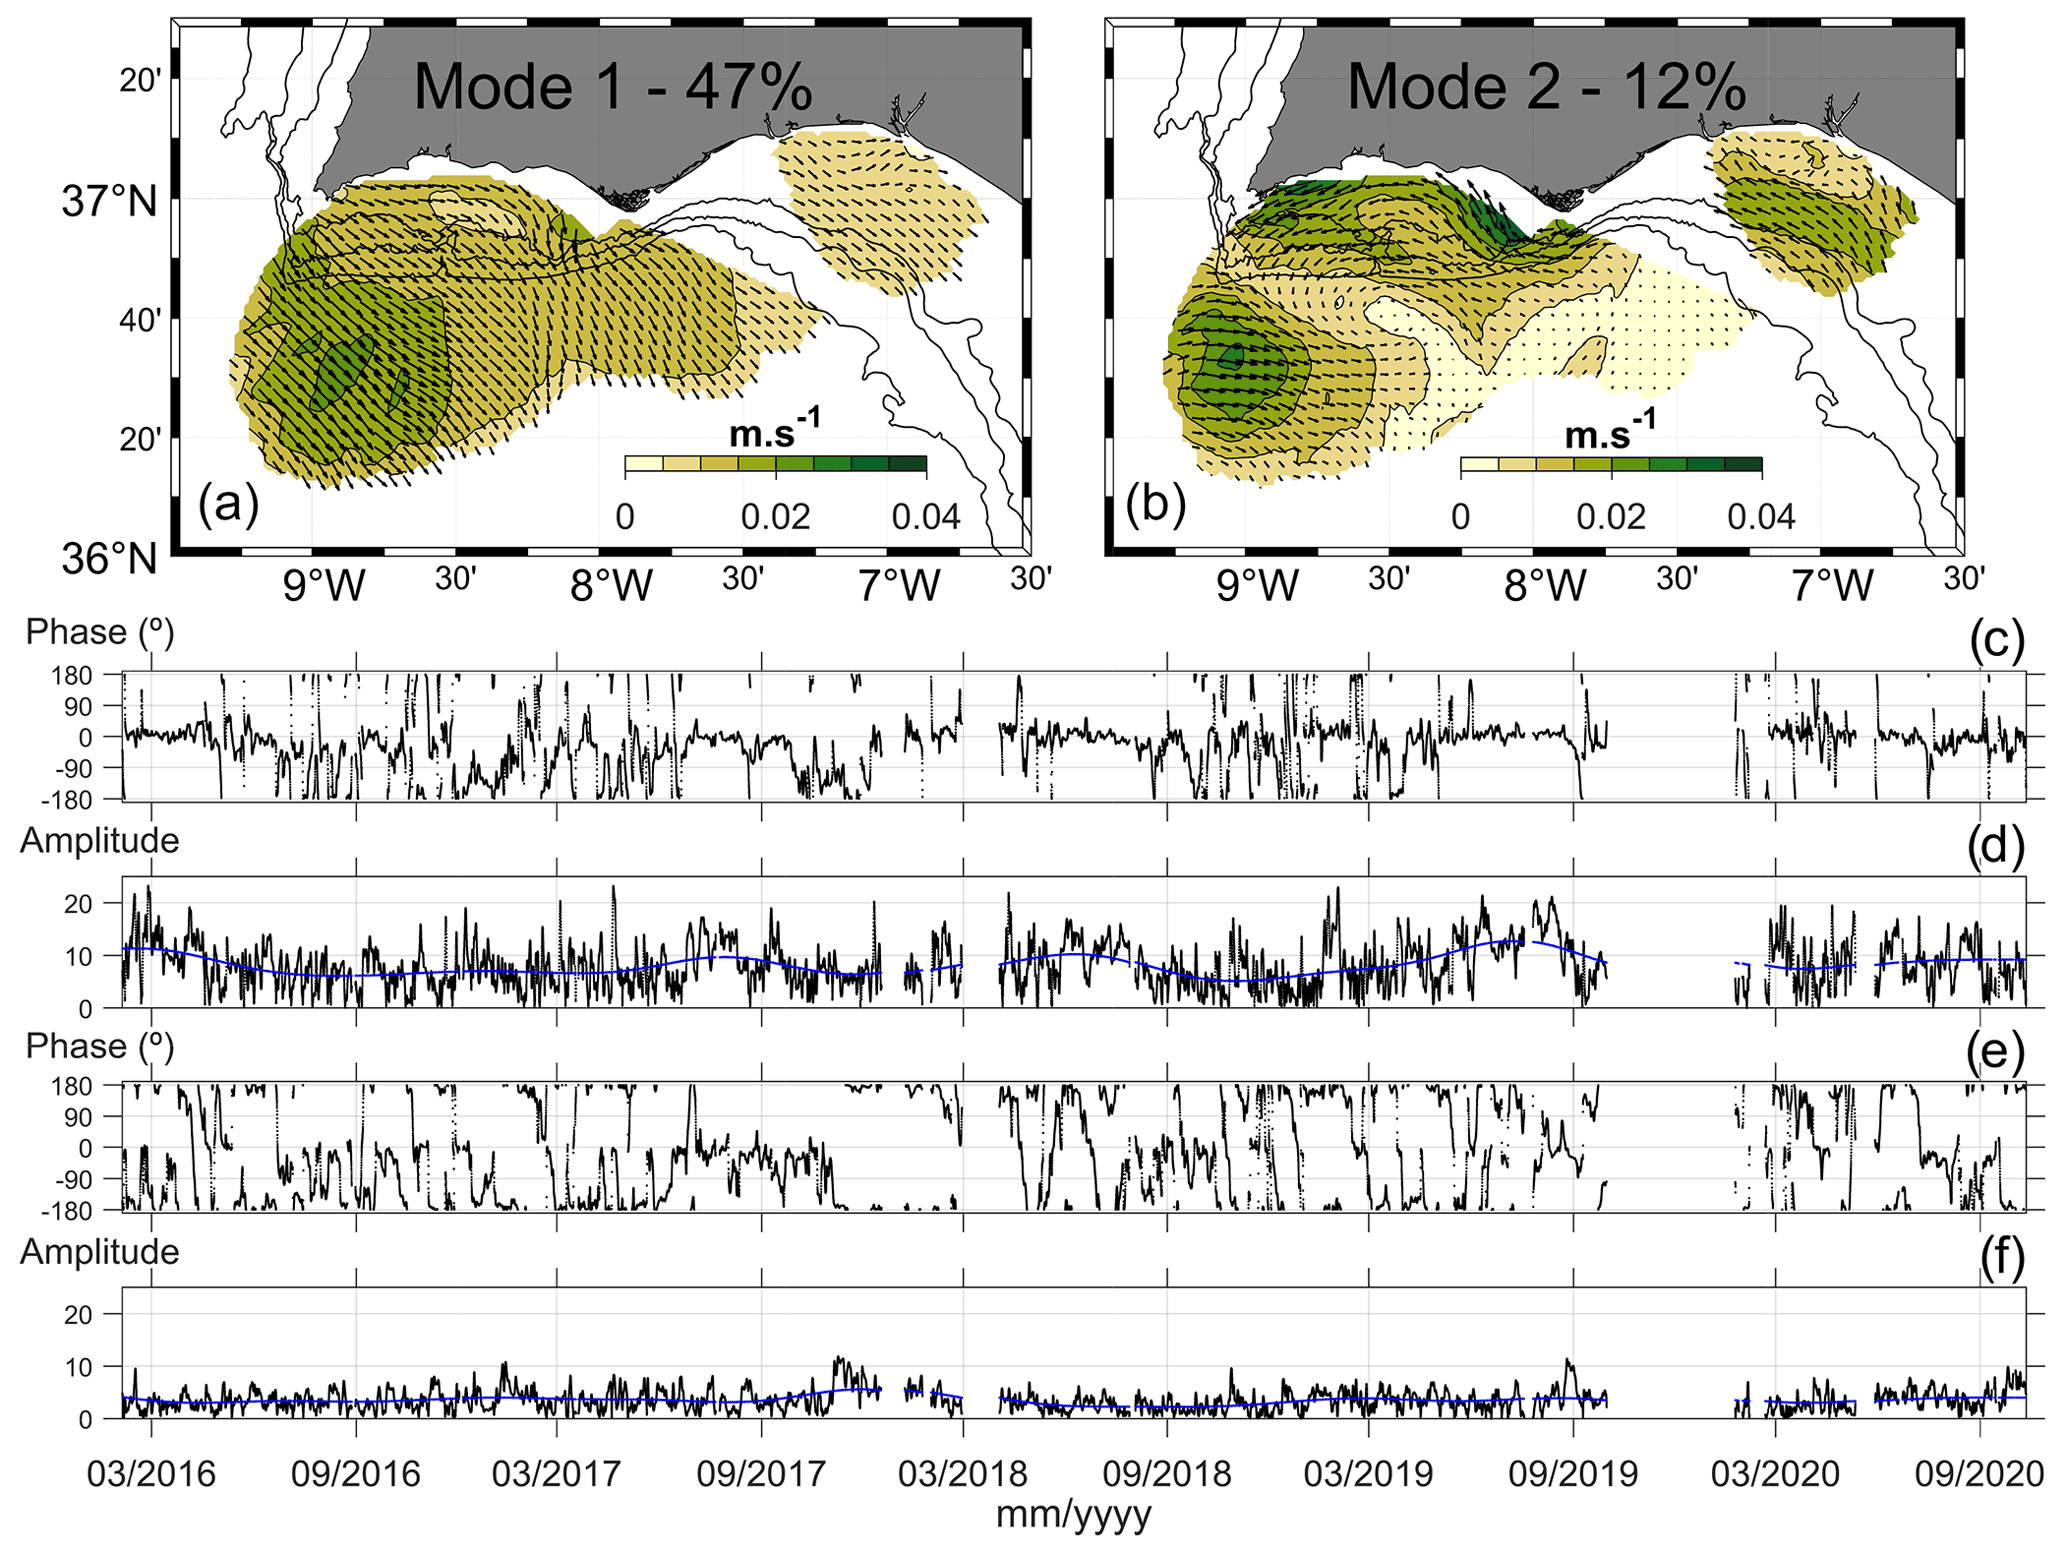
Figure 7Results of the complex EOF analyses: spatial modes 1 (a) and 2 (b) and temporal modes 1 (c: phase, d: amplitude) and 2 (e: phase, f: amplitude). The reconstructed velocity for each mode corresponds to the local spatial value multiplied by the dimensionless amplitude and rotated respective phase angle. For clarity, arrows are represented every three grid nodes. The ticks on the x axes indicate the beginning of spring and autumn. The blue line in (d) and (f) represents the low-pass-filtered time series with a cut-off period of 6 months.
Mode 2 describes a more variable circulation, both spatially and temporally, than mode 1 (Fig. 7b). Velocity amplitudes are greatest over the shelf (except for the offshore area south of CSV, as for mode 1). At the western bight, the circulation features a cyclonic cell, about 70 km in diameter, characterised by strong PFs near the coast that recirculate offshore near CSV to merge with the region of maximum amplitude offshore. This circulation pattern occurs mainly (64 %) in summer and in autumn, when the phase is dominantly between −25 and 25∘ (Fig. 7e). PFs are comparatively weaker at the eastern shelf and are best observed on the outer shelf rather than inner shelf. Of note is that this flow goes around CSM, thus connecting both shelves. Mode 2 is often out of phase, being for example between 155 and 205∘ 48 % of the whole time series (against 19 % of the time between −25 and 25∘) and up to 60 % in winter and spring. For approximately 30 % of these “out-of-phase” events in winter and spring, mode 1 is in phase. Therefore, both modes contribute to the development of strong EFs over the shelf and southeastward flows further offshore.
It is noted that the EOF results remain similar with unfiltered data. In particular, the spatial patterns of modes 1 and 2 are similar to filtered data, and the explained variability is 42 % and 9.4 % respectively.
5.4 Flow variability
The Hovmöller diagrams of currents at transects TrW, TrCSM and TrE show that the alongshore component is generally stronger than the cross-shore one (Fig. 8; see Fig. 1 for transect locations). Both components tend also to be weakest at TrE (Fig. 8e, f), as previously observed at the eastern bight on the mean and SD maps (see Figs. 5 and 6). Coastal PFs are often restricted to the shelf, i.e. up to the 200 m isobath (indicated with black horizontal lines in Fig. 8). By contrast, EFs tend to occupy the entire transects' length, especially at TrW and TrCSM. The analysis of coastal flows' width (i.e. cross-shore extension from land) confirms this pattern: 60 %–70 % of PFs extend up to the shelf break (Fig. 9a, c, e), while EFs extend dominantly up to the offshore limit of each transect (Fig. 9b, d, f). Cross-shore velocities are predominantly directed offshore (orange in Fig. 8). Onshore flows (green in Fig. 8) may occur in any season, the strongest events often being associated with strong PFs (red in Fig. 8) along the whole transect (such as in March–June 2017) corresponding to periods of north-westward flows over the study area.
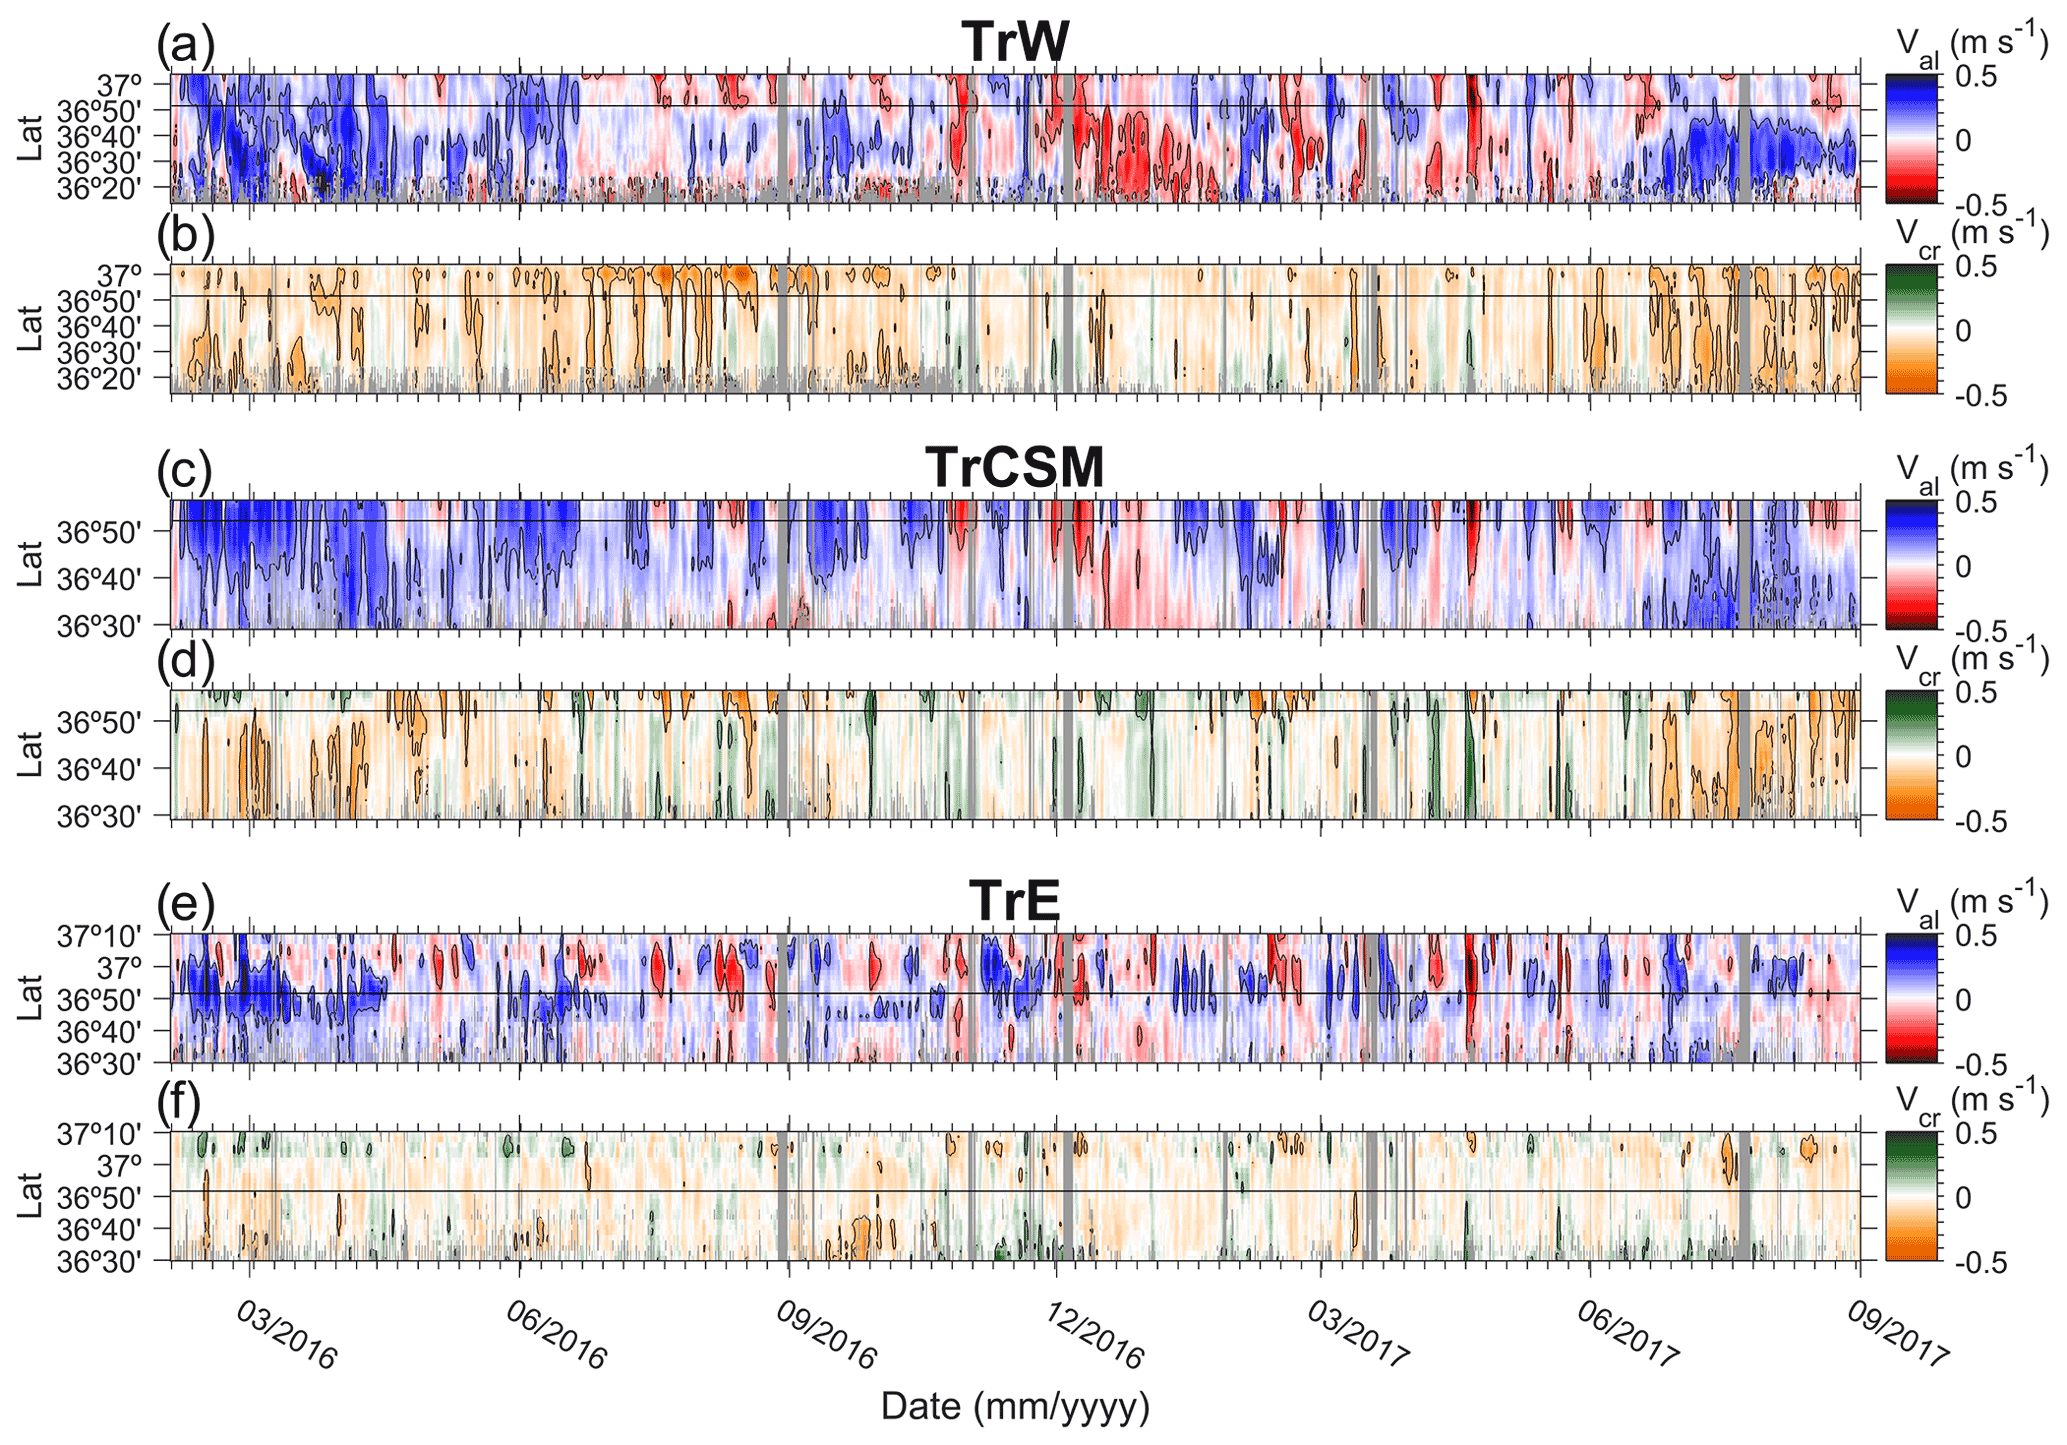
Figure 8Hovmöller diagram of Val (a, c, e) and Vcr (b, d, f) extracted at transects TrW, TrCSM and TrE, from 3 February 2016 to 1 September 2017. Equatorward and poleward velocities are represented in blue and red, respectively; onshore and offshore velocities are represented in green and orange, respectively. Black contours indicate ± 0.15 m s−1. The 200 m isobath is indicated as a black horizontal line. Major ticks on x axes represent the first day of the indicated month, and minor ticks represent 1-week intervals.
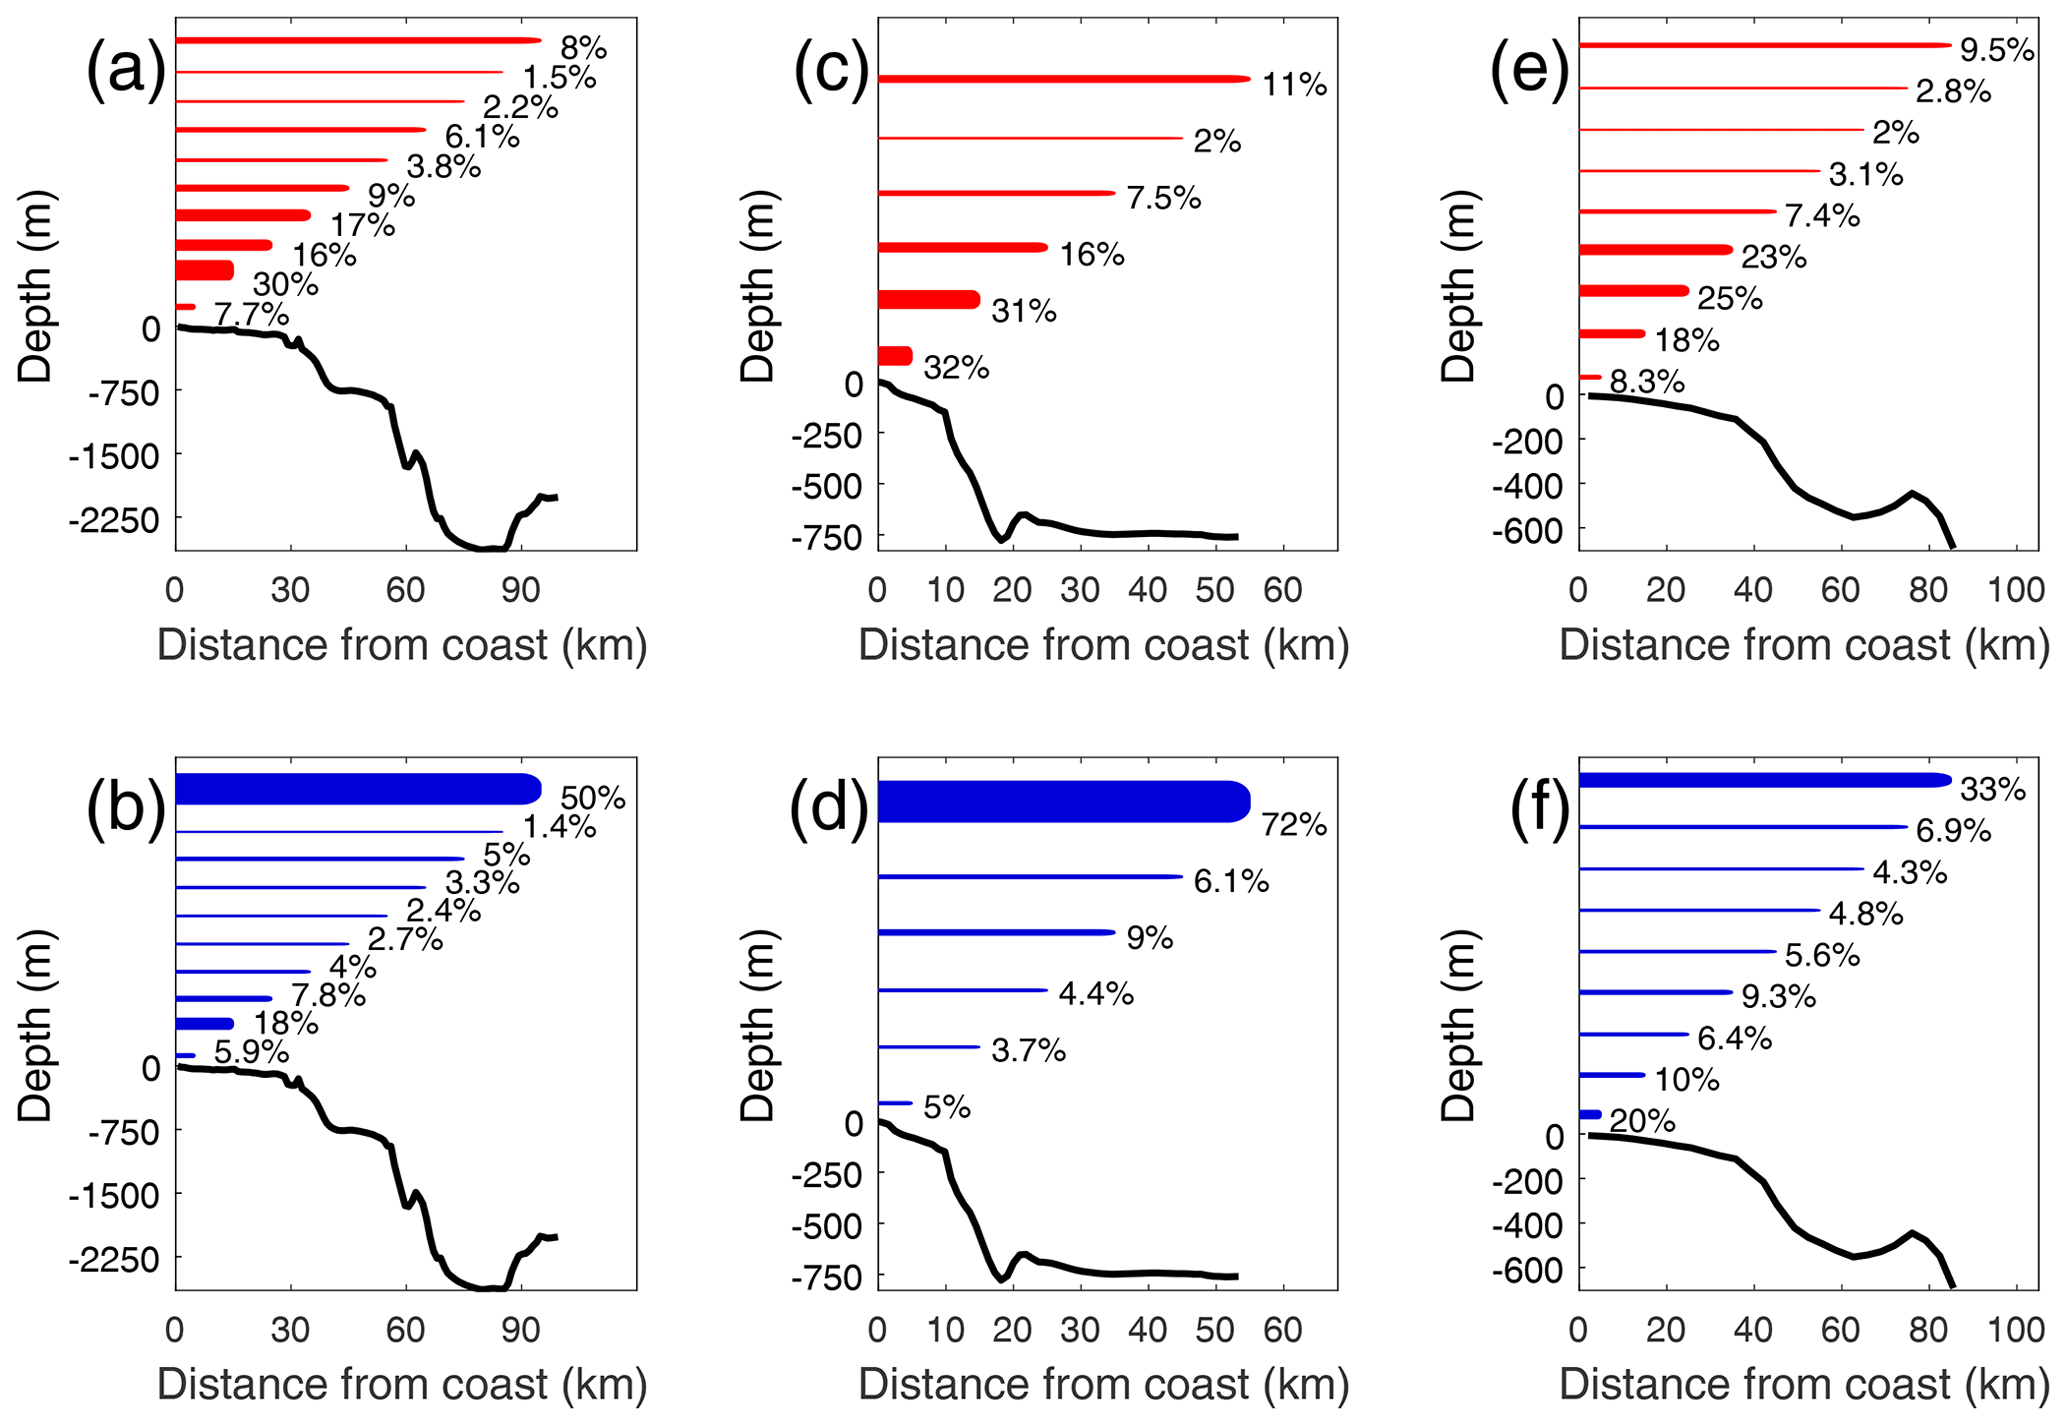
Figure 9Percentage of the offshore extent (from the coast) of alongshore flows (PF: red; EF: blue) at transects TrW (a–b), TrCSM (c–d) and TrE (e–f). Each bar represents the distance from the coast, and bar thickness indicates the percentage. The along-transect bathymetry is represented as a black line.
At TrW, strong offshore flows (Vcr up to 0.5 m s−1) are observed over the shelf in summer and autumn (e.g. see summer 2016 in Fig. 8b). During these events, Val is mainly poleward over the shelf and equatorward further offshore, in agreement with the cyclonic pattern described by EOF mode 2 (also in summer and autumn) over this region (see Fig. 7b, e–f). Similar observations at TrCSM also suggest an episodic cyclonic recirculation of coastal PFs in front of CSM (e.g. end of summer 2017 in Fig. 8c, d).
6.1 Slope current
The present analysis of HFR subtidal currents shows that the mean surface circulation at the NMGoC is southeastward and strongest over the slope at the so-called RIMC (Figs. 5 and 6). Previous surveys have directly measured strong currents oriented along the slope with magnitude (0.15–0.2 m s−1) similar to the present observations (e.g. Fig. 8; Cravo et al., 2013; Criado-Aldeanueva et al., 2009, 2006; García-Lafuente et al., 2006; García Lafuente and Ruiz, 2007; Peliz et al., 2009; Relvas and Barton, 2005). This current is a prominent feature of the spring–summer climatological geostrophic circulation (Sánchez and Relvas, 2003). Numerical modelling also predicts a temporally persistent slope current, the GCC, with equivalent magnitude in the upper layer (Peliz et al., 2014, 2009, 2007).
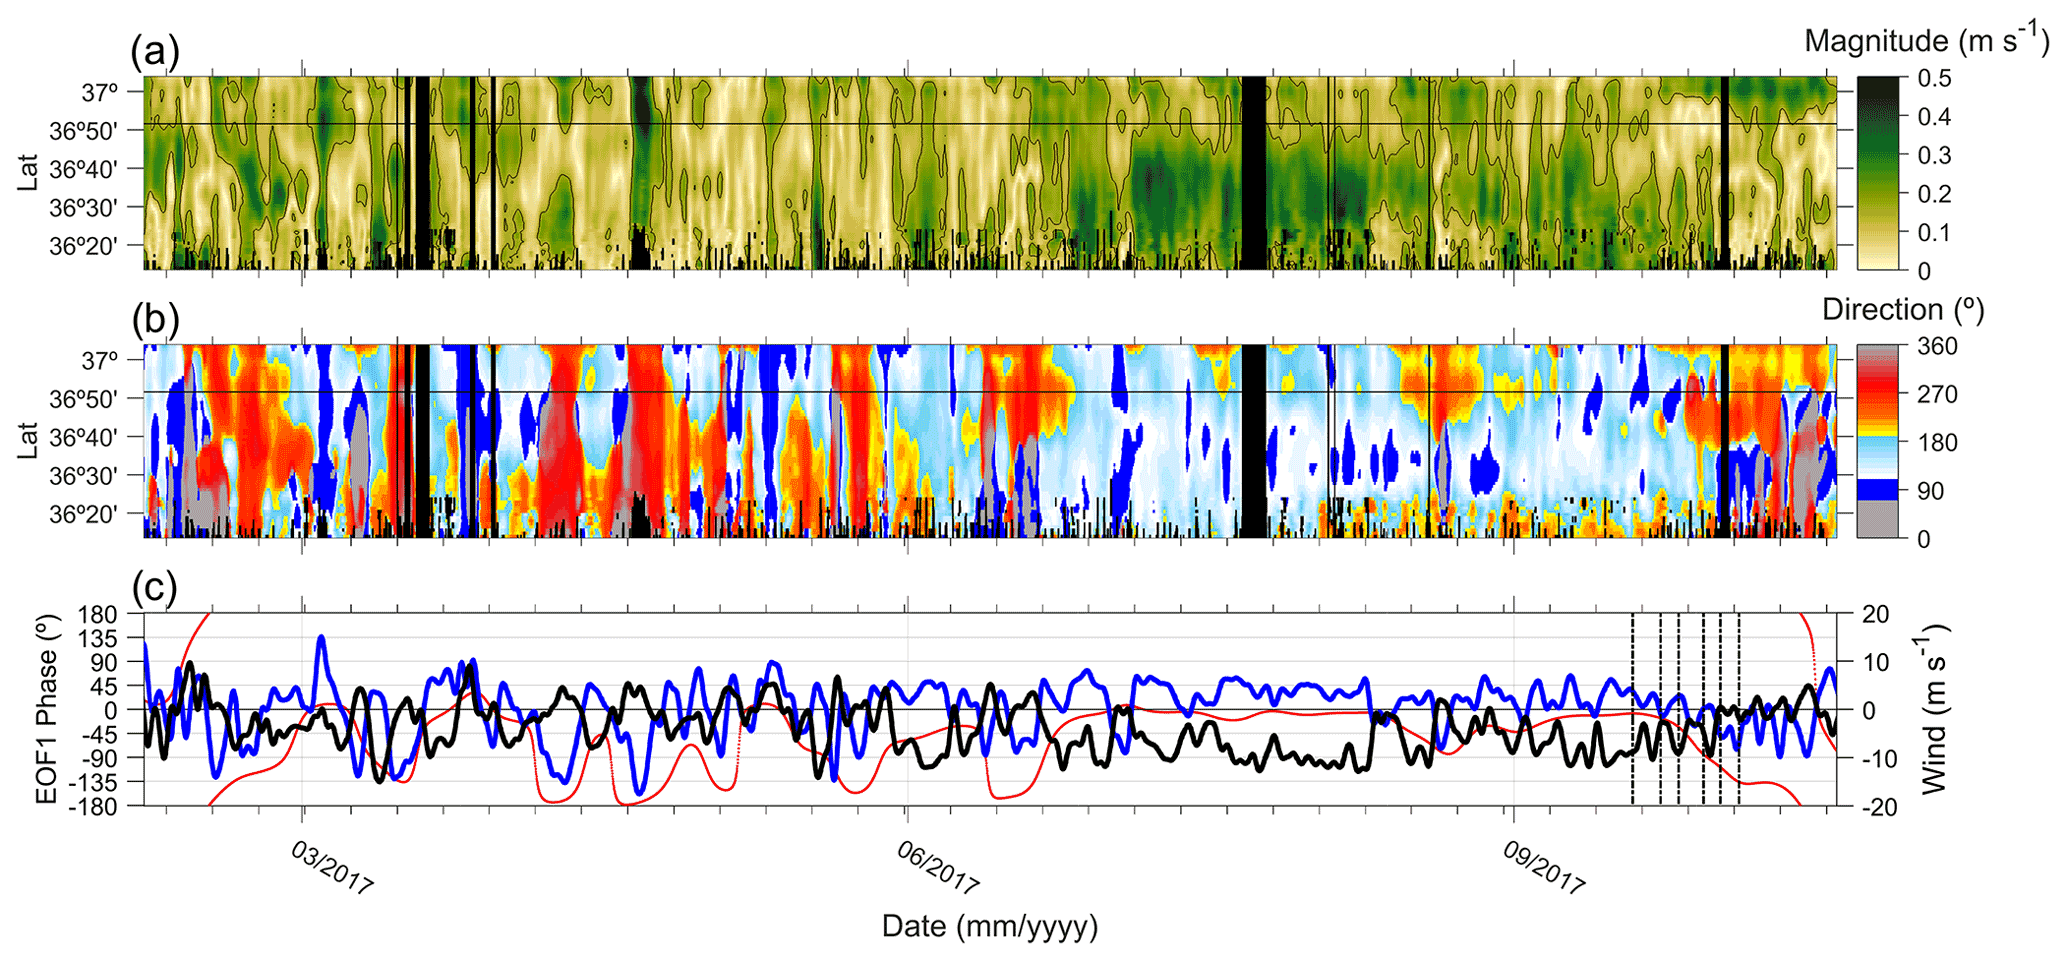
Figure 10Hovmöller diagram of (a) magnitude and (b) directions of currents at transect TrW; (c) zonal (blue line) and meridional (black line) of sub-inertial ERA5 wind (https://cds.climate.copernicus.eu, last access: 18 September 2021) extracted at 36∘45′ N, 8∘30′ W along with the phase of EOF mode 1 (red points). Dashed vertical lines indicate the day of each of the SST maps represented in Fig. 11. Major ticks on x axes represent the first day of the indicated month, and minor ticks represent 1-week intervals.
The mean HFR flow at the RIMC rigorously follows the slope at the eastern bight, in agreement with previous studies, but not west where it is oblique to the shelf break orientation. Yet, along shelf (i.e. eastward) currents develop frequently at the western bight, as indicated by the flow directional distribution (see the east–west-elongated SD ellipses in Fig. 5b). It is noted that the off-shelf flow variability is greatest at the western border of the GoC (Fig. 7a, b), the region most exposed to north-westerlies. The predominance of north-westerlies during the upwelling season (de Oliveira Júnior et al., 2021; Garel et al., 2016; Sánchez et al., 2007; Sánchez and Relvas, 2003) corresponds to a modulation of the slope circulation, which is stronger and broader and has the largest main variability in summer (Figs. 6; 7d, blue line). To evaluate the effect of the wind on the off-shelf circulation, the ERA5 subtidal wind at 36∘45′ N, 8∘30′ W (see Fig. 1) is compared with the velocity along TrW in February–October 2017 (Fig. 10). In Fig. 10b, the colour scale of the flow direction is designed to highlight along-slope flows (i.e. eastward, in dark blue), southeast flows (light blue) and broadly westward flows (red). In winter, the slope current alternates frequently with periods of westward circulation over the entire margin associated with Levanter wind (Fig. 10b, c). In summer, north-westerlies dominate (Fig. 10c), and the off-shelf flow is strong (dark green in Fig. 10a); the slope current (dark blue) is shifted offshore and often rotated to the southeast (light blue) along the wind direction. It is noted that the southeastward circulation over the western margin associated with strong north-westerlies is very similar to the mean circulation (compare Fig. 5a with the example of Fig. 11a whose wind conditions are indicated in Fig. 10c). The wind conditions that allow the development of the (eastward) along-slope surface flow are not clear. However, these observations show that north-westerlies tend to deflect the surface slope current measured by HFR clockwise, as reported in other areas exposed to strong wind (e.g. Lipa et al., 2014).
At the eastern bight, CTD and SST observations suggest that the slope current constitutes the northern branch of a persistent large-scale anticyclonic cell (Sánchez and Relvas, 2003; Vargas et al., 2003). The HFR data coverage is too limited offshore to map such an eddy. However, such recirculation is consistent with the strong enhancement of the cross-shelf flow component that was reported at the eastern limit of the study area (Figs. 5a and 6a–d).
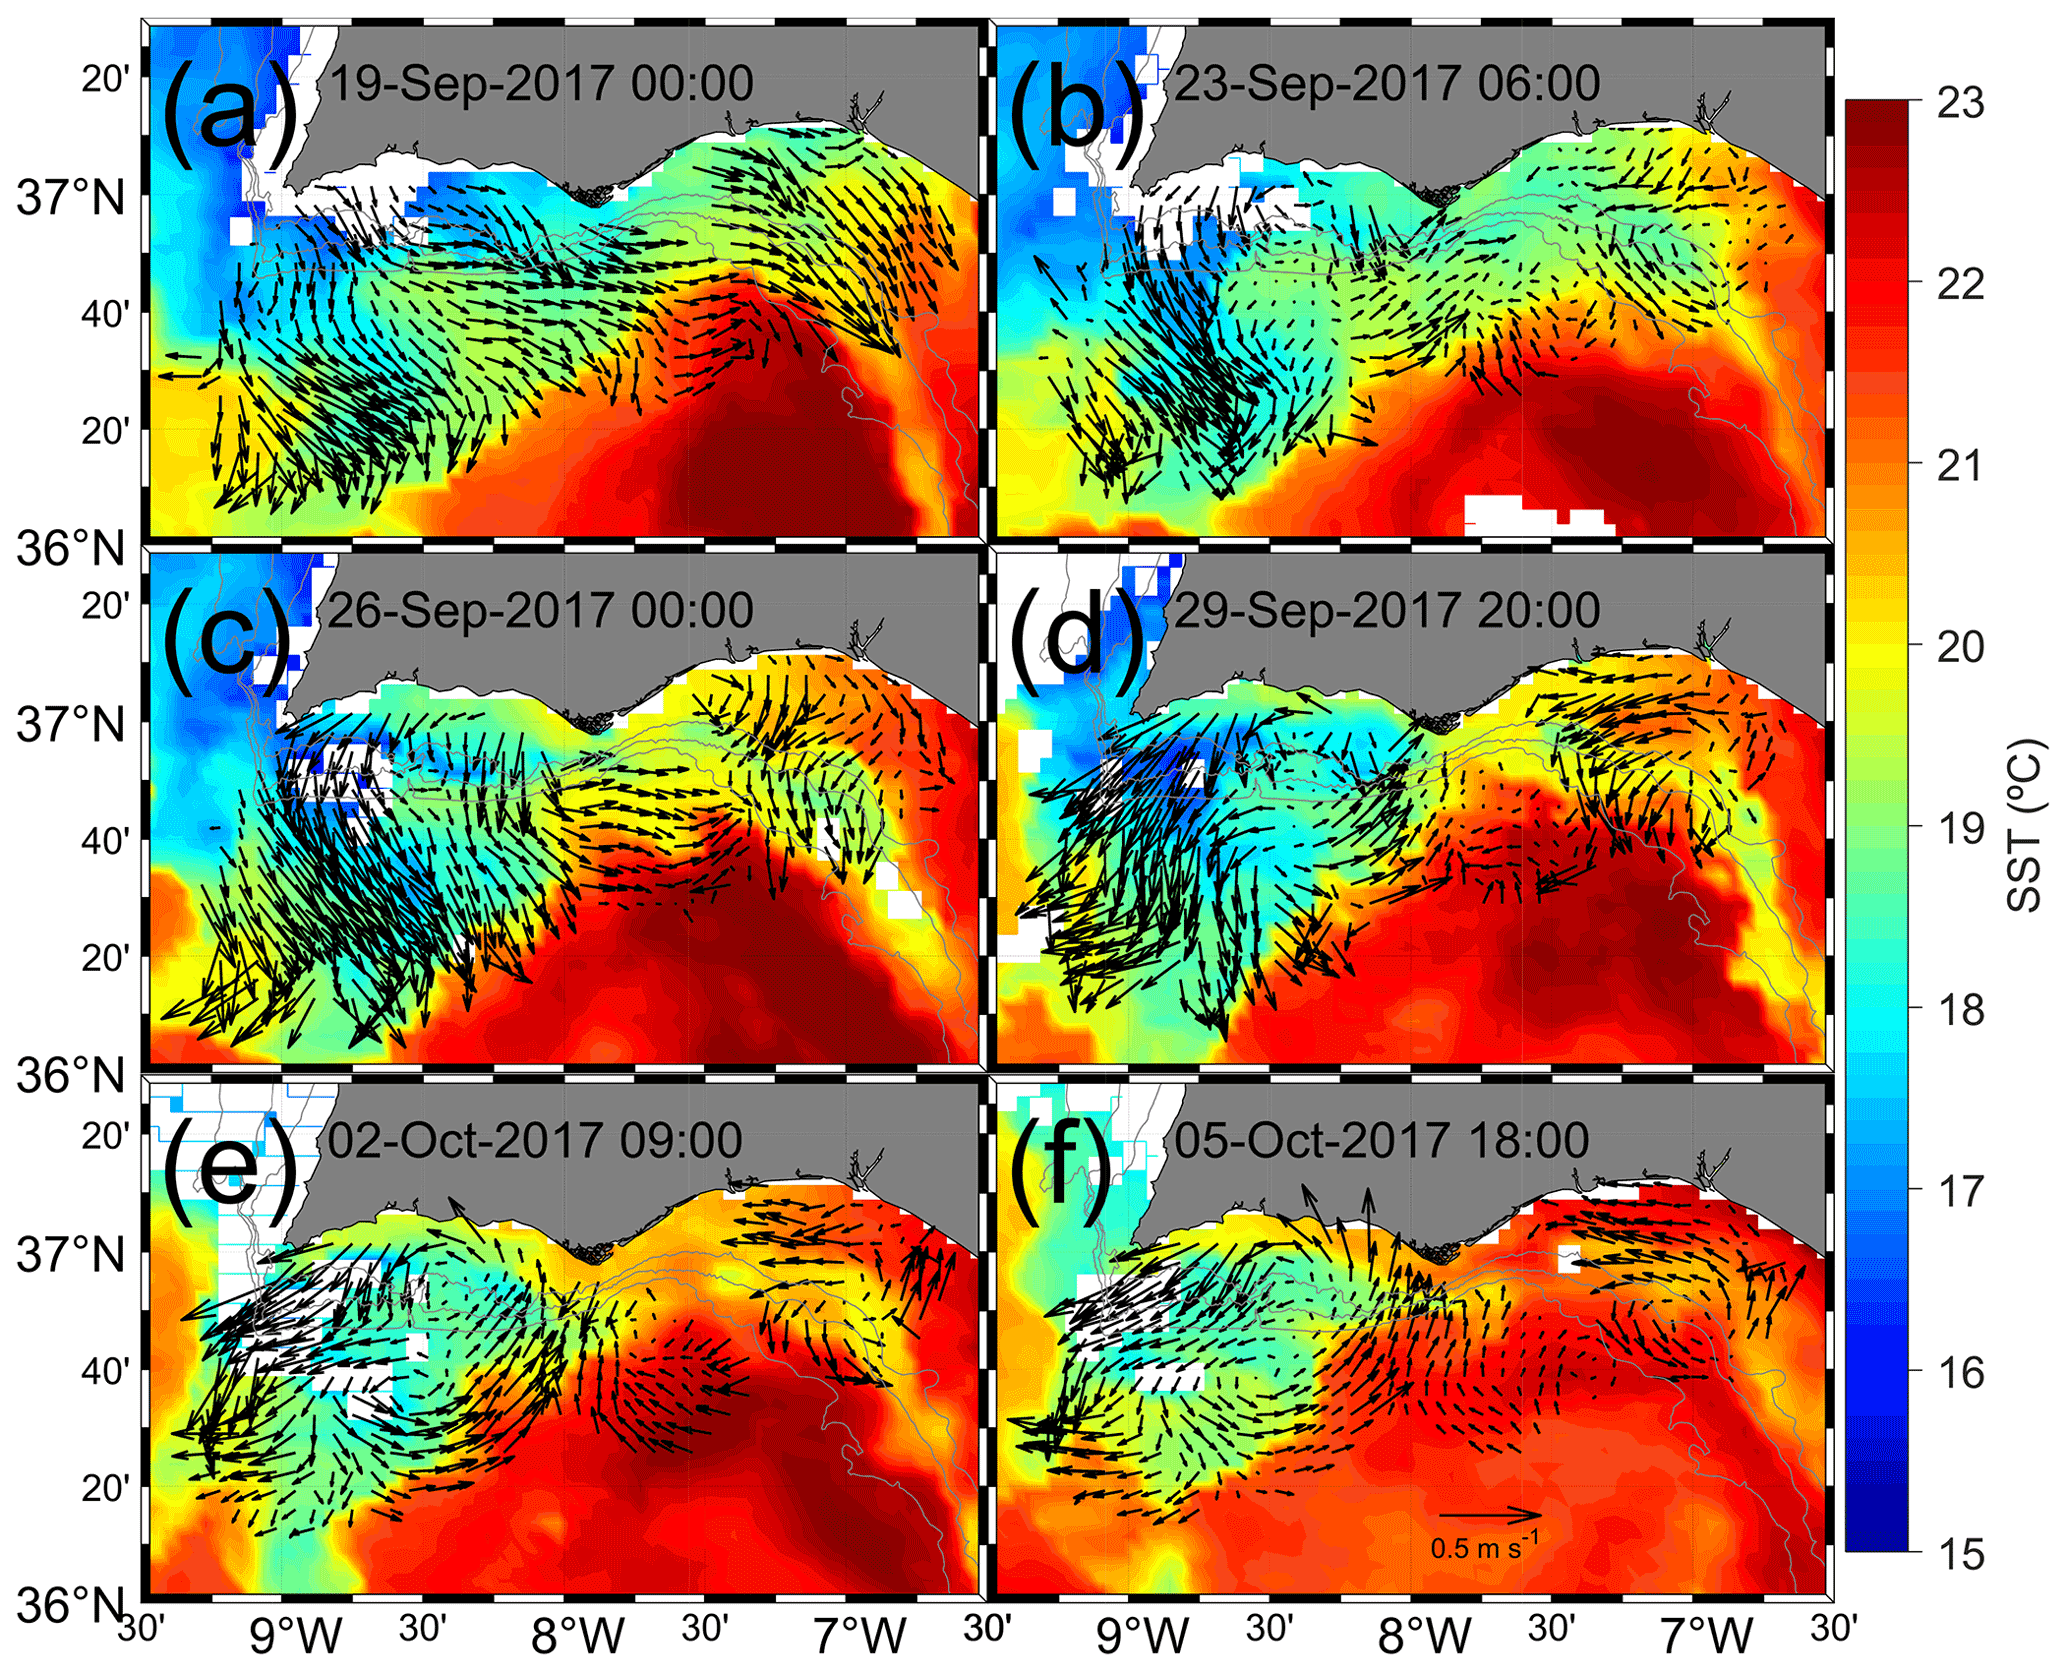
Figure 11SST from VIIRS-SNPP (https://oceandata.sci.gsfc.nasa.gov, last access: 15 November 2021) and HFR subtidal surface currents (as arrows, the scale of which is indicated in f). For clarity, arrows are represented every four grid nodes.
The CTD and SST data indicate that the slope current has a relatively low temperature and salinity in spring–summer, typical of upwelled Atlantic waters in the GoC (Fiúza, 1983; Folkard et al., 1997; Relvas and Barton, 2002; Sánchez and Relvas, 2003; Vargas et al., 2003; see also the SST in Fig. 11). Coastal upwelling produced by Ekman transport under favourable local wind is often cited as the driver of the geostrophic jet over the slope, similar to the southward jet observed along the west Iberian coast (Relvas and Barton, 2002; Sánchez and Relvas, 2003). It has also been observed that the latter southward jet turns cyclonically at CSV due to conservation of potential vorticity and progresses eastward towards the Strait of Gibraltar, merging with locally upwelled water (García-Lafuente et al., 2006; Relvas and Barton, 2002; Sánchez and Relvas, 2003). In addition, wind stress curl produced at CSV is expected to affect the water circulation at the western bight during the upwelling season (Criado-Aldeanueva et al., 2006; García-Lafuente et al., 2006; Sánchez-Leal et al., 2020; Sánchez et al., 2007, 2006; Sánchez and Relvas, 2003), when northerlies are most frequent and intense over the west Iberian coast (Alvarez et al., 2008; Fiúza et al., 1982; Leitão et al., 2018). According to Castelao and Barth (2007), a geostrophic equatorward jet must develop offshore of the curl maxima as a response to Ekman pumping. Satellite observations in spring and summer indicate that the (monthly and seasonal) mean curl maxima may reach as south as 36∘ N over the western bight (Alvarez et al., 2008; Castelao and Luo, 2018; Criado-Aldeanueva et al., 2006; Sánchez and Relvas, 2003), in agreement with the southward extent of the RIMC during these seasons (Fig. 6b–c). These processes may contribute to the development of the slope flow at the NMGoC during the upwelling season. Local upwelling in winter is also expected due to the eastward migration of the Azores high-pressure cell, promoting westerlies over the GoC (Chase, 1951). Furthermore, numerical modelling simulations suggested that part of the Atlantic water is entrained by the denser Mediterranean outflow below, producing a slope current due to mass conservation (Kida et al., 2008; Peliz et al., 2009, 2007). Since water exchange in the Strait of Gibraltar is continuous (García-Lafuente et al., 2021, 2011), this mechanism could contribute to the observation of a slope current throughout the year, as reported in the present study.
Long-term (11 years) ADCP records at a sub-monthly timescale (i.e. low-pass filtered with a cut-off period of 40 d) over the eastern shelf slope (45 km southeastward from TrE at 450 m water depth) show that reversals of southeastward flows are wind-driven (Criado-Aldeanueva et al., 2009). “Levanter” wind events typically blow northwestward at the study area without clear seasonality (de Oliveira Júnior et al., 2021; Losada, 1999; Ribas-Ribas et al., 2011). As exemplified in winter 2017, the southeastward circulation over the entire NMGoC reverses during these (strong) events (see red in Fig. 10b). In addition, the circulation described by EOF mode 1 when the phase is close to 180∘ (see Fig. 7) is remarkably associated with strong Levanters (Fig. 10c), indicating the reversal of the main flow pattern over the NMGoC. These events correspond to the ∼ 10 % of PFs occupying the entire margin in Fig. 9a, c and e and generally occur when the eastern component of ERA5 wind in the area is greater than 10 m s−1, approximately (not shown).
6.2 Shelf circulation
The HFR and ADCP data analyses show that subtidal coastal currents are polarised in the alongshore direction at the NMGoC (Figs. 4, 5, 7 and Table 2), generalising similar findings from a few ADCP mooring sites at the eastern bight (de Oliveira Júnior et al., 2021; Garel et al., 2016; Prieto et al., 2009). EOF modes 1 and 2 indicate that the circulation is generally a regional feature, continuous along the coast (Fig. 7). This coastal circulation pattern opposes the frequent disruption of PFs near CSM proposed by García-Lafuente et al. (2006), whose study is often cited in the literature (e.g. Casaucao et al., 2021; de Castro et al., 2017; Hanebuth et al., 2018; Mestdagh et al., 2020; Mulero-Martínez et al., 2021; Navarro et al., 2013). In agreement with García-Lafuente et al. (2006), the connection between PFs at both bights is not always clear (e.g. Fig. 11). Comparison of the alongshore flow at various shelf locations, as exemplified in Fig. 12, suggests that the PF circulation is continuous for relatively strong velocities (> 0.1 m s−1). Conditioned mean maps based on the alongshore velocity at W2 show that PFs are continuous for Val > 0.1 m s−1 (Fig. 13a, b). By contrast, EFs are always continuous (Fig. 13c, d). Clearly, the setup of PFs at CSM occurs when these flows are well developed at the adjacent bights. This delay (see 7 and 19 April 2017 in Fig. 12) explains the predominance of EFs at CSM, while EFs and PFs are balanced elsewhere (Table 2) as previously observed at Armona station (Garel et al., 2016). The delay is possibly due to cape-induced bathymetric and geographic effects (e.g. Gan and Allen, 2002). In particular, the slope current is very close to the coastline near CSM. In detail, PFs from the eastern bight overshoot CSM and turn sharply northward to connect with the inner-shelf flow at the western bight, which results in the N–S-elongated SD ellipses west of CSM (Figs. 5, 6; see also the spatial patterns of both EOF modes in Fig. 7).
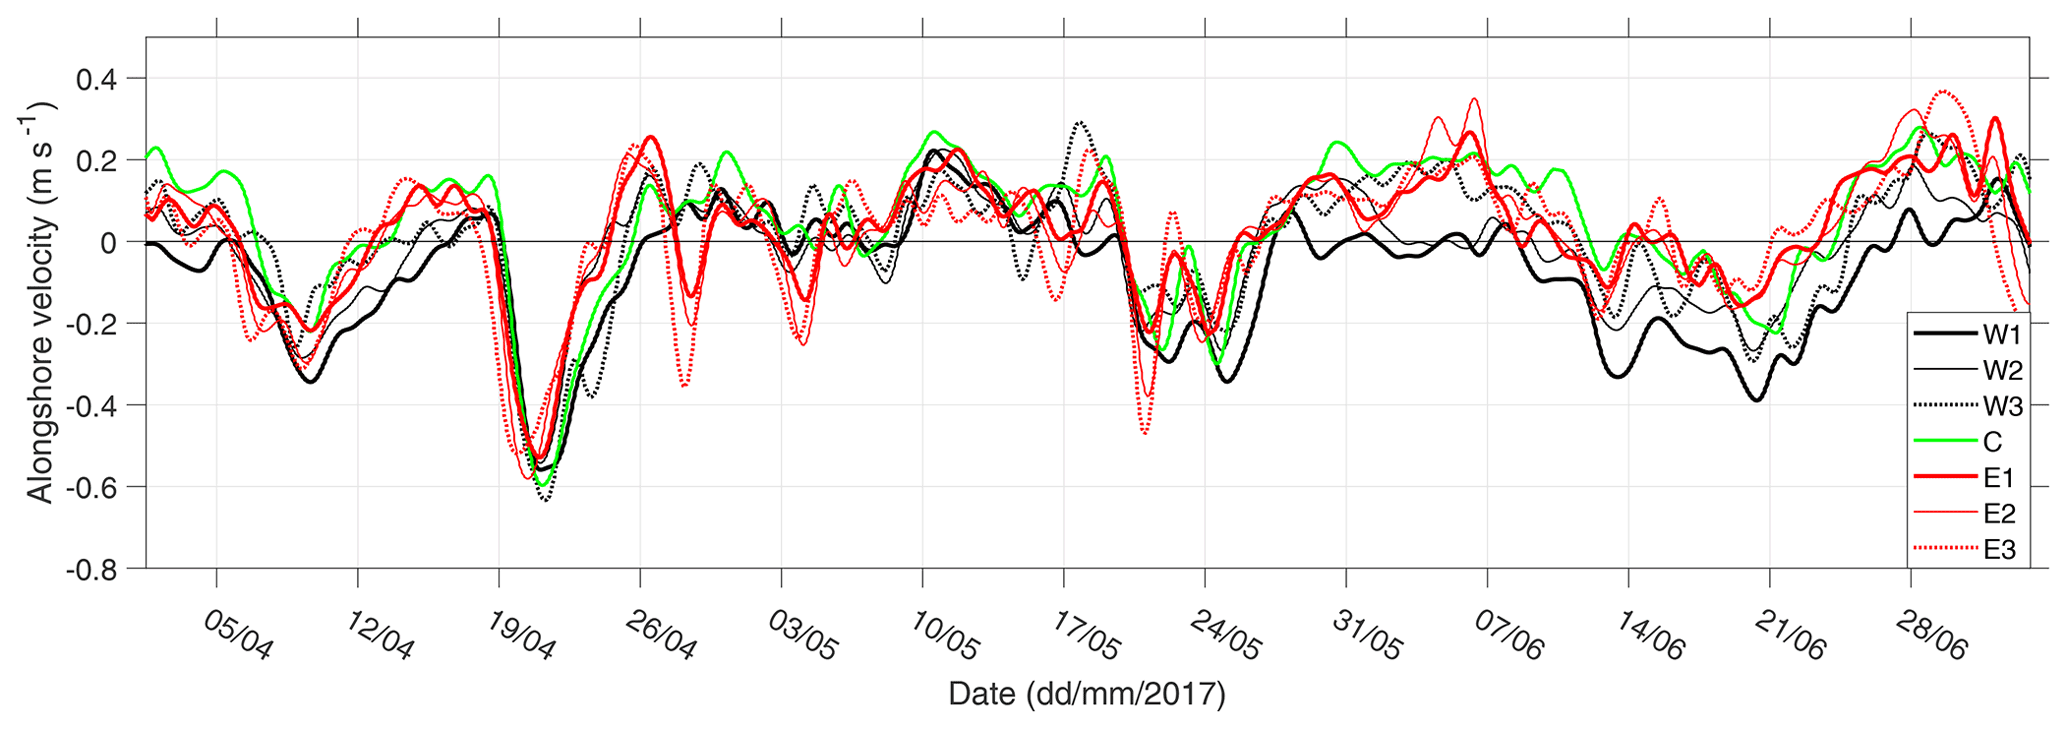
Figure 12Alongshore velocities at the seven selected nodes. See Fig. 1 for location. Alongshore velocities are obtained from the angle of maximum variance of velocity vectors at each node.
Based on SST images, it has been suggested that the PF signal propagates from the eastern to the western bight (see for example Fig. 11) and likewise that EFs proceed at least partly from the west Portuguese coast (Relvas and Barton, 2002). Such propagation patterns are not conspicuous on the subset of alongshore velocities reported in Fig. 12. To evaluate whether coastal flows develop preferentially at the eastern or western bights, the timing of EF and PF development is analysed considering the three grid nodes W2, C and E3 (for location, see Fig. 1). Flow reversals were defined as events occurring at the 3 grid nodes within a 7 d period. To discard small oscillations in the flow direction, an event was retained when, at each selected node, Val was ≥ 0.05 m s−1 before and after reversed flows lasting 36 h, at least. A total of 23 EF and 25 PF reversal events were detected. In total, 61 % of EFs developed first at E3 (against 17 % at W2), and 48 % of PFs develop first at W2 (against 44 % at E3). Sequential reversals at adjacent nodes (i.e. W2 then C then E3 for EFs and the opposite for PFs) were defined as propagation events; no propagation event was obtained for PFs (that tend to develop later at CSM, as previously described), and only three events were obtained for EFs. Thus, coastal flows appear first at any of both bights, but they tend to appear first at the bight towards which they are directed, as illustrated on 6 June 2017 (PF developed first to the west) and on 21 June 2017 (EF developed first to the east) in Fig. 12 (see also the early development of PFs at the western bight in Fig. 11b and c).
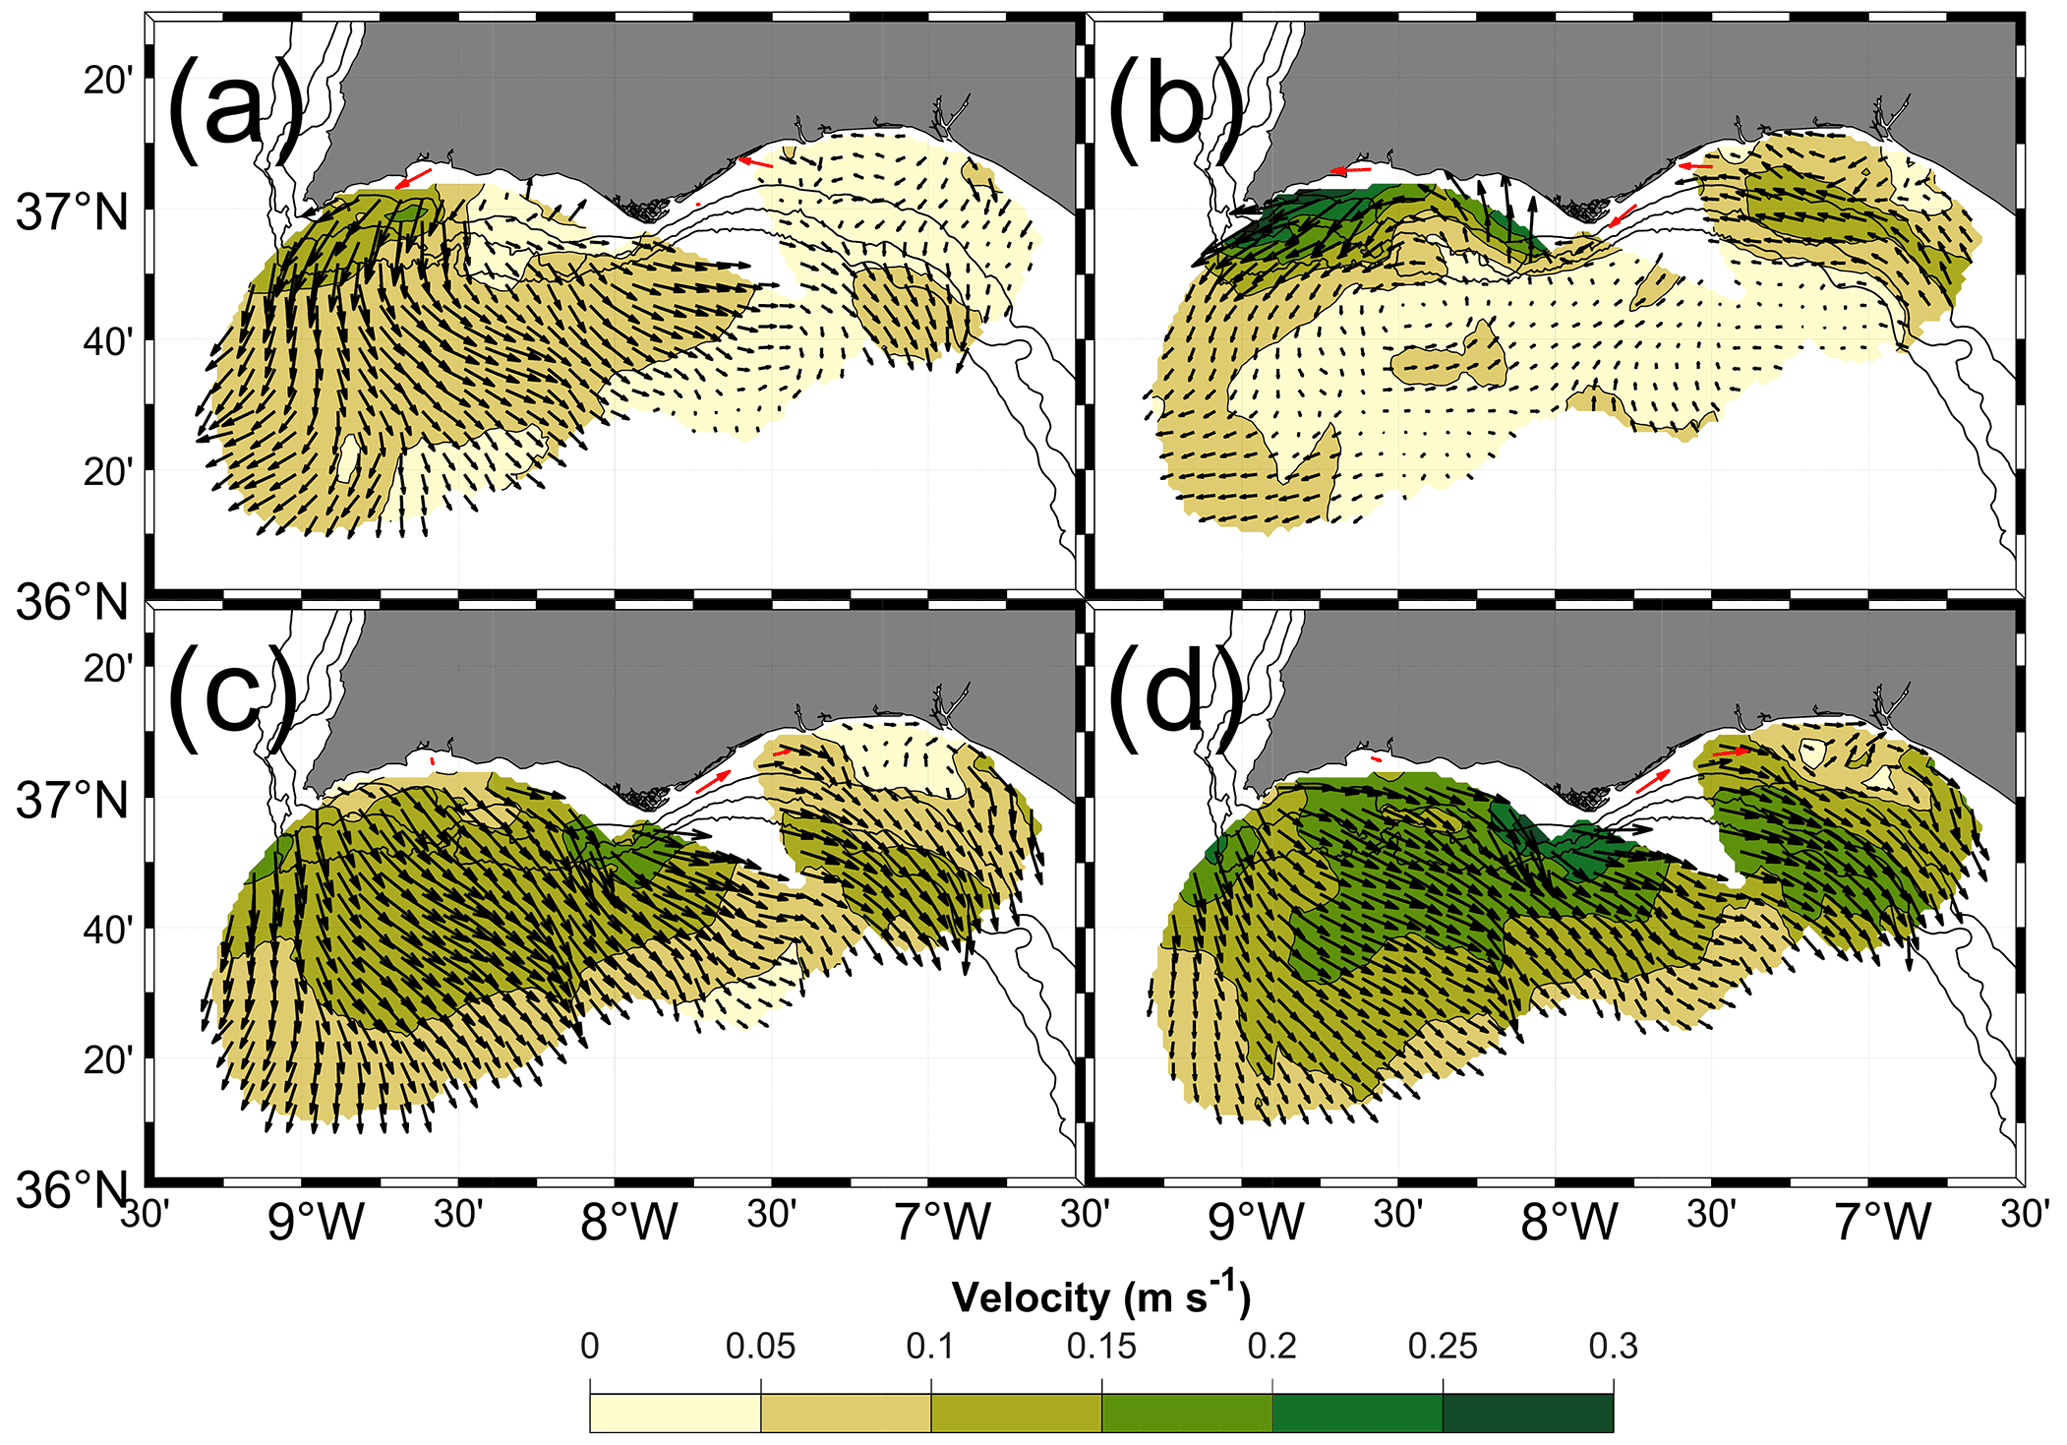
Figure 13Conditioned mean map computed from periods when the alongshore velocity at W2 was between 0.05 and 0.1 m s−1 (a, c) and for periods with velocities > 0.1 m s−1 (b, d). Panels (a) and (b) represent PFs (c, d represent EFs). Red arrows indicate the mean velocity computed from available ADCP data for the same periods. For clarity, arrows are represented every four grid nodes.
CCCs have been suggested to be driven in summer by alongshore pressure differences due to the strong temperature gradient between Cádiz and Huelva (García-Lafuente et al., 2006). This small-scale thermal gradient, restricted to the eastern bight, fails to explain the early setup of PFs at the western bight (where alongshore temperature variations are comparatively weaker; e.g. Vargas et al., 2003; see also Fig. 11). Instead, an alongshore pressure gradient of regional scale, from the region of the Guadalquivir mouth to CSV (Relvas and Barton, 2002), is consistent with the erratic-like setup of PFs along the coast. Finally, it is noted that the 44 % of PFs that started at E3 developed at W2 with an average delay of 1.24 d. This represents an average propagation speed of 2 m s−1, which is within the range of coastal trapped wave propagation at other systems (Maiwa et al., 2010; Rivas, 2017).
As discussed in Sect. 6.1, about 10 % of PFs correspond to a general north-westward circulation over the entire NMGoC associated with strong Levanter wind (> 10 m s−1). In these cases, PFs observed at the coast are mainly wind-driven and should not be considered CCCs. For weaker wind conditions, about 60 % of PFs are restricted to the shelf (Fig. 9), opposed to the dominant flow direction on the slope, and should therefore be regarded as CCCs. This spatial distribution is concordant with SST observations of warm water near the coast and cold waters further offshore in spring and summer (Fiúza, 1983; Folkard et al., 1997; Relvas and Barton, 2005, 2002; Reul et al., 2006) as exemplified in Fig. 11. Comparisons of the flow direction at depths of 40 and 500 m at the transects indicate that CCCs develop predominantly (> 60 %) during the upwelling season (with maximum in late summer–early autumn) and are the rarest (< 10 %) in late autumn and winter. Consequently, PFs in winter are mainly wind-driven while they are often CCCs (i.e. alongshore coastal flows with direction opposed to the eastward slope current) driven by distinct processes in summer (de Oliveira Júnior et al., 2021; García-Lafuente et al., 2006; Garel et al., 2016; Relvas and Barton, 2002; Teles-Machado et al., 2007).
6.3 Recirculation between shelf and slope flows
Mode 2 of the EOF analysis (which represents 12 % of the data variability) indicates episodic recirculation between the shelf and off-shelf regions over the western bight (Fig. 7b). This recirculation is cyclonic and most frequent in summer and autumn when mode 1 is weak and mode 2 is in phase (see Sect. 5.3). To highlight this recirculation, data are selected from June to October when mode 2 phase is between −65 and 65∘ and the ratio of mode 1 and mode 2 amplitudes is ≤ 2. The conditioned mean map obtained from these subsets outlines a cyclonic eddy over the entire western bight (Fig. 14). The northern branch of the eddy consists of a CCC (see also the ADCP current direction in the inner-shelf, red arrows in Fig. 14) that strongly recirculates offshore near CSV. This recirculation provides a means to transport offshore coastal water-borne material such as chlorophyll (see Fig. 4 in Cristina et al., 2015). It is consistent with the rare observation (based on SST) of CCCs propagating around CSV and northward along the western coast during persistent Levanter wind conditions (Relvas and Barton, 2002). The shelf region with strong southward velocity is near 8∘40′ W (Fig. 5), which is best defined in summer results from this recirculation. The southern branch of the eddy is constituted by the slope current.
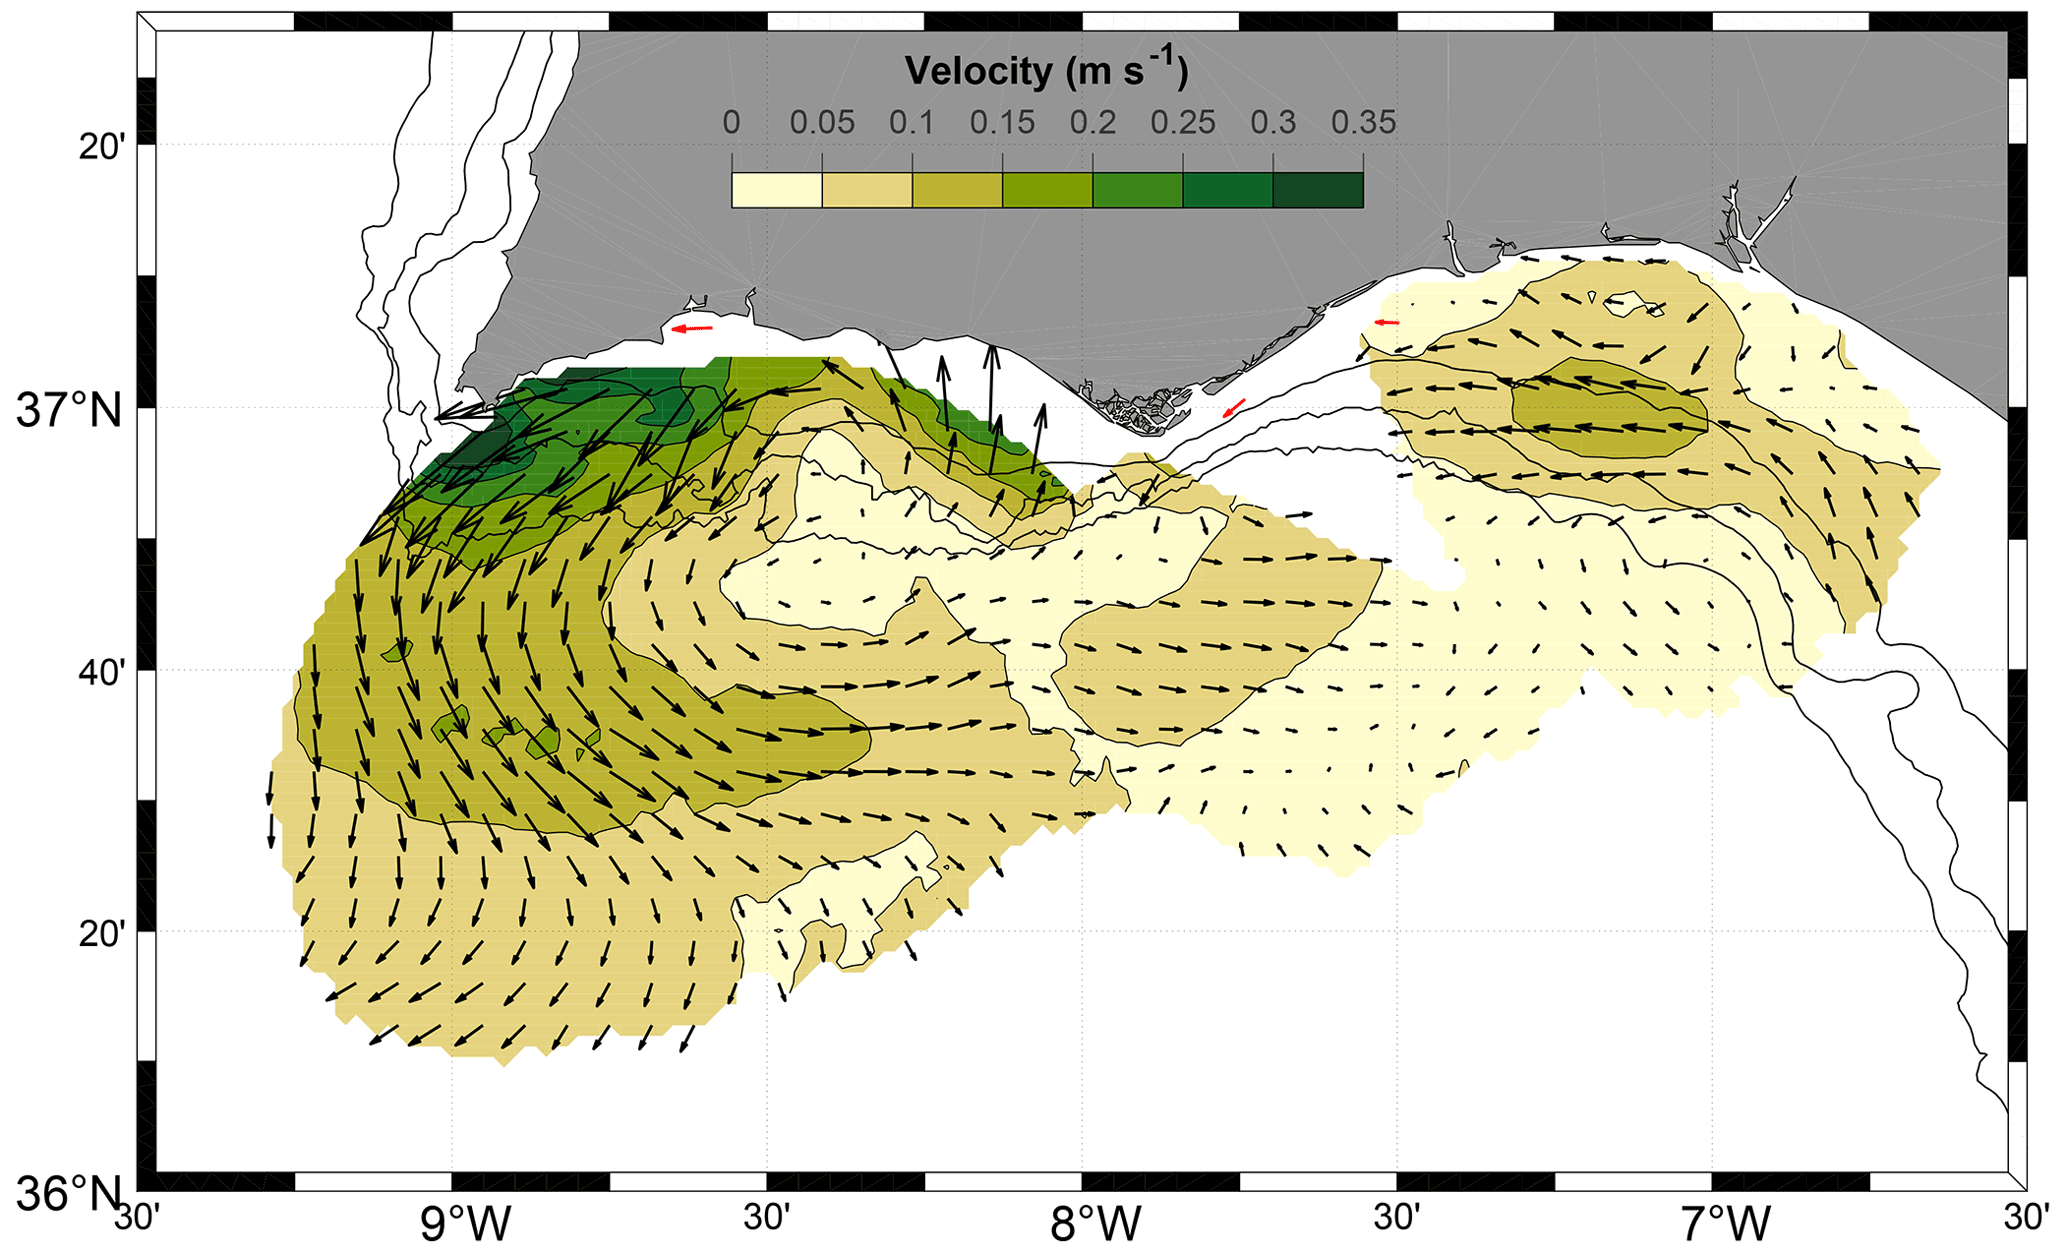
Figure 14Conditioned mean map computed from periods in June to October with mode 2 phase between −65 and 65∘ and the ratio of mode 1 and mode 2 amplitudes ≤ 2. For clarity, arrows are represented every four grid nodes. Red arrows indicate the mean velocity computed from available ADCP data for the same periods.
A cyclonic eddy was previously described as a quasi-permanent feature in spring and summer over the western bight (García-Lafuente et al., 2006). The positive vertical component of northerly wind curl west of CSV produces ascending velocities resulting in an uprising of the isopycnic and advection of dense water from the ocean's interior towards the surface (Sánchez and Relvas, 2003). Because of this upwelling process, a cyclonic circulation must develop to compensate for the baroclinic pressure field (Criado-Aldeanueva et al., 2006; García-Lafuente et al., 2006). To investigate the eddy occurrence, a vector geometry-based detection algorithm was applied to the HFR time series (for details about the method, see Nencioli et al., 2010). The dataset was subsampled at each of three grid nodes, and a reduced area focused on the western bight (8–9∘ W and 36∘30′–37∘ N) was selected. Eddy centres were detected at grid points where four constraints were satisfied. These constraints use two parameters (a and b) that can be specified in order to give flexibility to the algorithm. After several sensitivity tests, the most suitable values for a and b were defined to be 4 and 3 respectively. From the 708 detections, less than 2 % occurred from November to March and more than 77 % from June to October. An example is provided in August 2017 when the CCCs recirculated cyclonically after a period of general southeast flows (in Fig. 15a, b). The eddy was briefly detected during the cyclonic recirculation period (blue dot in Fig. 15c), followed by a period with strong offshore shelf flows (Fig. 15d). Recirculation events (identified based on the EOF criteria defined in the previous paragraph) clearly correspond to the development of CCCs, i.e. opposed shelf and slope flows (see summer–autumn 2017 in Fig. 15e, where recirculation events identified by the red triangles on top). The cyclonic recirculation develops after periods of relatively strong north-westerlies (Fig. 15f–g). These conditions agree with the development of CCCs during the relaxation of upwelling-favourable wind, supporting that they result from the unbalance of a regional alongshore pressure gradient (de Oliveira Júnior et al., 2021; Garel et al., 2016; Relvas and Barton, 2002). The eddy is a transient feature (at least at the surface) detected during these periods, under low-wind-stress conditions (doted lines in Fig. 15g; see also Fig. 11).
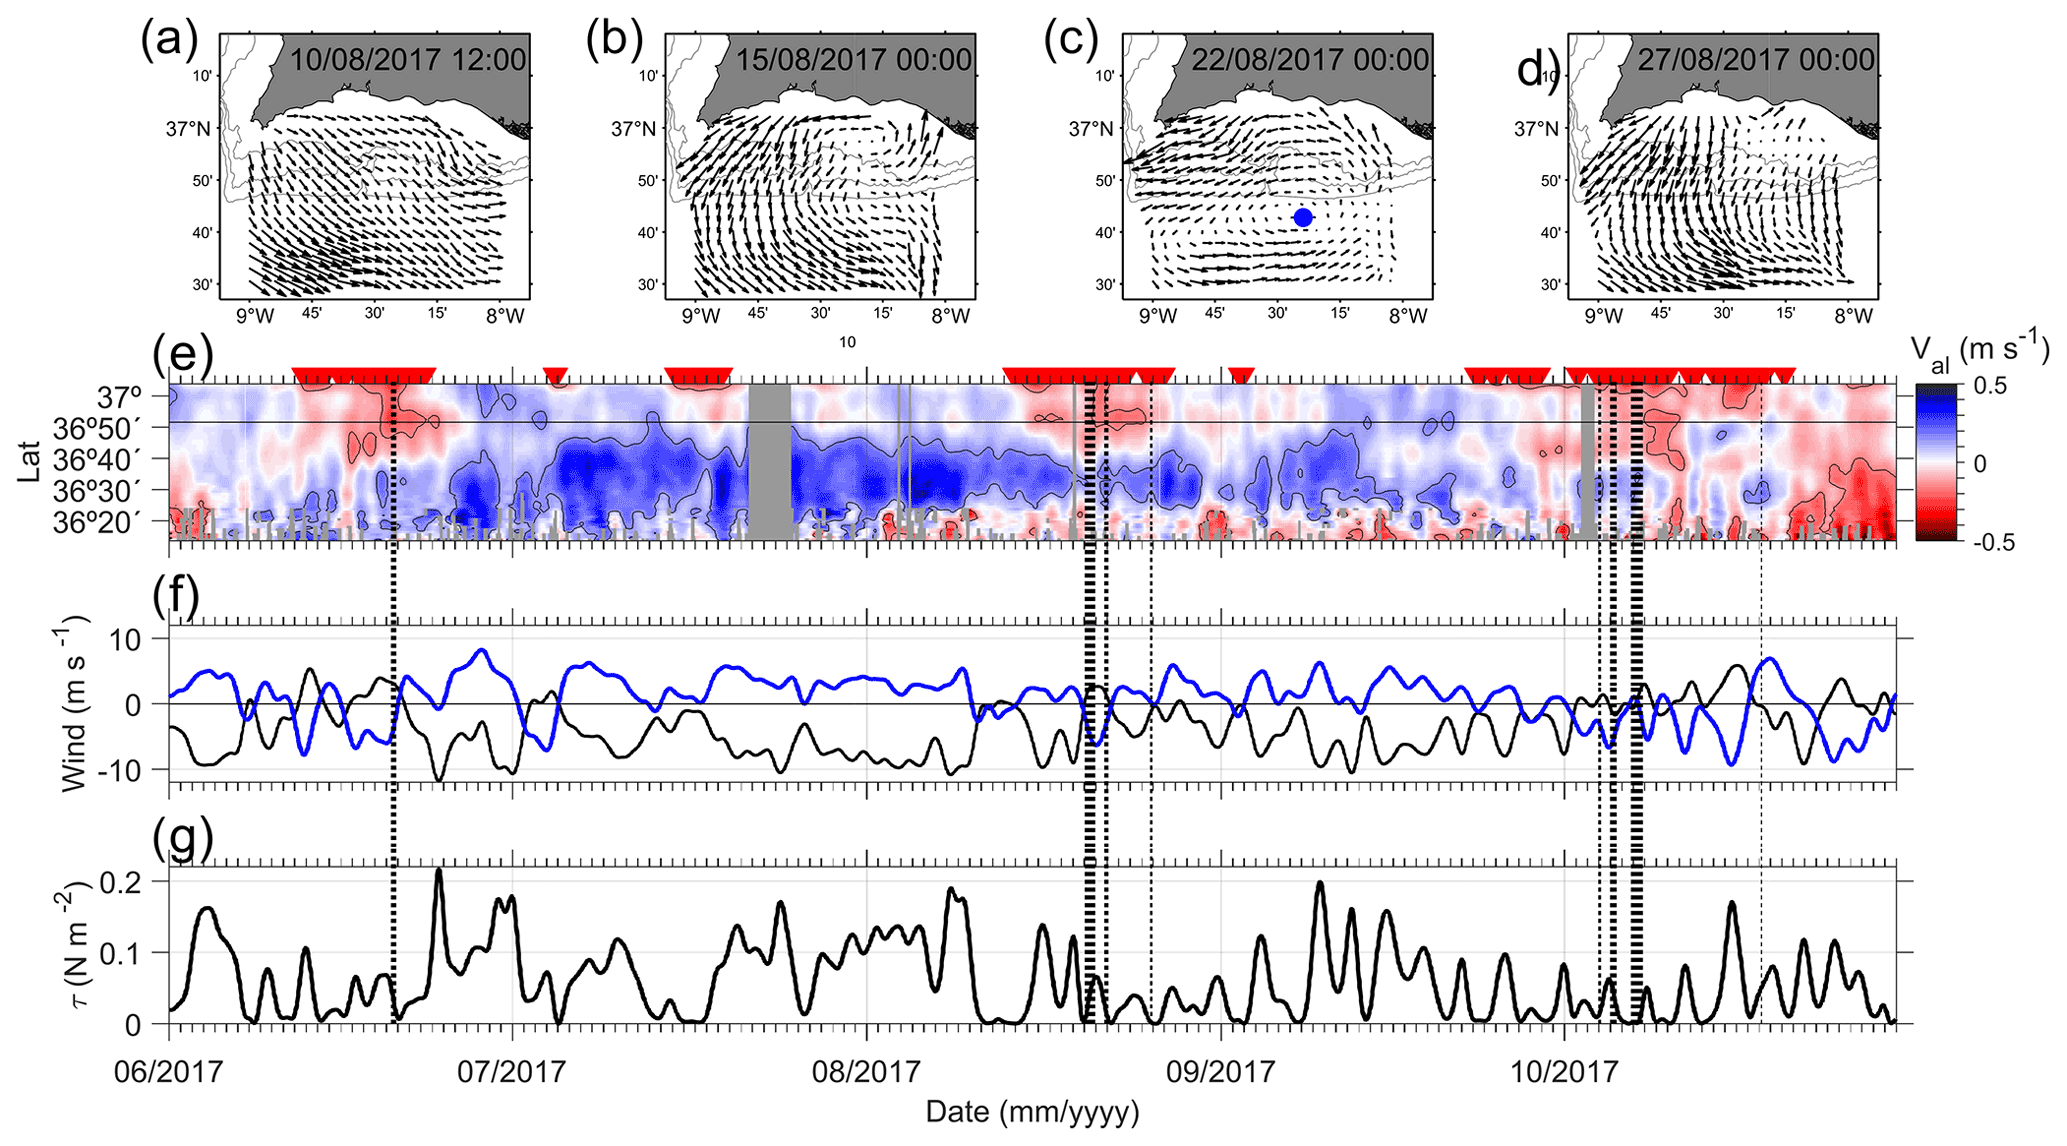
Figure 15Example of the cyclonic circulation evolution over the western region (a–d) and the detected cyclonic eddy centre (indicated by the blue dot in c). Hovmöller diagram of filtered Val extracted at TrW (e). Red triangles on top represent recirculation periods identified based on EOF criteria (mode 2 phase between −65 and 65∘ and ratio of mode 1 and mode 2 amplitudes ≤ 2). Filtered ERA5 wind averaged at the box −9∘ E, −7∘ E, 36∘45′ N and 37∘ N and black and blue curves representing the meridional and zonal components respectively (f). Wind stress magnitude (e). Black dotted vertical lines indicate periods when a cyclonic eddy was detected by the algorithm over the western bight. Major ticks represent the first day of the indicated month, and minor ticks represent 1 d intervals.
García-Lafuente et al. (2006) also proposed the presence a quasi-permanent cyclonic eddy over the eastern bight. A cyclonic recirculation in this region is not apparent in the mean maps (Figs. 5 and 6) and EOF analyses (Fig. 7). Furthermore, the previously described algorithm yielded significantly fewer (60) detections at the eastern bight compared with the western bight (708). These eddies tend to develop when the western eddy is present (63 %, within a time window of 36 h), as exemplified in Fig. 11f. Cyclonic recirculation of the CCC was also noted at TrCSM, but more rarely than in the west (compare Fig. 8a–b and c–d). Overall, the data suggest that a cyclonic recirculation between shelf and slope flows at the eastern bight is less frequent than in the west. However, it is not ruled out that this is due to the limited data coverage (see Fig. 3).
The present study depicts the main patterns of the surface circulation at the NMGoC, based on the analysis of hourly HFR currents from 2016 to 2020. The following conclusions are drawn, which are used to update the previous circulation sketch of the surface circulation during the upwelling season proposed for this region for no-storm conditions (Garcia-Lafuente et al., 2006). The main circulation patterns are represented as arrows, where red (blue) colour indicates the direction of warm (cold) water advection (Fig. 16), a wider arrow corresponds to a greater flow magnitude and a difference in the double arrowhead size represents an unbalanced flow direction, and dashed arrows indicate a transient (or sporadic) circulation.
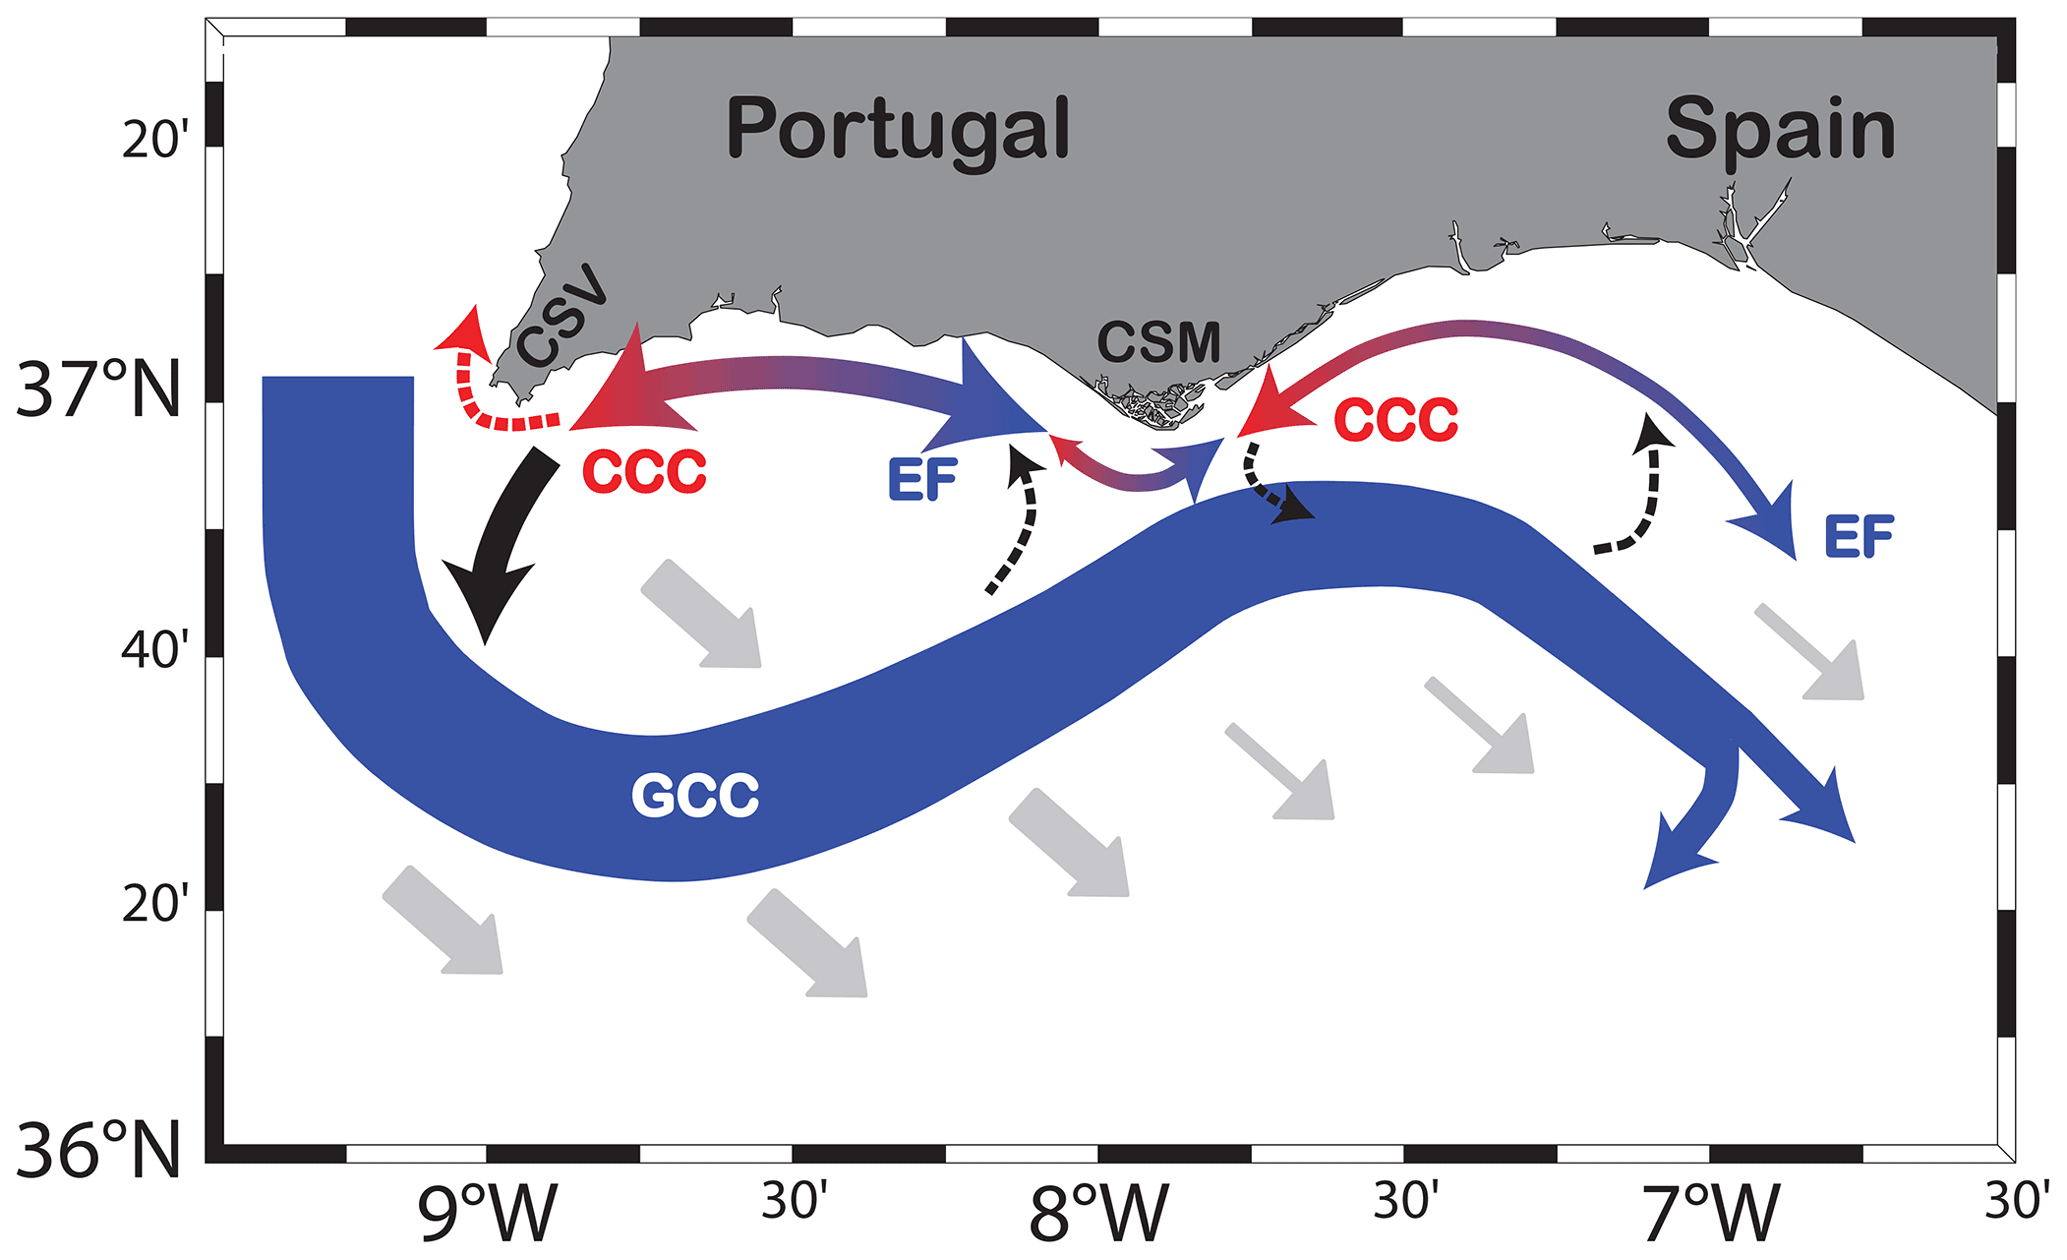
Figure 16Updated sketch of the main circulation patterns at the NMGoC during the upwelling season for no-storm conditions. The flow magnitude (schematically represented by the size of the arrows) is larger at the western bight than at the eastern bight. Red (blue) arrows indicate the direction of warm (cold) water advection. Dashed arrows indicate a transient (or sporadic) circulation. An equatorward slope current (the Gulf of Cádiz Current, GCC) proceeding from the west Portuguese coast and advecting cold water is superimposed to the background southeastward, wind-induced circulation (grey arrows). The GCC partly recirculates anticyclonically in the east. On the shelf, the flow is alongshore and balanced between the equatorward and poleward directions (as represented with equal double arrow head sizes), except near Cape Santa Maria (CSM). There, equatorward flows predominate (see the distinct double arrowhead sizes around the cape) as they reverse with some delay compared with the adjacent bights. However, the equatorward flows (advecting cold water) and poleward flows (advecting warm water) are generally continuous along the coast, reversing twice a week, on average. Poleward flows are coastal counter currents (CCCs), i.e. with a direction opposite to that of the GCC, which develop after periods of north-westerlies. At the western bight, they are associated with a cyclonic recirculation, strongest near Cape São Vicente (CSV), explaining the sporadic advection of warm water to the north of the cape (see the dashed red arrow near the cape). For weak wind stress, this recirculation depicts a short-lived eddy over the bight due to onshore recirculation near CSM (see the dashed arrow near the cape). At the eastern bight, the CCCs and equatorward flows are strongest at the outer shelf (rather than at the inner shelf in the west). Cyclonic recirculation of CCCs occurs less frequently than in the west (see dashed arrows).
-
The background circulation over the NMGoC is southeastward as a result of the dominant north-westerlies (grey arrows in Fig. 16). This circulation episodically reverses as a result of strong easterlies. Overall, the circulation is weaker at the eastern than at the western bight (as represented with the distinct arrow sizes in Fig. 16).
-
An equatorward slope current (GCC in Fig. 16, following Peliz et al., 2007) is observed along the continental shelf slope, the magnitude and width of which are seasonally modulated (stronger and broader in summer). This flow proceeds from the upwelling jet along the western coast. Strong north-westerlies tend to deflect this surface flow clockwise over the (exposed) western bight. At the eastern border of the study area, the observations support that the slope current partly recirculates anticyclonically (see Fig. 16).
-
Shelf flows are alongshore and balanced at the eastern and western bights (see the equal double head sizes in Fig. 16), changing direction twice a week on average, without clear seasonality (Garel et al., 2016). PFs (EFs) advect warm (cold) water in summer (see the blue and red arrows in Fig. 16 respectively). Contrarily to the SST, the alongshore flow signal does not propagate along the coast. Instead, it tends to develop first at the bight towards which the flow is directed (i.e. PFs tend to develop first at the western shelf and EFs at the eastern shelf), consistent with a regional alongshore pressure gradient inversion.
-
EFs dominate near CSM (see the distinct double arrow sizes around the cape in Fig. 16) due to a delay in the setup of PFs. The flow reverses when PFs are > 0.1 m s−1 (approximately) at the adjacent bights. Since these magnitudes are frequently reached, PFs generally go around the cape and are continuous along the coast.
-
The EFs observed near the coast often extend over the entire margin as they merge offshore with the slope current (GCC).
-
The PFs observed near the coast in winter are mainly associated with strong easterlies and extend over the entire margin. During the upwelling season, they dominantly consist of CCCs, i.e. alongshore coastal flows with direction opposed to the equatorward slope current (Fig. 16).
-
In the west, CCCs constitute the northern branch of a cyclonic recirculation which is strongest near CSV, promoting significant offshore transport and explaining the sporadic advection of warm water to the north of CSV (see the dashed red arrow near the cape in Fig. 16). This recirculation pattern (including CCCs) develops during the relaxation of upwelling-favourable wind, supporting that they result from the unbalance of a regional alongshore pressure gradient. For weak wind stress, a transient eddy is episodically formed, limited in the south by the GCC and in the east by onshore currents near CSM (see the dashed arrow near the cape in Fig. 16).
-
In the east, the core of alongshore flows is detached from the coast, on the outer shelf (Fig. 16). Cyclonic recirculation of CCCs seems less frequent than in the west (see dashed arrows in Fig. 16), although this result can be due to the limited spatial coverage of HFR data in this bight.
The HFR data were provided by Puertos del Estado and are available at http://opendap.puertos.es/thredds/catalog/radar_local_huelva/catalog.html (Puertos del Estado, 2020). The ADCP data were acquired through a partnership between IPMA – Portuguese Institute for the Sea and Atmosphere, CCMAR and CIMA and are available from the authors upon request (egarel@ualg.pt). ERA5 wind was obtained from the Climate Data Store database (https://doi.org/10.24381/cds.bd0915c6, Hersbach et al., 2018). Level 3 VIIRS-SNPP SST data were downloaded from Ocean Color database (https://oceandata.sci.gsfc.nasa.gov, Ocean Color Data, 2021). The drifter data were provided by the Portuguese Hydrographic Institute.
All authors contributed to the conceptualisation of the study and participated in the interpretation of the results. LdOJ processed the data, plotted the results and wrote the first version of the manuscript. EG and PR reviewed and edited the manuscript to its final version.
The contact author has declared that none of the authors has any competing interests.
Publisher's note: Copernicus Publications remains neutral with regard to jurisdictional claims in published maps and institutional affiliations.
The authors thank Anna Rubio, Charles-Antoine Guérin and the anonymous reviewer for their valuable and helpful comments on the manuscript. The authors additionally thank Tunipex for the support with the ADCP deployments.
This research has been supported by the Fundação para a Ciência e a Tecnologia through the grant UID/MAR/00350/2020 (attributed to CIMA, University of Algarve); grants UIDB/04326/2020, UIDP/04326/2020 and LA/P/0101/2020 (attributed to CCMAR); and through the PhD fellowship SFRH/BD/140250/2018 attributed to Luciano de Oliveira Júnior.
This paper was edited by Anna Rubio and reviewed by Charles-Antoine Guerin and one anonymous referee.
Alvarez, I., Gomez-Gesteira, M., deCastro, M., and Dias, J. M.: Spatiotemporal evolution of upwelling regime along the western coast of the Iberian Peninsula, J. Geophys. Res.-Ocean., 113, C07020, https://doi.org/10.1029/2008JC004744, 2008.
Alvera-Azcárate, A., Barth, A., Rixen, M., and Beckers, J. M.: Reconstruction of incomplete oceanographic data sets using empirical orthogonal functions: Application to the Adriatic Sea surface temperature, Ocean Model., 9, 325–346, https://doi.org/10.1016/j.ocemod.2004.08.001, 2005.
Beckers, J. M. and Rixen, M.: EOF Calculations and Data Filling from Incomplete Oceanographic Datasets, J. Atmos. Ocean. Technol., 20, 1839–1856, https://doi.org/10.1175/1520-0426(2003)020<1839:ECADFF>2.0.CO;2, 2003.
Boavida, J., Paulo, D., Aurelle, D., Arnaud-Haond, S., Marschal, C., Reed, J., Goncalves, J. M. S., and Serrao, E. A.: A well-kept treasure at depth: Precious red coral rediscovered in atlantic deep coral gardens (SW Portugal) after 300 Years, PLoS One, 11, 1–26, https://doi.org/10.1371/journal.pone.0147228, 2016.
Casaucao, A., González-Ortegón, E., Jiménez, M. P., Teles-Machado, A., Plecha, S., Peliz, A. J., and Laiz, I.: Assessment of the spawning habitat, spatial distribution, and Lagrangian dispersion of the European anchovy (Engraulis encrasicolus) early stages in the Gulf of Cadiz during an apparent anomalous episode in 2016, Sci. Total Environ., 781, 146530, https://doi.org/10.1016/j.scitotenv.2021.146530, 2021.
Castelao, R. M. and Barth, J. A.: The Role of Wind Stress Curl in Jet Separation at a Cape, J. Phys. Oceanogr., 37, 2652–2672, https://doi.org/10.1175/2007JPO3679.1, 2007.
Castelao, R. M. and Luo, H.: Upwelling jet separation in the California Current System, Sci. Rep.-UK, 8, 1–8, https://doi.org/10.1038/s41598-018-34401-y, 2018.
Chapman, R. D., Shay, L. K., Graber, H. C., Edson, J. B., Karachintsev, A., Trump, C. L., and Ross, D. B.: On the accuracy of HF radar surface current measurements: Intercomparisons with ship-based sensors, J. Geophys. Res.-Ocean., 102, 18737–18748, https://doi.org/10.1029/97JC00049, 1997.
Chase, J.: The Bermuda‐Azores high pressure cell; Its surface wind circulation, Woods Hole Oceanographic Institution, technical report no. 20, 51–60, 1951.
CMEMS Service Evolution: Report on European HF Radar systems development and roadmap for HF Radar products evolution in compliance with CMEMS needs, report, CMEMS, 2017.
CODAR: About Baseline Interpolation, Manual, http://support.codar.com/Technicians_Information_Page_for_SeaSondes/Docs/Informative/Baseline_Interpolation.pdf (last access: 15 March 2021), 2004a.
CODAR: Obtaining Total Current Velocities from Radials, Manual, http://support.codar.com/Technicians_Information_Page_for_SeaSondes/Docs/Informative/Combining_Radials.pdf (last access: 15 March 2021), 2004b.
Cravo, A., Relvas, P., Cardeira, S., and Rita, F.: Nutrient and chlorophyll a transports during an upwelling event in the NW margin of the Gulf of Cadiz, J. Marine Syst., 128, 208–221, https://doi.org/10.1016/j.jmarsys.2013.05.001, 2013.
Criado-Aldeanueva, F., García-Lafuente, J., Vargas, J. M., Del Río, J., Vázquez, A., Reul, A., and Sánchez, A.: Distribution and circulation of water masses in the Gulf of Cadiz from in situ observations, Deep-Sea Res. Pt. II, 53, 1144–1160, https://doi.org/10.1016/j.dsr2.2006.04.012, 2006.
Criado-Aldeanueva, F., García-Lafuente, J., Navarro, G., and Ruiz, J.: Seasonal and interannual variability of the surface circulation in the eastern Gulf of Cadiz (SW Iberia), J. Geophys. Res., 114, C01011, https://doi.org/10.1029/2008JC005069, 2009.
Cristina, S., Icely, J., Costa Goela, P., Angel DelValls, T., and Newton, A.: Using remote sensing as a support to the implementation of the European Marine Strategy Framework Directive in SW Portugal, Cont. Shelf Res., 108, 169–177, https://doi.org/10.1016/j.csr.2015.03.011, 2015.
de Castro, S., Lobo, F. J., and Puga-Bernabéu, Á.: Headland-associated banner banks generated during the last deglaciation near the Strait of Gibraltar (Gulf of Cadiz, SW Spain), Mar. Geol., 386, 56–75, https://doi.org/10.1016/j.margeo.2017.02.007, 2017.
de Oliveira Júnior, L., Garel, E., and Relvas, P.: The structure of incipient coastal counter currents in South Portugal as indicator of their forcing agents, J. Marine Syst., 214, 103486, https://doi.org/10.1016/j.jmarsys.2020.103486, 2021.
Díez-Minguito, M., Baquerizo, A., Ortega-Sánchez, M., Navarro, G., and Losada, M. A.: Tide transformation in the Guadalquivir estuary (SW Spain) and process-based zonation, J. Geophys. Res., 117, C03019, https://doi.org/10.1029/2011JC007344, 2012.
Fiúza, A. F. G.: Upwelling Patterns off Portugal, in: Coastal Upwelling Its Sediment Record, edited by: Suess, E. and Thiede, J., Springer US, Boston, MA, 85–98, https://doi.org/10.1007/978-1-4615-6651-9_5, 1983.
Fiúza, A. F. G., de Macedo, M. E., and Guerreiro, M. R.: Climatological space and time variation of the Portuguese coastal upwelling, Oceanol. Acta, 5, 31–40, 1982.
Folkard, A. M., Davies, P. A., Fiúza, A. F. G., and Ambar, I.: Remotely sensed sea surface thermal patterns in the gulf of-cadiz and the strait of Gibraltar: Variability, correlations, and relationships with the surface wind field, J. Geophys. Res.-Oceans, 102, 5669–5683, https://doi.org/10.1029/96JC02505, 1997.
Gan, J. and Allen, J. S.: A modeling study of shelf circulation off northern California in the region of the Coastal Ocean Dynamics Experiment: Response to relaxation of upwelling winds, J. Geophys. Res., 107, 3123, https://doi.org/10.1029/2000JC000768, 2002.
Garcia, C. M., Prieto, L., Vargas, M., Echevarría, F., Garcia-Lafuente, J., Ruiz, J., and Rubin, J. P.: Hydrodynamics and the spatial distribution of plankton and TEP in the Gulf of Cadiz (SW Iberian Peninsula), J. Plankton Res., 24, 817–833, https://doi.org/10.1093/plankt/24.8.817, 2002.
García Lafuente, J. and Ruiz, J.: The Gulf of Cádiz pelagic ecosystem: A review, Prog. Oceanogr., 74, 228–251, https://doi.org/10.1016/j.pocean.2007.04.001, 2007.
García-Lafuente, J., Delgado, J., Criado-Aldeanueva, F., Bruno, M., del Río, J., and Miguel Vargas, J.: Water mass circulation on the continental shelf of the Gulf of Cádiz, Deep-Sea Res. Pt. II, 53, 1182–1197, https://doi.org/10.1016/j.dsr2.2006.04.011, 2006.
García-Lafuente, J., Sánchez-Román, A., Naranjo, C., and Sánchez-Garrido, J. C.: The very first transformation of the Mediterranean outflow in the Strait of Gibraltar, J. Geophys. Res., 116, C07010, https://doi.org/10.1029/2011JC006967, 2011.
García-Lafuente, J., Sammartino, S., Huertas, I. E., and Flecha, S.: Hotter and Weaker Mediterranean Outflow as a Response to Basin-Wide Alterations, Front. Mar. Sci., 8, 613444, https://doi.org/10.3389/fmars.2021.613444, 2021.
Garel, E. and D'Alimonte, D.: Continuous river discharge monitoring with bottom-mounted current profilers at narrow tidal estuaries, Cont. Shelf Res., 133, 1–12, https://doi.org/10.1016/j.csr.2016.12.001, 2017.
Garel, E., Laiz, I., Drago, T., and Relvas, P.: Characterisation of coastal counter-currents on the inner shelf of the Gulf of Cadiz, J. Marine Syst., 155, 19–34, https://doi.org/10.1016/j.jmarsys.2015.11.001, 2016.
Hanebuth, T. J. J., King, M. L., Mendes, I., Lebreiro, S., Lobo, F. J., Oberle, F. K., Antón, L., Ferreira, P. A., and Reguera, M. I.: Hazard potential of widespread but hidden historic offshore heavy metal (Pb, Zn) contamination (Gulf of Cadiz, Spain), Sci. Total Environ., 637–638, 561–576, https://doi.org/10.1016/j.scitotenv.2018.04.352, 2018.
Hernández-Carrasco, I., Solabarrieta, L., Rubio, A., Esnaola, G., Reyes, E., and Orfila, A.: Impact of HF radar current gap-filling methodologies on the Lagrangian assessment of coastal dynamics, Ocean Sci., 14, 827–847, https://doi.org/10.5194/os-14-827-2018, 2018.
Hersbach, H., Bell, B., Berrisford, P., Biavati, G., Horányi, A., Muñoz Sabater, J., Nicolas, J., Peubey, C., Radu, R., Rozum, I., Schepers, D., Simmons, A., Soci, C., Dee, D., and Thépaut, J.-N.: ERA5 hourly data on pressure levels from 1959 to present, Copernicus Climate Change Service (C3S) Climate Data Store (CDS) [data set], https://doi.org/10.24381/cds.bd0915c6, 2018.
Kaihatu, J. M., Handler, R. A., Marmorino, G. O., and Shay, L. K.: Empirical orthogonal function analysis of ocean surface currents using complex and real-vector methods, J. Atmos. Ocean. Tech., 15, 927–941, https://doi.org/10.1175/1520-0426(1998)015<0927:EOFAOO>2.0.CO;2, 1998.
Kaplan, D. M., Largier, J., and Botsford, L. W.: HF radar observations of surface circulation off Bodega Bay (northern California, USA), J. Geophys. Res., 110, 1–25, https://doi.org/10.1029/2005JC002959, 2005.
Kida, S., Price, J. F., and Yang, J.: The upper-oceanic response to overflows: A mechanism for the Azores current, J. Phys. Oceanogr., 38, 880–895, https://doi.org/10.1175/2007JPO3750.1, 2008.
Kokkini, Z., Potiris, M., Kalampokis, A., and Zervakis, V.: HF Radar observations of the dardanelles outflow current in the north eastern Aegean using validated WERA HF radar data, Mediterr. Mar. Sci., 15, 753–768, https://doi.org/10.12681/mms.938, 2014.
Kundu P. K. and Allen J. S.: Some three-dimensional characteristics of low-frequency current fluctuations near the Oregon Coast, J. Phys. Oceanogr., 6, 181–199, https://doi.org/10.1175/1520-0485(1976)006<0181:STDCOL>2.0.CO;2, 1976.
Leitão, F., Relvas, P., Cánovas, F., Baptista, V., and Teodósio, A.: Northerly wind trends along the Portuguese marine coast since 1950, Theor. Appl. Climatol., 137, 1–19, https://doi.org/10.1007/s00704-018-2466-9, 2018.
Lipa, B., Barrick, D., Alonso-Martirena, A., Fernandes, M., Ferrer, M. I., and Nyden, B.: Brahan project high frequency radar ocean measurements: Currents, winds, waves and their interactions, Remote Sens., 6, 12094–12117, https://doi.org/10.3390/rs61212094, 2014.
Lipa, B. J. and Barrick, D. E.: Least-Squares Methods for the Extraction of Surface Currents from CODAR Crossed-Loop Data: Application at ARSLOE, IEEE J. Ocean. Eng., 8, 226–253, https://doi.org/10.1109/JOE.1983.1145578, 1983.
Lorente, P., Piedracoba, S., and Fanjul, E. A.: Validation of high-frequency radar ocean surface current observations in the NW of the Iberian Peninsula, Cont. Shelf Res., 92, 1–15, https://doi.org/10.1016/j.csr.2014.11.001, 2015.
Losada, A. M. P.: Analysis of the meteorological synoptic situations that affect the Straits of Gibraltar and their influence on the surface wind, Bol. Inst. Esp. Ocean., 15, 81–90, 1999.
Maiwa, K., Masumoto, Y., and Yamagata, T.: Characteristics of coastal trapped waves along the southern and eastern coasts of Australia, J. Oceanogr., 66, 243–258, https://doi.org/10.1007/s10872-010-0022-z, 2010.
Mestdagh, T., Lobo, F. J., Llave, E., Hernández-Molina, F. J., García Ledesma, A., Puga-Bernabéu, Á., Fernández-Salas, L. M., and Van Rooij, D.: Late Quaternary multi-genetic processes and products on the northern Gulf of Cadiz upper continental slope (SW Iberian Peninsula), Mar. Geol., 427, 106214, https://doi.org/10.1016/j.margeo.2020.106214, 2020.
Mulero-Martínez, R., Gómez-Enri, J., Mañanes, R., and Bruno, M.: Assessment of near-shore currents from CryoSat-2 satellite in the Gulf of Cádiz using HF radar-derived current observations, Remote Sens. Environ., 256, 112310, https://doi.org/10.1016/j.rse.2021.112310, 2021.
Navarro, G., Escudier, R., Pascual, A., Caballero, I., and Vázquez, A.: Singular Value Decomposition of Ocean Surface Chlorophyll and Sea Level Anomalies in the Gulf of Cadiz (South-Western Iberian Peninsula), 20 years Prog. Radar Altimetry Symp., Venice-Lido 2012, 2013.
Nencioli, F., Dong, C., Dickey, T., Washburn, L., and McWilliams, J. C.: A vector geometry-based eddy detection algorithm and its application to a high-resolution numerical model product and high-frequency radar surface velocities in the Southern California Bight, J. Atmos. Ocean. Tech., 27, 564–579, https://doi.org/10.1175/2009JTECHO725.1, 2010.
Nunes, R. A. O., Alvim-Ferraz, M. C. M., Martins, F. G., Calderay-Cayetano, F., Durán-Grados, V., Moreno-Gutiérrez, J., Jalkanen, J.-P., Hannuniemi, H., and Sousa, S. I. V.: Shipping emissions in the Iberian Peninsula and the impacts on air quality, Atmos. Chem. Phys., 20, 9473–9489, https://doi.org/10.5194/acp-20-9473-2020, 2020.
Ortega, C., Nogueira, C., and Pinto, H.: Sea and littoral localities' economy: Exploring potentialities for a maritime cluster – An integrated analysis of Huelva, Spain and Algarve, Portugal, J. Marit. Res., 10, 35–42, 2013.
Ocean Color Data: Level 3 VIIRS-SNPP SST data, https://oceandata.sci.gsfc.nasa.gov, last access: 15 November 2021.
Paduan, J. D. and Rosenfeld, L. K.: Remotely sensed surface currents in Monterey Bay from shore-based HF radar (Coastal Ocean Dynamics Application Radar), J. Geophys. Res.-Oceans, 101, 20669–20686, https://doi.org/10.1029/96JC01663, 1996.
Paduan, J. D. and Washburn, L.: High-Frequency Radar Observations of Ocean Surface Currents, Annu. Rev. Mar. Sci., 5, 115–136, https://doi.org/10.1146/annurev-marine-121211-172315, 2013.
Peliz, A., Dubert, J., Marchesiello, P., and Teles-Machado, A.: Surface circulation in the Gulf of Cadiz: Model and mean flow structure, J. Geophys. Res., 112, 1–20, https://doi.org/10.1029/2007JC004159, 2007.
Peliz, A., Marchesiello, P., Santos, A. M. P., Dubert, J., Teles-Machado, A., Marta-Almeida, M., and Le Cann, B.: Surface circulation in the Gulf of Cadiz: 2. Inflow-outflow coupling and the Gulf of Cadiz slope current, J. Geophys. Res., 114, 1–16, https://doi.org/10.1029/2008JC004771, 2009.
Peliz, A., Boutov, D., Cardoso, R. M., Delgado, J., and Soares, P. M. M.: The Gulf of Cadiz-Alboran Sea sub-basin: Model setup, exchange and seasonal variability, Ocean Model., 61, 49–67, https://doi.org/10.1016/j.ocemod.2012.10.007, 2013.
Peliz, A., Boutov, D., Barbosa Aguiar, A., and Carton, X.: The Gulf of Cadiz Gap wind anticyclones, Cont. Shelf Res., 91, 171–191, https://doi.org/10.1016/j.csr.2014.09.004, 2014.
Price, J. F., Baringer, M. O., Lueck, R. G., Johnson, G. C., Ambar, I., Parrilla, G., Cantos, A., Kennelly, M. A., and Sanford, T. B.: Mediterranean Outflow Mixing and Dynamics, Science, 259, 1277–1282, https://doi.org/10.1126/science.259.5099.1277, 1993.
Prieto, L., Navarro, G., Rodríguez-Gálvez, S., Huertas, I. E., Naranjo, J. M., and Ruiz, J.: Oceanographic and meteorological forcing of the pelagic ecosystem on the Gulf of Cadiz shelf (SW Iberian Peninsula), Cont. Shelf Res., 29, 2122–2137, https://doi.org/10.1016/j.csr.2009.08.007, 2009.
Puertos del Estado: HFR data, http://opendap.puertos.es/thredds/catalog/radar_local_huelva/catalog.html, last access: 13 October 2020.
Relvas, P. and Barton, E. D.: Mesoscale patterns in the Cape São Vicente (Iberian Peninsula) upwelling region, J. Geophys. Res., 107, 3164, https://doi.org/10.1029/2000JC000456, 2002.
Relvas, P. and Barton, E. D.: A separated jet and coastal counterflow during upwelling relaxation off Cape São Vicente (Iberian Peninsula), Cont. Shelf Res., 25, 29–49, https://doi.org/10.1016/j.csr.2004.09.006, 2005.
Reul, A., Muñoz, M., Criado-Aldeanueva, F., and Rodríguez, V.: Spatial distribution of phytoplankton < 13 µm in the Gulf of Cádiz in relation to water masses and circulation pattern under westerly and easterly wind regimes, Deep-Sea Res. Pt. II, 53, 1294–1313, https://doi.org/10.1016/j.dsr2.2006.04.008, 2006.
Ribas-Ribas, M., Gómez-Parra, A., and Forja, J. M.: Air–sea CO2 fluxes in the north-eastern shelf of the Gulf of Cádiz (southwest Iberian Peninsula), Mar. Chem., 123, 56–66, https://doi.org/10.1016/j.marchem.2010.09.005, 2011.
Rivas, D.: Wind-driven coastal-trapped waves off southern Tamaulipas and northern Veracruz, western Gulf of Mexico, during winter 2012–2013, Estuar. Coast. Shelf Sc., 185, 1–10, https://doi.org/10.1016/j.ecss.2016.12.002, 2017.
Sánchez, R. F. and Relvas, P.: Spring–summer climatological circulation in the upper layer in the region of Cape St. Vincent, Southwest Portugal, ICES J. Mar. Sci., 60, 1232–1250, https://doi.org/10.1016/S1054-3139(03)00137-1, 2003.
Sánchez, R. F., Mason, E., Relvas, P., da Silva, A. J., and Peliz, Á.: On the inner-shelf circulation in the northern Gulf of Cádiz, southern Portuguese shelf, Deep-Sea Res. Pt. II, 53, 1198–1218, https://doi.org/10.1016/j.dsr2.2006.04.002, 2006.
Sánchez, R. F., Relvas, P., and Delgado, M.: Coupled ocean wind and sea surface temperature patterns off the western Iberian Peninsula, J. Marine Syst., 68, 103–127, https://doi.org/10.1016/j.jmarsys.2006.11.003, 2007.
Sánchez-Leal, R. F., Bellanco, M. J., Naranjo, C., García-Lafuente, J., and González-Pola, C.: On the seasonality of waters below the seasonal thermocline in the Gulf of Cádiz, Cont. Shelf Res., 204, 104190, https://doi.org/10.1016/j.csr.2020.104190, 2020.
Simpson, J. H. and Sharples, J.: Introduction to the Physical and Biological Oceanography of Shelf Seas, in: Introduction to the Physical and Biological Oceanography of Shelf Seas, Cambridge University Press, Cambridge, 306–313, https://doi.org/10.1017/CBO9781139034098, 2012.
Solabarrieta, L., Rubio, A., Castanedo, S., Medina, R., Charria, G., and Hernández, C.: Surface water circulation patterns in the southeastern Bay of Biscay: New evidences from HF radar data, Cont. Shelf Res., 74, 60–76, https://doi.org/10.1016/j.csr.2013.11.022, 2014.
Stevenson, R. E.: Huelva Front and Malaga, Spain, eddy chain as defined by satellite and oceanographic data, Dtsch. Hydrogr. Zeitschrift, 30, 51–53, https://doi.org/10.1007/BF02226082, 1977.
Teles-Machado, A., Peliz, Á., Dubert, J., and Sánchez, R. F.: On the onset of the Gulf of Cadiz Coastal Countercurrent, Geophys. Res. Lett., 34, L12601, https://doi.org/10.1029/2007GL030091, 2007.
Vargas, J. M., García-Lafuente, J., Delgado, J., and Criado, F.: Seasonal and wind-induced variability of Sea Surface Temperature patterns in the Gulf of Cádiz, J. Marine Syst., 38, 205–219, https://doi.org/10.1016/S0924-7963(02)00240-3, 2003.