the Creative Commons Attribution 4.0 License.
the Creative Commons Attribution 4.0 License.
 | 15 Jul 2022
Deep through-flow in the Bight Fracture Zone
Virginie Thierry
Herlé Mercier
Iceland–Scotland Overflow Water (ISOW) is exported from the Nordic Seas into the Iceland Basin to feed the lower limb of the Meridional Overturning Circulation. The Bight Fracture Zone (BFZ) is known to be a major route for ISOW toward the Irminger Sea, but the role of this gateway in the evolution of ISOW properties over the subpolar gyre is unclear. A combination of ship-based and Deep-Argo data gathered between 2015 and 2018 allows us to investigate the pathways and hydrographic evolution of ISOW as it flows through the BFZ, as well as its influence on the North Atlantic Deep Water (NADW) properties in the Irminger Sea. The ISOW flow through the BFZ amounts to 0.8 ± 0.2 Sv and is mainly fed by the lighter part of the ISOW layer flowing west of 29–30∘ W as part of the East Reykjanes Ridge Current in the Iceland Basin. In the rift valley of the BFZ, between an eastern and a western sill, the bathymetry of the BFZ shapes a cyclonic circulation along which the ISOW layer is homogenized. The largest changes in ISOW properties are however observed downstream of the western sill, at the exit of the BFZ. There, ISOW is mixed isopycnally with comparatively fresher NADW circulating in the Irminger Sea. Hence, our analysis reveals the key role of the BFZ through-flow in the salinification of the NADW in the Irminger Current.
- Article
(9118 KB) - Full-text XML
- BibTeX
- EndNote


Iceland–Scotland Overflow Water (ISOW) is a major component of the lower limb of the Meridional Overturning Circulation (MOC). Formed by mixing between overflows from the Nordic Seas, Atlantic Water and Labrador Sea Water (LSW), ISOW is characterized by potential density higher than 27.8 kg m−3 and salinity higher than 34.94 downstream of the Iceland–Scotland–Faroe Ridge (Hansen and Østerhus, 2000; Johns et al., 2021; Saunders, 1994). ISOW is then carried southwestward along the Icelandic shelf (Kanzow and Zenk, 2014) and subsequently along the eastern flank of the Reykjanes Ridge within several veins of the East Reykjanes Ridge Current (Koman et al., 2020; Xu et al., 2010). While the Charlie-Gibbs Fracture Zone is known as the main ISOW gateway toward the Irminger Sea (Saunders, 1994), Xu et al. (2010) identified the Bight Fracture Zone (BFZ), a deep and wide gap of the Reykjanes Ridge near 57∘ N, as a second major route for ISOW toward the Irminger Sea. The importance of the BFZ for the connection of deep water between the two basins is supported by float trajectories (Bower et al., 2002; Kanzow and Zenk, 2014) and the OVIDE data analysis (Daniault et al., 2016). More recently, Petit et al. (2019) estimated that one-third of these southward veins reach the Irminger Sea through the BFZ; the remainder crosses the ridge through deeper fractures further south.
At about 58.8∘ N, Daniault et al. (2016) highlighted a strong asymmetry of the ISOW properties between the eastern and western flanks of the Reykjanes Ridge. Petit et al. (2019) showed that the asymmetry of the ISOW properties persists north and south of the BFZ, at about 56.4 and 63∘ N. The evolution of the ISOW properties from the Iceland Basin to the Irminger Sea is attributed to mixing through the complex bathymetry of the ridge. Analyzing microstructure and conductivity–temperature–depth (CTD) data from the OVIDE line, Ferron et al. (2016) showed that dissipation rates (vertical mixing) were enhanced over the flanks of the Reykjanes Ridge. Similarly, fracture zones are known sites of large modification of water mass properties (Mercier et al., 1994). Recent studies based on moorings (Bower and Furey, 2017) and Deep-Argo floats (Racapé et al., 2019) deployed in the Charlie-Gibbs Fracture Zone (CGFZ) have pointed out the mixing between ISOW and surrounding water masses, including Northeast Atlantic Deep Water, Lower Deep Water and LSW.
Understanding the propagation and evolution of ISOW is crucial to characterize the evolution of the lower limb of the MOC over the North Atlantic Subpolar Gyre and the propagation of climate signals to the rest of the ocean. While the role of the CGFZ in the spreading pathways of ISOW has been investigated for decades (Bower and Furey, 2017; Racapé et al., 2019; Saunders, 1994; Xu et al., 2010; Zou et al., 2017, 2020), the lack of direct observations prevented us from investigating the role of the BFZ.
In this study, we provide new insights into the ISOW flow through the BFZ by combining data from high-resolution hydrographic sections and Deep-Argo floats acquired at key locations in the BFZ. The article is organized as follows. Section 2 presents the data and methods used for the study. The ISOW pathways, transport and property evolution through the BFZ are analyzed in Sect. 3. The impact of the BFZ through-flow on the evolution of North Atlantic Deep Water (NADW) in the Irminger Sea is also discussed in Sect. 3. Section 4 summarizes the results and discusses their implications for the lower limb of the MOC.
2.1 Bathymetry of the Bight Fracture Zone
The deepening of the Reykjanes Ridge southward from Iceland is associated with several fracture zones, including the BFZ at 57∘ N (Fig. 1). The BFZ axis extends quasi-zonally from the Iceland Basin to the Irminger Sea and intersects the rift valley of the Reykjanes Ridge at 56.75∘ N, 34.17∘ W. The BFZ entrance is composed of a narrow sill (8.7 km wide – following the 2000 m isobaths) at 56.73∘ N, 33.72∘ W along the eastern side of the rift valley. This eastern sill reaches a bottom depth of ∼ 2150 m (Fig. 1c). Immediately west of the eastern sill, the axis of the BFZ intersects the rift valley of the Reykjanes Ridge that is oriented northeast–southwest and reaches bottom depths larger than 2500 m. A second sill at the BFZ exit is located on the western side of the rift valley (56.75∘ N, 35.55∘ W). It reaches a bottom depth close to that observed for the eastern sill, although it is larger when considering the 2000 m isobaths (11.3 km). At the approach of the Irminger Sea, the western sill connects to two channels deeper than 2500 m and separated by a seamount with a summit that lies at about 1700 m.
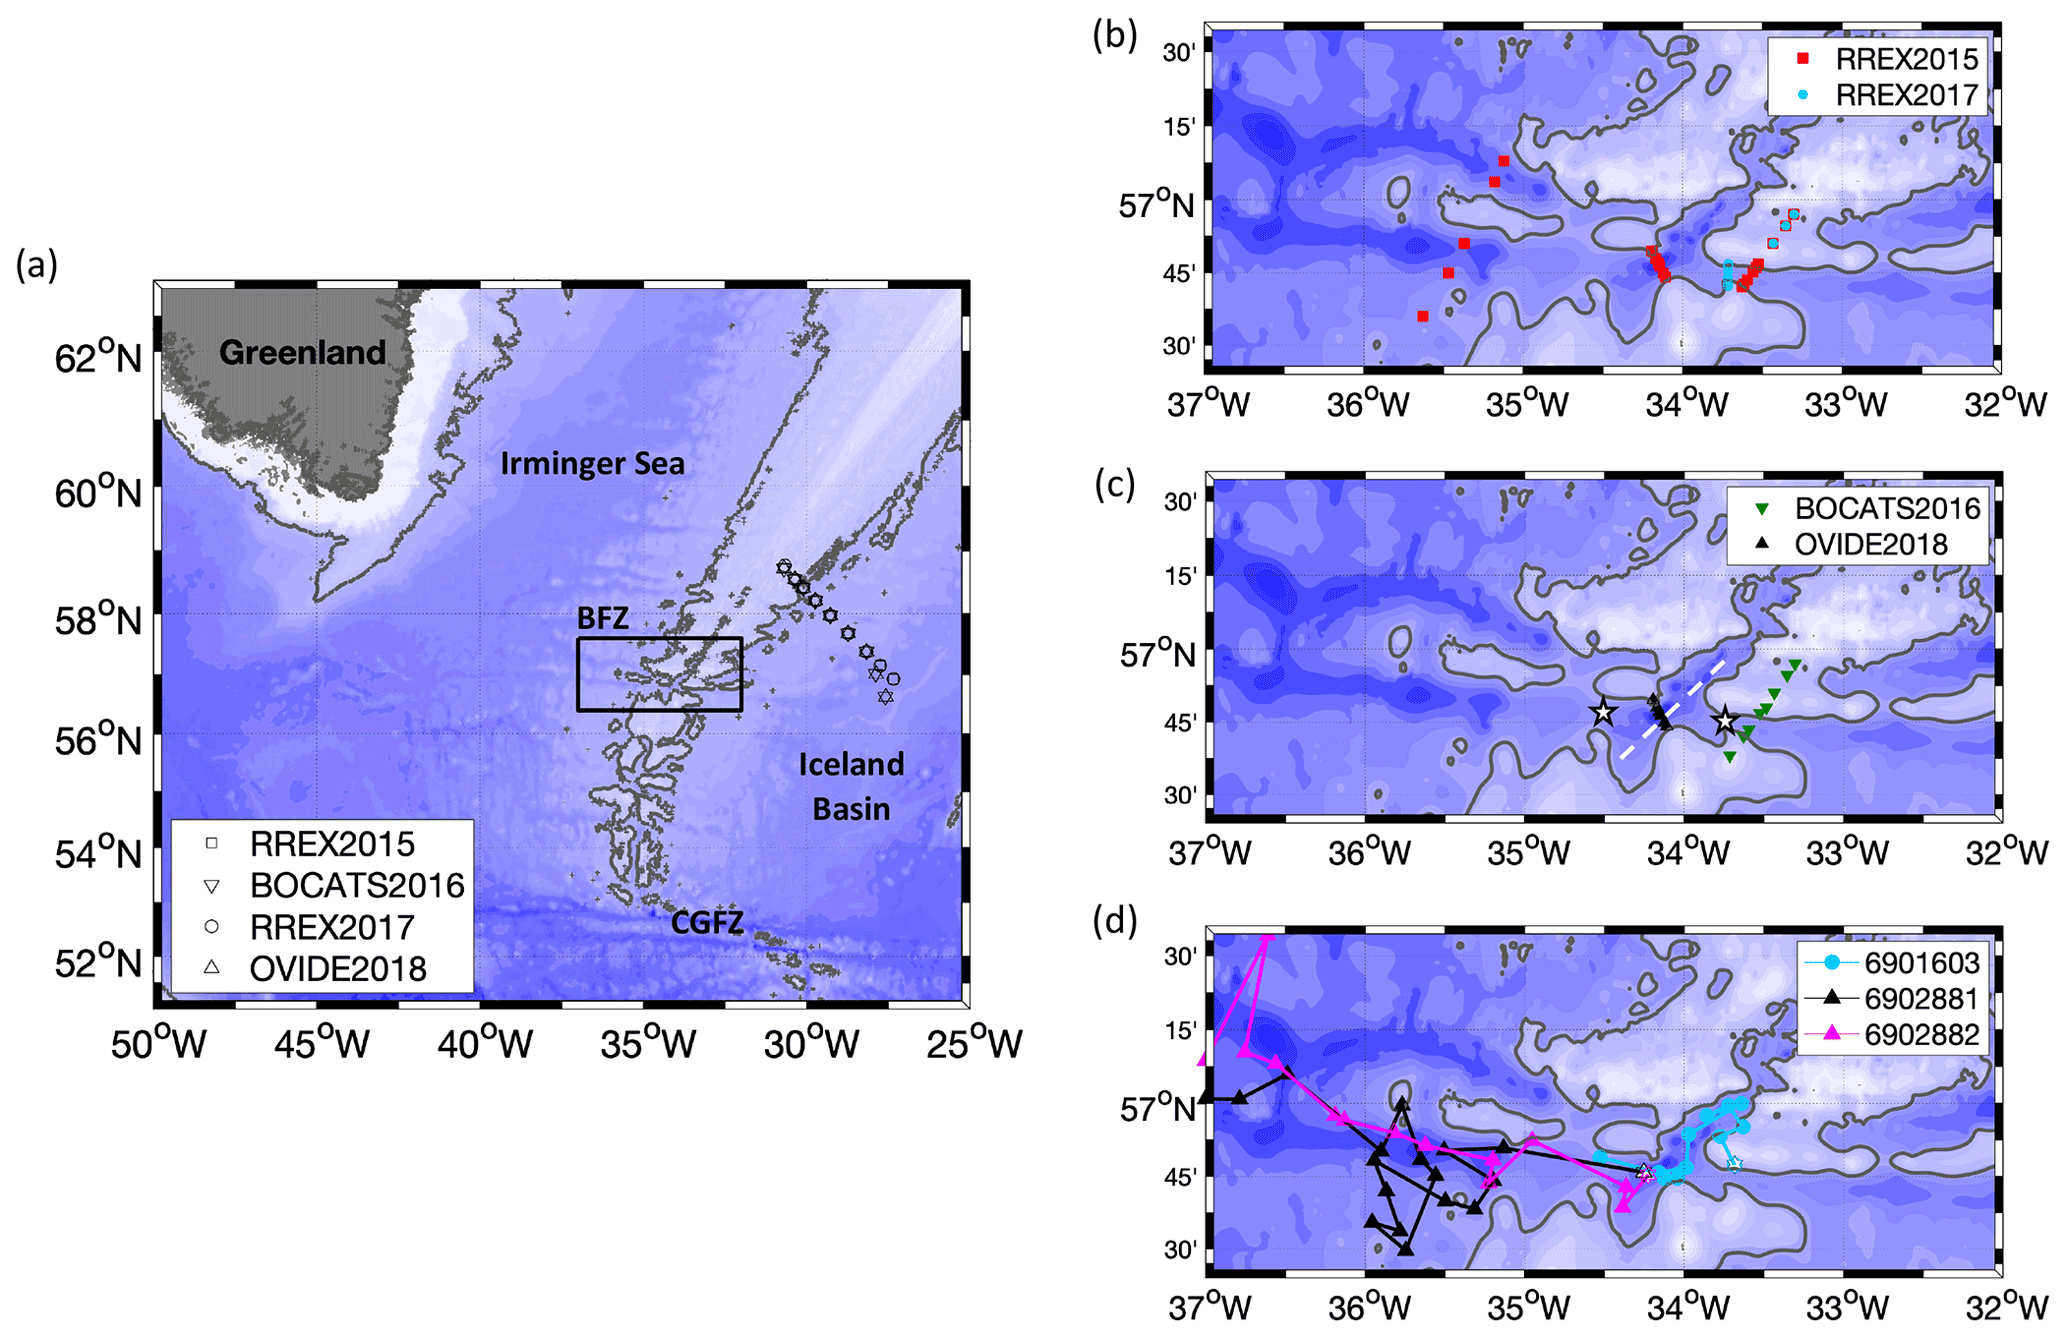
Figure 1Bathymetry of the Reykjanes Ridge from ETOPO1 with 200 m isobaths spacing from white at the surface to dark blue at depth for (a) the eastern subpolar gyre and (b, c, d) the region of the Bight Fracture Zone as identified by the black rectangle in the panel. The gray line outlines the 2100 m isobaths. (a) Hydrographic stations realized along the OVIDE line during the RREX15, BOCATS16, RREX17 and OVIDE18 cruises. (b) Hydrographic stations realized in the BFZ during the RREX15 and RREX17 cruises. (c) Hydrographic stations realized in the BFZ during the BOCATS16 and OVIDE18 cruises. The axis of the rift valley of the Reykjanes Ridge crosses the Middle section and is identified by a white dashed line. The eastern and western sills are identified by white stars. (d) Positions of the Deep-Arvor float profiles for 6902881 (cycles 1–14), 6902882 (cycles 1–18) and 6901603. All floats show overall westward trajectories from their deployment position identified by a white star.
2.2 Hydrographic and velocity sections
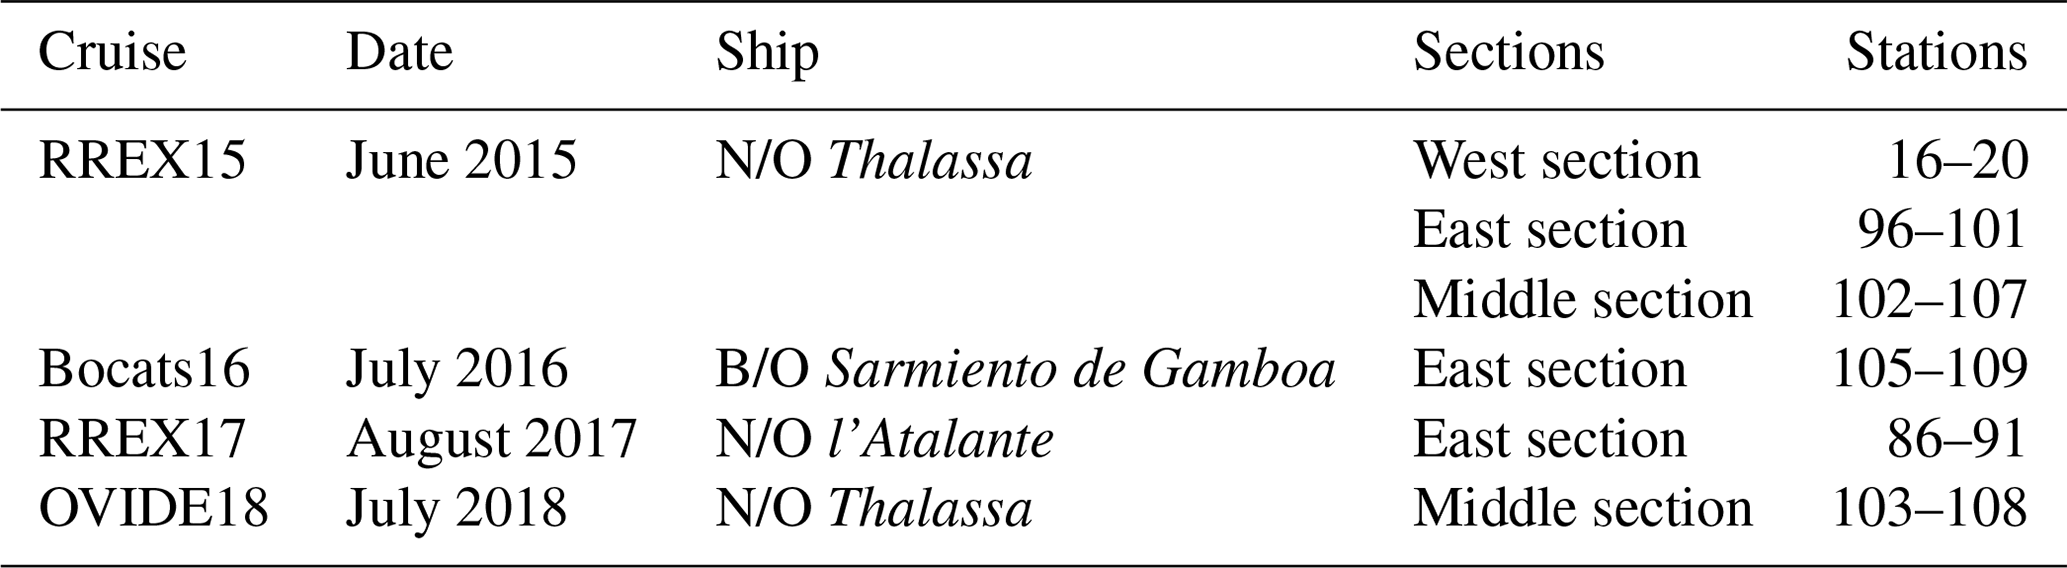
This study is based on high-resolution measurements obtained during four cruises between 2015 and 2018 at key locations of the BFZ (Fig. 1 and Table 1). Two sections are localized within the BFZ. The East section was occupied at the eastern entrance of the BFZ in 2015, 2016 and 2017. Depending on the cruises, it was located either at or 5.5 km upstream of the eastern sill. The Middle section was occupied in the rift valley in 2015 and 2018. At the exit of the BFZ, the West section intersected the two channels west of the western sill in 2015. These three hydrographic sections were designed to study the deep circulation and associated evolution of ISOW that enters the BFZ from the Iceland Basin, circulates in the rift valley of the Reykjanes Ridge and exits the BFZ toward the Irminger Sea.
Twenty-one CTDO2 (conductivity, temperature, depth and oxygen) stations were first implemented along the three sections (stations 16–20 and 96–107) in June 2015 on the French N/O Thalassa during the RREX15 cruise (Branellec and Thierry, 2016). It consists of six stations at the East section, six stations at the Middle section and four stations at the West section. The nominal station spacing was less than 2 km along the East and Middle sections and less than 10 km along the West section. We also use station 122 carried out at 52.7∘ N, 35.1∘ W during the RREX15 cruise for a comparison with the hydrographic properties in the CGFZ.
A year later, the BOCATS16 cruise carried out five CTDO2 stations along the East section in July 2016 on the Spanish B/O Sarmiento de Gamboa (stations 105–109; Branellec and Lherminier, 2017).
In addition to these two cruises, the RREX17 cruise carried out six CTDO2 stations at the East section in August 2017 on the French N/O l'Atalante (stations 86–91; Branellec and Thierry, 2018). The stations were 5.5 km west of those carried out during RREX15 and BOCATS16 to intersect the eastern sill of the BFZ. For simplicity, we refer to this section as the East section as well.
Finally, the OVIDE18 cruise carried out six CTDO2 stations along the Middle section in July 2018 on the French N/O Thalassa (stations 103–108; Branellec et al., 2019).
During the four cruises, CTDO2 stations were also carried out along the so-called OVIDE line (Fig. 1a) that intersects the Reykjanes Ridge at 58.8∘ N, 31.3∘ W (Lherminier et al., 2007). Here, we consider the stations on the eastern side of the Reykjanes Ridge, from 27.2 to 30.7∘ W, to analyze the along-stream evolution of ISOW upstream of the BFZ.
The accuracies of the temperature, practical salinity, pressure and dissolved oxygen concentration are better than 0.002 ∘C, 0.002, 1 dbar and 1.5 µmol kg−1 for the four cruises, except for the dissolved oxygen concentration, for which the accuracy was estimated at 2 µmol kg−1 for OVIDE18. Figures A1 and A2 show the salinity and potential temperature of the East and Middle sections.
The CTD rosette was equipped with a 300 kHz downward-looking and a 150 kHz upward-looking L-ADCP (lowered acoustic Doppler current profiler, RD Instruments). The upper layer current velocity components were measured by two S-ADCPs (shipboard acoustic Doppler current profiler, RD Instruments) operating at 38 (OS38) and 150 kHz (OS150), with the exception of BOCATS16 for which S-ADCPs operated with a combination of 75 (OS75) and 150 kHz (OS150). The maximum depths reached by the S-ADCP signal were 1300–1400 m for the OS38, 700–800 m for the OS75 and 200–250 m for the OS150. The calibrations and processing of these measurements were identical for all four cruises. As described by Petit et al. (2018), the OS150 datasets were used to correct the calibration of the second S-ADCP, and the velocity profiles were averaged over 2 km segments along the sections.
These measurements were used to estimate absolutely referenced geostrophic velocities perpendicular to the sections and the associated gridded transports (Fig. 2 and Table 3). The geostrophic velocities were estimated from the CTDO2 measurements using the seawater toolbox and were referenced by velocity measurements from the OS38 and OS75 (Petit et al., 2018). The geostrophic velocities were then evaluated by comparison to the L-ADCP velocities at the East and Middle sections (Figs. A3 and A4). Note that L-ADCP measurements provide local measurements of the total velocity field at each hydrographic station while geostrophic velocities are averaged velocities between two successive stations (Lherminier et al., 2007), so we cannot expect a perfect agreement between the two datasets. Nevertheless, the comparison of the amplitude and spatial structure of the velocity field reveals the remarkable agreement between the geostrophic and L-ADCP velocities for each section. The largest difference in velocity is found at the East section in 2017 where the geostrophy-based velocity in the ISOW core is about −0.36 m s−1, while the L-ADCP-estimated velocity is about −0.14 m s−1.
Table 1Summary of the sections occupied during the four hydrographic cruises and the associated station numbers. Details on the cruises and on the locations of the stations can be found in Branellec and Thierry (2016), Branellec and Lherminier (2017), Branellec and Thierry (2018), and Branellec et al. (2019).
2.3 Deep-Arvor floats
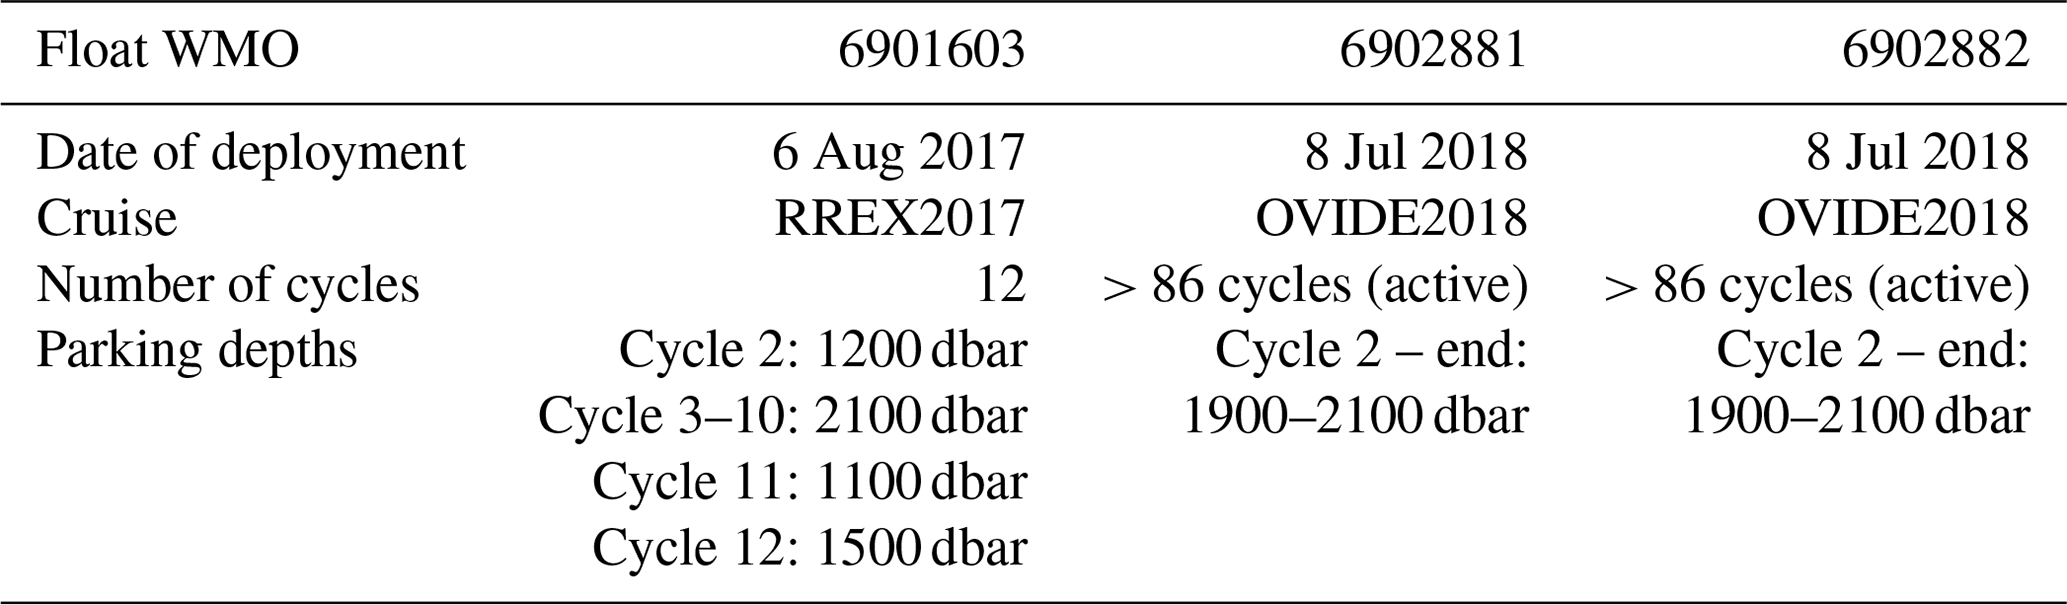
Data from three Deep-Arvor floats are used to assess the pathway and hydrographic evolution of ISOW as it flows westward through the BFZ. The Deep-Arvor floats are Argo floats profiling down to 4000 m (Le Reste et al., 2016; Le Traon et al., 2020) and returning top-to-bottom profiles of temperature, salinity and dissolved oxygen concentration as a function of pressure every 10 d. One Deep-Arvor float (WMO 6901603) was deployed at the East section during RREX17 (station 89 at 56.73∘ N, 33.72∘ W), and two Deep-Arvor floats (WMO 6902881, 6902882) were deployed simultaneously at the Middle section during OVIDE18 (56.80∘ N, 34.17∘ W) (Table 2). The Deep-Arvor float 6901603 completed 12 cycles before it died on 26 November 2017. Floats 6902881 and 6902882 completed a few cycles in the BFZ before exiting the fracture zone and drifting into the Irminger Sea. The three floats drifted mostly in the range 1900–2100 dbar within the ISOW core layer. Float 6901603 grounded at cycles 2, 11 and 12 and drifted at shallower pressure during these cycles. Trajectories within the ISOW layer of the Deep-Arvor floats are considered from cycle 2 because the floats are programmed to rise to the surface immediately after reaching their parking depth at the end of the first descent.
Temperature, practical salinity and pressure were measured using a Seabird SBE41CP CTD sensor with a target accuracy of 0.002 ∘C, 0.004 and 7 dbar, respectively. The salinity data were corrected following the procedure specified for Deep-Argo floats (Cabanes et al., 2016; Wong et al., 2021). A compressibility term (CPcor) was applied to correct a pressure-dependent conductivity sensor bias. For the three floats, the nominal CPcor value provided by Seabird (CPcor = −9.57 × 10⁻⁸ dbar−1) is replaced by the Argo recommended value, CPcor = −13.5 × 10⁻⁸ dbar−1. No further salinity bias or drift was detected for 6901603 and 6902882, while 6902881 was corrected for a salinity bias of 0.002. This bias was determined by comparison with a ship-based calibrated cast acquired at float deployment.
Table 2Details on the deployment and parking depth of the three Deep-Arvor floats.
In this section, we use the Deep-Arvor floats and the hydrographic sections of the four surveys to describe the propagation and hydrographic evolution of ISOW as it flows through the BFZ from the East Reykjanes Ridge Current to the Irminger Sea.
3.1 Propagation of ISOW through the BFZ
The potential temperature–salinity (θ–S) properties of ISOW at the BFZ are compared to those observed in the East Reykjanes Ridge Current along the OVIDE section (Fig. 3). The comparison in the density range 27.8–27.87 kg m−3 reveals three geographical areas along the OVIDE section that are related to the three ISOW branches permanently observed at 30, 29 and 27∘ W along the eastern flank of the Reykjanes Ridge (Daniault et al., 2016; Xu et al., 2010; Petit et al., 2019). ISOW east of 29∘ W is fresher than that observed in the BFZ, while ISOW west of 30∘ W has θ–S properties close to those observed in the BFZ. The θ-S properties between 29–30∘ W are variable in time, being fresher than at the BFZ in 2015 and 2016 but matching the ISOW properties in the BFZ in 2017 and 2018. The BFZ is thus mainly fed by the western branch of ISOW flowing west of 30∘ W along the 2150 m isobath, which is the depth of the sill at the eastern entrance of the BFZ. The BFZ is also fed by the middle branch of ISOW flowing between 29–30∘ W in 2017 and 2018. However, while ISOW at the eastern entrance of the BFZ is lighter than 27.87 kg m−3, ISOW between 29–30∘ W reaches denser values. Then, only the lightest variety of ISOW in this branch enters the BFZ.
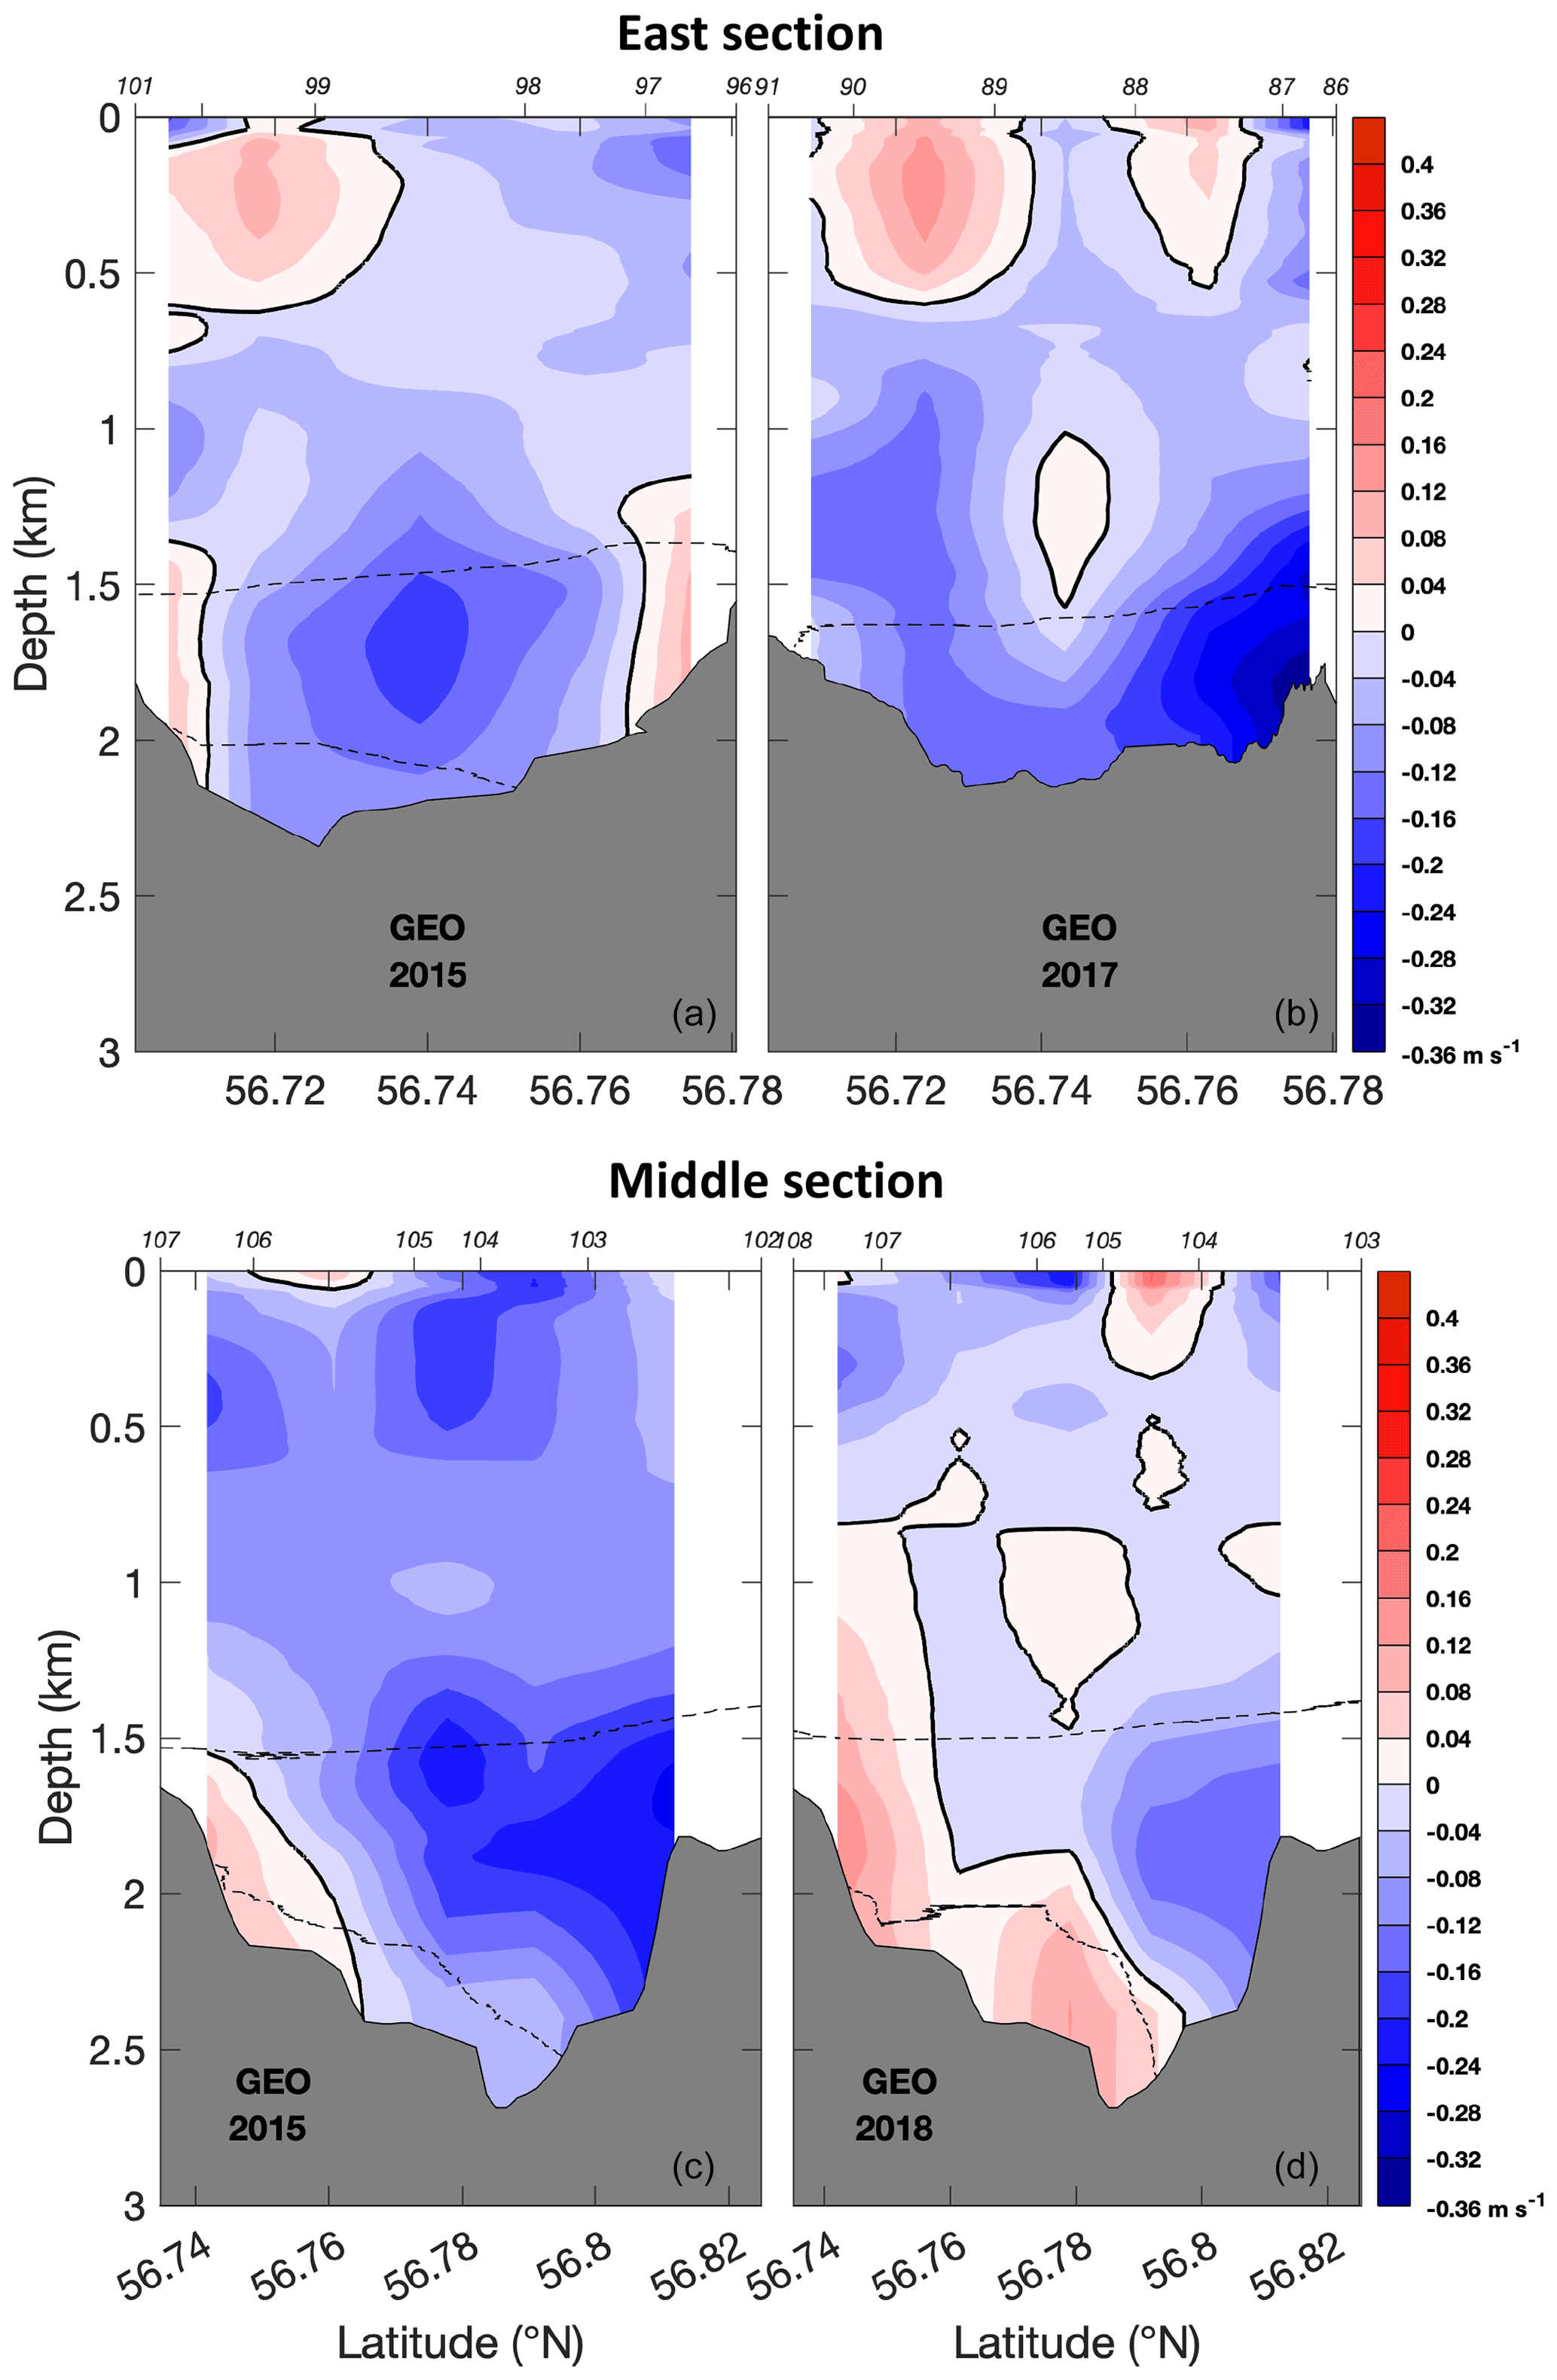
Figure 2Geostrophic velocity sections (m s−1) along the East section (a, b) in 2015 and 2017 and Middle section (c, d) in 2015 and 2018. Positive values correspond to eastward velocities. The black bold line outlines the 0 isotach. The dashed black lines indicate the potential density σ0=27.8 and 27.85 kg m−3. Bathymetry acquired from the echo-sounder of the ship survey is added in gray. Locations of the hydrographic stations are indicated on the top axis.
Once in the BFZ, the following analysis relies on a comparison of the velocity fields and hydrographic properties observed in the ISOW layer between the East and Middle sections and along the pathway of the Deep-Arvor float 6901603. The geostrophic velocity section acquired in 2016 is not discussed here because the sampling of the stations, limited to the two flanks of the channel, was not appropriate to capture the ISOW transport at depths higher than ∼ 1500 m within the sill.
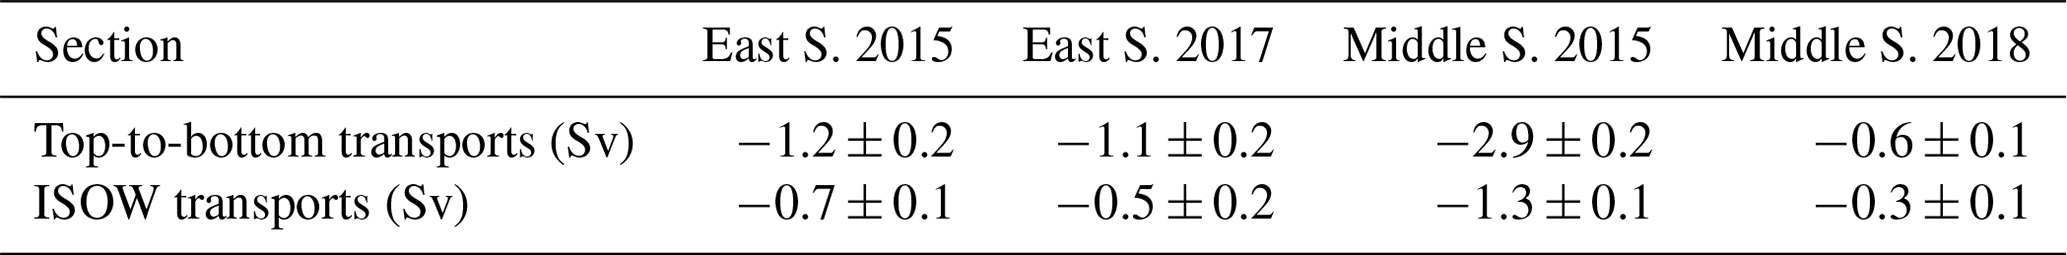
A comparison of the velocity fields observed in 2015 and 2017 in the ISOW layer of the East section reveals differences in the amplitude and location of the ISOW through-flow (Fig. 2). In 2015, the westward flow is intensified at the center of the sill (56.74∘ N), while a weak eastward flow is observed along its northern wall (56.77∘ N). In 2017, the westward flow is observed all along the section and is intensified along the northern wall of the sill. Our dataset does not allow us to determine whether these differences are due to temporal variability of the inflow from the Iceland Basin or to differences in the local bathymetric constraints within the narrow channel of the BFZ entrance, as the East section in 2015 is localized slightly upstream in the channel compared to the East section in 2017 (Fig. 1b). The ISOW transport is estimated at −0.7 ± 0.1 Sv in 2015 and −0.5 ± 0.2 Sv in 2017, which represents 56 % and 49 % of the top-to-bottom transport, respectively (Table 3). The similar ratio of ISOW to top-to-bottom transports between 2015 and 2017 suggests that the BFZ through-flow is influenced by local barotropic circulation, as observed at the CGFZ (Bower and Furey, 2017; Bower and von Appen, 2008; Racapé et al., 2019).
At the Middle section, the velocity field in the ISOW layer is composed of a westward flow along the northern wall of the rift valley and an eastward flow along its southern wall in 2015 and 2018 (Fig. 3). This circulation at the Middle section, following the flanks of the section, suggests that ISOW flows along a cyclonic loop in the rift valley of the Reykjanes Ridge, possibly driven by the bathymetry. The associated top-to-bottom and ISOW transports are 5 times weaker in 2018 than in 2015 (Table 3), although the ISOW transport represents the same proportion of the top-to-bottom transport for these two years (43 % in 2015 and 44 % in 2018). The reduced ISOW transport in 2018 is due to an overall reduced westward flow combined with an enhanced eastward flow, which is composed of an additional core of ISOW at 56.78∘ N that is not observed in 2015.
Table 3Geostrophic top-to-bottom and ISOW transports (Sv) across the East and Middle sections. ISOW is defined by σ0 > 27.8 kg m−3 and salinity higher than 34.94. Errors are estimated following Petit et al. (2018).
The hypothesis of a cyclonic pathway for ISOW in the rift valley is supported by the trajectory of the Deep-Arvor 6901603 float in summer 2017 (Fig. 1d). The float drifted northward at 1200 dbar during its first two cycles from the eastern entrance of the BFZ (Table 2). Although this parking depth is not associated with ISOW density, we note that its pathway is parallel to the 2100 m isobath of the seamount north of the sill. North of the seamount, the float drifted within the ISOW layer at 2100 dbar and reached the northern part of the rift valley at cycle 5. Finally, the float drifted mainly southwestward and then westward as it crossed the western sill of the BFZ at its last cycle. Hence, the trajectory of the 6901603 Deep-Arvor float sketches a cyclonic pathway in the rift valley of the Reykjanes Ridge during its 12 cycles.
The transformation of ISOW in the BFZ is now analyzed by comparing the θ–S properties of ISOW between the East and Middle sections in 2015 (Fig. 4a–b). The θ–S range of variation on a given isopycnal does not exceed 0.01 ∘C and 0.005 between the East and Middle sections. This shows that ISOW does not exhibit a significant evolution of its hydrographic properties by isopycnal mixing between the two sills of the BFZ in 2015. This is also true when considering the Deep-Arvor float properties (not shown). A decrease of ∼ 0.015 kg m−3 in density of the near-bottom water is however observed at the Middle section. This can possibly be ascribed to the bathymetry of the sill at the eastern entrance of the BFZ, in case the densest water cannot overflow this topographic obstacle at 2150 m depth (black star in Fig. 4b). This is however not supported by the velocity section at the East section in 2015 (Fig. 2), which shows westward velocities down to the bottom, so that we rather interpret this property change as evidence of vertical mixing.
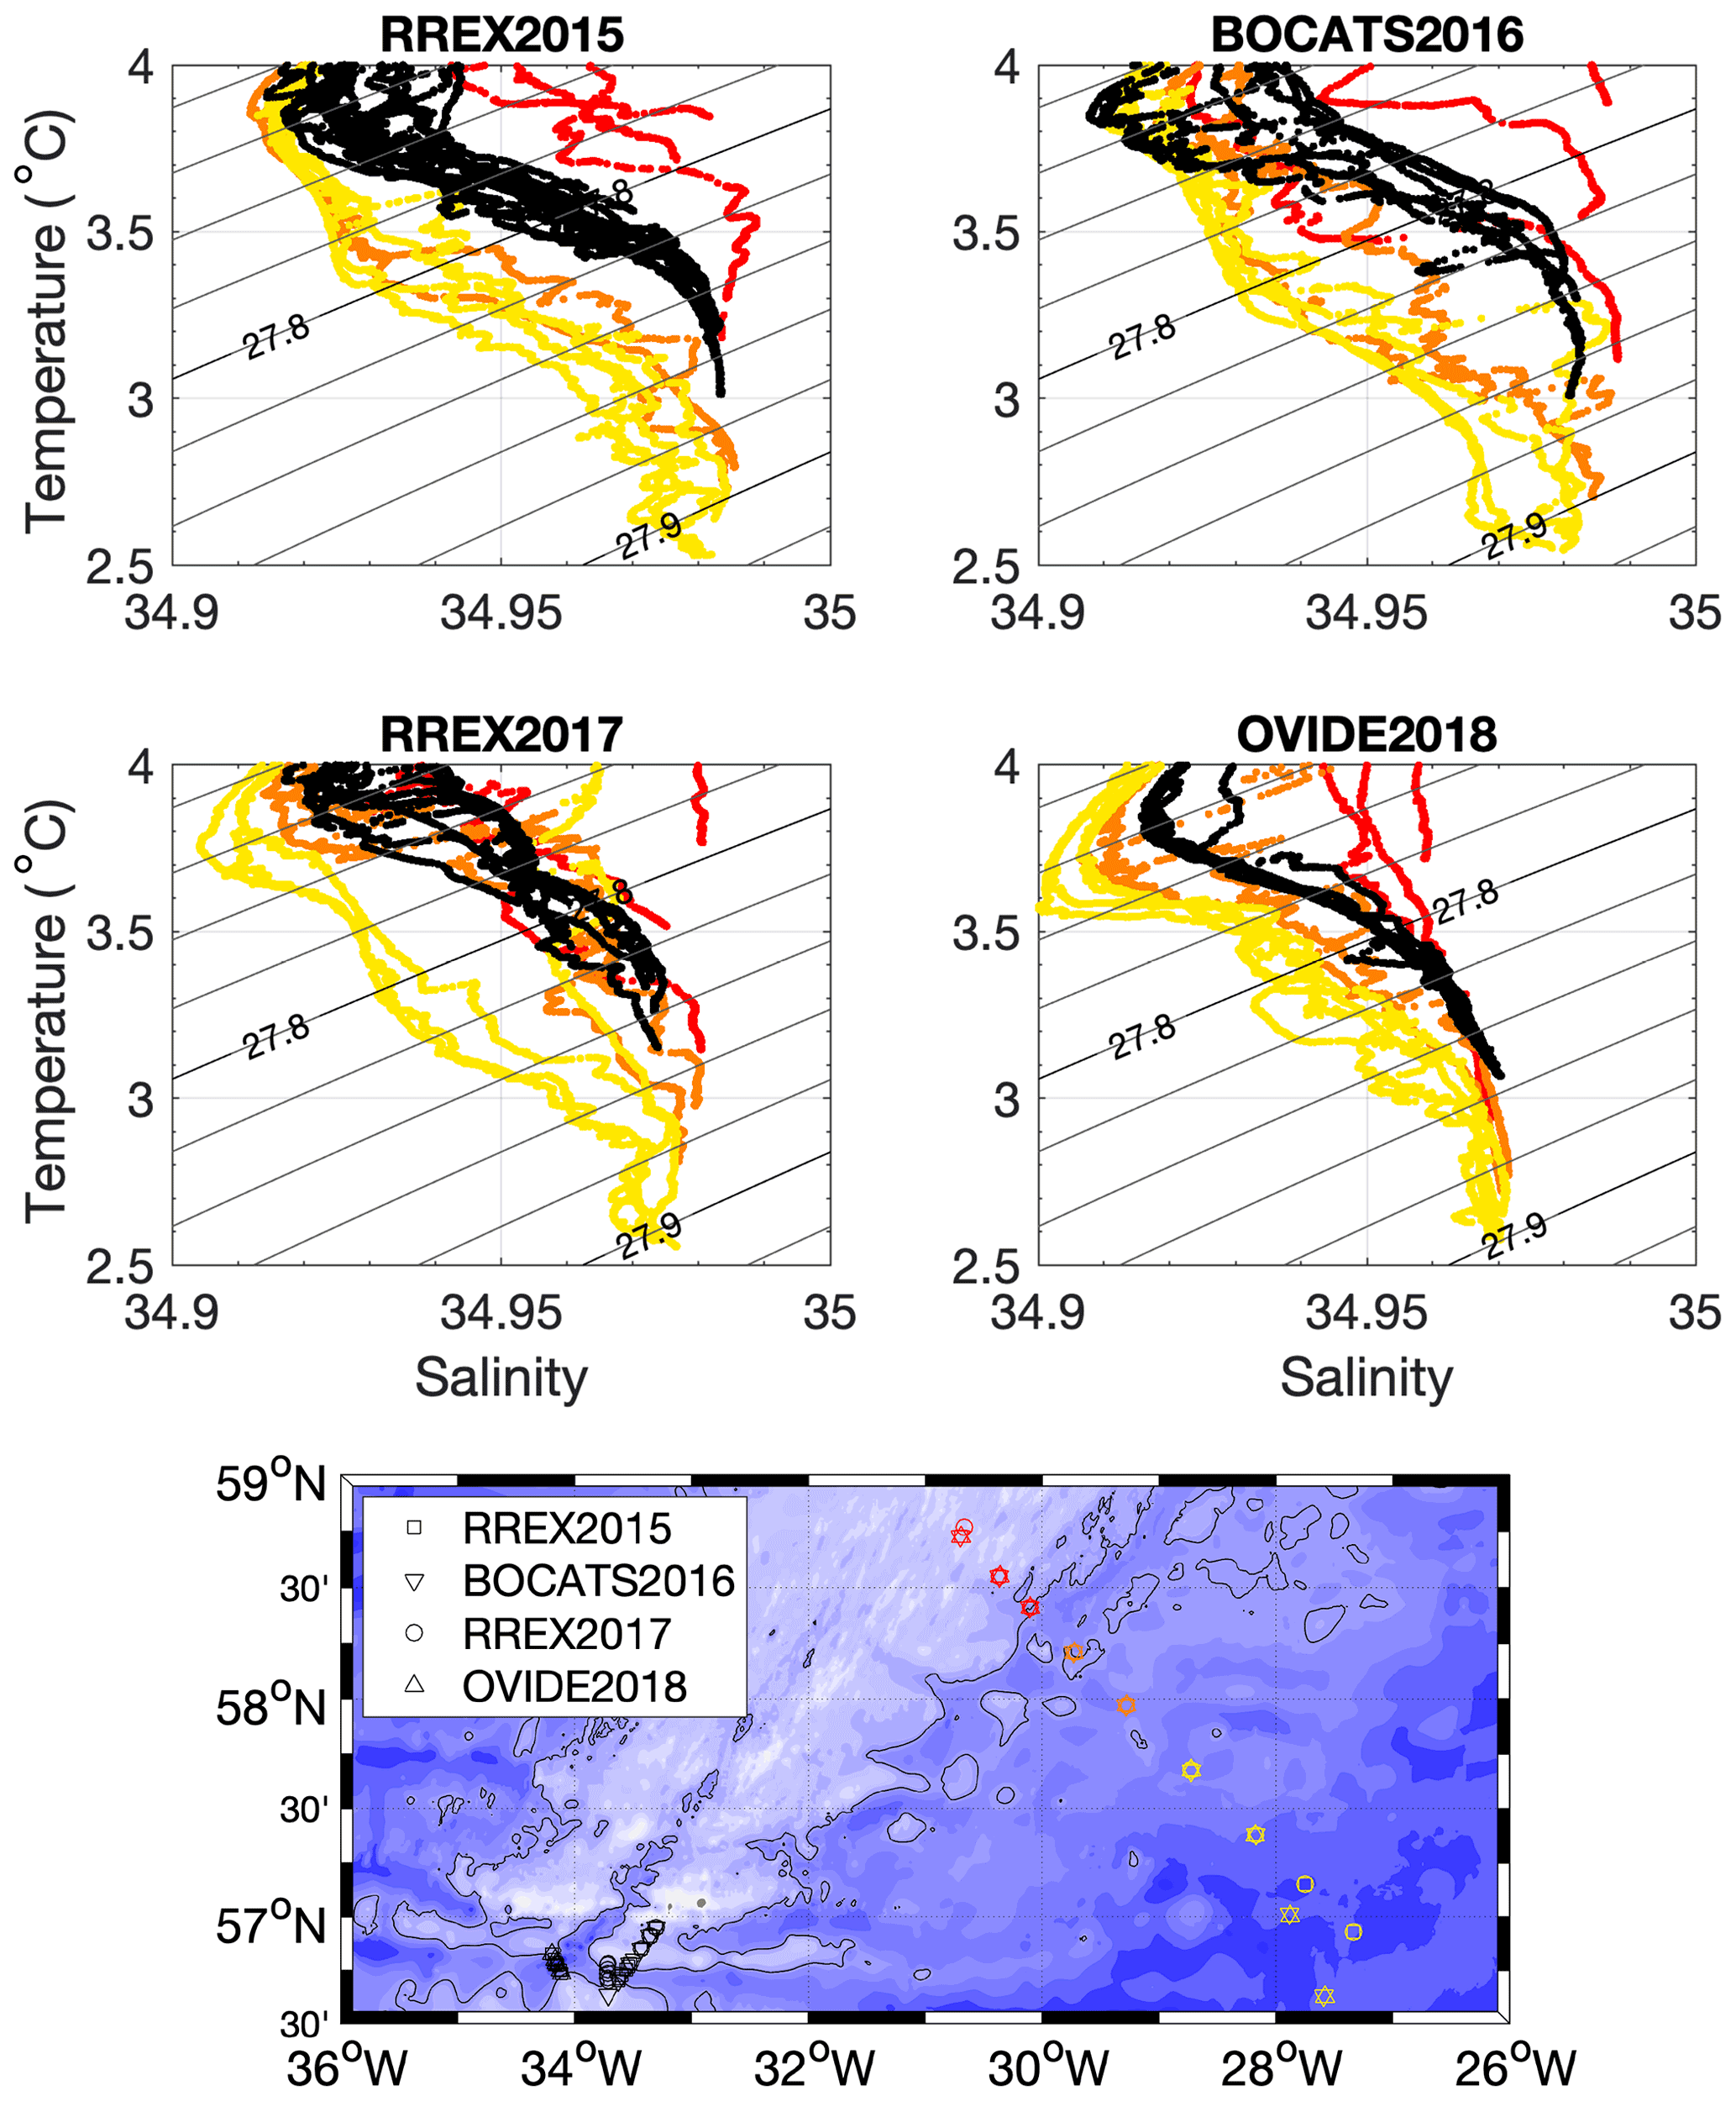
Figure 3θ–S diagram of the (color) southward along-ridge flow and (black) westward cross-ridge flow through the BFZ for each cruise indicated in the lower panel. The black line outlines the 2100 m isobath.
To better show this vertical mixing, we now consider the distribution of ISOW transport in temperature bins of 0.1 ∘C at these two sections (Fig. 4c–d). Their comparison reveals a net decrease in ISOW transport in the temperature bins 3.7 and 3.2 ∘C from the East to the Middle section. On the contrary, the ISOW transport significantly increases in the intermediate temperature bins 3.3–3.5 ∘C at the Middle section. The temperature range of the ISOW layer is thus reduced by 0.3 ∘C during its transit through the BFZ, with 77 % of ISOW localized within the 3.3–3.6 ∘C bins at the Middle section. These results highlight that ISOW is mainly homogenized as it flows westward in the BFZ, likely due to a vertical mixing within the ISOW layer.
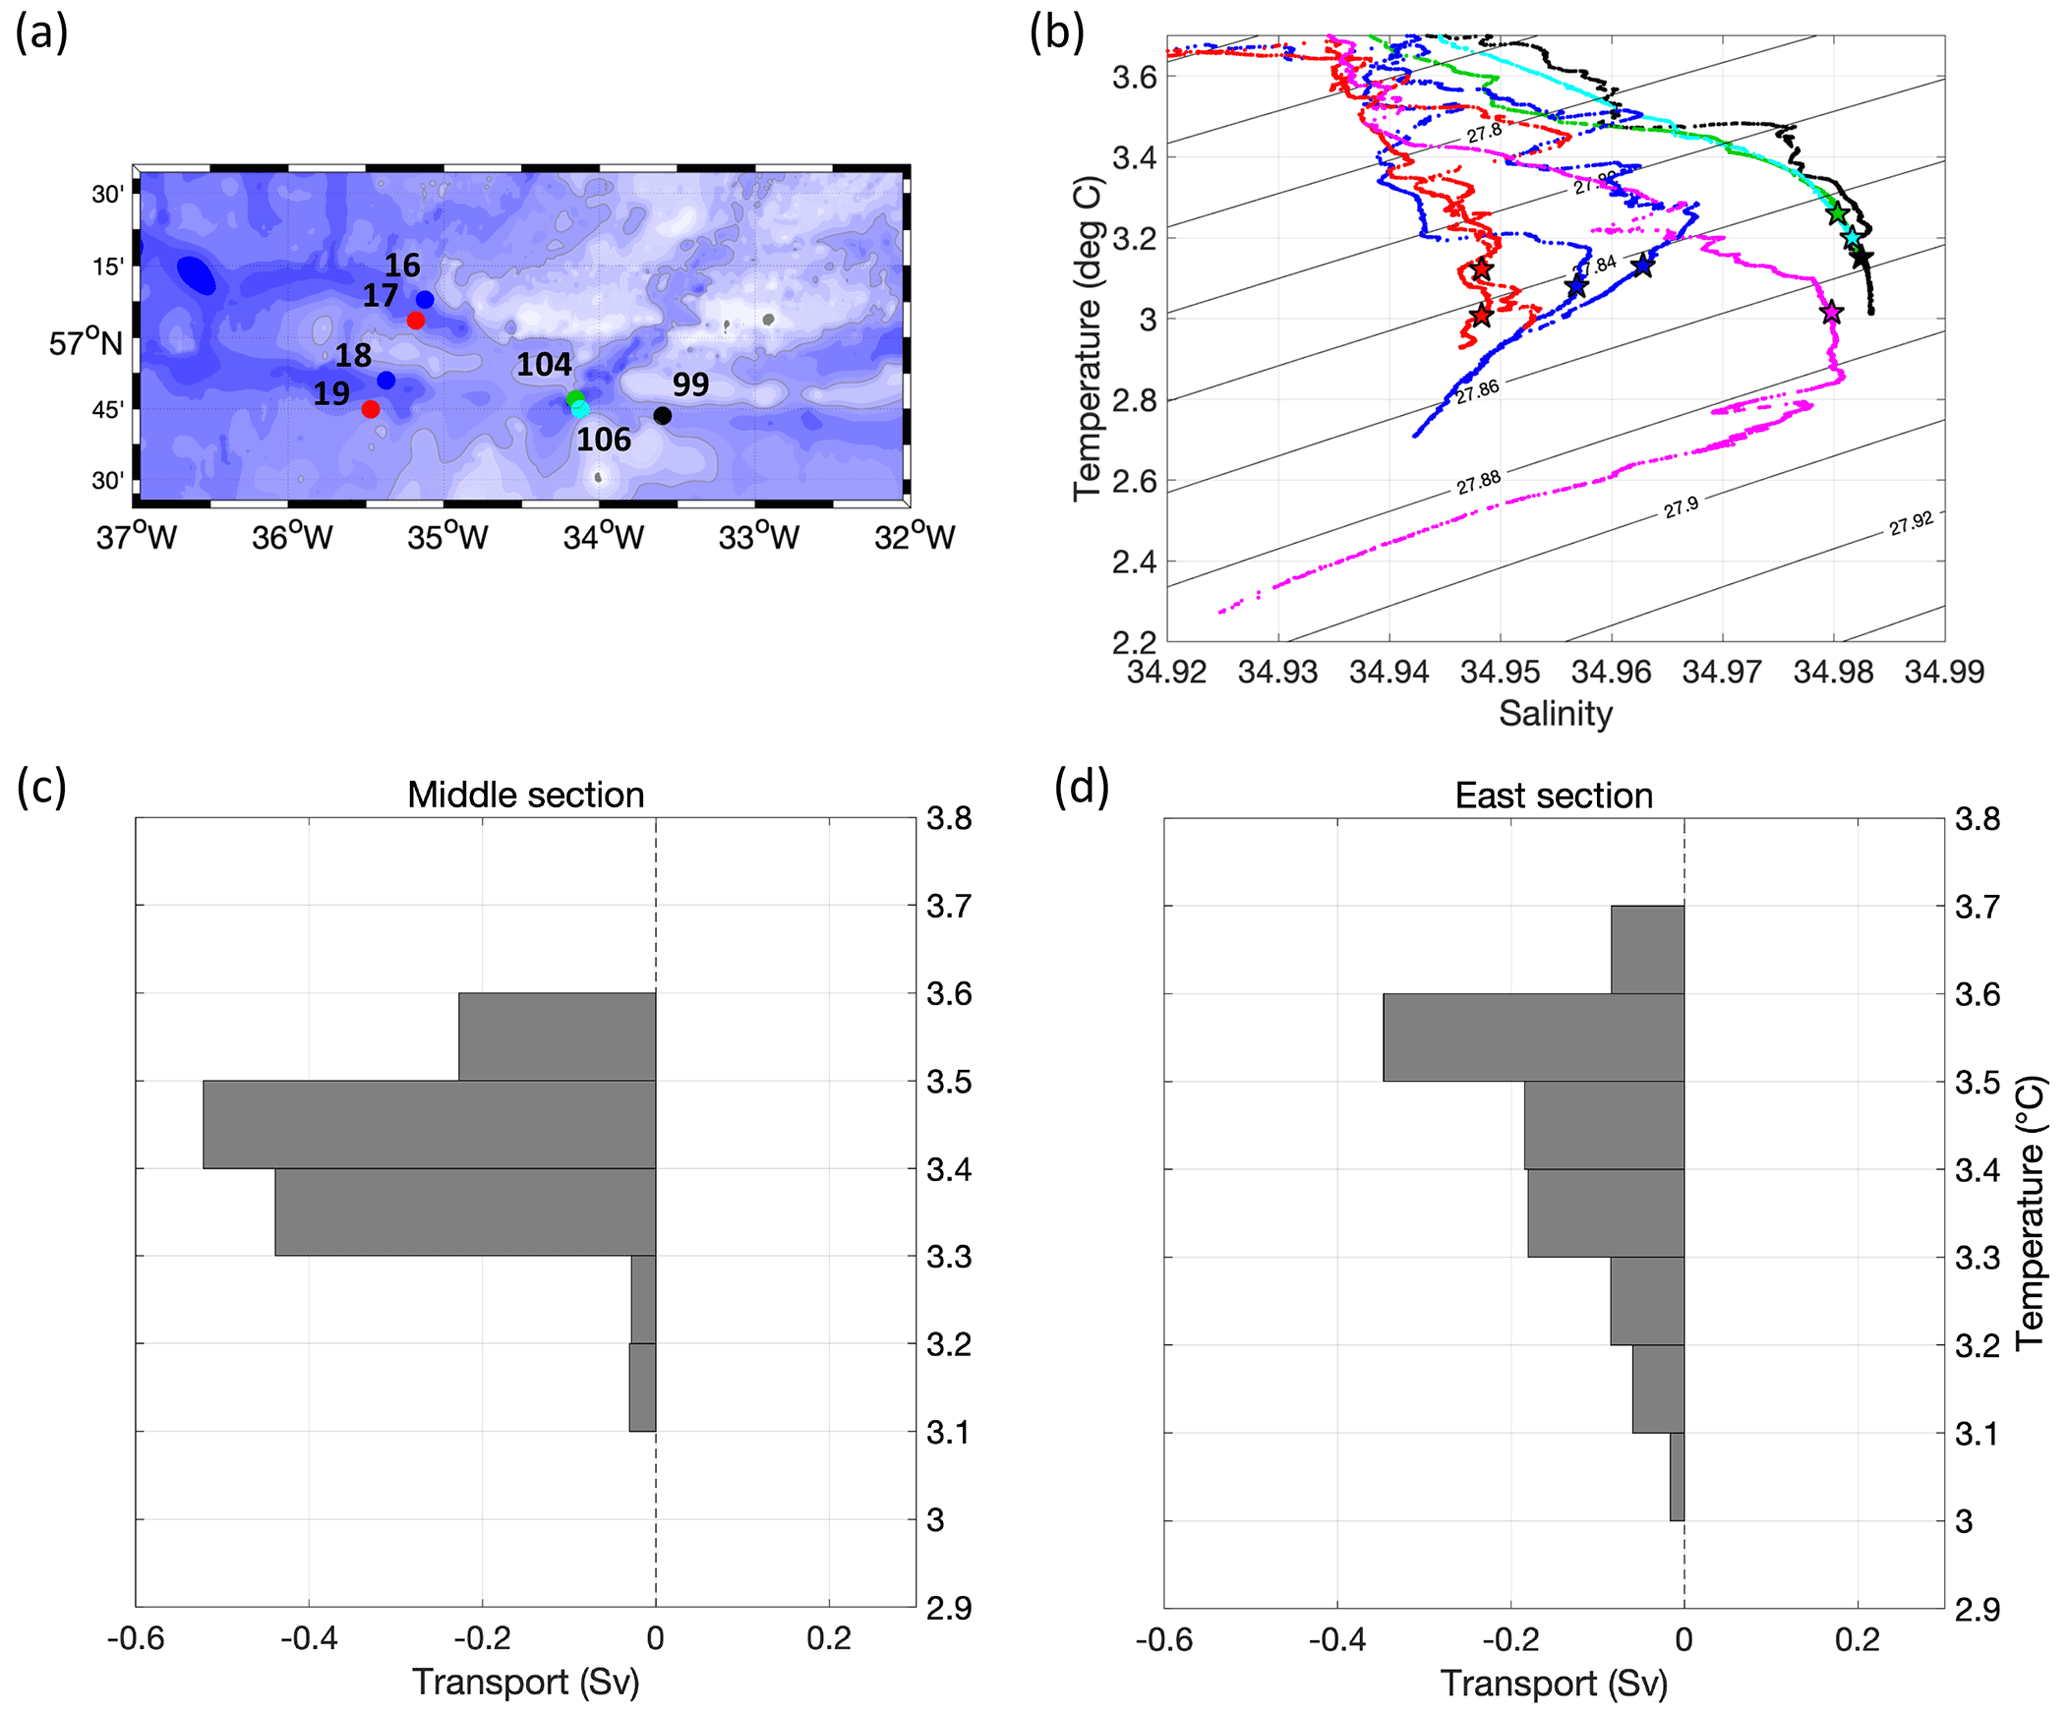
Figure 4(a, b) θ–S diagram of ISOW localized at the entrance of the BFZ (station 99 at the East section), in the rift valley (stations 104 and 106 at the Middle section) and at the exit of the BFZ (West section) for RREX15. At the West section, the northern stations of each channel are in blue (stations 16 and 18), and the southern stations are in red (stations 17 and 19). Purple dots indicate the θ–S properties of station 122 for RREX2015, which is localized in the westward core of ISOW in the CGFZ, at 52.7∘ N, 35.1∘ W (Petit et al., 2018). Each station is localized in the ISOW core of the sections. Stars indicate the 2150 m isobath for each profile, e.g., the bottom depth of the eastern sill. (c, d) Transports (Sv) cumulated in temperature bins of 0.1 ∘C and averaged at the (d) East and (c) Middle sections in 2015.
3.2 Impact of the BFZ through-flow on the hydrography of NADW
To assess the evolution of ISOW as the overflow exits the BFZ through the two western channels, we use L-ADCP profiles at the West section in 2015 and two Deep-Arvor floats deployed at the Middle section in 2018, 6902881 and 6902882. The analysis is based on L-ADCP instead of geostrophic velocities because the distance between the stations at the West section is too large to resolve the ISOW flow in these narrow channels.
The data suggest that the main exit pathway for ISOW follows the northern walls of the western channels and that incursion of dense water from the Irminger Sea follows the southern walls, leading to a mixing between NADW and ISOW from the BFZ. Indeed, the RREX15 ship-based data show that each of the western channels is composed of a westward flow along the northern walls (stations 16 and 18) and an eastward flow along the southern walls (stations 17 and 19) in the ISOW layer (Fig. 5). Accordingly, the two Deep-Arvor floats followed the northern wall of the southernmost channel when exiting the BFZ until at least 35.5∘ W (Fig. 1d). The trajectory of float 6902881 became more chaotic further west.
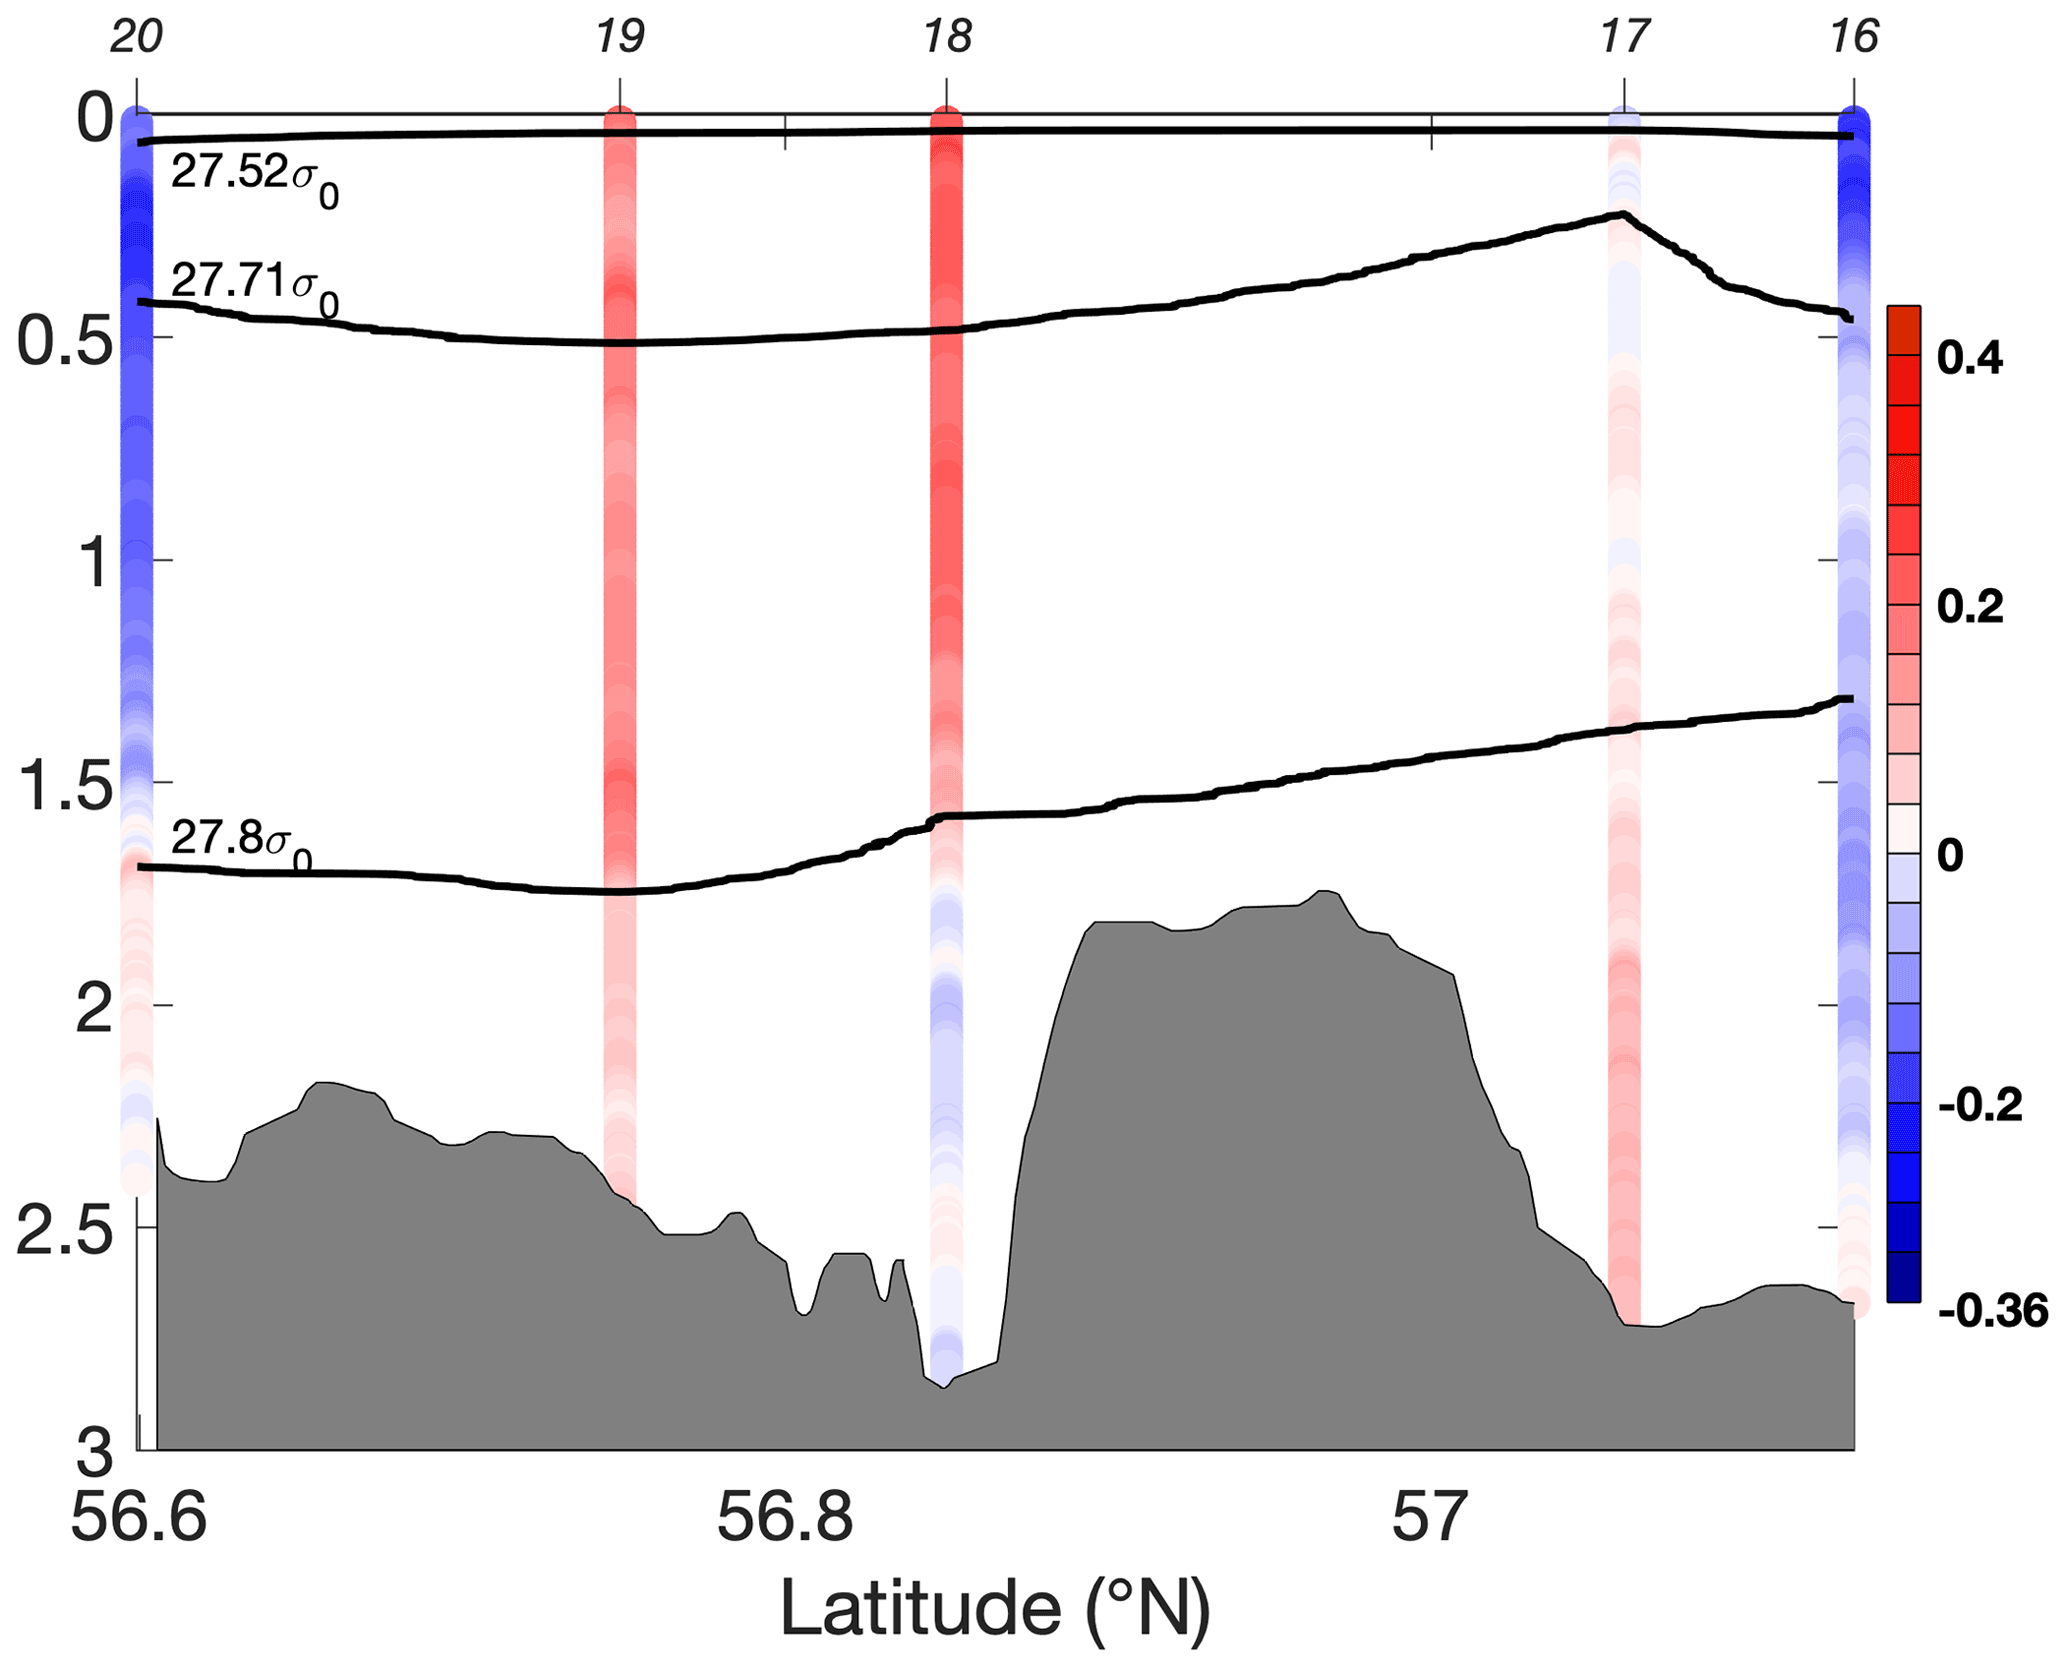
Figure 5Velocity profiles (m s−1) from L-ADCP measurements along the West section in 2015. Positive values correspond to eastward velocities. The dashed black lines indicate the potential density σ0=27.52, 27.71 and 27.8 kg m−3. Bathymetry acquired from the echo-sounder of the ship survey is added in gray. Locations of the hydrographic stations are indicated on the top axis.
Both the Deep-Arvor floats and the RREX15 ship-based data reveal that ISOW is colder and fresher in the western channels than in the rift valley (Figs. 4b and 6c–d). The RREX15 data additionally show that, for density lighter than σ0 < 27.855 kg m−3, the θ–S properties found along the northern walls of the channels are at intermediate positions between those in the BFZ and those observed along the southern walls of the channels. This suggests that ISOW exiting the BFZ along the northern walls of the channels is isopycnally mixed with colder and fresher NADW circulating in the Irminger Sea. The lower part of the layer (σ0 > 27.855 kg m−3) is fresher along the northern walls than in the upper part. This lower part of the layer cannot be renewed by BFZ through-flow, whose density is lower than 27.855 kg m−3, and must be mainly fed by denser NADW. The ISOW layer at the exit of the BFZ is thus a superposition of dense waters of different origins: the upper part results from the mixing of BFZ through-flow with fresher and colder NADW, while the lower part is mainly composed of dense NADW flowing in the Irminger Sea. Interestingly, the superposition of these dense waters creates a maximum in salinity at 27.83 kg m−3 (Figs. 4b and 6d), which was not observed at the upstream sills.
The Deep-Arvor floats then spread in the Irminger Sea and mix with surrounding water masses along their pathways. The two floats followed similar pathways in an interval of several weeks: heading toward the tip of Greenland and being abruptly diverted northeastward to join the Irminger Current (Fig. 6a–b). However, upon reaching ∼ 39∘ W at the exit of the BFZ, the float 6902882 first headed southward along the Reykjanes Ridge until 54∘ N and then turned back northward until 58∘ N. The southward spreading of this float along the western flank of the Reykjanes Ridge provides an opportunity to investigate the influence of the BFZ through-flow on the NADW properties flowing northward. More precisely, we now compare the θ–S properties of ISOW at the western exit of the BFZ with those in the vicinity of the CGFZ.
The RREX15 ship-based data show that the westward core of ISOW reaches a maximum in salinity at 27.88 kg m−3 at the CGFZ, while the maximum in salinity observed in the western channels of the BFZ is at 27.83 kg m−3 (Fig. 4b). The difference in density for the ISOW core between the two fracture zones is confirmed by the along-track properties of the float 6902882 (Fig. 6d–e). The core of ISOW is eroded toward lower densities as the float leaves the vicinity of the CGFZ to reach BFZ latitudes (Fig. 6e–f). North of the BFZ, the maximum in salinity is observed at lower densities (27.81 kg m−3), and the lower part of the layer (σ0 > 27.855 kg m−3) forms a mixing line between ISOW at 2.8 ∘C/34.94 and DSOW at 1.5 ∘C/34.9. The inflow of DSOW is possibly sourced by the recirculation evidenced by the two floats in the vicinity of Greenland. Hence, the limited northward erosion of the ISOW core reveals the key role of the BFZ through-flow in maintaining a maximum in salinity for the ISOW layer at these latitudes.
A combination of new and insightful datasets allows us to investigate the role of the BFZ as a new source of ISOW for the NADW spreading in the Irminger Sea. We first document ISOW pathways within the BFZ and its hydrographic evolution by analyzing data from hydrographic sections and three Deep-Arvor floats deployed at specific locations through the BFZ between 2015 and 2018. From east to west, the hydrographic sections were acquired at the eastern sill of the BFZ, within the rift valley and through western channels at the exit of the BFZ. This combination of observational datasets reveals that the BFZ is mainly fed by the lighter part of the ISOW layer flowing west of 29–30∘ W near 58∘ N, as part of the western and middle branches of the East Reykjanes Ridge Current in the Iceland Basin (Daniault et al., 2016; Xu et al., 2010 ; Petit et al., 2019). ISOW is then channeled in the BFZ by the narrow and deep bathymetry of its eastern sill with an averaged ISOW transport of 0.6 ± 0.2 Sv in 2015 and 2017.
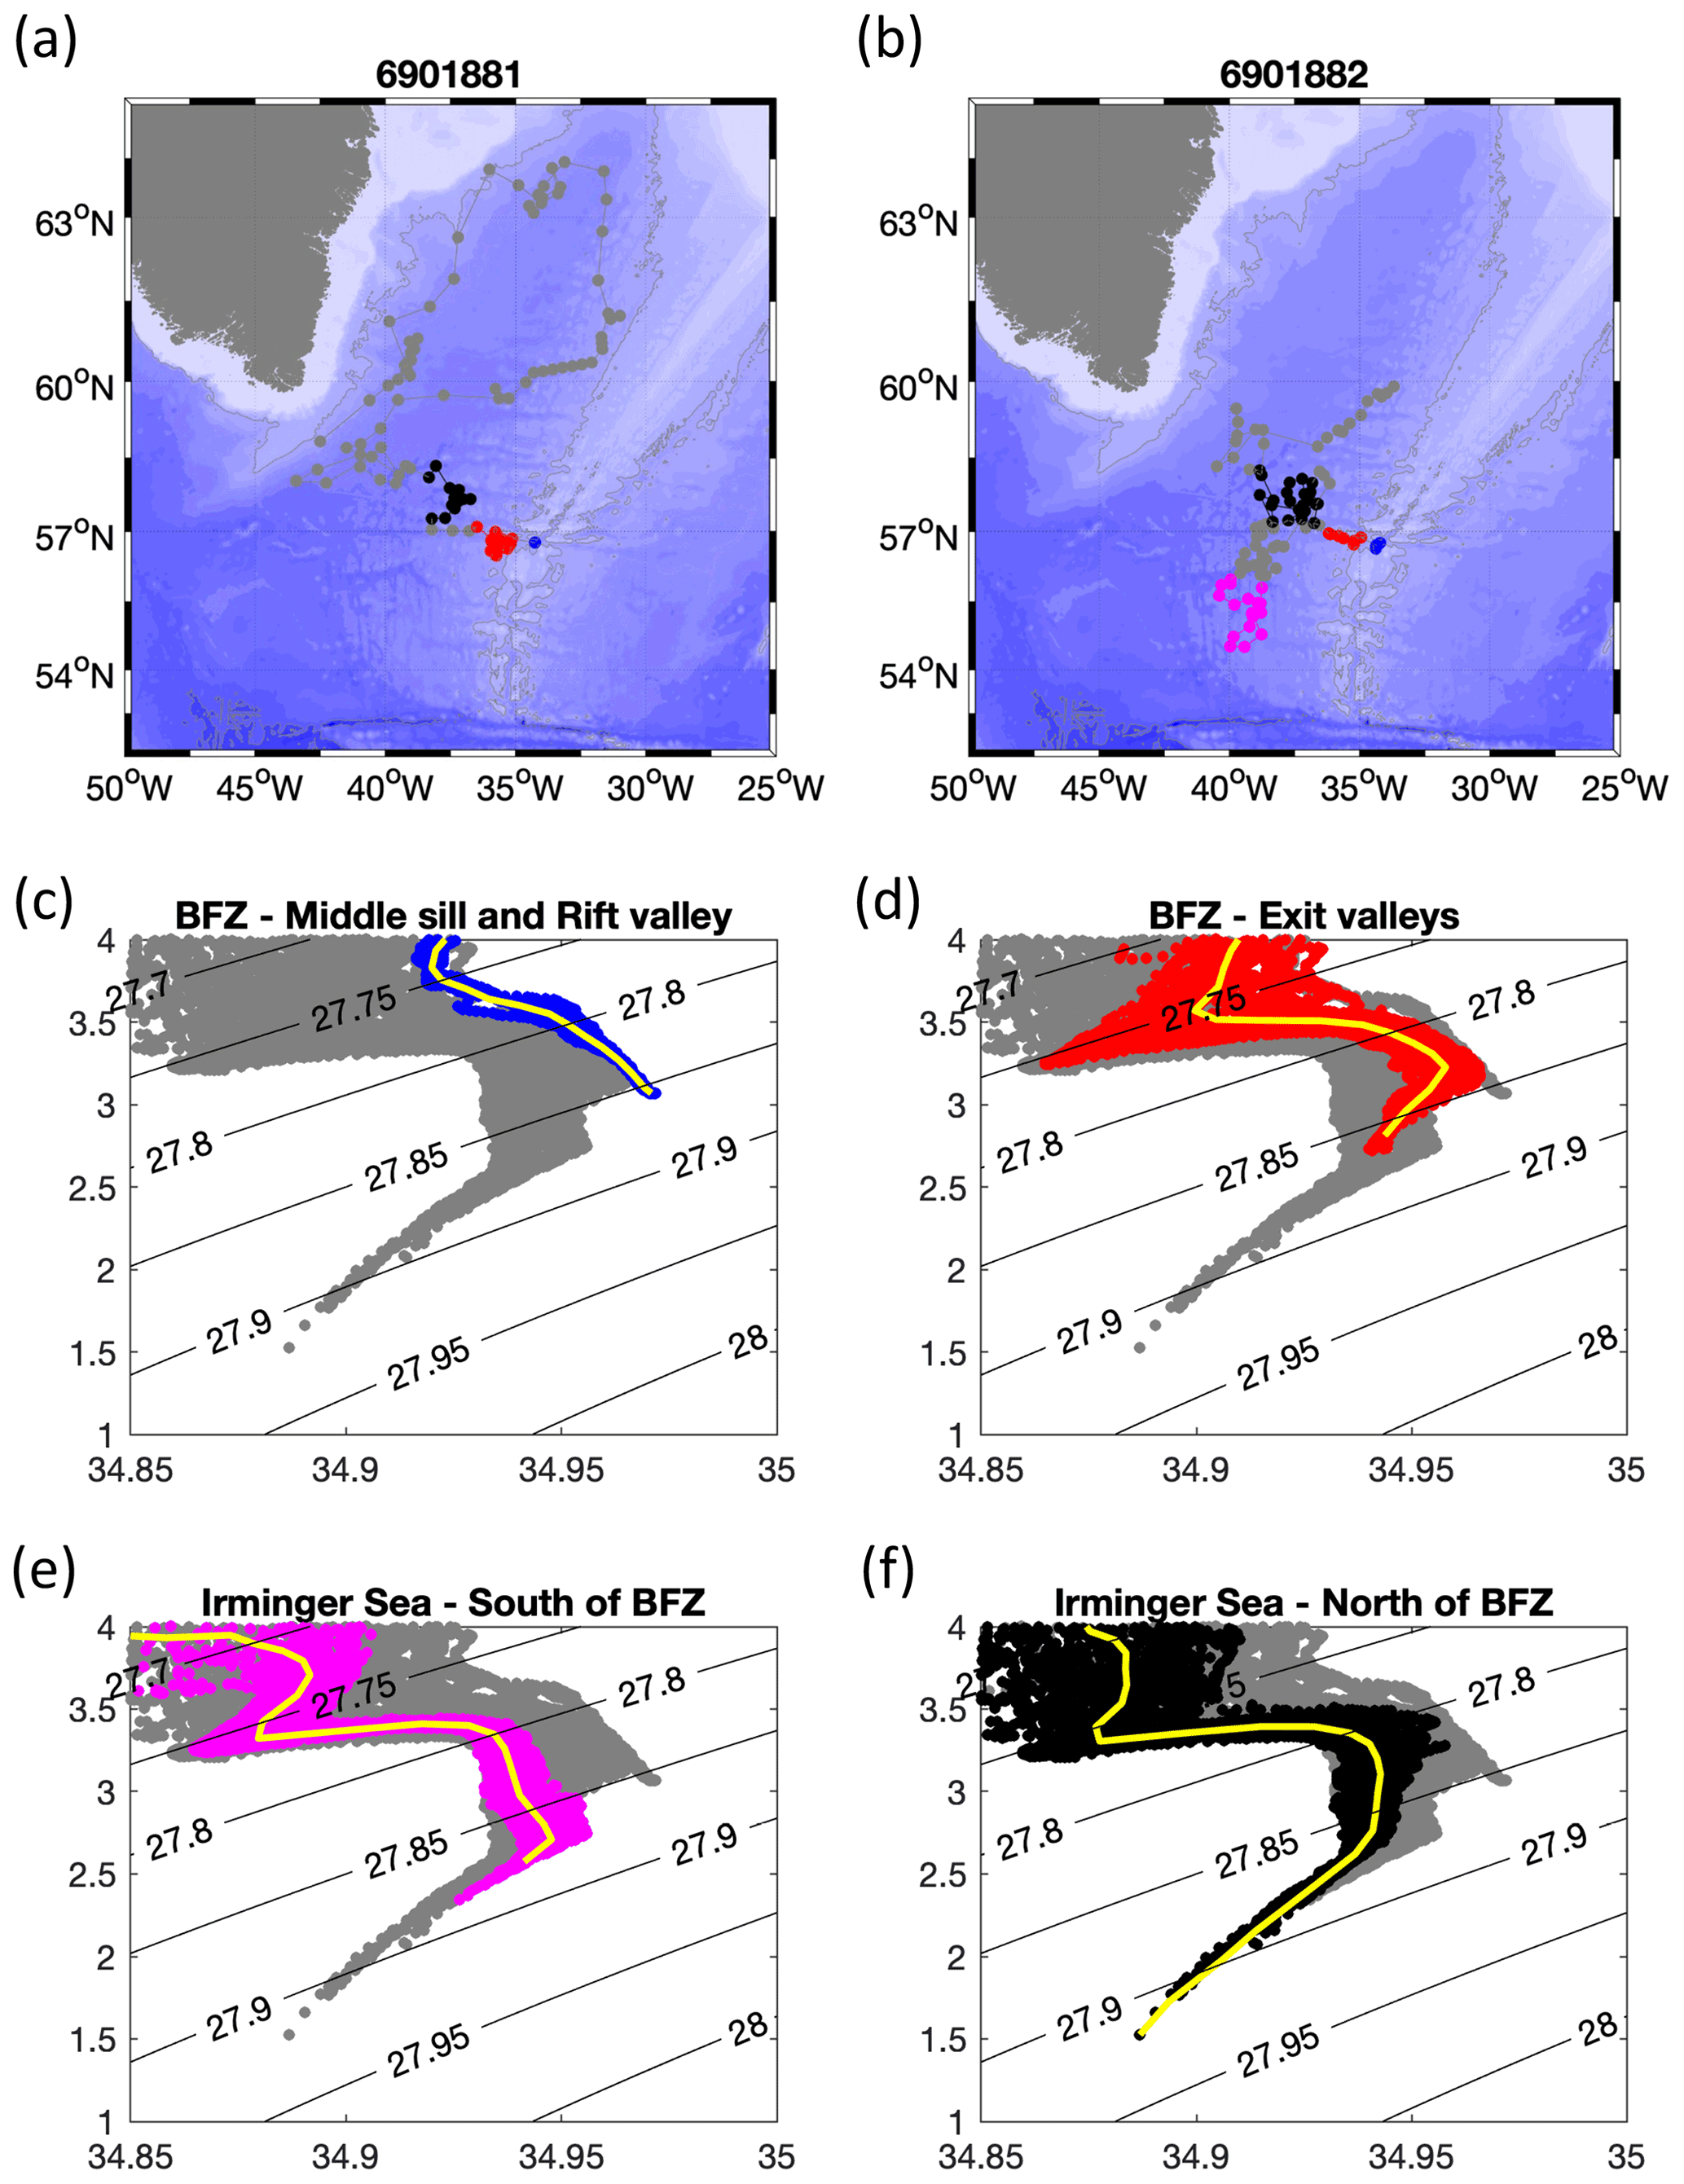
Figure 6(a–b) Trajectories of Deep-Arvor floats 6902881 and 6902882 from the Middle section with dots locating profiles distant of 10 d. (c–f) Associated θ–S profiles for the ISOW density range. Colors in θ–S plots refer to the location of the profiles in panels (a)–(b), from the interior of the BFZ (blue dots) to the interior of the Irminger Sea north of the BFZ (black dots). In yellow are the averaged properties of the colored profiles.
Once in the rift valley, the circulation within the ISOW layer is cyclonic with an averaged transport of 0.8 ± 0.2 Sv. The difference in ISOW transport between the East and the Middle sections in 2015 suggests that additional deep inflows (< 1 Sv) could join the rift valley from shallower valleys north of the main eastern sill. This is further confirmed by the ISOW transports of −0.3 ± 0.1 Sv in 2015 and −0.5 ± 0.1 Sv in 2016 estimated in a valley immediately north of the eastern sill (56.85–56.95∘ N) and sampled during RREX15 and BOCATS16 (Fig. 1b–c).
The cyclonic circulation of ISOW in the rift valley is associated with a strong homogenization of the ISOW layer, which highlights a vertical mixing within the layer. This vertical mixing is possibly due to a downslope acceleration of the bottom flow, downstream of the eastern sill, which induces instabilities and mixing.
We note that the coldest core of ISOW is localized along the left-hand side (e.g., southern wall) of the westward current in the rift valley and is associated with an inversion of the isopycnal slopes below ∼ 1500 m. Frey et al. (2019) found similar inversions through various fracture zones in the Atlantic and explained these structures by bottom friction. The bottom Ekman flux modifies the structure of the flow across the channel and displaces the coldest core of the overflow along the left-hand side of the current in the Northern Hemisphere.
Before joining the Irminger Sea, ISOW exits the BFZ along the northern walls of two channels localized downstream of the western sill. There, the BFZ through-flow encounters fresher and colder NADW circulating in the Irminger Sea. The associated mixing between these water masses induces a strong freshening of the BFZ through-flow in the upper part of the layer but not in its lower part, which is mainly composed of dense NADW flowing in the Irminger Sea. The superposition of these dense waters creates a maximum in salinity at 27.83 kg m−3.
Previous papers highlight the role of bathymetry in the mixing of deep waters (De Lavergne et al., 2017). For instance, the densest equatorial water masses of the Romanche and Chain fracture zones were strongly modified by vertical mixing downstream of the sills (Ferron et al., 1998; Mercier et al., 1994; Mercier and Morin, 1997). Studies in the CGFZ also show the influence of North Atlantic Current in the mixing of ISOW with surrounding water masses (Bower and Furey, 2017; Racapé et al., 2019). At the BFZ, our analysis suggests that another mechanism is in place downstream of the western sill. Indeed, we observe a strong mixing between ISOW and NADW of different origins within the western channels of the BFZ, but this mixing does not reach the bottom.
The impact of the BFZ through-flow on the NADW properties flowing in the Irminger Current is then investigated by comparing the properties of the ISOW core in the vicinity of the CGFZ and BFZ. We show that the ISOW core observed at CGFZ is eroded toward lower densities as ISOW reaches BFZ latitudes, which possibly leads to the asymmetry of the ISOW properties observed along the so-called OVIDE section (Daniault et al., 2016; Petit et al., 2019). This erosion is driven by a combination of fresh inflows from the Irminger Sea and salty outflows from the BFZ. The inflow of NADW from the interior of the Irminger Sea has been estimated to 1.4 Sv by Petit et al. (2019). It is of similar magnitude as the BFZ through-flow estimated in this study (∼ 1 Sv). Hence, our analysis highlights the key role of the BFZ through-flow in the salinification of the NADW as it flows northward along the Reykjanes Ridge and provides benchmarks for the validation of ocean models at high resolution.
Although more Deep-Arvor floats would be required to analyze the imprint of the BFZ through-flow on the evolution of NADW properties over the entire Irminger Sea, the pathways of the two Deep-Arvor floats can provide insights into the deep circulation in the Irminger Sea. The southward propagation of a Deep-Arvor float along the western flank of the Reykjanes Ridge is consistent with the southward currents observed west of the Irminger Current at OVIDE latitudes (de Jong et al., 2020; Lherminier et al., 2007; Sarafanov et al., 2012; Våge et al., 2011) and at 56.4∘ N along the Reykjanes Ridge (Petit et al., 2019). Moreover, the two floats sampled a similar circulation pattern in an interval of several weeks: they headed northwestward to reach the tip of Greenland and then got abruptly diverted northeastward into the Irminger Current. This propagation pathway agrees with previous papers showing that the Irminger Current continuously includes inflows from the western subpolar gyre (Lavender et al., 2005; Petit et al., 2019). Similarly, Racapé et al. (2019) showed that one of the Deep-Arvor floats launched at the CGFZ did not follow the well-known cyclonic circulation in the Irminger Sea but headed southwestward to reach the western boundary current near Newfoundland. An abrupt diversion close to the shelfbreak of Cape Farewell is consistent with recirculation of the East Greenland Current and Deep Western Boundary Current into the interior of the Irminger Sea at the Eirik Ridge (Fischer et al., 2018; Holliday et al., 2007; Pacini et al., 2020).
Finally, the temporal evolution of the ISOW properties that enter the BFZ can be assessed by comparing the East and Middle sections between the four cruises (Figs. 3, A1 and A2). Overall, the ISOW temperature does not show large changes from 2015 to 2018 at these two locations, while the ISOW salinity decreased by about 0.01 between 2015 and 2018. The decrease in salinity at the BFZ entrance is close to that observed at the OVIDE section. An investigation of this freshening is beyond the scope of our study, but we note that an ISOW freshening is consistent with the overall freshening of the Iceland Basin in the upper layer of the MOC (Fox et al., 2022; Holliday et al., 2020), as the upper ocean salinity anomaly propagates in the ISOW layer by entrainment along the Icelandic shelf (Devana et al., 2021).
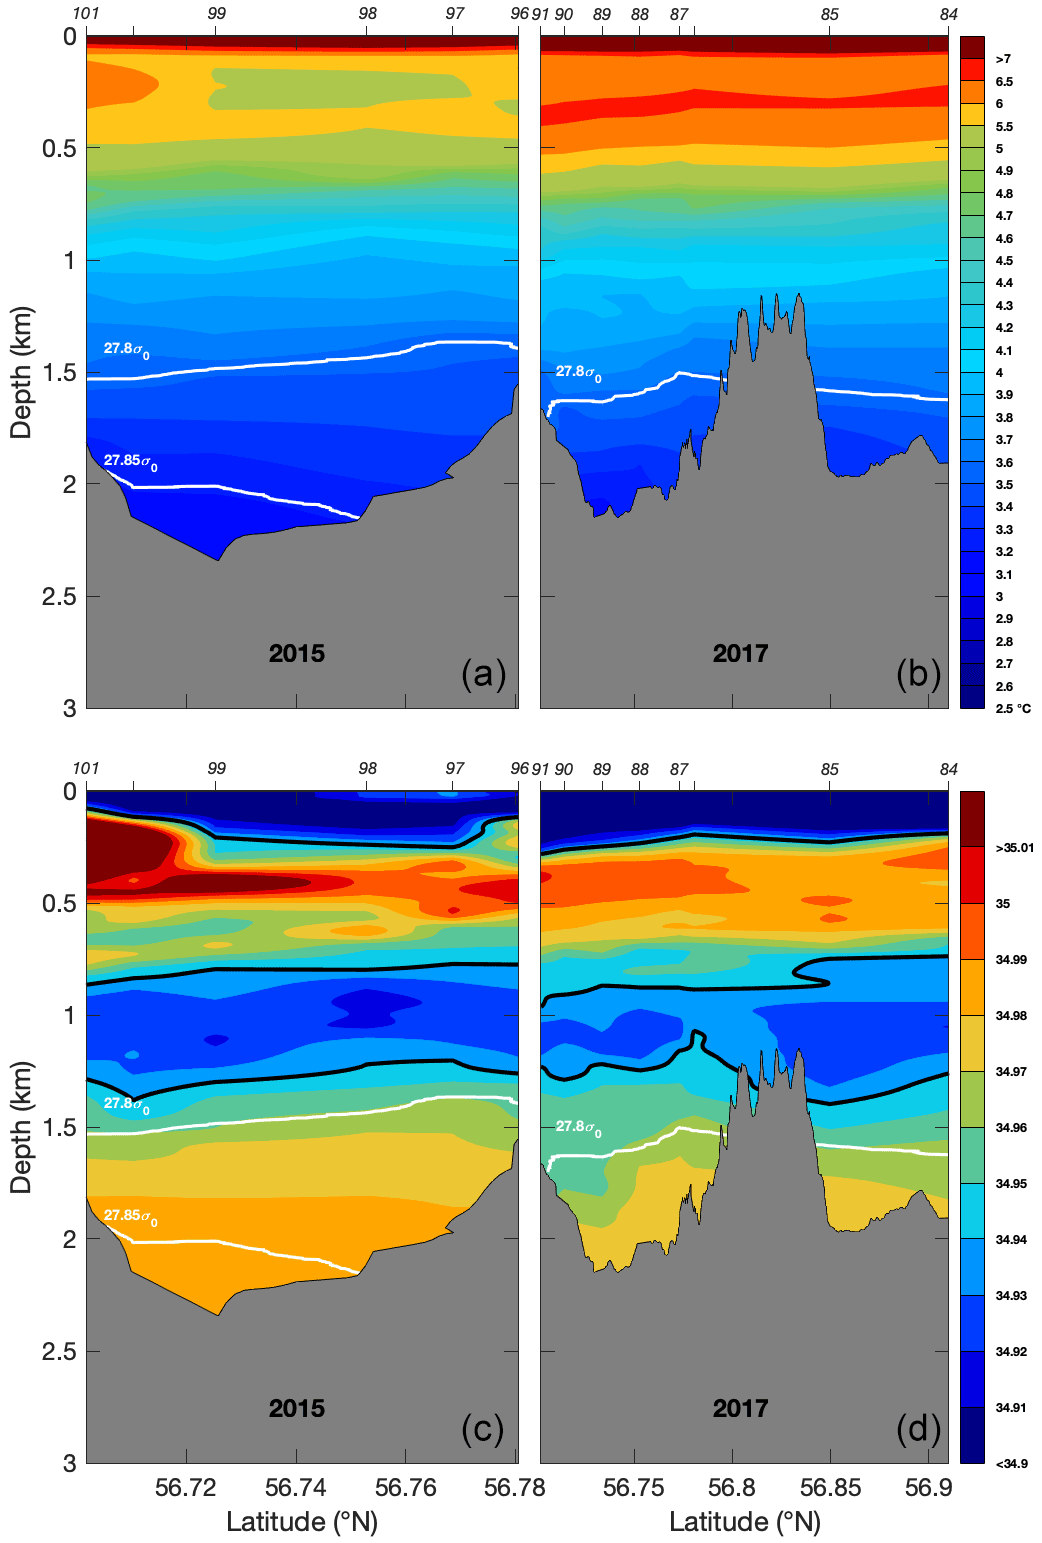
Figure A1Hydrographic sections along the East sections in 2015 and 2017 based on CTDO2 data for (a, b) potential temperature in degrees Celsius and (c, d) salinity. The bold black lines represent isohaline 34.94 for the lower panels. In all panels, the bold white lines show the potential density anomalies σ0=27.52, 27.71, 27.8 and 27.85 kg m−3. Bathymetries in gray are from the ship surveys. Locations and numbers of the hydrographic stations are indicated on the top axis.
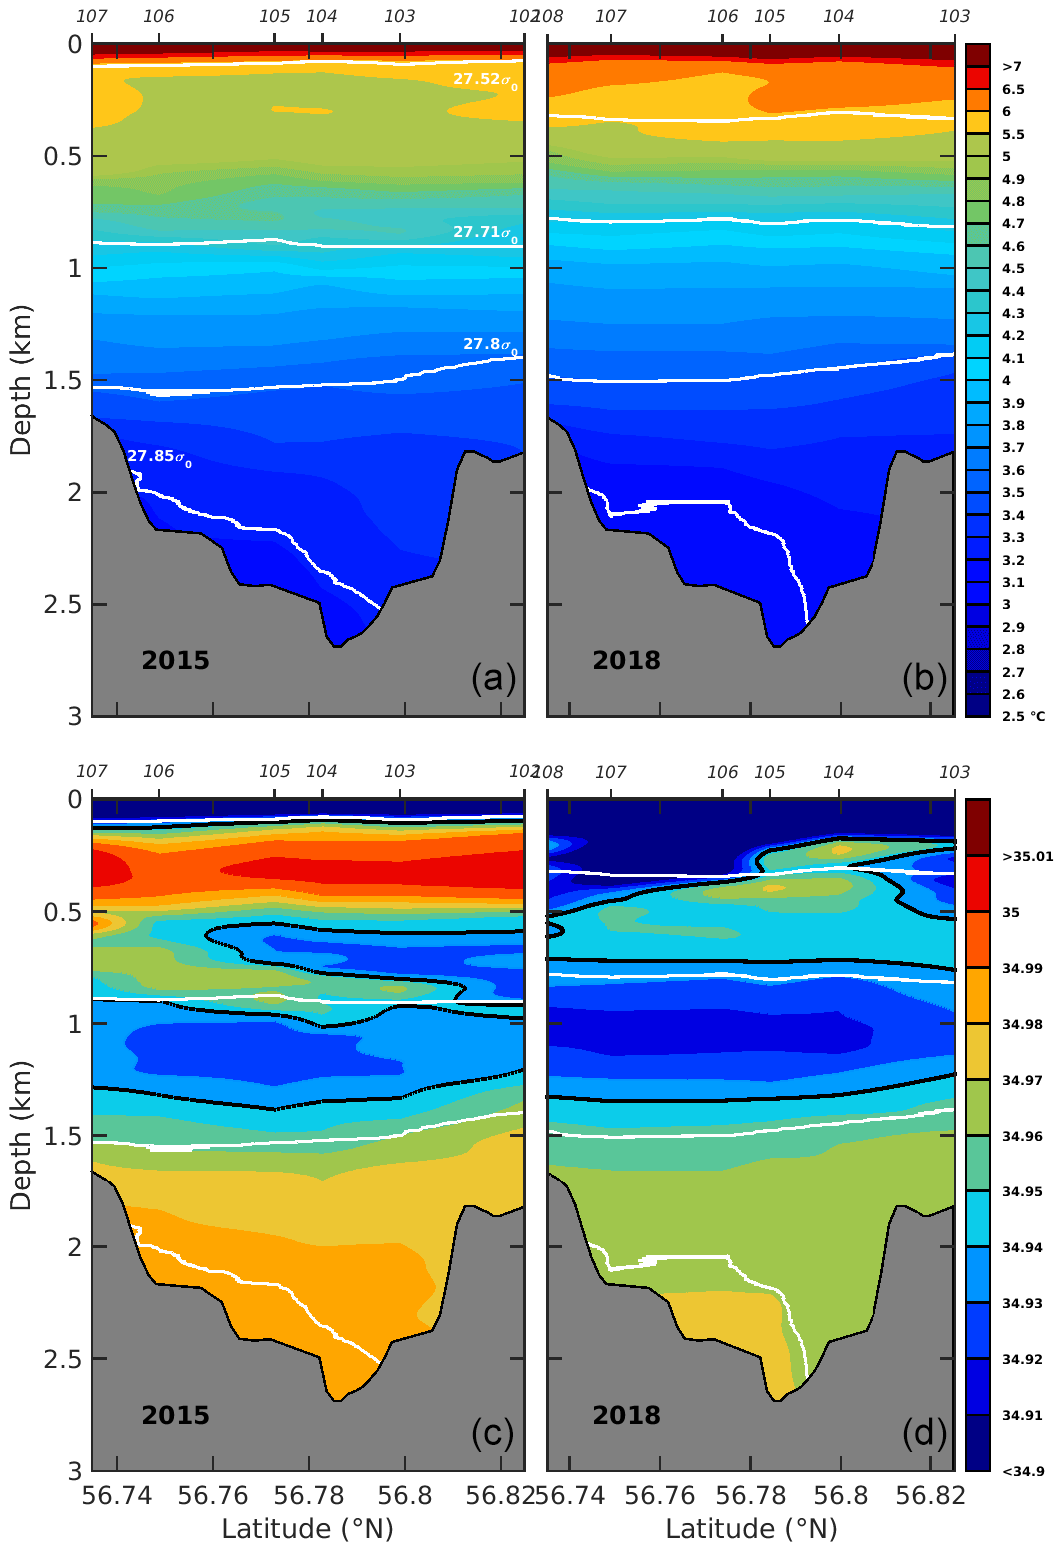
Figure A2Hydrographic sections along the Middle sections in 2015 and 2018 based on CTDO2 data for (a, b) potential temperature in degrees Celsius and (c, d) salinity. The bold black lines represent isohaline 34.94 for the lower panels. In all panels, the bold white lines show the potential density anomalies σ0=27.52, 27.71, 27.8 and 27.85 kg m−3. Bathymetry in gray is from the ship surveys. Locations of the hydrographic stations are indicated on the top axis.
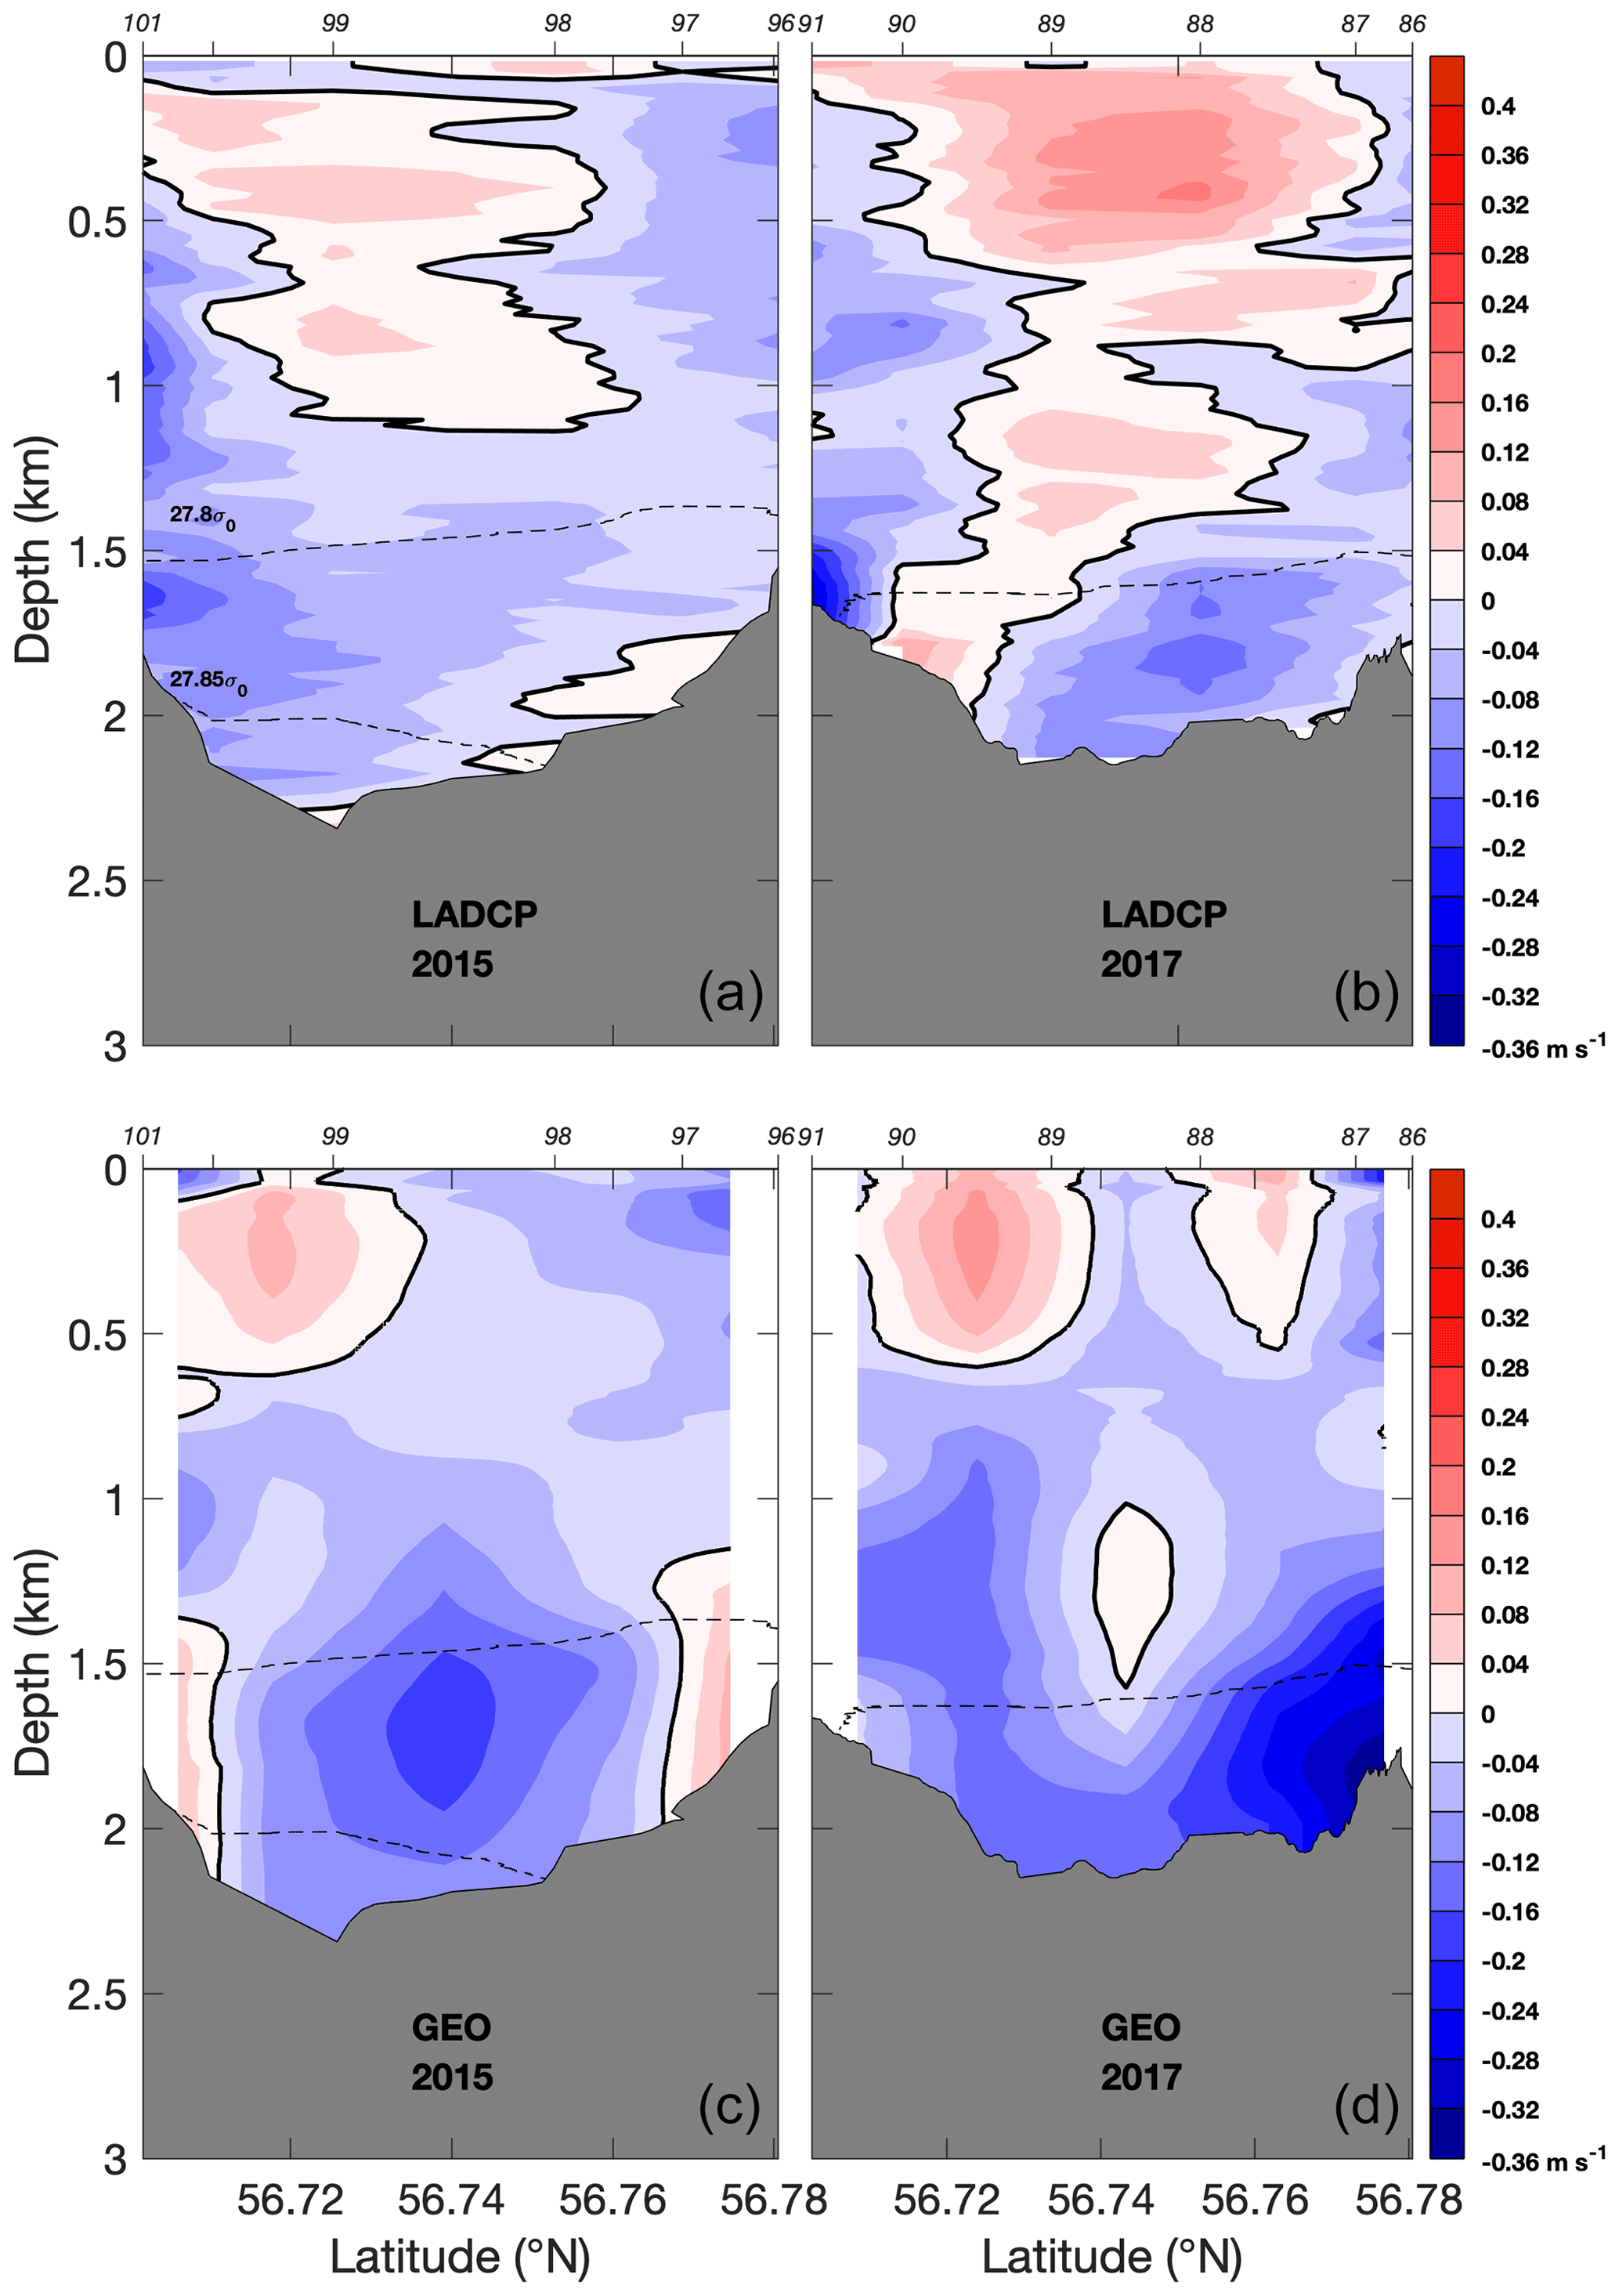
Figure A3(a, b) L-ADCP and (c, d) geostrophic velocity sections along the East sections in 2015 and 2017 (m s−1). Positive values correspond to eastward velocities. The black bold line outlines the 0 isotach. The dashed black lines indicate the potential density σ0=27.52, 27.71, 27.8 and 27.85 kg m−3. Bathymetries from the ship surveys are added in gray. Locations of the hydrographic stations are indicated on the top axis.
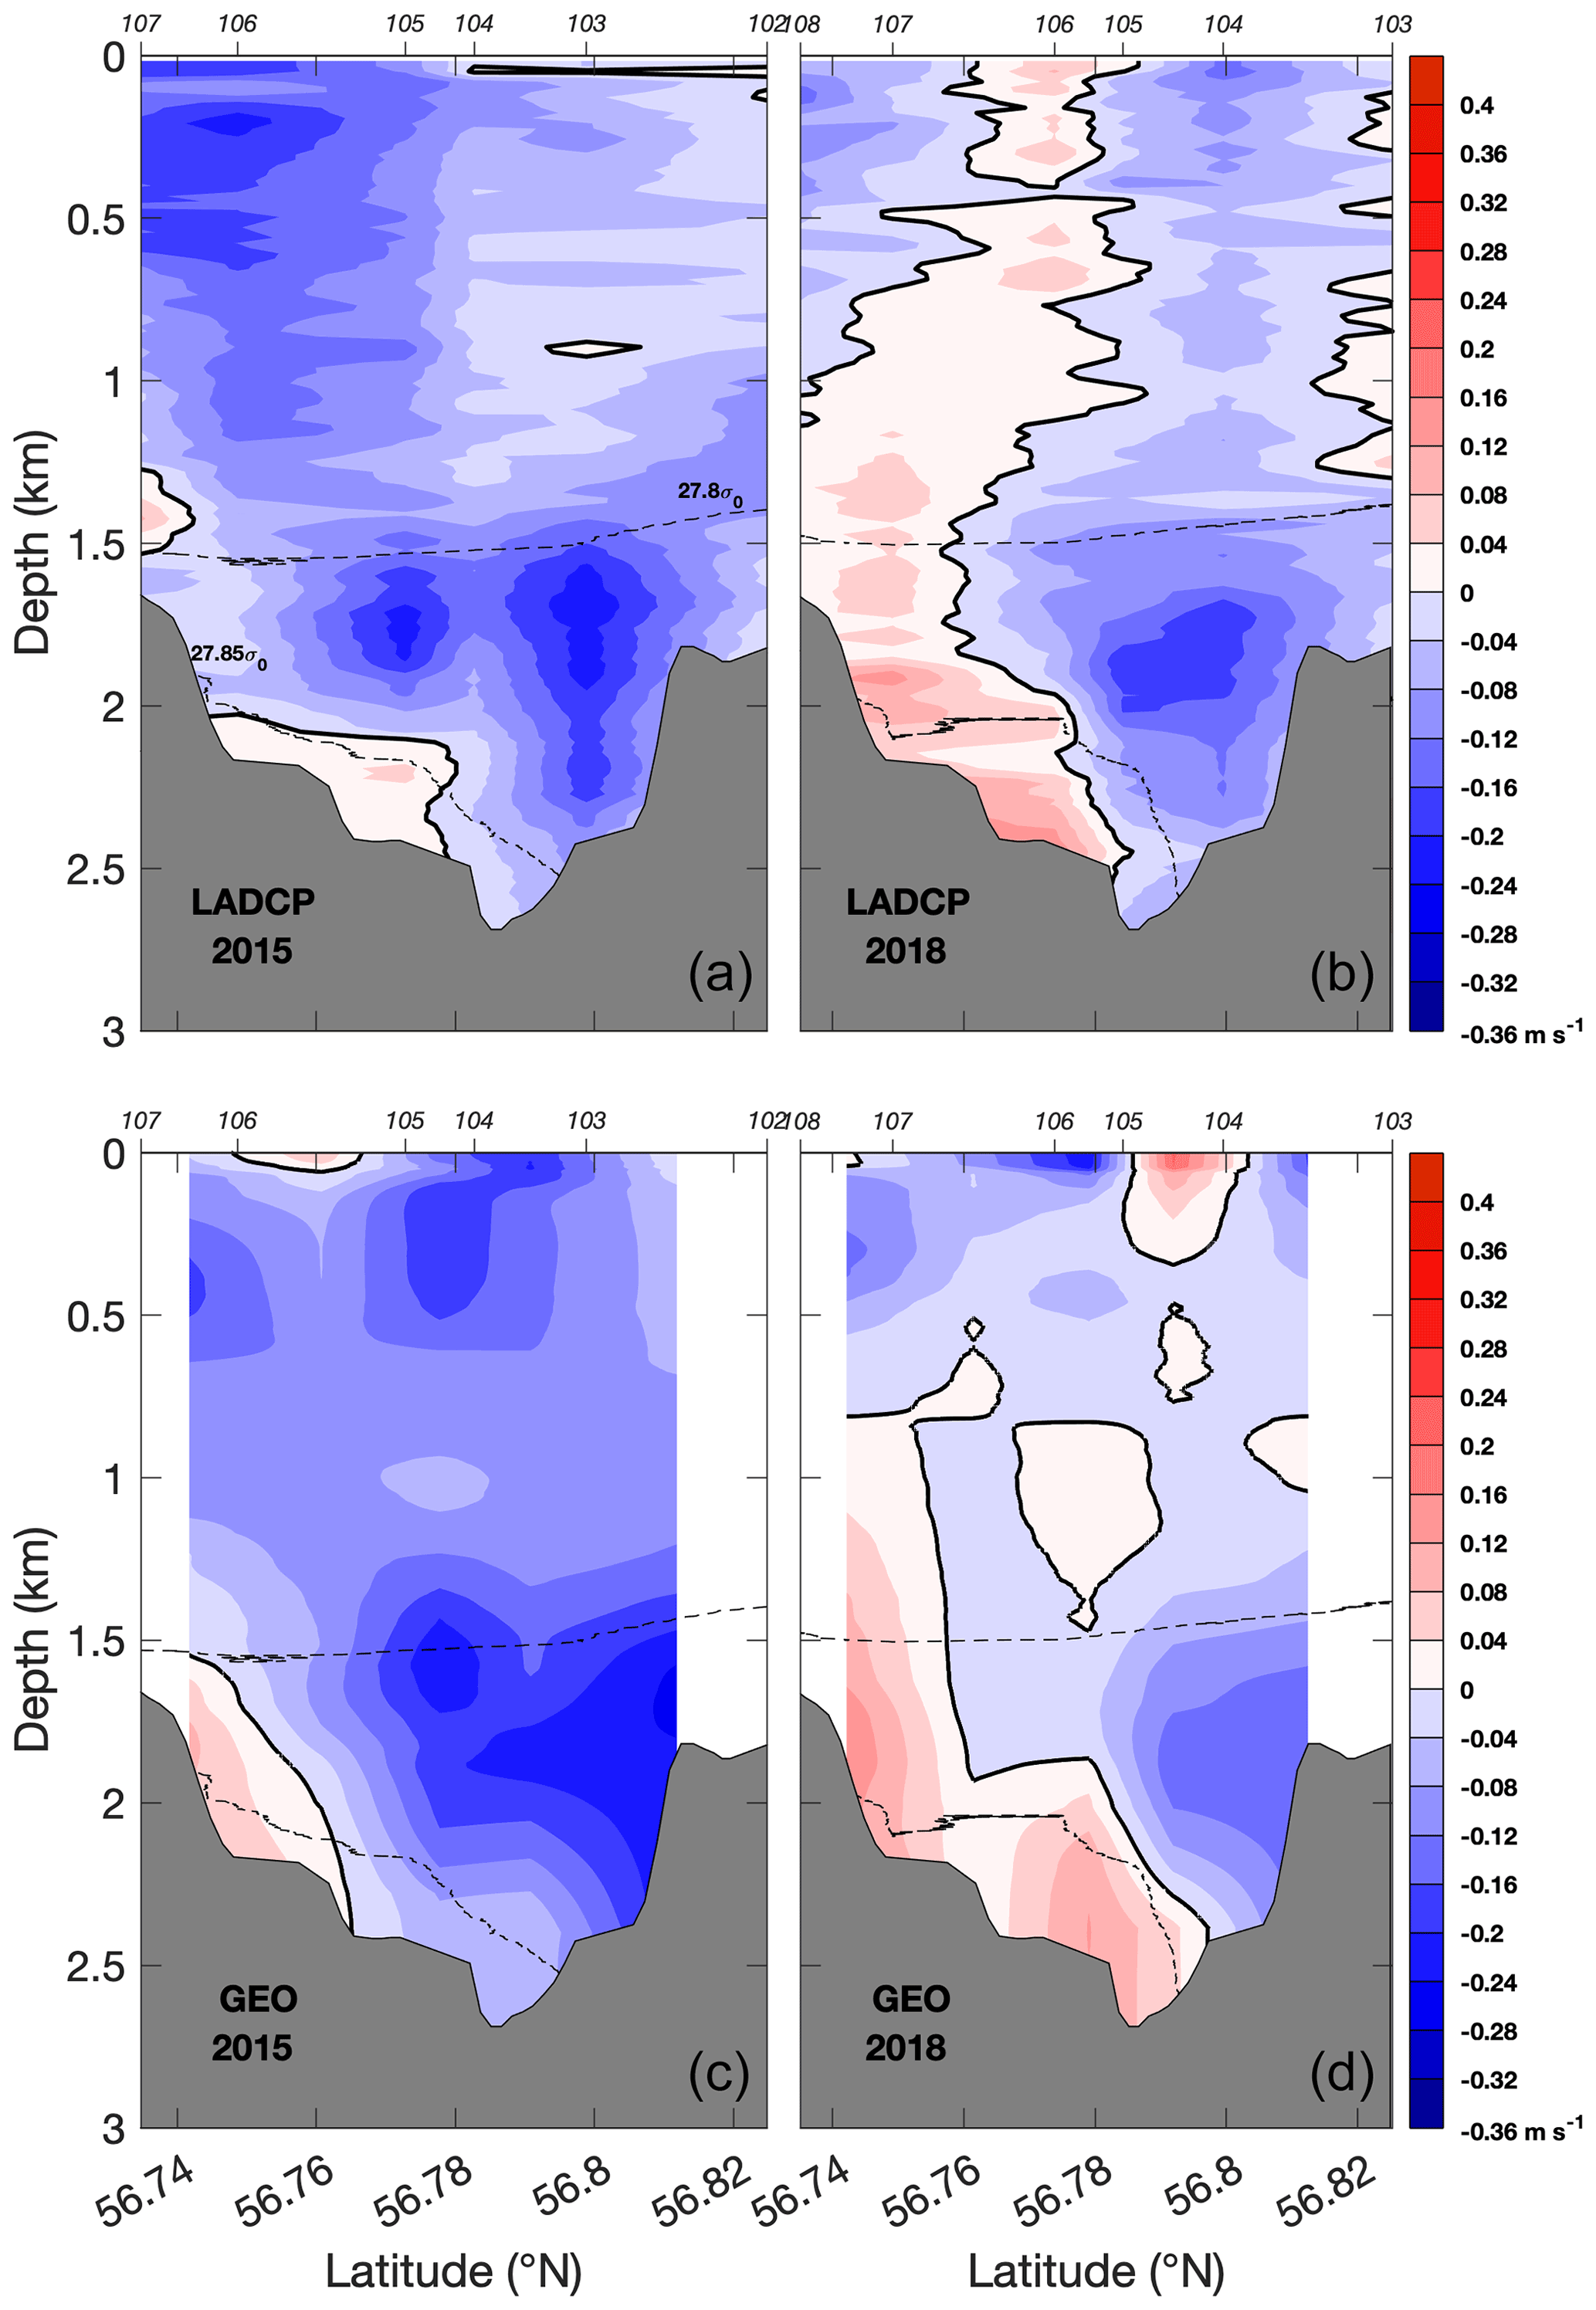
Figure A4(a, b) L-ADCP and (c, d) geostrophic velocity sections along the Middle sections in 2015 and 2018 (m s−1). Positive values correspond to eastward velocities. The black bold line outlines the 0 isotach. The dashed black lines indicate the potential density σ0=27.52, 27.71, 27.8 and 27.85 kg m−3. Bathymetries from the ship surveys are added in gray. Locations of the hydrographic stations are indicated on the top axis.
The hydrographic data obtained during the four cruises are archived online at https://doi.org/10.17882/55445 (Thierry et al., 2018) for RREX15 and RREX17, at https://digital.csic.es/handle/10261/154341, last access: 8 July 2022 (Pérez et al., 2017) for BOCATS16, and at https://doi.org/10.17882/87394 (Lherminier et al., 2022) for OVIDE18. The Deep-Arvor data of the floats used in this study are available at the Argo float data and metadata from the Global Data Assembly Centre (Argo GDAC), https://doi.org/10.17882/42182 (Argo, 2022). These data were collected and made freely available by the International Argo Program and the national programs that contribute to it (https://argo.ucsd.edu, ARGO, last access: 8 July 2022, https://www.ocean-ops.org, OceanOPS, last access: 8 July 2022). The Argo Program is part of the Global Ocean Observing System.
TP, VT and HM led the analysis and interpretation of the data. All the authors contributed to writing of the manuscript.
The contact author has declared that none of the authors has any competing interests.
Publisher’s note: Copernicus Publications remains neutral with regard to jurisdictional claims in published maps and institutional affiliations.
The authors thank all colleagues and ship crews involved in the RREX and OVIDE cruises during which the hydrography data were obtained.
This research has been supported by the French government within the framework of the “Investissements d'avenir” program managed by the Agence Nationale de la Recherche under the NAOS project (grant no. ANR-10-EQPX-40) and ARGO-2030 project (grant no. ANR-21-ESRE-0019). The OVIDE project was supported by CNRS, Ifremer, the national program LEFE (Les Enveloppes Fluides et l'Environnement) and the Spanish Ministry of Sciences and Innovation co-funded by the BOCATS2 project (grant no. PID2019-104279GB-C21) and ARIOS project (grant no. CTM2016-76146-C3-1-R).
This paper was edited by Ilker Fer and reviewed by three anonymous referees.
Argo: Argo float data and metadata from Global Data Assembly Centre (Argo GDAC), SEANOE [data set], https://doi.org/10.17882/42182, 2022.
Bower, A. and Furey, H.: Iceland-Scotland Overflow Water transport variability through the Charlie-Gibbs Fracture Zone and the impact of the North Atlantic Current, J. Geophys. Res.-Ocean., 122, 6989–7012, https://doi.org/10.1002/2017JC012698, 2017.
Bower, A. and von Appen, W.-J.: Interannual Variability in the Pathways of the North Atlantic Current over the Mid-Atlantic Ridge and the Impact of Topography, J. Phys. Oceanogr., 38, 104–120, https://doi.org/10.1175/2007JPO3686.1, 2008.
Bower, A., Le Cann, B., Rossby, T., Zenk, W., Gould, J., Speer, K., Richardson, P. L., Prater, M. D., and Zhang, H. M.: Directly measured mid-depth circulation in the northeastern North Atlantic Ocean, Nature, 419, 603–607, https://doi.org/10.1038/nature01078, 2002.
Branellec, P. and Lherminier, P.: BOCATS 2016. CTD-O2 data report, Int. Rep., LOPS/17-06, https://doi.org/10.13155/59190, 2017.
Branellec, P. and Thierry, V.: RREX 2015, CTD-02 Data report, ODE/LOPS/16-26, https://doi.org/10.13155/47156, 2016.
Branellec, P. and Thierry, V.: RREX 2017. CTD-O2 Data report, Rap. Int., LOPS/18-04, https://doi.org/10.13155/58074, 2018.
Branellec, P., Lherminier, P., Reynaud, T., and Le Bihan, C.: OVIDE 2018, CTD-O2 Data report, ODE/LOPS/19-01, https://doi.org/10.13155/86588, 2019.
Cabanes, C., Thierry, V., and Lagadec, C.: Improvement of bias detection in Argo float conductivity sensors and its application in the North Atlantic, Deep-Sea Res. Pt. I, 114, 128–136, https://doi.org/10.1016/j.dsr.2016.05.007, 2016.
Daniault, N., Mercier, H., Lherminier, P., Sarafanov, A., Falina, A., Zunino, P., Pérez, F. F., Ríos, A. F., Ferron, B., Huck, T., Thierry, V., and Gladyshev, S.: The northern North Atlantic Ocean mean circulation in the early 21st century, Prog. Oceanogr., 146, 142–158,. https://doi.org/10.1016/j.pocean.2016.06.007, 2016.
de Jong, M. F., de Steur, L., Fried, N., Bol, R., and Kritsotalakis, S.: Year-Round Measurements of the Irminger Current: Variability of a Two-Core Current System Observed in 2014–2016, J. Geophys. Res.-Ocean., 125, 10, https://doi.org/10.1029/2020JC016193, 2020.
De Lavergne, C., Madec, G., Roquet, F., Holmes, R. M., and McDougall, T. J.: Abyssal ocean overturning shaped by seafloor distribution, Nature, 551, 181–186, https://doi.org/10.1038/nature24472, 2017.
Devana, M. S., Johns, W. E., Houk, A., and Zou, S.: Rapid Freshening of Iceland Scotland Overflow Water Driven By Entrainment of a Major Upper Ocean Salinity Anomaly, Geophys. Res. Lett., 48, 1–11, https://doi.org/10.1029/2021gl094396, 2021.
Ferron, B., Mercier, H., Speer, K., Gargett, A., and Polzin, K.: Mixing in the Romanche Fracture Zone, J. Phys. Oceanogr., 28, 1929–1945, https://doi.org/10.1175/1520-0485(1998)028<1929:MITRFZ>2.0.CO;2, 1998.
Ferron, B., Kokoszka, F., Mercier, H., Lherminier, P., Huck, T., Rios, A., and Thierry, V.: Variability of the Turbulent Kinetic Energy Dissipation along the A25 Greenland–Portugal Transect Repeated from 2002 to 2012, J. Phys. Oceanogr., 46, 1989–2003, https://doi.org/10.1175/JPO-D-15-0186.1, 2016.
Fischer, J., Karstensen, J., Oltmanns, M., and Schmidtko, S.: Mean circulation and EKE distribution in the Labrador Sea Water level of the subpolar North Atlantic, Ocean Sci., 14, 1167–1183, https://doi.org/10.5194/os-14-1167-2018, 2018.
Fox, A. D., Biastoch, A., Cunningham, S. A., Fraser, N., Handmann, P., Holliday, N. P., Johnson, C., Martin, T., Oltmanns, M., Rath, W., Rühs, S., Sanchez-Franks, A., and Schmidt, C.: Exceptional freshening and cooling in the eastern subpolar North Atlantic caused by reduced Labrador Sea surface heat loss, Ocean Sci. Discuss. [preprint], https://doi.org/10.5194/os-2022-18, in review, 2022.
Frey, D. I., Morozov, E. G., Fomin, V. V., Diansky, N. A., and Tarakanov, R. Y.: Regional Modeling of Antarctic Bottom Water Flows in the Key Passages of the Atlantic, J. Geophys. Res.-Ocean., 124, 8414–8428, https://doi.org/10.1029/2019JC015315, 2019.
Hansen, B. and Østerhus, S.: North Atlantic–Nordic Seas exchanges, Prog. Oceanogr., 45, 109–208, https://doi.org/10.1016/S0079-6611(99)00052-X, 2000.
Holliday, N. P., Meyer, A., Bacon, S., Alderson, S. G., and de Cuevas, B.: Retroflection of part of the east Greenland current at Cape Farewell, Geophys. Res. Lett., 34, 1–5, https://doi.org/10.1029/2006GL029085, 2007.
Holliday, N. P., Bersch, M., Berx, B., Chafik, L., Cunningham, S., Florindo-López, C., Hátún, H., Johns, W., Josey, S. A., Larsen, K. M. H., Mulet, S., Oltmanns, M., Reverdin, G., Rossby, T., Thierry, V., Valdimarsson, H., and Yashayaev, I.: Ocean circulation causes the largest freshening event for 120 years in eastern subpolar North Atlantic, Nat. Commun., 11, 585, https://doi.org/10.1038/s41467-020-14474-y, 2020.
Johns, W. E., Devana, M., Houk, A., and Zou, S.: Moored Observations of the Iceland-Scotland Overflow Plume Along the Eastern Flank of the Reykjanes Ridge, J. Geophys. Res.-Ocean., 126, 1–26, https://doi.org/10.1029/2021JC017524, 2021.
Kanzow, T. and Zenk, W.: Structure and transport of the Iceland Scotland Overflow plume along the Reykjanes Ridge in the Iceland Basin, Deep-Sea Res. Pt. I, 86, 82–93, https://doi.org/10.1016/j.dsr.2013.11.003, 2014.
Koman, G., Johns, W. E., and Houk, A.: Transport and Evolution of the East Reykjanes Ridge Current, J. Geophys. Res.-Ocean., 125, 10, https://doi.org/10.1029/2020JC016377, 2020.
Lavender, K. L., Brechner Owens, W., and Davis, R. E.: The mid-depth circulation of the subpolar North Atlantic Ocean as measured by subsurface floats, Deep-Sea Res. Pt. I, 52, 767–785, https://doi.org/10.1016/j.dsr.2004.12.007, 2005.
Le Reste, S., Dutreuil, V., André, X., Thierry, V., Renaut, C., Le Traon, P. Y., and Maze, G.: “Deep-Arvor”: A new profiling float to extend the argo observations down to 4000 m depth, J. Atmos. Ocean. Technol., 33, 1039–1055, https://doi.org/10.1175/JTECH-D-15-0214.1, 2016.
Le Traon, P.-Y., D'Ortenzio, F., Babin, M., Leymarie, E., Marec, C., Pouliquen, S., Thierry, V., Cabanes, C., Claustre, H., Desbruyères, D., Lacour, L., Lagunas, J.-L., Maze, G., Mercier, H., Penkerc'h, C., Poffa, N., Poteau, A., Prieur, L., Racapé, V., Randelhoff, A., Rehm, E., Schmechtig, C. M., Taillandier, V., Wagener, T., and Xing, X.: Preparing the New Phase of Argo: Scientific Achievements of the NAOS Project, Front. Mar. Sci., 7, 577408, https://doi.org/10.3389/fmars.2020.577408, 2020.
Lherminier, P., Mercier, H., Gourcuff, C., Alvarez, M., Bacon, S., and Kermabon, C.: Transports across the 2002 Greenland-Portugal Ovide section and comparison with 1997, J. Geophys. Res.-Ocean., 112, C07003, https://doi.org/10.1029/2006JC003716, 2007.
Lherminier, P., Perez, F. F., Branellec, P., Mercier, H., Velo, A., Messias, M., Castrillejo, M., Reverdin, G., Fontela, M., and Baurand, F.: GO-SHIP A25 – OVIDE 2018 Cruise data, SEANOE [data set], https://doi.org/10.17882/87394, 2022.
Mercier, H. and Morin, P.: Hydrography of the Romanche and Chain Fracture Zones, J. Geophys. Res.-Ocean., 102, 10373–10389, https://doi.org/10.1029/97JC00229, 1997.
Mercier, H., Speer, K. G., and Honnorez, J.: Flow pathways of bottom water through the Romanche and chain fracture zones, Deep-Sea Res. Pt. I, 41, 1457–1477, https://doi.org/10.1016/0967-0637(94)90055-8, 1994.
Pacini, A., Pickart, R. S., Bahr, F., Torres, D. J., Ramsey, A. L., Holte, J., Karstensen, J., Oltmanns, M., Straneo, F., Le Bras, I. A., Moore, G. W. K., and Femke de Jong, M.: Mean conditions and seasonality of the west Greenland boundary current system near cape farewell, J. Phys. Oceanogr., 50, 2849–2871, https://doi.org/10.1175/JPO-D-20-0086.1, 2020.
Pérez, F. F., García-Ibáñez, M. I., Fontela, M., Lherminier, P., Branellec, P., Zunino, P., Alonso Pérez, F., de la Paz, M., and Padín, X. A.: Carbon Dioxide, Hydrographic, and Chemical Data Obtained During the R/V Sarmiento de Gamboa Cruise in the North Atlantic Ocean on CLIVAR Repeat Hydrography Section OVIDE-2016-BOCATS (June 17–July 31, 2016), DigitalCSIC [data set], https://digital.csic. es/handle/10261/154341 (last access: 8 July 2022), 2017.
Petit, T., Mercier, H., and Thierry, V.: First direct estimates of volume and water mass transports across the Reykjanes Ridge, J. Geophys. Res.-Ocean., 123, 6703–6719, https://doi.org/10.1029/2018JC013999, 2018.
Petit, T., Mercier, H., and Thierry, V.: New Insight Into the Formation and Evolution of the East Reykjanes Ridge Current and Irminger Current, J. Geophys. Res.-Ocean., 124, 9171–9189, https://doi.org/10.1029/2019JC015546, 2019.
Racapé, V., Thierry, V., Mercier, H., and Cabanes, C.: ISOW Spreading and Mixing as Revealed by Deep-Argo Floats Launched in the Charlie-Gibbs Fracture Zone, J. Geophys. Res.-Ocean., 124, 6787–6808, https://doi.org/10.1029/2019JC015040, 2019.
Sarafanov, A., Falina, A., Mercier, H., Sokov, A., Lherminier, P., Gourcuff, C., Gladyshev, S., Gaillard, F., and Daniault, N.: Mean full-depth summer circulation and transports at the northern periphery of the Atlantic Ocean in the 2000s, J. Geophys. Res.-Ocean., 117, C01014, https://doi.org/10.1029/2011JC007572, 2012.
Saunders, P. M.: The flux of overflow water through the Charlie-Gibbs Fracture Zone, J. Geophys. Res., 99, 12343, https://doi.org/10.1029/94JC00527, 1994.
Thierry, V., Mercier, H., Petit, T., Branellec, P., Balem, K., and Lherminier, P.: Reykjanes Ridge Experiment (RREX) dataset, SEANOE [data set], https://doi.org/10.17882/55445, 2018.
Våge, K., Pickart, R. S., Sarafanov, A., Knutsen, Ø., Mercier, H., Lherminier, P., van Aken, H. M., Meincke, J., Quadfasel, D., and Bacon, S.: The Irminger Gyre: Circulation, convection, and interannual variability, Deep-Sea Res. Pt. I, 58, 590–614, https://doi.org/10.1016/j.dsr.2011.03.001, 2011.
Wong, A., Keeley, R., Carval, T., and the Argo Data Management Team: Argo Quality Control Manual for CTD and Trajectory Data, Version 3.6, https://doi.org/10.13155/33951, 2021.
Xu, X., Schmitz, W. J., Hurlburt, H. E., Hogan, P. J., and Chassignet, E. P.: Transport of Nordic Seas overflow water into and within the Irminger Sea: An eddy-resolving simulation and observations, J. Geophys. Res.-Ocean., 115, C12048, https://doi.org/10.1029/2010JC006351, 2010.
Zou, S., Lozier, S., Zenk, W., Bower, A., and Johns, W.: Observed and modeled pathways of the Iceland Scotland Overflow Water in the eastern North Atlantic, Prog. Oceanogr., 159, 211–222, https://doi.org/10.1016/j.pocean.2017.10.003, 2017.
Zou, S., Bower, A., Furey, H., Susan Lozier, M., and Xu, X.: Redrawing the Iceland-Scotland Overflow Water pathways in the North Atlantic, Nat. Commun., 11, 1890, https://doi.org/10.1038/s41467-020-15513-4, 2020.