the Creative Commons Attribution 4.0 License.
the Creative Commons Attribution 4.0 License.
 | 30 Jun 2021
Technical note: Stability of tris pH buffer in artificial seawater stored in bags
Wiley H. Wolfe
Kenisha M. Shipley
Yuichiro Takeshita
Taylor Wirth
Todd R. Martz
Equimolal tris (2-amino-2-hydroxymethyl-propane-1,3-diol) buffer in artificial seawater is a well characterized and commonly used standard for oceanographic pH measurements. We evaluated the stability of tris pH when stored in purportedly gas-impermeable bags across a variety of experimental conditions, including bag type and storage in air vs. seawater over 300 d. Bench-top spectrophotometric pH analysis revealed that the pH of tris stored in bags decreased at a rate of 0.0058±0.0011 yr−1 (mean slope ±95 % confidence interval of slope). The upper and lower bounds of expected pH change at t=365 d, calculated using the averages and confidence intervals of slope and intercept of measured pH change vs. time data, were −0.0042 and −0.0076 from initial pH. Analyses of total dissolved inorganic carbon confirmed that a combination of CO2 infiltration and/or microbial respiration led to the observed decrease in pH. Eliminating the change in pH of bagged tris remains a goal, yet the rate of pH change is lower than many processes of interest and demonstrates the potential of bagged tris for sensor calibration and validation of autonomous in situ pH measurements.
- Article
(4099 KB) - Full-text XML
- BibTeX
- EndNote


Ocean pH is a key measurement used for tracking biogeochemical processes such as photosynthesis, respiration, and calcification (Takeshita et al., 2016) and represents perhaps the most recognized variable associated with ocean acidification (OA), the decrease in ocean pH due to the uptake of anthropogenic carbon dioxide (Doney et al., 2009). OA progresses with a global average pH decline of 0.002 per year in the surface open ocean (Bates et al., 2014), and the accumulated and projected near-term effects of OA have been shown to have deleterious effects on many calcifying organisms (Cooley and Doney, 2009). Beyond the narrow scope of calcifiers, organismal response is complex, exhibiting varied responses across processes such as reproduction, growth rate, and sensory perception. Organismal responses are further complicated by their impact on ecosystem level dynamics, such as altering competition and predator–prey relationships (Doney et al., 2020). Furthermore, pH effects are often exacerbated by concomitant stressors, such as decreased dissolved oxygen or increased temperature. Ultimately, OA will affect humans through impacts on fisheries, aquaculture, and shoreline protection (Branch et al., 2013; Doney et al., 2020).
The quality of pH measurement required to observe various phenomena is often broken into “climate” and “weather” levels of uncertainty (Newton et al., 2015), or 0.003 and 0.02, respectively. Discrete sampling has been shown to be capable of meeting the climate level of uncertainty when best practices are followed, yet many labs do not consistently meet this standard (Bockmon and Dickson, 2015). Furthermore, while discrete, bench-top methodologies can be the most accurate, the ocean's vast size limits the oceanographic community's ability to make ship-based discrete pH measurements to decadal reoccupations of a few major sections per ocean basin (Sloyan et al., 2019). The sparsity of ship-board measurements hinders our ability to assess sub-decadal processes, such as seasonal cycles or bloom events, over much of the ocean (Karl, 2010) and highlights the need for autonomous, high-frequency pH measurements. Technological advancements have led to more routine autonomous pH measurements over the past decade, providing opportunities to fill some gaps in time and space in discrete sampling programs (e.g., Byrne, 2014; Martz et al., 2015; Lai et al., 2018; Wang et al., 2019; Tilbrook et al., 2019). Globally, pH sensors now operate on hundreds of autonomous platforms including moorings and profiling floats, delivering unique data sets in the form of Eulerian and depth-resolved Lagrangian time series (Johnson et al., 2017; Bushinsky et al., 2019; Sutton et al., 2019). While sensors increase data coverage, many sensor-based pH measurements, particularly on moored systems, continue to fall short of both climate and weather levels of uncertainty, as highlighted in the intercomparison tests carried out by the Alliance for Coastal Technologies (ACT, 2012) and by the Wendy Schmidt Ocean Health XPRIZE (Okazaki et al., 2017).
Independent validation is typically required for autonomous sensors to meet both weather and climate levels of uncertainty. For example, autonomous underway pCO2 systems (Pierrot et al., 2009), moorings (Bushinsky et al., 2019), and autonomous surface vehicles (Chavez et al., 2017; Sabine et al., 2020) are able to provide climate quality observations with an uncertainty of ±2 µatm because traceable standard gases are frequently measured in situ. For pH measurements on profiling floats (Johnson et al., 2016), sensor performance is validated by comparing to a deep reference pH field that is calculated using empirical algorithms (Williams et al., 2016; Bittig et al., 2018; Carter et al., 2018). This approach has demonstrated the ability to obtain high-quality pH measurements from a network of profiling floats (Johnson et al., 2017) but requires measurements in the deep ocean where pH is comparatively stable. It is atypical for other pH sensors, including coastal moored sensors, to have an automated or remote validation. Therefore, on such deployments, validation has largely relied on discrete samples taken alongside the sensor (Bresnahan et al., 2014; McLaughlin et al., 2017; Takeshita et al., 2018), which presents unique challenges, primarily that spatiotemporal discrepancy can lead to errors of >0.1, especially in highly dynamic systems (Bresnahan et al., 2014).
Similar to the method in use by pCO2 systems, one approach to validate in situ pH sensors is by measuring a reference material or pH standard, repeatedly during a sensor deployment. The most commonly used standard for oceanographic pH measurement is an equimolal tris (2-amino-2-hydroxymethyl-propane-1,3-diol) buffer in artificial seawater (ASW), hereafter referred to as tris or tris-ASW (DelValls and Dickson, 1998; Papadimitriou et al., 2016). The pH of tris has been characterized over a range of temperature, salinity, and pressure (DelValls and Dickson, 1998; Rodriguez et al., 2015; Takeshita et al., 2017; Müller et al., 2018), allowing for accurate calculation of tris pH across a wide range of marine conditions. Furthermore, when stored in borosilicate bottles and under ideal conditions, these buffers have been shown to be stable to better than 0.0005 over a year (Dickson, 1993; Nemzer and Dickson, 2005), making tris a good candidate for in situ validation of long-term deployments of autonomous pH sensors. To be utilized for in situ applications, the reference solution must be stored in bags (as in Hales et al., 2005; Seidel et al., 2008; Sayles and Eck, 2009; Spaulding et al., 2014; Wang et al., 2015; Lai et al., 2018). Recently, in situ sensor validation using bagged tris was demonstrated by Lai et al. (2018) during a 150 d deployment of an autonomous pH sensor, where the tris standard was measured in situ every 5 d. However, the stability of tris when stored in bags has not been quantified systematically using spectrophotometric bench-top pH measurement techniques recommended as best practice (Dickson et al., 2007).
In this work we quantified the stability of tris stored in bags for 300 d. Tris from four separately prepared batches was stored in two bag types either in a lab or submerged in seawater. In addition, one batch was stored in borosilicate bottles in the lab as a control. Spectrophotometric pH measurements were made approximately every 2 months on each bag of tris. Throughout the experiment, certified reference materials (CRMs) for oceanic CO2 measurements (Dickson, 2001) were used to assess the stability of the spectrophotometric pH system.
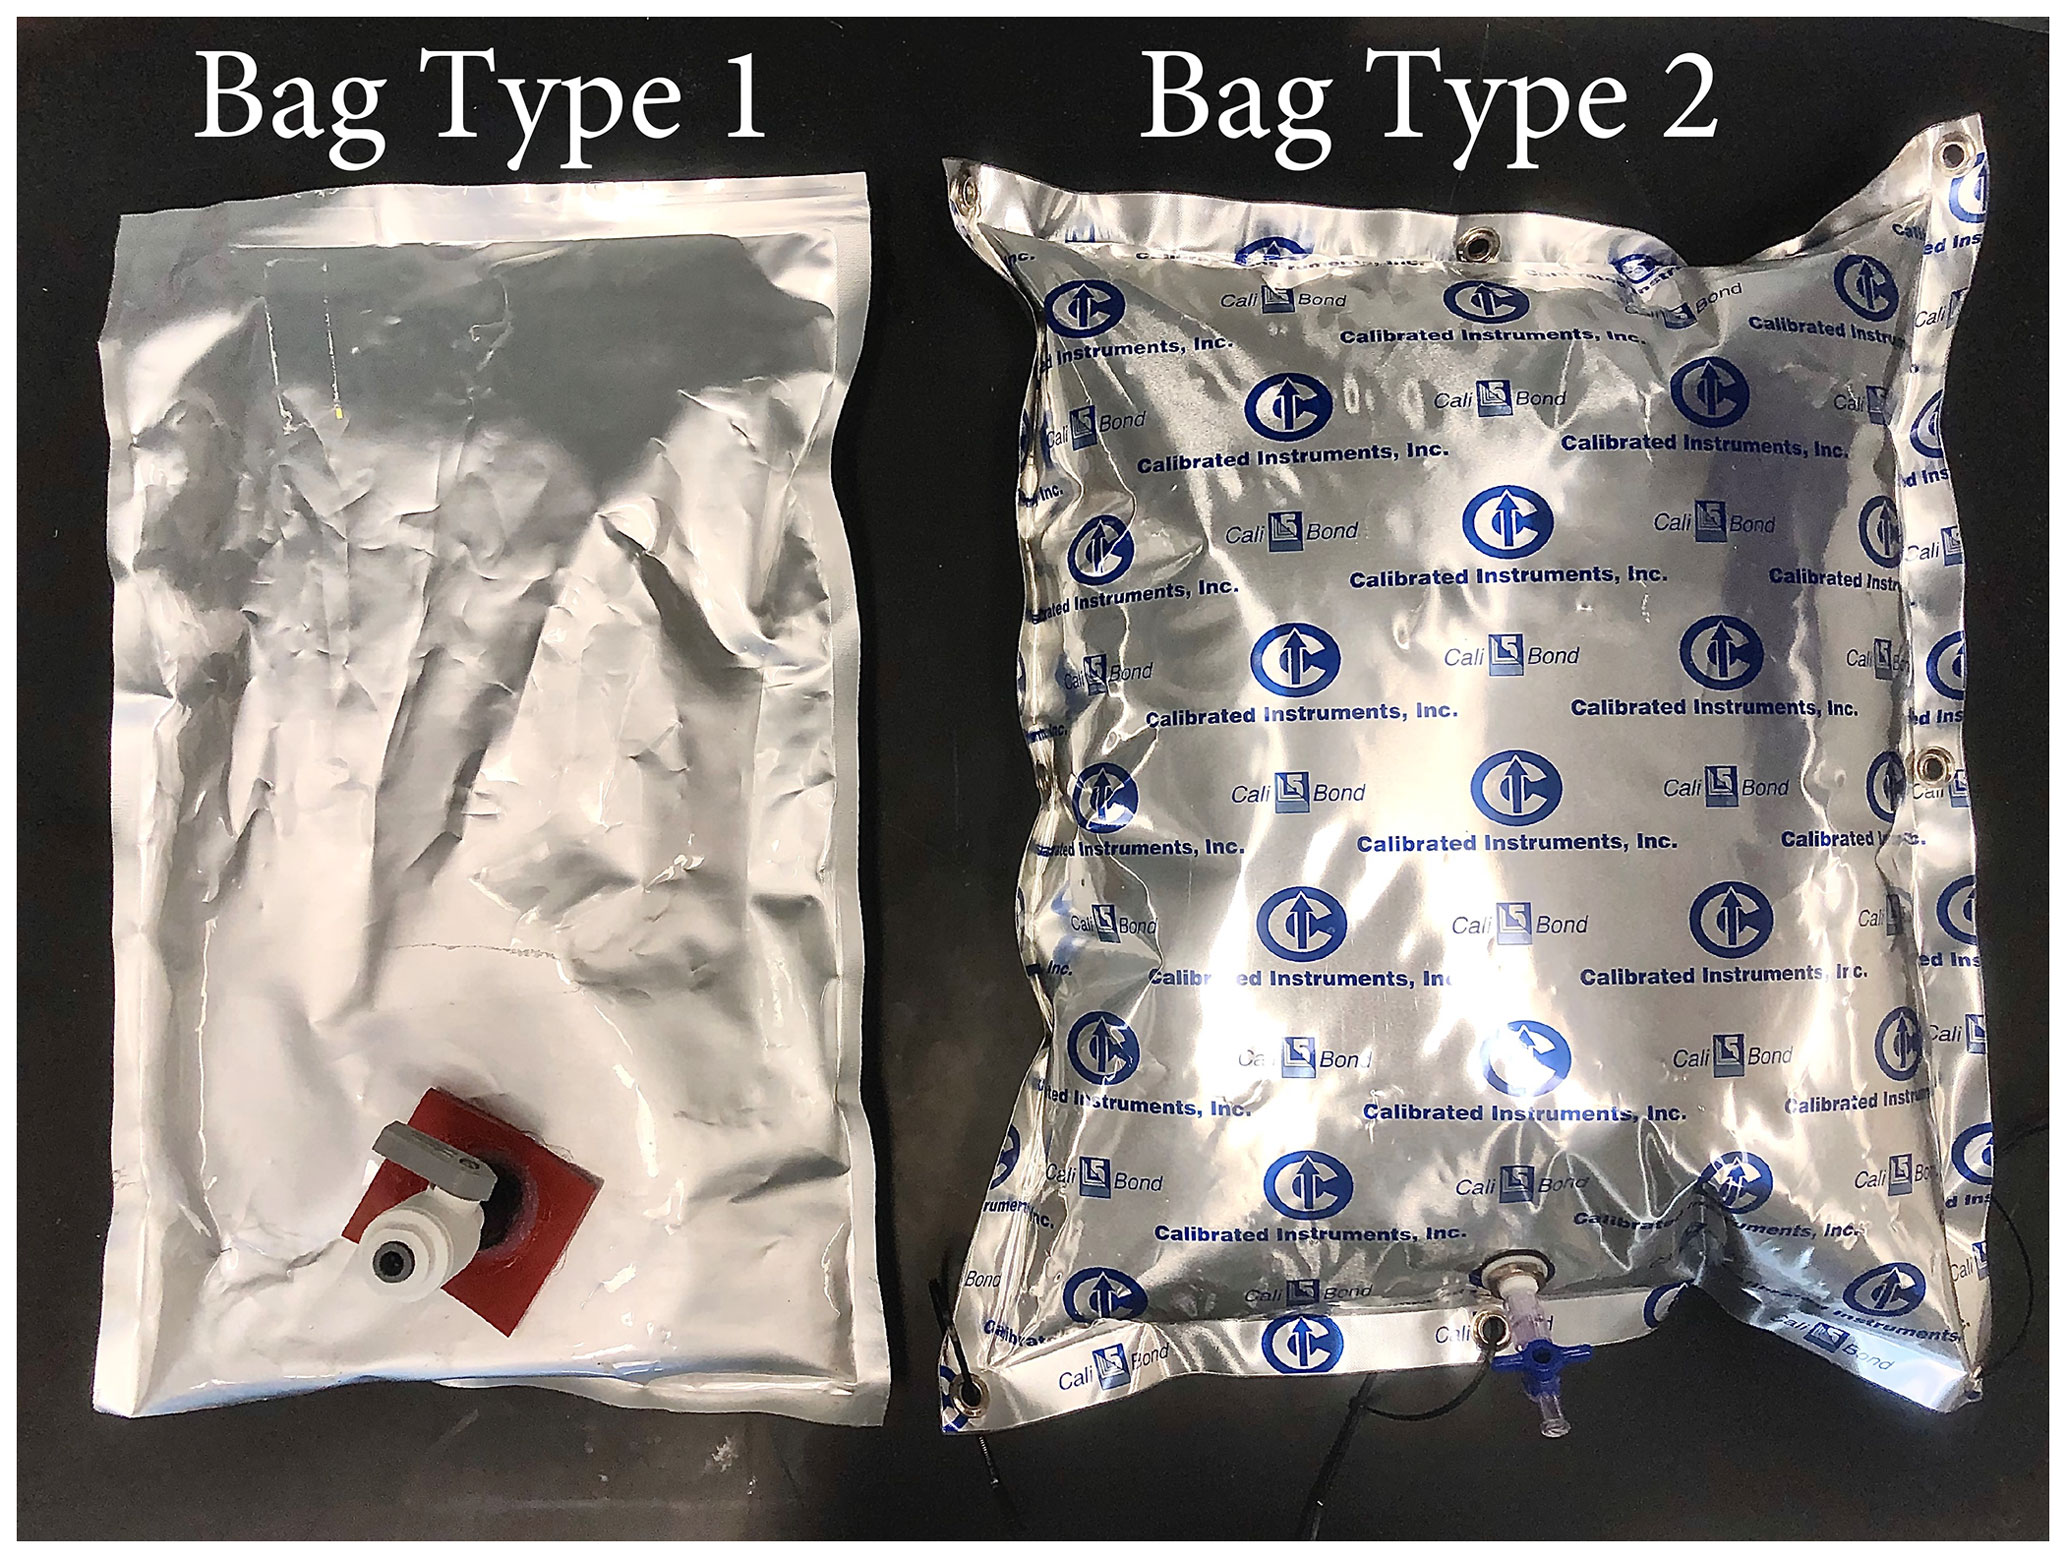
Two bag types were tested for storing tris (Fig. 1). Bag type 1 was custom made based on a design used in the “Burke-o-Lator” system (Hales et al., 2005; Bandstra et al., 2006), made from PAKDRY 7500 barrier film (IMPAK P75C0919). The barrier film is made of layers of polyester and nylon with a sealant layer of metallocene polyethylene. Two 23 cm×48 cm () sheets were heat sealed on three sides, forming a pocket, and a 1.9 cm () diameter hole was cut into one of the pocket walls for the bulkhead fitting and bulkhead nut (McMaster-Carr 8674T55). The bulkhead was sealed into the wall with a silicone gasket (McMaster-Carr 9010K13) and washer (McMaster-Carr 95649A256) and coated with silicone sealant (McMaster-Carr 74955A53). A “push-to-connect” ball valve fitting (McMaster-Carr 4379K41) was attached to the bulkhead. The modified pocket was rinsed, dried, and heat sealed along the final edge to create a ∼4 L bag. Bags were left to dry for at least 24 h before filling. Bag type 2 was a commercially available 3 L Cali-5-Bond bag purchased from Calibrated Instruments and used without modification. It is a multi-layer bag made of plastic, aluminum foil (to prevent liquid and gas permeation), a layer of inert high-density polyethylene (to form a non-reactive inner wall), and a polycarbonate Stopcock Luer valve.
In this experiment, four batches of tris were prepared following the procedure in DelValls and Dickson (1998), using off-the-shelf reagents with no additional standardization or purification (e.g., recrystallization of salts). The focus of this paper is stability of bagged tris over time and does not prioritize obtaining highly accurate equimolal tris (as would be necessary for characterization of thermodynamic constants, for example). The calculated pH of tris in this study was 8.2652 at 20 ∘C, based on quantity of reagents used. This is 0.0135 higher than the pH of equimolal tris, 8.2517 at 20 ∘C (DelValls and Dickson, 1998). The pH discrepancy was due to a unit error in the measurement of HCl (our preparation used mol L−1 rather than the prescribed mol kg-sol−1). This unit error resulted in a tris : trisH+ of 1:0.97 that slightly differs from the 1:1 of truly equimolal tris. As this ratio is nearly equimolal, the term “equimolal” will continue to be used throughout this study. The details of the specific reagents used to prepare the tris solution can be found in Table A1.
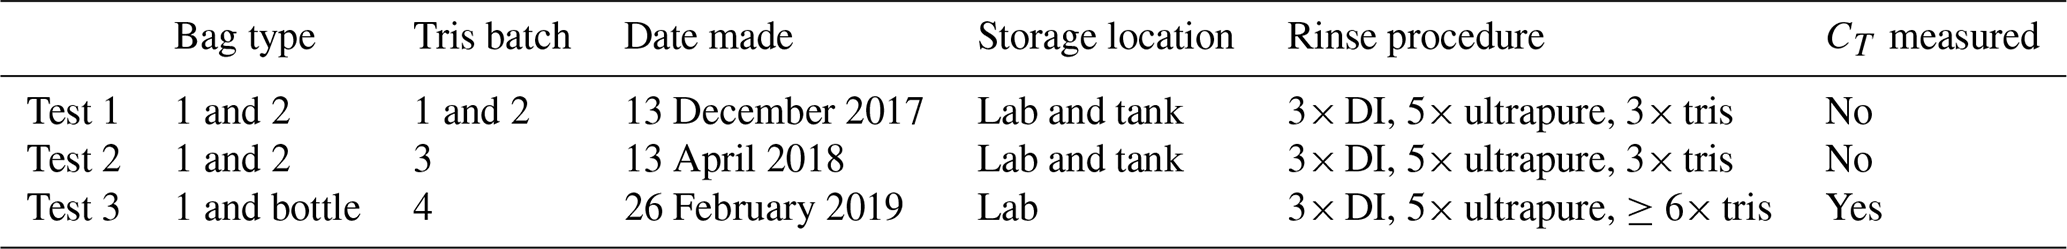
Three stability tests were initiated at different times over the course of 18 months. The initiation of a given test is defined as the date of preparation of the tris used in that test. A summary of the differences between these tests is shown in Table 1 and described here. Each bag has a unique identifier in the format of “batch number, bag number, lab or tank.” If this identifier is duplicative, the bags are differentiated with letters A to D. Each bag was rinsed before filling: 3 times with deionized water (DI), 5 times with ultrapure water (>18 MΩ resistivity), and at least 3 times with 200 mL of tris. Tris bags were stored on a lab bench or in a 5000 L test tank filled with ozone-sterilized, filtered seawater. Bag type 2 experienced delamination of exterior layers when stored in seawater during test 2 and was not used in further testing. Tris from batch 4 was also stored in borosilicate bottles following the procedure in Nemzer and Dickson (2005). In addition to pH measurements, dissolved inorganic carbon (CT) was measured on both bagged and bottled tris during test 3 to see if changes in pH were due to increased CO2. CT samples were measured using a custom-built system based on an infrared (IR) analyzer (LI-COR 7000) similar to systems used by O'Sullivan and Millero (1998) and Friederich et al. (2002). This IR measurement system is capable of measuring relatively low CT without requiring method adjustment and has been used to make near-zero CT measurements (Paulsen and Dickson, unpublished data). CT measurements were made on CRMs (Batch 179 and 183). The precision of the CT measurements was ±1.4 µmol kg−1 (pooled SD, nsamples=15, nmeasurements=44).
Tris pH was measured every 55±20 d (mean ± SD of measurement interval) throughout the experiment. The pH of tris was measured in triplicate at each time point with spectrophotometry using m-cresol purple as the indicator dye using the system described in Carter et al. (2013). Absorbance measurements were made in a 10 cm jacketed cell, and the temperature was measured directly adjacent to the cell outflow using a NIST-traceable thermometer (±0.1 ∘C, QTI DTU6028P-001-SC). Blank and sample were held for 3 min in the jacketed flow cell prior to absorbance measurements.
On average, temperature was stable to within a 0.02 ∘C range over the course of the day; the mean temperature throughout the experiment was 20.09±0.23 ∘C (1σ), although temperature was 0.6 ∘C higher than the average on one measurement day. Spectrophotometric pH measurements are reported at 20 ∘C by adjusting the measured pH value at the measured cell temperature TC () to 20 ∘C () using the known temperature dependence of tris (pHtris) as follows:
pH and pH are the theoretical pH of tris (at the measured temperature and 20 ∘C respectively) and were calculated using Eq. (18) in DelValls and Dickson (1998). This adjustment assumes that any potential difference in between that corresponding to equimolal tris and that corresponding to our 1:0.97 tris : trisH+ ratio has a negligible effect over the small temperature range observed.
To account for pH-dependent errors from impurities in unpurified mCP, a pH-dependent correction factor was determined based on the protocol outlined in Takeshita et al. (2021). Briefly, pH of natural seawater with different ratios of added tris : trisH+ was measured subsequently using impure dye (pHimpure; from Aldrich, lot MKBH6858V) and purified dye (pHpure; from Robert Byrne's laboratory, University of South Florida; Liu et al., 2011) over a range of pH between 7.4 to 8.2 at approximately 0.2 intervals. Varying ratios of tris : trisH+ were used to obtain different solution pH, and to buffer any changes in pH during the experiment, which negates the need for dye perturbation corrections in this characterization. Triplicate measurements were made at each pH. A second-order pH-dependent error was observed as previously described, following the equation (R2=0.975, RMSE = 0.000434)
All subsequent pHspec measurements in this study were conducted with impure dye and are reported with this dye impurity correction (Eq. 2) applied. The correction adjusted the reported pH by 0.0093±0.0002 (mean ± SD, n=126). No dye perturbation correction was used (a correction for a change in pH caused by the addition of the dye), as the high buffering capacity of tris, in combination with a dye adjusted to a pH similar to that of tris, results in a negligible change in measured pH.
Measurements of tris batches 1 and 2 made in the first 150 d have been removed from the data set due to procedural changes made to the spectrophotometric pH system to correct for problems with temperature equilibration. Outliers were removed from the spectrophotometric pH measurements if the absorbance at 760 nm was above 0.005 or below −0.002 (indicative of a measurement problem, such as a bubble or lamp drift), resulting in the removal of 2 out of 163 measurements. Additionally, outliers were removed from the data set if they were greater than 3 SD from the mean of a measurement triplicate, where SD is calculated as using all sets of triplicates (1 SD=0.0004, n=55), resulting in the removal of 2 of 161 remaining measurements. The remaining 159 measurements were used for the analysis presented here. An analysis of variation, or ANOVA, was used to detect the dependence of the results on tris batch, bag/bottle, type and storage location. Analysis was performed using MATLAB R2020a and the standard function “anovan” Throughout the experiment, CRMs (procured from Andrew Dickson, Scripps Institution of Oceanography) for seawater CT and total alkalinity were measured regularly to verify instrument performance (Dickson, 2001). A time series of CRM measurements over the duration of the work described here showed no systematic drift. (Fig. A1 in Appendix A). To assess if the change in pH was driven by the addition of CO2, the final pH and available CT measurements were compared with a model described here. The theoretical change in tris-artificial seawater (ASW) pH due to an increase in CT is straightforward to calculate, since both tris and CO2 acid–base equilibria are well-characterized in seawater and ASW media. The pH is calculated for tris-ASW + CT using an equilibrium model following the approach described in Sect. 2 of Dickson et al. (2007) for the case of known alkalinity and CT. In the case of ASW, the seawater equilibrium constants for CO2 are appropriate because minor ions present in seawater and not ASW do not appreciably affect the CO2 equilibrium constants (particularly when the goal is to compute relative changes in pH) as the ionic background of ASW is closely matched to that of seawater at salinity = 35. In our model, minor acid–base species important to seawater alkalinity but not present in ASW (borate, phosphate, silicate, fluoride) are set to zero. The definition of total alkalinity is modified to include the tris acid–base system following the definition of acid-base donor/acceptor criteria given by Dickson (1981): tris is assigned as a level-1 proton acceptor and tris-H+ is at the zero level. Thus, in our model, tristot=0.08 molal, alkalinity = 0.04 molal, and CT is a variable. An algorithm (see Annexe 1 in Dickson et al., 2007) is then used to find the root of the alkalinity equation in its residual form by solving for pH.
Figure 2 depicts pH, stored in either a bag or bottle, as a function of time and is subdivided for tests 1, 2, and 3. A linear decrease was observed for all bags or bottles. A linear regression was calculated for each experimental condition and, in the cases where measurements at t=0 were removed due to protocol changes described above, the line was extrapolated back to t=0, shown by the dotted line. The measured or extrapolated y intercept is reported as the initial pH in Table 2. In all tests, trend lines are extrapolated to t=365 d to illustrate observed and predicted change over the course of a year as shown by the solid line. For ease of visual comparison, the y axis of each subplot has an identical pH range of 0.017.
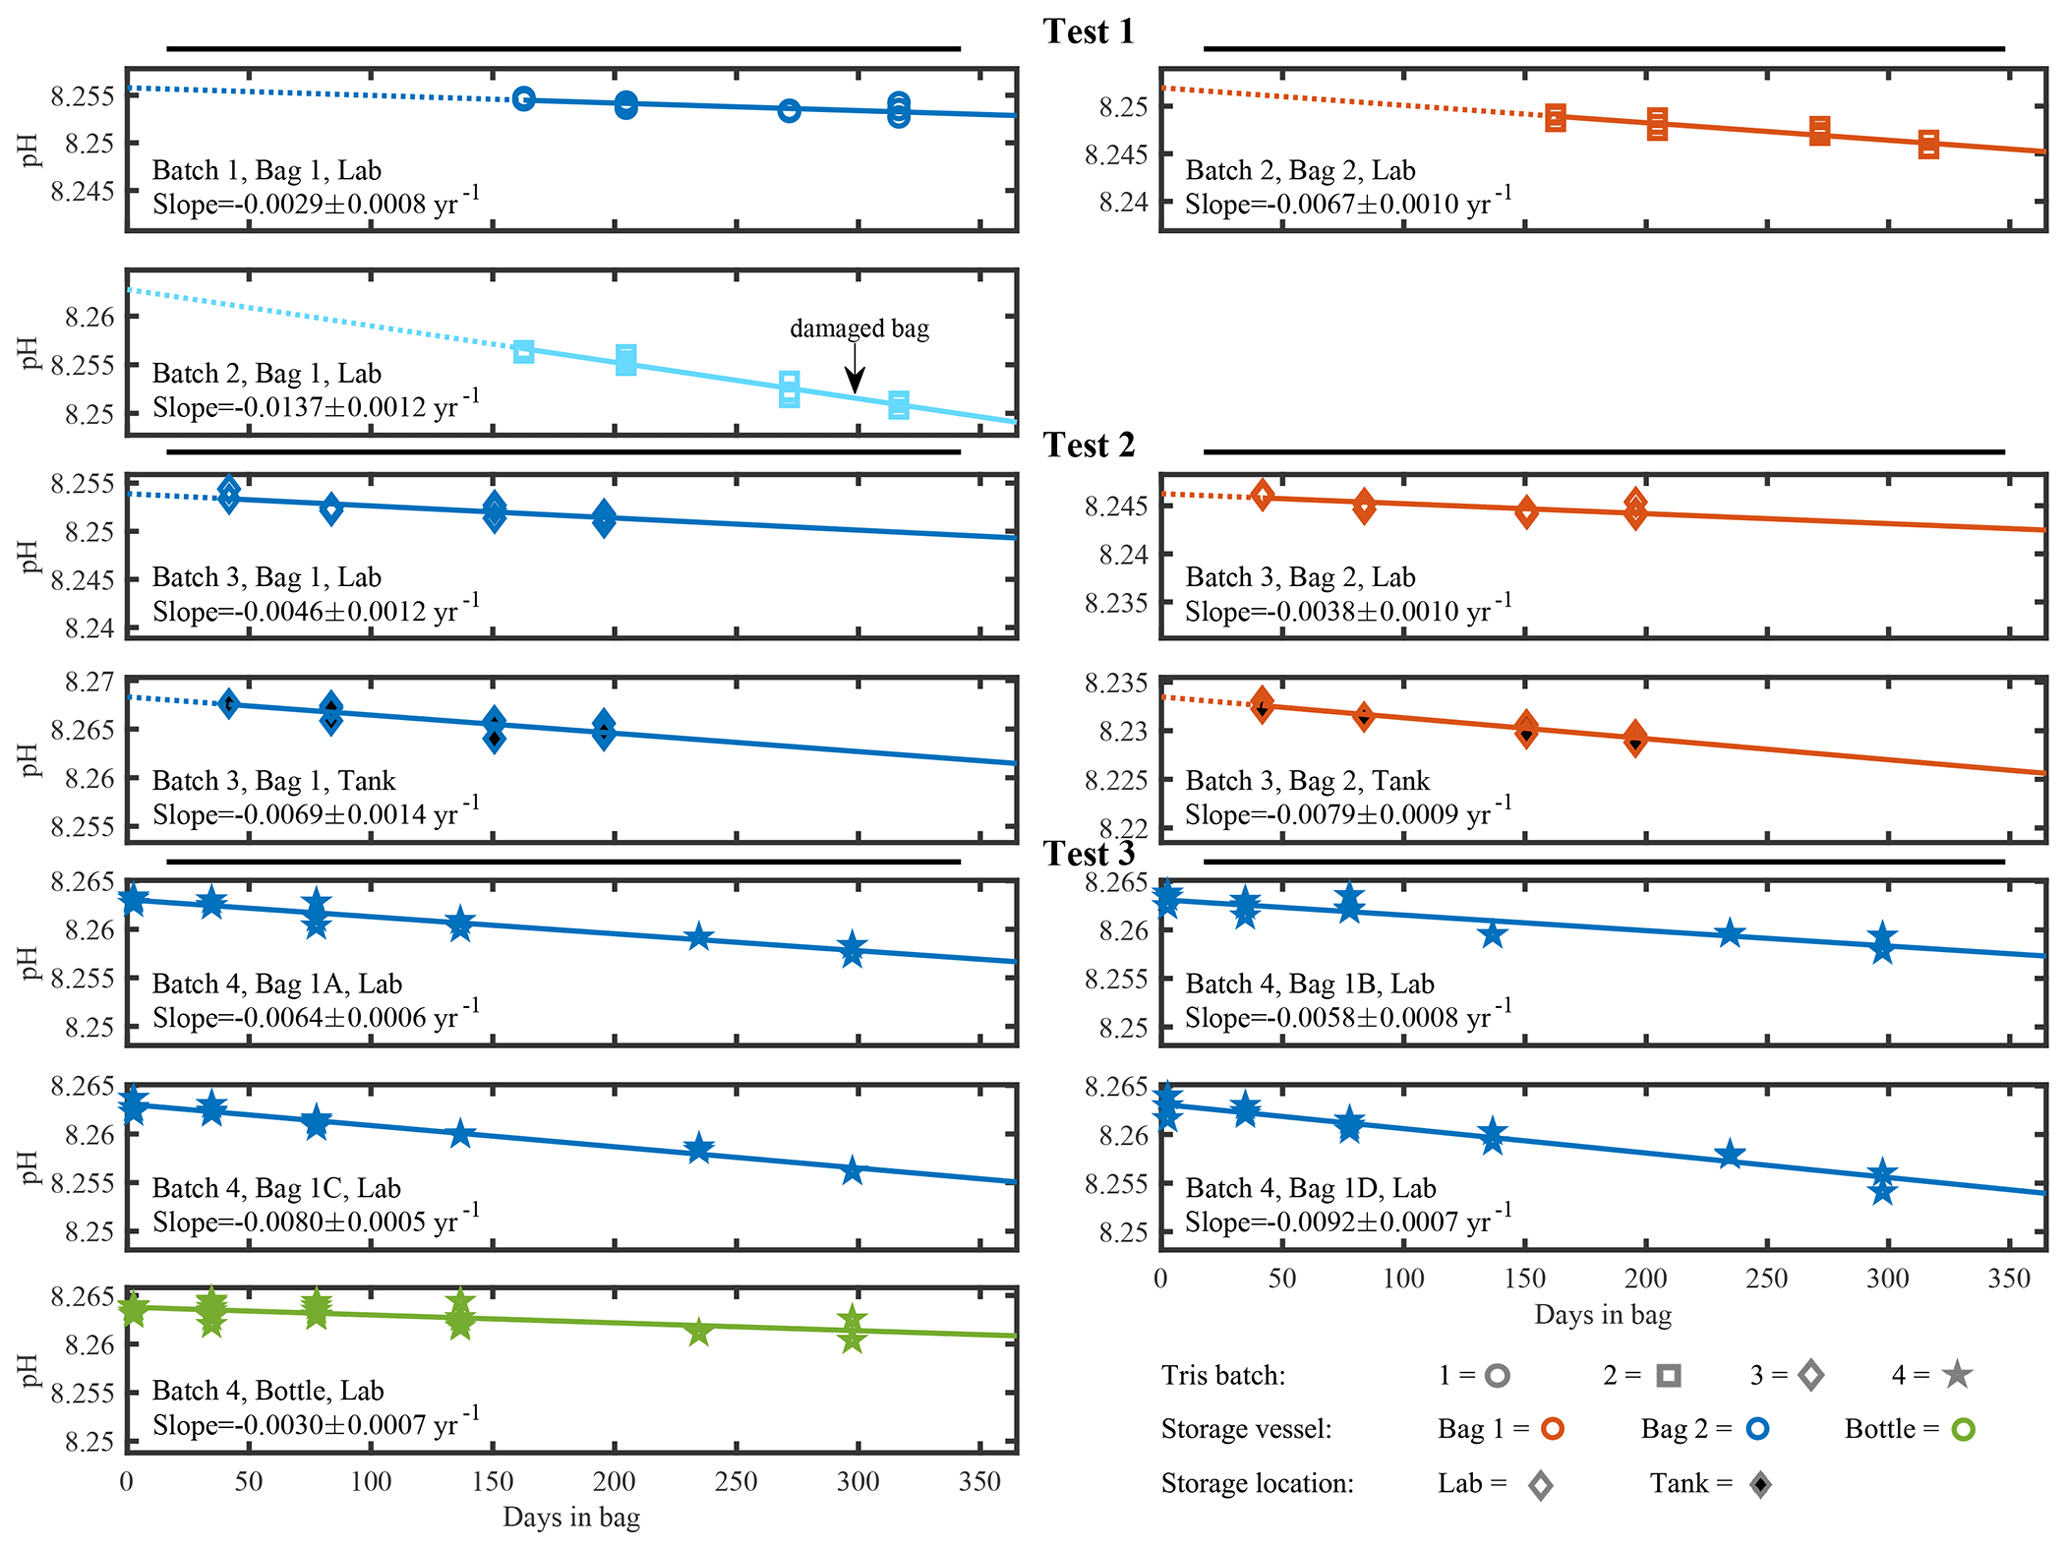
Figure 2Individual time series of measured pH in tris buffer solutions. Tris batch is indicated by shape, storage vessel by color, and storage location by fill. This marker system is also followed in Fig. A2. The solid line is a linear regression starting at the first included pH measurement and ending 365 d after the tris was bagged. The dotted line illustrates the extrapolation back to 0 d stored in bag when measurements at t=0 do not exist. The range of the y axis scale is fixed at 0.017 pH for all subplots.
Table 2Linear regression statistics from trend lines shown in Figs. 1 and 2. The last row shows the regression statistics for tris from all batches, in either bag type, stored in the lab or test tank. Slope and intercept are shown as mean ±95 % CI. The reported intercept is the regression intercept; when initial pH measurements are available, they differ by less than 0.0003 from regression intercept.
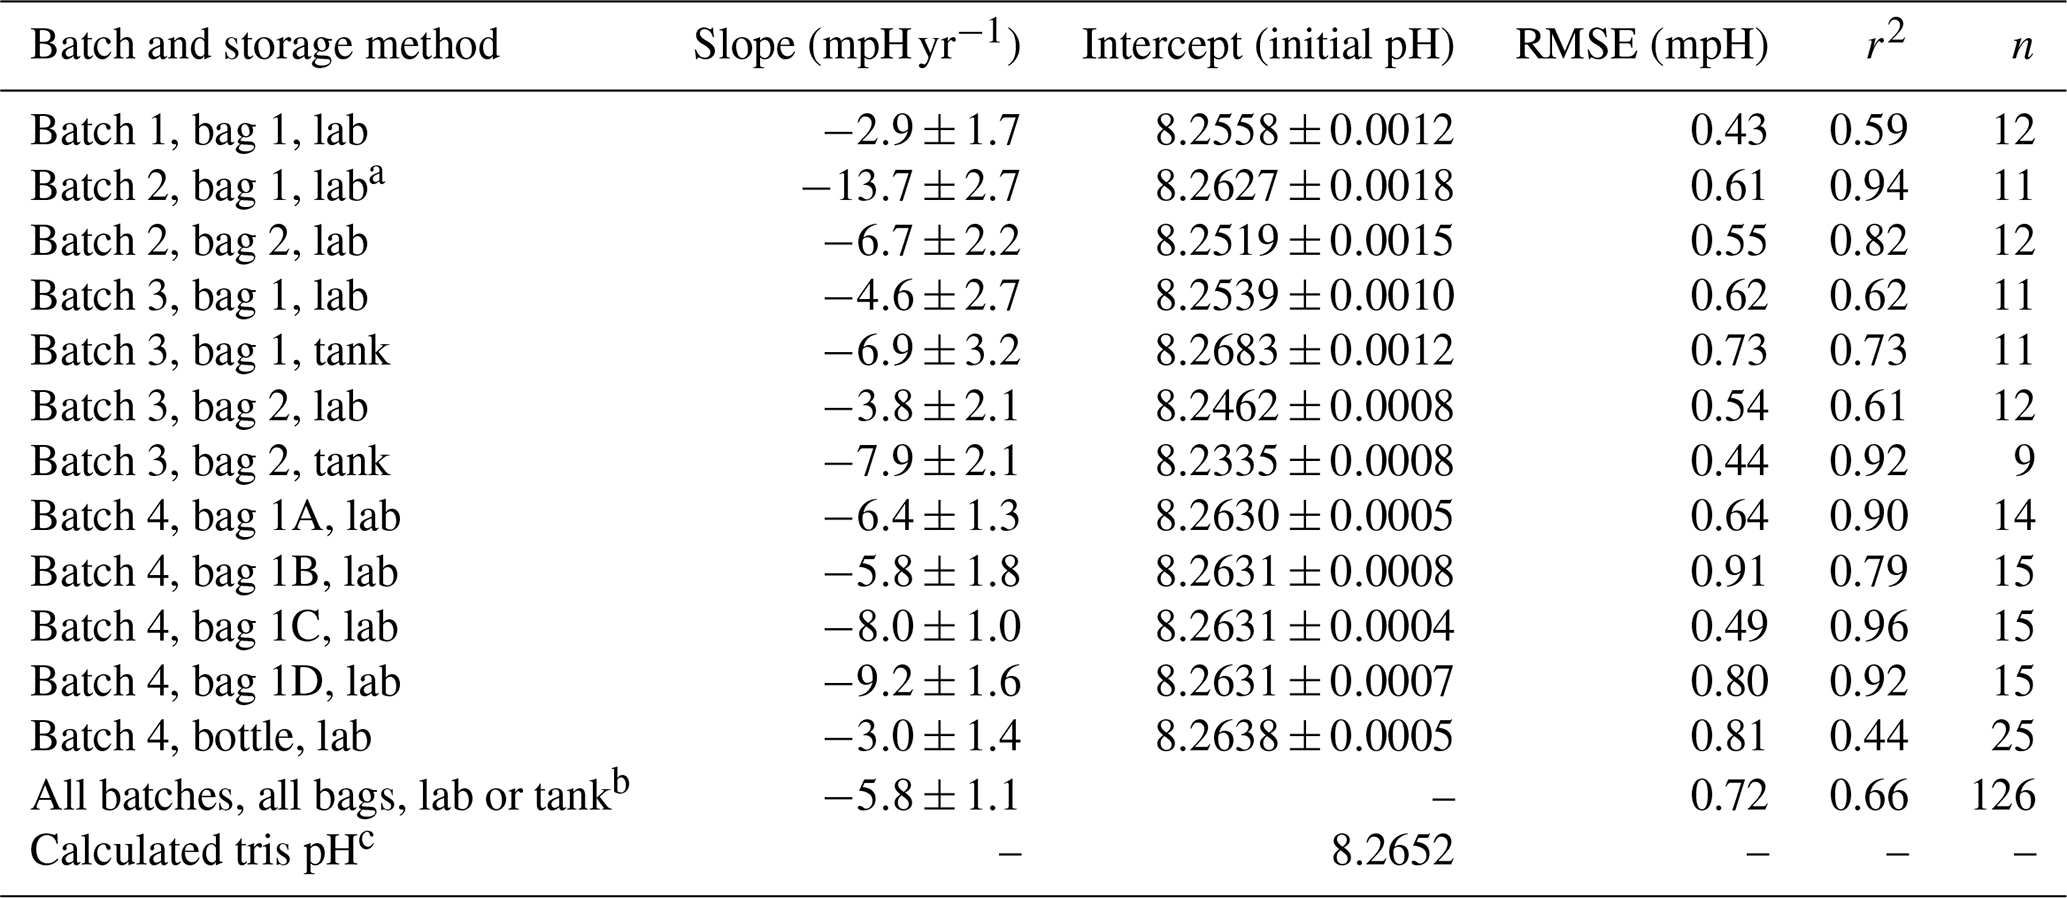
a Indicates the
outlier (batch 2, bag 1, lab) caused by a damaged bag. The outlier, “batch
2, bag 1, lab”, was not used in the “All batches, all bags, lab or tank”
composite.
b In all batches, all bags, lab or tank, the slope was
calculated with a linear fit of all (non-outlier) tris measurements. The
RMSE is the mean RMSE of all (non-outlier) bag fits.
c The
calculated tris pH was calculated at 20 ∘C; however, this
calculated pH is 0.0135 higher than equimolal tris as noted above (DelValls
and Dickson, 1998).
Only bags from test 3, using tris batch 4 and bag type 1, have direct initial pH measurements and replicate bags. Initial pH measurements of these 4 bags were 8.2630±0.0007 (mean ± SD, n=12). Importantly, the very low SD suggests that a single initial pH measurement is representative of all replicate bags filled with a single tris batch, if the preparation procedure used in test 3 is followed. This inter-bag consistency is beneficial because it reduces the number of initial pH measurements required when filling multiple bags. There is also strong agreement in initial pH measurements between bagged and bottled tris in test 3, with the initial pH of bottled tris 0.0007 higher than bagged tris (8.26327±0.0004, n= 6). The differences in filling procedure or impurities between bags and bottles in test 3 appear to have little effect on the initial pH. The mean initial pH of tris batch 4 is 0.002 (n=5) lower than calculated pH (Fig. A2). This difference between the mean initial pH of tris batch 4 and calculated pH is similar in direction and magnitude to those reported in other studies: DeGrandpre et al. (2014) reported , and Müller and Rehder (2018) reported −0.002 to −0.008 (measured pH minus ). With standard laboratory equipment and off-the-shelf reagents, an uncertainty of 0.006 is expected in prepared tris (Paulsen and Dickson, 2020). Measurements were also made on Dickson standard tris (batch T35) using the same instrument, and the pH was 0.0019 higher than the calculated pH (n=2). In tests 1 and 2, the initial pH was extrapolated from a linear regression. The extrapolated initial pH values are more variable and lower (on average) than those directly measured (Fig. A2). These differences may be a result of the extrapolation or different experimental variables such as the increased rinsing of bags, or the single bag type and storage location used in test 3.
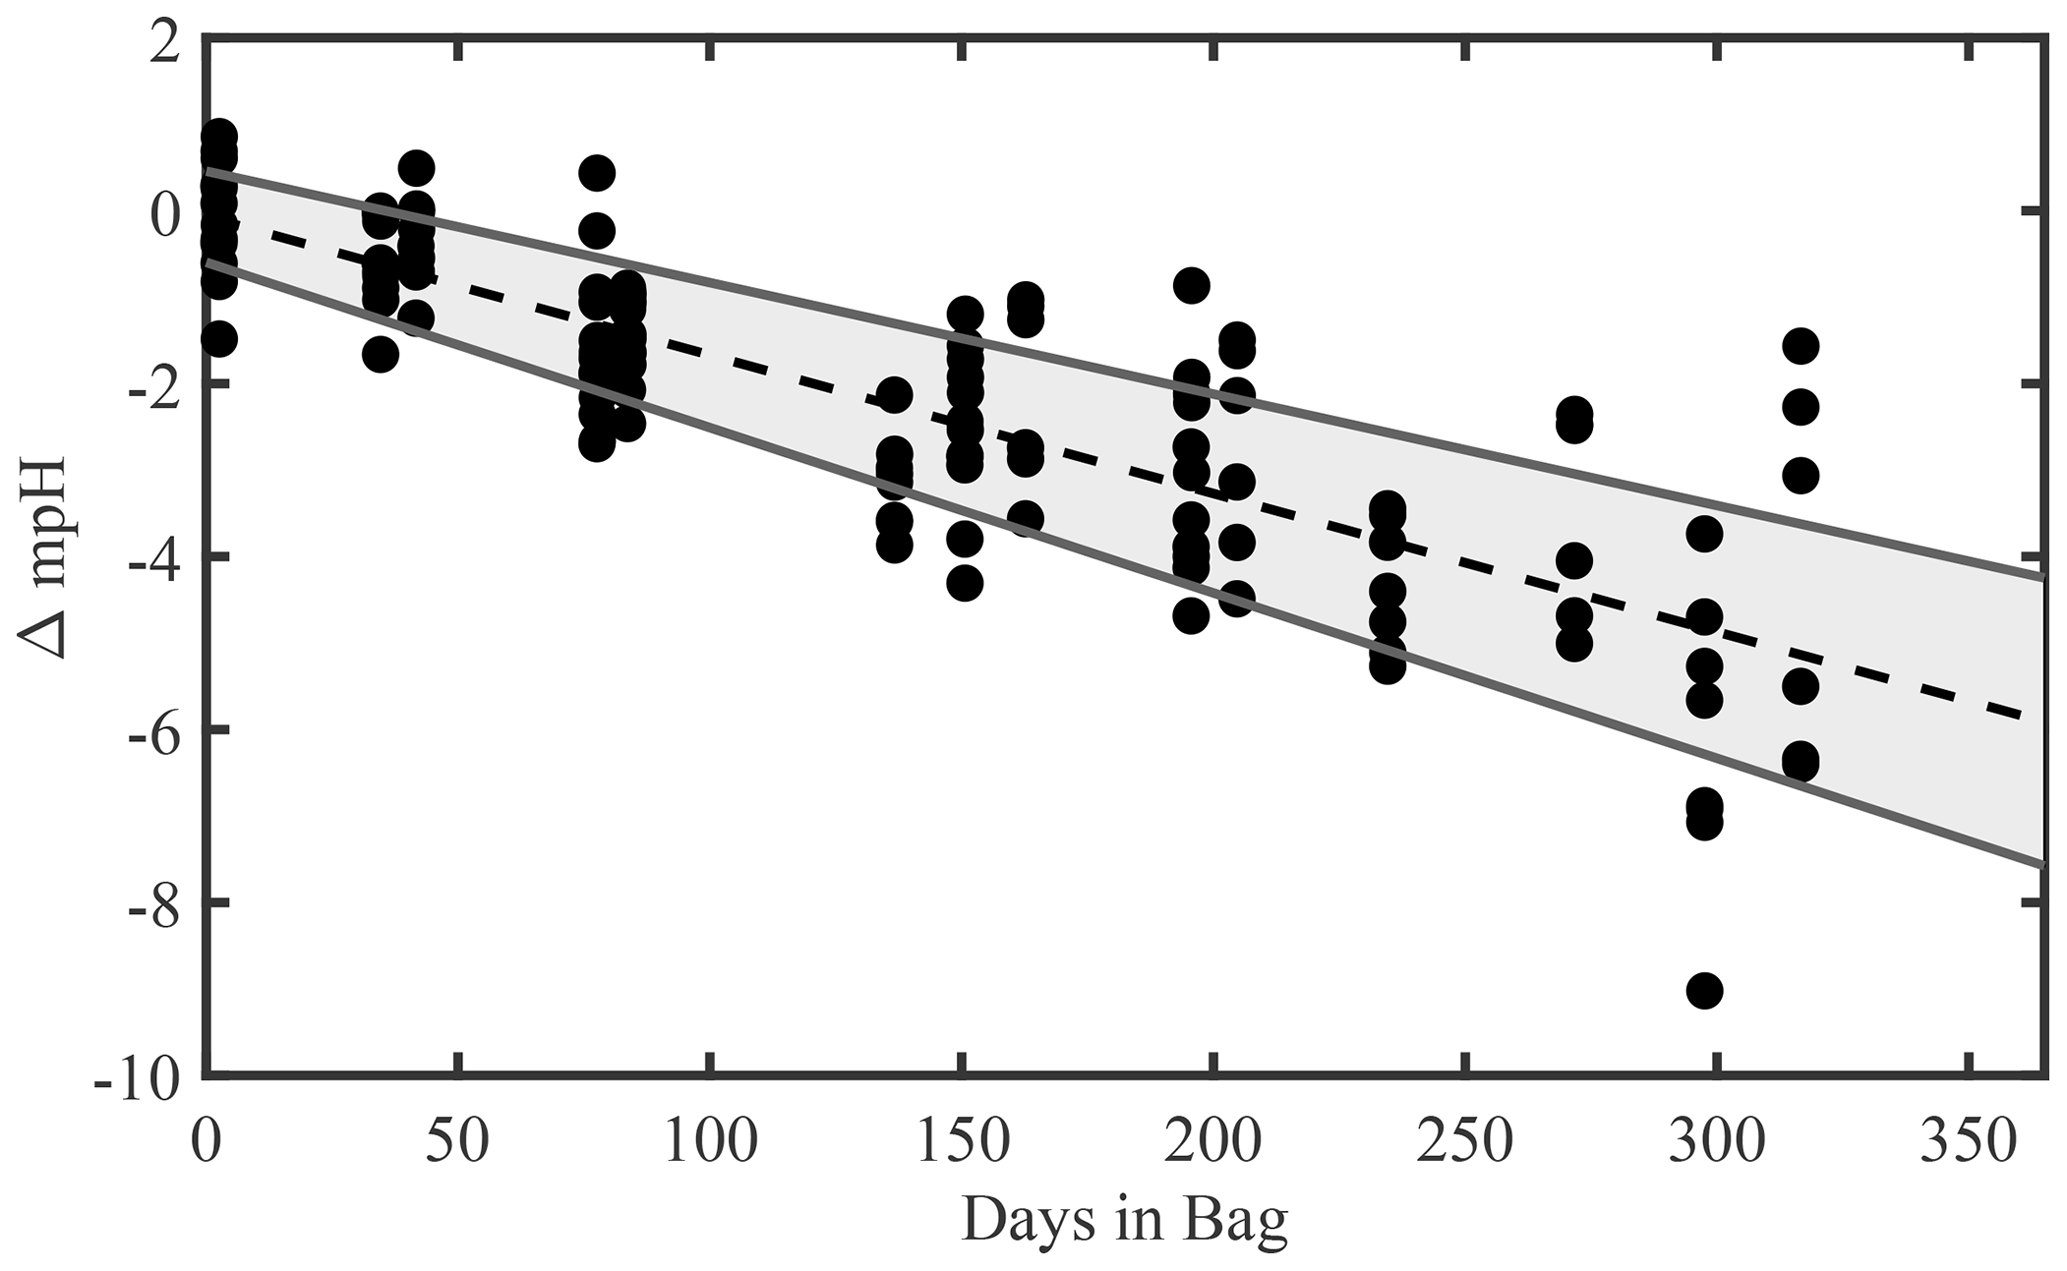
Figure 3Combined time series of measured pH in tris buffer solutions. The dots represent every measurement made on a (non-damaged) bag of tris. The dotted line is the “all bags, all batches, lab or tank” regression. The grey shaded region is the observational 95 % CI. The CI is intended to estimate the future pH of a tris bag (with known initial pH and an unmeasured bag specific rate of change). The upper and lower bounds are −0.0042 and −0.0076 pH per year, respectively.
Figure 3 depicts a composite of all test results as the change from the initial pH of tris as a function of time elapsed since bagging. A linear regression on all pH measurements, excluding the outlier of “batch 2, bag 1, lab”, of tris stored in bag types 1 or 2, has a slope of yr−1 (mean ± 95 % confidence interval (CI)). The upper and lower bounds of ΔpH at t=365 d, −0.0042, and −0.0076 are important to consider when utilizing this bagged storage method of tris. These bounds provide the broadest expected range in pH change over a year of storage and include both the intercept and slope confidence intervals (slopeCI and interceptCI, respectively). For example, the upper bound of ΔpH at t=365 d is calculated as . The outlier (batch 2, bag 1, lab) was excluded due to noticeable damage to the bag (see Fig. A3 in Appendix A), which is believed to have caused its pH to decrease at more than 2 times the average rate of the other bags. The damage appears to be a break in the metallic bag layer, potentially caused by creasing or pinching of the bag during handling. This observation highlights the importance of maintaining bag integrity, particularly during use in the field. A successful 2-week field deployment has been conducted using the tris bags described here and a modified SeapHOx in a shallow, coral reef flat (Bresnahan et al., 2021). This 2-week deployment was significantly shorter than the year of storage described here, and further field testing in longer deployments in varied environments is required before widespread use of this technology. For the longer time frame depicted in Fig. 3, the only comparable example found in the literature is the work of Lai et al. (2018). In this work, Lai et al. (2018) used bagged tris for sensor calibration, with in situ tris measurements made over 150 d. Lai et al. (2018) did not report a change in the pH of bagged tris over the deployment; however, the reported precision of the SAMI-pH in situ instrument (±0.003) would not resolve the expected change shown in our Fig. 3. Therefore, the results of Lai et al. (2018) are not inconsistent with our study.
A significant increase in CT was observed for all types of bags and bottles in Experiment 3 (Fig. 4). A high correlation between solution pH and CT was observed, with a slope of pH per 100 µmol kg−1 (n=14, r2=0.70), suggesting that the change in tris pH and CT was primarily driven by an increase in CO2. The observed slope agrees closely with a theoretical model prediction of a linear decrease in pH of −0.0024 per 100 µmol kg−1 of CT added (over the range of CT observed). There are two possible sources of the increasing CT: gas exchange of CO2 with the environment and microbial respiration within the storage vessel. Gas exchange should not be a significant source of CO2 for tris stored in a borosilicate bottle, as this is the standard equipment used to store seawater CO2 and tris buffers and is known to minimize gas exchange (Dickson et al., 2007). Therefore, it is likely that respiration was the primary driver for the increase in CT for tris stored in bottles. On average, the pH decrease in tris stored in bags was larger than that in the standard bottle (Fig. 2), indicating either an additional source of CO2 from gas exchange, or larger amounts of respiration. Distinguishing between these two theorized sources would require measurements of additional parameters such as dissolved organic carbon.
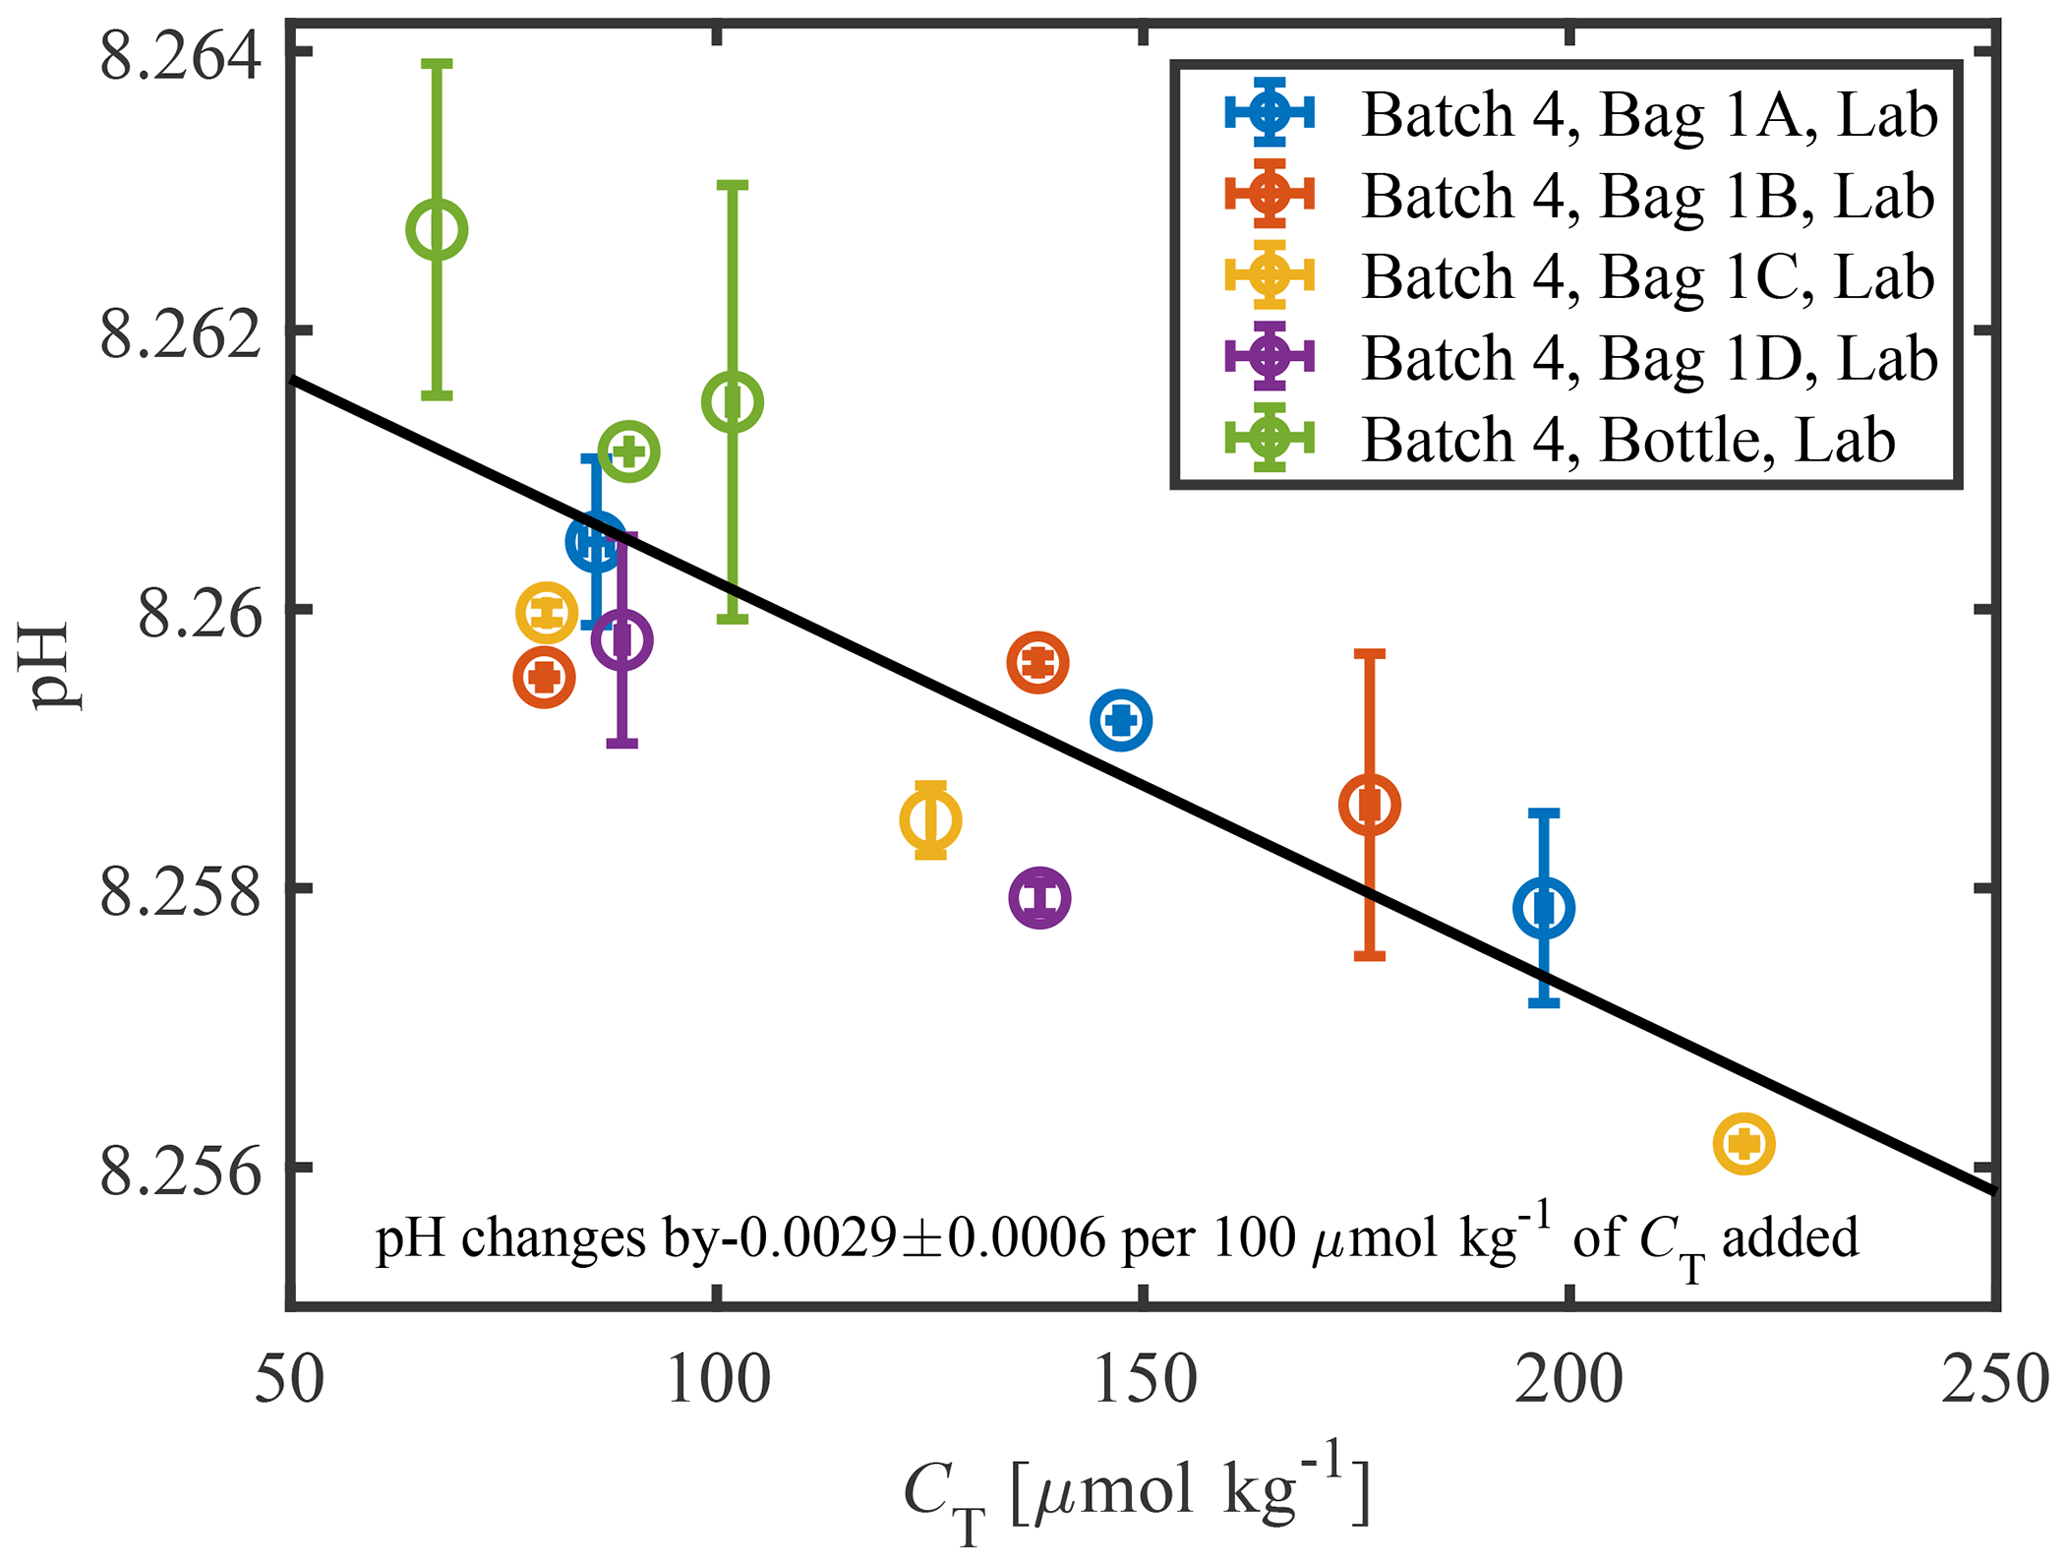
Figure 4pH plotted against CT shows a linear relationship between the two parameters in a tris buffer with a slope of −0.0029 pH for every 100 µmol kg−1 of CT added. The measurements shown are from three sampling occurrences between 130–300 d stored on bags and bottles used in Test 3. Only two measurements are shown for “batch 4, bag 1d, lab” because it ran empty before CT were made.
The pH stability of tris could be improved by reducing either likely source of CT: gas exchange or microbial respiration. For bags, CO2 may diffuse through the fittings, gasket, or bag walls, particularly if damaged. The relatively small breaks in the aluminum foil layer caused “batch 2, bag 1, lab” to decrease more than twice as fast as the average bag. Storage bag, fitting, and gasket material, as well as careful handling, are therefore important factors in minimizing gas exchange. For example, silicone is permeable to CO2 and thus could have been a path of gas exchange into the tris for this experiment. As noted above, Nemzer and Dickson (2005) found an almost negligible change of 0.5 mpH yr−1 in bottled tris. Our bottled tris changed at −3.0 mpH yr−1 (n=10 bottles measured over 161 d), approximately half the rate of the tris stored in bags. While −3.0 mpH yr−1 is near the detection limit of our measurements, it suggests that the bottling protocol used in this study was not as well controlled as that of Nemzer and Dickson (2005). For example, the Dickson lab at Scripps Institution of Oceanography regularly uses an annealing oven to combust all trace organic films that may persist on glass bottles, but in our study, bottles were not annealed. Although bags cannot be annealed, future steps that may be worth consideration to reduce microbial respiration in bags include addition of a biocide to the tris solution, acid cleaning the bags, and using ultraviolet light to remove organics from the ultrapure water used to prepare tris. There are some disadvantages to these proposed steps. Addition of a biocide may not be ideal for use in sensitive environments if the tris is discharged after use and would alter the composition of the solution slightly. While rinsing or prolonged soaking of the bags with an acid may help to remove organics, it is unclear if it would have negative effects on the integrity of the bags. Beyond removing organics on the bag surfaces, care should be taken to avoid introducing organic contaminates into the tris during the solution preparation and bag-filling procedures to minimize future respiration.
Both bag type 1 and 2 experienced problems with structural integrity during this experiment. A single type 2 bag experienced delamination of exterior bag layers when stored submerged in seawater, causing the eventual tearing and failure of the bag when handling. Bag type 2 was not used in test 3 due to this failure. It should be noted that in other studies which successfully used bag type 2, the bag was submerged in seawater for less time than in this experiment (Sayles and Eck, 2009; Aßmann et al., 2011; Wang et al., 2015). A single bag type 1 had the subtler problem of small breaks in the aluminum foil bag layer, likely causing an increased pH rate of change. In non-damaged bags, factors such as bag type/bottle, lab/tank storage, or tris batch did not have statistically significant (p value < 0.05) correlations with the pH change of tris (p values 0.12, 0.11 and 0.09, respectively). The results of the ANOVA support that tris can be held in bag type 1 or 2 and stored in a lab or tank, and the pH will change similarly regardless of storage method for up to 300 d. Additional bag types could be tested, such as bags made by Pollution Measurement Corp. used by Lai et al. (2018) or Scholle DuraShield used by Takeshita et al. (2015).
These results suggest that when bags are carefully handled prior to and after filling, tris pH changes are small over time. Specific recommendations for further work include the following: bags must be handled with care and enclosed in protective containers to prevent damage, bags must be rinsed with tris prior to filling, and additional testing is merited to determine sources of and methods to reduce contamination, such as acid washing.
This article describes our characterization of the stability of tris buffer in artificial seawater when stored in purportedly gas-impermeable bags. Several different tests, initiated over the course of a year and a half and lasting up to 300 d, exhibited an average decrease of 5.8 mpH yr−1. In comparison, tris stored in standard borosilicate bottles was shown to have a decrease of 3.0 mpH yr−1. For yearlong deployments, an expected pH change of −0.0058 is well below the weather quality threshold of 0.02 pH units. This low rate of change demonstrates the value of bagged tris for in situ validation of autonomous pH sensors (regardless of sensor operating principles), particularly in highly dynamic areas where repeatability of calibration based on discrete samples is challenging. Given the thorough characterization of tris over wide ranges of environmental variables, this contribution can aid in the traceability and intercomparability of pH sensor measurements. While valuable at the current stage of development (as demonstrated by, for example, Lai et al., 2018 and Bresnahan et al., 2021), further development would ideally result in a commercially available bag and filling procedure that can yield a rate of pH change less than the climate threshold of 0.003 per year. This will require further tests to identify the source of CO2, gas exchange, or microbial respiration, as well as steps to reduce or eliminate these sources.
Periodic measurement of bagged tris in situ would allow for detection of sensor drift. Most in situ pH sensors are deployed in the euphotic zone in coastal areas, typically resulting in expedited biofouling and sedimentation and leading to sensor drift (Bresnahan et al., 2014) that could be identified and potentially corrected. Such periodic calibration/validation would aid in identifying sensor issues and allow for greater consistency and continuity between a time series and planned or vicarious crossovers where an automated calibration can be used to augment or replace pre- and post-deployment calibrations/validations.
Table A1Detailed information about the specific reagents used to make the tris solution.

* Reagent chemicals that meet or surpass specifications of the British Pharmacopeia (BP), European Pharmacopeia (EP), Food Chemicals Codex (FCC), United States Pharmacopeia (USP).
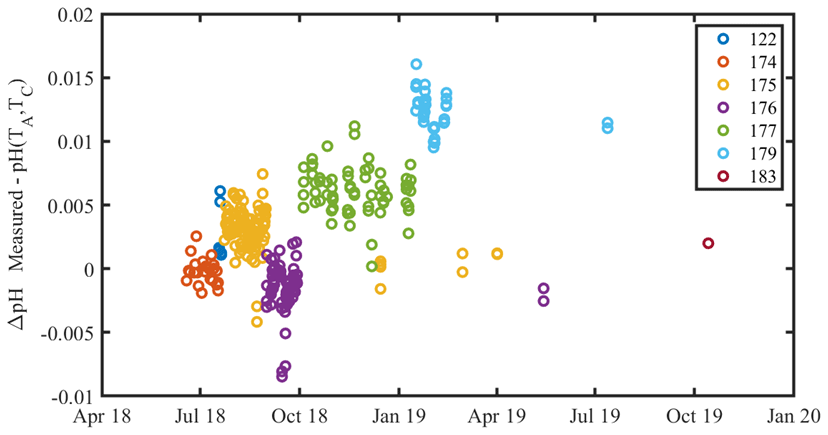
Figure A1A time series of the residual between measured and calculated CRM pH throughout the experiment. Marker color denotes CRM batch number. There is a clear variability between measured and calculated pH, which is typical of CRM batches (Andrew Dickson, personal communication, 2019). There was no observable systematic drift in the pH system during the experiment. The mean standard deviation of pH measurements within a CRM batch is 0.0016, which is comparable to the 0.0019 reported in Bockmon and Dickson (2015). The same 760 nm absorbance wavelength outlier removal procedure used for tris measurements was applied to CRM measurements.
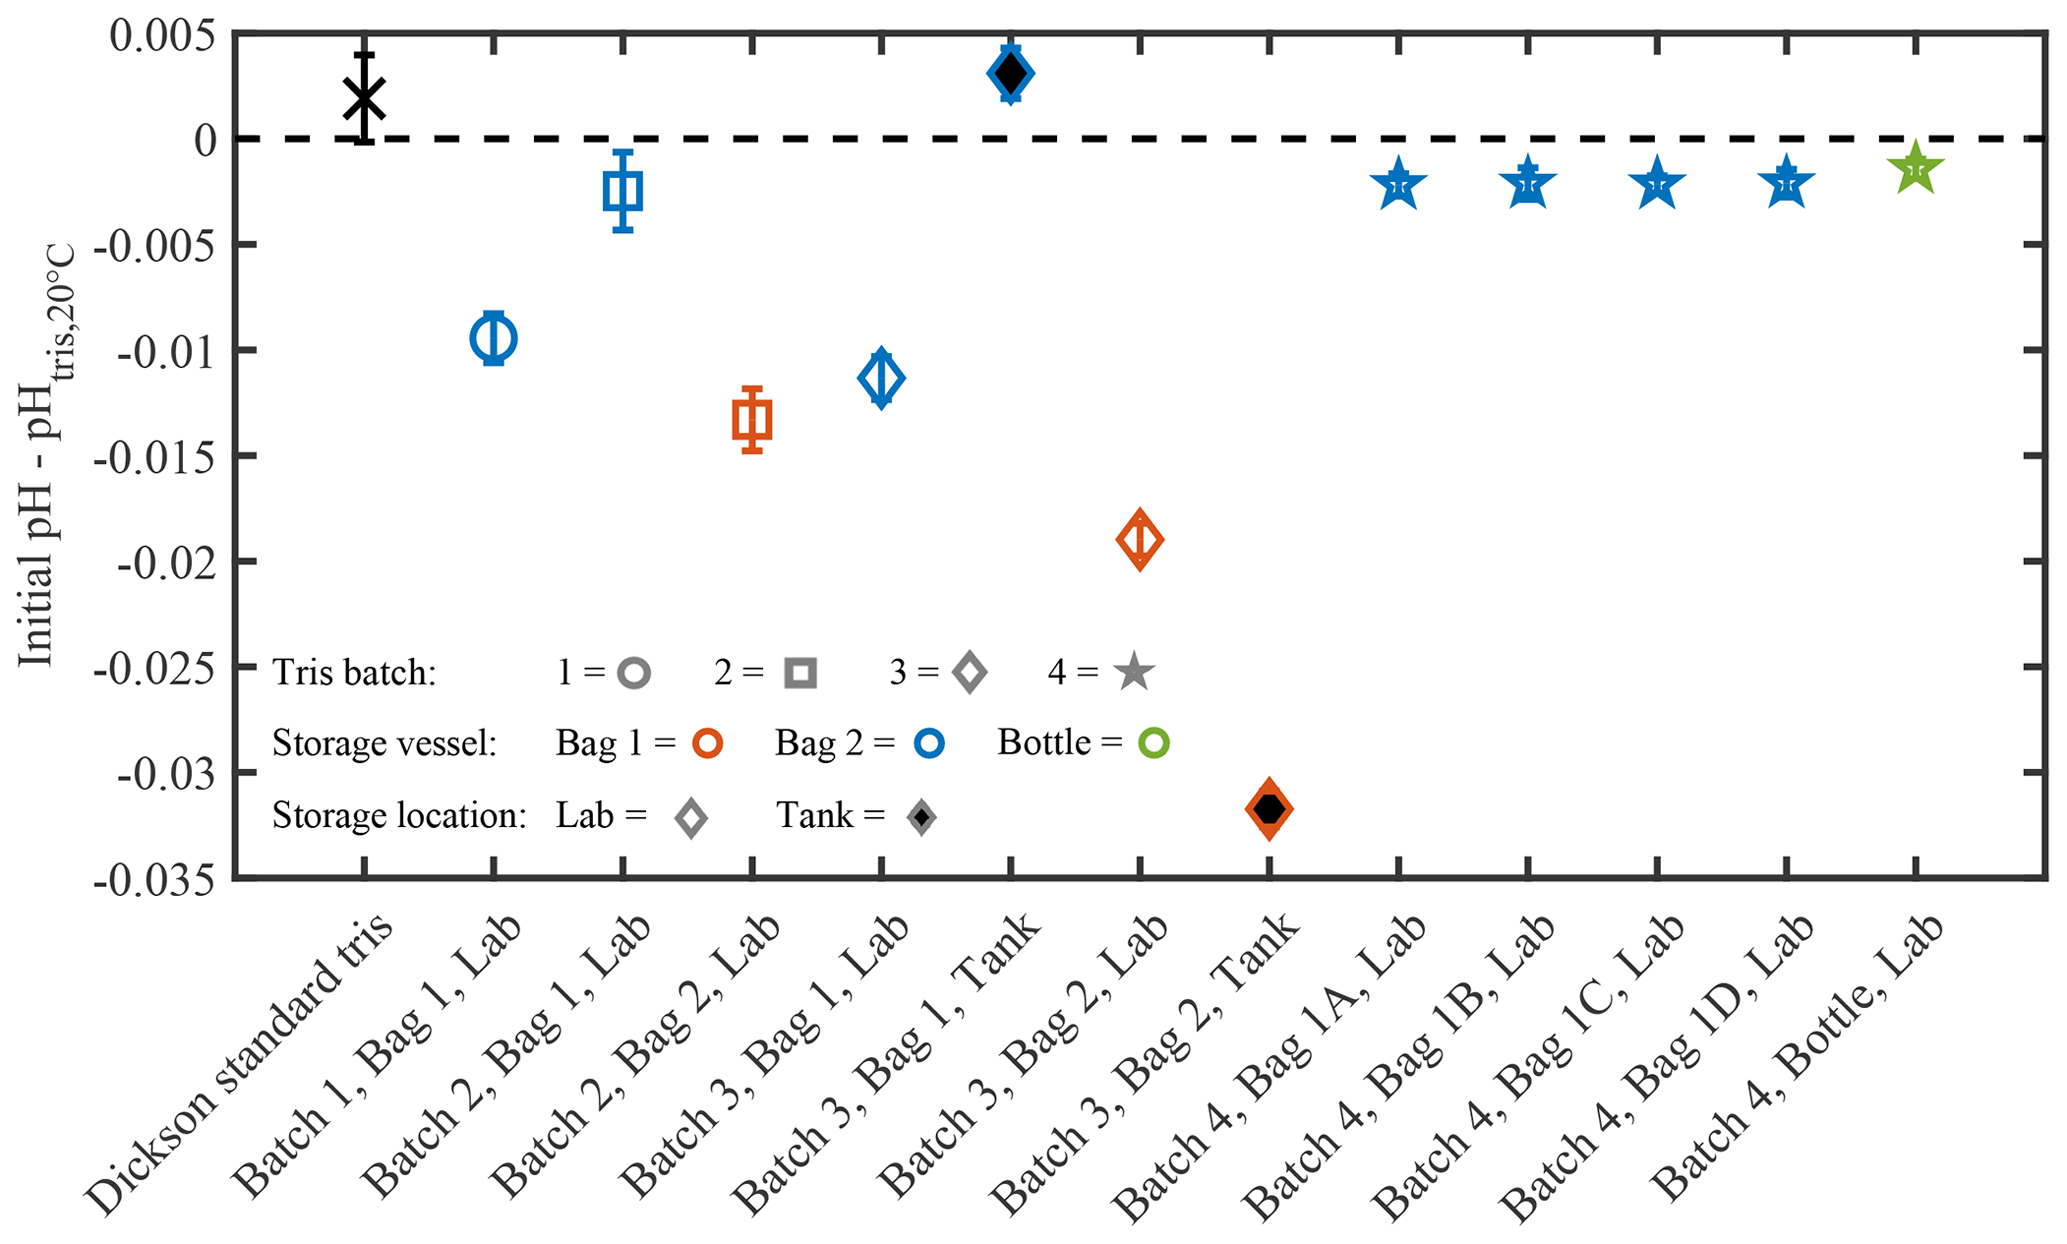
Figure A2The initial pH residual of each tris bag or bottle measured in this experiment. The initial pH is reported as a residual from the calculated pH at 20 ∘C. The initial pH was measured directly for tris batch 4 and extrapolated for tris batches 1–3. Additionally, two bottles of Dickson standard tris (show by the black “X”) were measured on 12 October 2018. The zero black dashed line is the calculated pH of tris at 20 ∘C, based upon the measured reagent concentrations (DelValls and Dickson, 1998).
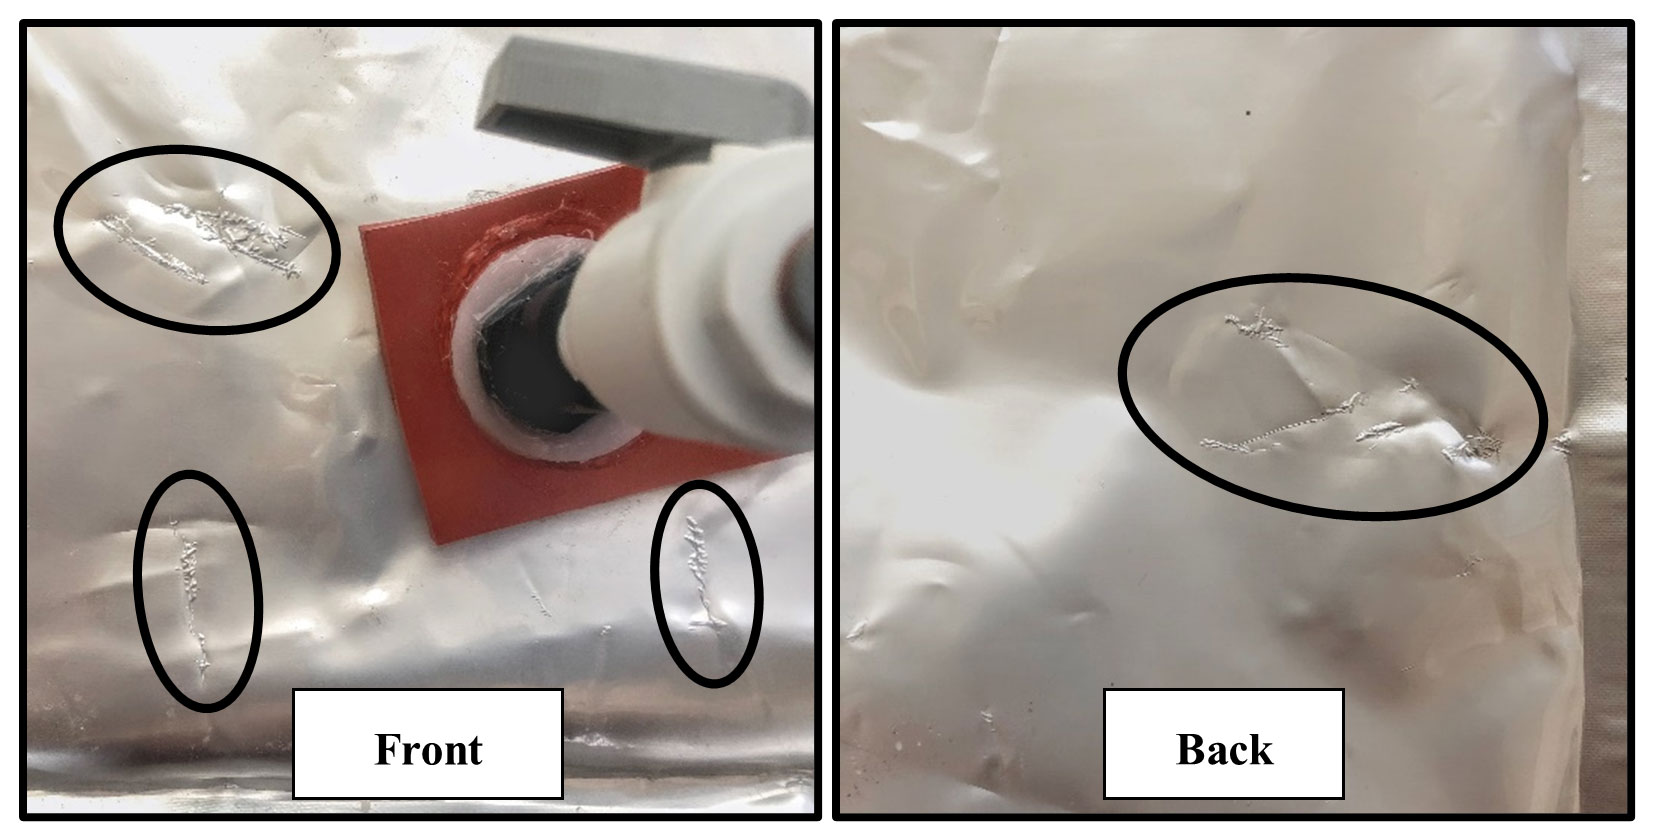
Figure A3The ovals indicate marks on the exterior of “batch 2, bag 1, lab”. These marks appear to be damage to the interior metallic layer, possibly due to creasing of the bag. These marks were not present on any other bag used in this study.
pH and CT data are available via the UC San Diego Library Digital Collections at https://doi.org/10.6075/J0QC022G (Wolfe et al., 2021).
WW performed formal analysis, visualization, and writing (original draft preparation). KS and TW contributed to investigation and writing (review and editing). PB, YT, and TM contributed to funding acquisition, conceptualization, formal analysis, and writing (review and editing).
The authors declare that they have no conflict of interest.
We thank May-Linn Paulsen and Andrew Dickson's laboratory for sharing their tris expertise throughout this project. We thank the National Science Foundation Ocean Technology and Interdisciplinary Coordination (NSF-OTIC 1736905 and NSF-OTIC 1736864) and the David and Lucile Packard Foundation for supporting this work.
This research has been supported by the National Science Foundation (grant no. 1736905).
This paper was edited by Mario Hoppema and reviewed by Jens Daniel Müller and one anonymous referee.
ACT: Protocols for the Performance Verification of In Situ pH Sensors, Alliance for Coastal Technologies, Solomons, Maryland, USA, https://doi.org/10.25607/OBP-331, 2012.
Aßmann, S., Frank, C., and Körtzinger, A.: Spectrophotometric high-precision seawater pH determination for use in underway measuring systems, Ocean Sci., 7, 597–607, https://doi.org/10.5194/os-7-597-2011, 2011.
Bandstra, L., Hales, B., and Takahashi, T.: High-frequency measurements of total CO2: Method development and first oceanographic observations, Mar. Chem., 100, 24–38, https://doi.org/10.1016/j.marchem.2005.10.009, 2006.
Bates, N., Astor, Y., Church, M., Currie, K., Dore, J., Gonzalez-Davila, M., Lorenzoni, L., Muller-Karger, F., Olafsson, J., and Santana-Casiano, J.: A Time-Series View of Changing Surface Ocean Chemistry Due to Ocean Uptake of Anthropogenic CO2 and Ocean Acidification, J. Oceanogr., 27, 126–141, https://doi.org/10.5670/oceanog.2014.16, 2014.
Bittig, H. C., Steinhoff, T., Claustre, H., Fiedler, B., Williams, N. L., Sauzède, R., Körtzinger, A., and Gattuso, J.-P.: An Alternative to Static Climatologies: Robust Estimation of Open Ocean CO2 Variables and Nutrient Concentrations From T, S, and O2 Data Using Bayesian Neural Networks, Front. Mar. Sci., 5, 328, https://doi.org/10.3389/fmars.2018.00328, 2018.
Bockmon, E. E. and Dickson, A. G.: An inter-laboratory comparison assessing the quality of seawater carbon dioxide measurements, Mar. Chem., 171, 36–43, https://doi.org/10.1016/j.marchem.2015.02.002, 2015.
Branch, T. A., DeJoseph, B. M., Ray, L. J., and Wagner, C. A.: Impacts of ocean acidification on marine seafood, Trends Ecol. Evol., 28, 178–186, https://doi.org/10.1016/j.tree.2012.10.001, 2013.
Bresnahan, P. J., Martz, T. R., Takeshita, Y., Johnson, K. S., and LaShomb, M.: Best practices for autonomous measurement of seawater pH with the Honeywell Durafet, Methods in Oceanography, 9, 44–60, https://doi.org/10.1016/j.mio.2014.08.003, 2014.
Bresnahan, P. J., Takeshita, Y., Wirth, T., Martz, T. R., Cyronak, T., Albright, R., Wolfe, K., Warren, J. K., and Mertz, K.: Autonomous in situ calibration of ion-sensitive field effect transistor pH sensors, Limnol. Oceanogr.-Meth., 19, 132–144, https://doi.org/10.1002/lom3.10410, 2021.
Bushinsky, S. M., Takeshita, Y., and Williams, N. L.: Observing changes in ocean carbonate chemistry: our autonomous future, Current Climate Change Reports, 5, 207–220, https://doi.org/10.1007/s40641-019-00129-8, 2019.
Byrne, R. H.: Measuring Ocean Acidification: New Technology for a New Era of Ocean Chemistry, Environ. Sci. Technol., 48, 5352–5360, https://doi.org/10.1021/es405819p, 2014.
Carter, B., Radich, J., Doyle, H., and Dickson, A.: An automated system for spectrophotometric seawater pH measurements, Limnol. Oceanogr.-Meth., 11, 16–27, https://doi.org/10.4319/lom.2013.11.16, 2013.
Carter, B. R., Feely, R. A., Williams, N. L., Dickson, A. G., Fong, M. B., and Takeshita, Y.: Updated methods for global locally interpolated estimation of alkalinity, pH, and nitrate, Limnol. Oceanogr.-Meth., 16, 119–131, https://doi.org/10.1002/lom3.10232, 2018.
Chavez, F., Pennington, J. T., Michisaki, R., Blum, M., Chavez, G., Friederich, J., Jones, B., Herlien, R., Kieft, B., Hobson, B., Ren, A., Ryan, J., Sevadjian, J., Wahl, C., Walz, K., Yamahara, K., Friederich, G., and Messié, M.: Climate Variability and Change: Response of a Coastal Ocean Ecosystem, J. Oceanogr., 30, 128–145, https://doi.org/10.5670/oceanog.2017.429, 2017.
Cooley, S. R. and Doney, S. C.: Anticipating ocean acidification's economic consequences for commercial fisheries, Environ. Res. Lett., 4, 8, https://doi.org/10.1088/1748-9326/4/2/024007, 2009.
DeGrandpre, M. D., Spaulding, R. S., Newton, J. O., Jaqueth, E. J., Hamblock, S. E., Umansky, A. A., and Harris, K. E.: Considerations for the measurement of spectrophotometric pH for ocean acidification and other studies, Limnol. Oceanogr.-Meth., 12, 830–839, https://doi.org/10.4319/lom.2014.12.830, 2014.
DelValls, T. and Dickson, A.: The pH of buffers based on 2-amino-2-hydroxymethyl-1,3-propanediol (`tris') in synthetic sea water, Deep-Sea Res. Pt. I, 45, 1541–1554, https://doi.org/10.1016/S0967-0637(98)00019-3, 1998.
Dickson, A. G.: An exact definition of total alkalinity and a procedure for the estimation of alkalinity and total inorganic carbon from titration data, Deep-Sea Res. Pt. I, 28, 609–623, 1981.
Dickson, A. G.: pH buffers for sea-water media based on the total hydrogen-ion concentration scale, Deep-Sea Res. Pt. I, 40, 107–118, https://doi.org/10.1016/0967-0637(93)90055-8, 1993.
Dickson, A. G.: Reference materials for oceanic CO2 measurements, J. Oceanogr., 14, 21–22, 2001.
Dickson, A. G., Sabine, C. L., and Christian, J. R.: Guide to Best Practices for Ocean CO2 Measurements, PICES Special Publication 3, North Pacific Marine Science Organization, Sidney, British Columbia, 191 pp., 2007.
Doney, S. C., Fabry, V. J., Feely, R. A., and Kleypas, J. A.: Ocean acidification: the other CO2 problem, Annu. Rev. Mar. Sci., 1, 169–192, https://doi.org/10.1146/annurev.marine.010908.163834, 2009.
Doney, S. C., Busch, D. S., Cooley, S. R., and Kroeker, K. J.: The impacts of ocean acidification on marine ecosystems and reliant human communities, Annu. Rev. Env. Resour., 45, 83–112, https://doi.org/10.1146/annurev-environ-012320-083019, 2020.
Friederich, G., Walz, P., Burczynski, M., and Chavez, F.: Inorganic carbon in the central California upwelling system during the 1997–1999 El Niño–La Niña event, Prog. Oceanogr., 54, 185–203, https://doi.org/10.1016/S0079-6611(02)00049-6, 2002.
Hales, B., Takahashi, T., and Bandstra, L.: Atmospheric CO2 uptake by a coastal upwelling system, Global Biogeochem. Cy., 19, GB1009, https://doi.org/10.1029/2004gb002295, 2005.
Johnson, K. S., Jannasch, H. W., Coletti, L. J., Elrod, V. A., Martz, T. R., Takeshita, Y., Carlson, R. J., and Connery, J. G.: Deep-Sea DuraFET: A Pressure Tolerant pH Sensor Designed for Global Sensor Networks, Anal. Chem., 88, 3249–3256, https://doi.org/10.1021/acs.analchem.5b04653, 2016.
Johnson, K. S., Plant, J. N., Coletti, L. J., Jannasch, H. W., Sakamoto, C. M., Riser, S. C., Swift, D. D., Williams, N. L., Boss, E., Haëntjens, N., Talley, L. D., and Sarmiento, J. L.: Biogeochemical sensor performance in the SOCCOM profiling float array, J. Geophys. Res.-Oceans, 122, 6416–6436, https://doi.org/10.1002/2017jc012838, 2017.
Karl, D. M.: Oceanic ecosystem time-series programs: Ten lessons learned, J. Oceanogr., 23, 104–125, https://doi.org/10.5670/oceanog.2010.27, 2010.
Lai, C.-Z., DeGrandpre, M. D., and Darlington, R. C.: Autonomous Optofluidic Chemical Analyzers for Marine Applications: Insights from the Submersible Autonomous Moored Instruments (SAMI) for pH and pCO2, Front. Mar. Sci., 4, 438, https://doi.org/10.3389/fmars.2017.00438, 2018.
Liu, X. W., Patsavas, M. C., and Byrne, R. H.: Purification and Characterization of meta-Cresol Purple for Spectrophotometric Seawater pH Measurements, Environ. Sci. Technol., 45, 4862–4868, https://doi.org/10.1021/es200665d, 2011.
Martz, T. R., Daly, K. L., Byrne, R. H., Stillman, J. H., and Turk, D.: Technology for ocean acidification research needs and availability, J. Oceanogr., 28, 40–47, https://doi.org/10.5670/oceanog.2015.30, 2015.
McLaughlin, K., Dickson, A., Weisberg, S. B., Coale, K., Elrod, V., Hunter, C., Johnson, K. S., Kram, S., Kudela, R., Martz, T., Negrey, K., Passow, U., Shaughnessy, F., Smith, J. E., Tadesse, D., Washburn, L., and Weis, K. R.: An evaluation of ISFET sensors for coastal pH monitoring applications, Regional Studies in Marine Science, 12, 11–18, https://doi.org/10.1016/j.rsma.2017.02.008, 2017.
Müller, J., Bastkowski, F., Sander, B., Seitz, S., Turner, D., Dickson, A., and Rehder, G.: Metrology for pH Measurements in Brackish Waters-Part 1: Extending Electrochemical pH(T) Measurements of TRIS Buffers to Salinities 5–20, Fron. Mar. Sci., 5, 176, https://doi.org/10.3389/fmars.2018.00176, 2018.
Müller, J. D. and Rehder, G.: Metrology of pH Measurements in Brackish Waters – Part 2: Experimental Characterization of Purified meta-Cresol Purple for Spectrophotometric pHT Measurements, Frontiers in Marine Science, 5, 177, https://doi.org/10.3389/fmars.2018.00177, 2018.
Nemzer, B. and Dickson, A.: The stability and reproducibility of Tris buffers in synthetic seawater, Mar. Chem., 96, 237–242, https://doi.org/10.1016/j.marchem.2005.01.004, 2005.
Newton, J., Feely, R., Jewett, E., Williamson, P., and Mathis, J.: Global Ocean Acidification Observing Network: Requirements and Governance Plan, 2nd Edn., Global ocean acidification observing network, Seattle, Washington, USA, 2015.
O'Sullivan, D. W. and Millero, F. J.: Continual measurement of the total inorganic carbon in surface seawater, Mar. Chem., 60, 75–83, https://doi.org/10.1016/s0304-4203(97)00079-0, 1998.
Okazaki, R. R., Sutton, A. J., Feely, R. A., Dickson, A. G., Alin, S. R., Sabine, C. L., Bunje, P. M. E., and Virmani, J. I.: Evaluation of marine pH sensors under controlled and natural conditions for the Wendy Schmidt Ocean Health XPRIZE, Limnol. Oceanogr.-Meth., 15, 586–600, https://doi.org/10.1002/lom3.10189, 2017.
Paulsen, M. L. and Dickson, A. G.: Preparation of 2-amino-2-hydroxymethyl-1, 3-propanediol (TRIS) pHT buffers in synthetic seawater, Limnol. Oceanogr.-Meth., 18, 504–515, https://doi.org/10.1002/lom3.10383, 2020.
Papadimitriou, S., Loucaides, S., Rérolle, V., Achterberg, E. P., Dickson, A. G., Mowlem, M., and Kennedy, H.: The measurement of pH in saline and hypersaline media at sub-zero temperatures: Characterization of Tris buffers, Mar. Chem., 184, 11–20, https://doi.org/10.1016/j.marchem.2016.06.002, 2016.
Pierrot, D., Neill, C., Sullivan, K., Castle, R., Wanninkhof, R., Lüger, H., Johannessen, T., Olsen, A., Feely, R. A., and Cosca, C. E.: Recommendations for autonomous underway pCO2 measuring systems and data-reduction routines, Deep-Sea Res. Pt. II, 56, 512–522, https://doi.org/10.1016/j.dsr2.2008.12.005, 2009.
Rodriguez, C., Huang, F., and Millero, F. J.: The partial molal volume and compressibility of Tris and Tris–HCl in water and 0.725 m NaCl as a function of temperature, Deep-Sea Res. Pt. I, 104, 41–51, https://doi.org/10.1016/j.dsr.2015.06.008, 2015.
Sabine, C., Sutton, A., McCabe, K., Lawrence-Slavas, N., Alin, S., Feely, R., Jenkins, R., Maenner, S., Meinig, C., and Thomas, J.: Evaluation of a new carbon dioxide system for autonomous surface vehicles, J. Atmos. Ocean. Tech., 37, 1305–1317, https://doi.org/10.1175/JTECH-D-20-0010.1, 2020.
Sayles, F. L. and Eck, C.: An autonomous instrument for time series analysis of TCO2 from oceanographic moorings, Deep-Sea Res. Pt. I, 56, 1590–1603, https://doi.org/10.1016/j.dsr.2009.04.006, 2009.
Seidel, M. P., DeGrandpre, M. D., and Dickson, A. G.: A sensor for in situ indicator-based measurements of seawater pH, Mar. Chem., 109, 18–28, https://doi.org/10.1016/j.marchem.2007.11.013, 2008.
Sloyan, B. M., Wanninkhof, R., Kramp, M., Johnson, G. C., Talley, L. D., Tanhua, T., McDonagh, E., Cusack, C., O'Rourke, E., McGovern, E., Katsumata, K., Diggs, S., Hummon, J., Ishii, M., Azetsu-Scott, K., Boss, E., Ansorge, I., Perez, F. F., Mercier, H., Williams, M. J. M., Anderson, L., Lee, J. H., Murata, A., Kouketsu, S., Jeansson, E., Hoppema, M., and Campos, E.: The Global Ocean Ship-Based Hydrographic Investigations Program (GO-SHIP): A Platform for Integrated Multidisciplinary Ocean Sci., Front. Mar. Sci., 6, 445, https://doi.org/10.3389/fmars.2019.00445, 2019.
Spaulding, R. S., DeGrandpre, M. D., Beck, J. C., Hart, R. D., Peterson, B., De Carlo, E. H., Drupp, P. S., and Hammar, T. R.: Autonomous in Situ Measurements of Seawater Alkalinity, Environ. Sci. Technol., 48, 9573–9581, https://doi.org/10.1021/es501615x, 2014.
Sutton, A. J., Feely, R. A., Maenner-Jones, S., Musielwicz, S., Osborne, J., Dietrich, C., Monacci, N., Cross, J., Bott, R., Kozyr, A., Andersson, A. J., Bates, N. R., Cai, W.-J., Cronin, M. F., De Carlo, E. H., Hales, B., Howden, S. D., Lee, C. M., Manzello, D. P., McPhaden, M. J., Meléndez, M., Mickett, J. B., Newton, J. A., Noakes, S. E., Noh, J. H., Olafsdottir, S. R., Salisbury, J. E., Send, U., Trull, T. W., Vandemark, D. C., and Weller, R. A.: Autonomous seawater pCO2 and pH time series from 40 surface buoys and the emergence of anthropogenic trends, Earth Syst. Sci. Data, 11, 421–439, https://doi.org/10.5194/essd-11-421-2019, 2019.
Takeshita, Y., Frieder, C. A., Martz, T. R., Ballard, J. R., Feely, R. A., Kram, S., Nam, S., Navarro, M. O., Price, N. N., and Smith, J. E.: Including high-frequency variability in coastal ocean acidification projections, Biogeosciences, 12, 5853–5870, https://doi.org/10.5194/bg-12-5853-2015, 2015.
Takeshita, Y., McGillis, W., Briggs, E. M., Carter, A. L., Donham, E. M., Martz, T. R., Price, N. N., and Smith, J. E.: Assessment of net community production and calcification of a coral reef using a boundary layer approach, J. Geophys. Res.-Oceans, 121, 5655–5671, https://doi.org/10.1002/2016JC011886, 2016.
Takeshita, Y., Martz, T. R., Coletti, L. J., Dickson, A. G., Jannasch, H. W., and Johnson, K. S.: The effects of pressure on pH of Tris buffer in synthetic seawater, Mar. Chem., 188, 1–5, https://doi.org/10.1016/j.marchem.2016.11.002, 2017.
Takeshita, Y., Johnson, K. S., Martz, T. R., Plant, J. N., and Sarmiento, J. L.: Assessment of Autonomous pH Measurements for Determining Surface Seawater Partial Pressure of CO2, J. Geophys. Res.-Oceans, 123, 4003–4013, https://doi.org/10.1029/2017jc013387, 2018.
Takeshita, Y., Warren, J. K., Liu, X., Spaulding, R. S., Byrne, R. H., Carter, B. R., DeGrandpre, M. D., Murata, A., and Watanabe, S.: Consistency and stability of purified meta-cresol purple for spectrophotometric pH measurements in seawater, Mar. Chem., in review, 2021.
Tilbrook, B., Jewett, E. B., DeGrandpre, M. D., Hernandez-Ayon, J. M., Feely, R. A., Gledhill, D. K., Hansson, L., Isensee, K., Kurz, M. L., Newton, J. A., Siedlecki, S. A., Chai, F., Dupont, S., Graco, M., Calvo, E., Greeley, D., Kapsenberg, L., Lebrec, M., Pelejero, C., Schoo, K. L., and Telszewski, M.: An Enhanced Ocean Acidification Observing Network: From People to Technology to Data Synthesis and Information Exchange, Frontiers in Marine Science, 6, 21, https://doi.org/10.3389/fmars.2019.00337, 2019.
Wang, Z. A., Sonnichsen, F. N., Bradley, A. M., Hoering, K. A., Lanagan, T. M., Chu, S. N., Hammar, T. R., and Camilli, R.: In Situ Sensor Technology for Simultaneous Spectrophotometric Measurements of Seawater Total Dissolved Inorganic Carbon and pH, Environ. Sci. Technol., 49, 4441–4449, https://doi.org/10.1021/es504893n, 2015.
Wang, Z. A., Moustahfid, H., Mueller, A. V., Michel, A. P. M., Mowlem, M., Glazer, B. T., Mooney, T. A., Michaels, W., McQuillan, J. S., Robidart, J. C., Churchill, J., Sourisseau, M., Daniel, A., Schaap, A., Monk, S., Friedman, K., and Brehmer, P.: Advancing Observation of Ocean Biogeochemistry, Biology, and Ecosystems With Cost-Effective in situ Sensing Technologies, Frontiers in Marine Science, 6, 22, https://doi.org/10.3389/fmars.2019.00519, 2019.
Williams, N. L., Juranek, L. W., Johnson, K. S., Feely, R. A., Riser, S. C., Talley, L. D., Russell, J. L., Sarmiento, J. L., and Wanninkhof, R.: Empirical algorithms to estimate water column pH in the Southern Ocean, Geophys. Res. Lett., 43, 3415–3422, https://doi.org/10.1002/2016gl068539, 2016.
Wolfe, W. H., Shipley, K. M., Bresnahan, P. J., Takeshita, Y., Wirth, T., and Martz, T. R.: Data from: Technical note: stability of tris pH buffer in artificial seawater stored in bags, UC San Diego Library Digital Collections, https://doi.org/10.6075/J0QC022G, 2021.