the Creative Commons Attribution 4.0 License.
the Creative Commons Attribution 4.0 License.
 | 27 Jan 2021
The impacts of runoff decrease and shoreline change on the salinity distribution in the wetlands of Liao River estuary, China
Mingliang Zhang
Tianping Xu
Hengzhi Jiang
The wetland of Liao River estuary (LRE) in northeastern China is one of the best-preserved wetlands across the globe. However, it is extremely vulnerable to hydrological changes as well as other disturbances, particularly upstream river discharges and the reclamation from anthropogenic activities. In this study, a 3D hydrodynamic model was used to reproduce the flow patterns of the LRE and to explore the variation in salinity under different scenarios. Furthermore, the impact of river discharge and shoreline changes on the salinity distribution in the LRE was quantitatively analyzed and discussed through several simulation experiments. The model reasonably reconstructed the spatiotemporal variability and distribution of salinity in the Liao River estuary and the wetlands across intertidal areas. Increases in runoff were demonstrated to significantly decrease the mean salinity values of the estuary, with changes in salinity negatively correlated to the longitudinal distance from the estuary mouth. Moreover, the shoreline change caused by the construction of Panjin Port was observed to have an obvious influence on the salinity distribution of the LRE, particularly in the lower reaches of the Pink Beach wetland. Comparisons of the Liao River estuary residual flow fields under different shorelines revealed that the establishment of the port resulted in the diffusion of the runoff from the Daliao River due to the obstruction of the port body, which enhanced the tidal mixing effect and consequently weakened the dilution effect of freshwater entering the Pink Beach wetland. Overall, the current study should be helpful for offering a greater understanding of Suaeda heteroptera vegetation degradation in the LRE, China, and also provides a new perspective in investigating the degradation mechanism in other estuarine wetlands.
- Article
(14825 KB) - Full-text XML
- BibTeX
- EndNote


Estuaries are located at the interface area of rivers, land and the ocean and are commonly described as enclosed or semi-enclosed bodies of water, where seawater is significantly diluted by the inflow of freshwater from upstream rivers. Accumulated freshwater can potentially regulate water and salinity at different temporal scales and can offer the possibility to optimize suitable salinity conditions for animal and plant habitats within the estuarine zone. Estuaries are thus considered as highly productive ecosystems. As an essential component of estuaries, estuarine wetlands function as the bond connecting terrestrial and coastal water ecosystems, possessing features from both terrestrial and aquatic environments. Wetlands in estuaries are characterized by high biodiversity and hold the unique role of maintaining the ecological equilibrium (McClain et al., 2003). Estuarine wetlands can provide substantial ecological services, including flood control, sediment retention, the uptake of pollutants and carbon fixation and also act as habitats for fish, waterfowl and other biotic communities (Tsihrintzis et al., 1998; Weilhoefer, 2011; Yang et al., 2018).
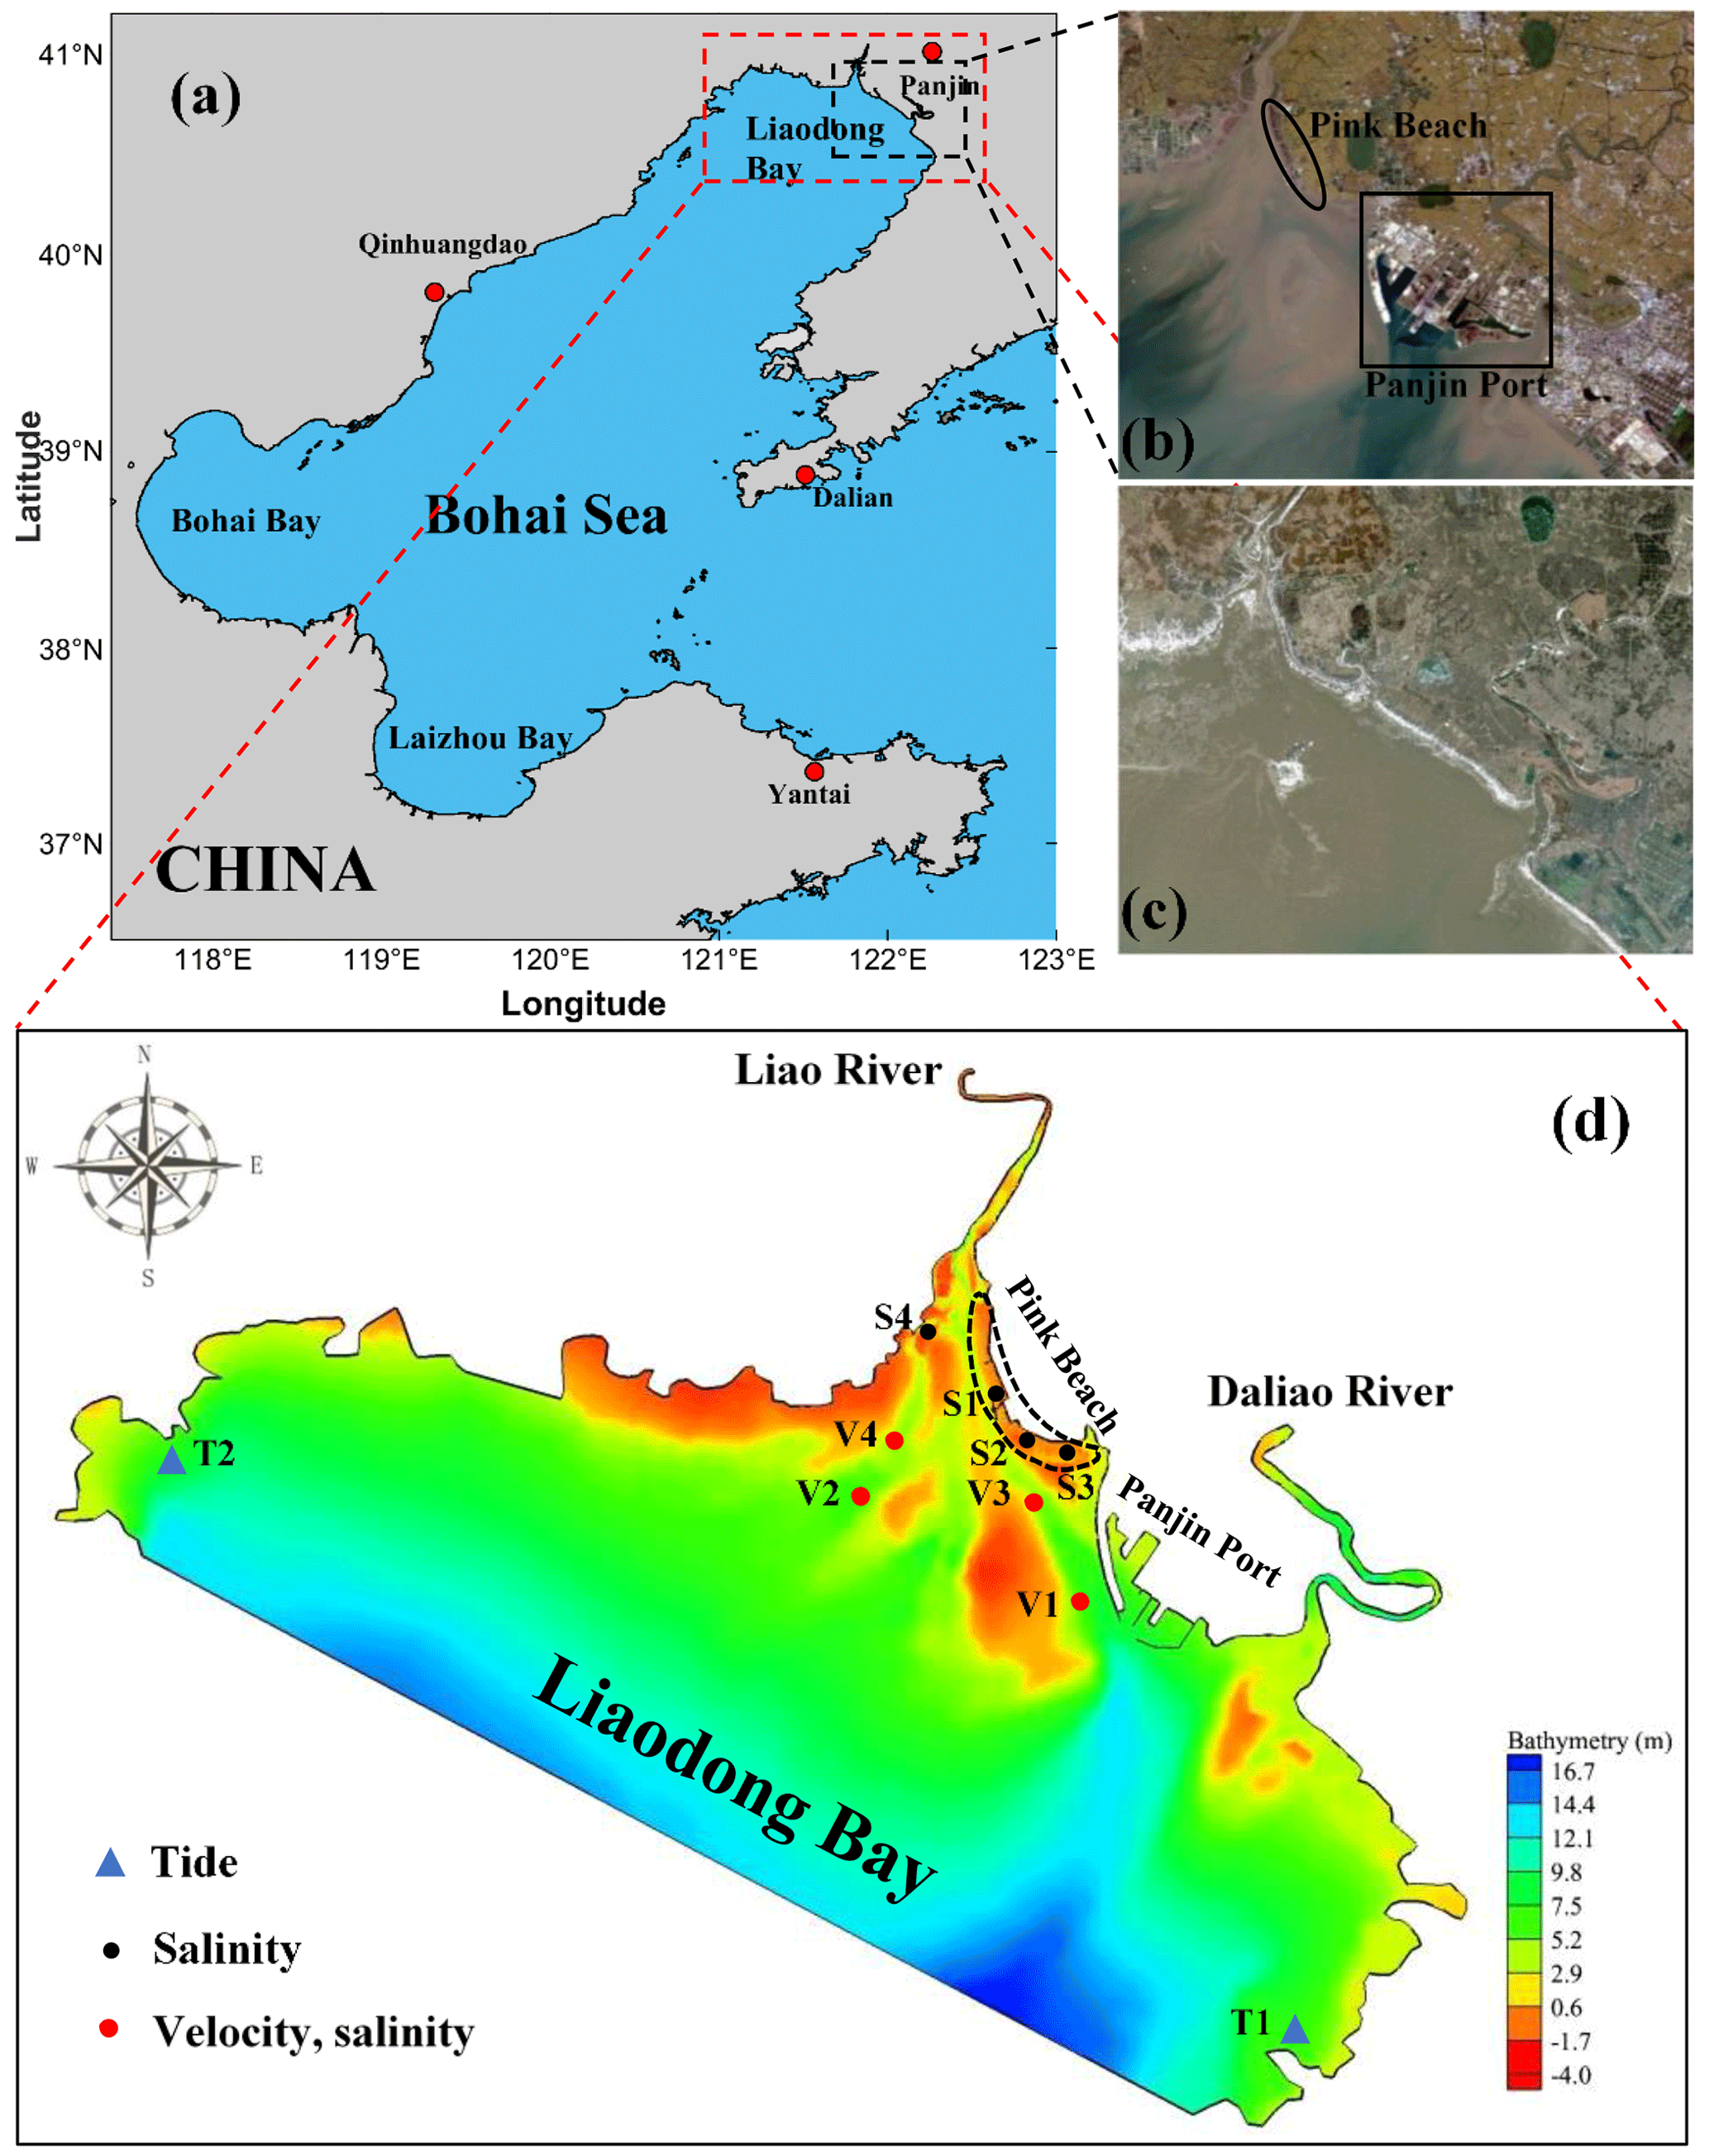
Figure 1Sketch maps of the study domain. (a) The geographical position of the LRE. (b) The Landsat image of intermediate and eastern area of the LRE in 2019 (from Geospatial Data Cloud, Computer Network Information Center, Chinese Academy of Sciences: http://www.gscloud.cn/, last access: 20 November 2019). The black elliptical shape represents the PBW region, and the black rectangle denotes the Panjin Port area. (c) The Landsat image of eastern LRE in 1995. (d) The bathymetry of the LRE waters (positive values represent water depth and negative values indicate land elevation), the observation stations and analysis gauges. The blue triangles denote the tidal stations, the red circles are the tidal flow and salinity observation stations, and the black circles represent the analysis gauges used for salinity comparison.
Estuaries form an environment with sinuous coastlines, where rivers, streams or creek inlets meet the sea or ocean. The hydrological properties of estuaries create a complex physical environment due to the combined effects of upstream rivers and the adjacent ocean. Estuary circulations are primarily controlled by freshwater discharge, the tidal range and tidal currents (Sassi and Hoitink, 2013; Veerapaga et al., 2019) and are modified by winds, shorelines and topography (Alebregtse and de Swart, 2016; Lai et al., 2018), which further influence the processes of salinity transport and salt wedges in estuary waters (Haralambidou et al., 2010; Gong and Shen, 2011; Liu et al., 2019). Salinity changes in estuaries have been the focal point of much work over the past few decades in order to understand saltwater intrusion mechanisms, with the majority of the research based on on-site observations and numerical models. Early studies analyzed observation data to investigate the salt intrusion phenomenon in estuaries, with further evaluations performed on estuary mixing type, salt intrusion distance, salinity distribution and the current circulation (Pritchard, 1952, 1954; Hansen and Rattray, 1965). This was followed by field surveys via instrumentation of acoustic-Doppler-current profilers (ADCP) and conductivity–temperature–depth (CTD), whereby researchers investigated the salinity distribution characteristics and the salt transport mechanisms in the Hudson River estuary (Bowen and Geyer, 2003; Lerczak et al., 2006). Studies suggested that the salt intrusion in an estuary is maintained by two opposite longitudinal transport processes: (i) an advection resulting from freshwater outflow, which tends to drive salt out of the estuary, and (ii) a down-gradient advection, which drives salt landward (Lerczak et al., 2006). The salinity patterns in estuaries were also demonstrated to be the result of additional factors, such as the longitudinal advection and vertical mixing (MacCready, 2011; Scully and Geyer, 2012).

Figure 2Mesh sketch of the LRE (a) and detailed meshes for the Panjin Port region in 1995 (b) and 2019 (c).

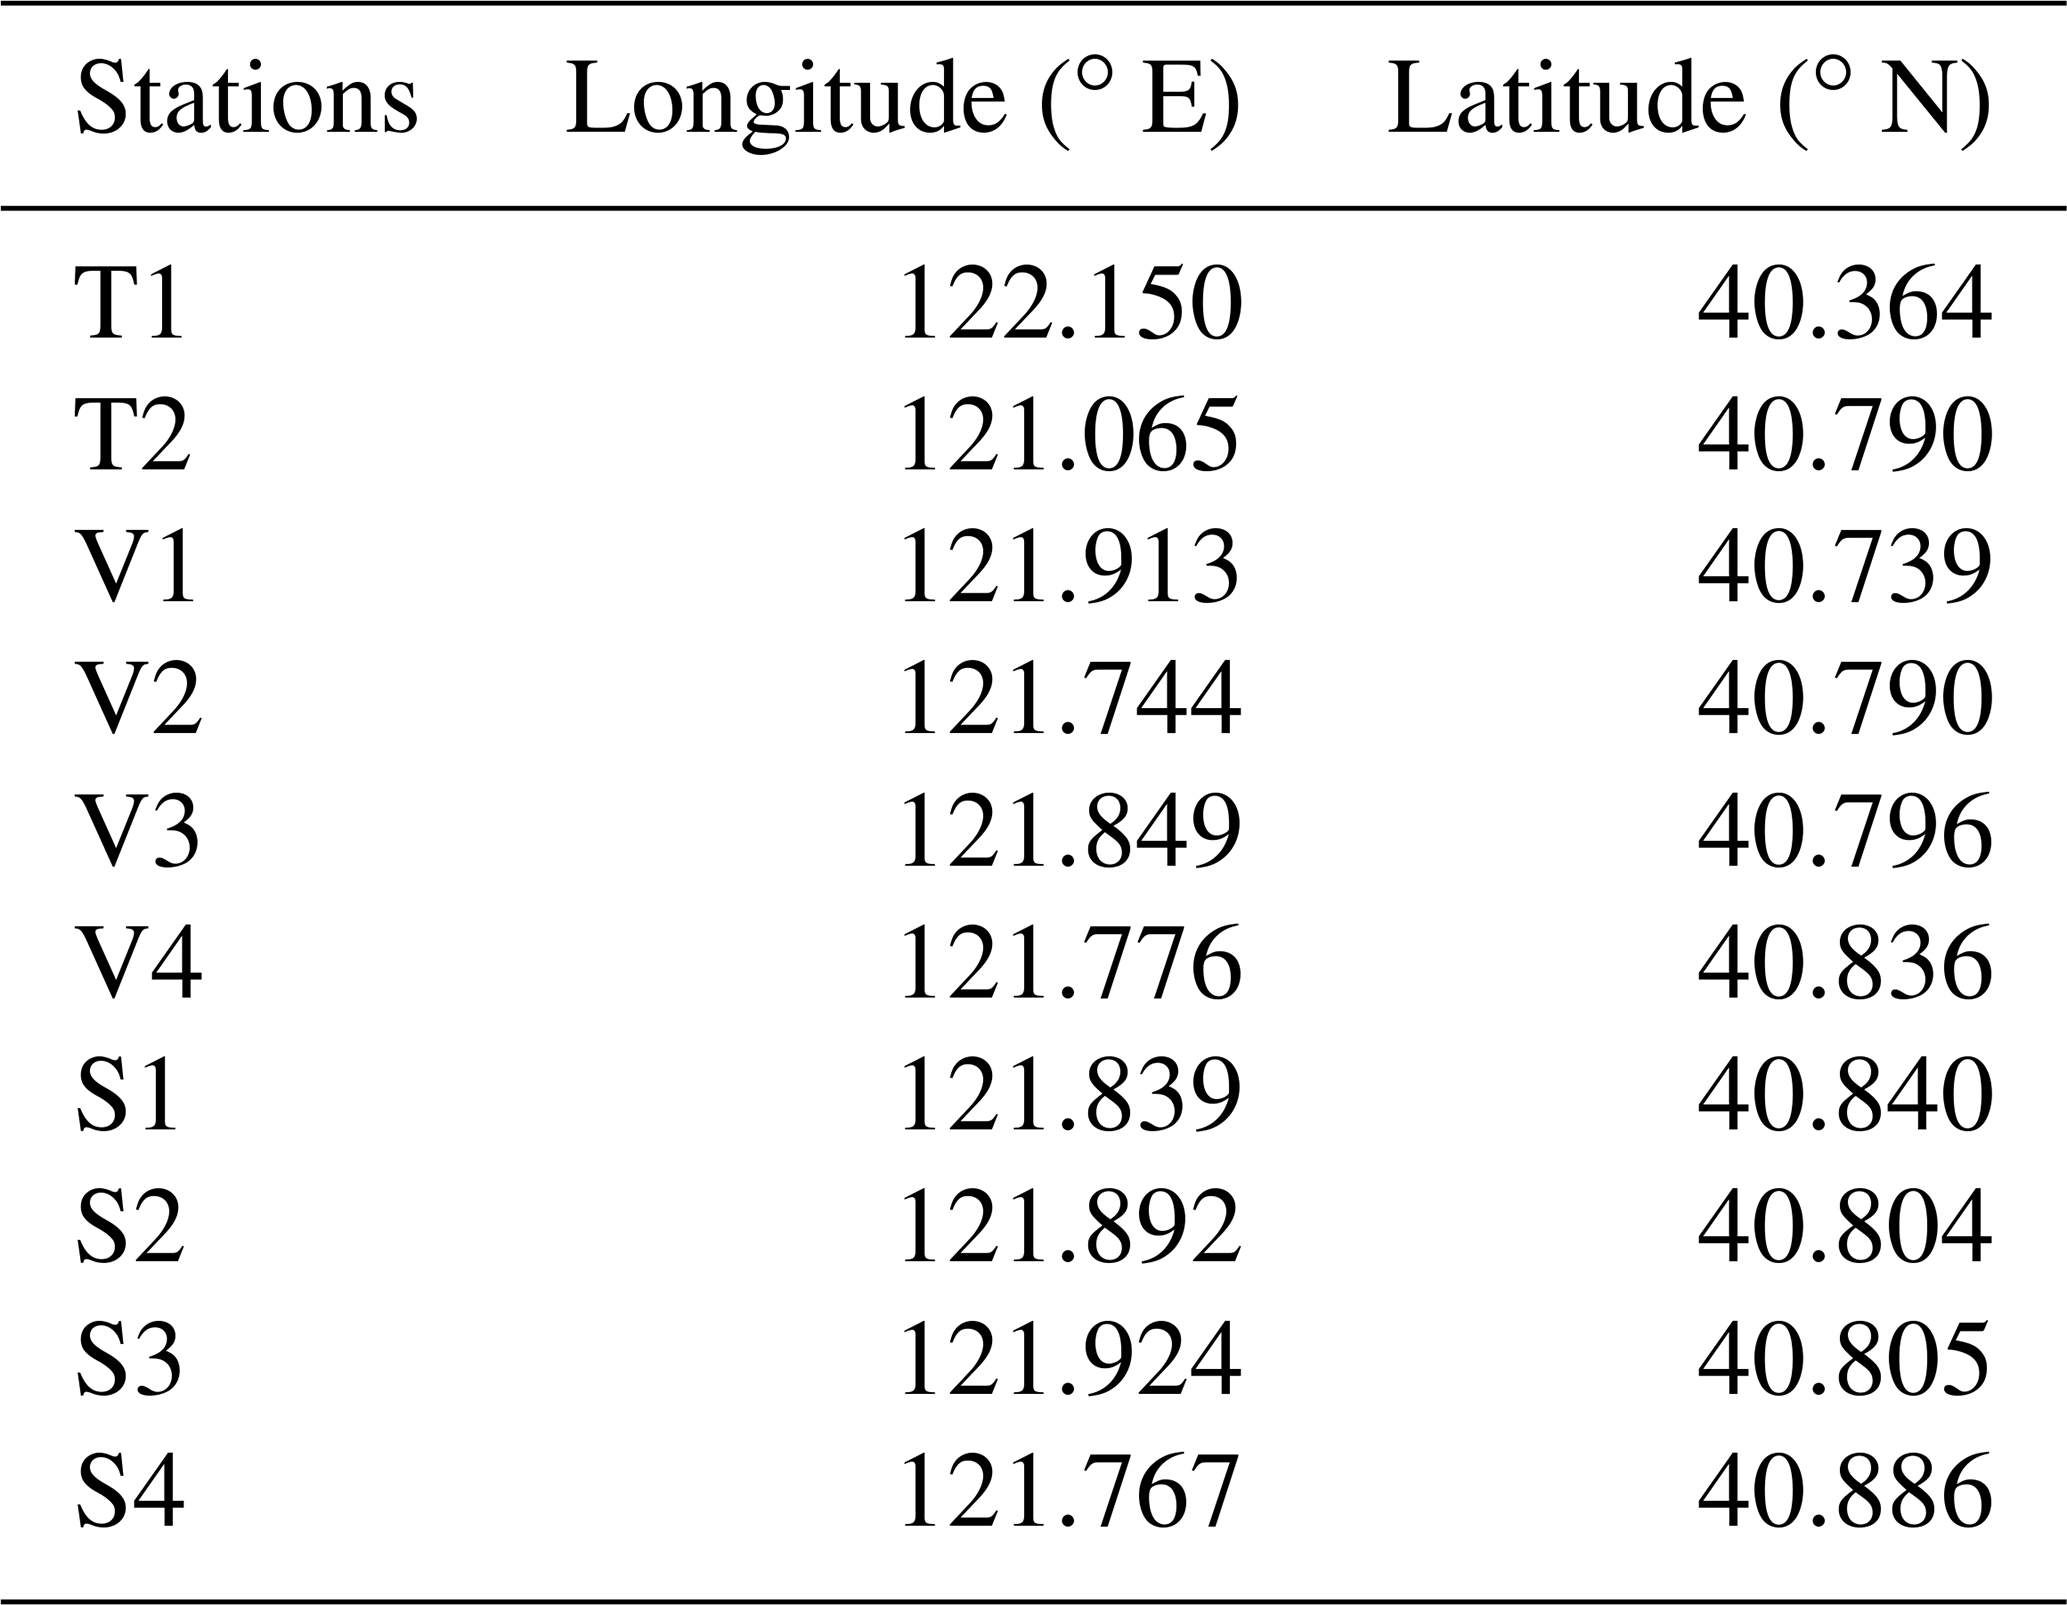
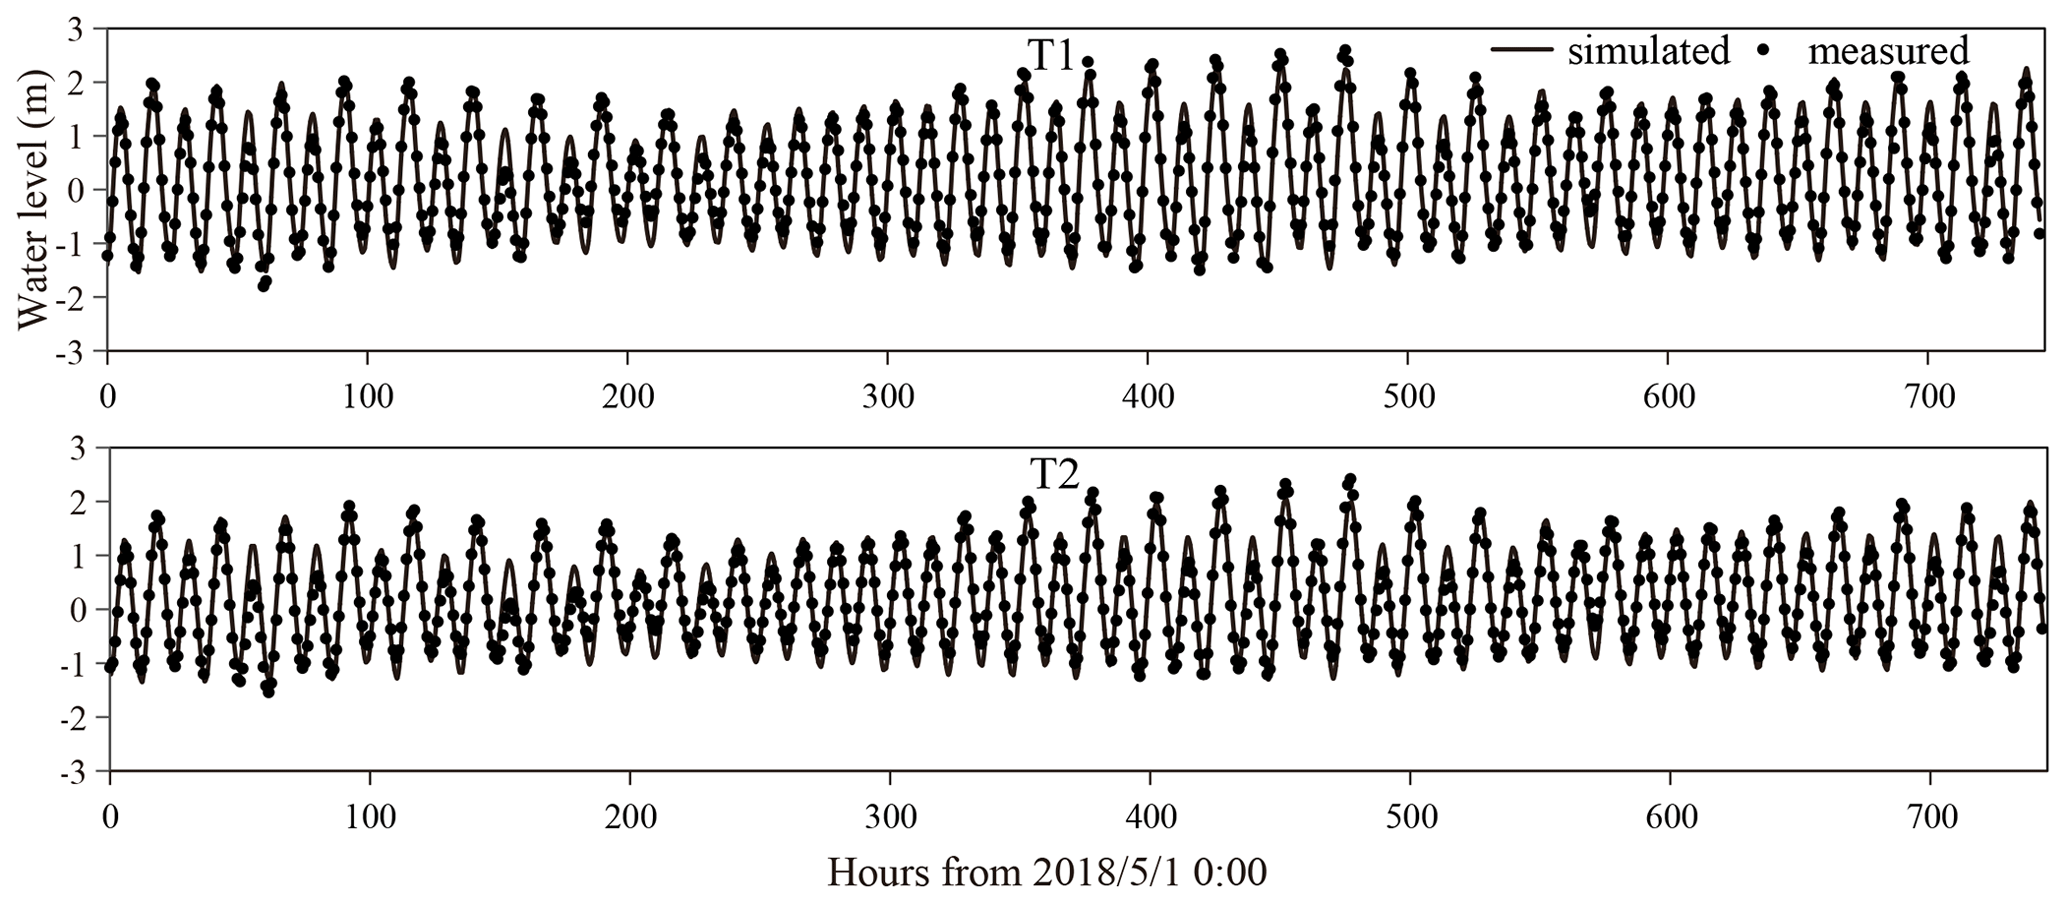
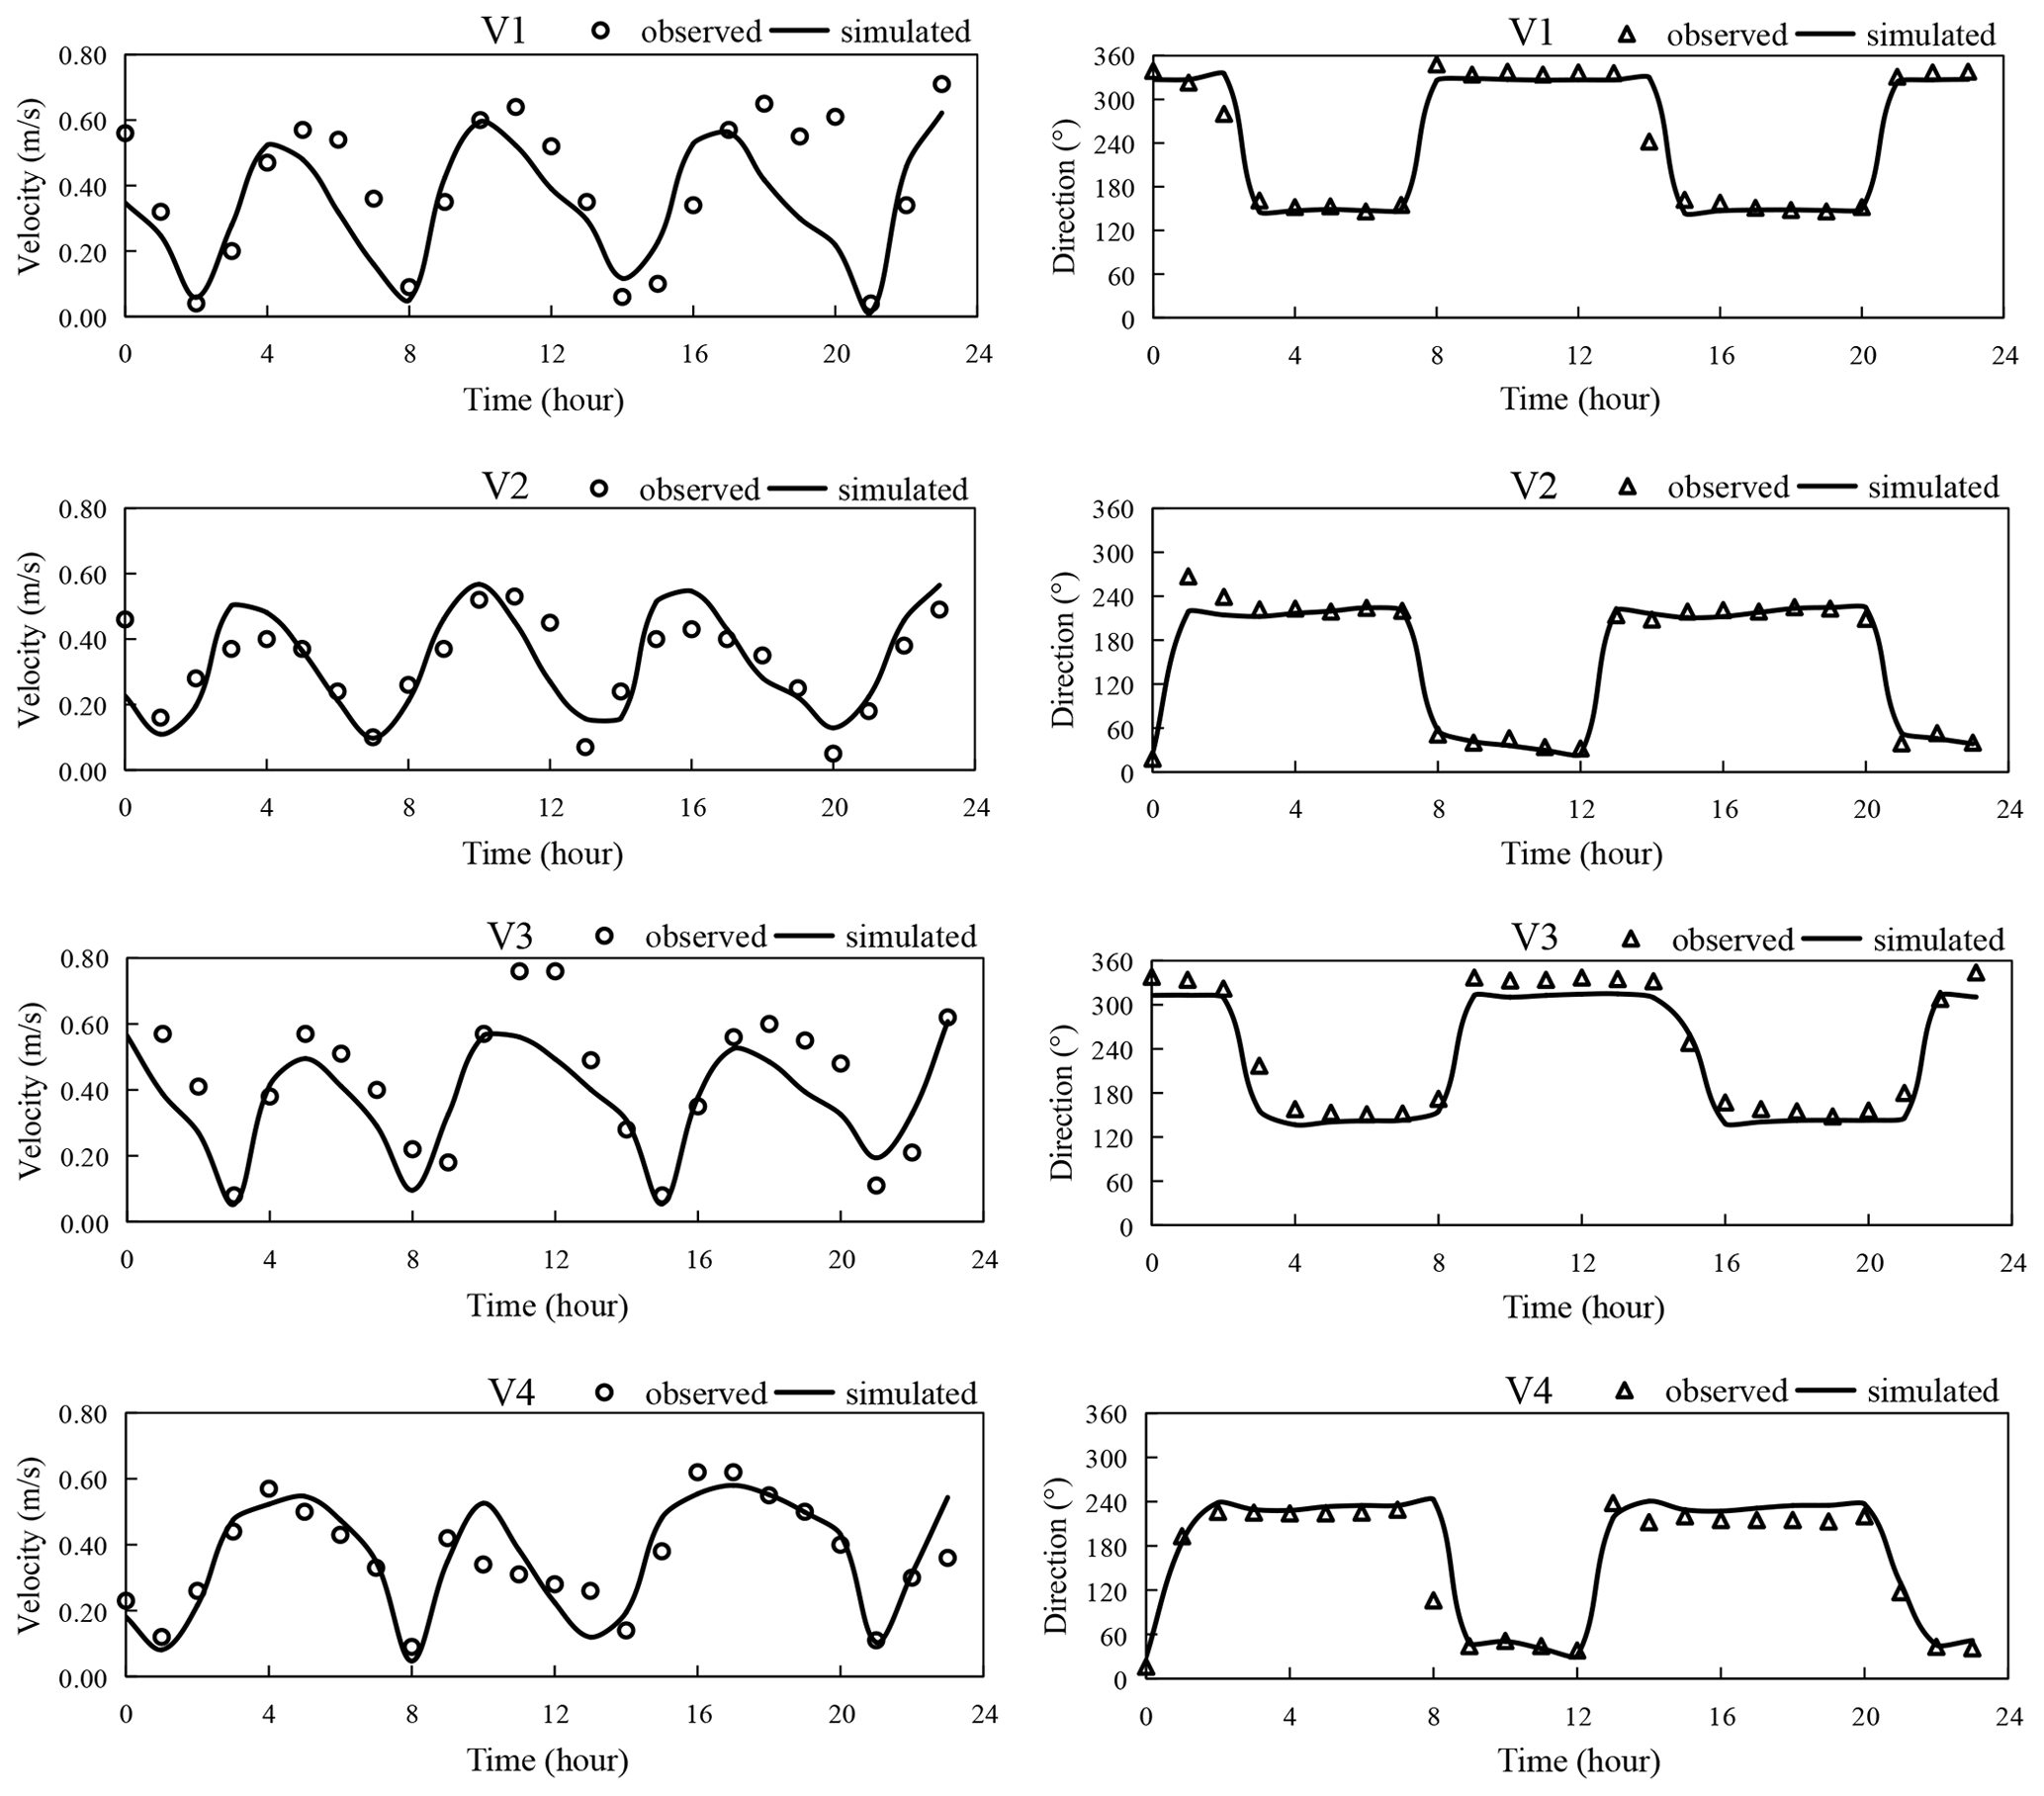
Figure 4Comparison of simulated and measured tidal currents at the monitoring stations during neap tide.
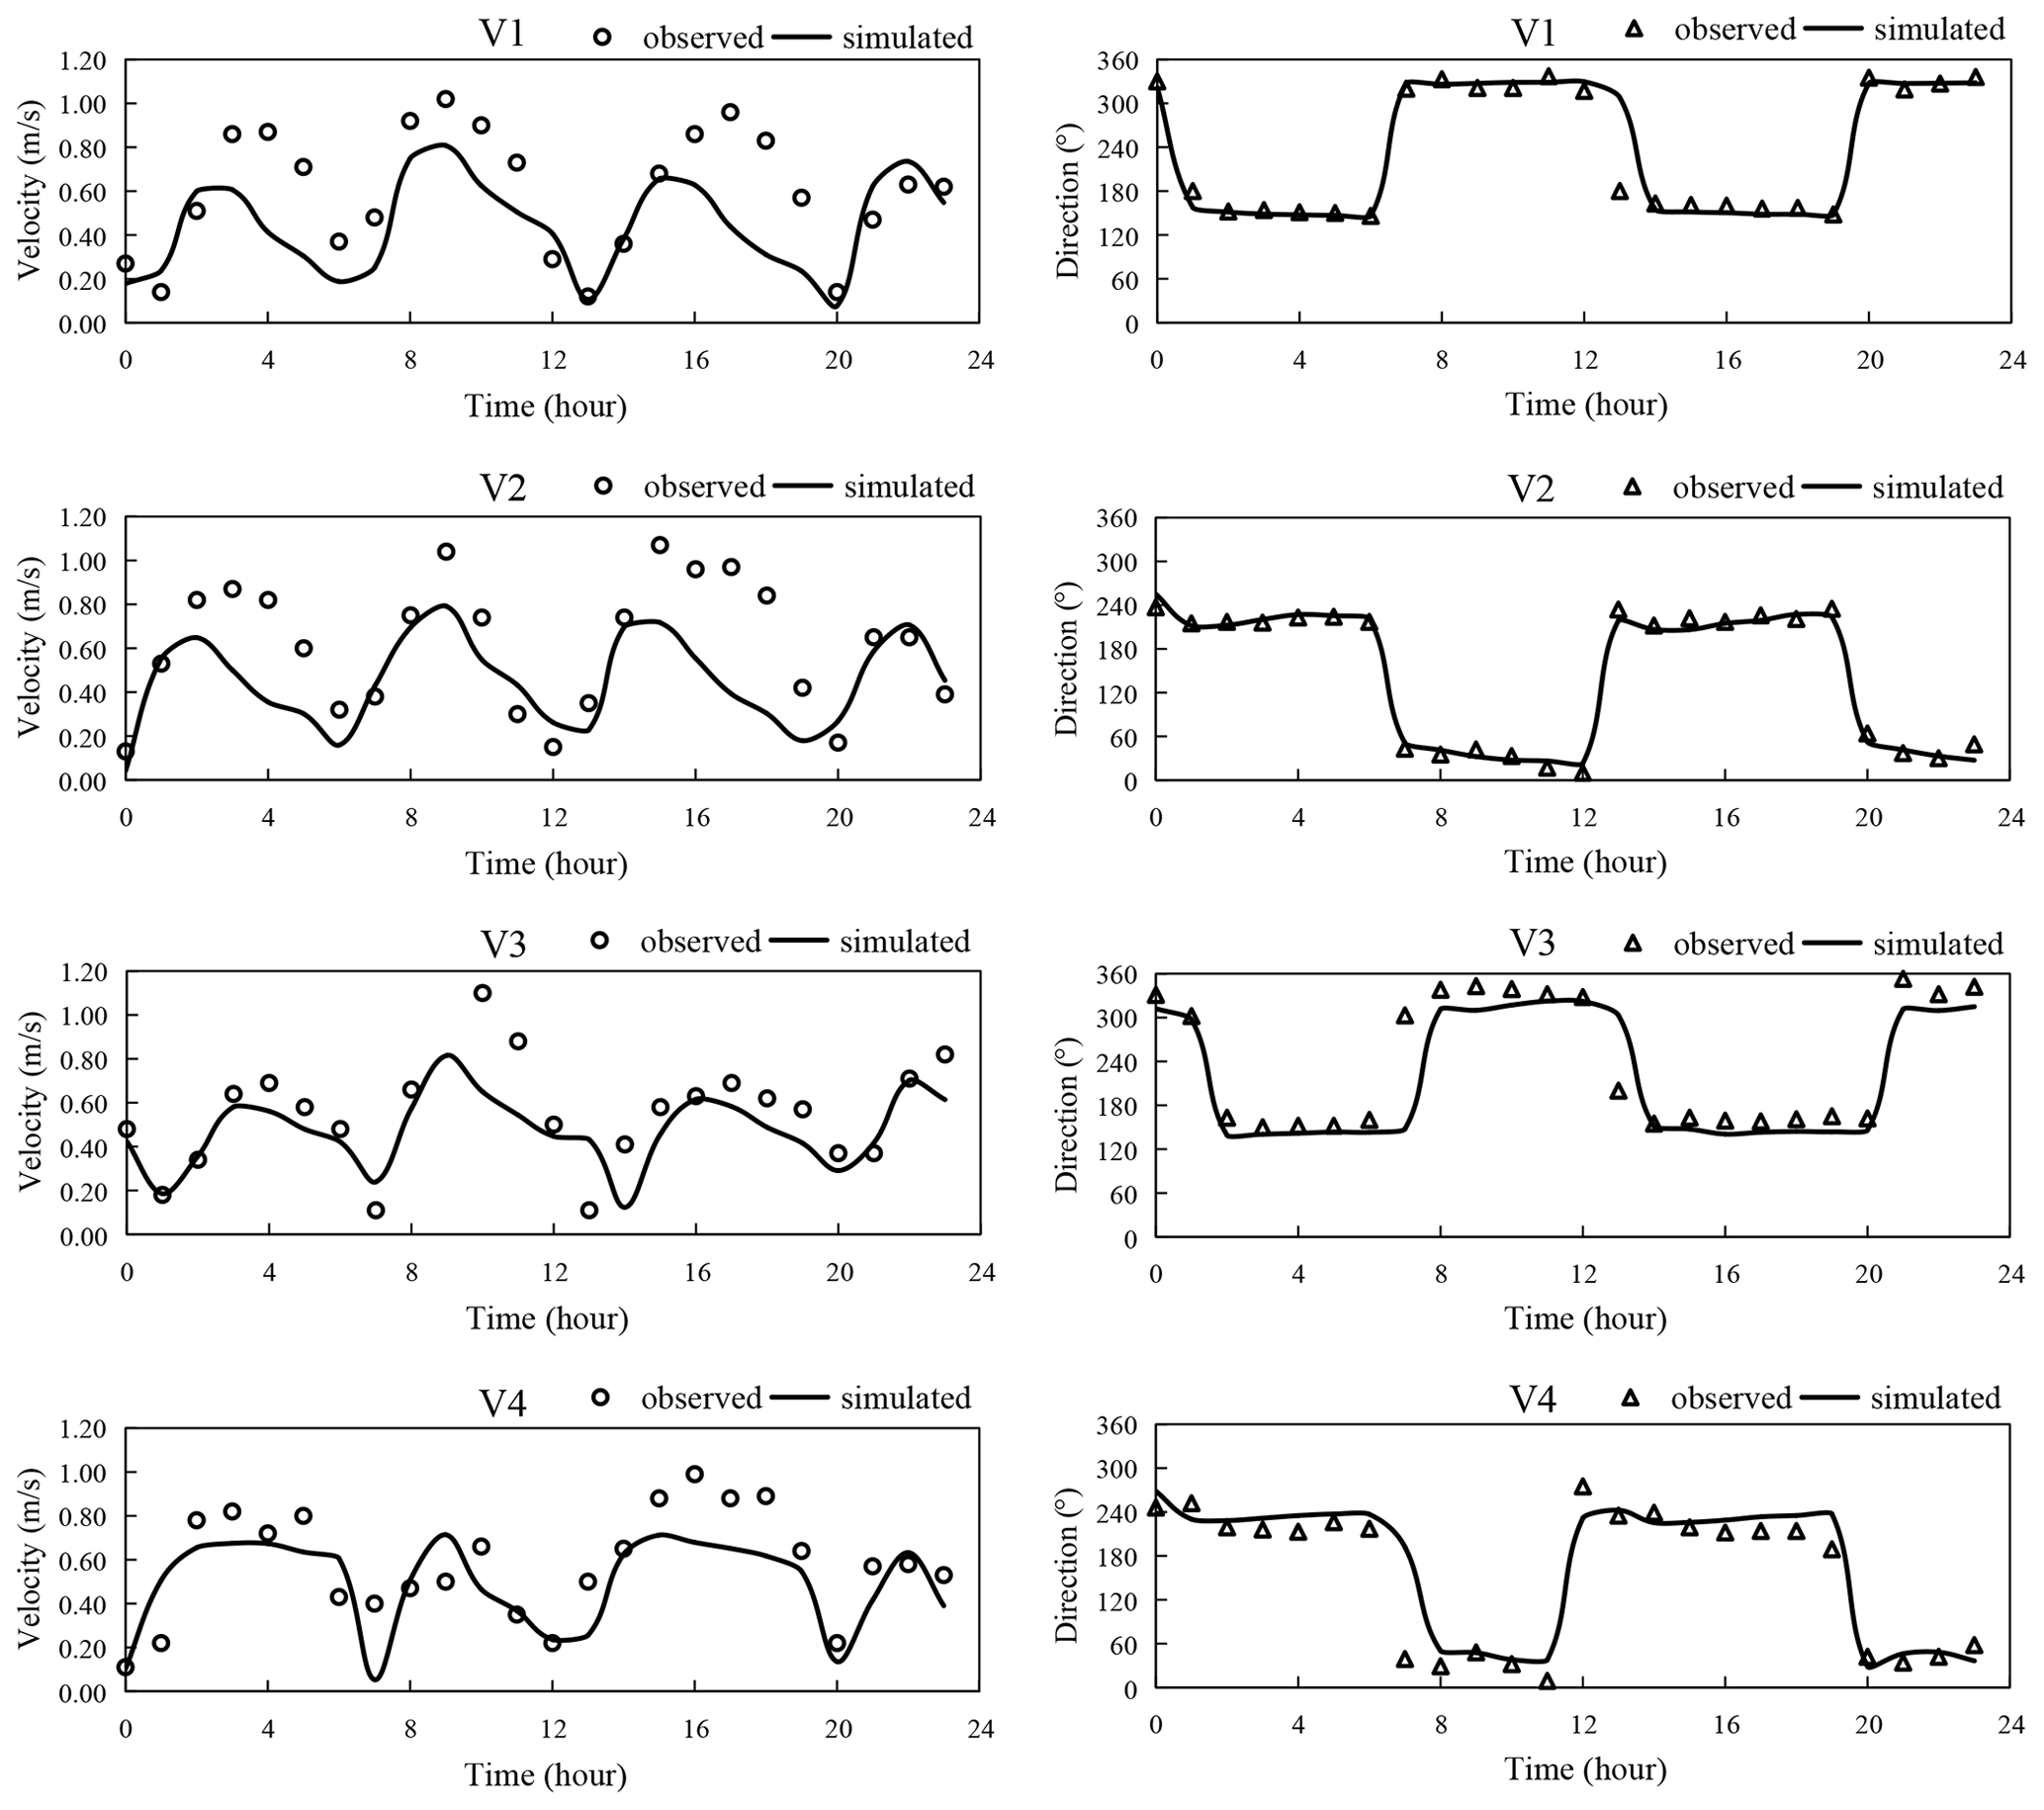
Figure 5The comparison of simulated and measured tidal currents at the monitoring stations during spring tide.

The development and application of numerical models have been a key component of research on the salt transport and saltwater intrusion in estuarine waters at high spatial and temporal resolutions. For example, Zhao et al. (2010) simulated wetland–estuarine–shelf interaction processes at the Plum Island Sound and Merrimack River system in the Massachusetts coast using the three-dimensional (3D) unstructured-grid, finite-volume coastal ocean model (FVCOM), where the water exchange was observed to vary with the magnitude of freshwater discharge and wind conditions. Gong et al. (2018) employed the coupled ocean–atmosphere–wave–sediment transport (COAWST) model to investigate the effects of local and remote winds and wind waves on salt intrusion in the Pearl River estuaries, with conclusions having an applicability to other partially mixed estuaries under the threat of salt intrusion. Popescu et al. (2015) presented a 3D hydrodynamic model to understand the hydrodynamics of the Danube Delta wetlands, demonstrating the strong impact of the Danube River variable discharges on the habitats and the overall ecological status of the delta. Andrews et al. (2017) applied the 3D hydrodynamic model to examine the impacts of anthropogenic changes (land use changes, levee construction, channel modifications etc.) on the physical characteristics and salt intrusion processes at the San Francisco Estuary. Wang et al. (2019) combined the FVCOM model with long-term field survey data to investigate the seasonal variability of currents and salinity in the Indus River estuary. Results revealed that the salinity intrusion distance was principally controlled by river discharge in the estuary, while the seawater intrusion was significantly impacted by tidal forcing in the absence of river runoff. Tian (2019) combined field data collected in the Chester River estuary with FVCOM to identify the driving factors and their relative importance in controlling the saltwater intrusion variability across time. Results demonstrated that river discharge was the primary factor controlling saltwater intrusion changes over inter-annual timescales, while sea surface levels dominated the seasonal variations (Tian, 2019). Estuarine salinity has a significant effect on the growth of coastal wetland plants and plays an important role in maintaining the ecological health of estuarine wetlands (Song et al., 2009). Despite this, studies on the spatial and temporal distribution of salinity in estuarine wetlands are limited, with most work generally focusing on salinity transport and saltwater intrusion mechanisms along the estuaries (Ralston et al., 2008; Haralambidou et al., 2010; Veerapaga et al. 2019; Wang et al., 2019).
The Liao River in northeastern China is one of the seven largest rivers in the country and ends at the LRE located at the top of Liaodong Bay (Fig. 1a). Due to the recent rapid urban sprawl and growth in population, water consumption has increased dramatically in the Liao River basin. In addition, the upstream closure projects have directly led to a sharp decrease in the downstream runoff of Liao River into Liaodong Bay, which may further affect the exchange and mixing of salt water and freshwater in the estuary (Ralston et al., 2008; Gong and Shen, 2011). Panjin Port is located on the southeast of the LRE, adjacent to the Daliao River (Fig. 1b). The port was founded in 1995, completed in 1999, and following more than 10 years of continuous expansion, the existing land area has reached 230 000 m2. The construction of Panjin Port is of great importance for the development of the local economy, yet its construction has also been problematic. The large area of marine reclamation has resulted in drastic changes in the southeast coast of the LRE since 1995 (Fig. 1b and c). Large areas of marine reclamation can alter both the local topography and the original coastline (Jia et al., 2018). Changes in the shoreline will have an impact on the characteristics of the original flow field, which can consequently affect the transport processes of ocean materials, including sediment transport, pollutant diffusion and salinity distribution (Alebregtse and de Swart, 2016).
Suaeda heteroptera is one of the most common pioneer salt-tolerant plants in the LRE. Large areas of a Suaeda heteroptera community grow in the intertidal zone along the east coastline of the LRE, forming a unique natural landscape which is known as the Pink Beach wetland. According to satellite images and on-site observations, the wetlands in the LRE have experienced severe degradation over the past decade, particularly in the Pink Beach wetland (PBW) close to the northwest of Panjin Port (Wang et al., 2020). Much effort has been made to investigate the growth mechanisms and influencing factors of vegetation Suaeda heteroptera in salt marshes (Song et al., 2009; Wang et al., 2010; Sun et al., 2016). Experiments implemented by Li et al. (2018) have revealed that high salinity can significantly restrain the growth of salt marsh vegetation (Suaeda heteroptera and Phragmites australis). However, the impacts of runoff decrease and shoreline change on the temporal and spatial distributions of salinity and the relationship between wetland degradation and anthropogenic activities in the LRE are not yet fully understood.
In this study, the FVCOM model was combined with field observations to investigate the effect of anthropogenic shoreline changes on the salinity distribution in the LRE. The principle aims of this study are to (1) evaluate and quantify the effect of shoreline changes resulting from the port construction on estuary circulations and salinity distributions in the LRE, (2) explore the potential influence of these variations on the growth of Suaeda heteroptera in tidal wetlands in the LRE, and (3) provide a reference for wetland conservation and water resource utilization in the LRE. The rest of the paper is organized as follows. A brief introduction of the study area is given in Sect. 2. Section 3 provides a description of the FVCOM model and demonstrates the implementation of the modeling system and model validation, including tidal level, flow and salinity. The effects of shoreline change resulting from port construction on residual flow and the spatial–temporal distribution of salinity in the LRE are analyzed and discussed in detail in Sect. 4. Finally, the general conclusion of the paper is detailed in Sect. 5.
The LRE, situated in the northwest of Liaoning Province, China, is a funnel-shaped shallow estuary that exhibits a decrease in width from 20 km at the mouth to 1 km at the upstream reach. It is an important ecological economic zone in the north of Liaodong Bay, playing an important role in the comprehensive development of the marine industry and fishing economy in northeastern China. The bathymetry of the LRE is complicated, with the formation of many shallow shoals due to sediment deposition. The water depth ranges from <3 m in the shoals to <7 m in the main channels. The tidal feature in Liaodong Bay fundamentally belongs to semidiurnal tide. In addition, except for the region along the coast of Liaoning Province in which semidiurnal tide predominates, most marine domains are under the control of diurnal tide (Liu et al., 2005). The upstream river network of the LRE is relatively simple, mainly dominated by the Liao River, and is also affected by the river discharge from the Daliao River. The multi-year average river discharge of the Liao River ranges from 101 m3 s−1 in the dry season to 285 m3 s−1 in wet season (Qiao et al., 2018), barely reaching 450 m3 s−1 under extreme precipitation conditions.
3.1 Model description
The FVCOM was adopted to simulate tidal flow and salinity in the LRE. It is a three-dimensional ocean model which was originally developed by Chen et al. (2003; http://fvcom.smast.umassd.edu/fvcom/, last access: 4 March 2018) based on primitive equations and improved by researchers at the University of Massachusetts-Dartmouth (UMASSD) and Woods Hole Oceanographic Institution (WHOI) (Chen et al., 2006a). Previous applications include research on large lakes, coastal estuarine regions and regional ocean areas (Gronewold et al., 2019; Lin and Fissel, 2014; Lai et al., 2018). The modeling system uses the finite-volume method with the capability to deal with horizontal unstructured triangular cells, which is well fitted to irregular coastlines and small-scale simulations (such as estuarine wetlands) with high resolution. The application of terrain-following coordinates results in an improved capacity to solve complex bathymetric conditions (Chen et al., 2006b). In addition, the ocean circulation model employs the modified level 2.5 Mellor and Yamada and Smagorinsky turbulent closure schemes for vertical and horizontal mixing.
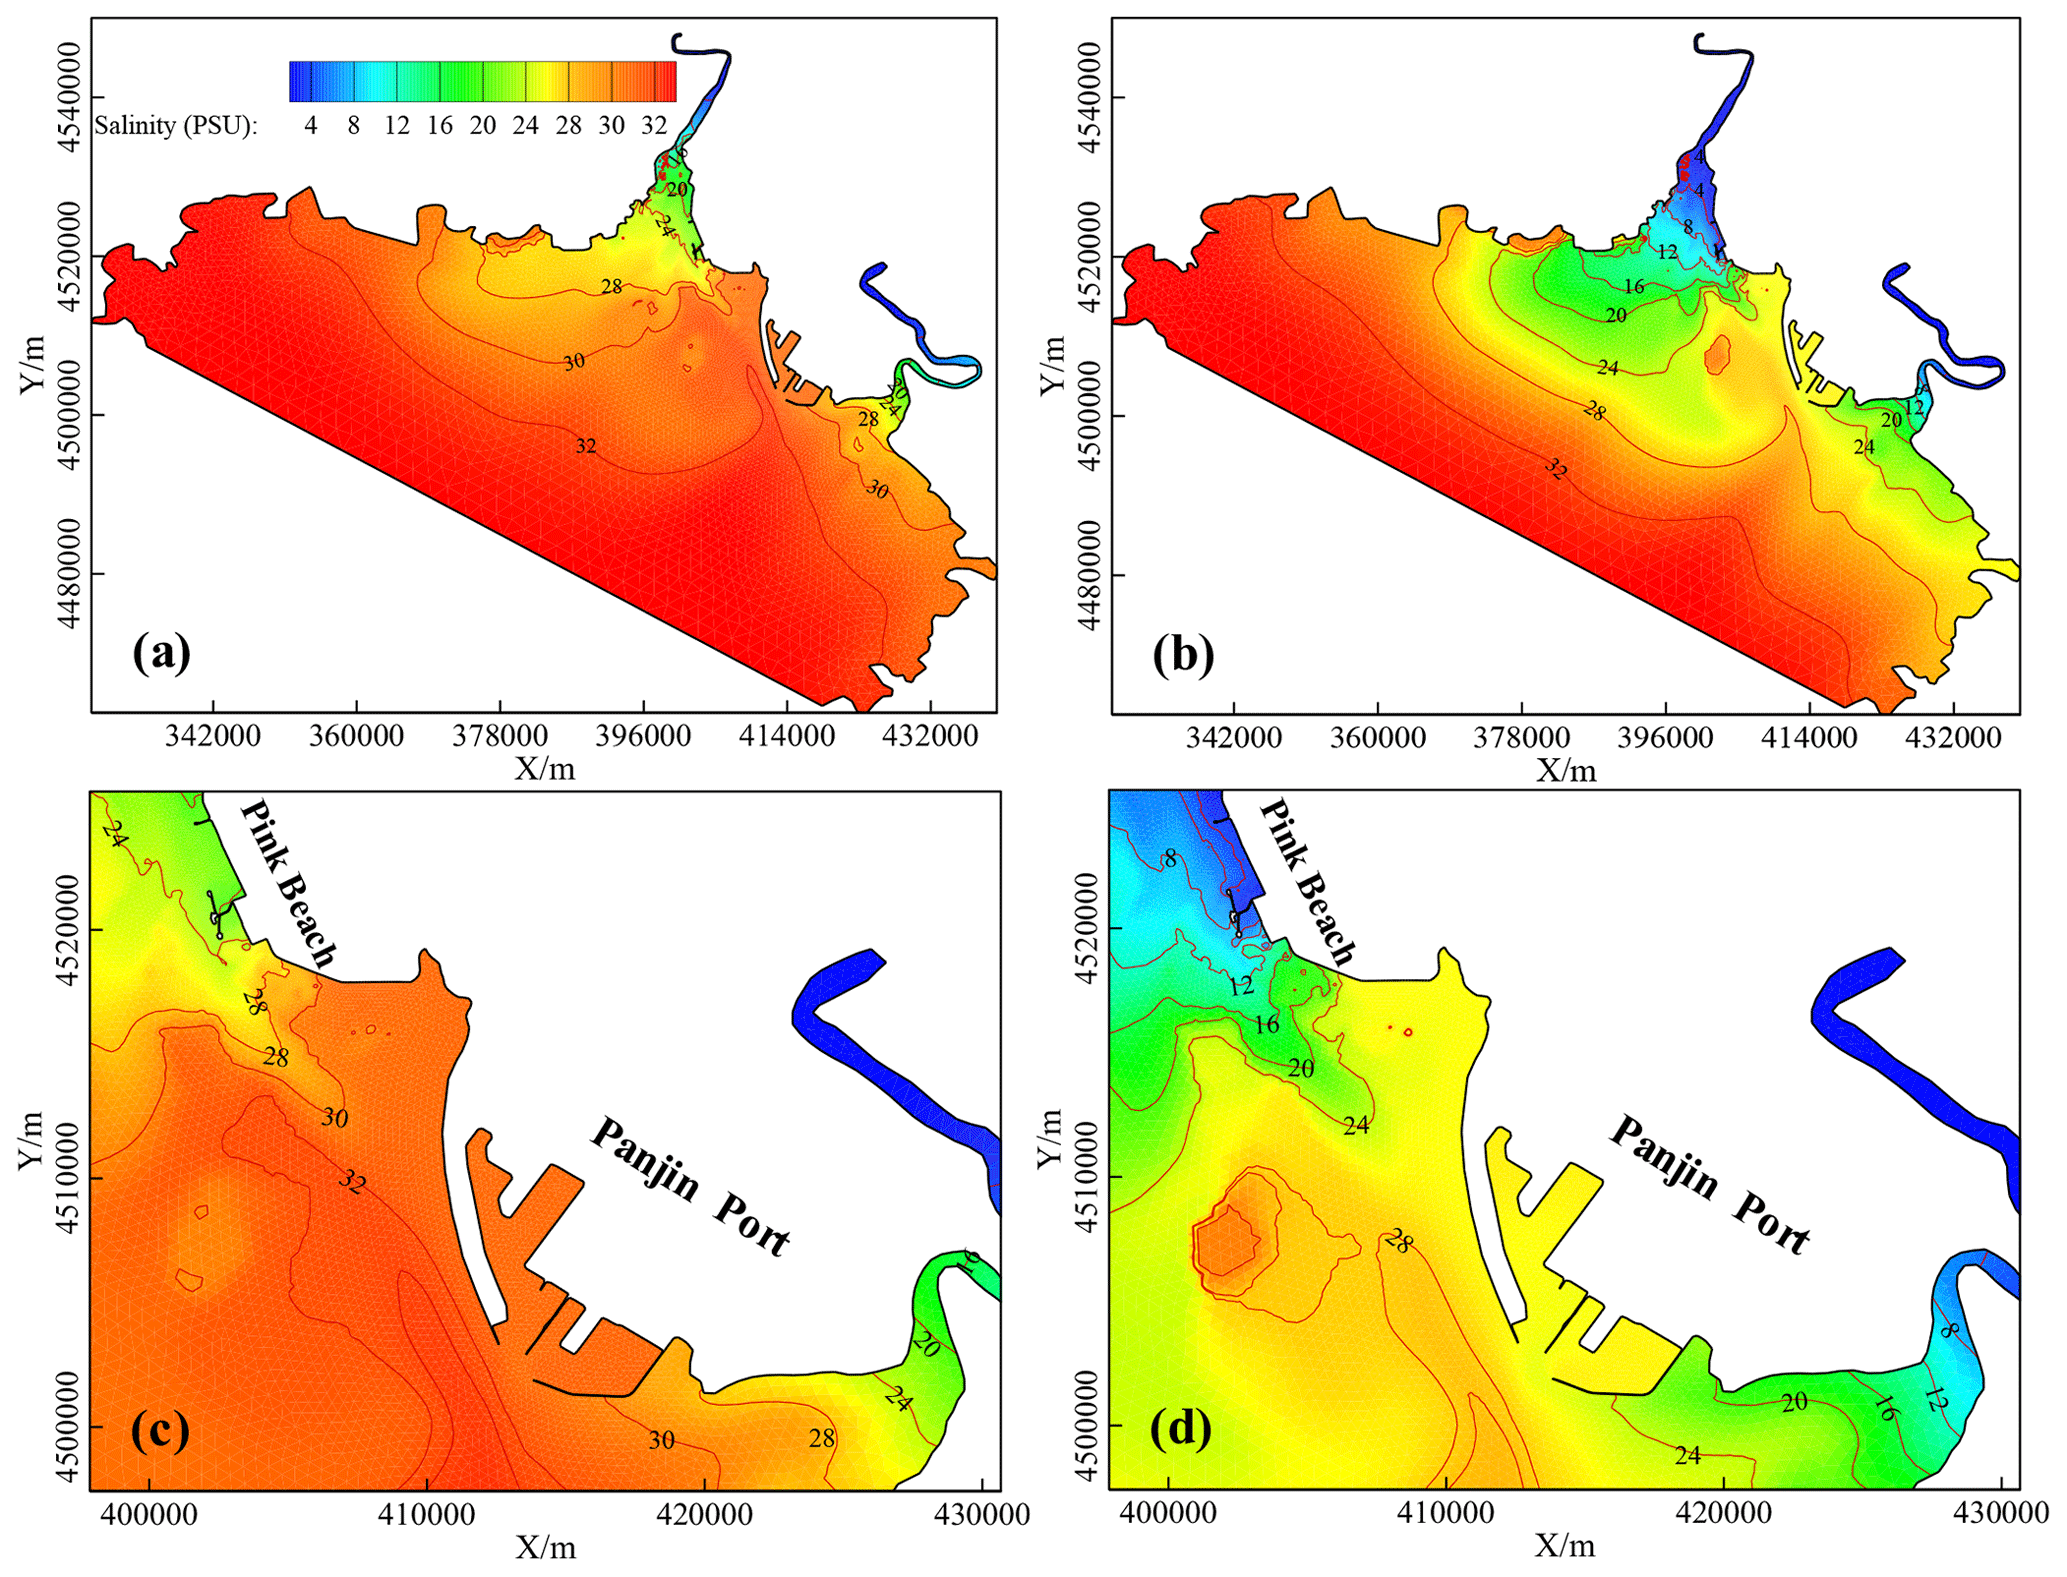
Figure 7Simulated distribution of 50 h averaged salinity in the LRE during a spring tide for Case 1 (a) and (c) and Case 2 (b) and (d).

Figure 8Simulated distribution of 50 h averaged salinity in the LRE during a neap tide for Case 1 (a and c) and for Case 2 (b and d).
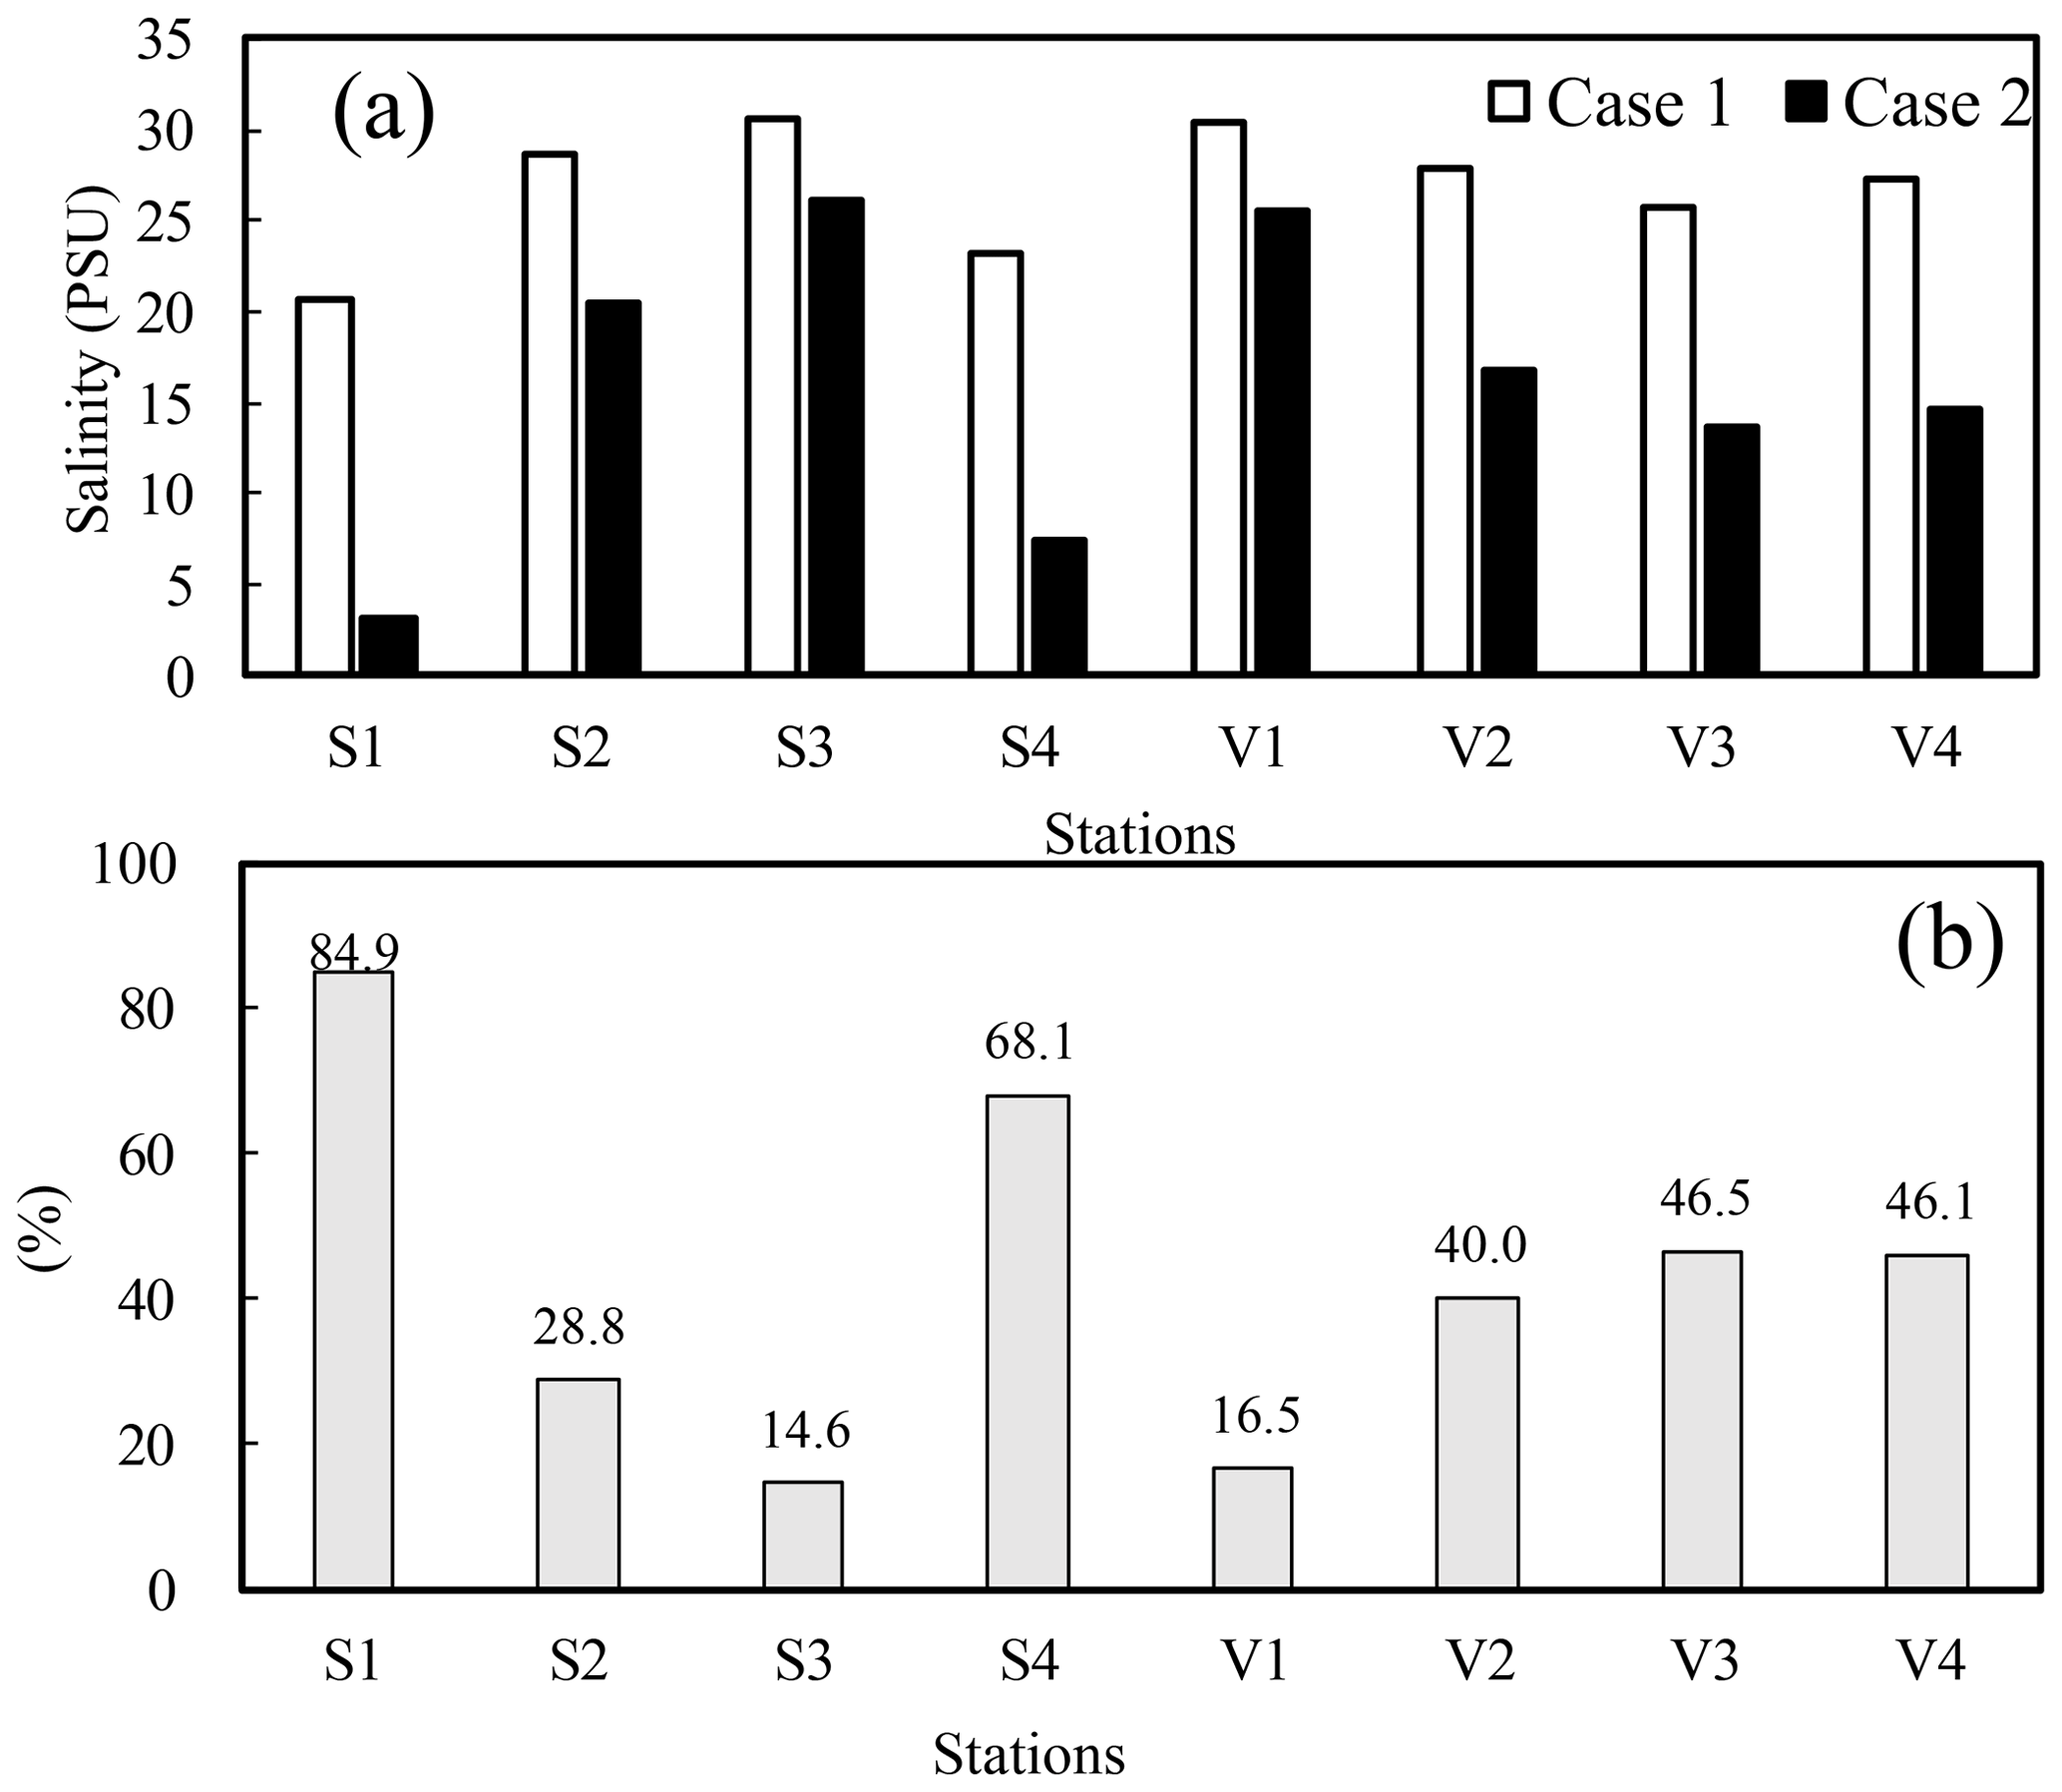
Figure 9(a) Comparison of 30 d averaged salinity at the eight stations for Case 1 and Case 2; (b) the decrease percentage of salinity values in (a).
3.2 Model configuration
The model domain covers the whole sea region located at the top of Liaodong Bay, including the Liao River and the Daliao River, extending from the 40.303 to 40.710∘ northern latitudes and the 121.029 to 122.031∘ eastern longitudes. In order to visually reflect the shoreline changes resulting from the construction of Panjin port, two coastlines of the port area were manually extracted from Landsat images collected in 1995 and 2019 (from Geospatial Data Cloud, Computer Network Information Center, Chinese Academy of Sciences: http://www.gscloud.cn/, last access: 20 November 2019) using ArcGIS software. The remaining coastline of the LRE was manually extracted from Google Earth software (with higher spatial resolution). As shoreline changes in other areas of the LRE were relatively less significant over the time span, two port coastlines were then respectively reconnected with the same remaining coastline in the finite-element Surface-water Modeling System by Aquaveo (Chen et al., 2006b), which was applied to generate an unstructured triangular mesh for the LRE domain. The bathymetry of the computation domain was derived from the Navigation Guarantee Department of the Chinese Navy Headquarters (China Navigation Publications Press) and the topographic survey data in the upstream of the LRE that we measured. The total number of grid nodes and elements were 9501 and 17 938 for grid 1995 (Fig. 2b), and 13 699 and 25 928 for grid 2019, respectively (Fig. 2c). The largest lateral and longitudinal lengths of the model domain were 113 and 67 km, respectively, while the spatial resolution of the model grids varied from 2500 m at the external open boundary to 60 m at the intertidal area of the wetland domain.
The three-dimensional baroclinic mode with 11 vertical sigma levels was adopted for the modeling system, with the external and internal mode time steps set to 2 and 10 s, respectively. The model was only driven by surface elevation, salinity and temperature at the open boundary. The open boundary condition for surface elevation and vertically averaged velocity was the original FVCOM setup (active sea level, ASL) and that for the perturbation of salinity and temperature was the Blumberg and Kantha (BKI) condition (Blumberg and Kantha, 1985). The tidal water level at each open boundary node was derived from the Global Tide Model available within the MIKE 21 Toolbox (DHI, 2017). The velocity in the open cell is computed using the linear or nonlinear momentum equations. The open boundary condition for salinity was set to 32 PSU at the sea surface and interpolated between 32 and 34 PSU along the sigma layers, and that for temperature was specified as a constant 15 ∘C from the surface to the bottom. The startup u and v values were specified as zero. The initial conditions for salinity and temperature were based on the quasi-steady result derived by running the model for approximately 4 months. Sea surface heat fluxes and wind forcings were omitted for simplicity. Furthermore, four case studies were set up based on two computational grids and two different river discharge conditions, as illustrated in Table 1. Following this, the river discharges of the Liao River and Daliao River were set to 25 and 48 m3 s−1 (285 and 266 m3 s−1), indicating a sharply decreased mean runoff (normal mean runoff) circumstance, respectively (Qiao et al. 2018).
3.3 Model validation
To validate the model's performance in the simulation of the tidal dynamics and salt transport in LRE, the simulated results were compared with the available measured data. Therefore, two tide level stations (T1 and T2), four tidal flow observation stations (V1, V2, V3 and V4), two salinity measuring gauges (V1 and V2) and four wetland salinity analysis sites (S1, S2, S3 and S4) were selected to evaluate and analyze the model performance in the study domain. Table 2 gives the specific coordinate information about the eight stations. The model simulations cover the period from 20 April to 10 September 2018. The tide level was verified from 00:00 on 1 May to 23:00 UTC+8 on 31 May 2018. The periods of tidal flow validation were divided into neap tide and spring tide, of which the neap tide period was from 11:00 on 8 June to 10:00 UTC+8 on 9 June 2018, and the spring tide period from 06:00 on 15 June to 05:00 UTC+8 on 16 June 2018. The salinity data were measured at V1 and V2, with a validation period from 05:00 on 10 September to 04:00 UTC+8 on 11 September 2018 for V1, and from 06:00 on 10 September to 05:00 UTC+8 on 11 September 2018 for V2.
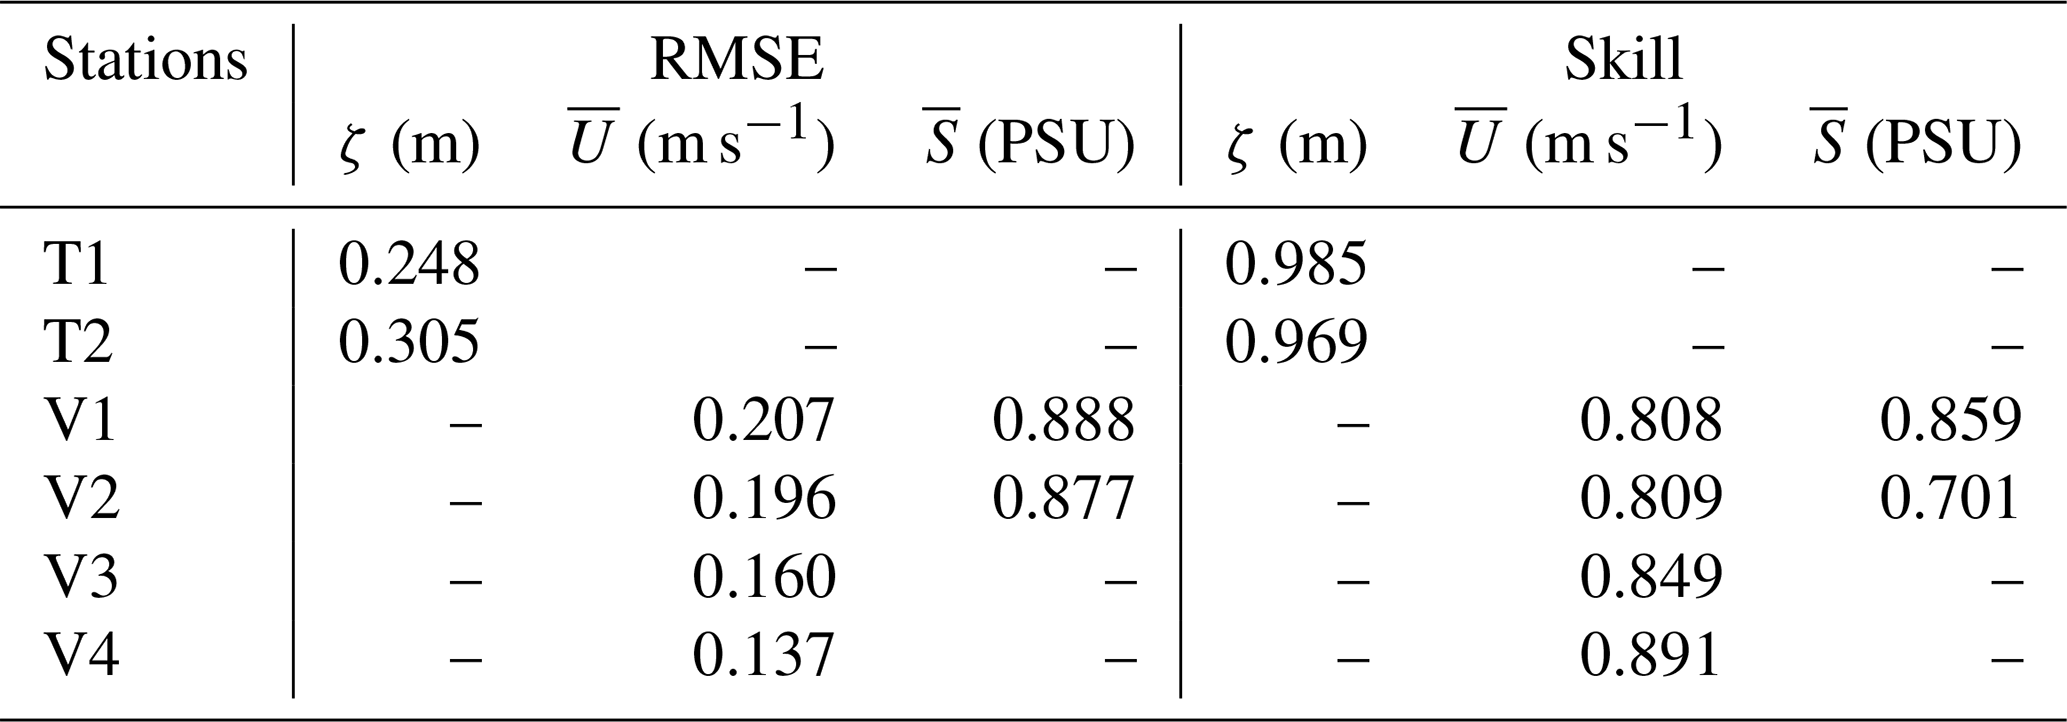
The comparison between modeled and observed data was quantified using the root mean square error (RMSE) and the predictive skill score (skill). The magnitude of the RMSE indicates the average deviation between the simulated results and the observed data, while the predictive skill score represents the degree to which the simulated value fits the measured value (1 = perfect fit, 0 = complete difference). The RMSE and skill are defined as follows:
where Mi and Oi represent the modeled results and observed values, respectively; indicates the mean of the observed values; and n is the number of observed data points.
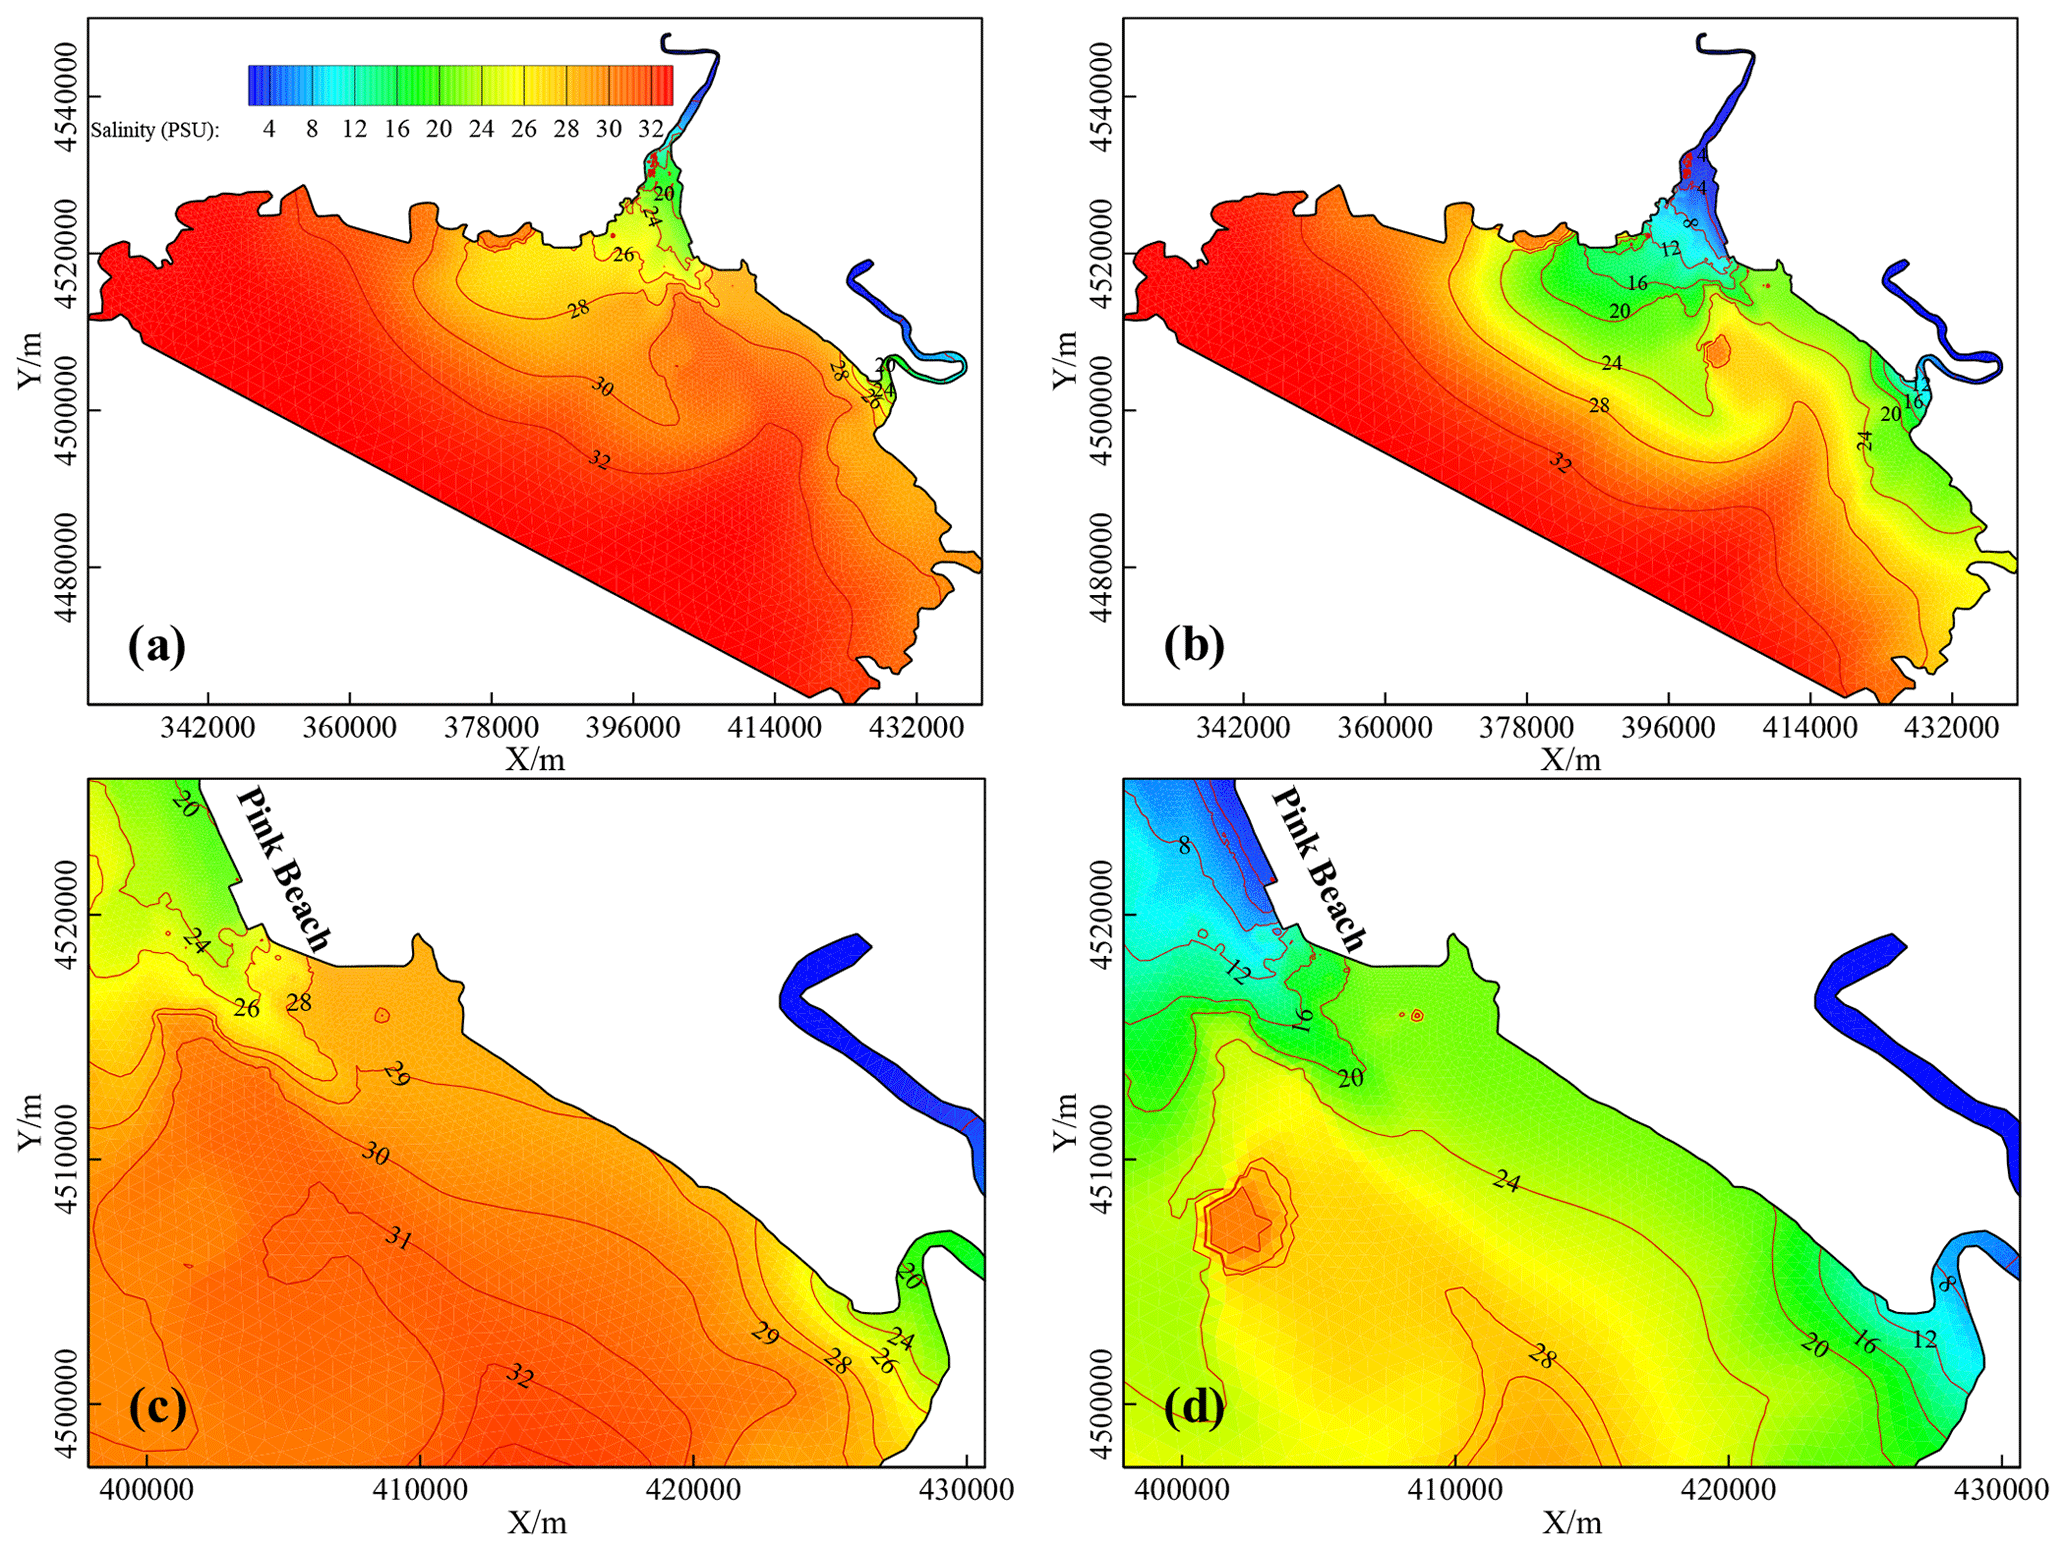
Figure 10Simulated distribution of 50 h averaged salinity in the LRE during a spring tide for Case 3 (a and c) and for Case 4 (b and d).
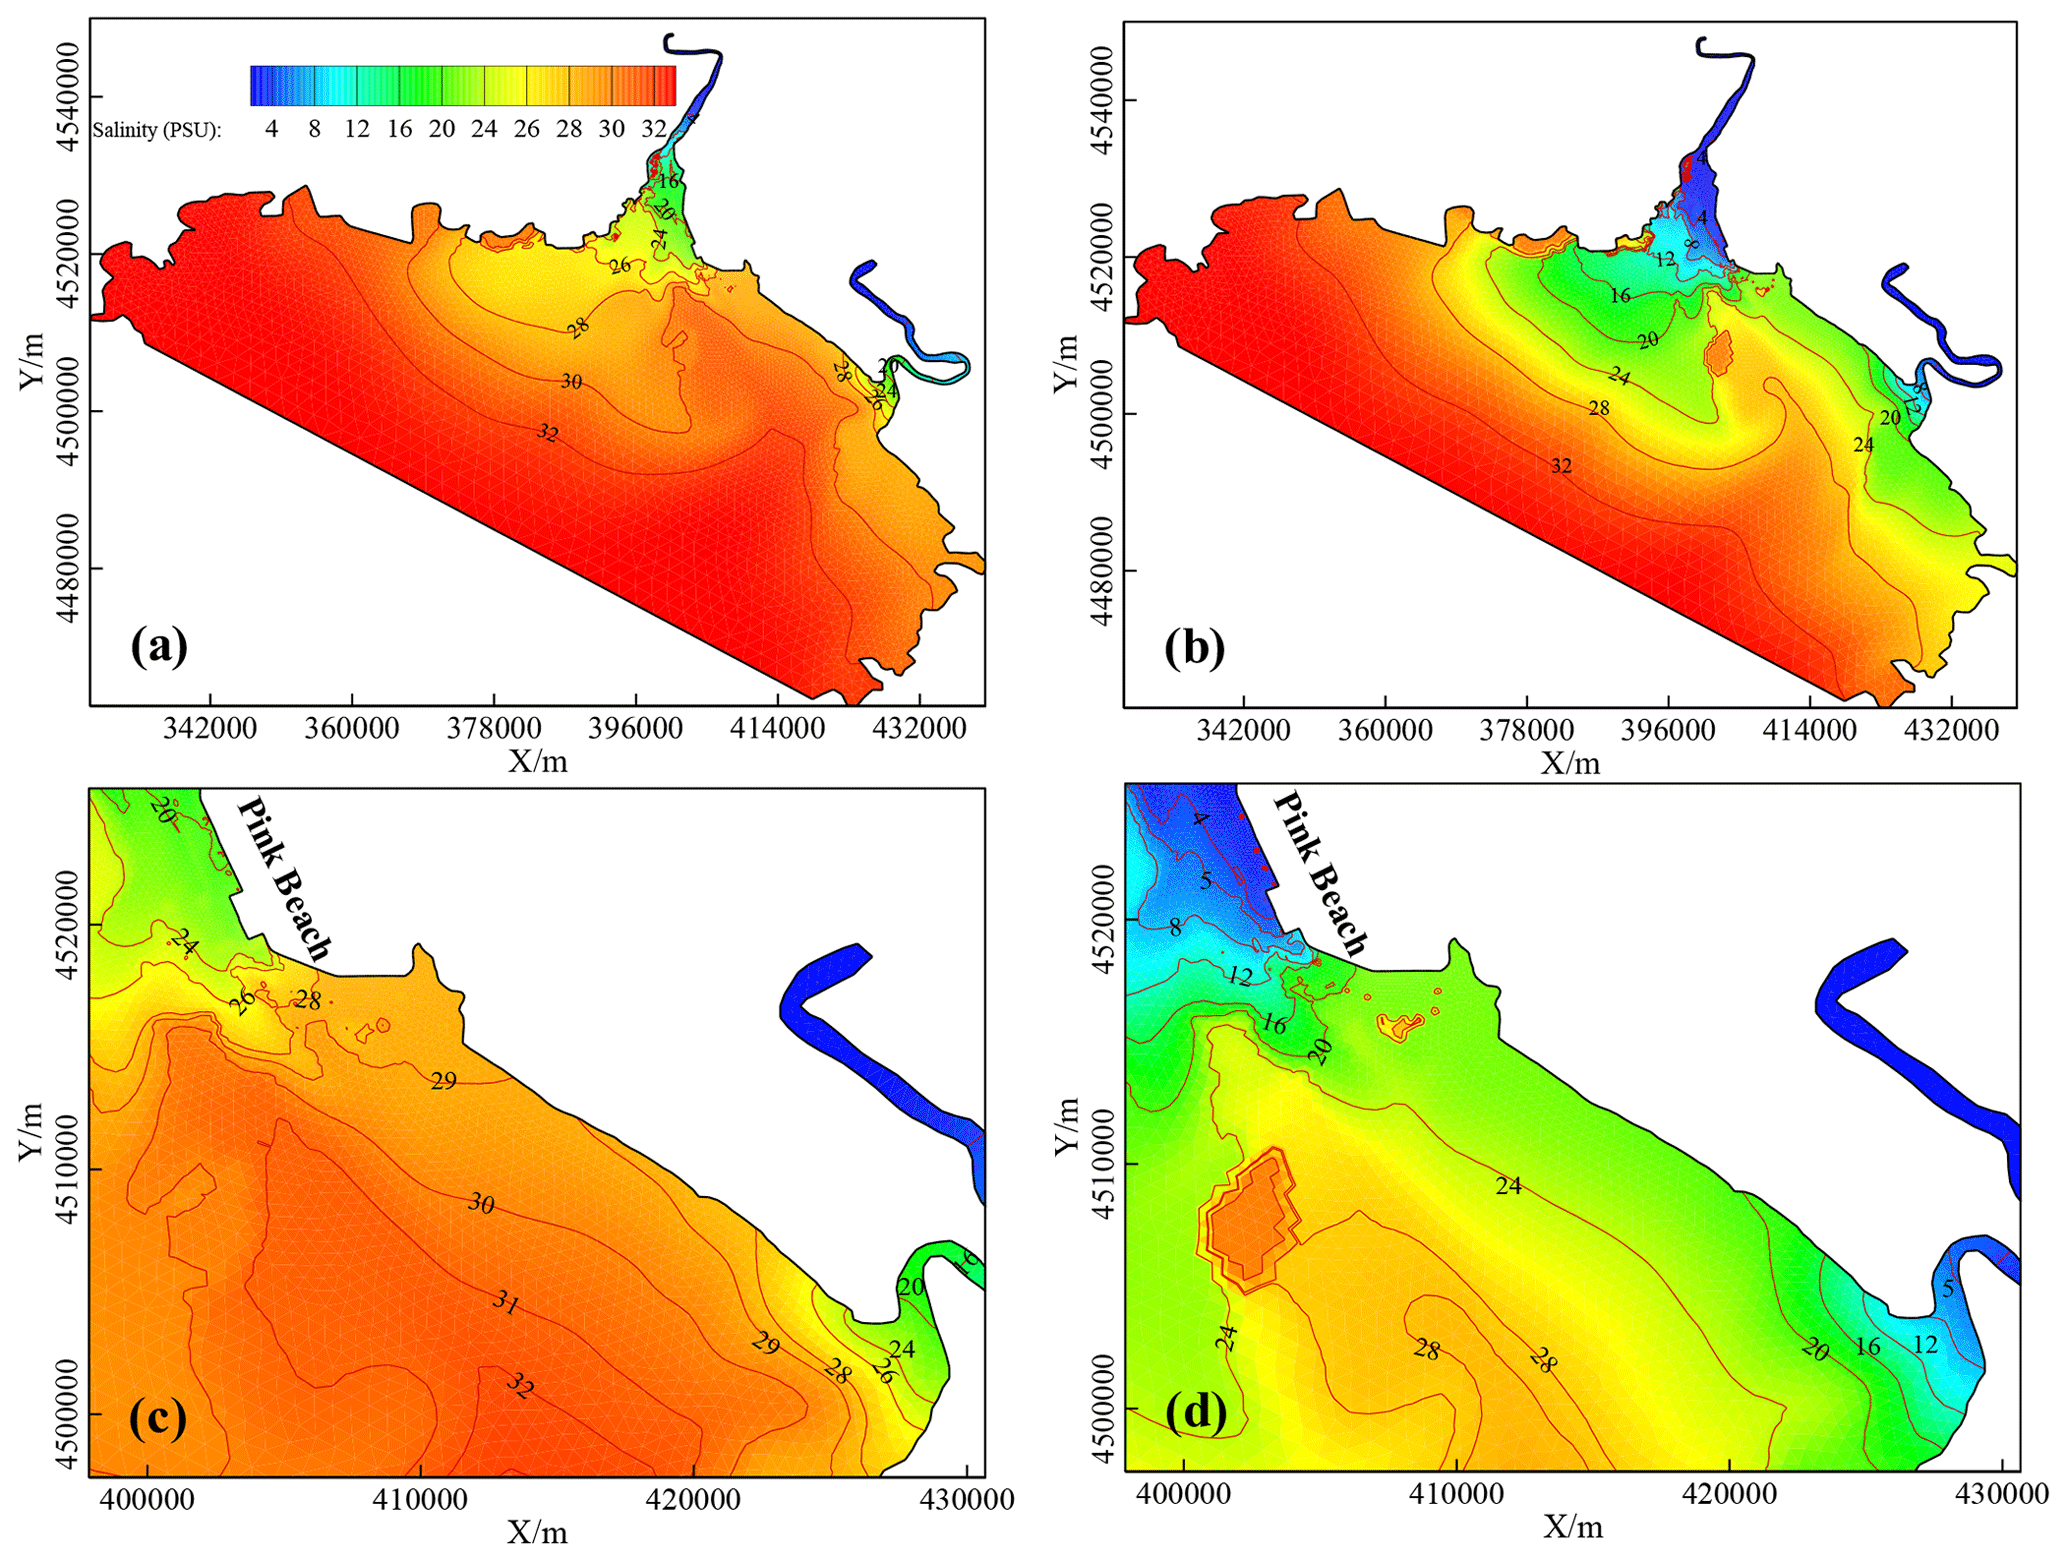
Figure 11Simulated distribution of 50 h averaged salinity in the LRE during a neap tide for Case 3 (a and c) and for Case 4 (b and d).
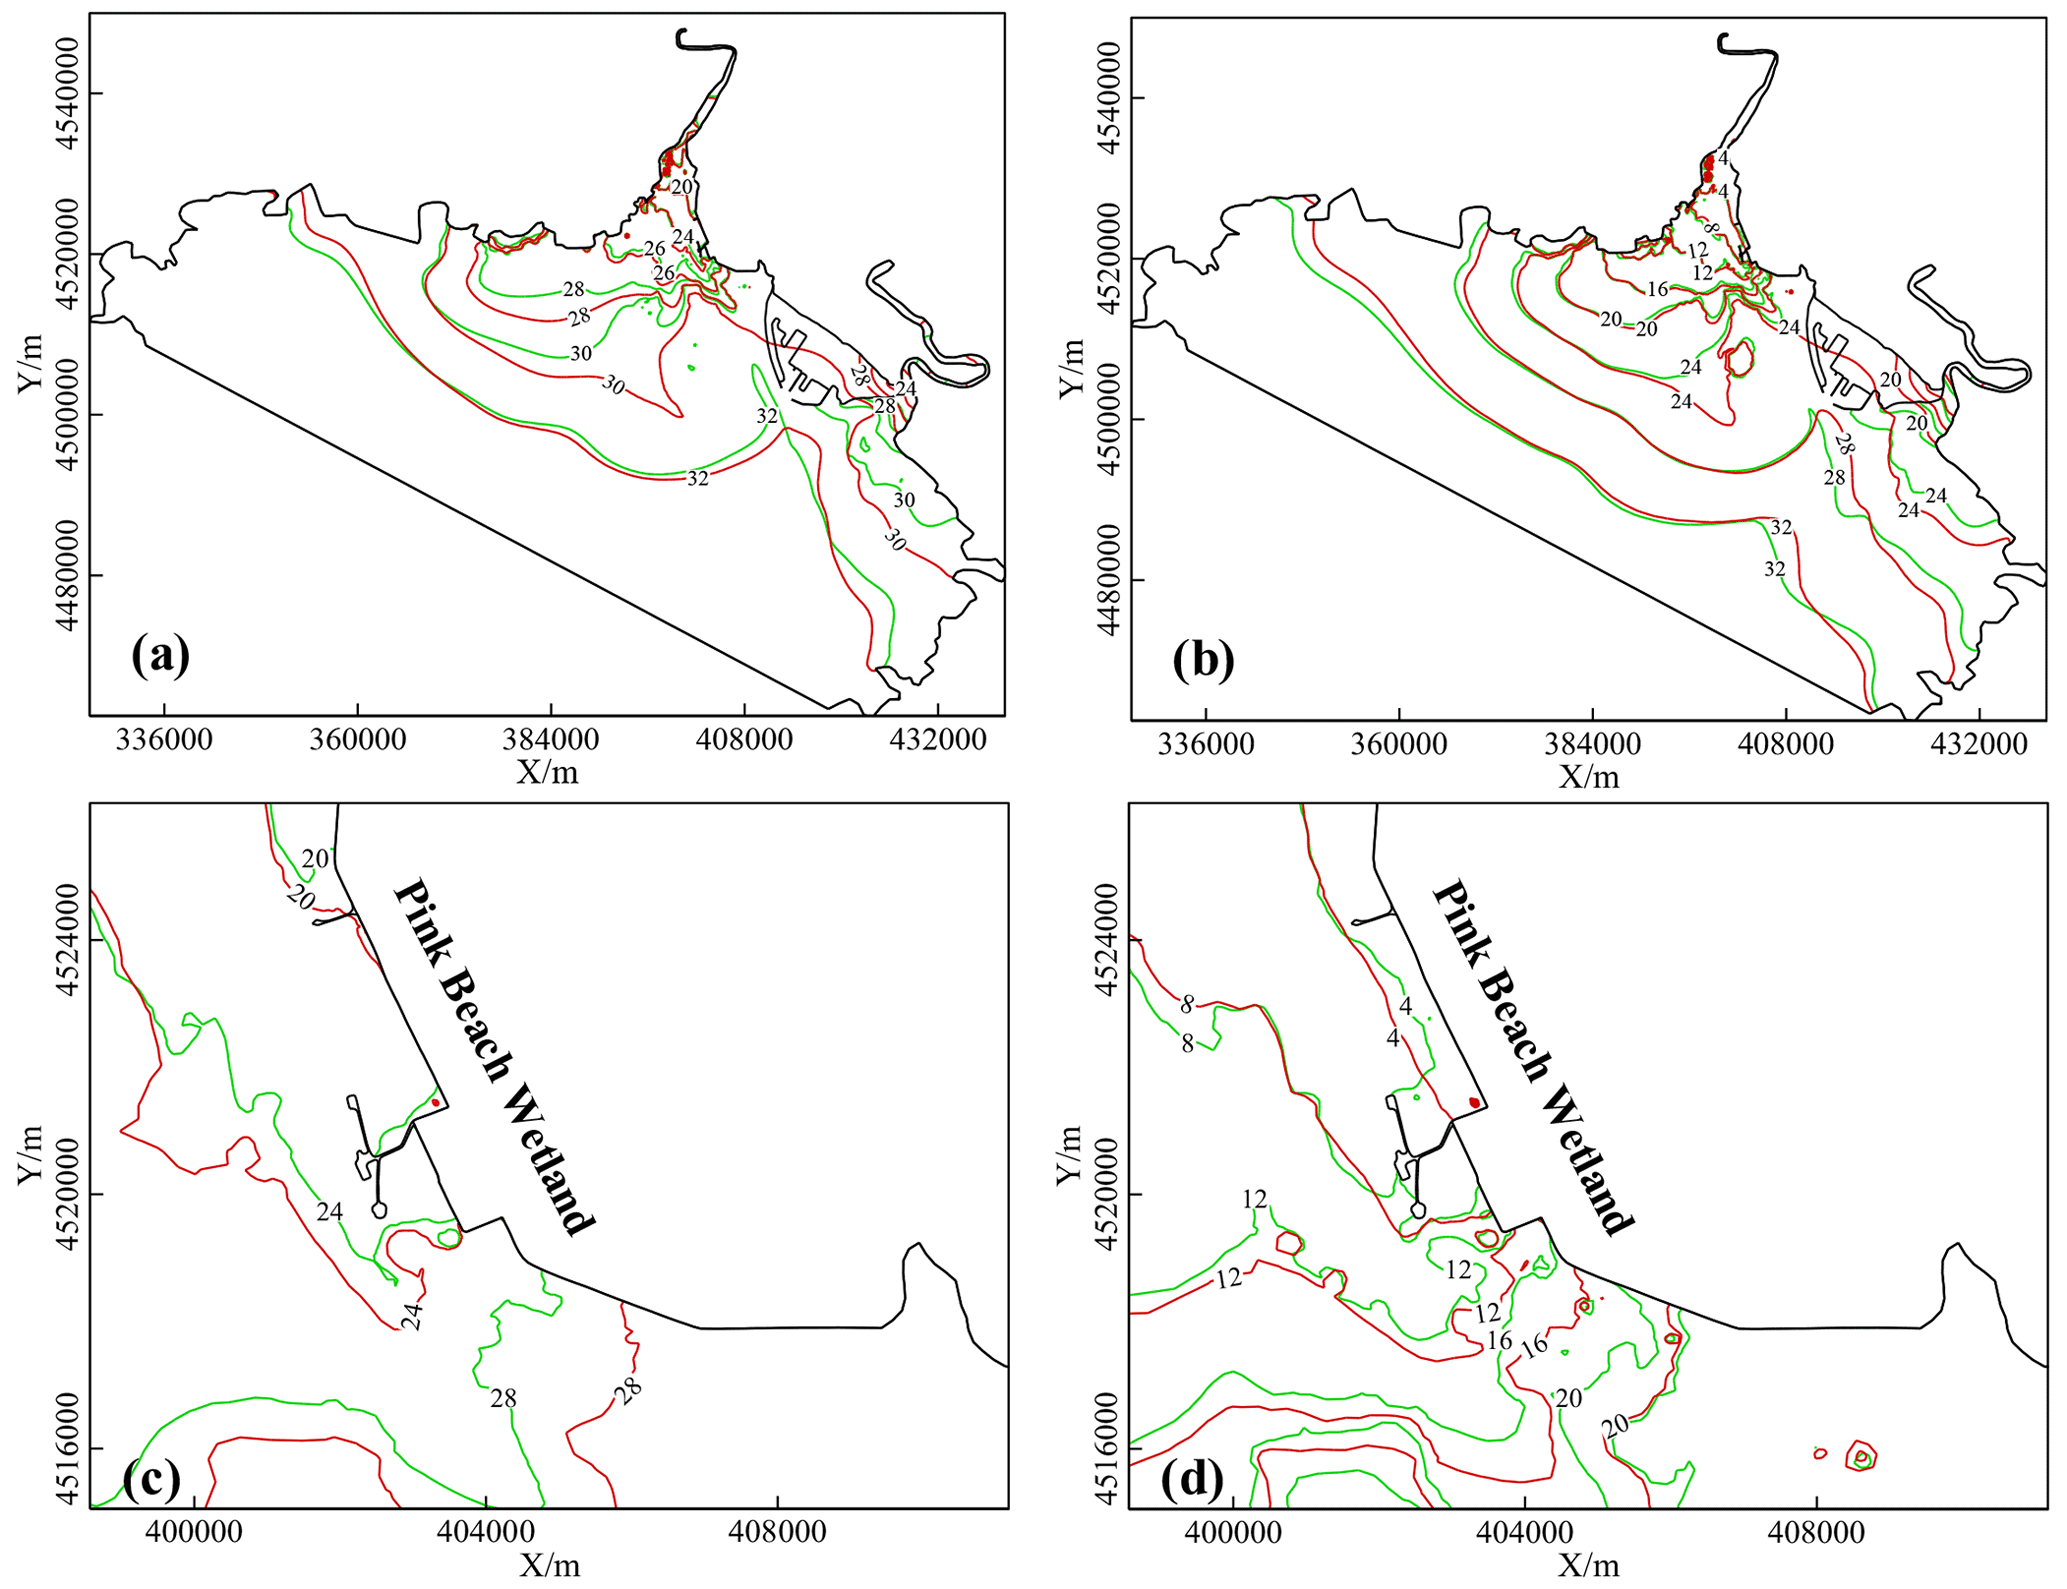
Figure 12Comparison of 50 h averaged isohalines simulated using grid 2019 (green solid line) and grid 1995 (red solid line) in low runoff conditions (a and c, Case 1 and Case 3) and normal mean runoff conditions (b and d, Case 2 and Case 4).
Figure 3 presents the tide level comparison results. The simulated water levels at T1 and T2 are observed to agree well with the measured data. In general, the amplitudes of the modeled results are consistent with the observations, with a maximum phase difference of less than 30 min. The harmonic analysis was also performed in this study, and the model results are in good agreement with the observations for the main component M2 in the two stations. The deviations between the model and field data are smaller than 9 % for the amplitude and 10∘ for the phase. Despite this, several significant errors are observed between the simulated high and low tide levels and the observed values. This may be attributed to the inaccurate open boundary water level conditions. The comparisons of the simulated and measured flow speeds and directions during neap and spring tides are presented in Figs. 4 and 5, respectively. In general, the modeled tidal flow exhibits a better match with the observation data in neap tide compared to spring tide. The poorer spring tide fitting results may be a result of the following: (1) the open boundary conditions adopted in the model may be inaccurate for certain periods, (2) the bathymetry used in the model may differ to that of the study area due to recent sediment deposition, and (3) the model employed a uniform bed roughness coefficient across the whole area. Figure 6 displays the comparisons of simulated and observed salinity at V1 and V2. The simulated salinity is in good agreement with the measured data, with broadly consistent trends in variation between datasets. Table 3 gives the results from the error quantification analysis of the simulated tide level (ζ), tidal flow () and salinity (). The skill scores for the T1 and T2 tide levels are both greater than 0.95, while flow velocities exceed 0.80. The results indicate that the model established in this paper can accurately reproduce the hydrodynamic processes in the LRE. The determined skill values for salinity indicate that the model effectively reproduces the salinity variations at V1 yet slightly underestimates the salinity at V2. The high simulation accuracies of the water level, currents and salinity determined by the proposed model in the study area demonstrates that the model is suitable for further studies on the salinity distribution in the LRE.
4.1 Effect of river discharge on salinity distribution in the LRE
To explore the effect of river discharge on salinity transport in the LRE, two experimental cases were established (Case 1 and Case 2). An average value of 50 h was chosen to reflect the irregular semi-diurnal tidal characteristics of the LRE. The salinity distribution characteristics at the surface and bottom layers are generally consistent due to the shallow water depth in the LRE, and salinity difference along the vertical was inapparent; thus the vertical averaged salinity value was selected for analysis. The 50 h averaged salinity distributions of the LRE during spring and neap tides under different runoff conditions are shown in Figs. 7 and 8. For Case 1, the salinity values in the middle of the estuary during neap and spring tides are maintained between 16–28 PSU and show a low longitudinal gradient from downstream to upstream. In Case 2, the salinity values of the middle LRE decease significantly and vary between 4–20 PSU, and the longitudinal salinity gradient becomes higher compared with Case 1. As the tidal current movement strengthens during the spring tide period, the saltwater intrusion distance in the estuary consequently increases compared to that during the neap tide period.
To quantify the effect of river discharge on the salinity of LRE, the 30 d averaged salinities of eight stations for Case 1 and Case 2 are compared in Fig. 9. The salinity of the LRE is observed to decrease dramatically as the river discharge increases to mean level. As shown in Fig. 9b, the averaged salinities of the eight sites in Case 2 decreased by 84.9 %, 28.8 %, 14.6 %, 68.1 %, 16.5 %, 40.0 %, 46.5 % and 46.1 %, respectively, compared with those in Case 1. As a result, the salinity of the LRE varies with runoff condition and tidal strengthening. Variation in river discharge exerts a significant effect on the longitudinal distribution of salinity in the estuary. Due to river closure projects in the upper reaches of the Liao River and increasing water consumption by population, the mean river discharge from the Liao River into Liaodong Bay has decreased sharply, which directly weakens the river flow's resistance to the tides and further strengthens the salt intrusion in the estuary. In addition, decrease in runoff will alter the tide duration in the estuary. For vegetation in salt marshes, the prolonged retention time of salt water will further increase the duration of salt stress which may result in negative effects on vegetation growth. Thus, as river discharge in the head of LRE sharply dropped over the past decade, it is reasonable to speculate that the corresponding salinity increase and prolonged salt water retention will have restrained effects on the growth of Suaeda heteroptera in the estuarine wetlands, which could potentially lead to the degradation of salt marshes and long-term instability of the estuary ecosystem in the LRE.

Figure 1330 d averaged salinities of the eight stations derived from the grid 1995 and grid 2019 in (a) low mean runoff conditions and (b) normal mean runoff conditions.
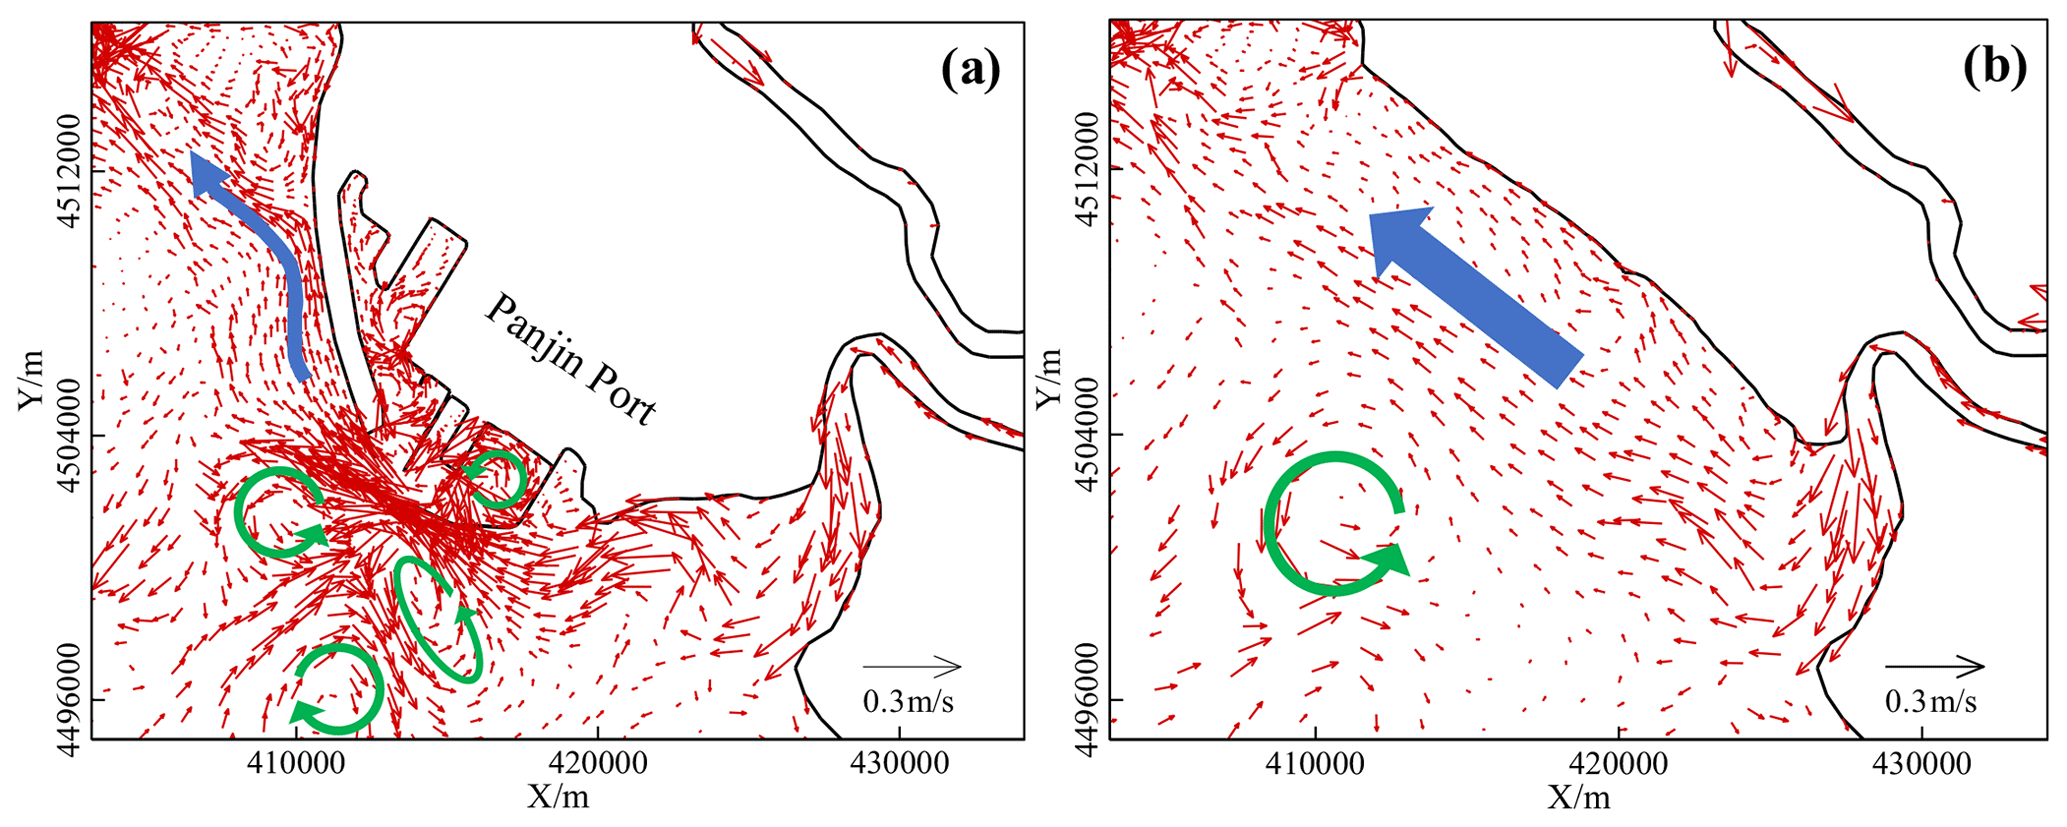
Figure 14Depth-averaged residual flow calculated by grid 2019 (a) and grid 1995 (b). Blue filling arrows indicate residual currents induced by runoff from Daliao River to the downstream part of PBW. Green annular arrows represent residual gyres.
4.2 Effect of shoreline change on salinity in the LRE
The majority of salt marsh plants in the LRE grow on the tidal flats along the coast, and they are thus submerged by seawater at high tide and exposed at low tide. This unique growth environment complicates the research on the degradation mechanisms facing such vegetation. Consequently, we applied numerical simulations to overcome this obstacle, focusing on the influence of shoreline change caused by anthropogenic activity on the salinity distribution of LRE. In addition, we further discussed the potential relationship between shore change and tidal wetland degradation in the LRE. To investigate the influence of shoreline change caused by the port construction on the salinity distribution in the LRE, the computational grids generated by two shorelines in 1995 (before port construction) and 2019 (after port construction) were adopted for salinity simulations in the LRE. The simulated results of the two grids were then compared and analyzed. Figures 10 and 11 show the average salinity distribution calculated by grid 1995 during a spring tide and a neap tide under different runoff conditions, respectively. In general, the salinity of the LRE in 1995 exhibits a significant decrease under high river discharge, with the longitudinal salinity gradient becoming more pronounced. It can be seen from Fig. 8 (9) and Fig. 10 (11) that salinity distribution during spring tide (neap tide) in 1995 evidently differs from that in 2019, especially at the east LRE where Panjin Port was built. For a more intuitive comparison, the isohalines of the LRE under low and normal mean runoff conditions were plotted using the results from the two grids, as shown in Fig. 12. The green isohalines (grid 2019) are located above the red isohalines (grid 1995) in the estuary waters during both runoff conditions, particularly in the eastern region of downstream PBW, adjacent to Panjin Port.
To quantify the influence of shoreline changes on the salinity of the LRE, we compared the 30 d averaged salinities determined via the two grids at the eight monitoring sites as shown in Fig. 13. For Case 1 and Case 3 (low mean runoff condition), following the construction of Panjin Port, the averaged salinities of the eight stations (S1, S2, S3, S4, V1, V2, V3 and V4) increased by 4.4 %, 6.2 %, 7.9 %, 0.7 %, 4.5 %, 2.6 %, 5.1 %, 2.6 %, 5.1 % and 2.3 %, respectively, and that for Case 2 and Case 4 (normal mean runoff condition) increased by −0.6 %, 14.5 %, 20.9 %, −1.3 %, 6.9 %, 2.2 %, 11.0 % and 1.4 %, respectively. These results indicate that the shoreline change caused by the extensive sea reclamation for the construction of Panjin Port has a considerable effect on the salinity distribution in the LRE, particularly in the downstream PBW (S2, S3) on the northwest part of Panjin Port. This increase is observed to be greater under normal mean runoff conditions compared to low mean runoff conditions, with a maximum increase in salinity of over 4 PSU.
4.3 Effect of shoreline change on residual flow in the LRE
To illustrate the potential factor leading to the salinity increase in southeast PBW, we analyzed the residual flow patterns of the LRE with and without Panjin Port. Comparison of the residual flow fields of the LRE under the two shoreline conditions as shown in Fig. 14 demonstrated that a residual flow induced by the runoff from the Daliao River traveled parallel to the coastline to the downstream part of the PBW before the port was built. Following the port establishment, under the obstruction of groyne and port, the residual current near the port exhibited significant variation in both magnitude and direction. Prior to the port construction, the runoff-induced residual flow from the Daliao River traveled along the shoreline to the lower reaches of the Pink Beach wetland, the continuous supply of freshwater can dilute the seawater and decrease the salinity, and also the nutrients transported by residual flow can be beneficial for vegetation growth. The port facilitated the bifurcation of the flow and generated several gyres, which results in a decrease in water mass and slows down the flow to the downstream part of PBW. It is reasonable to assume that the obstruction of the port body enhanced tidal mixing effects resulting in the diffusion of the Daliao River runoff and weakening the freshwater dilution effect on the seawater, which is responsible for the higher salinity in the PBW following the shoreline changes in 2019.
In this paper, a three-dimensional numerical model was applied to investigate the influences of river discharge and shoreline changes on the salinity distribution in the LRE. Two runoff conditions were set to represent different water seasons in the estuary. Data derived from Landsat satellite imagery and adapted using Google Earth software were employed to extract the LRE shorelines in 1995 and 2019. These were then used to generate the computational grids for tidal current and salinity distribution simulations of the LRE before and after the construction of Panjin Port. Simulation results indicate that both the decrease in river discharge and port-construction-induced shoreline change have noticeable effects on the longitudinal distribution of salinity in the LRE. Runoff decrease can significantly strengthen salt intrusion in estuary waters, resulting in salinity increase in wetland waters, which is unfavorable for vegetation growth. Furthermore, the changes in shoreline triggered by the construction of Panjin Port has noticeable effect on the salinity transport in the LRE, with the Pink Beach wetland in northwest Panjin Port observed to be the most effected. There is a rise in the water salinity amongst the wetlands located within the lower reaches of the Pink Beach wetland following the construction of the port, with a maximum increase in salinity of over 4 PSU. The obstruction effect of the port strengthens the tidal current mixing and decreases the residual flow to the downstream part of PBW, which further reduces freshwater supply to the wetland, leading to a rise in water salinity.
The ecological degradation of wetlands in the LRE has become more and more severe in the past decade, especially in the PBW. This is attributed to long-term disturbances resulting from anthropogenic activities, including river closure projects, agriculture irrigation and coastal constructions. Despite this, key physical processes in the LRE have yet to be systematically investigated and understood in terms of river discharge, wind, wave and complex terrain conditions. The influences of wind stress, estuary topography variations and water resource utilization in upper rivers on the spatial–temporal distribution of salinity in the LRE will be the focus of future work.
The open-source code of FVCOM ocean model version 3.2.1 is available from http://fvcom.smast.umassd.edu/fvcom/ (last access: 4 March 2018). Landsat imageries for shoreline extraction are available from Geospatial Data Cloud, Computer Network Information Center, Chinese Academy of Sciences (http://www.gscloud.cn/, last access: 20 November 2019).
All authors contributed to the design and development of the work. The experiments were originally carried out by MZ and TX. HJ carried out the data analysis. MZ and TX built the model and wrote the paper.
The authors declare that they have no conflict of interest.
This research has been supported by the National Nature Science Foundation of China (grant no. 51879028), the National Key R&D Program of China (grant no. 2019YFC1407704), and the Open Fund of State Key Laboratory of Coastal and Offshore Engineering, Dalian University of Technology (grant no. LP2009).
This paper was edited by Anne Marie Tréguier and reviewed by William Pringle and two anonymous referees.
Alebregtse, N. C. and de Swart, H. E.: Effect of river discharge and geometry on tides and net water transport in an estuarine network, an idealized model applied to the Yangtze Estuary, Cont. Shelf Res., 123, 29–49, https://doi.org/10.1016/j.csr.2016.03.028, 2016.
Andrews, S. W., Gross, E. S., and Hutton, P. H.: Modeling salt intrusion in the San Francisco Estuary prior to anthropogenic influence, Cont. Shelf Res., 146, 58–81, https://doi.org/10.1016/j.csr.2017.07.010, 2017.
Blumberg, A. F. and Kantha, L. H.: Open boundary condition for circulation models, J. Hydraul. Eng., 111, 237–255, https://doi.org/10.1061/(ASCE)0733-9429(1985)111:2(237), 1985.
Bowen, M. M. and Geyer, W. R.: Salt transport and the time-dependent salt balance of a partially stratified estuary, J. Geophys. Res., 108, 3158, https://doi.org/10.1029/2001JC001231, 2003.
Chen, C. S., Liu, H. D., and Beardsley, R. C.: An unstructured grid, finite-volume, three-dimensional, primitive equations ocean model: application to coastal ocean and estuaries, J. Atmos. Ocean. Tech., 20, 159–186, https://doi.org/10.1175/1520-0426(2003)020{<}0159:AUGFVT{>}2.0.CO;2, 2003.
Chen, C. S., Beardsley, R. C., and Cowles, G.: An unstructured grid, finite-volume coastal ocean model (FVCOM) system, Oceanography, 19, 78–89, https://doi.org/10.5670/oceanog.2006.92, 2006a.
Chen, C. S., Beardsley, R. C., and Cowles, G.: An unstructured grid, finite-volume coastal ocean model: FVCOM User Manual, Second Edition, Technical Report 06-0602, University of Massachusetts Dartmouth, New Bedford, MA, USA, 2006b.
Danish Hydraulic Institute (DHI): MIKE 21 Toolbox Global Tide Model – Tidal prediction, DHI Water and Environment, Hørsholm, Denmark, 2017.
Gong, W. P., Lin, Z. Y., Chen, Y. Z., Chen, Z. Y., and Zhang, H.: Effect of winds and waves on salt intrusion in the Pearl River estuary, Ocean Sci., 14, 139–159, https://doi.org/10.5194/os-14-139-2018, 2018.
Gronewold, A. D., Anderson, E. J., and Smith, J.: Evaluating operational hydrodynamic models for real-time simulation of evaporation from large lakes, Geophys. Res. Lett., 46, 3263–3269, https://doi.org/10.1029/2019GL082289, 2019.
Hansen, D. V. and Rattray, M.: Gravitational circulation in straits and estuaries, J. Mar. Res., 23, 104–122, 1965.
Haralambidou, K., Sylaios, G., and Tsihrintzis, V. A.: Salt-wedge propagation in a Mediterranean micro-tidal river mouth, Estuar. Coast. Shelf S., 90, 174–184, https://doi.org/10.1016/j.ecss.2010.08.010, 2010.
Jia H., Shen, Y. M., Su, M. R., and Yu, C. X.: Numerical simulation of hydrodynamic and water quality effects of shoreline changes in Bohai Bay, Front. Earth Sci., 12, 625–639, https://doi.org/10.1007/s11707-018-0688-x, 2018.
Lai, W. F., Pan, J. Y., and Devlin, A. T.: Impact of tides and winds on estuarine circulation in the Pearl River Estuary, Cont. Shelf Res., 168, 68–82, https://doi.org/10.1016/j.csr.2018.09.004, 2018.
Lerczak, J. A., Geyer, W. R., and Chant, R. J.: Mechanisms driving the time-dependent salt flux in a partially stratified estuary, J. Phys. Oceanogr., 36, 2296–2311, https://doi.org/10.1175/JPO2959.1, 2006.
Li, S. H., Ge, Z. M., Xie, L. N., Chen, W., Yuan, L., Wang, D. Q., Li, X. Z., and Zhang, L. Q. Ecophysiological response of native and exotic salt marsh vegetation to waterlogging and salinity: Implications for the effects of sea-level rise, Sci. Rep.-UK, 8, 2441. https://doi.org/10.1038/s41598-017-18721-z, 2018.
Lin, Y. H. and Fissel, D. B.: High resolution 3-D finite-volume coastal ocean modeling in lower Campbell River and Discovery Passage, British Columbia, Canada, J. Mar. Sci. Eng., 2, 209–225, https://doi.org/10.3390/jmse2010209, 2014.
Liu, C. J., Yu, M. H., Jia, L. W., Cai, H. Y., and Chen, X. Q.: Impacts of physical alterations on salt transport during the dry season in the Modaomen Estuary, Pearl River Delta, China, Estuar. Coast. Shelf S., 227, 106345, https://doi.org/10.1016/j.ecss.2019.106345, 2019.
Liu, H., Yin, B. S., Xu, Y. Q., and Yang D. Z.: Numerical simulation of tides and tidal currents in Liaodong Bay with POM, Prog. Nat. Sci., 15, 47–55, https://doi.org/10.1080/10020070512331341760, 2005
MacCready, P.: Calculating estuarine exchange flow using isohaline coordinates, J. Phys. Oceanogr., 41, 1116–1124, https://doi.org/10.1175/2011JPO4517.1, 2011.
McClain, M. E., Boyer, E. W., Dent, C. L., Gergel, S. E., Grimm, N. B., Groffman, P. M., Hart, S. C., Harvey, J. W., Johnston, C. A., Mayprga, E., McDowell, W. H., and Pinay, G.: Biogeochemical hot spots and hot moments at the interface of terrestrial and aquatic ecosystems, Ecosystems, 6, 301–312, https://doi.org/10.1007/s10021-003-0161-9, 2003.
Popescu, I., Cioaca, E., Pan, Q., Jonoski, A., and Hanganu, J.: Use of hydrodynamic models for the management of the Danube Delta wetlands: The case study of Sontea-Fortuna ecosystem, Environ. Sci. Policy, 46, 48–56, https://doi.org/10.1016/j.envsci.2014.01.012, 2015.
Pritchard, D. W.: Salinity distribution and circulation in the Chesapeake Bay estuaries system, J. Mar. Res., 11, 106–123, 1952.
Pritchard, D. W.: A study of the salt balance in a coastal plain estuary, J. Mar. Res., 13, 133–144, 1954.
Qiao, H., Zhang, M., Jiang, H., Xu, T., and Zhang, H.: Numerical study of hydrodynamic and salinity transport processes in the Pink Beach wetlands of the Liao River estuary, China, Ocean Sci., 14, 437–451, https://doi.org/10.5194/os-14-437-2018, 2018.
Ralston, D. K., Geyer, W. R., and Lerczak, J. A.: Subtidal salinity and velocity in the Hudson River estuary: observations and modeling, J. Phys. Oceanogr., 38, 753–770, https://doi.org/10.1175/2007JPO3808.1, 2008.
Sassi, M. G. and Hoitink, A. J. F.: River flow controls on tides and tide-mean water level profiles in a tidal freshwater river, J. Geophys. Res., 118, 4139–4151, https://doi.org/10.1002/jgrc.20297, 2013.
Scully, M. E. and Geyer, W. R.: The role of advection, straining, and mixing on the tidal variability of estuarine stratification, J. Phys. Oceanogr., 42, 855–868, https://doi.org/10.1175/JPO-D-10-05010.1, 2012.
Song, J., Chen, M., Feng, G., Jia, Y. H., Wang, B. S., and Zhang, F. S.: Effect of salinity on growth, ion accumulation and the roles of ions in osmotic adjustment of two populations of Suaeda salsa, Plant Soil, 314, 133–141, https://doi.org/10.1007/s11104-008-9712-3, 2009.
Sun, Z. G., Mou, X. J., and Sun, W. L.: Potential effects of tidal flat variations on decomposition and nutrient dynamics of Phragmites australis, Suaeda salsa, and Suaeda glauca litter in newly created marshes of the Yellow River Estuary, China, Ecol. Eng., 93, 175–186, https://doi.org/10.1016/j.ecoleng.2016.05.024, 2016.
Tian, R.: Factors controlling saltwater intrusion across multi-time scales in estuaries, Chester River, Chesapeake Bay, Estuar. Coast. Shelf S., 223, 61–73, https://doi.org/10.1016/j.ecss.2019.04.041, 2019.
Tsihrintzis, V. A., John, D. L., and Tremblay, P. J.: Hydrodynamic modeling of wetlands for flood detention, Water Resour. Manag., 12, 251–269, https://doi.org/10.1023/A:1008031011773, 1998.
Veerapaga, N., Azhikodan, G., Shintani, T., Iwamoto, N., and Yokoyama, K.: A three-dimensional environmental hydrodynamic model, Fantom-Refined: Validation and application for salt water intrusion in a meso-macrotidal estuary, Ocean Model., 141, 101425, https://doi.org/10.1016/j.ocemod.2019.101425, 2019.
Wang, J., Li, L., He, Z. G., Kalhoro, N. A., and Xu, D. F.: Numerical modelling study of seawater intrusion in Indus River Estuary, Pakistan, Ocean Eng., 184, 74–84, https://doi.org/10.1016/j.oceaneng.2019.05.029, 2019.
Wang, Y., Liu, R. H., Gao, H. W., Bai, J., and Ling, M.: Degeneration mechanism research of Suaeda heteroptera wetland of the Shuangtaizi Estuary National Nature Reserve in China, Procedia Environ. Sci., 2, 1157–1162, https://doi.org/10.1016/j.proenv.2010.10.124, 2010.
Wang, Y. N., Ji, Y. P., Sun, Z., Li, J., Zhang, M. L., and Wu, G. L.: Analysis of Suaeda heteroptera cover change and its driving factors in the wetlands of the Liao River Estuary, China, IOP Conf. Series: Earth and Environmental Science, 467, https://doi.org/10.1088/1755-1315/467/1/012150, 2020.
Weilhoefer, C. L.: A review of indicators of estuarine tidal wetland condition, Ecol. Indic., 11, 514–525, https://doi.org/10.1016/j.ecolind.2010.07.007, 2011.
Yang, J. S., Zhan, C., Li, Y. Z., Zhou, D., Yu, Y., and Yu, J. B.: Effect of salinity on soil respiration in relation to dissolved organic carbon and microbial characteristics of a wetland in the Liaohe River estuary, Northeast China, Sci. Total Environ., 642, 946–953, https://doi.org/10.1016/j.scitotenv.2018.06.121, 2018.
Zhao, L. Z., Chen, C. S., Vallino, J., Hopkinson, C., Beardsley, R. C., Lin, H. C., and Lerczak, J.: Wetland-estuarine-shelf interactions in the Plum Island Sound and Merrimack River in the Massachusetts coast, J. Geophys. Res., 115, 039, https://doi.org/10.1029/2009JC006085, 2010.