the Creative Commons Attribution 4.0 License.
the Creative Commons Attribution 4.0 License.
 | 27 Oct 2021
The riddle of eastern tropical Pacific Ocean oxygen levels: the role of the supply by intermediate-depth waters
Olaf Duteil
Ivy Frenger
Julia Getzlaff
Observed oxygen minimum zones (OMZs) in the tropical Pacific Ocean are located above intermediate-depth waters (IDWs), defined here as the 500–1500 m water layer. Typical climate models do not represent IDW properties well and are characterized by OMZs that are too deep-reaching. We analyze the role of the IDW in the misrepresentation of oxygen levels in a heterogeneous subset of ocean models characterized by a horizontal resolution ranging from 0.1 to 2.8∘. First, we show that forcing the extratropical boundaries (30∘ S and N) to observed oxygen values results in a significant increase in oxygen levels in the intermediate eastern tropical region. Second, we highlight the fact that the Equatorial Intermediate Current System (EICS) is a key feature connecting the western and eastern part of the basin. Typical climate models lack in representing crucial aspects of this supply at intermediate depth, as the EICS is basically absent in models characterized by a resolution lower than 0.25∘. These two aspects add up to a “cascade of biases” that hampers the correct representation of oxygen levels at intermediate depth in the eastern tropical Pacific Ocean and potentially future OMZ projections.
- Article
(2719 KB) - Full-text XML
-
Supplement
(1197 KB) - BibTeX
- EndNote


Oxygen levels in the ocean are characterized by high values in the high latitudes and the subtropical gyres, while concentrations decrease to close to zero in the tropical oceans in the oxygen minimum zones (OMZs). While OMZs are natural features, climate change is potentially responsible for their expansion (Breitburg et al., 2018), leading to a reshaping of the ecosystems and a potential loss of biodiversity.
Modeling oxygen levels is particularly challenging because of the complexity of the interactions between biological processes and physical transport (e.g., Deutsch et al., 2014; Ito and Deutsch, 2013; Duteil et al., 2014, 2018; Oschlies et al., 2018). Climate models tend to overestimate the volume of the OMZs (Cabré et al., 2015) and do not agree on the intensity and even sign of oxygen future evolution (Oschlies et al., 2017). In order to perform robust projections there is a need to better understand the processes at play that are responsible for the supply of oxygen to the OMZ. We focus here on the Pacific Ocean, where large OMZs are located in a depth range from 100 to 900 m (Karstensen et al., 2008; Paulmier and Ruiz-Pino, 2009). Previous modeling studies have shown that the tropical OMZ extension is at least partly controlled by connections with the subtropical ocean (Duteil et al., 2014). In addition, the roles of the equatorial undercurrent (Shigemitsu et al., 2017; Duteil et al., 2018; Busecke et al., 2019), the secondary Southern Subsurface Countercurrent (Montes et al., 2014), and the interior eddy activity (Frenger et al., 2018) have been previously highlighted. These studies focus on the mechanisms at play in the upper 500 m of the water column. The oxygen content below the core of the OMZ, however, plays a significant role in setting the upper oxygen levels by diffusive (Duteil and Oschlies, 2011) or vertical advective (Duteil, 2019) processes. Here, we focus specifically on the mechanisms supplying oxygen toward the eastern tropical Pacific Ocean at intermediate depth (500–1500 m) below the OMZ core.

Figure 1(a) Schema summarizing the intermediate water mass (IWM) pathway from the subtropics into the equatorial regions. EICS: Equatorial Intermediate Current System (solid thin lines). SEC: South Equatorial Current (Kawabe et al., 2008). Dashed lines: isopycnal diffusive processes. Observed (World Ocean Atlas) oxygen levels (mmol m−3) in the lower thermocline (mean 500–1500 m) are represented in color. (b) Schema (adapted from Ménesguen et al., 2019) illustrating the complexity of the EICS, extending below the thermocline until more than 2000 m of depth (see Sect. 4.1 for a detailed description). Observed (World Ocean Atlas) oxygen levels at 160∘ W are represented in color. NEC and SEC: North and South Equatorial Current. NECC: North Equatorial Countercurrent. EUC: Equatorial Undercurrent. EIC: Equatorial Intermediate Current. NSCC and SSCC: North and South Subsurface Countercurrent. LLSC: low-latitude subsurface current. LLIC: low-latitude intermediate current. NEIC and SEIC: North and South Equatorial Intermediate Current. NICC and SICC: North and South Intermediate Current. EDJ: equatorial deep jet.
The water masses occupying this intermediate depth layer (500–1500 m) (Emery, 2003) subduct at high latitudes (Karstensen et al., 2008). Oxygen solubility increases with lower temperatures; thus, waters formed in the Southern Ocean are characterized by high oxygen values. In particular, the Antarctic Intermediate Water (AAIW) (Molinelli, 1981) ventilates large areas of the lower thermocline of the Pacific Ocean (Sloyan and Rintoul., 2001) and is characterized by oxygen values larger than 300 mmol m−3 at subduction time (Russel and Dickson, 2003). The oxygenated core of the AAIW in the tropical Pacific is located at about 500–1200 m of depth at 40∘ S (Russell and Dickson, 2003), directly below the depth of the OMZs in the eastern Pacific; the Pacific AAIW mixes down to 2000 m of depth with the oxygen-poor Pacific Deep Water (PDW) as determined by OMP (optimum multiparameter) analysis (Pardo et al., 2012; Carrasco et al., 2017). The oxygen-rich (>200 mmol m−3 at 40∘ S) AAIW spreads from its formation side in the Southern Ocean to the subtropical regions. The northern part of the Pacific basin is characterized by the North Pacific Intermediate Water (NPIW) (Talley, 1993) confined to the northern Pacific, conversely to the AAIW, which spreads far northward with its signature reaching 15∘ N (Qu and Lindstrom, 2004). AAIW, NPIW, and the upper part of the PDW are oxygenated water masses occupying the lower thermocline between 500 and 1500 m of depth. In this study we do not specifically focus on the individual water masses, but rather on the water occupying the intermediate water depth (500–1500 m) (Emery, 2003) of the subtropical and tropical ocean. We will refer to the waters in this depth range as intermediate-depth waters (IDWs).
In the subtropics, the IDW (particularly the AAIW) circulates into the intermediate flow of the South Equatorial Current and the New Guinea Coastal Undercurrent (Qu and Lindstrom, 2004) where it retroflects in the zonal equatorial flows of the Southern Intermediate Countercurrent (SICC) and Northern Equatorial Intermediate Current (NEIC) within about ±2∘ off the Equator (Zenk et al., 2005; Kawabe and Fujio, 2010) (Fig. 1). These currents are part of the Equatorial Intermediate Current System (EICS) constituted by a complex system of narrow jets extending below 500 m in the lower thermocline (Firing, 1987; Ascani et al., 2010; Marin et al., 2010; Cravatte et al., 2012, 2017; Ménesguen et al., 2019). While this complex jet system has been shown to exist, in particular using Argo float displacements (Cravatte et al., 2017), the spatial structure and variability of the jets are still largely unknown. In addition, there is little knowledge about their role in transporting properties such as oxygen.
Table 1Main characteristics of the models and experiments analyzed in this study.

The simulation of the supply of oxygen to the eastern tropical Pacific below the OMZ core is a difficult task as it depends on the realistic simulation of the IDW properties (in particular the oxygen content) and the IDW pathway (through the EICS). It is known that current climate models, in particular CMIP5 (Coupled Model Intercomparison Project Phase 5) models, have deficiencies in correctly representing the IDW. In particular, the AAIW is too shallow and thin, with a limited equatorward extension compared to observations (Sloyan and Kamenkovich, 2007; Sallée et al., 2013; Meijers, 2014; Cabré et al., 2015; Zhu et al., 2017 for the South Atlantic Ocean). Discrepancies in the simulated properties of IDW compared to observations are due to a combination of a range of errors in the climate models, including in the simulation of wind and buoyancy forcing, an inadequate representation of subgrid-scale mixing processes in the Southern Ocean, and midlatitude diapycnal mixing parameterizations (Sloyan and Kamakovich, 2007; Zhu et al., 2017). In addition, the EICS is mostly lacking in coarse-resolution models (Dietze and Loeptien, 2013; Getzlaff and Dietze, 2013). Higher-resolution (0.25, ∘) configurations partly resolve the EICS but with smaller current speeds than observed (Eden and Dengler, 2008; Ascani et al., 2015). The mechanisms forcing the EICS are complex and still under debate (see the review by Menesguen et al., 2019).
In this study we focus on the impact of the subtropical IDW (and of the deficiencies in the representation of its properties and transport) on the oxygen content in the eastern tropical Pacific in a set of model simulations. Section 2 gives an overview of all models that we used and of the sensitivity simulations. Next, we assess to what extent the subtropical IDWs modulate (or drive) the oxygen levels in the eastern tropical (20∘ S–20∘ N; 160∘ W–coast) Pacific Ocean and determine the role of (i) the oxygen content of the IDW in the subtropical regions (Sect. 3) and (ii) the zonal recirculation of the oxygen by the EICS toward the eastern part of the basin (Sect. 4). We conclude in Sect. 5.
2.1 Description of models
We analyze the mean state of the oxygen fields, OMZ, and EICS of the following model experiments (see Table 1), which have previously been used in recent studies focusing on the understanding of the mean state or variability of tropical oxygen levels.
-
The NEMO (Nucleus for European Modelling of the Ocean) model (Madec et al., 2017) has been used throughout this study in different configurations. We first use a coarse-resolution version (see Sect. 2.2). This configuration is known in the literature as ORCA2 (Madec et al., 2017), but we call it NEMO2 in this study for clarity reasons. The resolution is 2∘, refined meridionally to 0.5∘ in the equatorial region. It possesses 31 vertical levels on the vertical (10 levels in the upper 100 m), ranging from 10 to 500 m thickness at depth. Advection is performed using a third-order scheme. Isopycnal diffusion is represented by a biharmonic scheme along isopycnal surfaces. The parameterization of Gent and Mcwilliams (1990) (hereafter GM) has been used to mimic the effect of unresolved mesoscale eddies. The circulation model is coupled to a simple biogeochemical model that comprises six compartments (phosphate, phytoplankton, zooplankton, particulate and dissolved organic matter, oxygen). The same configuration was used in Duteil et al. (2018) and Duteil (2019). The simulation has been forced by climatological forcings based on the Coordinated Reference Experiments (CORE) v2 reanalysis (normal year forcing) (Large and Yeager, 2008) and integrated for 1000 years. Initial fields (temperature, salinity, phosphate, oxygen) are provided by the World Ocean Atlas (WOA) 2018 (Garcia et al., 2018; Locarnini et al., 2019).
Two other versions of NEMO have been used (see Sect. 2.2). The configuration ORCA05 (that we call NEMO05 here) is characterized by a spatial resolution of 0.5∘. It possesses 46 levels on the vertical, ranging from 6 to 250 m thickness at depth (15 levels in the upper 100 m). Advection is performed using a third-order scheme. Isopycnal diffusion is represented by a biharmonic scheme along isopycnal surfaces. Effects of unresolved mesoscale eddies are parameterized following GM. In the configuration TROPAC01 (that we call NEMO01 in the rest of this study), a 0.1∘ resolution two-way AGRIF (adaptive grid refinement in Fortran) has been embedded in the Pacific Ocean between 49∘ S and 31∘ N into the global NEMO05 grid (similar to the configuration used in Czeschel et al., 2011). Since the model is eddying in the nested region, GM is not used. Both configurations are forced by the same interannually varying atmospheric data given by the Coordinated Ocean–Ice Reference Experiments (CORE) v2 reanalysis products over the period 1948–2007 (Large and Yeager, 2008), starting from the same initial conditions. The initial fields for the physical variables are given by the final state of a 60-year integration of NEMO01 (using 1948–2007 interannual forcing and following an initial 80-year climatological spin-up at coarse resolution). The interpretation of differences in the ventilation in the IDW is aided by the use of a passive tracer (see Sect. 2.2.2).
-
The UVic (University of Victoria) model (e.g., used in Getzlaff et al., 2016; Oschlies et al., 2017) is an Earth system model (ESM) that has a horizontal resolution of 1.8∘ latitude × 3.6∘ longitude. The experiment has been integrated for 10 000 years. The biogeochemical model is an NPZD-type (NPZD: nutrient–phytoplankton–zooplankton–detritus) model of intermediate complexity that describes the full carbon cycle (see Keller et al., 2012, for a detailed description). This model is forced by monthly climatological NCAR/NCEP wind stress fields.
-
The GFDL (Geophysical Fluid Dynamics Laboratory) CM2-0 suite (Delworth et al., 2012; Griffies et al., 2015; Dufour et al., 2015) is based on the GFDL global climate model and includes a fully coupled atmosphere with a resolution of approximately 50 km. It consists of three configurations that differ in their ocean horizontal resolutions: GFDL1 (original name: CM2-1deg) with a nominal 1∘ resolution, GFDL025 (original name: CM2.5) with a nominal 0.25∘, and GFDL01 with a nominal 0.1∘ resolution (original name: CM2.6). These configurations were used in Frenger et al. (2018) and Busecke et al. (2019) for studies on ocean oxygen. At simulation year 48, the simplified ocean biogeochemistry model miniBLING has been coupled to the circulation model. It includes three prognostic tracers: phosphate, dissolved inorganic carbon, and oxygen (Galbraith et al., 2015). Due to the high resolution of GFDL01, the integration time is limited. We analyze simulation years 186 to 190.
All the models (NEMO2, UVic, GFDL suite) are forced using preindustrial atmospheric pCO2 concentrations.
Differences in model resolution but also in atmosphere forcings or spin-up duration strongly impact oxygen distribution (see Sect. S1 in the Supplement). However, the heterogeneity of the configurations that we analyze permits the determination of whether the simulated oxygen distributions display systematic biases and/or similar patterns.
The mean states of the oxygen distributions are discussed below in Sect. 3.1.
2.2 Sensitivity experiments
In order to disentangle the different processes at play, we perform two different sets of sensitivity simulations using the NEMO model engine. NEMO allows for testing the effects of increasing the ocean resolution and integrating the model over a relatively long time span.
2.2.1 Forcing of oxygen to observed values in the subtropical regions
In the first set of experiments the focus is on the role of the lower thermocline oxygen content for the ventilation of the eastern equatorial Pacific. We use NEMO2, the oceanic component of the IPSL-CM5A (Mignot et al., 2013), that is part of CMIP5. NEMO2 shows midlatitude oxygen biases consistent with CMIP5 models. We compare three experiments.
-
NEMO2-REF: the experiment is integrated from 1948 to 2007 starting from the spin-up state described in Sect. 2.1.
-
NEMO2-30S30N: the oxygen boundaries are forced to observed oxygen concentrations (WOA) poleward of 30∘ N and 30∘ S in the whole water column, which is in the middle and high latitudes.
-
NEMO2-30S30N1500M: same as NEMO2-30S30N; in addition, oxygen is forced to observed concentrations below 1500 m, mimicking a correct oxygen state of the deeper water masses (lower part of the AAIW, upper part of the PDW).
With the above three experiments we focus on the transport of IDW oxygen levels to the tropical ocean and the OMZs. The respiration rate (oxygen consumption) is identical in NEMO2-REF, NEMO2-30S30N, and NEMO2-30S30N1500M in order to avoid compensating effects between supply and respiration that depend on biogeochemical parameterizations (e.g., Duteil et al., 2012). We aim to avoid such compensating effects to ease interpretation and be able to focus on the role of the physical transport. The sensitivity of tropical IDW oxygen to subtropical and deep oxygen levels is discussed in Sect. 3.2.
2.2.2 Conservative tracer release in oxygenated waters
In the second set of experiments, we assessed the effect of a resolution increase on the transport of a conservative tracer. To do this, we used a 0.5∘ (NEMO05) and a higher-resolution 0.1∘ (NEMO01) configuration of the NEMO model engine (Table 1) to examine the transport of oxygenated IDW from the subtropical regions into the oxygen deficient tropics. In these experiments, we initialized the regions with climatological (WOA) oxygen levels greater than 150 mmol m−3 with a tracer value of 1 (and 0 when oxygen was lower than 150 mmol m−3). The tracer is initialized at the beginning of the experiment and not continuously released. In the model simulations, the tracer is subject to the same physical processes as other physical and biogeochemical tracers, i.e., advection and diffusion, but it does not have any sources and sinks. The experiments have been integrated for 60 years (1948–2007) using realistic atmospheric forcing (COREv2).
In order to complement the tracer experiment we performed Lagrangian particle releases. Lagrangian particles allow for tracing the pathways of water parcels due to the resolved currents and tracking the origin and fate of water parcels. The particles are advected offline with the 5 d mean of the NEMO05 and NEMO01 currents. The NEMO01 circulation fields have been interpolated to the NEMO05 grid in order to allow a comparison of the large-scale advective patterns between NEMO01 and NEMO05. We do not take into account subgrid processes in NEMO05. We used the ARIANE tool (Blanke and Raynaud, 1997). A particle release has been performed in the eastern tropical OMZ at 100∘ W in the tropical region between 10∘ S and 10∘ N. The particles have been released in the IDW (500–1500 m) and integrated backward in time from 2007 to 1948 in order to determine their pathways and their location of origin. The transport by the EICS is discussed in Sect. 4.2 (tracer levels and Lagrangian pathways).
3.1 IDW oxygen levels in models
The water masses subducted in middle and high latitudes are highly oxygenated waters. The subducted “oxygen tongue” (oxygen values up to 240 mmol m−3) located at IDW level is not reproduced in most of the models part of CMIP5 (Fig. 8 from Cabré et al., 2015; Fig. 4 from Takano et al., 2018) and in the models analyzed here (Fig. 2a), with an underestimation of about 20–60 mmol m−3 (NEMO2, GFDL1, GFDL025, GFDL01). UVic, a coarse-resolution model, shows oxygenated waters in the lower thermocline at midlatitudes (30–50∘ S). GFDL01, even though still biased low, presents larger oxygen values than the coarser-resolution models GFDL1, GFDL025, and NEMO2. A possible explanation is a better representation of the water masses, in particular the AAIW, in eddy-resolving models (Lachkar et al., 2009).
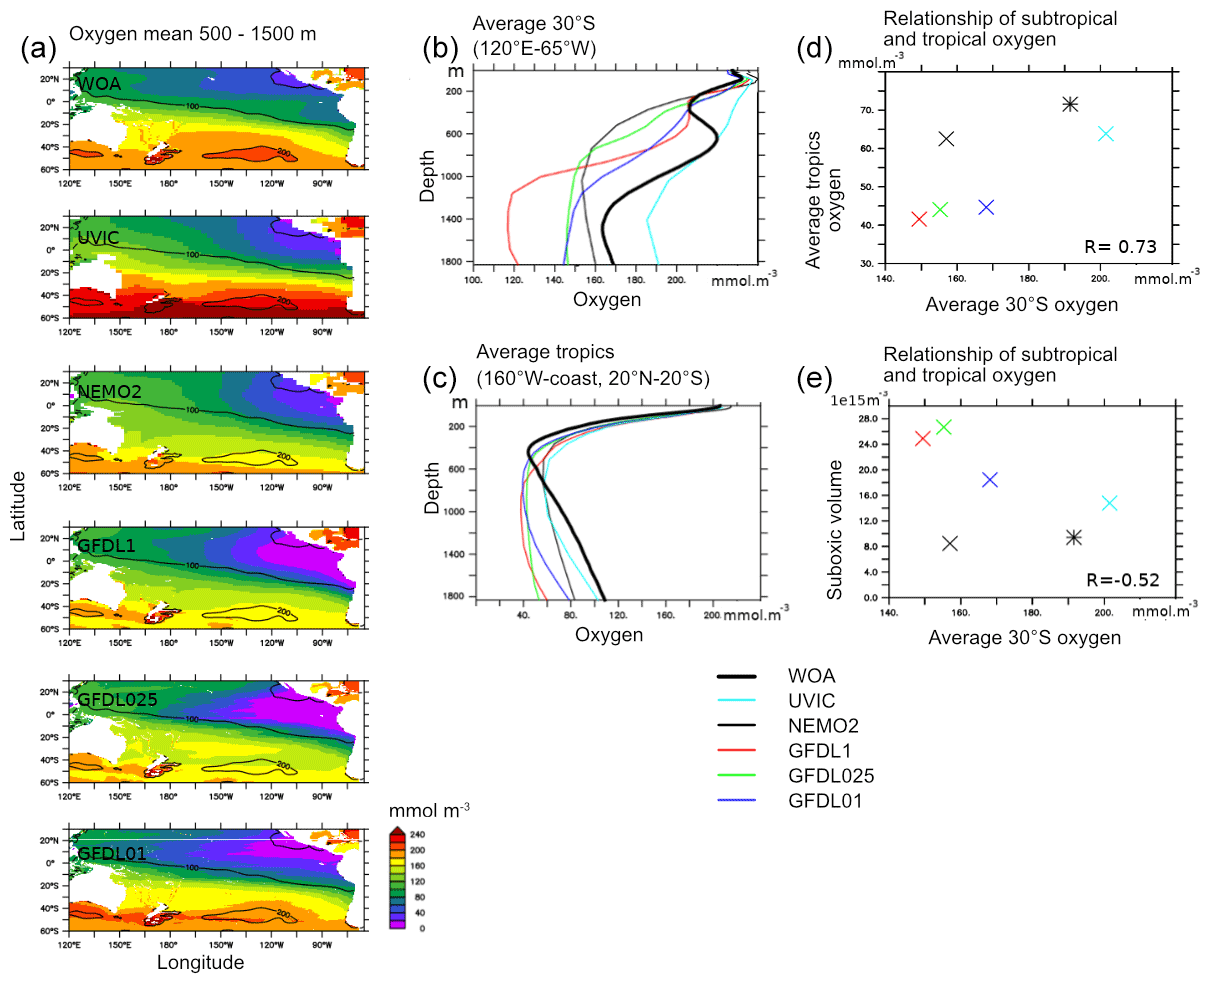
Figure 2(a) Oxygen levels (mmol m−3) in observations (World Ocean Atlas – WOA) (mean 500–1500 m) and models (UVic, NEMO2, GFDL1, GFDL025, GFDL01). Contours correspond to WOA values. (b) Average “30∘ S” (120∘ E–65∘ W, 30∘ S). (c) Average “tropics” (160∘ W–coast, 20∘ N–20∘ S). (d) Average “30∘ S” vs. “tropics”. (e) Average “30∘ S” vs. volume of tropical suboxic ocean (oxygen lower than 20 mmol m−3) regions (1015 m3). (b–e) UVic: black, NEMO2: cyan, GFDL1: red, GFDL025, green; GFDL01: blue, WOA: bold line (b, c) and star (d, e).
The IDW oxygen maximum is apparent at 30∘ S throughout the lower thermocline (600–1000 m) in observations (Fig. 2b), consistent with the circulation of IDW with the gyre from the midlatitude and high-latitude formation regions towards the northwest in subtropical latitudes (Sloyan and Rintoul, 2001), and followed by a deflection of the waters in the tropics towards the eastern basin (Qu and Lindstrom, 2004; Zenk et al., 2005). This oxygen peak is missing in all the models analyzed here.
Consistent with the low oxygen bias of models at subtropical latitudes (Fig. 2b), models also feature a bias in the tropical ocean (20∘ S–20∘ N) by 20–50 mmol m−3 (Fig. 2a and c) at intermediate depths in the eastern part of the basin (similarly to CMIP5 models, as shown by Cabré et al., 2015). The basin zonal averages of the mean oxygen level in the lower thermocline layer (500–1500 m) at 30∘ S and in the eastern part of the basin (average 20∘ S–20∘ N, 160∘ W–coast; 500–1500 m) are positively correlated (Pearson correlation coefficient R=0.73) (Fig. 2d), suggesting that the oxygen levels in the tropical Pacific Ocean are partly controlled by extratropical oxygen concentrations at intermediate depths and the associated water masses.
The models presenting the most poorly oxygenated water at 30∘ S display the largest volume of OMZs (GFDL025 and GFDL1), though the negative correlation (Pearson correlation coefficient ) is less pronounced between the volume of the OMZs and the mean oxygen levels in the layer 500–1500 m at 30∘ S (Fig. 2e). A correlation, even weak, suggests a major role of the IDW in regulating the OMZ volume. Reasons for this weaker correlation are due to the OMZs being a result of several processes next to oxygen supply by IDW, e.g., vertical mixing with other water masses (Duteil and Oschlies, 2011), isopycnal mixing in the upper thermocline (Gnanadesikan et al., 2013; Bahl et al., 2019), and supply by the upper thermocline circulation (Shigemitsu et al., 2017; Busecke et al., 2019).
In order to better understand the role of IDW entering the subtropical domain from higher latitudes for the oxygen levels in the eastern tropical Pacific Ocean, we perform sensitivity experiments (see Sect. 2.2.1) in the following.
3.2 Sensitivity of tropical IDW oxygen to subtropical and deep oxygen levels
3.2.1 Oxygen levels in the lower thermocline
The difference of the experiments NEMO2-30S30N–NEMO2-REF (average 1997–2007) (Fig. 3c and d) allows the quantification of the effect of model biases of IDW at midlatitudes (30∘ N, 30∘ S) on tropical oxygen levels. The mean state for 1997–2007 of each experiment is used in the analyses below.
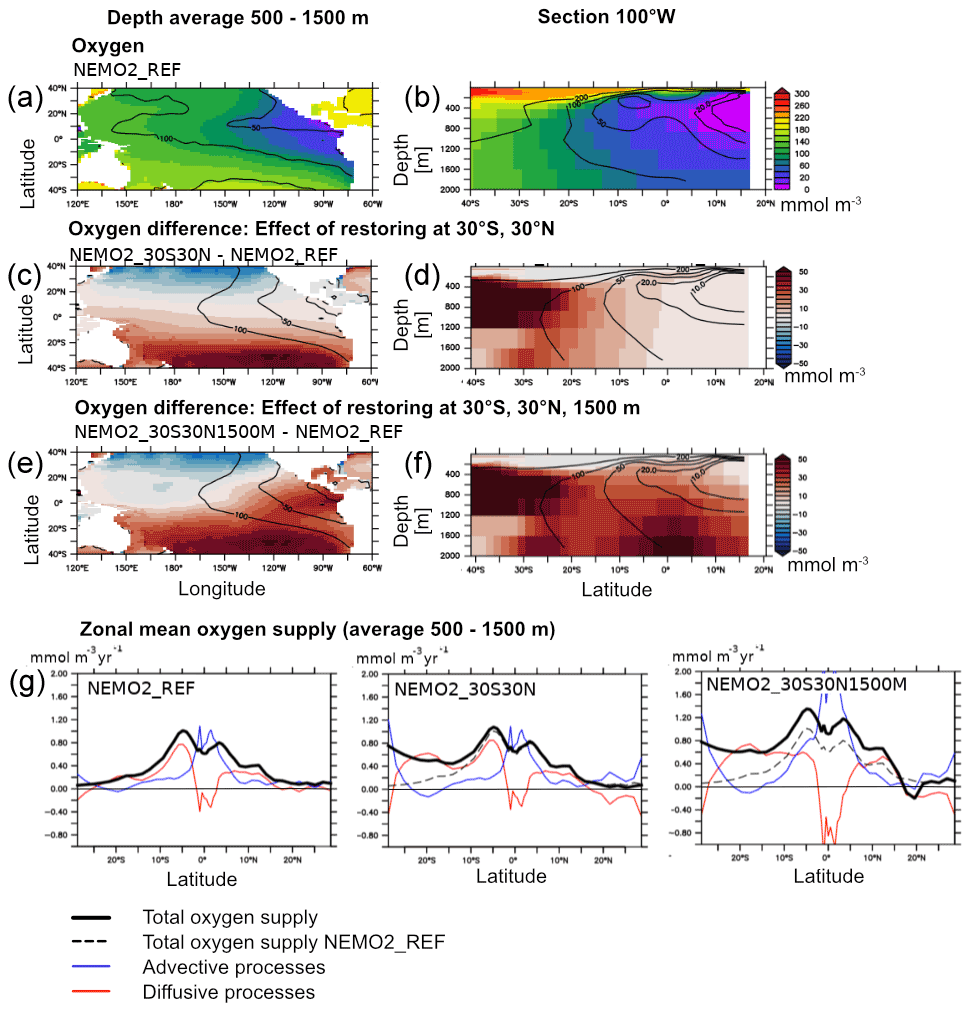
Figure 3(a, b) Oxygen (mmol m−3) in the experiments NEMO2_REF (color) and World Ocean Atlas (contour) (a average 500–1500 m, b 100∘ W). (c, d) Oxygen (mmol m−3) difference (c average 500–1500 m, d 100∘ W) between the experiments NEMO2_30S30N minus NEMO2_REF. (e, f) Oxygen (mmol m−3) difference (e average 500–1500 m, f 100∘ W) between the experiments NEMO2_30S30N1500M minus NEMO2_REF. (g) Basin zonal average (average 500–1500 m) of the total oxygen supply (bold) (mmol m−3 yr−1), advective processes (blue), and isopycnal diffusion (red) in NEMO2_REF, NEMO2_30S30N, and NEMO2_30S30N1500M. The dashed line is the total oxygen supply in NEMO2_REF.
We first assess the oxygen concentration and density levels at 30∘ S and 30∘ N in both the World Ocean Atlas (WOA) and the NEMO2-REF experiment. The deficiency in oxygen in NEMO2-REF is clearly highlighted at 30∘ S between 400 and 1500 m. The density levels are well reproduced in NEMO2-REF compared to WOA (Sect. S2).
As we force oxygen to observed levels poleward of 30∘ S and N (see Sect. 2.2.1), the difference between the two experiments shows a large anomaly in oxygen levels at 30∘ S (more than 50 mmol m−3) at IDW level (500–1500 m) corresponding to the missing deep oxygen maximum. The northern negative anomaly results from a deficient representation of the northern Pacific OMZ; i.e., modeled oxygen is too high for NPIW. The northern low and southern high anomalies spread towards the tropics at intermediate depth. A fraction of the positive oxygen anomaly recirculates at upper thermocline level due to a combination of upwelling and zonal advection by the tropical current system (for instance, the EUC at thermocline level is a major supplier of oxygen as shown in observations by Stramma et al., 2010, and in ocean models by Duteil et al., 2014, and Busecke et al., 2019).
The difference of NEMO2-30S30N1500M–NEMO2-REF (Fig. 3e and f) shows a deep positive anomaly in oxygen, as oxygen levels are lower than in observations by 30–40 mmol m−3 in the eastern tropical regions. This anomaly is partially transported into the IDW (500–1500 m). It shows that a proper representation of the deep oxygen levels (>1500 m) is important for a realistic representation of the lower thermocline and OMZs. Causes of the oxygen bias of the deeper water masses are beyond the scope of this study but may be associated with regional (tropical) issues, such as an improper parameterization of respiration (e.g., remineralization that is too deep) (Kriest et al., 2010) or a misrepresentation of deeper water masses.
3.2.2 Oxygen budget and processes
To assess the processes that drive the oxygen content of the (sub)tropical lower thermocline, we analyzed the oxygen budget in NEMO2-REF and NEMO2-30S30N, NEMO30S30N1500M. The budget is computed as an average between 500 and 1500 m and shown in Figs. 3g and 4.
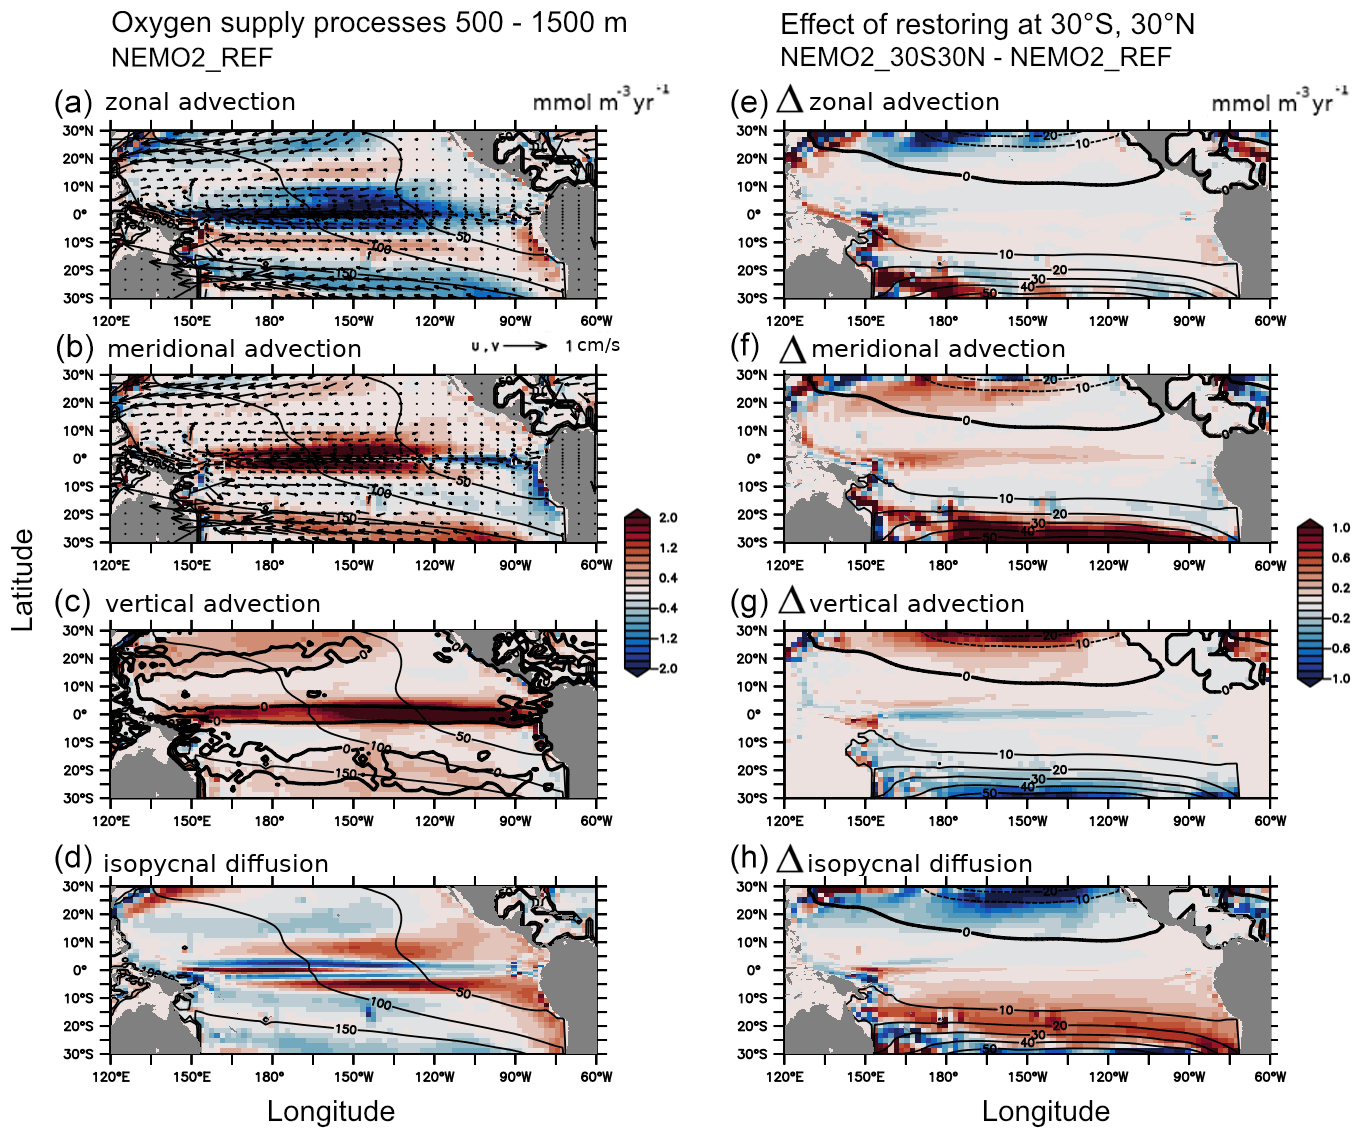
Figure 4(a–d) Oxygen supply processes (mmol m−3 yr−1; average 500–1500 m) in NEMO2_REF: (a) zonal advection, (b) meridional advection, (c) vertical advection, (d) isopycnal diffusion. The mean meridional and zonal currents are displayed as vectors (meridional, zonal advection). The mean vertical current (0 isoline) is represented as a bold contour (vertical advection). Oxygen levels (mmol m−3) are displayed as a black contour. (e–h) Difference in oxygen supply processes (mmol m−3 yr−1; average 500–1500 m) between NEMO2_30S30N and NEMO2_REF: (e) zonal advection, (f) meridional advection, (g) vertical advection, (h) isopycnal diffusion. The NEMO2_30S30N–NEMO2_REF oxygen anomaly (mmol m−3) is displayed as a contour.
The oxygen budget is
where Advx, Advy, and Advz are respectively the zonal, meridional, and vertical advection terms; Diffdia and Diffiso are the diapycnal and isopycnal diffusion terms. SMS (source minus sink) is the biogeochemical component (i.e., below the euphotic zone this is only respiration).
In NEMO2-REF, the physical oxygen supply is balanced by the respiration. The oxygen supply in the model is divided into advection, i.e., oxygen transport associated with volume transport, and isopycnal diffusion, i.e., subgrid-scale mixing processes that homogenize the oxygen gradient. Diapycnal diffusion is comparatively small and can be neglected.
The supply of oxygen from the high latitudes toward the tropical interior ocean is constituted by several processes acting concomitantly. Below the subtropical gyre, the oxygen is transported from the southeastern to the northwestern part of the gyre (Fig. 4a and b). Downwelling from the oxygen-rich mixed layer supplies the interior of the subtropical gyre (Fig. 4c). Isopycnal diffusion transfers oxygen from the oxygen-rich gyres to the poorly oxygenated regions (Fig. 4d). At the Equator, the EICS transports westward oxygen-poor water originating in the eastern side of the basin (Fig. 4a). The meridional advection term transports oxygen originating from the subtropics (Fig. 4b) in the tropical regions, which is upwelled (Fig. 4c).
Forcing oxygen levels in NEMO2-30S30N at 30∘ S and 30∘ N creates an imbalance between respiration (which remains identical in NEMO2-REF and NEMO2-30S30N) and supply. The oxygen anomaly generated at 30∘ S propagates equatorward. The positive anomaly originating from the southern boundary recirculates in the equatorial region. Isopycnal diffusion is a major process that transports the oxygen anomaly toward the Equator (Figs. 3g and 4h), in particular from 30 to 5∘ S and 30 to 10∘ N. Total advective transport plays an important role in the transport of the oxygen anomaly as well, especially in the Equator region (Fig. 4e and f) and at the western boundary (Fig. 4f). Meridional advection plays a large role close to the 30∘ boundaries as the oxygen is transported by the deeper part of the gyres. As the vertical gradient of oxygen decreases (the intermediate ocean being more oxygenated), the vertical supply from the upper ocean decreases in the southern (increases in the northern) subtropical gyre (Fig. 4g). Comparatively, the impact on zonal advection (Fig. 4e) is small as the zonal oxygen gradient stays nearly identical in both experiments (the oxygen anomaly is almost longitude-independent). The model does not display much increase in zonal recirculation at the Equator as well, except in the western part of the basin due to the advection of the oxygen provided by the retroflection of the deep limb of the subtropical gyre. The increase in meridional transport (Fig. 4f) is caused by the change in the oxygen meridional gradient, mainly caused by isopycnal diffusion processes away from the western boundary.
In the experiment NEMO2-30S30N1500, in complement to the isopycnal propagation of the subtropical anomaly, the deep (>1500 m) oxygen anomaly is upwelled in the eastern equatorial (500–1500 m) part of the basin (see Figs. 3g and S7). The transport due to advective terms strongly increases, mostly due to an increase in vertical advection (Fig. S7). This is consistent with the analysis by Duteil (2019), who showed that vertical advection is the dominant process to supply oxygen from the lower to the upper thermocline in the equatorial eastern Pacific Ocean in a similar NEMO2 configuration.
This simple set of experiments already shows that in climate models oxygen in the lower thermocline (500–1500 m) tropical ocean is partially controlled by properties of IDWs that enter the tropics from higher latitudes. This presumably also applies to other (biogeochemical) tracers.
Between 30 and 5∘ S the oxygen transport occurs mostly by small-scale isopycnal processes, while in the band 5∘ S–5∘ N the transport is dominated by large-scale advective processes. An increasing oxygen concentration in the gyres largely increases the relative importance of the isopycnal diffusion between 30 and 5∘ S. Further, upwelling in the tropics from deeper ocean layers (Pacific Deep Water, partially mixed in the lower IDW) plays an important role. We will examine the representation and the role of the EICS in supplying oxygen toward the eastern Pacific Ocean more closely in the following.
4.1 Structure of the currents in the upper 2000 m in observations and models
The current structure in the models analyzed in this study (see Sect. 2.1, Table 1) is shown in Fig. 5. In the mixed layer, the broad westward-drifting South and North Equatorial Currents (SEC, NEC) characterize the equatorial side of subtropical gyres. In the thermocline, the eastward-flowing equatorial undercurrent (EUC), flanked by the westward-flowing south and north countercurrents, is present in all models. Previous studies already discussed the upper thermocline current structure in the GFDL model suite (Busecke et al., 2019), NEMO2 and NEMO05 (e.g., Izumo, 2005; Lübbecke et al., 2008), and UVic (Dietze and Loeptien, 2013); the upper thermocline will not be further discussed in this study.

Figure 5Mean current velocity (m s−1) at (a) 1000 m of depth at (b) 100∘ W in UVic, NEMO2, NEMO05, GFDL025, GFDL01, and NEMO01. The mean oxygen levels (mmol m−3) (when coupled circulation–biogeochemical experiments have been performed; see Table 1) are displayed as a contour.
At intermediate depth, in the observations, a relatively strong (about 0.1 m s−1) westward-flowing Equatorial Intermediate Current (EIC) is present below the EUC at about 400–600 m of depth (Marin et al., 2010). A complex structure of narrow and vertically alternating jets every 200 m, so-called equatorial deep jets (EDJ), extends below the EIC until 2000 m (Firing, 1987; Cravatte et al., 2012). Laterally to the EIC, the low-latitude subsurface countercurrents (LLSCs) are observed. They include the North and South Subsurface Counter Current (NSCC and SSCC), located around 5∘ N and 5∘ S, and a series of jets between 5 and 15∘ N and between 5 and 15∘ S (in particular the Tsuchiya jets in the Southern Hemisphere described by Rowe et al., 2000). Below the LLSCs, the low-latitude intermediate currents (LLICs) include a series of westward and eastward zonal jets (500–1500 m depth range) alternating meridionally from 3∘ S to 3∘ N; the North and South Intermediate Countercurrents (NICC and SICC) flow eastward at 1.5–2∘ on both flanks of the lower EIC. The North and South Equatorial Intermediate Currents (NEIC and SEIC) flow westward at about 3∘ (Firing, 1987). A detailed schematic view of the tropical intermediate circulation is shown in a recent review by Ménesguen et al. (2019) and in Fig. 1.
In coarse-resolution models, the intermediate current system is not developed and sluggish (even missing in UVic and GFDL1). NEMO2 and NEMO05 display an incomplete EICS as the LLSCs are not represented. High-resolution models (GFDL025, GFDL01, NEMO01) display a more realistic picture, even if the mean velocity is still weaker than in observations (smaller than 5 cm s−1); it reaches more than 10 cm s−1 at 1000 m (Ascani et al., 2010; Cravatte et al., 2017). An interesting feature is that the jets are broader and faster in NEMO01 than in GFDL01. Possible causes include a different wind forcing, mixing strength, or topographic features as all these processes play a role in forcing the intermediate jets (see the review by Ménesguen et al., 2019). The intermediate currents are vertically less coherent in NEMO01 than in GFDL01 due to their large temporal variability in NEMO01. Strong seasonal and interannual variability of the EICS has been observed that displays varying amplitudes and (partially) positions of the main currents and jets (Firing et al., 1998; Gouriou et al., 2006: Cravatte et al., 2017). A clear observational picture of the EICS variability, however, is not yet available. Outside the tropics (in particular south of 15∘ S), the interior velocity pattern is similar in coarse- and high-resolution models, suggesting a similar equatorward current transport at intermediate depth in the subtropics in, for instance, NEMO05 and NEMO01.
4.2 Transport by the EICS
4.2.1 Tracer spreading towards the eastern tropical Pacific
We released a conservative tracer in the subtropical domain in well-oxygenated waters (waters where observed oxygen concentration is greater than 150 mmol m−3 – see Sect. 2.2.2) in a coarse- (NEMO05) and high-resolution configuration (NEMO01). The tracer does not have sources or sinks and is advected and mixed as any other model tracer; it allows for the assessment of the transport pathway of tracer (such as oxygen) from oxygenated waters into the oxygen-deficient eastern tropical Pacific.
The importance of ventilation by oxygen-rich waters, in particular the IDW, is illustrated by the tropical tracer concentration after 50 years (Fig. 6a) of integration (mean 2002–2007). Concentrations decrease from the release location to the northern part of the basin, where the lowest values (below 0.1) are located in NEMO05 and NEMO01. The 0.1 isoline, however, is located close to the Equator in NEMO05, while it is found around 7∘ N in NEMO01. This feature is associated with a pronounced tongue of high tracer concentration (>0.2) between 5∘ N and 5∘ S in NEMO1. Such a tongue is absent in NEMO05. The enhanced tracer concentration in the equatorial region suggests a stronger zonal equatorial ventilation in NEMO01, consistent with a stronger EICS (Fig. 5).
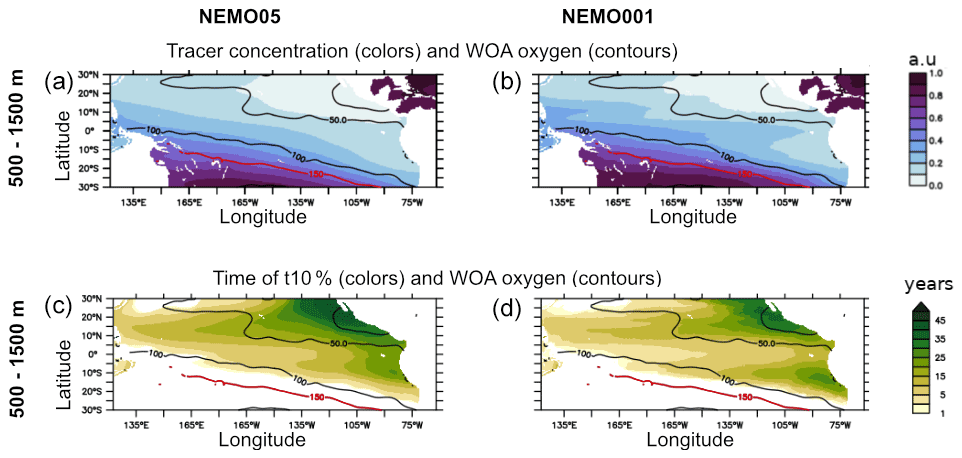
Figure 6Mean 500–1500 m tracer concentration (arbitrary unit) after 60 years of integration in (a) NEMO05 and (b) NEMO01. Time (years) at which the released tracer reaches the concentration 0.1 (t10 %) in (c) NEMO05 and (d) NEMO01: the WOA oxygen levels (mean 500–1500 m) are displayed as a contour. The red contour is the WOA 150 mmol m−3 oxygen isoline used to initialize the tracer level.
The preferential pathways of transport are highlighted by the determination of the transit time it takes for the tracer to spread from the oxygen-rich regions to the tropical regions. We define a threshold called t10 % when the tracer reaches a concentration of 0.1 (Fig. 6b) (similar to the approach of Sen Gupta and England, 2007). t10 % highlights a faster ventilation of the equatorial regions in NEMO01 compared to NEMO05, as t10 % displays a maximum value of 10 (western part) to 30 years (eastern part) between 5∘ N and 5∘ S in NEMO01 compared to 30 years to more than 50 years in NEMO05.
The poorly ventilated southern “shadow zone” (Luyten et al., 1983) is well characterized in NEMO01 compared to NEMO05, as its northern boundary is clearly defined by a higher oxygen concentration due to strong equatorial ventilation in NEMO01, suggesting strong transport by the EICS. The value of t10 % increases linearly at intermediate depth at 100∘ W in NEMO05 from 20∘ S to the Equator, suggesting a slow isopycnal propagation (consistent with the experiments performed using NEMO2 in Sect. 3.2). Conversely, the tracer accumulation is faster in the equatorial regions than in the midlatitudes in NEMO01, suggesting a larger role of advective transport, which is faster than the transport by isopycnal diffusive processes.
4.2.2 Equatorial IDW circulation
The analysis of the dispersion of Lagrangian particles (see Sect. 2.2.3) permits us to understand the origin of the waters circulating in the eastern part of the basin at IDW level. A total of 26 515 particles have been released in the area located at 100∘ W, 10∘ N–10∘ S, 500–1500 m. These particles have been integrated backwards in time in order to determine their origin and the ventilation of the eastern tropical Pacific Ocean (Fig. 7).
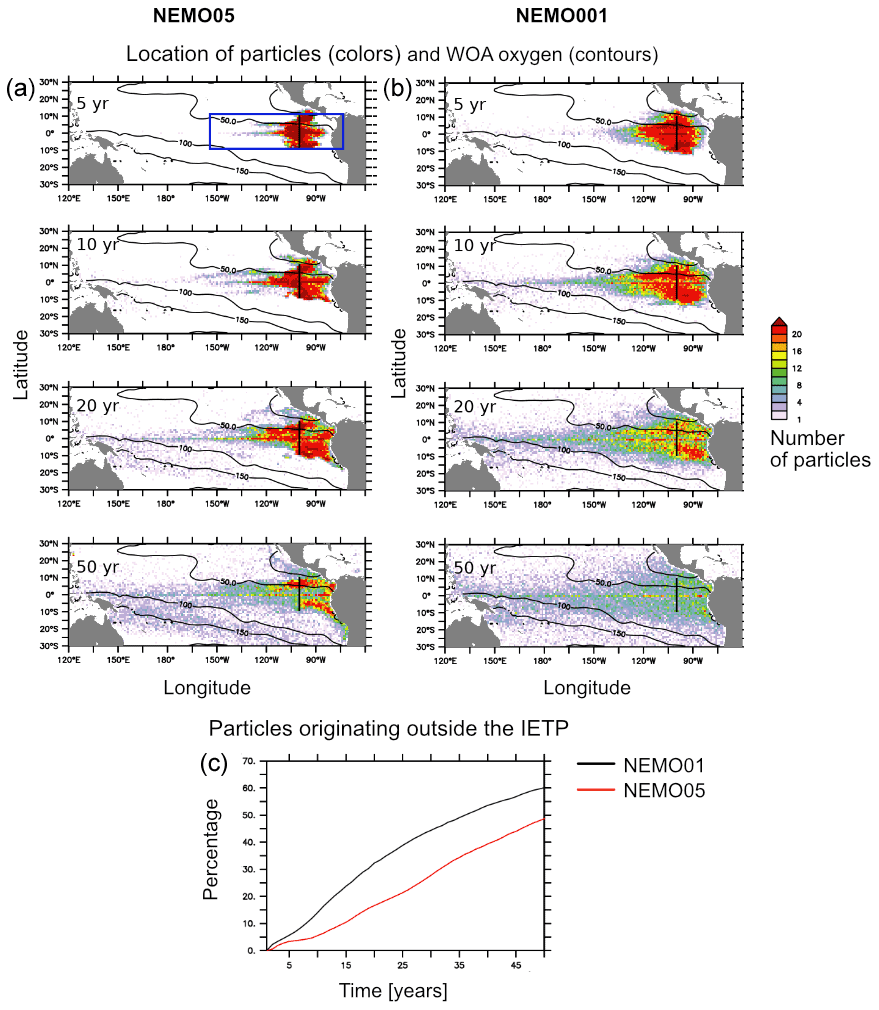
Figure 7Density (number of particles in a box) distribution of the location of released Lagrangian particles – backward integration after 5 (top row), 10 (second row), 20 (third row), and 50 (bottom row) years – in (a) NEMO05 and (b) NEMO01. The release location is identified in bold and is located at 100∘ W, 10∘ N–10∘ S, 500–1500 m of depth (black line). The number of particles has been integrated vertically. The observed mean (500–1500 m) oxygen levels (WOA) are displayed as contours. The blue contour represents the Intermediate Eastern Tropical Pacific (IETP) basin. (c) Percentage of particles originating outside the Intermediate Eastern Tropical Pacific (IETP) basin (160∘ W, 10∘ N–10∘ S, 500–1500 m) in NEMO05 (red) and NEMO01 (black) over time (years).
After 5 years of backwards integration we find that the particles originate from a well-defined region, which extends from 110 to 80∘ W in NEMO05 (Fig. 7a). This region extends westward until 150∘ W as a result of the stronger currents in NEMO01 (Fig. 7b). This larger dispersion and westward origin of the particles are clearly visible after 10, 20, and 50 years of integration. In order to quantify the dispersion of the particles, we define the Intermediate Eastern Pacific Ocean (IETP) as the region 10∘ N–10∘ S, 500–1500 m, 160∘ W–coast. The particles originate outside the IETP in close to 5 % and 50 % of the cases in NEMO05 and 10 % and 60 % of the cases of NEMO01 after a timescale of 10 and 50 years, respectively. Figure 7c shows a lag between NEMO01 and NEMO05: while 10 % of the particles originate outside the IETP after 10 years in NEMO01, the same quantity is reached only after 20 years in NEMO05, suggesting stronger transport in NEMO01. However, after the time period of 20 years, the number of particles originating outside the IETP does not grow faster any more in NEMO01 compared to NEMO05. A hypothesis is enhanced recirculation in NEMO01: the same particles may recirculate several times in the equatorial region due to alternating zonal jets in NEMO01.
The transport has been quantified based on the Lagrangian particle release (Fig. 8). The volume transport is higher in NEMO01 (up to 0.2 Sv) (Fig. 8a) compared to NEMO05 (less than 0.1 Sv at the Equator) (Fig. 8b). It also shows recirculating structures and alternating eastern and western transport in NEMO01 (Fig. 8c). These recirculating structures are absent in NEMO05 and foster the dispersion of particles as shown above.

Figure 8Mean transport (Sv) in (a) NEMO05 and (b) NEMO01 derived from the release of particles at 100∘ W, 10∘ N–10∘ S, 500–1500 m (backward integration). The mean zonal velocity (m s−1) is represented as a contour. (c) Zonally integrated transport (Sv) derived from the release of particles at 100∘ W, 10∘ N–10∘ S, 500–1500 m in NEMO05 (red) and NEMO01 (black). Negative values correspond to westward transport, while positive values correspond to eastward transport.
IDWs are constituted by waters masses which are subducted in the Southern Ocean and transported equatorward to the tropics by isopycnal processes (Sloyan and Kamenkovich, 2007; Sallée et al., 2013; Meijers, 2014) and the western boundary currents. At lower latitudes they recirculate into the lower thermocline of the tropical regions at 500–1500 m and into the EICS (Zenk et al., 2005; Marin et al., 2010; Cravatte et al., 2012; 2017; Ascani et al., 2015; Ménesguen et al., 2019) (see schema in Fig. 1). We show here that the representation of this ventilation pathway is important to take into account when assessing tropical oxygen levels and the extent of the OMZ in coupled biogeochemical circulation or climate models. Particularly, we highlight two critical, yet typical, biases that hamper the correct representation of the tropical oxygen levels.
5.1 Subtropical IDW properties and tropical oxygen
First, the current generation of climate models, such as the CMIP5 models, shows large deficiencies in simulating IDW. Along with an unrealistic representation of IDW properties when the waters enter the subtropics, the models also lack the observed prominent oxygen maximum associated with IDW. Restoring oxygen levels to observed concentrations poleward of 30∘ S and 30∘ N and below 1500 m of depth in a coarse-resolution model, which is comparable to CMIP5 climate models in terms of resolution and oxygen bias, shows a significant impact on the lower thermocline (500–1500 m) oxygen levels: a positive anomaly of 60 mmol m−3 at midlatitudes translates into an oxygen increase by 10 mmol m−3 in tropical regions after 50 years of integration.
The equatorward transport of the anomaly in the subtropics is largely due to isopycnal subgrid-scale mixing processes away from the western boundaries, as shown by the NEMO2 budget analysis. It suggests that mesoscale activity plays a major role in transporting IDW equatorward. In addition, subsurface eddies may facilitate the transport oxygen westward from the eastern Pacific Ocean toward the mid-Pacific Ocean region (Frenger et al., 2018, see their Fig. 2).
5.2 Transport at IDW level and Equatorial Intermediate Current System
Second, the Equatorial Intermediate Current System (EICS) is not represented in coarse-resolution models and only poorly represented in high-resolution ocean circulation models (0.25 and 0.1∘), as its strength remains too weak by a factor of 2 (consistent with previous studies; e.g., Ascani et al., 2015). The EICS transports the IDW that occupies the lower thermocline (500–1500 m of depth) and causes a recirculation of the IDW in the tropical ocean, as suggested by the observational study of Zenk et al. (2005) and shown in our study.
We investigated the impact of the EICS on the oxygen supply with tracer release experiments: the concentration of a conservative tracer that originates from the subtropical ocean is, after 50 years, 30 % higher in the eastern equatorial (5∘ N–5∘ S) Pacific in an ocean model with 0.1∘ resolution compared to an ocean model with 0.5∘ resolution. As the oxygen gradient along the Equator is similar to the gradient of the conservative tracer, we assume a similar enhancement of oxygen supply by 30 % in the eastern equatorial Pacific at the same timescale. This means that if we account for oxygen consumption due to respiration (about 1 mmol m−3 yr−1 between 5∘ N and 5∘ S; see Sect. 3.2), the better-resolved EICS in the higher-resolution ocean roughly leads to higher intermediate oxygen levels of 15–30 mmol m−3 compared to the lower-resolution ocean experiment on a timescale of 50 years. Consistently, the 0.1∘-ocean GFDL01 model displays oxygen concentrations larger by about 30 mmol m−3 in the eastern equatorial lower thermocline (500–1500 m) compared to the 1∘-ocean GFDL1 configuration (with higher subtropical oxygen concentrations of IDW of 15 mmol m−3 in GFDL01 at 30∘ S).
We would like to highlight two potential implications of our finding of the important role of the EICS for the Pacific eastern tropical oxygen supply: (i) first, we have shown that the intermediate current system (EICS) is important for the connection between the western and eastern Pacific Ocean at a decadal to multidecadal timescale. This suggests that the EICS modulates the mean state and the variability of the tropical oxygen in the lower thermocline and subsequently the whole water column by upwelling of deep waters. (ii) Second, we have found an enhancement of the connections between the equatorial deep ocean (>2000 m) and the lower thermocline if the resolution of a model is enhanced. This result is consistent with the studies of Brandt et al. (2011, 2012), who suggested, based on observational data and on an idealized model, that equatorial deep jets as part of the EICS (see Fig. 1b) propagate their energy upward and impact the upper ocean properties of the ocean, including their oxygen content. Taken this into account, we hypothesize that the Pacific Deep Water has a larger role than previously thought in modulating the intermediate and upper ocean properties.
A pragmatic approach to account for the missing EICS is to increase diffusion anisotropically, with increased zonal mixing in the tropics (Getzlaff and Dietze, 2013). This parameterization mimics a more vigorous EICS and improves the simulated shape of the OMZ in climate models (see Sect. S4). However, the prominent bias of IDW in climate models, and therefore of the water masses entering the EICS, is not accounted for with this parameterization. Furthermore, such a parameterization improves the mean state but does not reproduce the variability of the EICS.
5.3 Implication for biogeochemical cycles
The IDWs are an important supplier of oxygen to the tropical oceans, but also of nutrients (Palter et al., 2010) as well as anthropogenic carbon (e.g., Kathiwala et al., 2013), which accumulates in mode and intermediate waters of the Southern Ocean (Sabine et al., 2004; Resplandy et al., 2013). The mechanisms that we discussed here may therefore play a role in ocean carbon climate feedbacks on timescales of decades to a century.
This study shows that there is a need to look with greater care into IDW properties to understand the tropical oxygen distribution in models, in particular in CMIP-class models. As shown by Kwiatkowski et al. (2020), CMIP6 models (typical horizontal resolution of 1∘) do not agree on the future change in tropical oxygen levels (mean 100–600 m, their Fig. 2). This may partly originate in a misrepresentation of the properties of the IDW in the different models and the strength of the connection between the western and eastern Pacific Ocean. Simple analyses, similar to our Fig. 2 (oxygen levels at 30∘ S and oxygen levels in the eastern tropical Pacific) and Fig. S8 (mean kinetic energy at intermediate depth), may give some insight into the mechanisms at play. In addition, analyses of experiments performed in the context of the High-Resolution Model Intercomparison Project (resolution greater than 0.25∘) (Haarsma et al., 2016), part of CMIP6, will give a more complete insight on whether a significant Equatorial Intermediate Current System develops at higher resolution. While HighResMIP are not coupled with a biogeochemical module, velocity fields are available at a monthly resolution, which allows “offline” tracer or Lagrangian particle experiments to be performed.
Finally, this study suggests that changes in the properties of the IDW may contribute to the still partly unexplained deoxygenation of 5 mmol m−3 per decade occurring in the lower thermocline of the equatorial eastern Pacific Ocean (Schmidtko et al., 2017; Oschlies et al., 2018). In addition to an oxygen decrease in tropical regions, Schmidtko et al. (2017) showed a decrease in oxygen levels by 2–5 mmol m−3 in the regions of formation of AAIW. Based on repeated cruise observations, Panassa et al. (2018) highlighted an increase in the apparent oxygen utilization in the core of the AAIW, together with a 5 % increase in nutrient concentrations from 1990 to 2014. The transport of this modified AAIW, which is poorer in oxygen and richer in nutrients, toward the low latitudes by small-scale processes (Sect. 3) and at the Equator by the EICS (Sect. 4), may explain a significant part of the occurring deoxygenation in the equatorial ocean.
In addition to changes in the AAIW properties, little is known about the variability and long-term trend of the strength of the EICS, an oceanic “bridge” between the western and eastern part of the basin. After our first steps toward assessing the role of extratropical oxygen characteristics and the zonal transport of waters at intermediate depths for tropical oxygen concentration, a possible way forward to further assess this cascade of biases could be to perform idealized model experiments in high-resolution configurations aiming to assess the effect of both the observed change in the AAIW properties and a potential change in EICS strength on oxygen levels.
The code for the Nucleus for European Modelling of the Ocean (NEMO) is available at https://www.nemo-ocean.eu/ (NEMO consortium, 2021). The code for the University of Victoria (UVic) model is available at http://terra.seos.uvic.ca/model/ (Eby, 2021). The Lagrangian particle ARIANE code is available at http://stockage.univ-brest.fr/~grima/Ariane/ (Blanke and Grima, 2021). The Coordinated Ocean–Ice Reference Experiments (COREv2) dataset is available at https://data1.gfdl.noaa.gov/nomads/forms/core/COREv2.html (Large and Yeager, 2021). The experimental data are available on request.
The supplement related to this article is available online at: https://doi.org/10.5194/os-17-1489-2021-supplement.
OD conceived the study and performed the NEMO model and ARIANE experiments. OD, IF, and JG analyzed the data, discussed the results, and wrote the paper.
The authors declare that they have no conflict of interest.
Publisher's note: Copernicus Publications remains neutral with regard to jurisdictional claims in published maps and institutional affiliations.
This article is part of the special issue “Ocean deoxygenation: drivers and consequences – past, present and future (BG/CP/OS inter-journal SI)”. It is not associated with a conference.
This work is a contribution of the SFB754 “Climate–Biogeochemistry Interactions in the Tropical Ocean”, supported by the Deutsche Forschungsgemeinschaft (DFG). The NEMO simulations were performed at the North German Supercomputing Alliance (HLRN). We would like to thank Markus Scheinert (research unit “Ocean Dynamics”, GEOMAR) for his technical support in compiling the NEMO code and for providing the high-resolution NEMO input files. We would like to thank GFDL for producing the CM2-0 suite that involved a substantial commitment of computational resources and data storage. Julia Getzlaff acknowledges support by the project “Reduced Complexity Models” – supported by the Helmholtz Association of German Research Centres (HGF) (grant no. ZT-I-0010). Ivy Frenger acknowledges the German Federal Ministry of Education and Research (BMBF) project CUSCO (grant no. 03F0813A). Olaf Duteil acknowledges the German Research Foundation (DFG) (grant no. 434479332).
Olaf Duteil acknowledges the German Research Foundation (DFG) project SYVARBIO (grant no. 434479332). Ivy Frenger acknowledges the German Federal Ministry of Education and Research (BMBF) project CUSCO (grant no. 03F0813A). Julia Getzlaff acknowledges support by the project “Reduced Complexity Models” – supported by the Helmholtz Association of German Research Centres (HGF) (grant no. ZT-I-0010).
The article processing charges for this open-access publication were covered by the GEOMAR Helmholtz Centre for Ocean Research Kiel.
This paper was edited by Minhan Dai and reviewed by four anonymous referees.
Ascani, F., Firing, E., Dutrieux, P., McCreary, J. P., and Ishida, A.: Deep Equatorial Ocean Circulation Induced by a Forced–Dissipated Yanai Beam, J. Phys. Oceanogr., 40, 1118–1142, https://doi.org/10.1175/2010jpo4356.1, 2010.
Ascani, F., Firing, E., McCreary, J. P., Brandt, P., and Greatbatch, R. J.: The Deep Equatorial Ocean Circulation in Wind-Forced Numerical Solutions, J. Phys. Oceanogr., 45, 1709–1734, https://doi.org/10.1175/jpo-d-14-0171.1, 2015.
Bahl, A., Gnanadesikan, A., and Pradal, M. A.: Variations in Ocean Deoxygenation Across Earth System Models: Isolating the Role of Parameterized Lateral Mixing, Global Biogeochem. Cy., 33, 703–724, https://doi.org/10.1029/2018gb006121, 2019.
Blanke, B. and Grima, N.: ARIANE software for tracking particles [code], available at: http://stockage.univ-brest.fr/~grima/Ariane/ariane.html, last access: 14 October 2021.
Blanke, B. and Raynaud, S.: Kinematics of the Pacific Equatorial Undercurrent: An Eulerian and Lagrangian Approach from GCM Results, J. Phys. Oceanogr., 27, 1038–1053, https://doi.org/10.1175/1520-0485(1997)027<1038:kotpeu>2.0.co;2, 1997.
Brandt, P., Funk, A., Hormann, V., Dengler, M., Greatbatch, R. J., and Toole, J. M.: Interannual atmospheric variability forced by the deep equatorial Atlantic Ocean, Nature, 473, 497–500, https://doi.org/10.1038/nature10013, 2011.
Brandt, P., Greatbatch, R. J., Claus, M., Didwischus, S.-H., Hormann, V., Funk, A., Hahn, J., Krahmann, G., Fischer, J., and Körtzinger, A.: Ventilation of the equatorial Atlantic by the equatorial deep jets, J. Geophys. Res., 117, C12015, https://doi.org/10.1029/2012JC008118, 2012.
Breitburg, D., Levin, L. A., Oschlies, A., Grégoire, M., Chavez, F. P., Conley, D. J., Garçon, V., Gilbert, D., Gutiérrez, D., Isensee, K., Jacinto, G. S., Limburg, K. E., Montes, I., Naqvi, S. W. A., Pitcher, G. C., Rabalais, N. N., Roman, M. R., Rose, K. A., Seibel, B. A., Telszewski, M., Yasuhara, M., and Zhang, J.: Declining oxygen in the global ocean and coastal waters, Science, 359, eaam7240, https://doi.org/10.1126/science.aam7240, 2018.
Busecke, J. J. M., Resplandy, L., and Dunne, J. P.: The Equatorial Undercurrent and the Oxygen Minimum Zone in the Pacific, Geophy. Res. Lett., 46, 6716–6725, https://doi.org/10.1029/2019gl082692, 2019.
Cabré, A., Marinov, I., Bernardello, R., and Bianchi, D.: Oxygen minimum zones in the tropical Pacific across CMIP5 models: mean state differences and climate change trends, Biogeosciences, 12, 5429–5454, https://doi.org/10.5194/bg-12-5429-2015, 2015.
Carrasco, C., Karstensen, J., and Farias, L.: On the Nitrous Oxide Accumulation in Intermediate Waters of the Eastern South Pacific Ocean, Front. Mar. Sci., 4, 4–24, https://doi.org/10.3389/fmars.2017.00024, 2017.
Cravatte, S., Kessler, W. S., and Marin, F.: Intermediate Zonal Jets in the Tropical Pacific Ocean Observed by Argo Floats, J. Phys. Oceanogr., 42, 1475–1485, https://doi.org/10.1175/jpo-d-11-0206.1, 2012.
Cravatte, S., Kestenare, E., Marin, F., Dutrieux, P., and Firing, E.: Subthermocline and Intermediate Zonal Currents in the Tropical Pacific Ocean: Paths and Vertical Structure, J. Phys. Oceanogr., 47, 2305–2324, https://doi.org/10.1175/jpo-d-17-0043.1, 2017.
Czeschel, R., Stramma, L., Schwarzkopf, F. U., Giese, B. S., Funk, A., and Karstensen, J.: Middepth circulation of the eastern tropical South Pacific and its link to the oxygen minimum zone, J. Geophys. Res., 116, C01015, https://doi.org/10.1029/2010JC006565, 2011.
Delworth, T. L., Rosati, A., Anderson, W., Adcroft, A. J., Balaji, V., Benson, R., Dixon, K., Griffies, S. M., Lee, H.-C., Pacanowski, R. C., Vecchi, G. A., Wittenberg, A. T., Zeng, F., and Zhang, R.: Simulated Climate and Climate Change in the GFDL CM2.5 High-Resolution Coupled Climate Model, J. Climate, 25, 2755–2781, https://doi.org/10.1175/JCLI-D-11-00316.1, 2012.
Deutsch, C., Berelson, W., Thunell, R., Weber, T., Tems, C., McManus, J., Crusius, J., Ito, T., Baumgartner, T., Ferreira, V., Mey, J., and van Geen, A.: Centennial changes in North Pacific anoxia linked to tropical trade winds, 345, 665–668, https://doi.org/10.1126/science.1252332, 2014.
Dietze, H. and Loeptien, U.: Revisiting “nutrient trapping” in global coupled biogeochemical ocean circulation models, Global Biogeochem. Cy., 27, 265–284, https://doi.org/10.1002/gbc.20029, 2013.
Dufour, C. O., Griffies, S. M., de Souza, G. F., Frenger, I., Morrison, A. K., Palter, J. B., Sarmiento, J. L., Galbraith, E. D., Dunne, J. P., Anderson, W. G., and Slater, R. D.: Role of Mesoscale Eddies in Cross-Frontal Transport of Heat and Biogeochemical Tracers in the Southern Ocean, J. Phys. Oceanogr., 45, 3057–3081, https://doi.org/10.1175/JPO-D-14-0240.1, 2015.
Duteil, O.: Wind Synoptic Activity Increases Oxygen Levels in the Tropical Pacific Ocean, Geophys. Res. Lett , 46, 2715–2725, https://doi.org/10.1029/2018gl081041, 2019.
Duteil, O. and Oschlies, A.: Sensitivity of simulated extent and future evolution of marine suboxia to mixing intensity, Geophys. Res. Lett., 38, L06607, https://doi.org/10.1029/2011gl046877, 2011.
Duteil, O., Koeve, W., Oschlies, A., Aumont, O., Bianchi, D., Bopp, L., Galbraith, E., Matear, R., Moore, J. K., Sarmiento, J. L., and Segschneider, J.: Preformed and regenerated phosphate in ocean general circulation models: can right total concentrations be wrong?, Biogeosciences, 9, 1797–1807, https://doi.org/10.5194/bg-9-1797-2012, 2012.
Duteil, O., Böning, C. W., and Oschlies, A.: Variability in subtropical-tropical cells drives oxygen levels in the tropical Pacific Ocean, Geophys. Res. Lett., 41, 8926–8934, https://doi.org/10.1002/2014gl061774, 2014.
Duteil, O., Oschlies, A., and Böning, C. W.: Pacific Decadal Oscillation and recent oxygen decline in the eastern tropical Pacific Ocean, Biogeosciences, 15, 7111–7126, https://doi.org/10.5194/bg-15-7111-2018, 2018.
Eby, M.: Earth System Climate Model UVIC [code], available at http://terra.seos.uvic.ca/model/, last access: 14 October 2021.
Eden, C. and Dengler, M.: Stacked jets in the deep equatorial Atlantic Ocean, J. Geophys. Res., 113, C04003, https://doi.org/10.1029/2007jc004298, 2008.
Emery, W. J.: Water types and water masses, in: Encyclopedia of Atmospheric Sciences, 2nd Edn., edited by: Holton, J. R., Curry, J. A., and Pyle, J. A., Elsevier, Atlanta, GA, 1556–1567, 2003.
Firing, E.: Deep zonal currents in the central equatorial Pacific, J. Mar. Res., 45 791–812, https://doi.org/10.1357/002224087788327163, 1987.
Firing, E., Wijffels, S. E., and Hacker, P.: Equatorial subthermocline currents across the Pacific, J. Geophys. Res.-Oceans, 103, 21413–21423, https://doi.org/10.1029/98jc01944, 1998.
Frenger, I., Bianchi, D., Stührenberg, C., Oschlies, A., Dunne, J., Deutsch, C., Galbraith, E., and Schütte, F.: Biogeochemical Role of Subsurface Coherent Eddies in the Ocean: Tracer Cannonballs, Hypoxic Storms, and Microbial Stewpots?, Global Biogeochem. Cy., 32, 226–249, https://doi.org/10.1002/2017GB005743, 2018.
Galbraith, E. D., Dunne, J. P., Gnanadesikan, A., Slater, R. D., Sarmiento, J. L., Dufour, C. O., de Souza, G. F., Bianchi, D., Claret, M., Rodgers, K. B., and Marvasti, S. S.: Complex functionality with minimal computation: Promise and pitfalls of reduced-tracer ocean biogeochemistry models, J. Adv. Model. Earth Syst., 7, 2012–2028, https://doi.org/10.1002/2015MS000463, 2015.
Garcia, H. E., Weathers, K., Paver, C. R., Smolyar, I., Boyer, T. P., Locarnini, R. A., Zweng, M. M., Mishonov, A. V., Baranova, O. K., Seidov, D., and Reagan, J. R.: World Ocean Atlas 2018, in: Volume 3: Dissolved Oxygen, Apparent Oxygen Utilization, and Oxygen Saturation, Technical Edn., edited by: Mishonov, A., NOAA Atlas NESDIS 83, NOAA, 38 pp., available at: https://www.ncei.noaa.gov/sites/default/files/2020-04/woa18_vol3.pdf (last access: 14 October 2021), 2018.
Gent, P. R. and Mcwilliams, J. C.: Isopycnal Mixing in Ocean Circulation Models, J. Phys. Oceanogr., 20, 150–155, https://doi.org/10.1175/1520-0485(1990)020<0150:IMIOCM>2.0.CO;2, 1990.
Getzlaff, J. and Dietze, H.: Effects of increased isopycnal diffusivity mimicking the unresolved equatorial intermediate current system in an earth system climate model, Geophys. Res. Lett., 40, 2166–2170, https://doi.org/10.1002/grl.50419, 2013.
Getzlaff, J., Dietze, H., and Oschlies, A.: Simulated effects of southern hemispheric wind changes on the Pacific oxygen minimum zone, Geophys. Res. Lett., 43, 728–734, https://doi.org/10.1002/2015GL066841, 2016.
Gnanadesikan, A., Bianchi, D., and Pradal, M.: Critical role for mesoscale eddy diffusion in supplying oxygen to hypoxic ocean waters, Geophys. Res. Lett., 40, 5194–5198, https://doi.org/10.1002/grl.50998, 2013.
Gouriou, Y., Delcroix, T., and Eldin, G.: Upper and intermediate circulation in the western equatorial Pacific Ocean in October 1999 and April 2000, Geophys. Res. Lett., 33, L10603, https://doi.org/10.1029/2006gl025941, 2006.
Griffies, S. M., Winton, M., Anderson, W. G., Benson, R., Delworth, T. L., Dufour, C. O., Dunne, J. P., Goddard, P., Morrison, A. K., Rosati, A., Wittenberg, A. T., Yin, J., and Zhang, R.: Impacts on Ocean Heat from Transient Mesoscale Eddies in a Hierarchy of Climate Models, J. Climate, 28, 952–977, https://doi.org/10.1175/jcli-d-14-00353.1, 2015.
Gurvan, M., Bourdallé-Badie, R., Pierre-Antoine Bouttier, Bricaud, C., Bruciaferri, D., Calvert, D., Chanut, J., Clementi, E., Coward, A., Delrosso, D., Ethé, C., Flavoni, S., Graham, T., Harle, J., Iovino, D., Lea, D., Lévy, C., Lovato, T., Martin, N., Masson, S., Mocavero, S., Paul, J., Rousset, C., Storkey, D., Storto, A., and Vancoppenolle, M.: NEMO ocean engine, Zenodo, https://doi.org/10.5281/ZENODO.3248739, 2017.
Haarsma, R. J., Roberts, M. J., Vidale, P. L., Senior, C. A., Bellucci, A., Bao, Q., Chang, P., Corti, S., Fučkar, N. S., Guemas, V., von Hardenberg, J., Hazeleger, W., Kodama, C., Koenigk, T., Leung, L. R., Lu, J., Luo, J.-J., Mao, J., Mizielinski, M. S., Mizuta, R., Nobre, P., Satoh, M., Scoccimarro, E., Semmler, T., Small, J., and von Storch, J.-S.: High Resolution Model Intercomparison Project (HighResMIP v1.0) for CMIP6, Geosci. Model Dev., 9, 4185–4208, https://doi.org/10.5194/gmd-9-4185-2016, 2016.
Ito, T. and Deutsch, C.: Variability of the oxygen minimum zone in the tropical North Pacific during the late twentieth century: Variabilty Of Tropical Pacific OMZ, Global Biogeochem. Cy., 27, 1119–1128, https://doi.org/10.1002/2013GB004567, 2013.
Izumo, T.: The equatorial undercurrent, meridional overturning circulation, and their roles in mass and heat exchanges during El Niño events in the tropical Pacific ocean, Ocean Dynam., 55, 110–123, https://doi.org/10.1007/s10236-005-0115-1, 2005.
Karstensen, J., Stramma, L., and Visbeck, M.: Oxygen minimum zones in the eastern tropical Atlantic and Pacific oceans, Prog. Oceanogr., 77, 331–350, https://doi.org/10.1016/j.pocean.2007.05.009, 2008.
Kawabe, M. and Fujio, S.: Pacific ocean circulation based on observation, J. Oceanogr., 66, 389–403, https://doi.org/10.1007/s10872-010-0034-8, 2010.
Kawabe, M., Kashino, Y., and Kuroda, Y.: Variability and linkages of New Guinea coastal undercurrent and lower equatorial intermediate current, J. Phys. Oceanogr., 38, 1780–1793, https://doi.org/10.1175/2008JPO3916.1, 2008.
Keller, D. P., Oschlies, A., and Eby, M.: A new marine ecosystem model for the University of Victoria Earth System Climate Model, Geosci. Model Dev., 5, 1195–1220, https://doi.org/10.5194/gmd-5-1195-2012, 2012.
Khatiwala, S., Tanhua, T., Mikaloff Fletcher, S., Gerber, M., Doney, S. C., Graven, H. D., Gruber, N., McKinley, G. A., Murata, A., Ríos, A. F., and Sabine, C. L.: Global ocean storage of anthropogenic carbon, Biogeosciences, 10, 21690–2191, https://doi.org/10.5194/bg-10-2169-2013, 2013.
Kriest, I., Khatiwala, S., and Oschlies, A.: Towards an assessment of simple global marine biogeochemical models of different complexity, Prog. Oceanogr., 86, 337–360, https://doi.org/10.1016/j.pocean.2010.05.002, 2010.
Kwiatkowski, L., Torres, O., Bopp, L., Aumont, O., Chamberlain, M., Christian, J. R., Dunne, J. P., Gehlen, M., Ilyina, T., John, J. G., Lenton, A., Li, H., Lovenduski, N. S., Orr, J. C., Palmieri, J., Santana-Falcón, Y., Schwinger, J., Séférian, R., Stock, C. A., Tagliabue, A., Takano, Y., Tjiputra, J., Toyama, K., Tsujino, H., Watanabe, M., Yamamoto, A., Yool, A., and Ziehn, T.: Twenty-first century ocean warming, acidification, deoxygenation, and upper-ocean nutrient and primary production decline from CMIP6 model projections, Biogeosciences, 17, 3439–3470, https://doi.org/10.5194/bg-17-3439-2020, 2020.
Lachkar, Z., Orr, J. C., and Dutay, J.-C.: Seasonal and mesoscale variability of oceanic transport of anthropogenic CO2, Biogeosciences, 6, 2509–2523, https://doi.org/10.5194/bg-6-2509-2009, 2009.
Large, W. G. and Yeager, S. G.: The global climatology of an interannually varying air–sea flux data set, Clim. Dynam., 33, 341–364, https://doi.org/10.1007/s00382-008-0441-3, 2008.
Large, W. G. and Yeager, S. G.: Forcing for Coordinated Ocean-ice Reference Experiments v2 (COREv2) [dataset], available at: https://data1.gfdl.noaa.gov/nomads/forms/core/COREv2.html, last access: 14 October 2021.
Locarnini, R. A., Boyer, T. P., Mishonov, A. V., Reagan, J. R., Zweng, M. M., Baranova, O. K., Garcia, H. E., Seidov, D., Weathers, K. W., Paver, C. R., and Smolyar, I. V.: World Ocean Atlas 2018, in: Volume 5: Density, editeded by: Mishonov, A., NOAA Atlas NESDIS 85, NOAA, 41 pp., available at: https://www.ncei.noaa.gov/sites/default/files/2021-03/WOA18_Vol5_Density.pdf (last access: 14 October 2021), 2019.
Lübbecke, J. F., Böning, C. W., and Biastoch, A.: Variability in the subtropical-tropical cells and its effect on near-surface temperature of the equatorial Pacific: a model study, Ocean Sci., 4, 73–88, https://doi.org/10.5194/os-4-73-2008, 2008.
Luyten, J. R., Pedlosky, J., and Stommel, H.: The ventilated thermocline, J. Phys. Oceanogr., 13, 292–309, 1983.
Marin, F., Kestenare, E., Delcroix, T., Durand, F., Cravatte, S., Eldin, G., and Bourdallé-Badie, R.: Annual Reversal of the Equatorial Intermediate Current in the Pacific: Observations and Model Diagnostics, J. Phys. Oceanogr., 40, 915–933, https://doi.org/10.1175/2009jpo4318.1, 2010.
Meijers, A. J. S.: The Southern Ocean in the Coupled Model Intercomparison Project phase 5, Philos. T. Roy. Soc. A, 372, 20130296, https://doi.org/10.1098/rsta.2013.0296, 2014.
Ménesguen, C., Delpech, A., Marin, F., Cravatte, S., Schopp, R., and Morel, Y.: Observations and Mechanisms for the Formation of Deep Equatorial and Tropical Circulation, Earth Space Sci., 6, 370–386, https://doi.org/10.1029/2018ea000438, 2019.
Mignot, J., Swingedouw, D., Deshayes, J., Marti, O., Talandier, C., Séférian, R., Lengaigne, M., and Madec, G.: On the evolution of the oceanic component of the IPSL climate models from CMIP3 to CMIP5: A mean state comparison, Ocean Model., 72, 167–184, https://doi.org/10.1016/j.ocemod.2013.09.001, 2013.
Molinelli, E. J.: The Antarctic influence on Antarctic Intermediate Water, J. Mar. Res., 39, 267–293, 1981.
Montes, I., Dewitte, B., Gutknecht, E., Paulmier, A., Dadou, I., Oschlies, A., and Garçon, V.: High-resolution modeling of the Eastern Tropical Pacific oxygen minimum zone: Sensitivity to the tropical oceanic circulation, J. Geophys. Res.-Oceans, 119, 5515–5532, https://doi.org/10.1002/2014JC009858, 2014.
NEMO consortium: Annual mean of sea surface salinity in ∘ (NEMO-WRF coupling), available at: https://www.nemo-ocean.eu/, last access: 14 October 2021.
Oschlies, A., Duteil, O., Getzlaff, J., Koeve, W., Landolfi, A., and Schmidtko, S.: Patterns of deoxygenation: sensitivity to natural and anthropogenic drivers, Philos. T. Roy. Soc. A, 375, 20160325, https://doi.org/10.1098/rsta.2016.0325, 2017.
Oschlies, A., Brandt, P., Stramma, L., and Schmidtko, S.: Drivers and mechanisms of ocean deoxygenation, Nat. Geosci., 11, 467–473, https://doi.org/10.1038/s41561-018-0152-2, 2018.
Palter, J. B., Sarmiento, J. L., Gnanadesikan, A., Simeon, J., and Slater, R. D.: Fueling export production: nutrient return pathways from the deep ocean and their dependence on the Meridional Overturning Circulation, Biogeosciences, 7, 3549–3568, https://doi.org/10.5194/bg-7-3549-2010, 2010.
Panassa, E., Santana-Casiano, J. M., González-Dávila, M., Hoppema, M., van Heuven, S. M. A. C., Völker, C., Wolf-Gladrow, D., and Hauck, J.: Variability of nutrients and carbon dioxide in the Antarctic Intermediate Water between 1990 and 2014, Ocean Dynam., 68, 295–308, https://doi.org/10.1007/s10236-018-1131-2, 2018.
Pardo, P. C., Pérez, F. F., Velo, A., and Gilcoto, M.: Water masses distribution in the Southern Ocean: Improvement of an extended OMP (eOMP) analysis, Prog. Oceanogr., 103, 92–105, https://doi.org/10.1016/j.pocean.2012.06.002, 2012.
Paulmier, A. and Ruiz-Pino, D.: Oxygen minimum zones (OMZs) in the modern ocean, Prog. Oceanogr., 80, 113–128, https://doi.org/10.1016/j.pocean.2008.08.001, 2009.
Qu, T., and Lindstrom, E. J.: Northward Intrusion of Antarctic Intermediate Water in the Western Pacific, J. Phys. Oceanogr., 34, 2104–2118, https://doi.org/10.1175/1520-0485(2004)034<2104:nioaiw>2.0.co;2, 2004.
Resplandy, L., Bopp, L., Orr, J. C., and Dunne, J. P.: Role of mode and intermediate waters in future ocean acidification: Analysis of CMIP5 models, Geophys. Res. Lett., 40, 3091–3095, https://doi.org/10.1002/grl.50414, 2013.
Rowe, G. D., Firing, E., and Johnson, G. C.: Pacific Equatorial Subsurface Countercurrent Velocity, Transport, and Potential Vorticity, J. Phys. Oceanogr., 30, 1172–1187, https://doi.org/10.1175/1520-0485(2000)030<1172:pescvt>2.0.co;2, 2000.
Russell, J. L. and Dickson, A. G.: Variability in oxygen and nutrients in South Pacific Antarctic Intermediate Water, Global Biogeochem. Cy., 17, 1033, https://doi.org/10.1029/2000gb001317, 2003.
Sabine, C. L.: The Oceanic Sink for Anthropogenic CO2, Science, 305, 367–371, https://doi.org/10.1126/science.1097403, 2004.
Sabine, C. L., Feely, R. A., Gruber, N., Key, R. M., Lee, K., Bullister, J. L., Wanninkhof, R., Wong, C. S., Wallace, D. W. R., Tilbrook, B., Millero, F. J., Peng, T.-H., Kozyr, A., Ono, T., and Rios, A. F.: The Oceanic Sink for Anthropogenic CO2, Science, 305, 367–371, https://doi.org/10.1126/science.1097403, 2004.
Sallée, J.-B., Shuckburgh, E., Bruneau, N., Meijers, A. J. S., Bracegirdle, T. J., Wang, Z., and Roy, T.: Assessment of Southern Ocean water mass circulation and characteristics in CMIP5 models: Historical bias and forcing response, J. Geophys. Res.-Oceans, 118, 1830–1844, https://doi.org/10.1002/jgrc.20135, 2013.
Schmidtko, S., Stramma, L., and Visbeck, M.: Decline in global oceanic oxygen content during the past five decades, Nature, 542, 335–339, https://doi.org/10.1038/nature21399, 2017.
Sen Gupta, A. and England, M. H.: Evaluation of Interior Circulation in a High-Resolution Global Ocean Model. Part II: Southern Hemisphere Intermediate, Mode, and Thermocline Waters, J. Phys. Oceanogr., 37, 2612–2636, https://doi.org/10.1175/2007jpo3644.1, 2007.
Shigemitsu, M., Yamamoto, A., Oka, A., and Yamanaka, Y.: One possible uncertainty in CMIP5 projections of low-oxygen water volume in the Eastern Tropical Pacific, Global Biogeochem. Cy., 31, 804–820, https://doi.org/10.1002/2016gb005447, 2017.
Sloyan, B. M. and Kamenkovich, I. V.: Simulation of Subantarctic Mode and Antarctic Intermediate Waters in Climate Models, J. Climate, 20, 5061–5080, https://doi.org/10.1175/jcli4295.1, 2007.
Sloyan, B. M. and Rintoul, S. R.: Circulation, Renewal, and Modification of Antarctic Mode and Intermediate Water, J. Phys. Oceanogr., 31, 1005–1030, https://doi.org/10.1175/1520-0485(2001)031<1005:cramoa>2.0.co;2, 2001.
Stramma, L., Johnson, G. C., Firing, E., and Schmidtko, S.: Eastern Pacific oxygen minimum zones: Supply paths and multidecadal changes, J. Geophys. Res.-Oceans, 115, C09011, https://doi.org/10.1029/2009JC005976, 2010.
Takano, Y., Ito, T., and Deutsch, C.: Projected Centennial Oxygen Trends and Their Attribution to Distinct Ocean Climate Forcings, Global Biogeochem. Cy., 32, 1329–1349, https://doi.org/10.1029/2018gb005939, 2018.
Talley, L. D.: Distribution and Formation of North Pacific Intermediate Water, J. Phys. Oceanogr., 23, 517–537, https://doi.org/10.1175/1520-0485(1993)023<0517:dafonp>2.0.co;2, 1993.
Weaver, A. J., Eby, M., Wiebe, E. C., Bitz, C. M., Duffy, P. B., Ewen, T. L., Fanning, A. F., Holland, M. M., MacFadyen, A., Matthews, H. D., Meissner, K. J., Saenko, O., Schmittner, A., Wang, H., and Yoshimori, M.: The UVic earth system climate model: Model description, climatology, and applications to past, present and future climates, Atmos.-Ocean, 39, 361–428, https://doi.org/10.1080/07055900.2001.9649686, 2001.
Zenk, W., Siedler, G., Ishida, A., Holfort, J., Kashino, Y., Kuroda, Y., Miyama, T., and Müller, T. J.: Pathways and variability of the Antarctic Intermediate Water in the western equatorial Pacific Ocean, Prog. Oceanogr., 67, 245–281, https://doi.org/10.1016/j.pocean.2005.05.003, 2005.
Zhu, C., Liu, Z., and Gu, S.: Model bias for South Atlantic Antarctic intermediate water in CMIP5, Clim. Dynam., 50, 3613–3624, https://doi.org/10.1007/s00382-017-3828-1, 2017.
- Abstract
- Introduction
- Description of models and experiments
- Intermediate water properties and oxygen content
- Equatorial intermediate current system and oxygen transport
- Summary and implications
- Code and data availability
- Author contributions
- Competing interests
- Disclaimer
- Special issue statement
- Acknowledgements
- Financial support
- Review statement
- References
- Supplement