the Creative Commons Attribution 4.0 License.
the Creative Commons Attribution 4.0 License.
 | 23 Aug 2021
Simulated zonal current characteristics in the southeastern tropical Indian Ocean (SETIO)
Nining Sari Ningsih
Sholihati Lathifa Sakina
Raden Dwi Susanto
Farrah Hanifah
Detailed ocean currents in the southeastern tropical Indian Ocean adjacent to southern Sumatran and Javan coasts have not been fully explained because of limited observations. In this study, zonal current characteristics in the region have been studied using simulation results of a ∘ global hybrid coordinate ocean model from 1950 to 2013. The simulated zonal currents across three meridional sections were then investigated using an empirical orthogonal function (EOF), where the first three modes account for 75 %–98 % of the total variance. The first temporal mode of EOF is then investigated using ensemble empirical mode decomposition (EEMD) to distinguish the signals.
This study has revealed distinctive features of currents in the South Java Current (SJC) region, the Indonesian Throughflow (ITF)–South Equatorial Current (SEC) region, and the transition zone between these regions. The vertical structures of zonal currents in southern Java and offshore Sumatra are characterized by a one-layer flow. Conversely, a two-layer flow is observed in the nearshore and transition regions of Sumatra. Current variation in the SJC region has peak energies that are sequentially dominated by semiannual, intraseasonal, and annual timescales. Meanwhile, the transition zone is characterized by semiannual and intraseasonal periods with pronounced interannual variations. In contrast, interannual variability associated with El Niño–Southern Oscillation (ENSO) and the Indian Ocean Dipole (IOD) modulates the prominent intraseasonal variability of current in the ITF–SEC region. ENSO has the strongest influence at the outflow ITF, while the IOD's strongest influence is in southwestern Sumatra, with the ENSO (IOD) leading the current by 4 months (1 month). Moreover, the contributions (largest to smallest) of each EEMD mode at the nearshore of Java and offshore Sumatra are intraseasonal, semiannual, annual, interannual, and long-term fluctuations. The contribution of long-term variation (19.2 %) in the far offshore eastern Indian Ocean is larger than the interannual (16.3 %) and annual (14.7 %) variations. Future studies should be conducted to investigate this long-term variation.
- Article
(31728 KB) - Full-text XML
- BibTeX
- EndNote


The southeastern tropical Indian Ocean (SETIO) plays an important role in ocean and atmosphere dynamics of Indian Ocean. Several features make the SETIO region unique. This is partly due to the presence of the Indonesian Throughflow (ITF) (Gordon, 1986; Wyrtki, 1987; Murray and Arief 1988; and publications made thereafter), which transfers warm and fresh Pacific waters to the Indian Ocean and contributes to variability of sea surface temperature (SST) in the SETIO, particularly in the area off Java and Sumatra, which in turn affects the climate system both at regional and global scales (Clark et al., 2003; Saji and Yamagata, 2003). In the SETIO, the complex dynamical circulations exist due to the coexistence of the South Java Current (SJC), South Java Undercurrent (SJUC), South Equatorial Current (SEC), and the ITF, which originates from the outflow passages (e.g., Sunda, Lombok, and Ombai straits and the Timor Passage) and their mutual interactions. It has been recognized that the SJC and SJUC play an important role in distributing warm and fresh water into and out of the southeastern Indian Ocean and in turn influence the global climate system (e.g., Fieux et al., 1994, 1996; Sprintall et al., 1999, 2010; Wijffels et al., 2002; Wijffels and Meyers, 2004).
Previous studies have suggested that the current dynamics in the SETIO, as well as ocean circulations in the inner Indonesian seas, are strongly linked to the regional Indo-Pacific and global climates from intraseasonal, seasonal, interannual, and even longer timescales (e.g., Sprintall et al., 1999; Song et al., 2004; Iskandar et al., 2006; Yuan et al., 2008; Syamsudin and Kaneko, 2013; Sprintall and Révelard, 2014; Krishnamurthy and Krishnamurthy, 2016; Susanto et al., 2016). On an intraseasonal timescale, Iskandar et al. (2006) have confirmed the existence of intraseasonal variations of SJC and its deeper undercurrent (SJUC) along the southern Sumatran and Javan coasts using simulations from an ocean general circulation model (OGCM) for 13 years (1990–2003). They found that the intraseasonal SJC is dominated by the 90 d variations associated with propagation of the first baroclinic Kelvin waves, which are driven by strong 90 d winds over the central equatorial Indian Ocean. Meanwhile, 60 d variations are the dominant feature in the SJUC, which are forced by intraseasonal atmospheric variability associated with the eastward movement of the Madden–Julian Oscillation (MJO) over the eastern equatorial Indian Ocean.
On a seasonal timescale, variabilities of SJC and SJUC that exist along the coasts of western Sumatra and southern Java have been investigated based on observation data (e.g., Sprintall et al., 1999, 2010; Qu and Meyers, 2005). In general, their studies have revealed that the SJC is eastward during the northwest (NW) monsoon (December to February; DJF) and that the eastward-flowing SJC is enhanced in the presence of semiannual coastal Kelvin waves originating in the equatorial Indian Ocean during the first (March to May; MAM) and second (September to November; SON) transitional monsoons. During the southeast (SE) monsoon (July to August; JJA), the SJC flows mostly westward. In addition, Sprintall et al. (2010) have confirmed the extension of SJC and SJUC into the Ombai Strait through the Sawu Sea based on 3-year velocity measurements (2004–2006).
Moreover, like SJC, ITF also has seasonal variability. Sprintall et al. (2009) have examined the ITF transport in three exit passages, namely the Lombok and Ombai straits and Timor Passage, using INSTANT (International Nusantara STratification ANd Transport) data from January 2003 through December 2006. Their results show that seasonal variations of the ITF are influenced by the monsoon climate, with maximum ITF occurring during the SE monsoon. Under the El Niño–Southern Oscillation (ENSO) cycle, interannual variability of ENSO also affects the ITF transport, in which ENSO-related wind forcing is found to modulate the variability of ITF transport, which strengthened (weakened) during La Niña (El Niño) (Susanto et al., 2012; Susanto and Song, 2015; Feng et al., 2018). In addition to ENSO, Pujiana et al. (2019) have revealed that Indian Ocean Dipole (IOD) was also responsible for the anomalous ITF. They found a reduction in the ITF transport in 2016 due to an unprecedented negative IOD event. Feng et al. (2018) also reported the presence of decadal and interdecadal variations of the ITF transport, mostly due to the ITF responses to atmospheric forcing (trade winds) and oceanic adjustment in the Pacific (Meng et al., 2004; Feng et al., 2018). In addition to the wind forcing mechanism, fluctuations in rainfall over the Indonesian seas that modulate salinity also influence the ITF transport on interannual (Hu and Sprintall, 2016) and decadal (Hu and Sprintall, 2017; Jyoti et al., 2019) timescales. They found that the salinity effect mechanism is an important component of ITF dynamics and that it is different from the wind forcing mechanism. Moreover, it has been revealed that the salinity effect contributes 36 % of the total interannual variability of the ITF transport (Hu and Sprintall, 2016) and dominated an increasing trend of the ITF transport during the past decade (Hu and Sprintall, 2017).
In the offshore area of the SETIO, it has been reported that the SEC in the southern waters of Java has an intraseasonal variation on a 60 d timescale (e.g., Quadfasel and Cresswell, 1992; Semtner and Chervin, 1992; Bray et al., 1997). Further research carried out by Feng and Wijffels (2002) showed that baroclinic instability seems to be the main cause of intraseasonal variability in the SEC. Moreover, it is known that the SEC in the southern Indian Ocean bifurcates at the eastern coast of Madagascar into the Northeast Madagascar Current (NEMC) and Southeast Madagascar Current (SEMC). Yamagami and Tozuka (2015) have investigated interannual variability of the SEC bifurcation along the Madagascar coast. Their results indicate that interannual variation of SEC bifurcation latitude and the NEMC and SEMC transports are correlated with Niño 3.4 index, with a lag of about 5–15 months. However, the seasonal and interannual variations of SEC in the SETIO are still unclear.
Regarding dynamics and characteristics of the SETIO, especially adjacent to the western coast of Sumatra and the southern coast of Java, previous studies are either based on a numerical model, remote sensed data, or velocity or mooring observations within the Indonesian seas or at the exit passages of Indonesian seas (Sunda, Lombok, Ombai, and Timor passages), which lead into the SETIO. There is almost no ocean current or velocity measurement within the SETIO. The observational velocity data are available only at limited points in space and time. The first velocity measurement in the SETIO region was reported by Sprintall et al. (1999). The mooring was deployed in 200 m water depth off the southern coast of Java at 8.19∘ S, 109.53∘ E from March 1997 to March 1998 at depths of 55, 115, and 175 m, but only the current meters at 115 and 175 m were fully working properly (Sprintall et al., 1999). It should be underlined that the period of velocity measurement was conducted during strong El Niño and positive IOD episodes. Hence, not only might the observed currents not characterize the neutral years, but its characteristics might also not be fully resolved due to this limited vertical resolution. Another velocity measurement at the southern coast of Java with a relatively high vertical resolution is collected by RAMA (Research Moored Array for African-Asian-Australian Monsoon Analysis and Prediction). The RAMA mooring was installed at 8.5∘ S, 106.75∘ E (indicated by point R2 in Fig. 1), and it provides current data for a period of 17 months (December 2008 to May 2010) from the near surface down to a depth of 136 m with a vertical resolution of 8 m. Due to this limited duration of observed currents, it might hard to resolve variations on timescales greater than the semiannual cycle. Recently, there are some moorings to measure velocity and stratification deployed in the SETIO region. However, they have not been fully recovered or published. Therefore, due to the limited duration of in situ velocity measurements and the limited number of observation points in the SETIO, the detailed dynamics and characteristics of ocean currents in the region are not fully understood yet. It is important to obtain a better understanding of current characteristics, as well as their spatial and temporal variations in the SETIO adjacent to the southern coasts of Sumatra and Java, both for scientific and practical reasons, such as fisheries, climate, and navigation. These are the main motivations of the present study.

Figure 1Validation of HYCOM zonal currents with OSCAR and RAMA datasets. (a) Locations of validation points are as follows: points O1 (8∘ S, 116∘ E), O2 (7∘ S, 98∘ E), and O3 (11.5∘ S, 113∘ E) show the OSCAR data, while R1 (0∘ S, 90∘ E) and R2 (8.5∘ S, 106.75∘ E) show the RAMA data. (b–d) Time series of the zonal currents observed by the HYCOM (blue lines) and the OSCAR (red lines) at a depth of 0.5 m at points O1, O2, and O3, respectively. Meanwhile (e)–(h) are the time series of zonal currents observed by the HYCOM (blue lines) and the moored RAMA (red lines) at point R1 sequentially at depths of 50, 150, 250, and 350 m. Meanwhile, (i)–(k) are the same as (e)–(h), except for being for point R2 at depths of 40, 80, and 120 m,. In (e)–(h) (point R1), a monthly low-pass filter has been applied before plotting. RMSE stands for root-mean-square error, r shows the correlation coefficients.
In addition, many studies of the current dynamic in the SETIO adjacent to the southern coasts of Sumatra and Java, which were carried out by the previous investigators mentioned above (i.e., Sprintall et al., 1999, 2010; Qu and Meyers, 2005; Iskandar et al., 2006), focused on intraseasonal and seasonal variations based on relatively limited observation periods and measured data points. To the best of our knowledge, research concerning features of zonal currents in the SETIO, especially in regions of SJC, ITF and SEC, and the transition zone between these regions, as well as their interannual and long-term variations, has so far not been extensively performed in these regions, either based on observations or numerical models. It is necessary to acquire better and comprehensive insights into both spatial and temporal characteristics of the current circulation in the region. Hence, the aims of this paper are (1) to further investigate basic features and mode structures of the current vertical profile time series and their temporal variability in the SETIO adjacent to the Sumatran and Javan southern coasts based on relatively long-term data (64 years) derived from simulated results of a ∘ global version of the HYbrid Coordinate Ocean Model (HYCOM); (2) to better understand variability of the zonal current in the area of study, especially on intraseasonal, seasonal, and interannual timescales, by using a combination of empirical orthogonal function (EOF) analysis and the ensemble empirical mode decomposition (EEMD) method (i.e., Huang et al., 1998; Wu and Huang, 2009; Shen et al., 2017, and publications made thereafter); and (3) to comprehensively discuss the ocean current characteristics in the SETIO and subsequently elaborate their genesis.
The HYCOM has been successfully used by previous investigators to simulate current circulation within the Indonesian waters (e.g., Gordon et al., 2008; Metzger et al., 2010; Shinoda et al., 2012). In this study, we analyzed the monthly mean HYCOM simulated currents with ∘ horizontal resolution for the period of 64 years (1950–2013). Simulation results of the HYCOM version used in this study have been verified against several data, and the verifications have been documented in our earlier publications (Hanifah and Ningsih, 2016). In addition to the aforementioned comparisons, in this paper we have performed comparisons between the moored RAMA provided by National Oceanic and Atmospheric Administration (NOAA) and the HYCOM currents at two points (marked by points R1 and R2) and also comparisons between OSCAR (Ocean Surface Current Analysis Real-time) and the HYCOM currents at three points (marked by points O1, O2, and O3), as shown in Fig. 1. The RAMA and OSCAR datasets have been provided by NOAA (https://www.pmel.noaa.gov/tao/ data_deliv/deliv-nojava-rama.html, last access: 19 April 2020) and the Physical Oceanography Distributed Active Archive Center (PODAAC) (https://podaac.jpl.nasa.gov/dataset/OSCAR_L4_OC_third-deg, last access: 29 April 2020), respectively. The general agreement between the HYCOM currents and those of the moored RAMA is reasonably encouraging, with the correlation coefficient (r) ranging from 0.40 to 0.57 at point R1 (Fig. 1e–h) and 0.49 to 0.55 at point R2 (Fig. 1i–k), with the 95 % significance level at both points approximately ± 0.04 and ± 0.09, respectively. In addition, the root-mean-square errors (RMSEs) between them range from 0.10 to 0.28 m s−1 at point R1 and 0.17 to 0.29 m s−1 at point R2. Meanwhile, the comparisons between the HYCOM currents and the OSCAR data also show general agreement at points O1 (r= 0.65; RMSE = 0.17 m s−1), O2 (r= 0.59; RMSE = 0.19 m s−1), and O3 (r= 0.60; RMSE = 0.21 m s−1), with the 95 % significance level at the three points being ± 0.13 (Fig. 1b–d). Further details of the numerical model description of this applied HYCOM version can be found in Hanifah and Ningsih (2016). In addition to the HYCOM-simulated currents, to support analysis in this research, the Oceanic Niño and Dipole Mode Indices (ONI and DMI, respectively) were used to identify climate conditions and influences of interannual forcing associated with ENSO and IOD on interannual variability of the zonal currents in the study region. The ONI and DMI were obtained from NOAA website (http://www.cpc.ncep.noaa.gov/data/indices/, last access: 21 February 2021) and the Japan Agency for Marine Earth Science and Technology (JAMSTEC) website (http://www.jamstec.go.jp/frcgc/research/d1/iod/iod/dipole_mode_index.html, last access: 21 February 2021), respectively. In addition, the wind fields derived from NOAA (https://www.esrl.noaa.gov/psd/data/gridded/data.ncep.reanalysis.derived.surface.html, last access: 17 May 2020) are also used to investigate the effects of local and remote winds on zonal current variations.
The EOF method (i.e., Kantha and Clayson, 2000; Hannachi, 2004) was then used to investigate the mode structure of the zonal current vertical profile and its temporal variability, particularly at points ASM, AWJ, and AEJ (Transect A); points BSM, BWJ, and BEJ (Transect B); and points CSM, CWJ, and CEJ (Transect C), as shown in Fig. 2. Moreover, temporal variability of the first EOF mode of zonal current was analyzed by applying the EEMD method for decomposing a signal into a series of intrinsic mode functions and investigating the zonal current variability in the SETIO region adjacent to the southern coasts of Sumatra and Java. Furthermore, a power spectral analysis (Emery and Thomson, 2001) was applied to the EEMD results to identify dominant periods of the zonal current variability in the study area. The power spectral analysis is computed from a measured time series by cutting the time series into several segments and applying Fourier analysis to these segments. The contribution from individual Fourier harmonics was subsequently summed to derive total energy of time series. In addition, 95 % confidence red noise level in the power spectrum, specified to acquire accurate confidence thresholds for true periodic signatures, was calculated based on number of degrees of freedom in each frequency band (Mann and Lees, 1996).

Figure 2The area of study interest in the SETIO region adjacent to the Sumatran and Javan southern coasts. The blue arrows show climatological (yearly mean) surface (1 m) current field over 64 years from 1950 to 2013. Yellow lines are the meridional sections along the three longitudes (98, 107, and 113∘ E), while red lines are the three selected transects: A, B, and C. Green, yellow, and cyan circles are the locations in which the zonal currents are analyzed, namely points ASM, AWJ, AEJ (on Transect A); points BSM, BWJ, and BEJ (on Transect B); and points CSM, CWJ, and CEJ (on Transect C). The subscripts SM, WJ, and EJ denote regions which are close to Sumatra, West Java, and East Java, respectively.
3.1 Distinctive features of zonal currents in the study area
As we are interested in investigating characteristics of the main ocean currents that exist in the SETIO adjacent to the Sumatran and Javan southern coasts, such as the SJC, ITF, and SEC, in this study we only considered major components of those currents, namely the zonal current component, which was analyzed from the surface to 800 m depth. The maximum depth of 800 m was chosen to capture the presence of prevailing ocean currents in the area of study and the surrounding regions, such as cores of the SJUC. For example, these cores in the Ombai Strait exist at about 400–800 m depth (Sprintall et al., 2010). Furthermore, based on monthly averaged surface currents over a 64-year period (1950–2013), we analyzed the zonal currents at three transects, namely Transects A, B, and C, which represent the coastal region, the transition zone between coastal and offshore regions, and the offshore region, respectively (Fig. 2). Transects A and C were selected with respect to the prevalence of ocean currents in the area of interest, representing nearshore (SJC) and offshore (ITF–SEC) areas, respectively (Qu and Meyers, 2005; Fang et al., 2009; Ding et al., 2013). In the present study, we have performed additional analyses of current characteristics of Transect B as the transition zone between the SJC region (Transect A) and ITF–SEC region (Transect C) due to the existence of typical features of zonal currents along the three transects (A, B, and C), as shown in Fig. 2.
To support our reasons for assigning the three transects, we have provided Fig. 3 (as an example), which clearly shows the particular features of near-surface zonal currents along the three transects. Dynamics of zonal surface currents on Transect A (Fig. 3c), especially along the southern coasts of Sumatra and Java (98–114∘ E), show a complex interplay between remote wind forcings from both the equatorial Indian and Pacific Oceans and local wind. In general, there are enhanced eastward-flowing currents during MAM and SON, which are probably attributed to Kelvin wave passage. Seasonal characteristics of zonal currents associated with local wind, which is eastward (westward) during DJF (JJA), especially along the southern coast of Java, can be clearly seen after 6–12 months of band-pass filtering (figure not shown). In contrast, westward currents are dominant along Transect C (Fig. 3e). Meanwhile, although westward currents are quite dominant along Transect B, eastward currents are also present, especially at longitudes 95–107∘ E (Fig. 3d). Here, longitude–depth plots of mean zonal currents along sections A, B, and C are also presented in Fig. 4, which clearly shows the different zonal current system along the transects. Mean zonal currents along Transect A (Fig. 4a) show two distinguishing features: (1) the mean currents dominantly flow eastward from the sea surface to 100 m depth (95–114∘ E), and (2) they are predominantly westward from 115∘ E to 122∘ E. The 115∘ E longitude line is a region that is close to the Lombok Strait (LS; one of the ITF exit passages). In addition, the mean eastward current at AEJ also exists at depths beneath 100 m and reaches about 0.03 m s−1 at ∼ 400 m. Meanwhile, the average current on Transect B (the transitional zone) is westward, especially at longitudes 101 to 107∘ E (Fig. 4b). In the offshore region (Transect C), the mean zonal current flows westward throughout the region (Fig. 4c).
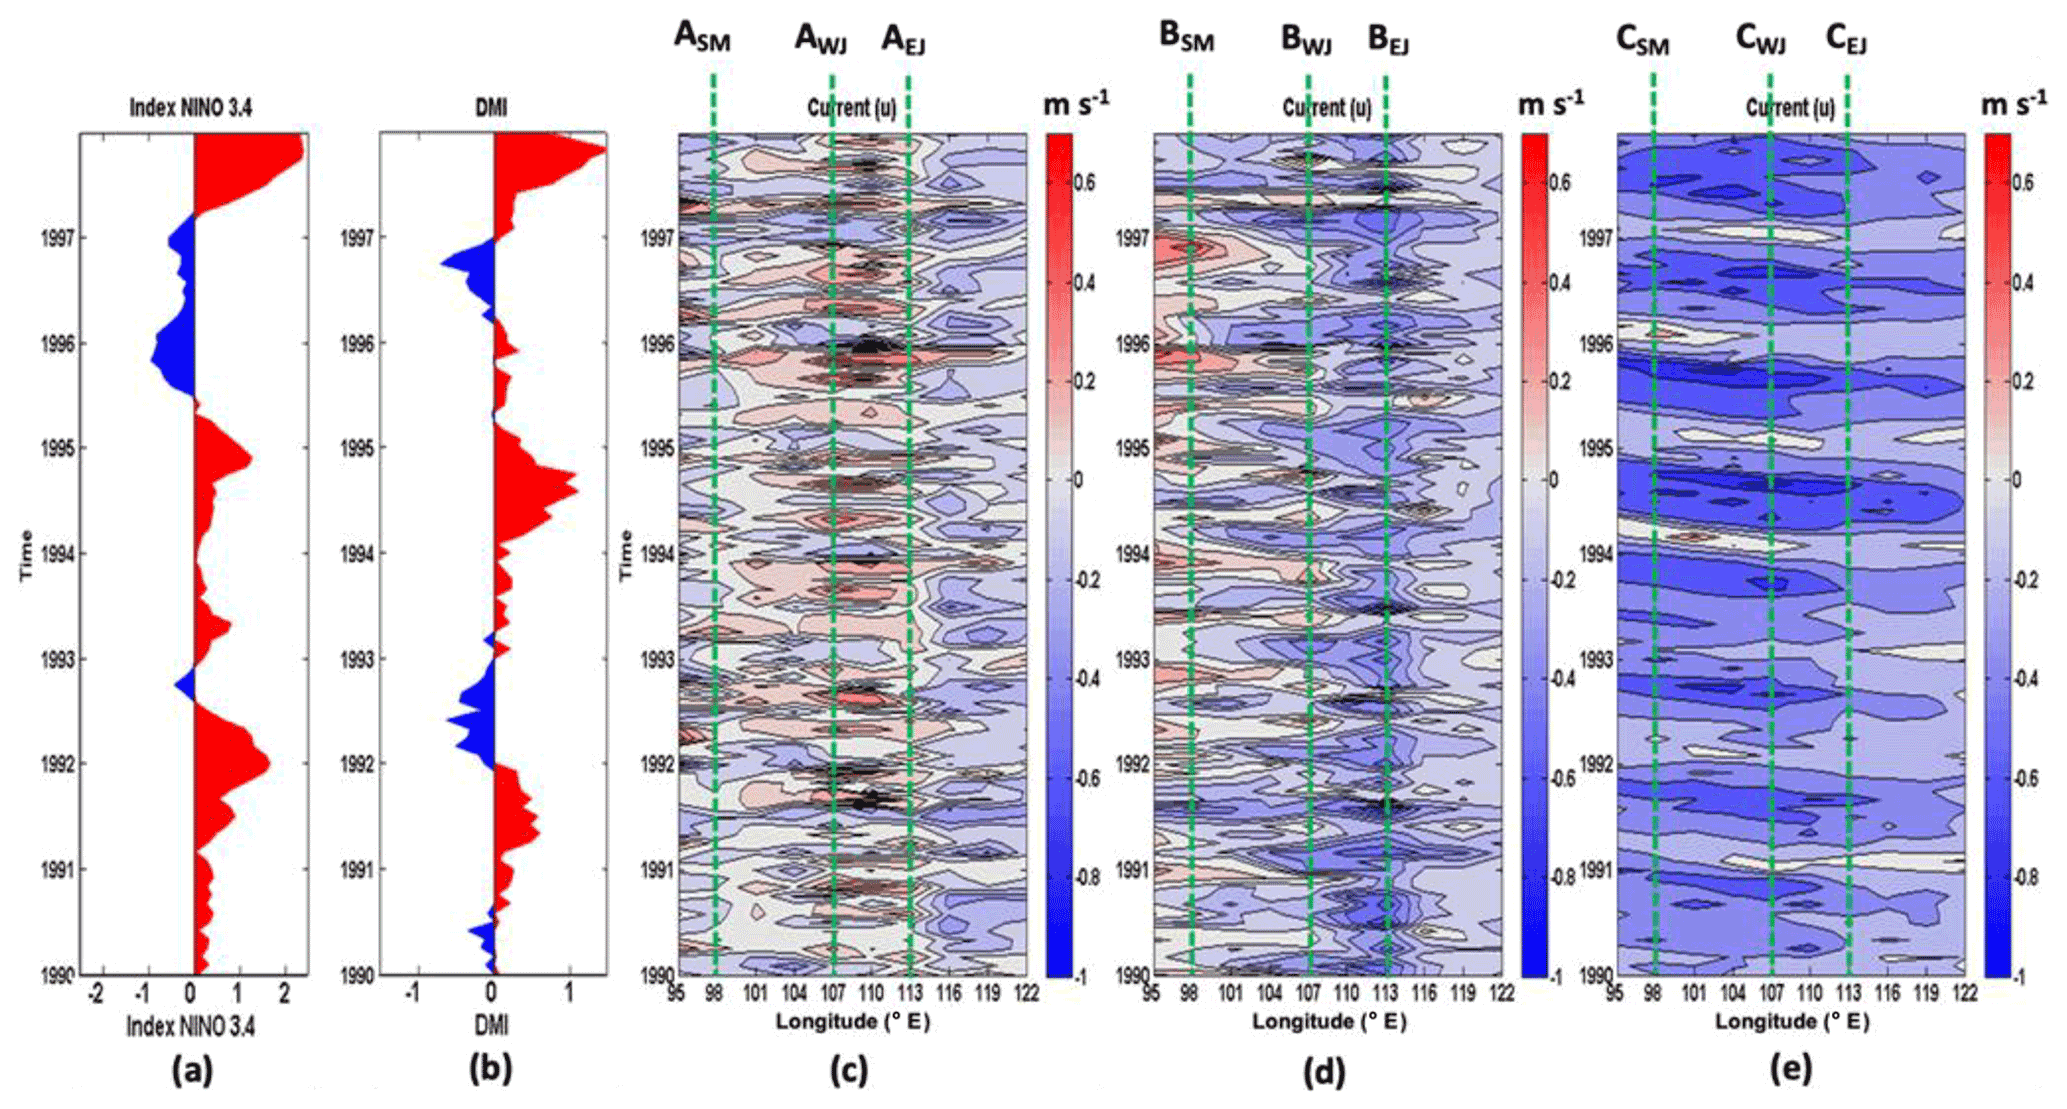
Figure 3Time–longitude profiles of (a) ONI and (b) DMI and monthly averages of surface (1 m) zonal currents along (c) Transect A, (d) Transect B, and (e) Transect C. Positive (negative) values of the zonal currents indicate eastward (westward) currents. Meanwhile, dashed green lines denote the longitudes of the nine selected points.
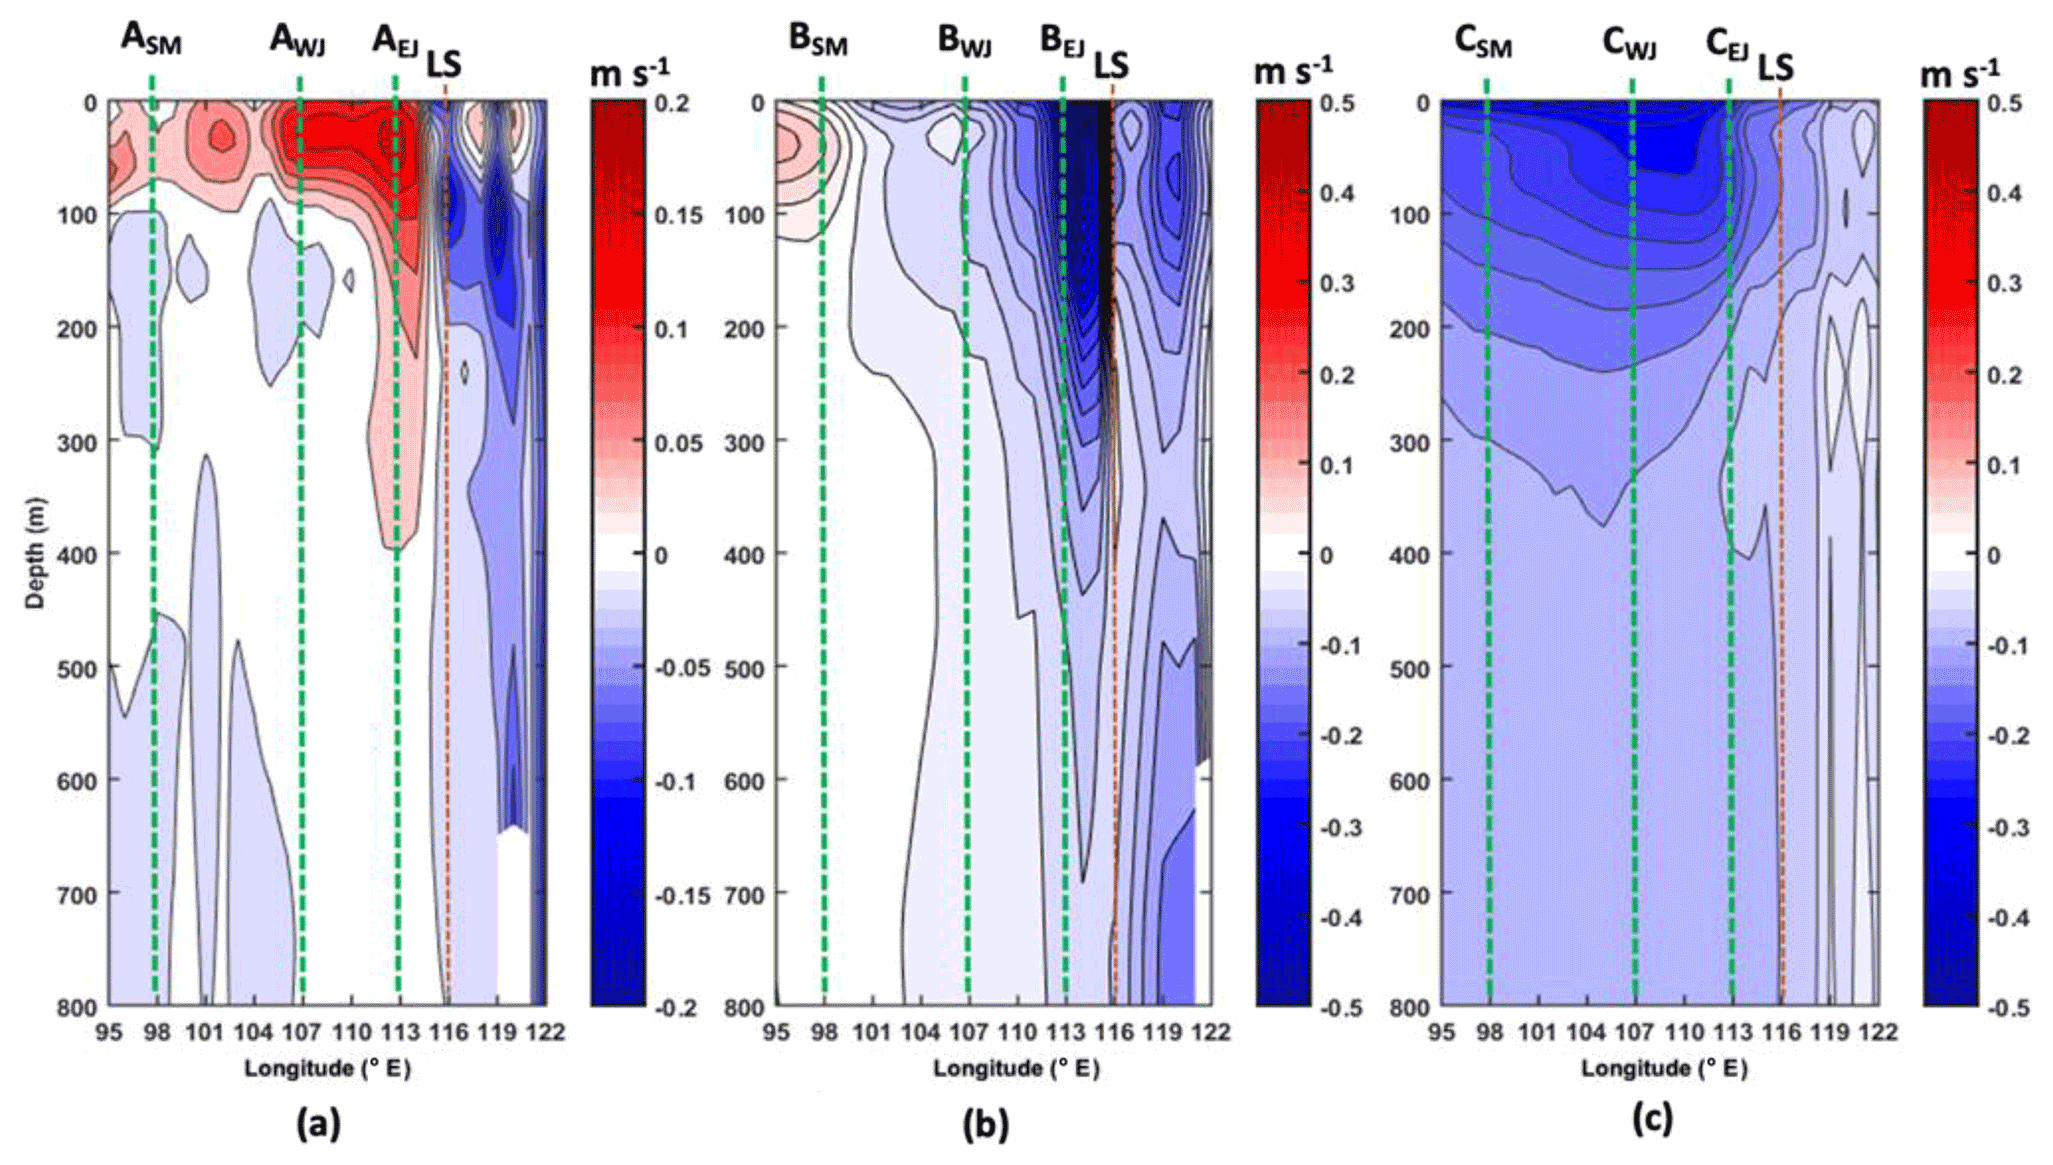
Figure 4Longitude–depth profiles of mean zonal currents along (a) Transect A, (b) Transect B, and (c) Transect C. Positive (negative) values of the zonal currents indicate eastward (westward) currents. Dashed green lines denote the longitudes of the nine selected points, whereas the dashed orange line denotes the longitude of Lombok Strait (LS).
Moreover, we also presented meridional sections of zonal current along the three longitudes (yellow lines in Fig. 2) to justify the selection of the locations for analyzing zonal current characteristics, namely sections Sumatra (SM; 98∘ E), West Java (WJ; 107∘ E), and East Java (EJ; 113∘ E), as shown in Fig. 5 (as an example). Figure 5 clearly shows the typical features of near-surface zonal currents along the three meridional sections, namely the coastal (SJC) area (0–∼ 2.5∘ S at SM; ∼ 7–8.5∘ S at WJ; and ∼ 8–9.5∘ S at EJ), the transitional zone (∼ 2.5–9∘ S at SM; ∼ 8.5–10∘ S at WJ; and ∼ 9.5–10.5∘ S at EJ); and the offshore (ITF–SEC) area (∼ 9–12∘ S at SM; ∼ 10–12∘ S at WJ; and ∼ 10.5–12∘ S at EJ).
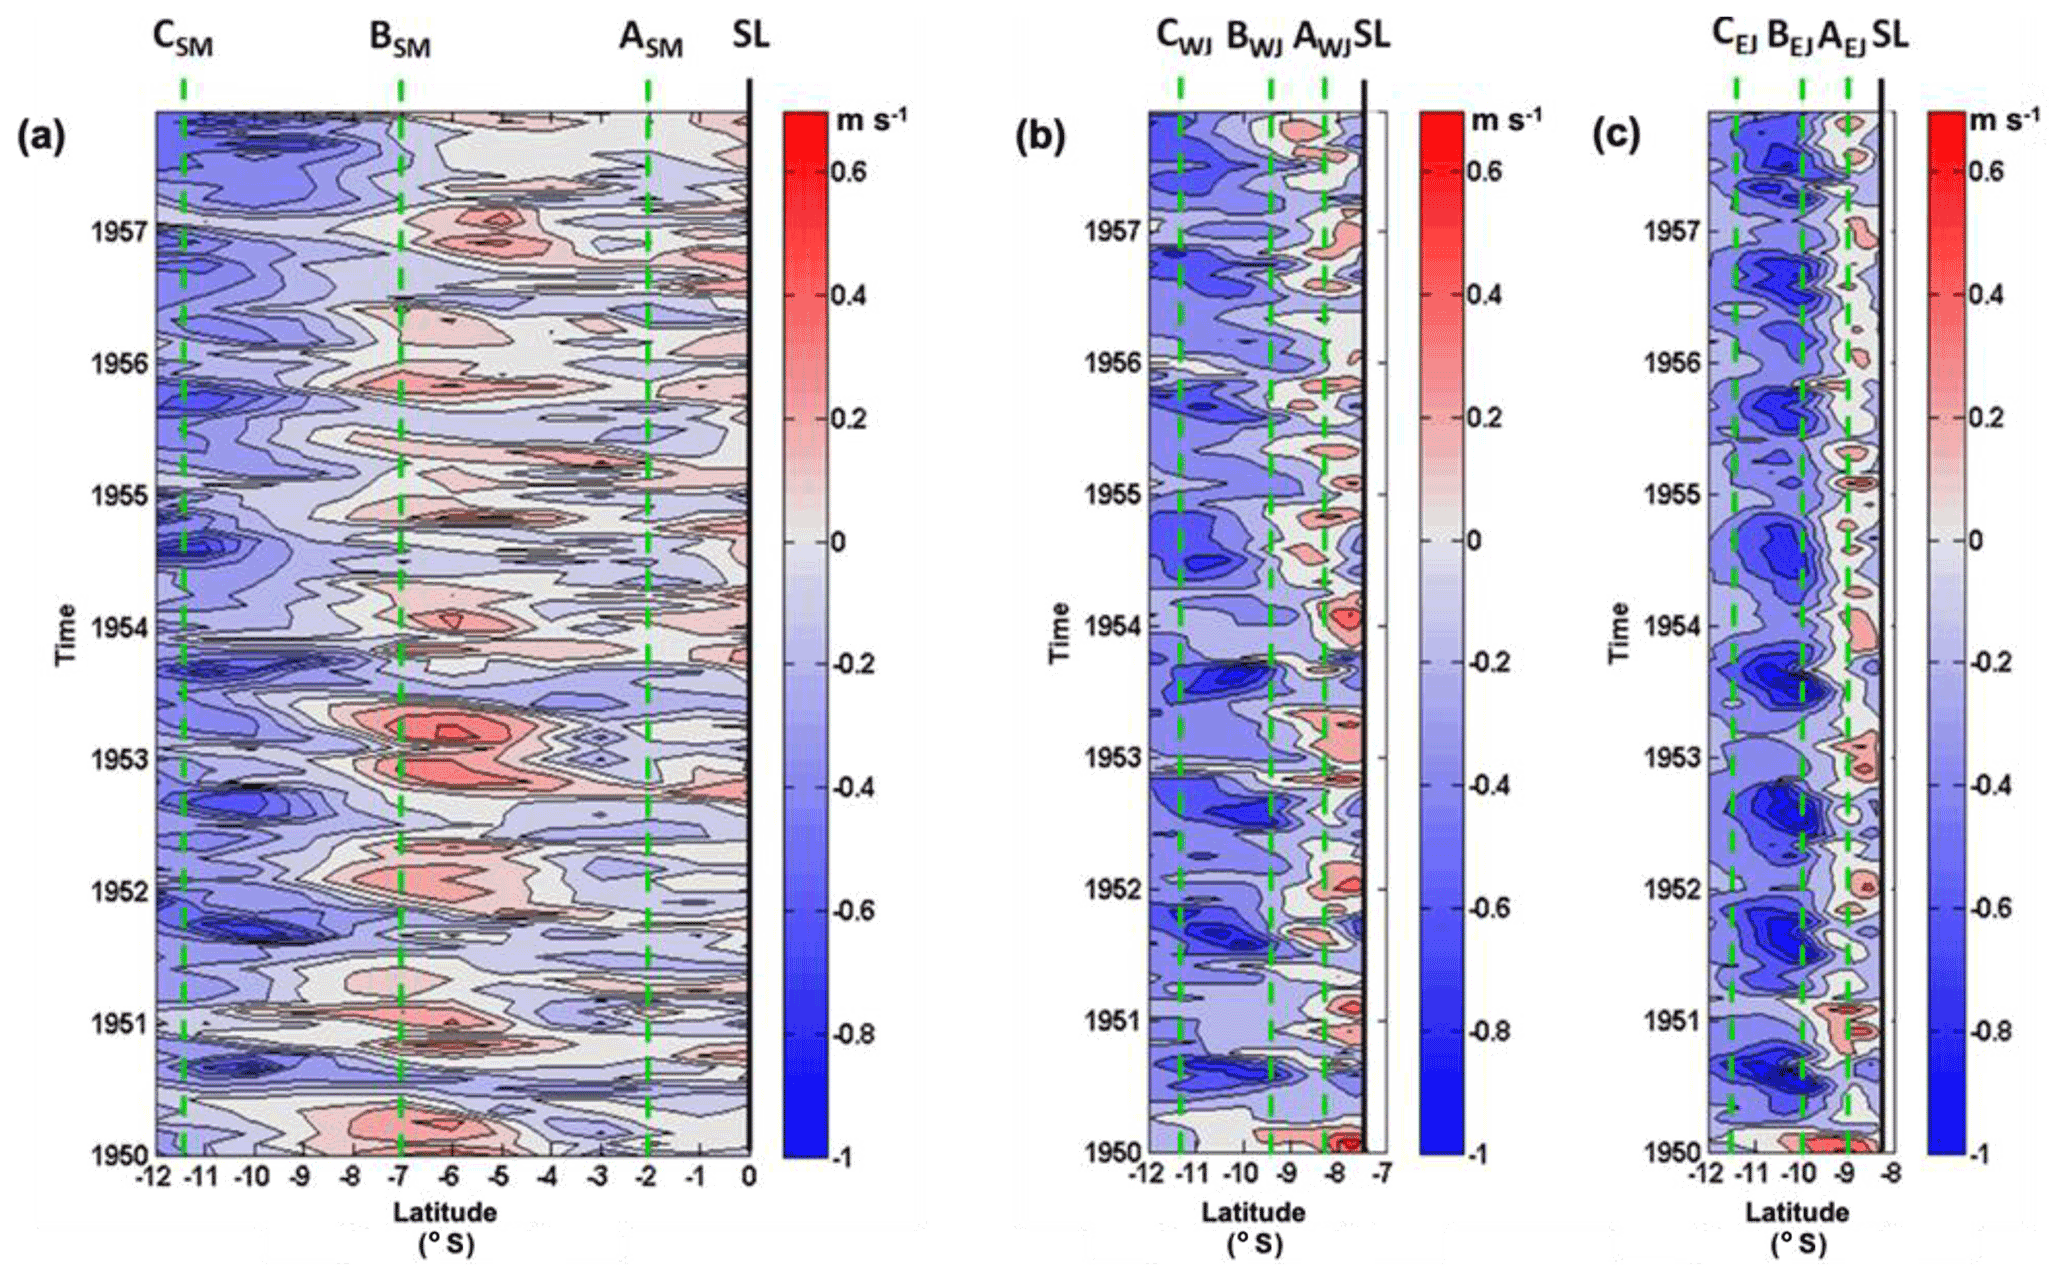
Figure 5The zonal surface (1 m) currents along three meridional sections (yellow lines in Fig. 2): (a) SM (98∘ E), (b), WJ (107∘ E), and (c) EJ (113∘ E). Positive (negative) values of the zonal currents indicate eastward (westward) currents. Meanwhile, dashed green lines denote the latitudes of the nine selected points. SL stands for shoreline.
Furthermore, because we are specifically interested in zonal current characteristics off southern waters of Sumatra and Java, we selected three points on each transect, namely points ASM, AWJ, and AEJ on Transect A; points BSM, BWJ, and BEJ on Transect B; and points CSM, CWJ, and CEJ on Transect C with respect to the particular features of zonal currents shown in Figs. 2, 3c–e, and 4–5. Here, the subscripts SM, WJ, and EJ of the nine selected points represent regions that are close to Sumatra, West Java, and East Java, respectively.
3.2 Climatological current fields
Based on the unique features of near-surface zonal currents along the three meridional sections (EJ: AEJ-BEJ-CEJ; WJ: AWJ-BWJ-CWJ; and SM: ASM-BSM-CSM in Fig. 2) as shown in Fig. 5, we further investigated the vertical structure of zonal current along the sections. Figure 6 shows seasonal mean profiles of zonal current velocity and its average (the climatological current field) over a period of 64 years (1950–2013). Seasonal variations in the zonal currents were analyzed during DJF, MAM, JJA, and SON at each point (Sections EJ, WJ, and SM), as shown in Fig. 2. It can be clearly seen in Fig. 6 that there are special characteristics of the mean zonal currents on each meridional transect (denoted by black lines in Fig. 6). In the following subsections, we analyze the climatological current fields of each meridional transect.
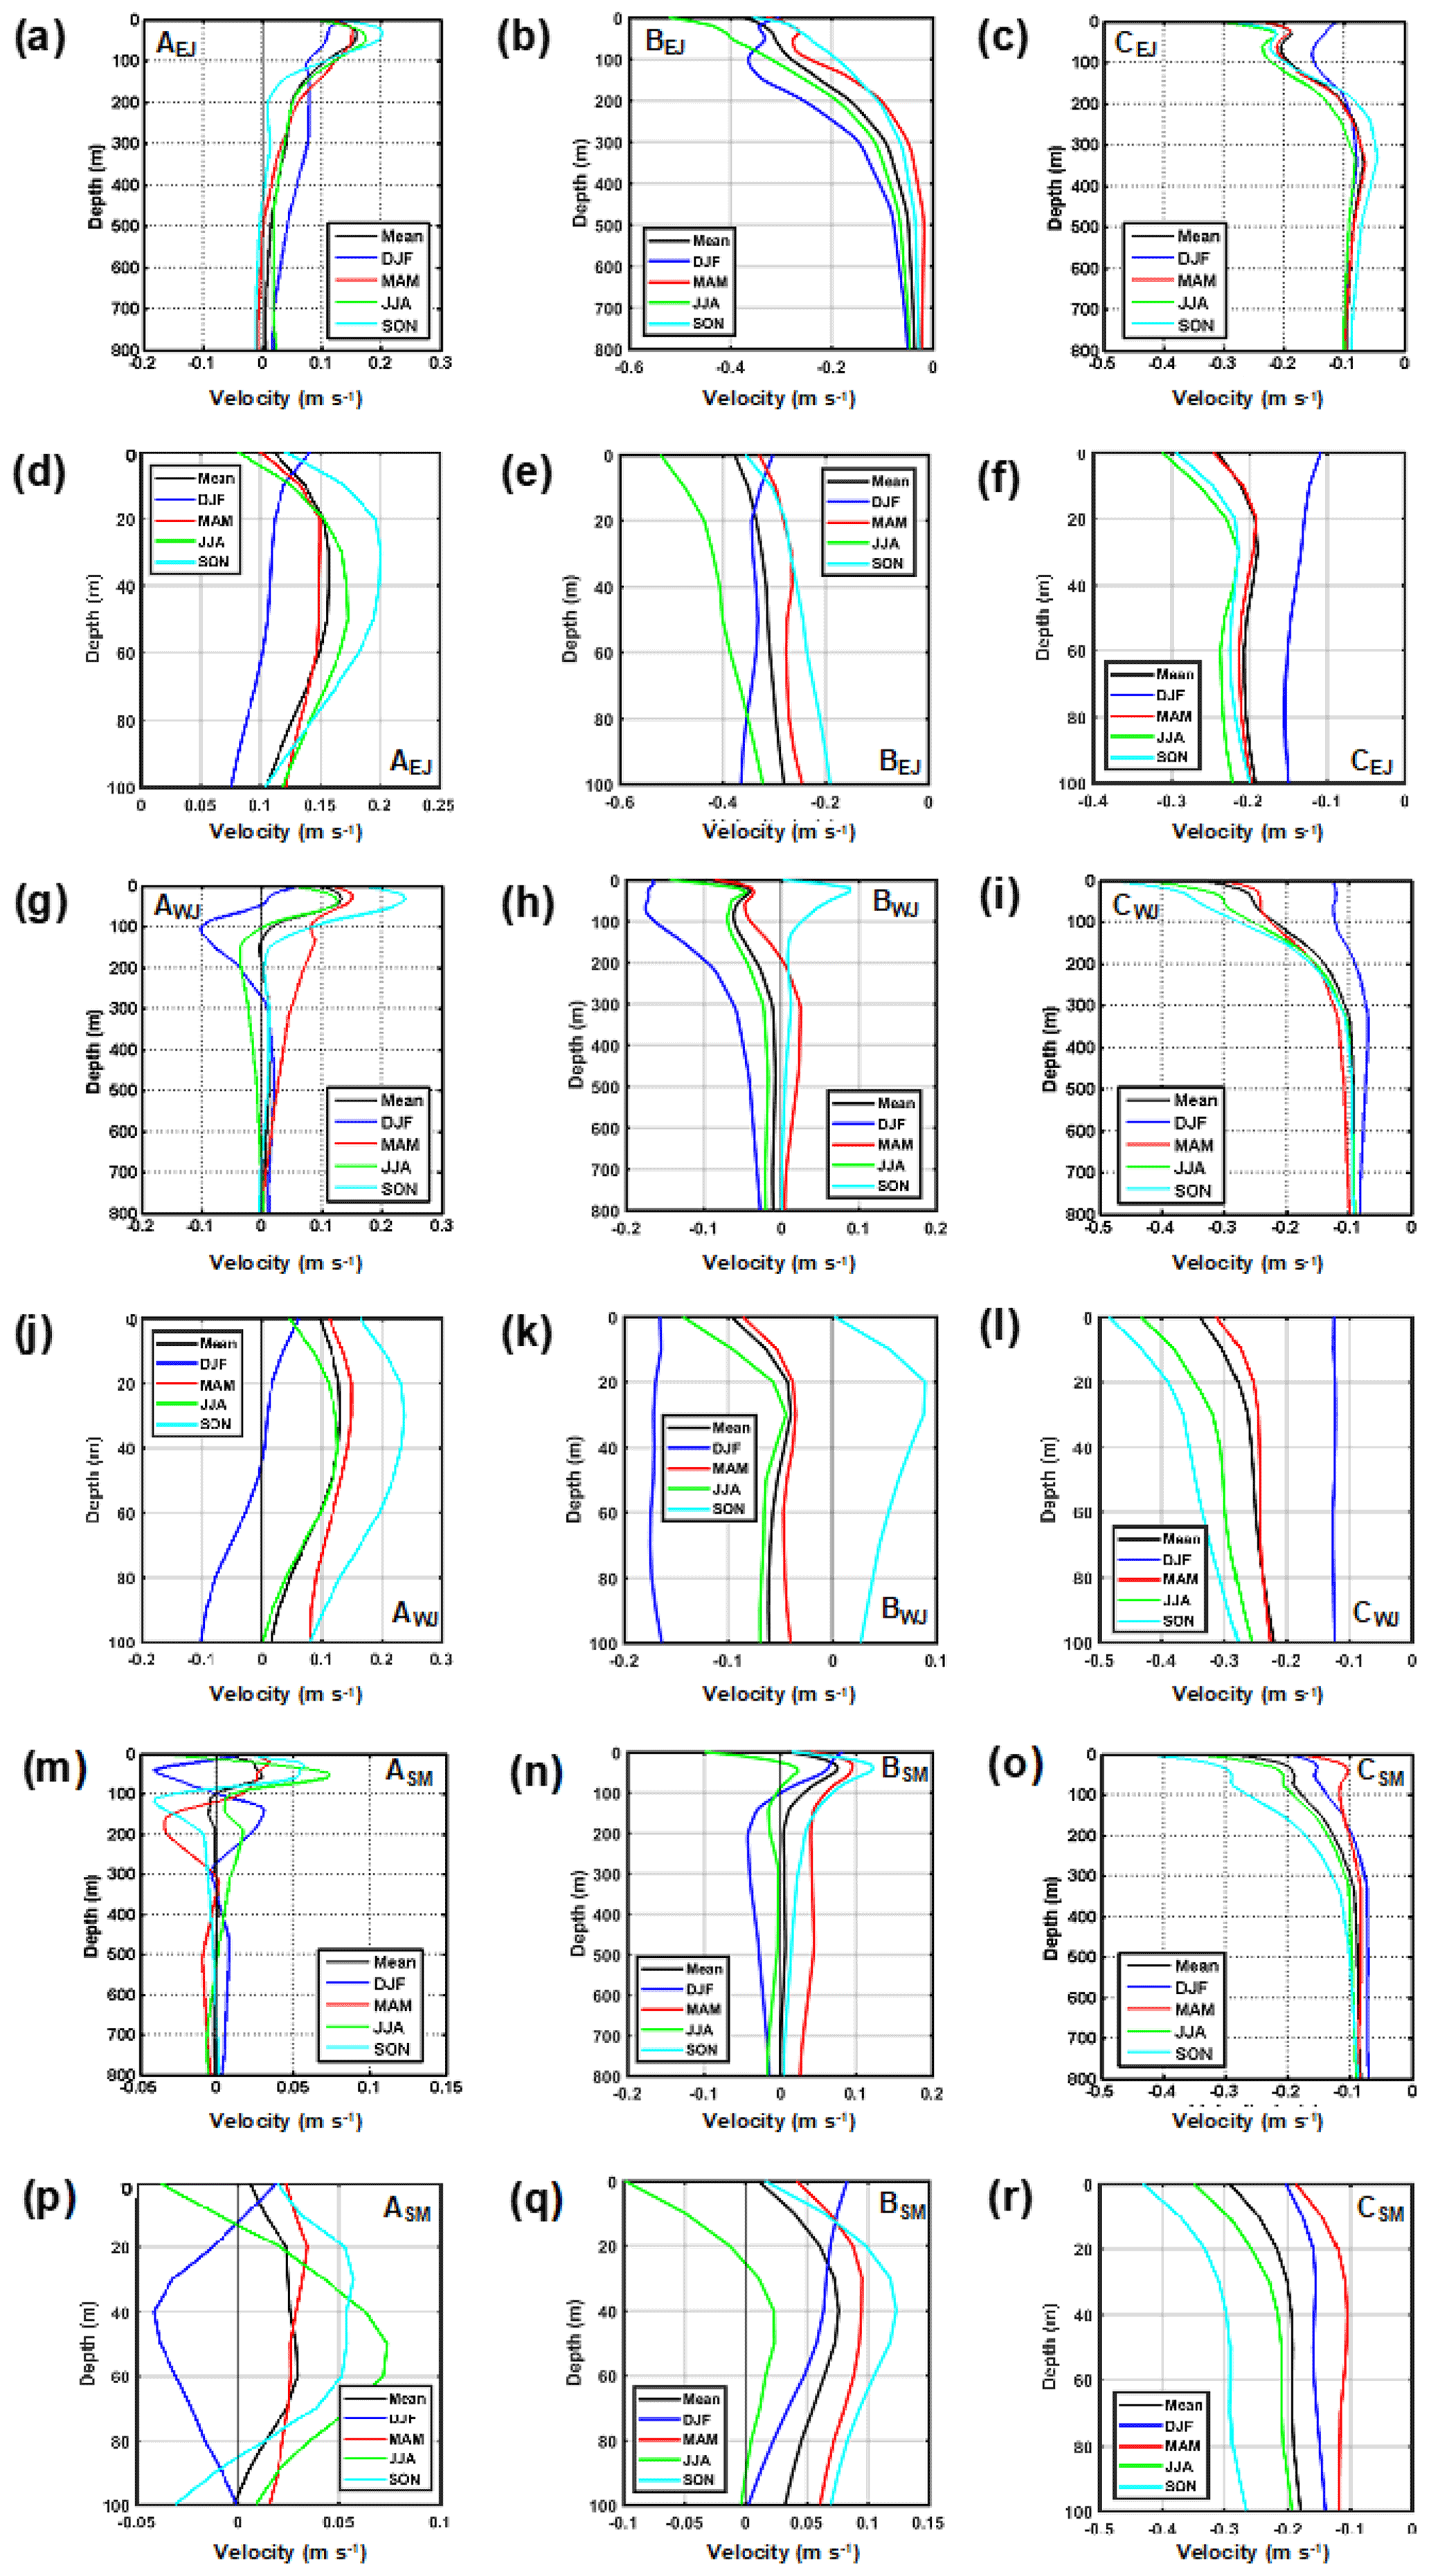
Figure 6Mean and seasonal profiles of zonal current velocity derived from the HYCOM simulation results for the period of 1950 through 2013 at the following points: (a) AEJ, (b) BEJ, (c) CEJ, (g) AWJ, (h) BWJ, (i) CWJ, (m) ASM, (n) BSM, and (o) CSM. Meanwhile, (d)–(f), (j)–(l), and (p)–(r) are the same as (a)–(c), (g)–(i), and (m)–(o), respectively, except provide results for depths of 0–100 m.
3.2.1 Vertical structure of zonal current along the meridional section of East Java (AEJ-BEJ-CEJ)
A different zonal current system along the meridional transect of East Java (EJ; AEJ-BEJ-CEJ) can clearly be seen in Fig. 6a–f. On average, for the period 1950 through 2013, zonal climatological current at AEJ (nearshore area) generally flows eastward from the sea surface to 100 m depth (Fig. 6a and d) and reaches a maximum value of about 0.16 m s−1. It is suggested that the average zonal current at this point is mainly attributed to SJC, and it shows seasonal variations. During the SE monsoon (JJA), the strength of climatological eastward SJC at this point in upper 10 m depth reduces (Fig. 6d). Meanwhile, during the NW monsoon (DJF), the current in the upper 10 m (Fig. 6d) flows more eastward in response to the prevailing northwesterly winds (Fig. 7). In general, the mean eastward current at AEJ, during DJF was attributed to local winds. Interestingly, during this monsoon period (DJF), the eastward current at AEJ, particularly that at depths beneath 100 m, strengthens and occurs up to ∼ 800 m. Other physical processes may account for the enhanced eastward current at this point. The SJC and SJUC, which are seasonally varying currents and predominantly eastward, are defined as the surface current in the upper 150 m and the subsurface current beneath 150 m down to 1000 m, respectively (Iskandar et al., 2006). The eastward-flowing SJC and SJUC are intensified, coinciding with the arrival of a seasonal downwelling Kelvin wave along the southern coast of Java (e.g., Sprintall et al., 1999, 2000; Iskandar et al., 2006). Downwelling Kelvin waves originating in the equatorial Indian Ocean during the transitional monsoons propagate along the coasts of western Sumatra and southern Java with phase speeds ranging from 1.5 to 2.9 m s−1 (e.g., Sprintall et al., 2000; Syamsudin et al., 2004; Iskandar et al., 2005). These phase speeds indicate that the downwelling Kelvin waves will arrive at AEJ in 21–41 d. In this case, downwelling Kelvin waves generated during the monsoon transition period in November may arrive at AEJ in December–January. Therefore, in addition to the local eastward winds, the downwelling Kelvin waves may also contribute to strengthen the eastward currents at AEJ during the NW monsoon, including those at depths beneath 100 m.
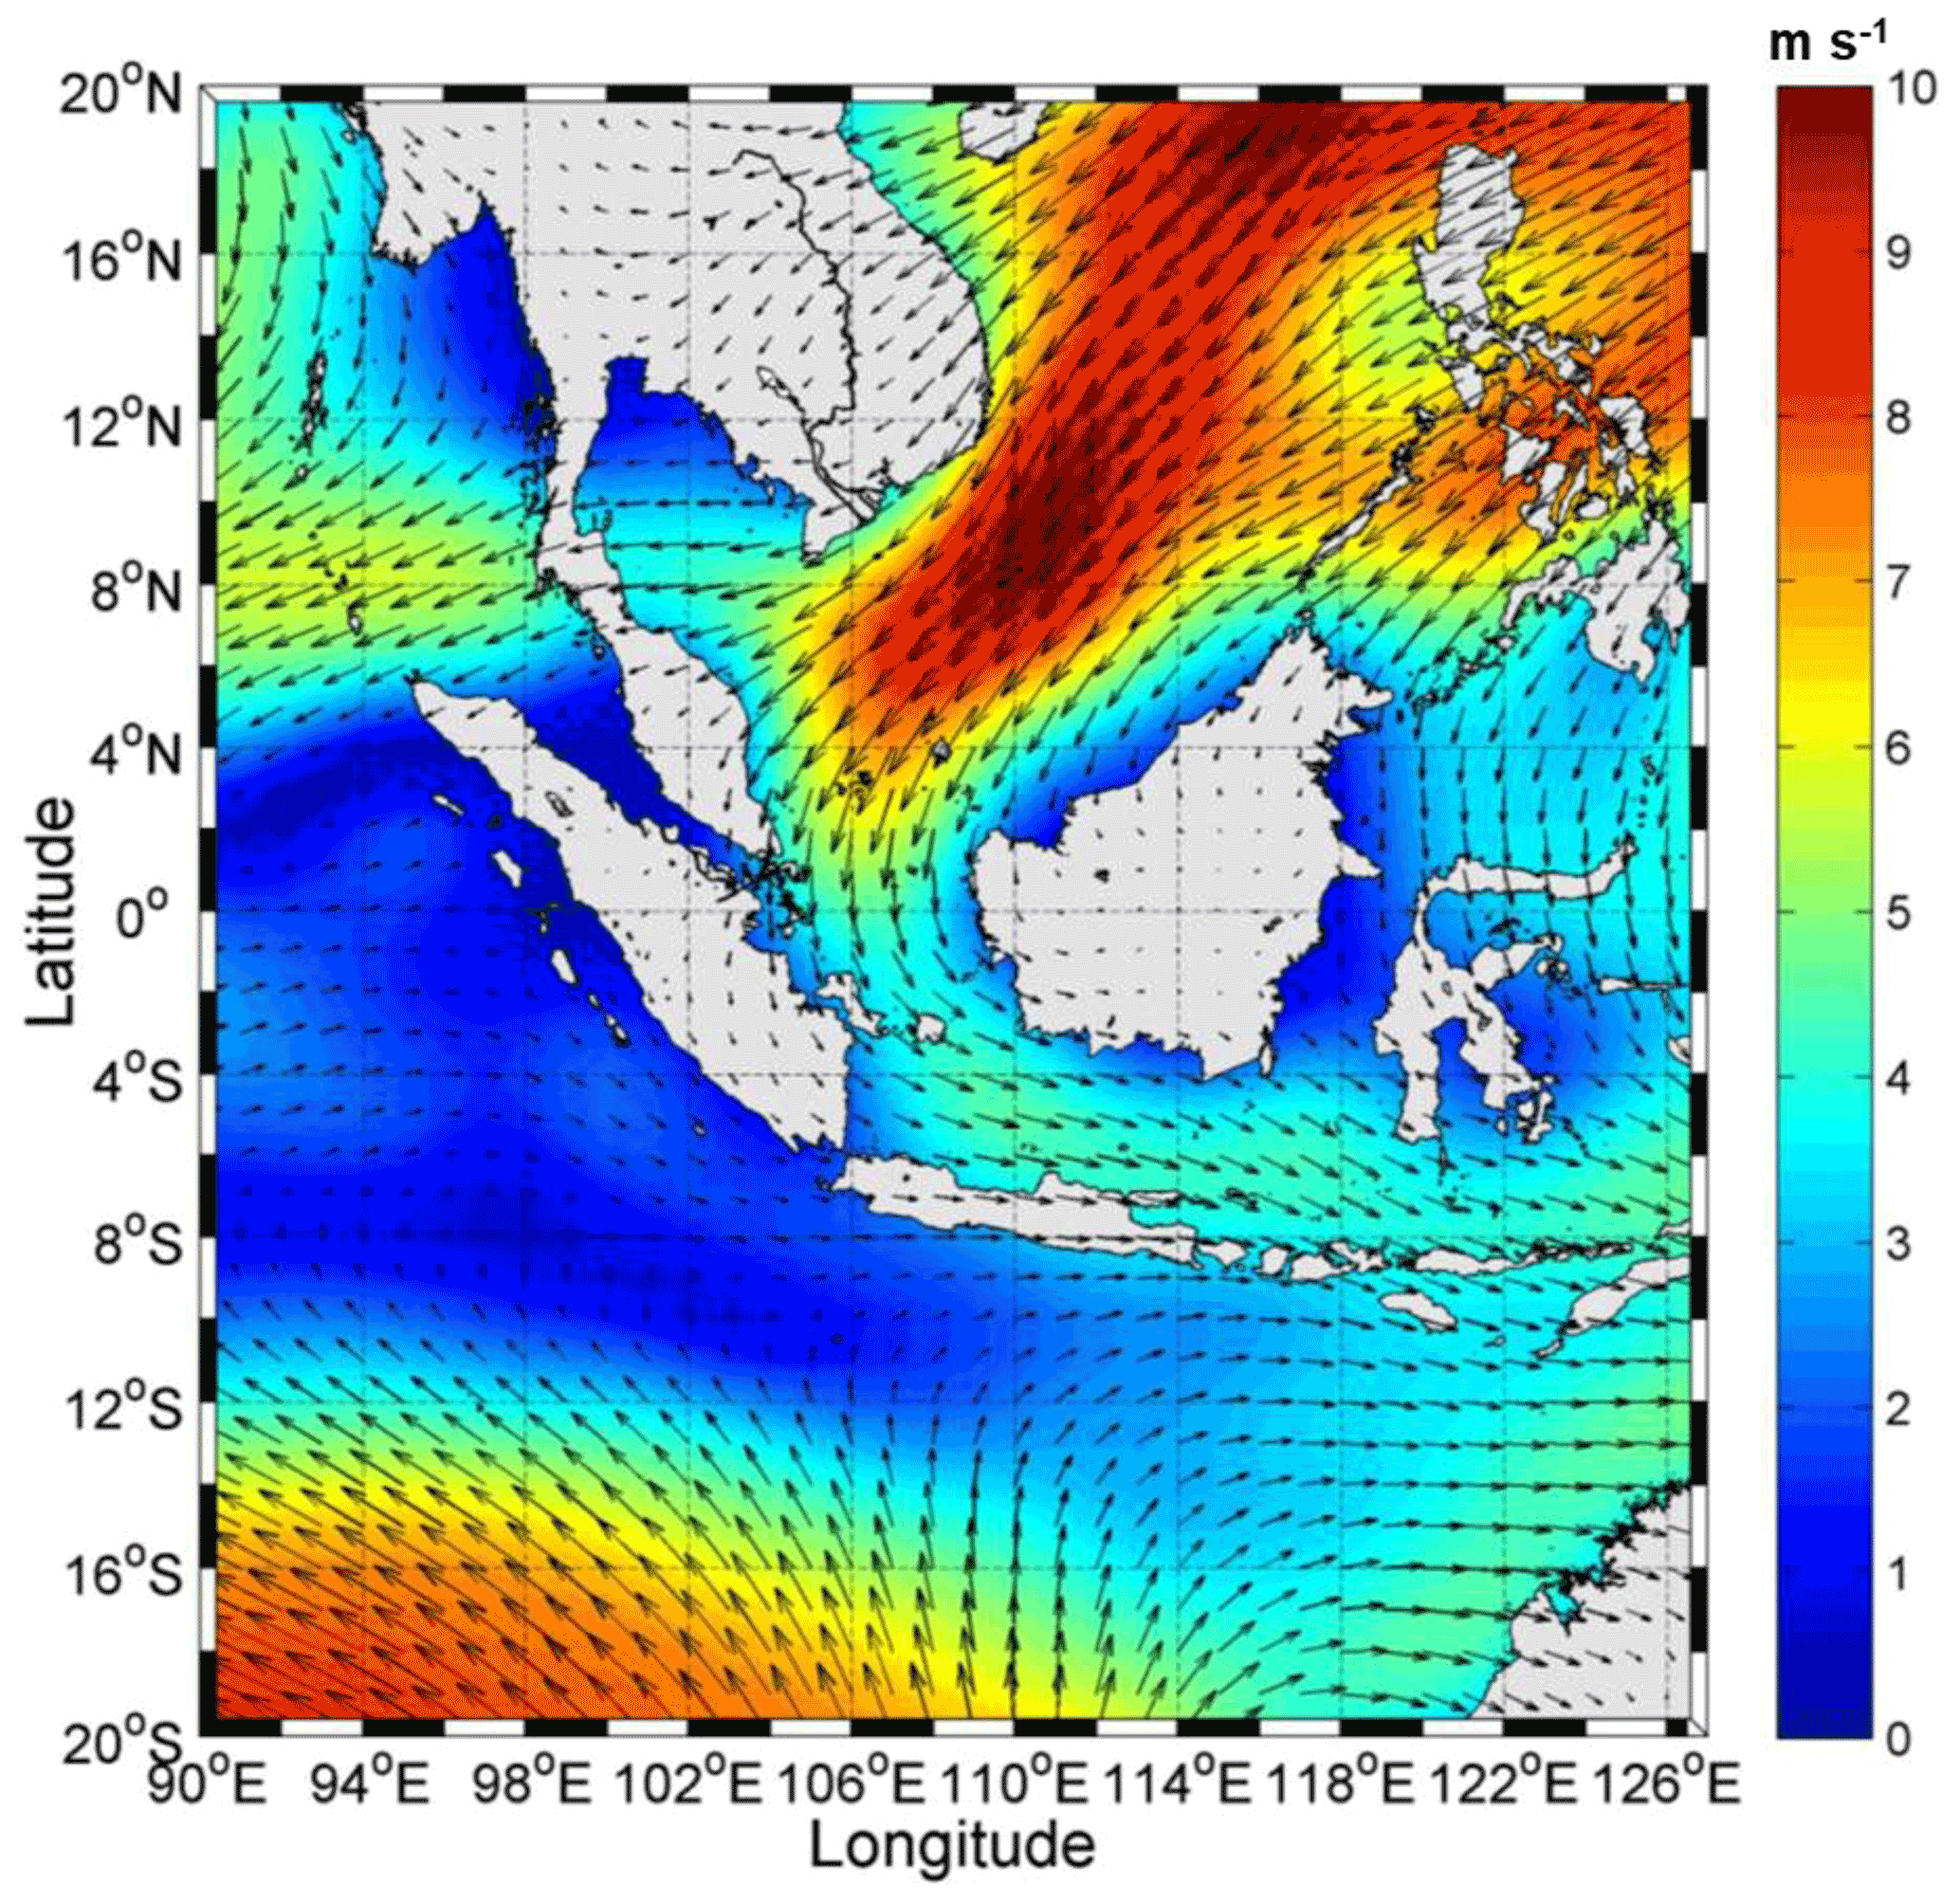
Figure 7Mean NW monsoon for the period of 1950 to 2013 (climatological wind field during the DJF).
Meanwhile, the average current at BEJ (the transitional zone) is westward. It is suggested that the mean westward current at the point BEJ is more dominated by the ITF (shown by black lines in Fig. 6b and e). Based on observations of the exit passages (Lombok Strait, Timor Passage, and total ITF along exit passages), ITF in JJA is stronger than that in DJF (e.g., Sprintall et al., 2009). In this study, however, it is found that westward current at the point BEJ at 100 m depth is stronger during DJF than JJA. This phase changing (delay) of the ITF seasonality from JJA to DJF at this point is also found in the Ombai Strait as documented by Sprintall et al. (2009, their Table 3; 2010, their Fig. 3). Moreover, Sprintall et al. (2010) found cores of subsurface maximum ITF during DJF extending from 100–250 m (100–800 m) depth at the northern (southern) part of the strait. In the present study, this seasonal feature of the subsurface maximum ITF is also found at BEJ, in which the corresponding westward current at this point reaches its maximum values at ∼ 100 m depth and the maximum westward current is stronger during DJF than JJA (Fig. 6b and e). Hence, we suggest that the primary driver for zonal westward current at BEJ is the ITF coming from the southern Ombai Strait. To confirm the above relation, we have calculated the correlation between zonal westward current at a depth of ∼ 100 m at point BEJ and that representing subsurface (∼ 200 m) maximum ITF in the southern Ombai Strait (Sprintall et al., 2010). The correlation coefficient between the zonal westward current at ∼ 100 m at the BEJ and that of the southern Ombai Strait is 0.58, with a 95 % significance level of approximately ± 0.33. This study shows that the zonal westward current at 100 m depth at BEJ has a strong correlation with the subsurface (∼ 200 m) maximum ITF in the southern Ombai Strait, confirming that the ITF flowing from the Ombai Strait is the primary driver for zonal westward current at BEJ.
In the offshore region of the study area, zonal current at CEJ (Fig. 6c and f) flows westward throughout the year and has average velocity around 0.20 m s−1 in the upper 100 m. Under such characteristics, we propose that the westward current at this point is the SEC in the southeast Indian Ocean, which joins the ITF flowing out from the Lombok and Ombai straits and Timor Passage. The HYCOM westward current at this point is stronger during JJA than DJF, which is associated with seasonal characteristics of the ITF in Lombok Strait and Timor Passage and of the total ITF through the Lombok and Ombai straits and Timor Passage (Potemra, 1999; Sprintall et al., 2009). The westward current at CEJ (Fig. 6c and f) reaches its maximum value of about 0.31 m s−1.
3.2.2 Vertical structure of zonal current along the meridional section of West Java (AWJ-BWJ-CWJ)
Figure 6g–l show the vertical structure of the zonal current along the meridional transect of West Java (WJ; AWJ-BWJ-CWJ). Similar to AEJ, mean zonal current at AWJ (nearshore region) is attributed to the SJC, which generally flows eastward in the upper 100 m depth (Fig. 6g and j) and reaches a maximum value of about 0.12 m s−1. Our simulation shows that during the monsoon transitions (MAM and SON), SJC is eastward and intensified by the propagation of coastal Kelvin waves associated with the Wyrtki Jet in the equatorial Indian Ocean, which is forced by the local equatorial zonal winds during both monsoons. These waves propagate along the Sumatran and Javan coasts (i.e., Sprintall et al., 2000; Druskha et al., 2010; Iskandar et al., 2009) and some portions propagate northward into the Lombok and Makassar Straits (Susanto et al., 2000, 2012; Pujiana et al., 2013), whereas the remaining parts continue eastward (Syamsuddin et al., 2004). Furthermore, the present study shows that the eastward current during SON is stronger than that during MAM, which is consistent with mooring observation in the Makassar Strait (Susanto et al., 2012; their Fig. 3). The stronger eastward current during SON was supposed to be attributed to the faster and more intense climatological Wyrtki Jet during SON rather than during MAM (Knox, 1976; McPhaden, 1982; Han et al., 1999; Qiu et al., 2009; McPhaden et al., 2015; Figs. 1d and 2e of Duan et al., 2016) and also associated with stronger wind forcing over the eastern equatorial Indian Ocean during the SON period than the MAM period (figure not shown), which in turn causes the jet.
Moreover, it can be seen that during the NW monsoon the eastward current at AWJ (Fig. 6g and j) is weaker than that at AEJ (Fig. 6a and d). The weaker current at AWJ may exist as a consequence of the weaker mean NW monsoon at this point compared with that at AEJ (Fig. 7). Interestingly, at a depth of 100 m, there is a maximum westward current at AWJ during DJF with velocity of about 0.1 m s−1 (Fig. 6g and j). Here, we suggest that ITF is the cause of the westward current at 100 m at AWJ during the DJF. In regard to the ITF, Fig. 3 of Sprintall et al. (2010) shows cores of subsurface maximum ITF extending from 100 to 250 m depth in the northern part of the Ombai Strait and from 100 to 800 m depth at the southern part of the strait during DJF. Meanwhile, the influence of ITF on the zonal current at AEJ at 100 m is weaker as a consequence of the stronger NW monsoon at AEJ compared with that at AWJ (Fig. 7), and thus the current instead flows eastward at AEJ during DJF (Fig. 6a and d).
To further investigate which one is more influential out of the ITF and the NW monsoon in terms of forcing the zonal current at the AWJ and AEJ at 100 m depth, we have carried out correlations between the zonal current at both points (each at a depth of ∼ 100 m) and both the NW zonal wind and the zonal current representing subsurface (∼ 200 m) maximum ITF in the southern Ombai Strait (Table 1). Here, the ITF in the southern part of the Ombai Strait was chosen for carrying out the correlations because the ITF mainly flows through the southern part of the passage (Sprintall et al., 2010). It was observed that the subsurface maximum ITF during DJF exists at a depth of about 200 m in both the northern and southern parts of the Ombai Strait and that it is stronger during DJF than JJA in both parts of the strait (Fig. 3 of Sprintall et al., 2010). In this study, the DJF zonal currents in the period of 2004 through 2006 in the southern Ombai Strait derived from the INSTANT program (http://www.marine.csiro.au/~cow074/instantdata.htm, last access: 17 May 2020) were used for the correlation analysis.
Table 1Correlation coefficients between zonal currents at 100 m depth at both AWJ and AEJ and both the local NW zonal wind and subsurface (200 m) maximum ITF in the southern Ombai Strait during DJF in the period of 2004 through 2006.
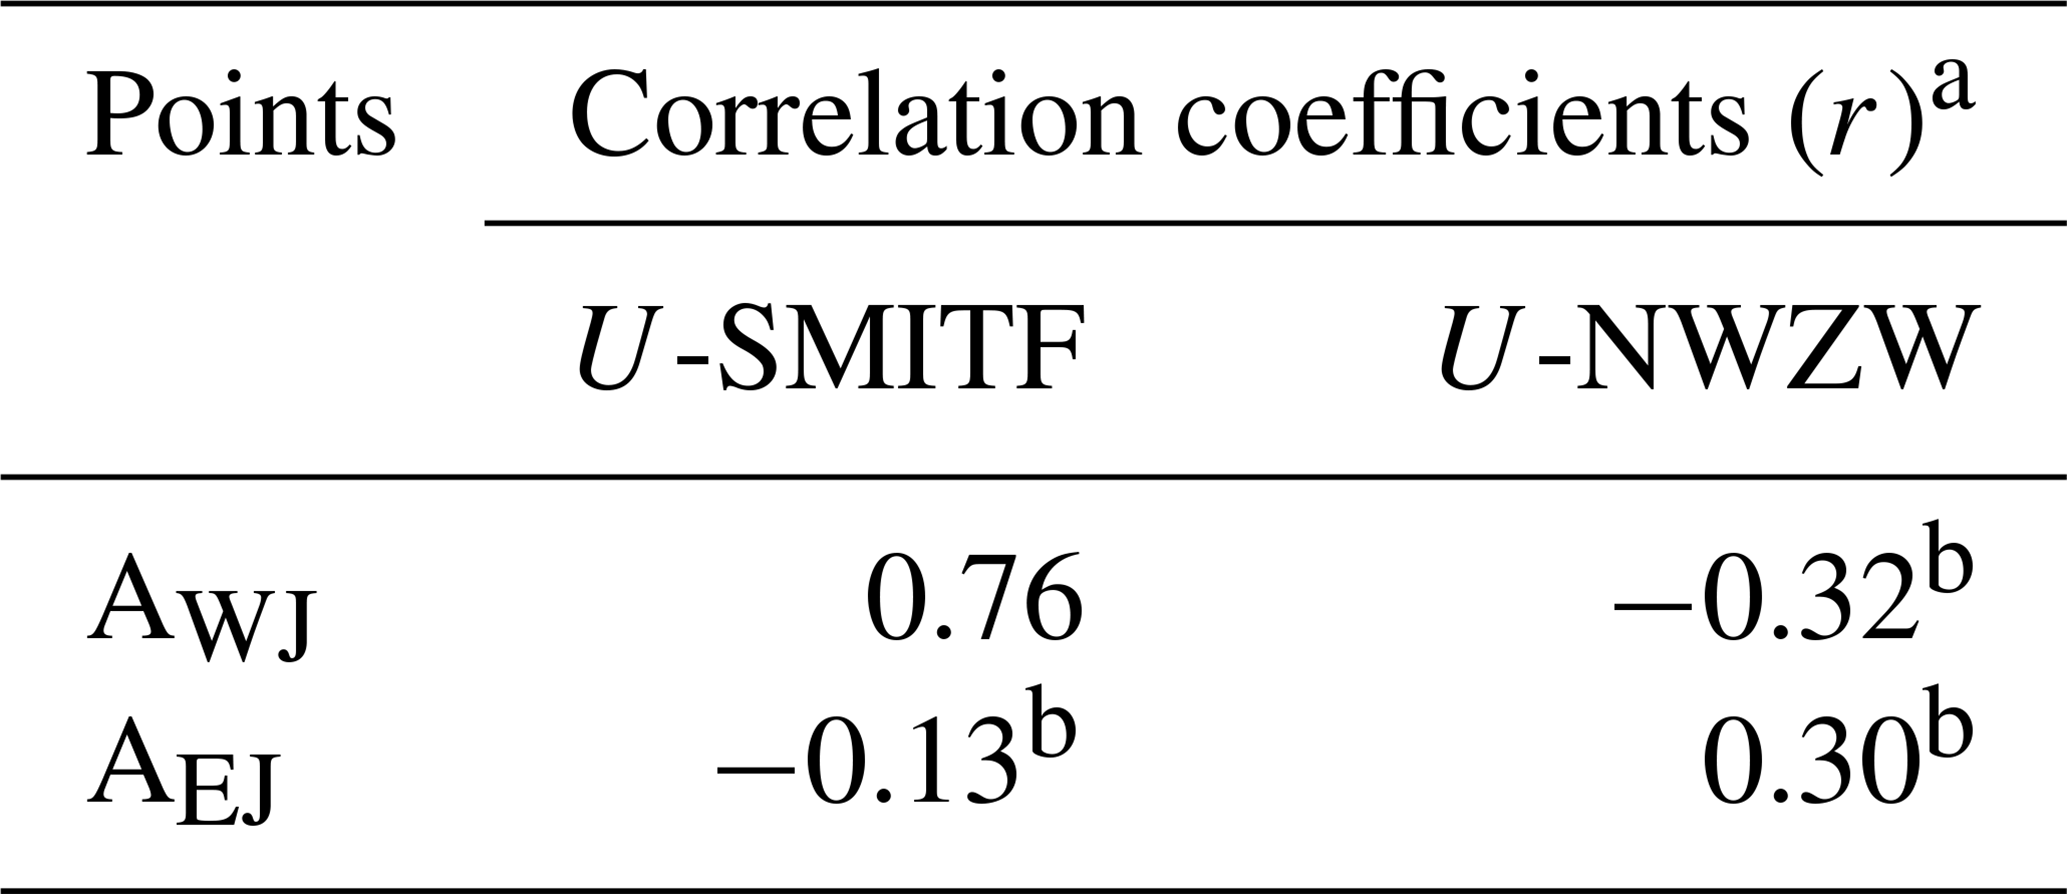
a The 95 % significance level is approximately ± 0.33. U represents the zonal currents at 100 m depth, SMITF stands for subsurface (200 m) maximum ITF in the southern Ombai Strait, and NWZW stands for northwesterly zonal wind. b Correlation below the significance level.
It is found that during DJF the zonal current at AWJ at 100 m shows high correlation with the subsurface (∼ 200 m) maximum ITF in the southern Ombai Strait, whereas its correlation with the NW zonal wind is weak (Table 1). Moreover, although during DJF the correlations between the zonal current at AEJ at 100 m and both the NW zonal wind and the subsurface (∼ 200 m) maximum ITF in the southern Ombai Strait are below the significance level, the NW zonal wind is more influential regarding force variation of zonal current at AEJ at 100 m than the ITF. Hence, during DJF we suggest that the westward current simulated at AWJ at 100 m is ITF related, whereas that at AEJ is relatively NW zonal wind related. As already discussed, in addition to the local eastward winds during DJF, it is suggested that the arrival of downwelling Kelvin waves in December–January at AEJ may contribute to a net eastward current across the water column, which in turn reduces the influence of ITF at this point.
In the transition region, the mean current at BWJ is westward and is more dominated by the ITF (denoted by black lines in Fig. 6h and k). Similar to BEJ, the seasonal feature of the subsurface maximum ITF is also found at BWJ, where the corresponding westward current at this point reaches its maximum value at ∼ 100 m depth and is stronger during DJF than JJA (Fig. 6h and k). In this study, it is also found that the zonal westward current at 100 m depth at BWJ has a strong correlation with the subsurface (∼ 200 m) maximum ITF in the southern Ombai Strait, with a correlation coefficient of about 0.77 and a 95 % significance level of approximately ± 0.33, corroborating that the ITF flowing from the Ombai Strait is the main driver for zonal westward current at this point.
Furthermore, like CEJ, characteristics of persistent westward currents exist in the offshore region (CWJ), attributed to the SEC, and the westward current has a mean velocity of around 0.22–0.33 m s−1 in the upper 100 m (Fig. 6i and l). The simulated westward current at CWJ shows seasonal variations and reaches its maximum value at about 0.48 m s−1.
3.2.3 Vertical structure of zonal current along the meridional section of Sumatra (ASM-BSM-CSM)
Vertical structures of zonal current along the meridional transect of Sumatra (SM; ASM-BSM-CSM) are shown in Fig. 6m–r. Similar to AEJ and AWJ, mean zonal current at ASM (nearshore region) is eastward, attributed to SJC, and associated with the Kelvin wave propagation. However, due to ASM located in front of western Sumatra (Fig. 2) and oriented in the northwest–southeast direction, the meridional component of velocity at this point is also dominant (Figs. 1a and 2). Therefore, zonal currents at ASM are relatively weak compared to those at AWJ and AEJ, which are located in front of southern Java and oriented in the west–east direction. For example, during SON, the eastward current reaches its maximum velocity of about 0.05 m s−1 at ASM (cyan lines in Fig. 6m and p), whereas it is about 0.23 m s−1 (at AWJ; Fig. 6g and j) and 0.20 m s−1 (at AEJ; Fig. 6a and d) at ∼ 30–50 m depth.
Furthermore, results of this study show that a maximum value of the eastward current at ASM, AWJ, and AEJ is found at a certain depth (at ∼ 30–50 m depth), and this strengthening of eastward flows is supposed to be attributed to a baroclinic Kelvin wave. The baroclinic Kelvin wave propagating vertically and horizontally along its waveguide can exert the most energy at a certain depth (Drushka et al., 2010; Pujiana et al., 2013; Iskandar et al., 2014). According to laboratory experiment observations conducted by Codiga et al. (1999) and Hallock et al. (2009), Kelvin waves can be trapped in a slope and propagate along an isobath. This phenomenon is known as a slope-trapped baroclinic Kelvin wave. Moreover, Kelvin waves that propagate along continental slope with strong stratification can cause strong current velocity. Codiga et al. (1999) also found that this slope Kelvin wave is formed after encountering a canyon-like bathymetry. Meanwhile, Pujiana et al. (2013) showed that Kelvin wave propagation from Lombok Strait to Makassar Strait, across the Sunda continental slope, is along isobaths at depths greater than 50 m. In this present study, the eastward current along the Transect A has a maximum current velocity at ∼ 30–50 m depth. Therefore, it is suggested that this maximum eastward current at ∼ 30–50 m depth is associated with a slope-trapped Kelvin wave that propagates at that depth along the southern coasts of Sumatra and Java.
In the transition region, the characteristics of the average zonal current (the climatological current field) at BSM (Fig. 6n and q) are different from those at BWJ (Fig. 6h and k) and BEJ (Fig. 6b and e). The average current at BSM is eastward, while at points BWJ and BEJ it is westward. During NW and transitional periods of the monsoon, zonal current at BSM flows eastward and reaches its maximum velocity of about 0.12 m s−1 at a depth of 40 m within the period of SON (Fig. 6q). Meanwhile, during the SE monsoon, the zonal current at this point flows westward. In contrast to the mean zonal currents in the nearshore region (ASM), it seems that the average zonal current field at BSM is not attributed to SJC. The reason is the BSM location, which is far from the coasts of Mentawai Islands and Enggano Island off the western coast of Sumatra (430 km away). This distance is more than Rossby radius of deformation at this latitude (∼ 90 km). Thereby, Kelvin waves, which affect the SJC variations, do not exist at this point. We suggest that the current variability at BSM is influenced by tropical current systems in the Indian Ocean, such as the Equatorial Counter Current (ECC), Southwest Monsoon Current (SWMC), and Wyrtki Jet. Here, we displayed seasonal averaged surface currents over 64 years (1950–2013) and schematics of the tropical current systems in the Indian Ocean as supporting evidence (Fig. 8).
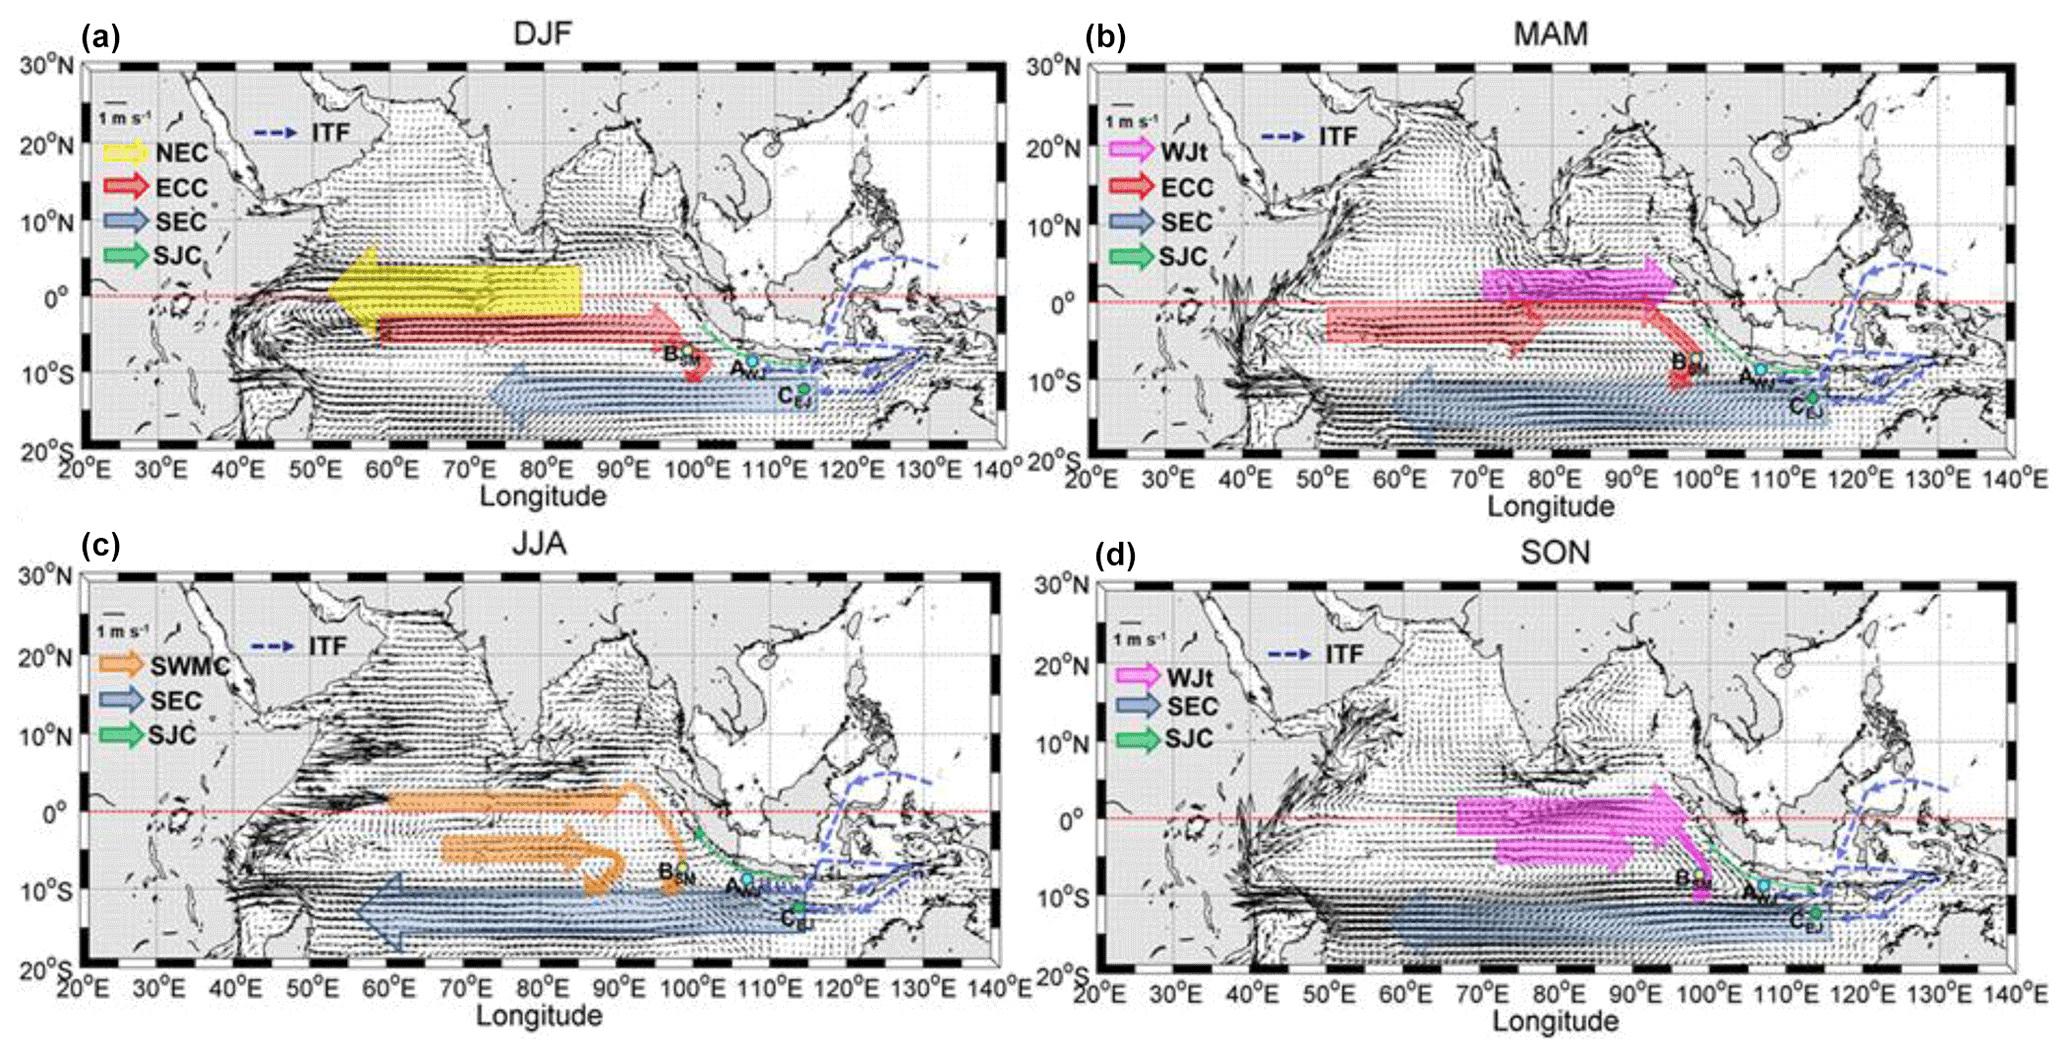
Figure 8Seasonal averaged surface (1 m) currents over 64 years (1950–2013) and schematics of the tropical current systems in the Indian Ocean during (a) DJF, (b) MAM, (c) JJA, and (d) SON. Current branches indicated by coloured arrows (not black) are the North Equatorial Current (NEC), Equatorial Counter Current (ECC), South Equatorial Current (SEC), South Java Current (SJC), Wyrtki Jet (WJt), Southwest Monsoon Current (SWMC), and Indonesian Throughflow (ITF). The dashed line represents the thermocline current.
Figure 8 shows that BSM is located in an area that is affected by the ECC, SWMC, and Wyrtki Jet. It can be seen in Fig. 8a that during DJF surface currents along the equatorial Indian Ocean are dominated by the westward North Equatorial Current (NEC) and the eastward ECC. Meanwhile, during JJA (Fig. 8c) the NEC disappears and the ECC becomes absorbed into the SWMC, which dominantly flows eastward in the northern Indian Ocean (Tomczak and Godfrey, 1994). In addition, during the transitional periods (MAM and SON) the jet is generated and causes a strengthening of eastward flows along the equatorial Indian Ocean (Fig. 8b and d). This explains why the climatological current at BSM flows eastward and reaches its maximum velocity during SON and MAM. These currents (the ECC, SWMC, and Wyrtki Jet) flow eastward before they turn and some part of their flow feed into the SEC in the southern Indian Ocean.
Current characteristics in the offshore region (CSM) generally show similarities with those at CWJ and CEJ, as shown in Fig. 6o and r. The current at CSM is attributed to the SEC and flows westward year round, with a mean velocity around 0.18–0.3 m s−1 in the upper 100 m. In addition, the strength of westward current at CSM varies seasonally and reaches its maximum value of about 0.42 m s−1 during SON (Fig. 6r).
3.3 Zonal current variability
EOF analysis gives vertical mode structures (spatial mode) and their normalized temporal mode variabilities relative to the mean which influence zonal current variability in the study area. Before performing the EOF analysis, the average value of the current data has been removed (solid black lines in the Fig. 6a–r). To further analyze the zonal current characteristics in the nearshore and offshore areas and the transition region between them, we examined the EOF modes of zonal current across the three meridional sections (EJ, WJ, and SM). In this paper, we only considered the first mode of EOF (EOF1) analysis since it is associated with the largest percentage of the variance. Figure 9 shows vertical structures and their associated temporal variability of EOF1 of zonal currents along the meridional sections. Here, as an example, the temporal variability is only shown for the last 8-year period of the EOF1 (2006–2013). It can be clearly seen that remarkable features of zonal currents are revealed between nearshore and offshore areas in the three meridional sections (Fig. 9).

Figure 9Vertical mode structures (a, c, e) and their associated temporal variability of EOF1 (b, d, f) for zonal currents relative to the mean flow along the three meridional sections: EJ (a, b), WJ (c, d), and SM (e, f). In this case, the temporal variability is shown for the last 8-year period of the EOF1. The direction of mode velocities relative to the mean flow is determined by multiplying the sign of the vertical mode structure and the sign of the temporal mode variability. Positive (negative) values of the velocity variability relative to the mean flow indicate eastward (westward) flow. Meanwhile, dashed green lines indicate the latitudes of the nine analyzed points, and SL stands for shoreline.
In general, the temporal mode of EOF1 of zonal currents across each meridional section shows intraseasonal and semiannual variabilities both in the nearshore and transition regions, whereas annual and interannual variations exist in the offshore area. However, the vertical structures of EOF1 in each section are quite different. In the nearshore area of Section EJ (Fig. 9a), the vertical structure of EOF1 is characterized by one-layer flow with a gradual decrease in speed from the surface to 800 m depth, whereas in the transition and the offshore regions the flow velocities decrease more rapidly with depth until they become nearly zero at depths of about 500 and 300 m, respectively. Meanwhile, in Section WJ (Fig. 9c) the vertical structure of EOF1 is also characterized by one-layer flow in which its unidirectional vertical structure gradually decreases from the surface to a depth of about 450 m in all areas. In contrast, a different vertical structure of EOF1 appears in Section SM (Fig. 9e). In this section, the vertical structure is characterized by two-layer flow in the nearshore and transition regions with the changeover between the two types of flow occurring at a depth of about 100 and 200 m, respectively. In addition, in the offshore area of Section SM, the vertical structure of EOF1 displays a unidirectional flow from the surface to a depth of ∼ 500 m.
To examine the EOF modes of zonal currents in more detail, further analysis was performed at three points on each meridional transect, namely points AEJ, BEJ, and CEJ (Transect EJ); points AWJ, BWJ, and CWJ (Transect WJ); and points ASM, BSM, and CSM (Transect SM). Table 2 displays the dominant variances at those points. As can be seen in Table 2, the first three modes at each point (except ASM) already represent ≥ 95 % of the total variance. In fact, the first two modes at each point (except ASM and AEJ) already represent ≥ 91 % of the total variance.
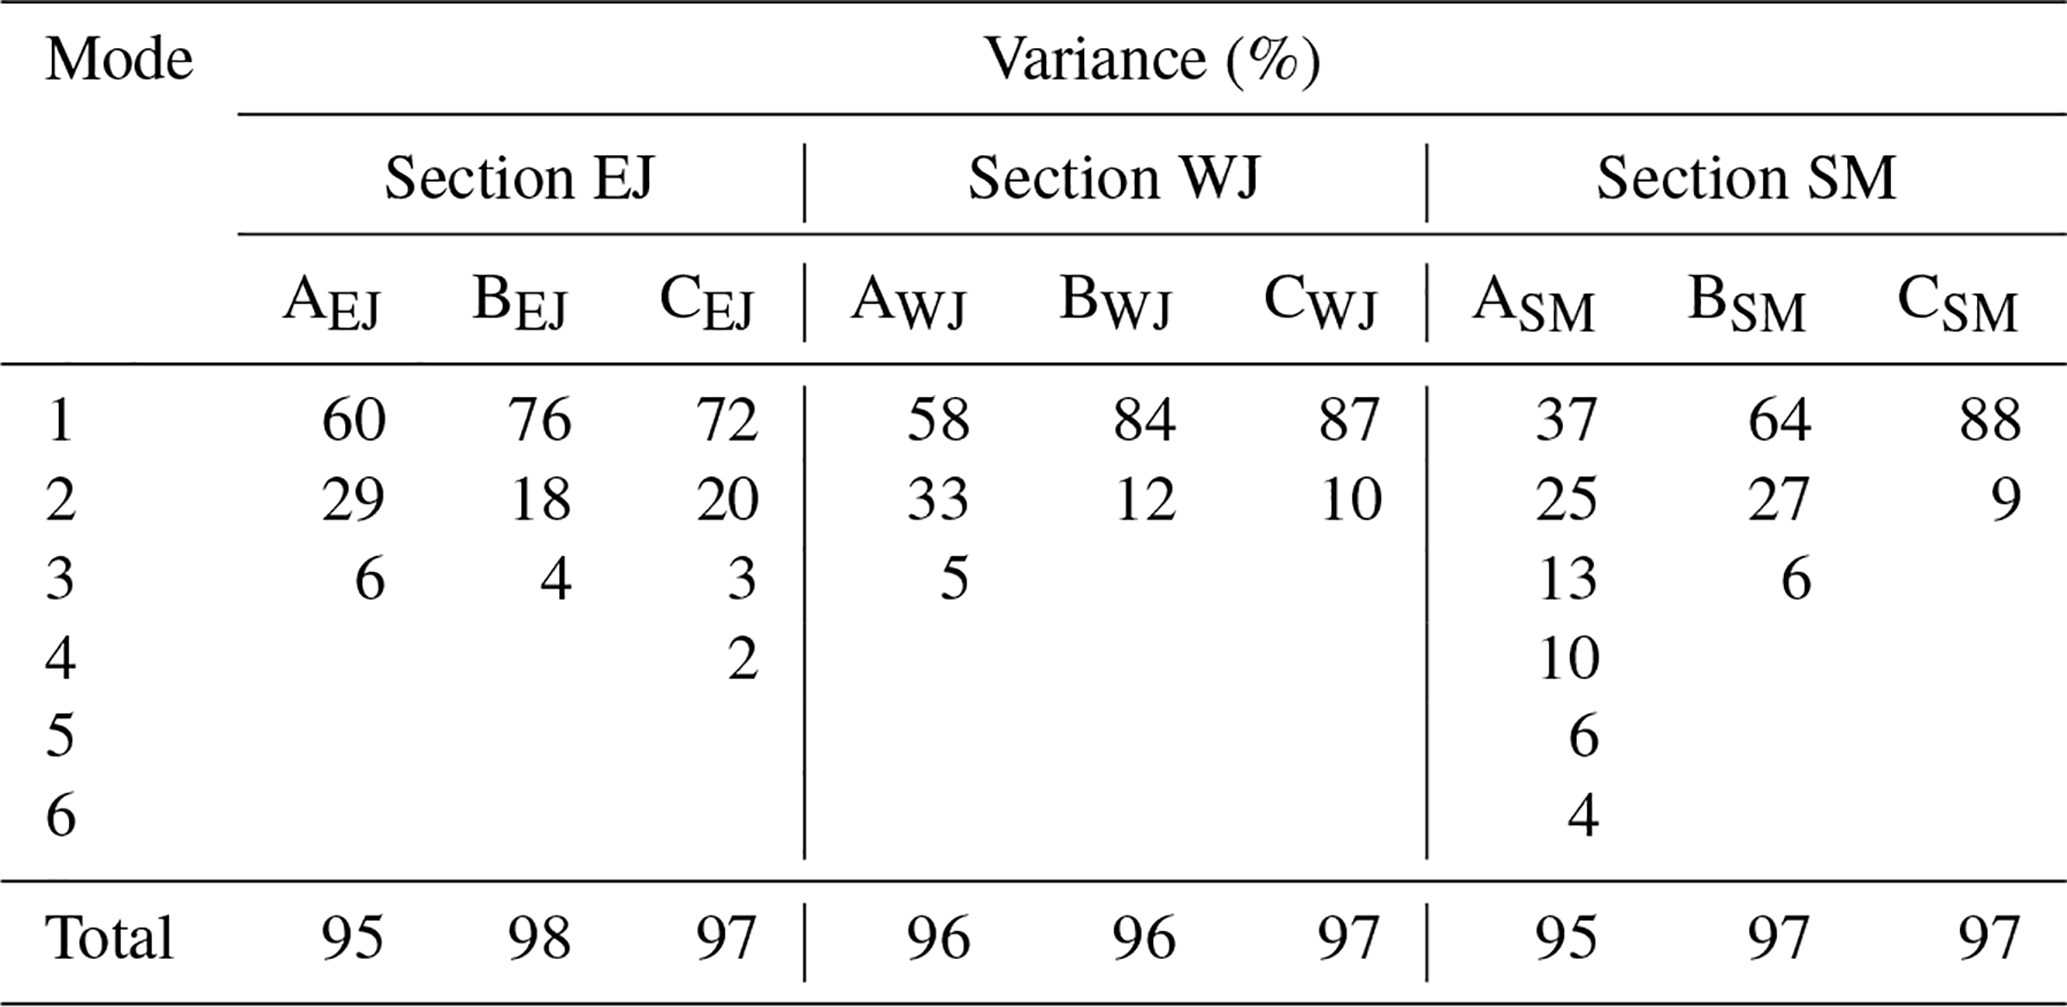
Table 3Maximum energy density (peak energies) at intraseasonal, semiannual, annual, and interannual timescales at points AWJ, BSM, and CEJ.
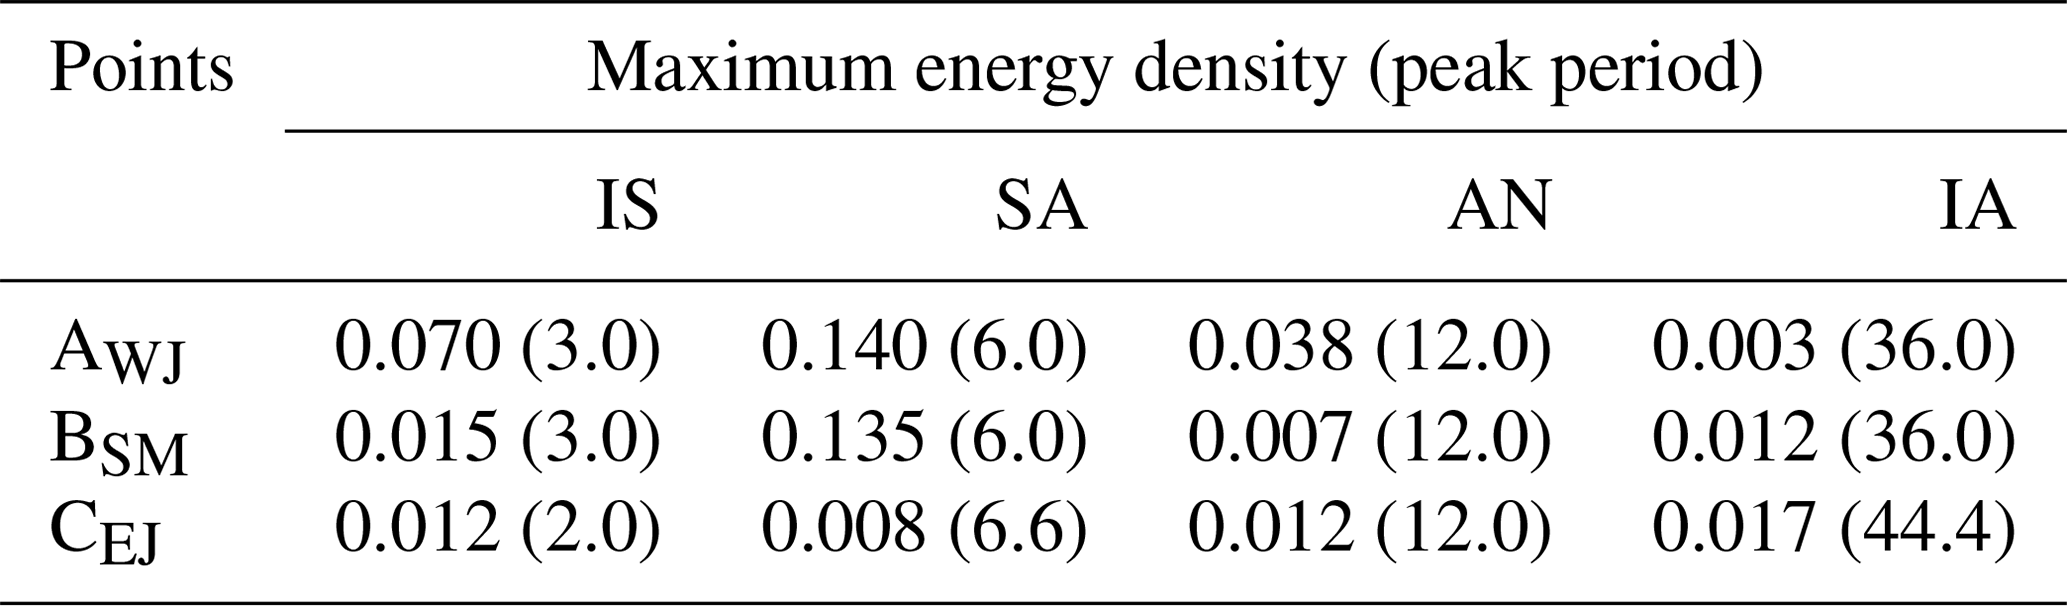
IS stands for intraseasonal, SA stands for semiannual, AN stands for annual, and IA stands for interannual. Maximum energy density is given in power per year, and the peak periods are given in months.
Here, we only consider the first modes of EOF analysis for further analysis since their percent variances (except at point ASM) are more than 50 % of the total variance (Table 2). Since the temporal variability of the EOF1 contains more than one frequency (Fig. 9b, d, and f), to find out what frequencies are dominant in the EOF1 it was then analyzed by using the EEMD method to decompose the signal. In this study, the EEMD analyses of currents are only presented at one point on each meridional transect, namely AWJ (Transect WJ), BSM (Transect SM), and CEJ (Transect EJ). The AWJ, BSM, and CEJ points were chosen to investigate SJC variability, interannual variability in the open SETIO, and SEC and ITF variabilities, respectively.
The EEMD analysis of the first temporal EOF mode provides 10 modes and signals, of which the first signal of the EEMD result is the summation of the second to tenth signals, which is in turn the same as the original EOF first temporal mode of zonal currents. Meanwhile, the second–sixth signals of the EEMD result vary from intraseasonal to interannual variabilities. The remaining signals of EEMD result show the long-term variation and trend. Moreover, the proportion of contribution of each EEMD mode to the EOF1 is estimated by calculating standard deviation of each EEMD mode relative to the total variance of PC1 (Figs. 10–12). In general, the contributions of each EEMD mode to the EOF1 at AWJ and BSM, from largest to smallest, are intraseasonal, semiannual, annual, interannual, and long-term (Figs. 10 and 11). Intriguingly, however, the contribution of long-term signal (19.2 %) at CEJ is larger than the interannual (16.3 %) and annual (14.7 %) signals (Fig. 12). For the scope of this paper, we only focused on the analysis of the EOF1 of zonal current from intraseasonal to interannual timescales. The interesting results concerning the existence of pronounced contribution of long-term variation to the EOF1 at CEJ will be investigated in a future study.
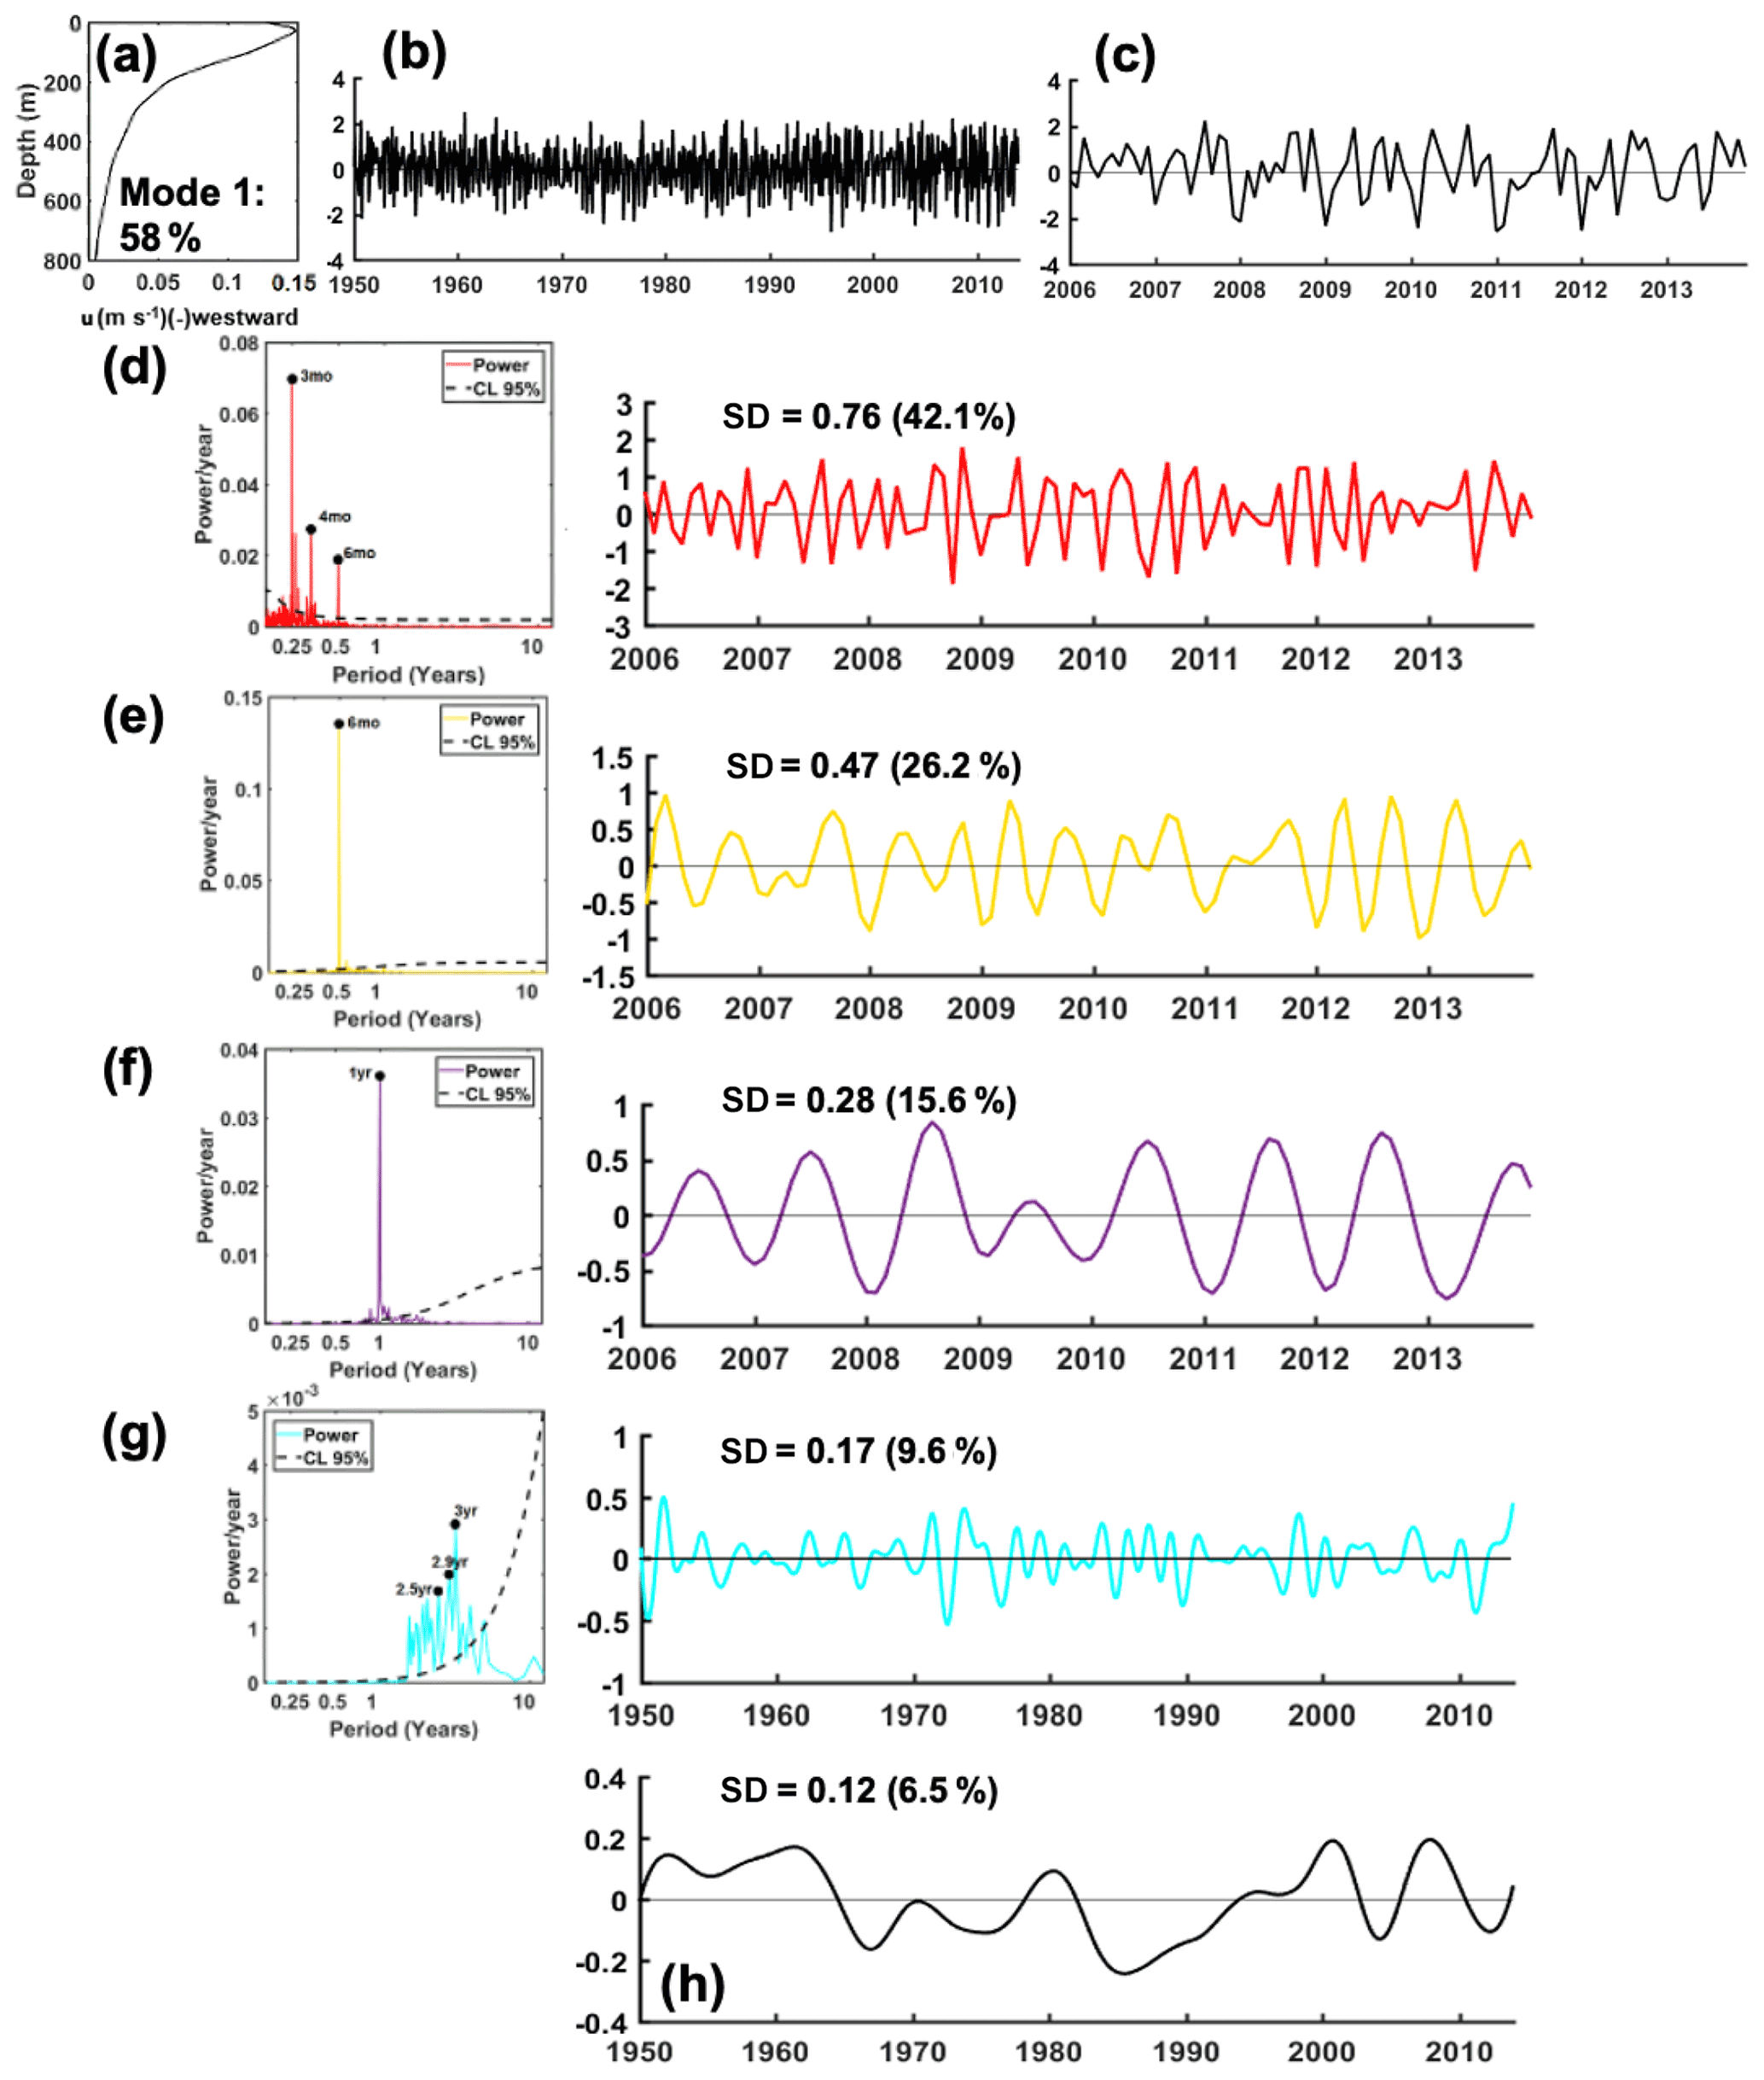
Figure 10(a) Vertical mode structure and (b) its associated temporal variability of EOF1 (58 % of total variance) at the point AWJ. Panel (c) is the same as (b) but only shows the last 8-year period of the EOF1. The EEMD is then applied to the EOF temporal structure to decompose temporal variability: (d) intraseasonal, (e) semiannual, (f) annual, and (g) interannual variabilities with their corresponding red spectrum as a reference for 95 % confidence limit (left column), whereas (h) represents the long-term variation and trend. Meanwhile, SD is standard deviation of each EEMD mode relative to the total variance of the EOF1.
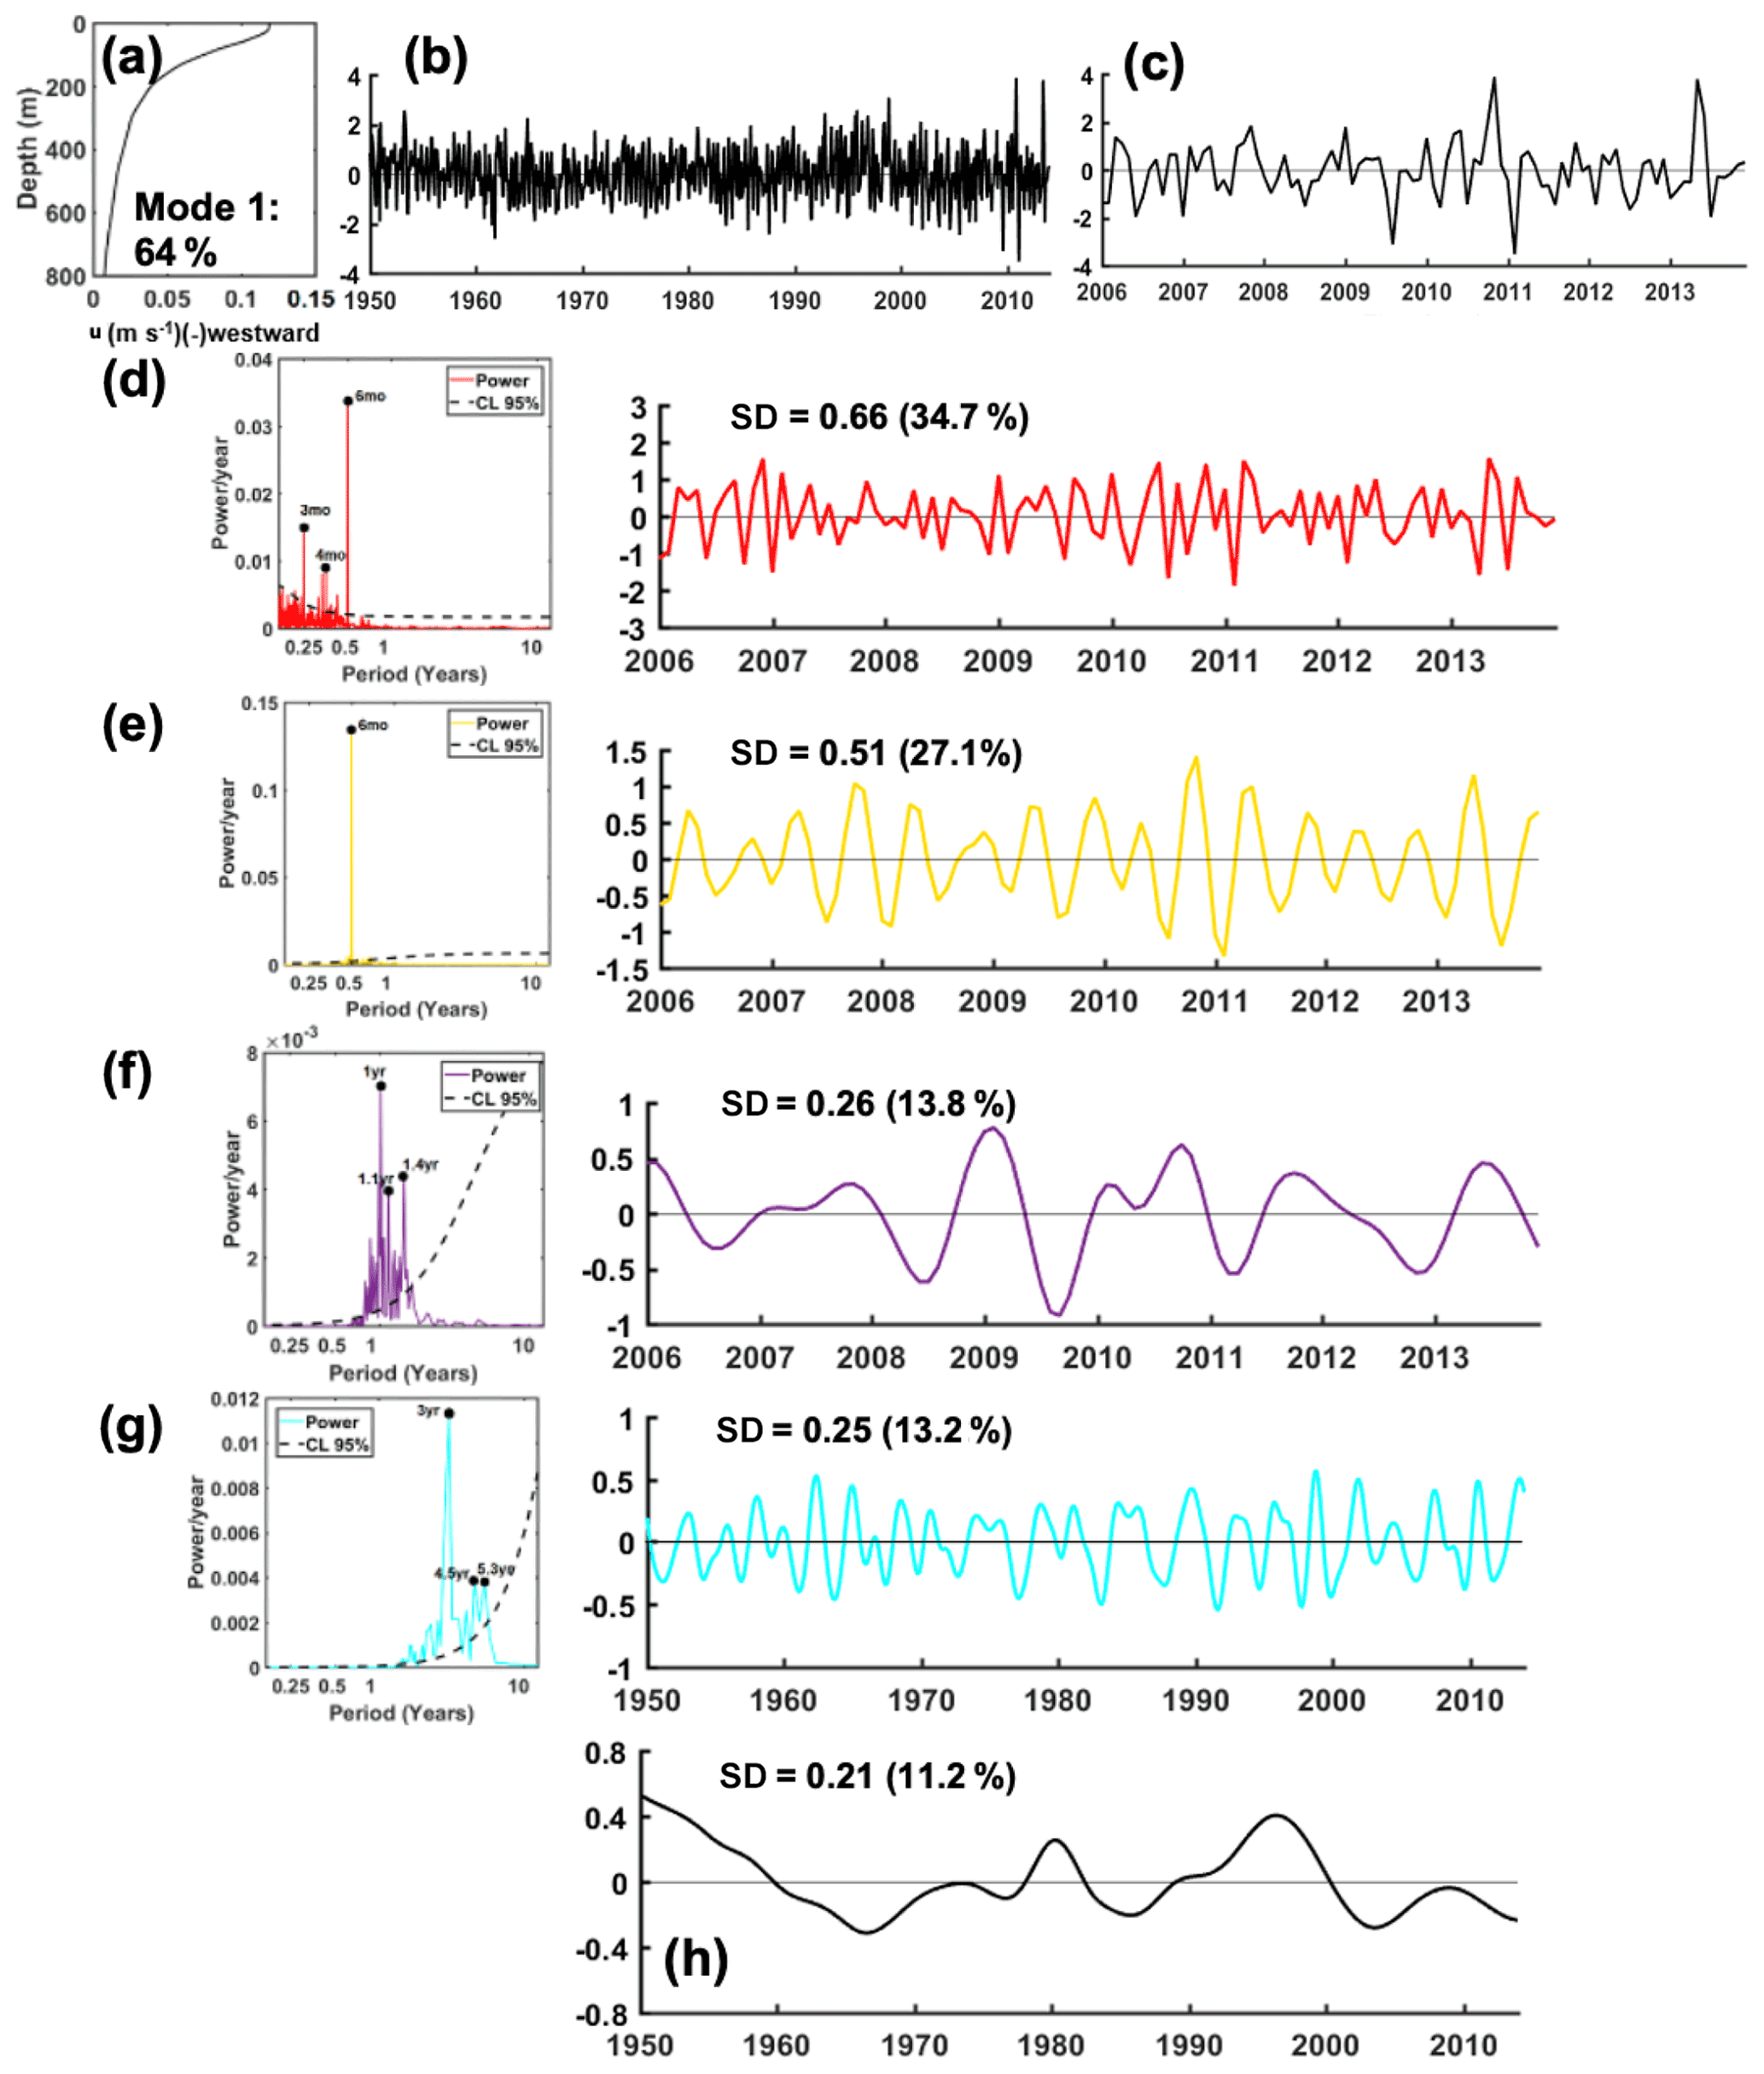
Figure 11The same as Fig. 10 but for point BSM, with the temporal variability of EOF1 accounting for 64 % of total variance.
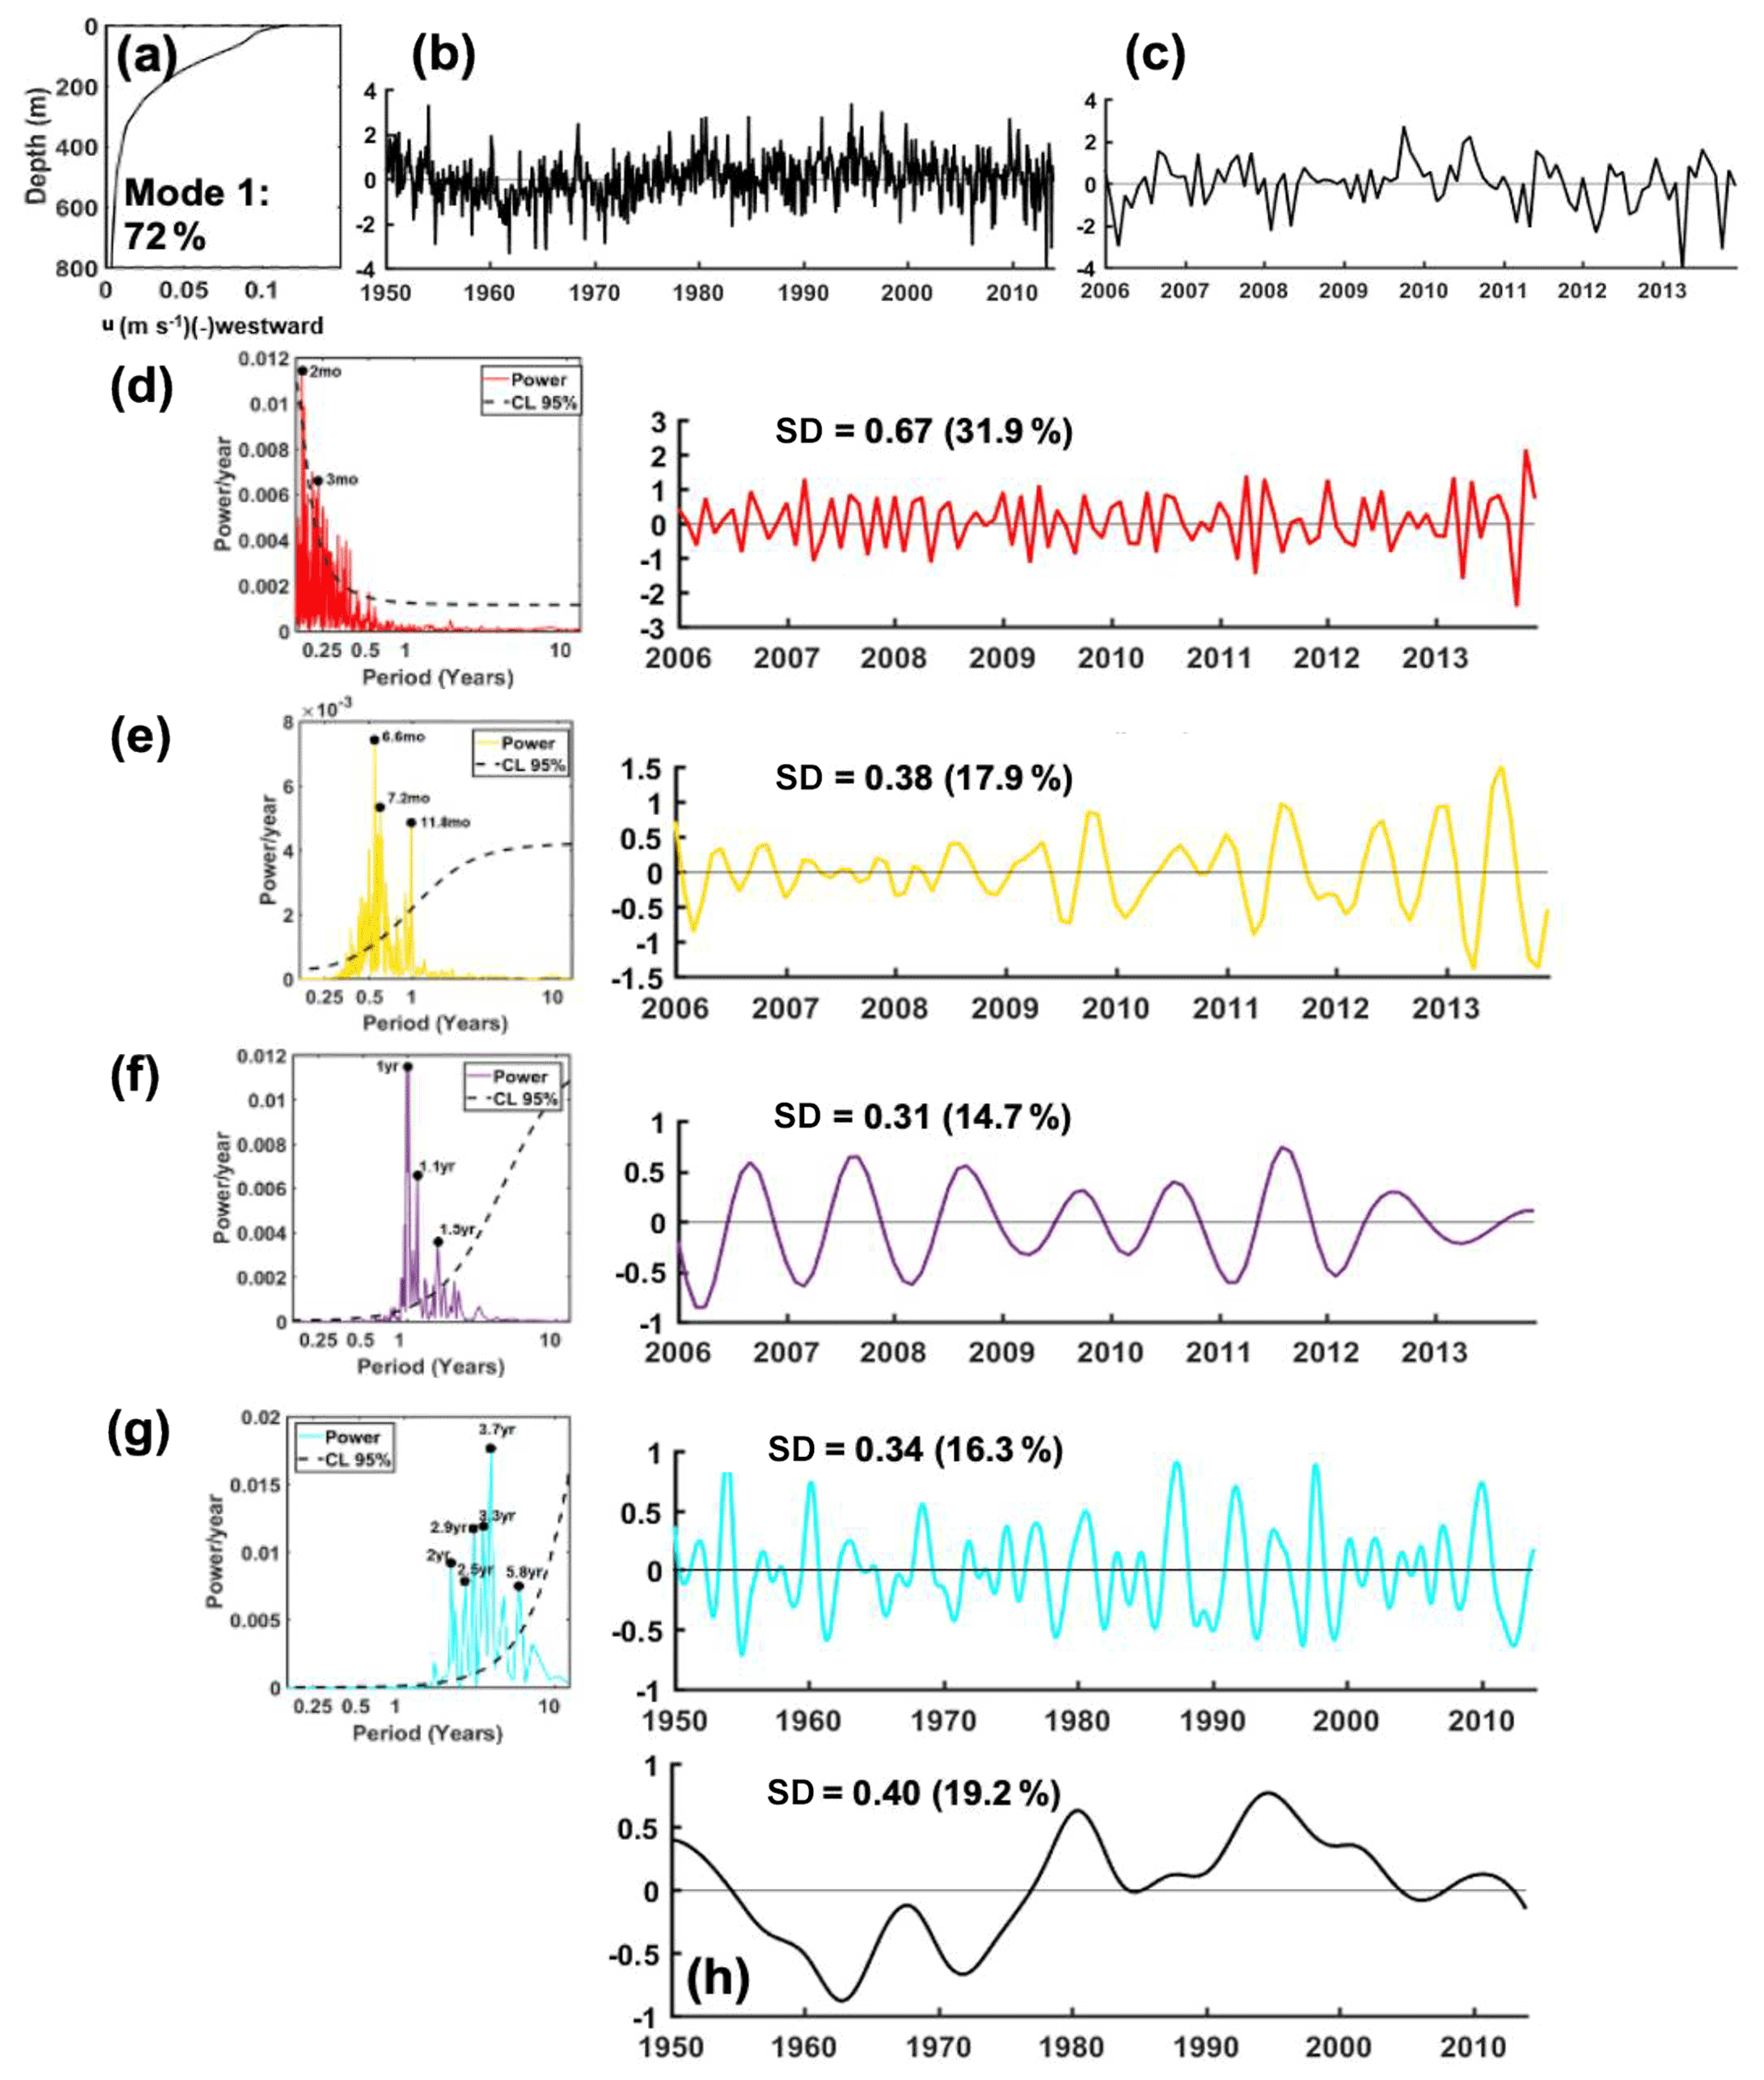
Figure 12The same as Fig. 10 but for point CEJ, with the temporal variability of EOF1 accounting for 72 % of total variance.
3.3.1 Intraseasonal, semiannual, and annual variations
Figure 10a–b show the vertical structure and temporal variability of the EOF1 (58 % of total variance) at AWJ, respectively. In order to see the temporal variation of the EOF1 more clearly in Fig. 10b, we have also provided data for the last 8-year period of the EOF first temporal mode (Fig. 10c, as an example). Current velocity variability relative to the mean flow can be obtained by multiplying the vertical mode structure (Fig. 10a) with the temporal variability (Fig. 10b).
Intraseasonal, semiannual, and annual variabilities of the EOF first temporal mode at AWJ as a result of the EEMD analysis are displayed in Fig. 10d–f, where their power spectra (Fig 10, left column) show the maximum energy for 3-month, 6-month, and 12-month periods, respectively. At this point, the highest power spectrum occurs at semiannual variability (Fig. 10e). In this figure (right), the semiannual variability of the EOF first temporal mode at AWJ clearly shows the presence of an eastward anomaly of the zonal current during the MAM and SON, which may be enhanced by downwelling Kelvin waves associated with the Wyrtki Jet in the equatorial Indian Ocean. Meanwhile, the anomaly of the zonal current at AWJ is westward during JJA in response to the prevailing southeasterly local winds during the SE monsoon. On the other hand, during DJF the anomaly of the zonal current at AWJ is not associated with the prevailing northwesterly local winds during the NW monsoon, in which the current anomaly is westward during this monsoon (Fig. 10e). As already discussed in Sect. 3.2 (Table 1 and Fig. 7), this may be attributed to the ITF, which has more influence on variation of zonal current at AWJ during DJF than the NW local wind.
Similar to AWJ, the first mode of EOF vertical structure and its temporal variability (64 % of total variance) at BSM show seasonal pattern (Fig. 11a–c). It is also found that signal on a 6-month (semiannual) period is quite dominant at BSM (Fig. 11e). In order to see the seasonal variation more clearly, we have provided a probability distribution function of the EOF1 of zonal currents for the NW, SE, and transition seasons at BSM at a depth of ∼ 40 m (Fig. 14). The 40 m depth was selected as an example because the most obvious seasonal variation of currents is present at this depth. It is found that variation of zonal current at BSM is dominantly eastward during DJF (Fig. 14a) and that this eastward current is enhanced during MAM and SON (Fig. 14b and d), which may be attributed to the tropical current systems in the Indian Ocean (ECC, SWMC, and Wyrtki Jet). Meanwhile, during JJA (Fig. 14c) the dominance of eastward current reduces, and the current tends to be dominantly westward. Furthermore, Fig. 12a–c show the first mode of EOF vertical structure and its temporal variability (72 % of total variance) at CEJ. In general, the anomaly of the zonal current at CEJ is westward, which is supposed to be associated with the meeting of SEC driven by trade winds and the ITF at this region. The EEMD analysis of the EOF1 of zonal current at CEJ also shows intraseasonal–interannual variabilities (Fig. 12d–g), where it is found that interannual timescale dominates the zonal current variation at CEJ (0.017 power per year).
To obtain a better understanding of the zonal current characteristics at AWJ, BSM, and CEJ, we have summarized the maximum energy density of zonal currents at intraseasonal, semiannual, annual, and interannual timescales that exists at each point based on power spectrum calculation in Figs. 10–12 (Table 3). It is shown that the zonal currents at AWJ have peak energies that are consecutively dominated by semiannual, intraseasonal, and annual signals, while the interannual signal is weaker than them at this point. Furthermore, although semiannual and intraseasonal signals are dominant at BSM, there is pronounced interannual variation of the zonal current at this point. In contrast, the zonal current variability at CEJ is dominated by interannual signal.
Furthermore, based on the power spectrum calculation shown in Fig. 12 (Table 3), it is found that intraseasonal variability of the SEC (zonal current at CEJ) is also prominent (∼ 0.012 power per year) in addition to the interannual signal (∼ 0.017 power per year). Meanwhile, based on sea level anomaly data in the period of October 1992 to the end of 1998 (about 6 years), Feng and Wijffels (2002) suggested that the strongest intraseasonal variability in the SETIO occurs in the SEC during the July–September season with baroclinic instability seeming to be the leading cause. On the other hand, in this study we found that the strongest intraseasonal variability occurs in the SJC (zonal current at AWJ). This different result seems to be due to differences in the length of data used in this study (64 years) and that in Feng and Wijffels (2002) (6 years). In addition, in this study we analyzed intraseasonal variability from the signal of the EOF first temporal mode of zonal currents (accounting for 58 %, 64 %, and 72 % of total variance at AWJ, BSM, and CEJ, respectively), whereas Feng and Wijffels (2002) analyzed the intraseasonal variation from standard deviation of the 6-year sea level anomaly data based on the 100 d high-pass filtered altimeter data during the four seasons (January–March, April–June, July–September, and October–December). Moreover, some of the differences may also be due to the fact that altimeter data do not resolve coastal processes well. However, further study is required to address this issue.
3.3.2 Interannual variations
In this study, it is found that the most energetic zonal current variations of EOF1 at AWJ, BSM, and CEJ exist at ∼ 30 m depth (Figs. 10a, 11a, and 12a). To exclusively investigate the ocean currents at an interannual timescale, lagged correlation analyses have been applied between the zonal currents at a depth of about 30 m at points AWJ, BSM, and CEJ and each of the climatic indices (e.g., ONI and DMI), as shown in Table 4. The ONI and DMI indices from 1950 to 2013 used in this study are shown in Fig. 13.
Table 4Lag correlation between the zonal currents at 30 m and each ONI and DMI.
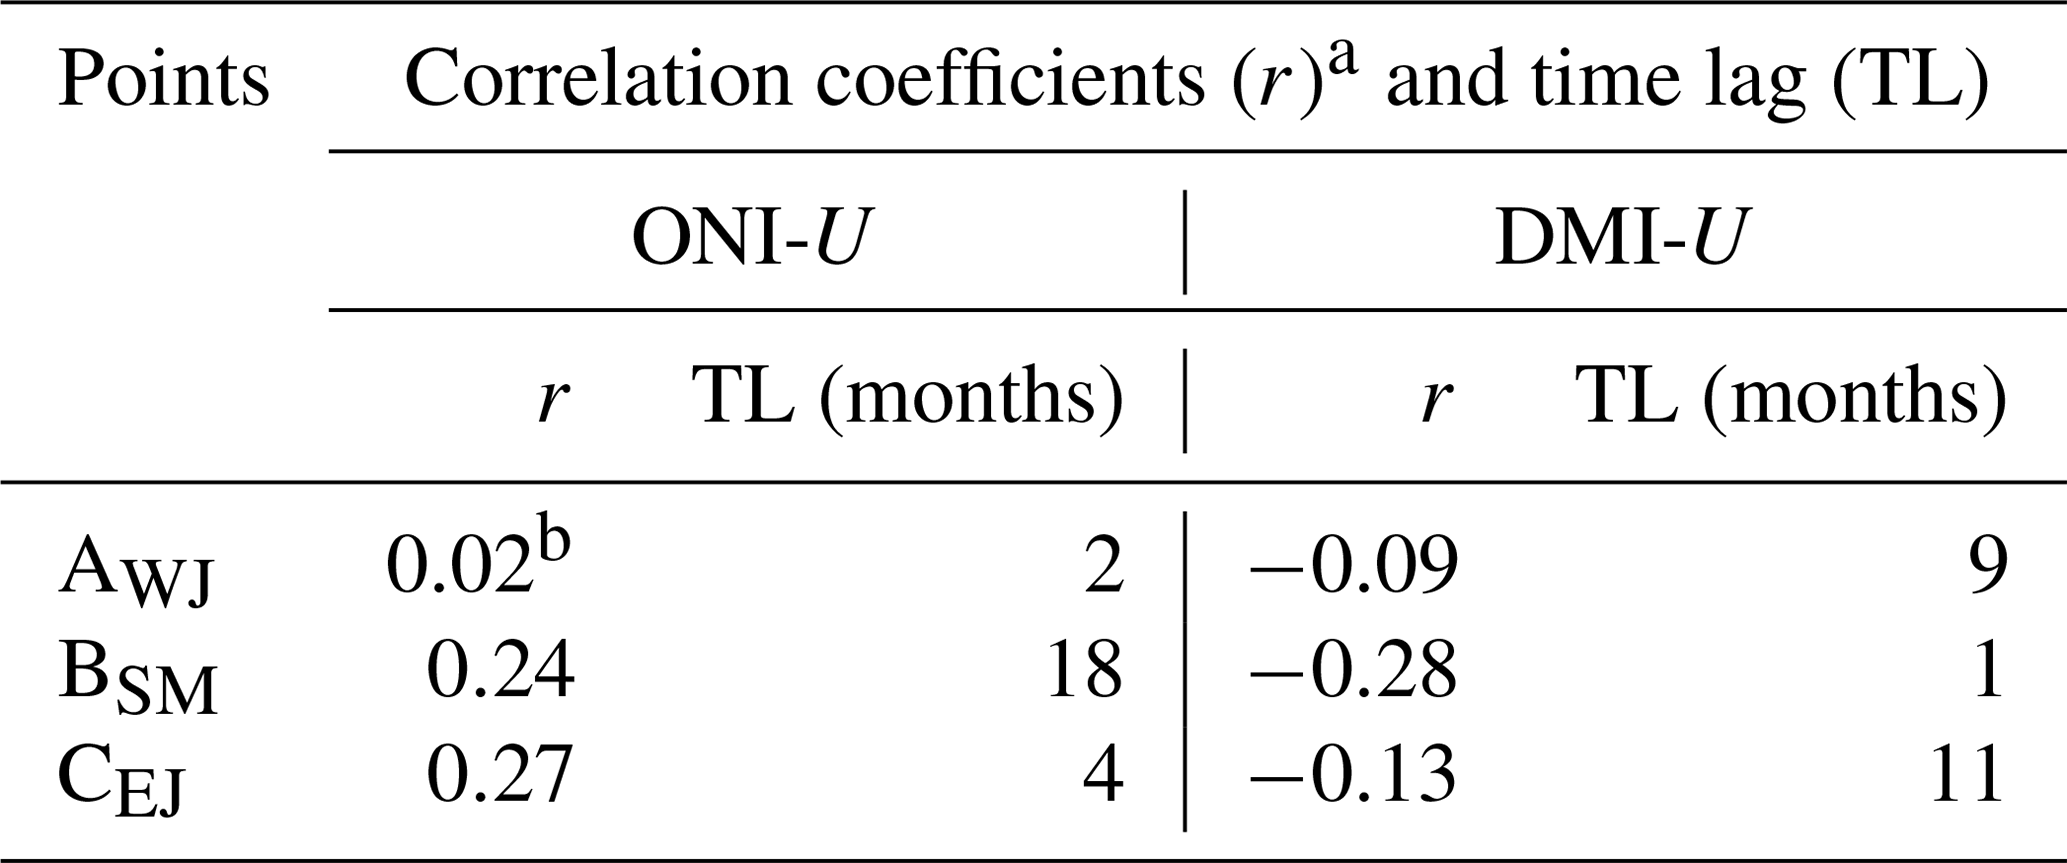
a The 95 % significance level is approximately ± 0.07. U indicates zonal currents at 30 m. Positive correlation coefficients between the currents and the ONI indicate the existence of an eastward (westward) anomaly of the currents during El Niño (La Niña). Meanwhile, negative correlation coefficients between the currents and the DMI indicate the existence of an eastward (westward) anomaly of the currents during negative (positive) IOD. A positive (negative) lag indicates that the variability in a former variable (e.g., ONI or DMI) leads (lags) that in the latter variable (the zonal current). b Correlation below the significance level.
The analysis of the lagged correlation indicates that the currents at BSM and CEJ show positive correlations with the ONI, namely r(18)=0.24 and r(4)=0.27, respectively, with the 95 % significance level approximately ± 0.07, indicating that an El Niño (La Niña) event is favorable for an eastward (westward) currents at these points (Figs. 11g and 12g) and showing that ITF transport is lower (higher) during El Niño (La Niña) events (Fieux et al., 1996; Meyers, 1996; Gordon and Susanto, 1999; Ffield et al., 2000; Susanto et al., 2001; Susanto and Gordon, 2005; Susanto et al., 2012; Liu et al., 2015; Susanto and Song, 2015; Zhang et al., 2016). ENSO seems to have a strongest influence on the zonal current variability at CEJ (Table 4), which is located close to the exits of the ITF. The ENSO signals penetrate into the SETIO mainly through the equatorial Pacific and coastal ocean Indonesian waveguides (Wijffels and Meyers, 2004; Zhang et al., 2016). Meanwhile, the present study shows that the correlation between the zonal current at AWJ and ONI is weak and below the significance level.
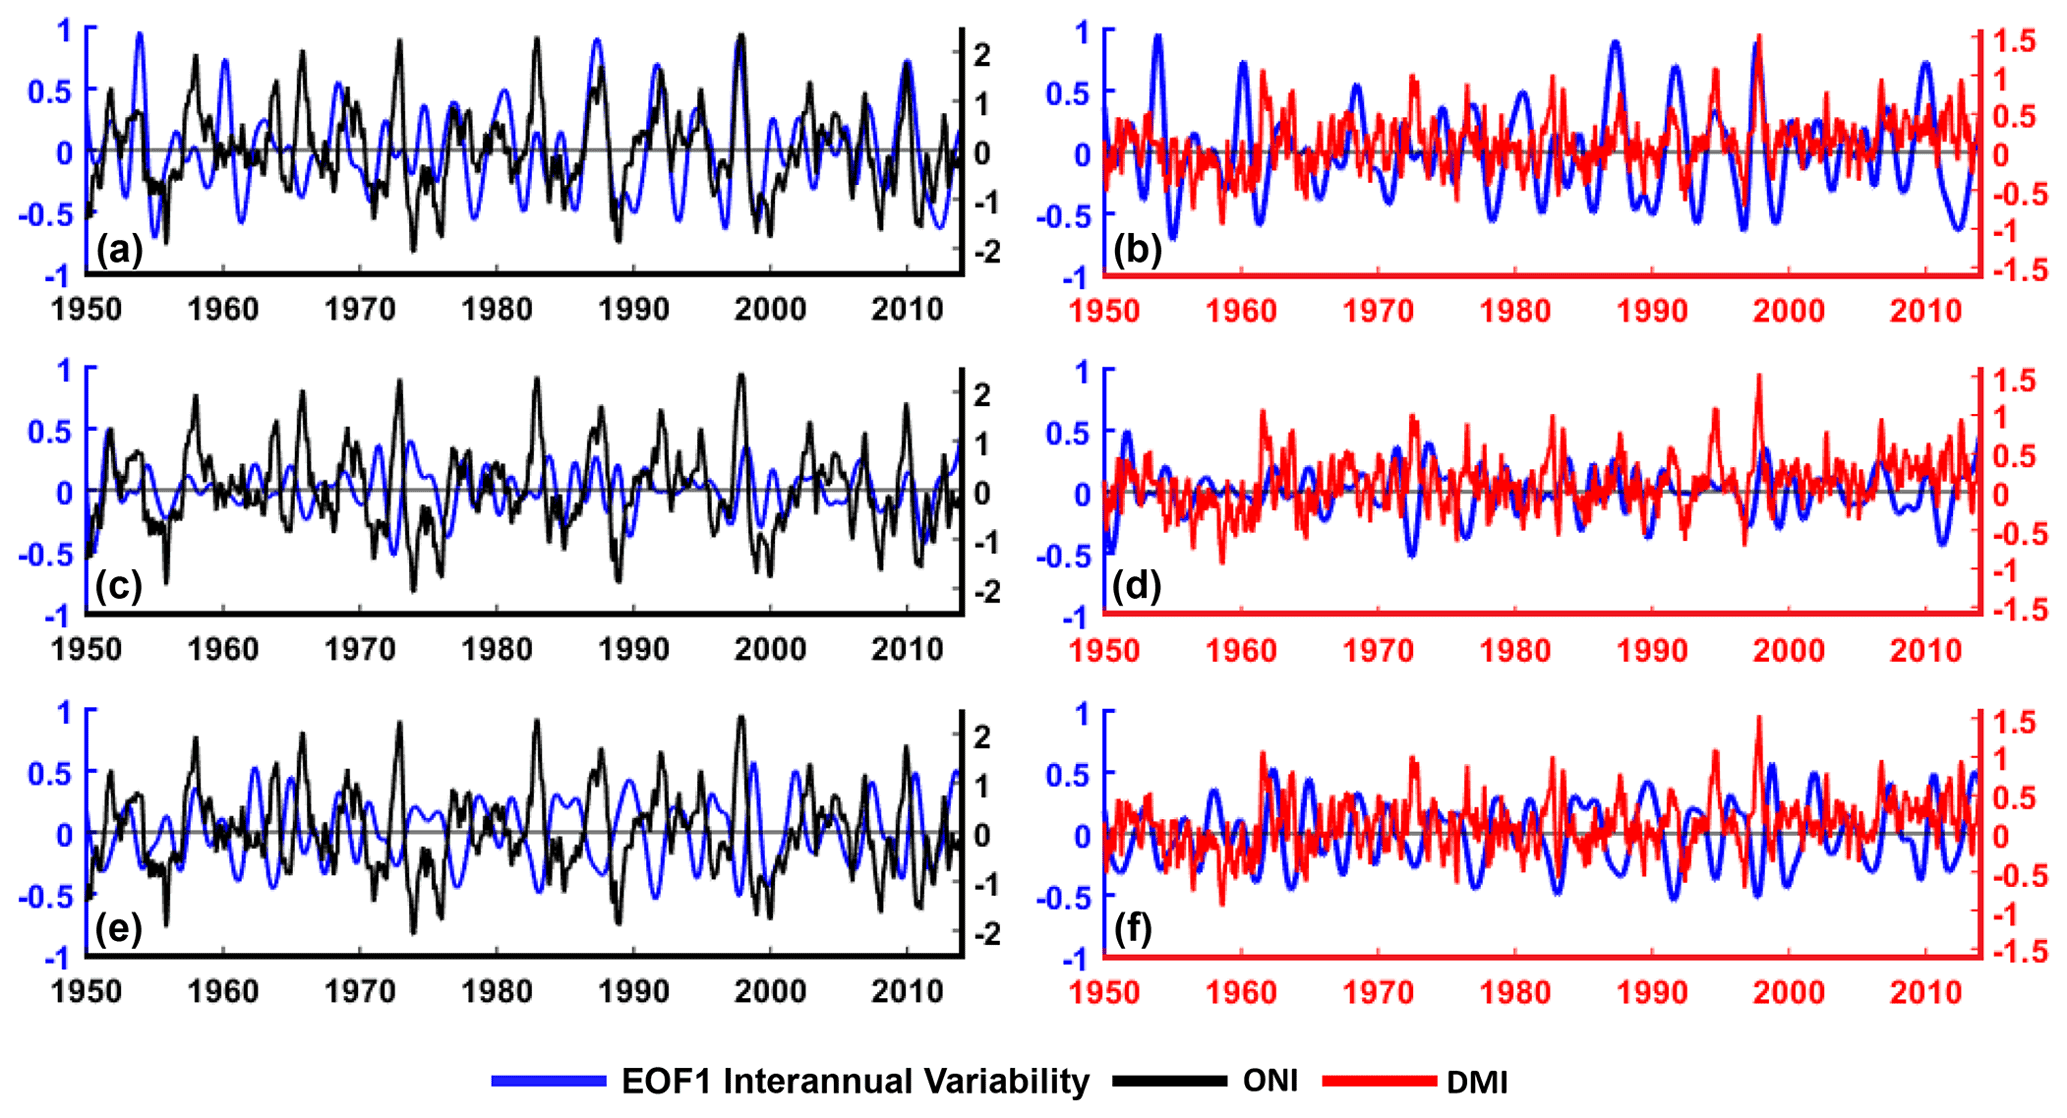
Figure 13The interannual variability of the EOF first temporal mode (blue lines) overlaid with ONI (black lines) and DMI (red lines) at CEJ (a, b), AWJ (c, d), and BSM (e, f).
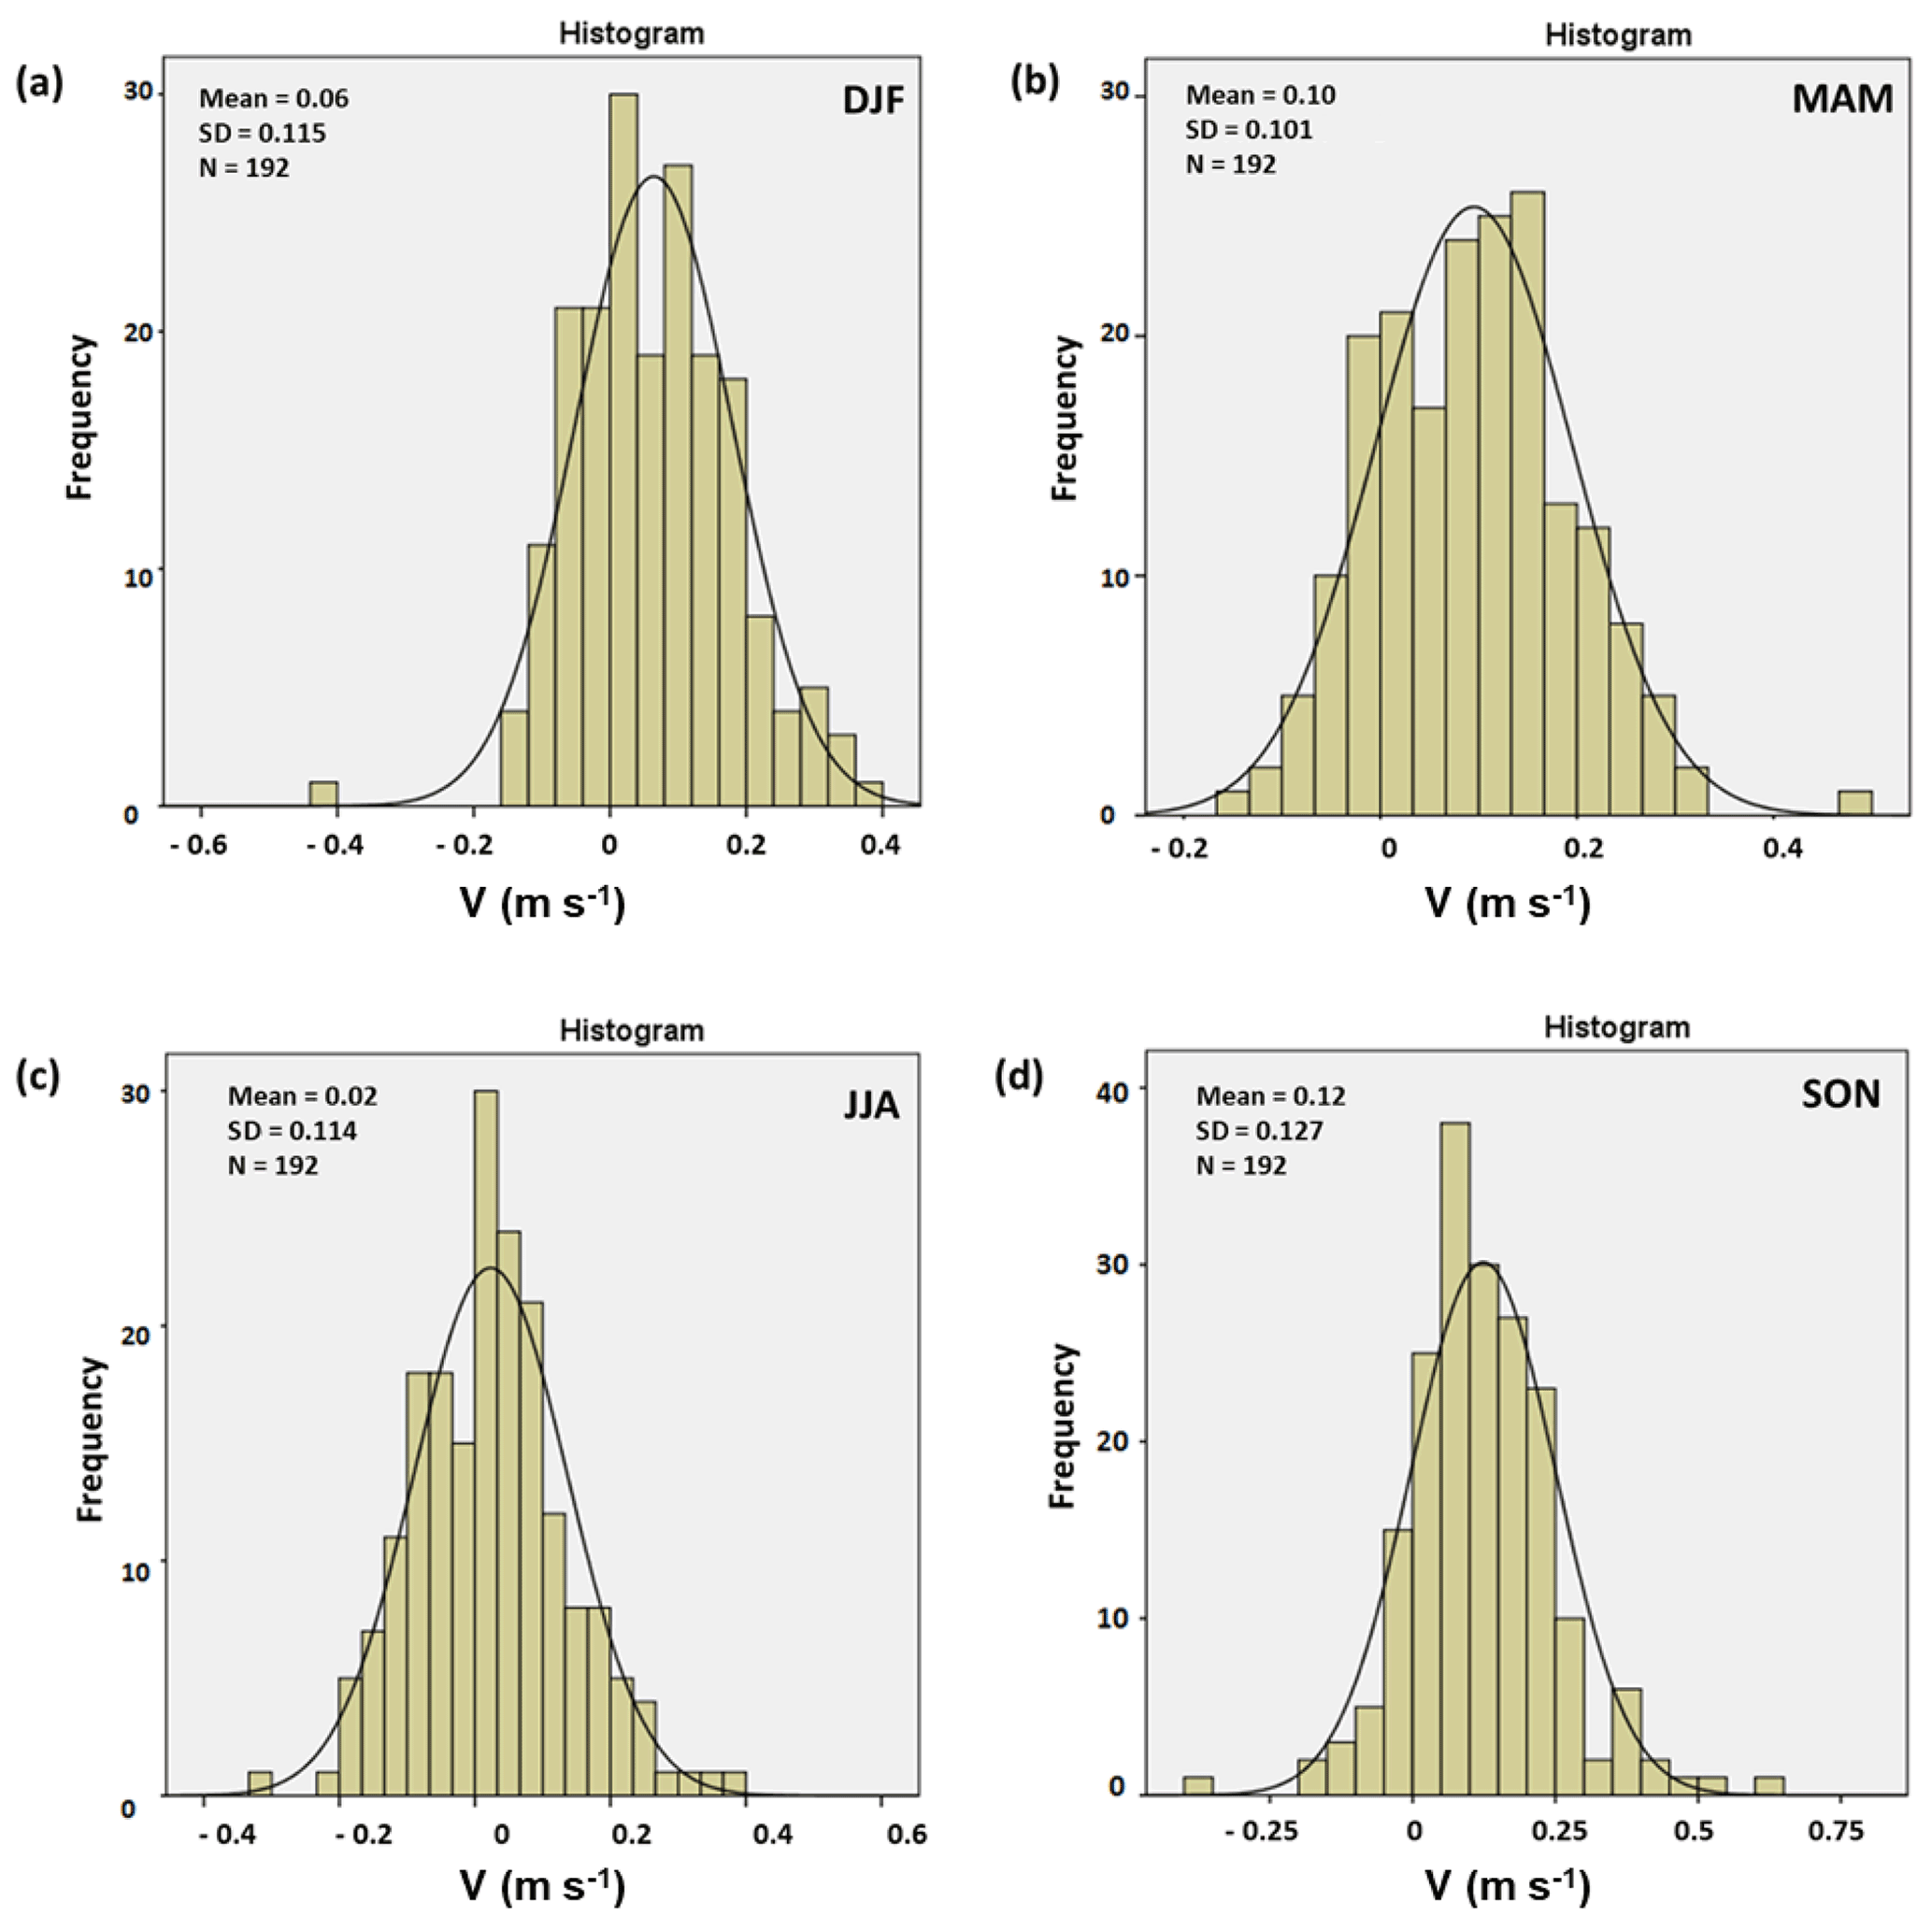
Figure 14A probability distribution function of the EOF1 of zonal currents for the NW (a), SE (c), and transition (b, d) seasons at BSM at a depth of ∼ 40 m.
Furthermore, negative correlation is found between IOD and zonal currents at AWJ [DMI-U: ], BSM [DMI-U: ], and CEJ [DMI-U: ]. The correlation analysis indicates that IOD is most influential in forcing the interannual variation of the zonal currents at BSM, with the IOD leading the zonal currents by 1 month. The influence of interannual phenomena at BSM, such as IOD, is stronger and relatively instantaneous compared to that at points CEJ and AWJ. This may be due to the location of BSM, which is close to the center of the eastern pole of the IOD (5∘ S, 100∘ E; Saji et al., 1999). In contrast to ONI, there are IOD signals at AWJ, although the IOD signals at this point are weak compared to BSM and CEJ (Table 4). This indicates that some of the IOD signals are coastally trapped.
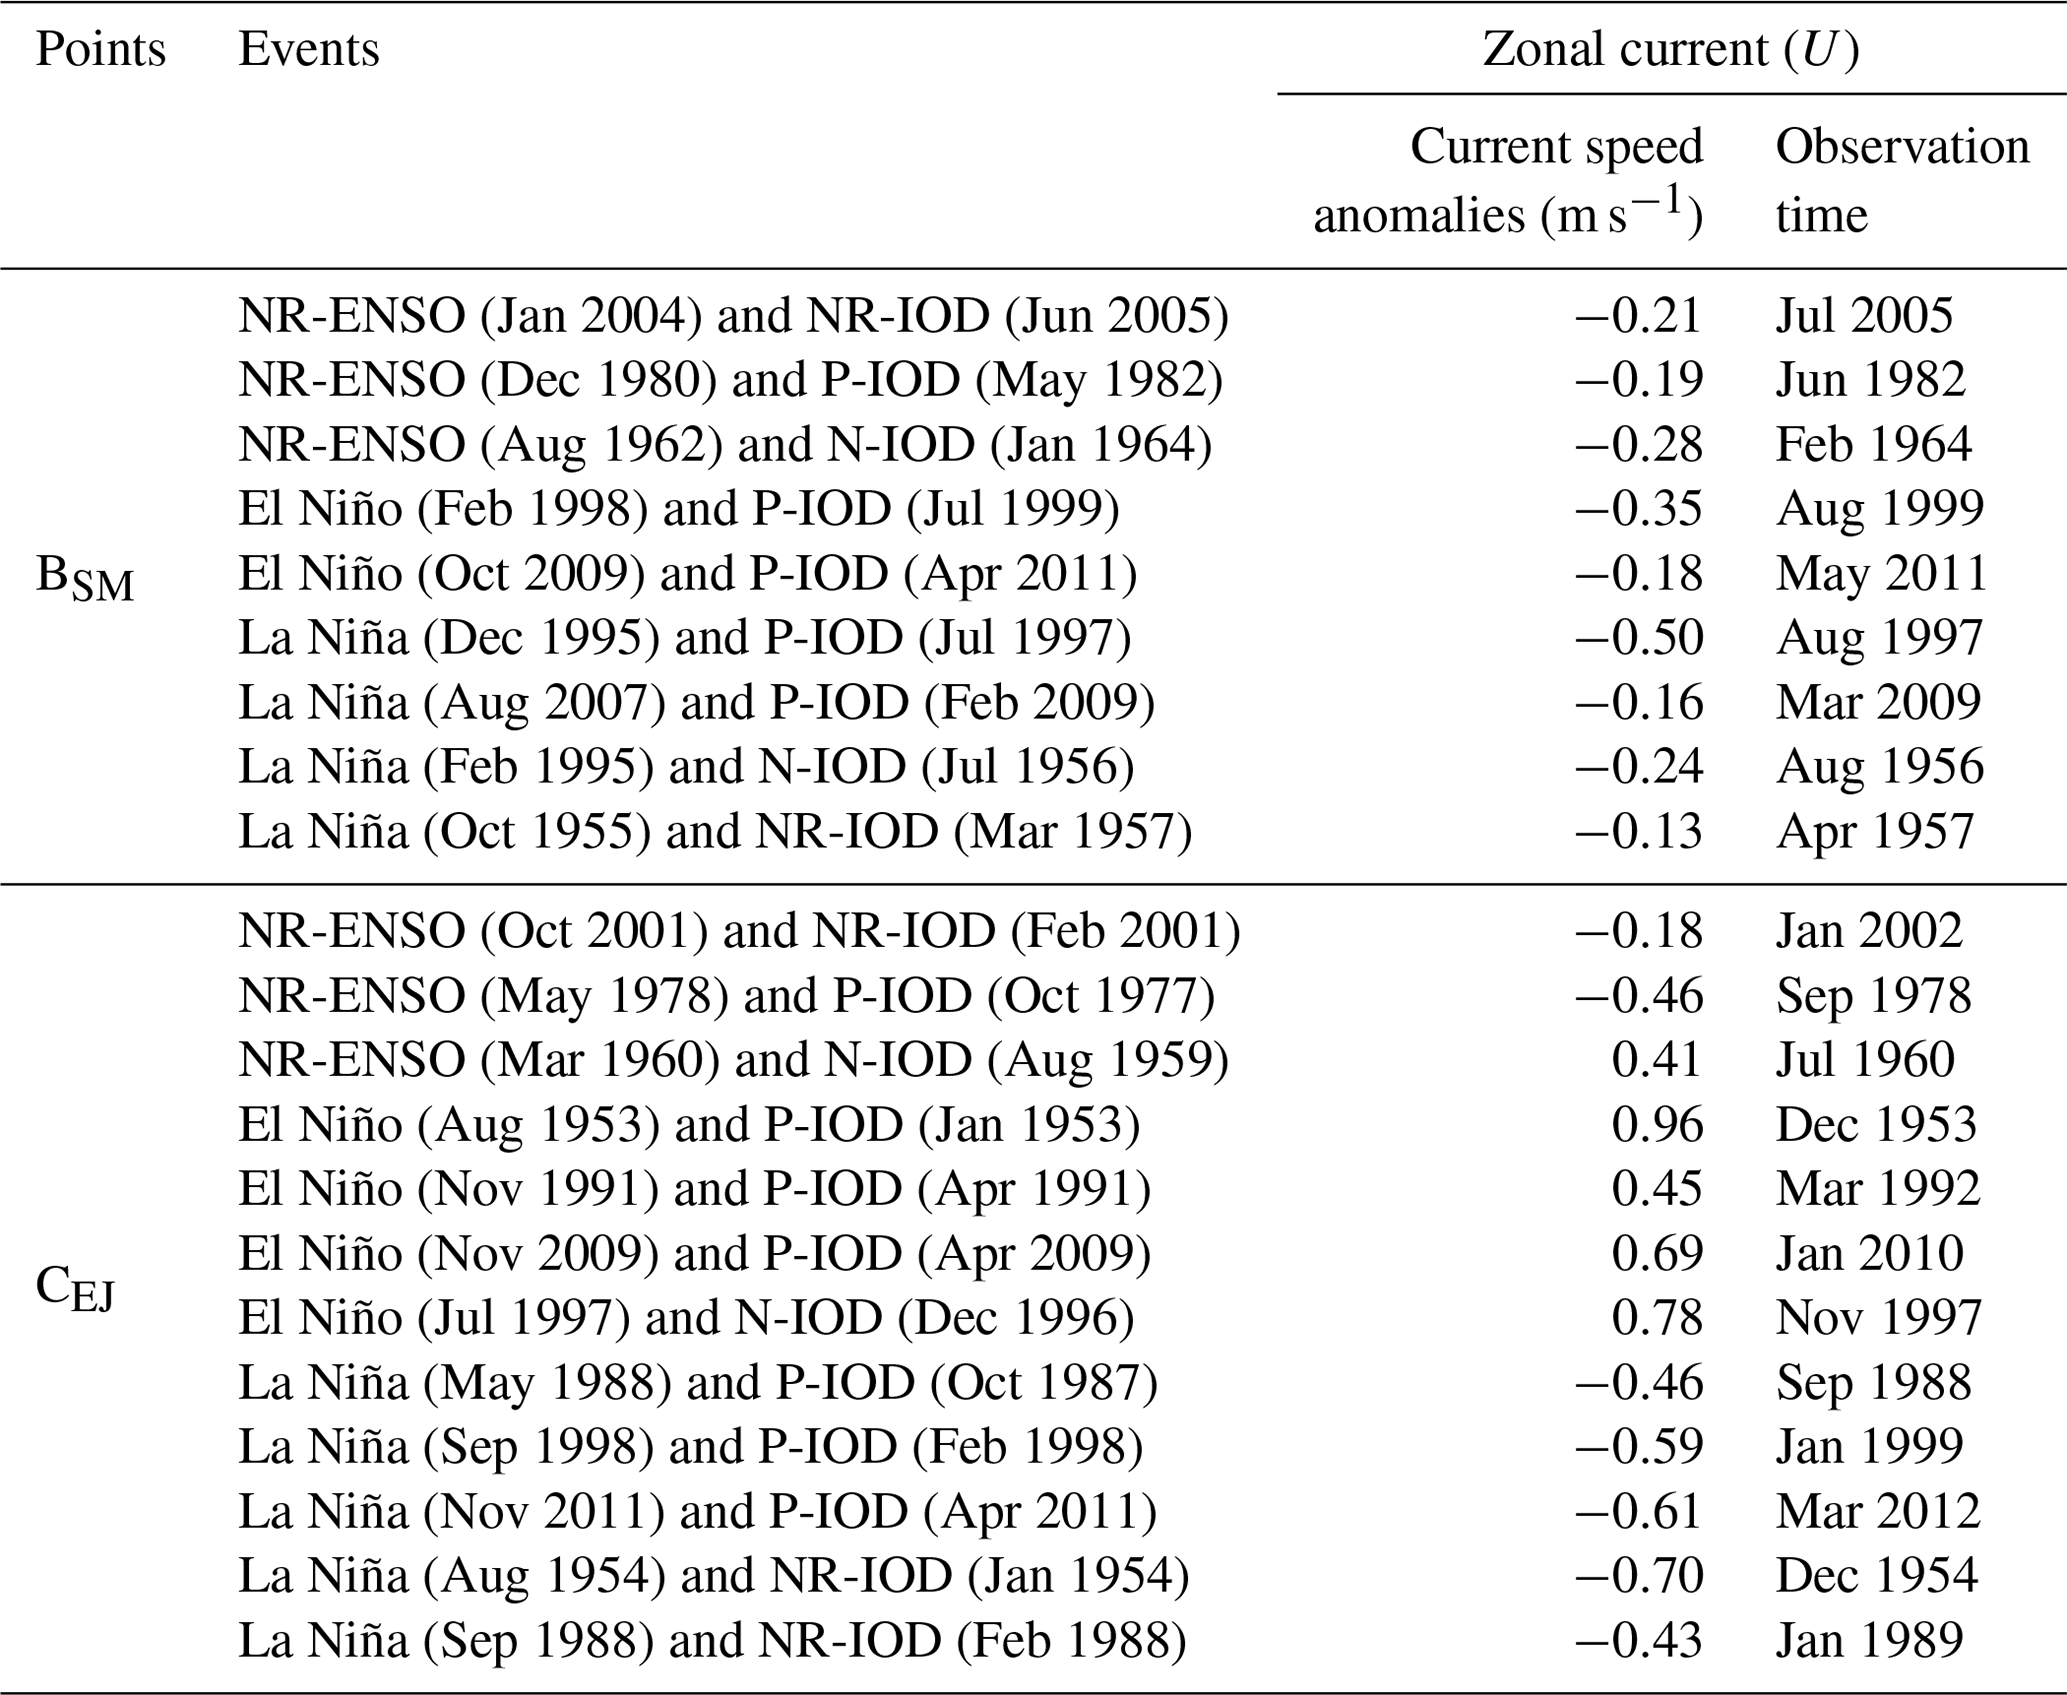
Table 5 lists extreme and neutral years and their concurrent events through 1950–2013. To further investigate interannual variation of zonal current, we summarized presence of major climate modes (ENSO and/or IOD) and the corresponding current anomalies at the points of BSM and CEJ (Table 6) based on the lagged correlation analyses in Table 4, the interannual variations of zonal current (Figs. 11g and 12g), and the ONI and DMI (Fig. 13). In Table 4, the ONI-U and DMI-U correlations are independent of IOD and of ENSO, respectively. Meanwhile, the current anomalies, which are attributed to the presence of major climate modes (ENSO and/or IOD) shown in the Table 6, could be forced by ENSO, IOD, or their combined effect. In this study, the amounts of the contribution values of ENSO and IOD or their combined effect on the current anomalies shown in the Table 6 are still unknown. Further studies are thus required to more quantitatively determine the contribution values of each of climate mode on zonal current variations in the study area as well as their possible teleconnection.
Table 5ENSO, IOD, and neutral events during the 1950–2013 period.
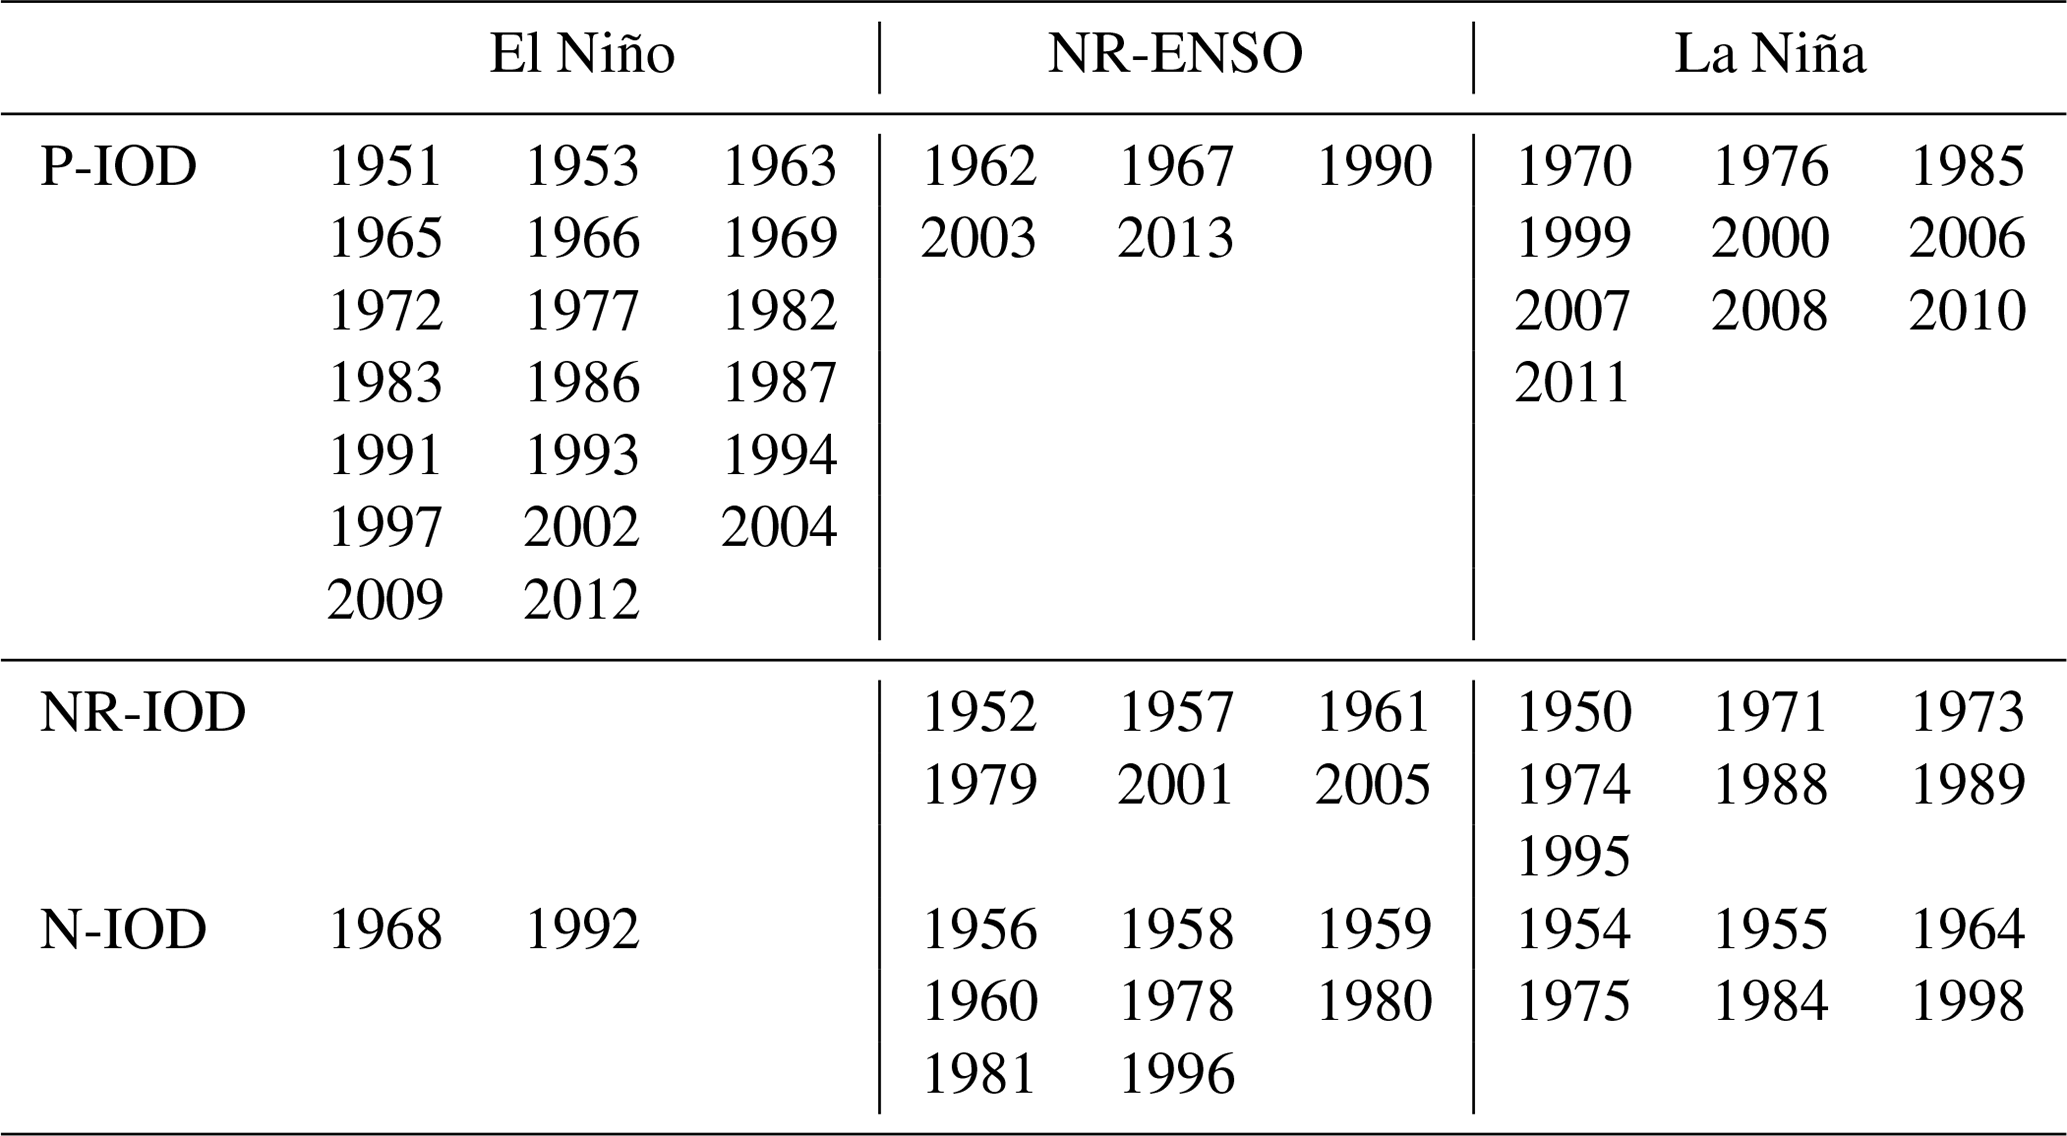
NR-ENSO is neutral ENSO (−0.5 ∘C < ONI < +0.5 ∘C). El Niño (ONI > +0.5 ∘C). La Niña (ONI < −0.5 ∘C). P-IOD is positive IOD (DMI > +0.36 ∘C). NR-IOD is neutral IOD (−0.36 ∘C < DMI < +0.36 ∘C). N-IOD is negative IOD (DMI < −0.36 ∘C). The classification of ENSO events is determined by ONI (http://www.ESRL.noaa.gov/, last access: 21 February 2021). Meanwhile, DMI is used for the classification of IOD events with criteria according to Yuan et al. (2008).
In addition to the lagged correlation analysis (Table 4), partial correlation analysis was also conducted since the IOD tends to co-occur with ENSO. Table 7 shows the partial correlation coefficients between zonal currents at 30 m on an interannual timescale for both ONI and DMI. As for ONI, the currents revealed significant positive correlations at CEJ during all monsoon seasons. This positive correlation suggests that El Niño (La Niña) events caused an eastward (westward) anomaly of currents at this point. Meanwhile, the partial correlation between the currents and the DMI showed significant negative correlation at BSM, in which it occurred only during the SE monsoon (JJA), as shown in Table 7. This negative correlation indicates that an eastward (westward) anomaly of the currents was induced by negative (positive) IOD. The results of the partial correlation analysis confirm and complement the previous findings in Table 4 that ENSO mainly contributed to the zonal current variability at CEJ in DJF, MAM, JJA, and SON, whereas the IOD had a significant influence on the variability of the current at BSM and only in JJA. In this present study, however, determining the causes of the influence of IOD on the current variability at BSM only in JJA is still a work in progress. Further research is necessary to explain the dynamical links of this matter. Additionally, the last mode (Figs. 10h, 11h, and 12h) represents long-term variation and trends, which may be associated with long-term internal variability within the Indian Ocean or remote forcing from the Pacific Ocean, as will be discussed in detail in a future paper.
3.3.3 Relationship of the zonal current variations at AWJ, BSM, and CEJ to both remote and local wind forcings
To confirm possible influences of wind forcings on dominant variations of zonal current at AWJ, BSM, and CEJ, we have calculated the correlation between them. In this study, it is found that the zonal currents at AWJ (close to the shore) have peak energy over a semiannual period (0.140 power per year; Table 3). The semiannual variations of the zonal current at AWJ show the presence of an eastward anomaly of the zonal current during MAM and SON, which may be associated with Kelvin waves forced by winds over the equatorial Indian Ocean (Wyrtki, 1973; Quadfasel and Cresswell, 1992; Sprintall et al., 1999, 2000, 2010). Furthermore, we have calculated the correlation between zonal currents in the upper layer (30 m) at AWJ and zonal winds for the semiannual signals extracted using the EEMD method (Fig. 15). The 30 m upper-layer flows at AWJ show a strong positive correlation with the zonal winds over the equatorial Indian Ocean, with the winds leading the current by approximately 1 month. The positive correlation indicates that the flows are to the east when the winds blow from the west to the east and vice versa for the easterly wind. The 1-month lag between the flows at AWJ and the zonal winds in the equatorial Indian Ocean is in agreement with the expected arrival time of Kelvin waves at this point, suggesting that it is of about 18–35 d, with phase speeds ranging from 1.5 to 2.9 m s−1 (e.g., Sprintall et al., 2000; Syamsudin et al., 2004; Iskandar et al., 2005). Interestingly, there is also a weaker positive correlation between the 30 m upper-layer flows at AWJ at a lag of about 1 month and zonal trade winds in the western equatorial Pacific Ocean (WEPO) at a semiannual timescale, indicating that a strengthening (weakening) of easterly trade winds over the WEPO is favorable for anomalous westward (eastward) currents at AWJ. The strengthening of easterly trade winds over the WEPO will increase the sea level in the northern waters of West Papua and New Guinea, enhancing the Pacific-to-Indian pressure gradient across the Indonesian seas and forcing strengthened ITF transport. Since the currents at AWJ are strongly correlated to the ITF (Table 1), it is suggested that this possible dynamic could result in anomalous westward currents at AWJ and vice versa for the weakening winds over the WEPO.
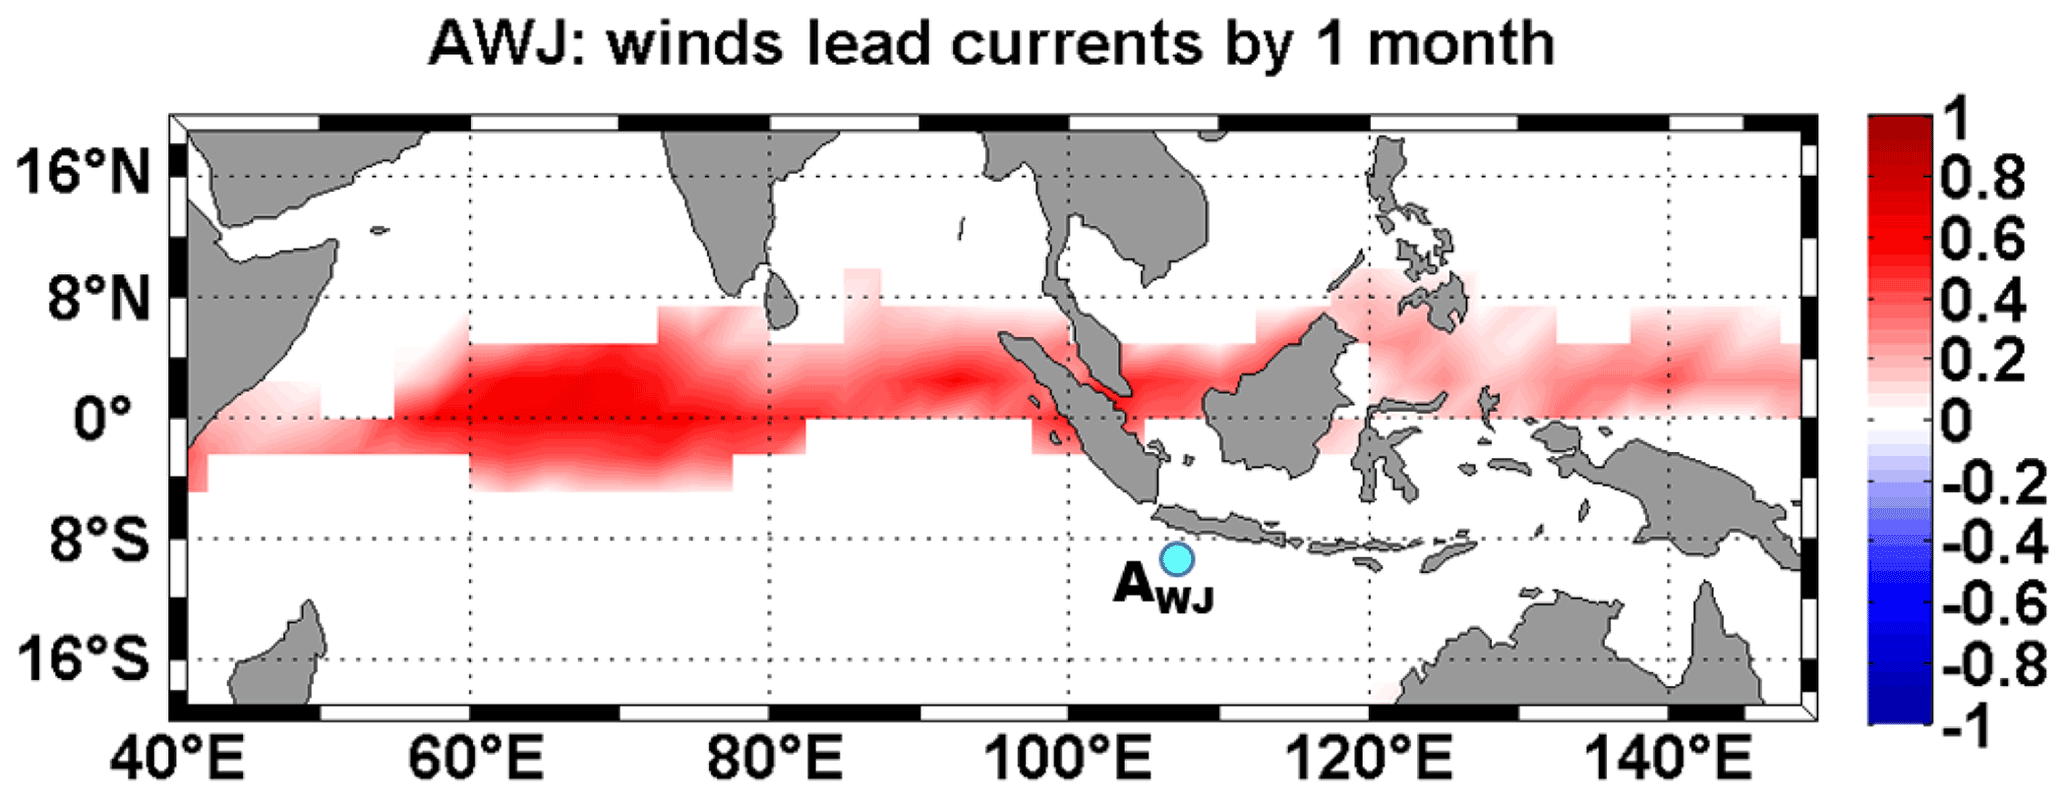
Figure 15A correlation map between zonal wind and zonal currents (at 30 m) at AWJ for the semiannual signals extracted using the EEMD method. The 95 % significance level is approximately ± 0.07.
Semiannual (0.135 power per year) signal of current variations is also dominant at BSM, but it is weaker than that at AWJ. In addition, there is pronounced interannual (0.012 power per year) variation of the zonal current at BSM (Table 3 and Fig. 11g), in which IOD is most influential in forcing interannual variation of currents at this point (at 30 m), as shown in Table 4. Like at AWJ, we also look for the relationships between the upper-layer flow (30 m) at BSM and the zonal winds but for the interannual signal obtained using the EEMD method (Fig. 16). At an interannual timescale, the 30 m upper-layer flows at BSM show a strong positive correlation with the zonal winds over the eastern tropical Indian Ocean, in which the response of the flows to the zonal winds are relatively instantaneously at a lag of about 1 month (Fig. 16). The location of the zonal winds affecting interannual variations in the upper-layer flows at BSM is in accord with the eastern pole region of IOD (10–0∘ S, 90–110∘ E; Saji et al., 1999).
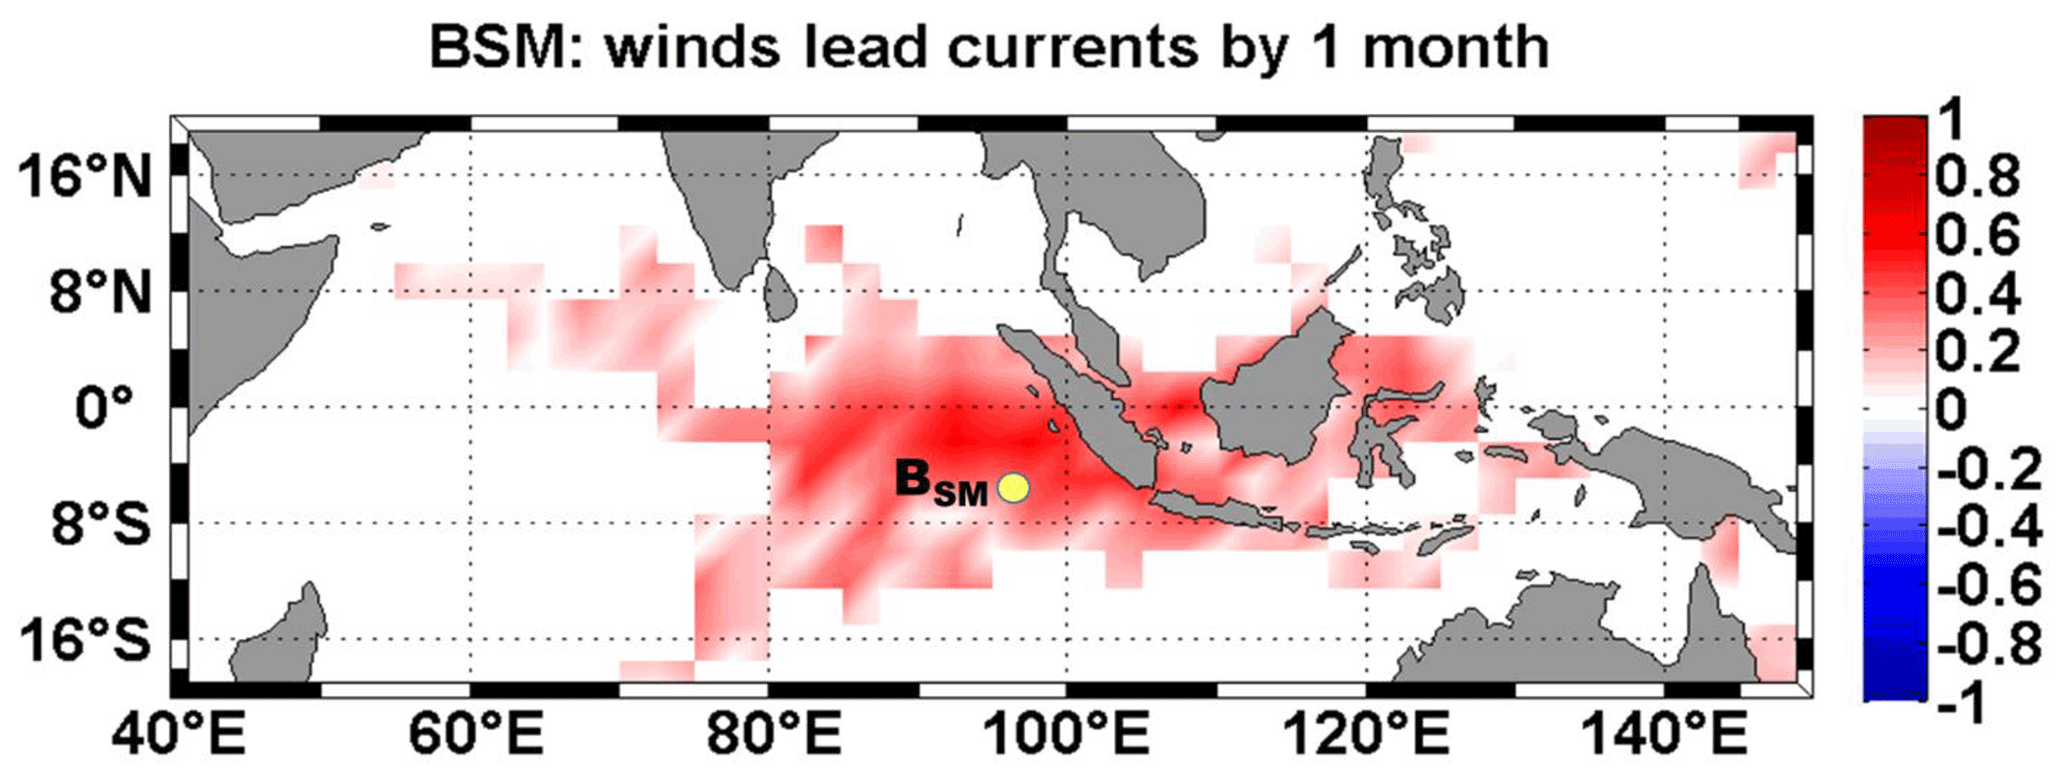
Figure 16The same as Fig. 15 but at BSM and for interannual signal.
Furthermore, as already explained, the zonal current variability at CEJ (close to the exits of the ITF) is dominated by an interannual (0.017 power per year) signal where the influence of ENSO is strongest at this point at depth of 30 m (Table 4). To enhance our understanding of the possible relationship of zonal currents at CEJ to wind forcings at an interannual timescale, we have also calculated the correlation between the upper-layer flow (30 m) at CEJ and the zonal winds, particularly in the Pacific Ocean. Like at BSM, the interannual signals of both flows and winds are extracted using the EEMD method. At an interannual timescale, the flows at CEJ at 30 m show a significant positive correlation with the local winds and the remote winds over the equatorial Pacific Ocean, in which the response of the flows to the zonal winds are about 4 to 6 months. In addition, we also found that the 4-month lag signal is stronger than the signals with the 5 to 6 months of lag. Figure 17 shows a correlation map between the Pacific winds and the currents at CEJ in the case of a 4-month lag.
Table 6Summary of major climate modes (ENSO and/or IOD) and the corresponding current anomalies through 1950–2013.
NR-ENSO is neutral ENSO, P-IOD is positive IOD, NR-IOD is neutral IOD, N-IOD is negative IOD. The classification criteria for ENSO and IOD events can be seen in Table 5.
Table 7Partial correlation coefficients between zonal currents at 30 m on an interannual timescale for both ONI and DMI. Only values above the 95 % significance level are shown.
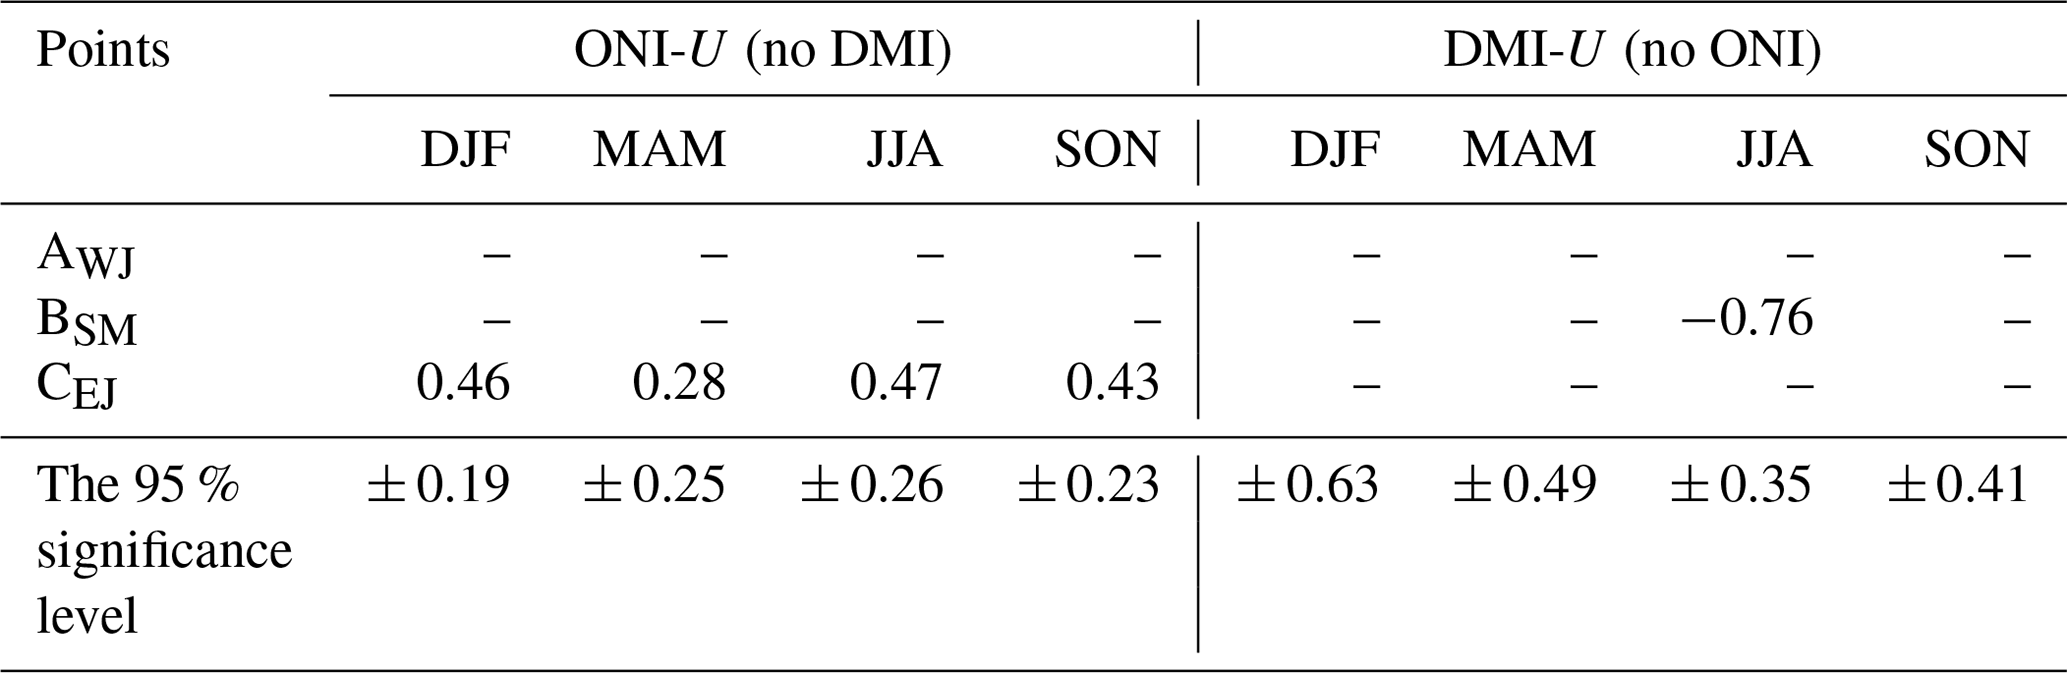
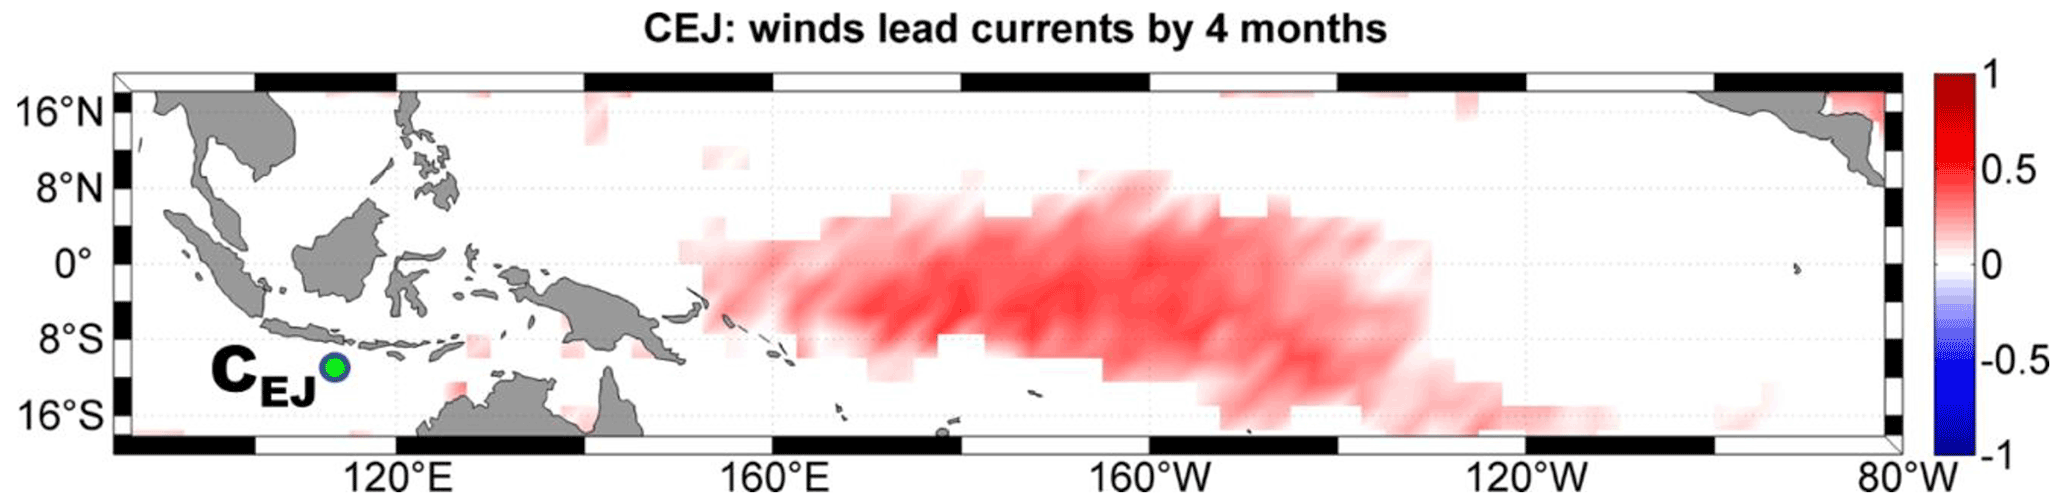
Figure 17The same as Fig. 15 but at CEJ and for interannual signal.
A previous study conducted by Wijffels and Meyers (2004) showed that the variability in the ITF region was associated with Kelvin and Rossby waves originating in the Indian and Pacific Oceans, respectively. They have revealed the pathways for equatorial Pacific wind energy traveling down the Papuan–Australian shelf break and radiating westward-propagating Rossby Waves into the Banda Sea and southeastern Indian Ocean (their Fig. 20). Hence, there is a contribution from the westward-propagating Rossby waves to the ITF variability inside the Indonesian seas or at the ITF exit regions (the Ombai and Lombok straits and the Timor Passage), which lead into the SETIO and the western coast of Sumatra and southern coast of Java. Our simulation (Fig. 2) clearly shows that ITF flowing from the exit passages of Indonesian seas (Lombok, Ombai, and Timor passages) feeds into the SETIO region. Moreover, Wijffels and Meyers (2004) have computed the remotely driven Pacific Rossby wave speeds as a function of latitude. The phase speeds have been compared with the theoretical Rossby wave speeds based on the atlas of Chelton et al. (1998). In this study, we have estimated the travel time of the westward-propagating Rossby waves excited by the wind anomalies in the central and western Pacific to the SETIO, especially at point CEJ, based on the pathways for the Pacific signals introduced by Wijffels and Meyers (2004). In general, it was found that the equatorial Pacific signals around 130∘ W took approximately 3.01 months to arrive at CEJ based on the mean phase speed of about 0.2 cm s−1 taken from Wijffels and Meyers (2004). This travel time estimation was within the range of the 4-month lags between the flows at CEJ and the Pacific winds derived from the lagged correlation analysis in Fig. 17.
Basic features of zonal currents and their temporal variability in the SETIO region adjacent to the southern coasts of Sumatra and Java have been studied using global HYCOM output over the course of 1950–2013. There are peculiar features of zonal currents in the coastal (the SJC) region, offshore (the ITF–SEC) region, and the transition zone between coastal and offshore regions of the SETIO. In general, surface zonal currents in Transect A (the SJC region), especially along the southern coasts of Sumatra and Java (98–114∘ E), show seasonal characteristics, i.e., they are eastward (westward) during DJF (JJA). Moreover, the eastward-flowing currents are enhanced during MAM and SON, and this is associated with the propagation of coastal Kelvin waves. On the other hand, westward currents are dominant along Transect C (the ITF–SEC region). Meanwhile, although westward currents are quite dominant along Transect B (the transition zone between the SJC region and ITF–SEC region), eastward currents are also present, especially at longitudes 95–107∘ E.
In the period of 1950 through 2013, the mean (climatological) current velocity of SJC on Transect A is dominantly eastward. We found that both remote and local wind forcings and seasonal conditions are necessary to explain the current variability in the study area. During JJA, the strength of climatological eastward SJC reduced, and the SJC in the upper 100 m along the southern coast of Java, at a certain period of time, flowed westward in response to the prevailing southeasterly local winds during those months. At the depth 100 m, there is a maximum westward current at AWJ during DJF with a velocity of about 0.1 m s−1, wherein the current at AWJ shows high correlation with the subsurface (200 m) maximum ITF in the southern Ombai Strait (remote forcing), whereas its correlation with the NW local wind is weak. Otherwise, it is found that the NW zonal wind is more influential in forcing variation in zonal current at AEJ than the ITF. Therefore, it is suggested that the westward current simulated at AWJ at 100 m during DJF is ITF related, whereas that at AEJ at 100 m is relatively NW zonal wind related.
Moreover, it is found that the average (climatological) current at BSM is eastward, while at points BWJ and BEJ it is westward, suggesting that the mean eastward current at BSM is influenced by tropical current systems in the Indian Ocean, such as the ECC, SWMC, and Wyrtki Jet, whereas the mean westward currents at the points BWJ and BEJ are more dominated by the ITF. In contrast, current characteristics on Transect C (offshore region) generally show similarities at all points (CSM, CWJ, and CEJ), where the current along this transect flows westward throughout the year, confirming that Transect C is the SEC or ITF region. Seasonal variation in the westward current on the Transect C agrees well with that of ITF in Lombok Strait, Timor Passage, and through the three exit passages (the total ITF through the Lombok and Ombai straits and Timor Passage), in which during JJA the flow is stronger than during DJF.
The EOF1 mode of zonal current across the three meridional sections (EJ, WJ, and SM) clearly shows unique features of zonal currents between nearshore and offshore regions in the sections. In Sections EJ and WJ, the vertical structure of EOF1 is characterized by one-layer flow. In the nearshore area of Section EJ, the vertical structure of EOF1 displays a gradual decrease in speed from the surface to 800 m depth, whereas in the transition and the offshore areas the flow velocities decline more rapidly with depth, reducing to nearly zero at depths of about 500 and 300 m, respectively. Meanwhile, in Section WJ, the one-layer flow of the vertical structure of EOF1 shows a unidirectional vertical structure that gradually decreases from the surface to a depth of ∼ 450 m in all areas. On the contrary, in the nearshore and transition regions of Section SM, it is marked by two-layer flow, in which the velocity reversal between the two types of flow takes place at depths of approximately 100 and 200 m, respectively. Meanwhile, in the offshore area of Section SM, the vertical structure of EOF1 exhibits a unidirectional flow from the surface to a depth of about 500 m.
In this study, the predominant variations in content of the zonal current anomalies in the region is quantitatively identified, varying from intraseasonal to interannual timescales. The analysis indicates that the zonal currents at AWJ (close to the shore) have peak energies that are successively dominated by semiannual, intraseasonal, and annual periods, and it can be seen that the interannual period is weaker than the others at this point. Moreover, although semiannual and intraseasonal variations are dominant at BSM (close to the center of the eastern pole of the IOD), there is pronounced interannual variation in the zonal current at this point. In contrast, the zonal current variability at CEJ (close to the major exit passages of the ITF) is dominated by interannual signal. Nevertheless, in addition to the interannual signal, the power spectrum analysis shows that intraseasonal variability of the zonal current (SEC) at CEJ is also prominent. The lagged correlation analysis shows that ENSO seems to have the strongest influence on the zonal current variability at CEJ, with the zonal current lagging the ENSO by 4 months. Meanwhile, the IOD is most dominant in controlling interannual fluctuation of the zonal current at BSM, with the IOD leading the zonal currents by 1 month. Furthermore, based on the partial correlation analysis, it has been revealed that ENSO contributes to the zonal current variation at CEJ in all monsoon seasons (DJF, MAM, JJA, and SON), while the IOD plays a significant role in controlling the variation of current at BSM only in JJA. In this study, the dynamical links that cause the influence of IOD on the current variability at BSM only in JJA are still not known. Therefore, further study is essential to elucidate the physical mechanisms responsible for this topic. Here, the proportion calculation of contribution of each EEMD mode to the EOF1 showed that the order of each mode's contribution from largest to smallest at AWJ and BSM is as follows: intraseasonal, semiannual, annual, interannual, and long-term signals. Interestingly, the contribution of long-term signal at CEJ is larger than the interannual and annual signals. However, the detailed analysis of long-term signal is not within the scope of this research and can be considered in a future study. Moreover, future work, including detailing the forcing mechanisms, investigating decadal variability and determining the cause of the long-term signals, will be necessary in order to gain a better understanding of these interesting topics.
The HYCOM zonal currents used in this study are freely available at the Research Group of Oceanography-ITB website https://www.oceanography.fitb.itb.ac.id/member/nsn/ (last access: 5 June 2020), simulated and already published by Hanifah and Ningsih (2016).
NSN formulated research goals and aims, developed the methodology, conducted the investigation process, designed the model, and prepared the published work. SLS maintained the research data, prepared the data presentation, and drafted the initial manuscript. RDS supervised the research project and EEMD methodology. FH designed the model simulation and validated the model results.
The authors declare that they have no conflict of interest.
Publisher's note: Copernicus Publications remains neutral with regard to jurisdictional claims in published maps and institutional affiliations.
The authors would like to gratefully acknowledge data support from NOAA for providing the moored RAMA current, wind fields, and ONI; PODAAC for providing the OSCAR dataset; and JAMSTEC for producing the DMI. The authors are also grateful to INSTANT, a multi-national programme with Indonesia, Australia, France, Netherlands, and the USA, for distributing the INSTANT current. Moreover, we would like to acknowledge the support given by the Indonesian Ministry of Education, Culture, Research and Technology (Kemendikbudristek) for making the writing of this paper possible. Finally, we really appreciate the valuable suggestions, comments, and corrections from the anonymous reviewers.
This research has been supported by the Indonesian Ministry of Education, Culture, Research and Technology under the Basic Research Grant 2019–2021 (grant no. 2/E1/KP.PTNBH/2019, 2/E1/KP.PTNBH/2020, and 2/E1/KP.PTNBH/2021). Raden Dwi Susanto is supported by World Class Professor (WCP) Program 2018 managed by the Indonesian Ministry of Education and Culture (Kemendikbud) (grant no. 123.21/D2.3/KP/2018), the National Aeronautics and Space Administration (NASA) (grant no. 80NSSC18K0777 and NNX17AE79A) through the University of Maryland, and a Jet Propulsion Laboratory–NASA subcontract (grant no. 1554354).
This paper was edited by Viviane Menezes and reviewed by two anonymous referees.
Bray, N. A., Wijffels, S. E., Chong, J. C., Fieux, M., Hautala, S., Meyers, G., and Morawitz, W. M. L.: Characteristics of the Indo-Pacific throughflow in the Eastern Indian Ocean, Geophys. Res. Lett., 24, 2569–2572, 1997.
Chelton, D. B., de Szoeke, R. A., Schlax, M.G., El Naggar, K., and Siwertz, N.: Geographical variability of the first-baroclinic Rossby radius of deformation, J. Phys. Oceanogr., 28, 433–460, 1998.
Clark, C. O., Webster, P. J., and Cole, J. E.: Interdecadal variability of the relationship between the Indian Ocean zonal mode and East African coastal rainfall anomalies, J. Clim., 16, 548–554, 2003.
Codiga, D. L., Renourad, D. P., and Fincham, A.: Experiments on waves trapped over the continental slope and shelf in a continuously stratified rotating ocean, J. Mar. Res., 57, 585–612, https://doi.org/10.1357/002224099321549602, 1999.
Ding, X., Bassinot, F., Guichard, F., and Fang, N. Q.: Indonesian throughflow and monsoon activity records in the Timor Sea since the last glacial maximum, Mar. Micropaleontol., 101, 115–126, https://doi.org/10.1016/j.marmicro.2013.02.003, 2013.
Drushka, K., Sprintall, J., Gille, S., and Brodjonegoro, I.: Vertical structure of Kelvin waves in the Indonesian throughflow exit passages, J. Phys. Oceanogr., 40, 1965–1987, https://doi.org/10.1175/2010JPO4380.1, 2010.
Duan, Y., Liu, L., Han, G., Liu, H., Yu, W., Yang, G., Wang, H., Wang, H., Liu, Y., Zahid, and Waheed, H.: Anomalous behaviors of Wyrtki Jets in the equatorial Indian Ocean during 2013, Sci. Rep., 6, 1–7, https://doi.org/10.1038/srep29688, 2016.
Emery, W. J. and Thomson, R. E.: Data Analysis Methods in Physical Oceanography, Elsevier, New York, 2001.
Fang, G., Wang, Y., Wei, Z., Fang, Y., Qiao, F., and Hu, X.: Interocean circulation and heat and freshwater budgets of the South China Sea based on numerical model, Dynam. Atmos. Ocean, 47, 55–72, https://doi.org/10.1016/j.dynatmoce.2008.09.003, 2009.
Feng, M. and Wijffels, S.: Intraseasonal variability in the South Equatorial Current of the East Indian Ocean, J. Phys. Oceanogr., 32, 265–277, 2002.
Feng, M., Zhang, N., Liu, Q., and Wijffels, S.: The Indonesian throughflow, its variability and centennial change, Geosci. Lett., 5, 1–10, https://doi.org/10.1186/s40562-018-0102-2, 2018.
Ffield, A., Vranes, K., Gordon, A. L., Susanto, R. D., and Garzoli, S. L.: Temperature variability within Makassar Strait, Geophys. Res. Lett., 27, 237–240, 2000.
Fieux, M., Andrie, C., Delecluse, P., Ilahude, A. G., Kartavtseff, A., Mantisi, F., Molcard, R., and Swallow, J. C.: Measurements within the Pacific-Indian Ocean throughflow region, Deep-Sea Res., 41, 1091–1130, https://doi.org/10.1016/0967-0637(94)90020-5, 1994.
Fieux, M., Molcard, R., and Ilahude, A. G.: Geostrophic transport of the Pacific-Indian Oceans throughflow, J. Geophys. Res., 101, 12421–12432, https://doi.org/10.1029/95JC03566, 1996.
Gordon, A. L.: Interocean exchange of thermocline water, J. Geophys. Res., 91, 5037–5046, https://doi.org/10.1029/JC091iC04p05037, 1986.
Gordon, A. L. and Susanto, R. D.: Makassar Strait transport: initial estimate based on Arlindo result, Mar. Technol. Soc. J., 32, 34–45, 1999.
Gordon, A. L., Susanto, R. D., Ffield, A., Huber, B. A., Pranowo, W., and Wirasantosa, S.: Makassar Strait throughflow, 2004 to 2006, Geophys. Res. Lett., 35, L24605, https://doi.org/10.1029/2008GL036372, 2008.
Hallock, Z. R., Teague, W. J., and Jarosz, E.: Subinertial slope trapped waves in the northeastern Gulf of Mexico, J. Phys. Oceanogr., 39, 1474–1485, https://doi.org/10.1175/2009JPO3925.1, 2009.
Han, W., McCreary Jr., J. P., Anderson, D. L. T., and Mariano A. J.: Dynamics of the eastern surface jets in the equatorial Indian Ocean, J. Phys. Oceanogr., 29, 2191–2209, 1999.
Hannachi, A.: A Primer for EOF Analysis of Climate Data, Department of Meteorology, University of Reading, UK, 2004.
Hanifah, F. and Ningsih, N. S.: The characteristic of eddies in the Banda Sea, Adv. Appl. Fluid Mech., 19, 889–902, https://doi.org/10.17654/FM019040889, 2016.
Hu, S. and Sprintall, J.: Interannual variability of the Indonesian Throughflow: The salinity effect, J. Geophys. Res.-Ocean., 121, 2596–2615, https://doi.org/10.1002/2015JC011495, 2016.
Hu, S. and Sprintall, J.: Observed strengthening of interbasin exchange via the Indonesian seas due to rainfall intensification, Geophys. Res. Lett., 44, 1448–1456, https://doi.org/10.1002/2016GL072494, 2017.
Huang, N. E., Shen, Z., Long, S. R., Wu, M. C., Shih, H. H., Zheng, Q., Yen, N-C., Tung, C. C., and Liu, H. H.: The empirical mode decomposition and the Hilbert spectrum for nonlinear and non-stationary time series analysis, Roy. Soc., 454, 903–905, https://doi.org/10.1098/rspa.1998.0193, 1998.
Iskandar, I., Mardiansyah, W., Masumoto, Y., and Yamagata, T.: Intraseasonal Kelvin waves along the southern coast of Sumatra and Java, J. Geophys. Res., 110, C04013, https://doi.org/10.1029/2004JC002508, 2005.
Iskandar, I., Tozuka, T., Sasaki, H., Masumoto, Y., and Yamagata, T.: Intraseasonal variations of surface and subsurface currents off Java as simulated in a high-resolution ocean general circulation model, J. Geophys. Res., 111, C12015, https://doi.org/10.1029/2006JC003486, 2006.
Iskandar, I., Masumoto, Y., and Mizuno, K.: Subsurface equatorial zonal current in the eastern Indian Ocean, J. Geophys. Res., 114, C06005, https://doi.org/10.1029/2008JC005188, 2009.
Iskandar, I., Masumoto, Y., Mizuno, K., Sasaki, H., Affandi, A. K., Setiabudidaya, D., and Syamsuddin, F.: Coherent intraseasonal oceanic variations in the eastern equatorial Indian Ocean and in the Lombok and Ombai Straits from observations and a high-resolution OGCM, J. Geophys. Res.-Ocean., 119, 615–630, https://doi.org/10.1002/2013JC009592, 2014.
Jyoti, J., Swapna, P., Krishnan, R., and Naidu, C. V.: Pacific modulation of accelerated south Indian Ocean sea level rise during the early 21st Century, Clim. Dynam., 53, 4413–4432, https://doi.org/10.1007/s00382-019-04795-0, 2019.
Kantha, L. H. and Clayson, C. A.: Numerical Models of Oceans and Oceanic Processes, International Geophysics Series, 66, Academic Press, London, 2000.
Knox, R. A.: On a long series of measurements of Indian Ocean equatorial currents near Addu Atoll, Deep-Sea Res., 23, 211–221, https://doi.org/10.1016/0011-7471(76)91325-5, 1976.
Krishnamurthy, L. and Krishnamurthy, V.: Decadal and interannual variability of the Indian Ocean SST, Clim. Dynam., 46, 57–70, https://doi.org/10.1007/s00382-015-2568-3, 2016.
Liu, Q, Feng, M., Wang, D., and Wijffels, S.: Interannual variability of the Indonesian Throughflow transport: a revisit based on 30-year expendable bathythermograph data, J. Geophys. Res., 120, 8270–8282, https://doi.org/10.1002/2015JC011351, 2015.
Mann, M. E. and Lees, J. M.: Robust estimation of background noise and signal detection in climatic time series, Clim. Change, 33, 409–445, 1996.
McPhaden, M. J.: Variability in the central equatorial Indian Ocean, Part I: Ocean dynamics, J. Mar. Res., 40, 157–176, 1982.
McPhaden, M. J., Wang, Y., and Ravichandran, M.: Volume transports of the Wyrtki Jets and their relationship to the Indian Ocean dipole, J. Geophys. Res., 120, 5302–5317, https://doi.org/10.1002/2015JC010901, 2015.
Meng, X., Wu, D., Hu, R., and Lan, J.: The interdecadal variation of Indonesian throughflow and its mechanism, Chinese Sci Bull., 49, 2058–2067, https://doi.org/10.1360/03wd0540, 2004.
Metzger, E. J., Hurlburt, H. E, Xu, X., Shriver, J. F., Gordon, A. L., Sprintall, J., Susanto, R. D., and van Aken, H. M.: Simulated and observed circulation in the Indonesian Seas ∘ global HYCOM and the INSTANT Observation, Dynam. Atmos. Ocean., 50, 275–300, https://doi.org/10.1016/j.dynatmoce.2010.04.002, 2010.
Meyers, G.: Variation of Indonesian throughflow and the El Niño Southern Oscillation, J. Geophys. Res., 101, 12,255–12,263. https://doi.org/10.1029/95JC03729, 1996.
Murray, S. P., and Arief, D.: Throughflow into the Indian Ocean through the Lombok Strait, January 1985–January 1986, Nat., 333, 444–447, 1988.
Potemra, J. T.: Seasonal variations of upper ocean transport from the Pacific to the Indian Ocean via Indonesian straits, J. Phys. Oceanogr., 29, 2930–2944, 1999.
Pujiana, K., Gordon, A. L., and Sprintall, J.: Intraseasonal Kelvin wave in Makassar Strait, J. Geophys. Res., 40, 2023–2034, https://doi.org/10.1002/jgrc.20069, 2013.
Pujiana, K., McPhaden, M. J., Gordon, A. L., and Napitu, A.: Unprecedented response of Indonesian Throughflow to anomalous Indo-Pacific climatic forcing in 2016, J. Geophys. Res.-Ocean., 124, 3737–3754, https://doi.org/10.1029/2018JC014574, 2019.
Qiu, Y., Li, L., and Yu, W.: Behavior of the Wyrtki Jet observed with surface drifting buoys and satellite altimeter, Geophys. Res. Lett., 36, 120–131, https://doi.org/10.1029/2009GL039120, 2009.
Qu, T. and Meyers, G.: Seasonal characteristics of circulation in the southeastern tropical Indian Ocean, J. Phys. Oceanogr., 35, 255–267, https://doi.org/10.1175/JPO-2682.1, 2005.
Quadfasel, D. and Cresswell, G. R.: A note on seasonal variability of the South Java Current, J. Geophys. Res., 97, 3685–3688, https://doi.org/10.1029/91JC03056, 1992.
Saji N. H., Goswani, B. N., Vinayachandran, P. N., and Yamagata, T.: A dipole mode in the tropical Indian Ocean, Nature, 401, 360–363, https://doi.org/10.1038/43854, 1999.
Saji, N. H. and Yamagata, T.: Possible impacts of Indian Ocean dipole mode events on global climate, Clim. Res., 25, 151–169, https://doi.org/10.3354/cr025151, 2003.
Semtner, A. J. and Chervin, R. M.: Ocean general circulation from a global eddy-resolving model, J. Geophys. Res., 97, 5493–5550, https://doi.org/10.1029/92JC00095, 1992.
Shen, B.-W., Cheung, S., Wu, Y.-L., Li, J.-L. F., and Kao, D.: Parallel implementation of the ensemble empirical mode decomposition and its application for earth science data analysis, Comput. Sci. Eng., 19, 49–57, https://doi.org/10.1109/MCSE.2017.3421555, 2017.
Shinoda, T., Han, W., Metzger, E. J., and Hurlburt, H.: Seasonal variation of the Indonesian through flow in Makassar Strait, J. Phys. Oceanogr., 42, 1099–1123, https://doi.org/10.1175/JPO-D-11-0120.1, 2012.
Song, Q., Gordon, A. L., and Visbeck, M.: Spreading of the Indonesian throughflow in the Indian Ocean, J. Phys. Oceanogr., 34, 772–792, 2004.
Sprintall, J. and Révelard, J.: The Indonesian throughflow response to Indo-Pacific climate variability, J. Geophys. Res.-Ocean., 119, 1161–1175, https://doi.org/10.1002/2013JC009533, 2014.
Sprintall, J., Chong, J., Syamsudin, F., Morawitz, W., Hautala, S., Bray, N., and Wijffels, S.: Dynamics of the South Java Current in the Indo-Australian basin, Geophys. Res. Lett., 26, 2493–2496, https://doi.org/10.1029/1999GL002320, 1999.
Sprintall, J., Gordon, A. L., Murtugudde, R., and Susanto, R. D.: A semi-annual Indian Ocean forced Kelvin waves observed in the Indonesian Seas, May 1997, J. Geophys. Res., 105, 17217–17230, https://doi.org/10.1029/2000JC900065, 2000.
Sprintall, J., Wijffels, S. E., Molcard, R., and Jaya, I.: Direct estimates of the Indonesian throughflow entering the Indian Ocean: 2004–2006, J. Geophys. Res., 114, C07001, https://doi.org/10.1029/2008JC005257, 2009.
Sprintall, J., Wijffels, S. E., Molcard, R., and Jaya, I.: Direct evidence of the south Java current in Ombai Strait, Dynam. Atmos. Ocean., 50, 140–156, https://doi.org/10.1016/j.dynatmoce.2010.02.006, 2010.
Susanto, R. D. and Gordon, A. L.: Velocity and transport of the Makassar Strait throughflow, J. Geophys. Res., 110, C01005, https://doi.org/10.1029/2004JC002425, 2005.
Susanto, R. D. and Song, Y. T.: Indonesian throughflow proxy from satellite altimeters and gravimeters, J. Geophys. Res.-Ocean., 120, 2844–2855, https://doi.org/10.1002/2014JC010382, 2015.
Susanto, R. D., Gordon, A. L., Sprintall, J., and Herunadi, B.: Intraseasonal variability and tides in Makassar Strait, Geophys. Res. Lett., 27, 1499–1502, https://doi.org/10.1029/2000GL011414, 2000.
Susanto, R. D., Gordon, A. L., and Zheng, Q.: Upwelling along the coasts of Java and Sumatra and its relation to ENSO, Geophys. Res. Lett., 28, 1599–1602, https://doi.org/10.1029/2000GL011844, 2001.
Susanto, R. D., Ffield, A., Gordon, A. L., and Adi, T. R.: Variability of Indonesian throughflow within Makassar Strait, 2004–2009, J. Geophys. Res., 117, C09013, https://doi.org/10.1029/2012JC008096, 2012.
Susanto, R. D., Wei, Z., Adi, T. R., Zheng, Q., Fang, G., Bin, F., Supangat, A., Agustiadi, T., Li, S., Trenggono, M., and Setiawan, A.: Oceanography surrounding Krakatau Volcano in the Sunda Strait, Indonesia, Oceanography, 29, 228–237, https://doi.org/10.5670/oceanog.2016.31, 2016.
Syamsudin, F. and Kaneko, A.: Ocean variability along the southern coast of Java and Lesser Sunda Islands, J. Oceanogr., 69, 557–570, https://doi.org/10.1007/s10872-013-0192-6, 2013.
Syamsudin, F., Kaneko, A., and Haidvogel, D. B.: Numerical and observational estimates of Indian Ocean Kelvin wave intrusion into Lombok Strait, Geophys. Res. Lett., 31, L24307, https://doi.org/10.1029/2004GL021227, 2004.
Tomczak, M. and Godfrey, J. S.: Regional Oceanography: An Introduction, Pergamon Press, Oxford, 1994.
Wijffels, S. and Meyers, G.: An intersection of oceanic waveguides: variability in the Indonesian throughflow region, J. Phys. Oceanogr., 34, 1232–1253, 2004.
Wijffels, S., Sprintall, J., Fieux, M., and Bray, N.: The JADE and WOCE I10/IR6 throughflow sections in the southeast Indian Ocean, Part 1: water mass distribution and variability, Deep-Sea Res. Pt. II, 49, 1341–1362, https://doi.org/10.1016/S0967-0645(01)00155-2, 2002.
Wu, Z. and Huang, N. E.: Ensemble empirical mode decomposition: a noise-assisted data analysis method, Adv. Adapt. Data Anal., 1, 1–41, https://doi.org/10.1142/S1793536909000047, 2009.
Wyrtki, K.: An equatorial jet in the Indian Ocean, Sciences, 181, 262–264, 1973.
Wyrtki, K.: Indonesian throughflow and the associated pressure gradient, J. Geophys. Res., 92, 12941–12946, 1987.
Yamagami, Y. and Tozuka, T.: Interannual variability of South Equatorial Current bifurcation and western boundary currents along the Madagascar coast, J. Geophys. Res.-Ocean., 120, 8551–8570, https://doi.org/10.1002/2015JC011069, 2015.
Yuan, Y., Chan, C. L. J., Wen, Z., and Chongyin, L.: Decadal and interannual variability of the Indian Ocean dipole, Adv. Atmos. Sci., 25, 856–866, https://doi.org/10.1007/s00376-008-0856-0, 2008.
Zhang, N., Feng, M., Du, Y., Lan, J., and Wijffels, S. E.: Seasonal and interannual variations of mixed layer salinity in the southeast tropical Indian Ocean, J. Geophys. Res.-Ocean. 121, 4716–4731, https://doi.org/10.1002/2016JC011854, 2016.