the Creative Commons Attribution 4.0 License.
the Creative Commons Attribution 4.0 License.
 | 27 Nov 2020
Seasonal variability of the Arabian Sea intermediate circulation and its impact on seasonal changes of the upper oxygen minimum zone
Henrike Schmidt
Rena Czeschel
Martin Visbeck
Oxygen minimum zones (OMZs) in the open ocean occur below the surface in regions of weak ventilation and high biological productivity with associated sinking organic matter. Very low levels of dissolved oxygen alter biogeochemical cycles and significantly affect marine life. One of the most intense though poorly understood OMZs in the world ocean is located in the Arabian Sea between 300 and 1000 m of depth. An improved understanding of the physical processes that have an impact on the OMZ in the Arabian Sea is expected to increase the reliability of assessments of its future development.
This study uses reanalysis velocity fields from the ocean model HYCOM (Hybrid Coordinate Ocean Model), which are verified with observational data, to investigate advective pathways of Lagrangian particles into the Arabian Sea OMZ at intermediate depths between 200 and 800 m.
In the eastern basin, the vertical expansion of the OMZ is strongest during the winter monsoon, revealing a core thickness 1000 m deep and oxygen values below 5 µmol kg−1. The minimum oxygen concentration might be favoured by a maximum water mass advection that follows the main advective pathway of Lagrangian particles along the perimeter of the basin into the eastern basin of the Arabian Sea during the winter monsoon. These water masses pass regions of high primary production and respiration, contributing to the transport of low-oxygenated water into the eastern part of the OMZ.
The maximum oxygen concentration in the western basin of the Arabian Sea in May coincides with a maximum southward water mass advection in the western basin during the spring intermonsoon, supplying the western core of the OMZ with high-oxygenated water.
The maximum oxygen concentration in the eastern basin of the Arabian Sea in May might be associated with the northward inflow of water across 10∘ N into the Arabian Sea, which is highest during the spring intermonsoon.
The Red Sea outflow of advective particles into the western and eastern basin starts during the summer monsoon associated with the northeastward current during the summer monsoon. On the other hand, waters from the Persian Gulf are advected with little variation on seasonal timescales.
As the weak seasonal cycle of oxygen concentration in the eastern and western basin can be explained by seasonally changing advection of water masses at intermediate depths into the Arabian Sea OMZ (ASOMZ), the simplified backward-trajectory approach seems to be a good method for prediction of the seasonality of advective pathways of Lagrangian particles into the ASOMZ.
- Article
(6581 KB) - Full-text XML
-
Supplement
(4093 KB) - BibTeX
- EndNote


The oxygen concentration below the permanent thermocline in the ocean is a result of the often complex, long, and modulated transport of oxygen from the surface mixed layer into the ocean interior (ventilation) and the local consumption of oxygen, mainly by microbial respiration of sinking organic matter due to biological productivity. Regions of sluggish ventilation can be found in all ocean basins, e.g. in the eastern parts of the tropical Pacific and Atlantic Ocean southeast and northeast of the subtropical gyre circulation (Luyten et al., 1983) and in the northern Indian Ocean. The northern Indian Ocean is as special case, since the limited poleward extension results in a lack of ventilation from the north. Weak ventilation combined with high biological production in upwelling regions and thus high respiration consequently results in very low levels of dissolved oxygen below the surface (Stramma et al., 2008; Gilly et al., 2013). These regions, so-called open-ocean oxygen minimum zones (OMZs), are characterized by low oxygen concentrations spanning a depth range of about 200–700 m (e.g. Karstensen et al. 2008).
It is well established that OMZs affect marine biogeochemical processes such as the global carbon and nutrient cycles (Bange et al., 2005; Naqvi et al., 2006). Conditions in nearly completely oxygen-depleted upwelling regions favour denitrification, which enhances production and release of climate-relevant trace gases to the atmosphere (Naqvi et al., 2010; Shenoy et al., 2012). Moreover, OMZs are avoided by higher trophic marine life, which depends on oxygen availability. Thus, they become a respiratory barrier that effects the ecosystem structure and limits suitable habitats (Levin et al., 2009; Stramma et al., 2012; Resplandy et al., 2012).
Observations as well as climate-change-forced global and regional models show a global trend towards decreasing oxygen levels, spatial expansion, and intensification of OMZs during the last decades with regional variations (Stramma et al., 2008, 2010; Keeling et al., 2010; Diaz and Rosenberg, 2008). Declining oxygen is anticipated to further intensify in response to global warming (Keeling et al., 2010; Schmidtko et al., 2017), which affects changes in ventilation, stratification, and solubility as well as eutrophication, causing microbial respiration (Diaz and Rosenberg, 2008; Keeling et al., 2010; Breitburg et al., 2018). Therefore, deoxygenation has become another major climate-change-induced stressor affecting the marine ecosystem, in addition to warming and acidification. Deoxygenation evolves into an important indicator for a changing oceanic environment.
Despite a missing precise threshold at which macro-organisms experience low-oxygen-induced stress or suffocate, or at which level chemical cycles switch to alternative pathways, there is community consensus around four oxygen regimes separated by approximate thresholds. The boundary between oxic and hypoxic conditions is defined at about 60 µmol kg−1 (Gray et al., 2002; Keeling et al., 2010). Regimes are termed suboxic if the oxygen concentration drops below 10 µmol kg−1(Keeling et al., 2010) and nitrate-involved respiration begins (Bange et al., 2005). Regions are called anoxic when dissolved oxygen is nearly depleted and sulfate reduction is the dominant respiratory process (Naqvi et al., 2010).
In this study we focus on the Arabian Sea OMZ (ASOMZ). It has the most limited horizontal extent of all open-ocean OMZs but is one of the most intense OMZs based on the largest vertical extent of hypoxic water (Kamykowski and Zentara, 1990) as well as on a significant core thickness, with suboxic conditions of oxygen concentrations typically around 3 µmol kg−1 (Rao et al., 1994). Observations reveal an intensification of the northern part of the ASOMZ over the period of the last 3 (Queste et al., 2018) to 5 decades (Ito et al., 2017) and a shoaling of the hypoxic boundary in the Sea of Oman (Piontkovski and Al-Oufi, 2015). The expansion of the ASOMZ is accompanied by declining sardine landings and an increase in fish kill incidents along the Omani coast (Piontkovski and Queste, 2016). Further expansion of the ASOMZ might have dramatic consequences on marine habitats and ecosystems (Keeling et al., 2010; Stramma et al., 2012). Hence, the food security and livelihoods of one of the most populous regions on earth – about 25 % of the world's population lives in the Indian Ocean rim countries – would be strongly affected (Breitburg et al., 2018). To understand ocean–climate interactions it is necessary to advance knowledge about the factors that impact the ventilation of the pronounced ASOMZ such as water mass advection and large-scale circulation.
While the circulation of the upper ocean is well known from drifter data (Shenoi et al., 1999) and satellite altimetry (Beal et al., 2013), precise subsurface ventilation pathways of water masses entering the AS beneath the surface layer are more uncertain in detail due to a lack of observational data (McCreary et al., 2013) and complex interactions with the monsoon cycles. One unique difference of the Indian Ocean OMZs compared to the other ocean basins that host OMZs is the fact that the upper layer of the Indian Ocean in general and the Arabian Sea (AS) in particular is strongly impacted by the Asian monsoon system, resulting in a seasonal reversal of all boundary currents and associated ocean ventilation patterns. Monsoonal wind forcing enabled by the land boundary in the north shifts from southwest winds during the summer monsoon, causing strong upwelling off the coasts of Somalia and Oman, to northeast winds during the winter monsoon, driving downwelling circulation (Schott and McCreary, 2001). The seasonal changes significantly influence biogeochemical cycles, biological activity, and ecosystem response (Hood et al., 2009; Resplandy et al., 2012; Brewin et al., 2012; Wang et al., 2014).
Ventilation of the ASOMZ is facilitated by three major intermediate source water masses. Oxygenated Indian Central Water (ICW) enters the AS at intermediate depth (200–500 m; Shenoy et al., 2020) from the south (Fig. 1). High-salinity Persian Gulf Water (PGW) enters the AS just beneath the thermocline in the north, spreading southward and along the perimeter of the basin (Prasad et al., 2001). Low-salinity but denser Red Sea Water (RSW) enters the AS at between 500 and 800 m and spreads across the basin (Beal et al., 2000; Shankar et al., 2005).
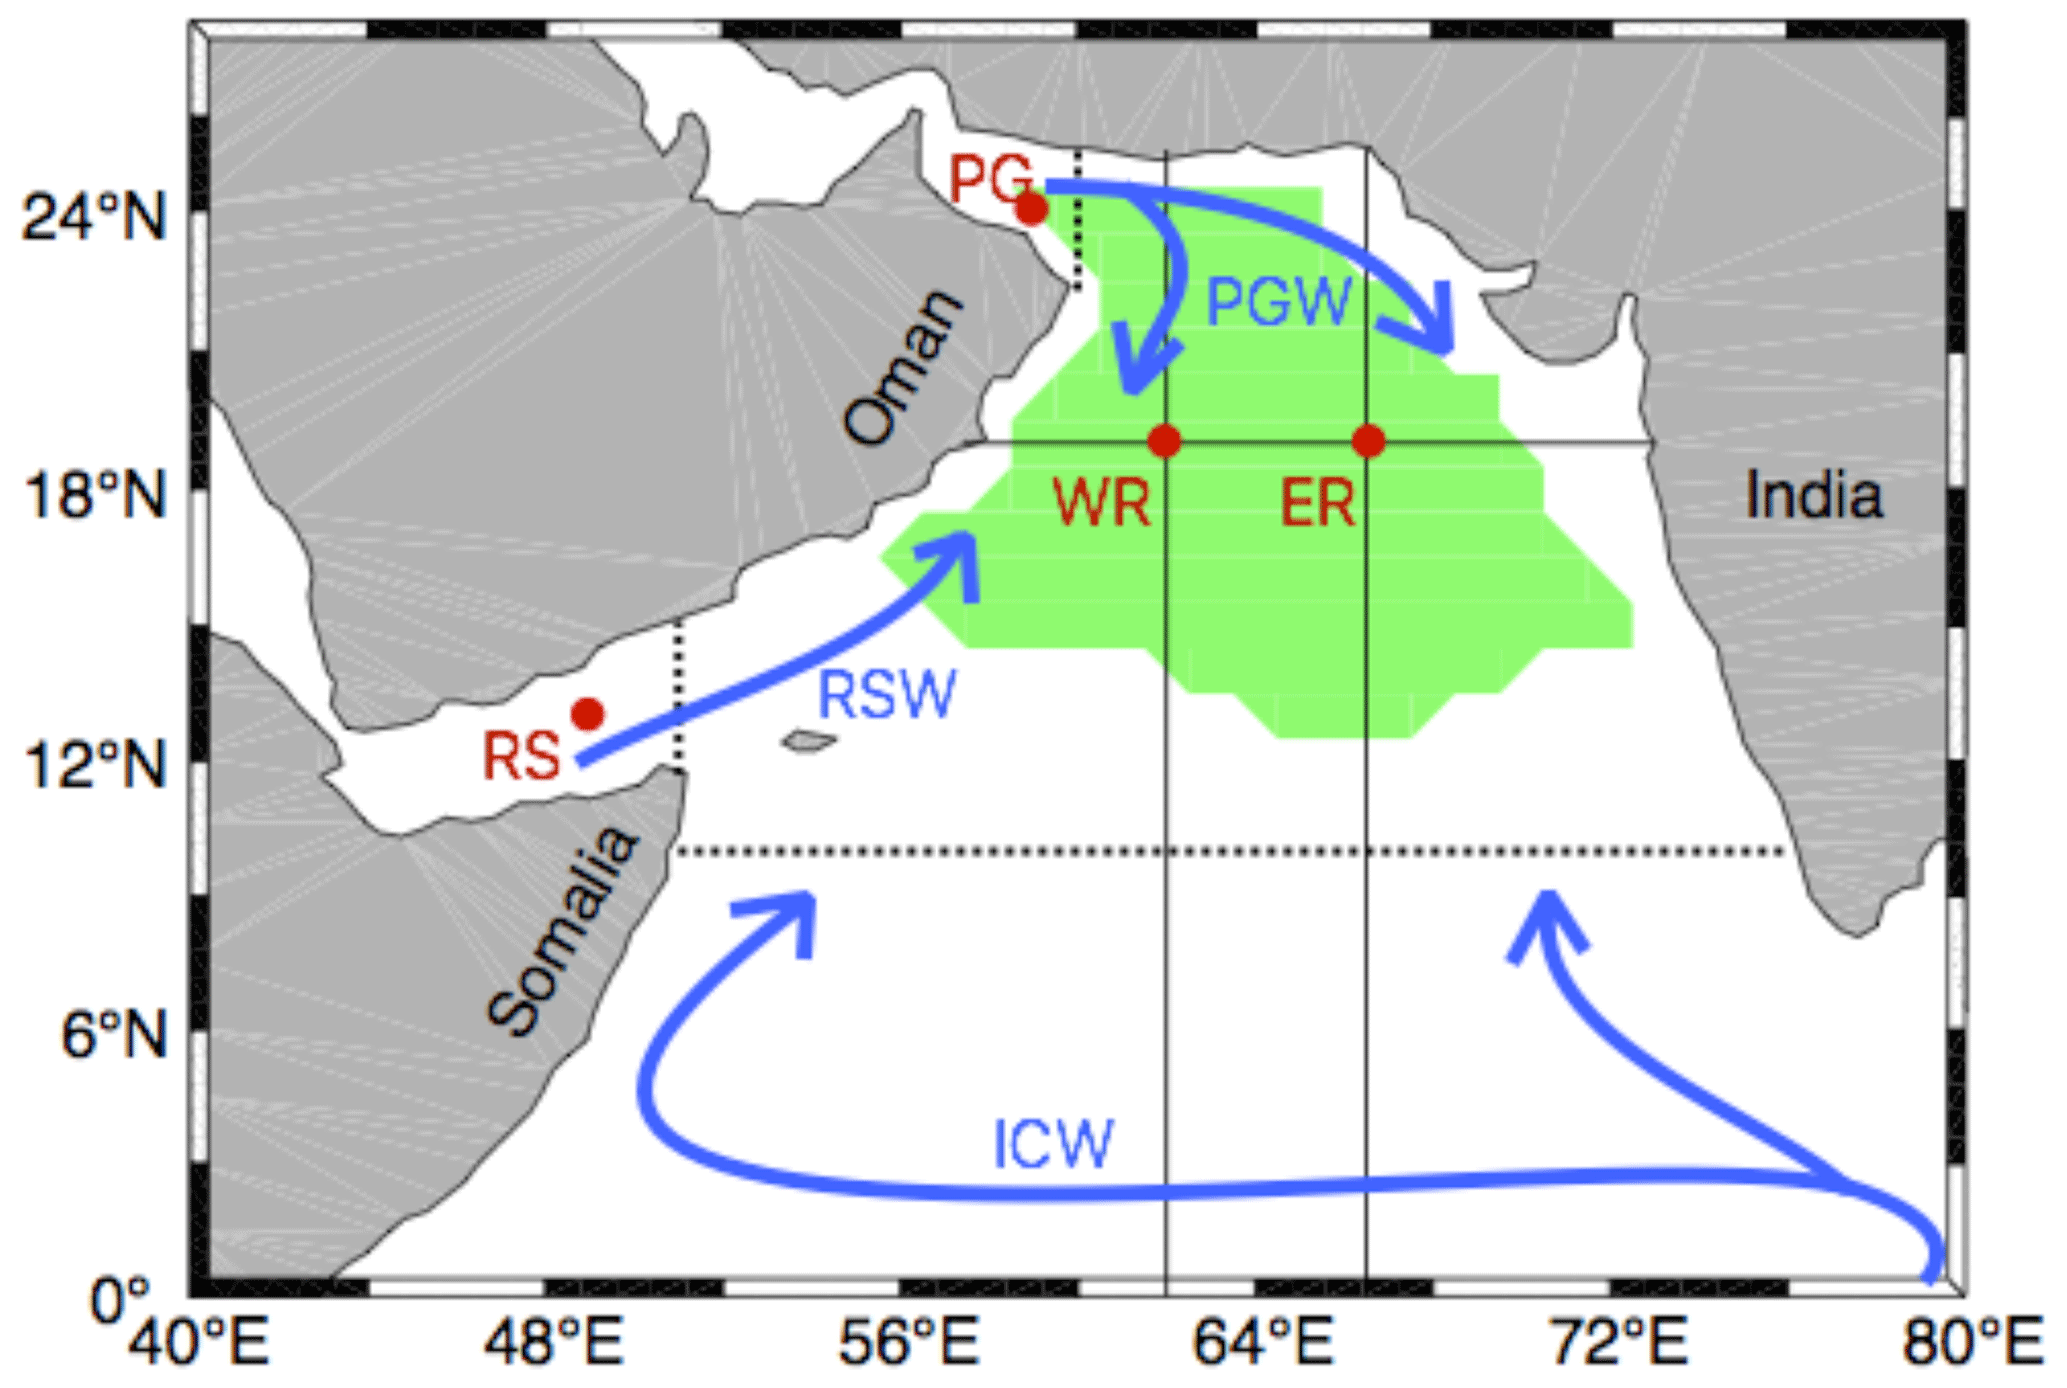
Figure 1Schematic pathways of the three major intermediate source water masses in the northwest Indian Ocean marked in blue: Indian Central Water (ICW), Red Sea Water (RSW), and Persian Gulf Water (PGW). The green patch sketches the location of the Arabian Sea OMZ (ASOMZ) defined by an oxygen concentration less than 10 µmol kg−1. Locations of four particle release points (western basin – WR, eastern basin – ER, Persian Gulf – PG, Red Sea – RS) are shown as red dots. Black solid lines indicate the sections shown in Fig. 2. Sections that need to be crossed by the Lagrangian particles to define the source regions for the ICW, RSW, and PGW are marked as black dashed lines.
Several assumptions were made to explain the dynamical and biological processes associated with the shape of the ASOMZ. So far it is known that, unlike in other tropical ocean basins, slow advection speed is not the main reason for the maintenance of the OMZ in the AS, where low-oxygen water has a residence time of 10 years (Olson et al., 1993). According to Sarma (2002) the residence time is only on the order of 6.5 years, and the maintenance of the OMZ is caused by sluggish circulation combined with varying biological activities. The relatively high oxygen rates at the western boundary are explained by the supply of oxygen-rich water due to the western boundary current (Swallow, 1984; Sarma, 2002) in combination with vertical mixing by energetic mesoscale eddies (Kim et al., 2001). Those higher oxygen levels persist despite high primary production at the surface and associated high consumption rates below. A process study of McCreary et al. (2013) stated the importance of the large-scale circulation for the shape of the ASOMZ as well as mesoscale features for variations of dynamical and biological processes.
Several studies have simulated the Indian Ocean circulation. These current model systems reveal large uncertainties and differences amongst them (McCreary et al., 2013). Typically, coarse-resolution coupled biogeochemical ocean models exhibit strong biases and tend to simulate lower oxygen concentrations in the Bay of Bengal than in the AS (e.g. Oschlies et al., 2008), contradicting the existing observations. Lachkar et al. (2016), however, suggest that the model performance improves with increasing model resolution. The latter findings support suggestions by Resplandy et al. (2012) and McCreary et al. (2013) that horizontal eddy mixing strongly impacts the oxygen dynamics in the AS. Studies on the equatorial Pacific from global coupled biogeochemical circulation models (Dietze and Löptien, 2013) point out that poor model performance is related to a deficient representation of ventilation pathways rather than being associated with a deficient representation of biogeochemical processes (i.e. respiration). This confirms the need for a better understanding of the intermediate circulation and its seasonality in the AS, including the pathways of RSW and PGW, to understand the associated variability of the ASOMZ and related climate–biogeochemical interactions.
It remains an open question how the interplay between physical and biogeochemical processes influences the Indian Ocean oxygen dynamics. Specifically, there are two issues concerning the ASOMZ.
-
Why does the ASOMZ occur further east relative to the upwelling area with associated high productivity? A satisfying explanation for this eastward shift has not been given so far (Acharya and Panigrahi, 2016).
-
Why is the ASOMZ maintained throughout the year with a weak seasonal cycle compared to the dramatic changes in physical forcing and biogeochemical conditions associated with the seasonally reversing monsoon winds?
Therefore, the present study focuses on advective pathways relevant for the ventilation dynamics of the ASOMZ. Main experiments are focused on the circulation on the isopycnal layer of σ=27 kg m−3, which is representative for the upper ASOMZ core. A backward-trajectory analysis was applied to examine the source regions of the seasonally changing advective pathways of the major water masses in the ASOMZ. For a better understanding of the zonal gradient of the ASOMZ we calculated the pathways of Lagrangian particles (van Sebille et al., 2018) based on two release points that are located in the eastern and the western basin of the Arabian Sea.
The following section explains the data sets, design of the experiments, and methods used for this study. Section 3 presents main ventilation pathways for the eastern and western basin of the AS, as well as their timescales and seasonality that are relevant for the variability of the ASOMZ and associated uncertainties. This is followed by the discussion and conclusions in Sect. 4.
2.1 Data sets
Trajectory calculations are based on reanalysis velocity data from the dynamic ocean model HYCOM (Hybrid Coordinate Ocean Model) (Bleck, 2002) provided by the Center for Ocean–Atmospheric Prediction Studies (COAPS). The model has a spatial resolution of 1∕12∘ in longitude and latitude with 40 depth levels between 0 and 5000 m, with decreasing resolution towards greater depth from 2 to 1000 m. It has a realistic bathymetry based on the General Bathymetric Chart of the Oceans (GEBCO) and uses isopycnal coordinates in the open stratified ocean, changes to terrain-following coordinates in shallower and coastal regions, and z-level coordinates in the mixed layer. The surface forcing is from the National Center for Environmental Prediction (NCEP) Climate Forecast System Reanalysis (CFSR, 1995–2011) and Climate Forecast System version 2 (CFSv2, 2011–2012). Furthermore, HYCOM is run in data assimilation mode using gridded “observations” from the Navy Coupled Ocean Data Assimilation (NCODA) system (Cummings, 2005; Cummings and Smedstad, 2013).
The variable vertical coordinates are beneficial to better reproduce the circulation near outflow and overflow regions compared to typical z-level models, which would generally have problems to resolve the shallower coastal regions properly (see also Bleck and Boudra, 1981; Bleck and Benjamin, 1993; Bleck, 2002). The latter is important for the analysis of the supply of Persian Gulf Water (PGW) and Red Sea Water (RSW) through the Gulf of Oman and the Gulf of Aden, respectively.
The model velocity outputs used here for the trajectory analysis were daily snapshots for the time period from January 2000 to December 2012. The velocity field during the winter and summer monsoon is shown using the mean seasonal velocity for the months November to February and June to September, respectively, averaged for the years 2000 to 2012. The data are spatially filtered using a window and presented on a grid with the same resolution.
For a validation of the HYCOM velocity data we compared the near-surface circulation of HYCOM with the climatology of YoMaHa'07, which is based on observational data obtained from Array of Real-time Geostrophic Oceanography (Argo) floats (Lebedev et al., 2007). This choice is motivated by the lack of observational data at intermediate depths between 200 and 800 m in the Arabian Sea (AS). YoMaHa'07 provides a bin-averaged monthly climatology of the surface velocity for the time period from 1997 to 2007. Therefore, HYCOM data used for the validation were monthly averaged for the time period from 1997 to 2007 and bin-averaged in accordance with the YoMaHa'07 climatology. The complex circulation pattern at the near surface, which is strongly affected by the seasonal Asian monsoon (Schott et al., 2009), is well described by the HYCOM data, reflecting all (reversing) currents that are relevant for the AS. During the winter monsoon, the Somali Current (SC) flows southwestward along the coast of Somalia (Fig. S1a, b). The Northeast Monsoon Current (NMC) moves westward at the southern tip of India and supplies the West Indian Coast Current (WICC), which flows northward along the coast of India (Fig. S1a, b). During the summer monsoon, the Somali Current (SC) and the Ras al Hadd Jet (RHJ; also known as the East Arabian Current; Vitale et al., 2017) flow northeastward along the coast of Somalia and Oman (Fig. S1c, d). A strong gyre, the Great Whirl (GW), can be identified, which generally develops off the coast of Somalia during the summer monsoon season (Fig. S1c, d). In accordance with observations, the West Indian Coast Current (WICC) flows southward along the coast of India and feeds the Southwest Monsoon Current (Fig. S1c, d). The comparison of the near-surface circulation obtained from HYCOM and Argo agrees very well during the winter and summer monsoon (see Supplement Fig. S1). Additionally, an analysis of seasonal surface velocities in the AS (Vitale et al., 2017; their Figs. 2a, 3a), which is based on a drifter climatology including data from March 1995 to March 2009 (Lumpkin and Pazos, 2007), also confirms the good representation of the near-surface velocity from HYCOM data.
For a brief validation of the HYCOM velocity data at a depth of 1000 m (Fig. S2) we compared the HYCOM climatology with the circulation described in Vitale et al. (2017). Their study is similarly based on Argo data, but contrary to the YoMaHa'07 climatology, they only provide velocity data when a minimum of three velocity vectors are present and provide a variance ellipse at each point. The northeastward flow along the coast of Somalia and Oman is also noticeable at 1000 m during the summer monsoon (Fig. S2b). Further offshore the deep-reaching gyre circulation of the Great Whirl can be identified. North of the Equator a uniform eastward flow is observed. This flow is connected to the East African Coastal Current (EACC) that separates from the coast while crossing the Equator (Vitale et al., 2017). During the winter monsoon, the flow at about 5∘ N changes direction into a westward flow. This flow splits at the Somali coast into a strong southward and a weaker northward flow (Fig. S2a). Also seen in Vitale et al. (2017) and the HYCOM velocity data is a westward flow in the Gulf of Aden during wintertime. The northeastern AS has comparable weak velocities at 1000 m of depth for both monsoon seasons.
The global monthly mean observational dissolved oxygen climatology of the World Ocean Atlas 2013 (WOA13) is constructed from data that cover a period from 1955 to 2012 available with a spatial resolution of interpolated on 102 depth levels (Garcia et al., 2013).
2.2 Design of the experiment
The motivation and key details of the conceptual design of the experiments to investigate the main advective pathways within the ASOMZ and its seasonal variability are presented in the following. To estimate the advective contribution to the OMZ ventilation we analysed the pathways of Lagrangian particles released into a two-dimensional (isopycnal) model-based velocity field. This approach is time-efficient and focuses on the along-isopycnal advection, though it ignores, for example, the effects of upwelling or diapycnal mixing. However, this method allows us to estimate the contribution from different source regions to the OMZ by performing backward trajectories and to draw conclusions on the basin's wide spread of oxygen at intermediate depth (200–800 m).
Our experiments are based on the assumption that PGW and RSW are the main local source water masses that are relevant for the ventilation of the ASOMZ (Prasad et al., 2001; Beal et al., 2000; Shankar et al., 2005) and that ventilation occurs mainly horizontally along isopycnals. The annual mean field of dissolved oxygen from WOA13 climatology is shown in Fig. 2 to give an overview of the location and spatial extension of the ASOMZ as well as the isopycnal layers associated with the density of the PGW and RSW. Therefore, advective pathways from Lagrangian particles (in the following only called pathways) into the OMZ are calculated on an isopycnal associated with the source regions of the PGW and RSW as well as the OMZ core region. The representative isopycnal surface of 27 kg m−3 was chosen for most experiments for two main reasons: this isopycnal lies in the upper core of the ASOMZ (Fig. 2) with low oxygen values of less than 10 µmol kg−1 throughout nearly the entire year (Fig. 3a). Furthermore, this is the density layer with seasonal changes in oxygen concentration (Fig. 3a). The core densities of PGW (σ=26.4 kg m−3) and RSW (σ=27.4 kg m−3), which appear to be the main source water masses ventilating the ASOMZ, bracket the isopycnal density of σ=27 kg m−3. The isopycnal density layer on which ICW is advected northward (σ=26.7 kg m−3) lies between the cores of RSW and PGW. For the AS, the supply of oxygen was suggested by Banse et al. (2014) to be on the isopycnal surfaces of 27 kg m−3 associated with depths between 300 and 500 m.
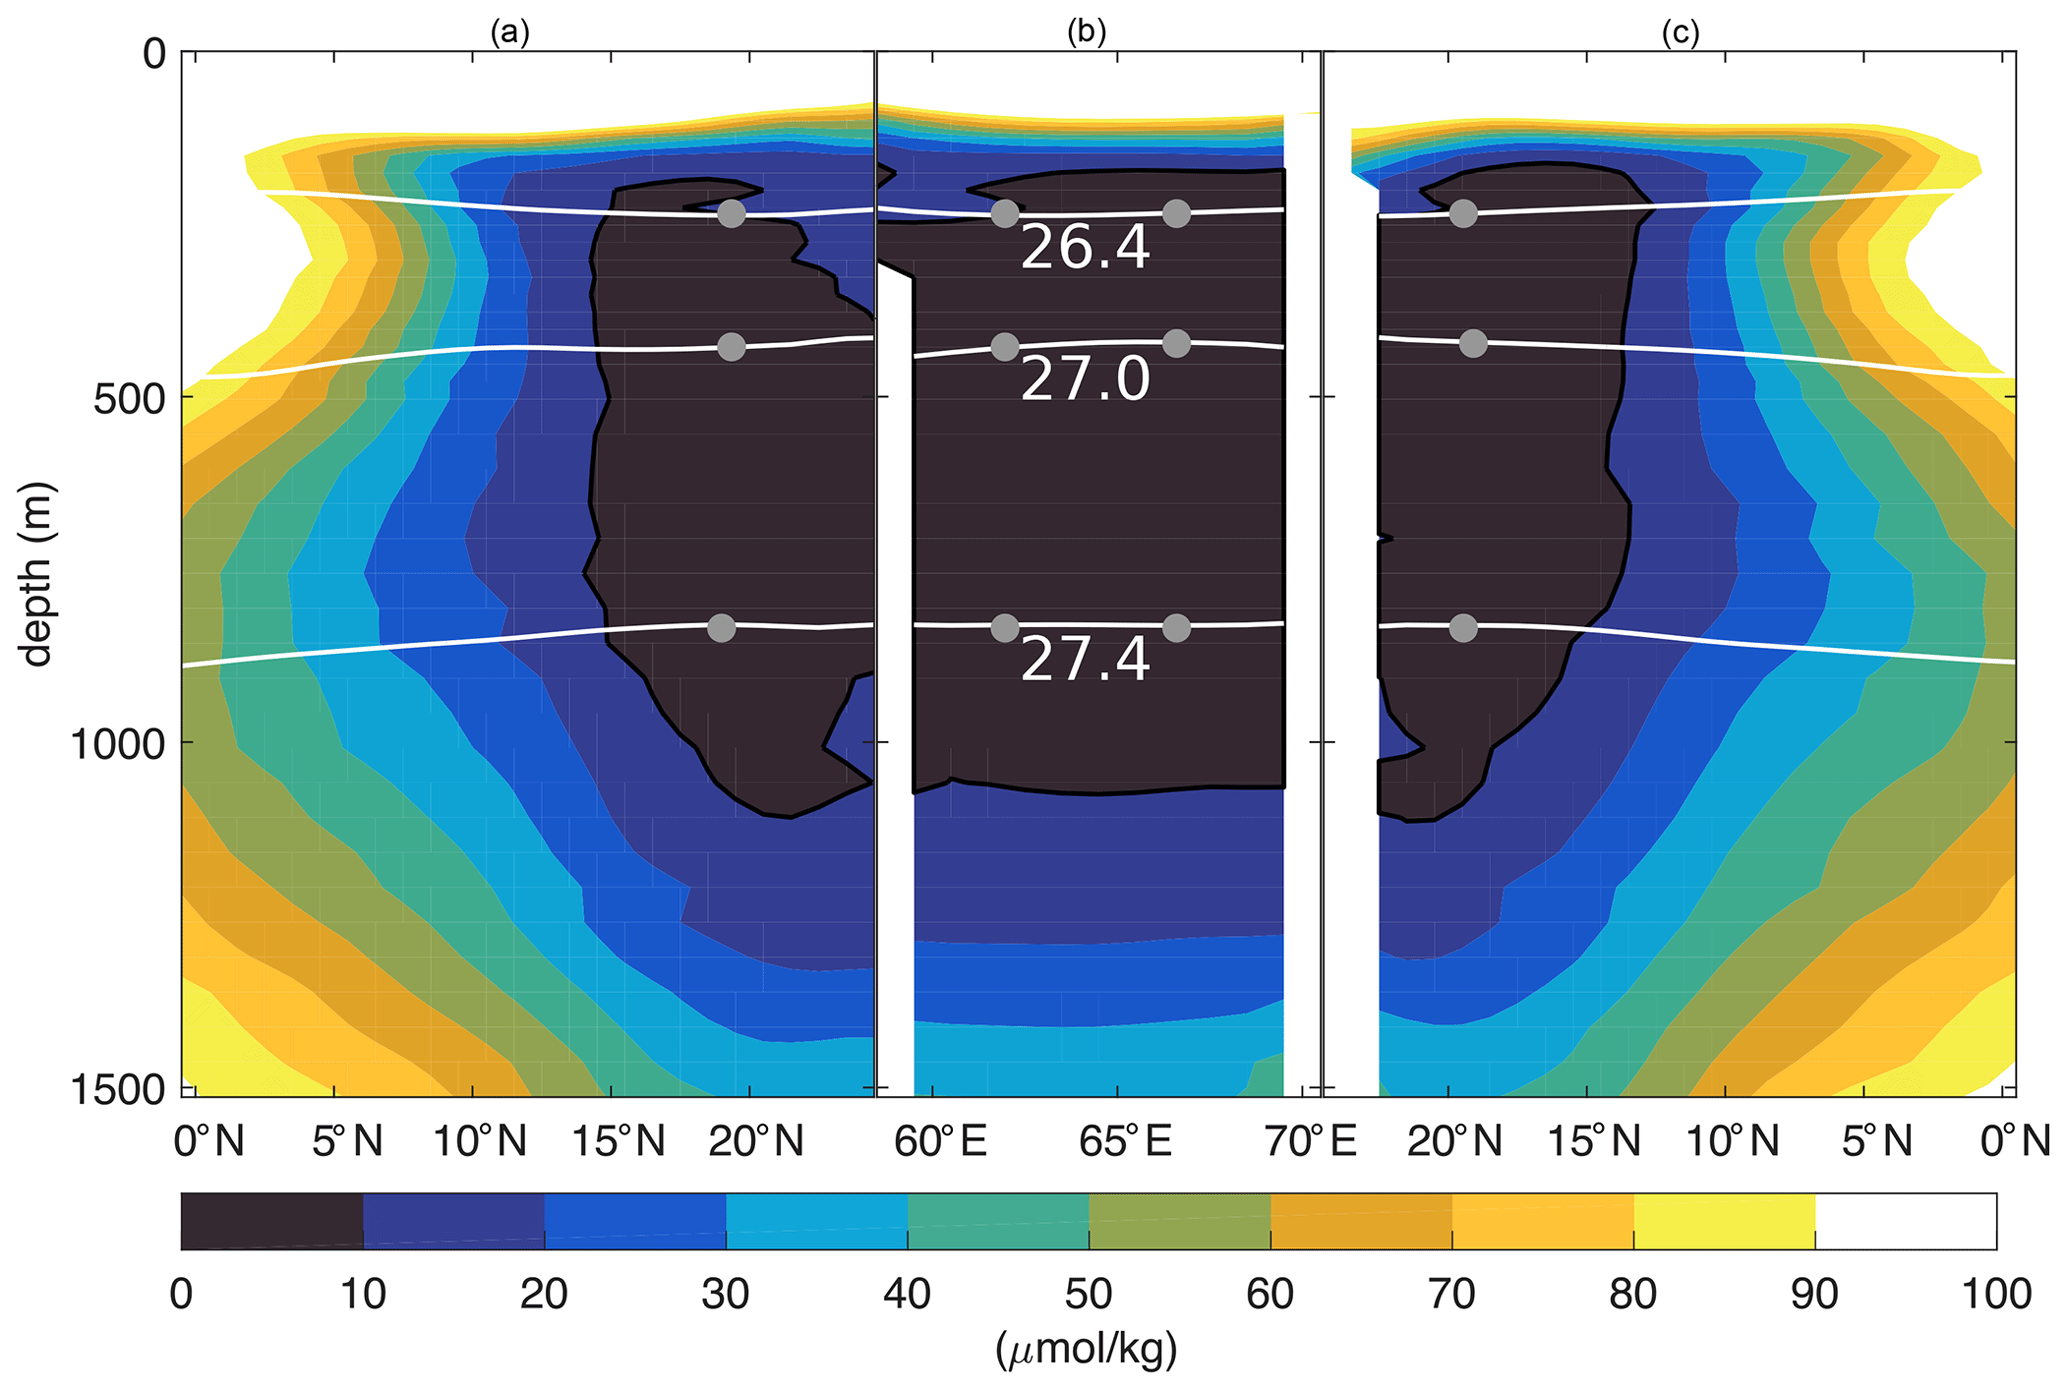
Figure 2Annual mean dissolved oxygen concentration along 62∘ E (a), 66.5∘ E (c), and 19∘ N (b) from the WOA13 climatology (see Fig. 1). Advective pathways from Lagrangian particles are calculated on three isopycnals (26.4, 27, 27.4 kg m−3) shown as white lines. The grey dots mark the release points in the western (WR) and eastern (ER) basin on each isopycnal level.
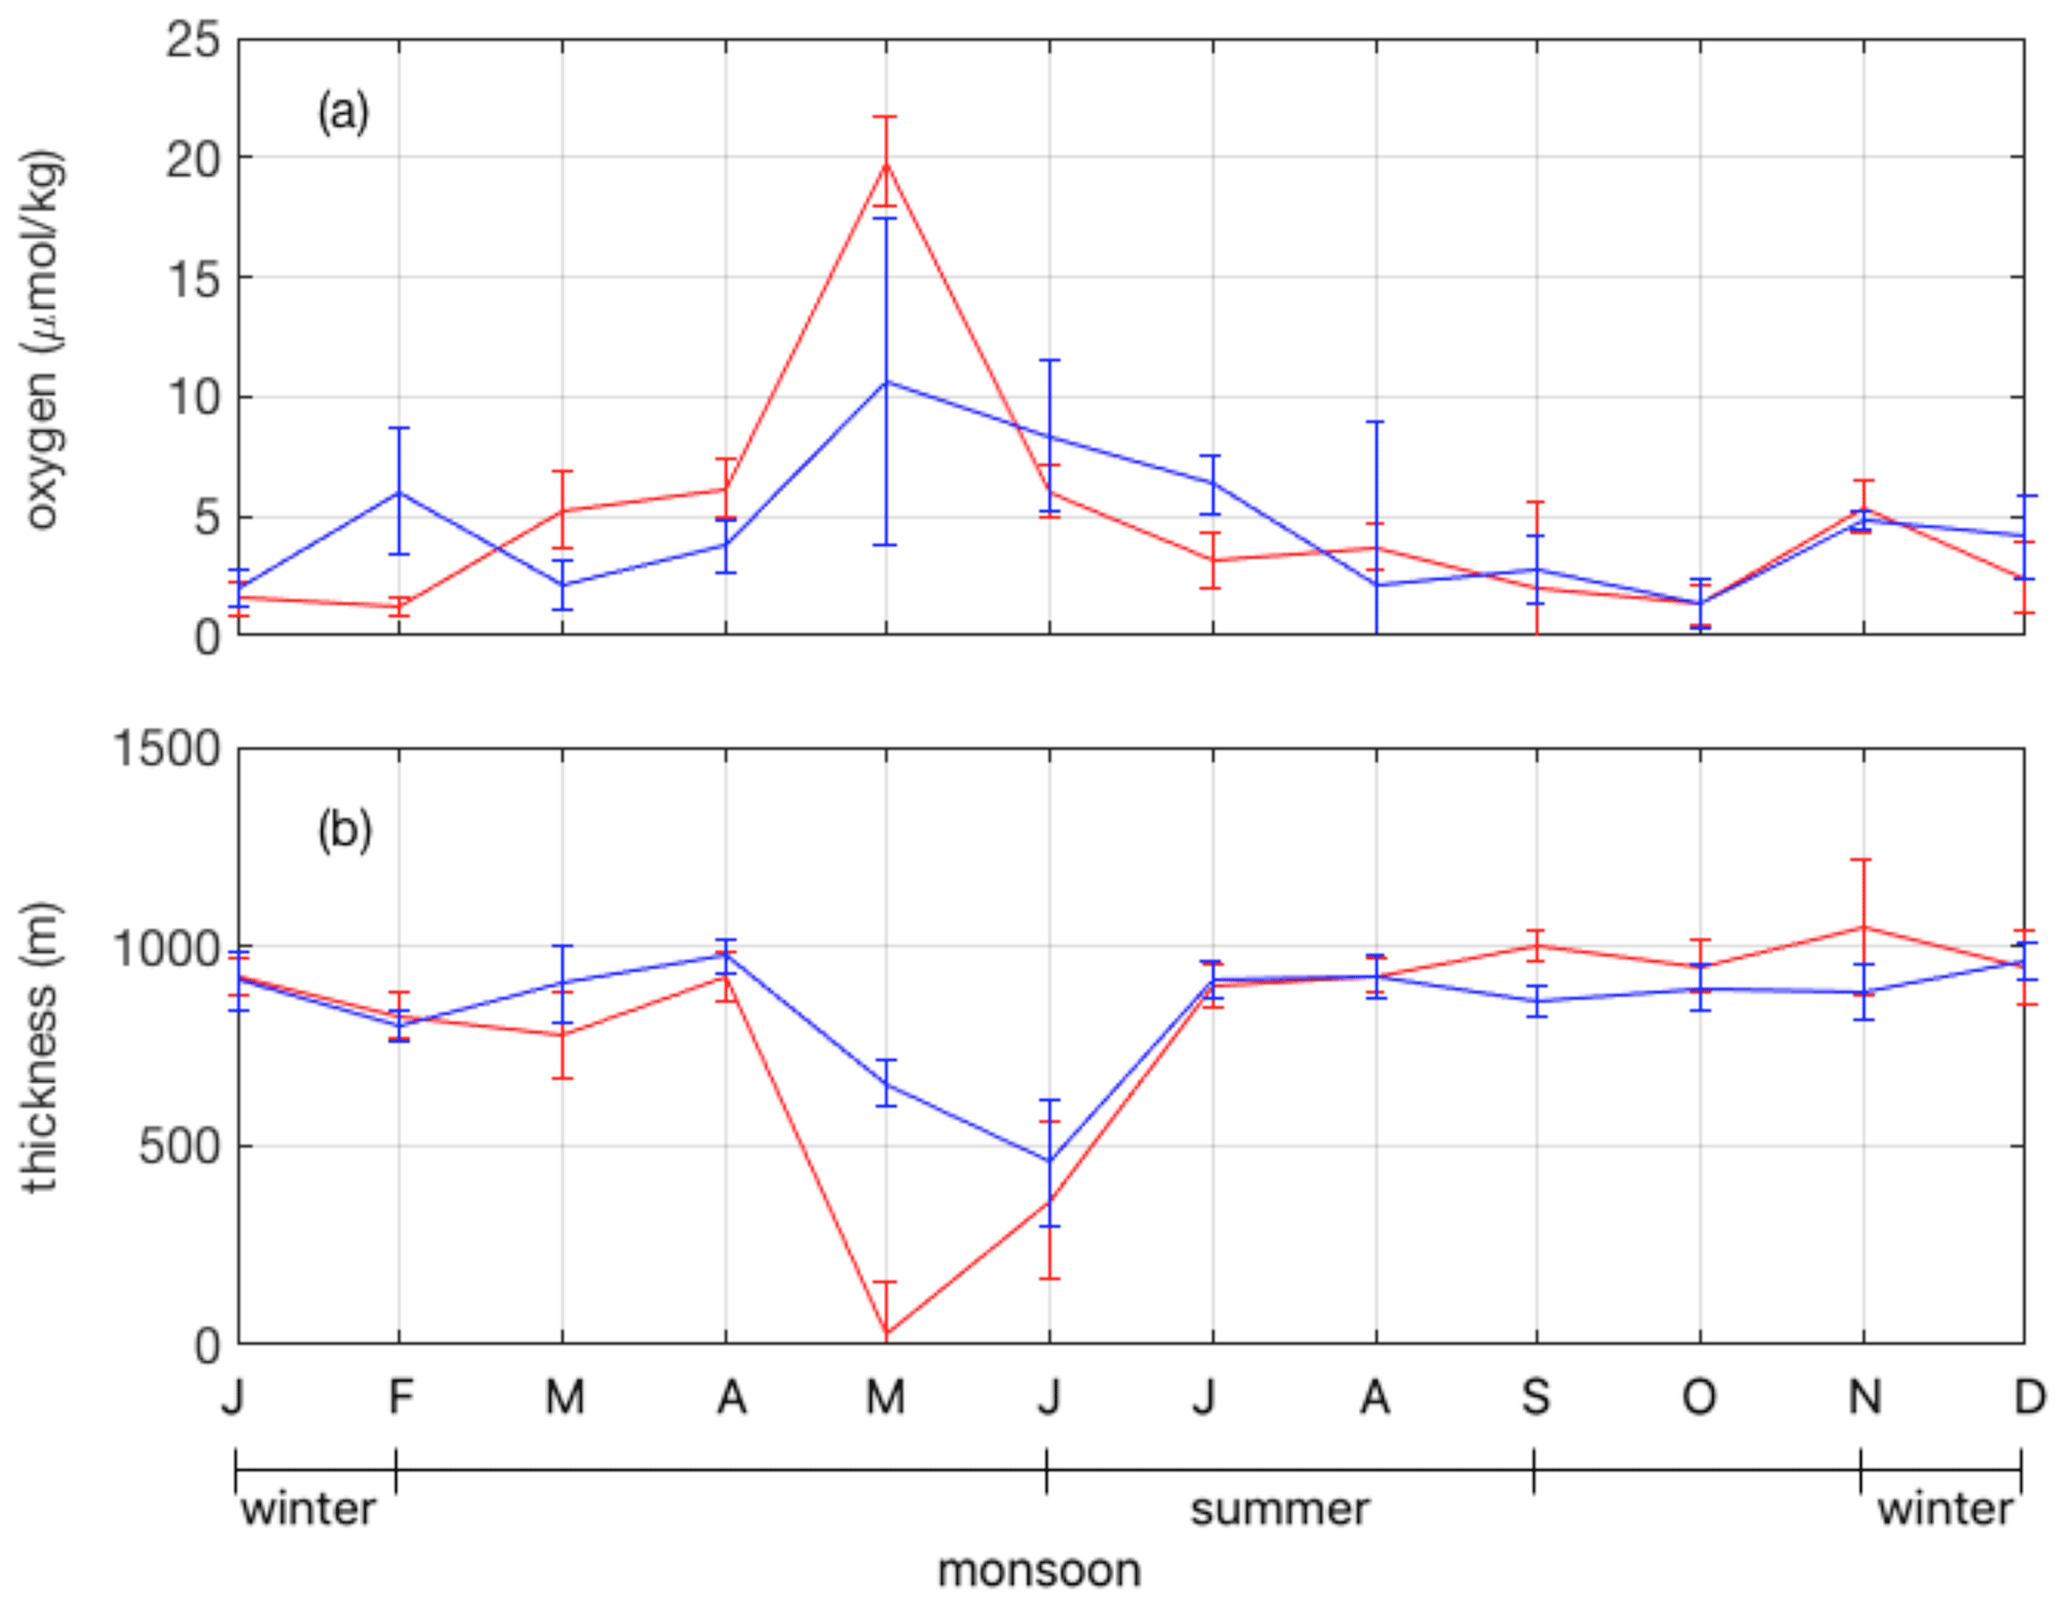
Figure 3(a) Mean seasonal cycle of dissolved oxygen concentration on the isopycnal surface of σ=27 kg m−3 at the location of the ER (red) and the WR point (blue) from observations. (b) Mean seasonal cycle of the thickness of the layer containing less than 10 µmol kg−1 of oxygen based on WOA13 at the location of the ER (red) and the WR point (blue). The error bars show the spatial standard deviation in an area of centred around the release point.
The contrast in extension and seasonal cycle, not only in oxygen but also in biogeochemical activity (Hood et al., 2009; Resplandy et al., 2012; Brewin et al., 2012), of the ASOMZ for the eastern and western basin encourages us to analyse the ventilation of each half of the basin individually. Therefore, we define two target locations in the eastern (ER) and western (WR) part of the core of the ASOMZ (Fig. 1). The western part is associated with the area of high primary production, and the eastern part is associated with the area of lowest oxygen values. Both target locations represent the core of the OMZ and are defined as circular areas with a radius twice the grid spacing, thus 1∕6∘, around the launching coordinates, which are 19.04∘ N and 66.64∘ E for the ER and 19.04∘ N and 62.00∘ E for the WR. The Lagrangian particles are spread equally over that area and are all released at the same time (for one run). For the forward trajectories two additional release locations in the Gulf of Aden, simulating the spreading of Red Sea Water (RS, 49.04∘ E and 13.04∘ W), and in the Gulf of Oman, simulating the spreading of Persian Gulf Water (PG, 59.04∘ E and 24.00∘ N; Fig. 1), were chosen.
After analysing the pathways within the ASOMZ (Sect. 3.2) we focused on the seasonal variation of the circulation in the AS (Sect. 3.3). To address this question we chose distinct sections along the main pathways (Fig. 1) and calculated the particle transit times from one region to another. Two zonal sections are at equal distance south and north of the release locations (17, 21∘ N) to investigate the impact of the northeast and southwest monsoon on the advection of the particles. A meridional section separates the eastern and western half of the basin between the release locations at 64.3∘ E to determine the interior circulation. Two meridional sections are located at the borders of the Gulf of Oman and Gulf of Aden as the sources of the main water masses. Another zonal section at 10∘ N serves as a southern boundary of the AS as our research area to get insight into the inflow from the south and its variation.
The Lagrangian particles were advected using the two-dimensional velocity fields from HYCOM reanalysis following basic relations of continuous deformation (see the Supplement; Lamb, 1879). This approach is consistent with more recent techniques as described in van Sebille et al. (2018). The daily velocity fields were vertically linearly interpolated onto the target isopycnal surface. The number of Lagrangian particles released is 50 000 for the runs that were mainly used for statistical purposes (see also Sect. 2.4) and 10 000 for runs 1 to 10 (Table 1). The particles were advanced using an Euler forward-in-time integration scheme with a time step of 1∕20 d. Both forward and backward trajectories were calculated, and particle positions are stored every fourth day. In addition to the model velocity field a random walk of particles is applied to represent subscale diffusion of 20 m2 s−1. Close to the coast a special case of random walk in the offshore direction is used to prevent trajectories leaving the ocean. The choice of magnitude of random walk is connected to the spatial and temporal grid resolution. A sensitivity experiment with different subscale diffusion coefficients of 10, 20, and 25 m2 s−1 does not reveal significantly different results (not shown here). Nevertheless, there are grid boxes along the coastline and in particular near islands where the particles can get trapped. These spuriously high probabilities were not considered for further analyses and masked. Moreover, the velocity fields of HYCOM are obviously divergent, in particular in upwelling and downwelling regions near coasts and islands (e.g. the Maldives, Socotra).
Table 1Trajectory calculations of percentages and transit times of advective Lagrangian particles for different runs performed with a length of 8 years on different isopycnals (σ=26.4, 27, 27.4 kg m−3) for this study. Transit times are defined by the times when 50 % of the particles crossed the section from the three major source regions (PG, RS, and southern Indian Ocean) to the two release areas (ER and WR). Percentages refer to the total number of Lagrangian particles that crossed the section during the simulation (8 years). Release locations are defined as circles with a radius twice the grid spacing, thus 1∕6∘, around the coordinates of the release points (abbreviations defined in Sect. 2.2). The number of released floats is 10 000 for all runs that are listed here.

Several sensitivity runs were conducted, many of them with a reduced number of particles to save computational costs. A comparison between the full number and a reduced number of particles gave very similar results (not shown here). In order to estimate the representativeness of the main Lagrangian pathway analysis on the central isopycnal surface (27 kg m−3) two further runs on shallower and deeper isopycnals were performed (using the isopycnals PGW σ=26.4 kg m−3 and RSW σ=27.4 kg m−3). These experiments used repeated daily velocity data for the calendar year 2006 for computational cost savings.
To estimate the impact of slower diffusion effects on the ventilation of the ASOMZ we compared the typical 8-year results (Table 1) to longer 13-year model runs. Again, both experiments gave very similar results, pointing towards a less important secondary role of the slower processes.
2.3 Trajectory visualization
To analyse the Lagrangian data, the Arabian Sea is divided into a grid of resolution. For each time step the number of particles residing in a certain grid box can be counted, leading to a map that shows the particle concentration over the analysed time in a certain grid box or at individual time steps (Gary et al., 2011). For a better comparison, the probability for each bin has been obtained. Summing up all particle counts in a certain grid box over the whole time and dividing it by the total number of particle counts for all grid boxes leads to probability maps that sum up to 100 % for the whole experimental area and time (van Sebille et al., 2018).
With a subsample of the trajectories that reach the source regions, these maps can highlight the most likely advective pathways (Gary et al., 2011). Additionally, it is possible to analyse the spreading of the particles by looking at single time steps.
The point-to-point transit time describes the time that each individual Lagrangian particle takes to transit between defined regions (van Sebille et al., 2018). The transit time is analysed along identified main advective pathways into the ASOMZ between distinct sections (see Sect. 2.2). The transit time is not unique, as different particles might travel between two regions in different ways with different lengths of time (Phelps et al., 2013). The transit times discussed here are thus defined by the times when 50 % of the particles crossed the distinct sections (percentages refer to the total number of particles that crossed the section during the simulation time of 8 years). Particles were prevented from being counted twice, as only the first crossing time of each particle at each section is registered and the time saved.
2.4 Trajectory validation and statistics
To test the reliability of the calculated Lagrangian trajectories five model runs with an identical setup were performed (each with 50 000 particles, 13-year duration, and starting at the ER in December 2012). The differences between these runs are discussed in Sect. 3.5.
To detect the interannual variability the runs with the duration of 13 years used for the statistics were compared to a climatological run, which was performed with 13-year averaged daily velocity fields. Furthermore, the 8-year runs (runs 1–6; Table 1) were started with a temporal offset of 2 years between the individual runs to study the effect of interannual variability. For the analysis of seasonality and transit time, we used the mean of these runs to smooth out the interannual variability.
Seasonal differences in particle movement around the release locations can be predicted by starting the calculations with a temporal offset of 3 months within the same year (January, April, July, and October). This was done for forward-calculated trajectories from the RS and PG release to predict the spreading of RSW and PGW.
3.1 Seasonal oxygen dynamics and circulation at intermediate depth
The northern Indian Ocean is a region of strong monsoonal forcing, and it is known that seasonal changes have a profound impact on the ASOMZ (Resplandy et al., 2012). Thus, first we give a short overview of the seasonal variability of the suboxic oxygen distribution and the circulation at intermediate depth in the AS.
The OMZ in the northern AS shows regional differences in the seasonal cycle, especially in the upper core (350–550 m of depth; Fig. 3). The annual mean oxygen concentration from observational climatologies shows that the layer containing less than 10 µmol kg−1 is deepest in the eastern basin (Fig. 4a). The maximum thickness arises during the fall intermonsoon and at the beginning of the winter monsoon with a depth of 1000 m (Fig. 3b) and nearly total oxygen depletion in the core (Fig. 3a). The oxygen concentration increases within the spring intermonsoon, and the suboxic layer in the eastern AS nearly vanishes in May (Fig. 3b).
A similar seasonal cycle is prominent in the western AS, with a maximum thickness of the suboxic layer of 900 m (Fig. 3b), but a weaker ventilation during the spring intermonsoon compared to the eastern AS. The layer containing an oxygen concentration less than 10 µmol kg−1 remains thicker than 500 m. Based on an area of in total centred around the target location, the spatial standard deviations were calculated (Fig. 3). They show that the seasonal cycle of the OMZ represents a large area and not only the target location. This holds especially true for the eastern basin.
At intermediate depth in the AS several boundary currents seasonally change direction, such as the Somali Current along the western boundary. Mean seasonal velocity for the period of 13 years shows the reversing of the Somali Current from a southwestward boundary current during the winter monsoon (Fig. 5a) to a stronger northeastward boundary current during the summer monsoon (Fig. 5b). Generally, velocities show the strongest variability along the boundaries, especially in the western basin, increasing towards the Equator (Fig. 5c), and in the marginal seas. Along the eastern boundary of the AS the flow at intermediate depth also changes direction between the different monsoon phases from a distinct southeastward-directed flow along the west coast of India during the northeast monsoon (Fig. 5a) to a northwestward-directed more variable flow during the southwest monsoon (Fig. 5b).
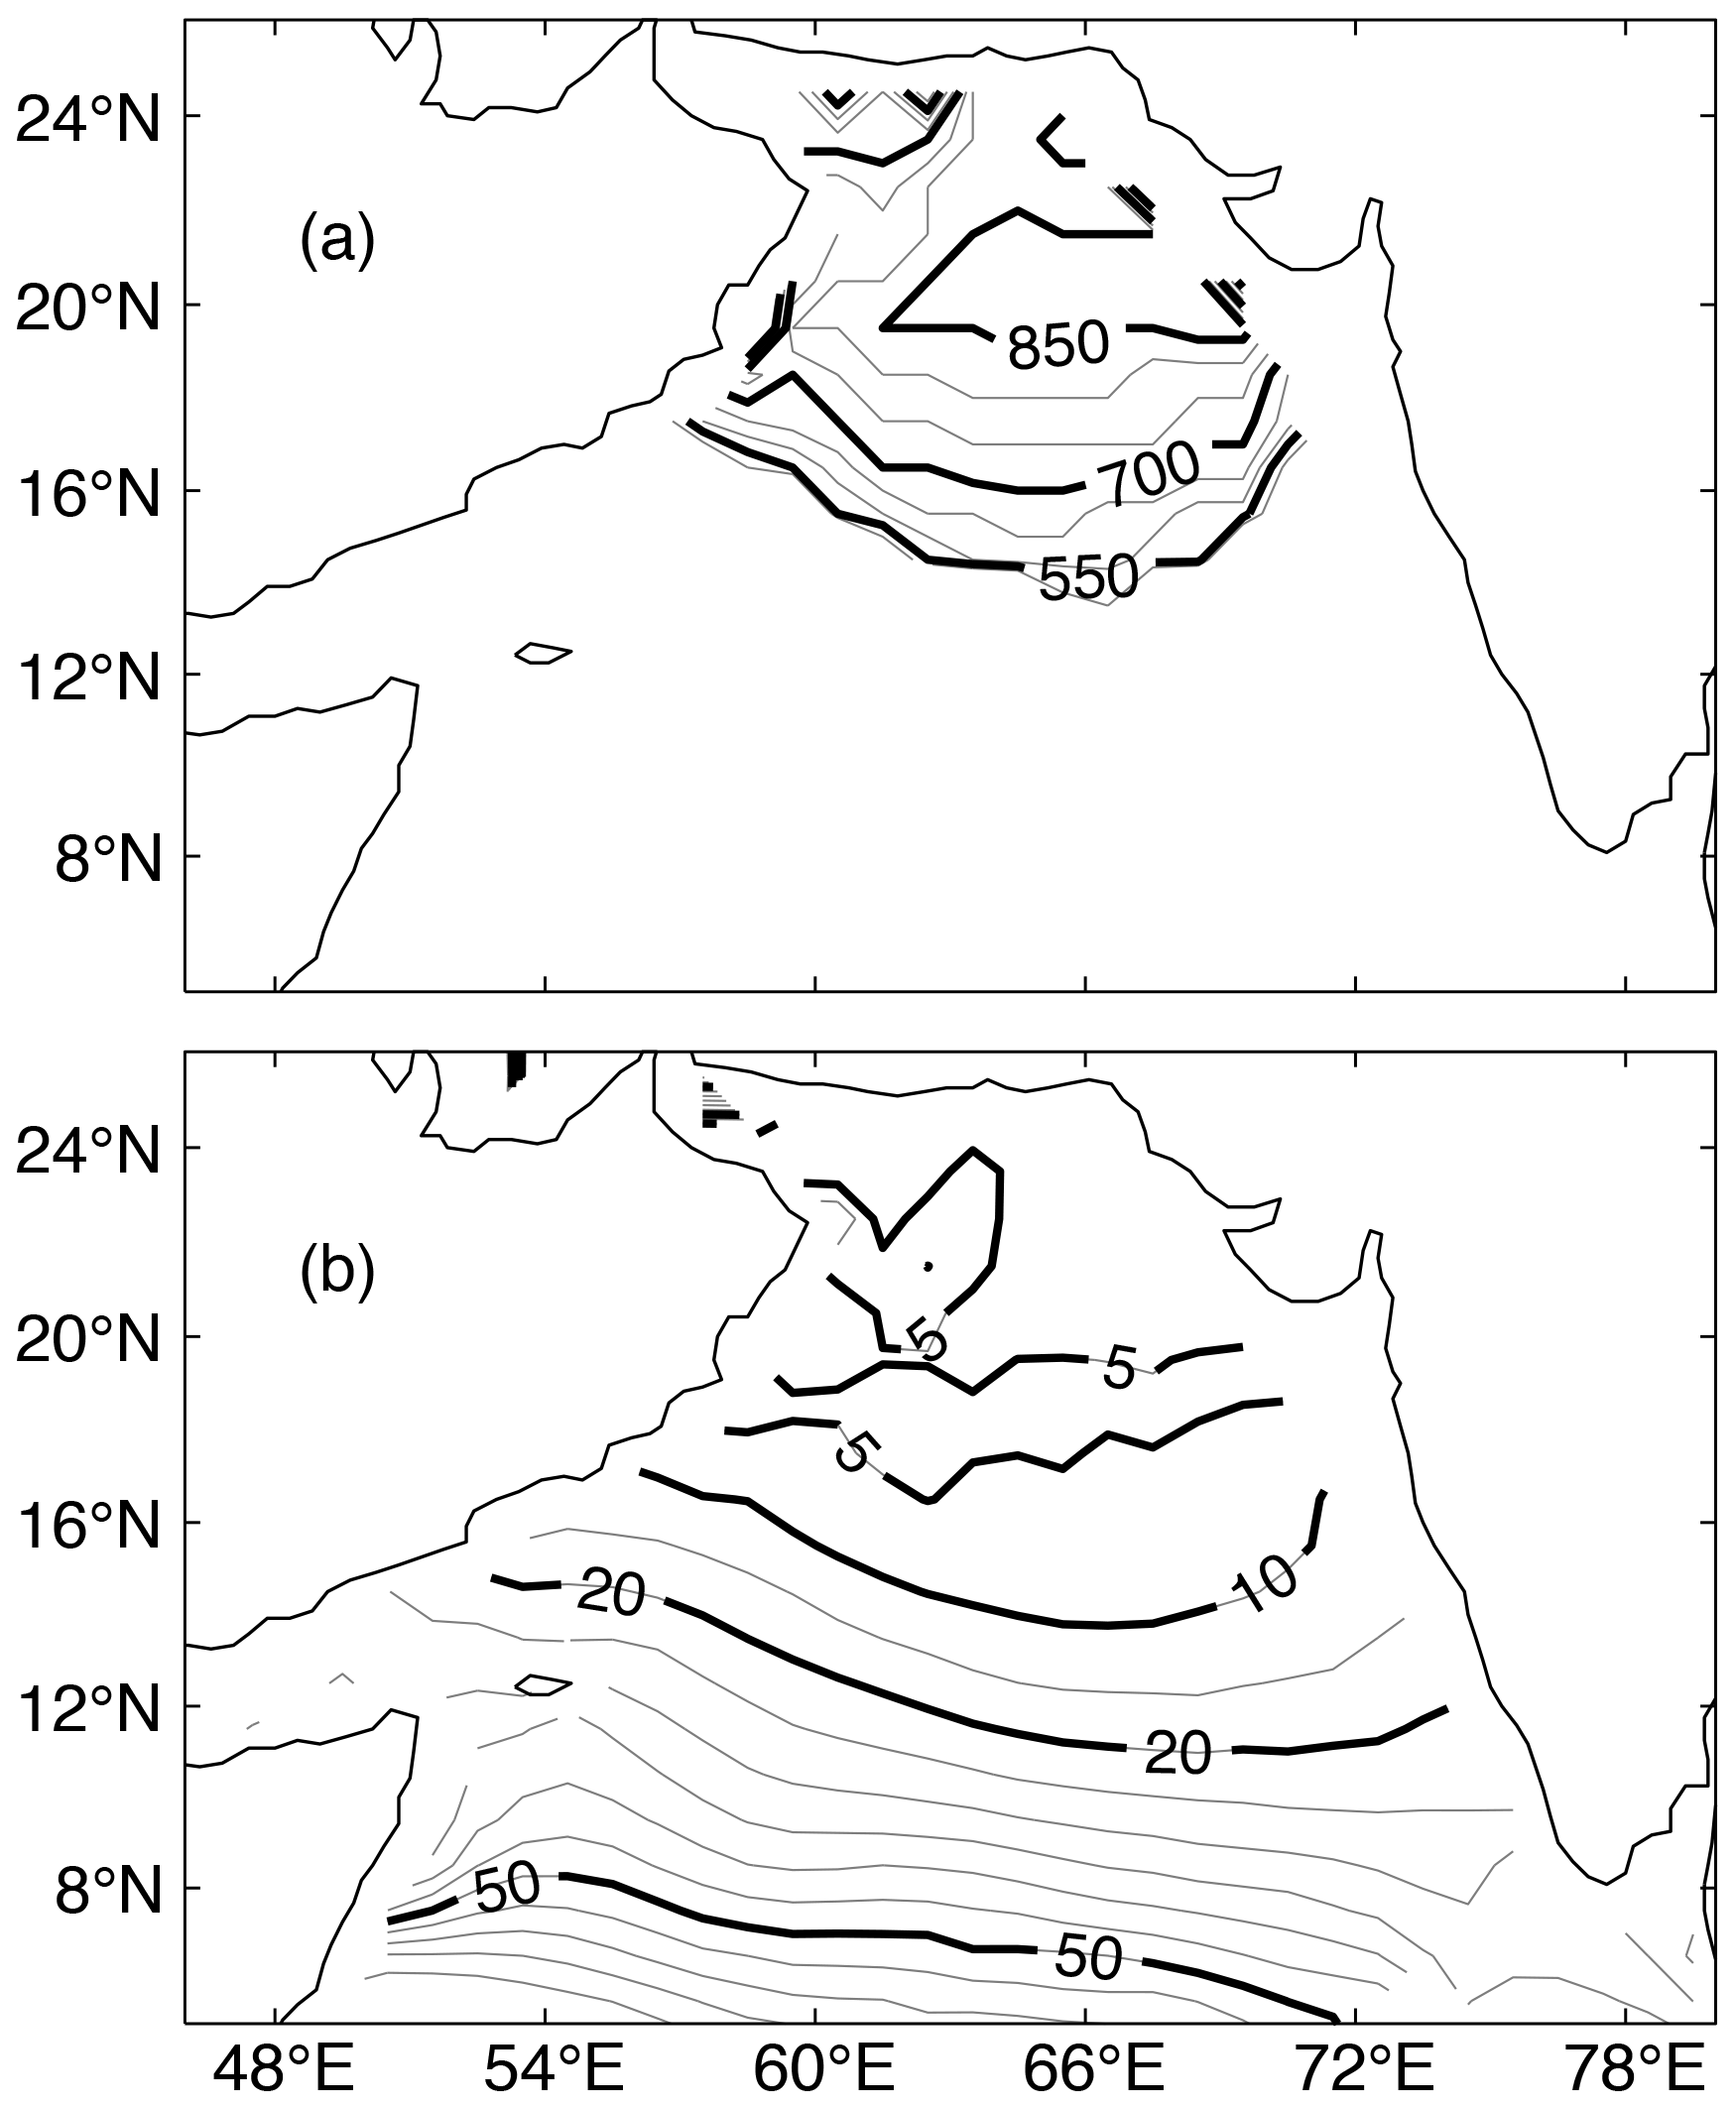
Figure 4(a) Thickness (in metres) of the layer containing an oxygen concentration less than 10 µmol kg−1 based on climatological data from WOA13. (b) Oxygen concentration (µmol kg−1) on the σ=27 kg m−3 isopycnal of WOA13.
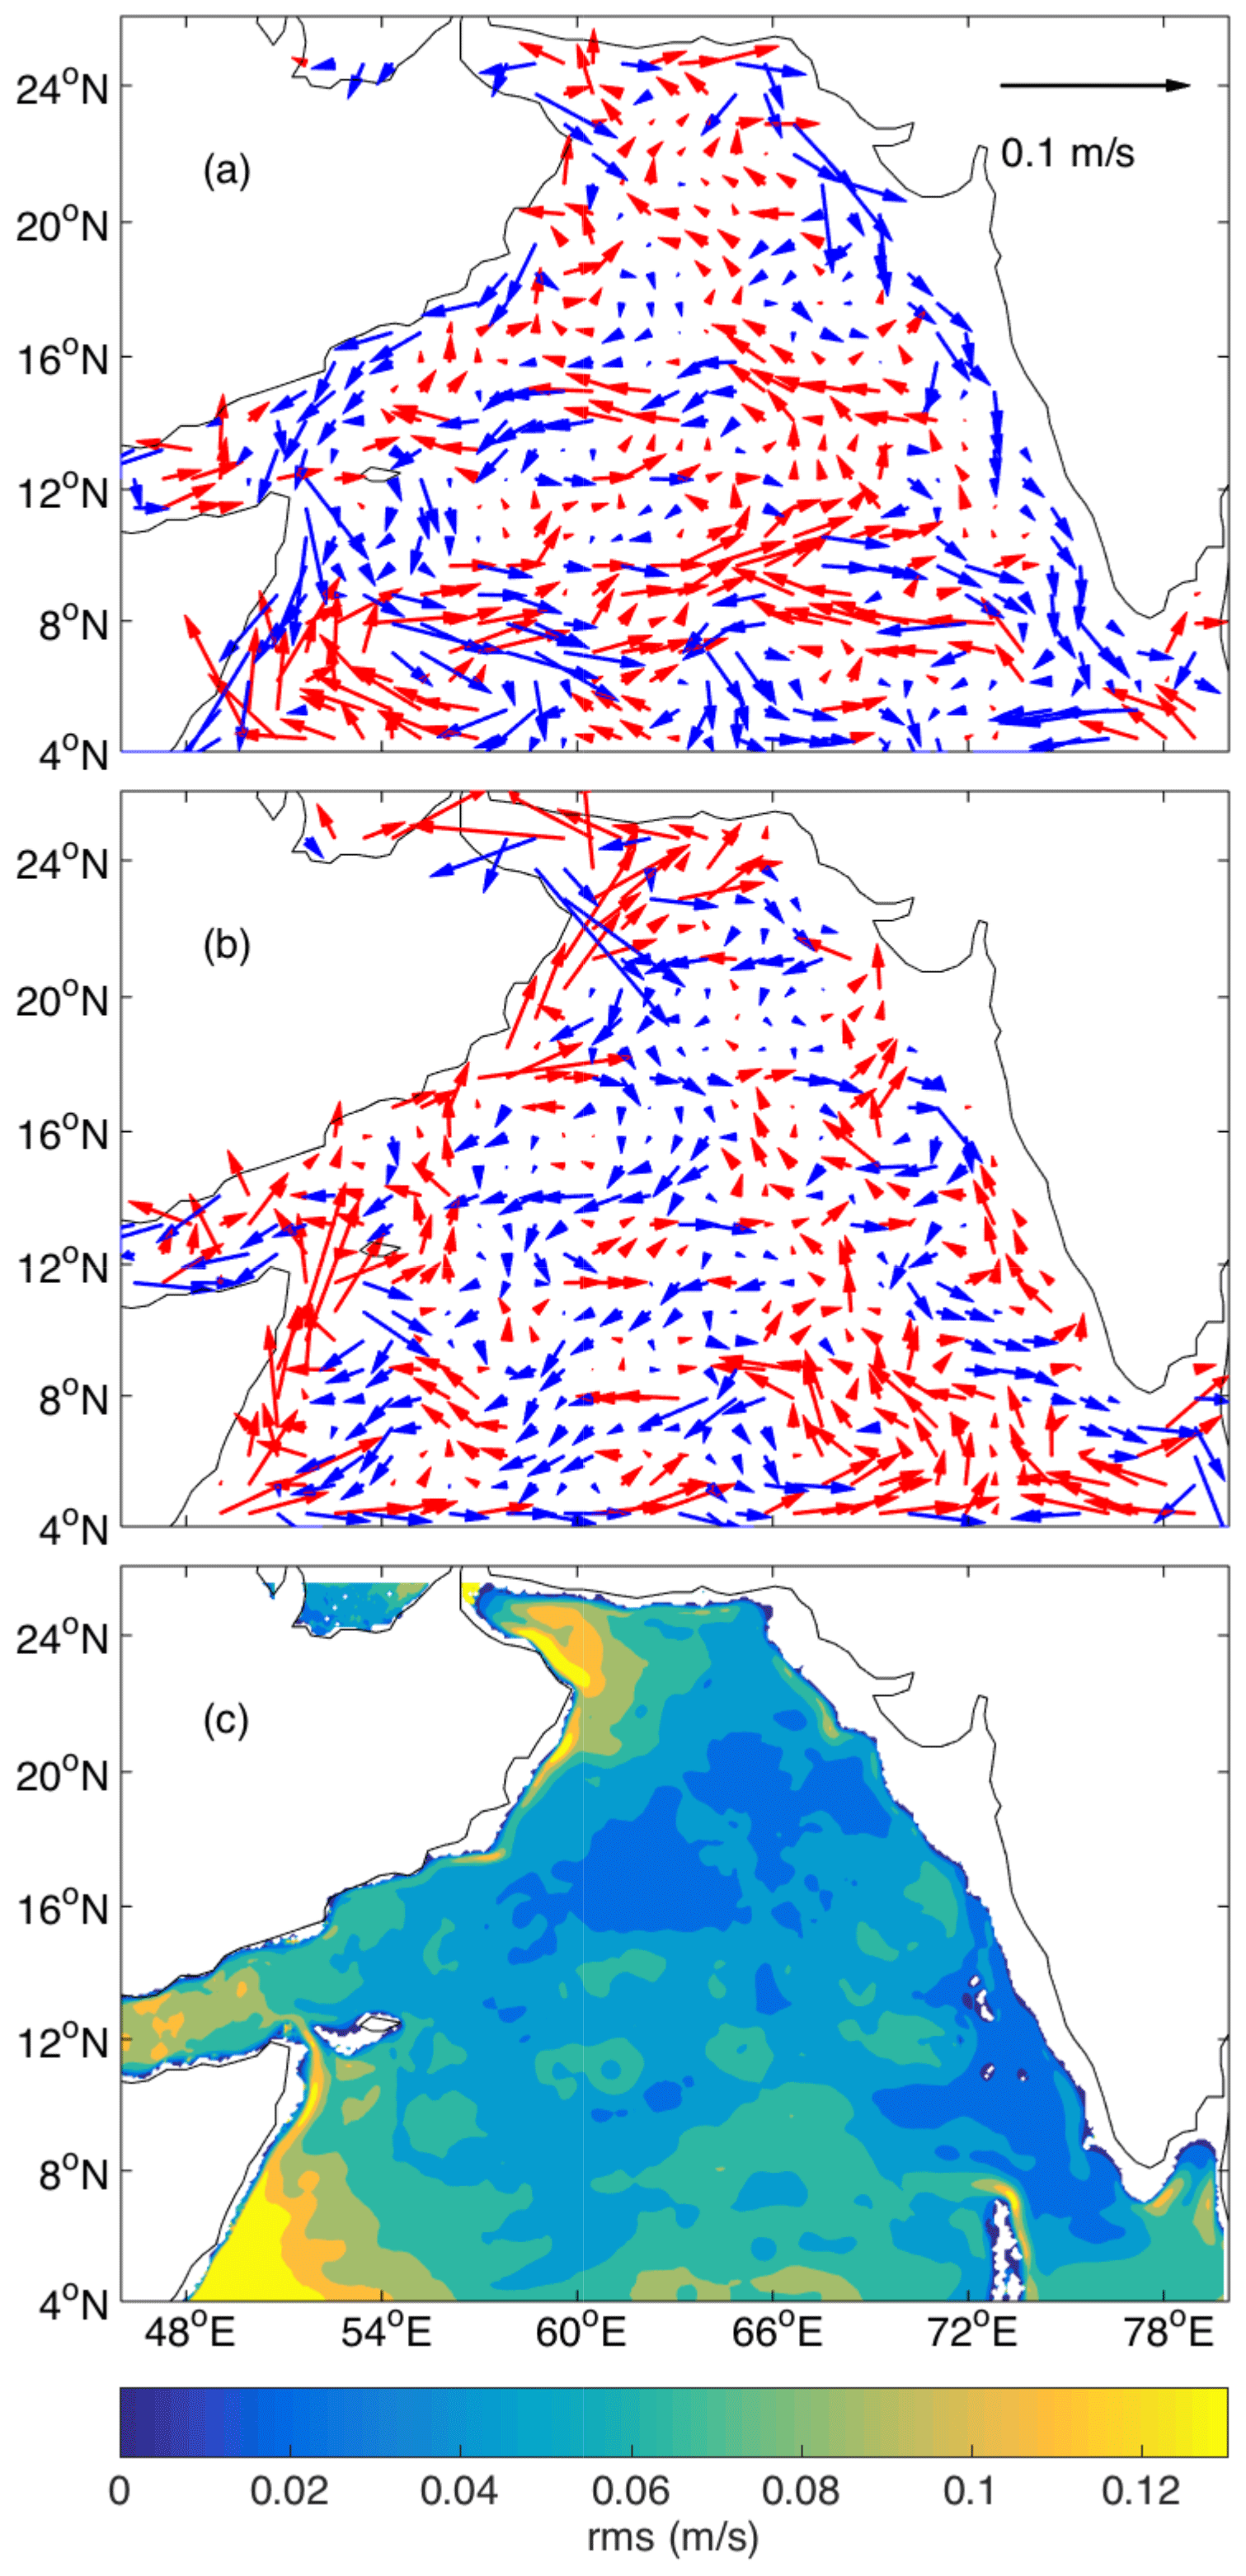
Figure 5Mean seasonal velocity for the Arabian Sea based on HYCOM for the isopycnal surface of σ=27 kg m−3 in the depth range of 450 to 500 m for the (a) northeast (November–February) and (b) southwest monsoon (June–September) averaged from 2000 to 2012. The velocity field is spatially filtered ( window) and presented on a grid with the same resolution. Northward-directed (southward-directed) currents are shown in red (blue). (c) Root mean square (rms) error of the annual mean velocities from 2000 to 2012.
3.2 Particle origins and main pathways
The presented particle pathways at intermediate depth within the AS are based on backward trajectories calculated for a time span of 8 years. Target points are located in the eastern and western part of the ASOMZ, and calculations were done on three different isopycnal levels.
Figure 6 shows exemplary trajectories connecting the target locations with the marginal seas. This subsample of trajectories already shows that the majority of particles follow distinct pathways.
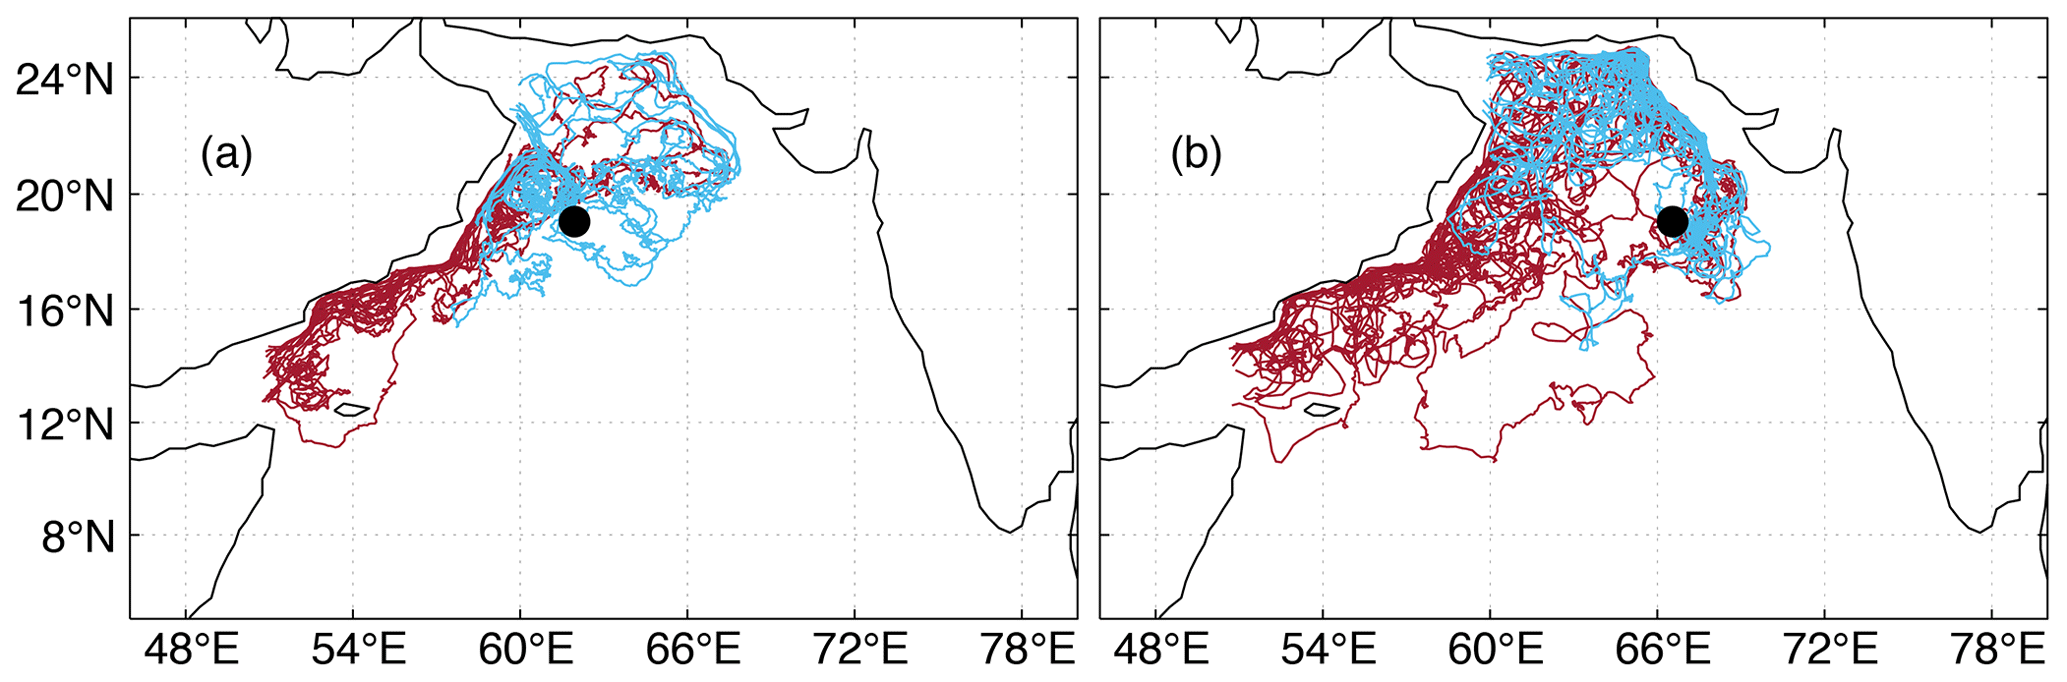
Figure 6Exemplary advective Lagrangian pathways connecting the Persian Gulf (blue) and the Red Sea (red) with the (a) western release (WR) and the (b) eastern release (ER) locations marked in black.
On their way into the eastern part of the ASOMZ most of the particles follow the northward and southward advective pathways along the eastern boundary of the AS. For the ER runs we find the highest particle probability along the northern Indian and Pakistani coastline on all three isopycnal levels (Figs. 7b, S4b, d). The northward advection of particles along the coast of India from the southeastern part of the AS is especially pronounced on the central isopycnal (Fig. 7b). A similar pattern but with lower probability is also seen on the shallower isopycnal (Fig. S4b). Both pathways along the eastern boundary of the AS at intermediate depth are confirmed by the seasonal mean circulation for the winter and summer monsoon (Fig. 5a, b).
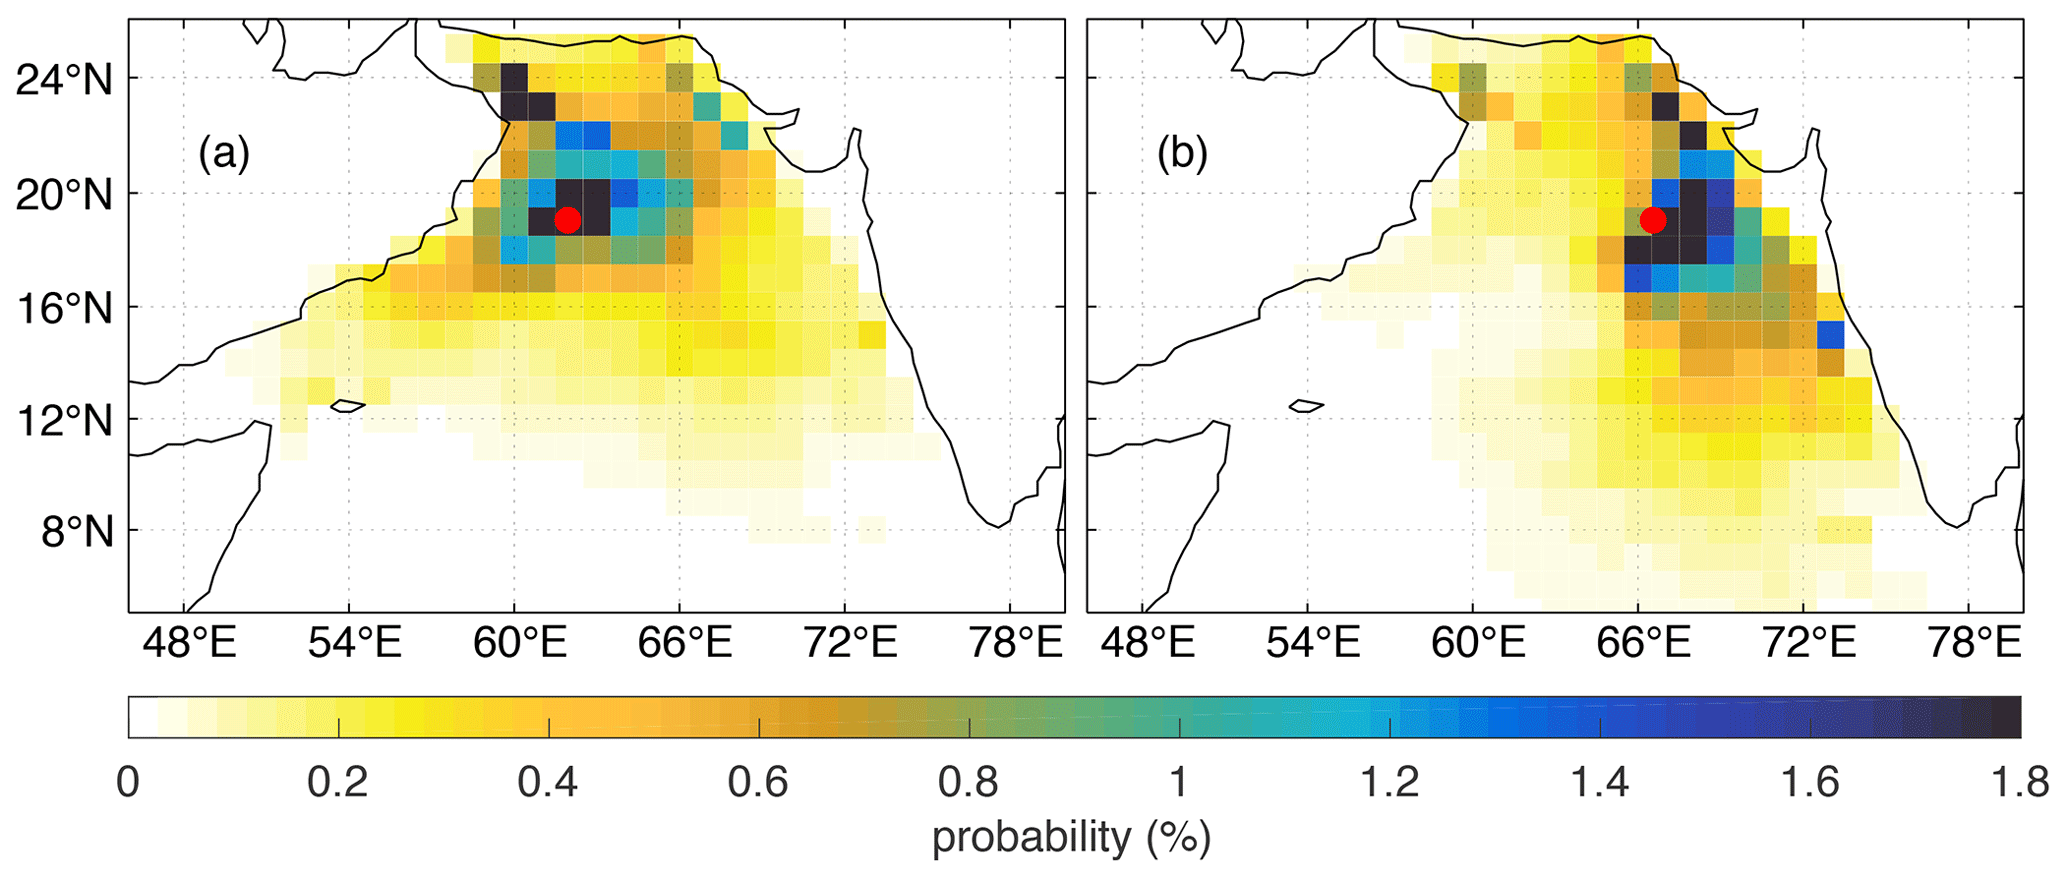
Figure 7Probability that a bin is occupied by a Lagrangian particle during the time span of 8 years for backward-trajectory calculations from (a) the western (WR) and (b) the eastern (ER) part of the ASOMZ along the isopycnal σ=27 kg m−3. Red dots mark the location of the WR and ER target points.
In the western part of the ASOMZ the highest probability of particles occurs north of the target location on all three isopycnal levels (Figs. 7a, S4a, c) but more equally spread around the target location compared to the eastern basin. This is also reflected in the high variability of the velocity field in the northwest corner of the AS (Fig. 5c). A pattern with lower probability extends in a southwest to northeast direction along the western boundary, pointing towards southward particle advection from the Gulf of Oman and the PG during the winter monsoon and northward particle advection from the RS into the western ASOMZ (Fig. 7a) during the summer monsoon.
The pattern of particle distribution after a simulation of 4 years (see Supplement Fig. S3b) confirms the particle distribution along the west coast of Indian and Pakistan seen in the patterns over the whole time series (Fig. 7b). Simulations of another 4 years backward show a wider and more equally spread distribution of particle origins that ventilate the eastern part of the ASOMZ (Fig. S3d).
The snapshot of the particle distribution after 4 years also shows the source of particles from the eastern part of the ASOMZ (Fig. S3a) for the WR. Similar to the ER, the particle origins after 8 years of simulation spread wider and more equally over the AS (Fig. S3c). After 12 years of simulation the origins of advected particles reveal no fundamental differences between the WR and ER (Fig. S3e, f). Therefore, in the following we consider the main pathways based on backward trajectories calculated for a time span of 8 years.
For two of the three major intermediate source water masses that ventilate the ASOMZ – the RSW and the PGW – the source area can be localized clearly so that it is possible to extract the particles that originate from the RS and the PG flowing through the Gulf of Aden and the Gulf of Oman, respectively. The most prominent particle pathway from the PG and the RS circles the basin clockwise along the western, northern, and northeastern boundary into the eastern ASOMZ (Fig. 8b, d). RSW spreads mostly northeastward along the coast of Yemen and Oman, where it enters the western part of the ASOMZ (Fig. 8c). Most particles spread further north along the coastline of Pakistan and India to enter the eastern basin, whereas the more direct interior pathway is less frequent (Fig. 8d). The pathway of PGW into the western part of the ASOMZ is directed southward along the coastline off Oman (Fig. 8a).
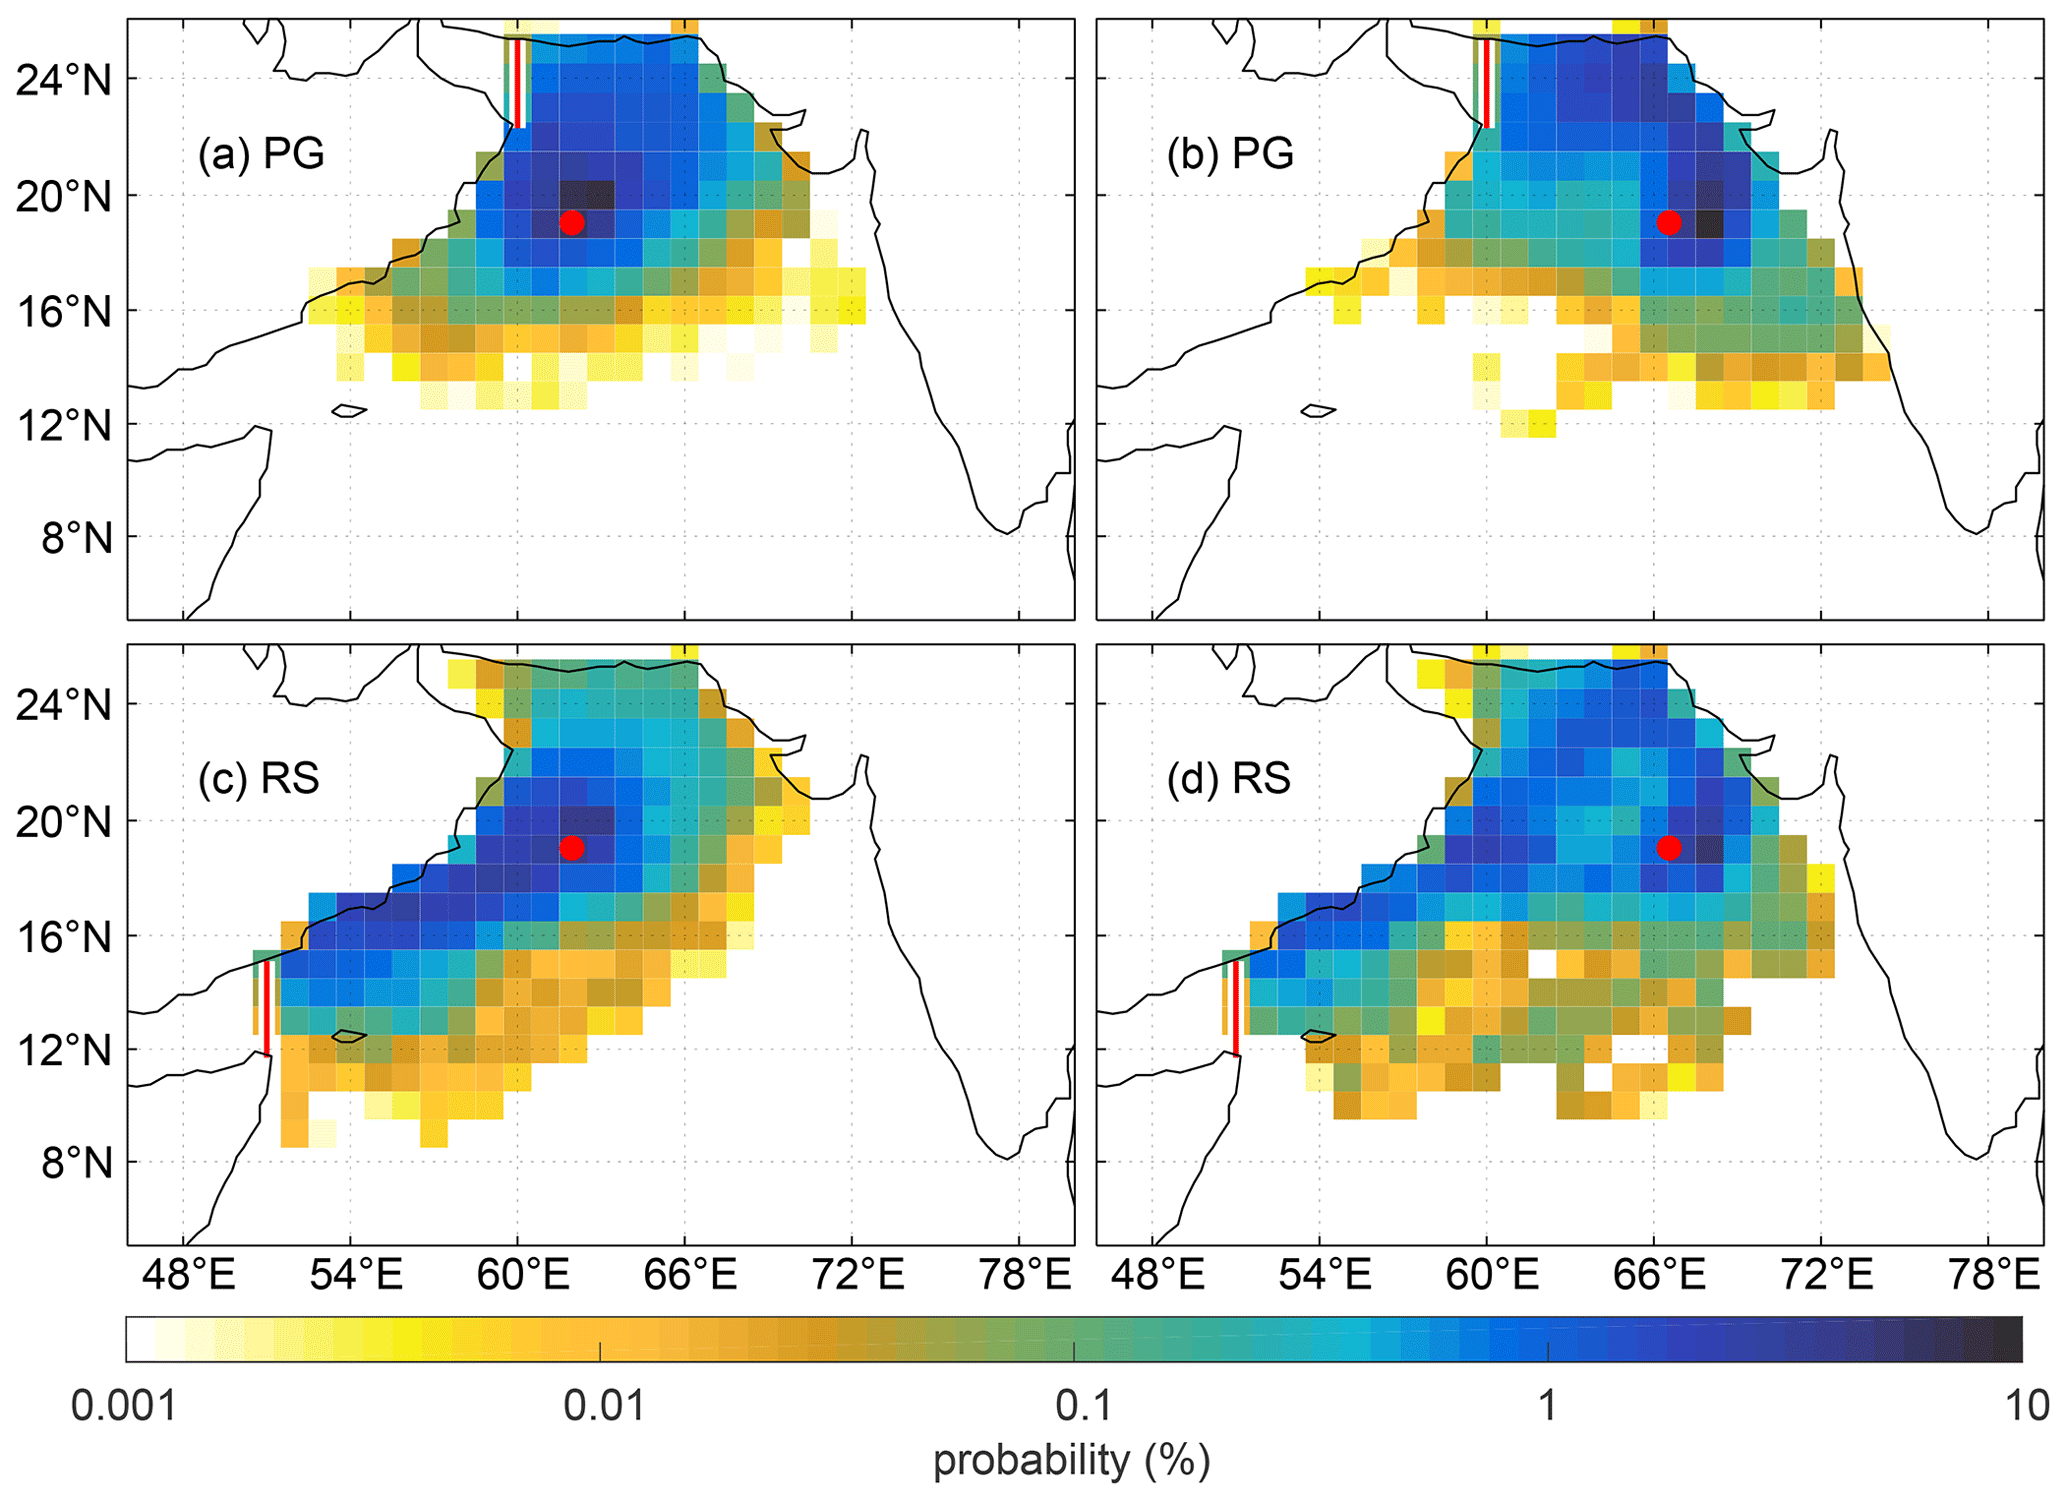
Figure 8Lagrangian particle position probability maps show the most pronounced pathways of fluid particles along the isopycnal σ=27 kg m−3 for the backward-trajectory analysis, entering the Persian Gulf from (a) WR and (b) ER and the Red Sea from (c) WR and (d) ER. Eastern (ER) and western target (WR) locations in the OMZ are marked in red, as are the sections that need to be crossed to define the source regions.
Water entering from the south at intermediate depth (ICW) shows a direct interior exchange from the eastern to the western basin in the region of the OMZ (Fig. S7). It is also noteworthy that the particles enter the AS more frequent from the southeast and tend not to follow the western boundary current on the central isopycnal. The trajectory pathways are confirmed by the velocity fields at intermediate depths, revealing prevailing northward currents in the eastern basin at about 10∘ N during the southwest monsoon (Fig. 5b) and northeastward currents in the western and central basin at about 10∘ N during the northeast monsoon (Fig. 5a).
The pattern of particle pathways associated with RSW and PGW calculated on the central isopycnal (Fig. 8) can be overall confirmed by the trajectories calculated on the shallower and deeper isopycnal levels (Figs. S5, S6). Broader pathways on the shallower isopycnal with lower values of particle probability point towards a stronger mixing in shallower depths due to the monsoon (Fig. S5). It is also noteworthy that the pathway of RSW to the eastern basin on the deeper isopycnal is more frequent in the interior of the AS than the advective pathway along the perimeter in the northern AS (Fig. S6d) in contrast to the circulation on the central isopycnal (Fig. 8d).
3.3 Particle transit time and percentage
After analysing the main pathways, in the following we focus on the point-to-point transit time of the Lagrangian particles, helping to further understand the circulation at intermediate depth. Therefore, the point-to-point transit time of particles is analysed across selected sections along their distinct pathways (see Sect. 2.2 for location of the sections). As transit time is individual for each particle, Fig. 9 shows the cumulative transit time of all particles crossing that section on the central isopycnal. Additionally, the times at which 50 % of the particles crossed the distinct sections are listed in Table 1. Herein, percentages refer to the total number of particles that crossed the section after the whole time span of the simulation (8 years).
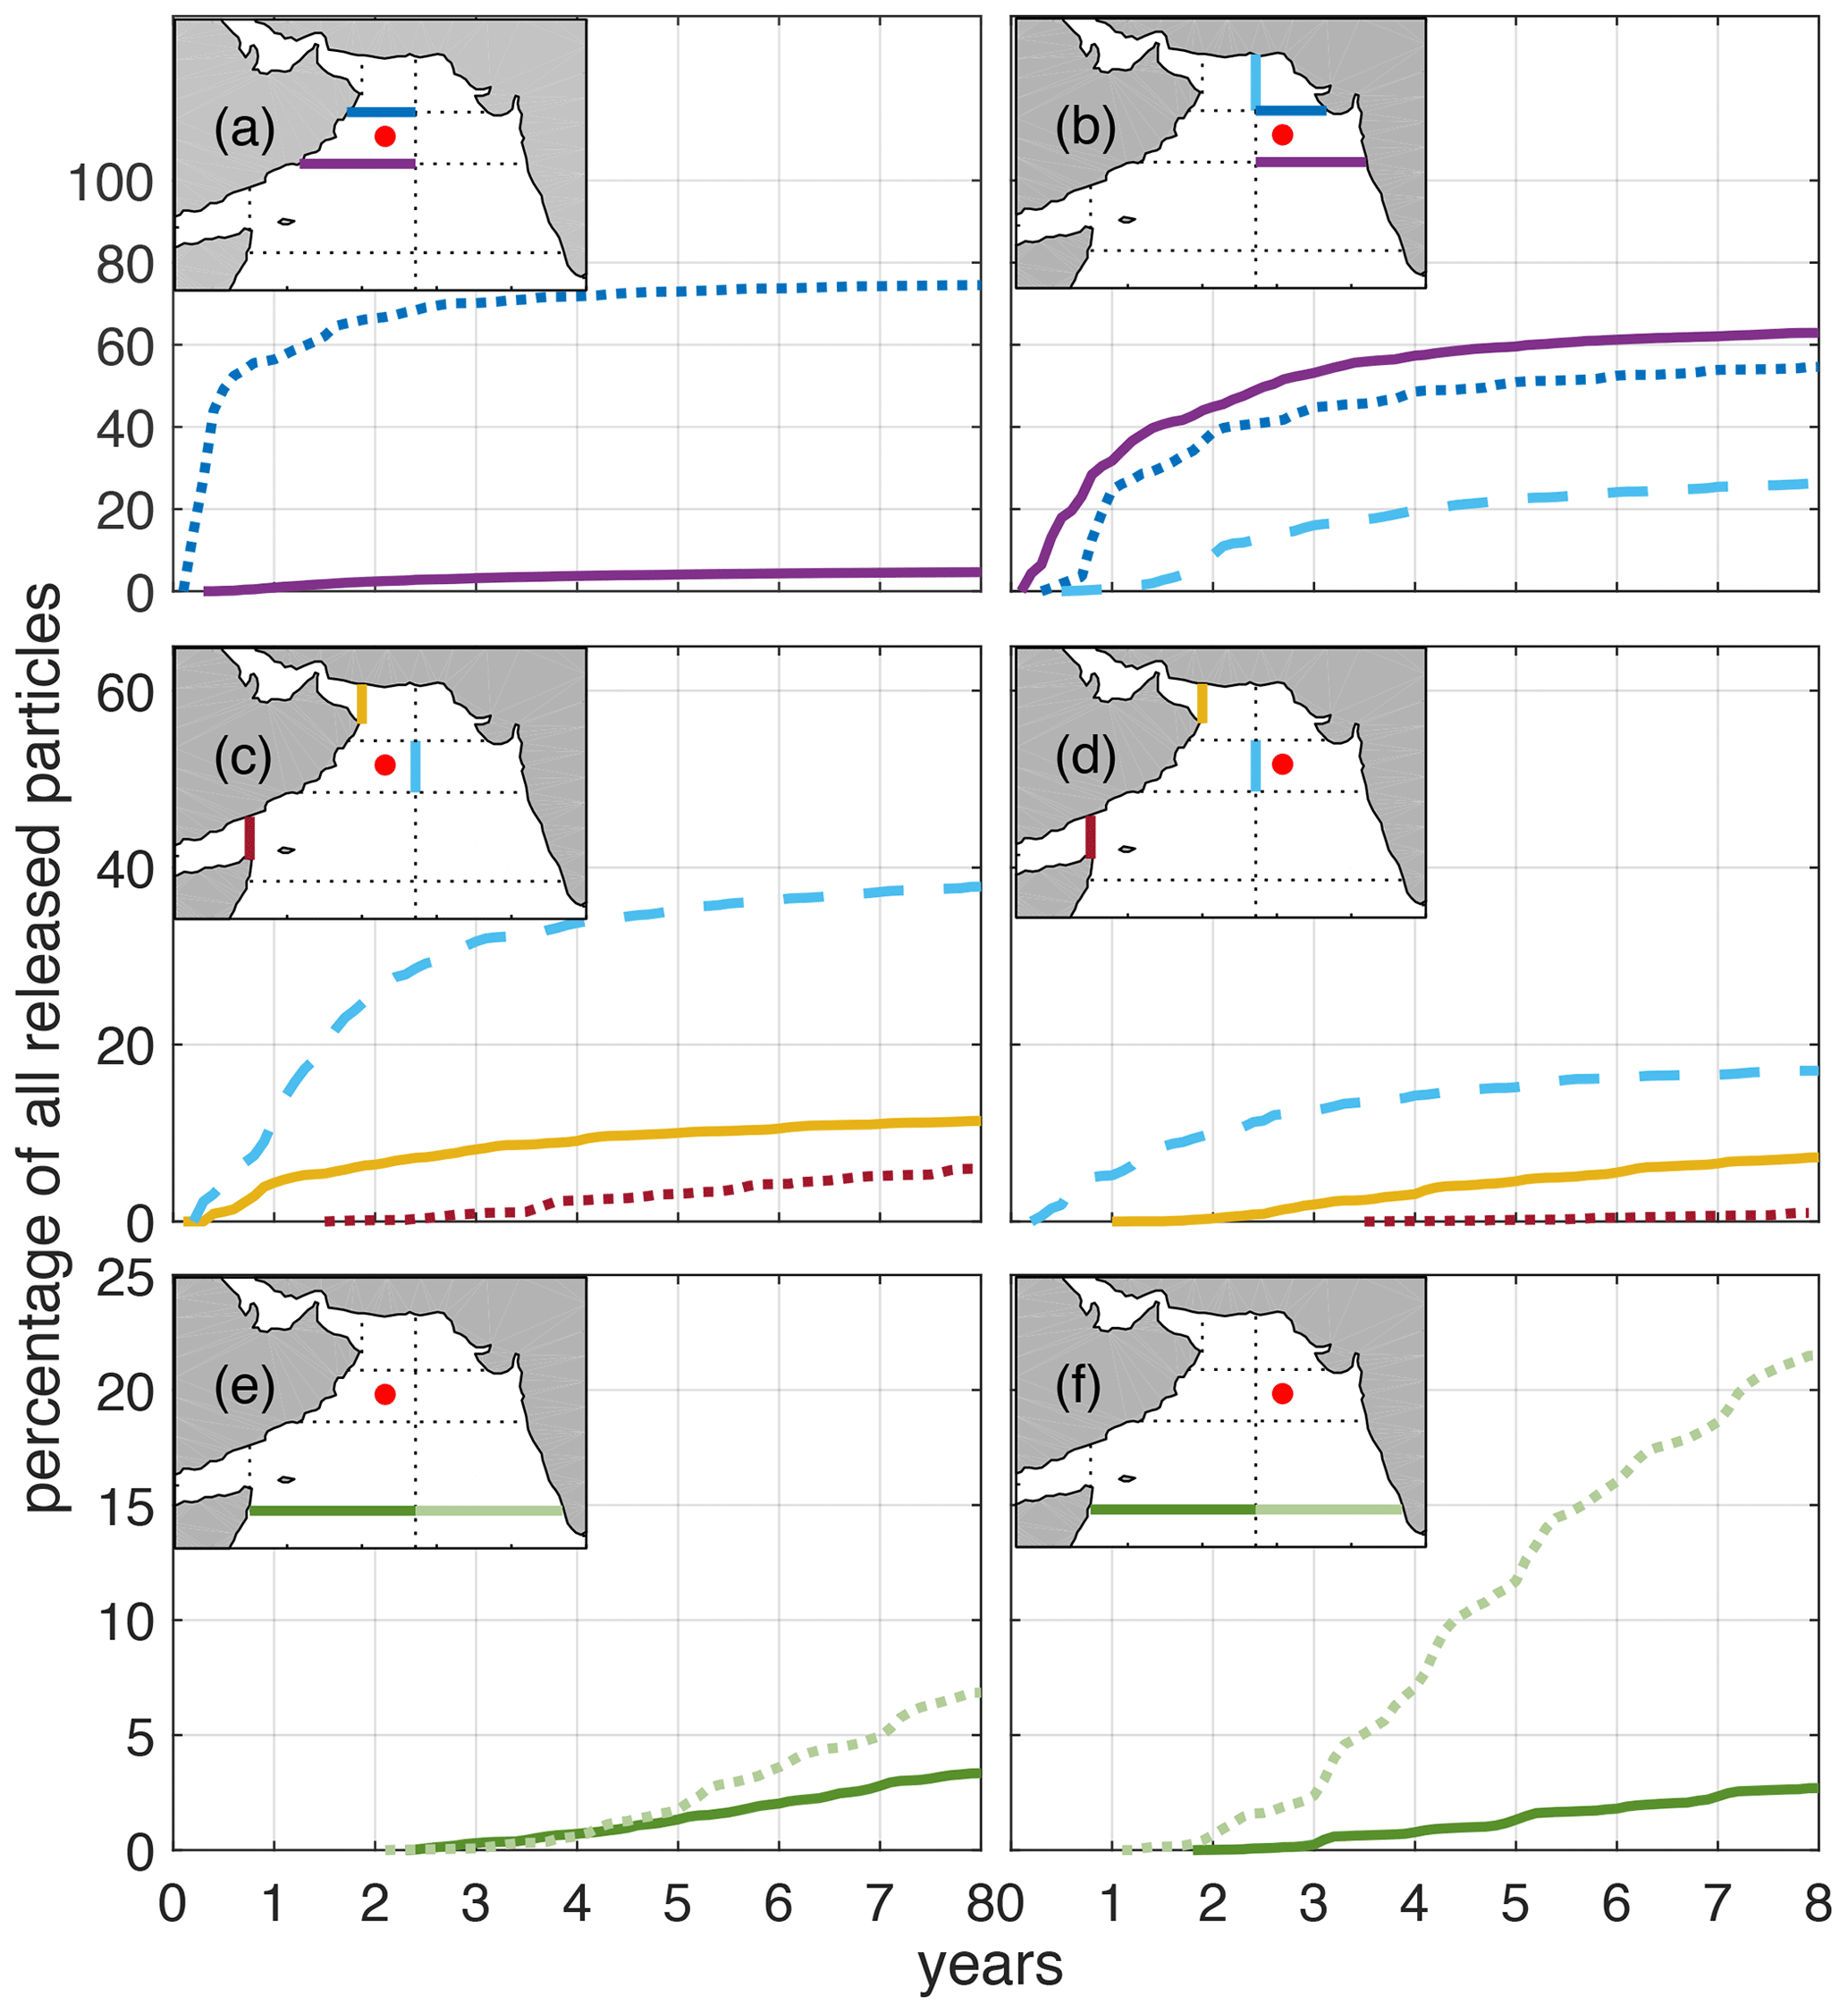
Figure 9Cumulative point-to-point transit times of Lagrangian particles calculated between distinct sections (see maps) along their main pathways and their release points in the western basin (a, c, e) and eastern basin (b, d, f), respectively. Sections are along 21∘ N shown as a dotted dark blue line and 17∘ N as a solid purple line (a, b), 64.3∘ E as a dashed light blue line (b, c, d), 60∘ E as a solid yellow line, 51∘ E as a dotted red line (c, d), and 10∘ N as a dotted light green line (east) and a solid green line (west) (e, d). The red dots mark the launching position of the backward trajectories. See Sect. 2.2 for a detailed description.
The western part of the ASOMZ is preferably ventilated from particles coming from the northern basin. Within the first year about 60 % of the released particles travel the pathway northward along the western boundary between the 21∘ N section and the WR (Fig. 9a). The number of particles travelling northward over the section at 17∘ N is much smaller. Barely 5 % of all particles cross that section during the whole calculation time (Fig. 9a).
In contrast, the numbers of particles ventilating the eastern part of the OMZ over the northern and the southern section are about the same with rates of 52 % (17∘ N) and 62 % (21∘ N) of the released particles crossing over the 8 years of calculation time (Fig. 9b). Compared to the western basin (Fig. 9a) the slope of the cumulative particle transit time curve is flatter (Fig. 9b). Thus, the point-to-point transit times of the individual particles are spread over a wider and longer time range for the ER.
In total, 28 % of the released particles travel around the perimeter of the basin (Fig. 9b), which is roughly 10 % more than the quantity of particles taking the westward interior pathway between ER and WR (Fig. 9d). However, the eastward interior pathway between WR and ER is more pronounced (Fig. 9c). The point-to-point transit times for all these sections are less than 6 months for the fastest particles and the slope of the cumulative transit time is weak, especially for particles released in the eastern ASOMZ (Fig. 9b, d), pointing towards large differences in transit times for individual particles.
Transit times from the PG and from the RS are shorter to the western basin (Fig. 9c) than to the eastern basin (Fig. 9d, Tab.1). For 50 % of all particles, the mean transit time to travel between the WR and the section in the Gulf of Oman on the isopycnal surface of 27 kg m−3 is 2 years (for values of the single runs, see Table 1). The equivalent mean transit time for the ER is 4.2 years. For 50 % of all particles, the mean point-to-point transit times to travel from the target locations to the RS section are 6.4 and 5.2 years for the ER and WR, respectively. The slope of the curves is somehow constant over the whole calculation period, especially for the transit times to the RS (Fig. 9c, d).
The AS is also ventilated from the south across 10∘ N (Fig. 9e, f). For both target points, WR and ER, the ventilation is stronger across the eastern half of the basin (Fig. 9e, f). Here again, the slope of the curves is somehow constant over the whole calculation period. For 50 % of all particles, the mean transit times between the target locations and the southeastern section of the basin are 4.8 and 6.0 years for the ER and WR and 5.4 and 5.6 years between the southwestern section and the ER and WR, respectively.
The point-to-point transit times at the shallower isopycnal are almost always quicker compared to the ones that were discussed above for the central isopycnal (Table 1). This tendency extends further down, as the deeper isopycnal has the slowest transit times.
Due to a broad distribution, the number of particles that cross the sections decreases with the distance of the particles from their target point. This also means that the remaining percentage of particles stays around the target location or in the adjacent area of one section.
3.4 Seasonal variability
The seasonal variability of certain pathways is shown by the monthly averaged cycle of the percentage of particles (Fig. 10). Some of the strongest seasonal variability is revealed by Lagrangian particles that are advected southward between the sections at 21∘ N and the target locations but with a more distinct amplitude in the western basin (Fig. 10a, b). Here the southward-travelling particles from the northern AS show a distinct maximum during the intermonsoon phase in spring (Fig. 10a). This maximum coincides with the maximum oxygen concentration in the western basin (Fig. 3a), pointing towards a southward transport of higher-oxygenated water during spring intermonsoon.
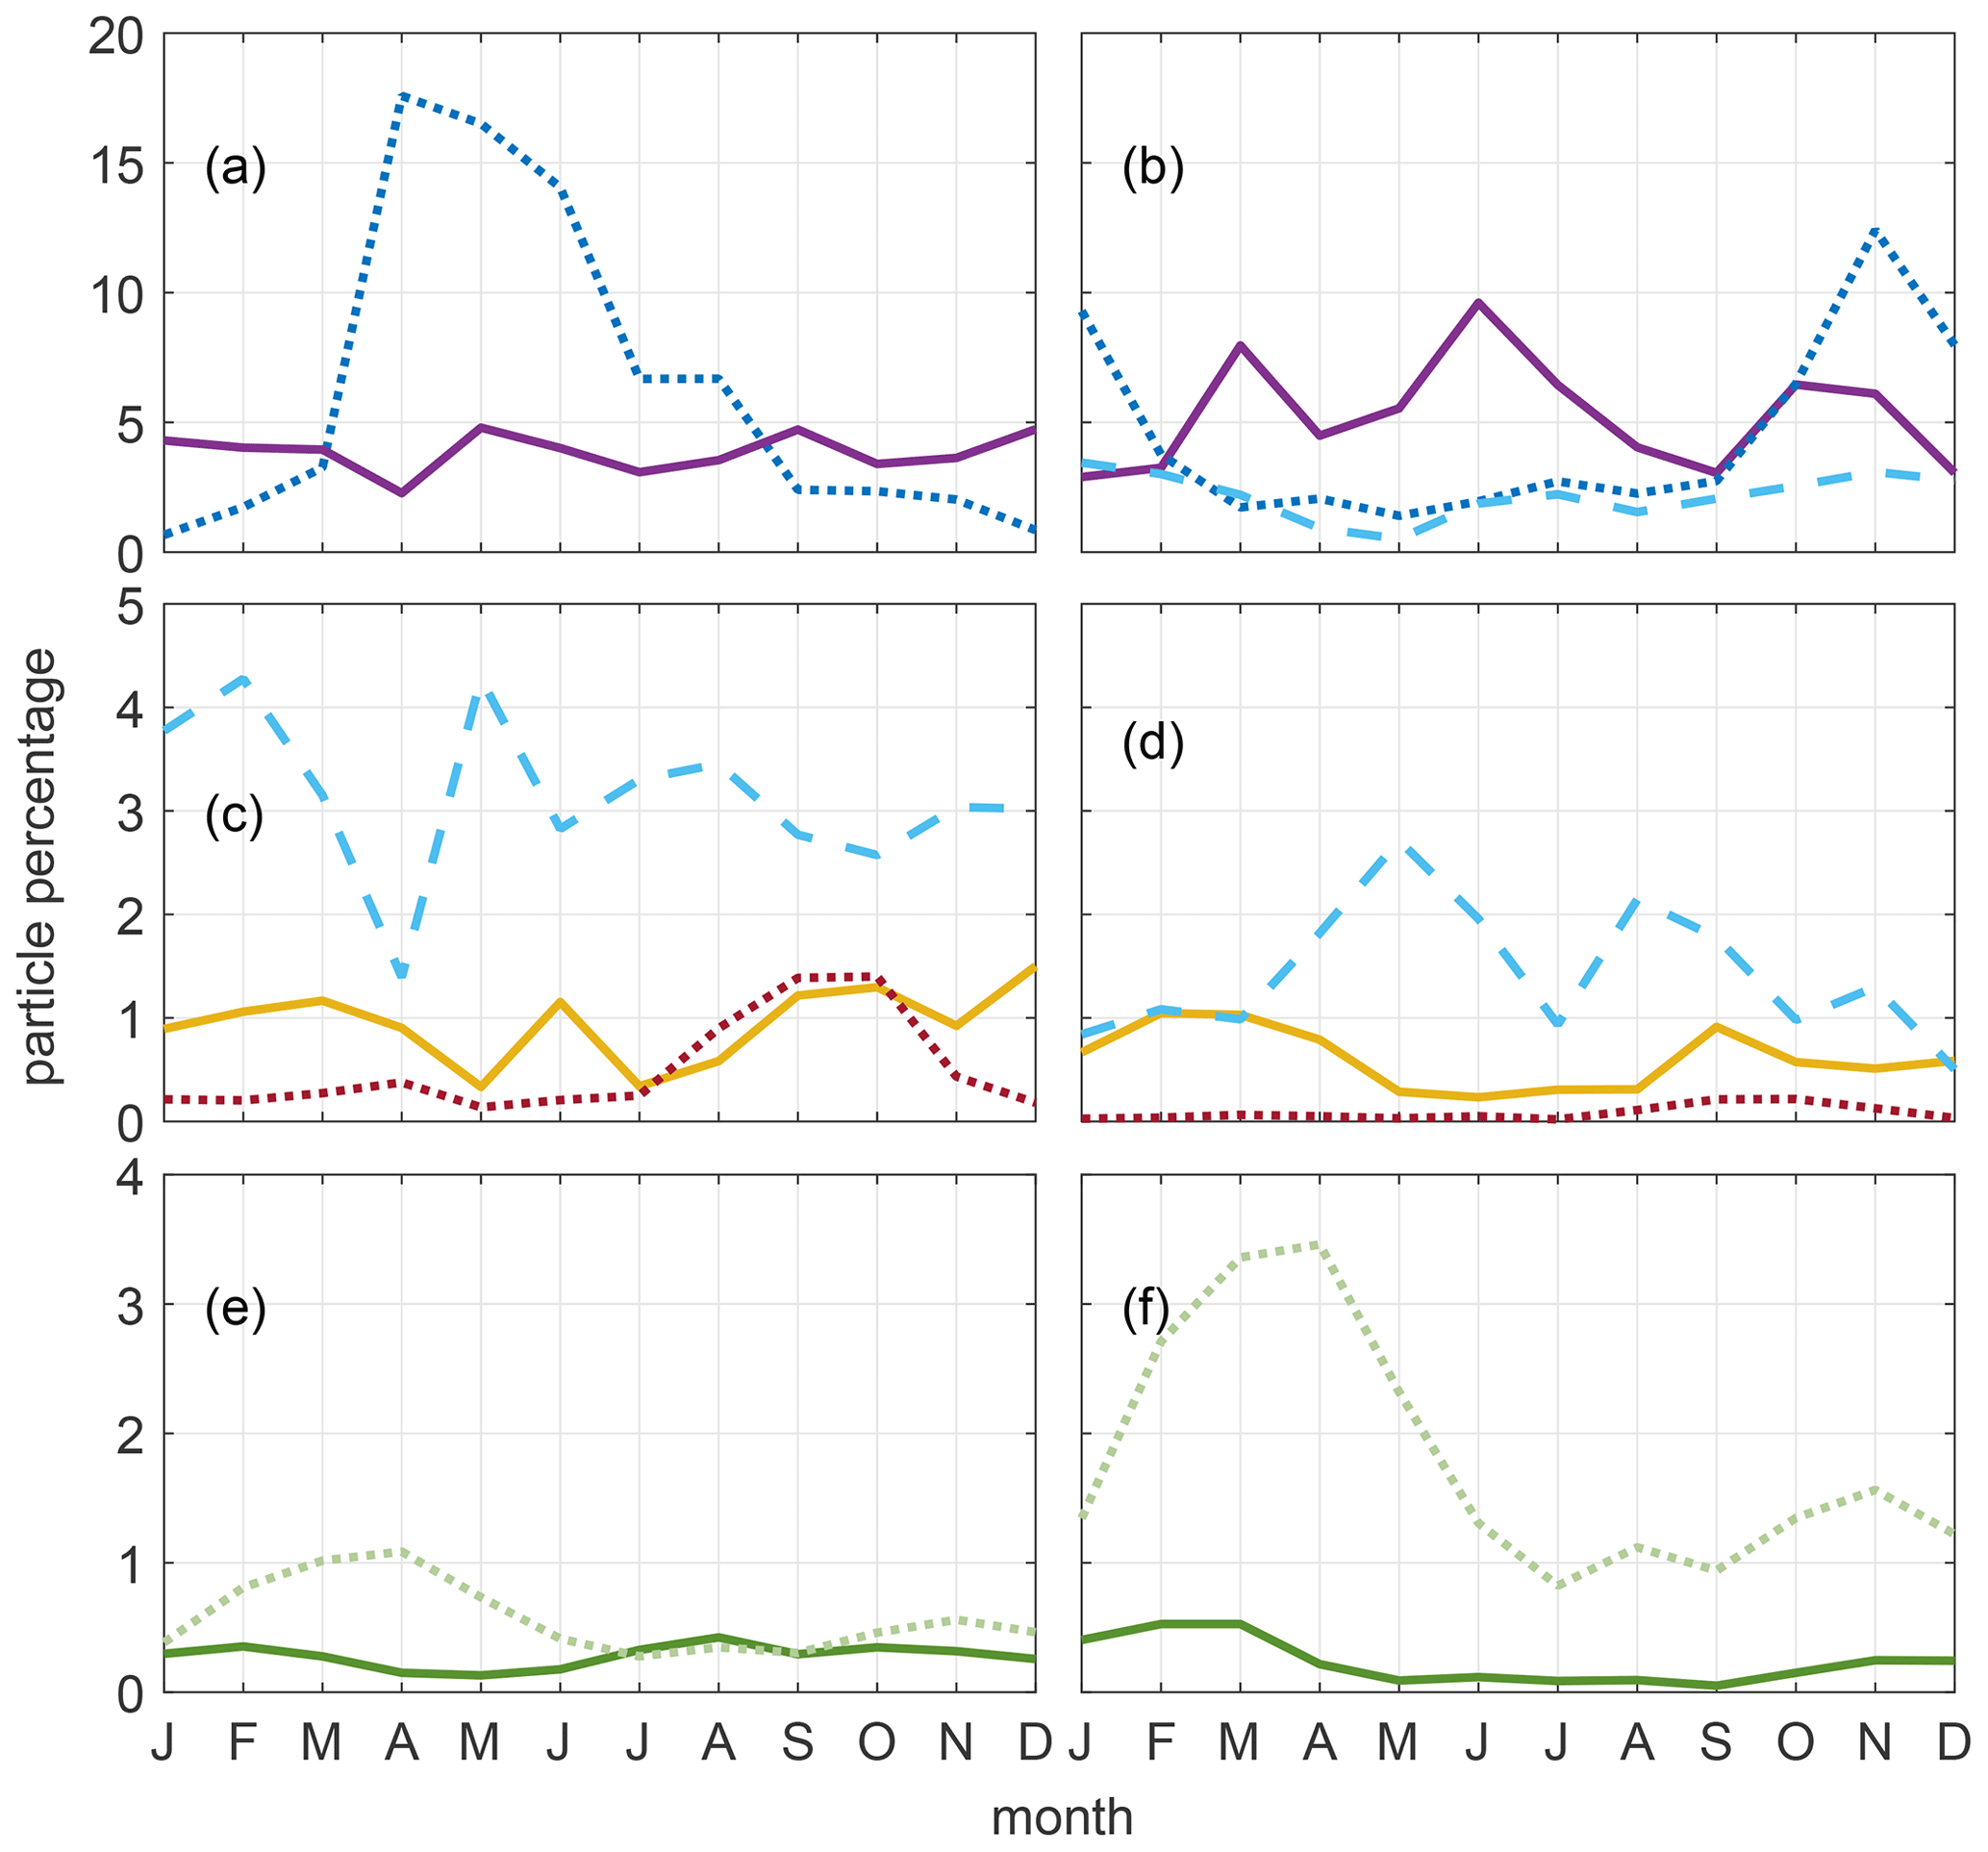
Figure 10Mean seasonal cycle of particle percentage travelling between distinct sections along their main pathways and their release points in the western basin (a, c, e) and the eastern basin (b, d, f), respectively. Sections are along 21∘ N shown as a dotted dark blue line and 17∘ N as a solid purple line (a, b), 64.3∘ E as a dashed light blue line (b, c, d), 60∘ E as a solid yellow line, 51∘ E as a dotted red line (c, d), and 10∘ N as a dotted light green line (east) and a solid green line (west) (e, d). For line colour and type, please see Fig. 9.
In contrast, in the eastern basin particles move preferably southward from the section at 21∘ N to the ER during the winter monsoon (Fig. 10b), which is also reflected in the southward eastern boundary current at intermediate depth (Fig. 5a). The eastward movement along the northern boundary across 64∘ E, which is one of the most prominent pathways of the particles into the eastern basin, is also strongest during the winter monsoon (Fig. 10b). Therefore, the minimum oxygen concentration, which can be observed in the eastern basin during the winter monsoon (Fig. 3a), might be explained by the transport of lower-oxygenated water due to the longer advection of particles. While looping around the northern part of the basin, particles cross regions with high primary production and resulting high consumption rates.
The advection of particles from the RS into the western basin increases at the beginning of the summer monsoon in July and peaks at the end of the summer monsoon in September (Fig. 10c). The northward transport along the western boundary is confirmed by the circulation at intermediate depth during the summer monsoon (Fig. 5b) and the seasonal cycle of the forward trajectories released in the RS (not shown). The same seasonal cycle is revealed for advection from the RS into the eastern basin, although it is weaker (Fig. 10d).
The transport of Lagrangian particles from the PG into the eastern basin shows a weak seasonal cycle, which peaks at the end of the winter monsoon (Fig. 10d). However, the transport of particles from the PG into the western basin (Fig. 10c) does not show a distinct seasonal cycle and neither does the interior transport from the eastern OMZ into the western OMZ (Fig. 10c), reflecting the high variability in the AS. The spreading of forward trajectories out of the PG reveals a weak seasonal cycle of particles moving further into the mid-AS and along the northern coast during the summer monsoon, whereas during the winter monsoon particles stay closer to the western coast and travel southward (not shown).
The eastward transport of particles along the northern boundary is weakest in the spring intermonsoon season (Fig. 10b). At the same time a higher direct interior transport from the western to the eastern half of the ASOMZ can be observed (Fig. 10d). The northward transport into the AS across 10∘ N mainly takes place at the eastern part of the basin, showing a maximum of the seasonal cycle during the spring intermonsoon (Fig. 10e, f). Hence, the maximum oxygen concentration at intermediate depth in spring (Fig. 3a) might be associated with the northward and eastward transport of higher-oxygenated water into the eastern basin (Fig. 10b, d, f). The northward transport into the AS is weak at the western side of the basin in comparison to the eastern side and reveals a weak seasonal cycle (Fig. 10e, f).
3.5 Trajectory error estimation and interannual variability
One source of error arises from the calculation technique itself by adding subscale diffusion and random walk at the coastlines. To predict the discrepancy of that error, five runs were performed with an identical setup (see Sect. 2.4). The percentage of trajectories reaching the PG and RS as well as the southern Indian Ocean, and their mean transit times, have standard deviations of 0.13, 0.01, and 0.20 (0.21) for PG particle percentage, RS particle percentage, and ICW east (west) particle percentage, respectively. These differences are not distinguishable in the particle probability maps.
As discussed earlier in Sect. 2.2 a different value for the diffusivity coefficient does not change the results significantly. Also, the reduction of the number of released particles from 50 000 to 10 000 for the runs of 8 years (Table 1) has no remarkable effect (Sect. 2.2).
Furthermore, particle probability maps for the simulations performed with climatological velocity values over the duration of 13 years do not differ from the maps of runs that were performed with the continuous velocity data as described above. Nonetheless, the particle percentages and transit times for the source regions differ. The highest discrepancy is a deviation of 30 % for the percentage of particles that travel from the PG to the western part of the ASOMZ. Other runs show discrepancies between 4 % and 6 % in particle percentages. A year-to-year time series analysis of the velocities shows strong damping for the climatology having peak velocities of 0.2 compared to about 0.8 m s−1 (not shown here).
To test the spatiotemporal variability, runs with the length of 8 years were performed with a temporal offset of 2 years between the runs. Again, the particle probability maps (Fig. 7) show similar results among each other (not shown here). Concerning the standard deviations of particle percentages reaching the source regions, values lie between 0.3 for particles travelling between the RS and ER and 8.6 for particles travelling form the PG to the WR. These huge differences in particle quantity travelling from the marginal seas into the ASOMZ in different years, as well as the comparison with climatological velocity runs, suggest a dependency on interannual variabilities. These are probably linked to the variability in monsoon strength that influences the intermediate circulation in the AS. Therefore, the analysis of seasonal variability was performed with all three runs of each target location (Table 1) to get a more confident result and better travel times, smoothing out possible burst of years with strong ventilating currents.
Due to the small number of runs, it is not possible to give an estimation error, but the range within which the values spread is given as discussed above.
The seasonal cycle of the Asian monsoon has a strong impact on the Arabian Sea circulation from the surface to intermediate depths. The western boundary circulation reverses direction from a strong northward flow in summer (Fig. 5a) to a weaker southward flow in winter (Fig. 5b) even at 450–500 m of depth. On annual average these flow variations become a northward-directed western boundary current, as previously found by Schott and McCreary (2001), with the strongest variability off the Somali and Omani coast (Fig. 5c).
During the summer monsoon enhanced upwelling occurs along the western boundary, leading to the incidence of vigorous phytoplankton blooms and further leading to one of the highest observed biological productivities in the world ocean (Qasim, 1982). Hence, the core of the ASOMZ is expected to be at the same location below, at intermediate depth, since high consumption rates are linked to high productivity rates above. However, the core of the ASOMZ is shifted away from that region and more pronounced in the eastern basin than at the expected area along the western boundary (Figs. 3, 4; Acharya and Panigrahi, 2016). Suboxic conditions with an oxygen concentration less than 10 µmol kg−1 can be found between 200 and 1000 m of depth (Fig. 2) with weak annual variability in the deeper core according to gridded observational data (not shown). The east–west contrast in oxygen concentrations found in the updated WOA13 data (Fig. 3) confirms the results shown in Resplandy et al. (2012), who used a prior version of the WOA data.
However, oxygen concentrations from monthly mean gridded observations indicate a weak seasonal variability in the upper level of the ASOMZ, showing higher oxygen values in the spring intermonsoon, which are more pronounced in the eastern basin, and slightly higher oxygen at the end of the winter monsoon only for the western basin (Fig. 3a). This ventilation goes along with a shallowing of the suboxic layer in May and June (Fig. 3b). This seasonal variability was observed earlier by Sarma (2002) and Banse et al. (2014), showing higher oxygen values in the northern AS at around 300 m of depth during the northeast monsoon.
In this study the main pathways of computed advective Lagrangian particles in the AS are determined on three different layers at the top, middle, and bottom of the ASOMZ, as is their temporal and spatial variability. To consider the east–west contrast of the ASOMZ, one target location for particles is placed in the eastern basin where the suboxic layer is thickest during the winter monsoon. The other target location is in the western part of the ASOMZ where primary production is strongest during the summer monsoon.
Presented results from the trajectory calculations on the central isopycnal density layer (27 kg m−3) reveal a main advective pathway into the eastern part of the ASOMZ along the perimeter of the basin (Fig. 8b, d). At the beginning of the summer monsoon, RSW spreads out of the Gulf of Aden (Fig. 11b) and flows northward along the coast of Oman, following the direction of the Somali Current (Fig. S1c). In the northwestern part of the basin where the Gulf of Oman merges with the AS, PGW is advected southward throughout the year with limited reversals (Fig. 11a–c). Observations confirm the small seasonal variations of the PGW outflow (Johns et al., 2003), which can be influenced by cyclones (Wang et al., 2013). The eastward flow along the northern boundary and the southward flow along the Indian coastline into the eastern basin peak during the winter monsoon (Fig. 11a). This winter monsoon season is crucial for the ventilation of the OMZ with PGW as was shown by Lachkar et al. (2019) with a model sensitivity study. Lagrangian particles cross regions with high primary production during long-distance advection while circulating in the northern part of the basin. A study of seasonal vertically migrating scattering layers reveals a rapid increase in biomass in the northern Arabian Sea in the layer between 250 and 450 m of depth during the period of June to November (Wang et al., 2014). Resulting high consumption rates in the outflow region of the Gulf of Oman in winter (Fig. 11a, Acharya and Panigrahi, 2016; Lachkar et al., 2018) might lead to a transport of lower-oxygenated water, which might be responsible for the minimum oxygen concentration in the eastern basin in winter (Fig. 3a).

Figure 11Schematic of the main advective pathways of the water masses for the (a) winter monsoon, (b) summer monsoon, (c) spring intermonsoon, and (d) autumn intermonsoon seasons. See also Fig. 1. The dark green dots indicate regions of strong net primary production as shown in Acharya and Panigrahi (2016). The dotted line in (b) marks the main upwelling region along the coast during the summer monsoon. The wind direction during monsoon phases is indicated by the black arrows (a, b). The green patches sketch the location of the Arabian Sea OMZ as in WOA13 data: light green marks the area where the 10 µmol kg−1 layer is thicker than 650 m, and the darker green marks the area where the 10 µmol kg−1 layer is thicker than 950 m.
A more direct interior pathway, especially from the RS into the eastern basin south of 21∘ N, is negligible, confirming previous studies (Fig. 6; Lachkar et al., 2016). Tracking the particles of RSW by using a water mass analysis, Acharya and Panigrahi (2016) reveal a maximal percentage of spreading along the coastlines but no propagation of RSW in the interior basin. However, the direct interior exchange of water between the eastern and western interior part of the ASOMZ shows high variation, which is maximal in May (Fig. 10d). The interior pathway between the eastern and western basin for the exchange of water masses becomes more pronounced on the deeper isopycnal surface (27.4 kg m−3; Fig. S6d).
Particle probability maps (Fig. 7) reveal the advection of particles from the southeast into the eastern part of the ASOMZ. The contribution of particles advecting into the eastern basin along the Indian coast is similar from the north and the south (Fig. 9b). Although the surface currents (Fig. S1a, c) along the coast of south India reverse with the changing monsoon winds (Schott and McCreary, 2001), the northward transport at intermediate depth shows no obvious seasonal cycle (Fig. 10b).
A more pronounced ventilation from the south (8∘ N) in the eastern AS was described earlier by Acharya and Panigrahi (2016). Even though ICW spreads northward uniformly across the basin at intermediate depth (You and Tomczak, 1993), our results suggest that particles enter the AS more predominantly along the eastern boundary (Fig. 11; Schott and McCreary, 2001) than from the western boundary, as they do in the thermocline (You and Tomczak, 1993). The maximum oxygen concentration at intermediate depth in May (Fig. 3a) might therefore be associated with the maximum northward transport into the eastern basin during the spring intermonsoon (Fig. 11c) and the supply of higher-oxygenated water. The northward advection into the eastern basin along the Indian coast shows a second maximum during the winter monsoon (Fig. 11a), which can be confirmed by observations showing a supply of oxygenated ICW during that time (Shenoy et al., 2020).
RSW spreads out of the Gulf of Aden during the summer monsoon (Fig. 11b) and passes the western basin OMZ on its way northward, with a peak in the autumn intermonsoon phase (Fig. 11d). These results are in agreement with the study of Beal et al. (2000), who tracked the spreading of RSW by salinity properties. Compared to the strong variability of the western boundary current, the seasonal oxygen cycle in the western basin is weak (Fig. 3a). This could be explained by the loss of oxygen via consumption when RSW passes the area of strong primary production off the coast of Oman (Acharya and Panigrahi, 2016) during the summer monsoon (Fig. 11).
The western ASOMZ is ventilated from the north with PGW not only along the boundary current but also with water that resided in or circled the northern basin of the AS. Particle advection into the western basin from the north is strongest during the spring intermonsoon (Fig. 11c). This is confirmed by the maximum oxygen concentration during May (Fig. 3a). However, Prasad et al. (2001) stated that PGW spreads further down the Omani coast during the winter monsoon with the western boundary undercurrent and more equally to the eastern basin around the northern pathway during the rest of the year. The same spreading patterns of PGW can also be confirmed on the central isopycnal surface. The seasonal cycle of oxygen concentration shows a second peak in February (Fig. 3a).
Advective pathways from the marginal seas, which are bound to the western basin, are shorter to the western part of the OMZ than to the eastern part, especially for water stemming from the Gulf of Aden. The analysis of a point-to-point transit time of particles that reach the marginal seas shows that the mean transit time for 50 % of the particles that travel between the PG and the ER is 4.2 years but just 2 years for the WR. Particles from the RS have a mean point-to-point travel time of 6.4 and 5.2 years to the ER and WR, respectively. However, prolonged transit times alone are not sufficient to explain the different characteristics in the eastern and western part of the ASOMZ, especially when considering the strong seasonal variability of the advective pathways.
The comparison of travel times and particle percentages between different years (Table 1) as well as with climatological runs shows high discrepancies and standard deviations associated with a strong interannual variability that is likely driven by the strength of the monsoon forcing.
Another point that underlines the connection between monsoon forcing and strength as well as variability of water mass advection into the ASOMZ is the comparison between the results from three isopycnal layers (Table 1). The transit times become longer with increasing depths, pointing towards weaker currents and circulation.
However, more runs are required to calculate reliable statistics to further validate ventilation times and percentages of the contribution of water masses to advection. In addition, extended time series are needed to confidently predict interannual variabilities. Nevertheless, the simplified backward-trajectory approach seems to be a good method for prediction of the seasonality of advective pathways into the ASOMZ.
The seasonal variability of advective pathways into the ASOMZ agrees well with the weak seasonal oxygen cycle and shows clear differences between the eastern and western basin. Still, the oxygen content of advected water masses is strongly influenced by the strength and seasonality of biogeochemical processes in the AS. Nonetheless, we conclude that advection of water mass plays a crucial role for the eastward shift of the ASOMZ and might also be responsible for the maintenance of low oxygen in the ASOMZ throughout the year. However, we cannot state whether the physical or biogeochemical processes play the dominant role in the seasonal variability of the ASOMZ based on this method.
The 1∕12∘ global HYCOM+NCODA Ocean Reanalysis output is publicly available from the Center for Ocean–Atmospheric Prediction Studies (COAPS) at http://HYCOM.org (http://tds.hycom.org/thredds/catalogs/GLBu0.08/expt_19.1.html; last access: 24 September 2019). The WOA13 data can be freely downloaded from the National Oceanic and Atmospheric Administration (NOAA; https://www.nodc.noaa.gov/cgi-bin/OC5/woa13/woa13oxnu.pl; https://www.nodc.noaa.gov/cgi-bin/OC5/woa13/woa13.pl; last access: 10 April 2019).
The supplement related to this article is available online at: https://doi.org/10.5194/os-16-1459-2020-supplement.
HS, RC, and MV conceived the study. HS handled all the data and performed the simulations. All authors discussed, wrote, and modified the paper.
The authors declare that they have no conflict of interest.
This article is part of the special issue “Ocean deoxygenation: drivers and consequences – past, present and future (BG/CP/OS inter-journal SI)”. It is not associated with a conference.
Special thanks go to Professor Andreas Oschlies, my PhD supervisor, who gave me time and support to continue this work. Financial support was received through GEOMAR. This work is a contribution of the Deutsche Forschungsgemeinschaft (DFG) supported project “Sonderforschungsbereich 754: Climate–Biogeochemistry Interactions in the Tropical Ocean” (http://www.sfb754.de, last access: 25 November 2020). The 1∕12∘ global HYCOM+NCODA Ocean Reanalysis was funded by the US Navy and the Modelling and Simulation Coordination Office. Computer time was made available by the DoD High Performance Computing Modernization Program. We thank the anonymous reviewers for their helpful feedback.
The article processing charges for this open-access publication were covered by a Research Centre of the Helmholtz Association.
This paper was edited by Minhan Dai and reviewed by three anonymous referees.
Acharya, S. S. and Panigrahi, M. K.: Eastward shift and maintenance of Arabian Sea oxygen minimum zone: Understanding the paradox, Deep-Sea Res. Pt. I, 115, 240–252, https://doi.org/10.1016/j.dsr.2016.07.004, 2016.
Bange, H. W., Naqvi, S. W. A., and Codispoti, L.: The nitrogen cycle in the Arabian Sea, Progr. Oceanogr., 65, 145–158, https://doi.org/10.1016/j.pocean.2005.03.002, 2005.
Banse, K., Naqvi, S. W. A., Narvekar, P. V., Postel, J. R., and Jayakumar, D. A.: Oxygen minimum zone of the open Arabian Sea: variability of oxygen and nitrite from daily to decadal timescales, Biogeosciences, 11, 2237–2261, https://doi.org/10.5194/bg-11-2237-2014, 2014.
Beal, L. M., Ffield, A., and Gordon, A. L.: Spreading of Red Sea overflow waters in the Indian Ocean, J. Geophys. Res., 105, 8549–8564, https://doi.org/10.1029/1999JC900306, 2000.
Beal, L. M., Hormann, V., Lumpkin, R., and Foltz, G. R.: The response of the surface circulation of the Arabian Sea to monsoonal forcing, J. Phys. Oceanogr., 43(9), 2008-2022, https://doi.org/10.1175/JPO-D-13-033.1, 2013.
Bleck, R.: An oceanic general circulation model framed in hybrid isopycnic-Cartesian coordinates, Ocean Model., 4, 55–88, https://doi.org/10.1016/S1463-5003(01)00012-9, 2002.
Bleck, R. and Benjamin, S. G.: Regional Weather Prediction with a Model Combining Terrain-following and Isentropic Coordinates, Part I: Model Description, Mon. Weather Rev., 121, 1770–1785., https://doi.org/10.1175/1520-0493(1993)121<1770:RWPWAM>2.0.CO;2, 1993.
Bleck, R. and Boudra, D. B.: Initial Testing of a Numerical Ocean Circulation Model Using a Hybrid (Quasi-Isopycnic) Vertical Coordinate, J. Phys. Oceanogr., 11, 755–770, https://doi.org/10.1175/1520-0485(1981)011<0755:ITOANO>2.0.CO;2, 1981.
Breitburg, D., Levin, L. A., Oschlies, A., Grégoire, M., Chavez, F. P., Conley, D. J., Garçon, V., Gilbert, D., Gutiérrez, D., Isensee, K., Jacinto, G. S., Limburg, K. E., Montes, I., Naqvi, S. W. A., Pitcher, G. C., Rabalais, N. N., Roman, M. R., Rose, K. A., Seibel, B. A., Telszewski, M., Yasuhara, M., and Zhang, J.: Declining oxygen in the global ocean and coastal waters, Science, 359, eaam7240, https://doi.org/10.1126/science.aam7240, 2018.
Brewin, R. J., Hirata, T., Hardman-Mountford, N. J., Lavender, S. J., Sathyendranath, S., and Barlow, R.: The influence of the Indian Ocean Dipole on interannual variations in phytoplankton size structure as revealed by Earth Observation, Deep-Sea Res. Pt. II, 77–80, 117–127, https://doi.org/10.1016/j.dsr.2012.04.009, 2012.
COAPS: Center for Ocean-Atmospheric Prediction Studies, HYCOM+NCODA Ocean Reanalysis, available at: http://tds.hycom.org/thredds/catalogs/GLBu0.08/expt_19.1.html, last access: 24 September 2019.
Cummings, J. A.: Operational multivariate ocean data assimilation, Q. J. Roy. Meteor. Soc., 131, 3583–3604, https://doi.org/10.1256/qj.05.105, 2005.
Cummings, J. A. and Smedstad, O. M.: Variational Data Assimilation for the Global Ocean, in: Data Assimilation for Atmospheric, Oceanic and Hydrologic Applications, Vol. II, https://doi.org/10.1007/978-3-642-35088-7, 303–343, 2013.
Diaz, R. J. and Rosenberg, R.: Spreading dead zones and consequences for marine ecosystems, Science, 321, 926–929, 2008.
Dietze, H. and Loeptien, U.: Revisiting ”nutrient trapping” in global coupled biogeochemical ocean circulation models, Global Biogeochem. Cy., 27, 265–284, https://doi.org/10.1002/gbc.20029, 2013.
Garcia, H. E., Locarnini, R. A., Boyer, T. P., Antonov, J. I., Baranova, O., Zweng, M., Reagan, J., and Johnson, D.: World Ocean Atlas 2013 Volume 3: Dissolved Oxygen, Apparent Oxygen Utilization, and Oxygen Saturation, NOAA Atlas NESDIS 75, 3, 27 pp, 2013.
Gilly, W. F., Bernan, J. M., Litvin, S. Y., and Robison, B. H.: Oceanographic and biological effects of shoaling of the oxygen minimum zone, Annu. Rev. Mar. Sci. 5, 393–420, https://doi.org/10.1146/annurev-marine-120710-100849, 2013.
Gray, J. S., Wu, R. S., and Or, Y. Y.: Effects of hypoxia and organic enrichment on the coastal marine environment, Mar. Ecol. Prog. Ser., 238, 249–279, https://doi.org/10.3354/meps238249, 2002.
Gary, S. F., Lozier, M. S., Böning, C. W., and Biastoch, A.: Deciphering the pathways for the deep limb of the Meridional Overturning Circulation, Deep-Sea Res. Pt. II, 58, 1781–1797, 2011.
Hood, R. R., Wiggert, J. D., and Naqvi, S. W. A.: Indian Ocean Research: Opportunities and Challenges, Geoph. Monog. Series 185, 409–428, https://doi.org/10.1029/2008GM000714, 2009.
Ito, T., Minobe, S., Long, M. C., and Deutsch, C.: Upper ocean O2 trends 1958–2015, Geophys. Res. Lett., 44, 4214–4223, https://doi.org/10.1002/2017GL073613, 2017.
Johns, W., Yao, F., Olson, D., Josey, S., Grist, J., and Smeed, D.: Observations of seasonal exchange through the Straits of Hormuz and the inferred heat and freshwater budgets of the Persian Gulf, J. Geophys. Res., 108, 3391, https://doi.org/10.1029/2003JC001881, 2003.
Kamykowski, D. and Zentara, S.-J.: Hypoxia in the world ocean as recorded in the historical data set, Deep-Sea Res., 37, 1861–1874, https://doi.org/10.1016/0198-0149(90)90082-7, 1990.
Karstensen, J., Stramma, L., and Visbeck, M.: Oxygen minimum zones in the eastern tropical Atlantic and Pacific oceans, Progr. Oceanogr., 77, 331–350, https://doi.org/10.1016/j.pocean.2007.05.009, 2008.
Keeling, R. E., Körtzinger, A., and Gruber, N.: Ocean deoxygenation in a warming world., Annu. Rev. Mar. Sci., 2, 199–229, https://doi.org/10.1146/annurev.marine.010908.163855, 2010.
Kim, H.-S., Flagg, C. N., and Howden, S. D.: Northern Arabian Sea variability from TOPEX/Poseidon altimetry data: an extension of the US JGOFS shipboard ADCP study, Deep-Sea Res. Pt. II, 48, 1069–1096 , https://doi.org/10.1016/S0967-0645(00)00131-4, 2001.
Lamb, S. H.: Hydrodynamics, Cambridge University Press, Cambridge, 1879.
Lachkar, Z., Smith, S., Lévy, M., and Pauluis, O.: Eddies curb denitrification and compress ecosystems in the Arabian Sea, Geophys. Res. Lett., 43, 1–17, https://doi.org/10.1002/2016GL069876, 2016.
Lachkar, Z., Lévy, M., and Smith, S.: Intensification and deepening of the Arabian Sea oxygen minimum zone in response to increase in Indian monsoon wind intensity, Biogeosciences, 15, 159–186, https://doi.org/10.5194/bg-15-159-2018, 2018.
Lachkar, Z., Lévy, M., and Smith, K. S.: Strong intensification of the Arabian Sea oxygen minimum zone in response to Arabian Gulf warming; Geophys. Res. Lett., 46, 5420–5429, 2019.
Lebedev, K. V., Yoshinari, H., Mximenko, N. A., and Hacker, P.: YoMaHa'07: velocity data assessed from trajectories of Argo floats at parking level and at the sea surface, IPRC Tech. Note 4, 2007.
Levin, L. A., Whitcraft, C. R., Mendoza, G. F., and Gonzalez, J. P.: Oxygen and organic matter thresholds for benthic faunal activity on the Pakistan margin oxygen minimum zone (700–1100m), Deep-Sea Res. Pt. II, 56, 449–471, https://doi.org/10.1016/j.dsr2.2008.05.032, 2009.
Lumpkin, R. and Pazos, M.: Measuring surface currents with surface velocity program drifters: the instrument, its data, and some recent results, in: Lagrangian analysis and prediction of coastal and ocean dynamics (LAPCOD), edited by: Griffa, A., Kirwan, A. D., Mariano, A. J., Ozgokmen, T., and Rossby, T., Cambridge University Press, Cambridge, New York, 39–67, 2007.
Luyten, J. R., Pedlosky, J., and Stommel, H.: The ventilated thermocline, J. Phys. Oceanogr., 13, 292–309, https://doi.org/10.1175/1520-0485(1983)013<0292:TVT>2.0.CO;2, 1983.
McCreary, J. P., Yu, Z., Hood, R. R., Vinaychandran, P. N., Furue, R., Ishida, A., and Richards, K. J.: Dynamics of the Indian-Ocean oxygen minimum zones, Progr. Oceanogr., 112–113, 15–37, https://doi.org/10.1016/j.pocean.2013.03.002, 2013.
Naqvi, S. W. A., Naik, H., Pratihary, A., D'Souza, W., Narvekar, P. V., Jayakumar, D. A., Devol, A. H., Yoshinari, T., and Saino, T.: Coastal versus open-ocean denitrification in the Arabian Sea, Biogeosciences, 3, 621–633, https://doi.org/10.5194/bg-3-621-2006, 2006.
Naqvi, S. W. A., Bange, H. W., Farías, L., Monteiro, P. M. S., Scranton, M. I., and Zhang, J.: Marine hypoxia/anoxia as a source of CH4 and N2O, Biogeosciences, 7, 2159–2190, https://doi.org/10.5194/bg-7-2159-2010, 2010.
NOAA: National Oceanic and Atmospheric Administration, WOA13 temperature, salinity and oxygen, available at: https://www.nodc.noaa.gov/cgi-bin/OC5/woa13/woa13oxnu.pl; https://www.nodc.noaa.gov/cgi-bin/OC5/woa13/woa13.pl, last access: 10 April 2019.
Olson, D. B., Hitchcock, G. L., Fine, R. A., and Warren, B. A.: Maintenance of the low-oxygen layer in the central Arabian Sea, Deep-Sea Res. Pt. II, 40, 673–685, https://doi.org/10.1016/0967-0645(93)90051-N, 1993.
Oschlies, A., Schulz, K. G., Riebesell, U., and Schmittner, A.: Simulated 21st century's increase in oceanic suboxia by CO2-enhanced biotic carbon export, Global Biogeochem. Cy., 22, GB4008, https://doi.org/10.1029/2007GB003147, 2008.
Phelps, J. J., Polton, J. A., Souza, A. J., and Robinson, L. A.: Hydrodynamic timescales in a hyper-tidal region of freshwater influence. Cont. Shelf Res. 63, 13–22, https://doi.org/10.1016/j.csr.2013.04.027, 2013.
Piontkovski, S. A. and Queste, B. Y.: Decadal changes of the Western Arabian Sea ecosystem, International Aquatic Research, 8, 49–64, https://doi.org/10.1007/s40071-016-0124-3, 2016.
Piontkovski, S. A. and Al-Oufi, H. S.: The Oman shelf hypoxia and the warming Arabian Sea, Int. J. Environ. Stud., 72, 256–264, https://doi.org/10.1080/00207233.2015.1012361, 2015.
Prasad, T. G., Ikeda, M., and Kumar, S. P.: Seasonal spreading of the Persian Gulf Watermass in the Arabian Sea, J. Geophys. Res., 106, 17059–17071, https://doi.org/10.1029/2000JC000480, 2001.
Qasim, S.: Oceanography of the northern Arabian Sea, Deep Sea Res. Pt. I, 49, 2035–2051, 1982.
Queste, B. Y., Vic, C., Heywood, K. J., and Piontkovski, S. A.: Physical controls on oxygen distribution and denitrification potential in the north west Arabian Sea, Geophys. Res. Lett., 45, 4143–4152, https://doi.org/10.1029/2017GL076666, 2018.
Rao, C. K., Naqvi, S. W. A., Kumar, M. D., Varaprasad, S. D. J., Jayakumar, D. A., George, M. D., and Singbal, S. Y. S.: Hydrochemistry of Bay of Bengal: possible reasons for a different water column cycling of carbon and nitrogen from the Arabian Sea, Mar. Chem., 47, 279–290, https://doi.org/10.1016/0304-4203(94)90026-4, 1994.
Resplandy, L., Lévy, M., Bopp, L., Echevin, V., Pous, S., Sarma, V. V. S. S., and Kumar, D.: Controlling factors of the oxygen balance in the Arabian Sea's OMZ, Biogeosciences, 9, 5095–5109, https://doi.org/10.5194/bg-9-5095-2012, 2012.
Sarma, V.: An evaluation of physical and biogeochemical processes regulating perennial suboxic conditions in the water column of the Arabian Sea, Global Biogeochem. Cy., 16, 1082, https://doi.org/10.1029/2001GB001461, 2002.
Schmidtko, S., Stramma, L., and Visbeck, M.: Decline in global oceanic oxygen content during the past five decades, Nature, 542, 335–339, https://doi.org/10.1038/nature21399, 2017.
Schott, F. A. and McCreary, J. P.: The monsoon circulation of the Indian Ocean, Progr. Oceanogr., 51, 1–123, https://doi.org/10.1016/S0079-6611(01)00083-0, 2001.
Schott, F. A., Xie, S. P., and McCreary Jr., J. P.: Indian Ocean circulation and climate variability, Rev. Geophys., 47, RG1002, https://doi.org/10.1029/2007RG000245, 2009.
Shankar, D., Shenoi, S. S. C., Nayak, R. K., Vinayachandran, P. N., Nampoothiri, G., Almeida, A. M., Michael, G. S., Ramesh Kumar, M. R., Sundar, D., and Sreejith, O. P.: Hydrography of the eastern Arabian Sea during summer monsoon 2002, J. Earth Syst. Sci., 114, 459–474, https://doi.org/10.1007/BF02702023, 2005.
Shenoi, S. S. C., Saji, P. K., and Almeida, A. M.: Near-surface circulation and kinetic energy in the tropical Indian Ocean derived from Lagrangian drifters, J. Mar. Res., 57, 885–907, https://doi.org/10.1357/002224099321514088, 1999.
Shenoy, D. M., Sujith, K. B., Gauns, M. U., Patil, S., Sarkar, A., Naik, H., Narvekar, P. V., and Naqvi, S. W. A.: Production of dimethylsulphide during the seasonal anoxia off Goa, Biogeochemistry, 110, 47–55, https://doi.org/10.1007/s10533-012-9720-5, 2012.
Shenoy, D. M., Suresh, I., Uskaikar, H., Kurian, S., Vidya, P. J., Shirodkar, G., Gauns, M. U., and Naqvi, S. W. A.: Variability of dissolved oxygen in the Arabian Sea Oxygen Minimum Zone and its driving mechanisms, J. Mar. Syst., 204, 103310, https://doi.org/10.1016/j.jmarsys.2020.103310, 2020.
Stramma, L., Johnson, G. C., Sprintall, J., and Mohrholz, V.: Expanding Oxygen-Minimum Zones in the Tropical Oceans, Science, 320, 655–658, https://doi.org/10.1126/science.1153847, 2008.
Stramma, L., Schmidtko, S., Levin, L. A., and Johnson, G. C.: Ocean oxygen minima expansions and their biological impacts, Deep-Sea Res. Pt. I, 57, 587–595, https://doi.org/10.1016/j.dsr.2010.01.005, 2010.
Stramma, L., Prince, E. D., Schmidtko, S., Luo, J., Hoolihan, J. P., Visbeck, M., Wallace, D. W. R., Brandt, P., and Körtzinger, A.: Expansion of oxygen minimum zones may reduce available habitat for tropical pelagic fishes, Nat. Clim. Change, 2, 33–37, https://doi.org/10.1038/nclimate1304, 2012.
Swallow, J. C.: Some aspects of the physical oceanography of the Indian Ocean, Deep-Sea Res., 31, 639–650, https://doi.org/10.1016/0198-0149(84)90032-3, 1984.
Van Sebille, E., Griffies, S. M., Abernathey, R., Adams, T. P., Berloff, P., Biastoch, A., Blanke, B., Chassignet, E. P., Cheng, Y., Cotter, C. J., Deleersnijder, E., Döös, K., Drake, H. F., Drijfhout, S., Gary, S. F., Heemink, A. W., Kjellsson, J., Koszalka, I. M., Lange, M., Lique, C., MacGilchrist, G. A., Marsh, R., Mayorga Adame, C. G., McAdam, R., Nencioli, F., Paris, C. B., Piggott, M. D., Polton, J. A., Rühs, S. Shah, S. H. A. M., Thomas, M. D., Wang, J., Wolfram, P. J., Zanna, L., und Zika, J. D.: Lagrangian ocean analysis: fundamentals and practices, Ocean Model., 121, 49–75, 2018.
Vitale, S. S., DiMarco S. F., Seidel, H. F., and Wang, Z.: Circulation analysis in the northwest Indian Ocean using Argo floats and surface drifter observations, and SODA reanalysis output, Dyn. Atmos. Oceans, 78, 57–70, https://doi.org/10.1016/j.dynatmoce.2017.02.002, 2017.
Wang, Z., DiMarco, S. F., Jochens, A. E., and Ingle, S.: High salinity events in the northern Arabian Sea and Sea of Oman, Deep Sea Res. Pt. I, 74, 14–24, https://doi.org/10.1016/j.dsr.2012.12.004, 2013.
Wang, Z., DiMarco, S. F., Ingle, S., Belabbassi, L., and Al-Kharusi, L. H.: Seasonal and annual variability of vertically migrating scattering layers in the northern Arabian Sea, Deep Sea Res. Pt. I, 90, 152–165, https://doi.org/10.1016/j.dsr.2014.05.008, 2014.
You, Y. and Tomczak, M.: Thermocline circulation and ventilation in the Indian Ocean derived from water mass analysis, Deep-Sea Res. Pt. I, 40, 13–56, https://doi.org/10.1016/0967-0637(93)90052-5, 1993.