the Creative Commons Attribution 4.0 License.
the Creative Commons Attribution 4.0 License.
Effect of Caribbean Water incursion into the Gulf of Mexico derived from absolute dynamic topography, satellite data, and remotely sensed chlorophyll a
Juan Antonio Delgado
Joël Sudre
Sorayda Tanahara
Ivonne Montes
José Martín Hernández-Ayón
Alberto Zirino
The dynamics of the Loop Current (LC) and the detached Loop Current eddies (LCEs) dominate the surface circulation of the Gulf of Mexico (GoM) and transport Caribbean Water (CW) into the gulf. In this work, 25 years (1993–2017) of daily satellite data are used to investigate the variability of these physical processes and their effect on chlorophyll a (Chl a) concentrations from 1998 to 2017, including temporal changes, mean differences, and regional concentration tendencies. The physical variables analyzed are absolute dynamic topography (ADT) and oceanic currents. From the ADT and oceanic current monthly climatologies, it is shown that there is an annual intrusion of CW with an inward incursion that starts in spring, peaks in the summer, reaches to 28∘ N and 90.45∘ W, and then retreats in winter to approximately 26.5 ∘ N and 88.3 ∘ W. Minimum surface Chl a concentrations (< 0.08 mg m−3) are found during the summer–autumn period inside the region of maximum incursion of CW; the opposite is observed during the winter period when Chl a concentrations were at a maximum, e.g., > 0.14 mg m−3. The 3-year running averages of the ADT 40 cm isoline qualitatively reproduce the climatological pattern of 25 years showing that before 2002 CW was less intrusive. This suggests that from 2003 onward, larger volumes of oligotrophic waters from the Caribbean Sea have invaded the western GoM and reduced mean surface Chl a concentrations. A direct comparison between the 1998–2002 and 2009–2014 periods indicates that in the latter time interval, the Chl a concentration above waters deeper than 250 m has decreased significantly.
- Article
(22374 KB) - Full-text XML
- BibTeX
- EndNote
The effects of global warming on the circulation of the world's oceans and its concomitant consequences on the oceans' biological productivity are some of the most important scientific and economic issues of our times. Forecasting the effects of global warming on ocean resources depends on having a clear understanding of the manner in which physical processes (e.g., solar radiation, winds, circulation, and vertical mixing) affect primary production. This understanding is aided by the availability of remote sensing observations, unparalleled in their spatial and temporal coverage of the earth's surface. Since 1990, satellite data on absolute dynamic height (ADT), chlorophyll a (Chl a) concentration, and derived products (eddy kinetic energy (EKE), geostrophic and Ekman currents) have been available to study the Gulf of Mexico (GoM), an important socioeconomic region for fisheries, petroleum, natural gas, and tourism. We have availed ourselves of a 25-year time series of satellite data to study the relationship between the physical dynamics of the GoM and its effect on primary production in the context of a global warming scenario. Unlike previous studies, this work entails the analysis of the Loop Current (LC), the path footprint of the LC eddies (LCEs), and the dominant features of the surface circulation that transport Caribbean Water (CW) into the GoM (Nowlin and McLellan, 1967; Morrison et al., 1983). The LC in the eastern GoM is part of the North Atlantic Ocean Subtropical Gyre, an essential contributor to the interhemispheric Meridional Overturning Cell (Schmitz and McCartney, 1993; Candela et al., 2003; Schmitz et al., 2005). This current carries warm waters from the gulf to the North Atlantic through the Straits of Florida via the Gulf Stream (Hurlburt and Thompson, 1980), thereby also being an important contributor to the upper ocean heat budget of the GoM (Liu et al., 2012). Based on a detailed analysis in the central and western GoM by Portela et al. (2018), within the gulf are seven water masses in order of increasing mean density: the remnants of Caribbean Surface Water (CSWr: also referred to as CW), North Atlantic Subtropical Underwater (NASUW), Gulf Common Water (GCW), Tropical Atlantic Central Water (TACW), the nucleus of the TACW (TACWn), Atlantic Intermediate Water (AAIW), and North Atlantic Depth Water (NADW). Here, we are principally concerned with surface effects.
CW enters the GoM via the LC with specific biological (i.e., low Chl a) and physical characteristics (warmer by ∼0.6 units and less saline waters by ∼0.5 units). The current penetrates into the gulf, reaching 28∘ N, near the Mississippi Delta. As it extends to the north, it forms a loop (Austin, 1955) that turns southeast to ultimately exit into the Atlantic Ocean.
Knowledge of how the thrust of the LC affects the intrusion of CW is based on hydrographic data (Leipper, 1970; Niiler, 1976; Behringer et al., 1977; Molinari et al., 1977; Huh et al., 1981; Paluszkiewicz et al., 1983), remote sensing observations (Vukovich et al., 1979; Vukovich, 1988; Leben and Born, 1993; Leben, 2005), and, in the last 20 years, numerical modeling (Hurlburt and Thompson, 1980; Candela et al., 2003; Oey et al., 2005; Sturges and Lugo-Fernandez, 2005; Counillon and Bertino, 2009; Cardona and Bracco, 2016; Wei et al., 2016). More recently, novel developments based on artificial neural networks and empirical orthogonal function analysis have also been applied to predict LC variation (Zeng et al., 2015), effecting reliable forecasts for up to 5 to 6 weeks. Knowledge of how the primary forcing mechanism affects the Loop Current is important to the circulation of the GoM as both a direct and indirect generator of surface-layer eddies and as a source of lower-layer flows (Hamilton et al., 2016). Based on satellite altimetry observations and the dynamic height gradient from 1993 to 2009, Lindo-Atichati et al. (2013) observed northward seasonal penetration of the LC, peaking in summer. LC extension and anticyclonic eddy separation are the result of the momentum imbalance (Pichevin and Nof, 1997) and form the shape of future LCEs. Chang and Oey (2010), using a numerical model, proposed that wind stress could be the primary forcing that releases LCEs. In a second paper, supported by satellite observations, they proposed that the LC intrusion and the shedding of the LCEs followed a biannual cycle (Chang and Oey, 2013). A reanalysis of archived data also detected statistically significant LCE separation seasonality (Hall and Leben, 2016). Recently, Candela et al. (2019) analyzed 4 years of water current data and reported a seasonal cycle in the transport through the Yucatán Channel, with the annual cycle as the main harmonic peak in July.
Interacting seasonal and stochastic processes could trigger the separation of the LCEs (Fratantoni et al., 1998; Zavala-Hidalgo et al., 2003, 2006) as well as forming Caribbean eddies and other topographic features (Garcia-Jove et al., 2016). In this context, the LC system has some similarities with the North Brazil Current retroflection (Pichevin et al., 1999; Goni and Johns, 2001; Zharkov and Nof, 2010), the Agulhas retroflection (de Ruijter et al., 1999; Baker-Yeboah et al., 2010), and the Gulf Stream, wherein large meanders pinch off as warm rings (Brown et al., 1983; Richardson, 1983; Savidge and Bane, 1999).
Despite extensive research, after more than a half-century we are still struggling to completely understand LC variability, the processes controlling the Loop Current extension, and the mechanism of the detachment of anticyclones from the loop. Because positive time trends have been reported in temperature, winds, sea level, and the greater number of detached eddies separated from the LC, it can be expected that these phenomena would affect primary productivity and, indirectly, surface Chl a concentration (Polovina, et al., 2008; Laffoley and Baxter., 2016). In this work, 25 years (1993–2017) of daily ADT data combined with monthly radiance data from 1998 to 2017 are used to investigate the variability of the transport of Caribbean Surface Water into the gulf and its effect on Chl a concentration. We examined temporal changes, mean differences, and regional concentration tendencies.
Three independent datasets were used to provide evidence of temporal variability in the extension of CW into the GoM. We used ADT and surface velocity fields (geostrophy and Ekman) from the GEKCO (Geostrophic Ekman Current Observatory; Sudre et al., 2013) product from 1993 to 2017 with a resolution of , in conjunction with Chl a ocean color data derived from the reprocessing R2014.0 product suite from Aqua MODIS (Moderate Resolution Imaging Spectroradiometer) and from SeaWIFS (Sea-Viewing Wide Field-of-View Sensor), using the OCx algorithm with a spatial resolution of 9×9 km (https://oceancolor.gsfc.nasa.gov/cgi/l3, last access: 19 November 2019). The 2003–2017 monthly Chl a ocean color product was derived from Aqua MODIS, and the 1998–2002 monthly Chl a ocean color product was derived from SeaWIFS.
Climatology was created from maps of ADT that result from the elevation of the sea surface height referenced to the geoid using the product from DUACS (Data Unification and Altimeter Combination System) available on the AVISO (Archiving, Validation and Interpretation of Satellite Oceanographic data) website at https://www.aviso.altimetry.fr/en/data (last access: 19 November 2019). The ADT climatology was constructed using the 25 years of daily satellite maps from 1993 to 2017, averaging for each month in the different years. We considered LCEs in any stage of formation, detaching, and reattaching to the LC as evidence of the incursion of CW. After the ADT climatology was obtained, the predominant boundary contour of CW was extracted from each climatological month. It was observed that the 40±2.2 cm ADT contour was well matched to the climatological maxima of its respective EKE. For this reason, the ADT 40 cm contour is taken as the main ADT reference that tracks the Caribbean Water Front (CWF).
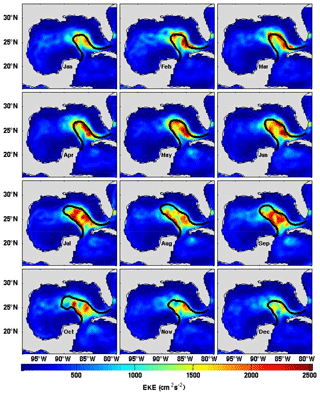
Figure 2Climatological monthly maps of eddy kinetic energy (EKE) in the GoM: red contours correspond to the areas of maxima EKE. The heavy black line corresponds to the 40 cm isoline of the CWF (the contour of the CWF is significant at the 95 % level). The EKE was calculated using daily maps of satellite-derived currents from AVISO (GEKCO) for a quarter of a century (1993–2017).
Specifically, monthly CWF positions were obtained from short-term running averages of daily satellite observations in 3-year periods. Each running average was moved rearward by 1 year, e.g., 1993–1995, 1994–1996, 2014–2016, 2015–2017. For each 3-year period, a set of 12 monthly maps was obtained, resulting in a total of 23 sets of monthly CWF maps: 10 sets from 1993 to 2002 and 13 sets from 2003 to 2017. We used the 40 cm contour of each set of 3-year averages because this was the contour with the highest EKE observed in the 25-year dataset. To retrieve the CWF contours, we first determined the initial latitudinal position of the CWF to be at 80.7∘ W with the respective corresponding longitudinal positions between Cuba and Florida. The CWF contour lines that run from east to west and finish close to the tip of the Yucatán Peninsula were separated by 0.2±0.1∘. However, some ADT contour “islands” appeared next to the CWF with a typical distance of > 0.3∘ from the CWF contour. Additionally, a spectral analysis was done using a daily time series of 25 years of ADT data to build a spatially averaged region influenced by the LC between 91.25∘ W and 23.125∘ N and between 83.5∘ W and 28.12∘ N.
When ADT island distances were > 0.3∘ from the front, we used a MATLAB code procedure to eliminate them from the CWF contours. Once the CWF's contours were retrieved, the next step was to visually corroborate the quality and coherence of each CWF contour over the monthly field maps of ADT, sea surface currents, and Chl a distribution. In this way, inconsistencies were detected and corrected. The MATLAB code procedure satisfactorily corrected 91.3 % of the contours. The remaining sets were corrected by hand via visual analysis.
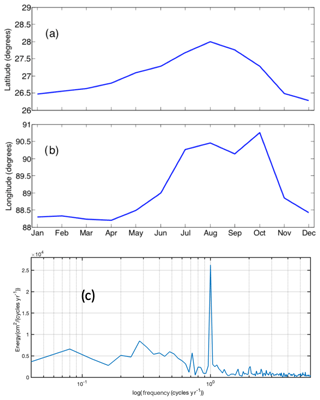
Figure 3Geographical positions of the CWF tracked using the 40 cm ADT isoline representing 1993–2017 monthly average values: (a) northward and (b) westward, respectively; (c) ADT spectral analysis in a region influenced by the CWF (91.25∘ W, 23.125∘ N and 83.5∘ W, 28.12∘ N).
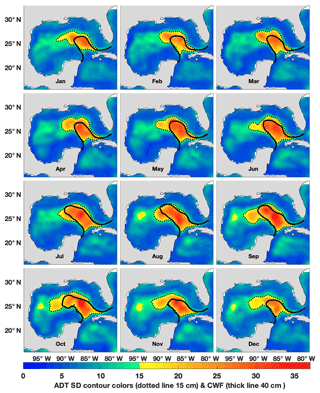
Figure 4The ADT quarter-century CWF (1993–2017) monthly climatology and its standard deviation are shown in heavy and dotted lines, respectively. The heavy line corresponds to the 40 cm isoline of the CWF. The dotted line encloses values of the standard deviation > 15 cm.
The main mesoscale instabilities were obtained from calculations of the climatological monthly EKE maps of geostrophic and Ekman currents obtained from 25 years of daily satellite observations from GEKCO using the following equation:
where u and v represent the total current ( and ), uE and vE represent the Ekman current, ug and vg represent the geostrophic current, U and V are the means of the oceanic currents, and u′ and v′ are the anomalies of the current. To find the relationship between ADT and EKE patterns, the 40 cm ADT isoline was overlaid on the monthly EKE maps. This made the EKE means representative of the energy of the mesoscale eddy field (Jouanno et al., 2012).
For consistency between the different satellite datasets, all monthly climatological spatial fields were standardized at spatial resolution by bilinear interpolation.
3.1 Tracking the intrusion of Caribbean Water
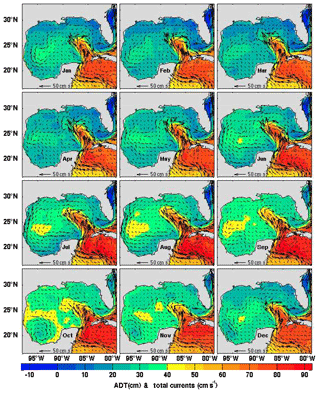
The LC enters the gulf through the Yucatán Channel and exits through the Straits of Florida, penetrating northward into the GoM until instabilities form in the current and a ring-like LCE pinches off. There are two ways of tracking the LC: (1) tracking the thermal signal (not possible in summer due to weak thermal contrast in the GoM) and (2) tracking the sea surface height through satellite altimetry. In 2005, Leben, using the 17 cm contour in daily sea surface topography maps (this contour closely follows the edge of the high-velocity core of the LCEs and LC), tracked the LC thermal fronts in the sea surface temperature images during good thermal contrast. In a different way, Lindo-Atichati et al. (2013) calculated the maximum horizontal gradient of the sea surface height (SSH) to track only the contours of the Loop Current Front (LCF). In this work, we used the ADT to track both the LC and the LCEs formed by the influence of the CW. Monthly mean surface oceanic currents from GEKCO overplotted on the ADT data are shown in Fig. 1. Maximum satellite surface current velocities in the Caribbean Sea and the GoM, as well as in the Yucatán current on the continental coast, were > 50 cm s−1, coinciding with in situ estimates of ∼60 cm s−1 (Badan et al., 2005). The monthly GoM total current fields show the variability of the primary forcing that coincides with the mean ADT edge; the vectors of maximum velocity are tangent to the edge of the maximum slope change. To locate the CW, the 40 cm mean ADT isoline was chosen. The ADT reference corresponds to regions of maximum ADT gradients and maximum EKE. Figure 1 shows that (mostly) in autumn (October, November, and December) and winter (January, February, and March), the CW retracts to its most southeasterly location. In contrast, in spring (April, May, June) and summer (July, August, September), CW penetration moves towards the northwest. In fact, the extension begins in May and reaches maximum penetration in August, showing an annual pattern. This movement is similar to that observed by Chang and Oey (2013). They found that in summer, the maximum LC intrusion was forced by the trade winds. Their and our observations are also consistent with the work of Candela et al. (2019), who reported that water transport into the GoM in July through the Yucatán Channel was at a maximum.
It is accepted that LCEs occur in a geographical control zone that is based on momentum imbalance (Pichevin and Nof, 1997; Nof, 2005) rather than instability. Also, we should not abandon the idea that the formation of instabilities such as meanders and cyclonic eddies are due to high EKE produced by upstream conditions that influence the circulation within the GoM (Oey et al., 2003) and produce changes in the fluxes in the Yucatán Channel (Candela et al., 2002), transport variations in the LC (Maul and Vukovich, 1993), variations in the deep outflow (Bunge et al., 2002), and cyclonic eddies in Campeche Bank and Tortugas (Fratantoni et al., 1998; Zavala-Hidalgo et al., 2003). The areas of large EKE are related to the intrusion and retreat of CW (Garcia-Jove et al., 2016) via baroclinic and barotropic instabilities (e.g., Jouanno et al., 2009).
Figure 2 shows that the 40 cm isoline encloses the maximum EKE area of the LC–LCEs during each climatological month, demonstrating that its distribution is mainly centered in the LC region; consequently, the maximum EKE borders the CW Front just where the abrupt horizontal gradients of ADT exist and changes in current speed occur. It is clear that the 40 cm isoline of ADT matches both the maximum EKE values and the maximum ADT gradient very well and is a good tracker of the contours of LC–LCEs. Lindo-Atichati et al. (2013) proposed a methodology using the SSH maximum horizontal gradient, which is the addition of sea height anomaly and mean dynamic topography, to obtain the contours of the LCF and LCEs. In our analysis, we chose the 40 cm isoline as a general reference to track the LCF, LCEs, and CW transport.
The enhanced monthly EKE signals respond in the same way as the LCF, repeating the mean monthly pattern as well as the total currents; the CW intrusion starts in spring and peaks in summer to retract in autumn and winter, and there are no relevant mesoscale EKE structures in the western GoM. These results confirm an annual pattern of CW intrusion in summer months and a retraction in winter.
3.2 West and northward Caribbean Water extension
The monthly intrusions of the CWF were tracked by taking as a reference the northernmost latitudes and westernmost longitudes of the 40 cm ADT isoline representing 1993–2017 monthly average values of the ADT (not spatially averaged). The climatological position of the CWF for each month of the year is shown in Fig. 3. These results confirm the annual intrusion of CW as follows: (1) analysis of the maximum north and westward penetration of the front over 25 years shows that from January to February, it is retracted southeast to ∼26.55∘ N and ∼88.32∘ W (Fig. 3a and b, respectively) and intrudes to 28∘ N, 90.45∘ W in August; (2) an ADT spectral analysis derived from 25 years of daily data from the CWF region shows a strong annual signal that originates from the back and forth of the ADT signal (Fig. 3c). In this work, the ADT signal also includes the seasonal steric effect. Based on Hall and Leben (2016), a steric signal appears as an annual sine wave with a 5.8 cm amplitude. When the estimated seasonal steric influence is removed, the high energy peak diminishes by 74 %.
In winter, the “tongue” of the CWF moves slowly to the north without westward advance; in spring it lengthens and travels slightly towards the west. From January to March, the northward CWF position shifts slowly, tracing a gently sloping line that starts at 26.5∘ N, reaches its maximum northern position of 28∘ N in August, and then decreases in December to 26.28∘ N (maximum travel of the CWF was 1.72∘ or 191 km). In summer, the CWF intrudes further into the interior of the GoM in both the north and west: its maximum northern and westward advance occurs in August to 28∘ N and 90.45∘ W, but then the CWF retracts in the last month of summer. Regarding CWF westerly movement (Fig. 3b), the CWF traveled little from January to April; in May, however, it extended quickly and in July, August, and September reached approximately 90.2∘ W. It peaked in October at 90.76 ∘ W (maximum range was 2.56∘ or 253 km, calculated at 27.5∘ N latitude). In December, the CWF retracted abruptly to 88.24∘ W.
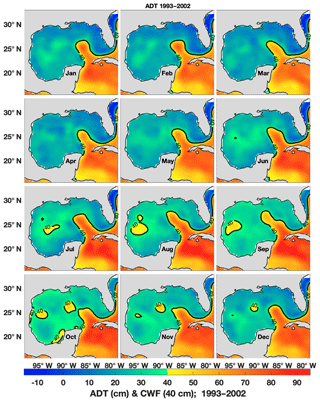
Figure 6Monthly means of absolute dynamic topography (ADT) from 1993 to 2002 (color) and the respective CWF computed with the 40 cm isoline (heavy black line).
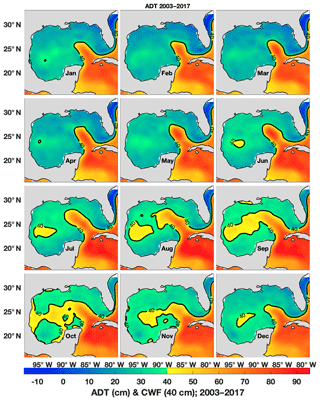
Figure 7Monthly means of absolute dynamic topography (ADT) from 2003 to 2017 (color) and the respective CWF computed with the 40 cm isoline (heavy black line).
Another aspect of the CWF is the rate of intrusion and retraction. From March to August, the CWF moves to the north with a penetration speed on the order of ∼1.02 km d−1, covering a distance of 153 km or 1.37∘. On the other hand, the rate of retraction from August to November is ∼1.86 km d−1, equivalent to 168 km (1.51∘). The entire process of northerly intrusion occurred in three stages: first, from January to April, the front moved slowly northward, increasing its speed while maintaining its westward position. Between May and July the front moved northwest and was then quasi-stationary in July and August near 90.45∘ W; finally, in September, it moved from 90.13 to 90.76∘ W, equivalent to 63 km, at a rate of 2.1 km d−1. The retraction to the west occurred relatively quickly as the front retracted 193 km towards the east in a single month (October) at the rate of 6.3 km d−1, and in November it traveled 41 km at a rate of 1.4 km d−1, also towards the east.
Figure 4 shows the calculated climatological areas of the standard deviation (SD) of the CWF contours > 15 cm (dotted line) and CWF contours > 40 cm (heavy black line). From these areas we calculated ratios between the two (15 cm ∕ 40 cm). The SD contour of 15 cm was selected because this value was 3 times greater than the annual steric signal reported by Hall and Leben (2016). Ratio values were 1.37 in January, increased to 1.45 in February and to 1.60 in March, then peaked in April (1.63) to decrease in May (1.47) and June (1.46), reaching a low value in August (1.27). The monthly ratio then increased in September to 1.55, decreased slightly in October (153), reached a maximum value in November of 1.65, and settled to 1.55 in December. A plot of these monthly ratios clearly shows a strong biannual signal peaking in April and November (not pictured). Chang and Oey (2012, 2013) proposed that the LC intrusion and the shedding of the LCE followed a biannual cycle. This biannual cycle can also be related to the annual lowest and highest values of the ratio.
Table 1Average bold numbers for Chl a concentrations (mg m−3) and differences (mg m−3; %) between early and contemporary averages at two geographical areas: 95.5∘ W, 22.12∘ N and 91.5∘ W, 25.87∘ N (Western GoM) as well as 86∘ W, 22.12∘ N and 84.75∘ W, 23.37∘ N (LC–LCEs) during “early” (1998–2002), “middle” (2003–2008), and “contemporary” (2009–2014) epochs. The table shows the compared averages in bold. The standard deviations and the number of pixels considered are shown in parentheses.

3.3 Monthly spatial variability of the Caribbean Water Front
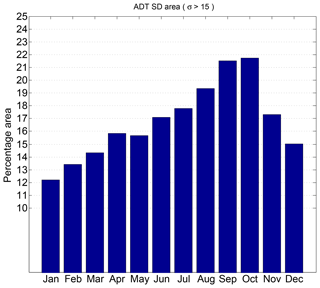
It was found that where penetration–retraction of the CWF occurs, SD variability varies from 15 to 35 cm, extending west to 90.8 in winter and 93.5∘ W in summer (Fig. 4). West of the CWF, in the deep zone of the GoM, the observed variability was close to 10 cm distributed in the band of latitude between 23 and 28.5∘ N. The regions of maximum variability (SD > 15 cm) occur in the CWF zone and extend outside the irregular area of reference (isoline of the 40 cm ADT). The effect of CWF penetration and regions of anticyclonic circulation was determined from the area of the variability of ADT, with maximum values close to ∼35 cm in the central region of the CWF at 86.67∘ W and 25.6∘ N. The percentage of the area of influence of SD > 15 cm in relation to the area of the gulf (1.56×10⁶ km2) is presented in Fig. 5, where a gradual monthly increase is observed from January to October, followed by a decrease in November and December. In January, the direct influence of the CWF on the gulf by area was 12.4 %, rising to 21.5 % for October and subsequently decreasing in December to 15.4 %. We suppose that the greater percentage area of the SD may be attributed to a greater influence of Caribbean Sea water.
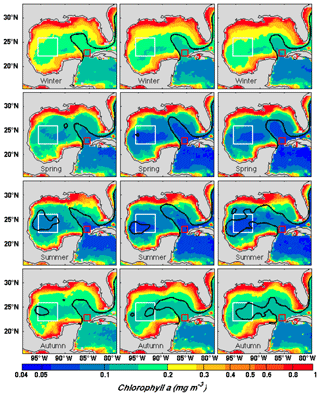
Figure 9From top left to bottom right, average Chl a values according to period: column 1 is SeaWIFS 1998–2002, column 2 is MODIS 2003–2008, and column 3 is MODIS 2009–2014. From top to bottom the panels correspond to the mean seasons. The average Chl a concentration is computed inside the white and red squares (white corresponds to the western GoM and red corresponds to the LC area). Average values for each time period and season are in Table 1.
3.4 Changes in Caribbean Water incursion from 2003 to the present
Using the 40 cm reference, a 3-year running average of the ADT data was calculated to extract the minimum number of years that would produce a similar pattern over a quarter century of the CWF. The results indicate a difference in CWF path and westward penetration before and after 2002. It is observed that before 2002 the CWF was less intrusive in the west (Fig. 6); after 2002 it extended towards the west in both summer and autumn (Fig. 7). It is important to note that the intrusion of the CWF is due to the influence of LCEs that have a strong presence in the western GoM. This fact is supported by a statistical analysis of the lifetimes of LCEs during two time periods (1993–2002 and 2003–2015) (http://www.horizonmarine.com/loop-current-eddies.html, last access: 19 November 2019). The data show that the LCEs in the 1993–2002 period had a mean life of 6.8 months, while the average life in 2003–2015 was 11.7 months. To prove that there is a significant difference between these periods, a Student's t test was applied with the result that the difference between them is significant (, p=0.005). The LCE mean life difference is clear evidence that the incoming volume of water from the Caribbean Sea (with oligotrophic features; Aguirre-Gómez and Salmerón-García, 2015) reached farther in the western GoM after 2002. These observations also agree with the results of Lindo-Atichati et al. (2013), confirming that, on average, the LC northward intrusion starts to increase in 2002. These authors also report an increase in the number per year of LC rings over the same period that also coincided with a significant increase in sea height residuals (2.78±0.26 cm per decade from 1993 to 2009). This supports the finding that from 2003 onward, larger volumes of oligotrophic waters from the Caribbean Sea have invaded the western GoM.
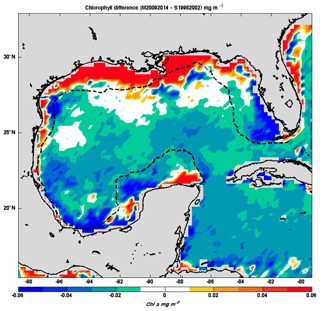
Figure 10Differences in Chl a concentration (mg m−3) for 2009–2014 average values of MODIS data minus 1998–2002 average SeaWIFS values. The broken line represents the 250 m isobath. White contoured areas indicate no significant differences.
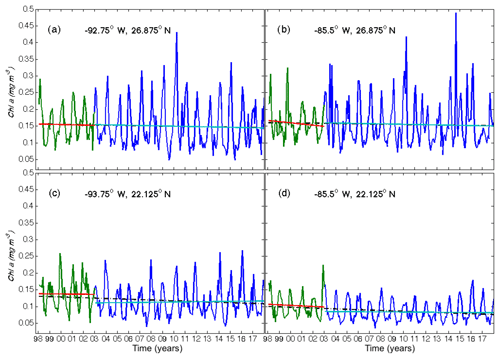
Figure 11Chl a concentrations (mg m−3) at four stations (a to d) in the GoM; daily time series derived from SeaWIFS from 1998 to 2002 (green) and MODIS from 2003 to 2017 (blue). Least squares regressions for SeaWIFS (red line), MODIS (cyan line), and the overall linear regressions for each station (dashed black line).
3.5 Chlorophyll a satellite imagery, climatology, and changes in the last decade
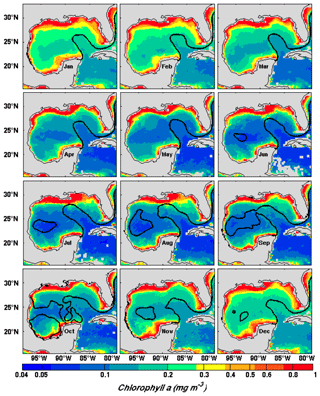
Another product that tracks the effect of CW inside the western GoM is Chl a satellite imagery, being an index of primary productivity (Boyer et al., 2009). Physical processes that affect the distribution and abundance of Chl a include estuarine influxes, the depth of the nutricline, wind stress, thermal stratification, and eddy advection. However, over deep waters of the GoM, it is wind stress and thermal stratification that principally affect the Chl a concentration (Martínez-López and Zavala-Hidalgo, 2009; Müller-Karger et al., 2015, Damien et al., 2018). It was found that the oligotrophic CW contrasts seasonally with the gulf waters and allows for the observation of two levels of Chl a (high and low, Müller-Karger et al., 1989). Here, the temporal relationship between the CWF and Chl a concentration was constructed from SeaWIFS and MODIS monthly climatological images (Fig. 8). The highest concentrations of Chl a in the interior of the GoM are observed during autumn and winter months when high concentrations are triggered by vertical mixing (Pasqueron de Fommervault et al., 2017; Damien et al., 2018) and values were > 0.14 mg m−3, in agreement with Dandonneau et al. (2004), whereas in spring–summer they decreased to 0.08–0.09 mg m−3. During spring–summer, when the maximum CW penetration occurs, our data confirm that the “footprint” of the CWF water (delineated by the 40 cm isoline of ADT) is in general oligotrophic, indicating that Caribbean Water has indeed entered the GoM. During this period, the Chl a surface concentration remains low as the increase in surface temperature strengthens stratification. Additionally, the winds from the southeast are weak, thereby reducing the mixing of nutrients to the surface. In contrast, during the autumn–winter months, the northerly winds are stronger, increasing vertical mixing, deepening the mixed layer, and carrying cold, nutrient-rich subsurface water into the euphotic layer (Müller-Karger et al., 1991, 2015; Pasqueron de Fommervault et al., 2017).
In seeking relationships between the spatial–seasonal distribution of the Chl a concentration and the incursion signaled by the ADT-generated data, three spatial–temporal periods were selected; each was averaged pixel by pixel, and the three were labeled: “early” (1998–2002), “middle” (2003–2008), and “contemporary” (2009–2014) epochs. The 5-year averages of the early and contemporary periods of two separate areas were compared: (1) an area located in the western GoM at 95.5∘ W, 22.12∘ N and 91.5∘ W, 25.87∘ N, as well as (2) a smaller area located in the center of the LC at 86∘ W, 22.12∘ N and 84.75∘ W, 23.37∘ N (Fig. 9). The differences in the means were tested for significance with a two-tailed z test at the 95 % confidence level (Fowler et al., 2013). The results are shown in Table 1 and may be summarized as follows.
- a.
Temporal differences. (1) Western GoM differences between early and contemporary Chl a concentrations are significantly different in all seasons; (2) Loop Current differences between early and contemporary Chl a concentrations are significantly different during winter, spring, and autumn but not in summer.
- b.
Spatial differences. (1) In winter, the western GoM is significantly higher in Chl a than the LC during both the early and contemporary periods; (2) in the spring, the western GoM is significantly higher than the LC during the early period but not in contemporary period; (3) in summer, the LC is significantly higher than the western GoM during both the early and contemporary periods; and (4) in autumn, the western GoM is significantly higher than LC during the early period but not significantly different from the LC in the contemporary period.
- c.
Seasonal differences. In the western GoM and the LC in both the early and contemporary periods, Chl a decreases from winter to spring and from spring to summer, and it increases from autumn to winter, but autumn concentrations do not exceed winter (see also Fig. 9). All differences are significant.
Examination of Table 1 indicates that at both areas, the winter season is the most productive, followed by autumn, with the lowest Chl a concentrations occurring in summer (see also Fig. 9). There is also a time-dependent trend, with contemporary values that are, in general, lower than the values in the early and middle epochs. Both areas exhibit identical climatic trends over time and during each season, indicating that these effects are applicable outside the continental shelf. The early spring epoch is more eutrophic than the middle and contemporary epochs, indicating a decline in nutrient concentrations over time. This effect is also evident in the LC core, where Chl a concentrations decreased with time and signals the entrance to the gulf of more oligotrophic water during the middle and contemporary epochs. Perhaps the most notable seasonal scenario occurs in the summer to early October period, when the CWF “tongue” extends into the interior of the GoM. Although the concentration of Chl a in the western GoM declines gradually with time to from ∼0.09 to ∼0.08 mg m−3, the interesting fact is that the area of oligotrophic water expands and becomes larger in the contemporary period. On the other hand, in the LC core, the Chl a concentrations in the three epochs do not significantly differ, suggesting that the water entering the GoM is from a single source, namely the Caribbean Sea. In general, the extensive penetration of the LC within the GoM, as well as the increase in the life periods and sizes of LCEs, coincides with the intrusion of nutrient-poor CW.
Two points summarize the result of the seasonal analysis of the three epochs: first, the extent of the CW intrusion confirms the northwest migration of eddies during each epoch. Second, the Chl a concentration declines over time.
The second point was confirmed by calculating the average Chl a concentrations outside the continental shelf over two time periods, considering only the concentrations above waters deeper than 250 m. Using data from 1998 to 2002 (SeaWIFS) and from 2009 to 2014 (MODIS), we conducted a Student's t test for differences in the means (Fig. 10). The latter period was significantly lower with t=4.75 and p < 0.001 (n1=1.825; n2=2.190). This analysis confirms that the Chl a concentration of the GoM decreases over time and appears to disagree with the results of Müller-Karger et al. (2015), who did not indicate a time trend in Chl a concentration in the GoM. As the data were taken with different sensors and to eliminate the uncertainty that this difference is not caused by a systematic difference between the SeaWIFS and MODIS datasets used in our analysis, we calculated least squares regressions to the SeaWIFS and MODIS time series at four stations corresponding to the northwest, northeast, southwest, and southeast regions of Müller-Karger et al. (2015) (Fig. 11). For each dataset, inner slopes and overall slopes were calculated. For all four stations, the SeaWIFS (1998–2002) and the MODIS (2003–2017) data series merged exactly and all stations show negative trends; equivalently, the combined time series (1998–2017) also show a negative tendency, supporting the conclusion that the Chl a concentration over the deep GoM has decreased over time.
The difference between our results and those obtained by Müller-Karger et al. (2015) may be attributed to the different way in which the two groups treated the data. Müller-Karger et al. (2015) divided the GoM into four quadrants with depths of over 1000 m: Region 1 northeast (RO1), Region 2 (RO2 northwest), Region 3 (RO3 southeast), and Region 4 (RO4 southwest). They calculated the spatial average in each quadrant to build four time series from 1993 to 2012. In their words, “Time series of anomalies of wind speed, SST, SSHA and Chl a concentration were obtained by subtracting the monthly mean (climatology) from the monthly field for that variable”. Time series of wind speed, sea surface temperature (SST), sea surface height (SSH), and Chl a data obtained at these stations from satellite products were analyzed statistically and plotted. Other variables plotted by Müller-Karger et al. (2015) were mixed layer depth (MLD) as calculated from a hydrodynamic model and net primary production (NPP) calculated from MODIS data using the vertically generalized productivity model (VGPM) of Behrenfeld and Falkowski (1997).
On the other hand, we calculated the average of the Chl a concentration pixel by pixel in waters over 250 m of depth for two time periods (1998–2002 and 2009–2014) and subtracted the respective monthly (climatological) means to find the difference (Fig. 10). From 2009 onward, the difference indicated a small reduction of Chl a in the first optical depth (1–20 or 40 m of depth) that is increasing with time. A Student's t test was used to conclude that the reduction was significant. We also treated the data exactly as Müller-Karger et al. (2015) did and obtained slightly negative slopes over the entire 1998 to 2013 period.
We suggest that Müller-Karger et al. (2015) did not detect the small negative trend in their Chl a plots because their calculated slopes indicated no time-dependent change. We surmise that they were also influenced by the lack of slope in the modeled MLD plot despite clear positive trends for SST, SSHA, and wind force. Actually, although close to zero, the slopes, as indicated in Müller-Karger et al. (2015), were not zero but −0.03 for RO1, −0.01 for RO2, and simply given in as −0.0 for RO3 and 0.0 for RO4 (see their Table 1). Müller-Karger et al. (2015) also ignored the fact that the time–Chl a correlation coefficients (R) for all four regions were negative.
To confirm our findings, we chose four stations, each one centrally located in each quadrant (Müller-Karger et al., 2015), and conducted regression analyses of the logarithmic transform of the SeaWIFS and MODIS Chl a concentrations. All four regions showed a negative slope and a negative R, and the negative slopes in the southern gulf (RO3 and RO4) were significantly different from 0 (p≪0.05). This is shown in Fig. 11.
The observed small but persistent decline in Chl a from 1993 to 2017 may be attributed to the AMOC's overall effect of warming the surface water and thereby promoting stratification. However, we wish to make clear that our conclusion about the recent time-dependent lowering of Chl a pertains only to the near surface and may not indicate a decrease in the primary productivity integrated over the entire water column. In the GoM, the chlorophyll maximum as measured by fluorescence occurs at about 75 m, e.g., below one optical depth, and is greater in summer than in winter (Pasqueron de Fommervault et al., 2017), indicating that the relationship between water column productivity and near-surface Chl a concentration in the GoM requires further study. Our own results and conclusions are based on SeaWIFS and Aqua MODIS chlorophyll data, which for Type One water correlate very well with chlorophyll measured with standard laboratory methods (Mati Kahru, personal communication). In our work we can only say that according to these satellite products, we find a time-dependent diminution of the Chl a signal. This diminution has been widely observed by others although in other waters (Behrenfeld et al., 2006; Polovina et al., 2008; Irwin and Oliver, 2009; Laffoley and Baxter., 2016).
The availability of a large spatial extension of satellite observations of ADT, sea surface currents, wind stress over a quarter century, and Chl a over 20 years has enabled us to confirm the LC and CW dynamics observed in the 1960s and 1970s with more recent in situ observations. The verification of the CWF climatologies developed in this work is important as a reference baseline for further numerical modeling, and it impacts assessments of the gulf's biogeochemistry, energy, heat transport, and Chl a concentration. A recent committee of the National Academic of Sciences (2018) suggested three main study topics to advance the knowledge of the processes that characterize the GoM: (1) the LC system active area, (2) the variation of the inflows of the LC system, and (3) the dynamic interactions of the LC system in the west. Following these suggestions, we have confirmed that the maximum influence of the CW into the GoM (e,g., its maximum extension into the gulf or intrusion) has a temporal variability, being stronger in summer and weaker in the late fall and winter. This is supported by the fact that the generated monthly EKE maps have the maximum gradient at the periphery of the CWF and have a similar monthly pattern of extension and retraction as the CWF.
We noted that in the summer months the wind stress from the southeast is weak, thereby minimizing the flow of nutrients to the surface and causing Chl a to be low, specifically for three reasons: (1) the increase in the surface temperature of the water column strengthens stratification, (2) the intrusion of the CW to the western gulf's surface thickens the surface layer, and (3) the eddy-driven anticyclonic circulation deepens the nutricline. This contrasts with the cold seasons when the surface temperature of the water is lower and the northerly winds are stronger, favoring the flow of nutrients to the surface.
The 3-year running averages of the ADT 40 cm isoline qualitatively reproduce the climatological pattern of a quarter of a century, showing that before 2002 the CWF was less intrusive and the LCE sizes were smaller. In the 1993–2002 period, we calculated that the mean life cycle of the eddies was 6.8 months and that in the 2003–2015 period the mean life cycle was 11.7 months. This difference suggests that after 2003, larger volumes of oligotrophic waters from the Caribbean Sea invaded the western GoM and reduced mean surface Chl a concentrations. This work shows that the intrusion of CW by LC–LCEs extends further into the western GoM than was previously known.
Chl a concentrations respond to the dynamics inside the GoM and are influenced by the CWF and the LC anticyclonic and cyclonic eddies.
Since 2002, near-surface Chl a concentrations over bathymetry deeper than 250 m have decreased, and GoM surface waters may be turning more oligotrophic than in the previous decade.
This work, based on 25 years of remotely sensed data, emphasizes the role of climatology in determining GoM circulation and its productivity and suggests that further climatologically induced changes are probably imminent.
Sea surface water and absolute dynamic topography were processed by SSALTO/DUACS and distributed by AVISO+ (https://www.aviso.altimetry.fr/en/data, last access: 19 November 2019) with support from CNES. The GEKCO (Geostrophic Ekman Current Observatory; Sudre et al., 2013; http://www.legos.obs-mip.fr/members/sudre/gekco_form with support, last access: 19 November 2019) product used in this study was developed by Joël Sudre at LEGOS, France. MODIS and SeaWIFS Chl a maps were derived from two NASA products: Aqua MODIS (Moderate Resolution Imaging Spectroradiometer; https://oceancolor.gsfc.nasa.gov/l3/, last access: 19 November 2019) and SeaWIFS (Sea-Viewing Wide Field of View Sensor) using the OCx algorithm with a spatial resolution of 9×9 (https://oceancolor.gsfc.nasa.gov/l3/, last access: 19 November 2019). Finally, the general features of the Gulf of Mexico Loop Current eddies were taken from the Woods Hole Group: https://www.horizonmarine.com/loop-current-eddies (last access: 19 November 2019).
JH-A and JAD initiated the collaboration and designed the study. AZ, JH-A, and JAD contributed to the result interpretation. The conceptualization and arrangement of the original paper were under the charge of AZ, JH-A, JS, IM, ST-R, and JAD. Preprocessing of all data was carried out by JS and JAD. JAD enhanced the figure quality. All authors contributed equally to editing and review. All authors worked on the paper.
The authors declare that they have no conflict of interest.
We thanks the reviewers for their positive criticisms and comments that helped us to improve the paper. This study was carried out as part of the PhD thesis research conducted by the lead author at the Faculty of Marine Science and the Oceanographic Research Institute (FCM-IIO/UABC), Postgraduate Coastal Oceanography Program, and it was supported by the Graduate Professional Development Mexican Program grants (PRODEP: DSA/103.5/16/5801), the National Institute of Technology of Mexico (TecNM), and the Mexican Energy Bureau and Hydrocarbons Mexican Trust, project 201441. This is a contribution of the Gulf of Mexico Research Consortium (CIGoM).
This research has been supported by the National Council of Science and Technology of Mexico – Secretariat of Energy – Hydrocarbons Trust (grant no. 201441).
This paper was edited by Piers Chapman and reviewed by two anonymous referees.
Aguirre-Gómez, R. and Salmerón-García, O.: Characterization of the western Caribbean Sea waters through in vivo chlorophyll fluorescence, Rev. Mar. Cost., 7, 9–26, https://doi.org/10.15359/revmar.7.1, 2015.
Austin, G. B.: Some recent oceanographic surveys of the Gulf of Mexico, EOS T. Am. Geophys. Un., 36, 885–892, https://doi.org/10.1029/TR036i005p00885, 1955.
Badan, A., Candela, J., Sheinbaum, J., and Ochoa, J.: Upper-layer circulation in the approaches to Yucatan Channel, in: New Developments in the Circulation of the Gulf of Mexico, edited by: Sturges, W. and Lugo-Fernandez, A., Geophys. Monog. Series, 161, 57–69, 2005.
Baker-Yeboah, S., Byrne, D. A., and Watts, D. R.: Observations of mesoscale eddies in the South Atlantic Cape Basin: Baroclinic and deep barotropic eddy variability, J. Geophys. Res., 115, C12069, https://doi.org/10.1029/2010JC006236, 2010.
Behrenfeld, M. J. and Falkowski, P. G.: Photosynthetic rates derived from satellite-based chlorophyll concentration, Limnol. Oceanogr., 42, 1–20, 1997.
Behrenfeld, M. J., O'Malley, R. T., Siegel, D. A., McClain, C. R., Sarmiento, J. L., Feldman, G. C., and Boss, E. S.: Climate-driven trends in contemporary ocean productivity, Nature, 444, 752–755, https://doi.org/10.1038/nature05317, 2006.
Behringer, D. W., Molinari, R. L., and Festa, J. F.: The Variability of Anticyclonic Current Patterns in the Gulf of Mexico, J. Geophys. Res., 82, 5469–5476, https://doi.org/10.1029/JC082i034p05469, 1977.
Boyer, J. N., Kelble, C. R., Ortner, P. B., and Rudnick, D. T.: Phytoplankton bloom status: Chlorophyll-a biomass as an indicator of water quality condition in the southern estuaries of Florida, USA, Ecol. Indic., 9, S56–S67, https://doi.org/10.1016/j.ecolind.2008.11.013, 2009.
Brown, O. B., Olson, D. B., Brown, J. W., and Evans, R. H.: Satellite infrared observations of the kinematics of a warm-core ring, Mar. Freshwater Res., 34, 535–545, https://doi.org/10.1071/MF9830535, 1983.
Bunge, L., Ochoa, J., Badan, A., Candela, J., and Sheinbaum J.: Deep flows in the Yucatan Channel and their relation to changes in the Loop Current extension, J. Geophys. Res., 107, 1–7, https://doi.org/10.1029/2001JC001256, 2002.
Candela, J., Sheinbaum, J., Ochoa, J., Badan, A., and Leben, R.: The potential vorticity flux through the Yucatan Channel and the Loop Current in the Gulf of Mexico, Geophys. Res. Lett., 29, 2059, https://doi.org/10.1029/2002GL015587, 2002.
Candela, J., Tanahara, S., Crepon, M., Barnier, B., and Sheinbaum, J.: Yucatan Channel flow: Observations versus CLIPPER ATL6 and MERCATOR PAM models, J. Geophys. Res.-Oceans, 108, 3385, https://doi.org/10.1029/2003JC001961, 2003.
Candela, J., Ochoa, J., Sheinbaum, J., López, M., Pérez-Brunius, P., Tenreiro, M., and Arriaza-Oliveros, L.: The Flow through the Gulf of Mexico, J. Phys. Oceanogr., 49, 1381–1401, https://doi.org/10.1175/JPO-D-18-0189.1, 2019.
Cardona, Y. and Bracco, A.: Predictability of mesoscale circulation throughout the water column in the Gulf of Mexico, Deep-Sea Res. Pt. II, 129, 332–349, https://doi.org/10.1016/j.dsr2.2014.01.008, 2016.
Chang, Y.-L. and Oey, L.-Y.: Eddy and Wind-Forced Heat Transports in the Gulf of Mexico, J. Phys. Oceanogr., 40, 2728–2742, https://doi.org/10.1175/2010JPO4474.1, 2010.
Chang, Y.-L. and Oey, L.-Y.: Why does the Loop Current tend to shed more eddies in summer and winter?, Geophys. Res. Lett., 39, 1–7, https://doi.org/10.1029/2011GL050773, 2012.
Chang, Y.-L. and Oey, L.-Y.: Loop Current Growth and Eddy Shedding Using Models and Observations: Numerical Process Experiments and Satellite Altimetry Data, J. Phys. Oceanogr., 43, 669–689, https://doi.org/10.1175/JPO-D-12-0139.1, 2013.
Counillon, F. and Bertino, L.: High-resolution ensemble forecasting for the Gulf of Mexico eddies and fronts, Ocean Dynam., 59, 83–95, https://doi.org/10.1007/s10236-008-0167-0, 2009.
Damien, P., Pasqueron de Fommervault, O., Sheinbaum, J., Jouanno, J., Camacho-Ibar, V. F., and Duteil, O.: Partitioning of the Open Waters of the Gulf of Mexico Based on the Seasonal and Interannual Variability of Chlorophyll Concentration, J. Geophys. Res.-Oceans, 123, 2592–2614, https://doi.org/10.1002/2017JC013456, 2018.
Dandonneau, Y., Deschamps, P. Y., Nicolas, J. M., Loisel, H., Blanchot, J., Montel, Y., Thieuleux, F., and Bécu, G.: Seasonal and interannual variability of ocean color and composition of phytoplankton communities in the North Atlantic, equatorial Pacific and South Pacific, Deep-Sea Res. Pt. II, 51, 303–318, https://https://doi.org/10.1016/j.dsr2.2003.07.018, 2004.
de Ruijter, W. P. M., Biastoch, A., Drijfhout, S. S., Lutjeharms, J. R. E., Matano, R. P., Pichevin, T., van Leeuwen, P. J., and Weijer, W.: Indian-Atlantic interocean exchange: Dynamics, estimation and impact, J. Geophys. Res.-Oceans, 104, 20885–20910, https://doi.org/10.1029/1998jc900099, 1999.
Fowler, J., Cohen, L., and Jarvis, P.: Practical statistics for field biology, John Wiley & Sons, 2013.
Fratantoni, P. S., Lee, T. N., Podesta, G. P., and Müller-Karger, F.: The influence of Loop Current perturbations on the formation and evolution of Tortugas eddies in the southern Straits of Florida, J. Geophys. Res.-Oceans, 103, 24759–24779, https://doi.org/10.1029/98JC02147, 1998.
Garcia-Jove, M., Sheinbaum, J., and Jouanno J.: Sensitivity of Loop Current metrics and eddy detachments to different model configurations: The impact of topography and Caribbean perturbations, Atmosfera, 29, 235–265, https://doi.org/10.20937/ATM.2016.29.03.05, 2016.
Goni, G. J. and Johns, W. E.: A census of North Brazil Current rings observed from TOPEX/POSEIDON altimetry: 1992–1998, Geophys. Res. Lett., 28, 1–4, https://doi.org/10.1029/2000GL011717, 2001.
Hall, C. A. and Leben, R. R.: Observational evidence of seasonality in the timing of loop current eddy separation, Dynam. Atmos. Oceans, 76, 240–267, https://doi.org/10.1016/j.dynatmoce.2016.06.002, 2016.
Hamilton, P., Lugo-Fernández, A., and Sheinbaum, J.: A Loop Current experiment: Field and remote measurements, Dynam. Atmos. Oceans, 76, 156–173, https://doi.org/10.1016/j.dynatmoce.2016.01.005, 2016.
Huh, O. K., Wiseman, W. J. J., and Rouse, L. J.: Intrusion of loop current waters onto the West Florida continental shelf, J. Geophys. Res., 86, 4186–4192, https://doi.org/10.1029/JC086iC05p04186, 1981.
Hall, C. R. and Leben, R. R.: Observational Evidence of Seasonality in the timing of Loop Current eddy separation, Dynam. Atmos. Oceans, 76, 240–367, 2016.
Hurlburt, H. E. and Thompson, J. D.: A numerical study of loop current intrusions and eddy shedding, J. Phys. Oceanogr., 10, 1611–1651, https://doi.org/10.1175/1520-0485(1980)010<1611:ansolc>2.0.co;2, 1980.
Irwin, A. J. and Oliver, M. J.: Are ocean deserts getting larger?, Geophys. Res. Lett., 36, L18609, https://doi.org/10.1029/2009GL039883, 2009.
Jouanno, J., Sheinbaum, J., Barnier B., and Molines, J. M.: The mesoscale variability in the Caribbean Sea. Part II: Energy sources, Ocean Model., 26, 226–239, https://doi.org/10.1016/j.ocemod.2008.10.006, 2009.
Jouanno, J., Sheinbaum Pardo, J., Barnier, B., Molines, J. M., and Candela Pérez, J.: Seasonal and interannual modulation of the Eddy Kinetic Energy in the Caribbean Sea, J. Phys. Oceanogr., 42, 2041–2055, https://doi.org/10.1175/JPO-D-12-048.1, 2012.
Laffoley, D. and Baxter, J. M.: Explaining Ocean Warming: Causes, scale, effects and consequences, Full Report, Gland, Switzerland, IUCN, 27, https://doi.org/10.2305/IUCN.CH.2016.08.en, 2016.
Leben, R. R.: Altimetry-derived Loop Current metrics, in: Circulation of the Gulf of Mexico: Observations and Models, Geophysical Monograph Series, 161, edited by: Sturges, W. and Lugo-Fernandes, A., 181–201, AGU, Washington, D. C., 2005.
Leben, R. R. and Born, G. H.: Tracking Loop Current eddies with satellite altimetry, Adv. Space Res., 13, 325–333, https://doi.org/10.1016/0273-1177(93)90235-4,1993.
Leipper, D. F.: A sequence of current patterns in the Gulf of Mexico, J. Geophys. Res., 75, 637–657, https://doi.org/10.1029/JC075i003p00637, 1970.
Lindo-Atichati, D., Bringas, F., and Goni, G.: Loop Current excursions and ring detachments during 1993–2009, Int. J. Remote Sens., 34, 5042–5053, https://doi.org/10.1080/01431161.2013.787504, 2013.
Liu, Y., Lee, S.-K., Muhling, B. A., Lamkin, J. T., and Enfield, D. B.: Significant reduction of the Loop Current in the 21st century and its impact on the Gulf of Mexico, J. Geophys. Res., 117, C05039, https://doi.org/10.1029/2011JC007555, 2012.
Martínez-López, B. and Zavala-Hidalgo, J.: Seasonal and interannual variability of cross-shelf transports of chlorophyll in the Gulf of Mexico, J. Mar. Syst., 77, 1–20, https://doi.org/10.1016/j.jmarsys.2008.10.002, 2009.
Maul, G. A. and Vukovich, F. M.: The relationship between variations in the Gulf of Mexico Loop Current and Straits of Florida Volume Transport, J. Phys. Oceanogr., 23, 785–796, https://doi.org/10.1175/1520-0485(1993)023<0785:TRBVIT>2.0.CO;2, 1993.
Molinari, R. L., Baig, S., Behringer, D. W., Maul, G. A., and Legeckis, R.: Winter intrusions of the Loop Current, Science, 198, 505–507, https://doi.org/10.1126/science.198.4316.505, 1977.
Morrison, J. M., Merrell Jr., W. J., Key, R. M., and Key, T. C.: Property distributions and deep chemical measurements within the western Gulf of Mexico. J. Geophys. Res.-Oceans, 88, 2601–2608, https://doi.org/10.1029/JC088iC04p02601, 1983.
Müller-Karger, F. E., McClain, C. R., Fisher, T. R., Esaias, W. E., and Varela, R.: Pigment distribution in the Caribbean Sea: Observations from space, Prog. Oceanogr., 23, 23–64, https://doi.org/10.1016/0079-6611(89)90024-4, 1989.
Müller-Karger, F. E., Walsh, J. J., Evans, R. H., and Meyers, M. B.: On the seasonal phytoplankton concentration and sea surface temperature cycles of the Gulf of Mexico as determined by satellites, J. Geophys. Res., 96, 12645, https://doi.org/10.1029/91JC00787, 1991.
Müller-Karger, F. E., Smith, J. P., Werner, S., Chen, R., Roffer, M., Liu, Y., Muhling, B., Lindo-Atichati, D., Lamkin, J., Cerdeira-Estrada, S., and Enfield, D. B.: Natural variability of surface oceanographic conditions in the offshore Gulf of Mexico, Prog. Oceanogr., 134, 54–76, https://doi.org/10.1016/j.pocean.2014.12.007, 2015.
National Academies of Sciences, Engineering, and Medicine: Understanding and Predicting the Gulf of Mexico Loop Current: Critical Gaps and Recommendations, Washington, DC, The National Academies Press, https://doi.org/10.17226/24823, 2018.
Niiler, P. P.: Observations of low-frequency currents on the West Florida continental shelf, Memoires Societé Royale des Sciences de Liege, 6, 331–358, 1976.
Nof, D.: The momentum imbalance paradox revisited, J. Phys. Oceanogr., 35, 1928–1939, https://doi.org/10.1175/JPO2772.1, 2005.
Nowlin, W. D. and McLellan, H. J.: A characterization of Gulf of Mexico waters in winter, J. Mar. Res., 25, 29–59, 1967.
Oey, L.-Y.: Effects of winds and Caribbean eddies on the frequency of Loop Current eddy shedding: A numerical model study, J. Geophys. Res., 108, 1–25, https://doi.org/10.1029/2002JC001698, 2003.
Oey, L.-Y., Ezer, T., Forristall, G., Cooper, C., DiMarco, S., and Fan, S.: An exercise in forecasting loop current and eddy frontal positions in the Gulf of Mexico, Geophys. Res. Lett., 32, L12611, https://doi.org/10.1029/2005GL023253, 2005.
Paluszkiewicz, T., Atkinson, L. P., Posmentier, E. S., and McClain, C. R.: Observations of a Loop Current frontal eddy intrusion onto the West Florida Shelf, J. Geophys. Res.-Oceans, 88, 9639–9651, https://doi.org/10.1029/JC088iC14p09639,1983.
Pasqueron de Fommervault, O., Perez-Brunius, P., Damien, P., Camacho-Ibar, V. F., and Sheinbaum, J.: Temporal variability of chlorophyll distribution in the Gulf of Mexico: bio-optical data from profiling floats, Biogeosciences, 14, 5647–5662, https://doi.org/10.5194/bg-14-5647-2017, 2017.
Pichevin, T. and Nof, D.: The momentum imbalance paradox, Tellus A, 49, 298–319, https://doi.org/10.3402/tellusa.v49i2.14484, 1997.
Pichevin, T., Nof, D., and Lutjeharms, J.: Why are there Agulhas rings?, J. Phys. Oceanogr., 29, 693–707, https://doi.org/10.1175/1520-0485(1999)029<0693:WATAR>2.0.CO;2, 1999.
Polovina, J. J., Howell, E. A., and Abecassis, M.: Ocean's least productive waters are expanding, Geophys. Res. Lett., 35, 2–6, https://doi.org/10.1029/2007GL031745, 2008.
Portela, E., Tenreiro, M., Pallàs-Sanz, E., Meunier, T., Ruiz-Angulo, A., Sosa-Gutiérrez, R., and Cusí, S.: Hydrography of the Central and Western Gulf of Mexico, J. Geophys. Res.-Oceans, 123, 5134–5149, https://doi.org/10.1029/2018JC013813, 2018.
Richardson, P. L.: Eddy kinetic energy in the North Atlantic from surface drifters, J. Geophys. Res.-Oceans, 88, 4355–4367, https://doi.org/10.1029/JC088iC07p04355, 1983.
Savidge, D. K. and Bane, J. M.: Cyclogenesis in the deep ocean beneath the Gulf Stream: 1. Description, J. Geophys. Res., 104, 18111–18126, https://doi.org/10.1029/1999JC900132, 1999.
Schmitz Jr., W. J. and McCartney, M. S.: On the North Atlantic circulation, Rev. Geophys., 31, 29–50, https://doi.org/10.1029/92RG02583, 1993.
Schmitz Jr., W. J., Biggs, D. C., Lugo-Fernandez, A., Oey, L.-Y., and Sturges, W.: A synopsis of the circulation in the Gulf of Mexico and on its continental margins. In Circulation in the Gulf of Mexico: Observations and Models, Geophys. Monogr. Ser., 161, 11–30, https://doi.org/10.1029/161GM03, 2005.
Sturges, W. and Lugo-Fernandez, A.: Circulation in the Gulf of Mexico: Observations and Models, Geophys. Monogr. Ser., 161, 31–56, https://doi.org/10.1029/GM161, 2005.
Sudre, J., Maes, C., and Garcon, V.: On the global estimates of geostrophic and Ekman surface currents, Limnol. Oceanogr., 3, 1–20, https://doi.org/10.1215/21573689-2071927, 2013.
Vukovich, F. M.: Loop Current boundary variations, J. Geophys. Res.-Oceans, 93, 15585–15591, https://doi.org/10.1029/JC093iC12p15585, 1988.
Vukovich, F. M., Crissman, B. W., Bushnell, M., and King, W. J.: Some aspects of the oceanography of the Gulf of Mexico using satellite and in situ data, J. Geophys. Res., 84, 7749, https://doi.org/10.1029/JC084iC12p07749, 1979.
Wei, M., Jacobs, G., Rowley, C., Barron, C. N., Hogan, P., Spence, P., Smedstad, O. M., Martin, P., Muscarella, P., and Coelhod, E.: The performance of the US Navy's RELO ensemble, NCOM, HYCOM during the period of GLAD at-sea experiment in the Gulf of Mexico, Deep-Sea Research Pt. II, 129, 374–393, https://doi.org/10.1016/j.dsr2.2013.09.002, 2016.
Zavala-Hidalgo, J., Morey, S. L., and O'Brien, J. J.: Cyclonic Eddies Northeast of the Campeche Bank from Altimetry Data, J. Phys. Oceanogr., 33, 623–629, https://doi.org/10.1175/1520-0485(2003)033<0623:CENOTC>2.0.CO;2, 2003.
Zavala-Hidalgo, J., Morey, S. L., O'Brien, J. J., and Zamudio, L.: On the Loop Current eddy shedding variability, Atmosfera, 19, 41–48, 2006.
Zeng, X., Li, Y., and He, R.: Predictability of the loop current variation and eddy shedding process in the Gulf of Mexico using an artificial neural network approach, J. Atmos. Ocean. Tech., 32, 1098–1111, https://doi.org/10.1175/JTECH-D-14-00176.1, 2015.
Zharkov, V. and Nof, D.: Why Does the North Brazil Current Regularly Shed Rings but the Brazil Current Does Not?, J. Phys. Oceanogr., 40, 354–367, https://doi.org/10.1175/2009JPO4246.1, 2010.


