the Creative Commons Attribution 4.0 License.
the Creative Commons Attribution 4.0 License.
 | 06 Sep 2019
Dissolved organic carbon dynamics in the East China Sea and the northwest Pacific Ocean
Ling Ding
Tiantian Ge
Xuchen Wang
Oceanic dissolved organic carbon (DOC) represents one of the largest carbon reservoirs on Earth, and its distribution and biogeochemical cycles play important roles in carbon cycling and other biogeochemical processes in the ocean. We report the distribution and concentrations of DOC for water samples collected from the shelf-edge and slope regions in the East China Sea (ECS) and the Kuroshio Extension (KE) in the northwestern North Pacific during two cruises in 2014–2015. The DOC concentrations were 45–88 µM in the ECS and 35–65 µM in the KE. In addition to biological processes that are estimated to account for 7 % and 8 %–20 % in shaping the DOC distribution in the ECS and KE regions, respectively, the DOC distribution is largely controlled by hydrodynamic mixing of different water masses. By comparing the DOC results with dissolved inorganic carbon (DIC) and dissolved inorganic radiocarbon (Δ14C-DIC) measured from the same water samples, we further demonstrate that the intrusion of the Kuroshio Current could dilute the DOC concentrations at stations in the outer shelf and slope regions of the ECS. The concentrations of DOC in the KE were significantly lower in surface waters than in the ECS, and a relatively low and stable DOC level (∼40 µM) was found in deep water (below 1500 m) at all stations. Based on the previously reported DIC and Δ14C-DIC values for the stations, the observed spatial variations of DOC in the upper 700 m among the stations in the KE were mainly influenced by mixing of the two water masses carried by the Kuroshio and Oyashio, the two dominant western boundary currents in the region. The hydrodynamic processes are thus important factors in the distribution and dynamics of DOC in the KE region.
- Article
(6871 KB) - Full-text XML
-
Supplement
(461 KB) - BibTeX
- EndNote


The world's oceans contain the second largest reservoir of carbon on Earth, and dissolved organic carbon (DOC) is the largest reduced carbon pool (685 Pg C) in the ocean (Hansell and Carlson, 1998; Hansell et al., 2009). The DOC in the ocean consists of a highly diverse organic molecular mixture in which ∼20 000 individual molecular formulae have been detected (Riedel and Dittmar, 2014). The concentration and distribution of ocean DOC play significant roles not only in the global carbon cycle but also in control and regulation of the microbial community and many biogeochemical processes in the oceans (Azam et al., 1983; Fenchel, 2008; Carlson et al., 2010; Nelson and Carlson, 2012). Because ocean DOC is directly linked to the oceanic dissolved inorganic carbon (DIC) system through biological photosynthesis and microbial respiration processes, the DOC pool in the ocean also indirectly contributes to the cycles of atmospheric CO2 (Druffel et al., 1992; Carlson et al., 1994, 1998, 2010; Hansell and Carlson, 2001).
In the most recent 20 years, improved precision of DOC concentration analysis via the high-temperature catalytic oxidation (HTCO) technique has revealed detailed oceanic DOC distributions, such as those generated by the US Climate Variability Repeat (CLIVAR) hydrography programme (Sharp et al., 1995, 2002; Carlson et al., 2010; Hansell et al., 2012; Bercovici and Hansell, 2016). In general, biological and physical processes combine in modulating the distribution and dynamics of DOC in open oceans (Hansell and Waterhouse, 1997; Ogawa et al., 1999; Hansell et al., 2009; Carlson et al., 2010; Bercovici and Hansell, 2016). It has been widely observed that oceanic DOC accumulates in the upper water column (100 m) at elevated concentrations (70–90 µM) compared with its relatively constant values (35–45 µM) in deep water (> 1000 m), reflecting biological production of DOC in the euphotic zone and microbial consumption with depth (Hansell et al., 2009). However, many previous studies conducted in different coastal and open oceans have shown that the distribution of DOC appeared to depend, to a large extent, on the hydrographical structure and/or horizontal/vertical water mixing (Hansell and Waterhouse, 1997; Hansell and Peltzer, 1998; Hung et al., 2007; Ogawa et al., 2003; Guo et al., 1995) and the secondary biological forcing superimposed on the physical forcing (Carlson et al., 2010; Wu et al., 2017). Based on a water mixing model, Wu et al. (2017) also reported that microbial degradation contributed 10 % of the DOC removal and that physical mixing controlled the majority variation of the DOC pool in the northern South China Sea.
The northwestern North Pacific is a rather special oceanic region where carbon cycling and biogeochemical processes are greatly influenced by two major oceanic western boundary currents: the Kuroshio Current (KC) and Oyashio Current (OC). As one of the largest marginal seas in the northwestern North Pacific, the hydrological characteristics of the East China Sea (ECS) are largely influenced by vigorous exchange between the warm saline Kuroshio and cold fresh continental shelf water masses (Hsueh, 2000). Ogawa et al. (2003) reported that the distribution of DOC was primarily controlled by hydrological rather than by biological processes around the shelf edge of the ECS. However, few studies have focused on the distribution and dynamics of DOC around the Kuroshio Extension region. DOC 14C analysis from different North Pacific stations revealed the export of young DOC accompanied by the North Pacific Intermediate Water (NPIW) formation, resulting in an enrichment in the Δ14C-DOC values and a reduction in the notably old DOC 14C age in the Pacific Ocean interior (Druffel et al., 1992, 2019), but the vertical profiles of DOC were only determined at stations in the subpolar water in the northwestern North Pacific (Hansell et al., 2002). DOC observations in the WOCE (World Ocean Circulation Experiment) and CLIVAR cruises were collected at Line P02 stations along a 30∘ N latitudinal transect, but the distribution of DOC near the KE was not investigated during these cruises.
Overall, our understanding of DOC dynamics and cycling in the outer shelf and slope regions of the ECS and KE region is still limited. In this work, we present the results from DOC concentrations measured in the ECS and KE region in the northwestern North Pacific combined with the observations of dissolved inorganic carbon (DIC) concentrations and dissolved inorganic radiocarbon (Δ14C-DIC) values for an evaluation of the roles of the physical mixing process on the distribution of DOC in these two different dynamic oceanic regions.
2.1 Study areas
Water samples were collected from two main oceanic regions: the ECS and the KE region in the northwestern North Pacific (Fig. 1). The ECS is one of the largest marginal seas connected to the northwest North Pacific, with a broad continental shelf area of approximately 0.5×10⁶ km2 (Gong et al., 2003). In the relatively shallow (< 60 m) and wider inner shelf region, oceanic processes are largely influenced by the inputs of the Yangtze River and Yellow River, which are the largest and second largest rivers in China, and each delivers 1.58×10¹² g DOC and 3.20×10¹⁰ g DOC into the ECS (Wang et al., 2012; Xu et al., 2016). In the outer shelf and slope region of the ECS, the hydrographic characteristics and oceanic processes are affected largely by the northward-flowing Kuroshio Current, which impinges on the shelf break, and a branch of the Kuroshio Current enters the ECS across the shelf break (Chen and Wang, 1999; Guo et al., 2006; Hu et al., 2015; Ge et al., 2016). The high primary productivity and intersection of different water masses make the ECS a complex region for studying the ocean carbon biogeochemical cycle.

Figure 1Map showing the study region and the sampling stations in the ECS and the northwestern North Pacific during two cruises in 2014–2015 described in the text. Two major western boundary currents, the northeastward-flowing Kuroshio and southward-flowing Oyashio, meet and form the Kuroshio Extension flowing eastward to the north central Pacific.
The Kuroshio Extension (KE) in the northwestern North Pacific is an important and highly dynamic region that is largely influenced by the Kuroshio and Oyashio currents. The Kuroshio Current carrying relatively warm and saline waters flows northward along the east coast of Japan, turns eastward near 34∘ N, 140∘ E, and subsequently flows as the KE into the north central Pacific (Yasuda et al., 1996; Qiu, 2001; Qiu and Chen, 2011). The southward-flowing Oyashio Current, which carries fresh and cold subarctic water, meets with Kuroshio water at approximately 37∘ N and forms the Kuroshio–Oyashio interfrontal zone, where the subarctic water mass mixes with the KE water and flows eastward (Yasuda et al., 1996; Qiu and Chen, 2011; Hu et al., 2015). The new NPIW is formed in the same region and is a mixture of relatively fresh and recently ventilated Oyashio water and high-salinity Kuroshio water (Yasuda et al., 1996; Talley, 1997; Qiu and Chen, 2011). The mixed water region in the KE has been characterized as an important sink of anthropogenic CO2 in the northwestern North Pacific (Tsunogai et al., 1993), and it is a key area for understanding regional climate and ecosystem variations and biogeochemical cycles (Yasuda, 2003; Wu et al., 2012; Hu et al., 2015; Nishibe et al., 2017).
Table 1Summary of sampling stations and times in the ECS and the KE in the northwestern North Pacific (NP).
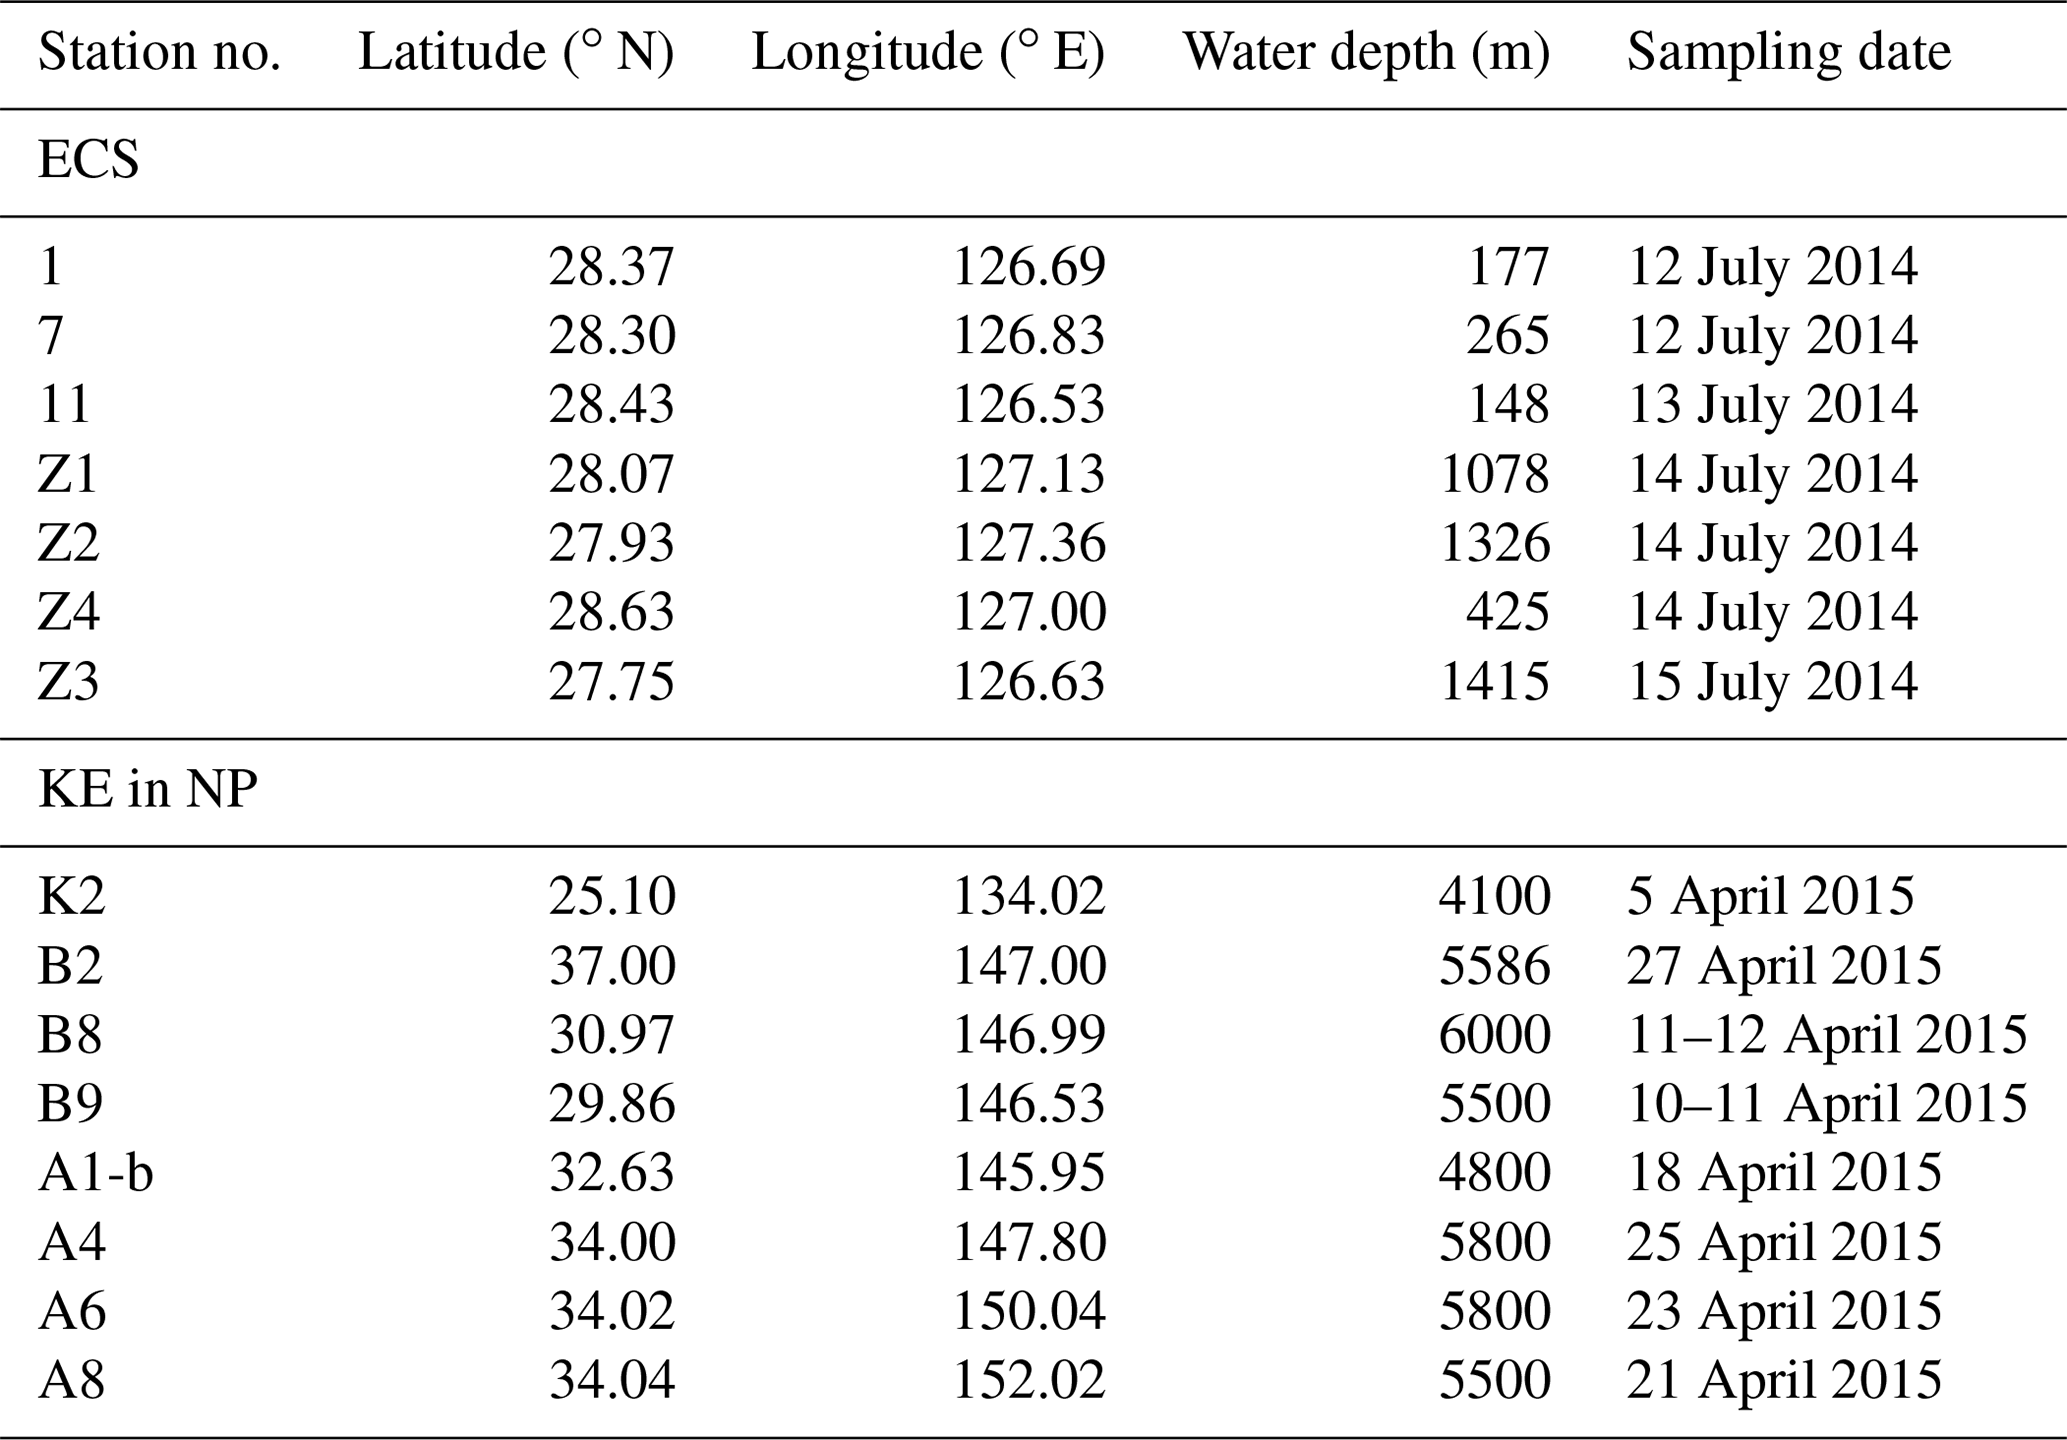
2.2 Sample collection
Water samples for DOC analysis were collected from seven stations on the shelf-edge and slope region of the ECS during a cruise in July 2014 aboard the Japanese R/V Shinsei Maru and from eight deep stations in the KE region and western North Pacific during a cruise in April–May 2015 aboard the Chinese R/V Dongfanghong 2 (Fig. 1). General information on the sampling stations is summarized in Table 1. All water samples were collected using 12 L Niskin bottles deployed on a rosette with a calibrated SeaBird CTD (model SBE 911) that recorded the temperature and salinity profiles. The accuracies for temperature and salinity are 0.001 ∘C and 0.001, respectively.
After collection, water samples from the Niskin bottles were transferred directly into a 1 L pre-combusted (at 550 ∘C for 4 h) glass bottle after rinsing three times with seawater. The water was filtered immediately on board through Whatman GF/F filters with 0.7 µM pore size (prebaked at 550 ∘C for 4 h). The filtered water samples were acidified with superhigh purity 85 % H3PO4 (Aladdin®) to a pH of 2 and preserved in a frozen state at −20 ∘C until chemical analysis.
2.3 Chemical analysis
Concentrations of DOC were analysed by the HTCO method (Sharp et al., 1995, 2002) using a Shimadzu TOC-L analyser equipped with an ASI-V autosampler. Potassium hydrogen phthalate (KHP) dissolved in high-purity Milli-Q water was used as the DOC standard. The quality assessment for DOC measurements was checked against reference low-carbon water and deep-sea water which were analysed every 10 samples (CRM Batch 13 with 41–44 µM DOC concentration, supplied by Hansell Biogeochemical Laboratory at the University of Miami, USA). The average value and standard deviation of deep-sea water reference throughout our measuring was 43±1 µM, which was used as an index of our analytical precision. The instrumental blank was subtracted using high-purity Milli-Q water that was analysed between samples (before every deep-sea water sample). The average blank of the DOC measurement was ≤5 µM, and the analytical precision on triplicate injections was ±3 %. All samples were analysed in duplicate from different vials, and the average values were reported. The standard deviation for DOC ranged from ±0.1 to 4.0 µM.
The methods for DIC concentrations and Δ14C-DIC measurements were described in detail in separate papers for the samples collected during the same cruises (Ge et al., 2016; Ding et al., 2018). In brief, DIC concentrations were measured using a Shimadzu TOC-L analyser with the total IC mode. Sodium carbonate and sodium bicarbonate dissolved in Milli-Q water were used as the DIC standards, and the concentration values were checked against DIC reference materials (deep-sea water) for quality assessment (supplied by Andrew Dickson at Scripps Institution of Oceanography). The total blanks were approximately < 0.15 % of the seawater DIC concentrations, and the analytic precisions were < 3 %. For 14C-DIC measurement, DIC was first extracted as gaseous CO2 using our modified method with extraction efficiencies > 96 % (Ge et al., 2016). The 14C-DIC values were analysed in the National Ocean Sciences Accelerator Mass Spectrometry (NOSAMS) facility at Woods Hole Oceanographic Institution (WHOI). The purified CO2 was graphed for Δ14C analysis using AMS. The Δ14C values are reported as the modern fraction based on the reference material used (McNichol et al., 1994). The conventional 14C ages (years before present or years BP) were calculated following the method of Stuiver and Polach (1977). The maximum total uncertainty is 6 ‰, as tested with a DIC standard (Ge et al., 2016).
3.1 Hydrography
The hydrographic parameters of the sampling stations (temperature and salinity) recorded with the CTD are summarized in Table S1 in the Supplement, and the depth profiles are plotted in Fig. S1. The hydrology of the water is further described in the T–S diagrams, as plotted in Fig. 2. The physical properties of different water masses in the two oceanic regions were extracted from literature and corresponded to the temperature and salinity of the water types in their formation area or the values around the boundaries, which is also included in Fig. 2. Because our study involved two distinctive oceanic regions, we separately plotted the hydrographic characters (T–S diagrams) for stations in the ECS (Fig. 2a) and KE (Fig. 2b) regions.
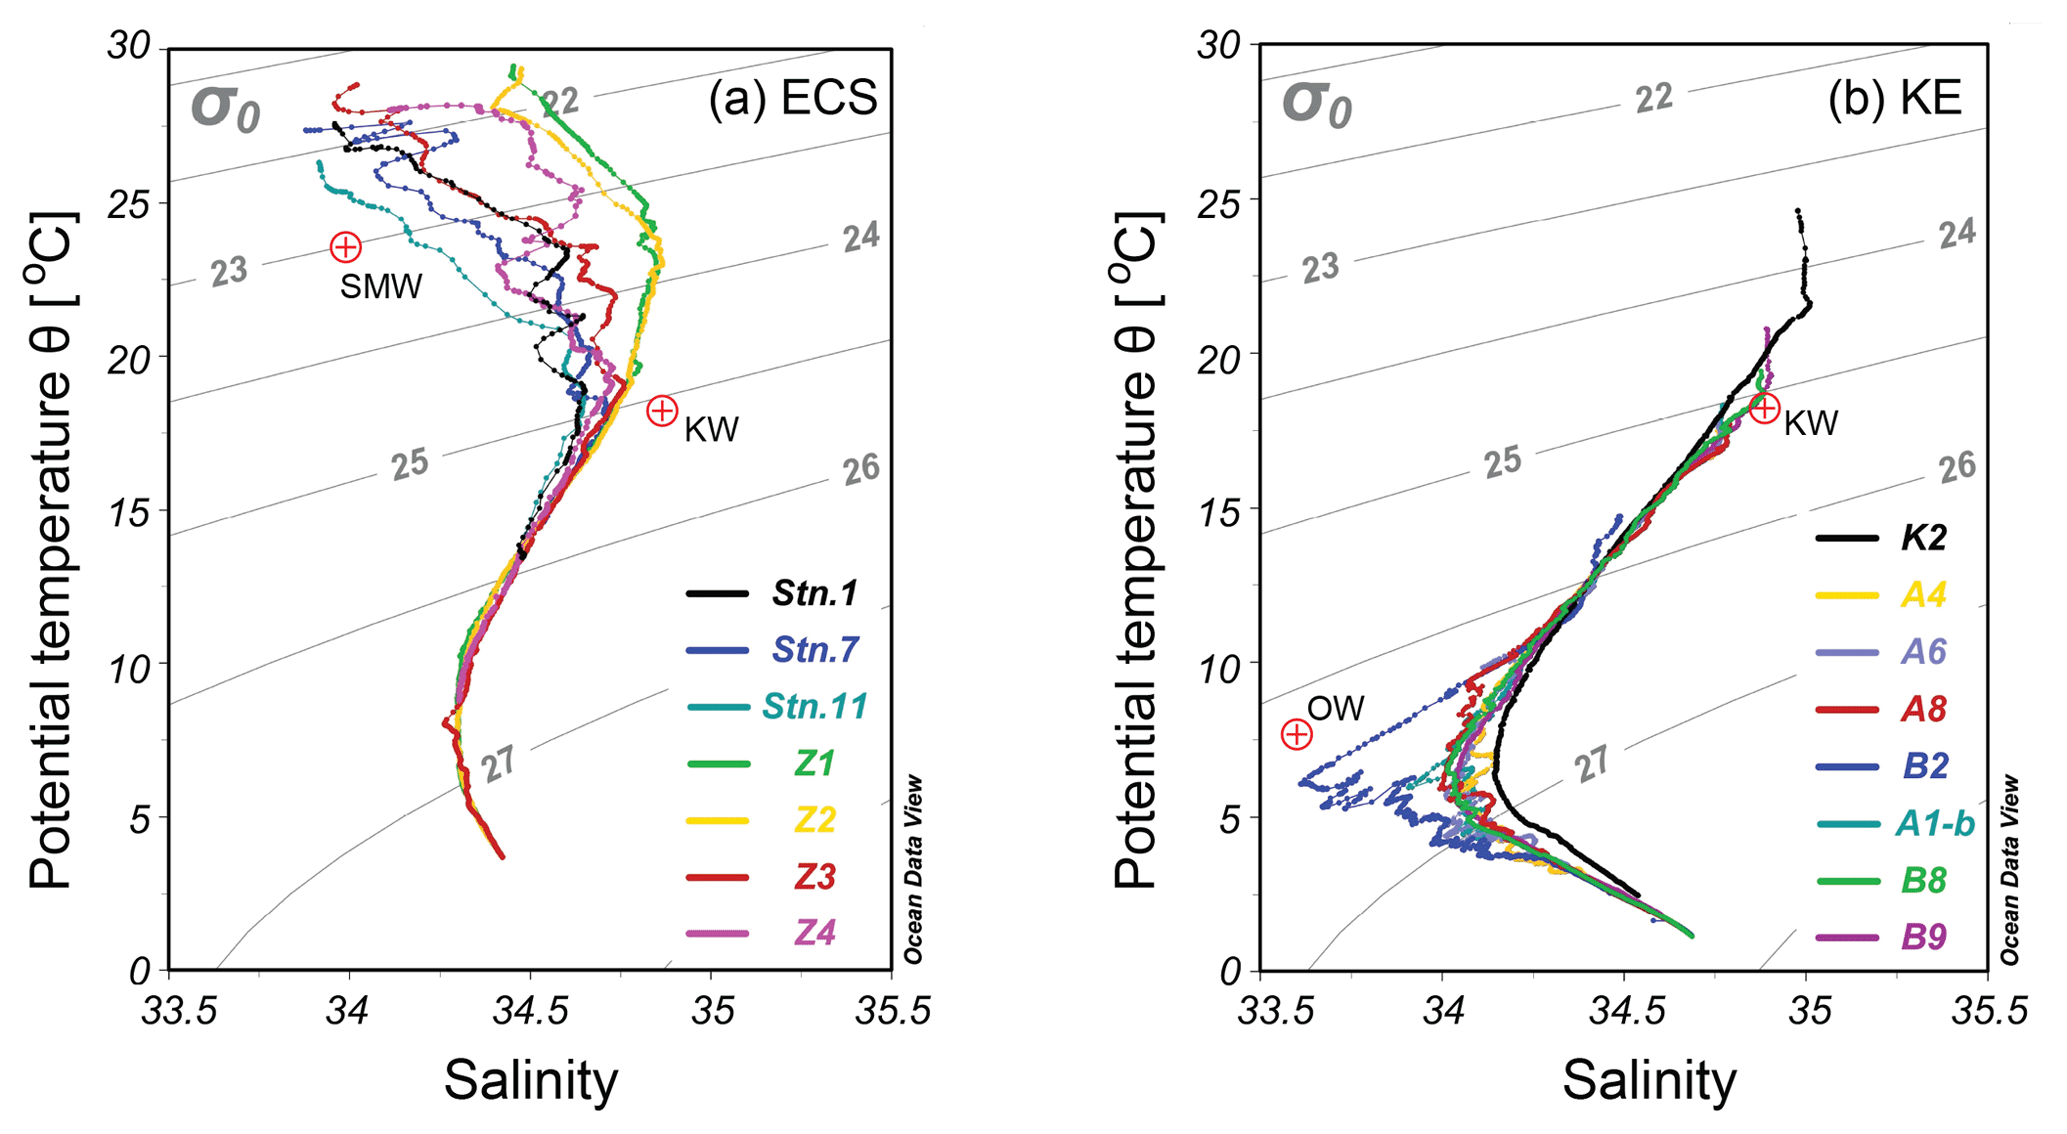
Figure 2Potential temperature vs. salinity (T–S) diagrams for the sampling stations. (a) Seven shelf-edge to slope stations in the ECS and (b) eight deep stations in the KE region in the northwestern North Pacific. σ0 isolines are included in the figures. The coloured lines correspond to CTD data, and red dots indicate the potential temperature (θ) and salinity (S) of different water masses. The representative θ and S of these water types referred to previous studies (Yasuda et al., 1996; Chen and Wang, 1999; Hung et al., 2003; Wong et al., 2007). Acronyms used in this figure: SMW – shelf mixed water, KW – Kuroshio Water and OW – Oyashio Water.
As shown in Figs. 2a and S1 for the seven shelf-edge and slope stations in the ECS, the water temperature was higher (26.3–29.3 ∘C) at the surface (≤10 m and σt≤22.1) and decreased rapidly with depth at all stations. The salinity ranged from 33.88 to 34.87 and exhibited a reversed S shape, i.e. lower at the surface, increasing with depth to the maximum at 150 m water depth (23.2–24.9 σt), and decreasing again to 500 m (26.4–26.8 σt). The salinity (S) remained relatively constant below 500 m depth (at σt > 26.8) for the three slope stations (Figs. 2a and S1).
For station K2 and the seven deep stations in the KE, the temperature (T) of the surface water ranged from 14.7 to 24.4 ∘C, exhibited a rapid decrease and subsequently remained constant for all stations at density levels of σt > 27.6 at ∼1500 m depth (Figs. 2b and S1). The largest temperature variations occurred in the upper 700 m with the highest T (24.4 ∘C) observed at station K2 (end-member value of T in the Kuroshio water) and the lowest T (14.7 ∘C) at station B2 observed in the surface layer (5 m) (end-member value of T in the Oyashio water) (Fig. 2b). The salinity (S) for these stations was higher at the surface, decreased initially to reach a minimum at the density range of 26.4–26.9 σt, and subsequently increased with depth to approximately 2500 m with the density layer of 27.6 σt (Fig. 2b). The salinity for all stations remained relatively uniform below 2500 m (σt > 27.6). Similar to T, the largest differences in salinity also appeared in the upper 700 m water column (the density range of 26.4–27.0 σt), where low salinity (34.49) was observed at the surface of station B2. The salinity decreased to 33.66 near 250 m and subsequently increased to values similar to those of the other stations at 2500 m. The salinity for the remaining seven stations (stations K2, A1-b, A4, A6, A8, B8 and B9) showed less variation in the surface layers (5 m) (34.76 to 34.98), and station K2 had the highest S (34.98) at the surface among all stations (Figs. 2b and S1) (the typical salinity of Kuroshio water is 34.98 and 33.66 for the Oyashio water).
3.2 Concentrations and distribution of DOC
To examine the distribution of DOC with different water masses in the studied regions, we plotted the depth profiles (Fig. 3) and the T–S–DOC diagrams for the ECS and the KE, as shown in Fig. 4. The concentrations of DOC ranged from 45 to 88 µM in the ECS and from 35 to 65 µM in the KE region (Fig. 3 and Table S1). The concentrations of DOC ranged from 55 to 88 µM for the four shelf-edge stations (stations 11, 1, 7 and Z4) and from 45 to 84 µM for the three slope stations (stations Z1, Z2 and Z3) in the ECS. As plotted in Figs. 3a and 4a, the concentrations of DOC showed less variation (71–81 µM) in the surface water (≤10 m and σt≤22.1) and decreased rapidly to ∼300 m depth for all stations in the ECS. Below 300 m, the concentrations of DOC remained relatively constant down to 1000–1400 m depth for Z1, Z2 and Z3 (Fig. 3a).
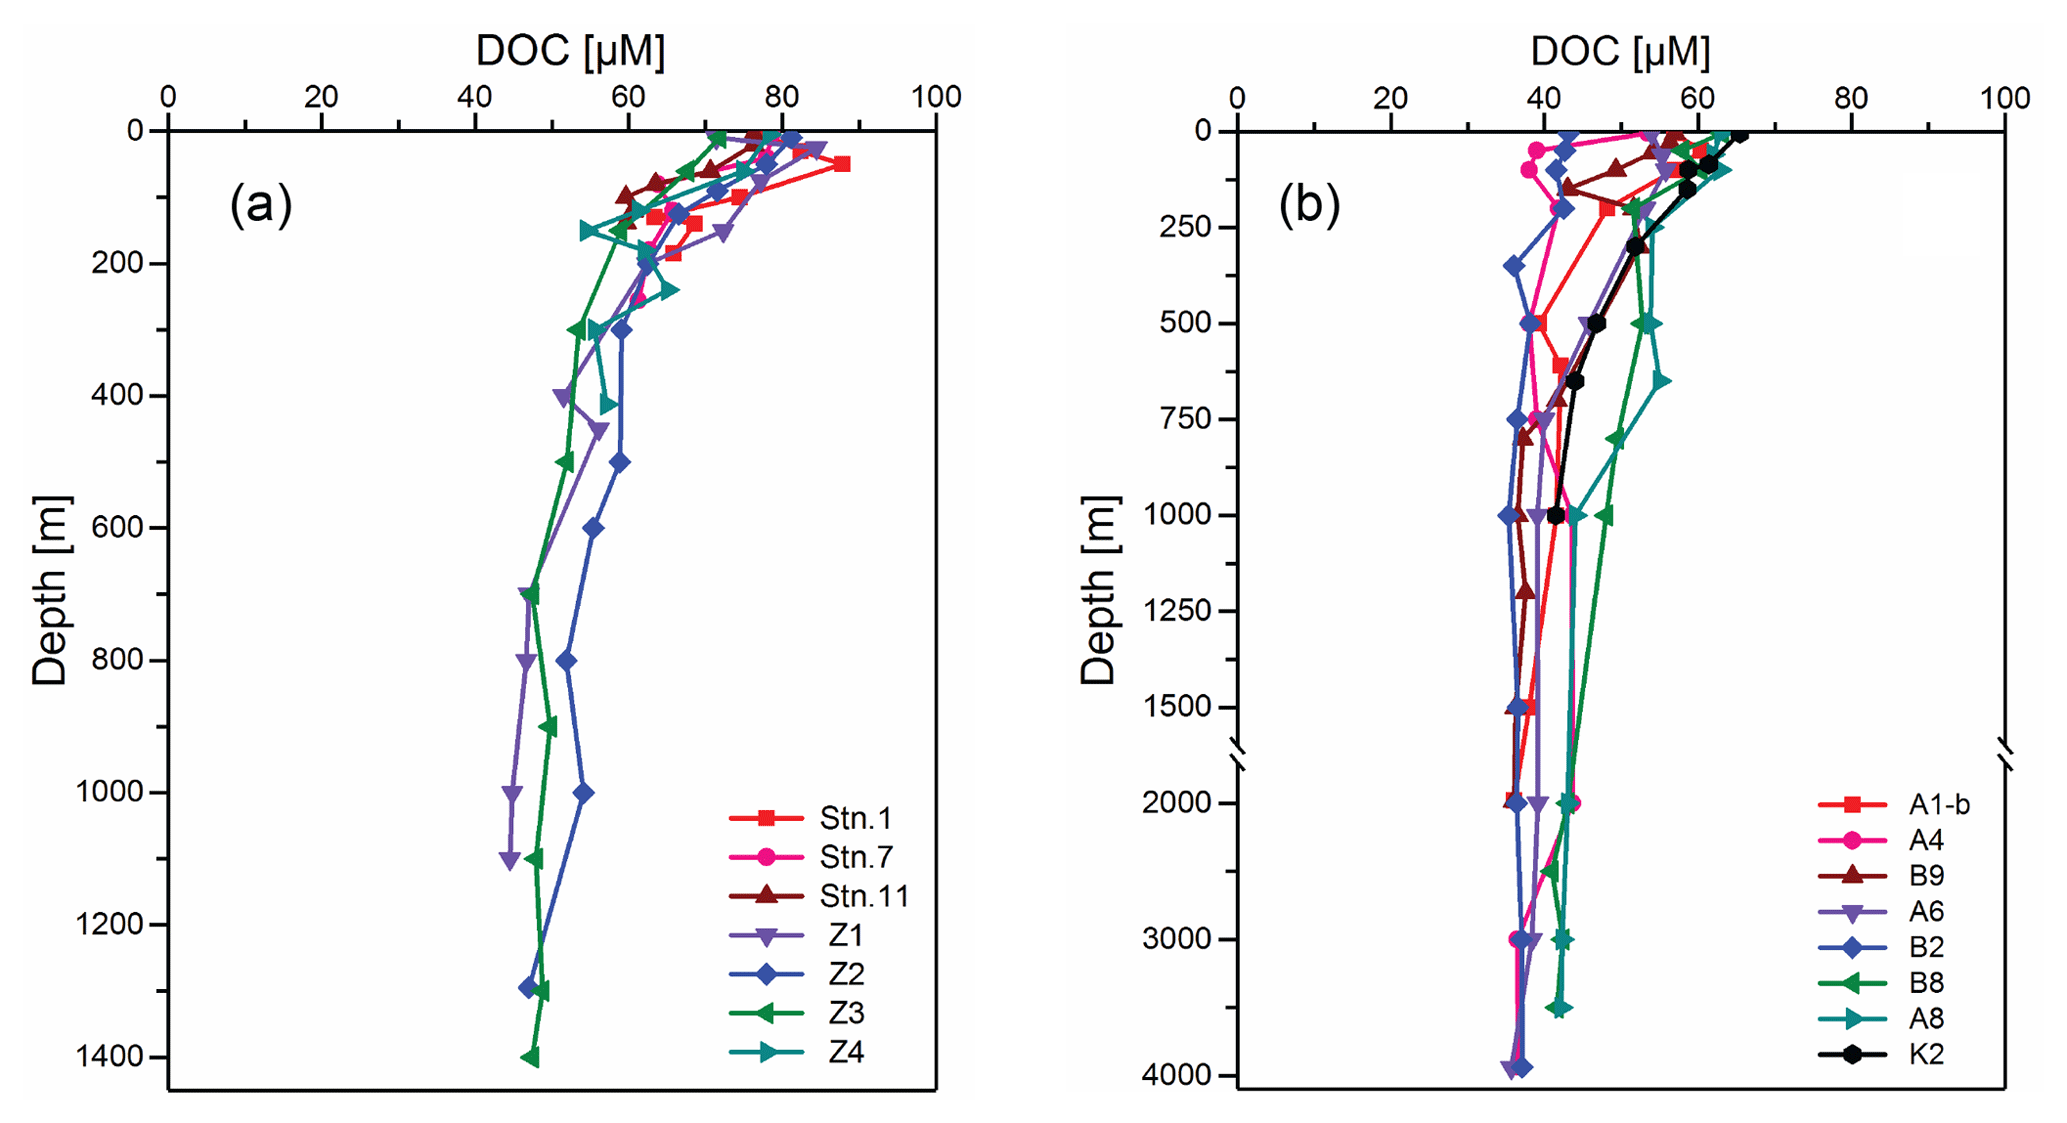
Figure 3Depth profiles of DOC concentrations measured for the stations in the (a) ECS and (b) northwestern North Pacific during the two cruises in 2014–2015. Note in panel (b) that the depth below 1500 m is on a different scale.
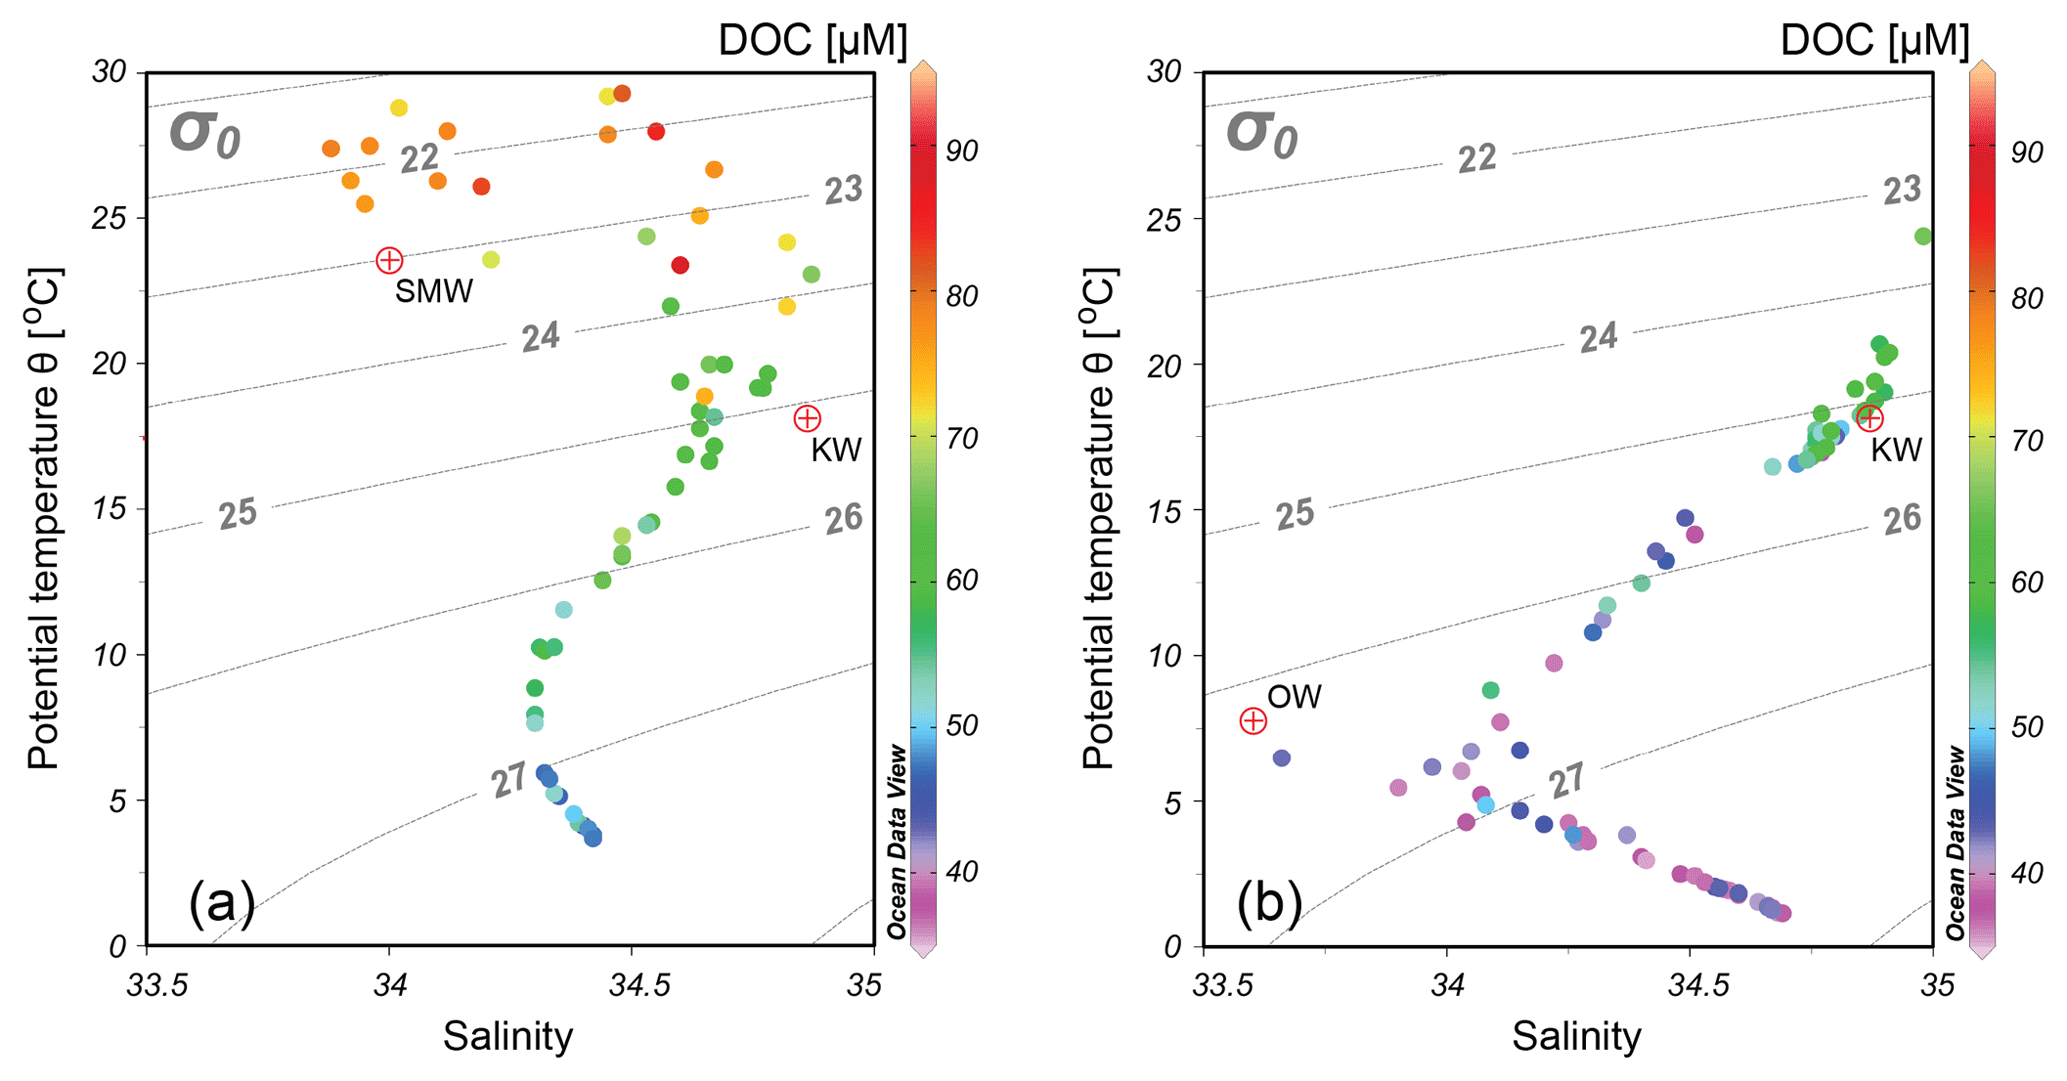
Figure 4DOC concentrations superimposed on plots of potential temperature vs. salinity for the sampling stations in the (a) ECS and (b) Kuroshio Extension in the northwestern North Pacific. σ0 isolines are included in the figures. Red dots indicate the potential temperature and salinity of the water types, and acronyms of water types are SMW – shelf mixed water, KW – Kuroshio Water and OW – Oyashio Water.
The concentrations of DOC in the KE region were much lower than that in the ECS, and above 1000 m the stations showed large spatial variations (Fig. 3b). The highest DOC value (65 µM) and the lowest DOC level (43 µM) were measured at the surface at stations K2 and B2, respectively. In the upper 200 m depth, the concentrations of DOC also showed a notably rapid decrease for most stations. The DOC concentrations were visibly lower at stations A4 and B2 (36–53 µM) than at the other stations in the upper 700 m depth (at σt < 27.0), whereas the concentrations were slightly higher in the 500–800 m depth at stations B8 and A8. The T–S–DOC diagrams showed that DOC concentrations decreased to relative low levels (36–44 µM) at all stations at σt > 27.5 (approximately below 1500 m depth) and remained constant in deep waters (Figs. 3b and 4b).
3.3 Concentrations and radiocarbon distribution of DIC
The results of the DIC concentrations and Δ14C-DIC values measured from the same samples have been recently published (Ge et al., 2016; Ding et al., 2018). In this work, we use these data as water mass tracers to support our DOC results. In brief, as shown in Fig. 5a, the DIC concentrations were higher in the four shelf-edge stations (stations 11, 1, 7 and Z4) than those in the slope stations (Z1 and Z2) at the same depths in the ECS (Fig. 5a). The depth profiles of Δ14C-DIC showed a trend opposite to that of the concentrations of DIC, i.e. higher at the surface and decreasing with depth (Fig. 5b). Higher DIC concentrations had lower Δ14C-DIC values. The Δ14C-DIC values at 138 m for station 11 and 413 m for station Z4 were significantly lower than the values of the slope stations at the same water depths (Fig. 5b).

Figure 5Depth profiles of DIC concentrations and Δ14C-DIC measured for the stations in the (a, b) ECS and (c, d) northwestern North Pacific during the two cruises in 2014–2015. Note in panels (c) and (d) that the depth below 1500 m is on a different scale. The plots were adapted from data previously reported in Ge et al. (2016) and Ding et al. (2018).
The concentrations of DIC were also lower at the surface and increased with depth for the stations in the KE region (Fig. 5c). The large variability in DIC concentrations was observed between 400 and 800 m depths. The Δ14C-DIC values were high at the surface, decreased with depth and showed large variations in the upper 250–1000 m among the stations (Fig. 5d). The Δ14C-DIC values showed a rapid drop within only the upper 500 m of the water column at station A4 and in the upper 1000 m depth at station B2 and subsequently remained constant below 1000 m depth. The Δ14C-DIC profiles for stations K2, A8 and B9 exhibited a similar trend. The surface bomb 14C signal mixed well down to 600 m and subsequently decreased until 1500 m (1000 m for K2) (Fig. 5d).
4.1 Processes that control the DOC distribution in the ECS
In this study, the concentrations of DOC measured in the shelf-edge and slope waters are comparable to the values reported previously for the ECS (Hung et al., 2003; Ogawa et al., 2003; Gan et al., 2016). As one of the large river-influenced shallow (∼60 m) marginal seas, many factors could influence the distribution of DOC. The inputs of the Yangtze and Yellow rivers play important roles affecting the carbon cycling in the ECS. In their study, Wang et al. (2012) and Xue et al. (2017) reported that the Yangtze and Yellow rivers delivered 3.1×10¹² and 7.26×10¹⁰ g terrestrial organic carbon, comprised 45 %–50 % DOC input to the ECS in 2009 and 2015. This riverine DOC was derived mainly from pre-aged soil organic matter with 14C ages of around 1000 years (Wang et al., 2012; Xue et al., 2017). The observed higher DOC concentrations in the upper layer of the ECS could be caused by the riverine refractory DOC that was cycled in the water for a long time and transported offshore. In addition, DOC concentration in the shallow shelf region of the ECS could be influenced by relatively high primary production, flux from sediment and bacterial degradation (Ogawa et al., 2003; Wang et al., 2012; Gan et al., 2016). However, export of DOC from the shelf water to the slope offshore could be limited because most of the bioavailable DOC had been respired in the shelf waters (Bauer and Bianchi, 2011; Bauer et al., 2013; Ward et al., 2017). In the shelf-edge and slope region of the ECS, early studies by Hung et al. (2003) and Ogawa et al. (2003) reported that the distribution of DOC was primarily controlled by physical processes rather than production and/or microbial processes. In this respect, we observed a statistically significant positive correlation between DOC and water temperature (R2=0.82, p<0.001) for the stations in the ECS (Fig. 6a). A similar pattern has also been found in other marginal seas of the North Pacific (Hung et al., 2007; Dai et al., 2009). In our recent study, we reported that the concentrations of DIC and Δ14C-DIC in the ECS slope and the KE region showed conservative behaviour and could be used as tracers of water mass movement and water parcel homogenization as predicted by the solution mixing model (Ge et al., 2016; Ding et al., 2018). As shown in Fig. 6b, the negative relationship between DOC and DIC (R2=0.73, p<0.001) for the stations further suggests that physical processes (such as horizontal and vertical water mixing) influenced the distribution and variation of DOC in the shelf break and slope region of the ECS. However, since DOC is not conservative in the ocean, the observed strong correlation between DOC and T could involve biological and microbial processes and possibly depth covariation. Using this DOC–T correlation alone, we are not able to draw a conclusion that physical mixing was the controlling factor influencing the distribution of DOC in the ECS.
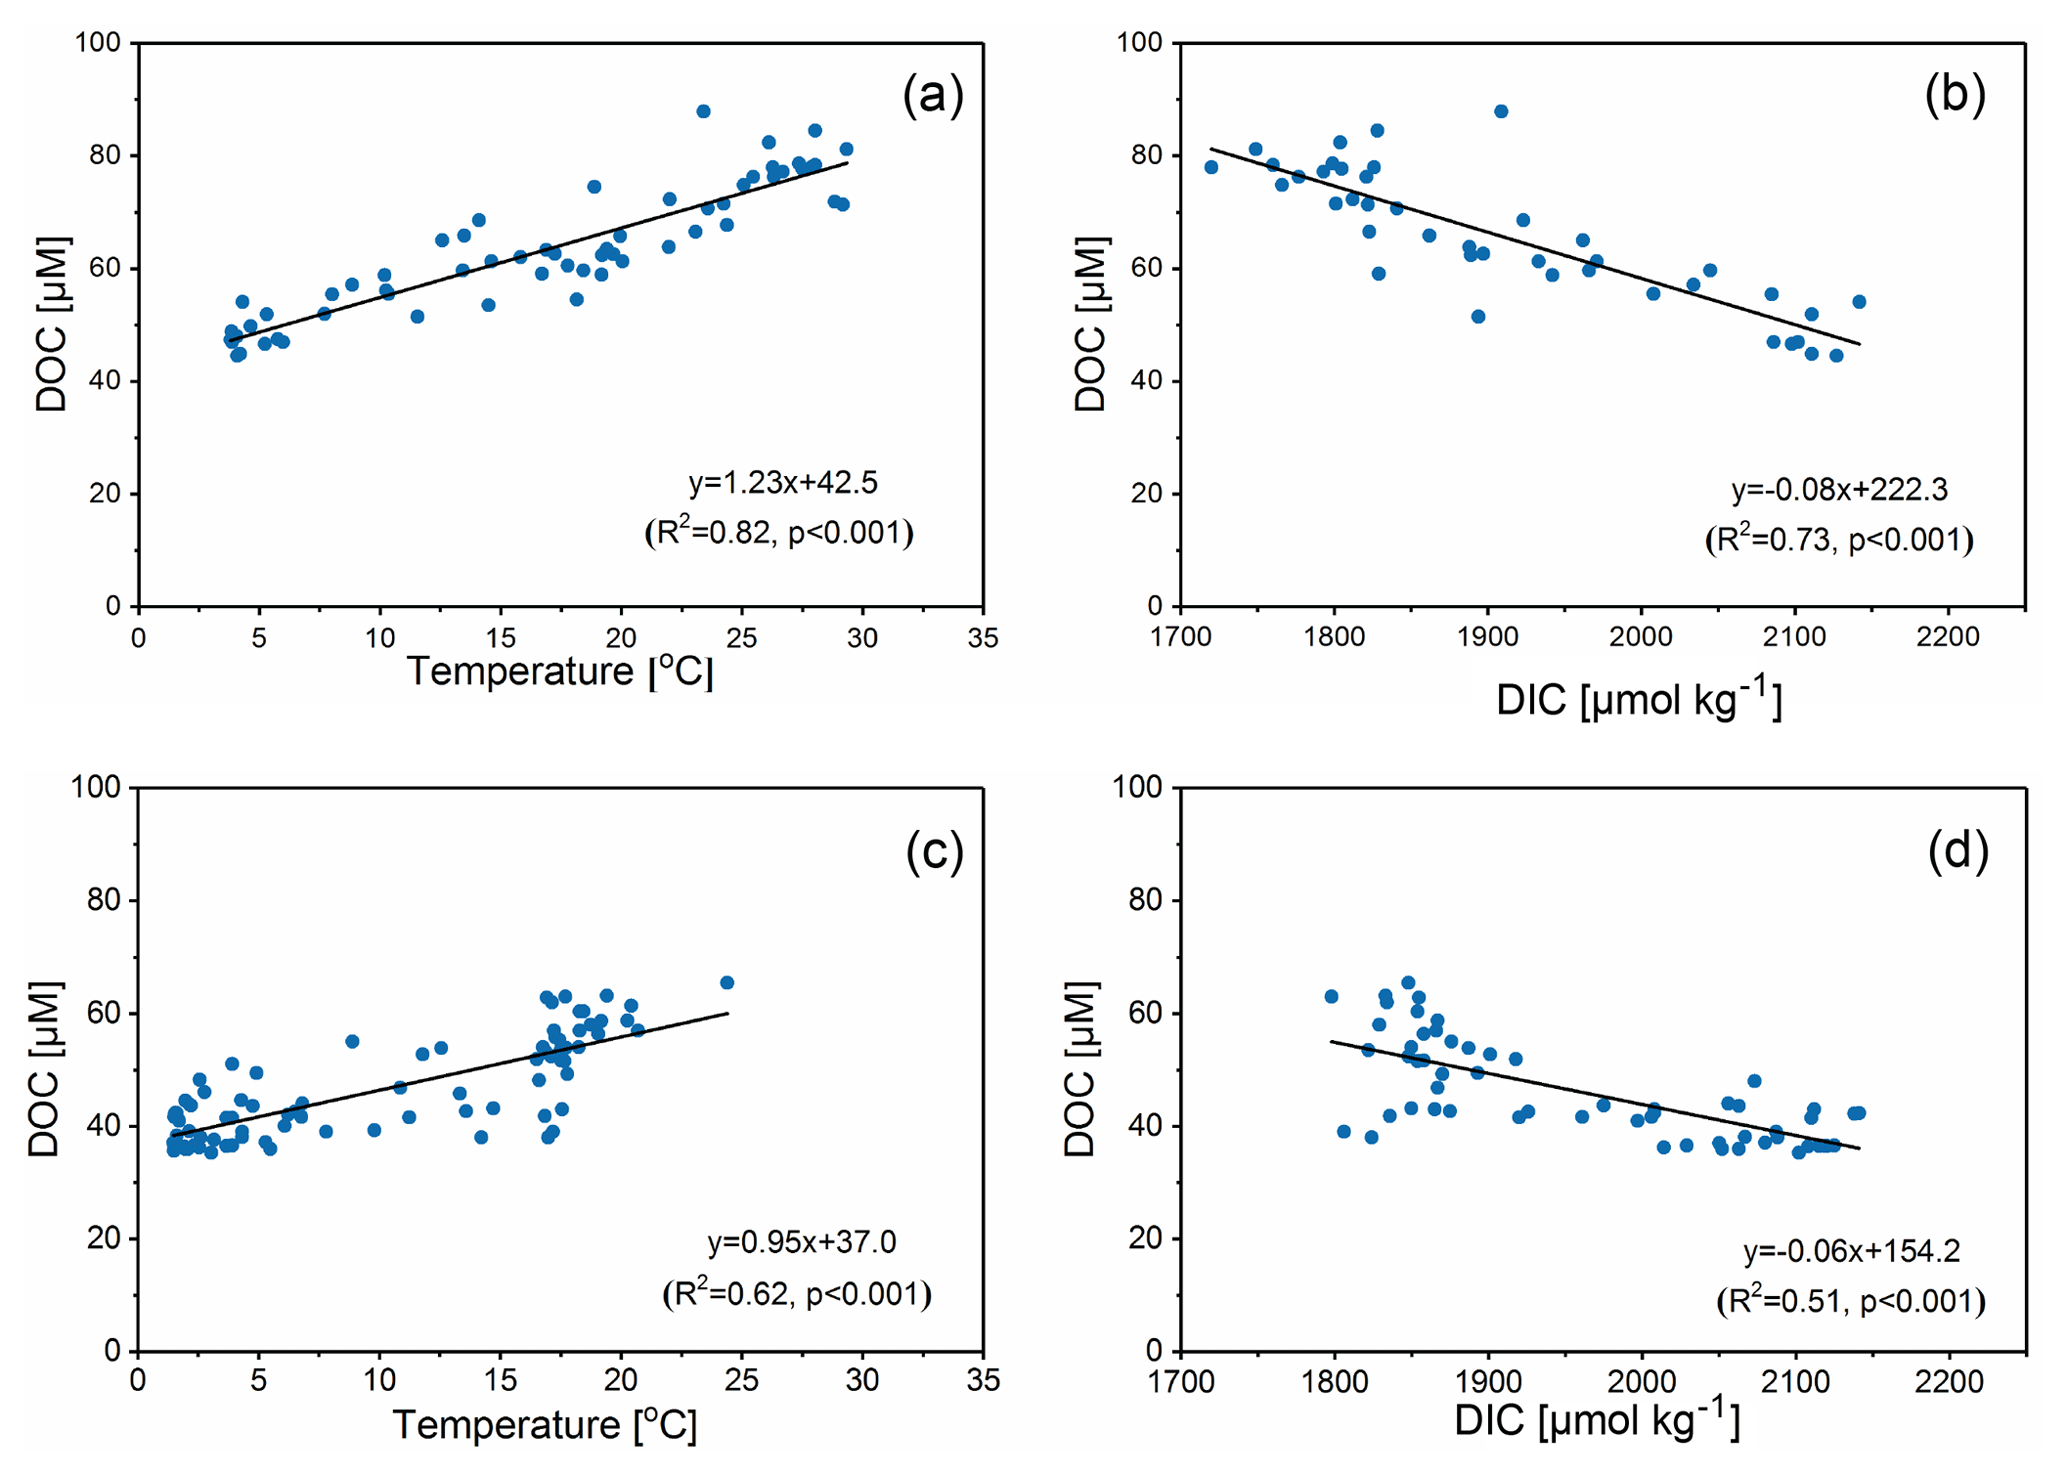
Figure 6Correlation of DOC concentrations with water temperature and DIC concentrations for stations sampled in the (a, b) ECS and (c, d) KE. The solid lines denote linear regressions fit to the data.
Although the river inputs play an important role in the ECS, our sampling stations in the slope region are unlikely affected directly by freshwater input from the Yangtze River, according to the high salinity without any freshwater dilution signals in Figs. 2a and S1. The vertical variations of DOC for the shelf-edge and slope stations, as shown in Fig. 3a, followed a typical trend similar to the DOC depth profiles observed in open oceans, with higher levels of DOC in the low-density upper waters and low levels of DOC in the high-density deep waters. Around the shelf edge of the ECS, the vigorous exchange between the warm saline Kuroshio and cold fresh continental shelf water masses affect the hydrographical characteristics (Hsueh, 2000). As shown in Fig. 2a, the salinity maximum at the density range of 23.2–24.9 σt (near 100–160 m) is influenced largely by the northward-flowing Kuroshio Current. Physical models and chemical tracers both supplied clear evidence of the intrusion of upwelled Kuroshio intermediate water (500–800 m) into the ECS shelf region (Yang et al., 2011, 2012; Ge et al., 2016). To further demonstrate the influence of different water mass mixing processes on the hydrological properties, Fig. 7 compared the latitudinal distributions of salinity, DOC/DIC concentrations and Δ14C-DIC for the seven stations in the ECS. The cross-section salinity plot (Fig. 7a) showed that the water mass in the studied area was composed of mixed Kuroshio and shelf waters. It appeared likely that the influences of Kuroshio intermediate water (500–800 m) on the bottom water at station Z4 and station 11 brought low concentrations of DOC, high concentrations and low Δ14C values of DIC (Fig. 7b–d). This intrusion of Kuroshio intermediate water diluted the DOC at stations 11 and Z4. However, it appears that this upwelling intrusion had almost no effect on the surface water (< 100 m depth) for the shelf stations. The intrusion of Kuroshio intermediate water could reflect a smaller-scale or eddy effect rather than a large-scale influence beyond stations 11 and Z4 (Ge et al., 2016).
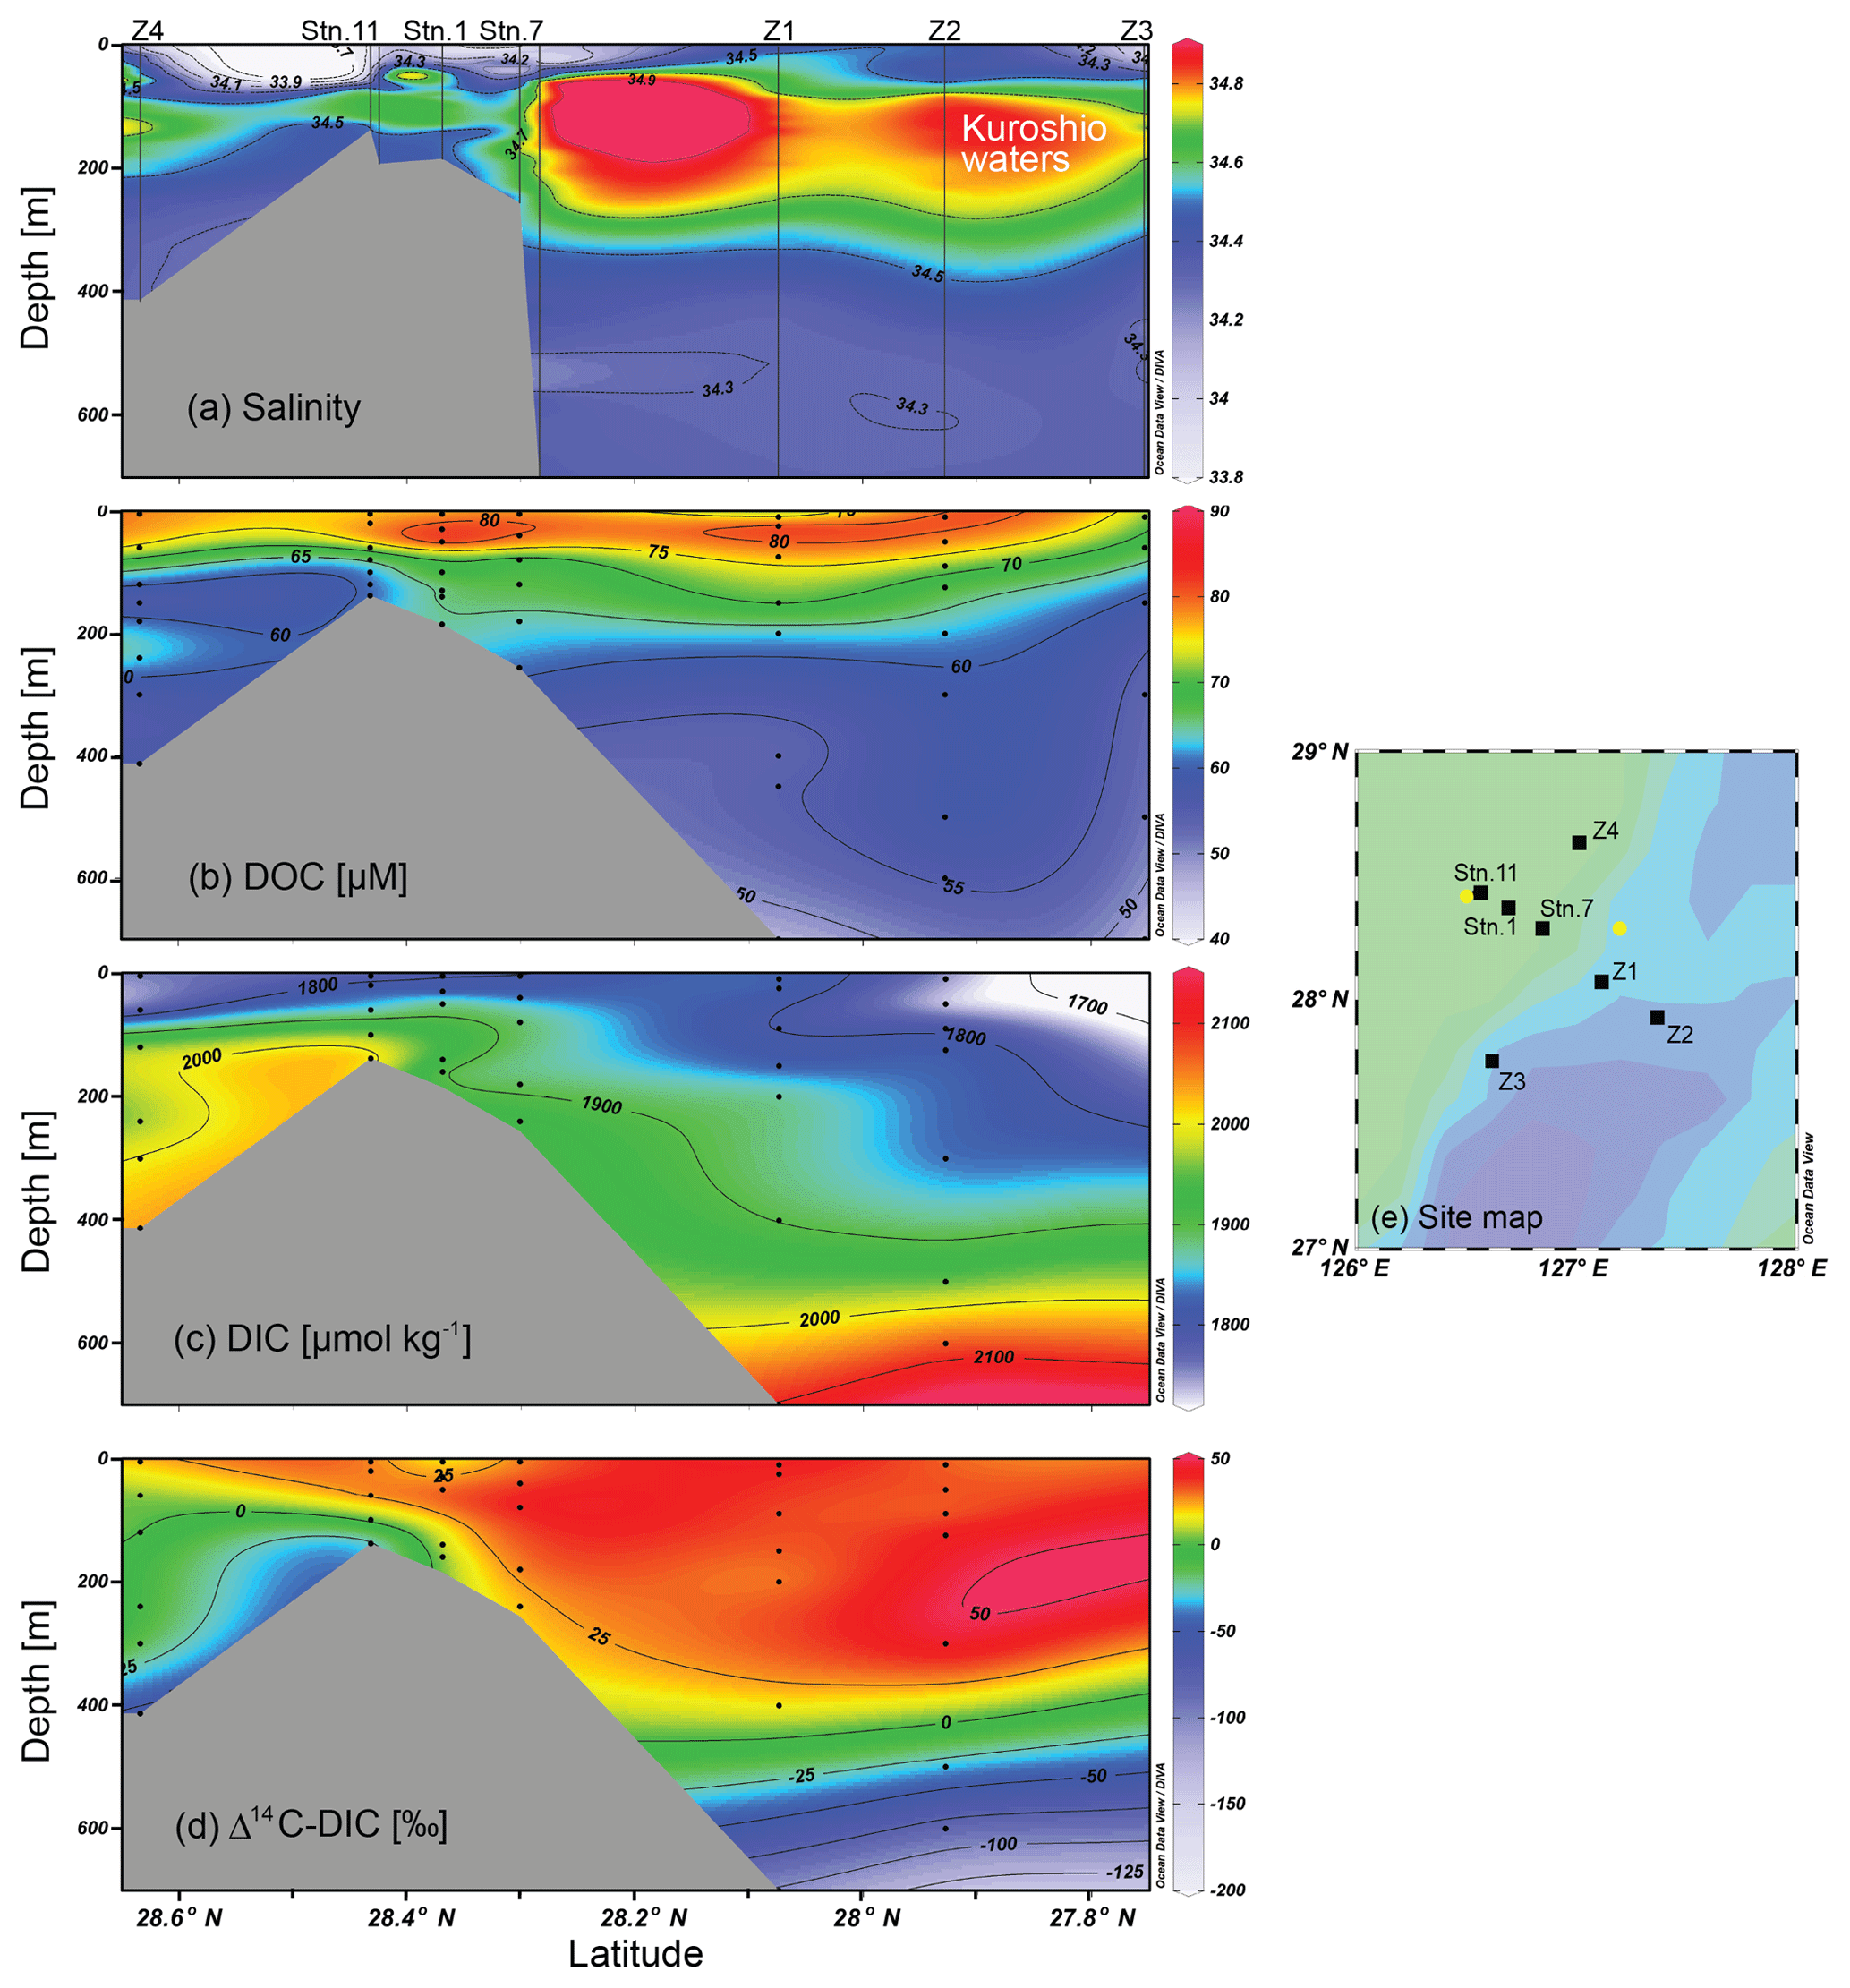
Figure 7Transectional distributions of (a) salinity, (b) DOC concentrations, (c) DIC concentrations and (d) Δ14C-DIC values for the (e) sampling stations (black squares) covering the shelf-edge and slope region of ECS during the cruise in July 2014. Black dots indicate the depths where samples were collected. Note that (a) the salinity of the other two stations (yellow circles) from the cruise in July 2011 is included to support the spreading of the data. (b–d) The distributions of DOC concentrations include seven stations, whereas DIC concentrations and Δ14C-DIC values are given only for six stations due to the lack of data at station Z3 (Ge et al., 2016).
The calculation based on the Δ14C-DIC mass balance showed that approximately 54 %–65 % of the bottom water in the shelf region of ECS originated from the intrusion of Kuroshio intermediate water (Ge et al., 2016). As referred to the water mass analysis on the basis of the assumed conservative variables (potential temperature and salinity) as the characteristics of water type (Catalá et al., 2015a, b), if we use the same two end-member mixing models (Ge et al., 2016) and the corresponding average DOC values for the shelf water (77 µM) and Kuroshio water (52 µM), the conservative concentrations of DOC (referred to as DOC0) could be calculated in the range of 61–64 µM, which is slightly higher but comparable to the observed DOC values in the bottom waters at stations 11 and Z4 (56–61 µM). The negative values of ΔDOC (measured DOC–DOC0) could represent the biological consumption effects superimposed on the water physical mixing processes around the shelf edge and in the slope of ECS. Based on the calculated ΔDOC and the field-measured DOC, we estimated that the bioavailable fraction of DOC could account for approximately 7 % of the total DOC pool in this region. The value is comparable to the results (6.1 % and 10 % ± 5 %) previously reported for the Kuroshio Current and the shelf-slope region of the South China Sea (Gan et al., 2016; Wu et al., 2017). Clearly, biological processes had a significant influence on DOC but were not the dominant controlling factor on the observed DOC distributions in the ECS.
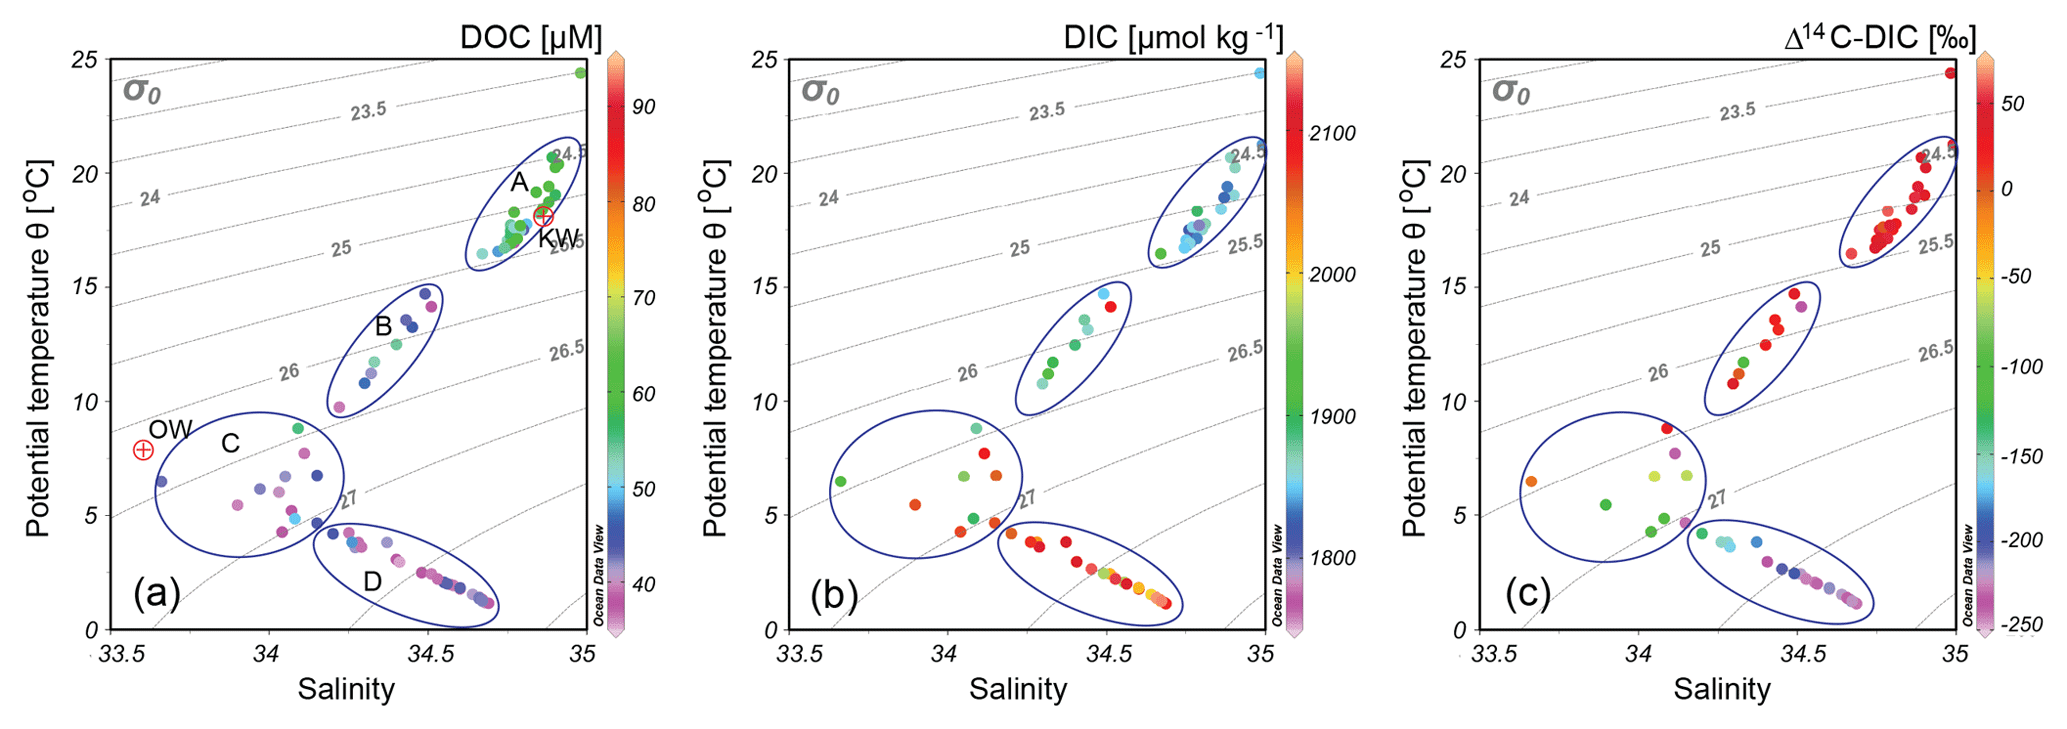
Figure 8Plot of potential temperature (θ) vs. salinity with (a) DOC concentrations, (b) DIC concentrations and (c) Δ14C-DIC values (indicated as the colours of points) associated with the potential water density (σt) for eight stations in the northwestern North Pacific. The circular areas represent different water masses in terms of (A) lower-density water in the upper 300 m depth; (B) mixed upper water in 300–500 m depth; (C) mixed intermediated water in 500–800 m water depth; and (D) denser North Pacific deep water below 1000 m depth. Higher levels of DOC were associated with lower DIC concentrations, and high Δ14C-DIC values were found in lower-density waters (σ0 < 25.5, water mass A), while lower levels of DOC were associated with higher DIC concentrations, and low Δ14C-DIC values occurred in denser waters (water mass C at 26.4–27.1σ0 and water mass D at σ0 > 27.1). Note: DOC concentrations were measured for all stations, whereas DIC results from Ding et al. (2018) were only measured for six stations except stations A1-b and A6. Red dots indicate the potential temperature and salinity of the water types, and acronyms of water types as in Fig. 4 are shown.
4.2 Processes that influence the DOC profiles in the Kuroshio Extension
In general, the biological and physical processes could both affect the DOC profiles in open oceans (Hansell and Waterhouse, 1997; Ogawa et al., 1999; Hansell et al., 2009; Carlson et al., 2010; Bercovici and Hansell, 2016). Based on a correlation analysis of data collected over 10 years in the KE region, Nishikawa et al. (2011) presumed that the shoaling of mixed layer depth could reduce the nutrient supply from deep layers, resulting in less productivity around the KE region in the spring. Low primary production was also observed during the springtime on previous cruises between 2008 and 2011 in the KE region attributed primarily to the low concentration of nitrate and silicic acid (Nishibe et al., 2015). Moreover, notably low levels of available dissolved nitrogen (< 4 µM) were observed in the region (unpublished data) during the same cruise in spring (April–May 2015). The relatively lower surface DOC concentrations (average 57±7 µM) could be due to the low primary production during sampling in the spring season. Despite the low DOC concentrations in the region, we observed the interesting feature of relatively large spatial variations for DOC concentration among these stations, especially in the upper 1500 m (Figs. 3b and 4b). For example, concentrations of DOC in the upper 100 m depth at stations B2 and A4 located north of and around the KE were significantly lower (average 43±5 µM) than those of other stations and were close to the deep water values (approximately 36–44 µM, average 39±3 µM), while elevated concentrations of surface DOC (61–65 µM) prevailed at station K2 located far south of KE and the other five stations (54–63 µM, stations A1-b, B8, B9, A6 and A8), with values 28 % higher than average. In the KE region, primary production is largely affected by advection along the KE meander and differs among representative areas in spring, i.e. high in the northern edge and around the KE axis (483–630 mg C m−2 d−1), accompanied by high chlorophyll a concentration and high column-integrated chlorophyll a values (35–44 mg m−2) in April (Nishibe et al., 2015). The relatively high primary production should result in a high level of DOC in the stations located north and around the KE, but the measured DOC concentrations were rather low at stations B2 and A4. In addition, surface mooring data from the NOAA Kuroshio Extension Observatory (KEO) indicated that physical processes dominate the carbon input to the mixed layer at KEO (Fassbender et al., 2017). Therefore, we speculate that the low DOC levels at stations B2 and A4 were unlikely directly related to the primary production, and instead, the observed large spatial variations were mainly modulated by the mixing dynamics of different water masses rather than biological processes in the region.
Hydrodynamic mixing can be directly evaluated by comparing the DOC concentrations with the variables of hydrographic properties. In Fig. 6c and d, we examined the correlations of the DOC concentrations with water temperature and DIC concentrations in the KE region, respectively. Overall, a positive relationship exists between the DOC concentrations and temperature in the KE (Fig. 6c, R2=0.62, p<0.001), and a negative correlation exists between the DOC and DIC concentrations (Fig. 6d, R2=0.51, p<0.001). Considering the relatively conservative behaviour of DIC in the open ocean, it could be used as tracers of water mass movement and water parcel homogenization as predicted by the solution mixing model in the KE region (Ding et al., 2018). The observed correlations of DOC concentrations and hydrographic variables could thus indicate the physical water mixing played important roles in the DOC distribution in the KE region. To further examine the distribution of DOC with different water masses in the KE region, we plotted the DOC and DIC concentrations and Δ14C-DIC values superimposed on the plots of potential temperature (θ) and salinity in Fig. 8. It can be observed that the distributions of DOC, DIC and Δ14C-DIC were clearly associated with different water masses, as identified by the temperature, salinity and potential density (σ0) in the T–S diagrams (Fig. 8). The denser water mass C with density levels of 26.4–27.1 σ0 near 500–800 m (Fig. 8) likely originated from the subarctic gyre, which had low temperature and salinity and was transported by the south-flowing Oyashio Current along the western boundary to the KE region. This water is subsequently mixed with the warm saline water mass transported by the northeast-flowing Kuroshio Current (water mass A) corresponding to the six stations (K2, A1-b, A6, A8, B8 and B9) south of the KE axis.
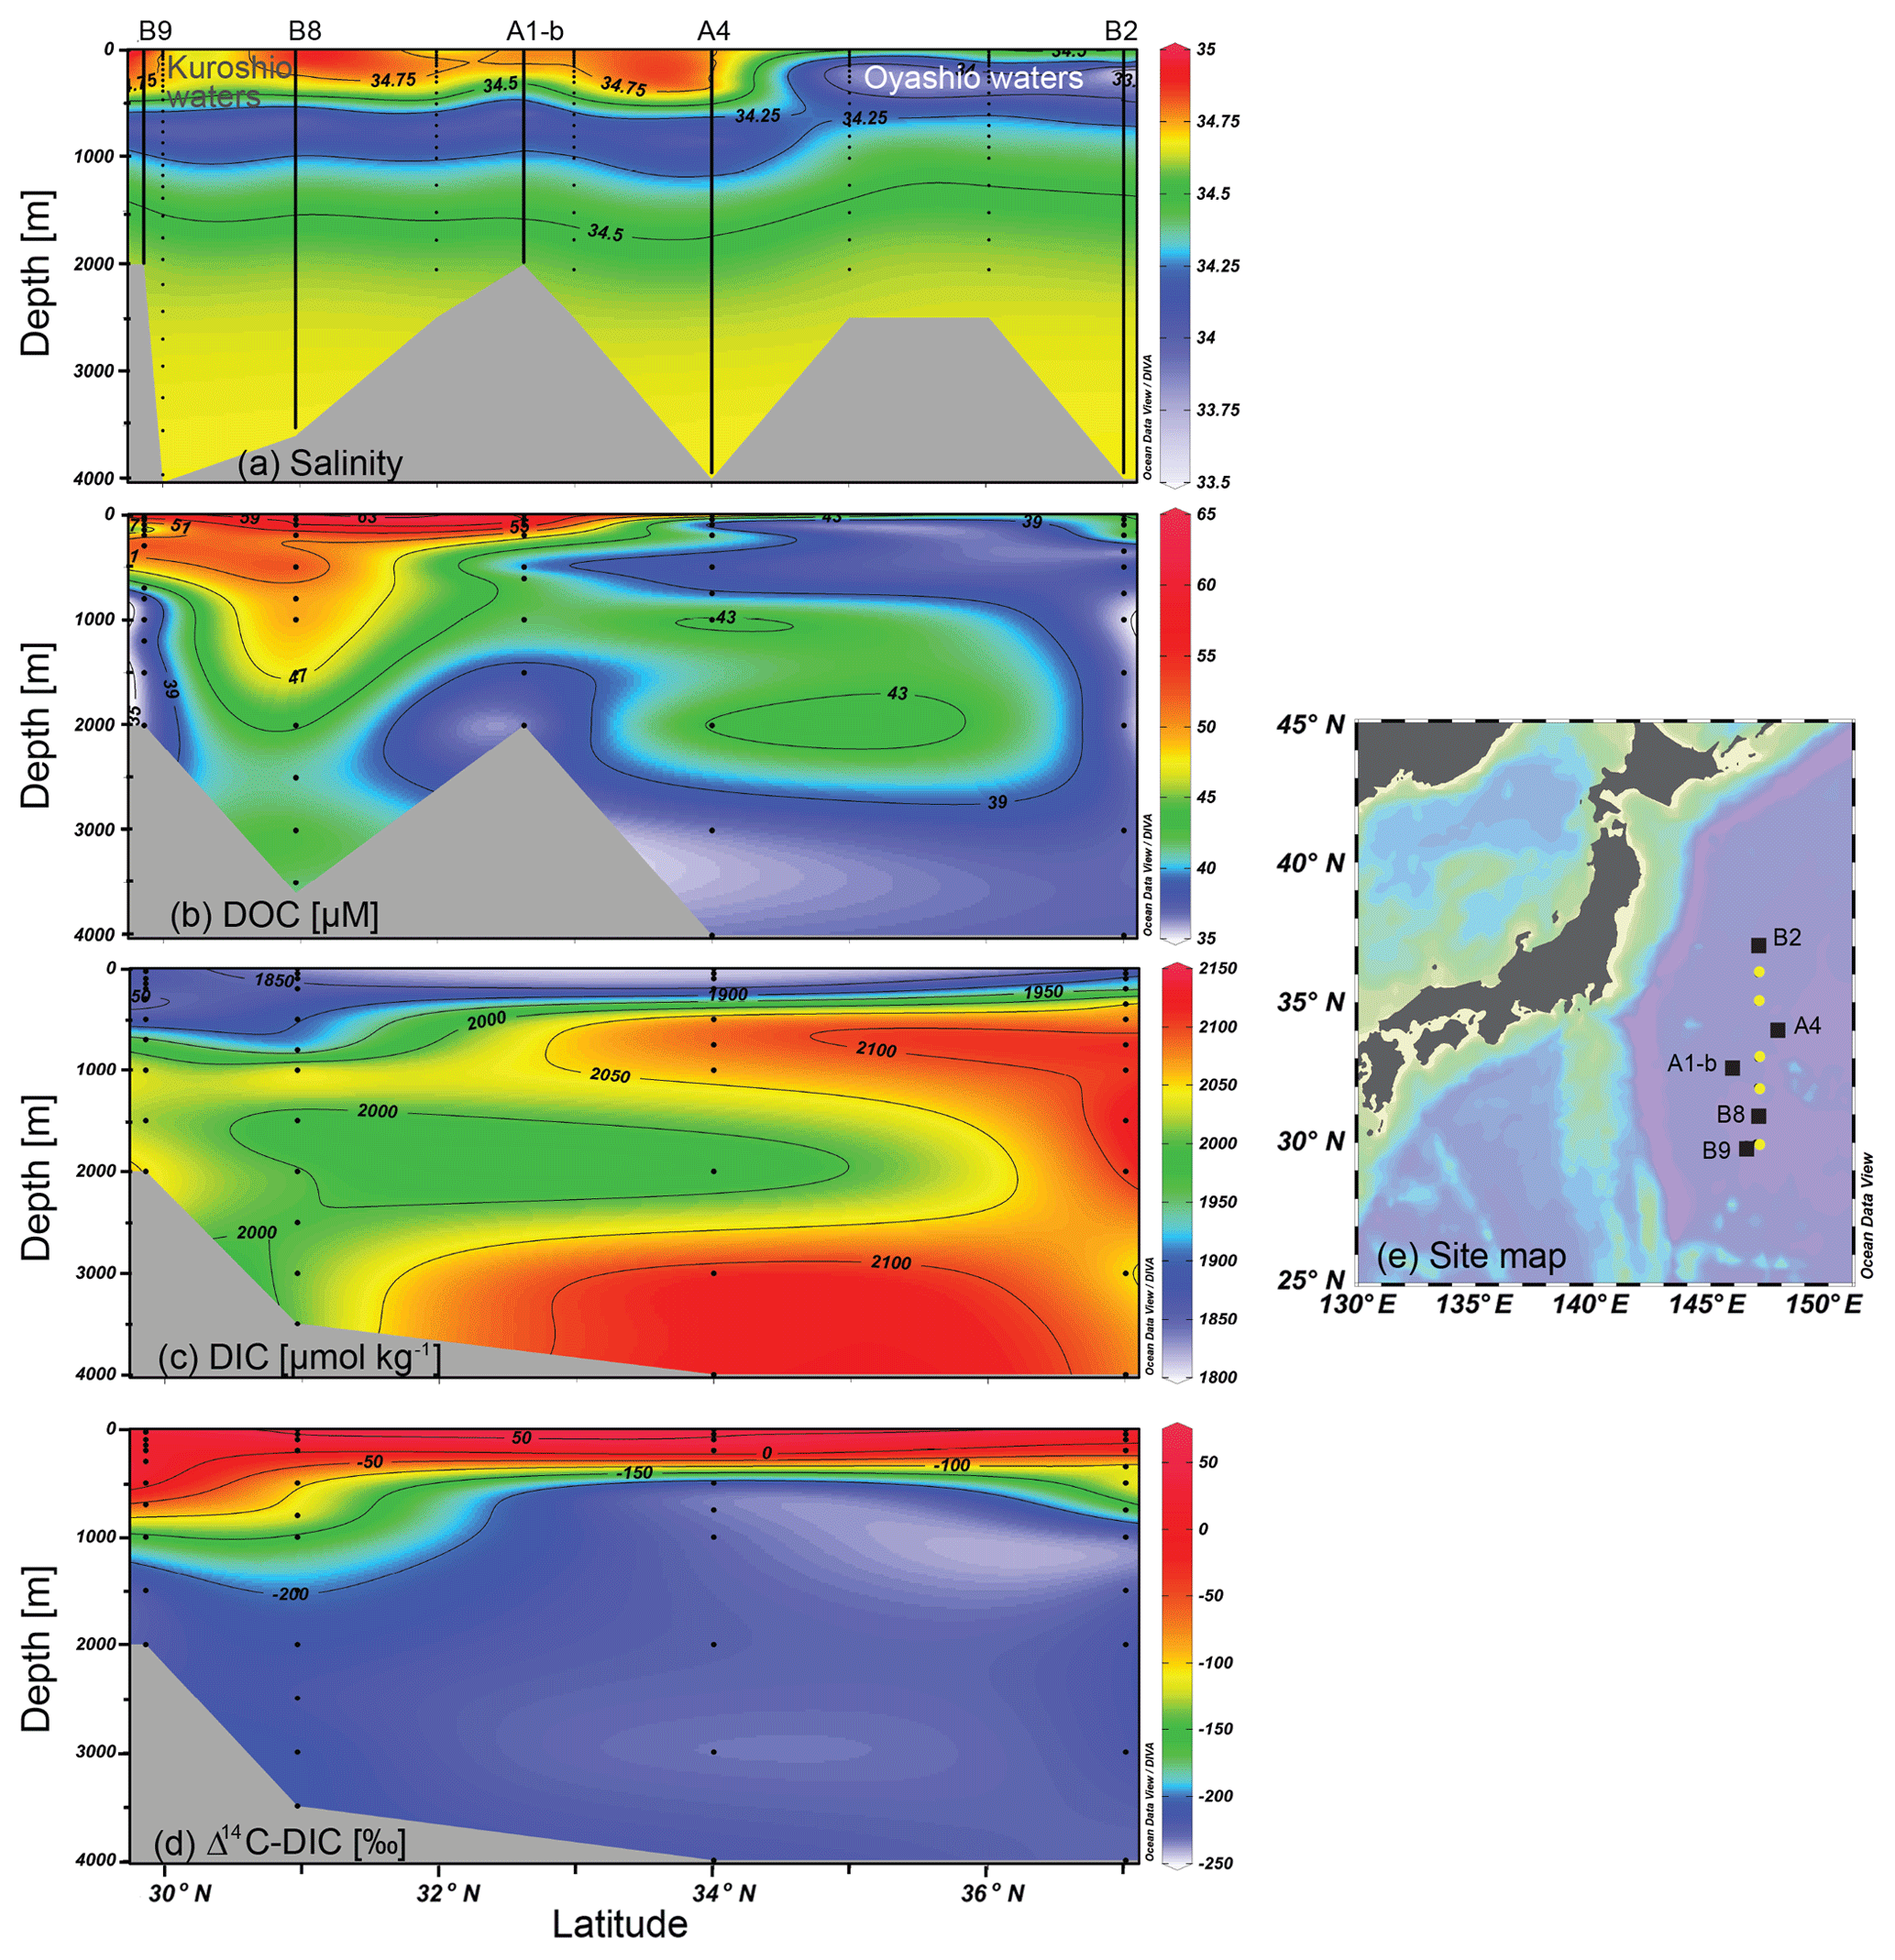
Figure 9Transectional distributions of (a) salinity, (b) DOC concentrations, (c) DIC concentration and (d) Δ14C-DIC values for (e) stations (black squares) sampled across the KE in the northwestern North Pacific. Black dots indicate depths where samples were collected. Note that (a) the salinity of another five stations (yellow circles) along the 147∘ E transect is included to support the spreading of the data. The hydrographic data for the five reference stations are taken from the Pacific data source at https://www.nodc.noaa.gov/ocads/ (last access: 24 December 2018). (c–d) DIC concentrations and Δ14C-DIC values are given only for four stations due to the lack of data at station A1-b (Ding et al., 2018).
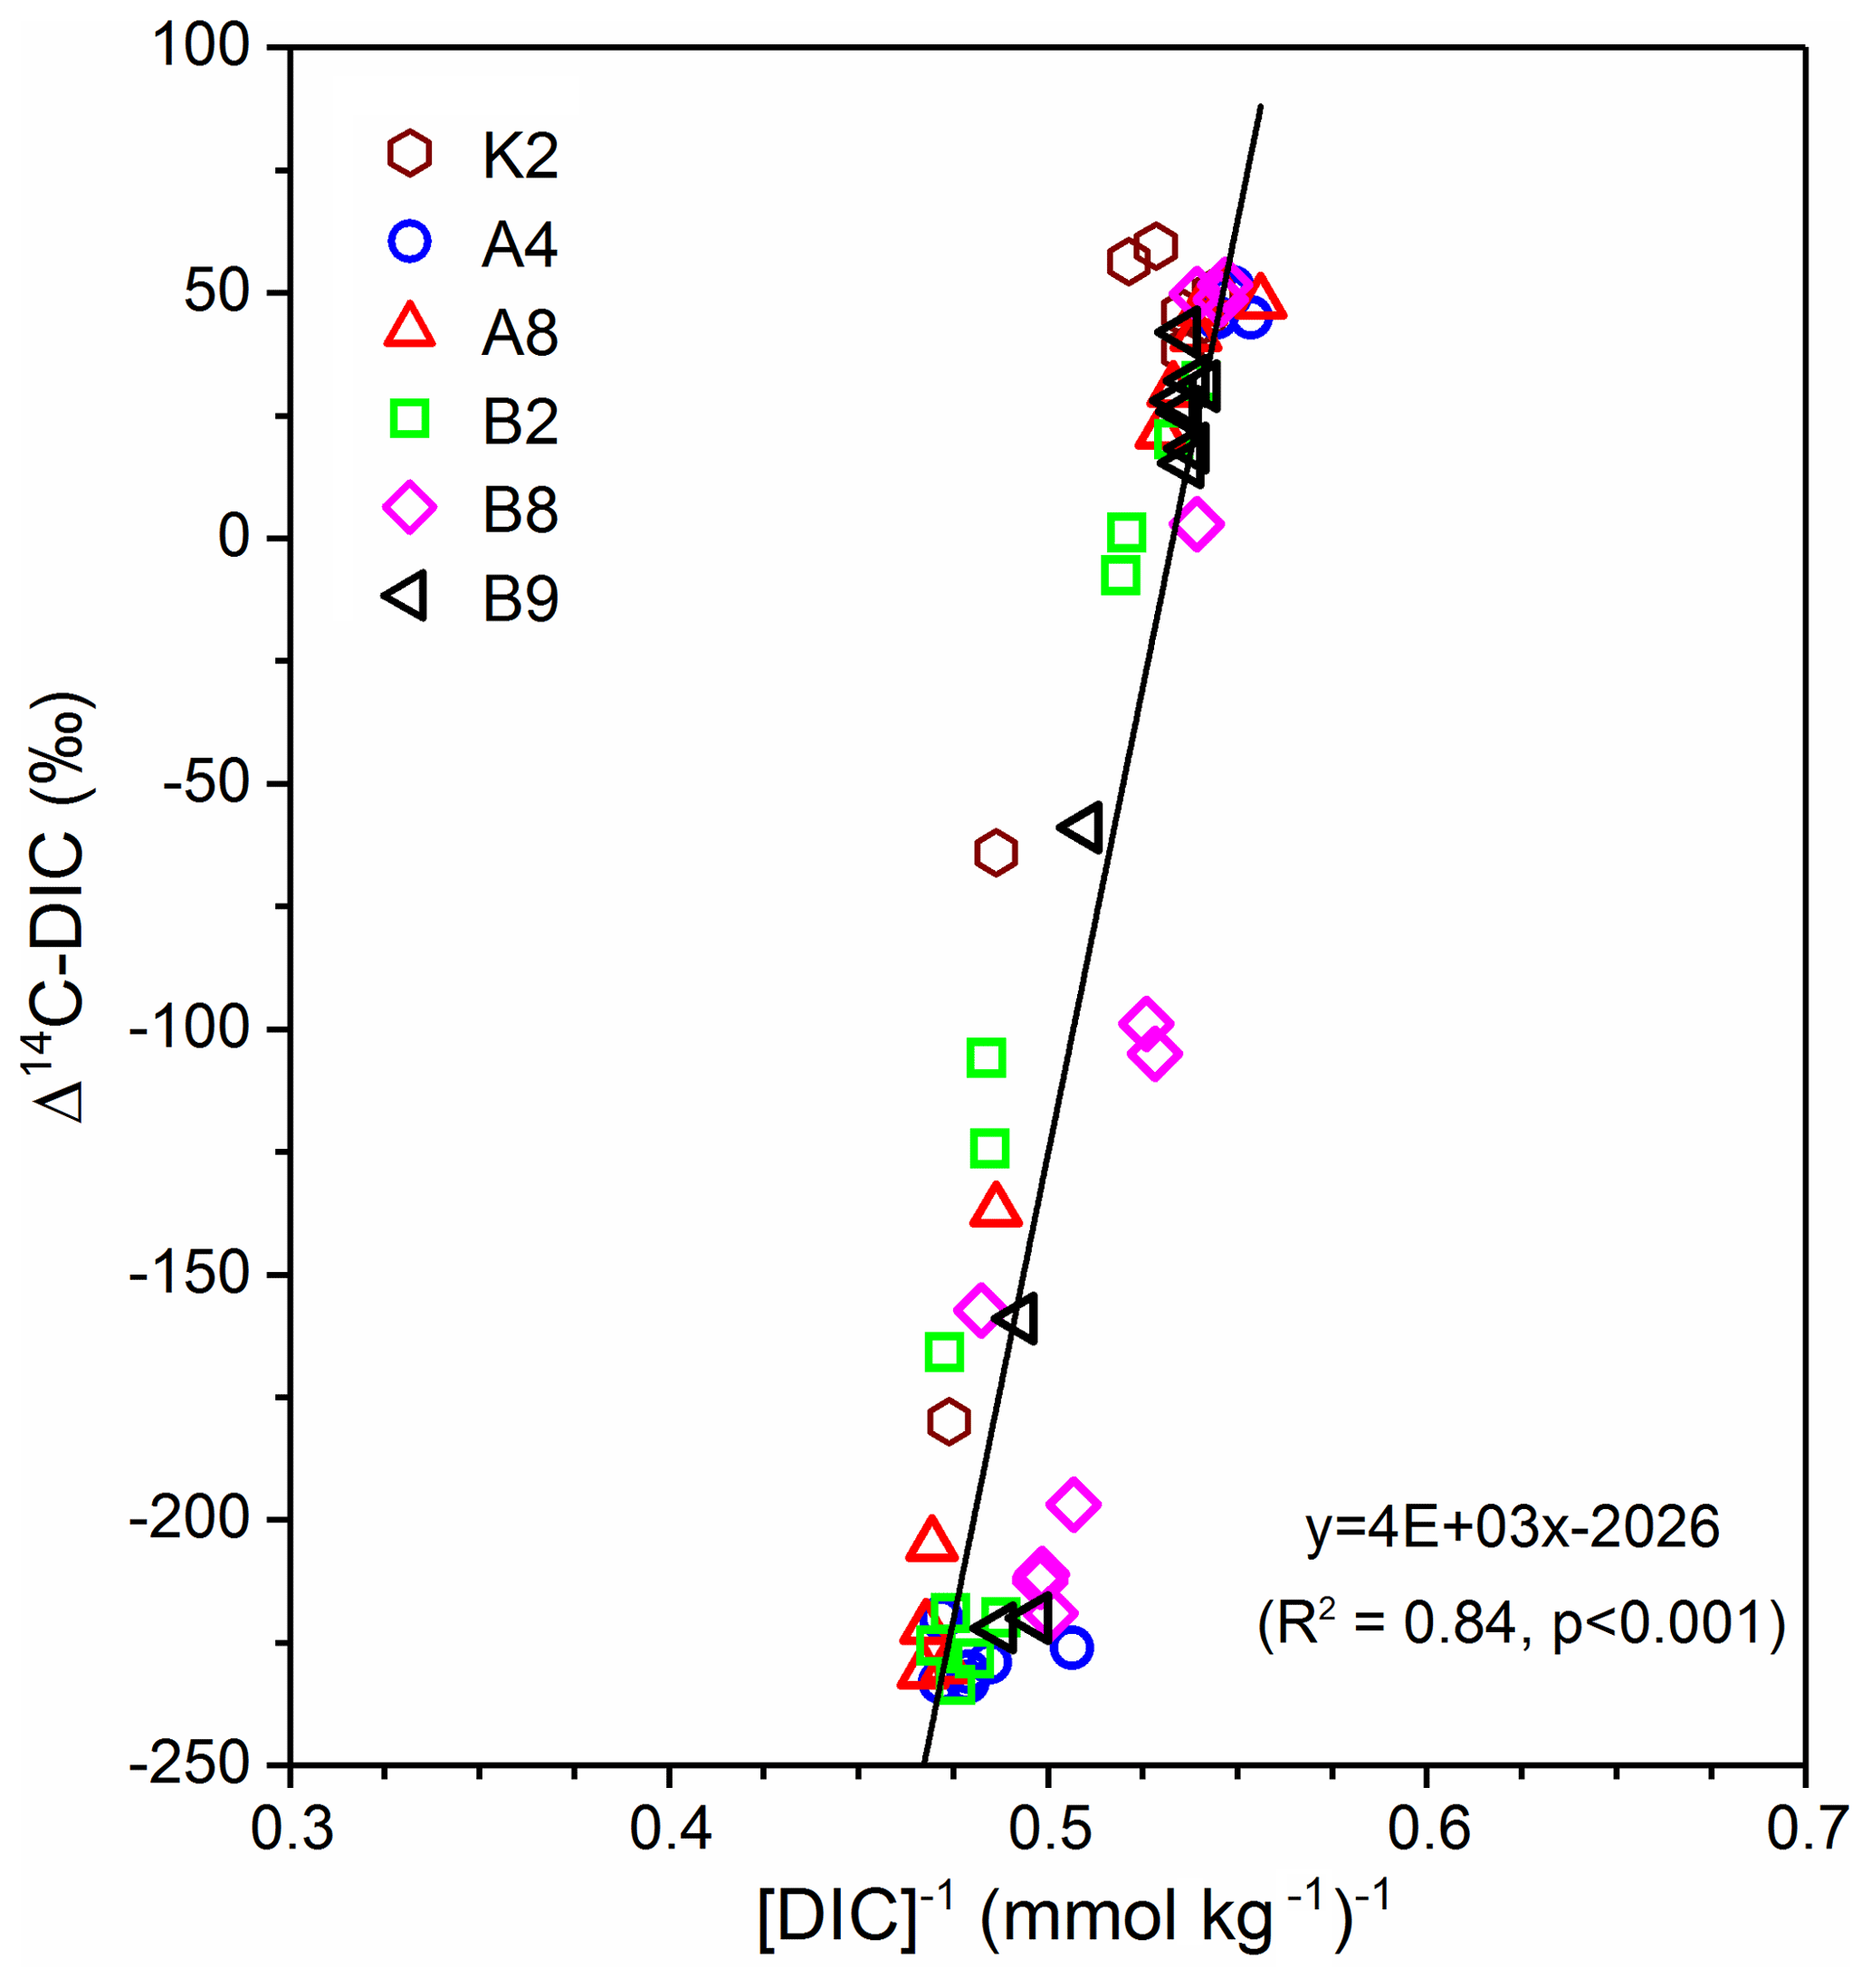
Figure 10Keeling plot of Δ14C-DIC vs. concentration of [DIC]−1 measured for six stations (B9, B8, A4, A8, B2 and K2) in the northwestern North Pacific (data from Ding et al., 2018). The line indicates the linear regression fit to all data points.
Many results suggested that hydrodynamic processes, such as the deep water penetration by vertical mixing, possibly affected the DOC concentrations within the surface waters in the high latitudes despite high primary production (Ogawa et al., 1999; Ogawa and Tanoue, 2003). Considering the relatively lower temperature (< 15 ∘C) and salinity (< 34.5) in the upper 700 m (Figs. 2b and S1), station B2 was mainly affected by the intrusion of cold and fresh subarctic water transported by the southward-flowing Oyashio, which also carried lower concentrations of DOC. In contrast, despite the nutrient-depleted and low primary productivity in the subtropical gyre, physical stability factors such as water column stratification could restrict the vertical mixing of the surface and deep waters, which is beneficial for DOC accumulation in the surface layer. The similar patterns of hydrographic properties and relatively higher DOC levels in the upper 500 m at station K2 and other five stations (A1-b, B8, B9, A6 and A8) in the KE region suggested that the Kuroshio water dominated the mixing in the upper 500 m at these stations, which are mainly characterized by a subtropical warm and high-salinity water mass, as demonstrated in Figs. 3b and S1. The regional influences of the two water masses carried by Kuroshio and Oyashio currents can be demonstrated more clearly in Fig. 9, where we plotted the salinity, DOC and DIC concentrations, and Δ14C-DIC values for the five stations (B2, A4, A1-b, B8 and B9) as a cross-KE transect from north to south. It can be observed that the Kuroshio, which carries relatively high DOC, dominated stations B9, B8 and A1-b above 500 m depth. The latitudinal distributions of salinity could serve as intuitive evidence to show the intrusion of Oyashio Current, which resulted in the low salinity near 200–800 m at station B2 and other two reference stations at the north and near of 35∘ N labelled in Fig. 9e (at a density range of 26.4–26.9 σt in Fig. 2b). It appeared likely that the Oyashio, which carries low salinity, low DOC but high DIC concentrations, and low Δ14C-DIC values in the subarctic intermediate water, influenced the upper layers (above 1000 m) at station B2. The Oyashio water could have further intruded southward to affect the upper 200–1000 m at station A4 and mixed with the Kuroshio water to form the KE water mass flowing eastward, which resulted in low DOC, high DIC and low Δ14C-DIC values. However, it cannot be determined whether this southward intrusion of Oyashio water is a seasonal or decadal oscillation (Ding et al., 2018). Previous studies focused on physical oceanography have shown that the unstable mode of the KE could generate active water mass changes around the region, such as the enhanced mesoscale eddies and ocean recirculation (Qiu and Chen, 2005, 2011; Ma et al., 2016). The fresher Oyashio-origin water could be transported southward through the mesoscale eddies (Qiu and Chen, 2011), influencing the chemical and biological processes in the KE region. Using the significantly low Δ14C-DIC values at stations B2 and A4 in the upper 700 m depth in the KE region, we also demonstrated the same strong influence of the southward Oyashio-transported subarctic intermediate water mass via mesoscale eddies (Ding et al., 2018). The ratios of Oyashio water to Kuroshio water mixing for the five stations (B2, B8, A4, A8 and B9) were obtained by mass balance calculations based on the selected two end-member Δ14C-DIC values (an average of 50 ‰ for the Kuroshio water and −220 ‰ for the North Pacific Intermediate Water of Oyashio) in the Δ14C-DIC Keeling plot analysis (Fig. 10) (Ding et al., 2018). For example, 55 %–58 % Oyashio water could contribute to produce the observed Δ14C-DIC values at the depth of 500 m in stations B2 and B8 and 100 % Oyashio water at station A4 and 96 %–100 % Kuroshio water at stations A8 and B9, respectively. If we consider that the distribution of DOC is controlled mainly by hydrodynamic mixing in the KE region, the conservative concentrations of DOC could subsequently be calculated using the two water mass mixing models and the corresponding average DOC values for the selected end-member water masses (an average of 57 µM for the Kuroshio water and 40 µM for the NPIW of Oyashio) derived from the Δ14C-DIC values within the range of 40–56 µM. The difference between the measured and conservative DOC (DOC0) concentrations (ΔDOC = DOCmeasured − DOC0) can represent other biological processes that secondarily modulate DOC in the KE region. For example, the positive ΔDOC values (∼6 µM) that accounted for approximately 11 % of the measured DOC at station B8 indicated a net DOC increase from biological processes, accompanied by the relatively low DIC concentrations shown in Fig. 9c. The recirculation gyre immediately south of the KE has been found to exhibit high production rates in the winter–spring season in the North Pacific due to the entrainment of nutrient-rich water during deep winter mixing (Yasunaka et al., 2013, 2014). However, biological consumptions of DOC could account for 8 %–20 % of the total DOC pool based on the negative ΔDOC values (2–8 µM) and the measured DOC at stations B2 and A4.
The concentrations of DOC in deep waters in the KE region were low, in the range of 36–44 µM, comparable to the values reported for the deep North Pacific (Druffel et al., 1992; Hansell and Carlson, 1998; Hansell et al., 2009) and the deep South Pacific (34–43 µM) (Doval and Hansell, 2000; Druffel and Griffin, 2015) but slightly lower than the values in the North Atlantic (40–48 µM) (Carlson et al., 2010; Druffel et al., 2016). These uniformly low levels of DOC indicate the homogeneous distribution of deep water and the more presumably refractory DOC left behind in deeper waters in the KE and North Pacific (Carlson et al., 2010; Hansell et al., 2012; Follett et al., 2014). Radiocarbon measurements of DOC collected in the KE indicate that the 14C age of DOC in deep water was ∼6200 years (Wang, unpublished data), similar to the DOC ages in the deep North Pacific (Druffel et al., 1992), and support the refractory nature of DOC in the deep KE. The lower deep DOC concentrations in the North Pacific relative to the North Atlantic could be due to the general circulation pattern of the world ocean, as proposed by Hansell and Carlson (1998). DOC has been cycled for longer timescales with older 14C ages (∼6000 years) in the deep North Pacific (Druffel et al., 1992) than DOC (∼4000 years) in the North Atlantic Ocean (Bauer et al., 1992). However, by comparing with the deep DOC results in the slope region of the ECS, it can be observed that the deep DOC level in the KE was 10–15 µM lower on average than that in the ECS, implying the possibility of outflow export of DOC from marginal seas to the ocean interior and cycling in the deep ocean for a long duration.
The results of our study indicate that the concentration of DOC ranged from 45 to 88 µM in the outer shelf and the slope region of ECS and from 35 to 65 µM in the KE region. The distribution of DOC in the shelf-edge and slope region of the ECS was largely influenced by the physical mixing processes of Kuroshio and ECS shelf waters. The upwelling intrusion of Kuroshio intermediate water could dilute the DOC concentrations at stations around the shelf break region of the ECS.
In comparison, the concentrations of DOC in the KE region were significantly lower in the surface layer. The DOC in the deep water of the KE had similar comparable values as those reported for the deep north and south Pacific. The large spatial variations of DOC in the upper 700 m among the stations in the KE were influenced primarily by hydrodynamic mixing of two different water masses. The Kuroshio, which carries warm and relatively higher DOC water, and the Oyashio, which carries cold and fresh subarctic intermediate water with lower DOC, mix to form KE. These mixing dynamics could have a major influence on primary production and on biogeochemical processes in the KE region.
All data used in this study will be freely available, for scientific use only, upon request. Anyone interested in using this data set for scientific research should contact the corresponding author via e-mail.
The supplement related to this article is available online at: https://doi.org/10.5194/os-15-1177-2019-supplement.
LD is a post-doc working on this project, participated in the cruises, sample analysis and manuscript writing. TG is a laboratory technician participated in all cruises, sampling and sample analysis. XW is the corresponding author and leading scientist for this study from proposal writing, cruise and sampling planning, and manuscript writing. All authors have read the manuscript and agreed on the authorship.
The authors declare that they have no conflict of interest.
We thank Lixin Wu and Jing Zhang for providing the ECS and KE cruise opportunity, and Huiwang Gao and Lei Li for the help during sample collection. We thank Yuejun Xue, Chunle Luo, Caili Xu, Yuanzhi Qi and Sen Shan for help and assistance during sample analysis in laboratory. We give our special thanks to the captains and crew members of R/V Dongfanghong 2 and R/V Shinsei Maru for help during the cruises. We thank the associate editor and three reviewers for the valuable and constructive comments that greatly improved the manuscript.
This research has been supported by the National Natural Science Foundation of China (grant nos. 91858210 and 91428101) and the Fundamental Research Funds for the Central Universities (grant no. 201762009).
This paper was edited by Mario Hoppema and reviewed by three anonymous referees.
Azam, F., Fenchel, T., Field, J. G., Gray, J., Meyer-Reil, L., and Thingstad, F.: The ecological role of water-column microbes in the sea, Mar. Ecol Prog Ser., 20, 257–263, 1983.
Bauer, J. E. and Bianchi, T. S.: Dissolved organic carbon cycling and transformation, in: Treatise on Estuarine and Coastal Science, edited by: Wolanski, E. and McLusky, D., Academic Press, Waltham, 2011.
Bauer, J. E., Williams, P. M., and Druffel, E. R. M.: 14C activity of dissolved organic carbon fractions in the north-central Pacific and Sargasso Sea, Nature, 357, 667–670, 1992.
Bauer, J. E., Cai, W.-J., Raymond, P. A., Bianchi, T. S., Hopkinson, C. S., and Regnier, P. A. G.: The changing carbon cycle of the coastal ocean, Nature, 504, 61–70, https://doi.org/10.1038/nature12857, 2013.
Bercovici, S. K. and Hansell, D. A.: Dissolved organic carbon in the deep Southern Ocean: Local versus distant controls, Global Biogeochem. Cy., 30, 350–360, https://doi.org/10.1002/2015GB005252, 2016.
Carlson, C. A., Ducklow, H. W., and Michaels, A. F.: Annual flux of dissolved organic carbon from the euphotic zone in the northwestern Sargasso Sea, Nature, 371, 405–408, https://doi.org/10.1038/371405a0, 1994.
Carlson, C. A., Ducklow, H. W., Hansell, D. A., and Smith, W. O.: Organic carbon partitioning during spring phytoplankton blooms in the Ross Sea polynya and the Sargasso Sea, Limnol. Oceanogr., 43, 375–386, https://doi.org/10.4319/lo.1998.43.3.0375, 1998.
Carlson, C. A., Hansell, D. A., Nelson, N. B., Siegel, D. A., Smethie, W. M., Khatiwala, S., Meyers, M. M., and Halewood, E.: Dissolved organic carbon export and subsequent remineralization in the mesopelagic and bathypelagic realms of the North Atlantic basin, Deep-Sea Res. Pt. II, 57, 1433–1445, https://doi.org/10.1016/j.dsr2.2010.02.013, 2010.
Catalá, T. S., Reche, I., Álvarez, M., Khatiwala, S., Guallart, E. F., Benítez-Barrios, V. M., Fuentes-Lema, A., Romera-Castillo, C., Nieto-Cid, M., Pelejero, C., Fraile-Nuez, E., Ortega-Retuerta, E., Marrasé, C., and Álvarez-Salgado, X. A.: Water mass age and aging driving chromophoric dissolved organic matter in the dark global ocean, Global Biogeochem. Cy., 29, 917–934, https://doi.org/10.1002/2014GB005048, 2015a.
Catalá, T. S., Reche, I., Fuentes-Lema, A., Romera-Castillo, C., Nieto-Cid, M., Ortega-Retuerta, E., Calvo, E., Álvarez, M., Marrasé, C., Stedmon, C. A., and Álvarez-Salgado, X. A.: Turnover time of fluorescent dissolved organic matter in the dark global ocean, Nat. Commun., 6, 5986, https://doi.org/10.1038/ncomms6986, 2015b.
Chen, C.-T. A. and Wang, S.-L.: Carbon, alkalinity and nutrient budgets on the East China Sea continental shelf, J. Geophys. Res.-Oceans, 104, 20675–20686, https://doi.org/10.1029/1999jc900055, 1999.
Dai, M., Meng, F., Tang, T., Kao, S.-J., Lin, J., Chen, J., Huang, J.-C., Tian, J., Gan, J., and Yang, S.: Excess total organic carbon in the intermediate water of the South China Sea and its export to the North Pacific, Geochem. Geophys. Geosyst., 10, Q12002, https://doi.org/10.1029/2009GC002752, 2009.
Ding, L., Ge, T., Gao, H., Luo, C., Xue, Y., Druffel, E. R. M., and Wang, X.: Large variability of dissolved inorganic radiocarbon in the Kuroshio Extension of the northwest North Pacific, Radiocarbon, 60, 691–704, https://doi.org/10.1017/RDC.2017.143, 2018.
Doval, M. D. and Hansell, D. A.: Organic carbon and apparent oxygen utilization in the western South Pacific and the central Indian Oceans, Mar. Chem., 68, 249–264, https://doi.org/10.1016/S0304-4203(99)00081-X, 2000.
Druffel, E. R., Williams, P. M., Bauer, J. E., and Ertel, J. R.: Cycling of dissolved and particulate organic matter in the open ocean, J. Geophys. Res., 97, 15639–15659, 1992.
Druffel, E. R. M. and Griffin, S.: Radiocarbon in dissolved organic carbon of the South Pacific Ocean, Geophys. Res. Lett., 42, 4096–4101, https://doi.org/10.1002/2015GL063764, 2015.
Druffel, E. R. M., Griffin, S., Coppola, A. I., and Walker, B. D.: Radiocarbon in dissolved organic carbon of the Atlantic Ocean, Geophys. Res. Lett., 43, 5279–5286, https://doi.org/10.1002/2016GL068746, 2016.
Druffel, E. R. M., Griffin, S., Wang, N., Garcia, N. G., McNichol, A. P., Key, R. M., and Walker, B. D.: Dissolved organic radiocarbon in the Central Pacific Ocean, Geophys. Res. Lett., 46, 5396–5403, https://doi.org/10.1029/2019GL083149, 2019.
Fassbender, A. J., Sabine, C. L., Cronin, M. F., and Sutton, A. J.: Mixed-layer carbon cycling at the Kuroshio Extension Observatory, Global Biogeochem. Cy., 31, 272–288, https://doi.org/10.1002/2016GB005547, 2017.
Fenchel, T.: The microbial loop-25 years later, J. Exp. Mar. Bio. Ecol., 366, 99–103, https://doi.org/10.1016/j.jembe.2008.07.013, 2008.
Follett, C. L., Repeta, D. J., Rothman, D. H., Xu, L., and Santinelli, C.: Hidden cycle of dissolved organic carbon in the deep ocean, P. Natl. Acad. Sci. USA., 111, 16706–16711, https://doi.org/10.1073/pnas.1407445111, 2014.
Gan, S., Wu, Y., and Zhang, J.: Bioavailability of dissolved organic carbon linked with the regional carbon cycle in the East China Sea, Deep-Sea Res. Pt. II, 124, 19–28, https://doi.org/10.1016/j.dsr2.2015.06.024, 2016.
Ge, T., Wang, X., Zhang, J., Luo, C., and Xue, Y.: Dissolved inorganic radiocarbon in the Northwest Pacific continental margin, Radiocarbon, 58, 517–529, https://doi.org/10.1017/RDC.2016.23, 2016.
Gong, G.-C., Wen, Y.-H., Wang, B.-W., and Liu, G.-J.: Seasonal variation of chlorophyll a concentration, primary production and environmental conditions in the subtropical East China Sea, Deep-Sea Res. Pt. II, 50, 1219–1236, https://doi.org/10.1016/S0967-0645(03)00019-5, 2003.
Guo, L., Santschi, P. H., and Warnken, K. W.: Dynamics of dissolved organic carbon (DOC) in oceanic environments, Limnol. Oceanogr., 40, 1392–1403, https://doi.org/10.4319/lo.1995.40.8.1392, 1995.
Guo, X., Miyazawa, Y., and Yamagata, T.: The Kuroshio onshore intrusion along the shelf break of the East China Sea: The origin of the Tsushima Warm Current, J. Phys. Oceanogr., 36, 2205–2231, https://doi.org/10.1175/JPO2976.1, 2006.
Hansell, D. A. and Waterhouse, T. Y.: Controls on the distributions of organic carbon and nitrogen in the eastern Pacific Ocean, Deep-Sea Res. Pt. I, 44, 843–857, https://doi.org/10.1016/S0967-0637(96)00128-8, 1997.
Hansell, D. A. and Peltzer, E. T.: Spatial and temporal variations of total organic carbon in the Arabian Sea, Deep-Sea Res. Pt. II, 45, 2171–2193, https://doi.org/10.1016/S0967-0645(98)00067-8, 1998.
Hansell, D. A. and Carlson, C. A.: Deep-ocean gradients in the concentration of dissolved organic carbon, Nature, 395, 263–266, https://doi.org/10.1038/26200, 1998.
Hansell, D. A. and Carlson, C. A.: Marine dissolved organic matter and the carbon cycle, Oceanography, 14, 41–49, 2001.
Hansell, D. A., Carlson, C. A., and Suzuki, Y.: Dissolved organic carbon export with North Pacific Intermediate Water formation, Global Biogeochem. Cy., 16, 1007, https://doi.org/10.1029/2000GB001361, 2002.
Hansell, D. A., Carlson, C. A., Repeta, D. J., and Schlitzer, R.: Dissolved organic matter in the ocean: A controversy stimulates new insights, Oceanography, 22, 202–211, https://doi.org/10.5670/oceanog.2009.109, 2009.
Hansell, D. A., Carlson, C. A., and Schlitzer, R.: Net removal of major marine dissolved organic carbon fractions in the subsurface ocean, Global Biogeochem. Cy., 26, GB1016, https://doi.org/10.1029/2011gb004069, 2012.
Hsueh, Y.: The Kuroshio in the East China Sea, J. Mar. Syst., 24, 131–139, https://doi.org/10.1016/S0924-7963(99)00083-4, 2000.
Hu, D., Wu, L., Cai, W., Gupta, A. S., Ganachaud, A., Qiu, B., Gordon, A. L., Lin, X., Chen, Z., Hu, S., Wang, G., Wang, Q., Sprintall, J., Qu, T., Kashino, Y., Wang, F., and Kessler, W. S.: Pacific western boundary currents and their roles in climate, Nature, 522, 299–308, https://doi.org/10.1038/nature14504, 2015.
Hung, J. J., Chen, C. H., Gong, G. C., Sheu, D. D., and Shiah, F. K.: Distributions, stoichiometric patterns and cross-shelf exports of dissolved organic matter in the East China Sea, Deep-Sea Res. Pt. II, 50, 1127–1145, https://doi.org/10.1016/S0967-0645(03)00014-6, 2003.
Hung, J. J., Wang, S. M., and Chen, Y. L.: Biogeochemical controls on distributions and fluxes of dissolved and particulate organic carbon in the Northern South China Sea, Deep-Sea Res. Pt. II, 54, 1486–1503, https://doi.org/10.1016/j.dsr2.2007.05.006, 2007.
Ma, X., Zhao, J., Chang, P., Liu, X., Montuoro, R., Small, R. J., Bryan, F. O., Greatbatch, R. J., Brandt, P., Wu, D., Lin, X., and Wu, L.: Western boundary currents regulated by interaction between ocean eddies and the atmosphere, Nature, 535, 533–537, https://doi.org/10.1038/nature18640, 2016.
McNichol, A. P., Jones, G. A., Hutton, D. L., Gagnon, A. R., and Key, R. M.: The rapid preparation of seawater ∑CO2 for radiocarbon analysis at the National Ocean Sciences AMS Facility, Radiocarbon, 36, 237–246, 1994.
Nelson, C. E. and Carlson, C. A.: Tracking differential incorporation of dissolved organic carbon types among diverse lineages of Sargasso Sea bacterioplankton, Environ. Microbiol., 14, 1500–1516, https://doi.org/10.1111/j.1462-2920.2012.02738.x, 2012.
Nishibe, Y., Takahashi, K., Shiozaki, T., Kakehi, S., Saito, H., and Furuya, K.: Size-fractionated primary production in the Kuroshio Extension and adjacent regions in spring, J Oceanogr., 71, 27–40, https://doi.org/10.1007/s10872-014-0258-0, 2015.
Nishibe, Y., Takahashi, K., Sato, M., Kodama, T., Kakehi, S., Saito, H., and Furuya, K.: Phytoplankton community structure, as derived from pigment signatures, in the Kuroshio Extension and adjacent regions in winter and spring, J. Oceanogr., 73, 463–478, https://doi.org/10.1007/s10872-017-0415-3, 2017.
Nishikawa, H., Yasuda, I., and Itoh, S.: Impact of winter-to-spring environmental variability along the Kuroshio jet on the recruitment of Japanese sardine (Sardinops melanostictus), Fish. Oceanogr., 20, 570–582, https://doi.org/10.1111/j.1365-2419.2011.00603.x, 2011.
Ogawa, H. and Tanoue, E.: Dissolved Organic Matter in oceanic waters, J. Oceanogr., 59, 129–147, https://doi.org/10.1023/a:1025528919771, 2003.
Ogawa, H., Fukuda, R., and Koike, I.: Vertical distributions of dissolved organic carbon and nitrogen in the Southern Ocean, Deep-Sea Res. Pt. I, 46, 1809–1826, https://doi.org/10.1016/S0967-0637(99)00027-8, 1999.
Ogawa, H., Usui, T., and Koike, I.: Distribution of dissolved organic carbon in the East China Sea, Deep-Sea Res. Pt. II, 50, 353–366, https://doi.org/10.1016/S0967-0645(02)00459-9, 2003.
Qiu, B.: Kuroshio and Oyashio currents, in: Encyclopedia of Ocean Science, edited by: Steele, J. H., Turekian, K. K., and Thorpe, S. A., 1413–1425, Academic Press, San Diego, 2001.
Qiu, B. and Chen, S.: Variability of the Kuroshio Extension Jet, recirculation gyre, and mesoscale eddies on decadal time scales, J. Phys. Oceanogr., 35, 2090–2103, https://doi.org/10.1175/jpo2807.1, 2005.
Qiu, B. and Chen, S.: Effect of decadal Kuroshio Extension Jet and eddy variability on the modification of North Pacific Intermediate Water, J. Phys. Oceanogr., 41, 503–515, https://doi.org/10.1175/2010JPO4575.1, 2011.
Riedel, T. and Dittmar, T.: A method detection limit for the analysis of natural organic matter via Fourier Transform Ion Cyclotron Resonance Mass Spectrometry, Anal. Chem., 86, 8376–8382, https://doi.org/10.1021/ac501946m, 2014.
Sharp, J. H., Benner, R., Bennett, L., Carlson, C. A., Fitzwater, S. E., Peltzer, E. T., and Tupas, L. M.: Analyses of dissolved organic carbon in seawater: the JGOFS EqPac methods comparison, Mar. Chem., 48, 91–108, https://doi.org/10.1016/0304-4203(94)00040-K, 1995.
Sharp, J. H., Carlson, C. A., Peltzer, E. T., Castle-Ward, D. M., Savidge, K. B., and Rinker, K. R.: Final dissolved organic carbon broad community intercalibration and preliminary use of DOC reference materials, Mar. Chem., 77, 239–253, https://doi.org/10.1016/S0304-4203(02)00002-6, 2002.
Stuiver, M. and Polach, H. A.: Discussion reporting of 14C data, Radiocarbon, 19, 355–363, https://doi.org/10.1017/S0033822200003672, 1977.
Talley, L. D.: North Pacific Intermediate Water transports in the mixed water region, J. Phys. Oceanogr., 27, 1795–1803, https://doi.org/10.1175/1520-0485(1997)027<1795:npiwti>2.0.co;2, 1997.
Tsunogai, S., Ono, T., and Watanabe, S.: Increase in total carbonate in the western North Pacific water and a hypothesis on the missing sink of anthropogenic carbon, J Oceanogr., 49, 305–315, https://doi.org/10.1007/bf02269568, 1993.
Wang, X., Ma, H., Li, R., Song, Z., and Wu, J.: Seasonal fluxes and source variation of organic carbon transported by two major Chinese Rivers: The Yellow River and Changjiang (Yangtze) River, Global Biogeochem. Cy., 26, GB2025, https://doi.org/10.1029/2011GB004130, 2012.
Ward, N. D., Bianchi, T. S., Medeiros, P. M., Seidel, M., Richey, J. E., Keil, R. G., and Sawakuchi, H. O.: Where carbon goes when water flows: Carbon cycling across the aquatic continuum, Front. Mar. Sci., 4, 7, https://doi.org/10.3389/fmars.2017.00007, 2017.
Wong, G. T. F., Tseng, C.-M., Wen, L.-S., and Chung, S.-W.: Nutrient dynamics and N-anomaly at the SEATS station, Deep-Sea Res. Part II, 54, 1528–1545, https://doi.org/10.1016/j.dsr2.2007.05.011, 2007.
Wu, L., Cai, W., Zhang, L., Nakamura, H., Timmermann, A., Joyce, T., McPhaden, M. J., Alexander, M., Qiu, B., Visbeck, M., Chang, P., and Giese, B.: Enhanced warming over the global subtropical western boundary currents, Nat. Clim. Change, 2, 161–166, https://doi.org/10.1038/nclimate1353, 2012.
Wu, K., Dai, M., Li, X., Meng, F., Chen, J., and Lin, J.: Dynamics and production of dissolved organic carbon in a large continental shelf system under the influence of both river plume and coastal upwelling, Limnol. Oceanogr., 62, 973–988, https://doi.org/10.1002/lno.10479, 2017.
Xu, C., Xue, Y., Qi, Y., and Wang, X.: Quantities and fluxes of dissolved and particulate black carbon in the Changjiang and Huanghe Rivers, China, Estuar. Coast., 39, 1617–1625, https://doi.org/10.1007/s12237-016-0122-0, 2016.
Xue, Y., Zou, L., Ge, T., and Wang, X.: Mobilization and export of millennial-aged organic carbon by the Yellow River, Limnol. Oceanogr., 62, 95–111, https://doi.org/10.1002/lno.10579, 2017.
Yang, D., Yin, B., Liu, Z., and Feng, X.: Numerical study of the ocean circulation on the East China Sea shelf and a Kuroshio bottom branch northeast of Taiwan in summer, J. Geophys. Res.-Oceans, 116, C05015, https://doi.org/10.1029/2010JC006777, 2011.
Yang, D., Yin, B., Liu, Z., Bai, T., Qi, J., and Chen, H.: Numerical study on the pattern and origins of Kuroshio branches in the bottom water of southern East China Sea in summer, J. Geophys. Res.-Oceans, 117, C02014, https://doi.org/10.1029/2011JC007528, 2012.
Yasuda, I.: Hydrographic structure and variability in the Kuroshio-Oyashio transition area, J. Oceanogr., 59, 389–402, https://doi.org/10.1023/a:1025580313836, 2003.
Yasuda, I., Okuda, K., and Shimizu, Y.: Distribution and modification of North Pacific Intermediate Water in the Kuroshio-Oyashio interfrontal zone, J. Phys. Oceanogr., 26, 448–465, https://doi.org/10.1175/1520-0485(1996)026<0448:damonp>2.0.co;2, 1996.
Yasunaka, S., Nojiri, Y., Nakaoka, S.-i., Ono, T., Mukai, H., and Usui, N.: Monthly maps of sea surface dissolved inorganic carbon in the North Pacific: Basin-wide distribution and seasonal variation, J. Geophys. Res.-Oceans, 118, 3843–3850, https://doi.org/10.1002/jgrc.20279, 2013.
Yasunaka, S., Nojiri, Y., Nakaoka, S.-I., Ono, T., Whitney, F. A., and Telszewski, M.: Mapping of sea surface nutrients in the North Pacific: Basin-wide distribution and seasonal to interannual variability, J. Geophys. Res.-Oceans, 119, 7756–7771, https://doi.org/10.1002/2014JC010318, 2014.