the Creative Commons Attribution 4.0 License.
the Creative Commons Attribution 4.0 License.
100 years of atmospheric and marine observations at the Finnish Utö Island in the Baltic Sea
Lauri Laakso
Santtu Mikkonen
Achim Drebs
Anu Karjalainen
Pentti Pirinen
Pekka Alenius
The Utö Atmospheric and Marine Research Station introduced in this paper is located on Utö Island (59∘46.84′ N, 21∘22.13′ E) at the outer edge of the Archipelago Sea, by the Baltic Sea towards the Baltic Proper. Meteorological observations at the island started in 1881 and vertical profiling of seawater temperature and salinity in 1900. Since 1980, the number of observations at Utö has rapidly increased, with a large number of new meteorological, air quality, aerosol, optical and greenhouse gas parameters, and recently, a variety of marine observations. In this study, we analyze long-term changes of atmospheric temperature, cloudiness, sea salinity, temperature and ice cover. Our main dataset consists of 248 367 atmospheric temperature observations, 1632 quality-assured vertical seawater temperature and salinity profiles and 8565 ice maps, partly digitized for this project. We also use North Atlantic Oscillation (NAO), major Baltic inflow (MBI) and Baltic Sea river runoff data from the literature as reference variables to our data. Our analysis is based on a statistical method utilizing a dynamic linear model. The results show an increase in the atmospheric temperature at Utö, but the increase is significantly smaller than on land areas and has taken place only since the early 1980s, with a rate of 0.4 ∘C decade−1 during the last 35 years. We also see an increase in seawater temperatures, especially on the surface, with an increase of 0.3 ∘C decade−1 for the last 100 years. In deeper water layers, the increase is smaller and influenced by vertical mixing, which is modulated by inflow of saline water from the North Sea and freshwater inflow from rivers and by wind-driven processes influenced by the local bathymetry. The date when air temperature in the spring exceeds +5 ∘C became 5 days earlier from the period 1951–1980 to the period 1981–2010 and the date when sea surface water temperature exceeds +4 ∘C changed to 9 days earlier. Sea ice cover duration at Utö shows a decrease of approximately 50 % during the last 35 years. Based on the combined results, it is possible that the climate at Utö has changed into a new phase, in which the sea ice no longer reduces the local temperature increase caused by the global warming.
- Article
(3038 KB) - Full-text XML
- BibTeX
- EndNote
Recently, average atmospheric concentration of carbon dioxide has exceeded 400 ppm (Kilkki et al., 2015) and the effects of climate change have become continuously more visible throughout the Earth (IPCC, 2013; Iles and Hegerl, 2017; Mikkonen et al., 2015). The Baltic Sea, with shallow waters and variable ice cover, rapidly responds to both annual and long-term changes (HELCOM, 2013; Lehmann et al., 2011). However, the responses are still slower than those observed over land areas, due to thermal inertia of the water body.
Previous studies from the Baltic Sea area show that during the 20th century, air temperatures have increased until 1930, decreased until the 1960s and started to increase again since the 1980s (HELCOM, 2013). Simultaneously, the sea surface temperatures have followed the atmospheric temperatures, with a clear increase due to a recent decrease in duration of ice cover. Seawater salinities in the Baltic Sea follow both changes in freshwater inflow and major Baltic inflows (MBIs). The MBIs increase stratification, leading to reduced vertical mixing.
In Finland, the longest observed data series containing sea temperatures and salinities together with meteorological variables are from the Island of Utö at the outer edge of the Archipelago Sea (Ahlnäs, 1961). Recently, Utö station was selected as one of the World Meteorological Organization (WMO) long-term observing stations in the recognition of its irreplaceable cultural and scientific heritage (World Meteorological Organization, 2017). However, despite observations having started already in 1881, a limited number of meteorological studies (Laapas and Venäläinen, 2017; Riihelä et al., 2015) and only few studies focusing on sea ice and hydrography (Ahlnäs, 1961; Haapala and Alenius, 1994; Haapala and Leppäranta, 1997; Jevrejeva et al., 2004) have been published. One reason for this is that a significant part of the observation data has not been digitized or quality assured until the current study. In our study, we use the meteorological, hydrographic and sea ice observations carried out in Utö, Baltic Sea, during the period 1881–2016.
The paper has three aims: (1) to bring the data series digitized for this project into the scientific domain and make them available for other scientists; (2) to describe the observations and typical atmospheric and marine conditions and ranges of variability at Utö Atmospheric and Marine Research Station; (3) to study the long-term changes of seawater properties, ice cover and meteorology at Utö.
The paper has the following structure. First, we describe the general environmental characteristics of the measurement place. Next, we continue by describing the observations and supporting datasets, data quality-assurance methods and the tools used for statistical analysis of the data. The paper continues with time series of air temperature, cloudiness and seawater temperatures, salinities and densities. The paper is closed with conclusions, some future plans and an appendix with a short description of the current observations and the local bathymetry.
The Baltic Sea is a shallow semi-enclosed seasonally ice-covered sea with average depth of 55 m and maximum depth of 459 m (Leppäranta and Myrberg, 2009). In spite of the shallow depth, the vertical stratification is strong in summer in shallow areas and throughout the year in areas that are deeper than the mean depth. The upper layer of the sea has a strong seasonal cycle, which is also reflected partly to the deeper water. Parts of the Baltic Sea are ice covered every winter, so that the extent of the annual maximum ice cover varies between 50 × 103 and 340 × 103 km2 (Seinä and Palosuo, 1996; Vainio, 2001) of the total area of 420 × 103 km2. The salinity varies from more than 20 ‰ in Kattegat down to less than 2 ‰ at the ends of the large bays in the northern part of the Gulf of Bothnia and Gulf of Finland (Feistel et al., 2010). In deep areas of the Baltic Proper, there is a permanent halocline somewhere between 60 and 80 m depth. Occasional saline water inflows (major Baltic inflows) from the North Sea (Matthäus et al., 2008) and continuous inflow of freshwater from the rivers (Ahlnäs, 1961; Hansson et al., 2011; Väli et al., 2013) keep the stratification strong.
Utö Island (59∘46.84′ N, 21∘22.13′ E), where the observations of this study are made, is located at the outer edge of the Archipelago Sea towards the Baltic Sea (Fig. 1). Utö is the southernmost permanently inhabited island in the Finnish archipelago. Its land area is approximately 0.8 km2 and the average permanent population between 20 and 30 people. Utö Island has had a lighthouse and a pilot station since the 18th century, with several generations of pilots living on the island. Due to its location and permanent population, local pilots (and during the 20th century, military officers) have carried out observations on a daily basis, with the exception of some short breaks during WWI.
The sea area 1 km west of Utö is relatively deep (104 m) and is connected to the open sea through a deep channel (see Fig. A1). Due to the regional bottom topography, depth structure and prevailing wind direction from southwest, currents at the Utö deep may be relatively strong in comparison to typical values in the Baltic Sea. This is visible in, e.g., seabed erosion (unpublished data). During the last decades, sea ice is observed at Utö every few years (Jevrejeva et al., 2004) while summertime cyanobacterial algae blooms are observed almost annually, in July or August (Kahru et al., 1994; Seppälä et al., 2007).
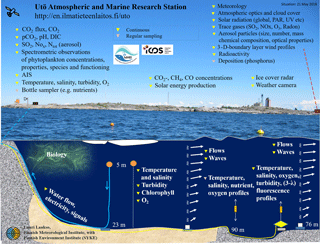
The Finnish Meteorological Institute started meteorological observations at Utö already in 1881 and a fixed oceanographic station has been in operation since 1900. Atmospheric trace gas and aerosol measurements were started on the island in 1980 in the framework of European Monitoring and Evaluation Programme (EMEP) (Laurila and Hakola, 1996; Ruoho-Airola et al., 2003). In 2012, the Finnish Meteorological Institute (FMI) and Finnish Environment Institute (SYKE) started the construction of a marine research station on the island, leading to a combined Utö Atmospheric and Marine Research Station (Finnish Meteorological Institute, 2017). The list of current observations and the site description are given in Appendix A (Table A1 and Fig. A2).
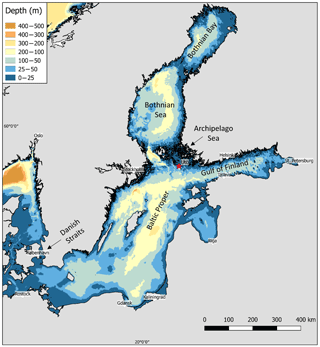
Figure 1Map of the Baltic Sea. The Utö measurement site is indicated with a red star. The local bathymetry around Utö Island is shown in Fig. A1 in Appendix A.
Observations at Utö are part of the HELCOM marine monitoring network, Integrated Carbon Observing System (ICOS), Finnish Marine Research Infrastructure (FINMARI) and Joint European Research Infrastructure network for Coastal Observatory – Novel European eXpertise for coastal observaTories (JERICO-NEXT) (Puillat et al., 2016). It is also planned to become a part of European Aerosols, Clouds, and Trace gases Research Infrastructure (ACTRIS).
3.1 Observations and other data
In this study, we focus on long-term changes at Utö during the period 1881–2016. As we do not have all data available for the whole period, and there are gaps in the data, the best coverage for combined data is for the period 1911–2016.
Meteorological observations including air temperature, wind speed and direction, cloudiness and sea surface temperature have been carried out with developing methods since 1881, initially three times a day and later on with increasing time resolution, currently with 10 min logging interval. As the methodology and exact observation locations have changed during this long period, and there are limited metadata from early measurements, especially the older data contain uncertainties. Meteorological data for the period 1881–1959 used in this study were manually digitized from annual written records; data since 1959 are taken from FMI electronic archives. These data were automatically checked from clear outliers and bad data, in addition to the original quality assurance done for all FMI operational meteorological observations. Our study focuses on air temperatures, but cloudiness and winds are also shortly discussed.
Vertical profiles of seawater salinity and temperature have been measured at the Utö deep (59∘46.96′ N, 21∘20.96′ E) at standard depths down to 100 m. The depth of the deepest measurement has varied but was always more than 80 m. The temperature observations started in 1900 and salinities have been measured since 1911. There were also some salinity records from the period 1900–1911, but due to poor data quality, they are excluded from our analysis.
The routine observations (until 2003) were done in fixed oceanographic stations in principle with 10-day intervals, on every month's 1st, 11th and 21st days. Because the observations from small boats are weather dependent, the exact observation days sometimes differ from the scheduled, and also the number of winter observations is smaller than that of the summer observations. Thus, the results for winter months include higher uncertainties than for the other seasons.
There was a gap in the marine observations in 2003–2012, because of lack of observers at that time period. Observations were started again in 2013, with an RBR XR-620 conductivity–temperature–depth (CTD) with a RINKO-III dissolved oxygen sensor, measuring temperature, salinity and pressure with 0.5 db (∼ 0.5 m) intervals. The profiles have been measured once every 10 days when weather and ice conditions have permitted. These new data are combined with the earlier fixed depth data in order to obtain as long time series as possible.
Oceanographic profiles were visually inspected, specifically for this study, using a code written in MATLAB. All suspicious profiles, like those with clearly wrong salinities and/or temperatures or impossible density profiles, were rejected. After the quality check, we had 1520 good-quality full vertical profiles of temperature and salinity from the period 1911–2002 and 112 more profiles from the period April 2013–July 2017.
Sea ice data were obtained from ice maps done during the ice season for the Gulf of Finland. The ice charts are based on ice observations done in a large number of locations, one of the observing sites being Utö. We used these generalized ice data instead of direct local ice observations from Utö, as there were few periods when we were not able to determine whether the sea ice observations at Utö were missing, or there was simply no ice. For the same reason, we also excluded from our analysis the ice thickness observations made at Utö during the period 1897–2015. The use of ice charts also provided us with better general understanding of the ice situation in the vicinity of Utö. The ice data used in this study are based on 8564 manually analyzed ice maps from the period 1914–2016.
NAO data were taken from Jones et al. (1997) with updates from Osborn (2004, 2006, 2011). MBI data were taken from Matthäus et al. (2008), with the latest updates from Mohrholz et al. (2015) and Nauman et al. (2018).
River runoff data for the period 1900–2016 are a combination of observations for the period 1900–1995 (Hansson et al., 2011) and modeling for the period 1996–2016 (Johansson, 2018). The offset between the two datasets was corrected by calculating averages for both datasets for the overlapping period (1950–1995) and correcting the modeled data with the difference.
3.2 Time series analysis methods
A trend is a change in the statistical properties of the background state of a system (Chandler and Scott, 2011). The simplest case is a linear trend, in which, when applicable, we need to specify only the trend coefficient and its uncertainty. Natural systems evolve continuously over time, and often it is not appropriate to approximate the background evolution with a constant trend. Furthermore, the time series can include multiple time-dependent cycles, and they are typically non-stationary; i.e., their distributional properties change over time.
In this work, we applied a dynamic linear model (DLM) approach to time series analysis of multiple meteorological variables measured at Utö Island. Dynamic linear models are regression models whose regression coefficients can depend on time. DLM is a state-space model capable of modeling univariate or multivariate time series also in the presence of non-stationarity, structural changes and irregular patterns. With a properly set up and estimated DLM model, we can detect significant changes in the background states and estimate the trends. The magnitude of the trend in an individual model is not prescribed by the modeling formulation. This dynamic approach is well known and documented in time series literature (Chatfield, 1989; Hamilton, 1994; Harvey, 1991; Migon et al., 2005). The method is the same one that was already applied in Mikkonen et al. (2015) for the Finnish mean temperature time series. DLM is used to statistically describe the underlying processes that generate variability in the observations. The method effectively decomposes the series into basic components, such as level, trend, seasonality and noise. The components can be allowed to change over time, and the magnitude of this change can be modeled and estimated. The part of the variability that is not explained by the chosen model is assumed to be uncorrelated noise and we can evaluate the validity of this assumption by statistical model residual diagnostics.
The model provides a method to detect and quantify trends, but it does not directly provide explanations for the observed changes, i.e., whether, for example, natural variability could explain the changes in the background levels. The model construction procedure and equational formulation follow closely the ones described in Mikkonen et al. (2015), and the results were calculated with software package DLM for R statistical language described in Petris et al. (2009) and Petris (2010). Confidence limits for the trend estimates were calculated with the maximum entropy bootstrap for time series method (Hrishikesh and López-de Lacalle, 2009). The variables of interest in this study were air temperature, cloudiness, seawater temperature in different depths, water salinity and density. Each variable was inspected in both manners: as total measurement series, where monthly variation is included in the model, and separately in different seasons of the year.
4.1 Long-term changes in atmospheric temperatures
Figure 2 represents the annual average atmospheric temperature at Utö during the period 1881–2016, together with the mean values for all of Finland. For illustrative purposes, we also included 5-year running mean (requiring at least 40 % data coverage) in this and subsequent figures; however, quantitative results are based on DLM analyses only. According to DLM analysis, annual average temperature at Utö has increased from 6.0 ∘C in 1881 to 7.5 ∘C in 2015. The total increase would have been 0.11 ∘C decade−1 if it were linear, which is lower than the average increase (0.14 ∘C decade−1) observed in Finland (Mikkonen et al., 2015).
While in Mikkonen et al. (2015) the temperature increase follows the pattern in global temperature time series (NASA, 2017), where the warming has taken place in two periods, before the 1940s and after the 1960s, in Utö the temperature increase has taken place only since 1980 without observable trends before that. This leads to an increase of 0.4 ∘C decade−1 during the last 35-year period, in line with results reported by Lehmann et al. (2011) and Almén et al. (2017), and the concluding remark of Mikkonen et al. (2015) stating that within the last 40 years the rate of temperature change in Finland has varied between 0.2 and 0.4 ∘C decade−1.
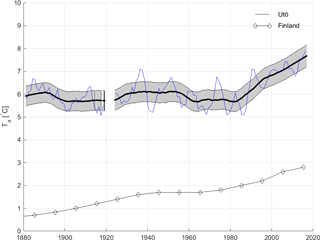
Figure 2Average annual air temperatures at Utö during 1881–2016. The solid line represents temperatures calculated with DLM, and the gray area shows the 95 % confidence range calculated using bootstrap method. The blue line over the DLM curve is a 5-year running mean of atmospheric temperature at Utö. The thin black line with diamonds shows the decadal average temperatures calculated for all of Finland (Mikkonen et al., 2015).
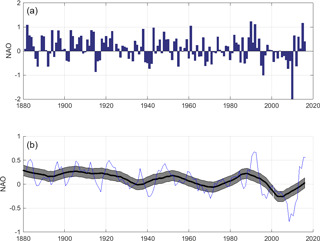
We also investigated the annual average temperatures against the NAO indices (Fig. 3) (Hänninen et al., 2000; Osborn, 2004, 2006, 2011) and found that on average, lower temperatures are connected to highest negative NAO values, and vice versa (visible also in the 5-year running mean shown in Figs. 2 and 3) (Lehmann et al., 2011). However, we were not able to explain the temperature trend or the longer (> 10-year) periods with higher and lower temperatures with the NAO cycle.
In addition to overall temperature trend, it is of interest to look the changes in different seasons (Fig. 4). Using simply 3 calendar months as seasons, we see similar trends in each season as in the annual temperature (Fig. 2). Looking at individual seasons, we notice that the long-term increase in annual temperatures (Fig. 2) results especially from the increase of temperatures during the winter and spring.
4.2 Cloudiness and wind
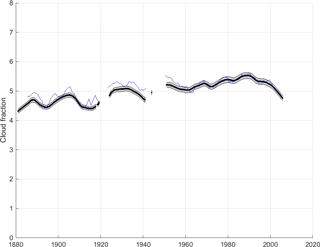
The quality assurance for atmospheric temperatures is relatively easy. For cloudiness and especially wind, the situation is more complicated. We analyzed the changes in cloudiness for the period 1881–2005 for which we had visual (manual) observations available. After October 2005, the cloud observations have been done with a ceilometer, and the results are not comparable with the previous data. Figure 5 shows the time series of cloudiness on a scale from 0 to 8. We see increase until 1990 and after that a decrease until the end of our visual (manual) observations, 2005. Automated observations (not shown) since 2005 show again an increasing trend in cloudiness. Further investigations focusing on reasons behind the changes in cloudiness are, however, out of the scope of this paper.
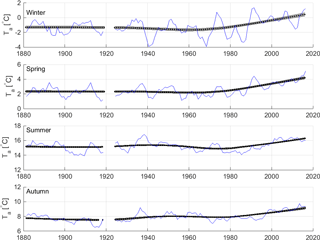
Figure 4Average seasonal air temperatures at Utö during 1881–2016. Winter: December, January, February; spring: March, April, May; summer: June, July, August; autumn: September, October, November. As in Fig. 2, the black line represents DLM-calculated trend, the gray area represents error for the trend, and the blue line represents the 5-year running average.
We also looked at wind time series (period 1959–2016) and found no significant changes in wind direction nor wind speed, in line with a recent study for the period 1979–2008 (Laapas and Venäläinen, 2017). However, because the wind observations are very sensitive to inhomogeneities in methods and location (Feser et al., 2015; Laapas and Venäläinen, 2017; Pryor et al., 2009; Wan et al., 2010), more analyses for observations done prior to 1959 are needed before further use of this part of the dataset.
4.3 Long-term changes in seawater temperatures, salinities and sea ice
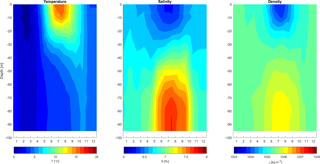
Figure 6 shows the monthly median seawater temperatures, salinities and densities in the Utö deep during the period 1911–2016. From the figure, we see the annual cycle of the water body: strong vertical stratification in the summer, with mixed layer depths around 20 m; vertical mixing throughout the whole water body in October; and the seasonal variation of salinity in all depths. Generally, at our site, average sea surface temperature varies between 18 ∘C during the summer and 0 ∘C during the winter while bottom temperature range is from 2 to 5 ∘C. Surface salinities vary between 6 and 7 ‰, water being less saline during the summer and more saline in winter. At the bottom, the situation is opposite, with up to 8 ‰ in summer and around 7 ‰ in winter. Density follows the cycle of salinity. The values for individual years and months may be significantly different from these medians due to MBIs bringing large amounts of saline water to the Baltic Sea, variation of annual temperatures, wind-driven water transport (Liblik and Lips, 2017), upwelling (Myrberg and Andrejev, 2003), river runoff and existence of sea ice cover. In contrast to the Baltic Proper, we do not see a permanent halocline between 60 and 80 m depth (Leppäranta and Myrberg, 2009) in the average figure shown here. We investigated the reasons for this behavior by (1) comparing vertical salinity profiles at Utö with those observed at point LL15 (59∘10.99′ N, 021∘44.80′ E; approximately 70 km south–southeast (SSE) of Utö, max depth 130 m) and a few CTD profiles taken next to the new cabled bottom profiler 2 km south of Utö (Fig. A1, location 6); (2) studying the publicly available bathymetric maps (see Fig. A1); and (3) investigating individual vertical salinity profiles.
Based on this analysis, we observed the following: (1) salinity profiles at Utö and LL15 correlate between the surface and approximately 60 m depth, but the salinities below 60 m are higher at point LL15; (2) the bathymetric map (see Fig. A1) shows two potential sills with depth of approximately 60 m in the channel between the observing site and open sea; (3) while the halocline between 60 and 80 m is not seen continuously, it is sometimes observed for shorter, few-month periods.
Based on these observations, we may conclude that the statement by Ahlnäs (1961), “The trench-like gully opens into the open sea in the south and the deep samples may be taken to reflect the characteristics of the corresponding water layers in the Northern Baltic” may not fully capture all dynamic aspects of the observing site.
Exact measurement depths and the number of different observation depths have varied during the last 100 years. We decided to focus on three different depths where we have the most data, while the depths have also physical meaning: 5 m represents the sea surface layer which is quite directly influenced by the atmosphere but is most probably not influenced by measurement errors, 50 m depth which is at the old winter water layer that is not directly influenced by the surface processes in summer and that is also the middle point between the surface and bottom, and 90 m which is the closest point to the bottom, with high data coverage. While the decision to investigate 5 and 90 m depths was clear, selection of 50 m was also supported by visual analysis of the temperature, salinity and density profiles: we inspected all profiles visually and found that during the summer months (June, July, August) thermocline was almost always above the 50 m depth.
Figure 7 represents the trends in water temperatures at these three depths. We see that the surface temperature follows the behavior of atmospheric temperatures (Fig. 2), with a rapid increase since the 1980s and a warmer period from the 1930s until the 1960s. The overall increase has been approximately 0.3 ∘C decade−1 during the last 100 years. For deeper layers, we observe partly different trends, with a faster increase in temperatures in the 1980s and a drop or hiatus during the last few years. As the main heating to the seawater comes from the surface of the sea, the higher increase of deep water temperatures during the 1980s and 1990s, and recent decrease have to be influenced by other phenomena than simply the increasing atmospheric temperatures.
Figure 8 shows the changes in salinity at different depths. We see that the salinity has varied significantly during the observing period but there is no general trend in the data. If we compare our salinity data (50 and 90 m depths) with those reported for 200 m depth in the Gotland Deep (BY15) by Fonselius and Valderrama (2003), we see that the periods of maximum and minimum salinities are correlated between the two sites.
In the salinity stratification, we see the following changes: the stratification was strongest in the 1950s and weakest in the 1980s and 1990s during the stagnation period when no major Baltic inflows occurred. The stratification increased again since 2013.
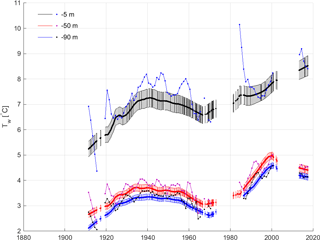
Figure 7Average seawater temperatures in Utö at depths of −5, −50 and −90 m. For better visualization, we have used a combination of lines in black and blue for −5 m, red and magenta for −50 m, and blue and black for −90 m, as shown in the legend.
The seawater temperatures and salinities combine in Fig. 9 as seawater density. As the salinity is a key factor (in layers where temperature variations are small) influencing seawater density, the density curves follow the changes in salinity. Figure 9 shows smaller vertical density gradients in the 1980s and 1990s than earlier and increase of density stratification during the last few years.
These changes, we assume, are responsible for the increased water temperatures at 50 and 90 m depths during the period 1980–2000 and the recent decrease since 2012, and are the explanation for why there is a difference between the behavior (slope) of surface water being directly in contact with the atmosphere and the deeper water layers during this period (1980–2000).
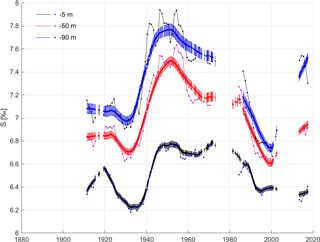
Figure 8Average seawater salinities in Utö at −5, −50 and −90 m depths. For details, see Fig. 7.
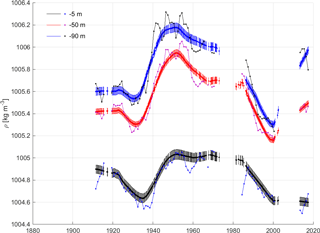
Figure 9Average seawater densities in Utö at −5, −50 and −90 m depths. For details, see Fig. 7.
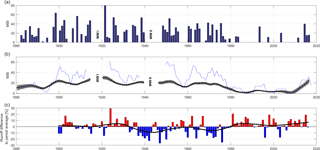
Figure 10MBIs during 1880–2016 (a, b). There are no data available for the World War periods of 1915–1920 (WWI) and 1940–1946 (WWII). Panel (c) shows the total river runoff to the Baltic Sea during the period 1900–2016. The unit is percent relative to the period average. Please see the text for details on data sources.
The observations at Utö are insufficient to explain directly the reasons for changes in the salinity stratification. However, the frequency and strength of major Baltic inflows (Feistel et al., 2008, update based on Nauman et al., 2018), shown in Fig. 10, clearly explain that the changes are related to major Baltic inflows since the 1980s. There have not been similar recent changes in the river runoff (Fig. 10c) able to explain the observed salinity increase.
We also see a rapid increase in salinities in the 1940s. While there are no MBI data due to WWII (Matthäus et al., 2008), the study by Ahlnäs (1961) supports strong MBIs during that period, combined with reduced river discharge (Hansson et al., 2011).
Utö is at the border between the open Baltic Proper and the Archipelago Sea. The sea ice cover (Fig. 11) has thus varied greatly from year to year. We see that the average duration of sea ice cover has decreased by 50 % since 1980, in line with the increased average temperature (Fig. 2) and previous studies (Jevrejeva et al., 2004; Merkouriadi and Leppäranta, 2014). This decrease in ice cover may have enhanced the recent rapid increase in air temperatures at Utö since the open sea is a large source of latent heat, which leads to higher atmospheric temperatures than when the sea is ice covered. Ice cover also increases albedo, which may have influenced the surface temperatures during the spring.
Table 1Average values with standard deviations for the 30-year periods of 1891–1920, 1921–1950, 1951–1980 and 1981–2010. As there have been gaps in observations, the uncertainties between variables and periods vary. Due to the limited amount of hydrographic and sea ice data during the first period (1891–1920), only values for air temperature and cloud fraction are shown.
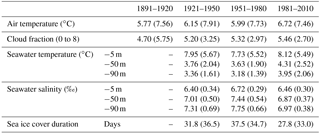
Finally, we calculated average monthly air and sea surface temperatures at Utö for four different 30-year reference periods, 1891–1920, 1921–1950, 1951–1980 and 1981–2010 (Fig. 12). The averages show the recent warming of winters and springs with a small increase in springtime seawater temperature. In time, the date when average air temperature exceeds 5 ∘C has changed to 5.4 days earlier from the previous periods to 1981–2010. The date when seawater temperature at 5 m depth exceeds 4 ∘C has changed even to 8.8 days earlier from the period 1951–1980 (and 1921–1950) to 1981–2010.
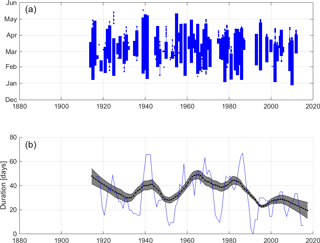
Figure 11Wintertime sea ice cover at Utö. Panel (a) shows the yearly duration of the ice cover and panel (b) shows the DLM trend and 5-year moving averages of the length of the ice season.
Average air temperatures, cloud fractions, seawater temperatures and salinities and durations of sea ice cover, together with standard deviations for the different 30-year periods are given in Table 1. The air temperature averages for all periods are calculated based on three observations per day, which was the initial observing frequency. Based on later high time resolution data, we estimated that the average air temperature values given in Table 1 are approximately 0.17 ∘C larger than the true average values using high time resolution data, and correspondingly, the cloud fraction values are 0.14 larger than the true averages.
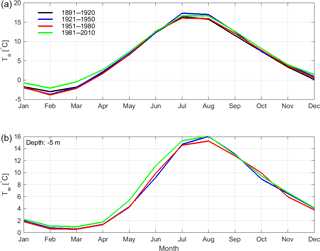
Figure 12Monthly average air temperatures (a) and sea surface water temperatures (b) at Utö during the four 30-year reference periods.
The data show clearly the high natural variability of environmental variables. However, these averages calculated stepwise for fixed 30-year climate periods also hide the rapid change which has taken place especially in temperatures since 1980, which is clearly visible in figures showing the trends.
In this study, we used an approximately 100-year long time series of atmospheric and marine observations carried out at Utö. The focus was on long-term changes and potential impacts of warming climate to the Baltic Sea hydrography. In an earlier study by Mikkonen et al. (2015), a clear increase of atmospheric temperatures was observed throughout continental Finland. In the sea areas, however, changes are dampened by the large heat capacity of the sea. In winter, the sea ice influences albedo, along with sensible and latent heat fluxes between the sea and the atmosphere.
In our study, we saw an increase in the atmospheric and sea (surface) water temperatures only since the 1980s, which is different from the Finnish average air temperature increase observed throughout the 20th century. As the increase observed at Utö is mostly due to the warmer spring and winter months, we assume that the impact of warming climate is visible especially after the reduction of wintertime sea ice cover.
We also found that there was a clear reduction in the vertical stability of the water column during the so-called stagnation period (1980–2010), when there were less major Baltic inflows than before. This enhanced mixing, together with increased air temperature may have been responsible for the increased deep water temperatures during this period. The latest observations since 2013 show again an increase in vertical stratification due to recent MBIs, which have increased the bottom salinities and decreased the temperatures, we assume, due to reduced vertical mixing.
Our results are in line with previous studies on climate and hydrographic changes on the northern Baltic Sea region. In the future, our aim is to continue the analyses of this dataset with other methods, and studies focusing more on individual changes and processes.
The data and analysis represented in this study also form a solid base for detailed process and biogeochemical studies which are an integral part of the JERICO-NEXT concept of integrated coastal observatories (Puillat et al., 2016). An interesting study utilizing the time series presented in this paper together with the new observations will be to use the new cabled bottom profiler together with an acoustic Doppler current profiler (ADCP) (Figs. A1 and A2) to study the occasional inflows of saline bottom water which may have significant impacts on the Archipelago Sea ecosystem (Vuorinen et al., 2015). Another planned study combining hydrographic observations with biogeochemistry and climate change is to use the profiler together with the flow-through system to analyze the thickness of biologically active layer and its connection to the marine carbon cycle.
Together with our new observations, the long data series represented in this paper will support better understanding of both the earlier observations and current, ongoing physical, chemical and biological changes in the Baltic Sea.
Meteorological data digitized and used in this article are available through the Finnish Meteorological Institute open data portal (https://en.ilmatieteenlaitos.fi/open-data, last access: 9 July 2018). Hydrographic data used in this study are available through SeaDataNet (https://www.seadatanet.org/, last access: 9 July 2018). Please cite this article when using the data.
Table A1Continuous atmospheric and marine observation at Utö. Site refers to numbers and coordinates in Fig. A1.
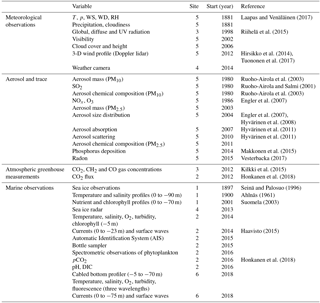
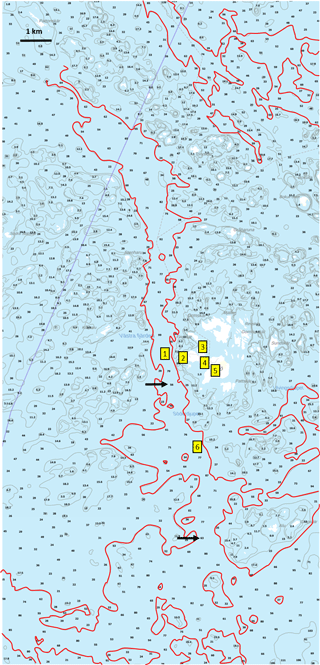
Figure A1Bathymetry close to Utö Island. 1: hydrographic observations (59∘46.96′ N, 21∘20.96′ E until 2002; currently 59∘46.97′ N, 21∘20.78′ E); 2: marine research station (59∘46.90′ N, 21∘21.45′ E); 3: greenhouse gases (GHGs) and solar radiation (59∘47.12′ N, 21∘22.04′ E); 4: radar (59∘46.84′ N, 21∘22.13′ E); 5: meteorological and air quality station (59∘46.76′ N, 21∘22.51′ E); 6: cabled bottom profiler and ADCP (59∘45.41′ N, 21∘22.13′ E); red line: 50 m contour; black arrows: possible sills (60 m depth). Map source: National Land Survey of Finland (2018).
LL was behind the idea of the paper, did most of the writing, drew all the figures except the map (Fig. 1) and did most of the data QC and analyses. SM did all statistical analyses, wrote Sect. 3.2 and participated in writing throughout the paper. PA provided the hydrographic data, supported in the QC process and contributed significantly to the introduction and interpretation of the results. AD and PP were responsible for the meteorological data used in the paper and their quality assurance. AK analyzed and digitized the ice map data used in the paper. All authors commented and improved the paper during the writing process.
The authors declare that they have no conflict of interest.
This article is part of the special issue “Coastal marine infrastructure in support of monitoring, science, and policy strategies”. It is not associated with a conference.
First of all, the authors want to thank the five generations of observers,
pilots and soldiers of keeping the observations running. Especially, we thank
our recent observers Ismo and Brita Willström who have done and
maintained the measurements used in this study. It is a privilege to work
with this unique dataset obtained by their invaluable efforts. This project
was partially funded by H2020-project JERICO-NEXT (grant agreement no. 654410)
and BONUS Baltic Blue project Bonus-Integral (funded jointly by the EU, the
German Federal Ministry of Education and Research, the Swedish Research
Council Formas, the Academy of Finland, the Polish National Centre for
Research and Development, and the Estonian Research Council). Santtu Mikkonen
acknowledges funding from the Nessling Foundation and Finnish Academy (project
no. 307331). Sakari Äärilä is acknowledged for drawing the map
used in Fig. 1. The authors also want to thank the referees for their
comments which improved the manuscript.
Edited by: Oliver Zielinski
Reviewed by: Ilppo Vuorinen and one anonymous referee
Ahlnäs, K.: Variations in Salinity at Utö 1911–1961, Geophysica, 8, 135–149, 1961. a, b, c, d, e, f
Almén, A.-K., Glippa, O., Pettersson, H., Alenius, P., and Engström-Öst, J.: Changes in wintertime pH and hydrography of the Gulf of Finland (Baltic Sea) with focus on depth layers, Environ. Monit. Assess., 189, 147, https://doi.org/10.1007/s10661-017-5840-7, 2017. a
Chandler, R. and Scott, E.: Statistical methods for trend detection and analysis in the environmental sciences, John Wiley & Sons, New York, USA, 2011. a
Chatfield, C.: The analysis of time series. An introduction, Chapman & Hall, London, UK, 1989. a
Engler, C., Lihavainen, H., Komppula, M., Kerminen, V.-M., Kulmala, M., and Viisanen, Y.: Continuous measurements of aerosol properties at the Baltic Sea, Tellus, 59B, 728–741, 2007. a, b
Feistel, R., Nausch, G., and Wasmund, N. (Eds.): State and evolution of the Baltic Sea, 1952–2005: a detailed 50-year survey of meteorology and climate, physics, chemistry, biology, and marine environment, John Wiley & Sons, Hoboken, USA, 703 pp. + Digital supplement 1 cd-rom, 2008. a
Feistel, R., Weinreben, S., Wolf, H., Seitz, S., Spitzer, P., Adel, B., Nausch, G., Schneider, B., and Wright, D. G.: Density and Absolute Salinity of the Baltic Sea 2006–2009, Ocean Sci., 6, 3–24, https://doi.org/10.5194/os-6-3-2010, 2010. a
Feser, F., Barcikowska, M., Krueger, O., Schenk, F., Weisse, R., and Xia, L.: Storminess over the North Atlantic and northwestern Europe – a review, Q. J. Roy. Meteor. Soc., 141, 350–382, https://doi.org/10.1002/qj.2364, 2015. a
Finnish Meteorological Institute: Utö Atmospheric and Marine Research Station, available at: http://en.ilmatieteenlaitos.fi/uto (last access: 1 July 2018), 2017. a
Fonselius, S. and Valderrama, J.: One hundred years of hydrographic measurements in the Baltic Sea, J. Sea Res., 49, 229–241, https://doi.org/10.1016/S1385-1101(03)00035-2, 2003. a
Haapala, J. and Alenius, P.: Temperature and salinity statistics for the Northern Baltic Sea 1961–90, Marine Research, 262, 51–121, 1994. a
Haapala, J. and Leppäranta, M.: The Baltic Sea ice season in changing climate, Boreal Environ. Res., 2, 93–108, 1997. a
Haavisto, N.: ADCP:n käyttö aaltomittarina Itämerellä, BSc Thesis, Department of Physics, University of Helsinki, Helsinki, Finland, 2015. a
Hamilton, J.: Time series analysis, Princeton University Press, Princeton, USA, 1994. a
Hänninen, J., Vuorinen, I., and Hjelt, P.: Climatic factors in the Atlantic control the oceanographic and ecological changes in the Baltic Sea, Limnol. Oceanogr., 45, 703–710, https://doi.org/10.4319/lo.2000.45.3.0703, 2000. a
Hansson, D., Eriksson, C., Omstedt, A., and Chen, D.: Reconstruction of river runoff to the Baltic Sea, AD 1500–1995, Int. J. Climatol., 31, 696–703, https://doi.org/10.1002/joc.2097, 2011. a, b, c
Harvey, A.: Forecasting, structural time series models and the Kalman filter, Cambridge University Press, Cambridge, UK, 1991. a
HELCOM: Climate change in the Baltic Sea Area, HELCOM thematic assessment in 2013, Baltic Sea Environ. Proc., no. 137, available at: http://www.helcom.fi/Lists/Publications/BSEP137.pdf (last access: 9 July 2018), 2013. a, b
Hirsikko, A., O'Connor, E. J., Komppula, M., Korhonen, K., Pfüller, A., Giannakaki, E., Wood, C. R., Bauer-Pfundstein, M., Poikonen, A., Karppinen, T., Lonka, H., Kurri, M., Heinonen, J., Moisseev, D., Asmi, E., Aaltonen, V., Nordbo, A., Rodriguez, E., Lihavainen, H., Laaksonen, A., Lehtinen, K. E. J., Laurila, T., Petäjä, T., Kulmala, M., and Viisanen, Y.: Observing wind, aerosol particles, cloud and precipitation: Finland's new ground-based remote-sensing network, Atmos. Meas. Tech., 7, 1351–1375, https://doi.org/10.5194/amt-7-1351-2014, 2014. a
Honkanen, M., Tuovinen, J.-P., Laurila, T., Mäkelä, T., Hatakka, J., Kielosto, S., and Laakso, L.: Measuring turbulent CO2 fluxes with a closed-path gas analyzer in marine environment, Atmos. Meas. Tech. Discuss., https://doi.org/10.5194/amt-2018-61, in review, 2018. a, b
Hrishikesh, D. V. and López-de Lacalle, J.: Maximum Entropy Bootstrap for Time Series: The Meboot R Package, J. Stat. Softw., 29, 1–19, https://doi.org/10.18637/jss.v029.i05, 2009. a
Hyvärinen, A.-P., Komppula, M., Engler, C., Kivekas, N., Kerminen, V.-M., Dal Maso, M., Viisanen, Y., and Lihavainen, H.: Atmospheric new particle formation at Utö, Baltic Sea 2003–2005, Tellus B, 60, 45–352, https://doi.org/10.1111/j.1600-0889.2008.00343.x, 2008. a
Hyvärinen, A.-P., Kolmonen, P., Kerminen, V.-M., Virkkula, A., Leskinen, A., Komppula, M., Hatakka, J., Burkhart, J., Stohl, A., Aalto, P., Kulmala, M., Lehtinen, K., Viisanen, Y., and Lihavainen, H.: Aerosol black carbon at five background measurement sites over Finland, a gateway to the Arctic, Atmos. Environ., 45, 4042–4050, https://doi.org/10.1016/j.atmosenv.2011.04.026, 2011. a, b
Iles, C. and Hegerl, G.: Role of the North Atlantic Oscillation in decadal temperature trends, Environ. Res. Lett., 12, 114010, https://doi.org/10.1088/1748-9326/aa9152, 2017. a
IPCC: Summary for Policymakers, book section SPM, Cambridge University Press, Cambridge, UK and New York, NY, USA, 1–30, https://doi.org/10.1017/CBO9781107415324.004, 2013. a
Jevrejeva, S., Drabkin, V. V., Kostjukov, J., Lebedev, A. A., Leppäranta, M., Mironov, Y., Schmelzer, N., and Sztobryn, M.: Baltic Sea ice seasons in the twentieth century, Clim. Res., 25, 217–227, https://doi.org/10.3354/cr025217, 2004. a, b, c
Johansson, J.: HELCOM Baltic Sea Environment Fact Sheets: Total and regional runoff to the Baltic Sea, available at: http://www.helcom.fi/baltic-sea-trends/environment-fact-sheets/, last access: 9 July 2018. a
Jones, P., Jonsson, T., and Wheeler, D.: Extension to the North Atlantic Oscillation using early instrumental pressure observations from Gibraltar and South-West Iceland, Int. J. Climatol., 17, 1433–1450, https://doi.org/10.1002/(SICI)1097-0088(19971115)17:13<1433::AID-JOC203>3.0.CO;2-P, 1997. a
Kahru, M., Horstmann, U., and Rud, O.: Satellite detection of increased cyanobacteria blooms in the Baltic Sea: natural fluctuations or ecosystem change?, Ambio, 23, 469–472, 1994. a
Kilkki, J., Aalto, T., Hatakka, J., Portin, H., and Laurila, T.: Atmospheric CO2 observations at Finnish urban and rural sites, Boreal Environ. Res., 20, 227–242, available at: http://hdl.handle.net/10138/228120 (last access: 9 July 2018), 2015. a, b
Laapas, M. and Venäläinen, A.: Homogenization and trend analysis of monthly mean and maximum wind speed time series in Finland, 1959–2015, Int. J. Climatol., 37, 4803–4813, https://doi.org/10.1002/joc.5124, 2017. a, b, c, d
Laurila, T. and Hakola, H.: Seasonal Cycle of C2–C5 hydrocarbons over the Baltic Sea and Northern Finland, Atmos. Environ., 30, 1597–1607, https://doi.org/10.1016/1352-2310(95)00482-3, 1996. a
Lehmann, A., Getzlaff, K., and Harlass, J.: Detailed assessment of climate variability of the Baltic Sea area for the period 1958–2009, Clim. Res., 46, 185–196, https://doi.org/10.3354/cr00876, 2011. a, b, c
Leppäranta, M. and Myrberg, K.: Physical oceanography of the Baltic Sea, Springer-Verlag, Berlin, Germany, 2009. a, b
Liblik, T. and Lips, U.: Variability of pycnoclines in a three-layer, large estuary: the Gulf of Finland, Boreal Environ. Res, 22, 27–47, available at: http://www.borenv.net/BER/pdfs/ber22/ber22-027-047-Liblik.pdf (last access: 9 July 2018), 2017. a
Makkonen, U., Saarnio, K., Ruoho-Airola, T., and Hakola, H.: Methods for determination of phosphate and total phosphorus in precipitation and particulate matter, no. 2 in Report Series, Finnish meteorological Institute, Helsinki, Finland, 2015. a
Matthäus, W., Nehring, D., Feistel, R., Nausch, G., Mohrholz, V., and Lass, H.: The inflow of highly saline water into the Baltic Sea, in: State and Evolution of the Baltic Sea, 1952–2005, John Wiley & Sons, Inc., 265–309, https://doi.org/10.1002/9780470283134.ch10, 2008. a, b, c
Merkouriadi, I. and Leppäranta, M.: Long-term analysis of hydrography and sea-ice data in Tvärminne, Gulf of Finland, Baltic Sea, Climatic Change, 124, 849–859, https://doi.org/10.1007/s10584-014-1130-3, 2014. a
Migon, H., Gamerman, D., Lopes, H., and Ferreira, M.: Dynamic Models, in: Handbook of statistics, Bayesian thinking: modeling and computation, Elsevier, https://doi.org/10.1016/S0169-7161(05)25019-8, 2005. a
Mikkonen, S., Laine, M., Mäkelä, H., Gregow, H., Tuomenvirta, H., Lahtinen, M., and Laaksonen, A.: Trends in the average temperature in Finland, 1847–2013, Stoch. Env. Res. Risk A., 29, 1521–1529, https://doi.org/10.1007/s00477-014-0992-2, 2015. a, b, c, d, e, f, g, h
Mohrholz, V., Naumann, M., Nausch, G., Krüger, S., and Gräwe, U.: Fresh oxygen for the Baltic Sea – An exceptional saline inflow after a decade of stagnation, J. Marine Syst., 148, 152–166, https://doi.org/10.1016/j.jmarsys.2015.03.005, 2015. a
Myrberg, K. and Andrejev, O.: Main upwelling regions in the Baltic Sea – A statistical analysis based on three-dimensional modelling, Boreal Env. Res., 8, 97–112, available at: http://www.borenv.net/BER/pdfs/ber8/ber8-097.pdf (last access: 9 July 2018), 2003. a
NASA: Global Temperature, available at: https://climate.nasa.gov/vital-signs/global-temperature/ (last access: 9 July 2018), 2017. a
National Land Survey of Finland: On-line, open-access Geodata portal Paikkatietoikkuna, available at: https://kartta.paikkatietoikkuna.fi/?lang=en, last access: 9 July 2018. a
Nauman, M., Nausch, G., and Mohrholz, V.: Water Exchange between the Baltic Sea and the North Sea, and conditions in the Deep Basins, HELCOM Baltic Sea Environment Fact Sheets, available at: http://www.helcom.fi/baltic-sea-trends/environment-fact-sheets/hydrography/water-exchange-between-the-baltic-sea-and-the-north-sea-and-conditions-in-the-deep-basins, last access: 9 July 2018. a, b
Osborn, T.: Simulating the winter North Atlantic Oscillation: the roles of internal variability and greenhouse gas forcing, Clim. Dynam., 22, 605–623, https://doi.org/10.1007/s00382-004-0405-1, 2004. a, b
Osborn, T.: Recent variations in the winter North Atlantic Oscillation, Weather, 61, 353–355, https://doi.org/10.1256/wea.190.06, 2006. a, b
Osborn, T.: Winter 2009/2010 temperatures and a record-breaking North Atlantic Oscillation index, Weather, 66, 19–21, https://doi.org/10.1002/wea.660, 2011. a, b
Petris, G.: An R Package for Dynamic Linear Models, J. Stat. Softw., 36, 1–16, https://doi.org/10.18637/jss.v036.i12, 2010. a
Petris, G., Petrone, S., and Campagnoli, P.: Dynamic Linear Models with R, useR!, Springer-Verlag, New York, USA, 2009. a
Pryor, S. C., Barthelmie, R. J., Young, D. T., Takle, E. S., Arritt, R. W., Flory, D., Gutowski Jr., W. J., Nunes, A., and Roads, J.: Wind speed trends over the contiguous United States, J. Geophys. Res.-Atmos., 114, D14105, https://doi.org/10.1029/2008JD011416, 2009. a
Puillat, I., Farcy, P., Durand, D., Karlson, B., Petihakis, G., Seppälä, J., and Sparnocchia, S.: Progress in marine science supported by European joint coastal observation systems: The JERICO-RI research infrastructure, J. Marine Syst., 162, 1–3, https://doi.org/10.1016/j.jmarsys.2016.06.004, 2016. a, b
Riihelä, A., Carlund, T., Trentmann, J., Müller, R., and Lindfors, A. V.: Validation of CM SAF Surface Solar Radiation Datasets over Finland and Sweden, Remote Sensing, 7, 6663–6682, https://doi.org/10.3390/rs70606663, 2015. a, b
Ruoho-Airola, T. and Salmi, T.: Episodicity of sulphate deposition in Finland, Water Air Soil Poll., 130, 529–534, 2001. a
Ruoho-Airola, T., Anttila, P., Tuovinen, J.-P., and Salmi, T.: Assessment Report on the Finnish EMEP data 1980–2000, no. 3, Finnish Meteorological Institute, Helsinki, Finland, 2003. a, b, c
Seinä, A. and Palosuo, E.: The classification of the maximum annual extent of ice cover in the Baltic Sea 1720–1995, Meri, 227, 79–91, 1996. a, b
Seppälä, J., Ylöstalo, P., Kaitala, S., Hällfors, S., Raateoja, M., and Maunula, P.: Ship-of-opportunity based phycocyanin fluorescence monitoring of the filamentous cyanobacteria bloom dynamics in the Baltic Sea., Estuar. Coast. Shelf Sci., 73, 489–500, https://doi.org/10.1016/j.ecss.2007.02.015, 2007. a
Suomela, J.: Saaristomeren veden laatu vuonna 2001, no. 3 in Lounais-Suomen ympäristökeskuksen monistesarja, Lounais-Suomen ympäristökeskus, Turku, Finland, 2003. a
Tuononen, M., O'Connor, E., Sinclair, V. A., and Vakkari, V.: Low-Level Jets over Utö, Finland, Based on Doppler Lidar Observations, J. Appl. Meteorol. Clim., 56, 2577–2594, https://doi.org/10.1175/JAMC-D-16-0411.1, 2017. a
Vainio, J.: Maximum extent of ice cover in the Baltic Sea in the winters 1719/20–2012/3 and 15 year moving average, in: Report Series of the Finnish Institute of Marine Research, Helsinki, Finland, vol. 27, 79–91, 2001. a
Väli, G., Meier, H., and Elken, J.: Simulated halocline variability in the Baltic Sea and its impact on hypoxia during 1961–2007, J. Geophys. Res.-Oceans, 118, 6982–7000, https://doi.org/10.1002/2013JC009192, 2013. a
Vesterbacka, P.: Surveillance of environmental radiation in Finland, in: Annual Report, vol. STUK-B-215, 1–89, available at: http://www.julkari.fi/handle/10024/134866 (last access: 9 July 2018), 2017. a
Vuorinen, I., Hänninen, J., Rajasilta, M., Laine, P., Eklund, J., Montesino-Pouzols, F., Corona, F., Junker, K., Meier, H. E. M, and Dippner, J.: Scenario simulations of future salinity and ecological consequences in the Baltic Sea and adjacent North Sea areas–implications for environmental monitoring, Ecol. Indic., 50, 196–205, https://doi.org/10.1016/j.ecolind.2014.10.019, 2015. a
Wan, H., Wang, X., and Swail, V.: Homogenization and trend analysis of Canadian near-surface wind speeds, J. Climate, 23, 1209–1225, https://doi.org/10.1175/2009JCLI3200.1, 2010. a
World Meteorological Organization: Long-term observing stations, available at: https://public.wmo.int/en/our-mandate/what-we-do/observations/long-term-observing-stations (last access: 9 July 2018), 2017. a


