the Creative Commons Attribution 4.0 License.
the Creative Commons Attribution 4.0 License.
 | 11 Jun 2018
Numerical study of hydrodynamic and salinity transport processes in the Pink Beach wetlands of the Liao River estuary, China
Huiting Qiao
Hengzhi Jiang
Tianping Xu
Hongxing Zhang
Interaction studies of vegetation within flow environments are essential for the determination of bank protection, morphological characteristics and ecological conditions for wetlands. This paper uses the MIKE 21 hydrodynamic and salinity model to simulate the hydrodynamic characteristics and salinity transport processes in the Pink Beach wetlands of the Liao River estuary. The effect of wetland plants on tidal flow in wetland areas is represented by a varying Manning coefficient in the bottom friction term. Acquisition of the vegetation distribution is based on Landsat TM satellites by remote sensing techniques. Detailed comparisons between field observation and simulated results of water depth, salinity and tidal currents are presented in the vegetated domain of the Pink Beach wetlands. Satisfactory results were obtained from simulations of both flow characteristics and salinity concentration, with or without vegetation. A numerical experiment was conducted based on variations in vegetation density, and compared with the tidal currents in non-vegetated areas; the computed current speed decreased remarkably with an increase in vegetation density. The impact of vegetation on water depth and salinity was simulated, and the findings revealed that wetland vegetation has an insignificant effect on the water depth and salinity in this wetland domain. Several stations (from upstream to downstream) in the Pink Beach wetlands were selected to estimate the longitudinal variation of salinity under different river runoff conditions; the results showed that salinity concentration decreases with an increase in river runoff. This study can consequently help increase the understanding of favourable salinity conditions for particular vegetation growth in the Pink Beach wetlands of the Liao River estuary. The results also provide crucial guidance for related interaction studies of vegetation, flow and salinity in other wetland systems.
- Article
(7392 KB) - Full-text XML
-
Supplement
(2720 KB) - BibTeX
- EndNote


Wetlands are transitional zones between terrestrial ecosystems and aquatic ecosystems, and have a variety of unique functions, which include the following: providing large amounts of food, raw materials and water resources for humans, and maintaining the ecological balance, biodiversity and resources for rare species. The role of aquatic plants regarding coastal protection from extreme events has consequently become a recurring question, along with the viability assessment of ecosystem-based management approaches (Barbier et al., 2008; Temmerman et al., 2013). Coastal wetlands are mainly distributed in coastal regions in China within eleven specific areas: Hebei, Liaoning, Shandong, Jiangsu, Zhejiang, Fujian, Guangdong, Hainan, Taiwan, Tianjin and Guangxi. Coastal wetland ecosystems cover 5.7959 × 10⁶ ha and account for 10.85 % of the total wetland area in China. Twelve types of coastal wetland plants are known to inhabit these ecosystems (Jiang et al., 2015).
Liao River estuary wetland is located in Panjin City, Liaoning Province, China, and covers an area of about 451300.5 ha (Zhang et al., 2009). The main vegetation in the wetland includes Phragmites communis and Suaeda heteroptera, both of which are found in the inter-tidal zone. Suaeda heteroptera is a typical saline–alkaline indicator plant which is primarily distributed on coastal tidal flats, forming a rare natural “pink beach” landscape (Fig. 1). The main factor limiting the growth of Suaeda heteroptera is water salinity, with the most suitable salinity for its growth being about 15 psu (practical salinity units); at salinity levels higher or lower than 15 psu Suaeda heteroptera is degraded or inhibited. Salinity and water content are also the main limiting factors for the growth of Phragmites communis, especially salinity, as high soil salinity can inhibit the growth of this species. Therefore, when river runoff is high, Phragmites communis will invade the growth area of Suaeda heteroptera, resulting in community succession.
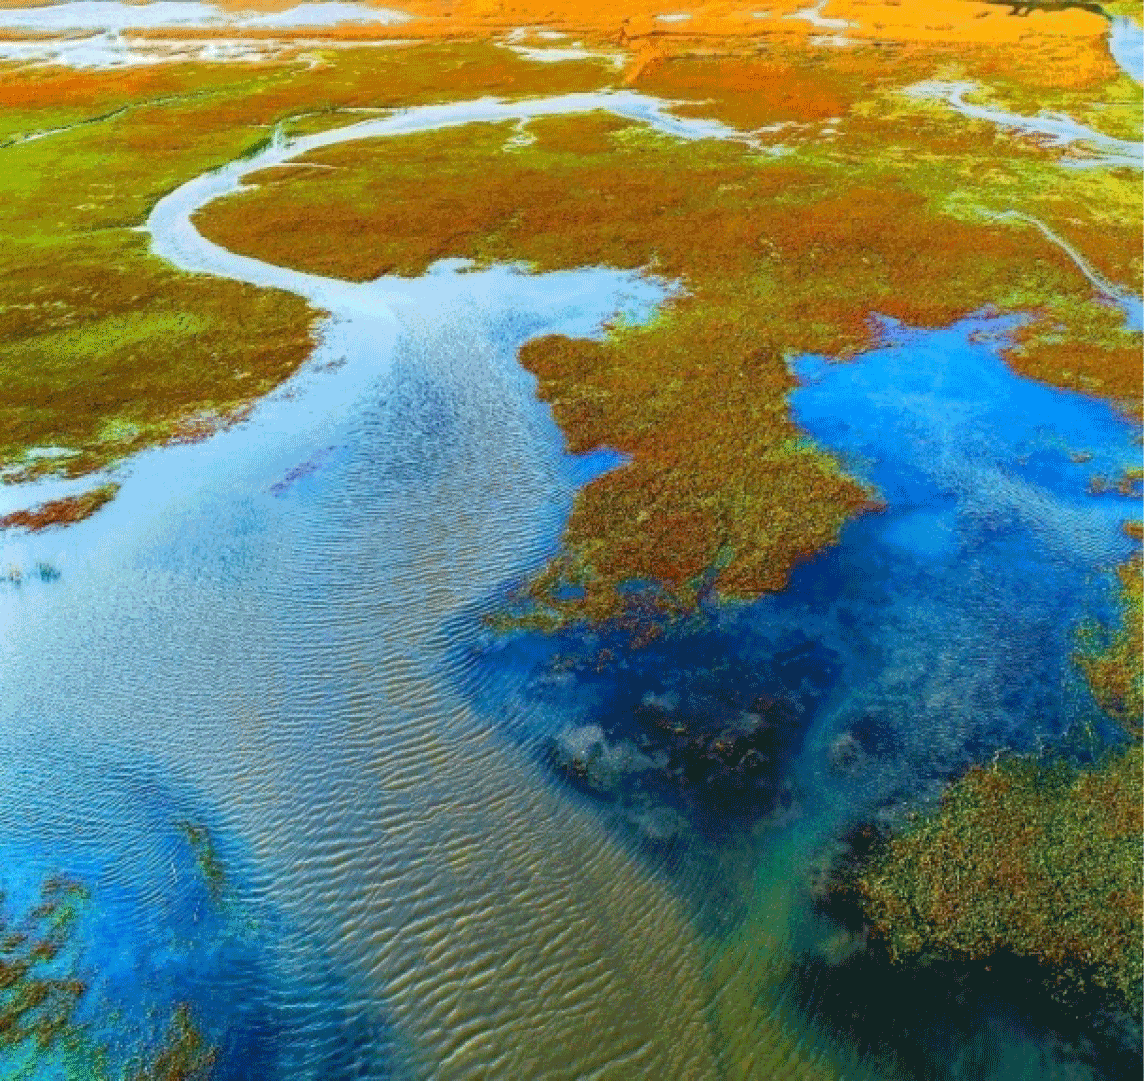
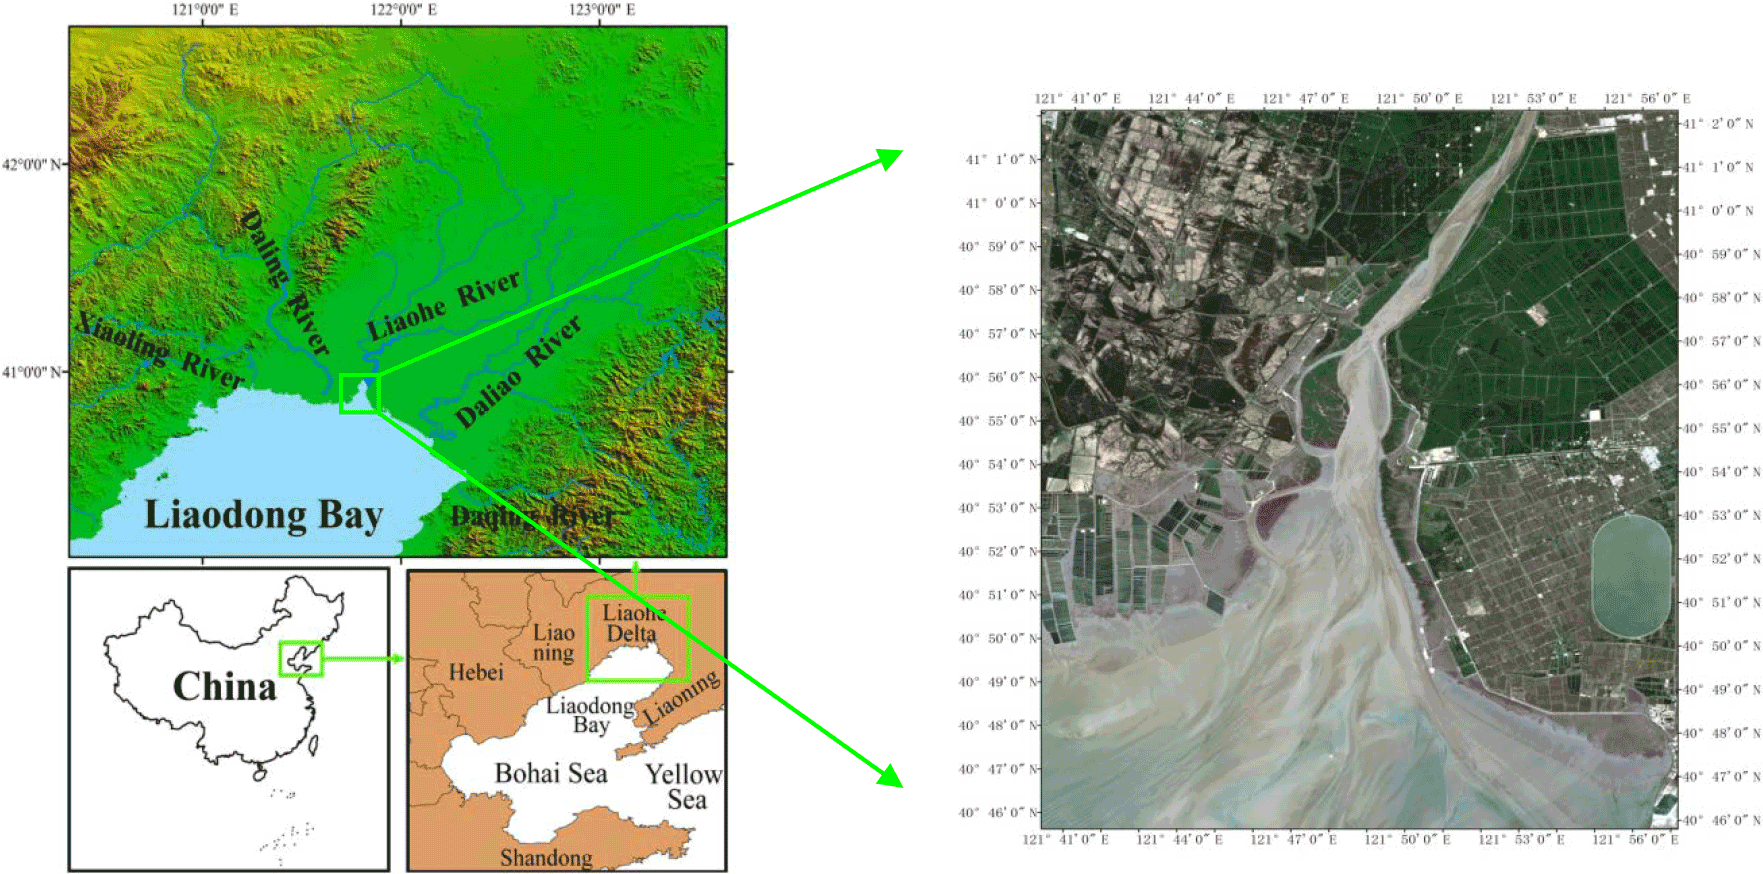
Figure 2The geographical location (Wang et al., 2017) and satellite image of the Liao River estuary.
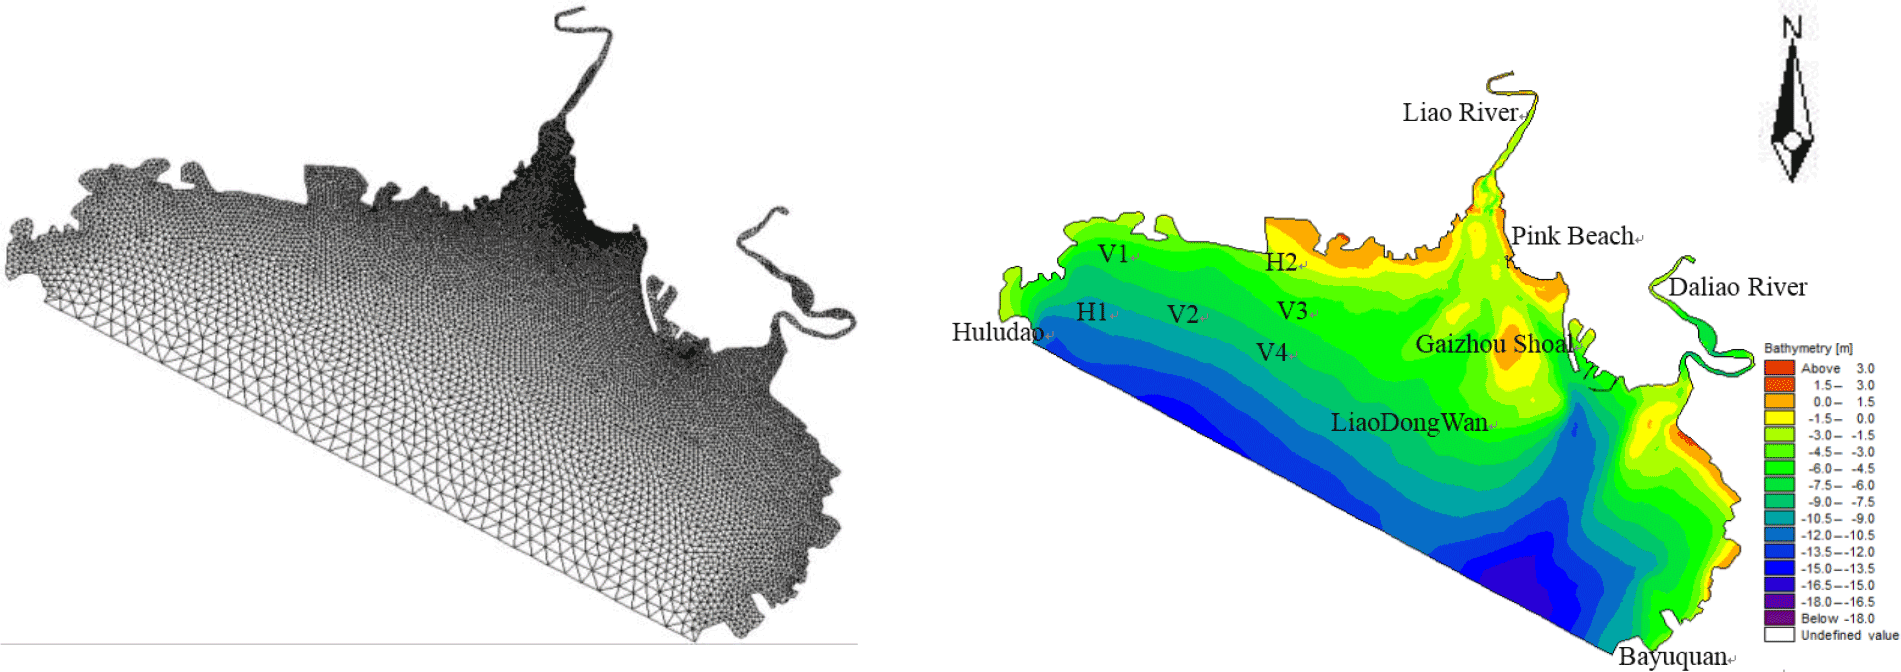
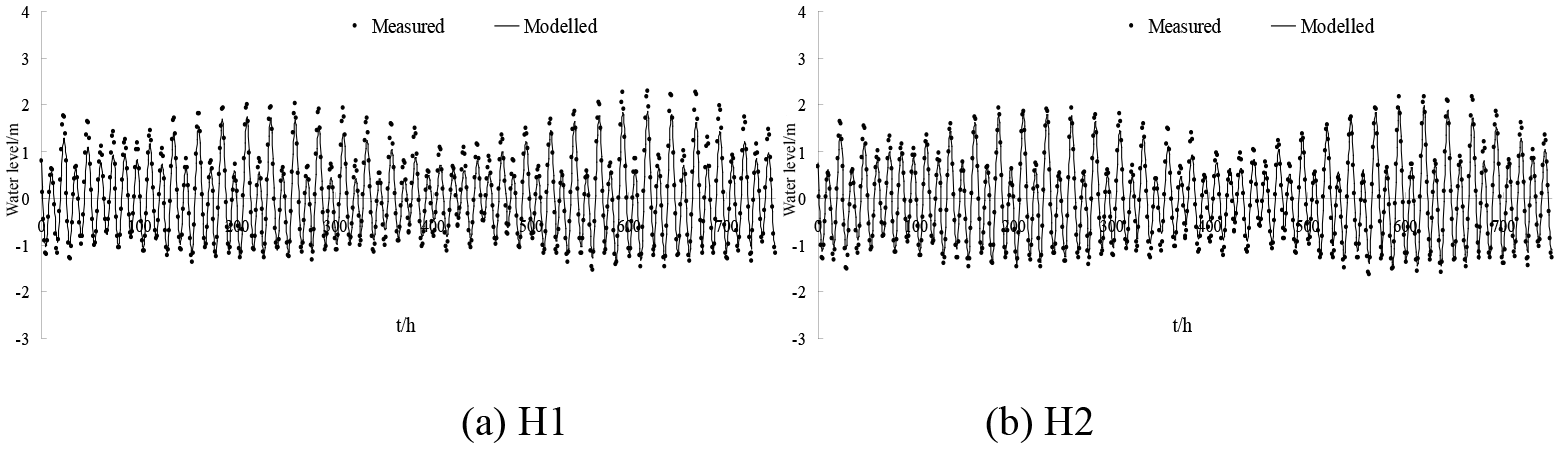
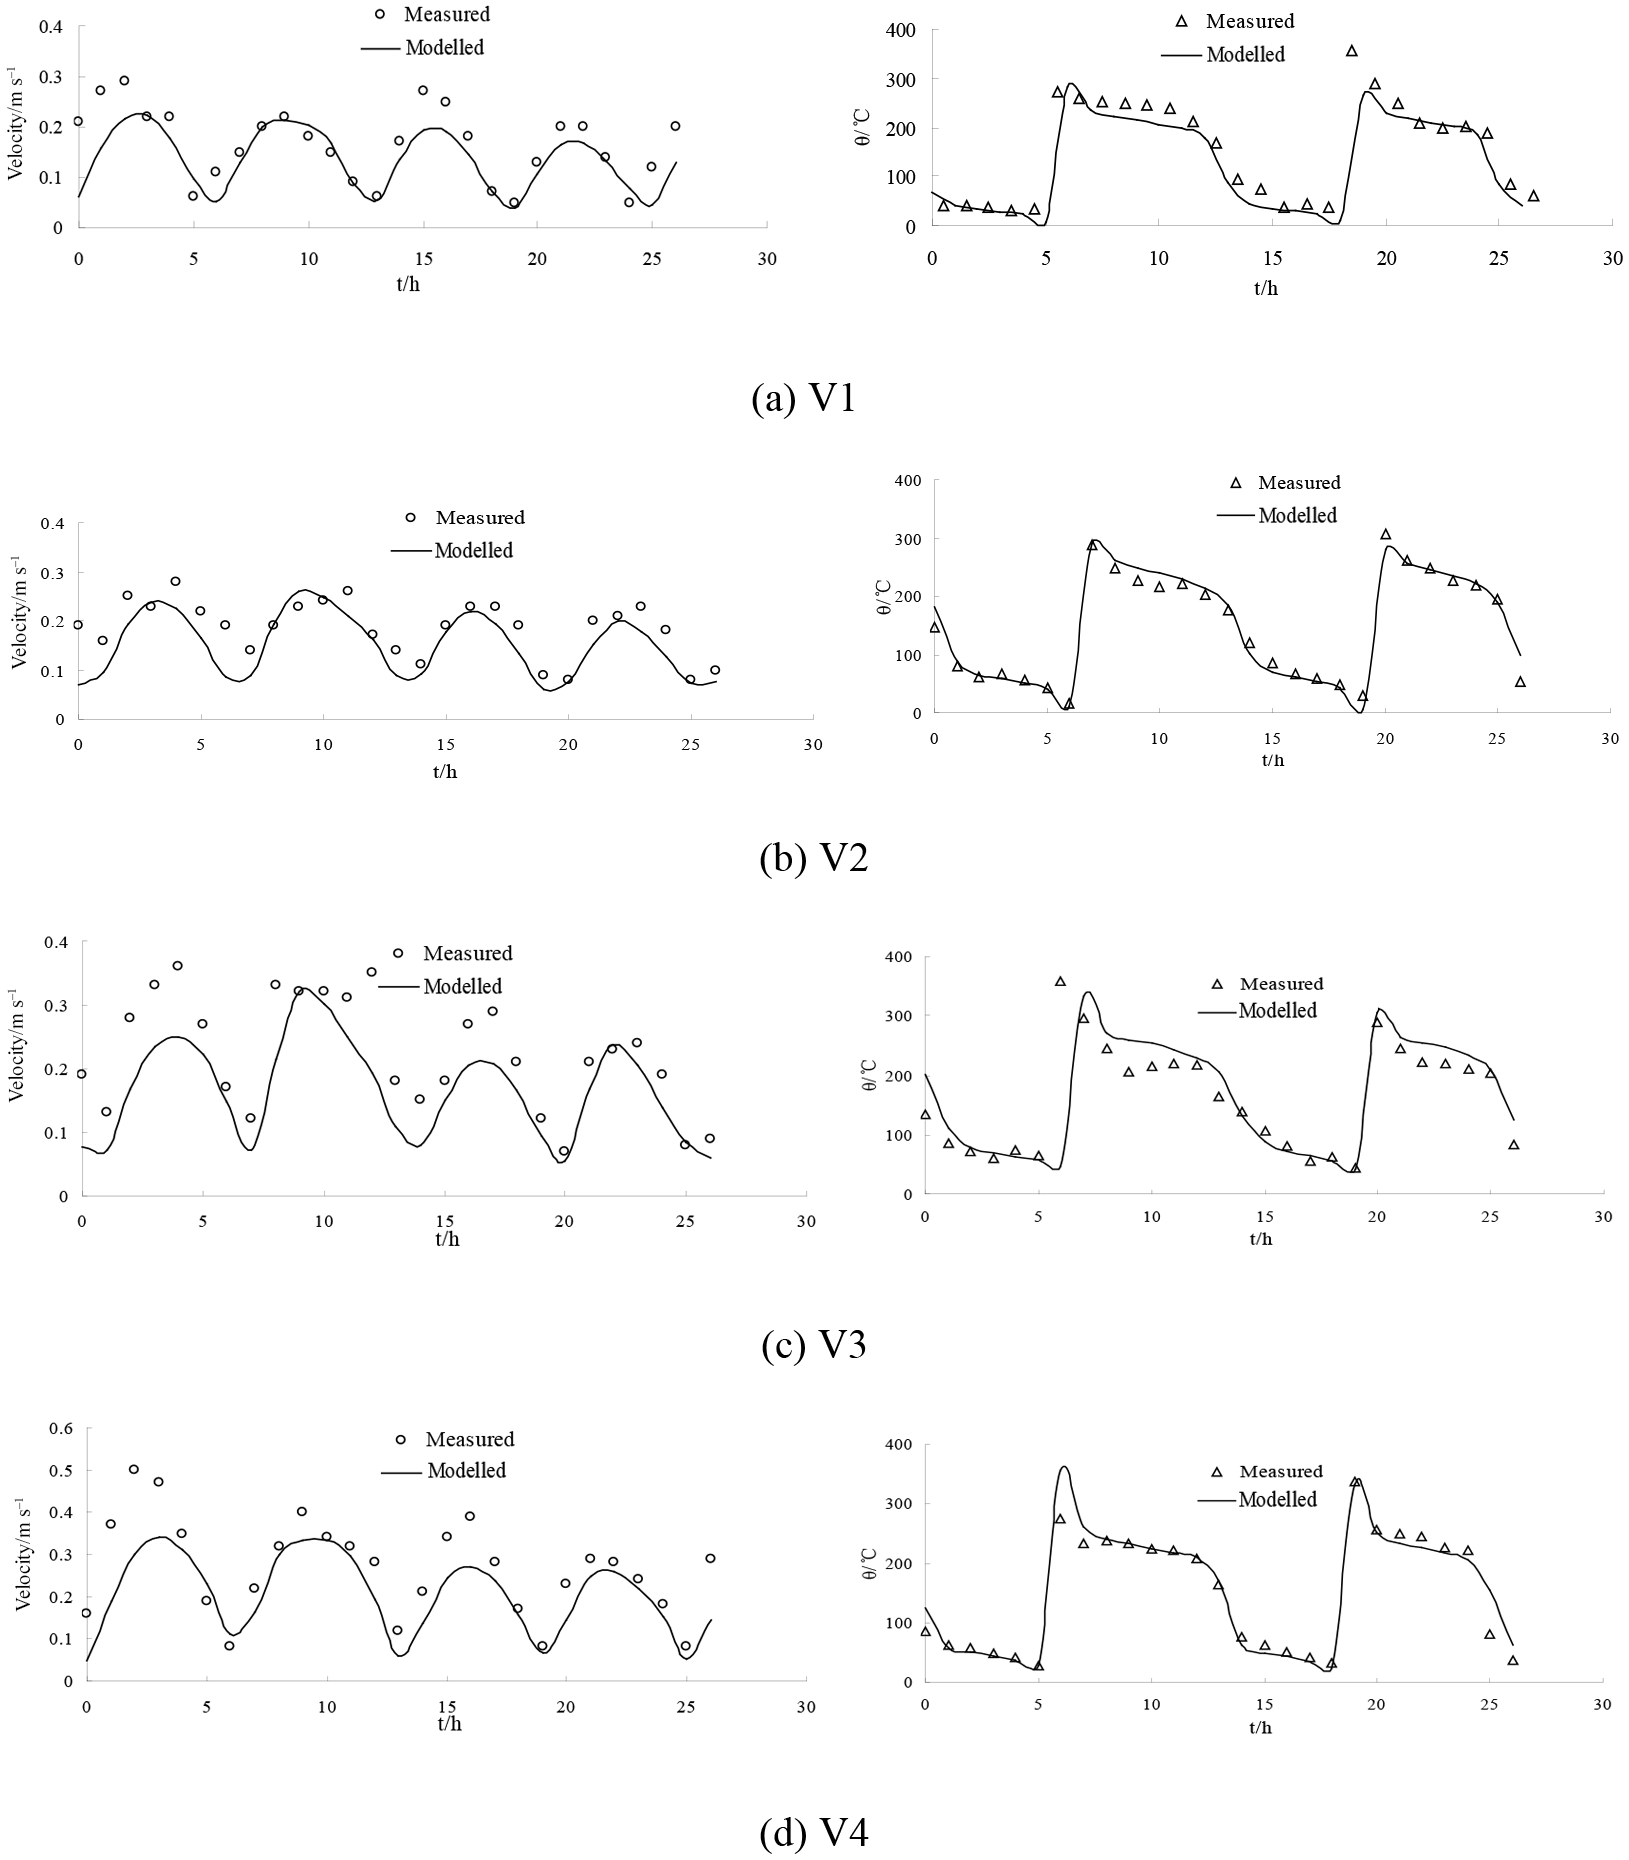
Figure 5The validation of current speed (left side) and direction (right side) at measured stations during neap tide.
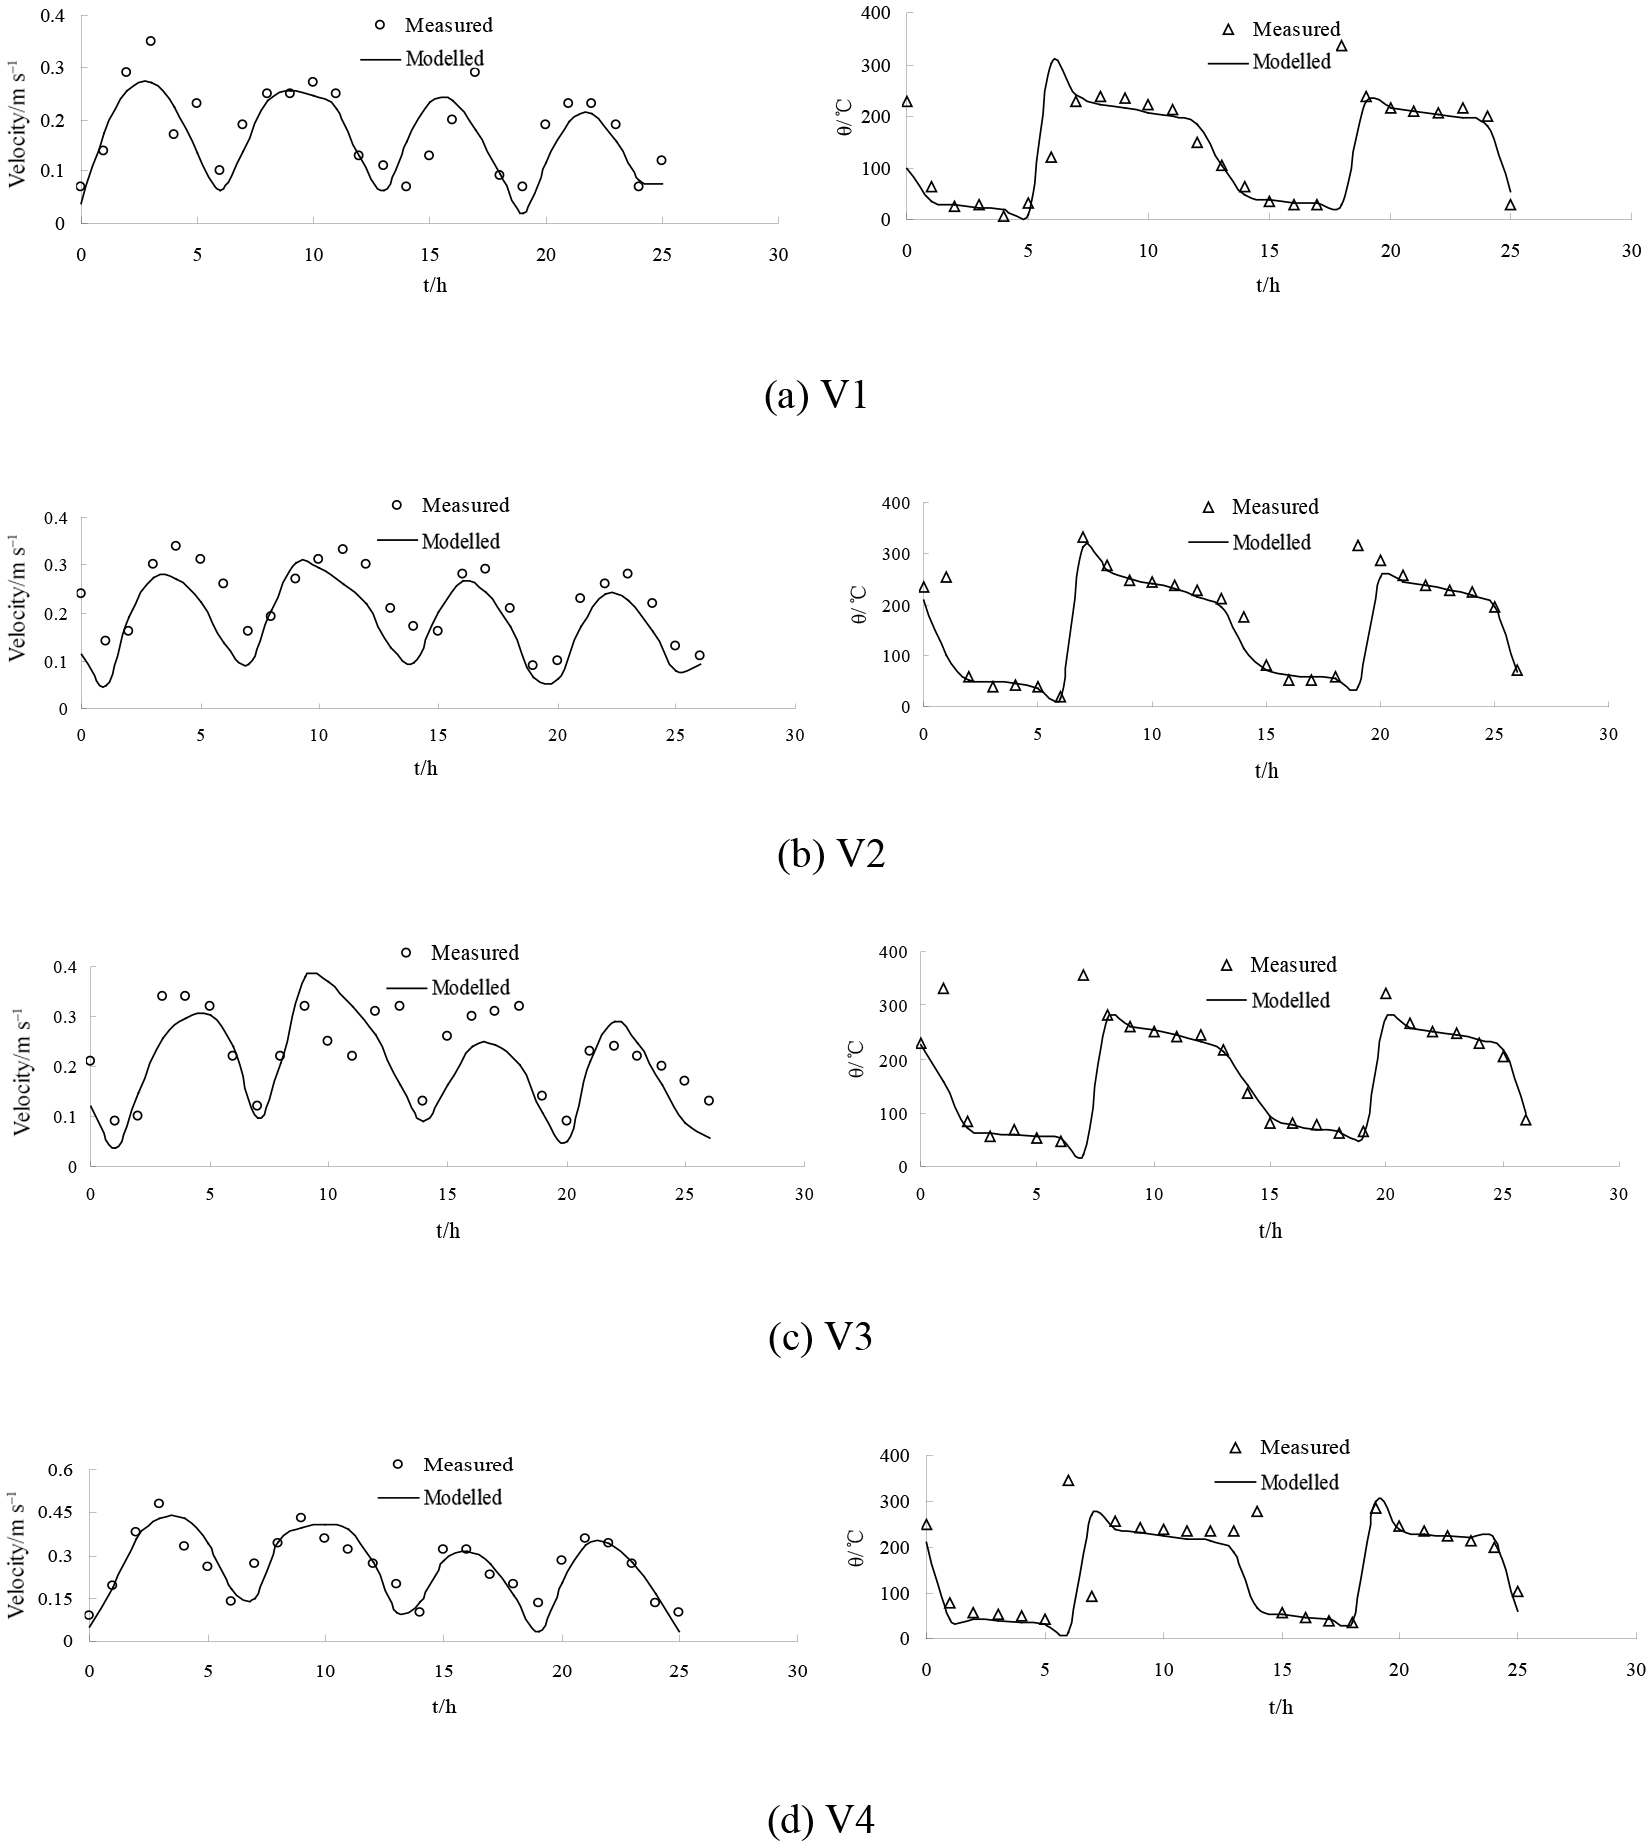
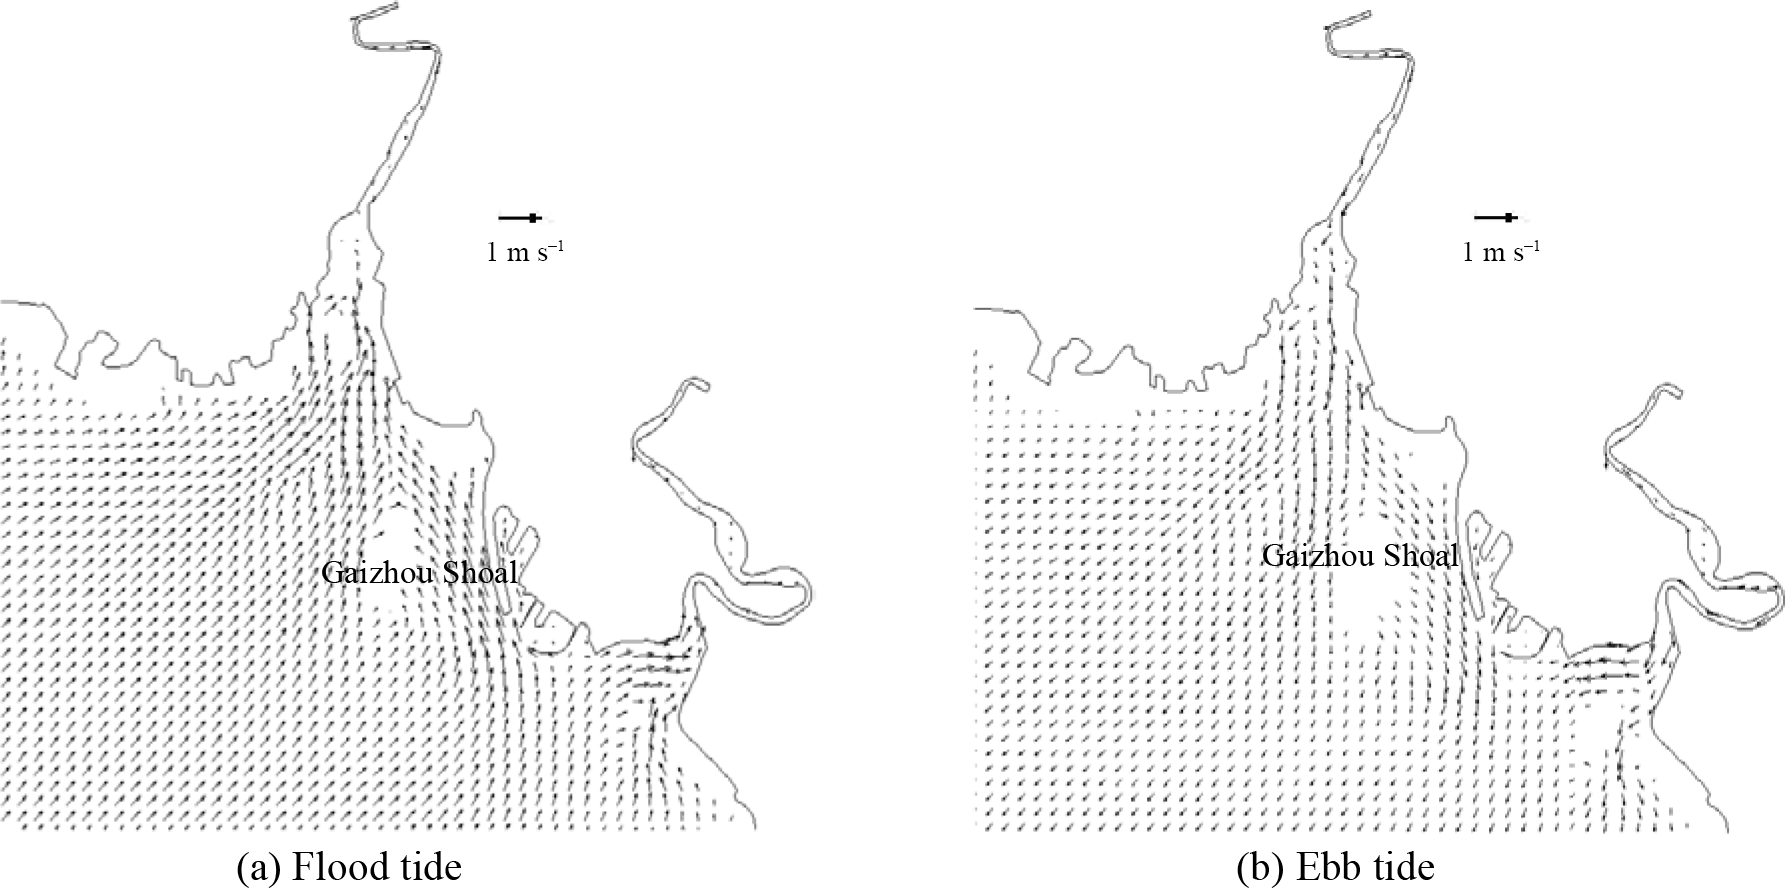
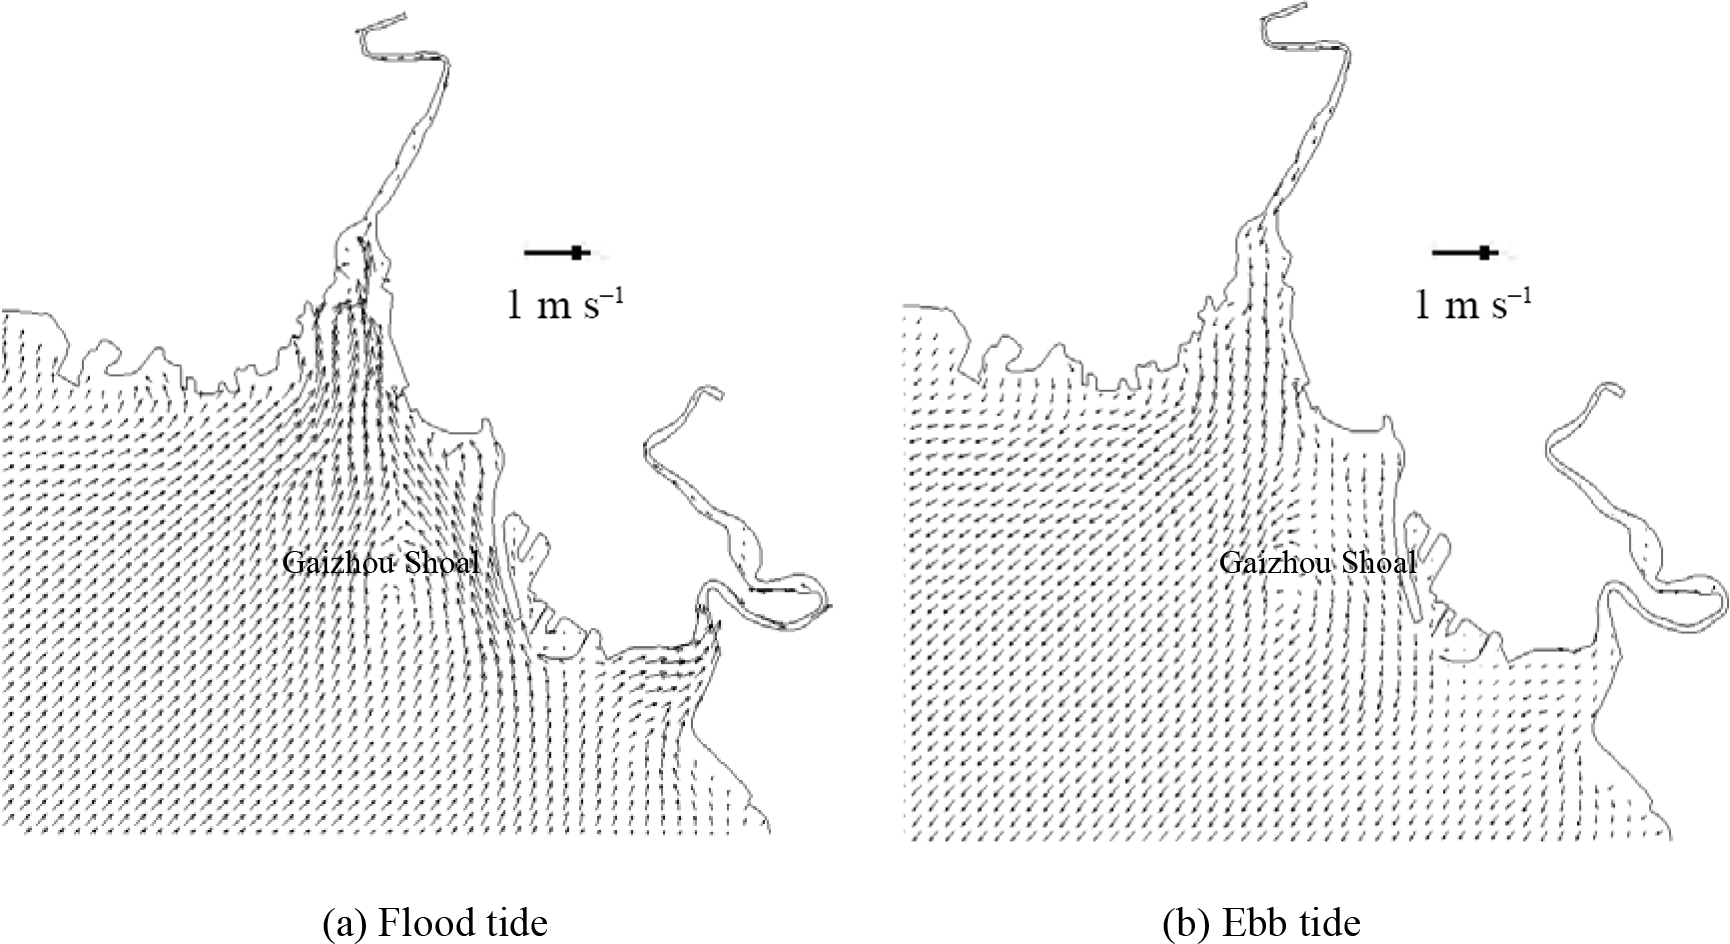
Figure 6The validation of current speed (left side) and direction (right side) at measured stations during spring tide. Figures 7 and 8 show the flow field in flood and ebb tide during the neap and spring tide. During the flood tide, as depicted in Figs. 7a and 8a, the general flow of the tidal current well offshore is north-eastward. The main flow flooding into the Liao River divides to go around both sides of Gaizhou Shoal. When the flow reaches the east and north-east of the Gaizhou Shoal, the flow turns to the north-west, forming a mainstream flow from the outside sea into Liao River. West of the Gaizhou Shoal, the water mainly flows to the north and the north-east, and is affected by the delta terrain. During the spring tide period, the Gaizhou Shoal can be swamped by the tidal currents on both sides because of the high tide level. During the ebb tide period, as depicted in Figs. 7b and 8b, due to the development of many shoals, the current at the mouth of the estuary is divided into many branches. West of the Gaizhou Shoal, the current gradually turns from south-westward to southward. East of the Gaizhou Shoal, the tide current flows directly south-east and then turns to the south. Part of the Gaizhou Shoal is high enough to be exposed at the low tide. Overall, the modelled results are acceptable and the model can be used for the following studies. The results of the salinity validation for V1, V2, V3 and V4 between 29 and 30 May 2014 at spring tide are reported in Fig. 9. The model correctly estimates the salinity in the Liao River estuary. The measured salinities were obtained by a Sea-Bird 911 plus conductivity–temperature–depth (CTD) profiler.
Recently, wetland ecosystems have been severely damaged and degenerated through the disproportionate consumption of wetland ecological resources, which in turn has resulted in serious declines in biodiversity and biological resources. A variety of studies on hydrodynamics in estuarine wetlands have been conducted, the most of which have focused on the following aspects: interaction between flow and vegetation, pollutant transport in wetlands and vegetation resistance experiments. Relevant prior research to this particular work mainly revolves around the study of the resistance coefficient of water flow when plants exist; most of this research utilises the Manning coefficient of water resistance (Ree et al., 1958; Chow et al., 1959). In addition, however, some scholars have studied the influence of plants on the structure of water flow, such as changes to flow, turbulence intensity and boundary shear force (Ikeda and Kanazawa, 1996). Considering the height and bending degree of willow species by water during flooding, the vegetation resistance was introduced into the Navier–Stokes equation. Numerical simulations of the three-dimensional flow field of the river and the floodplain wetland were then carried out (Wilson, 2006). Taking the reed community as the subject of their research, Shi et al. (2001) carried out an experiment to investigate the water resistance of non-submerged reeds and the relationship between the density and the resistance of reeds. Based on velocities from laboratory experiments for different water depths, discharges and aquatic vegetation densities, analyses were carried out for the resistance coefficient of vegetation (Li and Zhao, 2004).
The Saint-Venant equation and Nuding model were combined to simulate the steady-state and unsteady flow in the presence of vegetation in a channel and to analyse the effects of vegetation cover, beach slope and width on the cross-section of a river (Helmiö, 2005). A mathematical model that takes advantage of hydraulics typical of wetlands was used to simulate a one- and two-dimensional wetland flow in a laboratory experiment and a wetland pond. (Feng and Molz, 1997). The coupled SWIFT2D surface water and SEAWAT groundwater migration model was used to simulate the hydrological processes and salt exchange of the surface water and groundwater in estuaries and adjacent coastal wetlands (Christian et al., 2000). The two-dimensional numerical model was used to test the different flow conditions of Zhalong wetland, and the effect of reed vegetation on the process of storage and detention in wetlands was comprehensively evaluated (Gu et al., 2006). The two-dimensional k-ε turbulence hydrodynamic model for a curved open channel flow in curvilinear coordinates has been set up to simulate the hydrodynamic behaviour of turbulent flow in an open channel partially covered with vegetation; the effect of vegetation on flow was treated by both the drag force method and the equivalent resistance coefficient method (Zhang et al., 2013). In addition, some tidal flat wetland simulations have been carried out. The Delft3D model was used to investigate the impact of wetlands on tidal movement and turbulence for the semi-enclosed Breton Sound (BS) estuary in coastal Louisiana (Hu et al., 2014). The Telemac Modelling System (TMS) was applied to the development of a hydro-environmental model of the Severn Estuary and Bristol Channel to study microbial tracer transport processes due to mortality or interaction with the sediments, vegetation or some other water quality constituent (Abu-Bakar et al., 2017). Stark et al. (2017) established a depth-averaged hydrodynamic model (TELEMAC-2D) to assess the tidal hydrodynamics in the marsh channels of the Saeftinghe in the Netherlands during different stages of marsh development. Development towards a marsh system with a channel network and a vegetated platform is strongly influenced by the pioneer vegetation. Christiansen et al. (2000) introduced the physical processes of controlling mineral sediment deposition on a meso-tidal salt marsh surface on the Atlantic coast of Virginia; wetland plant patches locally reduce flow velocities and enhance sedimentation inside the patches. Bouma et al. (2005) collected a series of hydrodynamic data from the Scheldt Estuary beaches and swamps, and found that there was a clear linear relationship between the tidal amplitude and the maximum velocity on flats and in vegetated areas, meanwhile, the flow rate was obviously lower in vegetated areas. Su et al. (2013) developed a model known as the “mangrove-hardwood hammock model”, and simulated the evolution of vegetation succession along with changing groundwater salinity. The results demonstrate the impact of sea level rise on coastal vegetation and groundwater salinity. Lapetina and Sheng (2014) developed a three-dimensional storm surge model including a plant effect; the model is applicable to assess the feasibility of future wetland restoration projects. Regarding the study of salt intrusion in wetlands, Andrew et al. (2017) constructed a three-dimensional hydrodynamic model of the San Francisco Estuary and found that estuarine circulation was strongest during neap tides and that unsteady salt intrusion was strongest during spring tides. A three-dimensional hydrodynamic model (CH3D) was used to investigate the impact of the physical alteration on salinity in Caloosahatchee Estuary (Sun et al., 2016).
In general, the majority of studies have focused on the effects of vegetation on fluid movement in flume experiments; few detailed field observations or salinity simulations exist in mudflat–salt marsh ecosystems, especially involving the typical wetland plants of the Liao River estuary. Research on the salinity response of plants to river discharge in wetland waters has not yet been systematically assessed.
In this study, a two-dimensional hydrodynamic and salinity model is used to simulate flow patterns and salinity distribution in the wetland waters of the Liao River estuary. The resistance caused by vegetation is represented by the varying Manning coefficient. This study adopts remote sensing techniques to obtain the spatial distribution of two types of aquatic plants in the Pink Beach wetlands. The numerical model is calibrated and validated against field measurement data; the variation of salinity in the vegetated domain of the Pink Beach wetland is obtained under different runoff conditions.
The MIKE 21 model is one of the most widely used hydrodynamic models (with respects to both domestic and overseas research (Wang et al., 2013)), and was developed by the Danish Hydraulic Institute (DHI). The model is based on the cell-centred finite volume method implemented on an unstructured flexible mesh. It includes hydrodynamic, transport, ecological module/oil spill, particle tracking, mud transport, sand transport and inland flooding modules (Cox, 2003).
2.1 Hydrodynamic module
The hydrodynamic module is based on the numerical solution of the depth-integrated incompressible flow Reynolds-averaged mass conservation and momentum equations (William, 1980). The governing equations include the following:
The continuity conservation equation:
and the momentum equations:
where x and y are the Cartesian coordinates; is the total water depth; t is time; η is the water surface elevation; d is the still water depth; ρ is the density of water; ρ0 is a ratio of water density to air density; g is acceleration due to gravity; and are the depth-averaged velocity components in the x and y directions, respectively; f is the Coriolis parameter; S is the magnitude of the discharge due to point sources; Pa is the atmospheric pressure; (us, vs) is the velocity components in x and y directions for point sources; Txx, Txy, Tyx and Tyy are the components of the effective shear stress due to turbulence and viscous effects; and (τsx, τsy) and (τbx, τby) are the x and y components of the surface wind and bottom stresses, respectively. , is the depth-averaged velocity for the two-dimensional calculations, , , M is the Manning coefficient for the bed roughness in MIKE 21 model and ks is roughness height (DHI Software, 2007).
2.2 Salinity module
The fundamental salinity equation is
where is the depth-averaged salinity at average water depth, ss is the salinity of the source and Fs is the horizontal diffusion terms of the salinity.

3.1 Description of the study domain
The Liao River is one of the seven largest rivers in China and is located in the north of Liaodong Bay. This estuary is a crucial ecological economic zone and plays an important role in the comprehensive development and utilisation of marine industry in China. The Liao River estuary includes the Daliao and Liao rivers (Li et al., 2017). Pink Beach of the Liao River delta is a marsh wetland covered with Phragmites communis and Suaeda heteroptera; it has been listed as the largest reed wetland and the second largest marsh system in the world. It also provides an important habitat for a variety of marine wildlife, particularly certain endangered species, such as Phoca largha, Larus saundersi and Grus japonensis. However, over the past decade, the Pink Beach wetland has been significantly degraded and the Suaeda heteroptera community has decreased due to global warming, environmental pollution and other natural or human factors. Some studies on tidal flat wetlands have shown that the growth of marsh plant communities is associated with a limited range of salinity (Zhang et al., 2009). However, due to the lack of quantitative salinity observations, the impact of actual salinity on vegetation growth for the Pink Beach wetland is still unknown .
The study domain is located in the north of Liaodong Bay, extending from 40.3032 to 40.7105∘ N and 121.0294 to 122.0312∘ E (Fig. 2). An unstructured triangular mesh of the Liao River estuary (Fig. 3) was generated using bathymetry data by SMS (Surface Water Modelling System) software. The number of cells was 18108 with 9599 nodes in the computational domain. From the upper reaches of the river to the central part of the domain, i.e. at Pink Beach wetland, which is the focus of the present study, we use finer grid resolutions – as small as 98 m. Model grid size gradually increases away from the flats and estuarine deltas, and the maximum grid spacing utilised in the open sea is 2460 m. The topographic map was then obtained through terrain interpolation (Fig. 3).
To proceed with the numerical simulations, the equations of hydrodynamics require appropriate boundary and initial conditions. A total of three open boundaries and a solid boundary were established. The model was forced at the open boundary, from Huludao to Bayuquan, by a time series of tidal elevations from the TMD (Tide Model Driver) (Padman, 2005). Two flow boundaries in the north of the area are controlled by the discharge. The solid boundary is treated as impermeable with no slip. The salinity data of the open boundary and river discharge are set to 32.8 and 2 psu, respectively, in this model. The initial water level and salinity are 0 m and 32 psu, respectively.
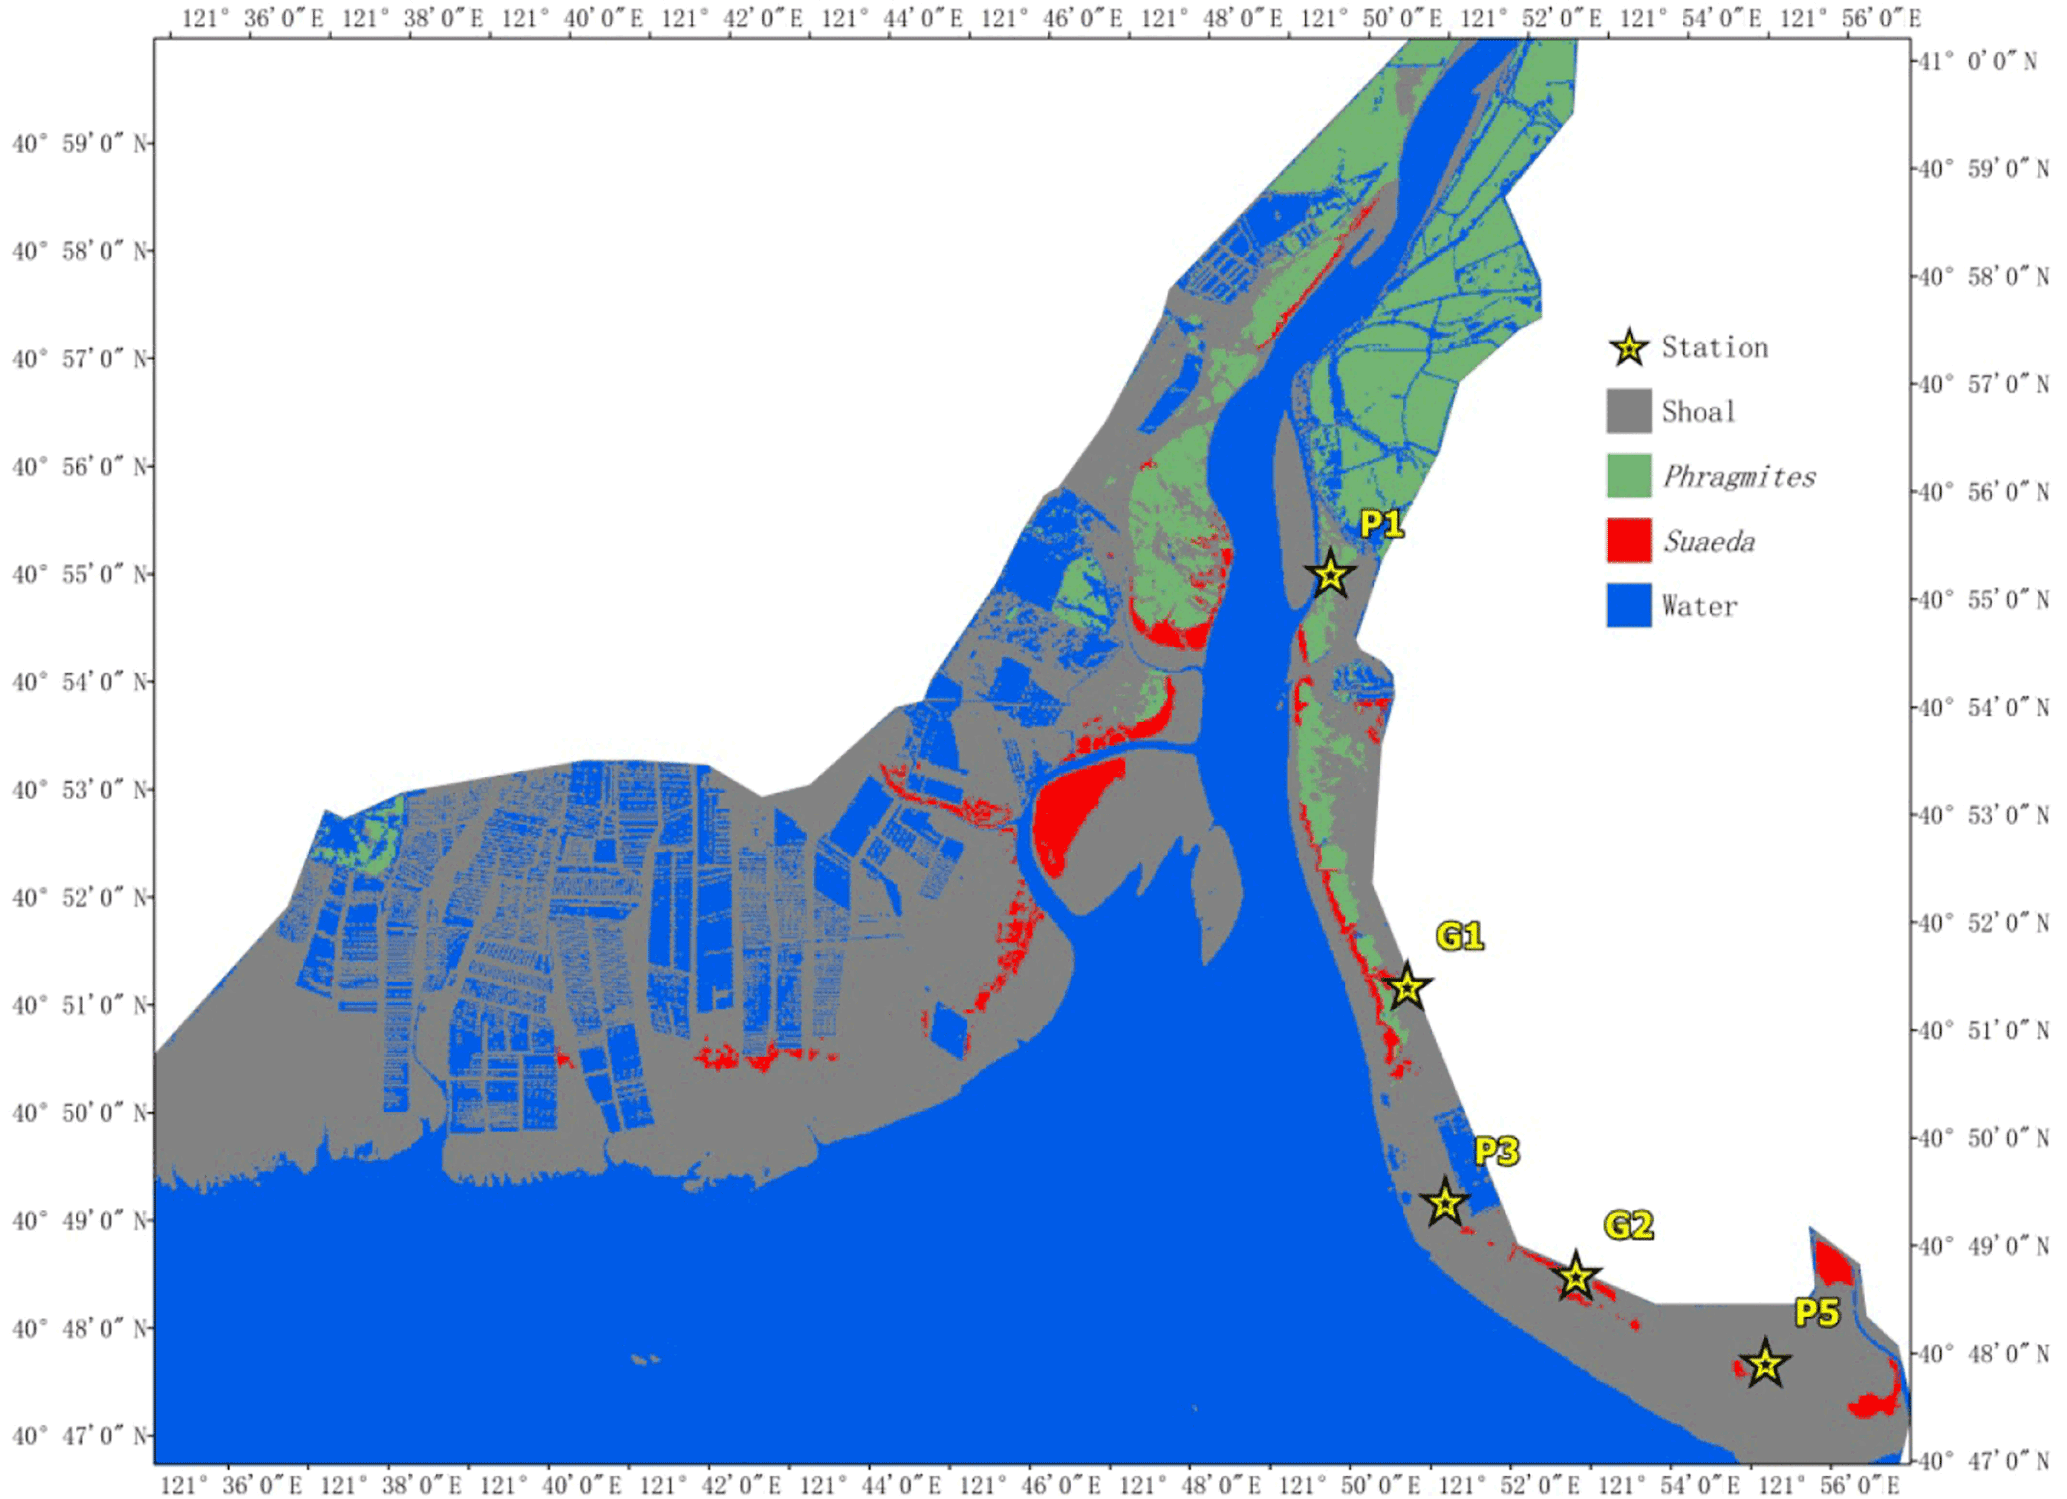
Figure 11The distribution of the aquatic plants and selected stations at Pink Beach wetlands.

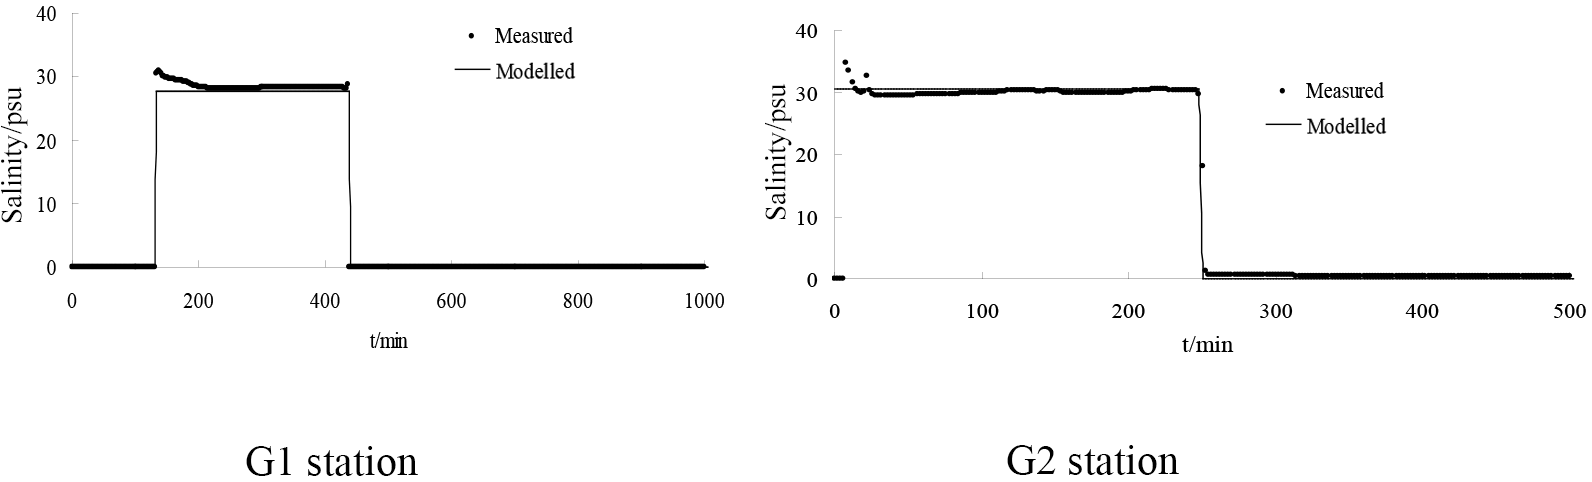
Figure 13Comparison of the simulated and measured salinity concentrations at locations G1 and G2.
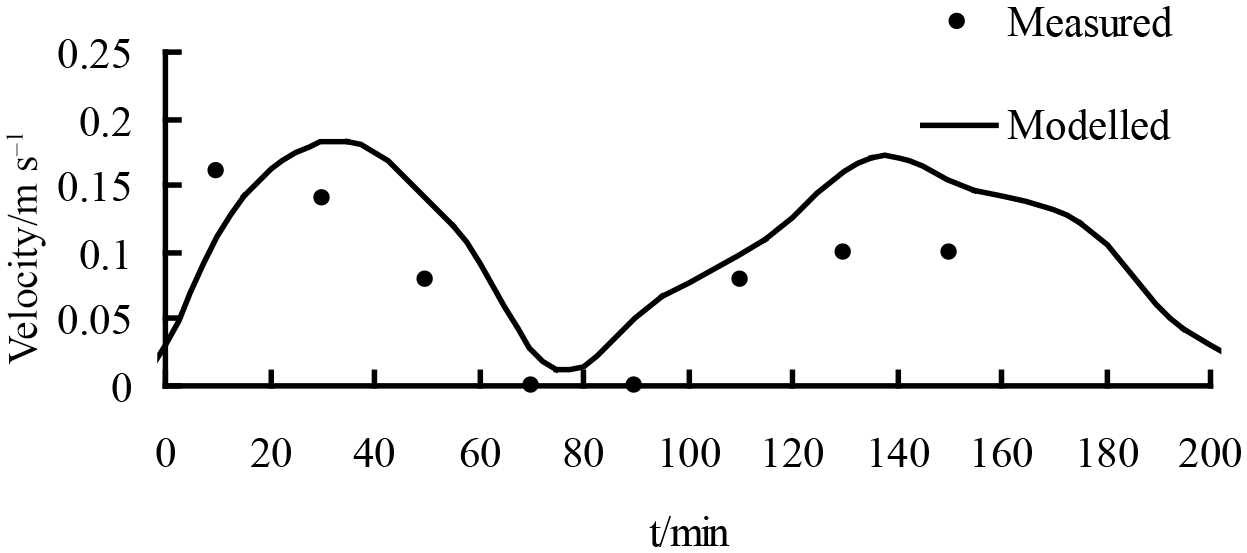

Figure 15Flow structure of Pink Beach in vegetated (a) and non-vegetated (b) areas. The black ellipses represent vegetated areas.
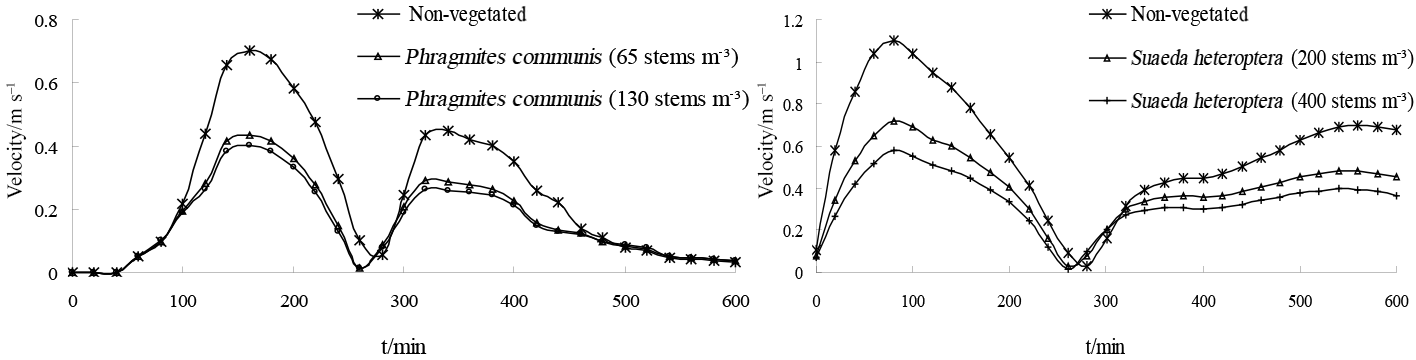
Figure 16Comparison of water velocity over regions of differing plant density at the Pink Beach wetlands.
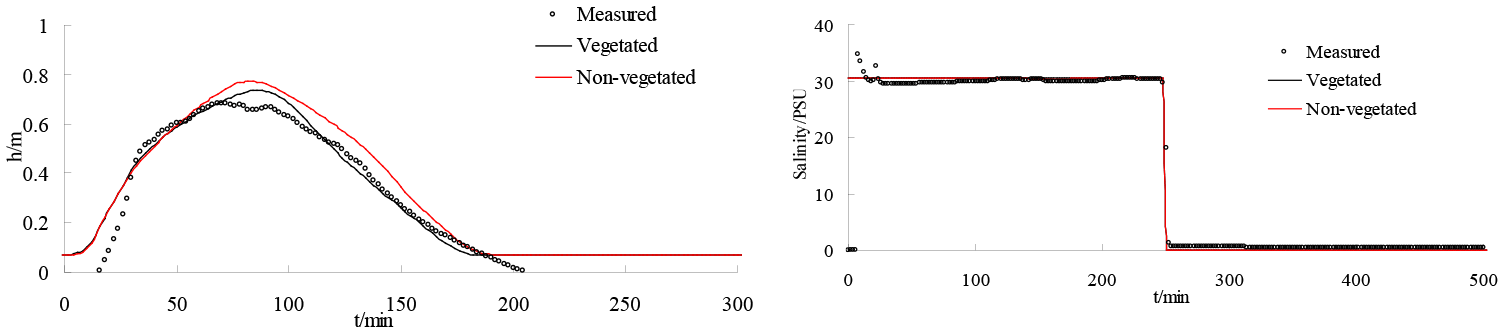
Figure 17Comparison of water depth and salinity in vegetated and non-vegetated areas at location G2.
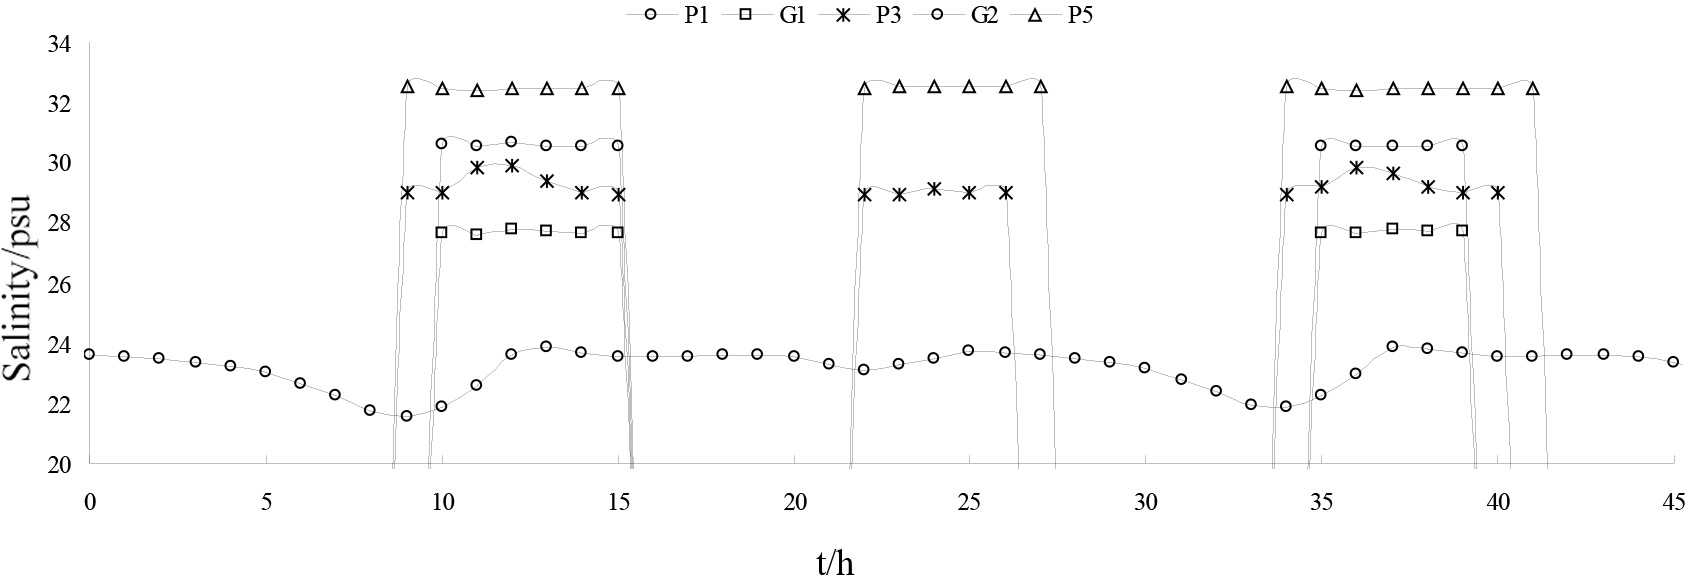
Figure 18The simulated salinity concentrations at the five locations displayed in Figure 11.
3.2 Simulation of tidal currents and salinity
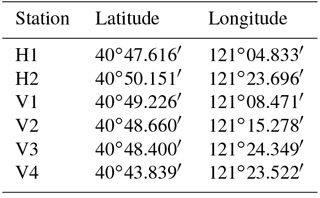
Simulations were carried out to verify the accuracy of the model. Simulations with a larger time step caused systematic violations of the Courant number (i.e. CN > 1), whereas smaller time steps significantly increased the computational time required. The model is an explicit format with a maximum time step of half an hour, which is automatically adjusted according to the CFL (Courant–Friedrichs–Lewy) conditions during the calculation. The parameter M represents the Manning coefficient for bed roughness and is set to 80 m1∕3 s−1 in this study. The hydrodynamic model was run for the period 1 May 2013 to 31 May 2014. A model spin-up period of a year was performed to achieve stabilisation from 1 May 2013 to 1 May 2014, and tidal water levels, tidal currents and salinity throughout the water column were used as calibration parameters over the period from 21 to 30 May 2014. There was a neap tide between 21 and 22 May 2014 and a spring tide between 29 and 30 May 2014. There were two tide level monitoring stations (H1 and H2) and four tidal current monitoring stations (V1, V2, V3 and V4) (Table 1 and Fig. 3).

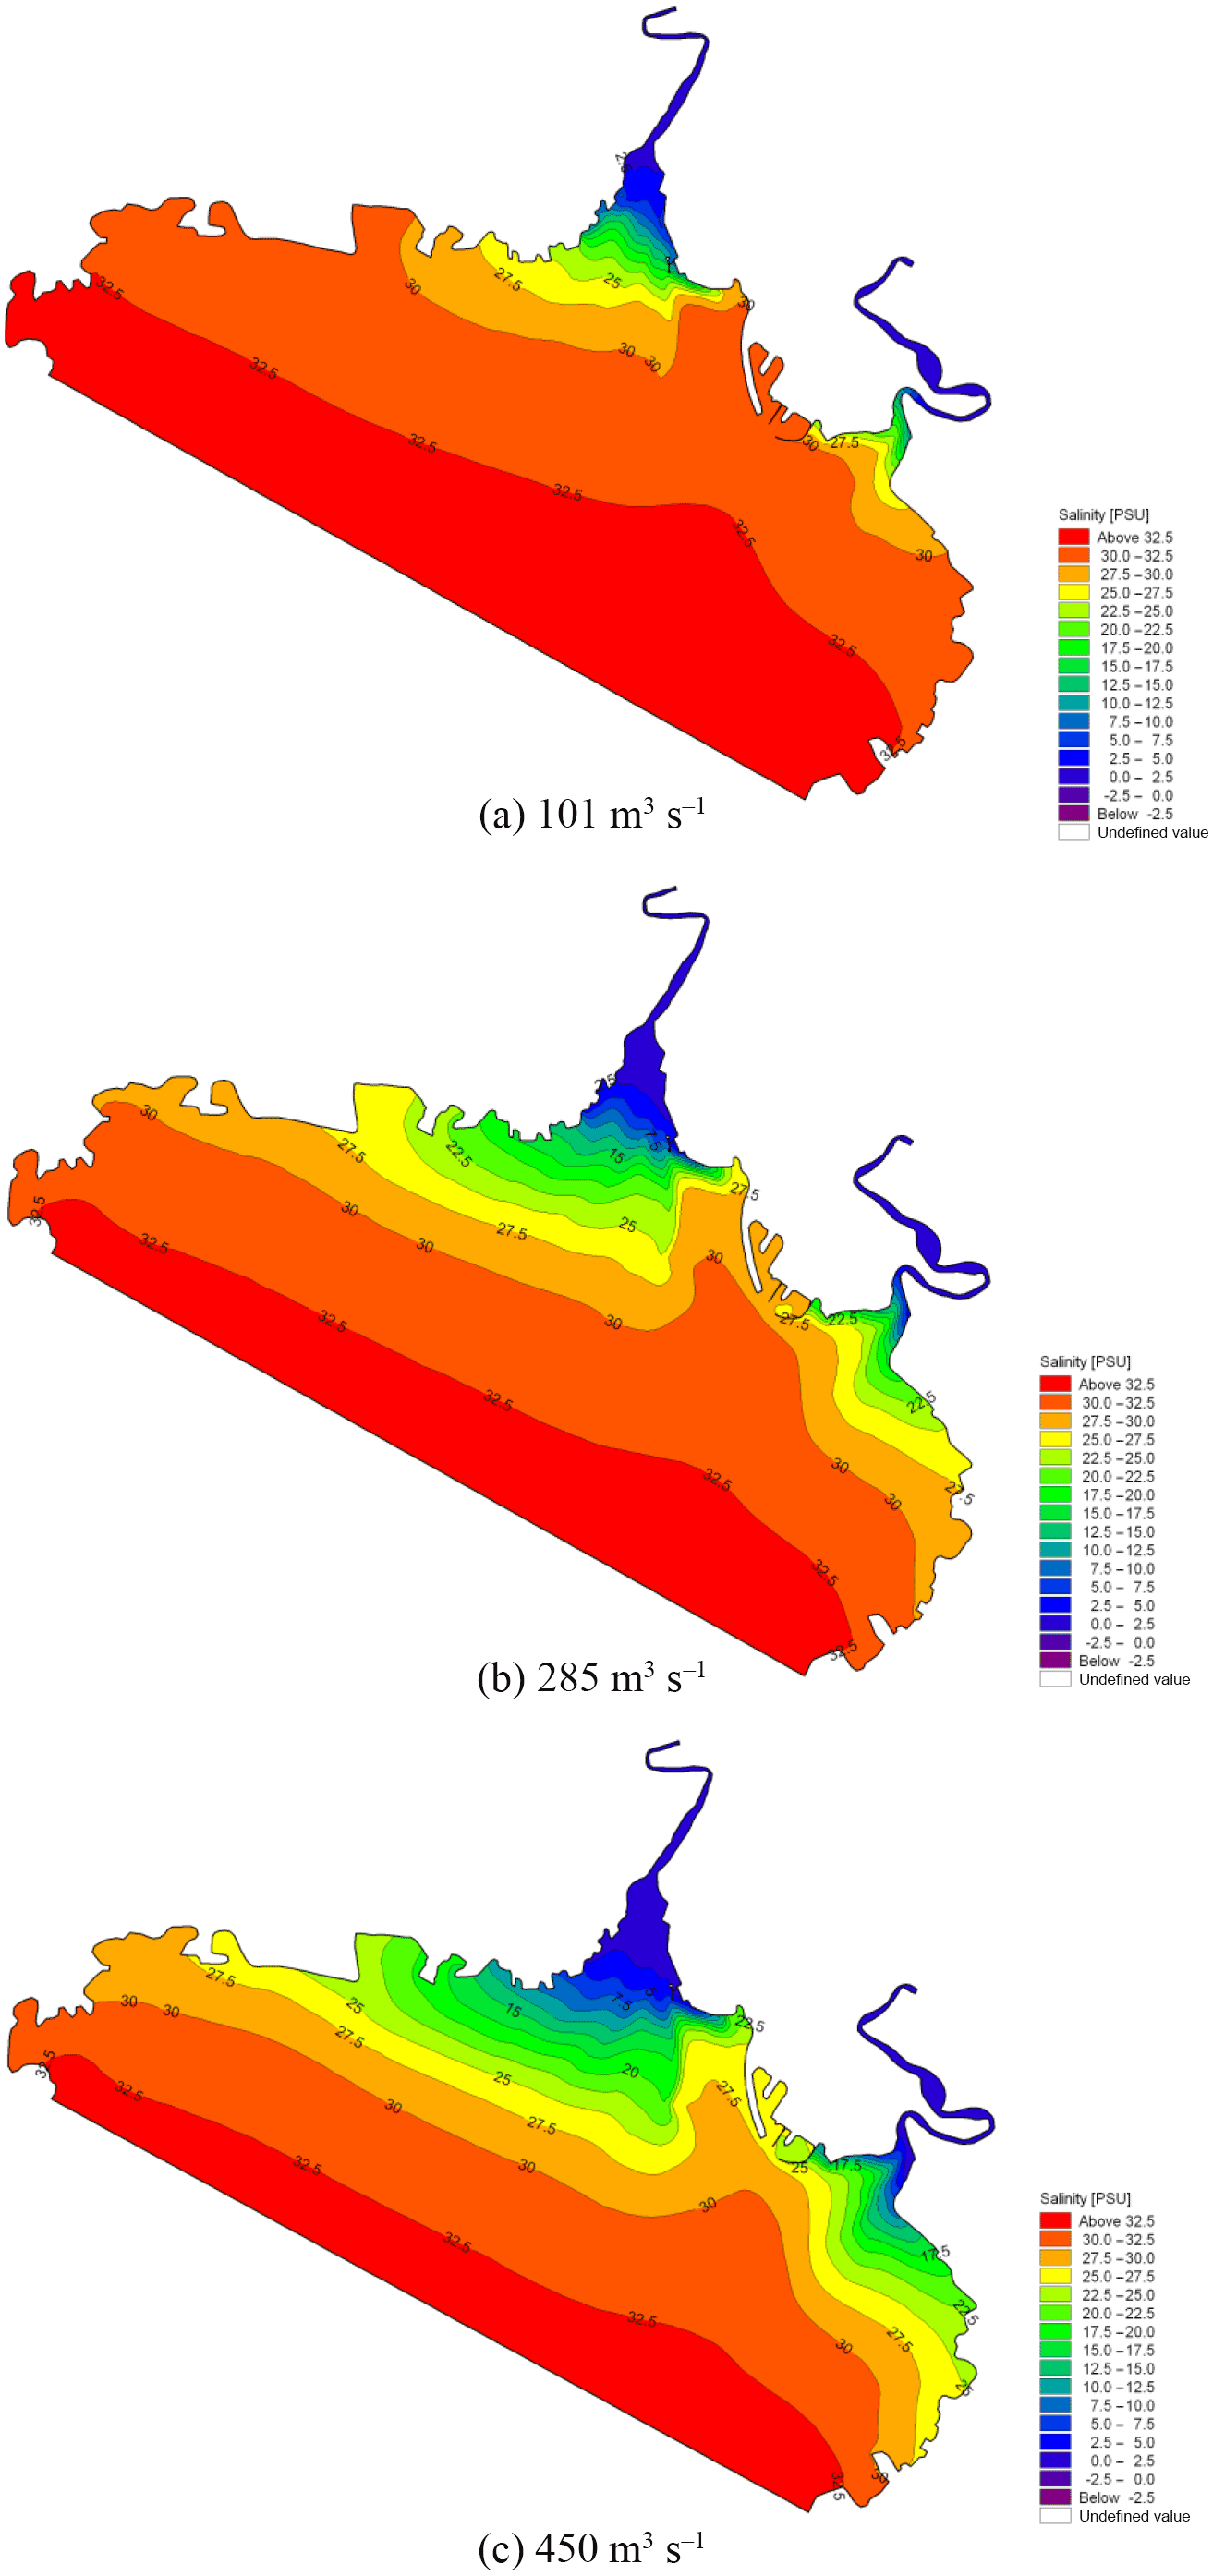
Figure 20Contour maps of salinity for the period of strongest saltwater intrusion with different rates of runoff.
The water levels and the tidal currents in the study domain were calculated and the results of the numerical simulation were compared with measured data, as shown in Figs. 4, 5 and 6. The model matched the timing of observed tidal water levels at two locations (Fig. 4), with no detectable phase shift in water levels; however the model slightly underestimated the water levels. This may be attributed to the accuracy of the time series of tidal elevations forced by the open boundary and the measured tidal level. The simulated tidal current speeds were approximately consistent with the field data (Figs. 5 and 6). In addition, the simulated direction of tidal currents was also consistent with the measured direction of tidal currents. These satisfactory validation results demonstrate that the proposed model is capable of simulating the flow in the Liao River estuary.
3.3 Hydrodynamics and salinity simulation in wetland domains
3.3.1 Assessment of wetland information by remote sensing
Remote sensing is an effective and powerful way to monitor vegetation status, growth and biophysical parameters (Hunter et al., 2010; DeFries 2008; Ustin and Gamon, 2010). It also allows for frequent acquisitions for multi-temporal studies and the reconstruction of historical time series in a cost-effective way (Coppin and Bauer, 1994; Munyati, 2000). The objective of the present research was, therefore, to adopt remote sensing to obtain information regarding vegetation in the wetlands of the Liao River estuary.
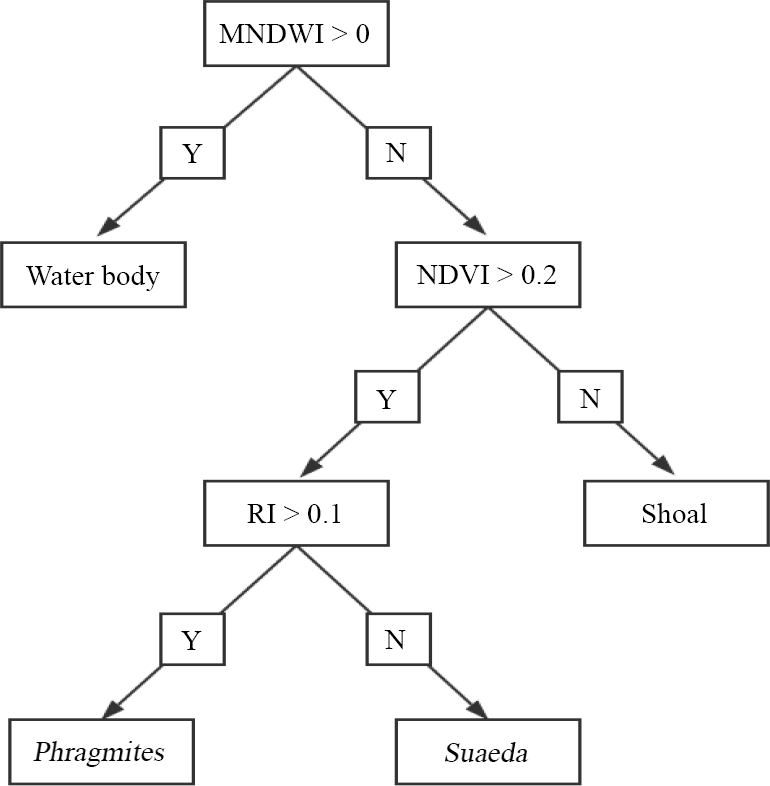
Information on the wetland was acquired on 3 June 2017 from the Landsat8 Operational Land Imager (OLI), provided by the USGS (http://glovis.usgs.gov/next/2017.06.03, last access: 3 June 2017). The resolution of the images was 30 m and the orbit number was 120/032. The images underwent radiometric calibration, atmospheric correction and image cutting through ENVI 5.1 (Environment for Visualizing Images) software before the classification. Firstly, the images were processed via the “Radiometric Calibration” tool (Zhang et al., 2013), which created the radiance images. The atmospheric correction of the resulting images was then carried out by combining the metadata (solar azimuth angle, image centre latitude and longitude, data acquisition time, band gain and band deviation, etc.) through the FLAASH (Fast Line-of-sight Atmospheric Analysis of Spectral Hypercubes) model (Yuan et al., 2009). The focus of this domain is on the upper reaches of the Liao River and the Pink Beach wetlands, which are the more densely vegetated areas. Therefore, the emphasis on information extraction was on the water body, the shoal and the vegetation. The NDVI (normalized difference vegetation index), the MNDWI (modified normalized difference water index) and the RI (Redness index) were used to extract different objects; each index can be utilised to extract a class of feature information. Firstly, features were calculated based on the reflectance of each band of the Landsat8 OLI sensor using the band functions in ENVI software. Then, different thresholds were set to classify different features. Finally, the decision tree classification (Fig. 10) in the ENVI classification tool was executed to realise the extraction of the water body, the shoal and the vegetation. Vegetation was then divided into two categories: Phragmites communis and Suaeda heteroptera (Fig. 11). G1, G2, P1, P3 and P5 stations are presented in Fig. 11.
The abovementioned information extraction was carried out as follows:
where b3 is the green band reflectance of the Landsat8 OLI sensor, b4 is the red band reflectance, b5 is the near infra-red band reflectance and b6 is the middle infra-red band reflectance.
The effect of vegetation on the hydrodynamics in wetland in estuary areas was represented by a varying Manning coefficient in the bottom friction term. The Manning coefficient for vegetation resistance depends on the flow depths, the number density and the diameter of the vegetation elements (Zhang et al., 2013). The Manning coefficient nv considering the vegetation effect is given by the following equation:
where m is the number density (the number of vegetation elements per unit horizontal area); , where dv is the average distance between two adjacent vegetation elements; CD is the drag coefficient; D is the average diameter of the vegetation element; and hv is vegetation height. In vegetated domains, cf can be expressed as .
3.3.2 Hydrodynamics and salinity simulation in wetland domains
The model simulation was conducted to evaluate estuarine hydrodynamics and salinity transport in the presence of vegetation at the Pink Beach wetland; realistic vegetation was incorporated into the model grid. The dominant vegetation types at the sites (Fig. 11) were Phragmites communis and Suaeda heteroptera. The average diameters of Phragmites communis and Suaeda heteroptera were 0.6 and 0.2 cm, respectively, and the plant stems were set to a respective 1.5 and 0.15 m high. The drag coefficients in the model (CD) were set to 1.0 and 0.3, respectively (Gu, 2006). The density was set to 65 stems per square metre for Phragmites communis and 200 stems per square metre for Suaeda heteroptera (He et al., 2008). The simulated and measured changes in water depth and salinity concentration at two stations (G1 and G2) are demonstrated in figures 12 and 13. Water depth in the Pink Beach region is correctly modelled but at G1, upstream of the vegetation zone, this model is in error compared to the observed results. As can be seen from Figure. 12, there is asymmetry between the flood and ebb tides in the vegetation area. The Liao River estuary has a complex terrain with a large area of tidal flats and shoals, which is one of the causes of the asymmetry between the flood and ebb tides. In addition, there are large numbers of Phragmites communis and Suaeda heteroptera in the Pink Beach wetlands which means that the resulting vegetation-induced resistance enhances this tide asymmetry. The model predicts salinity concentrations reasonably well compared with the measured data in the Pink Beach wetlands. The maximum water depth at G1 was 0.834 m during the spring tide on 29 June, the immersion time was 282 min and the maximum salinity was 31.02 psu. At G2, the maximum water depth was 0.682 m during the spring tide on 26 to 27 July, the immersion time was 184 min and the maximum salinity was 34.76 psu. The measured data and the calculated velocity also show good agreement at G1, further confirming the reliability and authenticity of the present simulation. In Figure 14, it can be noted that the velocity of G1 displays double humps and that the peak depth-averaged velocity at this site can reach 0.15 ms−1.
The results regarding flow structure at Pink Beach in the presence and absence of vegetation highlight the relationship between vegetation and currents (Fig. 15). From the numerical experiments, it can be seen that the presence of vegetation increases the resistance of the estuary bed and can effectively reduce the flow velocity. This is because when water flows through the vegetation, momentum and energy are lost, as the drag exerted by vegetation results in decreased flow speed.
Numerical experiments conducted in the wetland were used to investigate the effect of different plant densities on currents. For the experiments the Phragmites communis and the Suaeda heteroptera density were doubled to 130 and 400 stems m−2, respectively, and compared with the currents in the absence of vegetation. As shown in Figure. 16, when there is no vegetation, the flow velocities are higher in the wetland. When the density of Phragmites communis was increased from 65 to 130 stems m−2 and the density of Suaeda heteroptera was increased from 200 to 400 stems m−2, the experimental maximum flow velocity in Suaeda heteroptera and Phragmites communis areas decreased by 19 and 6 %, respectively. It is clear that the flow velocity in the wetland decreases with higher vegetation densities, and that there is a negative correlation between currents and vegetation densities.
It is generally acknowledged that the Liao River estuary is a salt marsh area; therefore the impact of vegetation on water depth and salinity is tested in this paper. Figure 17 presents a time series of water depth and salinity in vegetated and non-vegetated experiments at G2. It can be seen that the effects of vegetation on the water depth and salinity in the wetland domain are not obvious. This is because the tidal wave is a long wave, which has no evident effect on the water depth or the salinity of wetland domains.
Based on measured and simulated salinity data from Liao River estuary during the spring tide from 26 to 27 July 2017, five stations were selected in the Pink Beach wetland (from upstream to downstream) as shown in Figure. 11. This was done in order to analyse the longitudinal distribution of salinity in the tidal cycle under the same runoff conditions. The simulated salinity data for several stations along the Liao River from the entrance are given in Figure 18. It can be noted that the salinity concentration at P1 upstream is far lower than that of P5 downstream. The salinity concentration in the river can consequently be seen to increase from upstream to downstream; this is owing to the fact that as dilution by fresh water from upstream increases, salinity decreases. During the ebb tide, negative tide levels occur with dry domains being noted at locations G1, G2, P3 and P5. Hence, the salinity concentrations show gaps for this period. The influence of runoff variation on the salinity distribution of G1 and G2 in the Pink Beach wetland was analysed under different respective runoff conditions: 0, 30, 101, 285 and 450 m3 s−1. As depicted in Figure 19, the salinity concentration at Pink Beach for 0 m3 s−1 is significantly higher than the salinity under other runoff conditions. The salinities of G1 and G2 both reach about 32.78 psu at 0 m3 s−1; the salinity of G1 and G2 decrease to about 7.26 and 16.7 psu. respectively, at 101 m3 s−1; whilst at 450 m3 s−1, the salinity concentration of G1 is only 2 psu, and the salinity concentration of G2 is about 5.66 psu. The impact of discharge on the salinity distribution of the Liao River estuary is fairly remarkable. During the wet season, due to higher water discharge, salinity concentrations at G1 and G2 are relatively low. During the dry season, however, the flux of fresh water discharged into Pink Beach wetland declines substantially, which leads to enhanced saltwater intrusion. The distributions of salinity during the period of strongest saltwater intrusion under different runoff conditions are presented in Figure. 20. It can be observed that, driven by the different runoff, high salinity is mainly concentrated seawards and lower salinity is confined to the upper reach of the Liao River. Therefore, the larger the river discharge, the stronger the runoff diluting effect.
In this study, the MIKE 21 model is used to simulate the hydrodynamic characteristics and salinity transport processes in the Pink Beach wetlands of the Liao River estuary. The model couples hydrodynamic and salinity modules with the salt marsh plant effects. The spatial discretization of the primitive equations is performed using a cell-centred finite volume method in the horizontal plane with an unstructured grid of triangular elements. Landsat images are applied to differentiate the wetland vegetation types in the study region. Based on the obvious spectral distinction of vegetation, a decision tree containing a number of decision rules is designed to classify different types of vegetation cover; the Liao River estuary is classified into water body, shoal, and major wetland vegetation types, (e.g. Phragmites communis and Suaeda heteroptera).
The model is tested by simulating the water level, tidal current and salinity concentration in Liao River estuary, and the results are consistent with the measured data. The tidal flats are periodically exposed above the surface of the water in the study area. Numerical predictions indicate that vegetation imposes a significant influence on flow dynamics. The existence of vegetation is associated with lower flow velocities, as vegetation can modify the flow structure and lead to energy dissipation. By analysing the longitudinal variation of salinity in the Pink Beach wetland, we found that salinity gradually increased from upstream to downstream. The effect of runoff on salinity distributions in the wetland is fairly distinct. When the river discharge is low, less freshwater is mixed into the system and salinity is higher. These results are important for understanding wetland dynamics and salinity transport processes. Furthermore, they contribute to an improved comprehension of suitable circumstances for vegetation growth in the Pink Beach wetland. More generally, this study can provide an important scientific basis for wetland conservation and restoration.
The research data are provided in the Supplement.
The supplement related to this article is available online at: https://doi.org/10.5194/os-14-437-2018-supplement.
The authors declare that they have no conflict of interest.
This work was supported by the National Natural Science
Foundation of China (51779039), the Wetland Degradation and Ecological
Restoration Program of Panjin Pink Beach (PHL-XZ-2017013-002), the Fund of
Liaoning Marine Fishery Department (201725), the Open Fund of the State Key
Laboratory of Hydraulics and Mountain River Engineering (SKHL1517).
Edited by: John M. Huthnance
Reviewed by: two anonymous referees
Abu-Bakar, A., Ahmadian, R., and Falconer, R. A.: Modelling the transport and decay processes of microbial tracers in a macro-tidal estuary, Water Res., 123, 802–824, 2017.
Andrews, S. W., Gross, E. S., and Hutton, P. H.: Modeling salt intrusion in the San Francisco Estuary prior to anthropogenic influence, Cont Shelf Res., 146, 58–81, 2017.
Barbier, E. B., Koch, E. W., Silliman, B. R., Hacker, S. D., Wolanski, E., Primavera, J., Granek, E. F., Polasky, S., Aswani, S., Cramer, L. A., Stoms, D. M., Kennedy, C. J., Bael, D., Kappel, C. V., Perillo, G. M. E., and Reed, D. J.: Coastal ecosystem-based management with nonlinear ecological functions and values, Science, 18, 321–323, 2008.
Bouma, T., Vries, M., Low, E., Kusters, L., Herman, P., Tánczos, I., Temmerman, S., Hesselink, A., Meire, P., and Regenmortel, S.: Flow hydrodynamics on a mudflat and in salt marsh vegetation: identifying general relationships for habitat characterizations, Hydrobiologia, 540, 259–274, 2005.
Chow, V. T.: Open-channel hydraulics, McGraw-Hill, New York, 1959.
Christiansen, T., Wiberg, P. L., and Milligan, T. G.: Flow and sediment transport on a tidal salt marsh surface, Estuar. Coast. Shelf S., 50, 315–331, 2000.
Coppin, P. and Bauer, M.: Processing of multitemporal Landsat TM imagery to optimize extraction of forest cover change features, IEEE T. Geosci. Remote, 32, 918–927, 1994.
Cox, B. A.: A review of currently available in-stream water-quality models and their applicability for simulating dissolved oxygen in lowland rivers, Sci. Total Environ., 314–316, 335–377, 2003.
DeFries, R.: Terrestrial vegetation in the coupled human-earth system: contributions of remote sensing, Annu. Rev. Env. Resour., 33, 369–390, 2008.
DHI Software: Mike 21 flow model: hydrodynamic module scientific documentation, Denmark Hydraulic Institute, 2007.
Feng, K. and Molz, F. J.: A 2-D, diffusion-based, wetland flow model, J. Hydrol., 136, 230–250, 1997.
Gu, F. F.: Study on Resistance Coefficient of Reeds and Numerical Simulation of flow in Wetland, PhD thesis, Dalian University of Technology, Dalian, 2006.
He, Q., Zhou, G., Zhou, L., and Wang, Y.: Aerodynamic parameters and their affecting factors over Panjin reed wetland, Chin. J. Appl. Ecol., 19, 481–486, 2008.
Helmiö, T.: Unsteady 1D flow model of a river with partly vegetated floodplains–application to the Rhine River, Environ. Modell. Softw., 20, 361–375, 2005.
Hu, K., Chen, Q., and Wang, H.: A numerical study of vegetation impact on reducing storm surge by wetlands in a semi-enclosed estuary, Coast. Eng., 95, 66–76, 2014.
Hunter, P. D., Gilvear, D. J., Tyler, A. N., Willby, N. J., and Kelly, A.: Mapping macrophytic vegetation in shallow lakes using the Compact Airbone Spectrographic Imager (CASI), Aquat Conserv., 20, 717–727, 2010.
Ikeda, S. and Kanazawa, M.: Three-dimensional organized vortices above flexible water plants, J. Hydraul. Eng., 122, 634–640, 1996.
Jiang, T. T., Pan, J. F., Pu, X. M., Wang, B., and Pan, J. J: Current status of coastal wetlands in China: Degradation, restoration, and future management, Estuar. Coast. Shelf S., 164, 265–275, 2015.
Lapetina, A. and Sheng, Y. P.: Three-Dimensional Modeling of Storm Surge and Inundation Including the Effects of Coastal Vegetation, Estuar Coast., 37, 1028–1040, 2014.
Li, H., Ye, S., Ye, J., Fan, J., Gao, M., and Guo, H.: Baseline survey of sediments and marine organisms in Liaohe Estuary: Heavy metals, polychlorinated biphenyls and organochlorine pesticides, Mar. Pollut. Bull., 114, 555–563, 2017.
Li, Y. and Zhao, M.: Experimental studies of hydrodynamics in vegetated river flows – Vertical profiles of velocity, shear velocity and Manning roughness, J. Hydrodyn., 19, 515–519, 2004.
Munyati, C.: Wetland change detection on the Kafue Flats, Zambia, by classification of a multitemporal remote sensing image dataset, Int. J. Remote Sens., 21, 1787–1806, 2000.
Padman, L.: Tide Model Driver (TMD) Manual, Earth & Space Research, Version1.2, 2005.
Ree, W.: Retardation Coefficients for Row Crops in Diversion Terraces, American Society of Agricultural and Biological Engineers, St. Joseph, Michigan, 78–80, 1958.
Shi, Z.: A flume study on mean velocity profiles of flow in a coastal saltmarsh canopy, Ocean Eng., 19, 51–59, 2001.
Stark, J., Meire, P., and Temmerman, S.: Changing tidal hydrodynamics during different stages of eco-geomorphological development of a tidal marsh: A numerical modeling study, Estuar. Coast. Shelf Sci., 188, 56–58, 2017.
Su, Y. T., Hock, L. K., Donald, L. D., and Mike, T.: Interaction between salinity intrusion and vegetation succession: A modeling approach, Theor. Appl., 3, 032001, https://doi.org/10.1063/2.1303201, 2013.
Sun, D. T., Wan, Y. S., and Qiu, C.: Three-dimensional model evaluation of physical alteration of the Caloosahatchee River and Estuary: Impact on salt transport, Estuar. Coast. Shelf S., 173, 16–25, 2016.
Temmerman, S., Meire, P., Bouma, T., Herman, P., Ysebaert, T., and De, H.: Ecosystem-based coastal defence in the face of global change, Nature, 504, 79–83, 2013.
Ustin, S. and Gamon, J.: Remote sensing of plan functional types, New Phytol., 186, 795–816, 2010.
Wang, J., Ye, S., Edward, A. L., Yuan, H., Ding, X., and Zhao, G.: Surface sediment properties and heavy metal pollution assessment in the Shallow Sea Wetland of the Liaodong Bay, China, Mar. Pollut. Bull., 120, 347–354, 2017.
Wang, Q. G., Li, S. B., Jia, P., Qi, C. J., and Ding, F.: A review of surface water quality models, Sci. World J., 2013, 231768, https://doi.org/10.1155/2013/231768, 2013.
Wilson, C. A. M. E., Yagci, O., Rauch, H. P., and Olsen, N. R. B.: 3D numerical modelling of a willow vegetated river/floodplain system, J. Hydrol., 327, 13–21, 2006.
William, R.: Computational hydraulics: Elements of the Theory of Free Surface Flows, Coast. Eng., 3, 278, 1979–1980.
Yuan, J. G., Niu, Z., and Wang, X. P.: Atmospheric correction of hyperion hyperspectral image based on FLAASH, Spectrosc. Spect. Anal., 29, 1181–1185, 2009.
Zhang, M. L., Li, C. W., and Shen, Y. M.: Depth-averaged modeling of free surface flows in open channels with emerged and submerged vegetation, Appl. Math Model., 37, 540–553, 2013.
Zhang, X. L., Zhang, Z. H., Gu, D. Q., Xu, Z. J., and Ye, S.: Research on evolution of coastal wetlands in Liaohe River Delta, Ecology and Environmental Sciences, 18, 1002–1009, 2009 (in Chinese).
Zhang, S. W., Yan, F. Q., Yu, L. X., Bu, K., Yang, J. C., and Chang, L. P.: Application of Remote Sensing Technology to Wetland Research, Scientia Geographica Sinica, 33, 1406–1410, 2013 (in Chinese).
pink beachlandscape. The MIKE 21 model is used to simulate the hydrodynamic characteristics and salinity transport processes in this region. The results of this study are important for furthering the understanding of suitable circumstances for vegetation growth in the Pink Beach wetlands.