the Creative Commons Attribution 4.0 License.
the Creative Commons Attribution 4.0 License.
 | 13 Feb 2025
Impact of extratropical cyclones on coastal circulation in a semi-enclosed bay within the Humboldt Current System
Josse Contreras-Rojas
Piero Mardones
Marcus Sobarzo
This study examines the hydrodynamic response of the Gulf of Arauco, a semi-enclosed bay within the Humboldt Current System, to the passage of extratropical cyclones and their associated changes in wind patterns during the austral winter. Characterization of these cyclones over central Chile and their effect on the gulf's meridional wind was conducted using ERA5 atmospheric pressure fields in conjunction with a cyclone tracking algorithm. The hydrodynamic response was assessed through acoustic Doppler current profiler (ADCP) observations at two strategic sites, providing valuable insights into the currents at the gulf's connections with the open ocean. Measurements were conducted from July to September 2016 and May to July 2018. Additionally, the main modes of subtidal current variability were compared with the local wind through coherence wavelets, revealing a direct influence of cyclones on the modulation of the gulf's currents. Our findings suggest that intense northerly wind events, associated with the passage of extratropical cyclones, can cause surface water transport into the gulf, accumulating at the gulf's head. This would result in a pronounced pressure gradient, driving a water outflow through both connections with the open ocean, thereby altering the coastal circulation patterns. As the northerly wind decreases, the surface inflow in the northwest region attenuates, allowing the water to exit at shallower depths. This mechanism suggests cyclones play a vital role in renewing the waters of semi-enclosed bays such as the Gulf of Arauco, potentially reducing the water residence times. Consequently, these insights provide a broader understanding of wind-driven coastal dynamics, highlighting their significant impacts on marine ecosystems and coastal management in similar semi-enclosed bays globally. By contributing to the broader knowledge of the interaction between atmospheric and oceanic processes in coastal regions, this research offers a comparative perspective applicable to other regions affected by similar atmospheric phenomena.
- Article
(8626 KB) - Full-text XML
- BibTeX
- EndNote


Eastern boundary upwelling systems (EBUSs; Bakun and Nelson, 1991) are recognized as areas with some of the highest primary productions in the global ocean (Arístegui et al., 2009; Checkley and Barth, 2009; Montecino and Lange, 2009; Hutchings et al., 2006). These ecosystems thrive thanks to the equatorial winds that allow subsurface cold waters to rise to the surface, bringing essential nutrients to support marine life (Ekman, 1905). Within these regions, semi-enclosed bays further accentuate biological productivity due to their ability to retain nutrient-rich waters (Yannicelli et al., 2006; Vander Woude et al., 2006). These water bodies serve as a refuge for marine biota and foster the growth of important coastal cities such as San Francisco, Lisbon, Vigo, Cape Town, Valparaíso, and Concepción (Largier, 2020). Notably, many of these semi-enclosed bays are located between 30 and 60° latitudes in both hemispheres, where meteorological conditions contributing to wind-induced upwelling are not present throughout the year (Rahn and Garreaud, 2014; Chavez and Messié, 2009). Instead, these regions experience high seasonal variability, with wet or stormy seasons occasionally presenting conditions drastically different from those favoring upwelling, thus impacting the typical upwelling dynamics and, consequently, the marine ecosystems they sustain (García-Reyes and Largier, 2012).
Positioned within the mid-latitudes of the eastern Pacific Ocean (36°45′ and 37°20′ S), the Gulf of Arauco (GA) stands as one of the most significant semi-enclosed bays along the coast of Chile. The GA spans an area of approximately 1300 km2, making it one of the largest north-facing bays on the Humboldt Current System. Due to its location and geography, the GA accounts for some of the highest levels of primary production estimated in Chile (Daneri et al., 2000), making it a vital spawning and recruitment area for commercially and ecologically important fish species (Landaeta and Castro, 2006; Hernández et al., 2011). Given its location, atmospheric conditions favorable to wind-induced upwelling exhibit marked seasonal variability, being more frequent during the austral spring and summer months (Rahn and Garreaud, 2014). This annual cycle arises predominantly from the influence of the South Pacific anticyclone, characterized by its meridional migration throughout the year. As the anticyclone moves southward towards summer, southerly winds become more prevalent, leading to intense upwelling events (Rahn and Garreaud, 2014; Strub et al., 1998). Conversely, the anticyclone's northward shift during the austral winter exposes the region to transient large-scale low-pressure systems, known as extratropical cyclones, which typically bring strong northerly winds, heavy rainfall, and abrupt changes in pressure (Falvey and Garreaud, 2007; Saavedra and Foppiano, 1992). These systems are named for their wind circulation patterns and the latitude of their trajectory (Holton, 1973).
In addition to extratropical cyclones, other low-pressure systems can also influence the Chilean coast, including coastal lows, cut-off lows, and subtropical cyclones, each with distinct characteristics. Coastal lows are shallow, warm-core low-pressure systems that form near the coast when migratory anticyclones approaching southern Chile (∼40° S) generate a poleward pressure gradient and an offshore component in the low-level winds (Garreaud et al., 2002). These systems are short-lived (1–2 d) and primarily confined to the nearshore, with limited influence on large-scale circulation (Garreaud et al., 2002; Crespo et al., 2022). Cut-off lows are upper-level systems formed by the detachment of a trough from the westerly jet stream, creating isolated cold-core vortices that can persist for several days, primarily impacting upper atmospheric dynamics and precipitation patterns in central Chile (Fuenzalida et al., 2005). Subtropical cyclones, although extremely rare in the southeastern Pacific, exhibit hybrid characteristics of tropical and extratropical systems (Gozzo et al., 2014). However, the cold waters and high wind shear in the Humboldt Current System make their formation near Chile extremely rare, with only a few unofficial cases documented. Unlike cut-off lows, which primarily affect upper-level dynamics, or coastal lows, which are generally limited to weak winds at the coast, extratropical cyclones have a much greater potential to impact local atmospheric conditions near the sea surface. Therefore, this study focuses on extratropical cyclones, as they are likely the most significant low-pressure systems driving atmospheric and hydrodynamic changes in the GA during winter.
At a broader scale, extratropical cyclones play a critical role in the distribution of energy, momentum, and moisture across the atmosphere (Jones and Simmonds, 1993; Catto, 2016). The systems relevant to this study usually originate around the central South Pacific and follow a trajectory from west to east, primarily driven by strong temperature and moisture gradients (Simmonds and Keay, 2000; Catto et al., 2010; Reboita et al., 2015). Some studies have identified a predominant concentration of cyclonic activity roughly between latitudes 30 and 50° S, stretching from 90° W to the western coast of South America (Mendes et al., 2010; Reboita et al., 2021; Crespo et al., 2022). In this zone, extratropical cyclones occur more frequently during the austral winter months (Simmonds and Keay, 2000; Crespo et al., 2022). Their lifetime, however, shows little seasonality, typically lasting 2–3 d throughout most of the year (Mendes et al., 2010). The strong winds and heavy rain associated with extratropical cyclones can disrupt air and sea transport, cut off power supplies, and cause storm surges, leading to significant socioeconomic repercussions, particularly in coastal regions (Catto et al., 2010; Bitencourt et al., 2011; Colle et al., 2015; Gómez et al., 2021; Reboita et al., 2021).
The increased focus on studying the extreme characteristics of extratropical cyclones seems to have diverted attention from investigating their influence on ocean circulation, an aspect that remains relatively unexplored. In this contribution, we analyze this relationship within an equatorward-facing semi-enclosed bay situated on the western coast of South America. The observed shift in wind direction associated with these events and their higher frequency during austral winter suggest a likely change in the circulation patterns inside the GA during this season (Sobarzo et al., 2022). However, the majority of research on the GA has been conducted during the upwelling season (Djurfeldt, 1989; Letelier et al., 2009; Sobarzo et al., 2001; Parada et al., 2001; Valle-Levinson et al., 2003). As a result, winter studies are scarce and generally centered on the hydrography of bays within the GA (Faundez-Baez et al., 2001), on processes associated with the Biobío submarine canyon (Sobarzo et al., 2001, 2016), or on the impact of Biobío River discharges (Vergara et al., 2023), thereby leaving a notable gap in the understanding of the hydrodynamic behavior of the GA during winter.
This study seeks to address the existing knowledge gap regarding the winter hydrodynamics within the GA, mainly focusing on the circulation patterns influenced by the strong northerly winds during the passage of extratropical cyclones. By analyzing observational and reanalysis data collected over two winter periods, the study aims to clarify the relationship between meteorological conditions and circulation dynamics in this semi-enclosed bay. Furthermore, the work explores the interplay between atmospheric phenomena and coastal circulation, providing a deeper understanding of winter dynamics in the GA. The findings intend to provide a more comprehensive insight into the annual cycle of this region. Ultimately, these results have the potential to inform and improve decision-making in this ecologically significant region, thereby contributing to a more sustainable management of its maritime and biological resources. By extending these insights to other regions with similar geographical and meteorological conditions, this research offers a comparative perspective on the interaction between atmospheric and oceanic processes in semi-enclosed bays globally. Understanding these dynamics is crucial not only for the GA but also for other coastal areas within the Humboldt Current System and similar ecosystems worldwide. Consequently, the findings of this study can support the development of more effective environmental and marine management strategies in regions experiencing similar atmospheric phenomena, contributing to the broader knowledge and sustainable management of coastal ecosystems.
The paper is organized as follows: a brief context of the GA is provided in Sect. 2. The various datasets, the cyclone detecting algorithm, and their associated methodology are detailed in Sect. 3. Our main results are described in Sect. 4. Section 5 discusses these results and proposes a response mechanism to the passage of extratropical cyclones. Finally, Sect. 6 summarizes the key findings of this work.
The GA, located on the west coast of South America, is one of the largest north-facing bays on the Humboldt Current System and the largest semi-enclosed bay in central Chile (30–38° S). Notably, the coastline of the gulf undergoes a distinct shift in orientation, transitioning from a north–south orientation in the eastern region to an east–west direction towards the south (Fig. 1). It receives freshwater input from several rivers, including the Biobío River, one of the largest in Chile.
Santa María Island, at its western extremity, creates two connections with the open ocean: Boca Chica to the west and Boca Grande to the north. Boca Chica, located between Santa María Island and Punta Lavapié, is approximately 9 km long and has an average depth of 20 m. In comparison, Boca Grande boasts an approximate length of 25 km with a maximum depth of 60 m.
The GA's bathymetry is relatively gentle, and depth increases gradually towards the north, where it is harshly interrupted by the Biobío submarine canyon, which reaches up to 1200 m depth (Sobarzo et al., 2016). As a result, the GA is typically divided into two regions: the region south of 37° S with depths less than 50 m, which corresponds to the head of the gulf, and the region north of 37° S with depths between 50 and 500 m, which is more exposed to wind, the Biobío submarine canyon, and oceanic influences.
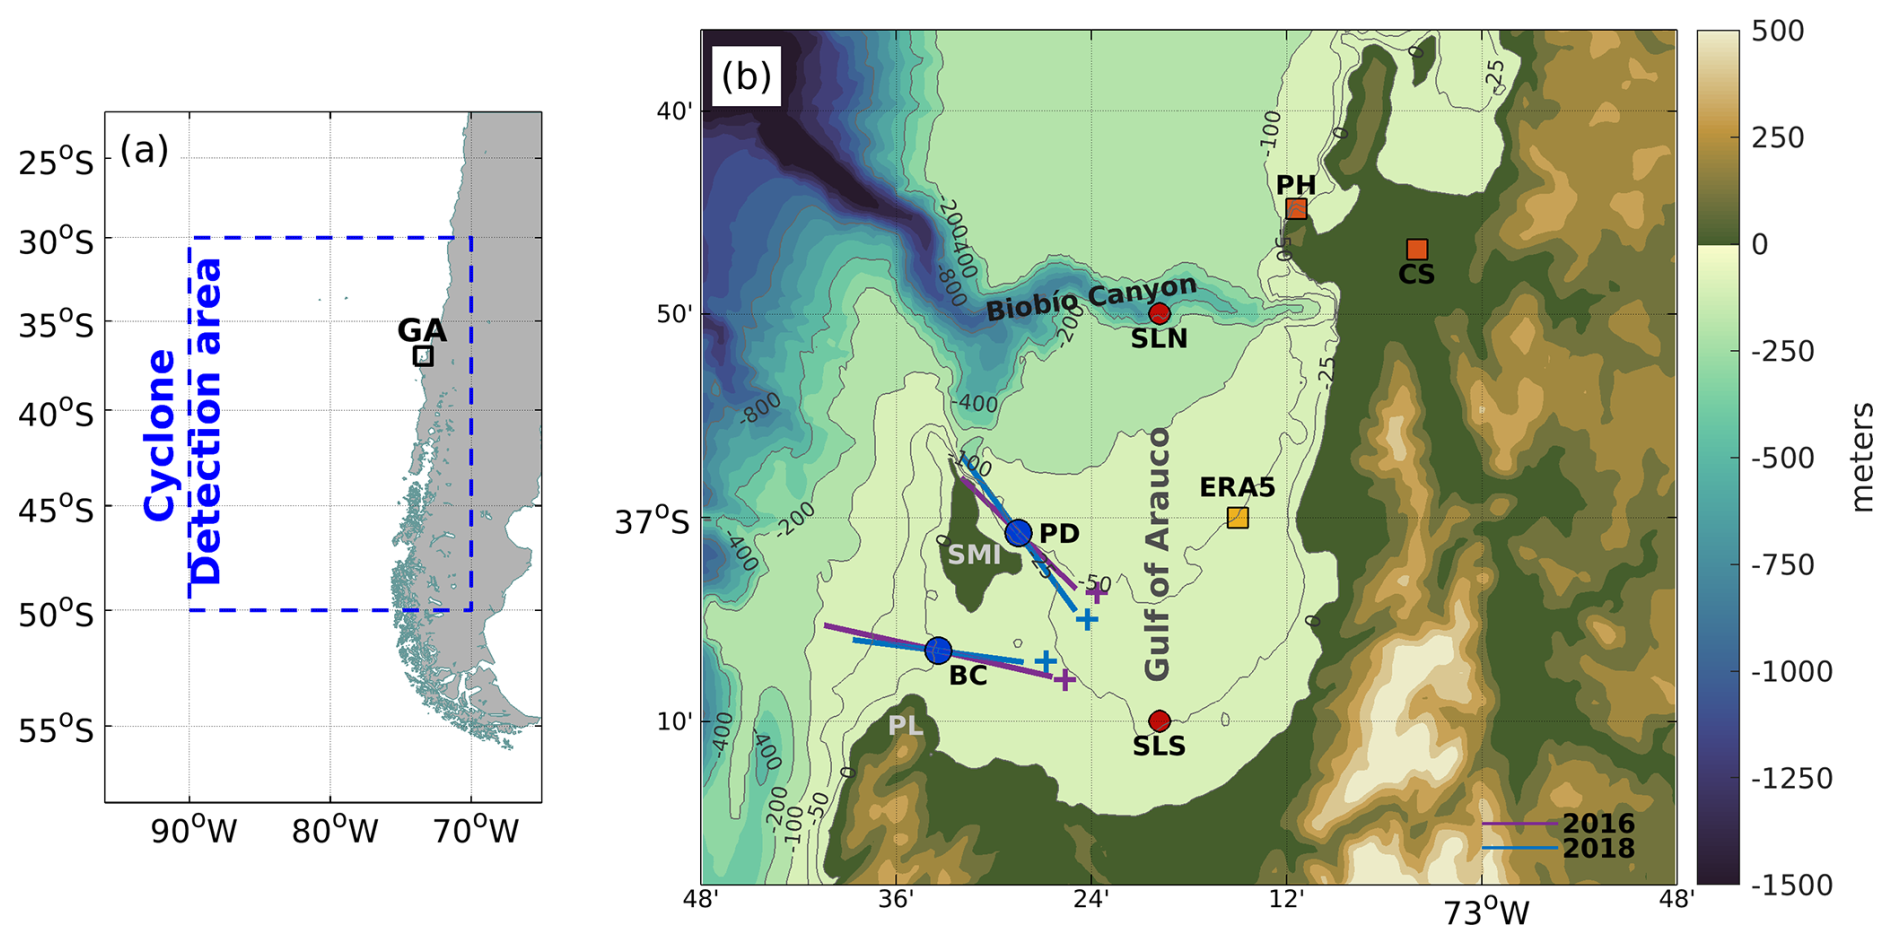
Figure 1(a) Map of the GA on Chile's west coast. The blue rectangle indicates where the trajectories of extratropical cyclones were selected. (b) Locations of meteorological stations (orange squares), acoustic Doppler current profilers (blue circles), reanalysis sea surface height (red circles), and ERA5 reanalysis wind (yellow square). The plus signs show the positive direction of the major principal axis of the currents during 2016 (purple) and 2018 (blue) centered for both locations. The solid gray lines are isobaths, and topography/bathymetry is shown in shaded colors. PL – Punta Lavapié, SMI – Santa María Island, CS – Carriel Sur station, PH – Punta Hualpén station, SLN – sea level north, SLS – sea level south.
The methodology of this study was implemented in two stages. Initially, an analysis of atmospheric data was performed to identify the passage of extratropical cyclones. Subsequently, an examination of the oceanographic response to these atmospheric low-pressure systems was conducted.
3.1 Datasets
The hourly mean fields of meridional winds 10 m above the surface and sea level pressure (SLP) from the ERA5 reanalysis for the period 1979–2020 were used for the identification of extratropical cyclones and the analysis of atmospheric conditions in the area. This reanalysis, produced by the European Centre for Medium-Range Weather Forecasts (ECMWF), is the most recent atmospheric reanalysis product (Hersbach et al., 2020). It combines historical observations, advanced modeling, and data assimilation to provide global-scale gridded data with a 0.25°×0.25° horizontal resolution for many atmospheric and ocean variables for public access. Additionally, local winds and SLP from Punta Hualpén station (36°44′50′′ S, 73°11′24′′ W) and Carriel Sur airport (36°46′50′′ S, 73°3′59′′ W) were used (Fig. 1). Punta Hualpén station data were available every 10 min from 2014 to 2018. Hourly averages were obtained for this study. Data from Carriel Sur were available from 1960 to 2020; however, only the records post-2005 exhibit a consistent hourly frequency.
Current data from two locations were obtained for the austral winter in 2016 and 2018 to analyze the response of the GA to the atmospheric forcing. These data were recorded by upward-looking RDI Workhorse acoustic Doppler current profilers (ADCPs) deployed in BC (37°6′33′′ S, 73°33′25′′ W) and PD (37°0′46′′ S, 73°28′27′′ W) (Fig. 1). The instruments were moored close to the bottom, and data were collected for the period and depths shown in Table 1. Quality control of the raw data showed that the current measurements at BC from 20 to 25 September 2016 exhibited significant errors and were, consequently, excluded from this study. After magnetic correction, hourly average currents were computed and rotated along the major principal axis (MPA; shown in Fig. 1) positive in the direction of the GA. Tidal variability was removed from the currents through harmonic analysis (T_TIDE, Pawlowicz et al., 2002). High frequencies were further filtered out using a 30 h cosine-Lanczos filter.
Table 1Available current data specifications.
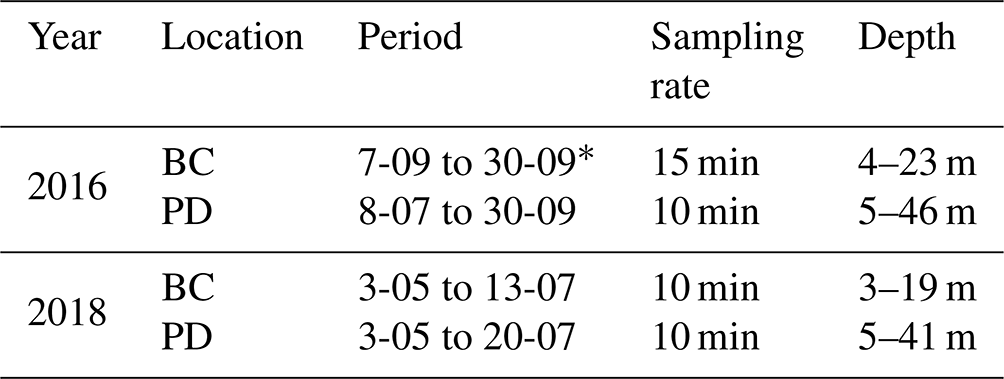
* Data from 20 to 25 September not available.
Two sea surface height series from the GLORYS12V1 reanalysis were used to identify meridional differences in the GA. The GLORYS12V1 reanalysis, produced by the Copernicus Marine Environment Monitoring Service (CMEMS), provides daily and monthly oceanic metrics derived from NEMO ocean simulations, incorporating influences from ECMWF ERA-Interim and ERA5 datasets. It assimilates data from various sources, including satellite and in situ observations, and operates with a horizontal resolution of and 50 vertical levels (Lellouche et al., 2021). While comprehensive, the reanalysis does not include a wave model and therefore does not explicitly account for wave set-up, a process caused by wave breaking near the coast that can contribute to additional variations in sea surface height, particularly in shallow or nearshore areas (Dean and Walton, 2010). Nevertheless, the data primarily reflect wind set-up and other regional-scale processes. The selected data points, as shown in Fig. 1, correspond to the gridded points located at the northernmost (36°50′ S, 73°19′48′′ W) and southernmost (37°10′ S, 73°19′48′′ W) positions within the GA.
3.2 Detection and analysis of extratropical cyclones
The passage of extratropical cyclones over the region was studied using the cyclone detection and tracking algorithm developed by the University of Melbourne (Simmonds and Keay, 2000). It employs pressure fields, such as SLP, to identify low-/high-pressure systems by detecting maxima/minima in the Laplacian of pressure fields (∇2p) on every time step. Afterward, using a three-step statistical process, the algorithm matches the detected low-pressure systems to the ones on previous time steps, creating tracks over time. This algorithm has been widely used in previous studies and effectively detects extratropical cyclones and anticyclones in the Southern Hemisphere (Aguirre et al., 2021; Messmer and Simmonds, 2021; Papritz et al., 2014).
The ERA5 SLP fields were resampled to a 1°×1° spatial grid and a 6 h temporal interval to enhance computational efficiency and better represent the spatial dimensions of extratropical cyclones. The study focused on extratropical cyclones that persisted for over a day within the study region, between 30–50° S and 70–90° W (Fig. 1a). Specific criteria were applied to distinguish extratropical cyclones from other cyclonic patterns identified by the algorithm, such as coastal lows, which are not the focus of this study. To filter out coastal lows, we adopted the methodology proposed by Crespo et al. (2022), which defines coastal lows as cyclonic circulations originating in the coastal region between 20 and 25° S and with trajectories not exceeding 1500 km. Considering evidence from previous studies (Mardones et al., 2022), which report the occurrence of coastal lows at latitudes up to 36° S, we extended this area to include coastal lows originating as far south as 40° S. Lastly, only cyclones with central pressures below 1010 hPa were retained, excluding any sporadic cyclonic patterns potentially flagged by the algorithm.
The fidelity of the ERA5 data with local observations was evaluated by comparing it with measurements from the two meteorological stations described in Sect. 3.1. The compared time series correspond to the point closest to the actual location of the stations. Statistical metrics, such as bias, root mean square error, and the linear temporal correlation coefficient (R), were employed to evaluate the discrepancies between these datasets.
3.3 Analysis of oceanographic conditions
The vertical structure and circulation variability were explored by calculating the subtidal current's empirical orthogonal functions (EOFs) (Halldor and Venegas, 1997). The analysis considered the first two orthogonal modes, as they accounted for over 80 % of the observed subtidal variance in each case. The relationship between these modes and the wind was evaluated using wavelet coherence analyses (Grinsted et al., 2004). For these analyses, the meridional winds of Punta Hualpén were used since they better represented the northerly wind events associated with the passage of extratropical cyclones. A composite analysis was used to better understand how currents respond to winds during extratropical cyclone events. The wind and current data were averaged for all cyclone passing events where the northerly wind exceeded 5 m s−1. The center of each event (marked t0) was identified as the time with the strongest northerly wind within 48 h after the cyclone's appearance in the area. After that, the mean values spanning the 48 h preceding (t0−48) and following (t0+48) this time were computed.
4.1 Wind and sea level pressure assessments
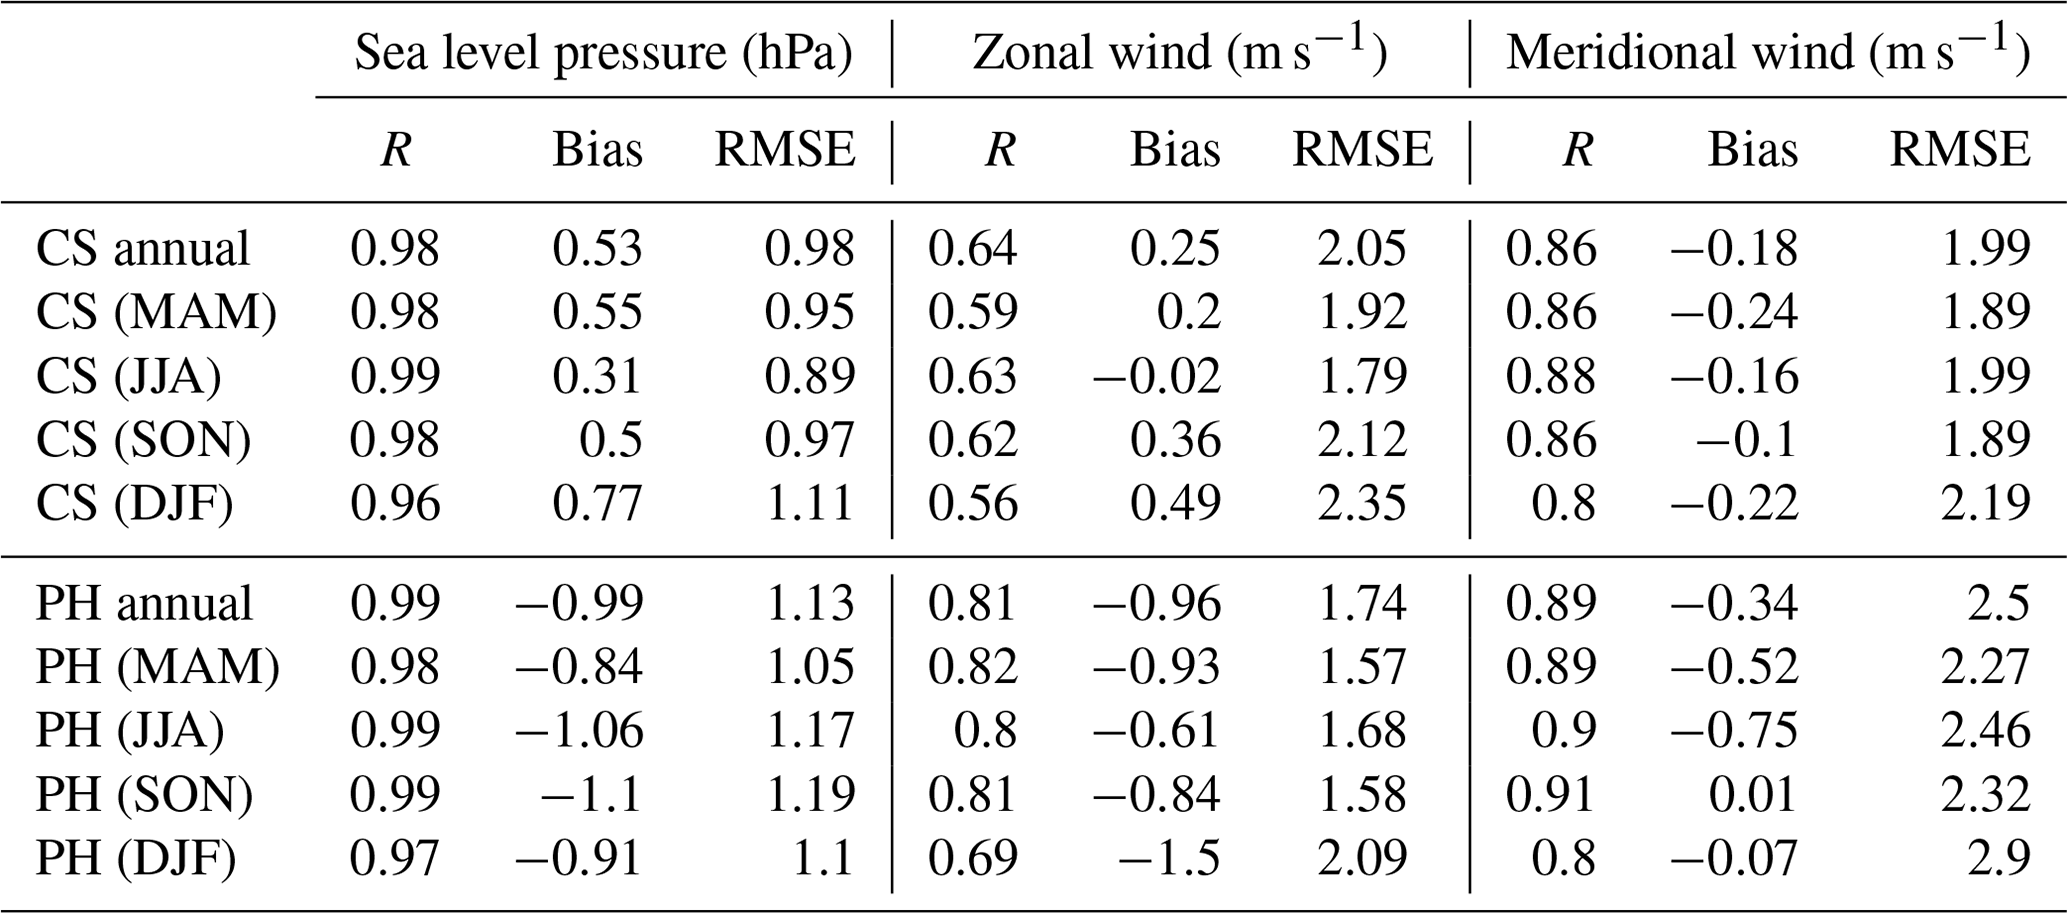
Local atmospheric data and selected time series from ERA5 showed strong agreement in SLP and wind components. Regarding the SLP, the linear correlation between coastal stations (Punta Hualpén and Carriel Sur) and ERA5 consistently exceeds 0.97 throughout the year, highlighting the reliability of this reanalysis for studying extratropical cyclones in the region (Table 2).
Correlation coefficients for Carriel Sur's zonal and meridional winds stand at 0.64 and 0.86, while those at Punta Hualpén registered 0.81 and 0.89, respectively. Austral winter consistently yielded higher correlations than summer across all variables (Table 2). Specifically, for Carriel Sur, this period showed the most favorable bias and RMSE values, particularly for SLP and zonal wind. While meridional wind reveals its lowest bias during spring, the magnitudes of discrepancies remain relatively consistent across all studied seasons.
The negative bias in meridional wind, calculated as observations minus ERA5 data, indicates that ERA5 generally reports higher values (i.e., less negative for negative values and greater for positive values) compared to observations at Carriel Sur and Punta Hualpén. This is primarily due to ERA5's tendency to underestimate the intensity of northerly winds, resulting in less negative values than those observed. For instance, ERA5's most negative values typically range between −15 and −16 m s−1, while observations at Carriel Sur and Punta Hualpén often exceed −20 m s−1 (not shown).
Table 2Comparative statistical analysis of ERA5 data relative to local observations for sea level pressure, zonal wind, and meridional wind. The bias is defined as observations minus ERA5 data, where a negative bias indicates that ERA5 values are greater than those of the observations (i.e., less negative for northerly winds or more positive for southerly winds). CS – Carriel Sur station, PH – Punta Hualpén station.
4.2 Characterization of extratropical cyclones over central Chile and their influence on local wind
Following the criteria detailed in Sect. 3.2, 1599 extratropical cyclones were detected over the study region between 1979 and 2020, with an average of 38±6.7 cyclones per year. Notably, 74 % of these cyclones lasted less than 2 d (Fig. 2a), while fewer than 1 % of these cyclones extended beyond 5 d. Cyclones predominated during the austral winter (May–August), where the monthly average reached 5.3 cyclones per month. In contrast, from September to April, an average frequency of only two cyclones per month was reached (Fig. 2b). Over the past 4 decades, an overall trend of −0.1 cyclones per year was observed, both when considering cyclones throughout the year and when specifically analyzing winter cyclones (Fig. 2c). Nevertheless, there was high variability throughout the time series, with exceptional peaks in 1997 and 2002 and a significant drop during 1998.
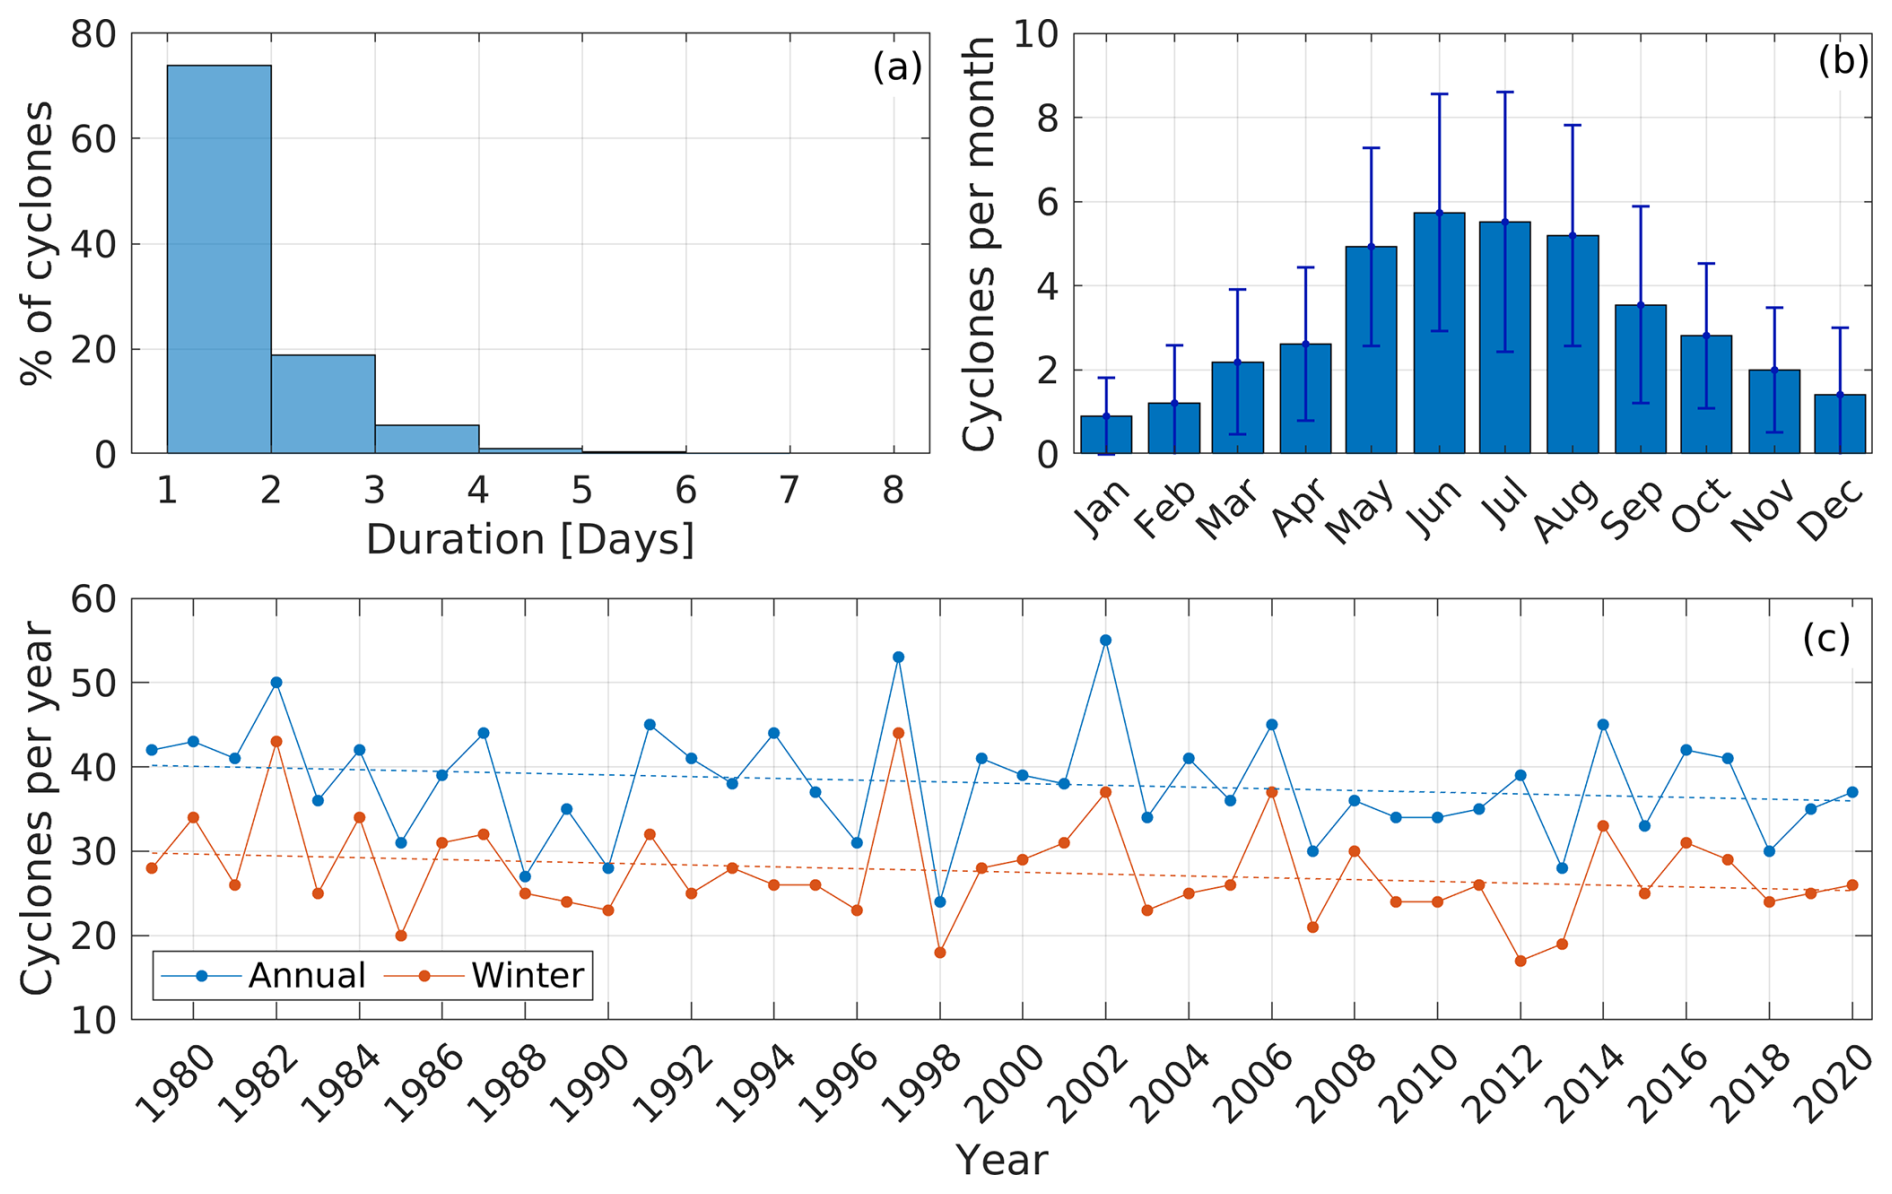
Figure 2(a) Distribution of the duration of cyclones within the study region. (b) Monthly average and standard deviation of cyclones from 1979 to 2020. (c) Total cyclones detected per year (blue) and during the winter (red) of each year. The dashed lines indicate the linear trend of each series.
The concept of northerly windy days (NWDs) is introduced to better understand the influence of extratropical cyclones on local wind patterns, particularly the northerly wind. NWDs represent days when the mean daily speeds of northerly wind exceed a threshold of 5 m s−1. This threshold corresponds to the lower quartile of the overall meridional wind distribution, which indicates the strongest northerly wind events (Fig. 3a). As a result, 2183 NWDs were identified for the 1979–2020 period. Remarkably, 1453 of these days aligned with an extratropical cyclone in the study area, making up 66.5 % of all NWDs (Fig. 3b).
It is also important to mention that cyclonic activity in the cyclone detection area does not always induce northerly winds inside the GA. However, the meridional wind from ERA5 indicated a northerly direction in ∼75 % of the instances when an extratropical cyclone was observed in the study region (Fig. 3c). The remaining ∼25 % predominantly comprised low-intensity southerly winds, with their magnitude concentrated around zero and never surpassing 7 m s−1.

Figure 3(a) Distribution of the negative (northerly) meridional wind speed, highlighted with its mean (solid blue line), median (dashed black line), and lower quartile (dashed red line). (b) Monthly count of days with northerly wind speeds exceeding the negative lower-quartile value (blue). The orange bars represent the days that also coincide with a cyclone's presence over the region. (c) Meridional wind component (ERA5) during cyclonic events in the study area. Positive values represent wind from the south, while negative values indicate wind from the north.
4.3 Subtidal current patterns during winter
Northerly winds of varying magnitudes were observed during most of the detected extratropical cyclone events for both studied periods (Table 1). Most cyclone events were detected before the peak of the northerly wind (Figs. 4a and 5a). This behavior can be attributed to the fact that the detection region starts at 90° W, capturing the cyclones before their peak impact over central Chile.
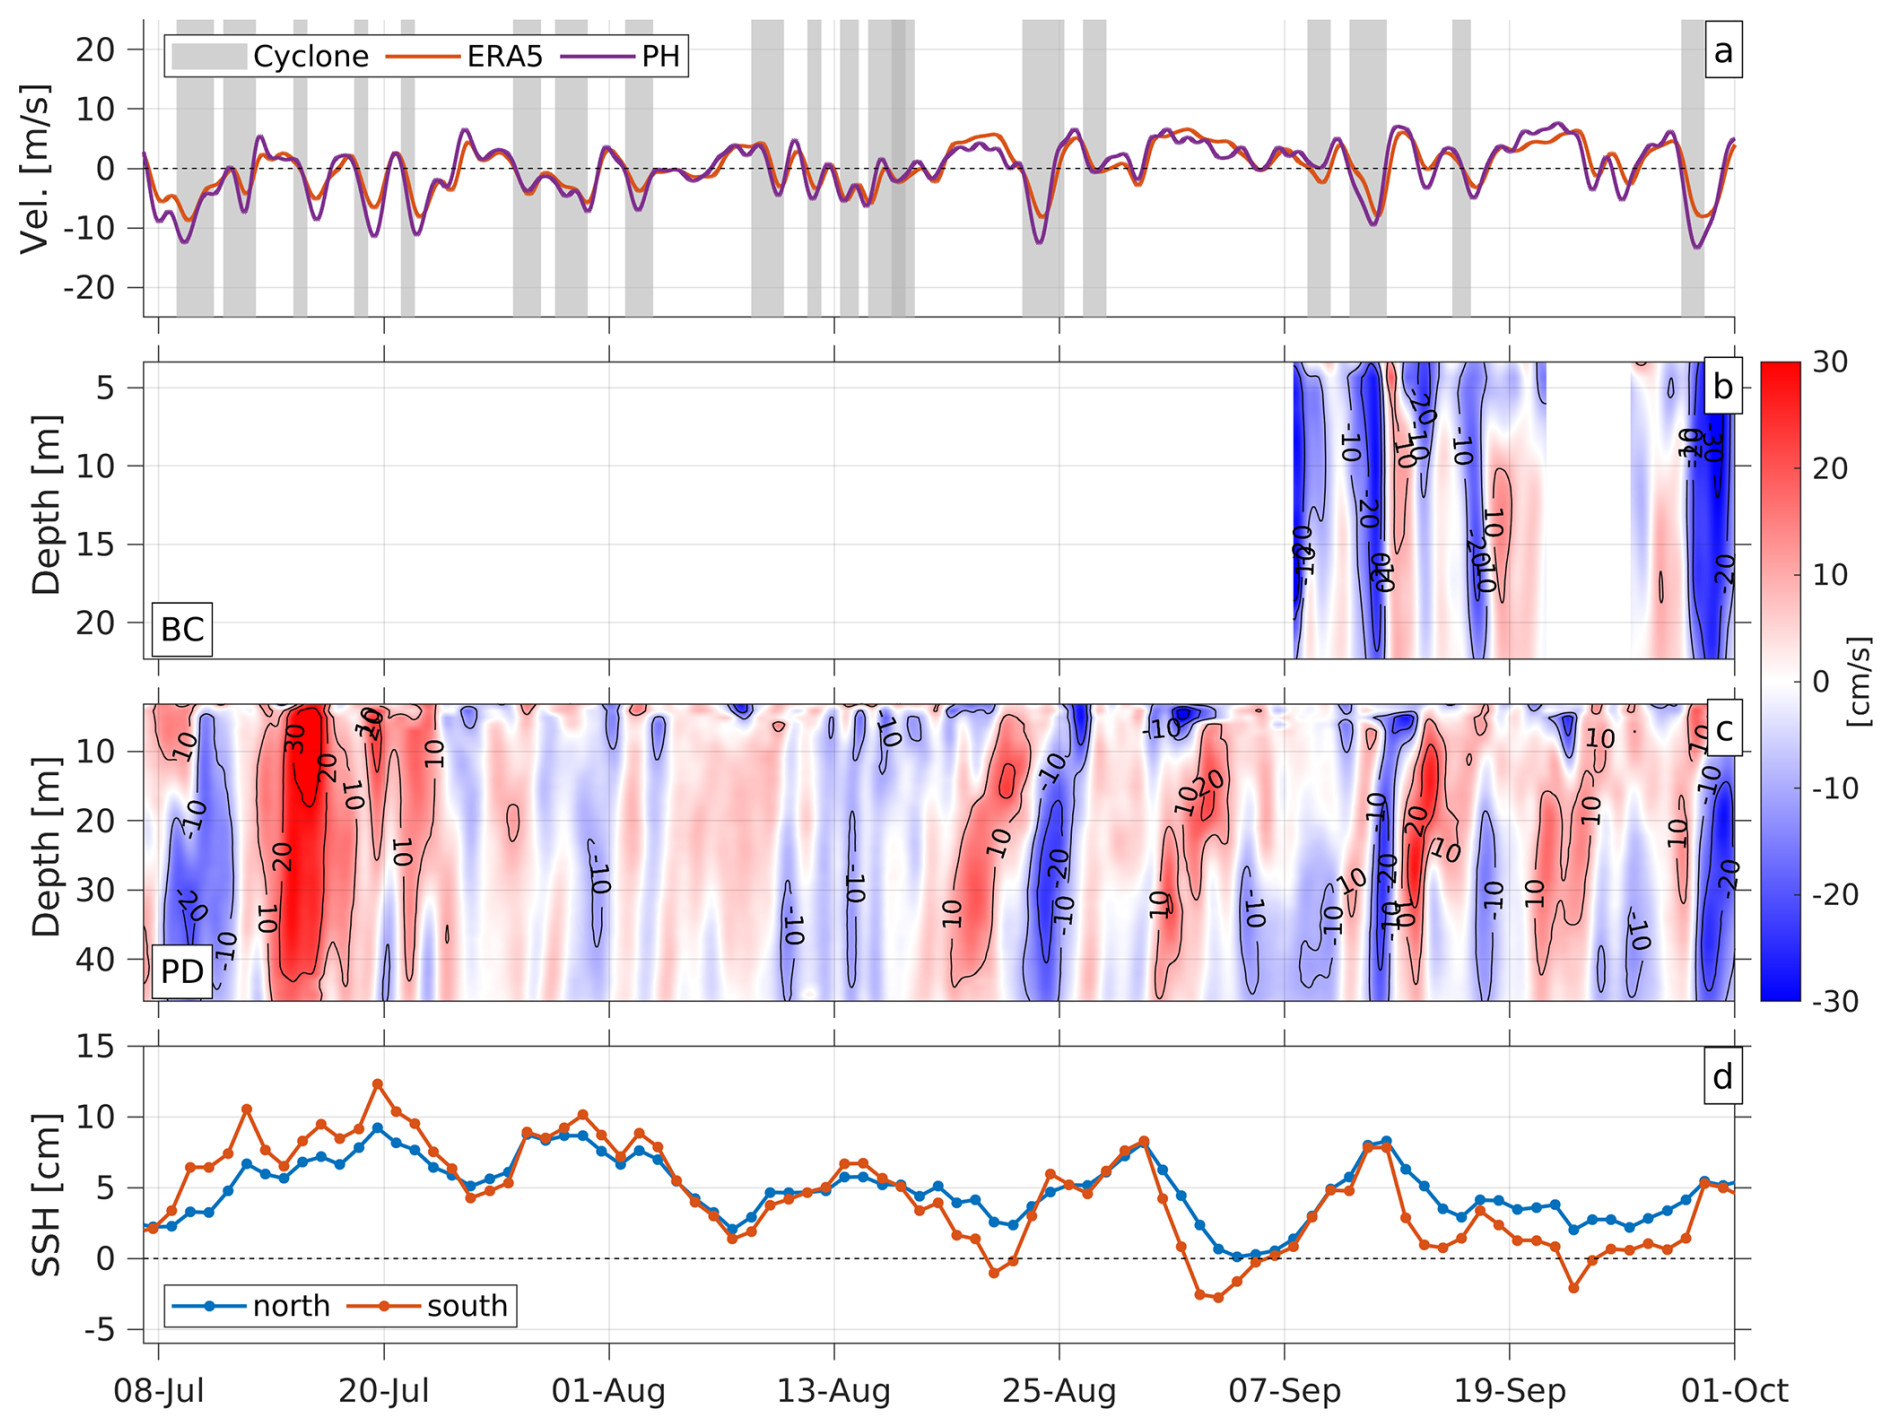
Figure 4Meridional winds (ERA5 and Punta Hualpén) from July to September 2016. The gray-shaded areas depict the passage of extratropical cyclones in the study area. (b) Subtidal currents along the MPA at BC. (c) Subtidal currents along the MPA at PD. Positive values signify inflow into the GA, and negative values represent outflow. (d) Sea surface height at the gulf's south (red) and north (blue).
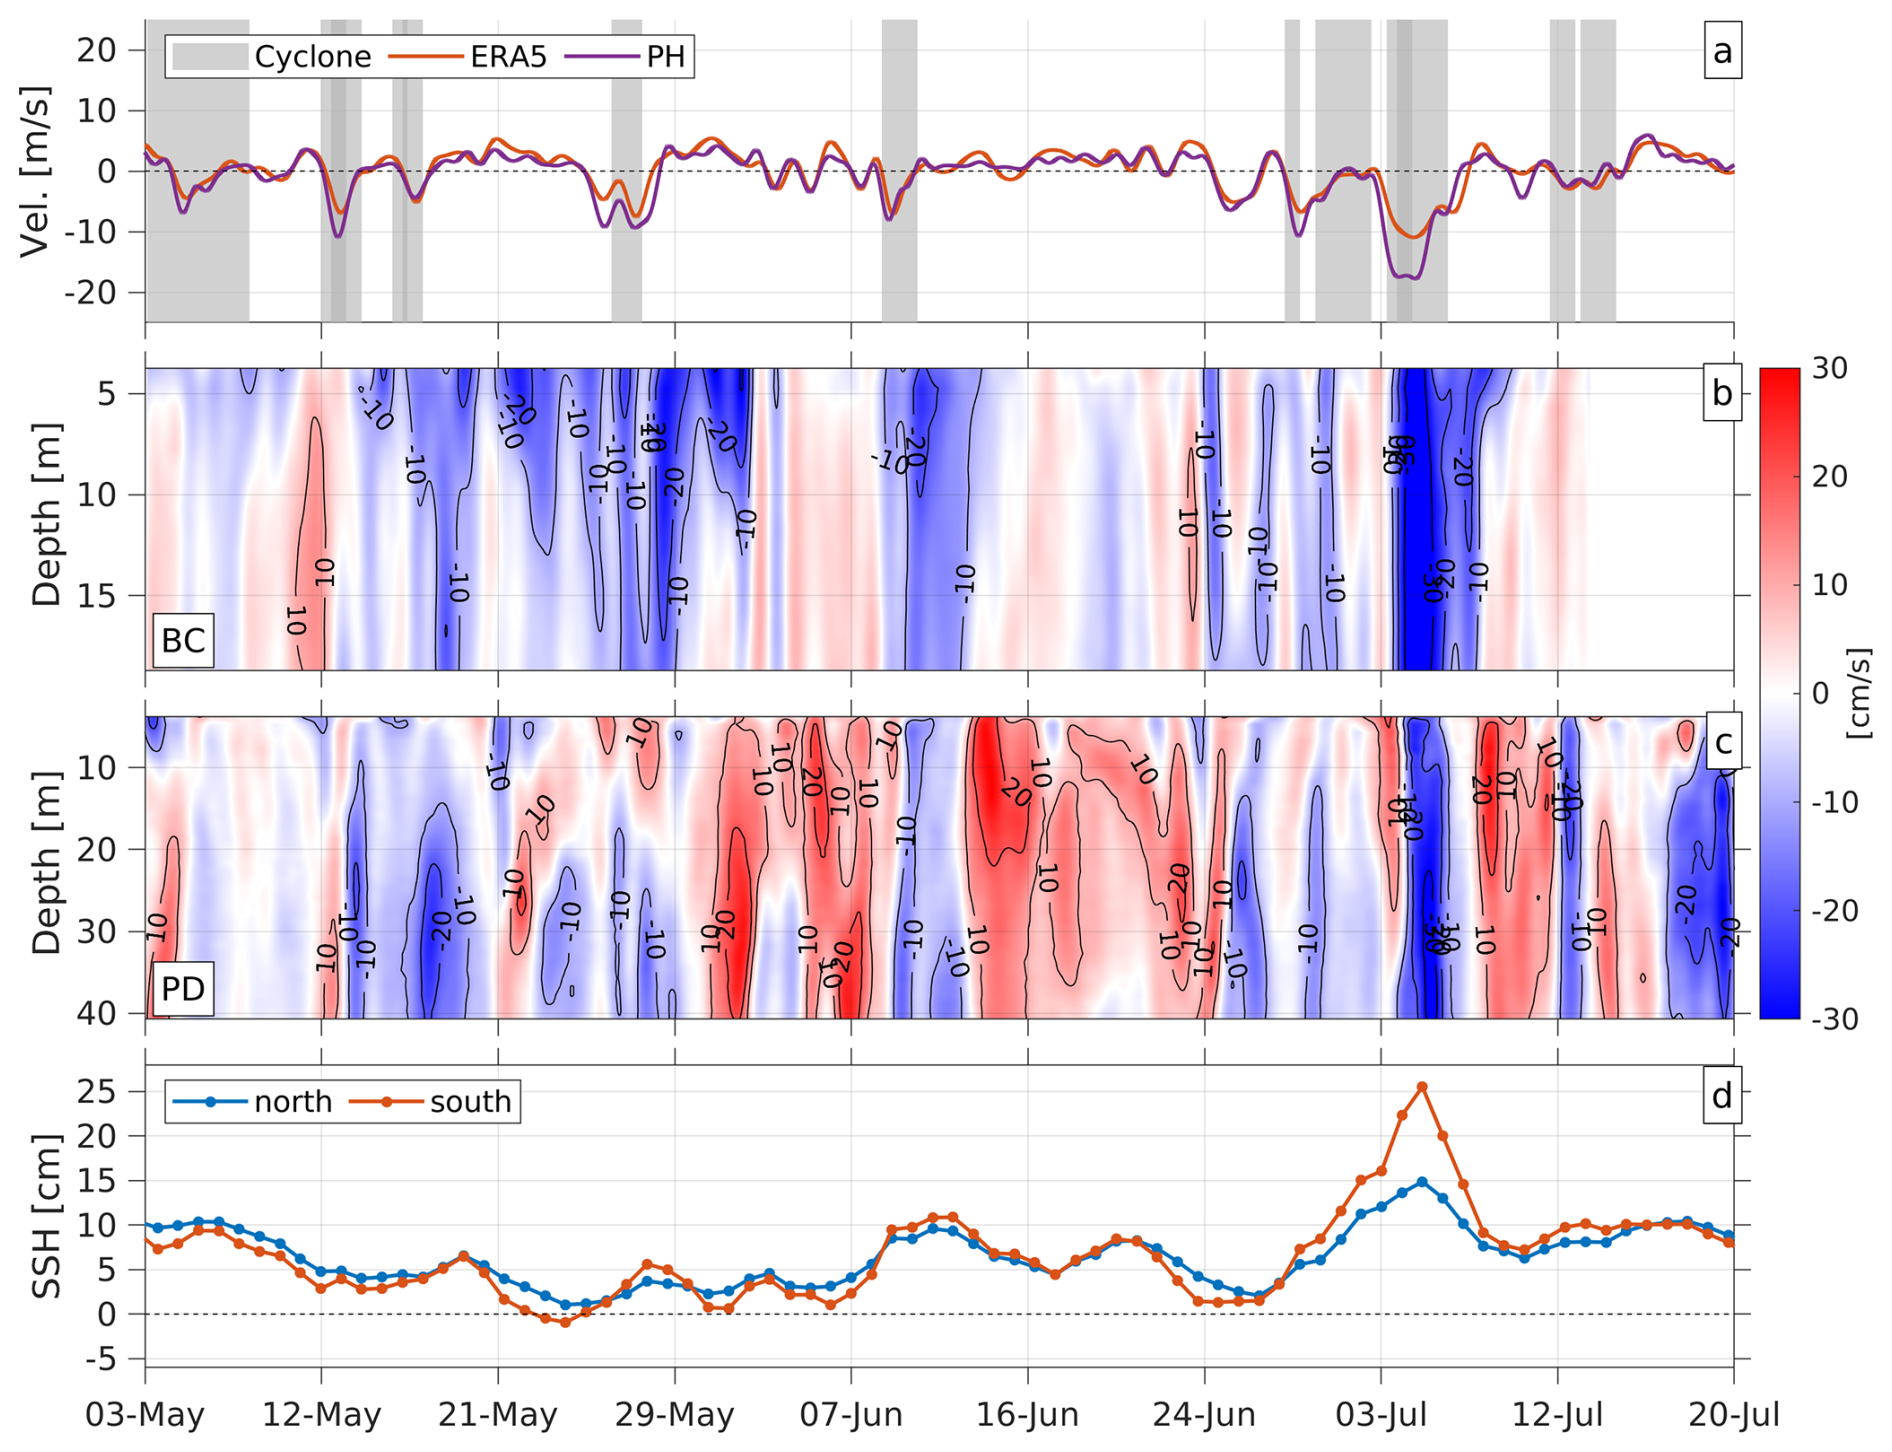
Figure 5Meridional winds (ERA5 and Punta Hualpén) from May to July 2018. The gray-shaded areas depict the passage of extratropical cyclones in the study area. (b) Subtidal currents along the MPA at BC. (c) Subtidal currents along the MPA at PD. Positive values signify inflow into the GA, and negative values represent outflow. (d) Sea surface height at the gulf's south (red) and north (blue).
During 2016, multiple cyclonic events were detected. BC data were only available for a few days in September. However, there was a predominant outflow from the GA with velocities reaching up to 20 cm s−1, coinciding with extratropical cyclones and northerly winds (Fig. 4b). These water outflows, extending throughout the water column, were interrupted by inflow events with velocities not exceeding 10 cm s−1.
PD's current displayed greater variability, alternating between uniform and double-layer behavior throughout the study period (Fig. 4c). This double layer was especially noticeable during the passage of extratropical cyclones where, in most cases, the currents flowed into the GA at the surface and out of the GA through the bottom layer when northerly winds peaked. In some instances, particularly during strong northerly wind events, such as those observed on 8–11 July, 24–26 August, and 28–30 September, this outflow extended across the entire water column, following peak wind events and reaching up to 20 cm s−1, marking the fastest currents during the study period. The proximity of certain extratropical cyclone events impacted the observed structures, particularly evident between 12 and 18 August, where overlapping influences constrained surface inflows to the upper 5 m. Notably, some events presented an opposite pattern, initially showing surface outflows that transitioned into column-wide inflows, like the event observed after 27 August. This is likely due to the absence of northerly wind generated by the passing cyclone (Fig. 4c).
Current data collected during 2018 showed a behavior similar to that observed in 2016. BC predominantly exhibited a single-layer flow, with the most intense currents during outflow from the gulf. Notably, these current intensifications usually begin with or after the peak of the northerly winds produced by extratropical cyclones. In some cases, such as the one observed on 13 May and from 27 to 29 May, a reduction in the magnitude of the current along the MPA can be observed during peak wind events. This reduction is attributed to a directional shift in the currents, causing them to flow southward-southwestward, along the orthogonal axis (not shown) to the one illustrated in Fig. 5b. Similar to 2016, PD currents displayed higher variability than that observed in BC (Fig. 5c). Currents predominantly exhibited a negative direction in conjunction with the presence of cyclones and their associated northerly wind. Conversely, currents flow toward the GA throughout the water column during positive or near-zero wind conditions. During northerly wind events, currents exhibit a dual-layered flow pattern, with currents flowing into the GA at the surface and exiting the GA at the deeper layers. In some instances, as seen on 13 May and from 3 to 7 July, currents tend to move outward throughout the entire water column following the wind peak (Fig. 5c).
Throughout most of these events, sea surface height in the southern region of the GA typically rose higher than that in the northern region, especially from 3 to 8 July. However, during periods without cyclones, this trend was typically reversed, with the northern region showing higher sea surface height than the southern region (Figs. 4d and 5d). This behavior suggests a water accumulation in the head of the GA during these events.
4.4 Relationship between currents and winds induced by extratropical cyclones
A standard vertical EOF analysis of subtidal currents was made before determining a statistical relation between the currents and the northerly winds driven by extratropical cyclones. The vertical EOF calculated with BC and PD currents exhibited similar behavior during the two studied periods, with a first single-layer mode and a second double-layer mode.
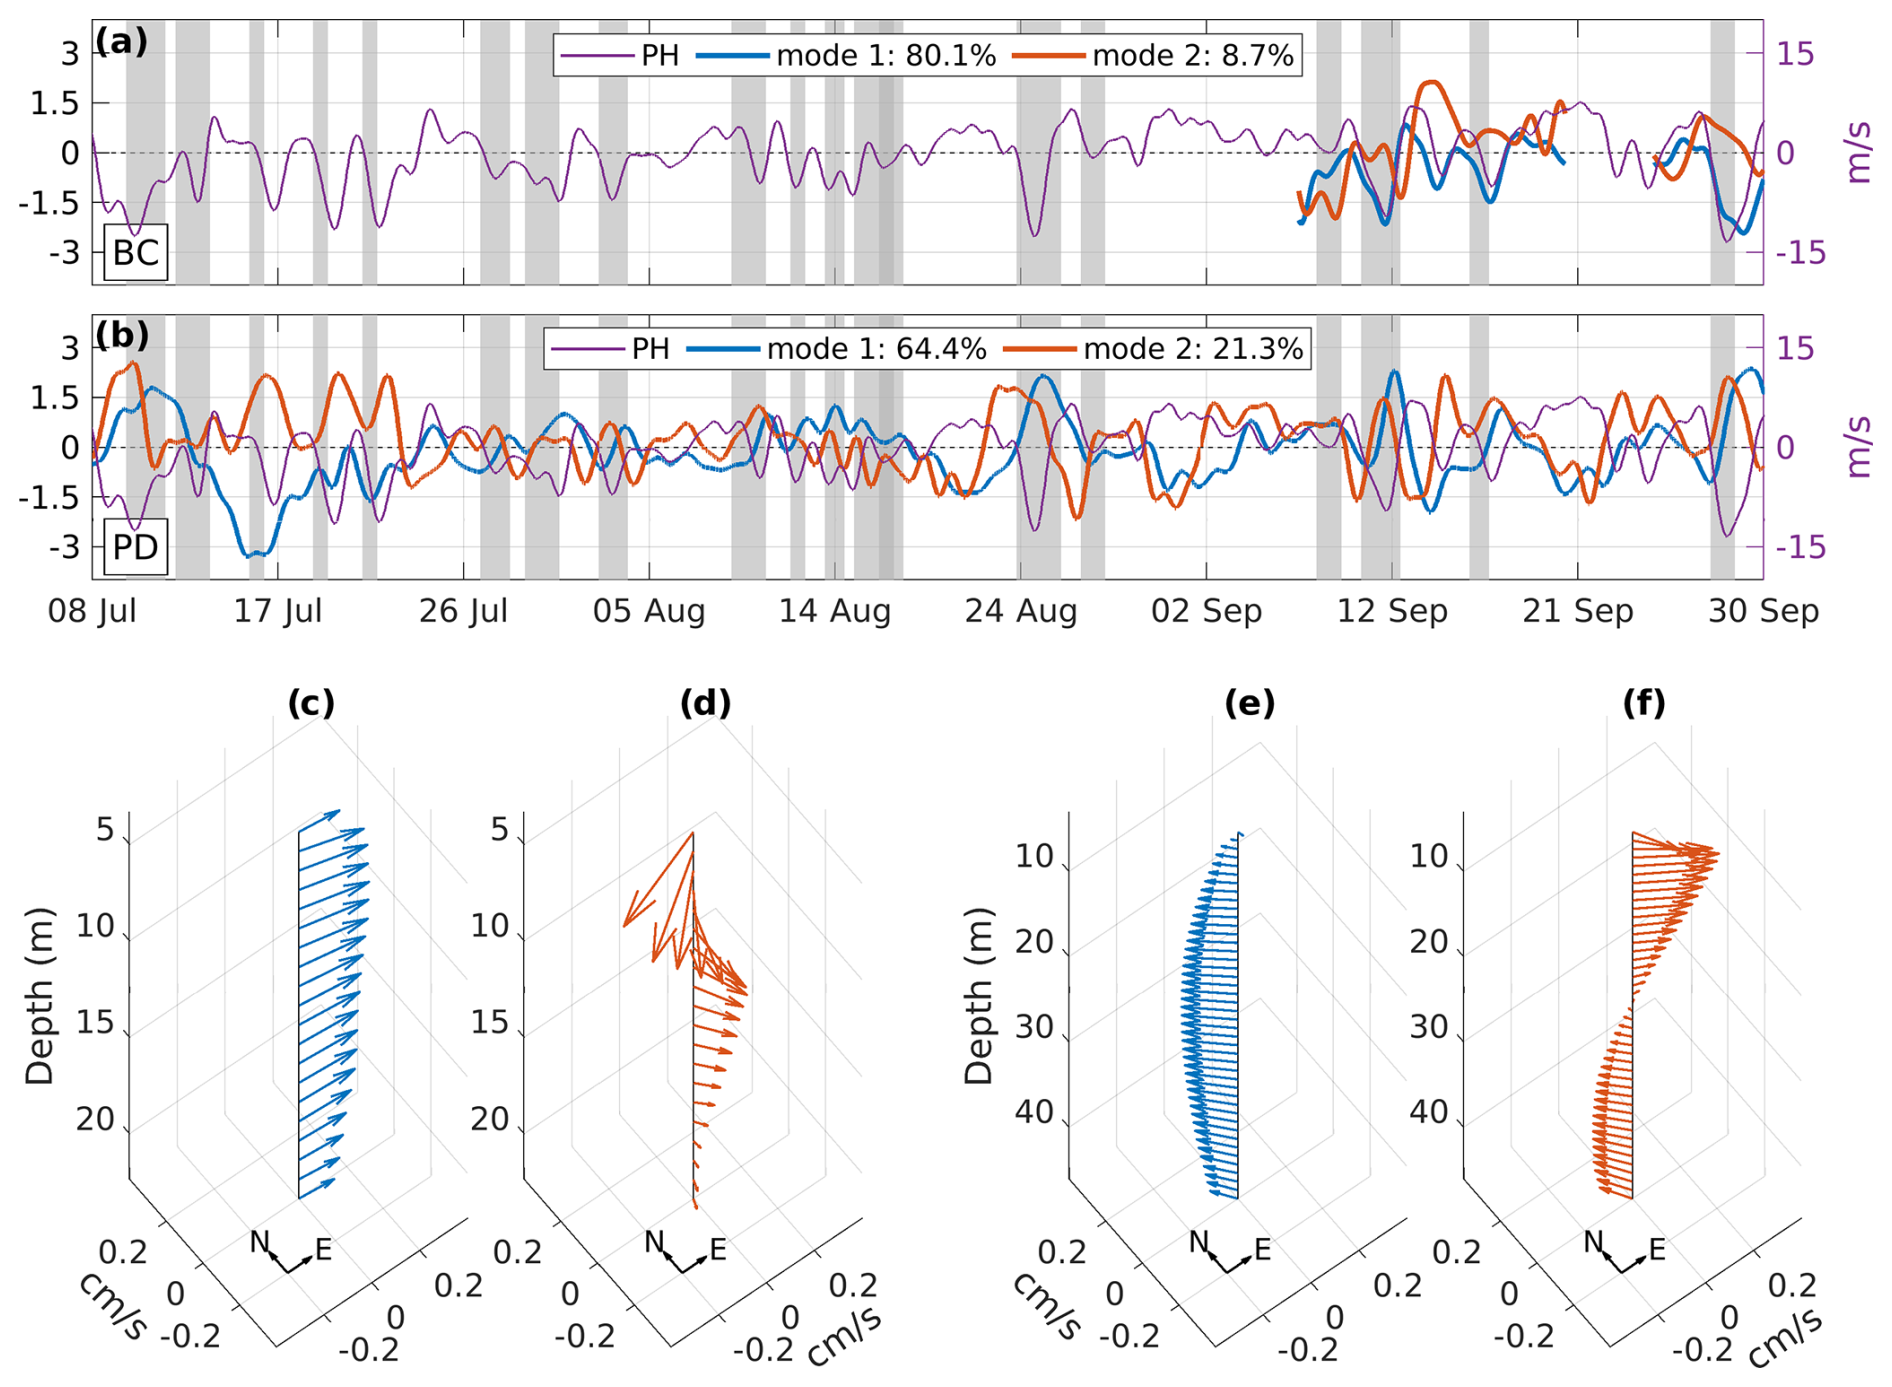
Figure 6Meridional wind from Punta Hualpén station (in purple) and time series of modes 1 (blue) and 2 (red) during 2016 for (a) BC and (b) PD. Vertical structures of the respective modes at (c–d) BC and (e–f) PD.
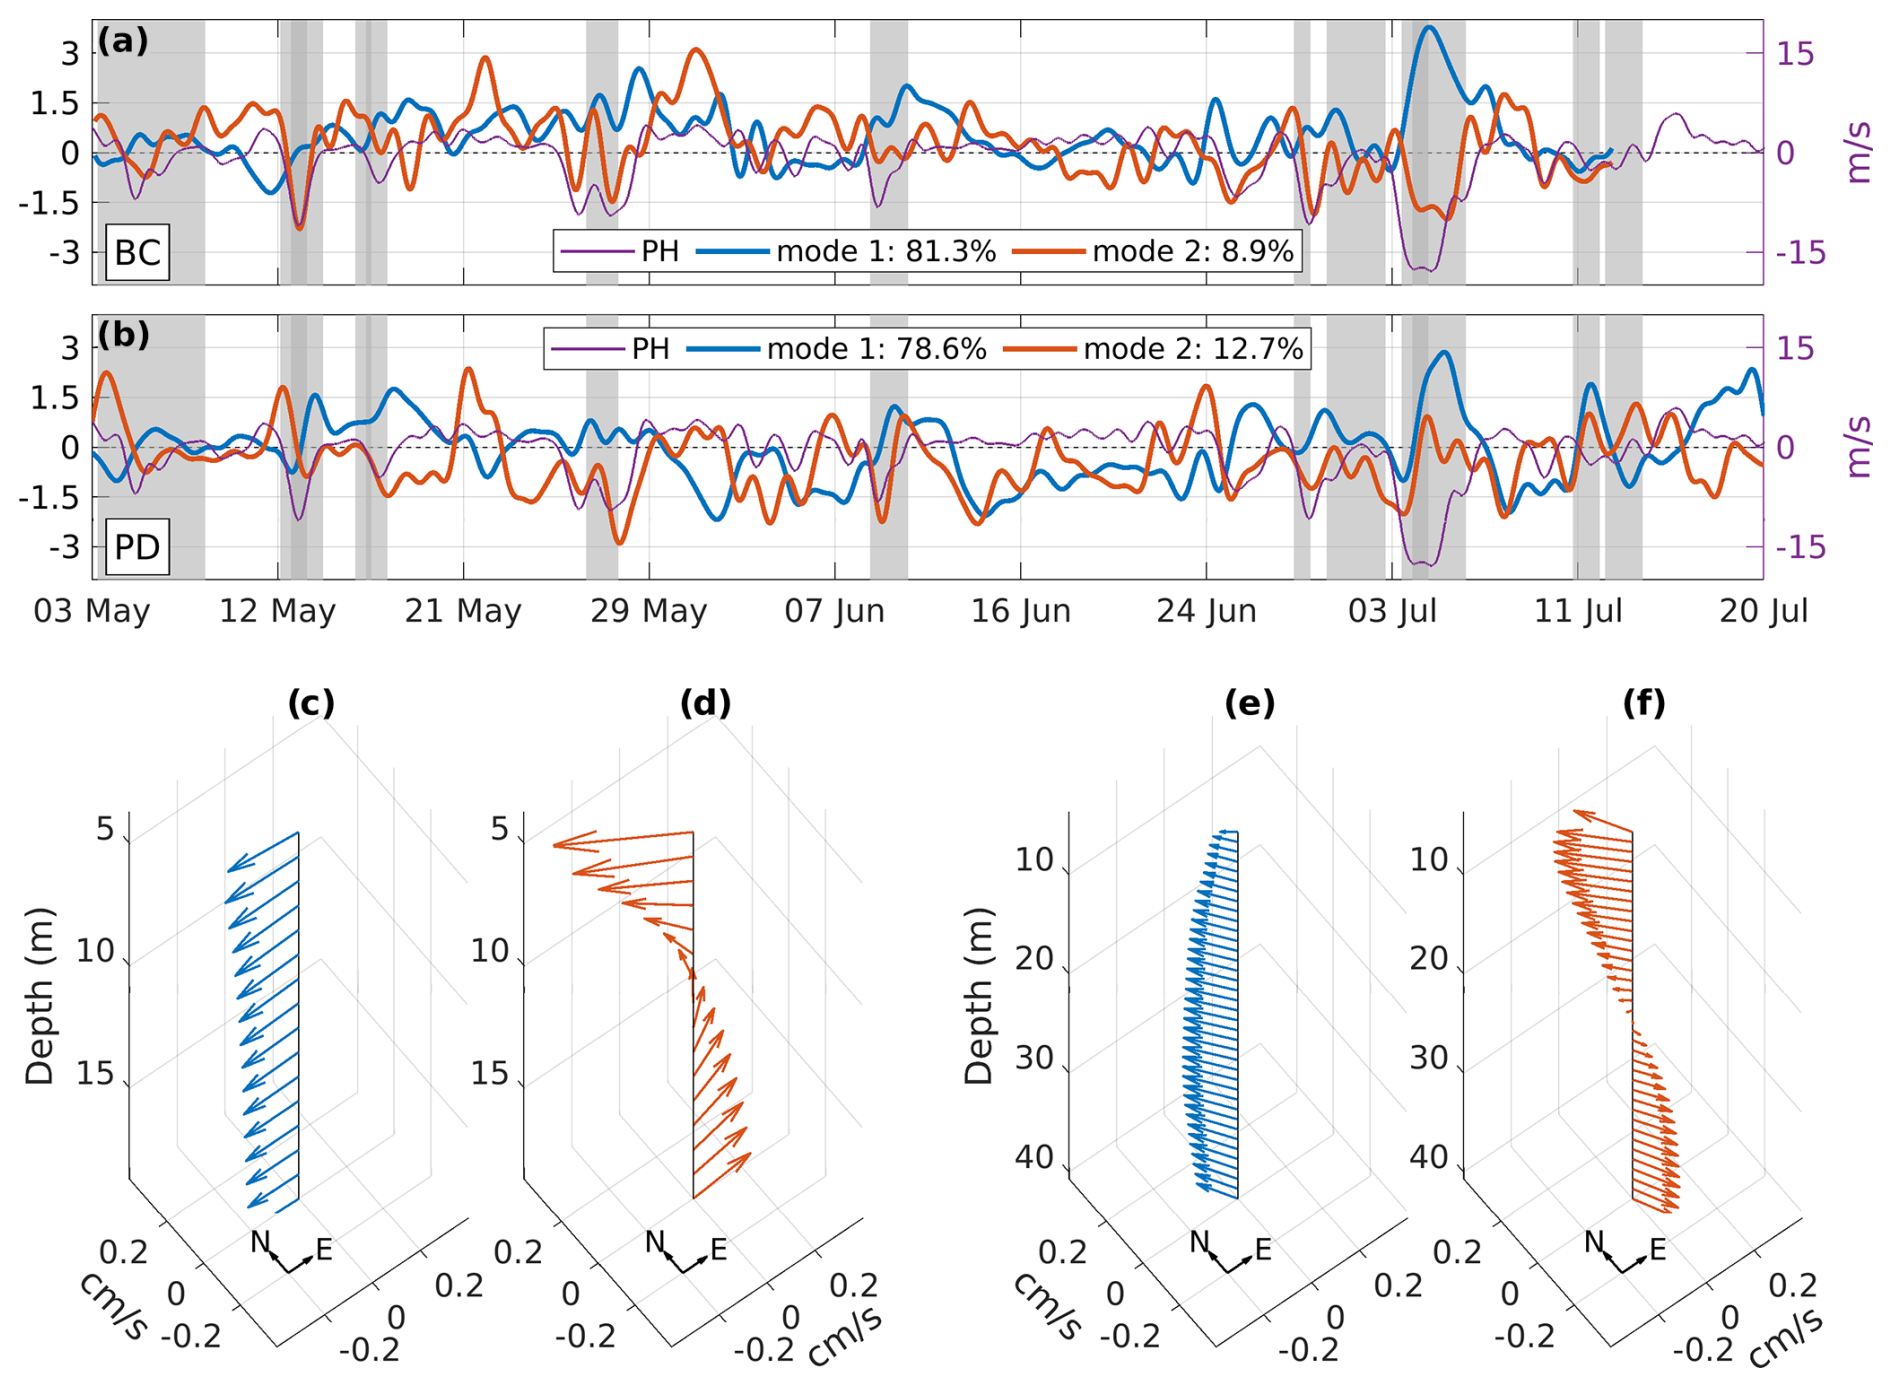
Figure 7Meridional wind from Punta Hualpén station (in purple) and time series of modes 1 (blue) and 2 (red) during 2018 for (a) BC and (b) PD. Vertical structures of the respective modes at (c–d) BC and (e–f) PD.
In the case of BC currents, the first vertical mode during 2016 accounts for over 80 % of the observed subtidal variance (Fig. 6a). This variance increases to 81.3 % in the 2018 campaign (Fig. 7a). Both periods showed a single-layer pattern closely aligned with the MPA axis shown in Fig. 1 and maintained similar amplitudes with depth (Figs. 6c and 7c). The second mode accounts for 8.7 % of the subtidal variance in the 2016 campaign and 8.9 % in the 2018 campaign. While the 2016 pattern transitions from a southwest–northeast axis at the surface to a north–south axis at the bottom (Fig. 6d), the 2018 structure rotates from northwest to northeast (Fig. 7d). During both periods, the vertical pattern displays higher amplitudes closer to the surface. For 2016, the amplitude diminishes to nearly zero near the bottom. In contrast, the 2018 pattern features a double-layer structure with a node at 10 m.
In the 2016 campaign for the PD currents, the first mode accounted for 64.4 % of the subtidal variance, while the second mode comprised 21.3 % (Fig. 6b). By 2018, these figures changed to 78.6 % and 12.7 % for the first and second modes, respectively (Fig. 7b). The vertical structure of both modes aligned with a northwest–southeast axis, mirroring the MPA's orientation, as shown in Fig. 1. The first mode in both campaigns displays its highest amplitudes at mid-depths, specifically between 20 and 30 m, and the lowest amplitudes at surface level (Figs. 6e and 7e). In 2016, the amplitude above 4 m decreased significantly, changing direction. In contrast, the second mode showcases a double-layered structure with a node at 25 m (Figs. 6f and 7f). In both studied periods, amplitudes were higher in the surface layer.
Wavelet coherence analyses were employed to elucidate the relationship between the variability of the vertical modes and the meridional wind induced by extratropical cyclones. These analyses revealed periods of shared variability between these time series, allowing the identification of specific periods where a significant correlation in variability patterns emerged.
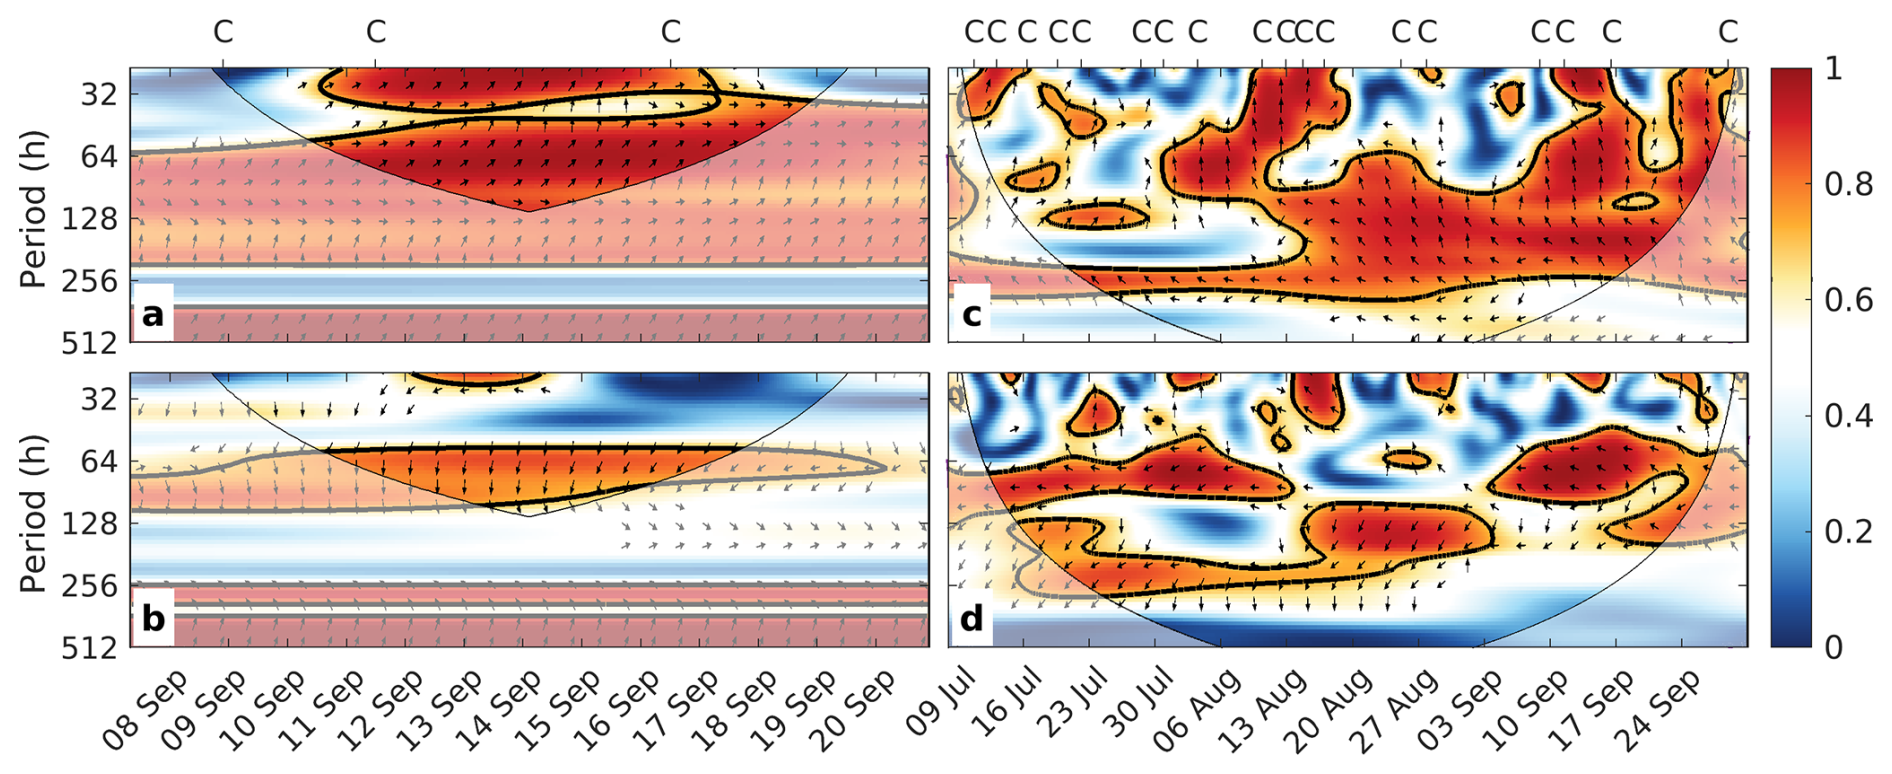
Figure 8Wavelet coherence between the meridional wind at Punta Hualpén and (a) the first vertical mode and (b) second vertical mode of the subtidal current at BC during the 2016 campaign. For PD, the coherence is shown in panels (c) for the first mode and (d) for the second mode. Letters C at the top of the panels indicate the passage of extratropical cyclones.

Figure 9Wavelet coherence between the meridional wind at Punta Hualpén and (a) the first vertical mode and (b) second vertical mode of the subtidal current at BC during the 2018 campaign. For PD, the coherence is shown in panel (c) for the first mode and (d) for the second mode. Letters C at the top of the panels indicate the passage of extratropical cyclones.
In the case of BC for 2016, the wind showed significant coherence with the first mode throughout the entire series (Fig. 8a), particularly for periods exceeding 64 h (2.6 d). This coherence also peaked for periods shorter than 64 h between 11 and 17 September, aligning with the passage of cyclones over the area. The coherence between the wind and the second mode peaked between 64 and 128 h for most of the series (Fig. 8b). Wavelet coherence analyses for the first PD mode displayed a significant peak centered at 256 h (10.6 d) throughout the series (Fig. 8c), and periods shorter than 64 h (2.6 d) showcased multiple coherence peaks. These values largely corresponded with the passage of three or more consecutive cyclones over the region. A consistent coherence band, ranging from 128 to 256 h (5–10 d), was evident from mid-August until the end of the series. Moreover, the wind's coherence with the second PD mode (Fig. 8d) was particularly evident in periods centered at 64 h (2.6 d). This coherence was most pronounced between 20 June and 13 August and later between 3 and 27 September. Furthermore, higher-frequency periods (less than 2 d) intermittently showcased high coherence throughout the series. Similar to what was observed in the first mode, most of these peaks at high frequencies were centered around several consecutive cyclonic events.
For the 2018 period, the coherence between the wind and the first variability mode of BC (Fig. 9a) did not show significant values for the 64 h periods (2.6 d). Instead, notable peaks occurred around 128 h periods (5.3 d) between 3 and 21 May and after 26 June, matching the occurrence of consecutive extratropical cyclones in the area. Notably, minor but significant peaks were observed between 24 and 48 h during all cyclone events lasting less than 36 h. Coherence with the second variability mode (Fig. 9b) showed significant in-phase peaks between 128 and 256 h throughout the series, except for the period between 9 and 29 June, which coincides with a longer absence of cyclones in the region. Again, significant peaks at 64 h were observed centered on the events of 6 May, 12 May, 27 May, and 28 June.
Similarly, the wavelet coherence between the wind and the principal component of the first mode in PD also exhibited high coherence at intervals during periods shorter than 64 h (2.6 d), which, in addition to being primarily in phase, coincide with the passage of cyclones over the study region (Fig. 9c). From 3 to 19 May and from 22 June to 7 July, the periods ranging from 64 to 128 h (2.6 to 5.3 d) exhibited significant coherence. Additionally, substantial coherence was detected for periods exceeding 256 h. However, these periods extended beyond the ones analyzed in this study.
In contrast, the wavelet coherence between the wind and the principal component of the second mode did not show significant values for periods longer than 128 h (Fig. 9d). When significant coherence occurred, especially at lower periods, it was intermittent and appeared during times similar to those observed in coherence with the first mode. Nevertheless, three periods of significant coherence stand out. From 9 to 18 May and from 24 May to 2 June, coherent signals were concentrated within the 32 to 64 h range, while from 5 to 15 June, they shifted to a 64 to 128 h range. These intervals correspond precisely with the transit of cyclones across the area, suggesting a notable synchronization between atmospheric disturbances and observed wavelet coherence.
4.5 Circulation response to northerly winds generated by the passage of extratropical cyclones in the region
Based on the previous results, a composite analysis was performed to elucidate the current's response to the northerly winds during extratropical cyclone events. This analysis included only those events where the north wind's intensity surpassed 5 m s−1. It was centered at a time t0 when the northerly wind was maximum, and it extended 48 h prior and 48 h after this time.
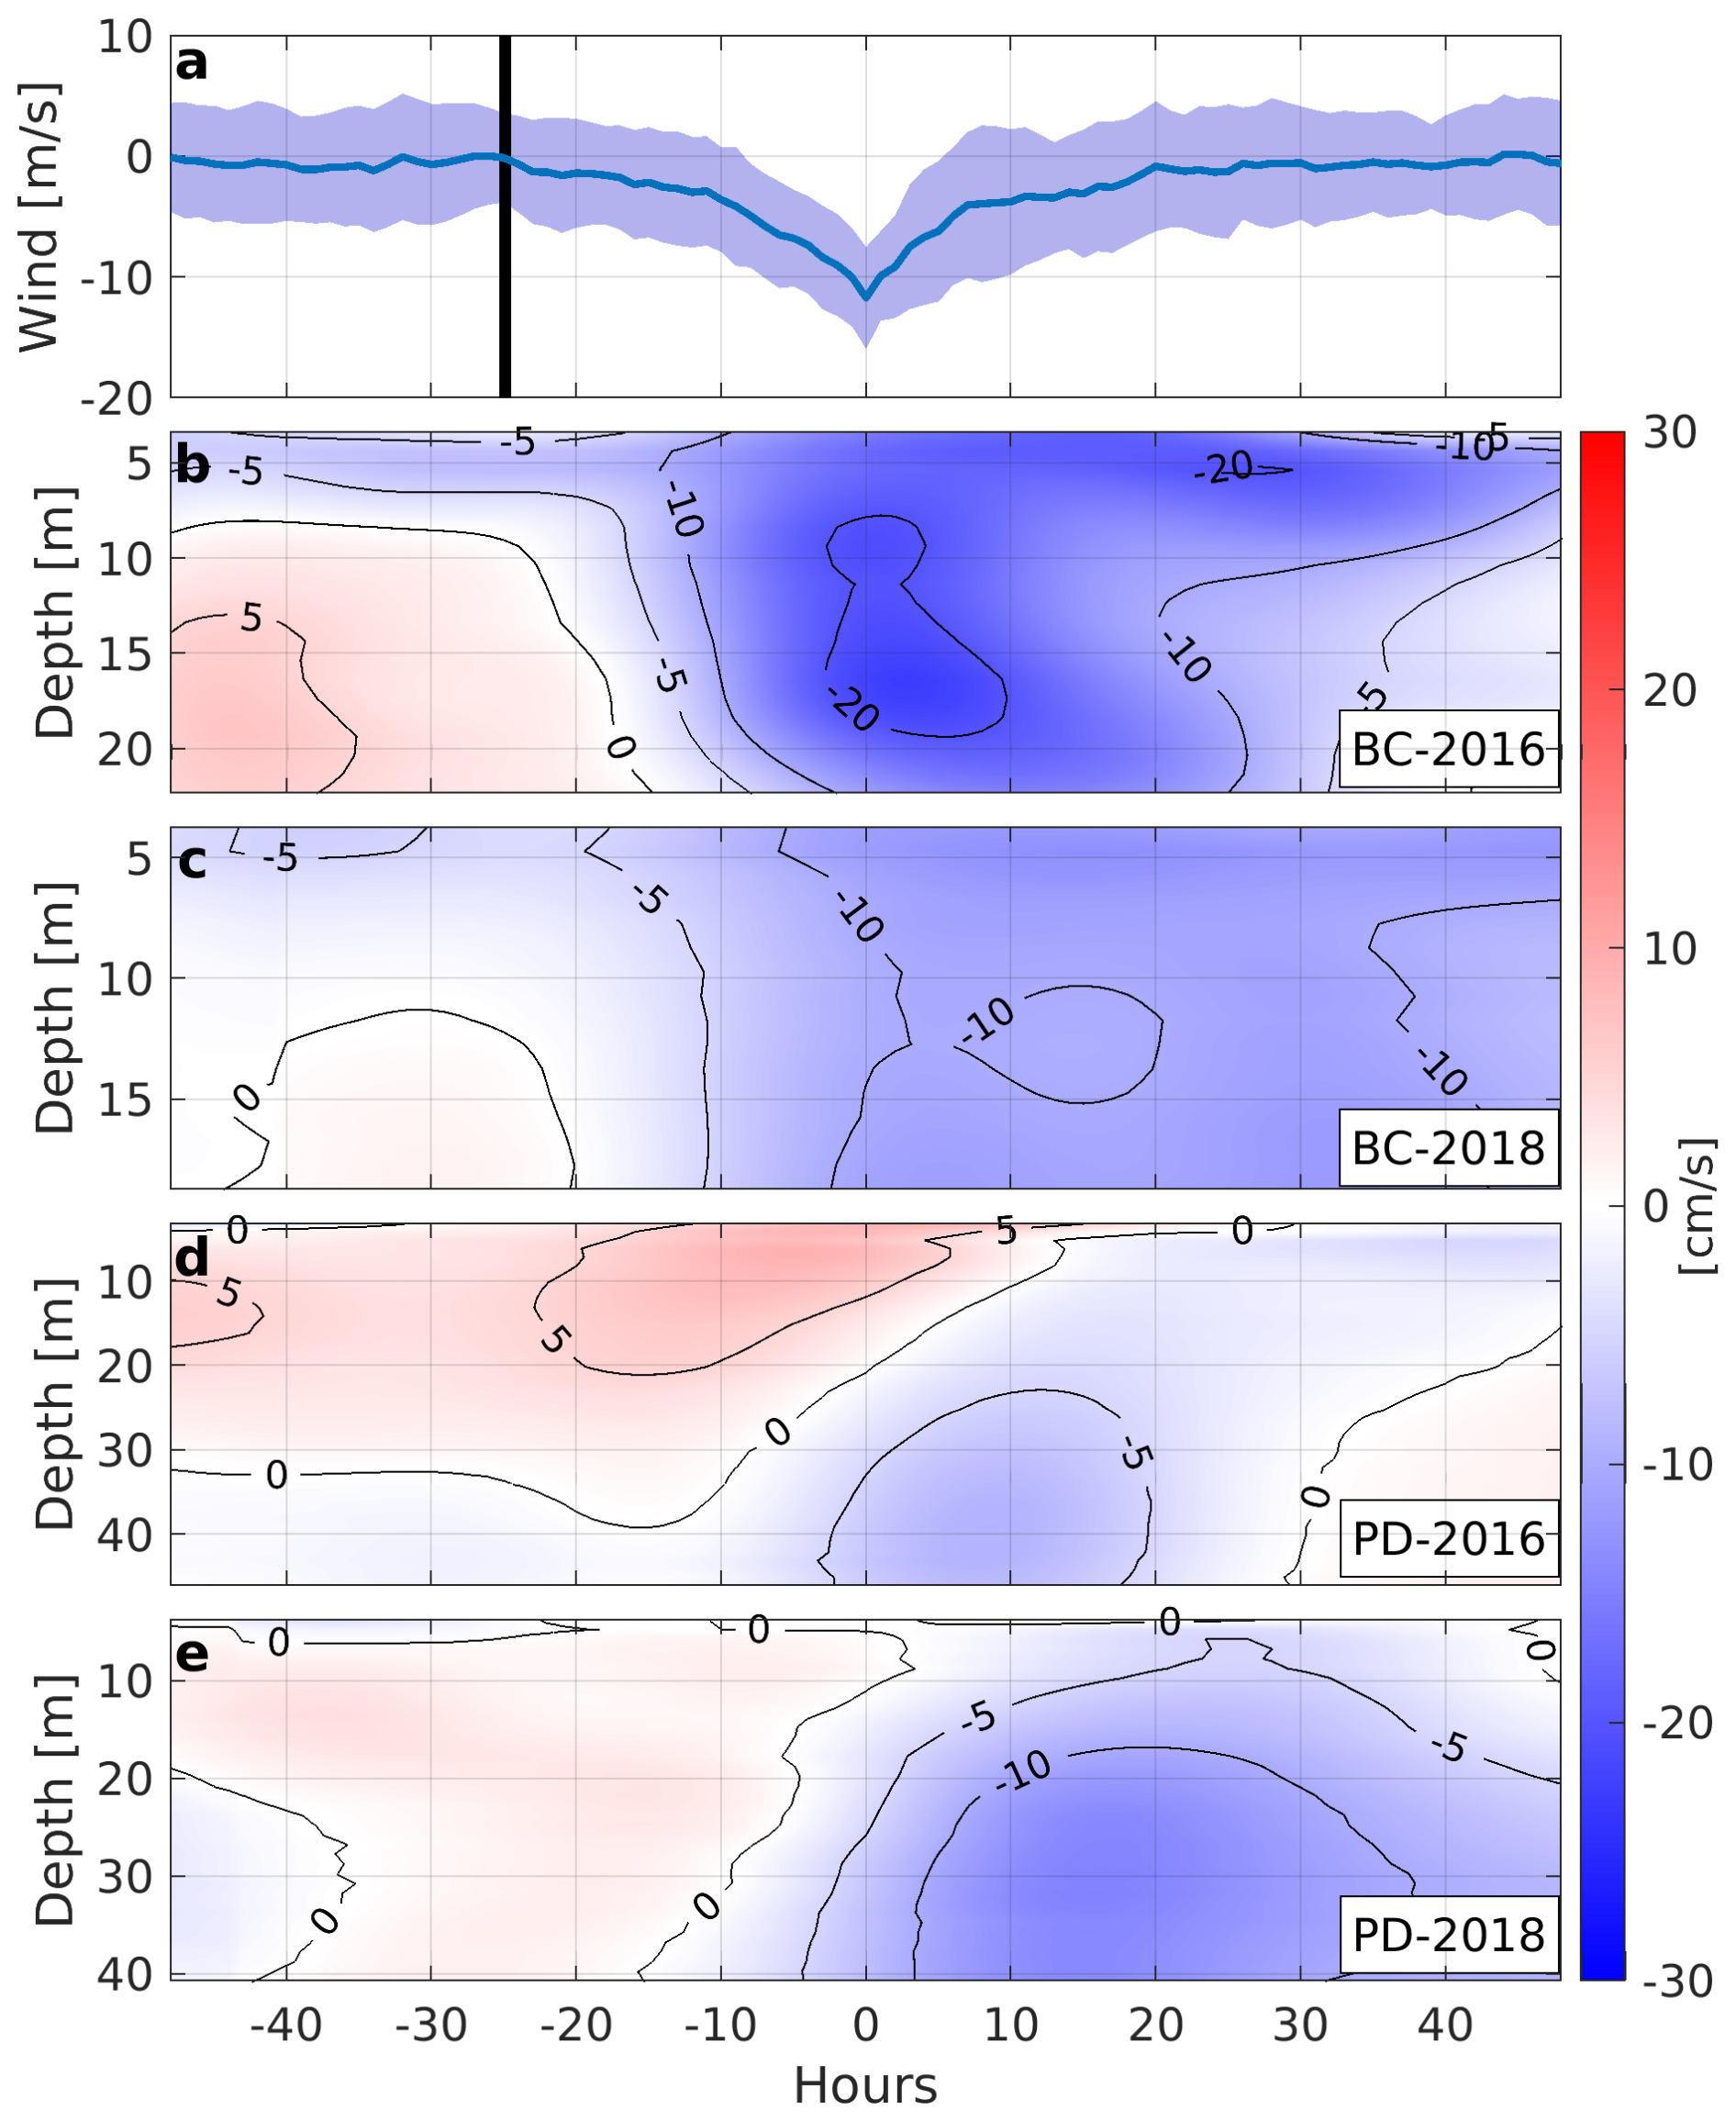
Figure 10Composite time series of (a) meridional wind in Punta Hualpén and its standard deviation. The vertical black line shows the average time at which an extratropical cyclone appears in the detection area before t0. Composite currents for (b) BC2016, (c) BC2018, (d) PD2016, and (e) PD2018 along the axis shown in Fig. 1.
On average, the time between the arrival of an extratropical cyclone to the detection area (vertical black line in Fig. 10a) and the maximum northerly wind generated inside the GA was approximately 25 h. The arrival of the cyclone coincides with a significant shift in the meridional wind component, gradually becoming more negative until reaching its peak at t0. As a result, mean currents in BC change from a double-layer pattern with a weak surface outflow to a strong outflow throughout the water column that reaches its maximum when the northerly wind is also maximum, especially during 2016 (Fig. 10a, b). In contrast, the initial conditions at PD showed weak mean currents flowing into the GA. This was evident a few hours before the maximum northerly wind, during which only the surface layers continued to flow in this direction. Around the peak of the northerly wind (t−10 to t+10), a distinct double circulation pattern emerged, characterized by a surface inflow and deeper-layer outflow. As the north wind decreases, the surface inflow attenuates, allowing the water to exit the GA at shallower depths.
5.1 Extratropical cyclones over central Chile
The results obtained from tracking extratropical cyclones in the region allowed for a detailed characterization of the frequency, trends, and relationship with intense northerly winds over the last 4 decades. The selected cyclone tracking algorithm has previously been employed to identify migratory anticyclones along the Chilean coast (Aguirre et al., 2021) and extratropical cyclones on the southern Brazilian coast (Bitencourt et al., 2011). The successful application of this algorithm in these studies within the region bolsters confidence in its results and underlines its suitability for our analysis. While other studies, such as those by Crespo et al. (2022) and Mendes et al. (2010), have focused on more specific periods when examining the passage of extratropical cyclones over central Chile, our study benefits from a longer time frame, spanning 4 decades. A key finding of this characterization was the notable decrease in the number of extratropical cyclones affecting the GA from 1979 to 2021, with a reduction rate of 0.1 cyclones per year. This trend is consistent with the findings of Aguirre et al. (2018), which noted a strengthening and poleward shift of the Pacific anticyclone. Such shifts may be influencing the frequency of cyclones in the region or altering their preferred tracks.
Furthermore, this study also quantified the relationship between intense northerly wind events and the passage of cyclones over the area. Although the relation between these two phenomena has been extensively studied (Barrett et al., 2011; Befort et al., 2019; Bitencourt et al., 2011; Domingues et al., 2019; Gómez et al., 2021; Ulbrich et al., 2009; Viale and Nuñez, 2011), this research identified extratropical cyclones as the primary atmospheric phenomenon responsible for extreme northerly winds in the region.
5.2 Response of the Gulf of Arauco to the passage of extratropical cyclones
This study underscores the complexity and dynamism of coastal systems, particularly due to the myriad of variables that influence the modulation of currents in these semi-enclosed areas (Largier, 2020). Coastal currents examined in this research demonstrated significant synoptic variability, a characteristic feature of this region (Sobarzo et al., 2022). Nevertheless, consistent patterns were observed between both studied periods, such as the orientation of currents and the percentage of variability and vertical structure encompassed within the principal modes of the EOF analysis. Furthermore, the vertical structures displayed by these variability modes correspond with the behaviors noted in other semi-enclosed water bodies with multiple oceanic outlets. An example is the Ría de Pontevedra, as Cruz et al. (2021) reported, where shallower ocean connections tend to have single-layer circulations during stormy seasons, while deeper entrances exhibit dual-layer circulations. Future studies focusing on the region should assess the persistence or variability of these circulation patterns in the context of climate change or large-scale phenomena such as the El Niño–Southern Oscillation.
The increase in coherence between the modes of variability and the meridional wind during the passage of extratropical cyclones indicates a direct influence of these atmospheric phenomena, through the wind, on the generation and modulation of currents within the GA. These results reinforce and expand the already-established relationship between the northerly winds and currents in both this region (Parada et al., 2001) and adjacent areas, such as the Bay of Concepción (Ahumada et al., 1983) and the Itata inner shelf (Sobarzo et al., 2022).
The behavior during the passage of cyclones was further evidenced in the composite of current response, where the average of the events showed an outflow through the water column in BC and a double-layer behavior in PD, with an inflow into the GA at the surface and an outflow at deeper layers. The results from this study align with those found by Parada et al. (2001), who characterized the circulation of the GA during favorable upwelling and downwelling winds during a summer–autumn transition period. It was noted that during strong northerly wind events, the currents in PD displayed a double-layer behavior, characterized by an inflow near the surface (10 m) and an outflow at the bottom (28 m) on the peak wind day. In the following 2 d, as the intensity of the northern winds decreased, the circulation in PD transitioned to an outflow across the entire water column, with the strongest currents observed at deeper levels, mirroring the behavior observed in our results. Furthermore, a similar surface dynamic has been observed in other regions, such as Monterey Bay, particularly under downwelling-favorable wind conditions. In such scenarios, currents in Monterey Bay enter the bay from the area closest to the Equator, follow the coastline, and eventually exit through the region nearer to the pole (Paduan et al., 2018).
The events observed during the passage of these atmospheric low-pressure systems allowed us to propose the following response mechanism within the GA: when an extratropical cyclone approaches the Chilean coast, it generates northerly winds. These northerly winds, particularly those exceeding 5 m s−1, can cause a dragging effect of water through Boca Grande (water entrance located to the north of the GA), resulting in a surface transport toward the head of the gulf. This water accumulation, influenced by the gulf's topography, induces a meridional pressure gradient that not only facilitates the outflow of water through Boca Chica (water entrance located to the west) but also propels the deeper gulf layers to exit through the northwest of Boca Grande. As the stress from the northerly winds over the ocean diminishes, the surface currents coming into the GA from the northwest adjust and mirror the deeper water transport, allowing the outflow currents to extend to shallower depths. This circulation pattern illustrates how an atmospheric phenomenon can play a critical role in modulating currents, which in turn could significantly influence various processes occurring in the ocean, such as the distribution of nutrients, the transport of larvae and marine species, or the dispersion of pollutants (Du and Shen, 2016; Guéry et al., 2019).
Nevertheless, it is important to acknowledge the limitations of the sea surface height data used in this study, particularly regarding the representation of local coastal processes. While this dataset effectively captures regional-scale oceanic dynamics, it does not account for small-scale wave processes (Lellouche et al., 2021), such as wave set-up, a process caused by wave breaking near the coast that can significantly alter sea surface height in shallow or nearshore areas (Dean and Walton, 2010). This absence means that certain high-frequency components of sea surface height variability are excluded, which could influence the pressure gradient proposed as a key response mechanism within the GA. Wave set-up, in particular, could enhance the meridional sea surface height difference observed during the northerly wind events, potentially amplifying the pressure gradient (Dean and Walton, 2010). Consequently, the omission of wave-driven processes likely introduces uncertainty and may lead to an underestimation of the pressure gradient. Despite this limitation, the consistency between observed circulation patterns and wind forcing supports the proposed mechanism, though its precise magnitude requires further refinement. Future studies should prioritize direct measurements of sea surface height within the GA, including both coastal and interior regions. Such measurements would confirm the existence of the proposed pressure gradient, thereby validating the mechanism described in this work. Additionally, these observations would enable more accurate estimations of the magnitude of the pressure gradient, providing a deeper understanding of the dynamics governing circulation patterns in the GA and similar semi-enclosed coastal systems.
5.3 Some environmental consequences
Despite the commonly associated adverse effects of extratropical cyclones, such as storm surges, erosion, and challenges to coastal economic activities (Parise et al., 2009; Bitencourt et al., 2011), this study suggests that the passage of these phenomena over areas like the GA can also have a positive impact in terms of ocean dynamics. Specifically, the northerly winds associated with extratropical cyclones appear to trigger a significant water outflow through Boca Chica and the western region of Boca Grande. This response implies an acceleration in water renewal, suggesting a reduction in residence times in these areas.
An estimation of the volume of water leaving the GA through Boca Chica during cyclone events was conducted. Considering the width of this mouth (9 km), its mean depth (20 m), and the average recorded current speed (10–20 cm s−1), it is estimated that between 1.5×10⁹ and 3.1×10⁹ m3 of water per day could be expelled, representing between 4 % and 7.5 % of the water volume of the gulf's head (the area south of 37° S). This estimated volume is the same order of magnitude for the water leaving the GA through the west side of Boca Grande (width: 7 km; mean depth: 50 m). These approximate figures confirm that the passage of cyclones over the region drives a water renewal within the GA.
This capacity of the wind to modify residence times has been observed in other semi-enclosed coastal systems like Mobile Bay and Chesapeake Bay, both located in the Northern Hemisphere (Du and Shen, 2016; Du et al., 2018). In the case of Mobile Bay, the change in wind direction decreases residence times by 13 % to 18 % compared to the average flow condition (Du et al., 2018), while in Chesapeake Bay, this time is reduced by 10 % (Du and Shen, 2016). In both cases, the reductions in residence times occur during the winter months, which is consistent with the findings in our study, where the highest frequency of extratropical cyclones occurs during this season.
Additionally, recent local studies have linked the increase in residence times within the GA to migratory high pressures (atmospheric high-pressure disturbances), a phenomenon directly opposite to extratropical cyclones in terms of atmospheric dynamics (Wong et al., 2021; Mardones et al., 2022). This increase is associated with an intensification of the southerly wind along the coast, in the opposite direction to the wind forced by extratropical cyclones. Similarly, in Mejillones Bay, located in northern Chile, longer residence times have been recorded under conditions favorable to upwelling due to the formation of upwelling shadows (Marín et al., 2003). All these precedents support the idea that the passage of extratropical cyclones is a mechanism that allows for water renewal inside the GA.
This water renewal and mixing of water masses associated with the passage of extratropical cyclones (Dacre et al., 2020) could have significant implications for oxygen dynamics within the GA. Studies in other coastal regions have shown that wind-driven processes, such as lateral advection and vertical mixing, enhance water renewal and facilitate the oxygenation of deeper layers (Coogan et al., 2019; Scully, 2010). This idea is further supported by observations from the annual cycle on the shelf north of the GA, where higher oxygen concentrations are typically observed during winter throughout the water column (Muñoz et al., 2023). Future research incorporating oxygen measurements would be essential to confirm and quantify these potential relationships.
Therefore, a decrease in the frequency of extratropical cyclones could have considerable implications for water quality in the GA, especially considering the sustained increase in urban, fishing, and industrial activity in the region (Holon SpA, 2020). Although the results of this study show a negative trend in cyclone frequency, it is crucial to recognize that this is not the only mechanism the GA presents in terms of water renewal. In fact, there have been observed events of water outflow through BC that do not coincide with the passage of an extratropical cyclone, suggesting the presence of various water renewal mechanisms within the GA. These aspects of circulation are not wind driven and are probably related to phenomena such as synoptic waves (Djurfeldt, 1989).
Finally, this study has some limitations. The data used are limited to two periods and represent only the outermost region of the gulf. Therefore, to gain a more comprehensive understanding of winter circulation and its relationship with wind, future studies should focus on obtaining simultaneous data both in the gulf's coastal regions and in the areas connecting with the ocean. Expanding the scope of data would allow for a more detailed view of the interactions between currents and wind in different areas of the gulf. This broader perspective would provide valuable information for a more complete understanding of the mechanisms driving circulation in this region and other coastal areas with similar characteristics, enhancing our ability to manage and conserve these diverse coastal systems.
This work examined the hydrodynamic response of the GA, the largest semi-enclosed bay of central Chile, to the passage of extratropical cyclones over the area (30–50° S) during two winter seasons. The study employed a cyclone detection model combined with current measurements taken at strategic points within the gulf, specifically at BC (in the center of Boca Chica) and PD (on the western side of Boca Grande). These locations were crucial for analyzing water exchange between this semi-enclosed body of water and the outer ocean.
The cyclone tracking model results revealed that intense north wind events (>5 m s−1) over the GA are primarily due to the passage of these systems over the region. Additionally, it was observed that the frequency of extratropical cyclones over central Chile has progressively decreased from 1979 to 2020.
The EOF analysis of subtidal currents at BC showed a predominantly single-layer behavior (>80 % of the subtidal variance) in both periods. Wavelet coherence analyses between this first mode and the meridional wind intensified when an extratropical cyclone crossed the area. This relationship was further highlighted in the case-by-case analysis, where currents exhibited a single-layer outflow, with magnitudes between 10 and 30 cm s−1 during intense northerly wind.
In contrast, the EOF analysis of currents at PD revealed most of the variability concentrated in a single-layer mode (64 %–78 % of the total variance) and a two-layer mode (21 %–13 % of the total variance). Similar to BC, wavelet coherence analyses showed peaks during the passage of cyclones over the region. These results and observations from case studies indicate that the initial response to the passage of cyclones is a two-layer one, with an inflow of water into the gulf in the surface layer and an outflow in the middle to deep layers. After reaching the maximum wind intensity, the currents adopt a single-layer behavior, orienting towards the exterior of the gulf.
Finally, this study suggests that the mechanism generating this type of response to the wind generated by extratropical cyclones is initially a surface drag towards the head of the gulf. This accumulation of water at the head creates a pressure gradient that drives the outflow of water through Boca Chica and simultaneously promotes the outflow of water from the deeper layers of Boca Grande. Once the wind diminishes in magnitude, the surface currents in PD replicate the behavior observed in the subsurface layers.
These findings have significant implications for understanding the wind-driven coastal dynamics in semi-enclosed bays globally, particularly those influenced by extratropical cyclones. By highlighting the intricate mechanisms of water exchange and circulation patterns, this study provides a broader understanding of how similar bays may respond to atmospheric disturbances, thereby informing better marine and environmental management strategies worldwide.
To provide additional context on the spatial distribution of extratropical cyclones influencing the GA, we have included a density map of the cyclone trajectories analyzed in this study. This visualization offers a good representation of cyclone activity in the study area by highlighting regions of higher cyclone concentration. The map highlights that most cyclones are concentrated between 42–48° S and 76–83° W, regardless of the season. However, a higher density of cyclones is observed during the winter months. Additionally, the distribution shows that during winter, cyclones tend to extend further north, with a noticeable presence around 30° S, in contrast to the summer months.
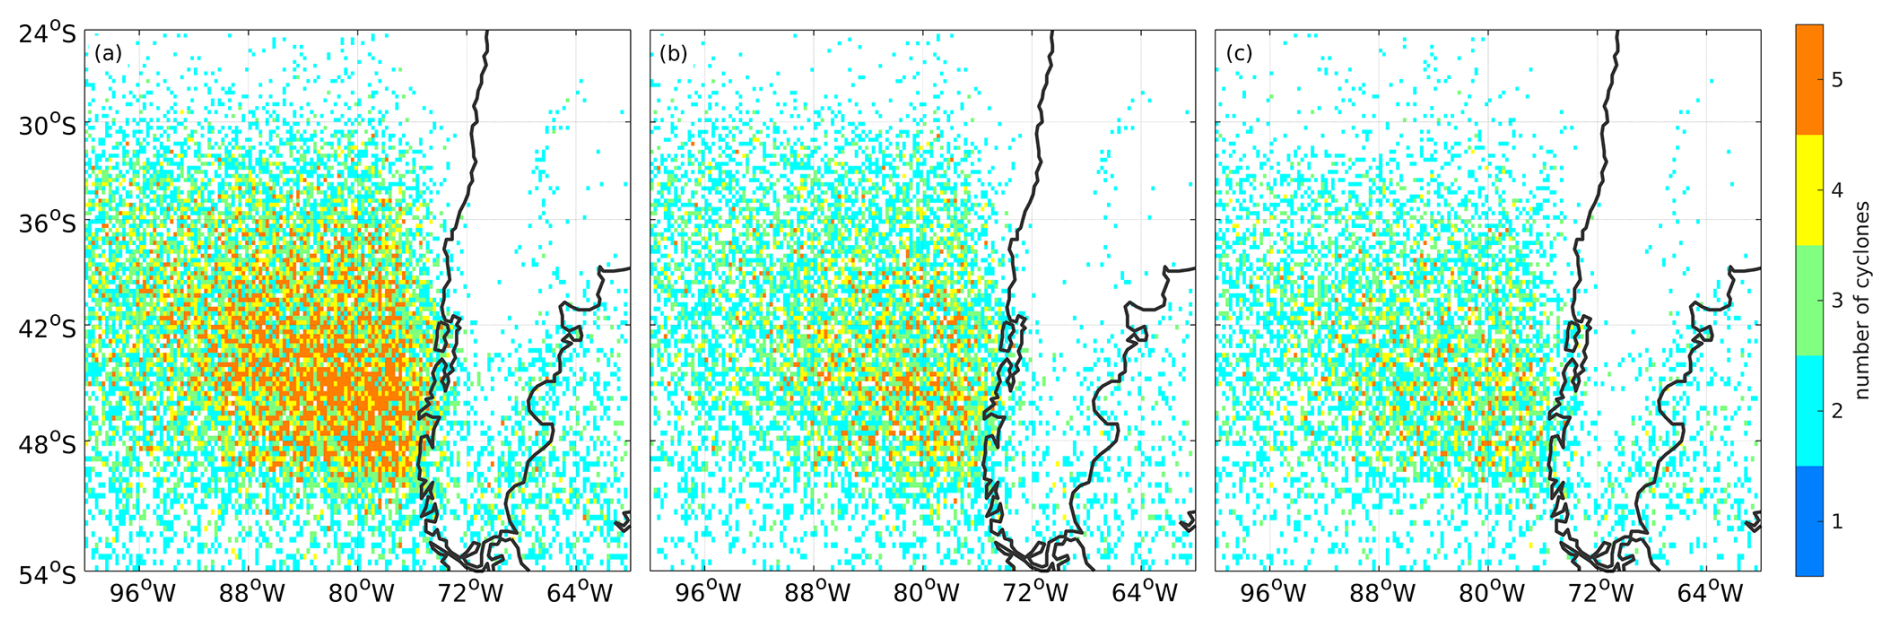
Figure A1Spatial density of extratropical cyclones passing through the study area, calculated as the number of cyclones per grid cell. The map shows the density for (a) all cyclones analyzed in this study and separate distributions for (b) winter and (c) summer periods.
Winds at 10 m above the surface of the Earth and mean sea level pressure from ERA5 products are obtained from ERA5 hourly data on single levels from 1940 to present available at the Copernicus Climate Data Store (https://doi.org/10.24381/cds.adbb2d47, Hersbach et al., 2023). Sea level height from the GLORYS12V1 reanalysis was obtained from the Global Ocean Physics Reanalysis dataset available from Copernicus Marine Services (https://doi.org/10.48670/moi-00021, Copernicus Marine Service, 2023).
JCR worked on the conceptualization, analysis, figures, and interpretation. JCR also wrote the article with contributions from PM and MS. MS supervised the study and gave input for writing and revising the paper. PM was involved as a scientific expert. All co-authors participated in the review and editing of the draft.
The contact author has declared that none of the authors has any competing interests.
Publisher's note: Copernicus Publications remains neutral with regard to jurisdictional claims made in the text, published maps, institutional affiliations, or any other geographical representation in this paper. While Copernicus Publications makes every effort to include appropriate place names, the final responsibility lies with the authors.
This article is part of the special issue “Oceanography at coastal scales: modelling, coupling, observations, and applications”. It is not associated with a conference.
We acknowledge the European Centre for Medium-Range Weather Forecasts (ECMWF) for the ERA5 reanalysis and the Copernicus Marine Services (CMEMS) for providing the GLORYS12V1 reanalysis. We extend our gratitude to the team at the University of Melbourne for their development of the cyclone detection and tracking algorithm. Special thanks are extended to Martina Messmer and Catalina Aguirre for their invaluable assistance in elucidating the algorithm's functions and providing guidance for its successful implementation. We would also like to thank Iván Pérez-Santos for his valuable insights into and feedback on this work, as well as the anonymous reviewer for their constructive comments.
Josse Contreras-Rojas and Marcus Sobarzo were partially supported by the Ecosystem Studies Program in the Gulf of Arauco (PREGA), funded by Celulosa Arauco y Constitución S.A., and by the Center for Oceanographic Research COPAS COASTAL (ANID no. FB210021) at the University of Concepción, Chile. PREGA provided the ocean current data measured in the gulf. In addition, Marcus Sobarzo was partially supported by INCAR (FONDAP-ANID no. 1522A0004-1523A0007).
This paper was edited by John M. Huthnance and reviewed by Iván Pérez-Santos and one anonymous referee.
Aguirre, C., García-Loyola, S., Testa, G., Silva, D., and Farías, L.: Insight into anthropogenic forcing on coastal upwelling off south-central Chile, Elem. Sci. Anth., 6, 59, https://doi.org/10.1525/elementa.314, 2018. a
Aguirre, C., Flores-Aqueveque, V., Vilches, P., Vásquez, A., Rutllant, J. A., and Garreaud, R.: Recent changes in the low-level jet along the subtropical west coast of South America, Atmosphere, 12, 465, https://doi.org/10.3390/atmos12040465, 2021. a, b
Ahumada, R., Rudolph, A., and Martinez, V.: Circulation and fertility of waters in Concepción Bay, Estuar. Coast. Shelf Sci., 16, 95–105, 1983. a
Arístegui, J., Barton, E. D., Álvarez-Salgado, X. A., Santos, A. M. P., Figueiras, F. G., Kifani, S., Hernández-León, S., Mason, E., Machú, E., and Demarcq, H.: Sub-regional ecosystem variability in the Canary Current upwelling, Prog. Oceanogr., 83, 33–48, 2009. a
Bakun, A. and Nelson, C. S.: The seasonal cycle of wind-stress curl in subtropical eastern boundary current regions, J. Phys. Oceanogr., 21, 1815–1834, 1991. a
Barrett, B. S., Krieger, D. B., and Barlow, C. P.: Multiday circulation and precipitation climatology during winter rain events of differing intensities in central Chile, J. Hydrometeorol., 12, 1071–1085, 2011. a
Befort, D., Wild, S., Knight, J., Lockwood, J., Thornton, H., Hermanson, L., Bett, P., Weisheimer, A., and Leckebusch, G.: Seasonal forecast skill for extratropical cyclones and windstorms, Q. J. Roy. Meteor. Soc., 145, 92–104, 2019. a
Bitencourt, D. P., Manoel, G., Acevedo, O. C., Fuentes, M. V., Muza, M. N., Rodrigues, M. L., and Leal Quadro, M. F.: Relating winds along the Southern Brazilian coast to extratropical cyclones, Meteorol. Appl., 18, 223–229, 2011. a, b, c, d
Catto, J. L.: Extratropical cyclone classification and its use in climate studies, Rev. Geophys., 54, 486–520, 2016. a
Catto, J. L., Shaffrey, L. C., and Hodges, K. I.: Can climate models capture the structure of extratropical cyclones?, J. Climate, 23, 1621–1635, 2010. a, b
Chavez, F. P. and Messié, M.: A comparison of eastern boundary upwelling ecosystems, Prog. Oceanogr., 83, 80–96, 2009. a
Checkley Jr., D. M. and Barth, J. A.: Patterns and processes in the California Current System, Prog. Oceanogr., 83, 49–64, 2009. a
Colle, B. A., Booth, J. F., and Chang, E. K.: A review of historical and future changes of extratropical cyclones and associated impacts along the US East Coast, Current Climate Change Reports, 1, 125–143, 2015. a
Coogan, J., Dzwonkowski, B., and Lehrter, J.: Effects of coastal upwelling and downwelling on hydrographic variability and dissolved oxygen in Mobile Bay, J. Geophys. Res.-Oceans, 124, 791–806, 2019. a
Copernicus Marine Service: Global Ocean Physics Reanalysis, [data set], https://doi.org/10.48670/moi-00021, 2023. a
Crespo, N. M., Reboita, M. S., Gozzo, L. F., de Jesus, E. M., Torres-Alavez, J. A., Lagos-Zúñiga, M. Á., Torrez-Rodriguez, L., Reale, M., and da Rocha, R. P.: Assessment of the RegCM4-CORDEX-CORE performance in simulating cyclones affecting the western coast of South America, Clim. Dynam., 60, 2041–2059, 2022. a, b, c, d, e
Cruz, E. R., Nolasco, R., Padin, X. A., Gilcoto, M., Babarro, J. M., Dubert, J., and Pérez, F. F.: A High-Resolution Modeling Study of the Circulation Patterns at a Coastal Embayment: Ría de Pontevedra (NW Spain) Under Upwelling and Downwelling Conditions, Front. Mar. Sci., 792, https://doi.org/10.3389/fmars.2021.661250, 2021. a
Dacre, H. F., Josey, S. A., and Grant, A. L.: Extratropical-cyclone-induced sea surface temperature anomalies in the 2013–2014 winter, Weather and Climate Dynamics, 1, 27–44, 2020. a
Daneri, G., Dellarossa, V., Quiñones, R., Jacob, B., Montero, P., and Ulloa, O.: Primary production and community respiration in the Humboldt Current System off Chile and associated oceanic areas, Mar. Ecol. Prog. Ser., 197, 41–49, 2000. a
Dean, R. G. and Walton, T. L.: Wave setup, in: Handbook of coastal and ocean engineering, World Scientific, 1–23, https://doi.org/10.1142/9789812819307_0001, 2010. a, b, c
Djurfeldt, L.: Circulation and mixing in a coastal upwelling embayment; Gulf of Arauco, Chile, Cont. Shelf Res., 9, 1003–1016, 1989. a, b
Domingues, R., Kuwano-Yoshida, A., Chardon-Maldonado, P., Todd, R. E., Halliwell, G., Kim, H.-S., Lin, I.-I., Sato, K., Narazaki, T., Shay, L. K., Miles, T., Glenn, S., Zhang, J. A., Jayne, S. R., Centurioni, L., Le Hénaff, M., Foltz, G. R., Bringas, F., Ali, M. M., DiMarco, S. F., Hosoda, S., Fukuoka, T., LaCour, B., Mehra, A., Sanabia, E. R., Gyakum, J. R., Dong, J., Knaff, J. A., and Goni, G.: Ocean observations in support of studies and forecasts of tropical and extratropical cyclones, Front. Mar. Sci., 6, 446, https://doi.org/10.3389/fmars.2019.00446, 2019. a
Du, J. and Shen, J.: Water residence time in Chesapeake Bay for 1980–2012, J. Mar. Syst., 164, 101–111, 2016. a, b, c
Du, J., Park, K., Shen, J., Dzwonkowski, B., Yu, X., and Yoon, B. I.: Role of baroclinic processes on flushing characteristics in a highly stratified estuarine system, Mobile Bay, Alabama, J. Geophys. Res.- Oceans, 123, 4518–4537, 2018. a, b
Ekman, V. W.: On the influence of the Earth's rotation on ocean currents, Arkiv för Matematik, Astronomi och Fysik, 2, 1–52, 1905. a
Falvey, M. and Garreaud, R.: Wintertime precipitation episodes in central Chile: Associated meteorological conditions and orographic influences, J. Hydrometeorol., 8, 171–193, 2007. a
Faundez-Baez, P., Morales, C., and Arcos, D.: Variabilidad espacial y temporal en la hidrografía invernal del sistema de bahías frente a la VIII región (Chile centro-sur), Revista Chilena de Historia Natural, 74, 817–831, 2001. a
Fuenzalida, H. A., Sánchez, R., and Garreaud, R. D.: A climatology of cutoff lows in the Southern Hemisphere, J. Geophys. Res.-Atmos., 110, https://doi.org/10.1029/2005JD005934, 2005. a
García-Reyes, M. and Largier, J.: Seasonality of coastal upwelling off central and northern California: New insights, including temporal and spatial variability, J. Geophys. Res.-Oceans, 117, https://doi.org/10.1029/2011JC007629, 2012. a
Garreaud, R., Rutllant, J., and Fuenzalida, H.: Coastal lows along the subtropical west coast of South America: Mean structure and evolution, Mon. Weather Rev., 130, 75–88, 2002. a, b
Gómez, M., Mäll, M., and Aránguiz, R.: The role of physical parameterization schemes in capturing the characteristics of extratropical cyclones over the South Pacific Ocean, Earth Space Sci., 8, e2021EA001744, https://doi.org/10.1029/2021EA001744, 2021. a, b
Gozzo, L. F., da Rocha, R. P., Reboita, M. S., and Sugahara, S.: Subtropical cyclones over the southwestern South Atlantic: Climatological aspects and case study, J. Climate, 27, 8543–8562, 2014. a
Grinsted, A., Moore, J. C., and Jevrejeva, S.: Application of the cross wavelet transform and wavelet coherence to geophysical time series, Nonlin. Processes Geophys., 11, 561–566, https://doi.org/10.5194/npg-11-561-2004, 2004. a
Guéry, L., Descamps, S., Hodges, K. I., Pradel, R., Moe, B., Hanssen, S. A., Erikstad, K. E., Gabrielsen, G. W., Gilchrist, H. G., Jenouvrier, S., and Bêty, J.: Winter extratropical cyclone influence on seabird survival: variation between and within common eider Somateria mollissima populations, Mar. Ecol. Prog. Ser., 627, 155–170, 2019. a
Halldor, B. and Venegas, S. A.: A manual for EOF and SVD analyses of climate data, McGill University, CCGCR Report, 52, 112–134, 1997. a
Hernández, A., Cubillos, L., and Quiñones, R.: Evaluación talla estructurada de los stocks de Ensis macha y Tagelus dombeii en el Golfo de Arauco, Chile, Rev. Biol. Mar. Oceanog., 46, 157–176, 2011. a
Hersbach, H., Bell, B., Berrisford, P., Hirahara, S., Horányi, A., Muñoz-Sabater, J., Nicolas, J., Peubey, C., Radu, R., Schepers, D., Simmons, A., Soci, C., Abdalla, S., Abellan, X., Balsamo, G., Bechtold, P., Biavati, G., Bidlot, J., Bonavita, M., Chiara, G., Dahlgren, P., Dee, D., Diamantakis, M., Dragani, R., Flemming, J., Forbes, R., Fuentes, M., Geer, A., Haimberger, L., Healy, S., Hogan, R. J., Hólm, E., Janisková, M., Keeley, S., Laloyaux, P., Lopez, P., Lupu, C., Radnoti, G., Rosnay, P., Rozum, I., Vamborg, F., Villaume, S., and Thépaut, J.-N.: The ERA5 global reanalysis, Q. J. Roy. Meteor. Soc., 146, 1999–2049, https://doi.org/10.1002/qj.3803, 2020. a
Hersbach, H., Bell, B., Berrisford, P., Biavati, G., Horányi, A., Muñoz Sabater, J., Nicolas, J., Peubey, C., Radu, R., Rozum, I., Schepers, D., Simmons, A., Soci, C., Dee, D., and Thépaut, J.-N.: ERA5 hourly data on single levels from 1940 to present, Copernicus Climate Change Service (C3S) Climate Data Store (CDS) [data set], https://doi.org/10.24381/cds.adbb2d47, 2023. a
Holon SpA: Actualización de la información disponible y propuesta de monitoreo para el diseño de la norma secundaria de calidad ambiental para el golfo de Arauco, Informe técnico, Holon SpA, https://pras.mma.gob.cl/wp-content/uploads/2021/08/10-Accion-Informe-Final.pdf (last access: 9 February 2025), 2020. a
Holton, J. R.: An introduction to dynamic meteorology, Am. J. Phys., 41, 752–754, 1973. a
Hutchings, L., Verheye, H. M., Huggett, J. A., Demarcq, H., Cloete, R., Barlow, R. G., Louw, D., and da Silva, A.: 6 Variability of plankton with reference to fish variability in the Benguela current large marine ecosystem–An overview, Lar. Mar. Ecosyst., 14, 91–124, 2006. a
Jones, D. A. and Simmonds, I.: A climatology of Southern Hemisphere extratropical cyclones, Clim. Dynam., 9, 131–145, 1993. a
Landaeta, M. F. and Castro, L. R.: Spawning and larval survival of the Chilean hake Merluccius gayi under later summer conditions in the Gulf of Arauco, central Chile, Fish. Res., 77, 115–121, 2006. a
Largier, J. L.: Upwelling bays: how coastal upwelling controls circulation, habitat, and productivity in bays, Annu. Rev. Mar. Sci., 12, 415–447, 2020. a, b
Lellouche, J.-M., Greiner, E., Bourdallé-Badie, R., Garric, G., Melet, A., Drévillon, M., Bricaud, C., Hamon, M., Le Galloudec, O., Regnier, C., Candela, T., Testut, C.-E., Gasparin, F., Ruggiero, G., Benkiran, M., Drillet, Y., and Le Traon, P.-Y.: The Copernicus Global 1/12° Oceanic and Sea Ice GLORYS12 Reanalysis, Front. Earth Sci., 9, https://doi.org/10.3389/feart.2021.698876, 2021. a, b
Letelier, J., Pizarro, O., and Nuñez, S.: Seasonal variability of coastal upwelling and the upwelling front off central Chile, J. Geophys. Res.-Oceans, 114, https://doi.org/10.1029/2008JC005171, 2009. a
Mardones, P., Wong, Z., Contreras-Rojas, J., Muñoz, R., Hernández-Miranda, E., and Sobarzo, M.: Upwelling Shadows Driven by the Low-Level Jet Along the Subtropical West Coast of South America: Gulf of Arauco, Chile, J. Geophys. Res.-Oceans, 127, e2021JC017979, https://doi.org/10.1029/2021JC017979, 2022. a, b
Marín, V. H., Delgado, L. E., and Escribano, R.: Upwelling shadows at Mejillones Bay (northern Chilean coast): a remote sensing in situ analysis, Investigaciones Marinas, 31, 47–55, 2003. a
Mendes, D., Souza, E. P., Marengo, J. A., and Mendes, M. C.: Climatology of extratropical cyclones over the South American–southern oceans sector, Theor. Appl. Climatol., 100, 239–250, 2010. a, b, c
Messmer, M. and Simmonds, I.: Global analysis of cyclone-induced compound precipitation and wind extreme events, Weather and Climate Extremes, 32, 100324, https://doi.org/10.1016/j.wace.2021.100324, 2021. a
Montecino, V. and Lange, C. B.: The Humboldt Current System: Ecosystem components and processes, fisheries, and sediment studies, Prog. Oceanogr., 83, 65–79, 2009. a
Muñoz, R., Vergara, O. A., Figueroa, P. A., Mardones, P., Sobarzo, M., and Saldías, G. S.: On the phenology of coastal upwelling off central-southern Chile, Dynam. Atmos. Oceans, 104, 101405, https://doi.org/10.1016/j.dynatmoce.2023.101405, 2023. a
Paduan, J. D., Cook, M. S., and Tapia, V. M.: Patterns of upwelling and relaxation around Monterey Bay based on long-term observations of surface currents from high frequency radar, Deep-Sea Res. Pt. II, 151, 129–136, 2018. a
Papritz, L., Pfahl, S., Rudeva, I., Simmonds, I., Sodemann, H., and Wernli, H.: The role of extratropical cyclones and fronts for Southern Ocean freshwater fluxes, J. Climate, 27, 6205–6224, 2014. a
Parada, C. E., Sobarzo, M. A., Figueroa, D., and Castro, L.: Circulación del Golfo de Arauco en un período de transición estacional: Un nuevo enfoque, Investigaciones Marinas, 29, 11–23, 2001. a, b, c
Parise, C. K., Calliari, L. J., and Krusche, N.: Extreme storm surges in the south of Brazil: atmospheric conditions and shore erosion, Brazilian J. Oceanogr., 57, 175–188, 2009. a
Pawlowicz, R., Beardsley, B., and Lentz, S.: Classical tidal harmonic analysis including error estimates in MATLAB using T_TIDE, Comput. Geosci., 28, 929–937, 2002. a
Rahn, D. A. and Garreaud, R. D.: A synoptic climatology of the near-surface wind along the west coast of South America, Int. J. Climatol., 34, 780–792, 2014. a, b, c
Reboita, M. S., Da Rocha, R. P., Ambrizzi, T., and Gouveia, C. D.: Trend and teleconnection patterns in the climatology of extratropical cyclones over the Southern Hemisphere, Clim. Dynam., 45, 1929–1944, 2015. a
Reboita, M. S., Reale, M., da Rocha, R. P., Giorgi, F., Giuliani, G., Coppola, E., Nino, R. B. L., Llopart, M., Torres, J. A., and Cavazos, T.: Future changes in the wintertime cyclonic activity over the CORDEX-CORE southern hemisphere domains in a multi-model approach, Clim. Dynam., 57, 1533–1549, 2021. a, b
Saavedra, N. and Foppiano, A.: Monthly mean pressure model for Chile, Int. J. Climatol., 12, 469–480, 1992. a
Scully, M. E.: Wind modulation of dissolved oxygen in Chesapeake Bay, Estuaries and coasts, 33, 1164–1175, 2010. a
Simmonds, I. and Keay, K.: Mean Southern Hemisphere extratropical cyclone behavior in the 40-year NCEP–NCAR reanalysis, J. Climate, 13, 873–885, 2000. a, b, c
Sobarzo, M., Figueroa, M., and Djurfeldt, L.: Upwelling of subsurface water into the rim of the Biobıo submarine canyon as a response to surface winds, Cont. Shelf Res., 21, 279–299, 2001. a, b
Sobarzo, M., Saldías, G. S., Tapia, F. J., Bravo, L., Moffat, C., and Largier, J. L.: On subsurface cooling associated with the Biobio River Canyon (Chile), J. Geophys. Res.-Oceans, 121, 4568–4584, 2016. a, b
Sobarzo, M., Soto-Riquelme, C., Flores, R. P., and Saldías, G. S.: Synoptic Flow Variability in a River-Influenced Inner Shelf off Central Chile, J. Mar. Sci. Eng., 10, 501, https://doi.org/10.3390/jmse10040501, 2022. a, b, c
Strub, T., J., M., V., M., J., R., and S., S.: Coastal ocean circulation off western South America, in: The Sea, Vol. 11, edited by: Robinson, A. R. and Brink, K. H., Wiley, New York, USA, 11, 273—313, 1998. a
Ulbrich, U., Leckebusch, G. C., and Pinto, J. G.: Extra-tropical cyclones in the present and future climate: a review, Theor. Appl. Climatol., 96, 117–131, 2009. a
Valle-Levinson, A., Atkinson, L. P., Figueroa, D., and Castro, L.: Flow induced by upwelling winds in an equatorward facing bay: Gulf of Arauco, Chile, J. Geophys. Res.-Oceans, 108, https://doi.org/10.1029/2001JC001272, 2003. a
Vander Woude, A. J., Largier, J. L., and Kudela, R. M.: Nearshore retention of upwelled waters north and south of Point Reyes (northern California)–Patterns of surface temperature and chlorophyll observed in CoOP WEST, Deep-Sea Res. Pt. II, 53, 2985–2998, 2006. a
Vergara, O. A., Echevin, V., Sobarzo, M., Sepúlveda, H., Castro, L., and Soto-Mendoza, S.: Impacts of the freshwater discharge on hydrodynamical patterns in the Gulf of Arauco (central-southern Chile) using a high-resolution circulation model, J. Mar. Syst., 240, 103862, https://doi.org/10.1016/j.jmarsys.2023.103862, 2023. a
Viale, M. and Nuñez, M. N.: Climatology of winter orographic precipitation over the subtropical central Andes and associated synoptic and regional characteristics, J. Hydrometeorol., 12, 481–507, 2011. a
Wong, Z., Saldías, G. S., Largier, J. L., Strub, P. T., and Sobarzo, M.: Surface thermal structure and variability of upwelling shadows in the Gulf of Arauco, Chile, J. Geophys. Res.-Oceans, 126, e2020JC01194, https://doi.org/10.1029/2020JC016194, 2021. a
Yannicelli, B., Castro, L. R., Valle-Levinson, A., Atkinson, L., and Figueroa, D.: Vertical distribution of decapod larvae in the entrance of an equatorward facing bay of central Chile: implications for transport, J. Plankton Res., 28, 19–37, 2006. a