the Creative Commons Attribution 4.0 License.
the Creative Commons Attribution 4.0 License.
 | 25 Nov 2025
Seasonal interplay of water mass mixing and nutrient dynamics in an Arctic fjord: a case study of Kongsfjorden, Svalbard
Hyebin Kim
Dukki Han
Sang Rul Park
This study examined seasonal variations in water mass structure and nutrient dynamics in Kongsfjorden, a high Arctic fjord where water mass composition varies seasonally due to mixing among Atlantic Water, Polar Surface Water, and glacial meltwater. In spring, the dominance of Modified Atlantic Water (MAW) facilitated active vertical mixing, leading to relatively high, uniform nutrient concentrations throughout the water column. In summer, the enhanced influence of glacial meltwater and warmer Polar Surface Waters (PSWw) resulted in strong surface stratification and significant nutrient depletion in the upper layer. To disentangle the effects of physical mixing from biological consumption, theoretical nutrient concentrations were calculated based on a four-component water mass mixing model. The positive differences between theoretical and observed concentrations (ΔNutrient) were indicative of significant biological uptake, which accounted for substantial nutrient reductions in observed surface concentrations from spring to summer: approximately 69 ± 18 % for NOx (sum of nitrate and nitrite; NO + NO), 74 ± 15 % for phosphate, and 47 ± 18 % for silicate. Crucially, ΔNutrient values served as a “biogeochemical memory”, reflecting the cumulative net biological consumption since the spring bloom rather than just instantaneous phytoplankton biomass. These biological processes also altered nutrient stoichiometry, as reflected by an increase in the surface dissolved inorganic nitrogen to phosphorus () ratio (DIN = NO + NO + NH; DIP = PO) from 15.0 in spring to 18.8 in summer, indicating a shift in nutrient limitation patterns. Consequently, summer surface waters transitioned toward potential co-limitation, with concentrations of phosphate (∼ 0.13 ± 0.07 µM) and silicate (∼ 1.66 ± 0.39 µM) approaching their respective limitation thresholds. These findings highlight a clear seasonal transition from a physically controlled, nutrient-replete spring to a biologically regulated, nutrient-limited summer. This understanding is crucial for predicting how Arctic fjord ecosystems, and their primary productivity, will respond to ongoing Atlantification and increased freshwater input under climate change.
- Article
(3101 KB) - Full-text XML
- BibTeX
- EndNote


The Arctic marine ecosystem, which is characterized by unique and dynamic environmental conditions, is governed by the complex interaction of physical, chemical, and biological factors. Within this system, nutrient availability, which is primarily controlled by ocean currents, riverine discharge, and atmospheric deposition, plays a fundamental role in maintaining biological productivity and ecological health (Duarte et al., 2012; Tovar-Sánchez et al., 2010). These nutrients are particularly vital for primary production, which is the foundation of the Arctic marine food web. Ocean currents, notably Atlantic and Pacific inflows, transport essential nutrients into the Arctic Ocean, thus influencing regional primary productivity (Carmack and Wassmann, 2006; Codispoti et al., 2013; Torres-Valdés et al., 2013). As a result, seasonal fluctuations in sea ice, solar radiation, and water column stratification drive nutrient dynamics and productivity cycles (Arrigo et al., 2014). In particular, during spring and summer, increased sunlight and meltwater often promote stratification and phytoplankton blooms (Hodal et al., 2012; Tremblay et al., 2015).
Arctic fjords such as Kongsfjorden in Svalbard are useful areas for assessing nutrient cycling processes due to the interactions between advected ocean currents (e.g., warm, saline Atlantic Water) and local water masses (Cottier et al., 2005; Svendsen et al., 2002; Hegseth and Tverberg, 2013). The inflow of nutrient-rich Atlantic Water has been shown to play a key role in regulating nutrient supply and productivity in fjord systems, contributing to complex spatiotemporal variability (Carmack and Wassmann, 2006). Understanding these dynamics, especially before and after blooms, is therefore essential for predicting how Arctic fjord ecosystems respond to environmental changes. This is because seasonal shifts in nutrient availability and plankton community structure strongly influence the region's fundamental biogeochemical processes (Tremblay et al., 2015; Vonnahme et al., 2022; Singh et al., 2020). Water mass mixing significantly influences nutrient distribution in Arctic fjords (Randelhoff et al., 2017; Hodal et al., 2012; Tamelander et al., 2013; Rysgaard et al., 1999). While AW inflow can enhance productivity by supplying nutrients (Carmack and Wassmann, 2006; Torres-Valdés et al., 2013), a quantitative understanding of how physical mixing and biological processes separately contribute to seasonal nutrient depletion remains a key knowledge gap. Disentangling these effects is critical for accurately assessing the biological drivers of productivity.
The present study addresses these gaps by examining seasonal (spring/summer) variation in water mass mixing and nutrient dynamics in Kongsfjorden. Specifically, a nutrient anomaly approach (ΔNutrient) derived from a water mass mixing model to quantify the net biological impact on the nutrient inventory. Furthermore, it aims to determine the impact of these seasonal mixing patterns, notably the active vertical mixing characteristic of spring and the enhanced stratification observed in summer on nutrient concentrations. A key aspect of this study is to explore whether differences between theoretical nutrient concentrations, derived from mixing models, and actual observed nutrient levels can be effectively used to discern the influence of biological processes. Specifically, this study tests the hypothesis that the difference between theoretical (mixing-derived) and observed nutrient concentrations can effectively quantify the cumulative influence of biological processes. By comparing these observed and theoretical nutrient levels, this study will assess the relative influence of physical mixing versus biological processes. Ultimately, this research aims to provide crucial baseline data for understanding how Arctic marine ecosystems respond to climate change, particularly in the context of warming-induced alterations to water masses and mixing dynamics within sensitive fjord environments.
2.1 Study Sites
Kongsfjorden, an Arctic fjord situated on the west coast of Spitsbergen, Svalbard, was used as the primary study site (Fig. 1). This fjord is approximately 20 km in length and varies in width from 4 to 10 km, reaching a maximum depth of approximately 300 m near its mouth. The hydrography in Kongsfjorden is characterized by significant freshwater input from several tidewater glaciers, a process that is more intense during the summer melt season. Furthermore, the fjord is influenced by the advection of relatively warm and saline AW transported via the West Spitsbergen Current and by the presence of colder, fresher waters of Arctic origin.
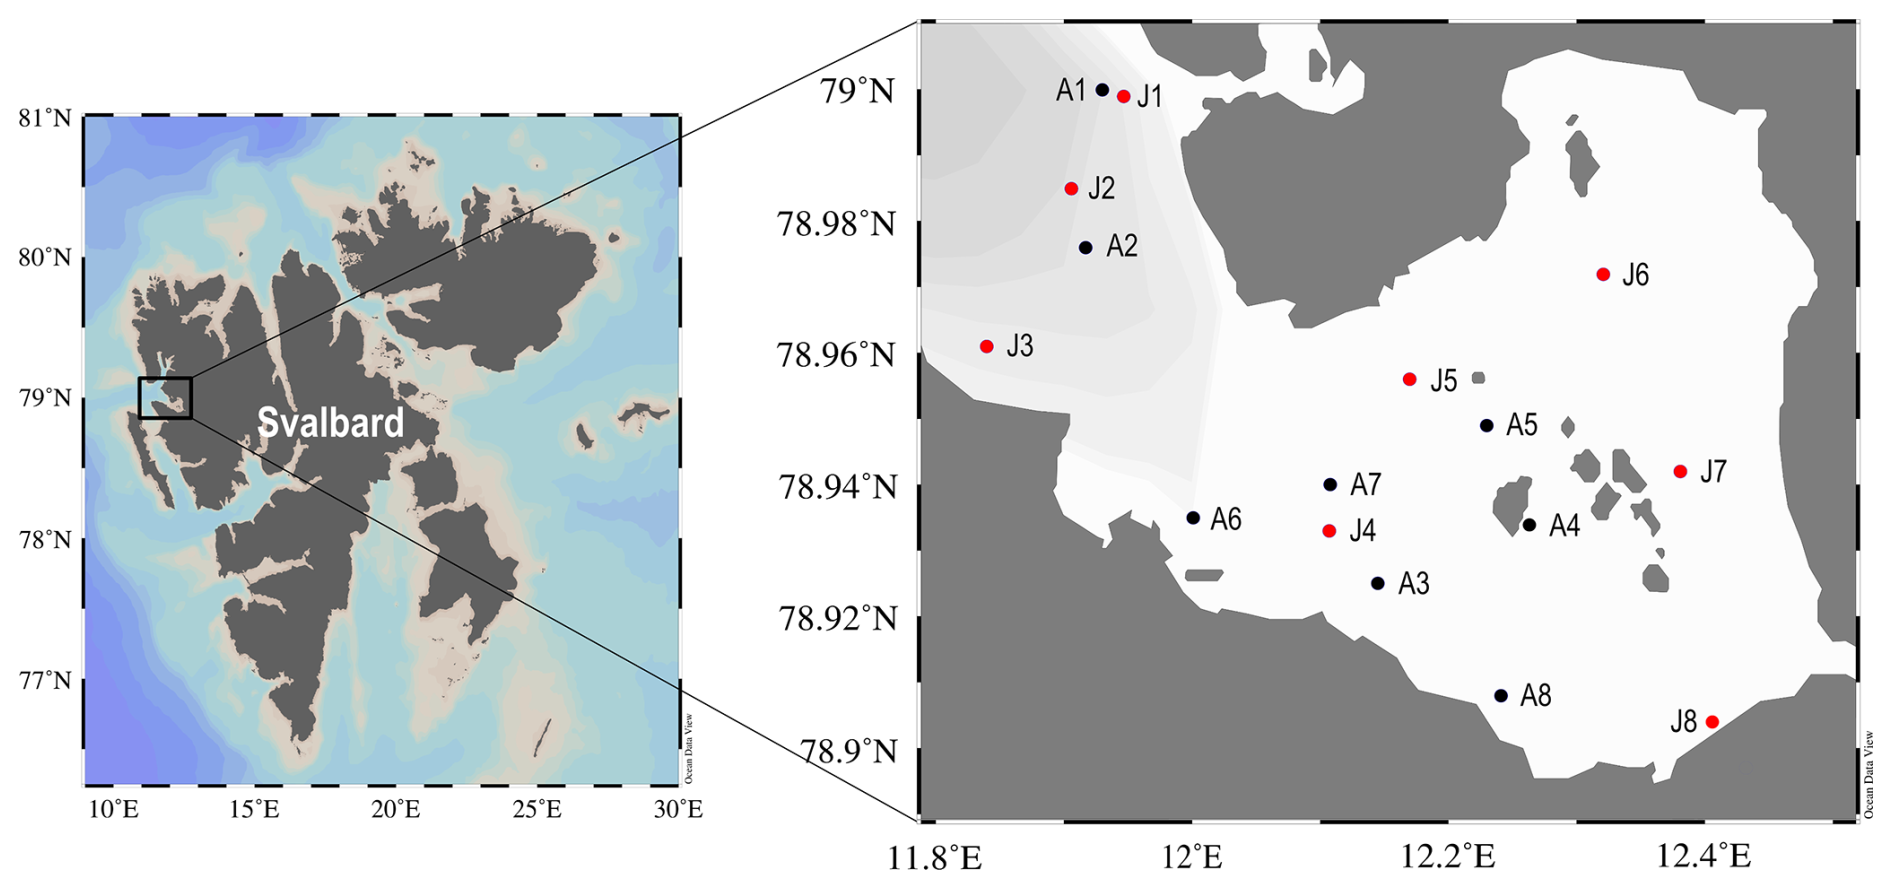
Figure 1Map of the study area in Kongsfjorden, which is located on the west coast of Spitsbergen, Svalbard. Sampling stations from the spring (April 2023) and summer (July 2023) cruises are shown. Black circles represent spring and red circles represent summer.
2.2 Sampling and Analytical Methods
Seawater samples were collected from three discrete depths within vertical water columns using a conductivity-temperature-depth (CTD) rosette system aboard the MS Teisten (April) and the RV Helmer Hanssen (July) during 2023 in Svalbard. Sampling depths were adjusted by season to capture key hydrographic features. In spring (April), samples were collected at 0 m (surface), 20 m (mid-depth), and 50 m (deep) to represent the well-mixed water column. In summer (July), a more stratified sampling strategy was employed to resolve the sharp vertical gradients caused by meltwater; samples were collected from 0–5 m (surface), 10–25 m (mid-depth, capturing the thermocline), and 50–100 m (deep). Detailed station-specific depths are provided in the caption of Fig. 4. During sample collection, the salinity and temperature were measured using sensors within the CTD system. Fluorescence was measured using a CTD attached fluorometer and is presented in fluorescence-derived chlorophyll-a concentrations (mg m−3).
Dissolved inorganic nutrients (NO2−, NO3−, PO, and Si(OH)4) were analyzed using a nutrient autoanalyzer (New QuAAtro39; SEAL Analytical, UK). For each nutrient, 50 mL of seawater was filtered through 0.7 µm GF/F filters (25 mm, Whatman Inc., Florham Park, NJ, USA). This filtration was conducted using acid-washed syringes, and the filtrate was collected in polypropylene conical tubes, which were stored at −20 °C until analysis. To ensure the accuracy and precision of the nutrient analysis, certified reference materials for each nutrient were run concurrently with the samples. According to the certified reference material (KANSO Co., LTD), the analytical uncertainty was within 5 % for dissolved inorganic nutrients. Hereafter, the sum of nitrate (NO) and nitrite (NO) is referred to as NOx, PO as phosphate, and Si(OH)4 as silicate. This terminology is used to ensure accuracy as nitrite concentrations, while minor, were not consistently negligible. For the analysis of nutrient ratios, dissolved inorganic nitrogen (DIN) was calculated as the sum of NO, NO, and NH, while dissolved inorganic phosphorus (DIP) corresponded to PO.
2.3 Water Mass Analysis and Theoretical Nutrient Concentrations
To assess the seasonal variability in the hydrographic structure of the fjord and its influence on the distribution of nutrients, water mass analysis was conducted. The mixing ratios of the different water masses present in Kongsfjorden were calculated using observed temperature and salinity data for both spring and summer. This analytical approach was in accordance with established methodologies detailed by Miller (1950) and Tomczak (1999), which require the precise definition of characteristic end-member water types that contribute to the observed water properties within the fjord. Nutrient concentrations for the end-members were adopted from the comprehensive study of Duarte et al. (2021), which provides representative background values for the water masses advected into the Svalbard region.
In the present study, four principal end-member water types were used in the mixing model due to their characteristic presence and influence in the Arctic region and specifically in Kongsfjorden: Atlantic Water (AW), Modified AW (MAW), Polar Surface Water (PSW), and its warmer variant Polar Surface Water warm (PSWw). While glacial meltwater (GMW) is a significant source of freshwater in summer, its direct influence was simplified and incorporated into the characteristics of PSWw, which represents the warm, low-salinity surface layer. This assumption is further addressed in the discussion regarding silicate dynamics. The selection of these water types was consistent with previous hydrographic characterization of the region (Nilsen et al., 2008; Rudels et al., 2000). AW, which is defined by its relatively high temperature and salinity, originates from lower latitudes and is advected into the Arctic. MAW represents AW that has undergone significant transformation through cooling, freshening, and nutrient alteration following its entry and circulation within the Arctic system. PSW is characterized by its cold temperatures and lower salinity, typically occupying the upper layers of the water column and originating from Arctic surface processes. PSWw shares many of the same general characteristics as PSW but is distinguished by notably warmer temperatures, often reflecting the influence of seasonal surface heating and increased meltwater input, particularly during the summer months.
The temperature–salinity (T–S) characteristics defining these end-members are detailed in Table 1 and visually represented in Fig. 2a. These definitions were carefully established based on a combination of established values from past research (e.g., Rudels et al., 2000) and an examination of the observed distribution of T–S data collected during the present study. This dual approach ensured that the defined end-members comprehensively and accurately covered the full spectrum of water types observed in Kongsfjorden during the sampling periods. Because the hydrographic properties of the deep-water masses in Kongsfjorden exhibited minimal temporal variation between the spring and summer seasons, a single, consistent set of T–S characteristics for each end-member was employed for water mass analysis in both the spring and summer datasets, allowing for a direct comparison of seasonal shifts in their relative contributions.
Table 1Temperature (°C), salinity, and nutrient concentrations (NOx, phosphate, and silicate; µM) for the four end-member water types: Atlantic Water (AW), Modified Atlantic Water (MAW), Polar Surface Water (PSW), and warm Polar Surface Water (PSWw). The temperature-salinity (T–S) definitions were adopted from Rudels et al. (2000), with σ0 represents the potential density anomaly referenced to 0 dbar. determined based on the characteristics of the most representative samples collected in this study (identified at the vertices of the T–S diagram in Fig. 2a). Nutrient values for each water mass are based on literature values from Duarte et al. (2021).
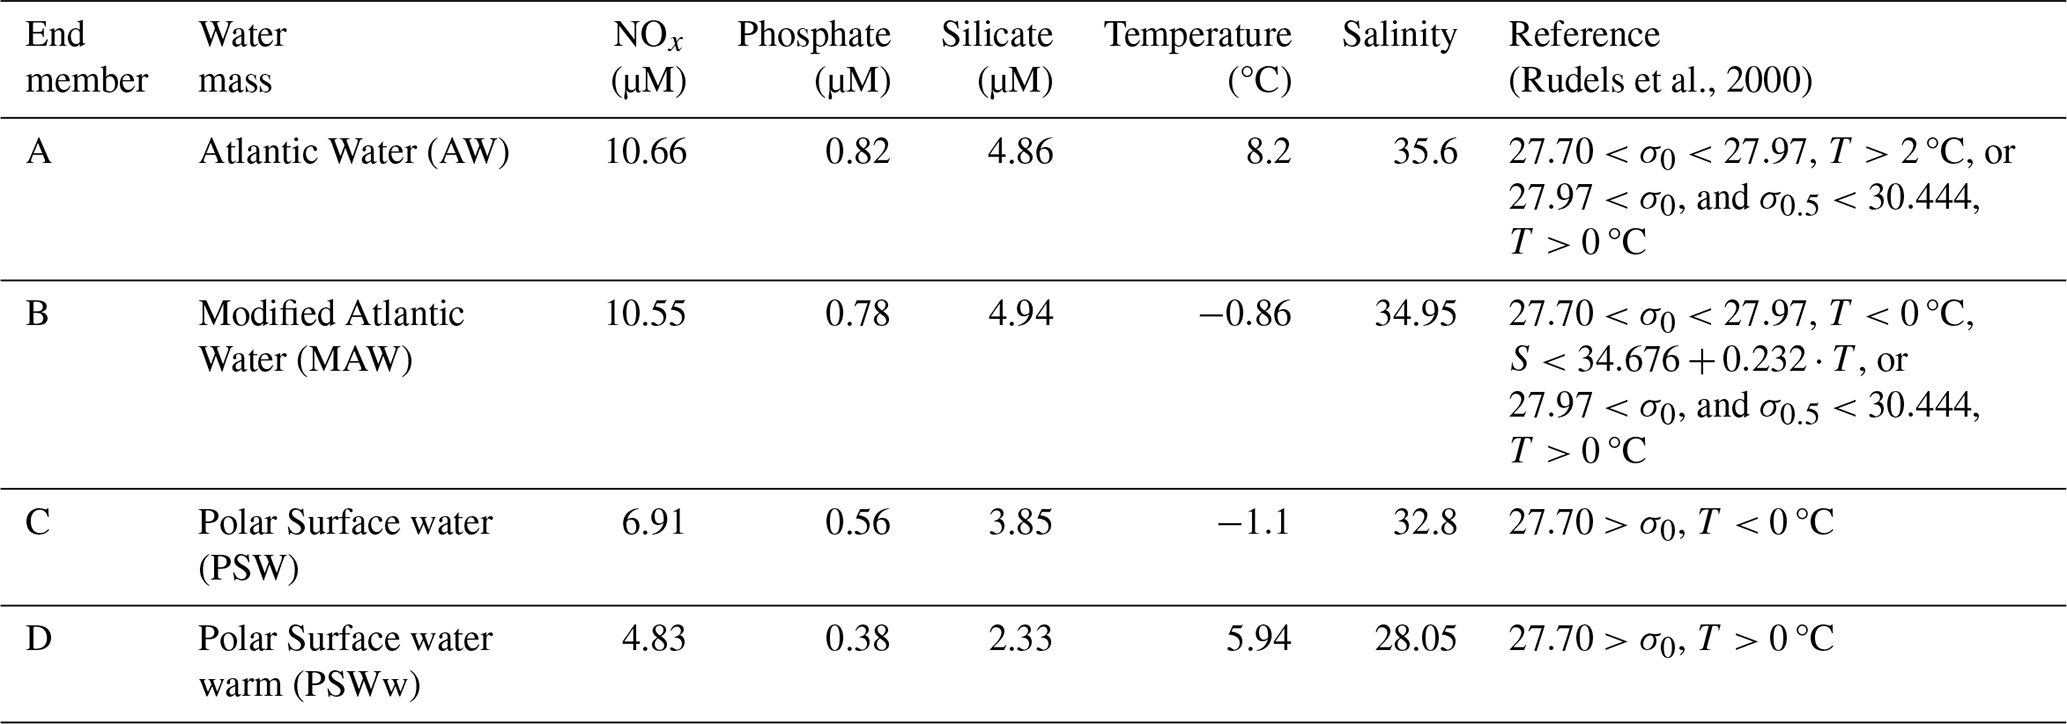
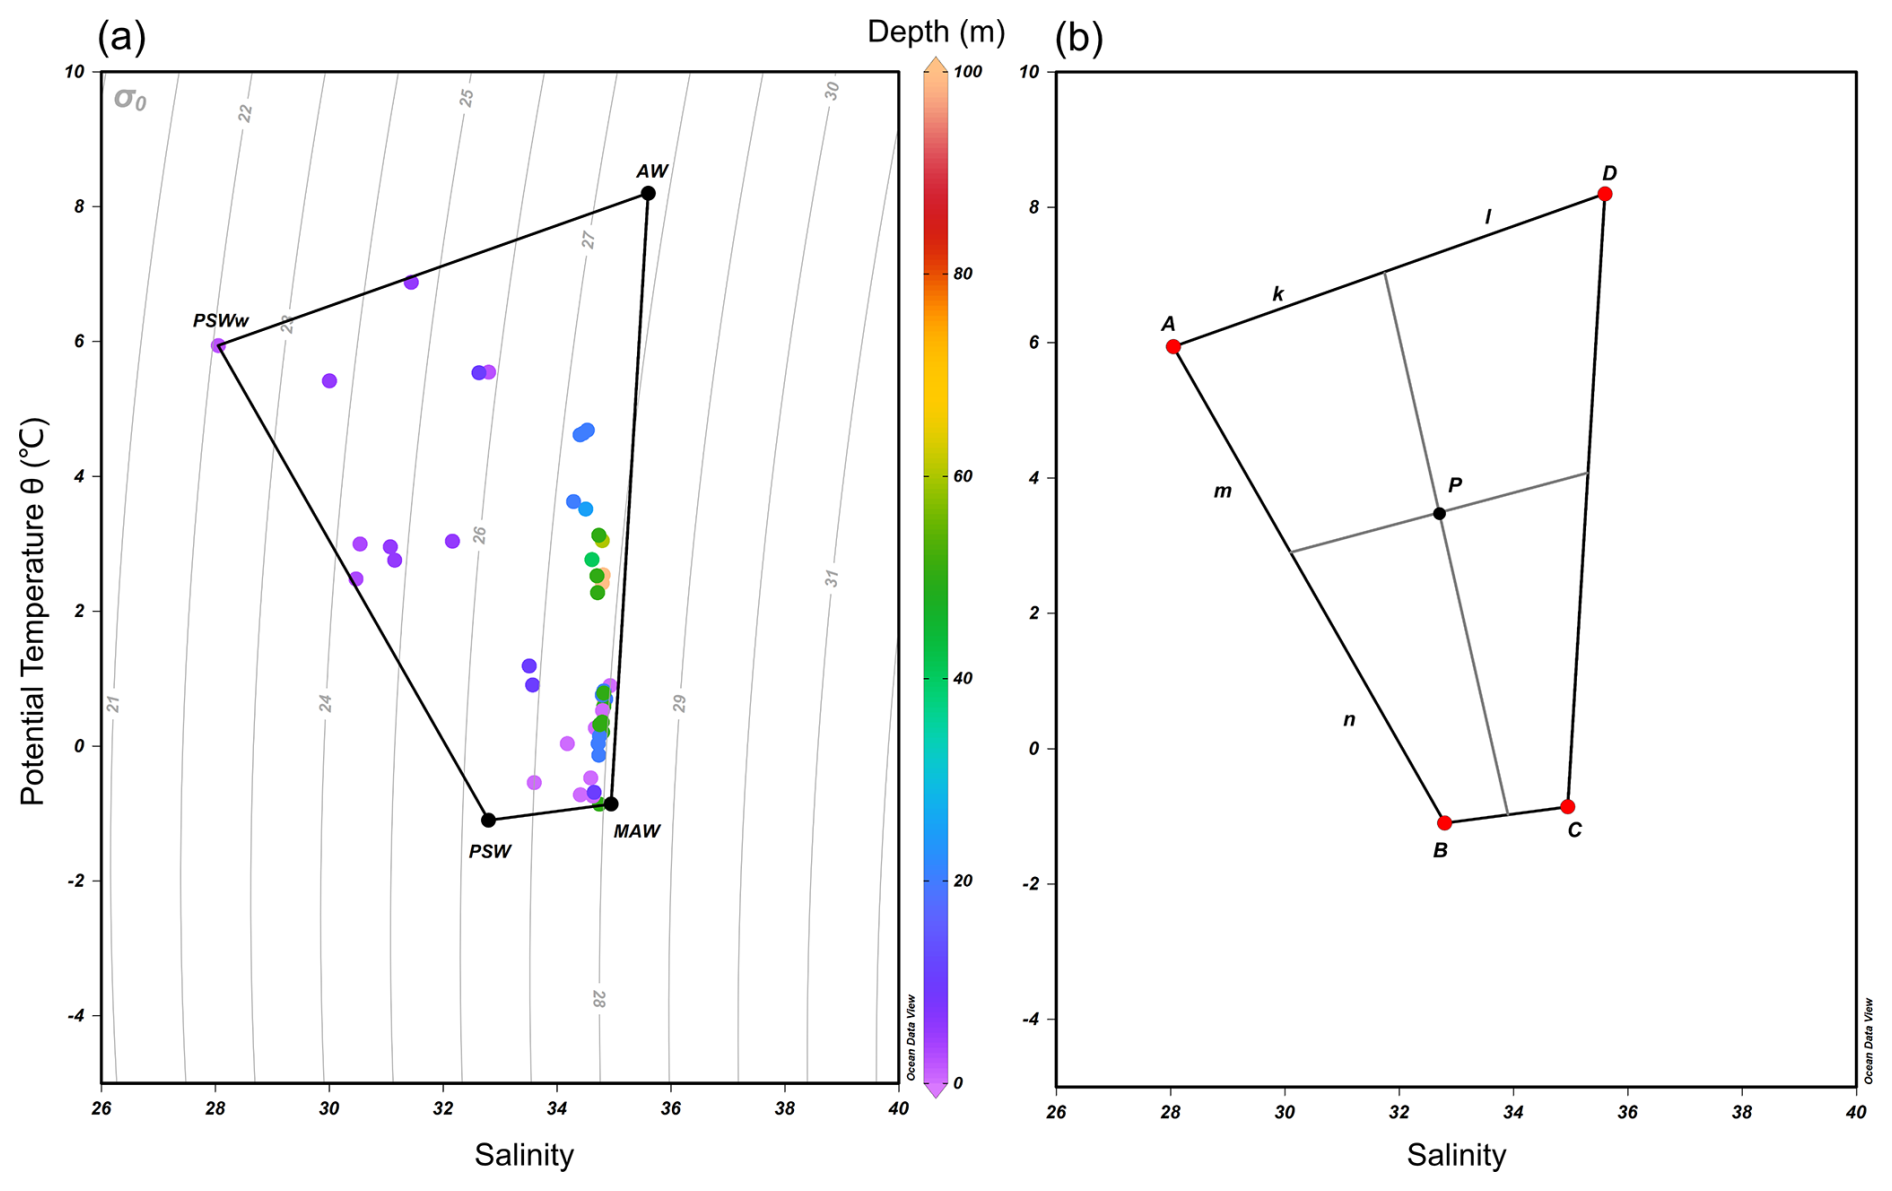
Figure 2(a) Temperature–salinity (T–S) diagram showing the four end-member water types used in this study: Atlantic Water (AW), Modified Atlantic Water (MAW), Polar Surface Water (PSW), and warm Polar Surface Water (PSWw). These end-members were defined based on previously published criteria (e.g., Rudels et al., 2000) and supported by hydrographic data collected during the cruises (Table 1). (b) Conceptual diagram of the four-end-member mixing framework. Point P denotes an arbitrary water parcel in T–S space. Its location relative to the end-members was used to estimate fractional contributions (fA, fB, fC, and fD), with the sum constrained to unity (.
The fractional contribution of AW, MAW, PSW, and PSWw (denoted as A, B, C, and D, respectively, Table 1) to any given water sample (P) collected within the fjord was calculated using a standard four end-member mixing model (Fig. 2b). This model operates on the principle of the conservative mixing of temperature and salinity (Miller, 1950). The output of this model provides the fractional contributions (fA, fB, fC, and fD) of each end-member to the sampled water under the fundamental constraint that the sum of these individual fractions equals unity (i.e., , or 100 %).
Theoretical nutrient concentrations (Nutrient∗) for each sample were calculated by multiplying the fraction of each end-member water mass (defined in Table 1) by its end-member nutrient concentration (Nutx) and summing the contributions as follows:
To assess the biological impact on nutrient concentrations, the difference (ΔNutrient) between the theoretical and observed concentrations was calculated:
A positive value indicated net nutrient removal beyond physical mixing, which was attributed to the net biological effect, primarily biological consumption.
2.4 Uncertainty Assessment
To evaluate the robustness of these calculations, a sensitivity analysis was performed to quantify the uncertainty propagated from the end-member nutrient definitions. The end-member concentrations for NOx, phosphate, and silicate were varied by ± 10 %. This range was selected as a conservative estimate of natural variability, supported by regional and global oceanographic studies that report nutrient concentrations in major water masses to generally vary within 5 %–15 % of the mean (Torres-Valdés et al., 2013; Hopwood et al., 2020). The resulting range in the calculated ΔNutrient values was used to define the uncertainty of the model-derived results, which is reported alongside the key quantitative findings. This assessment provides a measure of confidence in the conclusions against potential variations in the end-member characteristics.
2.5 Statistical analysis
All statistical analyses were performed using SPSS ver. 19 (IBM Corp., Armonk, NY, USA). Prior to hypothesis testing, the normality of the data was assessed using the Shapiro–Wilk test. Depending on the results of the normality test, either independent samples t-tests (for normally distributed variables) or Mann–Whitney U tests (for non-normally distributed variables) were applied to compare differences between groups. A significance level of p<0.05 was used for all tests.
3.1 Seasonal Variation in Hydrography and Observed Dissolved Inorganic Nutrient Levels
Kongsfjorden exhibited distinct seasonal hydrographic conditions during the study period (Fig. 3). Water temperatures in the fjord ranged from a minimum of −0.86 °C to a maximum of 6.88 °C (Fig. 3a), and salinity ranged from a minimum of 28.05 to a maximum of 34.93 (Fig. 3b). The spring season was characterized by lower temperatures, with a mean temperature of 0.16 ± 0.56 °C, and relatively high and uniform salinity, averaging 35.67 ± 0.28. In contrast, summer had significantly warmer waters (mean: 3.56 ± 1.49 °C) and markedly lower and more variable salinity (mean: 33.03 ± 1.92). These hydrographic changes were primarily driven by seasonal increases in solar radiation, sea ice meltwater, and glacial freshwater input, which collectively enhanced the vertical stratification of the water column.
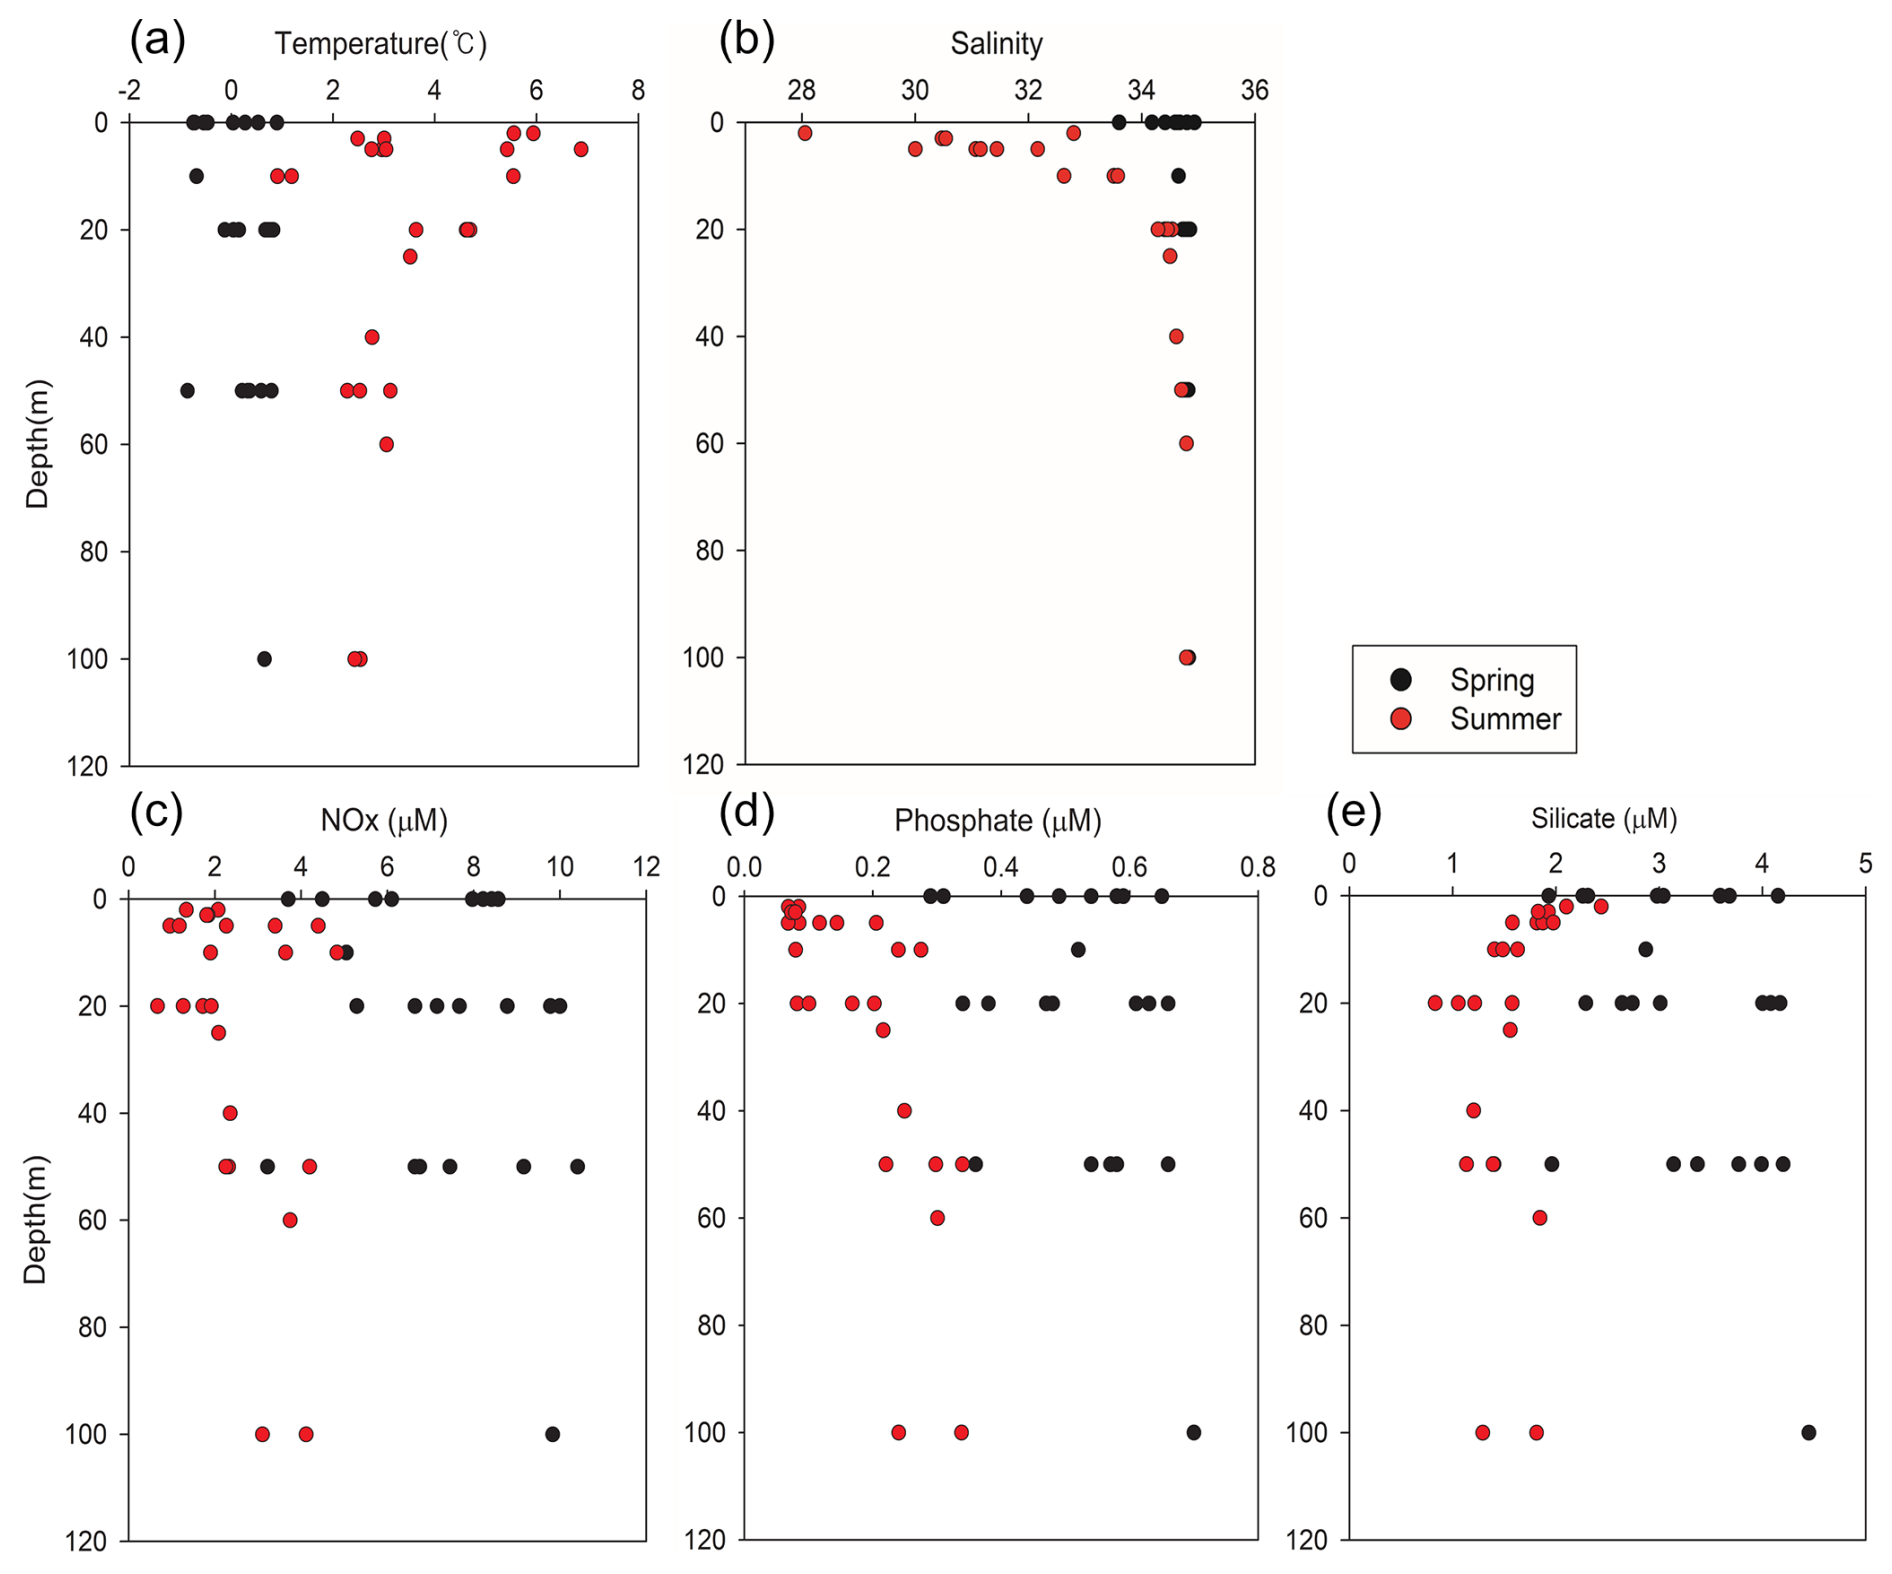
Figure 3Vertical profiles of (a) temperature (°C), (b) salinity, and (c) nitrate (µM), (d) phosphate (µM), and (e) silicate levels (µM) in Kongsfjorden. Black circles indicate spring data; red circles indicate summer data. Data represent measurements from multiple stations and depths.
Consistent with these hydrographic shifts, the levels of dissolved inorganic nutrients also exhibited strong seasonal patterns. The NOx concentration varied from 0.67 to 10.41 µM (Fig. 3c). During spring, the mean surface nitrate level was 7.10 ± 1.83 µM. In summer, however, mean surface nitrate concentrations decreased significantly to 2.20 ± 1.15 µM, representing an approximate 69 ± 18 % reduction from spring levels. While surface nitrate was depleted, concentrations in deeper water remained high, resulting in a stronger vertical gradient in summer compared to that in spring. This suggests that active vertical mixing replenished surface nutrients in spring, whereas reduced mixing and significant biological uptake occurred during the summer period.
Phosphate concentrations ranged from 0.07 to 0.70 µM (Fig. 3d). The spring surface mean was 0.50 ± 0.12 µM, declining considerably to 0.13 ± 0.07 µM during summer, a reduction of approximately 74 ± 15 %. Notably, summer phosphate concentrations often fell below the 0.20 µM threshold commonly regarded as limiting for phytoplankton growth in Arctic waters (Tremblay et al., 2015). Thus, there was a strong likelihood of phosphate limitation during this period, particularly given that phosphate declined at a greater rate than nitrate from spring to summer.
Silicate concentrations ranged from 0.83 to 4.45 µM (Fig. 3e). The mean surface concentration was 3.11 ± 0.72 µM in spring, decreasing to 1.66 ± 0.39 µM in summer, representing a 47 ± 18 % reduction. The summer surface silicate concentration approached the 2 µM threshold frequently cited as indicative of potential silicate limitation for diatom growth (Egge and Aksnes, 1992). In some samples, the summer surface silicate concentrations were higher than expected despite biological uptake, likely due to the influence of glacial meltwater enriched in silicate via bedrock erosion (Hawkings et al., 2017).
Statistical analysis confirmed that the seasonal differences observed for all three nutrients were significant (p<0.05 for all comparisons). These observed nutrient patterns in Kongsfjorden were largely consistent with findings from previous studies in the same location (e.g., Hodal et al., 2012). However, the background nutrient levels observed in this study were generally higher than those reported for some other Arctic regions, such as Young Sound, Greenland (Rysgaard et al., 1999), a difference attributable to the stronger and more direct influence of nutrient-rich AW in the Svalbard region. Spatial differences were also apparent within Kongsfjorden; in particular, stations with higher contributions from PSWw exhibited more pronounced summer surface nutrient depletion, particularly for phosphate, which had mean concentrations as low as 0.08 ± 0.03 µM. (This observation will be further discussed in the context of nutrient limitation in Sect. 3.4). This likely reflects the influence of glacial meltwater input and enhanced stratification associated with PSWw-dominated surface layers.
3.2 Seasonal Characteristics of Water Masses and Theoretical Nutrient Concentrations
The four-component end-member mixing model revealed distinct seasonal distributions of water masses within Kongsfjorden (Fig. 4). Overall, MAW, with a mean contribution of 52 ± 29 %, and AW (20 ± 16 %) were the dominant water masses influencing the fjord. These water masses are recognized as the primary sources of inorganic nutrients in this system. The contributions of PSW (14 ± 13 %) and PSWw (14 ± 14 %) were lower on average, though their influence varied considerably with season and depth.
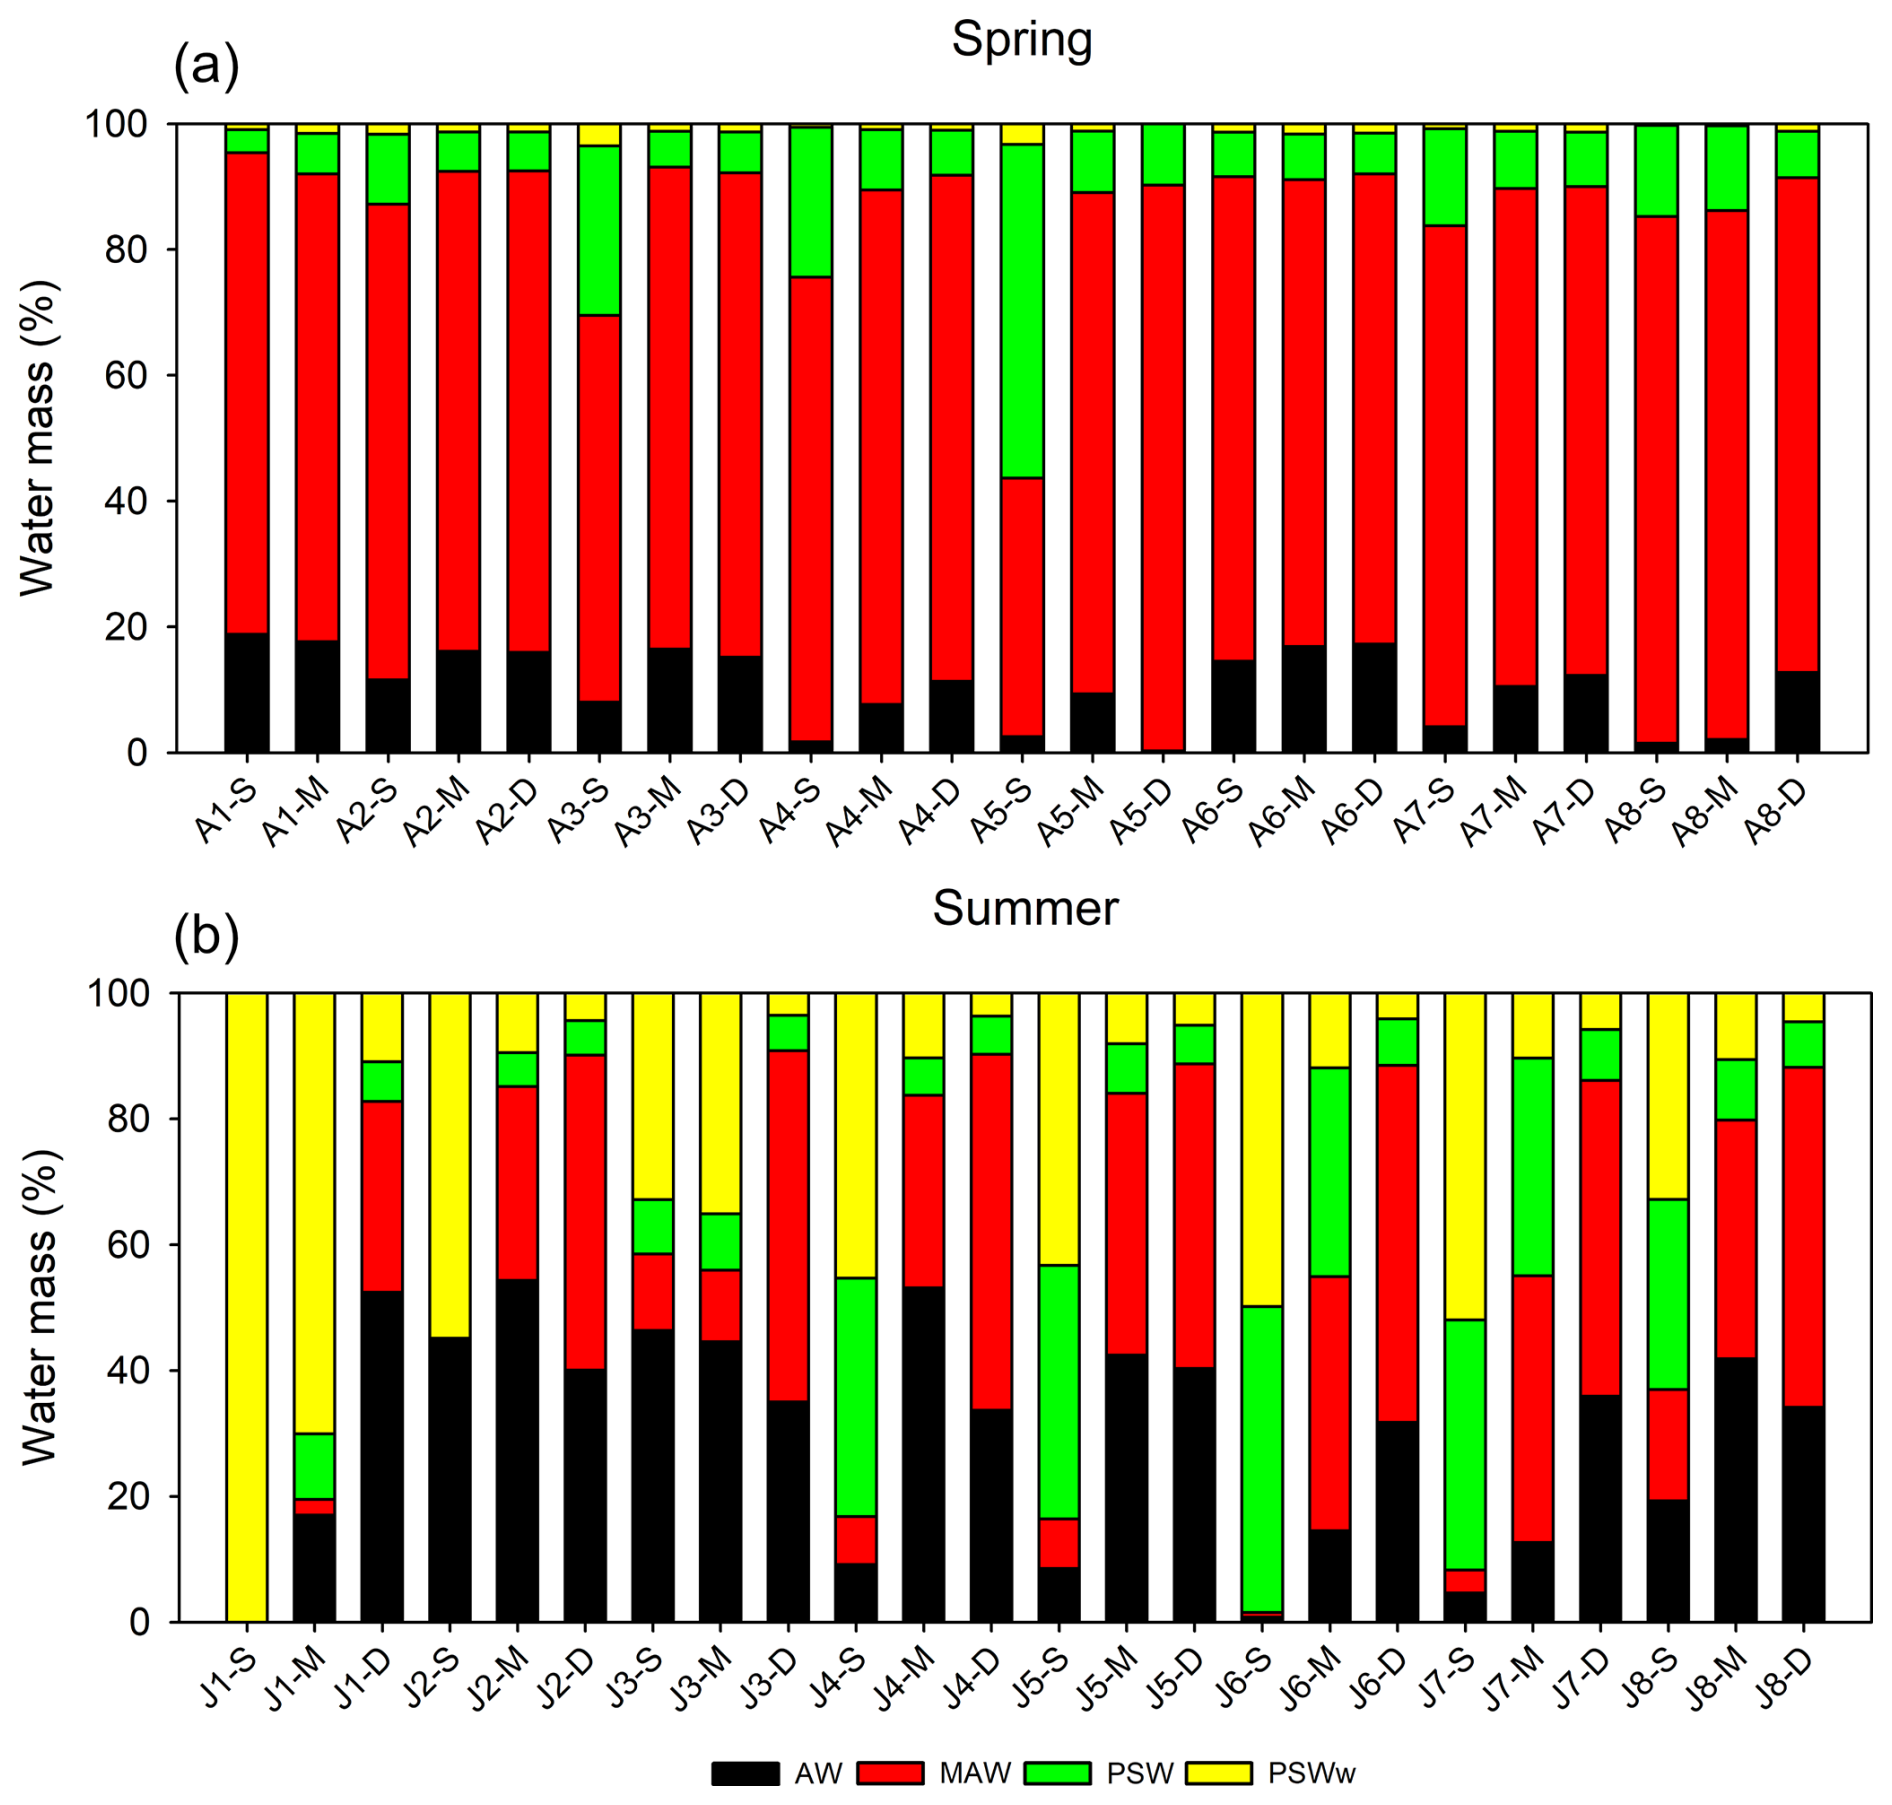
Figure 4Relative contributions of the four end-member water masses (AW, MAW, PSW, and PSWw) in Kongsfjorden during (a) spring and (b) summer based on the four-component mixing model. Labels on the x-axis indicate the sampling station followed by the relative sampling depth: S (Surface), M (Mid-depth), and D (Deep). For the spring cruise (a), S, M, and D samples were typically collected at 0, 20, and 50 m, respectively (except for station A2, where D was 100 m). For the summer cruise (b), sampling depths varied by station, with S samples from 0–5 m, M from 10–25 m, and D from 50–100 m for all stations except J1. At station J1, S, M, and D samples were collected at 2, 5, and 20 m, respectively.
During the spring season, the proportion of MAW was generally higher throughout the water column than in summer, suggesting the active mixing of the inflowing AW and the resident PSW. This mixing is facilitated by physical and chemical processes in the Arctic Ocean that promote the formation of MAW (Rudels et al., 2005), resulting in a relatively uniform vertical distribution of water masses from the surface to the deep layers of the fjord. In contrast, the summer season was characterized by a marked shift in the water mass composition. The surface layer (0–30 m) had a considerably higher proportion of PSWw (33 ± 25 %) and PSW (19 ± 16 %), which was primarily associated with seasonal sea ice meltwater, surface warming, and freshwater-induced stratification. However, the deep layer (>50 m) remained dominated by AW (36 ± 3 %) and MAW (53 ± 3 %). This vertical stratification limited the vertical exchange of water and nutrients between the surface and deep layers.
The observed water mass distribution patterns were broadly consistent with previous descriptions of Kongsfjorden by Svendsen et al. (2002) and Cottier et al. (2005). However, the proportion of MAW observed in this study was substantially higher than reported in some earlier studies, which may reflect the ongoing process of Atlantification, which is the enhanced penetration of Atlantic-origin waters into the Arctic Ocean (Polyakov et al., 2012), or be the result of long-term changes in the Arctic hydrography and climate. This trend suggests that future warming could further intensify the influence of warm, saline Atlantic-origin waters, fundamentally altering the fjord's stratification and nutrient supply regimes. Additionally, continued glacier melting driven by regional warming is expected to increase the volume of PSWw, thus intensifying surface stratification in the future.
3.3 Biological Impact on Nutrient Concentrations: Differences between Observed and Theoretical Concentrations (ΔNutrient)
To assess the biological influence on nutrient dynamics, the observed nutrient concentrations were compared to theoretical values derived from end-member mixing (Fig. 5). The difference represents net nutrient removal that exceeds a level that can be explained by physical mixing alone. A positive ΔNutrient value indicates that observed concentrations are lower than expected from conservative mixing, thus suggesting biological uptake or transformation. With few exceptions, observed nutrient concentrations were significantly lower than theoretical values (p<0.05 for all three nutrients), resulting in consistently positive ΔNutrient values. This provides strong evidence for substantial nutrient removal in Kongsfjorden beyond what can be accounted for by physical advection and mixing, with phytoplankton uptake the most likely mechanism.
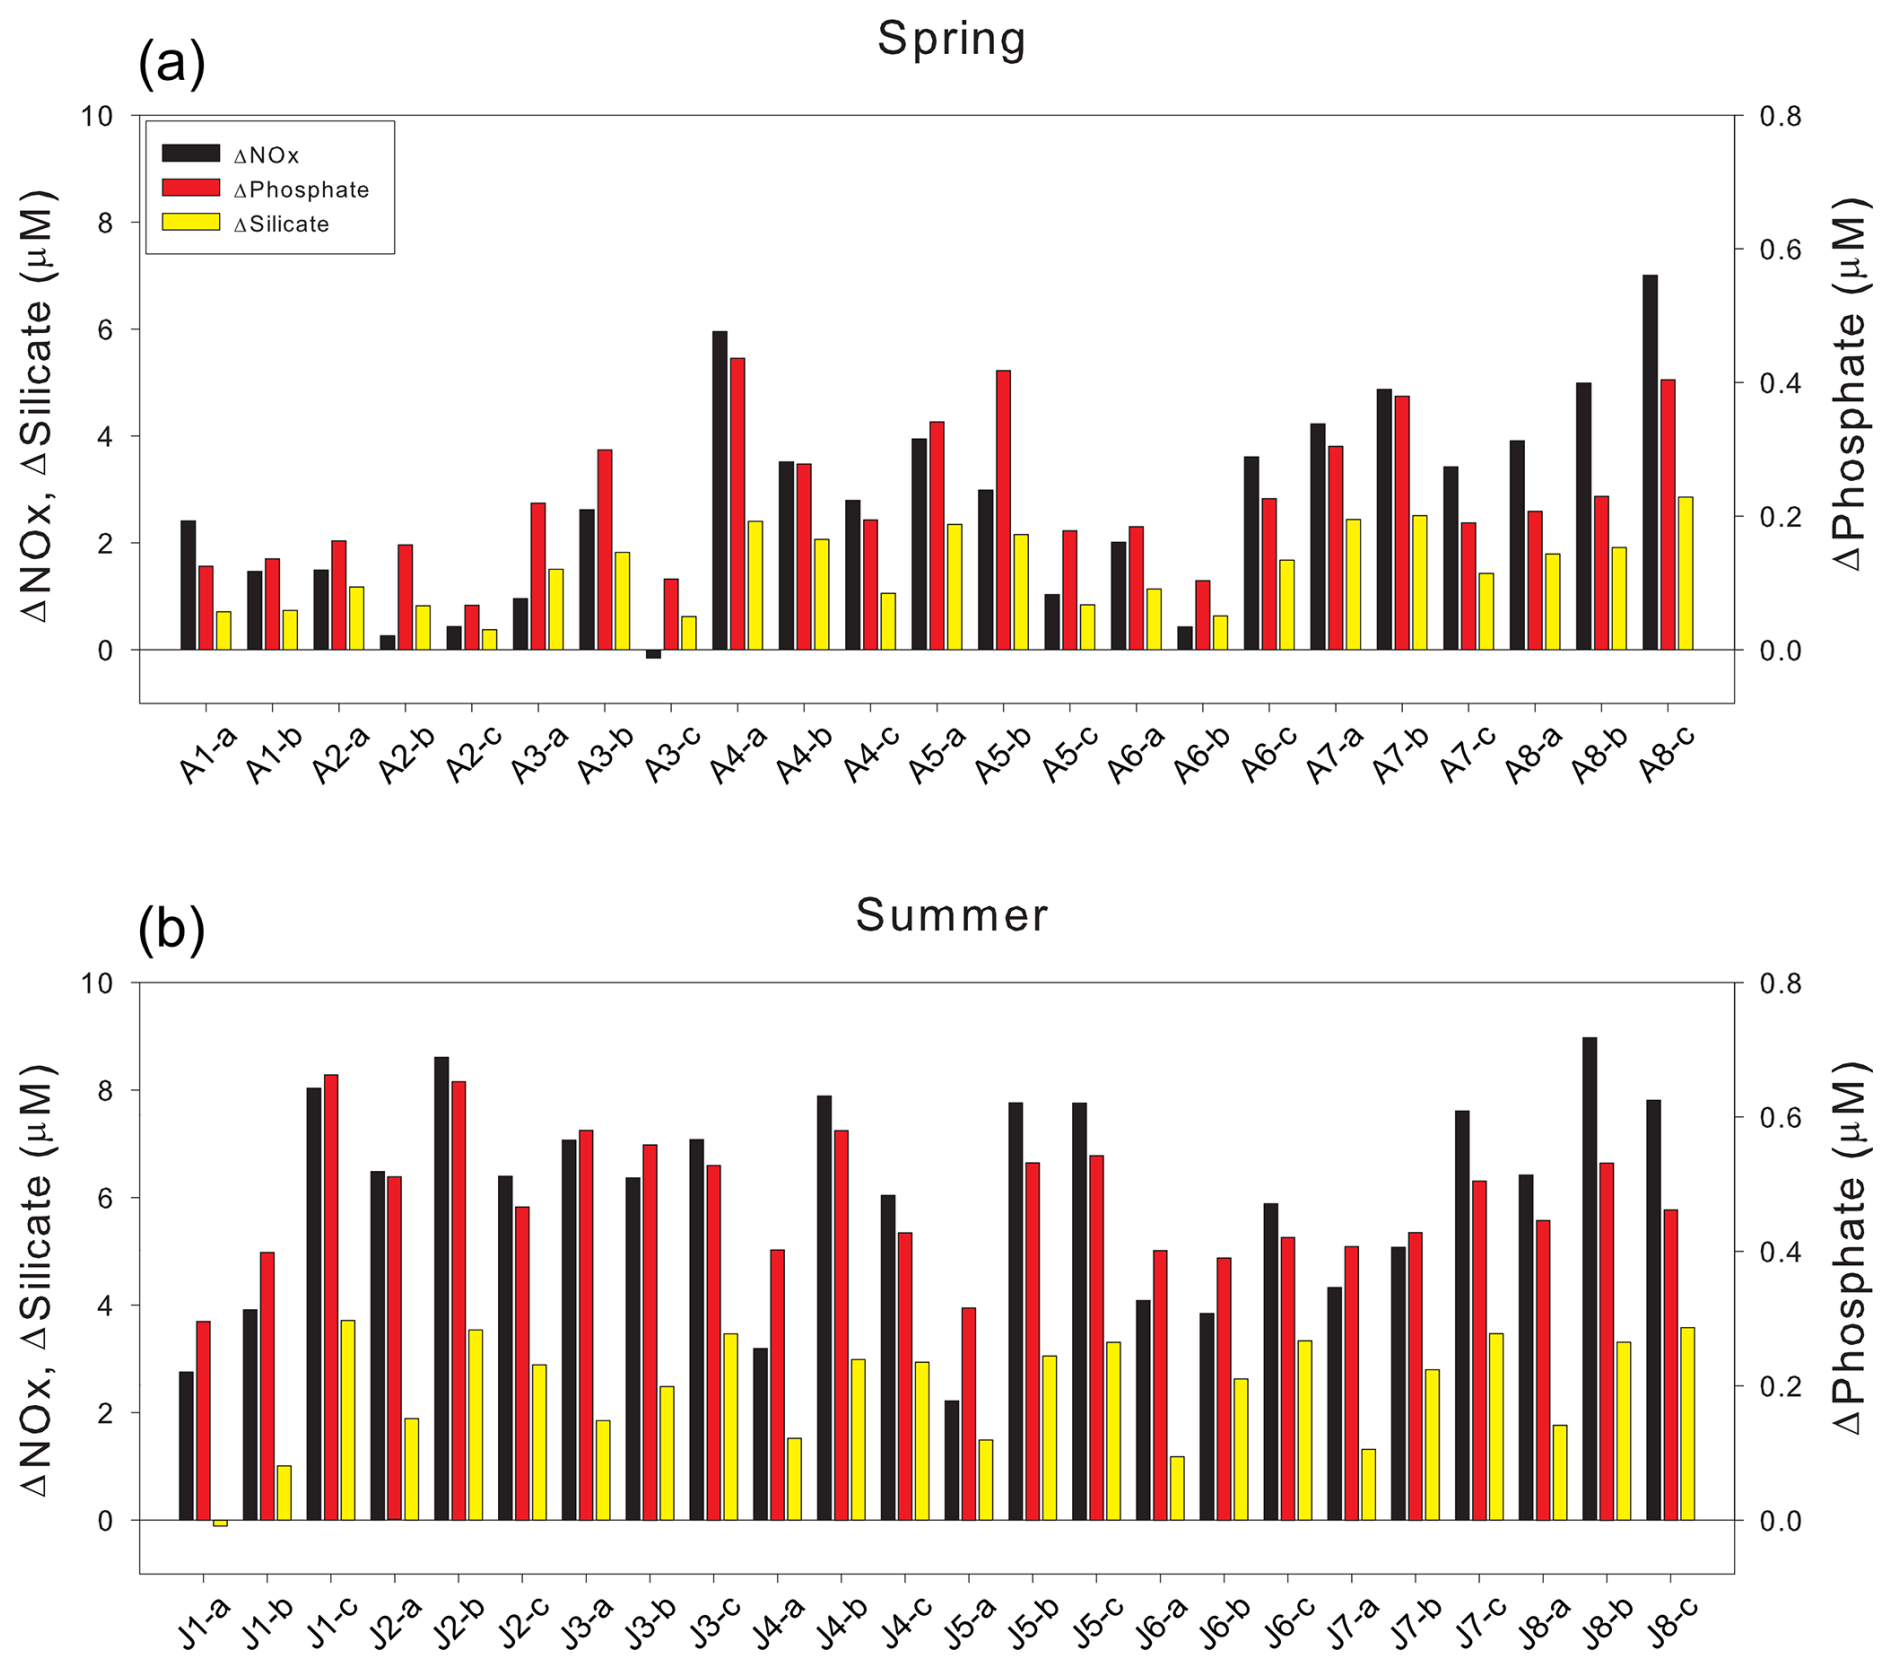
Figure 5Differences between theoretical (mixing-derived) and observed nutrient concentrations (ΔNutrient = Theoretical − Observed; µM) during (a) spring and (b) summer. Bars represent ΔNutrient values for nitrate, phosphate, and silicate, as indicated in the legend.
Seasonal and depth related comparisons of ΔNutrient values highlight the extent of this biological influence. ΔNOx increased from spring (mean surface: 3.13 ± 1.64 µM; mean deep: 2.66 ± 2.26 µM) to summer (mean surface: 5.76 ± 1.99 µM; mean deep: 7.03 ± 0.75 µM). A similar trend was observed for ΔPhosphate, rising from spring (mean surface: 0.25 ± 0.10 µM; mean deep: 0.20 ± 0.10 µM) to summer (mean surface: 0.48 ± 0.11 µM; mean deep: 0.48 ± 0.04 µM). ΔSilicate also increased between seasons, from spring mean (surface: 1.65 ± 0.66 µM; mean deep: 1.27 ± 0.77 µM) to summer (mean surface: 2.14 ± 0.99 µM; mean deep: 3.28 ± 0.25 µM). These consistently larger summer ΔNutrient values strongly indicate enhanced biological uptake during the stratified summer, representing the cumulative effect of nutrient consumption that occurred since the spring bloom.
In spring, slightly higher surface ΔNutrient values imply active phytoplankton uptake in the surface layer, potentially supported by vertical nutrient replenishment from underlying waters. During summer, the increase in ΔNOx and ΔSilicate at depth relative to the surface points to pronounced nutrient depletion in surface waters and subsequent export of organic matter. These elevated values at depth likely result from sustained biological uptake below the surface or from the downward transport of nutrient-depleted waters, with only limited remineralization during transport, ultimately leading to deep nutrient concentrations lower than those predicted by conservative mixing.
While this interpretation primarily attributes nutrient deficits to biological uptake, it is important to acknowledge that remineralization occurring below the euphotic zone could potentially regenerate nutrients at depth, thereby influencing the vertical nutrient budget. However, during the stratified summer, the strong pycnocline likely restricts the upward transport of these regenerated nutrients to the surface layer, limiting their immediate contribution to surface nutrient dynamics (Randelhoff et al., 2017; Tuerena et al., 2021; Fig. 3). Therefore, although remineralization in deeper water masses is an important part of the fjord's overall nutrient budget, its direct influence on the surface-layer ΔNutrient values calculated in this study is likely minimal during our observation period. These spatial decoupling underscores the importance of interpreting ΔNutrient within the context of euphotic zone net biological consumption, rather than as a comprehensive indicator of whole water column nutrient cycling. The modestly higher ΔPhosphate at the surface may reflect suppressed phosphate uptake under nitrogen or silicate limitation, or additional phosphate input from glacial meltwater insufficiently captured in the PSWw end-member (Hawkings et al., 2017).
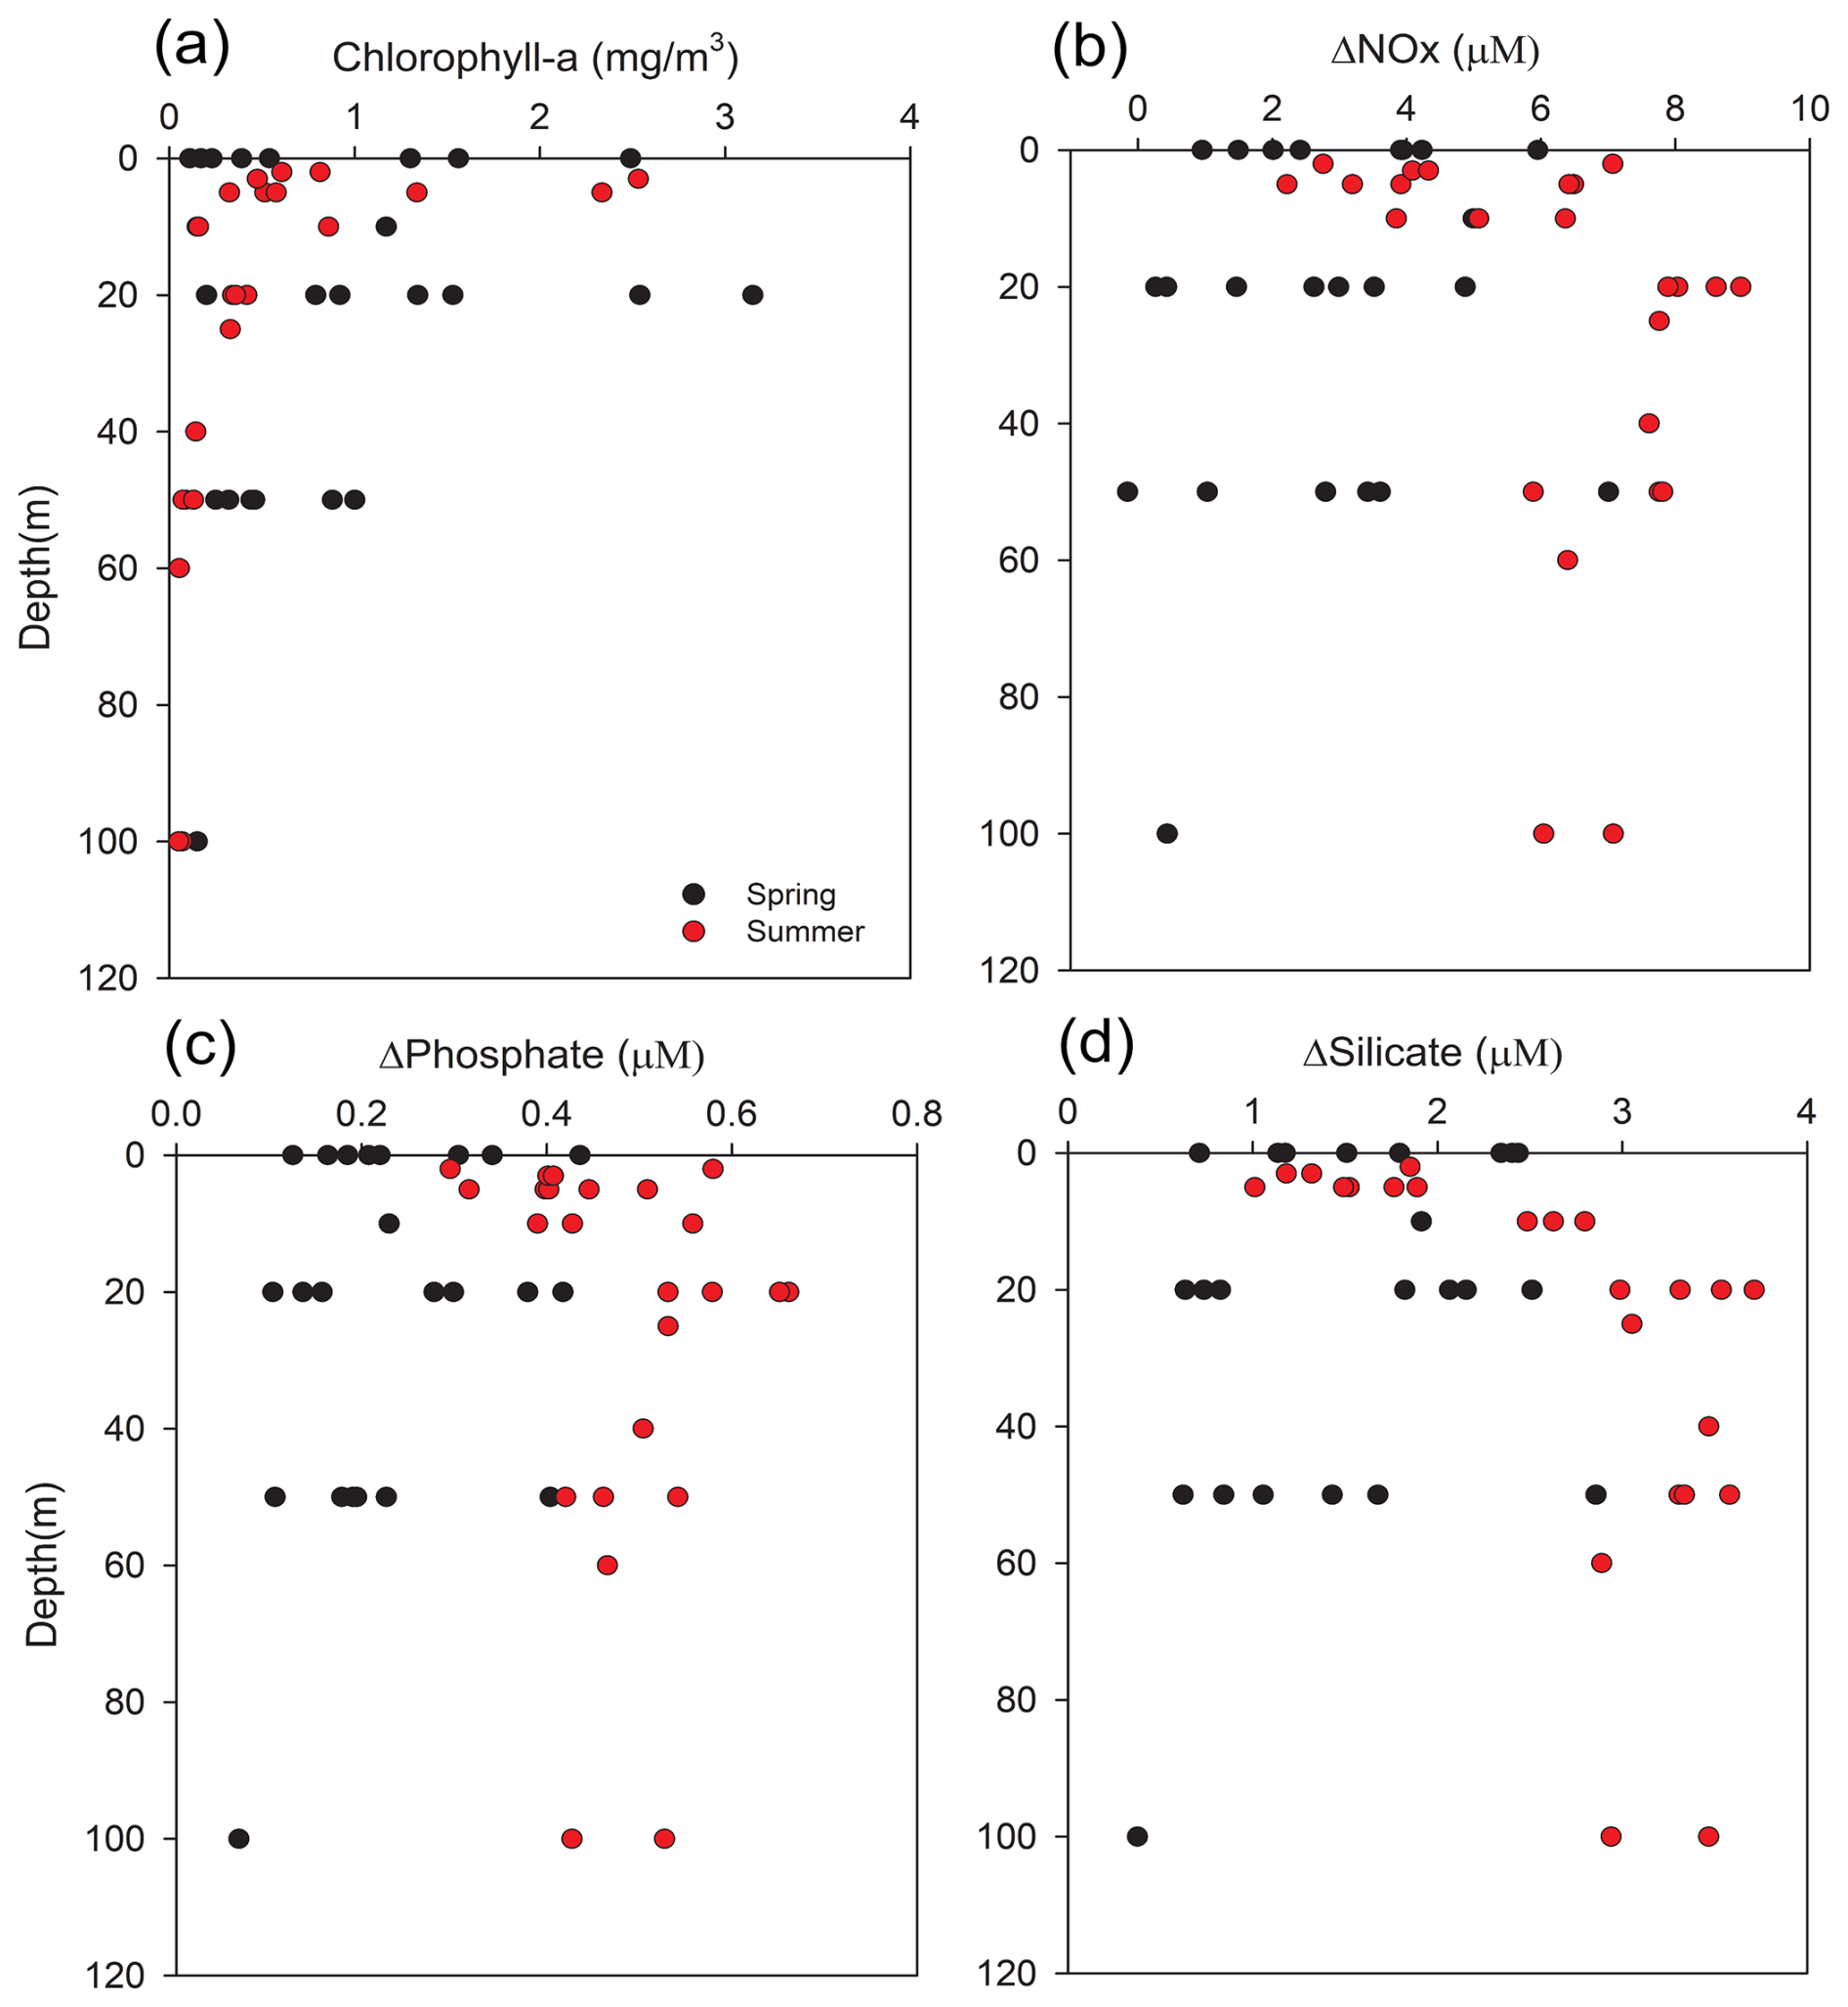
Figure 6Vertical profiles of (a) Chlorophyll-a (mg m−3), (b) ΔNOx (µM), and (c) ΔPhosphate (µM), (d) ΔSilicate (µM). Black circles indicate spring and red circles indicate summer. The legend applies to all panels. ΔNutrient values are calculated from differences between observed and theoretical concentrations derived from end-member mixing.
The vertical profiles of ΔNutrients and chlorophyll-a (Fig. 6) reveal distinct seasonal and depth-dependent contrasts. In spring, elevated surface ΔNutrient values coincided with relatively high chlorophyll-a, indicating active phytoplankton uptake supported by vertical nutrient replenishment. By contrast, summer profiles reflected strong stratification, with pronounced surface nutrient depletion and elevated ΔNOx and ΔSilicate at depth coupled with reduced chlorophyll-a, suggesting organic matter export and restricted upward regeneration. These vertical structures visually confirm the critical role of stratification in decoupling euphotic zone consumption from remineralization at depth. Building on the patterns revealed in these profiles, the relationship between ΔNutrient and chlorophyll-a was examined quantitatively (Fig. 7) to further explore the biological contribution to nutrient removal.
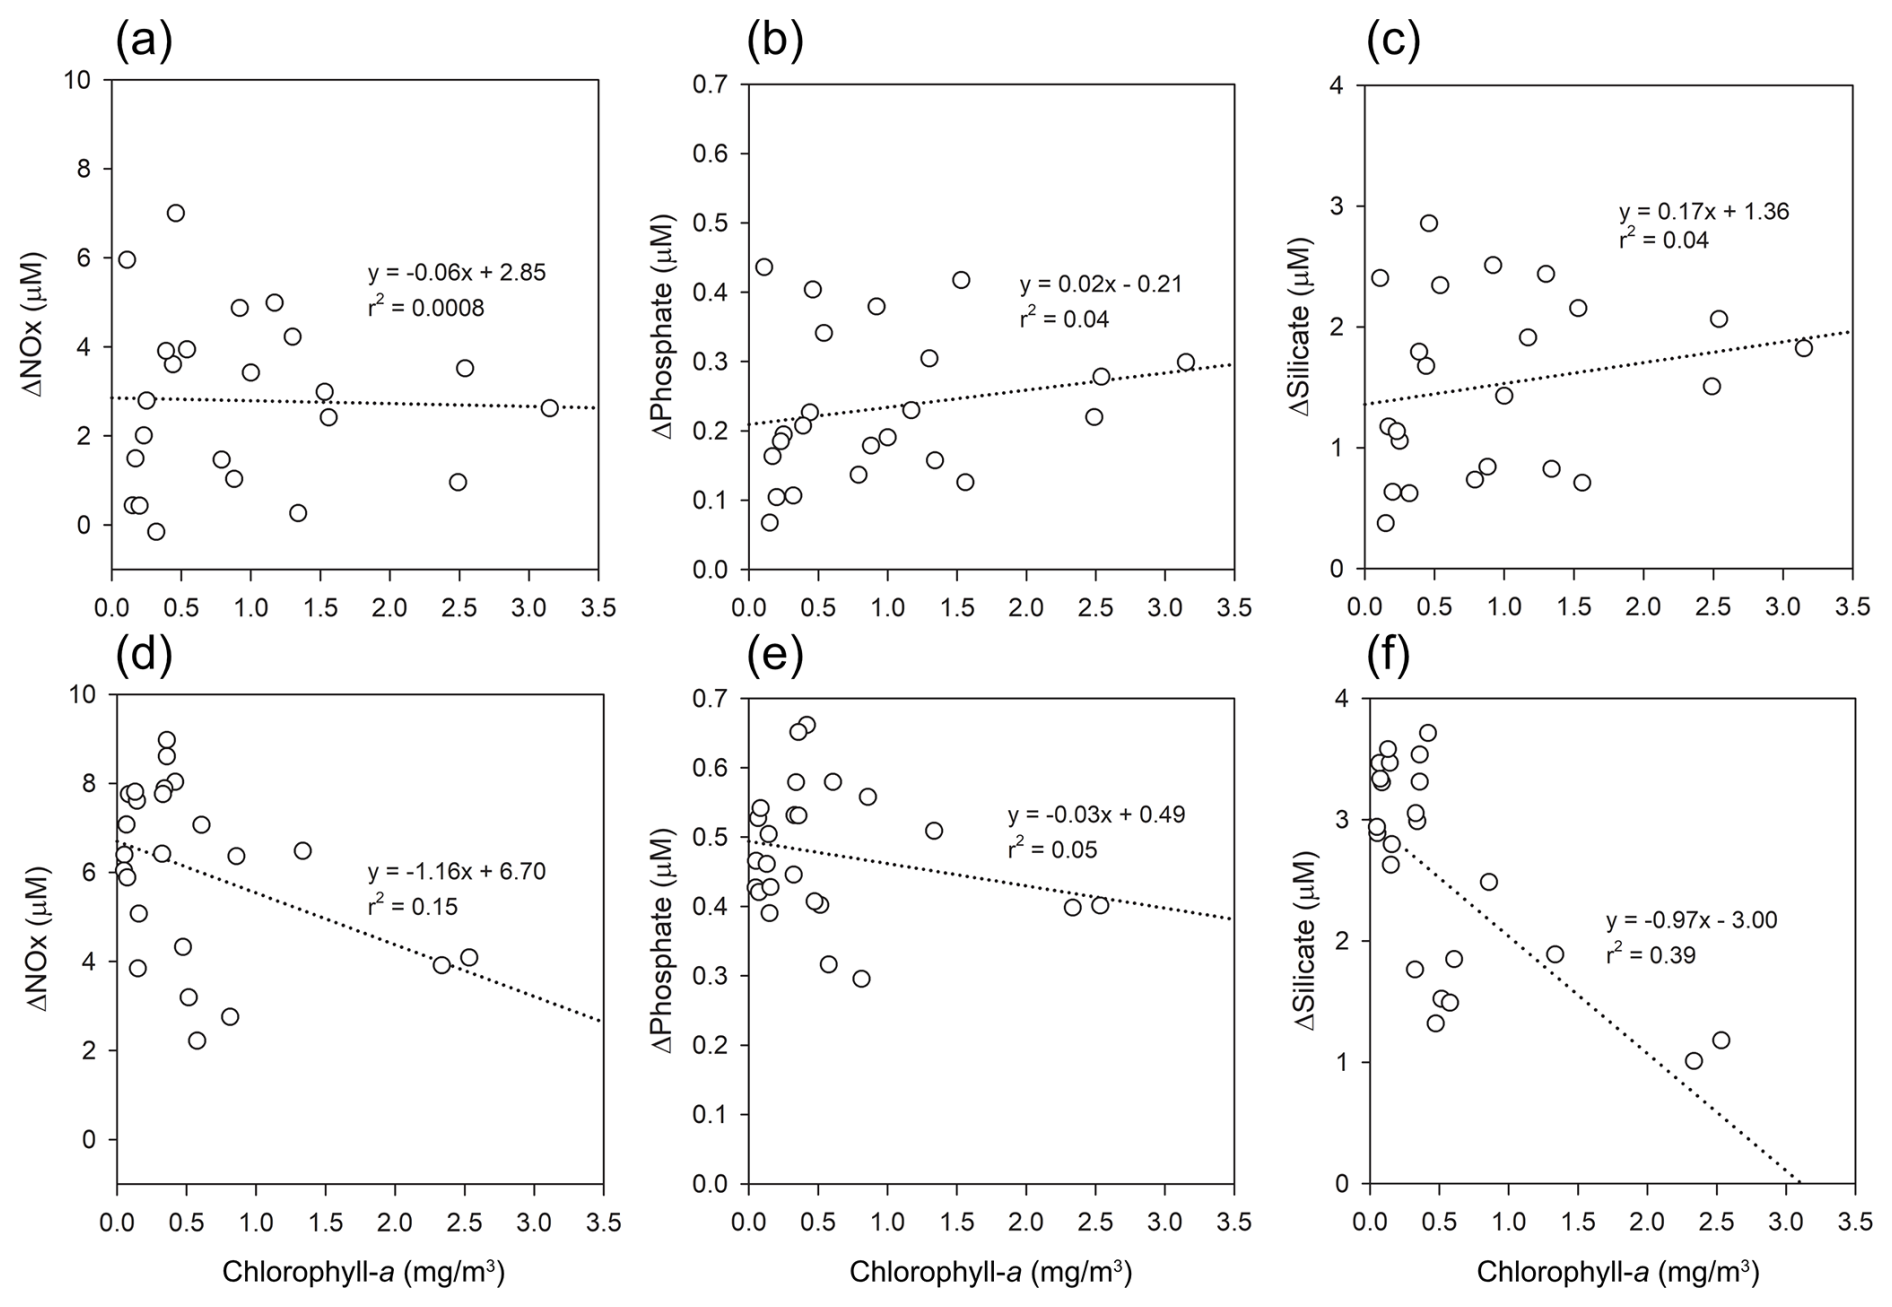
Figure 7Relationships between chlorophyll-a (mg m−3) and ΔNutrient (µM) in Kongsfjorden: (a–c) spring, (d–f) summer. Regression lines and r2 values are shown for each panel.
In spring, the absence of significant correlations (r2<0.04) suggests that sampling preceded the main phytoplankton bloom, as supported by elevated background nutrient levels. In contrast, summer data revealed weak but significant negative correlations most notably for nitrate (r2=0.15) (Fig. 7d) and silicate (r2=0.39) (Fig. 7f), indicative of biological drawdown, particularly by diatoms. These observations are consistent with post-bloom conditions (Egge and Aksnes, 1992; Hodal et al., 2012) and align with the seasonal rise in surface ratios (from 14.99 to 18.80), suggestive of NOx depletion following diatom-dominated productivity (Hodal et al., 2012).
The observed weak correlation between chlorophyll-a and ΔNutrient can be attributed to their fundamentally different temporal characteristics. Chlorophyll-a provides a snapshot of the standing phytoplankton biomass at the time of sampling, which can be strongly influenced by short-term processes such as grazing, sinking, and advection (Behrenfeld and Boss, 2014; Siegel et al., 2013). In contrast, ΔNutrient integrates the cumulative net nutrient removal over the course of the productive season, thereby functioning as a retrospective proxy for biological activity, a “biogeochemical memory”, that is, an integrated signal of the cumulative nutrient consumption that has occurred since the start of the productive season, rather than a snapshot of instantaneous biological activity. This temporal decoupling is particularly evident under post-bloom conditions, where chlorophyll-a concentrations may no longer reflect the magnitude of prior biological uptake.
Although the absence of complementary biological data such as primary productivity or phytoplankton community composition limits direct validation, this very constraint highlights the unique utility of ΔNutrient. In data-limited environments, where rate measurements are unavailable or logistically challenging, ΔNutrient offers a robust means of inferring the seasonal imprint of biological processes on nutrient distributions. It thus serves as a powerful tool for disentangling biological signals from physical mixing in dynamic systems such as Arctic fjords.
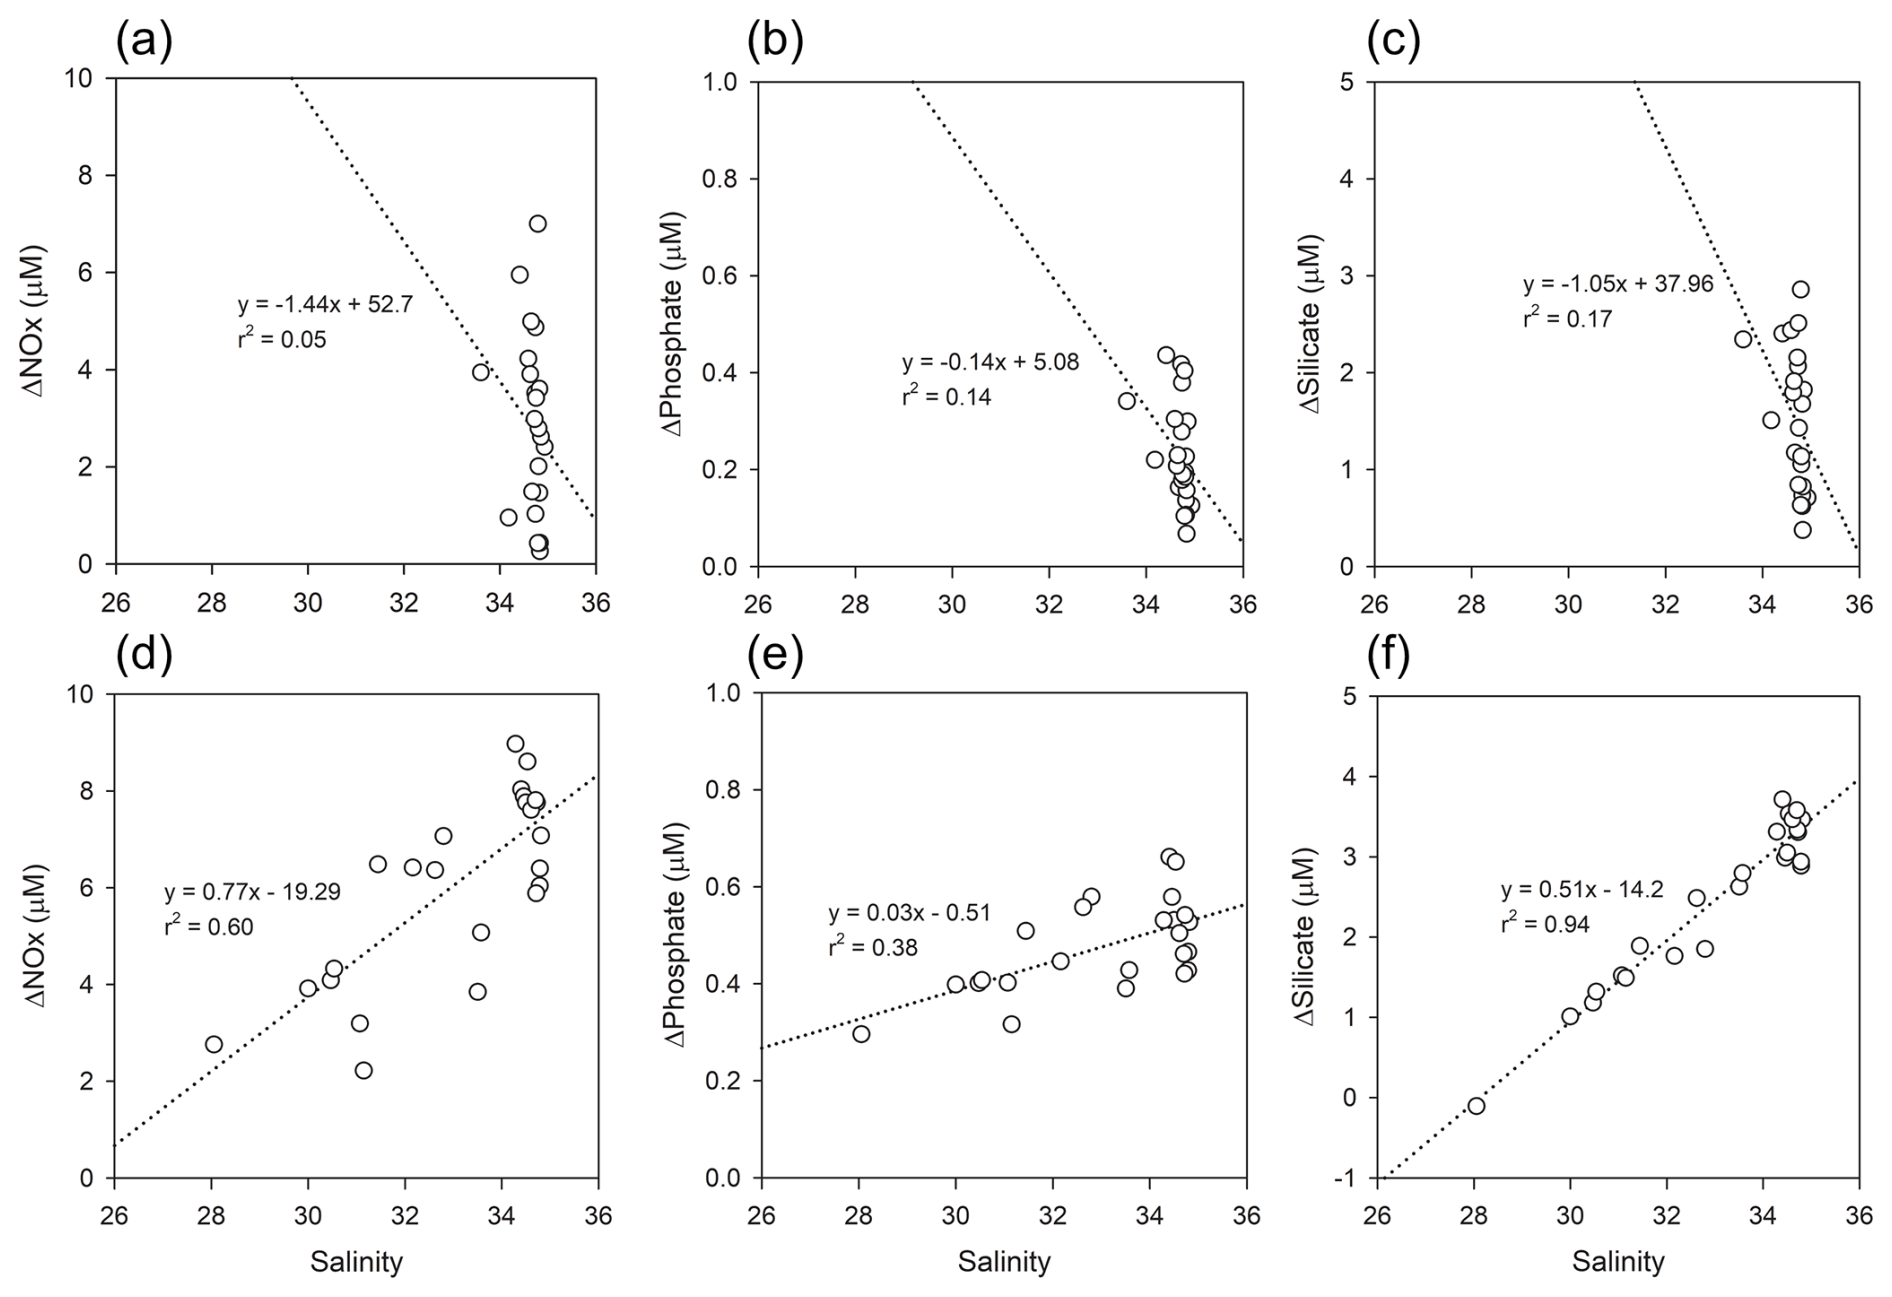
Figure 8Relationships between salinity and ΔNutrient (µM) in Kongsfjorden: (a–c) spring, (d–f) summer. Regression lines and r2 values are shown for each panel.
The relationship between salinity and ΔNutrient exhibited clear seasonal contrasts (Fig. 8). In spring, all ΔNutrient values showed weak negative correlations with salinity for instance, ΔPhosphate (r2=0.14) (Fig. 8b) suggesting a reduced influence of high-salinity, nutrient-rich AW and MAW on biological drawdown. During summer, NOx (r2=0.60) (Fig. 8d) and phosphate (r2=0.38) (Fig. 8e), and silicate (r2=0.94) (Fig. 8f) all showed positive correlations with salinity. The strong correlation observed for ΔSilicate suggests pronounced biological drawdown in higher-salinity waters, likely reflecting diatom uptake in AW and MAW influenced regions.
The weak summer correlation between ΔNutrient and chlorophyll-a is a critical finding, as it implies a temporal decoupling between cumulative nutrient consumption and instantaneous phytoplankton biomass. The consistently high ΔNutrient values observed in summer represent an integrated record of cumulative nutrient consumption since the start of the productive season, reflecting the legacy of nutrient uptake during the preceding spring bloom. In contrast, the lower and more variable chlorophyll-a concentrations likely represent a snapshot of a post-bloom community, where phytoplankton biomass has been diminished by factors such as grazing and sinking. Therefore, this study demonstrates that ΔNutrient is not merely a proxy for concurrent biological activity but rather a powerful integrated indicator that quantifies the total impact of seasonal biological processes on the nutrient inventory.
Interpretation of ΔSilicate warrants particular attentiondue to the non-conservative input from glacial meltwater (GMW), which was not included as a discrete end-member. Our decision not to include GMW as a fifth end-member is based on two primary challenges. First, defining a stable and representative silicate concentration for GMW is scientifically challenging due to its high and unpredictable variability. Studies on Svalbard's tidewater glaciers report a wide range of silicate concentrations in summer runoff, typically between 2 and 6 µM (e.g., Nowak and Hodson, 2014; Hatton et al., 2020). Incorporating a single fixed value for such a variable source would introduce a significant, and likely larger, source of error into the model. Second, regarding model parsimony and robustness, adding a fifth, highly uncertain end-member would increase the model's complexity and potentially reduce the robustness of the calculated contributions from the other, better-constrained water masses (AW, MAW, and PSW).
Therefore, a more conservative and scientifically defensible approach was adopted by subsuming the freshwater influence into the Polar Surface Water warm (PSWw) end-member used in this study. It is explicitly acknowledged that this methodological choice means the calculated ΔSilicate values inherently underestimate the true biological consumption. Crucially, this limitation strengthens the overall conclusion. The data presented in this study show a strong inverse correlation between observed silicate and salinity in summer (r2=0.94), empirically confirming a significant, non-conservative freshwater source of silicate. The fact that a substantial biological silicate drawdown is still calculated even with a model that systematically underestimates it provides powerful and compelling evidence that biological uptake is the dominant process regulating silicate dynamics in Kongsfjorden during the summer, far outweighing the effects of physical mixing alone.
More advanced approaches, such as the extended Optimum Multiparameter (OMP) analysis applied by Dinauer and Mucci (2018), can explicitly incorporate non-conservative processes and are considered powerful state-of-the-art methods. The application of this technique, however, requires at least n−1 independent conservative tracer to resolve n sources and processes. The dataset used in this study, primarily constrained by temperature and salinity, does not include the additional tracers (e.g., noble gases, stable isotopes) necessary for such an analysis. In this context, the ΔNutrient framework provides a more direct and transparent means of evaluating biological influences on nutrient distributions, while avoiding the large uncertainties that would arise from applying an under-constrained OMP model.
3.4 Seasonal Shift in Nutrient Limitation Patterns
The potential for nutrient limitations on phytoplankton growth in Kongsfjorden was evaluated using the ratio and the absolute concentrations of key nutrients (Fig. 9; see also Sect. 3.1). During spring, the mean surface ratio was 15.0 ± 2.7, while that in the mean deep-water was 13.8 ± 2.1. These values were slightly below or close to the canonical Redfield ratio of 16 : 1, suggesting that phytoplankton growth was not strongly limited by either nitrogen or phosphorus during this period. If any trend was present, it may have leaned toward mild nitrogen limitation. The relatively uniform ratios with increasing depth also indicated effective vertical mixing in spring.
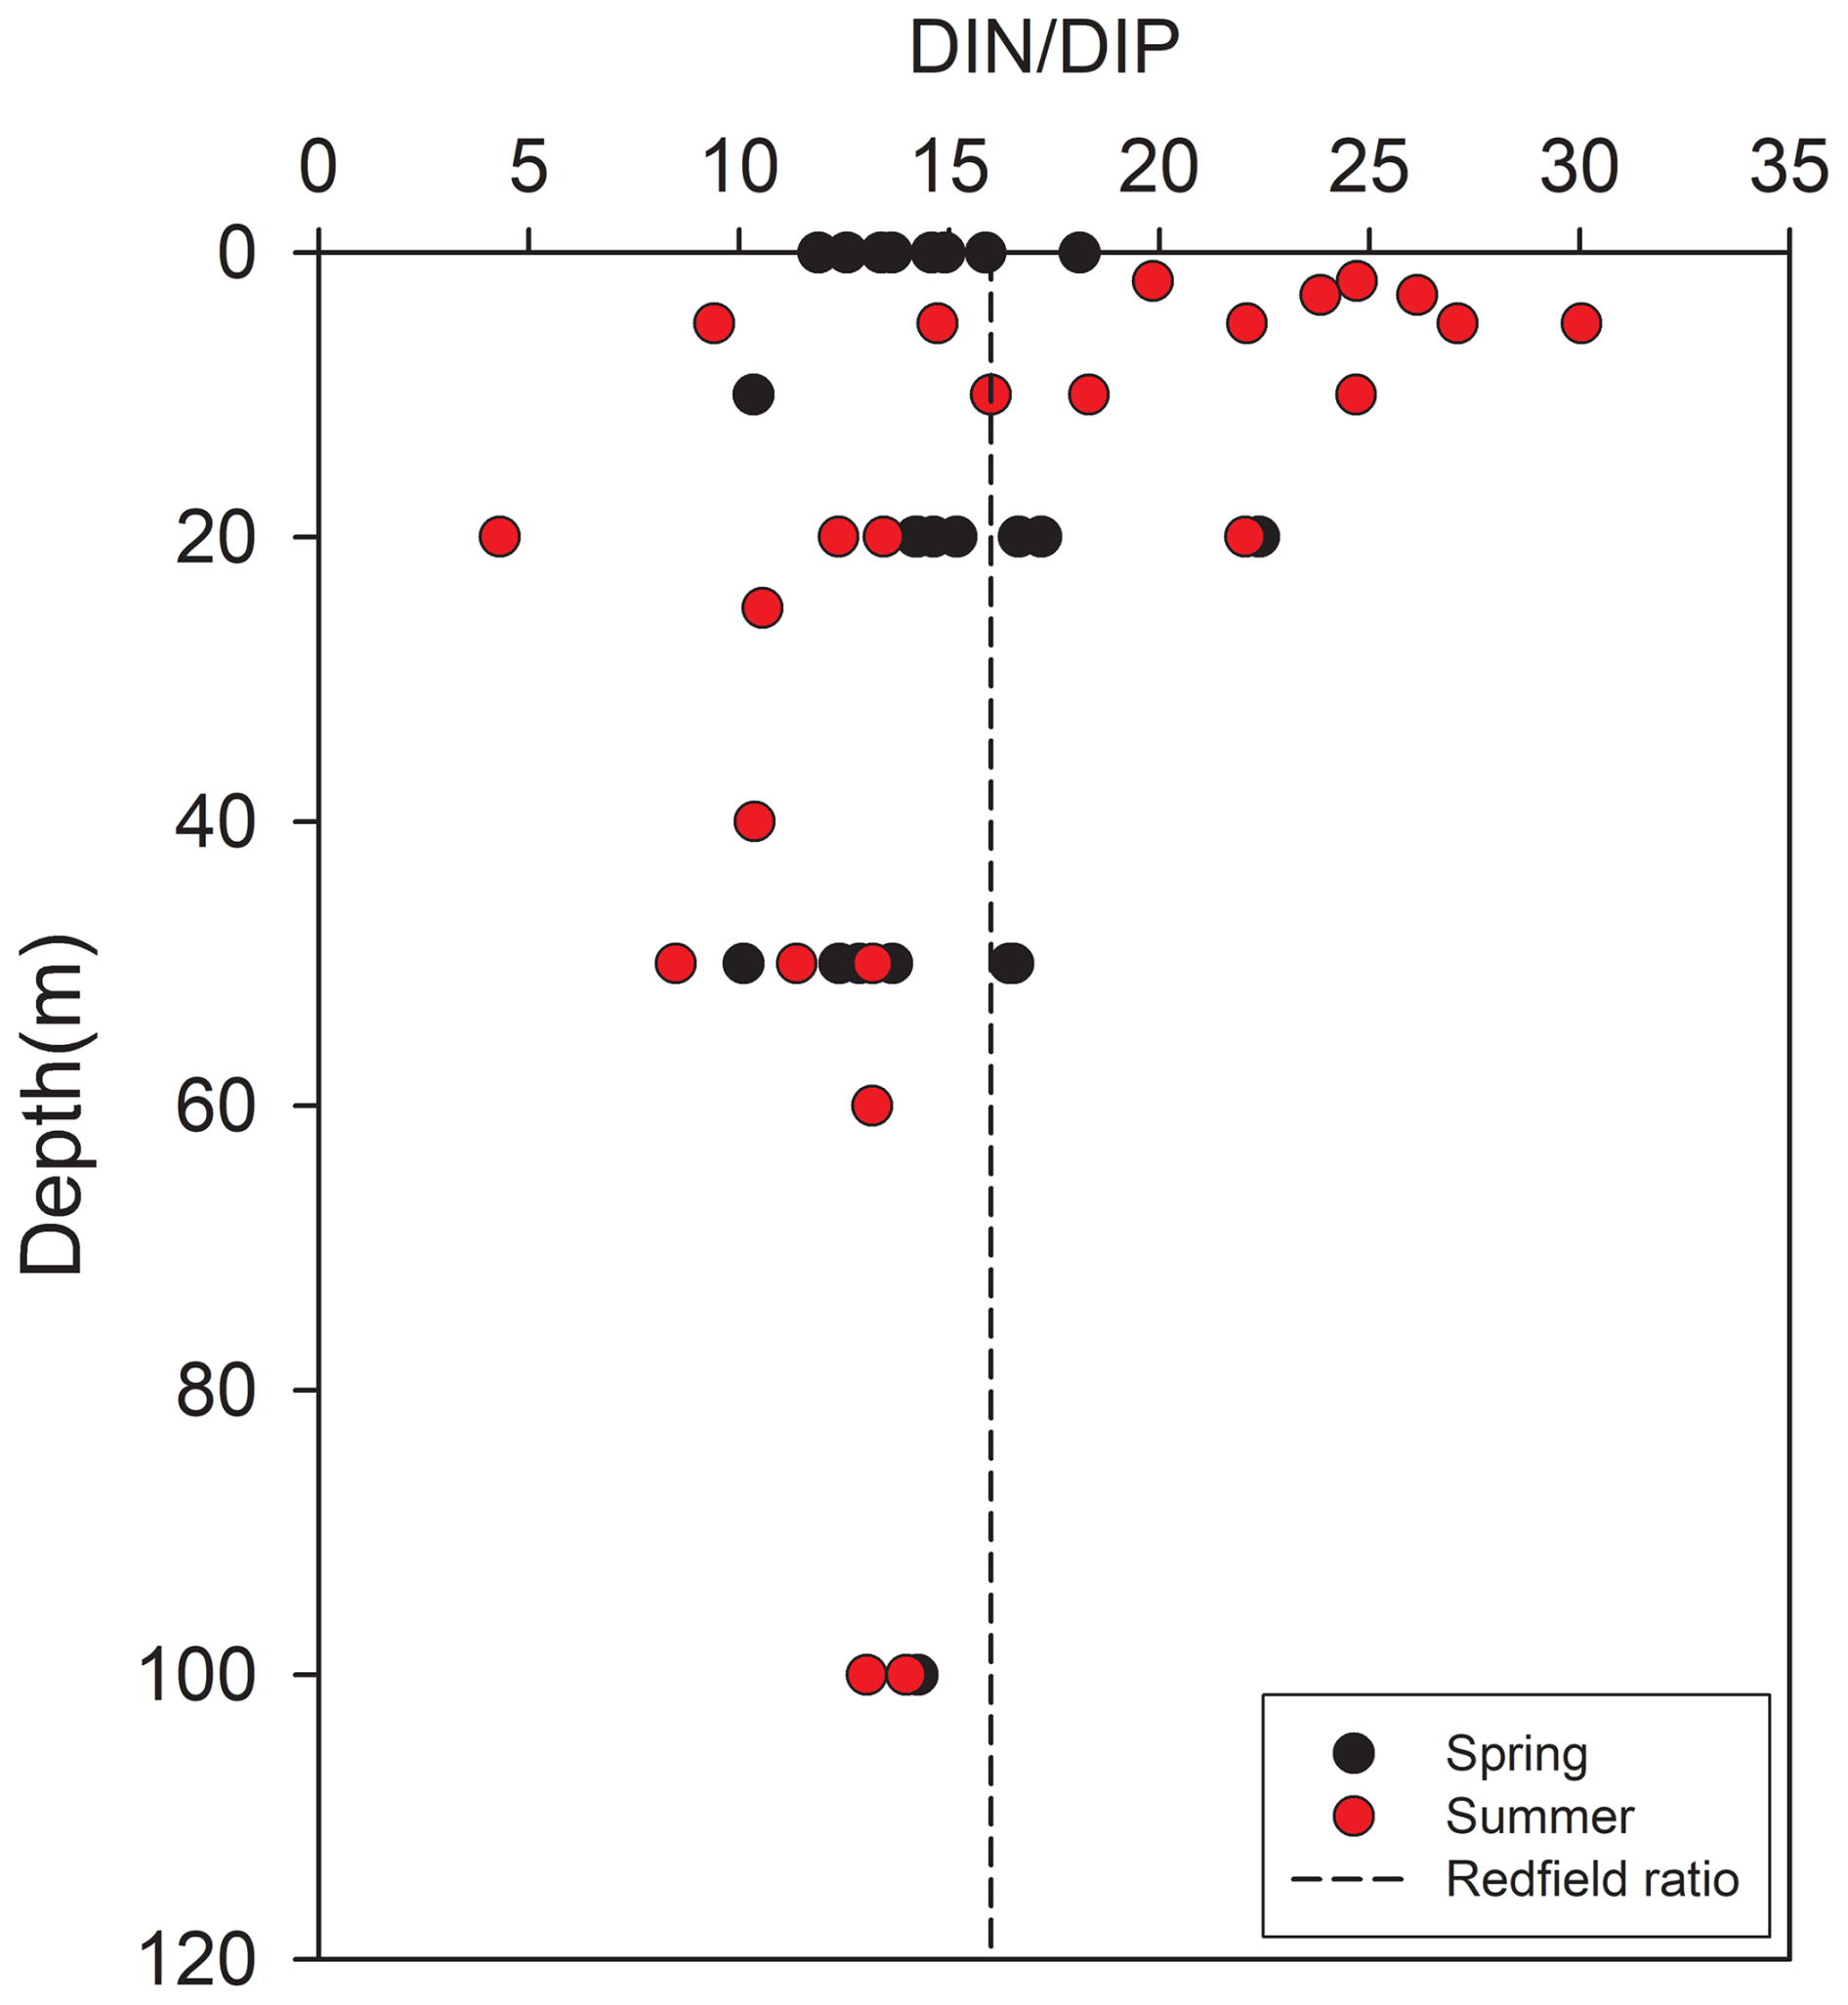
Figure 9Vertical profiles of the ratio in Kongsfjorden. Black circles represent spring values; red circles represent summer. The vertical dashed line indicates the Redfield ratio (16 : 1).
In contrast, the summer season exhibited a pronounced increase in the surface ratio, averaging 18.8 ± 7.0 and exceeding the Redfield ratio. This shift strongly suggests a transition toward phosphorus limitation in surface waters. The deep-layer ratio remained lower (mean: 13.2 ± 3.8), resulting in a marked vertical divergence. This contrast emphasizes the role of enhanced summer stratification in establishing distinct biogeochemical regimes in the surface and deep layers.
The possibility of phosphorus limitation in summer surface waters was supported by the absolute phosphate concentrations observed during this period. The mean summer surface phosphate concentration (0.13 ± 0.07 µM) fell below the commonly used 0.2 µM threshold indicating phosphorus limitation for Arctic phytoplankton (Tremblay et al., 2015). Concurrently, the mean surface silicate concentration during summer was 1.66 ± 0.39 µM, approaching the 2 µM threshold commonly associated with potential silicate limitation for diatom growth (Egge and Aksnes, 1992). This nutrient regime, characterized by low phosphate (<0.2 µM) and low silicate (<2 µM), likely imposed significant selective pressure on the phytoplankton community, potentially favoring the dominance of small flagellates, which are more competitive under nutrient-depleted conditions, particularly phosphorus limitation, over diatoms (Degerlund and Eilertsen, 2010; Larsen et al., 2004; Egge and Aksnes, 1992).
These observed seasonal shifts in nutrient limitation patterns were closely linked to phytoplankton community succession. In Arctic waters, spring diatom blooms typically deplete large amounts of NOx and silicate. Following these blooms, summer conditions, which are marked by stratification and altered nutrient ratios, may favor the dominance of other phytoplankton groups, including nitrogen-fixing microalgae or small species with distinct nutrient uptake strategies (Hodal et al., 2012; Sakshaug, 2004). The observed increase in the surface ratio from spring to summer supports this interpretation, as it indicates a faster depletion of phosphate relative to NOx following the spring diatom bloom. This pattern is consistent with the known consequences of intense spring diatom blooms in Arctic fjords. While these blooms consume large amounts of NOx and silicate, the post-bloom summer conditions, characterized by stratified and nutrient-depleted surface waters, often lead to a shift toward phosphorus limitation, as observed in our study. This succession favors smaller phytoplankton with distinct uptake strategies (Hodal et al., 2012).
The present study highlighted significant seasonal differences in water mass mixing and nutrient dynamics in Kongsfjorden, Svalbard. Spring conditions were dominated by MAW and active vertical mixing, resulting in relatively high and uniform nutrient concentrations, with ratios near the Redfield ratio. In contrast, summer featured increased surface freshening and strong stratification, which, together with enhanced biological uptake, led to substantial reductions in surface nutrient concentrations. The ΔNutrient metric effectively captured the cumulative biological drawdown over the season, acting as a “biogeochemical memory” that is decoupled from instantaneous biomass. As a result, summer surface waters shifted toward the potential co-limitation of phosphorus ( ∼ 18.8; phosphate ∼ 0.13 ± 0.07 µM) and silicate (∼ 1.66 ± 0.39 µM). These results suggest a seasonal transition from a well-mixed, nutrient-rich spring regime to a stratified, nutrient-limited summer system driven by biological processes.
This study is based on observational data obtained during a single year (2023), which inherently constrains the extent to which the observed seasonal patterns can be generalized to broader or longer-term biogeochemical characteristics of Arctic fjords. Considering that water mass structure and associated biological responses are subject to substantial interannual variability, future investigations should aim to establish multi-year, high-resolution observational time series to facilitate a more robust quantification of long-term biogeochemical trends in these rapidly changing environments.
To place our findings into a broader context, it is important to note that the observed shift toward phosphorus and silicate co-limitation in Kongsfjorden aligns with larger, global-scale trends of changing nutrient stoichiometry in the world's oceans (Liu et al., 2025; Weber and Deutsch, 2010). This position high-latitude systems like Arctic fjords as critical sentinels for monitoring the impacts of climate change on marine biogeochemistry. Understanding these dynamics is essential for predicting how Arctic fjord ecosystems may respond to ongoing climate change, which is expected to affect the water mass structure, meltwater input, and stratification, thus altering nutrient cycling and primary productivity.
The hydrographic and biogeochemical data used in this study were obtained from in situ observations in Kongsfjorden (Svalbard) during 2023. The data are available from the corresponding author upon reasonable request.
HK wrote the original draft and performed visualization and formal analysis. THK was involved in the review and editing of the manuscript, funding acquisition, and conceptualization. DH contributed to the review and editing of the manuscript and conducted the investigation. SRP contributed to the review and editing of the manuscript and provided critical input for the conceptualization of the study.
The contact author has declared that none of the authors has any competing interests.
Publisher's note: Copernicus Publications remains neutral with regard to jurisdictional claims made in the text, published maps, institutional affiliations, or any other geographical representation in this paper. While Copernicus Publications makes every effort to include appropriate place names, the final responsibility lies with the authors. Views expressed in the text are those of the authors and do not necessarily reflect the views of the publisher.
We would like to thank all MBL members for their support with the sample analysis.
This research has been supported by the Korea Institute of Marine Science and Technology promotion (grant no. RS-2025-02304432) and the Korea Institute of Ocean Science and Technology (grant no. PEA0333).
This paper was edited by Matthew P. Humphreys and reviewed by Louise Delaigue and one anonymous referee.
Arrigo, K. R., Perovich, D. K., Pickart, R. S., Brown, Z. W., van Dijken, G. L., Lowry, K. E., Mills, M. M., Palmer, M. A., Balch, W. M., Bates, N. R., Benitez-Nelson, C. R., Brownlee, E., Frey, K. E., Laney, S. R., Mathis, J., Matsuoka, A., Greg Mitchell, B., Moore, G. W. K., Reynolds, R. A., Sosik, H. M., and Swift, J. H.: Phytoplankton blooms beneath the sea ice in the Chukchi sea, Deep Sea Research Part II: Topical Studies in Oceanography, 105, 1–16, https://doi.org/10.1016/j.dsr2.2014.03.018, 2014.
Behrenfeld, M. J. and Boss, E. S.: Resurrecting the Ecological Underpinnings of Ocean Plankton Blooms, Annual Review of Marine Science, 6, 167–194, https://doi.org/10.1146/annurev-marine-052913-021325, 2014.
Carmack, E. and Wassmann, P.: Food webs and physical–biological coupling on pan-Arctic shelves: Unifying concepts and comprehensive perspectives, Progress in Oceanography, 71, 446–477, https://doi.org/10.1016/j.pocean.2006.10.004, 2006.
Codispoti, L. A., Kelly, V., Thessen, A., Matrai, P., Suttles, S., Hill, V., Steele, M., and Light, B.: Synthesis of primary production in the Arctic Ocean: III. Nitrate and phosphate based estimates of net community production, Progress in Oceanography, 110, 126–150, https://doi.org/10.1016/j.pocean.2012.11.006, 2013.
Cottier, F., Tverberg, V., Inall, M., Svendsen, H., Nilsen, F., and Griffiths, C.: Water mass modification in an Arctic fjord through cross-shelf exchange: The seasonal hydrography of Kongsfjorden, Svalbard, J. Geophys. Res. Oceans, 110, C12005, https://doi.org/10.1029/2004JC002757, 2005.
Degerlund, M. and Eilertsen, H. C.: Main Species Characteristics of Phytoplankton Spring Blooms in NE Atlantic and Arctic Waters (68–80° N), Estuaries and Coasts, 33, 242–269, https://doi.org/10.1007/s12237-009-9167-7, 2010.
Dinauer, A. and Mucci, A.: Distinguishing between physical and biological controls on the spatial variability of pCO2: A novel approach using OMP water mass analysis (St. Lawrence, Canada), Marine Chemistry, 204, 107–120, https://doi.org/10.1016/j.marchem.2018.03.007, 2018.
Duarte, C. M., Lenton, T. M., Wadhams, P., and Wassmann, P.: Abrupt climate change in the Arctic, Nature Climate Change, 2, 60–62, https://doi.org/10.1038/nclimate1386, 2012.
Duarte, P., Meyer, A., and Moreau, S.: Nutrients in Water Masses in the Atlantic Sector of the Arctic Ocean: Temporal Trends, Mixing and Links With Primary Production, Journal of Geophysical Research: Oceans, 126, e2021JC017413, https://doi.org/10.1029/2021JC017413, 2021.
Egge, J. K. and Aksnes, D. L.: Silicate as regulating nutrient in phytoplankton competition, Mar. Ecol. Prog. Ser., 83, 281–289, https://doi.org/10.3354/meps083281, 1992.
Hatton, J. E., Hendry, K. R., Hirst, C., Opfergelt, S., Henkel, S., Silva-Busso, A., Welch, S. A., Wadham, J. L., Lyons, W. B., Bagshaw, E., Staubwasser, M., and McKnight, D. M.: Silicon Isotopic Composition of Dry and Wet-Based Glaciers in Antarctica, Front. Earth Sci., 8, https://doi.org/10.3389/feart.2020.00286, 2020.
Hawkings, J. R., Wadham, J. L., Benning, L. G., Hendry, K. R., Tranter, M., Tedstone, A., Nienow, P., and Raiswell, R.: Ice sheets as a missing source of silica to the polar oceans, Nat. Commun., 8, 14198, https://doi.org/10.1038/ncomms14198, 2017.
Hegseth, E. N. and Tverberg, V.: Effect of Atlantic water inflow on timing of the phytoplankton spring bloom in a high Arctic fjord (Kongsfjorden, Svalbard), Journal of Marine Systems, 113–114, 94–105, https://doi.org/10.1016/j.jmarsys.2013.01.003, 2013.
Hodal, H., Falk-Petersen, S., Hop, H., Kristiansen, S., and Reigstad, M.: Spring bloom dynamics in Kongsfjorden, Svalbard: nutrients, phytoplankton, protozoans and primary production, Polar Biol., 35, 191–203, https://doi.org/10.1007/s00300-011-1053-7, 2012.
Hopwood, M. J., Carroll, D., Dunse, T., Hodson, A., Holding, J. M., Iriarte, J. L., Ribeiro, S., Achterberg, E. P., Cantoni, C., Carlson, D. F., Chierici, M., Clarke, J. S., Cozzi, S., Fransson, A., Juul-Pedersen, T., Winding, M. H. S., and Meire, L.: Review article: How does glacier discharge affect marine biogeochemistry and primary production in the Arctic?, The Cryosphere, 14, 1347–1383, https://doi.org/10.5194/tc-14-1347-2020, 2020.
Larsen, A., Flaten, G. A. F., Sandaa, R.-A., Castberg, T., Thyrhaug, R., Erga, S. R., Jacquet, S., and Bratbak, G.: Spring phytoplankton bloom dynamics in Norwegian coastal waters: Microbial community succession and diversity, Limnology and Oceanography, 49, 180–190, https://doi.org/10.4319/lo.2004.49.1.0180, 2004.
Liu, J., Wang, H., Mou, J., Penuelas, J., Delgado-Baquerizo, M., Martiny, A. C., Zhou, G., Hutchins, D. A., Inomura, K., Lomas, M. W., Fakhraee, M., Pellegrini, A., Kohler, T. J., Deutsch, C. A., Planavsky, N., Lapointe, B., Zhang, Y., Li, Y., Zhou, J., Zhang, Y., Sun, S., Li, Y., Zhang, W., Cao, J., and Chen, J.: Global-scale shifts in marine ecological stoichiometry over the past 50 years, Nat. Geosci., 18, 769–778, https://doi.org/10.1038/s41561-025-01735-y, 2025.
Miller, A. R.: A study of mixing processes over the edge of the continental shelf, Journal of Marine Research, 9, 214–223, 1950
Nilsen, F., Cottier, F., Skogseth, R., and Mattsson, S.: Fjord–shelf exchanges controlled by ice and brine production: The interannual variation of Atlantic Water in Isfjorden, Svalbard, Continental Shelf Research, 28, 1838–1853, https://doi.org/10.1016/j.csr.2008.04.015, 2008.
Nowak, A. and Hodson, A.: Changes in meltwater chemistry over a 20-year period following a thermal regime switch from polythermal to cold-based glaciation at Austre Brøggerbreen, Svalbard, Polar Research, https://doi.org/10.3402/polar.v33.22779, 2014.
Polyakov, I. V., Pnyushkov, A. V., and Timokhov, L. A.: Warming of the Intermediate Atlantic Water of the Arctic Ocean in the 2000s, J. Climate, https://doi.org/10.1175/JCLI-D-12-00266.1, 2012.
Randelhoff, A., Fer, I., and Sundfjord, A.: Turbulent Upper-Ocean Mixing Affected by Meltwater Layers during Arctic Summer, https://doi.org/10.1175/JPO-D-16-0200.1, 2017.
Rudels, B., Meyer, R., Fahrbach, E., Ivanov, V. V., Østerhus, S., Quadfasel, D., Schauer, U., Tverberg, V., and Woodgate, R. A.: Water mass distribution in Fram Strait and over the Yermak Plateau in summer 1997, Ann. Geophys., 18, 687–705, https://doi.org/10.1007/s00585-000-0687-5, 2000.
Rudels, B., Björk, G., Nilsson, J., Winsor, P., Lake, I., and Nohr, C.: The interaction between waters from the Arctic Ocean and the Nordic Seas north of Fram Strait and along the East Greenland Current: results from the Arctic Ocean-02 Oden expedition, Journal of Marine Systems, 55, 1–30, https://doi.org/10.1016/j.jmarsys.2004.06.008, 2005.
Rysgaard, S., Nielsen, T. G., and Hansen, B. W.: Seasonal variation in nutrients, pelagic primary production and grazing in a high-Arctic coastal marine ecosystem, Young Sound, Northeast Greenland, Marine Ecology Progress Series, 179, 13–25, https://doi.org/10.3354/meps179013, 1999.
Sakshaug, E.: Primary and Secondary Production in the Arctic Seas, in: The Organic Carbon Cycle in the Arctic Ocean, edited by: Stein, R. and MacDonald, R. W., Springer, Berlin, Heidelberg, 57–81, https://doi.org/10.1007/978-3-642-18912-8_3, 2004.
Siegel, D. A., Behrenfeld, M. J., Maritorena, S., McClain, C. R., Antoine, D., Bailey, S. W., Bontempi, P. S., Boss, E. S., Dierssen, H. M., Doney, S. C., Eplee, R. E., Evans, R. H., Feldman, G. C., Fields, E., Franz, B. A., Kuring, N. A., Mengelt, C., Nelson, N. B., Patt, F. S., Robinson, W. D., Sarmiento, J. L., Swan, C. M., Werdell, P. J., Westberry, T. K., Wilding, J. G., and Yoder, J. A.: Regional to global assessments of phytoplankton dynamics from the SeaWiFS mission, Remote Sensing of Environment, 135, 77–91, https://doi.org/10.1016/j.rse.2013.03.025, 2013.
Singh, A., David T., D., Tripathy, S. C., and Naik, R. K.: Interplay of regional oceanography and biogeochemistry on phytoplankton bloom development in an Arctic fjord, Estuarine, Coastal and Shelf Science, 243, 106916, https://doi.org/10.1016/j.ecss.2020.106916, 2020.
Svendsen, H., Beszczynska‐Möller, A., Hagen, J. O., Lefauconnier, B., Tverberg, V., Gerland, S., Børre Ørbæk, J., Bischof, K., Papucci, C., Zajaczkowski, M., Azzolini, R., Bruland, O., and Wiencke, C.: The physical environment of Kongsfjorden–Krossfjorden, an Arctic fjord system in Svalbard, Polar Research, 21, 133–166, https://doi.org/10.3402/polar.v21i1.6479, 2002.
Tamelander, T., Reigstad, M., Olli, K., Slagstad, D., and Wassmann, P.: New production regulates export stoichiometry in the ocean, PLoS ONE, 8, e54027, https://doi.org/10.1371/journal.pone.0054027, 2013.
Torres-Valdés, S., Tsubouchi, T., Bacon, S., Naveira-Garabato, A. C., Sanders, R., McLaughlin, F. A., Petrie, B., Kattner, G., Azetsu-Scott, K., and Whitledge, T. E.: Export of nutrients from the Arctic Ocean, Journal of Geophysical Research: Oceans, 118, 1625–1644, https://doi.org/10.1002/jgrc.20063, 2013.
Tremblay, J.-É., Anderson, L. G., Matrai, P., Coupel, P., Bélanger, S., Michel, C., and Reigstad, M.: Global and regional drivers of nutrient supply, primary production and CO2 drawdown in the changing Arctic Ocean, Progress in Oceanography, 139, 171–196, https://doi.org/10.1016/j.pocean.2015.08.009, 2015.
Tomczak, M.: Some historical, theoretical and applied aspects of quantitative water mass analysis, Journal of Marine Research, 57, 275–303, 1999.
Tovar-Sánchez, A., Duarte, C. M., Alonso, J. C., Lacorte, S., Tauler, R., and Galbán-Malagón, C.: Impacts of metals and nutrients released from melting multiyear Arctic sea ice, Journal of Geophysical Research: Oceans, 115, https://doi.org/10.1029/2009JC005685, 2010.
Tuerena, R. E., Hopkins, J., Buchanan, P. J., Ganeshram, R. S., Norman, L., von Appen, W.-J., Tagliabue, A., Doncila, A., Graeve, M., Ludwichowski, K. U., Dodd, P. A., de la Vega, C., Salter, I., and Mahaffey, C.: An Arctic Strait of Two Halves: The Changing Dynamics of Nutrient Uptake and Limitation Across the Fram Strait, Global Biogeochemical Cycles, 35, e2021GB006961, https://doi.org/10.1029/2021GB006961, 2021.
Vonnahme, T. R., Klausen, L., Bank, R. M., Michellod, D., Lavik, G., Dietrich, U., and Gradinger, R.: Light and freshwater discharge drive the biogeochemistry and microbial ecology in a sub-Arctic fjord over the Polar night, Front. Mar. Sci., 9, https://doi.org/10.3389/fmars.2022.915192, 2022.
Weber, T. S. and Deutsch, C.: Ocean nutrient ratios governed by plankton biogeography, Nature, 467, 550–554, https://doi.org/10.1038/nature09403, 2010.