the Creative Commons Attribution 4.0 License.
the Creative Commons Attribution 4.0 License.
 | 19 Nov 2025
Catalogue of extreme sea levels recorded at tide-gauge station Bakar in the northeastern Adriatic Sea (Mediterranean)
Iva Međugorac
Karla Jambrošić
Domagoj Dolički
Josipa Kuzmić
Jadranka Šepić
Iva Vrkić Seidl
Goran Gašparac
Extreme sea levels in the northern Adriatic Sea occasionally occur in late autumn and winter as a result of storm surges that combine with other sea-level processes of different spatial and temporal scales. This paper presents an (empirical) analysis of the 27 most intense episodes recorded at the Croatian tide-gauge station Bakar on the northeastern coast of the Adriatic Sea in the period from 1929 to 2022. Extreme sea levels were defined as events in which the hourly sea level exceeded 89 cm (99.99th percentile threshold) above the long-term average. The study examines the following: (i) the evolution of sea level, analysed through five components – high-frequency oscillations, tide, synoptic component (storm surge and basin-wide seiche), planetary-scale variability, and long-term sea-level variability; (ii) the meteorological conditions, based on reanalysis series and fields (mean sea-level pressure, 10 m wind, and 500 hPa surface geopotential heights); (iii) the impact of these episodes on the natural and built environments along the Croatian coastline; and (iv) the relevant scientific literature addressing these episodes. The study is complemented by an online catalogue, which contains supplementary information and is continuously updated with the latest extreme episodes (https://projekti.pmfst.unist.hr/floods/storm-surges/, Međugorac et al., 2024b).
- Article
(67943 KB) - Full-text XML
- BibTeX
- EndNote


The Adriatic Sea is a sub-basin of the Mediterranean Sea that is surrounded by mountain ranges, except at the narrow Strait of Otranto. It is ∼ 850 km long and ∼ 250 km wide, with depths ranging from less than 50 m on the northern shelf to 1250 m in the southern Adriatic Pit (Fig. 1). In late autumn and winter, the Adriatic is exposed to frequent passages of Mediterranean cyclones (we use “cyclones” to refer to extratropical cyclones), which cause pronounced mean sea-level pressure gradients and, consequently, a southeasterly sirocco wind over the Adriatic (e.g. Trigo and Davies, 2002; Lionello et al., 2021). Under these conditions, the water accumulates in the northern part of the basin and forms a storm surge that floods the coast. During these events, the northern Adriatic Sea does not behave coherently, i.e. the induced storm surge has a spatial structure that depends on the bathymetry of the basin and the distribution of atmospheric forcing fields (Međugorac et al., 2018). This ultimately determines whether the sea-level (SL) response is stronger along the western or the eastern coastline. Although storm surge is a dominant contributor to inundation in the northern Adriatic, other processes can have an influence on the formation of extreme SLs on temporal scales of minutes to decades; moreover, on some occasions, the role of these other processes can be decisive (Ferrarin et al., 2021; Lionello et al., 2021; Šepić et al., 2022; Ruić et al., 2023). Here, we define and provide an overview of all processes that contribute to extreme sea levels in the northeastern Adriatic, according to their period, from shorter to longer ones: high-frequency oscillations, tide, synoptic component, planetary-scale variability, and long-term sea-level variability.
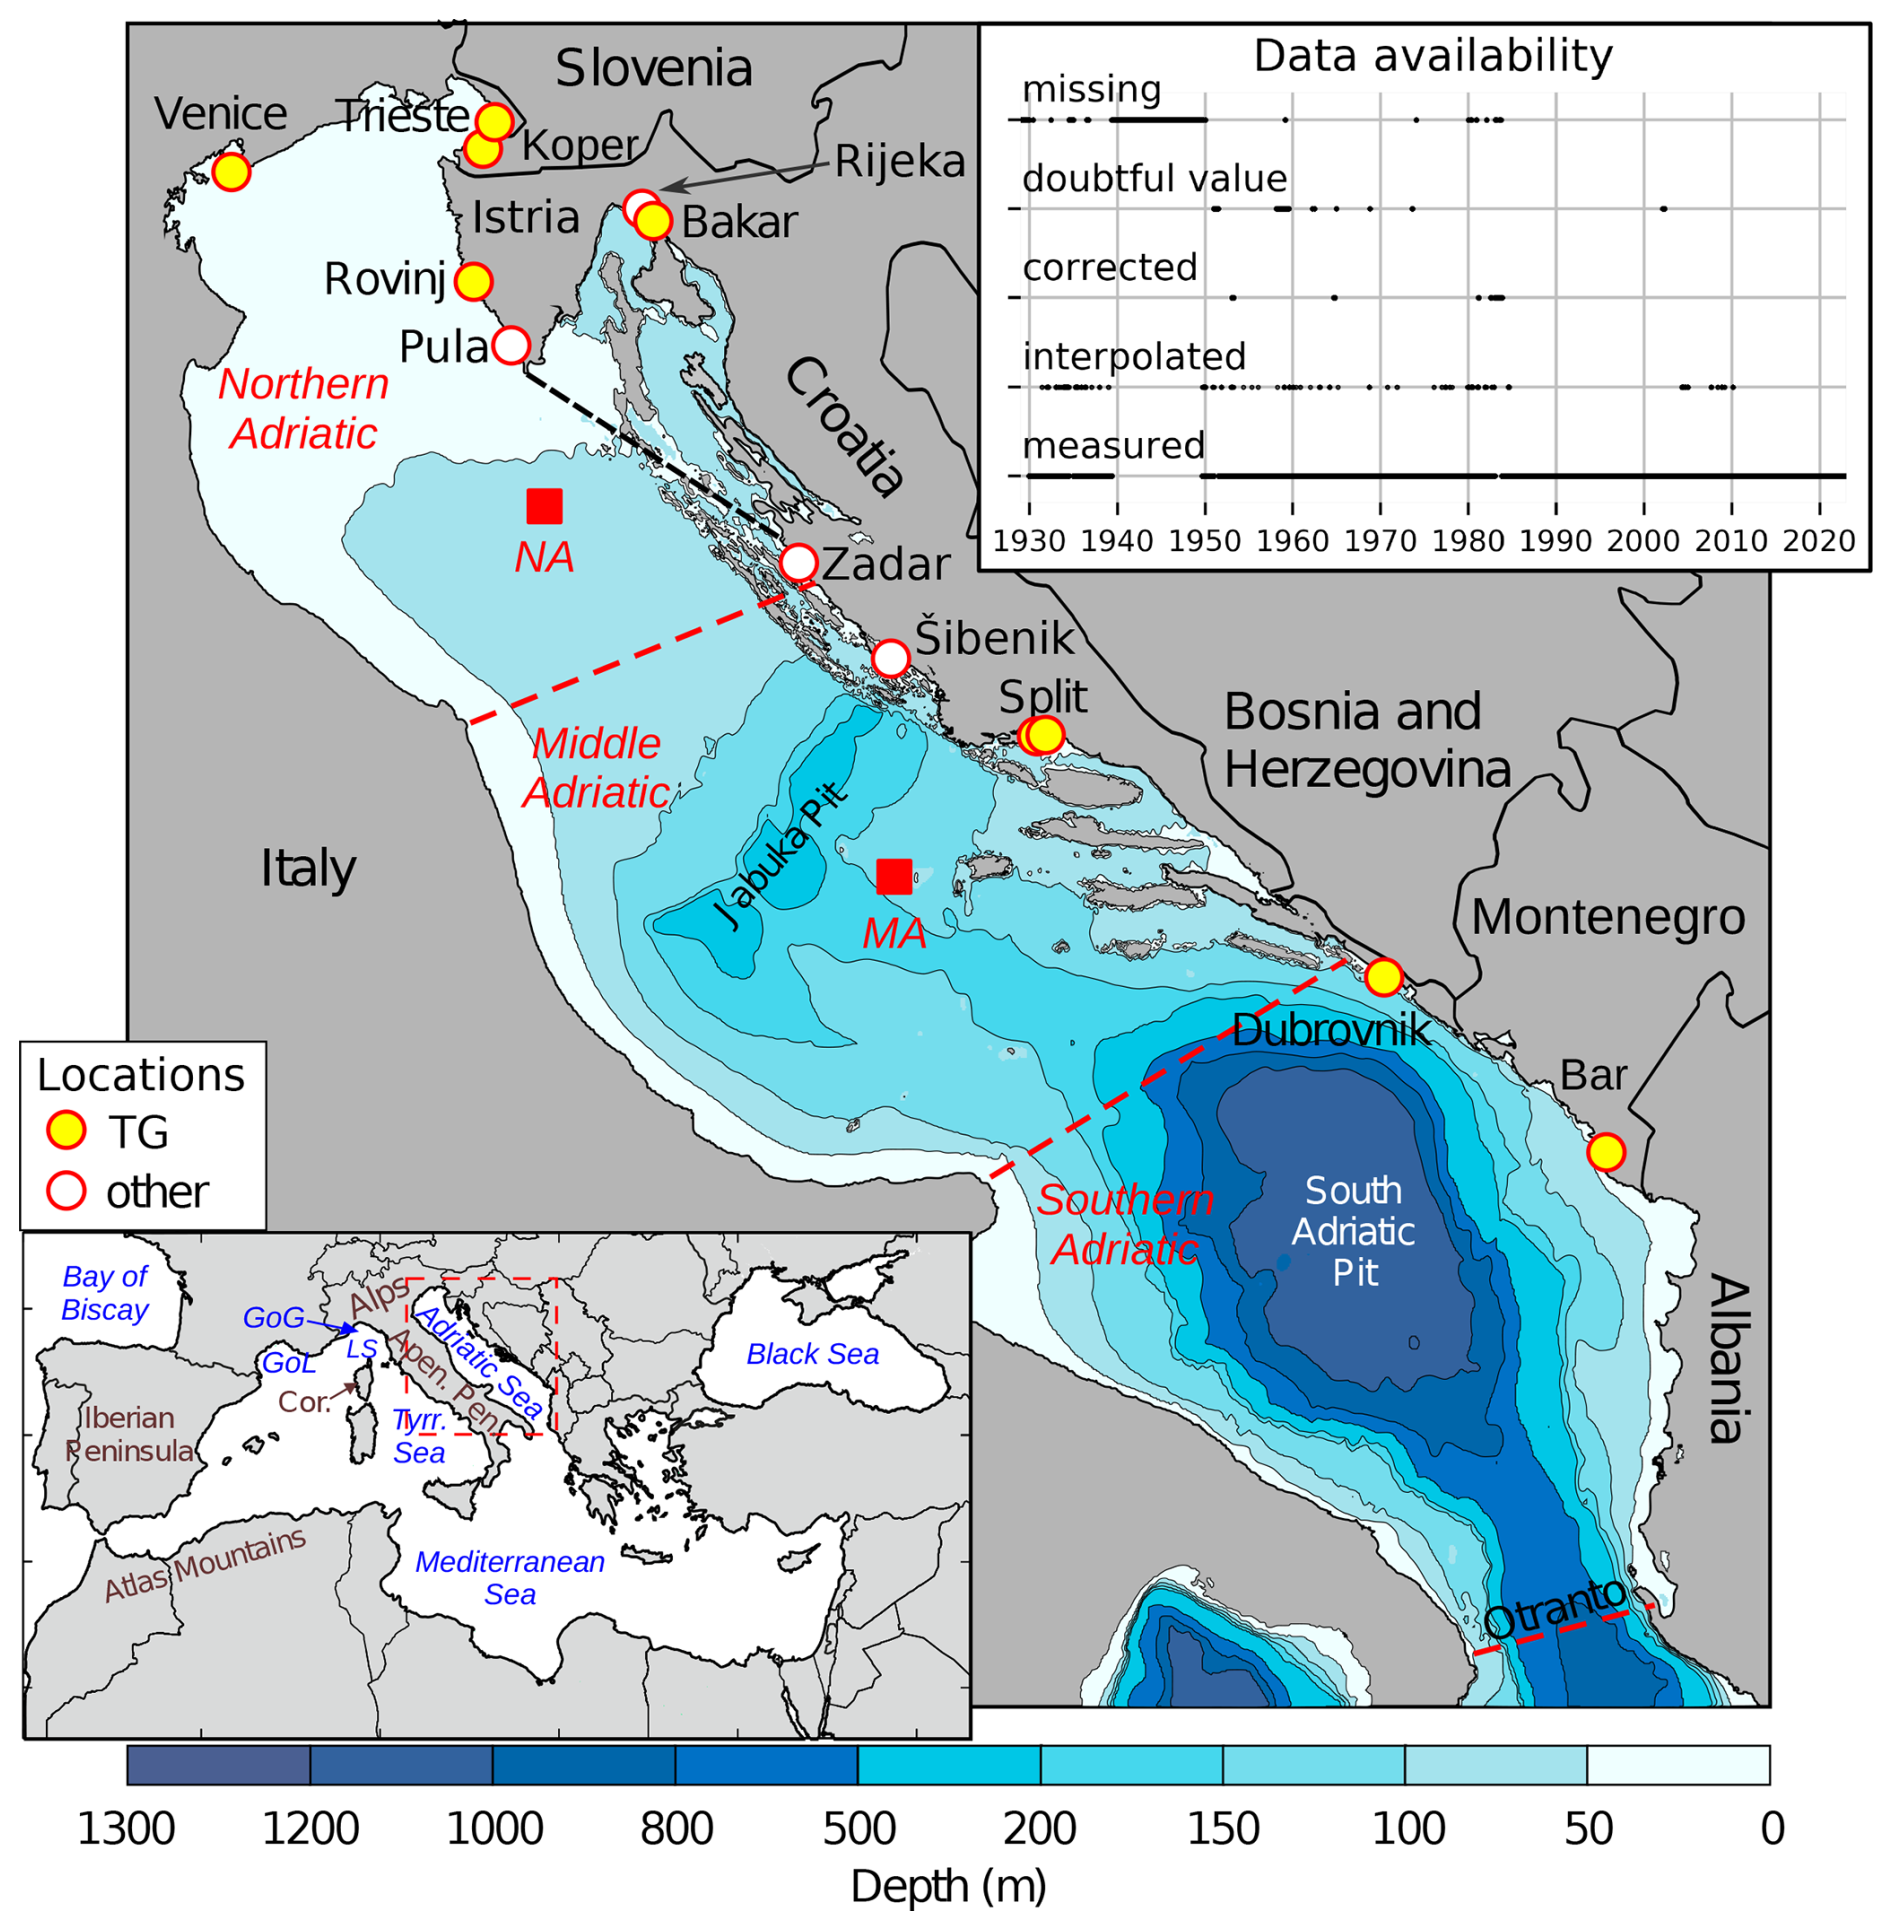
Figure 1Bathymetry of the Adriatic Sea. Locations of tide-gauge stations with records of at least 60 years (Pérez Gómez et al., 2022) are marked with red–yellow circles. Other major towns along the Croatian Adriatic coast are marked with red–white circles. The subdivision of the Adriatic into sub-basins is marked with dashed red lines, and the Kvarner Bay area is to the northeast of the dashed black line. The red rectangles mark grid points for which the atmospheric reanalysis series were analysed. The position of the Adriatic in relation to the Mediterranean is shown in the small inset in the lower-left corner, and the data availability of TG Bakar time series is shown in the upper-right corner. On the Mediterranean map, frequently referenced regions are labelled as follows: Gulf of Genoa (GoG), Gulf of Lion (GoL), Ligurian Sea (LS), Tyrrhenian Sea (Tyrr. Sea), Apennine Peninsula (Apen. Pen.), and Corsica (Cor.). Publisher's remark: please note that the above figure contains disputed territories.
High-frequency oscillations (also referred to as high-frequency component) represent sea-level oscillations on timescales of minutes to hours, which are primarily driven by short-period seiches and other long gravity waves in this region. Tide-gauge station Bakar (TG Bakar) is situated in Bakar Bay (Fig. 1), which is part of the wider Kvarner Bay region (Kvarner Bay is an area bounded on the outside by a line connecting Cape Kamenjak and Cape Skala, as indicated by the dashed black line in Fig. 1; Goldberg and Kempni, 1938), with both of these bays known for strong seiches. Oscillations in high-frequency component recorded in Bakar Bay are induced by mesoscale or synoptic atmospheric disturbances and controlled by the area's topography and bathymetry (Goldberg and Kempni, 1938; Šepić et al., 2008).
Astronomic tide is one of the main contributors to both positive and negative SL extremes in the Adriatic, from the northwestern region to the entire eastern coast (Šepić et al., 2022). In the Adriatic, it is of mixed type and usually modelled as a sum of seven main components – four semidiurnal (K2, S2, M2, and N2) and three diurnal (K1, O1, and P1). Semidiurnal spring tides occur near the full moon and new moon, while diurnal neap tides occur near the first- and last-quarter moons. Its amplitude increases towards the closed northern end of the Adriatic: an average daily range in Bakar Bay is ∼ 60 cm, while in Trieste Bay it reaches its maximum at ∼ 120 cm (Medvedev et al., 2020).
Synoptic component denotes sea-level variations driven by synoptic-scale atmospheric disturbances, on timescales of hours to days, and it includes both the forced response (storm surge described above) and free oscillations of the Adriatic (basin-wide seiches). This component plays the most significant role in the formation of the northern Adriatic extremes (e.g. Pasarić and Orlić, 2001; Međugorac et al., 2018; Ferrarin et al., 2021; Lionello et al., 2021; Šepić et al., 2022). If basin-wide seiches are already present in the basin, they can amplify or attenuate an incoming storm surge, depending on their phase relation. The fundamental Adriatic seiche mode has a period of ∼ 21.2 h (e.g. 21.9 h in Schwab and Rao, 1983; 21.2 h in Cerovečki et al., 1997; and 21.2 h in Raicich et al., 1999). It is a longitudinal oscillation of the entire basin with a nodal line at the Strait of Otranto (Fig. 1). Once triggered, usually after a storm-surge peak when sirocco suddenly stops or turns to bora (northeastern wind; cf., Grisogono and Belušić, 2009), the seiche decays slowly, with an e-folding time of 3.2 ± 0.5 d (Cerovečki et al., 1997). Its initial amplitude can reach several tens of centimetres, and due to its long duration, the seiche can persist through tidal cycles and potentially enhance or attenuate an extreme episode, depending on its phase relative to other involved processes (Šepić et al., 2022).
It should be mentioned that wave set-up – defined by Bowen et al. (1968) as “positive changes in mean water level due to the presence of a train of surface waves” – contributes to total SL, particularly in front of wide, gently sloping coasts and during extreme events characterised by high wind waves. The phenomenon occurs on timescales ranging from hours to days, encompassing both high-frequency oscillations and synoptic component. Its impact on SL extremes is notable in several Mediterranean regions, including some regions along the eastern Adriatic. In front of Bakar Bay, the 99th percentile of wave set-up during extreme events is estimated to be between 10 and 20 cm (Toomey et al., 2022; their Fig. 9).
Another important factor contributing to the Adriatic extremes is planetary-scale variability (here, also referred to as planetary-scale component), which prevails in periods of 10–100 d. This SL variation is primarily driven by atmospheric planetary waves (i.e. Rossby waves) that are most pronounced in the middle troposphere (∼ 500 hPa) and most energetic during the colder part of the year. Their influence is exerted through changes in surface atmospheric pressure and wind (Pasarić, 2000; Pasarić et al., 2000; Pasarić and Orlić, 2001). Prolonged intervals of raised SL, i.e. positive phases of planetary-scale variability, are particularly critical, as their amplitudes in Bakar can exceed 30 cm (Pasarić, 2000; Šepić et al., 2022); therefore, even not-so-intense cyclones can cause high total SLs during these sustained high SL periods (Međugorac et al., 2021).
Finally, long-term sea-level variability (here, also referred to as long-term sea-level component) occurs on timescales longer than 100 d and results from a combination of barotropic and baroclinic processes. It includes the seasonal cycle (with periods of 182.5 and 365 d) and other intra-annual processes (on periods of up to ∼ 1 year), interannual variability (year-to-year changes), (multi)decadal fluctuations, and secular change (here, also referred to as the linear rate of change or linear trend). This SL variation is influenced by atmospheric and oceanic drivers across a broad region, including the Atlantic Ocean (e.g. Orlić et al., 2018, and sources cited therein; detailed in Appendix A). While its contribution to Adriatic extreme sea levels remains secondary to synoptic component, it still represents an important contribution to extremes, reaching up to 28 cm (Međugorac and Pasarić, 2024).
It is assumed that these five processes are independent of each other, as they have sufficiently small amplitudes compared to the depth of the basin so that nonlinear interactions are negligible. The independence of processes has been confirmed for the interactions between the strongest components, tides and storm surges as well as tides and seiches, by empirical analyses (e.g. Cerovečki et al., 1997; Marcos et al., 2009) and by numerical experiments (e.g. Lionello et al., 2005, 2006). Based on this evidence, the assumption of linear superposition is considered reasonable. Therefore, we assume that extreme sea levels in the Adriatic Sea form as a linear superposition of all active processes; that by studying these processes separately, we can also distinguish between various sources of these processes; and that the intensity and timing of extremes depend on the phases and the amplitudes of all processes involved.
Research on the northern Adriatic SL extremes has mostly been focused on extremes hitting Venice. A comprehensive catalogue of extreme SLs that occurred in Venice between 787 and 1867 was compiled by Enzi and Camuffo (1995). In the 20th and 21st centuries, several northern Adriatic floods have been the subject of numerical modelling and data analysis efforts, which have examined various aspects of these floods, such as events' predictability, meteorological and oceanographic drivers, and the interplay of contributing processes. Still, much of the detailed research has focused on events that severely impacted Venice (e.g. the floods of 4 November 1966 and 12 November 2019). The events that were more pronounced along the eastern Adriatic coast (e.g. the flood of 1 November 2012; Međugorac et al., 2018) remain less studied in the literature.
Table 1Title of the serial publication, format of the newspaper (microfilm or print), document ID number (“Signature”, from the National and University Library), publication interval, and corresponding episode IDs (as listed in Table 2) covered in the newspaper reports.
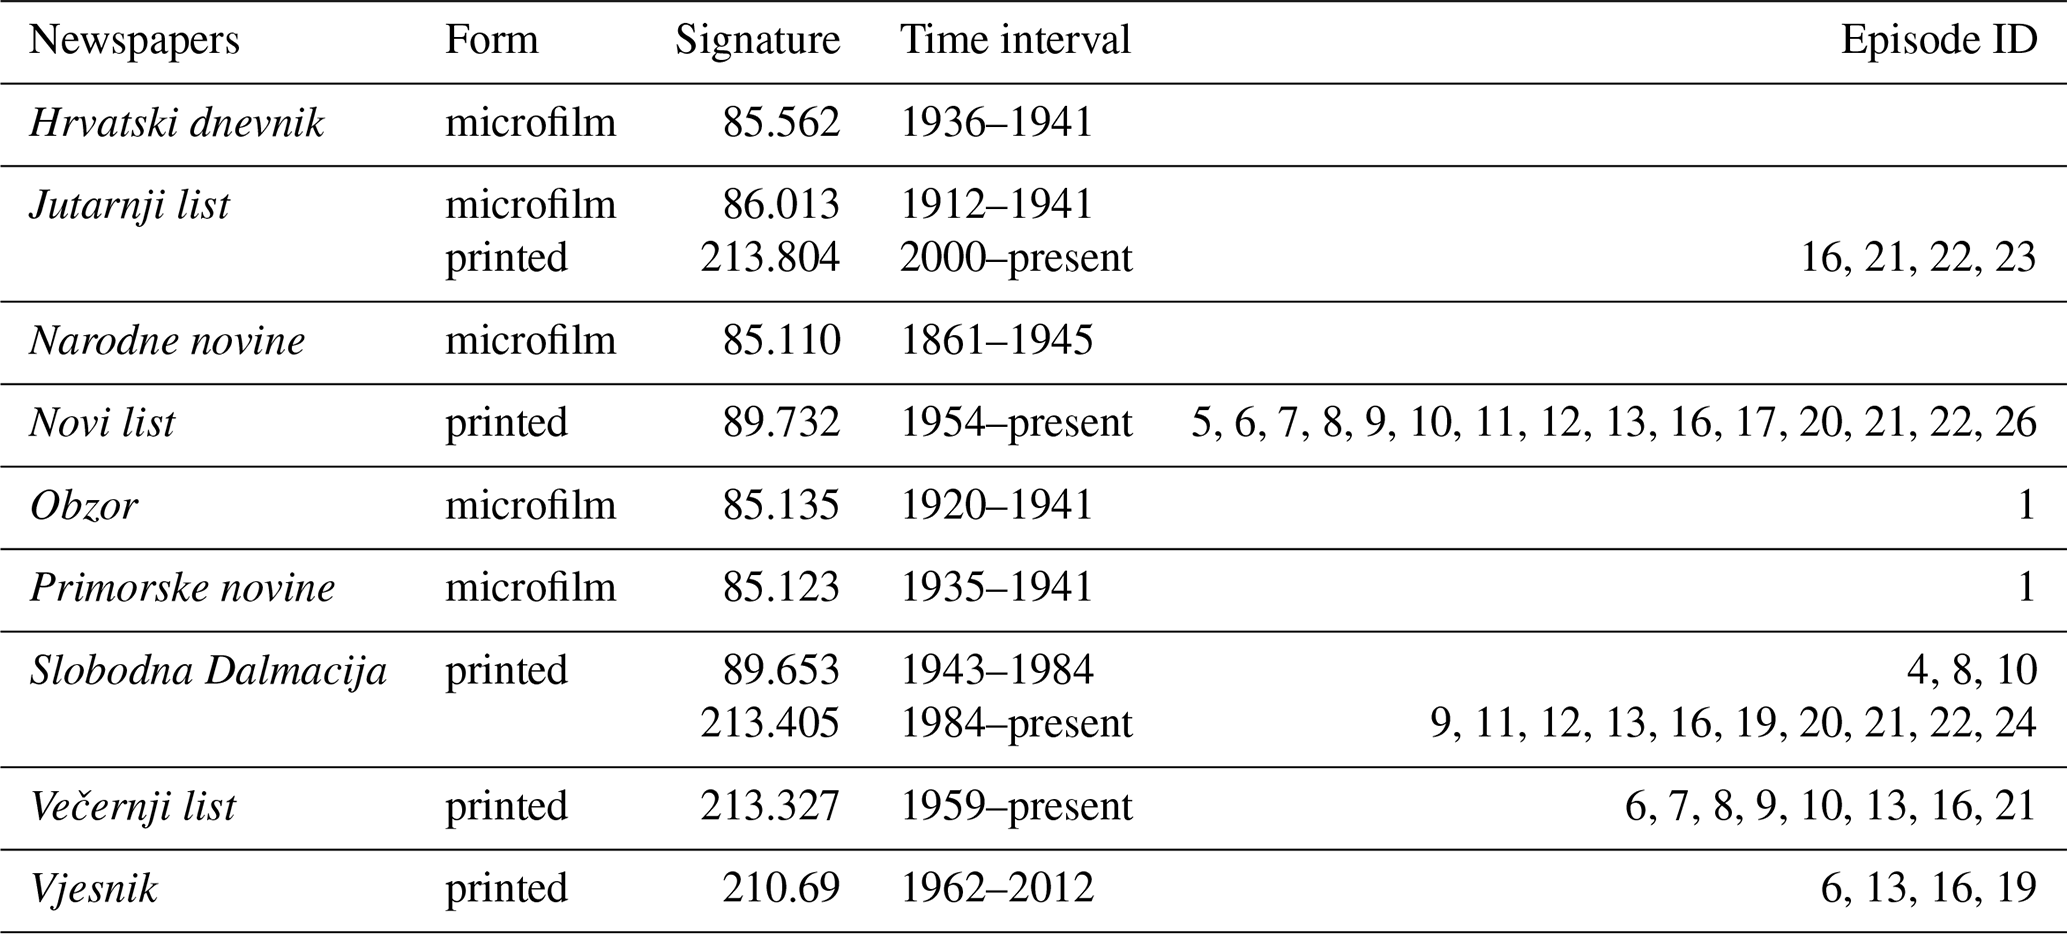
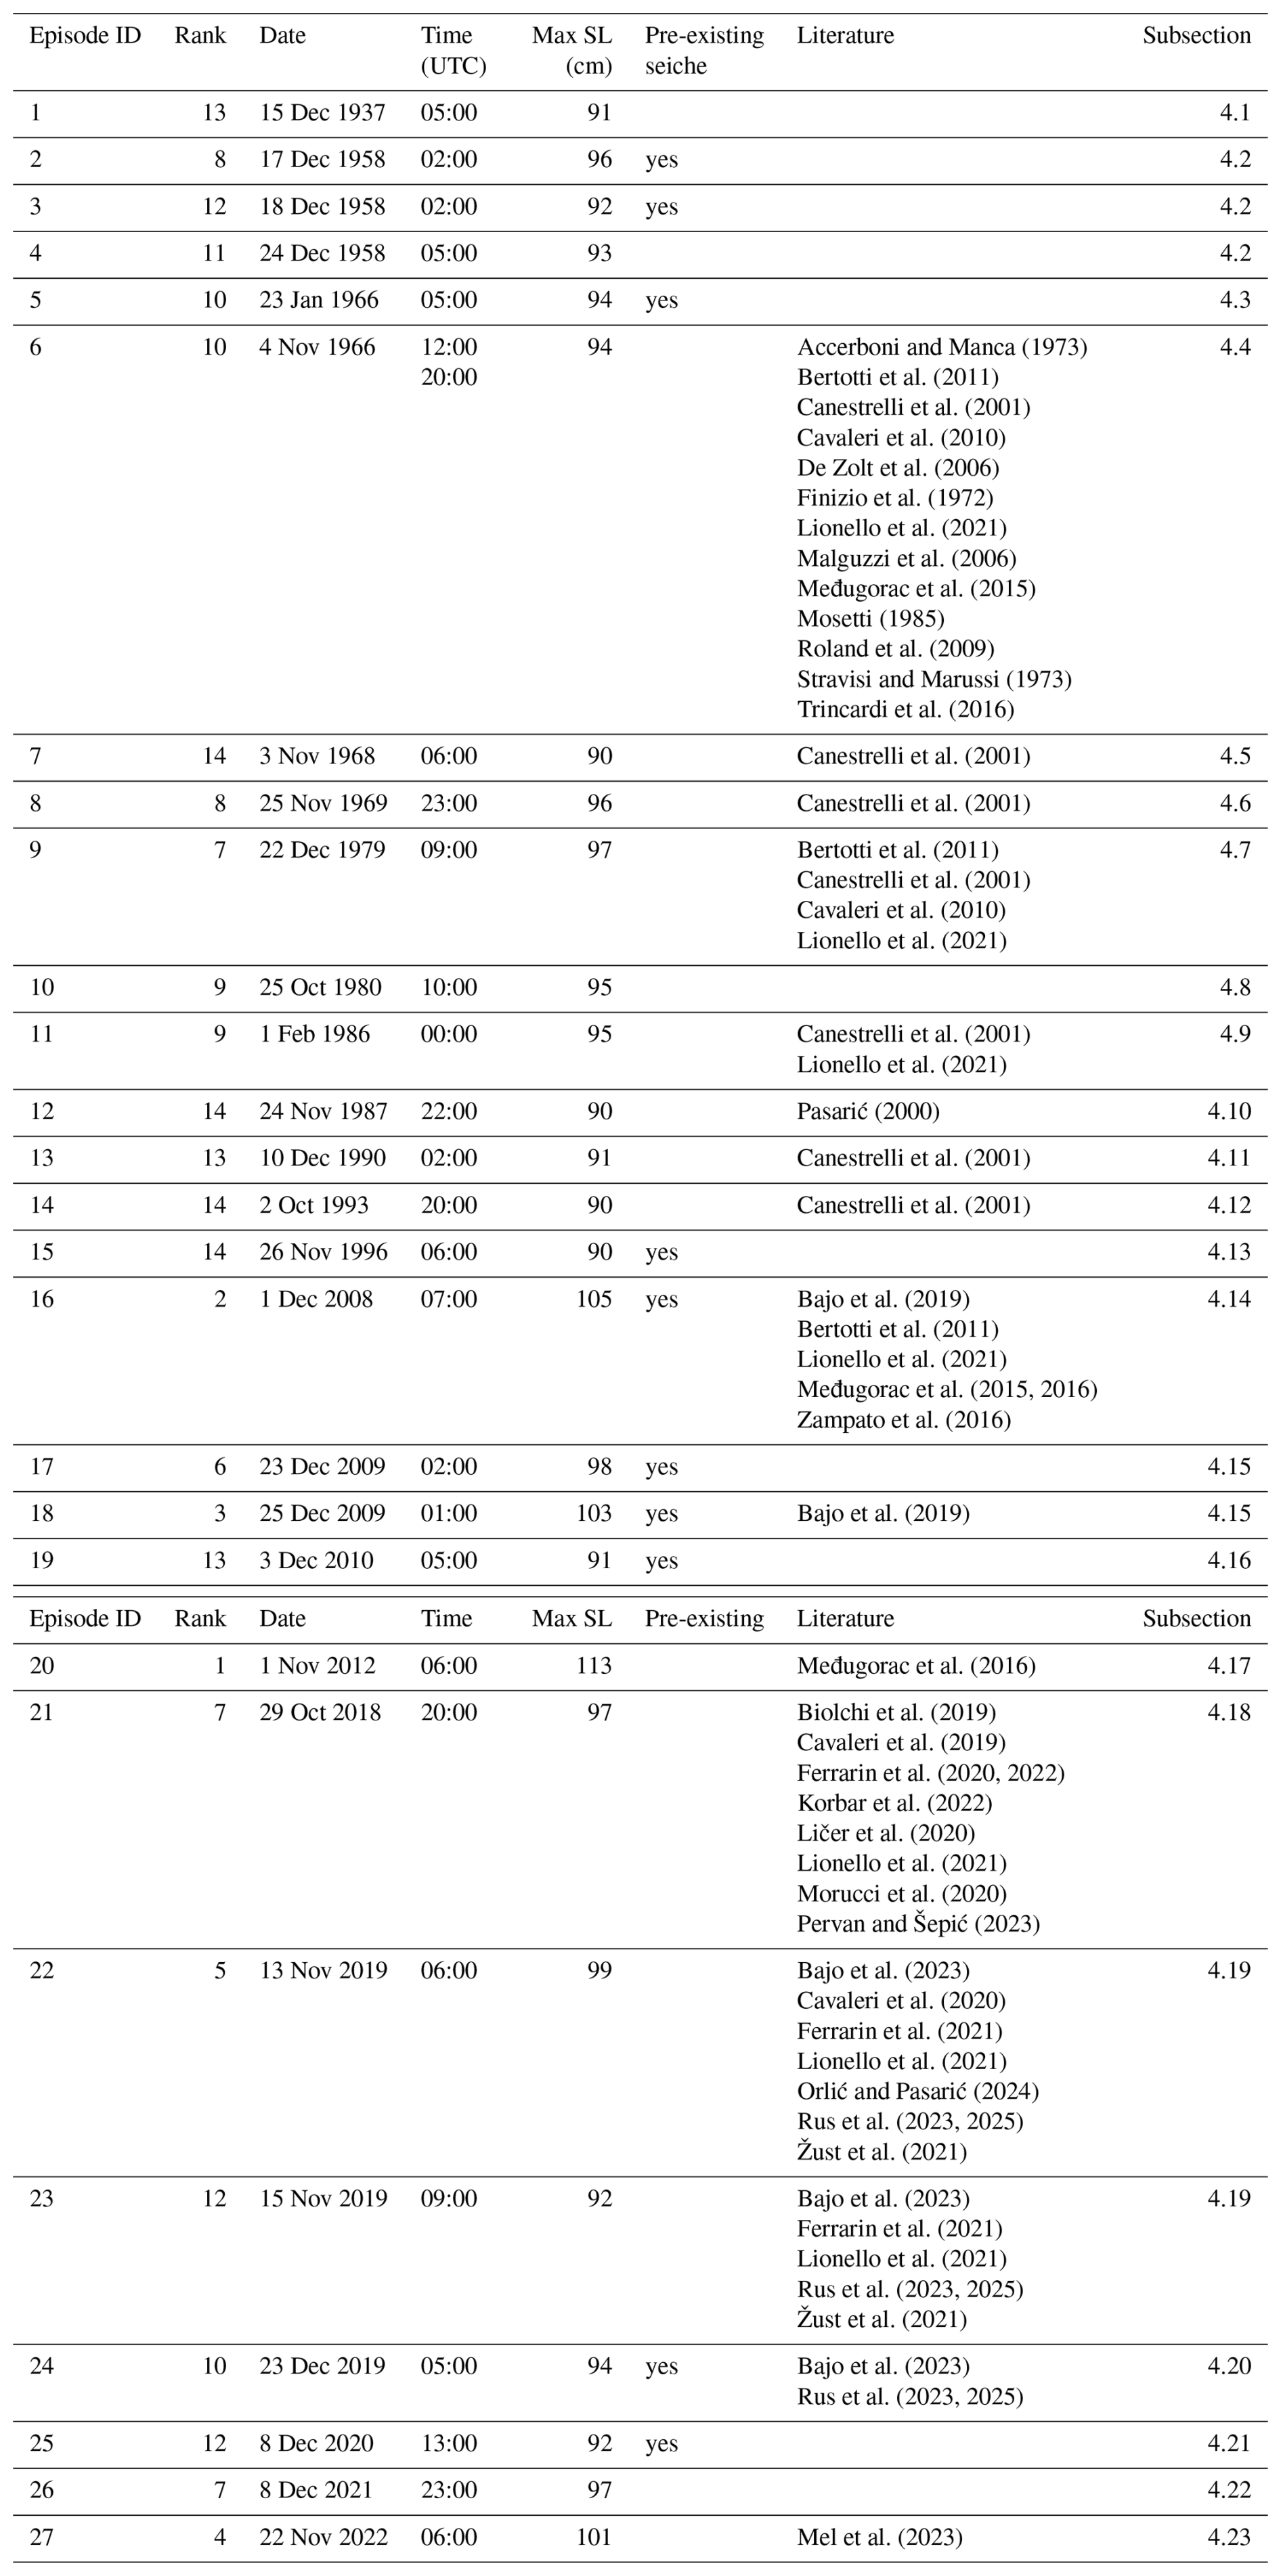
Table 2List of extreme SL episodes recorded at TG Bakar during the 1929–2022 period. Columns, from left to right, include the following: episode ID, episode rank (based on the maximum SL reached), date, time (UTC) of peak SL, maximum recorded SL, presence of pre-existing basin-wide seiches, list of scientific publications that have examined the episodes, and the number of the subsection in which each episode is analysed.
The aim of this paper is fourfold: (i) to compile a list of episodes with the highest sea levels recorded at Croatia's oldest TG station, Bakar, during the period from 1929 to 2022; (ii) to perform a process-oriented analysis of the episodes (examining the contribution of each SL component, along with the synoptic-scale, planetary-scale, and climatological context of the episodes); (iii) to summarise the impacts of these events on people's lives and on the natural and built environment along the Croatian coast; and (iv) to review the relevant studies that have addressed these flooding events in the past. The paper is organised as follows: after the introductory section (Sect. 1), Sect. 2 provides details on the sea-level, meteorological, and archival data used as well as past studies; Sect. 3 details the methodology, including the spectral analysis and decomposition of the sea-level and atmospheric time series; Sect. 4 provides a comprehensive analysis of the identified extreme episodes; Sect. 5 summarises and discusses the results; and Sect. 6 concludes the paper with the key findings.
2.1 Sea-level and meteorological data
The analysis of SL is based on hourly data measured at TG Bakar during the period from December 1929 to December 2022. TG Bakar (Međugorac et al., 2022, 2024a) was established on 5 December 1929 and was in operation until the beginning of the Second World War (May 1939); it was put back into operation in August of 1949 and has been in operation with minor interruptions ever since (Fig. 1). The sea levels measured at this station represent the longest recorded series of a single oceanographic parameter in Croatia and one of the longest records of sea level in the Mediterranean (Pérez Gómez et al., 2022) and worldwide. Further information about the station can be found on the station's website (https://www.pmf.unizg.hr/geof/en/research/oceanography/tide-gauge_station_bakar, last access: 10 December 2024). All SLs are given as values above the mean SL calculated over the 18.6-year period centred on 1971.5 (1962–1980; HVRS71 National Geodetic System; Rožić, 2009).
The atmospheric background of extremes, on a synoptic and planetary scale, was analysed using the following atmospheric fields from the ERA5 global reanalysis dataset (Hersbach et al., 2020; Hersbach et al., 2023a, b): mean sea-level pressure (MSLP), 10 m wind (u10 and v10 – referred to as W10 in this paper), and geopotential heights of the 500 hPa level (Z500). For episodes that occurred before 1 January 1940 (one episode), atmospheric background analyses were performed using the NOAA–CIRES–DOE 20th Century Reanalysis Project version 3 dataset (Slivinski et al., 2019). We also analysed reanalysis series of MSLP and Z500 taken at the sea grid point closest to the Bakar station (lon = 14.540, lat = 45.305, where lon and lat denote longitude and latitude) and W10 (u10 and v10) series taken at the sea grid points in the northern Adriatic (NA: lon = 14, lat = 44.3) and the middle Adriatic (MA: lon = 15.7, lat = 43) (shown in Fig. 1). The atmospheric reanalysis was complemented by measurements provided by the Croatian Meteorological and Hydrological Service (DHMZ): 24 h accumulated precipitation recorded at 06:00 UTC on specified days and hourly wind speeds (along with wind gusts, if recorded), both measured at coastal stations in Croatia. We also used synoptic maps from the Deutscher Wetterdienst (DWD, 2024).
2.2 Literature and archival data review
We conducted a literature search using sources such as the Web of Science and Google Scholar to compile a list of papers studying extracted extreme episodes. Only studies focusing on the meteo-oceanographic aspects of the episodes are included. Papers that merely mention the events or address unrelated topics are excluded. For example, Storm Vaia (October 2018; Maioni, 2024), which caused severe flooding in the Adriatic (Table 2, ID 21), has been widely analysed in studies focusing on topics such as forest damage, heavy precipitation, and hydro-geomorphological responses in mountainous areas. These topics fall outside the scope of our research.
To examine the impacts of episodes, daily newspapers in print or microfilmed form, stored in the National and University Library were reviewed (Table 1). Articles related to floods were found for 20 events. No records were found for the events of 17 and 18 December 1958, 2 October 1993, 26 November 1996, 23 December 2009, 8 December 2020, or 22 November 2022. For more recent episodes (starting with the episode of 1 December 2008), we also checked available online sources (listed under “Flood impacts” for each event).
3.1 Definition of extreme episodes
Extreme sea levels were defined as occasions on which the measured SL exceeded the 99.99th percentile threshold (89 cm for 1929–2022) of SL series. The inundation of most sea promenades in the northern Adriatic (built in the second half of the 20th century to be 50–75 cm above the mean SL at that time) occurs before 89 cm is reached in Bakar; thus, most of the studied events were undoubtedly associated with northern Adriatic floods. Consecutive values exceeding the given threshold were combined into one event, represented by the maximum SL reached during that event. Furthermore, consecutive events separated by a sea level lower than 89 cm but associated with a single atmospheric disturbance (e.g. a cyclone) were merged into a single episode. Only one such episode (consisting two events) was identified: on 4 November 1966 – the two significant peaks of this episode were due to the tidal maxima occurring on top of a sea level elevated due to other processes (Međugorac et al., 2015). We assigned a rank to each extreme based on the maximum total sea level reached during an episode (Table 2).
3.2 Decomposition of sea-level and meteorological series
Figure 2 shows the power spectrum of the Bakar SL record, with vertical lines marking the cut-off periods used to separate the total signal into five frequency bands corresponding to the defined components. In our analysis, we filter the SL time series into the following five components: (i) high-frequency oscillations, (ii) tide, (iii) synoptic component, (iv) planetary-scale variability, and (v) long-term sea-level variability. The definitions of these components are based on known sea-level drivers, spectral properties, and established methodologies (e.g. Šepić et al., 2022).
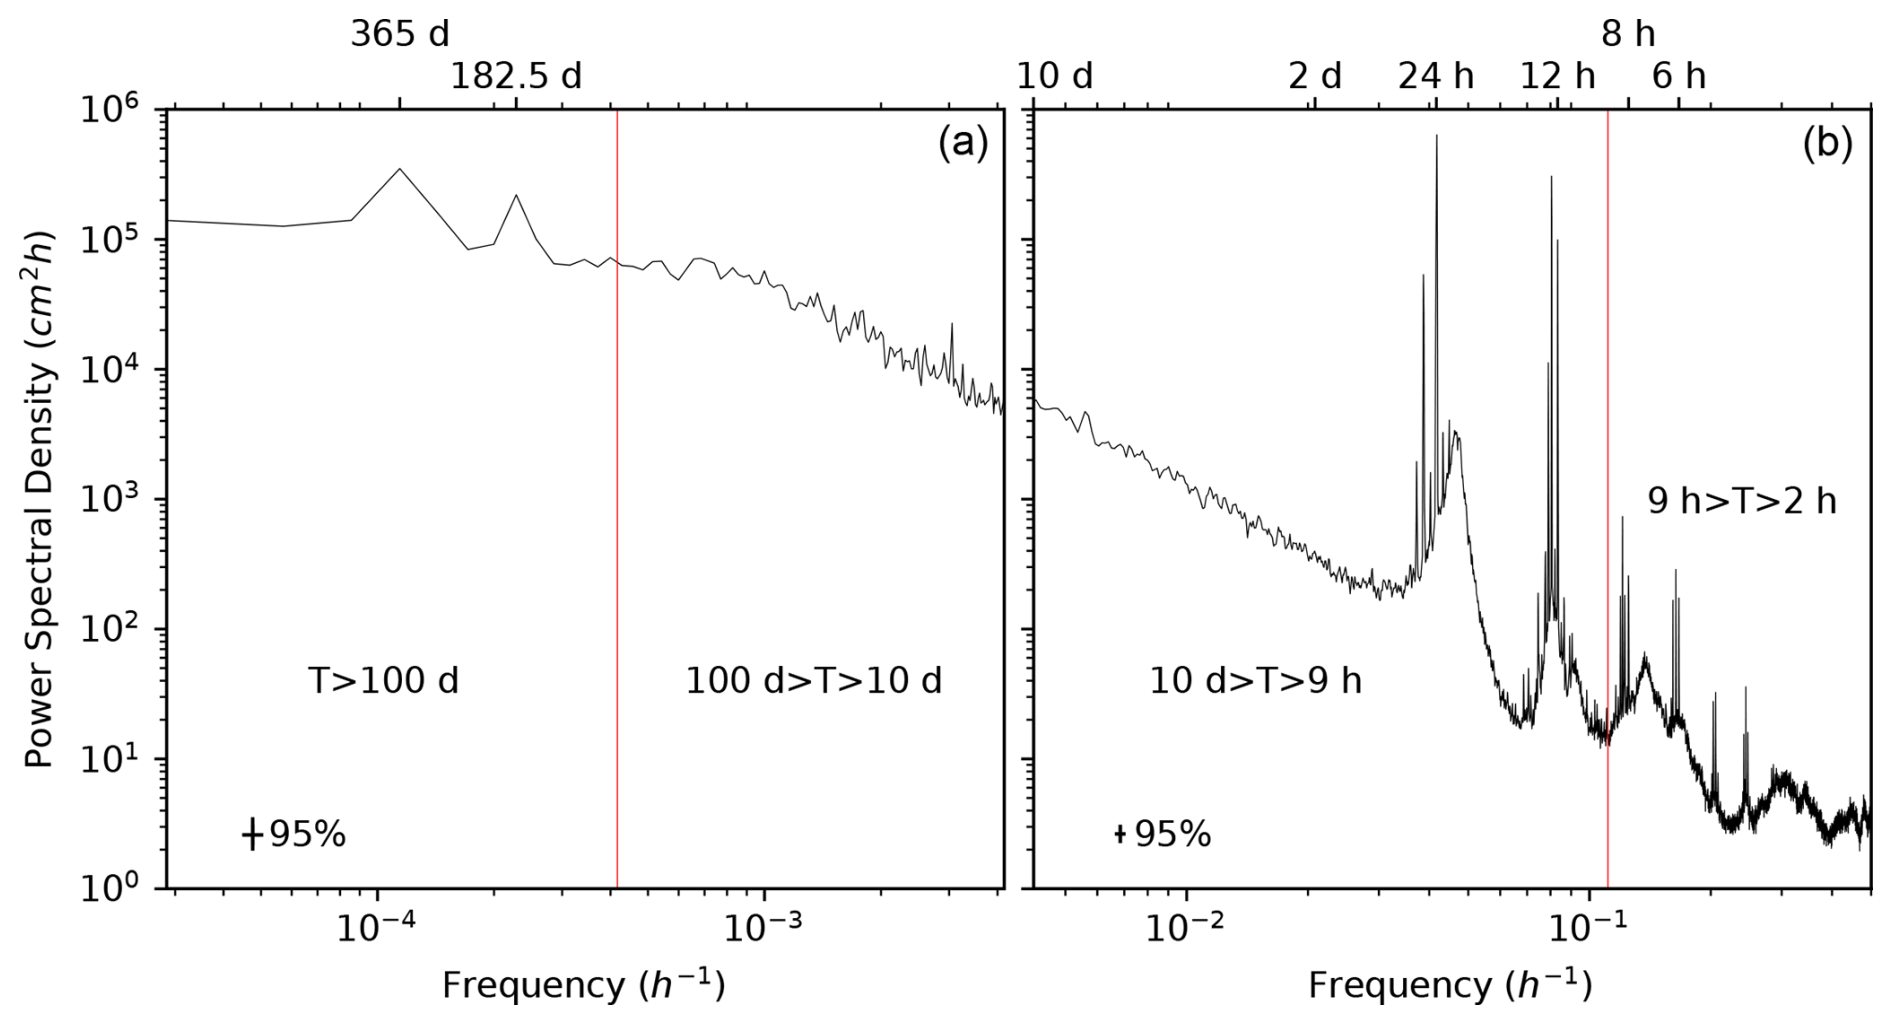
Figure 2Power spectral densities of the total SL measured at TG Bakar (1950–2022), shown for periods longer than 10 d (a) and shorter than 10 d (b). Spectra were computed using Hamming windows with a 50 % overlap: 4-year windows for the left panel and 1-year windows for the right panel. Vertical red lines indicate a period of 100 d (a) or 9 h (b). The 95 % confidence intervals are indicated. Vertical lines (red and sub-plot edges) mark boundaries between different SL processes.
We first isolated tide using harmonic analysis and synthesis. Specifically, we applied the MATLAB T_tide toolbox (Pawlowicz et al., 2002) year by year to hourly series. In each yearly subset, tide was modelled as the sum of the seven constituents (K1, O1, P1, K2, S2, M2, and N2), which are known to capture the majority of the tidal signal in the Adriatic Sea (Janeković and Kuzmić, 2005). Tidal constituents are visible in Fig. 2 as sharp peaks, which are strongest at periods of ∼ 12 and ∼ 24 h, but they are also visible at shorter (∼ 4.1 ∼ 4.9, ∼ 6.1, and ∼ 8.2 h) and longer (∼ 13.6 d) periods. Although obvious in Fig. 2, longer and shorter constituents were not explicitly included, as they have a minor impact on the tidal signal. Šepić et al. (2022) found that the mean absolute difference between tides estimated using all significant harmonics (43 components) and those using only the seven dominant harmonics was 2.48 cm in Bakar (estimated for the period from 1956 to 2020). Once tide was estimated and removed from the observed SLs, the non-tidal residual (de-tided) SL was further decomposed using filtering methods.
The de-tided SL series were subsequently split into the four non-tidal components by successive digital filtering, proceeding from the longest period to the shortest. We applied low-pass filters based on Kaiser windows, with half-power points at 100 d, 10 d, and 9 h. The 100 and 10 d limits follow established methodologies, while the 9 h limit was selected as it corresponds to a minimum in the SL spectrum (Fig. 2). Although the SL spectrum in the low-frequency range is rather monotonic, imposing these divisions is useful because different physical forcing mechanisms dominate on different timescales (e.g. Pugh and Thompson, 1986; Pasarić and Orlić, 2001).
High-frequency component covers periods of 2 h < T < 9 h. In our data, it notably includes the Kvarner Bay seiche (broad peak at ∼ 6 h) and the second higher harmonic of the Adriatic-wide seiche (broad peak at ∼ 7.3 h) (Goldberg and Kempni, 1938; Ruić et al., 2023). To our knowledge, the origin of the increased energy at a period of ∼ 3.2 h is unclear; the peak was reported but not explained by Šepić et al. (2022). It should be noted that tidal oscillations at periods of ∼ 8.2 h and shorter are also contained in this component.
Synoptic component covers periods of 9 h < T < 10 d. It includes storm surges and the two longest modes of the Adriatic-wide seiche. The fundamental mode is visible as a broad peak at ∼ 21.2 h and the first higher harmonic as a peak at ∼ 10.8 h (Fig. 2). For each episode, we assessed whether the fundamental basin-wide seiche was present and potentially contributing to synoptic component. This was done by visually inspecting the de-tided SL series in search of clearly distinguishable oscillations with 21.2 h period. If such oscillations were observed within up to 3 d prior to the extreme event, we assumed that the seiche was also active during the episode itself. This is a semiempirical approach, previously applied in similar studies (Međugorac et al., 2015; Šepić et al., 2022). In this paper, we use it solely to identify the presence of the basin-wide seiche – not to quantify its contribution to SL extremes.
Planetary-scale component covers periods of 10 d < T< 100 d, and it is primarily a response of SL to atmospheric Rossby waves. In our data, it also includes a longer-period tidal constituent, visible as a spectral line at ∼ 13.6 d (Fig. 2).
Long-term sea-level variability encompasses processes acting over periods of 100 d < T. In this paper, we examined this component in terms of three sub-processes, separated using filters with Kaiser windows: (i) intra-annual variability (100 d < T < 456 d), which includes the mean seasonal cycle and its anomalies; (ii) interannual variability (456 d < T < 5 years); and (iii) mean sea-level change (5 years < T), which includes (multi)decadal variations and the secular trend. The intra-annual variability was considered instead of the mean seasonal cycle (which is typically derived from a stationary model with fixed amplitude and phase) because the seasonal cycle in the Mediterranean shows significant interannual variability (e.g. Pérez-Gómez et al., 2021). As a result, using the mean seasonal cycle would not accurately reflect year-to-year changes. Additionally, the upper boundary of 456 d (15 months) was chosen to avoid splitting the annual process between intra-annual and interannual variability.
Figures 3–72 show the five sea-level processes, their contributions to the maxima, and the associated meteorological conditions on synoptic and planetary scales for each episode. Figure 73 presents long-term sea-level variability, decomposed into the three aforementioned sub-processes.
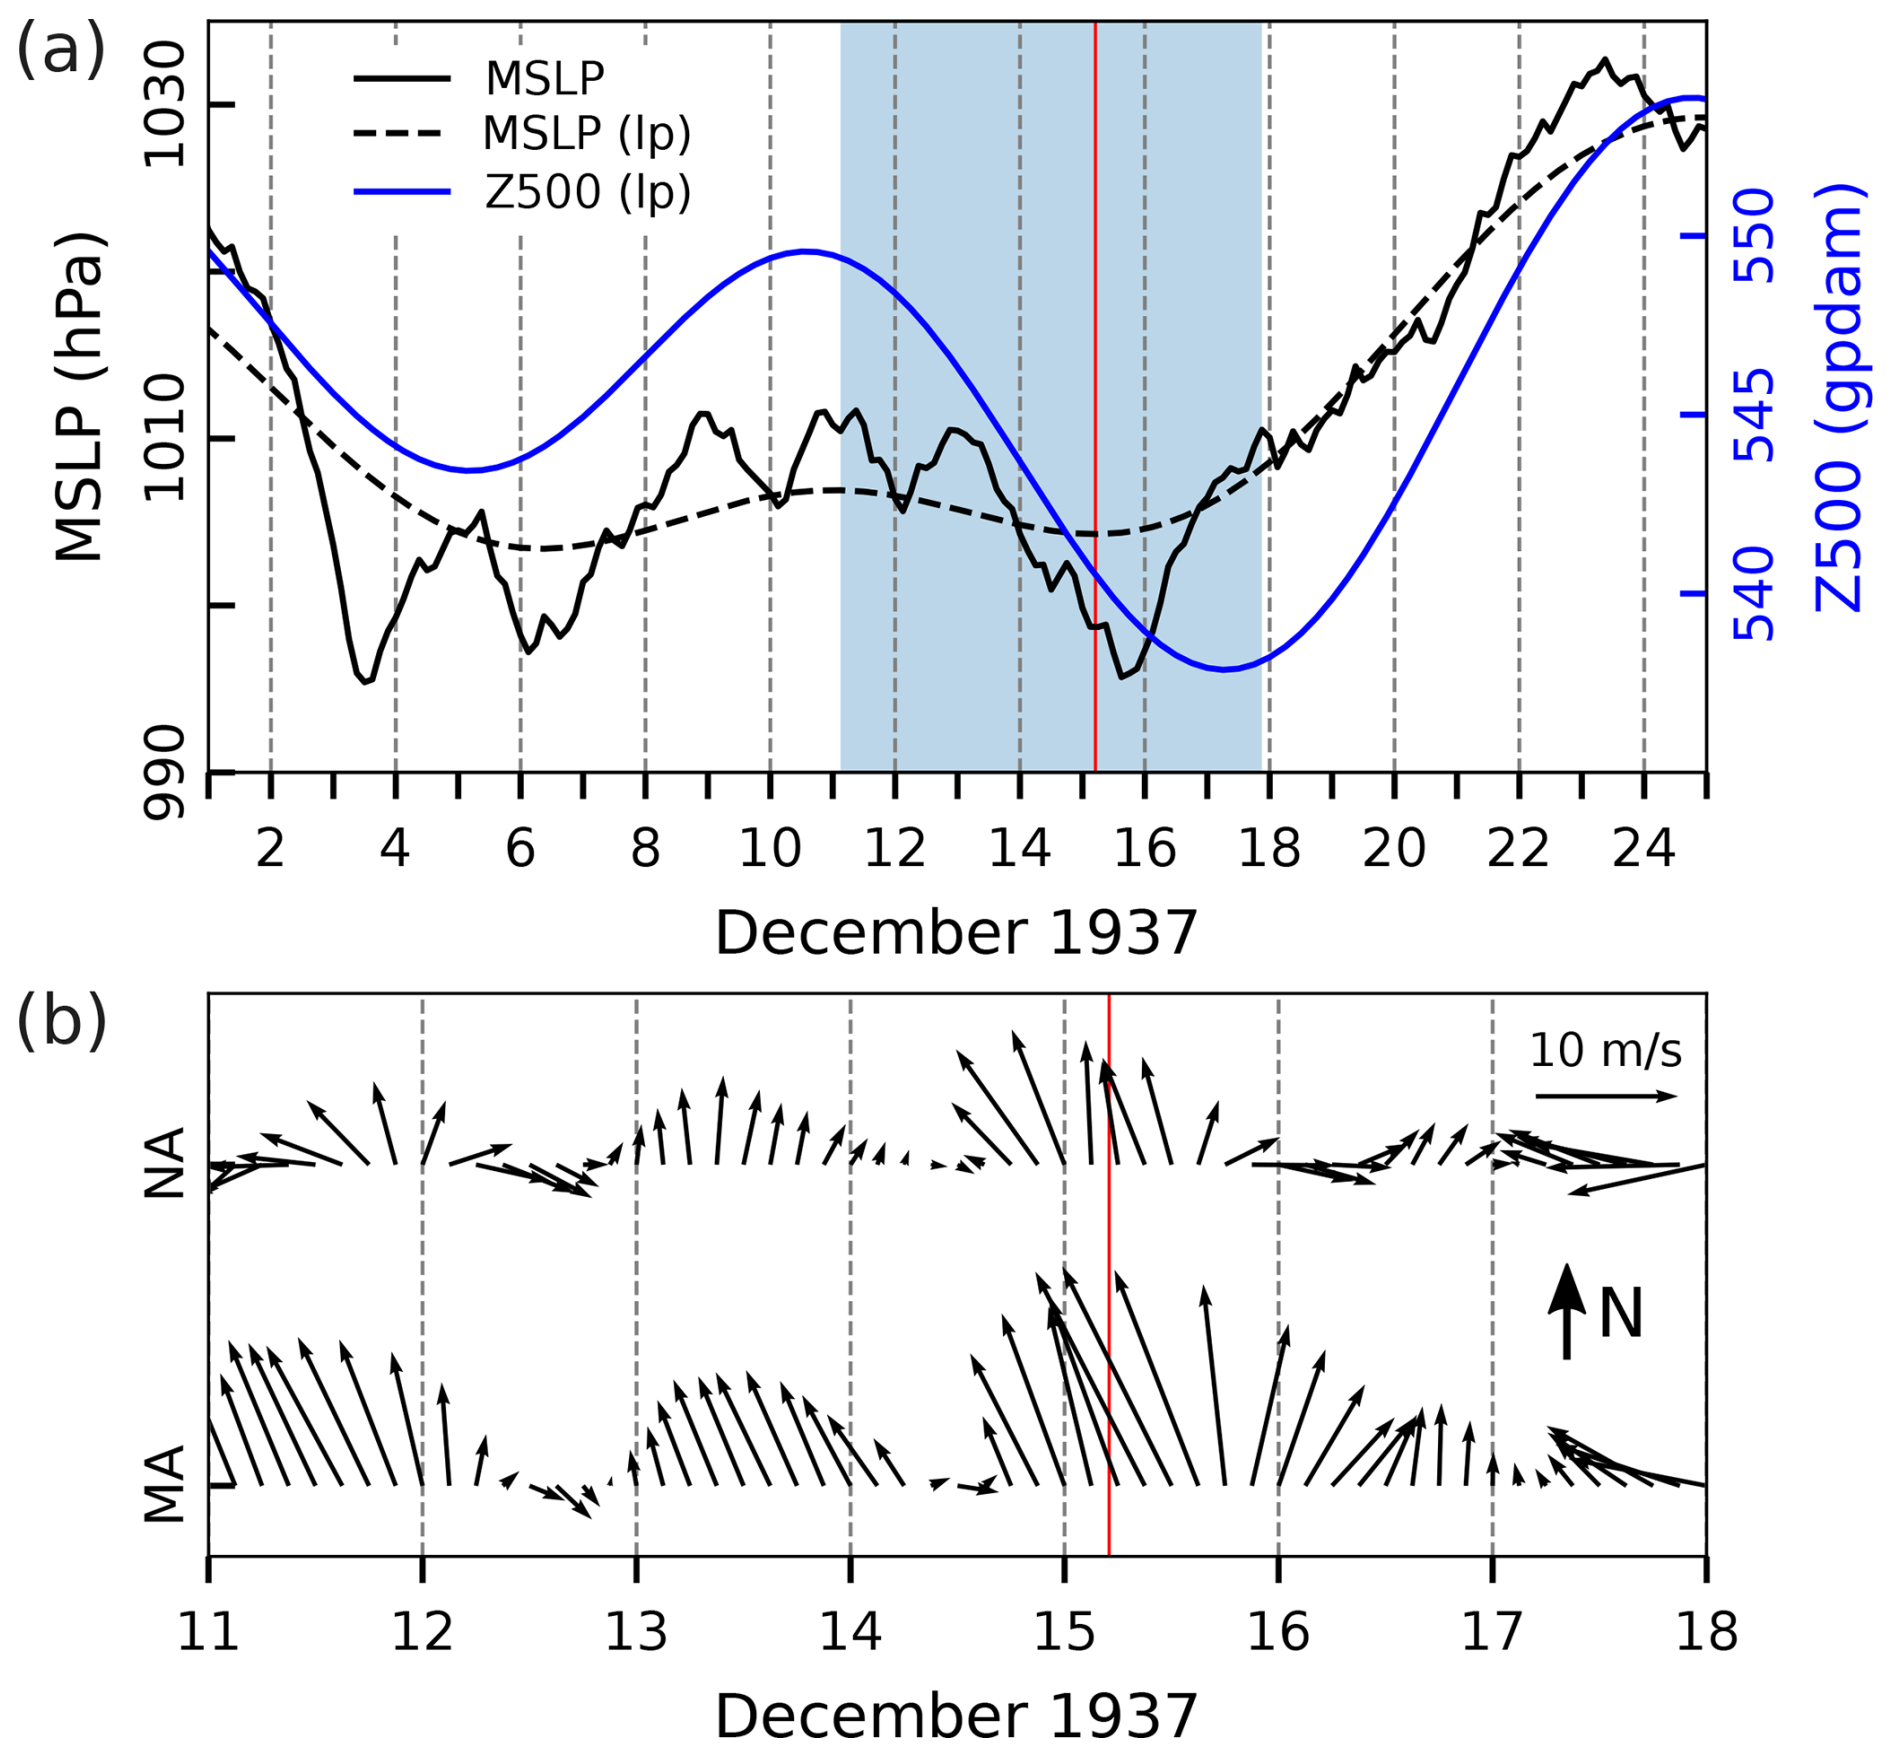
Figure 3Series of NOAA–CIRES–DOE reanalysis data related to the flood of 15 December 1937. (a) MSLP (every 3 h) and MSLP (lp) (low-pass filtered with a cut-off frequency of 10 d) and Z500 (lp) (low-pass filtered with a cut-off frequency of 10 d) at a grid point near TG Bakar. (b) W10 (every 3 h) during the period marked in blue in the upper plot for the middle Adriatic (MA) and northern Adriatic (NA) (all locations marked in Fig. 1). The red line indicates the onset of the SL maximum.
Given the high concentration of extreme episodes at the end of the studied period (seven episodes since 2018), we note that, for these episodes, additional attention should be given to the reliability of long-term sea-level variability, especially in relation to mean sea-level change (5 years < T). Filtering can heavily affect the edges of time series. To check whether this is an issue for our problem, we compared mean sea-level change calculated first for a full interval (1929–2022; black line in Fig. 73b) and then for a shorter interval (1957–1992; red line in Fig. 73b), and we paid special attention to differences between these two series at the edges of the shorter series (1957–1962; 1987–1992). In this way, we get an idea about the length of the unreliable marginal period. From Fig. 73b, it is evident that mean sea-level change is significantly affected by boundary values, especially in situations when sea level is anomalously high or low, as was the case in 1992 (anomalously low).
To analyse atmospheric forcing on a planetary scale and the corresponding SL response (planetary-scale component), we compared low-pass series of MSLP, Z500, and W10 (filtered with a 10 d cut-off frequency) with joint planetary-scale and long-term sea-level components. While planetary atmospheric forcing acts over periods of 10 d < T < 100 d and, thus, presumably affects only planetary-scale component (10 d < T < 100 d), we use the low-pass-filtered series (and not the band-pass ones) because, at periods longer than 100 d, both atmospheric and SL series show minimal variations over the time frames presented in the figures (approximately 1 month), i.e. series at periods longer than 100 d effectively act as mean values. We focus on MSLP, Z500, and W10 because, during the colder part of the year (over periods of 10 d < T < 100 d), the atmosphere exhibits quasi-barotropic behaviour. This allows disturbances in the middle troposphere (500 hPa) to be reflected at the surface (MSLP and accompanying W10), making Z500 a reliable indicator of planetary-scale surface meteorological conditions. In this paper, both in the text and figures, these low-pass series are labelled as MSLP (lp), Z500 (lp), and (for sea level) plan + long.
Episodes of extreme sea levels are listed chronologically in Table 2. For each episode, we first provide an overview of relevant past studies, followed by a description of the meteorological background, the sea-level processes contributing to the total SL, and the impacts of the episodes (on people, coastal infrastructure, and the environment), using information from sources listed in Table 1, supplemented with online sources for recent episodes.
4.1 The flood of 15 December 1937 (ID 1; rank 13)
This episode has not yet been addressed in the scientific literature.
4.1.1 Meteorological background
In the days leading up to this episode, weather conditions over the Adriatic were characterised by an air pressure of around 1010 hPa and predominantly southerly winds (Fig. 3). In the upper levels, a southwesterly flow prevailed at the leading edge of a vast trough extending from the Atlantic across western and central Europe to southeastern Europe. Within this trough, as colder air descended from the north towards the British Isles, a surface-based cyclone intensified over Great Britain on 13 and 14 December, with the central air pressure dropping to 985 hPa. At the same time, an upper-level ridge was present over the eastern Mediterranean, accompanied by a surface air pressure of around 1020 hPa. During the night of 14–15 December (Fig. 4a), a new cyclone developed in the Gulf of Lion, quickly moving towards the Tyrrhenian Sea and entering the Adriatic Sea in the early hours of 15 December (Fig. 4b). This situation led to a pronounced MSLP gradient over the Adriatic; as a result, a strong southerly wind developed on 14 December, shifting to strong to gale southwesterly and westerly winds in the evening and during the night of 15–16 December (Fig. 3b) (according to the Beaufort scale, strong wind: 10.8–13.8 m s−1; gale wind: 17.2–20.70 m s−1). Precipitation along the coast was heavier in the northern Adriatic compared to the south: on 15 December, 37 mm was recorded in Rijeka (Trsat); 11 mm was recorded in Novalja (an island near Zadar); and 6 mm was recorded in Hvar (an island near Split).
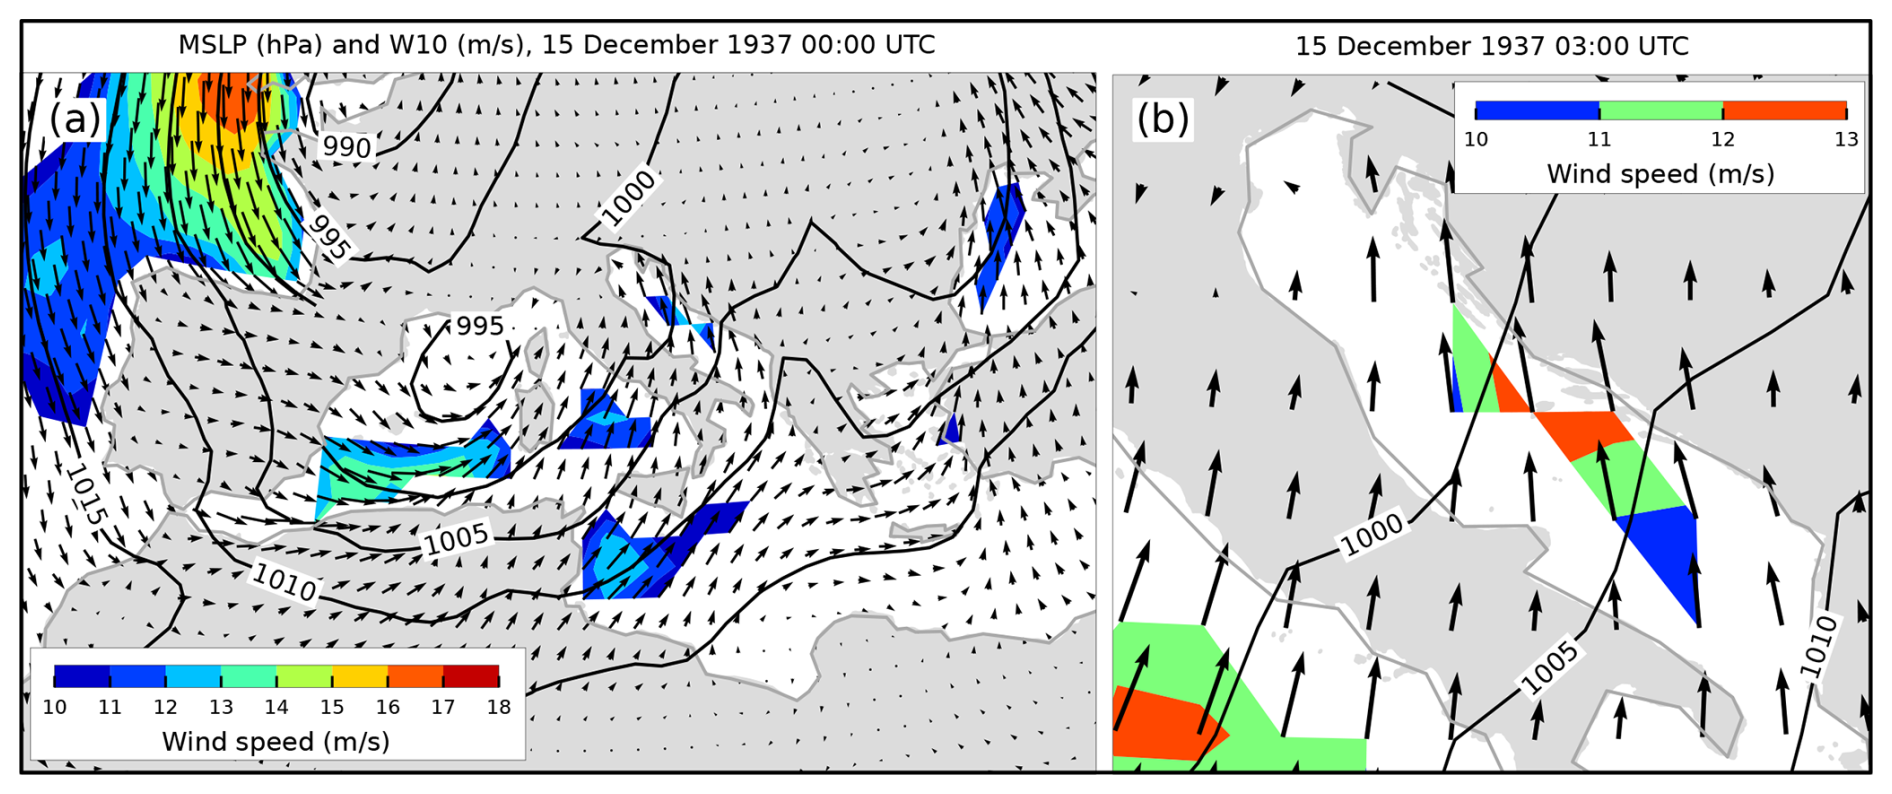
Figure 4MSLP (black lines) and W10 (arrows and colours) fields from the NOAA–CIRES–DOE reanalysis. Condition (a) over the Mediterranean that preceded the situation (b) over the Adriatic (an hour before maximum SL in Bakar). Only wind speeds exceeding 10 m s−1 are coloured.
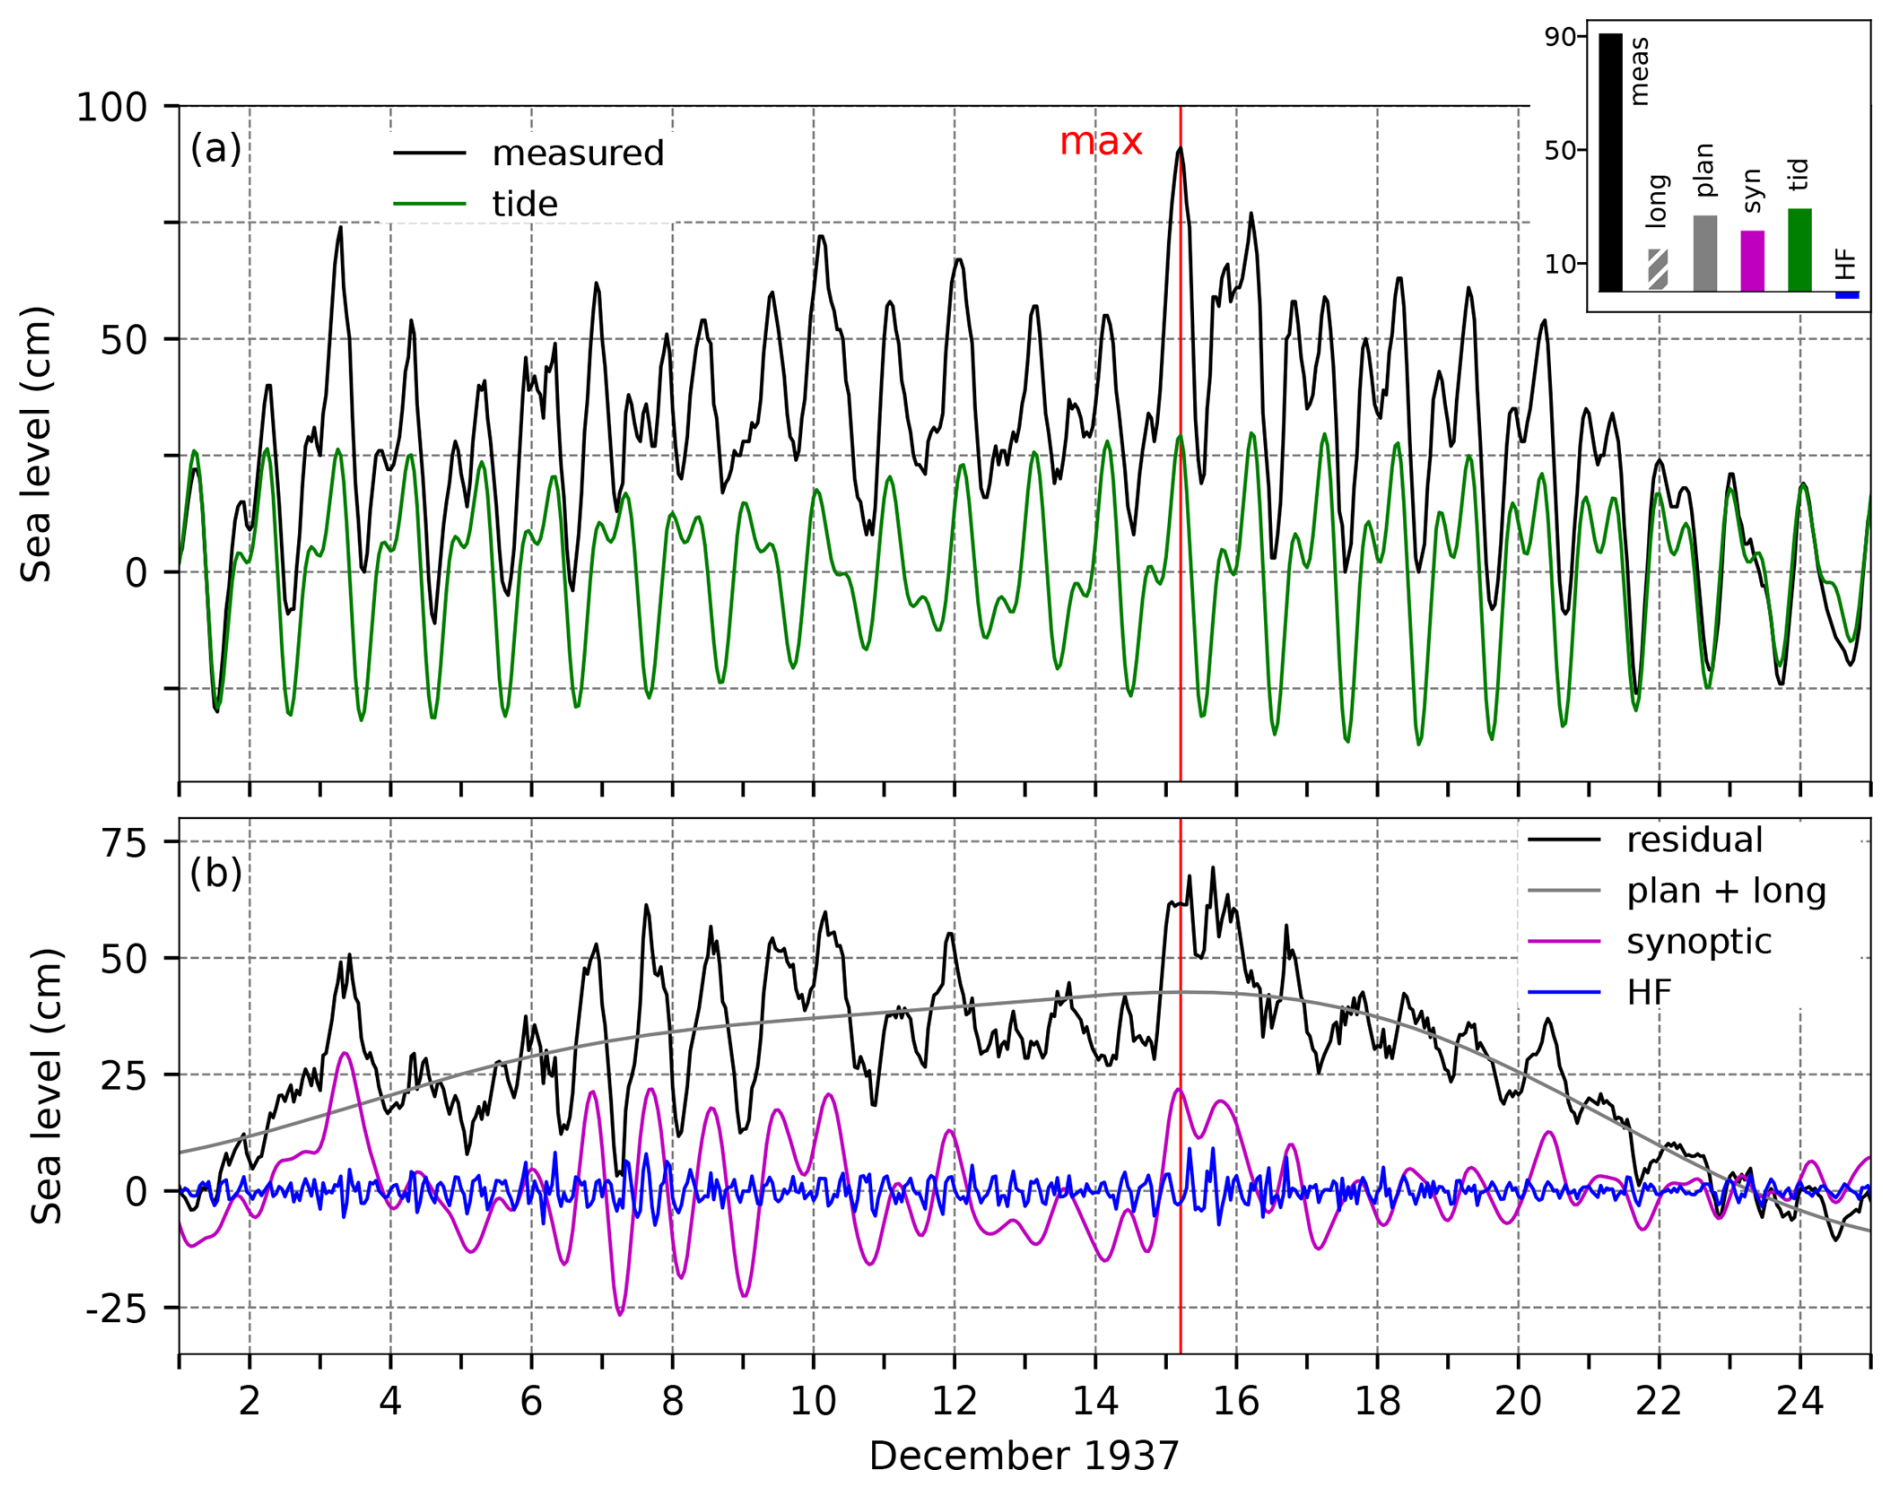
Figure 5SL series for the flood of 15 December 1937. Panel (a) shows the measured sea level (black) and tide (green). The inset figure shows the contributions (cm) of the five sea-level components to the maximum measured sea level (“meas”; 05:00 UTC): “HF” refers to high-frequency oscillations (2 h < T < 9 h), “syn” to synoptic component (9 h < T < 10 d), “tid” to tide, “plan” to planetary-scale variability (10 d < T < 100 d), and “long” to long-term sea-level variability (100 d < T). Panel (b) presents the residual sea level (black), the combined series of planetary-scale variability and long-term sea-level variability (grey; plan + long), synoptic component (purple), and high-frequency oscillations (blue). The red line indicates the time of occurrence of the total SL maximum.
4.1.2 Sea-level evolution
On 15 December 1937, at 05:00 UTC, the sea level in Bakar rose to 91 cm above the long-term mean (Table 2, Fig. 5).
The moon was just 2 d before the full moon, resulting in a semidiurnal spring tide. The SL maximum coincided with the primary daily tidal peak, with tide contributing 29 cm.
High-frequency oscillations were not pronounced during the episode, and they mitigated it by 3 cm.
Before the main event, several mild atmospheric disturbances impacted the Adriatic (Fig. 3a), generating basin-wide oscillations (Fig. 5b). The most notable episode of seiches occurred from 6 to 11 December. However, these oscillations were dampened before the main event and consequently, synoptic component during the episode was primarily driven by a storm surge. Atmospheric forcing during the episode was relatively brief, producing only a weak SL response, which was less pronounced than the response to planetary forcing or the tidal influence (Fig. 5a, histogram). Synoptic component contributed 22 cm to the total maximum.
Significant preconditioning for the flood (estimated by assessing planetary-scale component) had developed well in advance (Fig. 5b). Planetary-scale component, which contributed 27 cm to the maximum sea level, started rising at the beginning of the month as MSLP (lp) (Fig. 3a) dropped and winds (10 d < T < 100 d) shifted to a southerly direction. While MSLP (lp) varied in the lead-up to the flood, southerly winds persisted throughout this period, reaching speeds of up to 8 m s−1 in the middle Adriatic and up to 4 m s−1 in the northern Adriatic.
Long-term sea-level variability contributed 16 cm to this maximum (Figs. 73 and A1). The episode occurred shortly after a particularly pronounced annual peak (Figs. 73d and A1), making intra-annual variability – including the mean seasonal cycle and its anomalies – the dominant contributor, accounting for 15.6 cm. In contrast, interannual variability slightly reduced this component by 0.2 cm (Fig. 73c), while mean sea-level change contributed just 0.6 cm (Fig. 73b).
In summary, the flood resulted from a moderate storm surge superimposed on a background sea level that had been elevated by a combination of tide, planetary-scale variability, and long-term sea-level variability.
4.1.3 Flood impacts
The Obzor (16 December 1937) and Primorske novine (17 December 1937) newspapers reveal that the effects of the episode were particularly strong in the middle and the southern Adriatic. These effects include (i) winds peaking at 30 m s−1 (Split; Fig. 1), (ii) waves up to 10 m high that flooded coastal areas, (iii) submergence of coastal roads, (iv) disruptions to maritime traffic, and (v) significant damage to windows and roofs.
4.2 The floods of 17, 18, and 24 December 1958 (IDs 2, 3, and 4; ranks 8, 12, 11)
These episodes have not yet been addressed in the scientific literature.
4.2.1 Meteorological background
From 10 to 25 December, the weather over Europe was characterised by a wide upper-level trough that encompassed most of the European mainland. At the same time, the surface air pressure ranged from 990 hPa over the British Isles to approximately 1010 hPa over the Balkans and eastern Europe. Such low air pressure over Great Britain was the result of constant cyclonic activity in the Atlantic. The centre of one of those cyclones moved over the Celtic Sea on 15 December, while the air pressure dropped up to 970 hPa, and it remained nearby for the next few days.
As a part of the above-mentioned wide upper-level trough, short-wave troughs moved one after another over the Adriatic, supporting the unstable weather, while the surface air pressure was low for days and ranged mostly from 990 to 1005 hPa (Fig. 6a). The gradients in the air pressure over the Adriatic Sea were especially pronounced on 17 December (Fig. 7b), as the upper-level ridge started to penetrate from northwest Africa towards the eastern Mediterranean accompanied by an air-pressure increase in the low levels; as a result, strong southeasterly, southerly, and southwesterly winds blew over the Adriatic (Figs. 6b and 7).
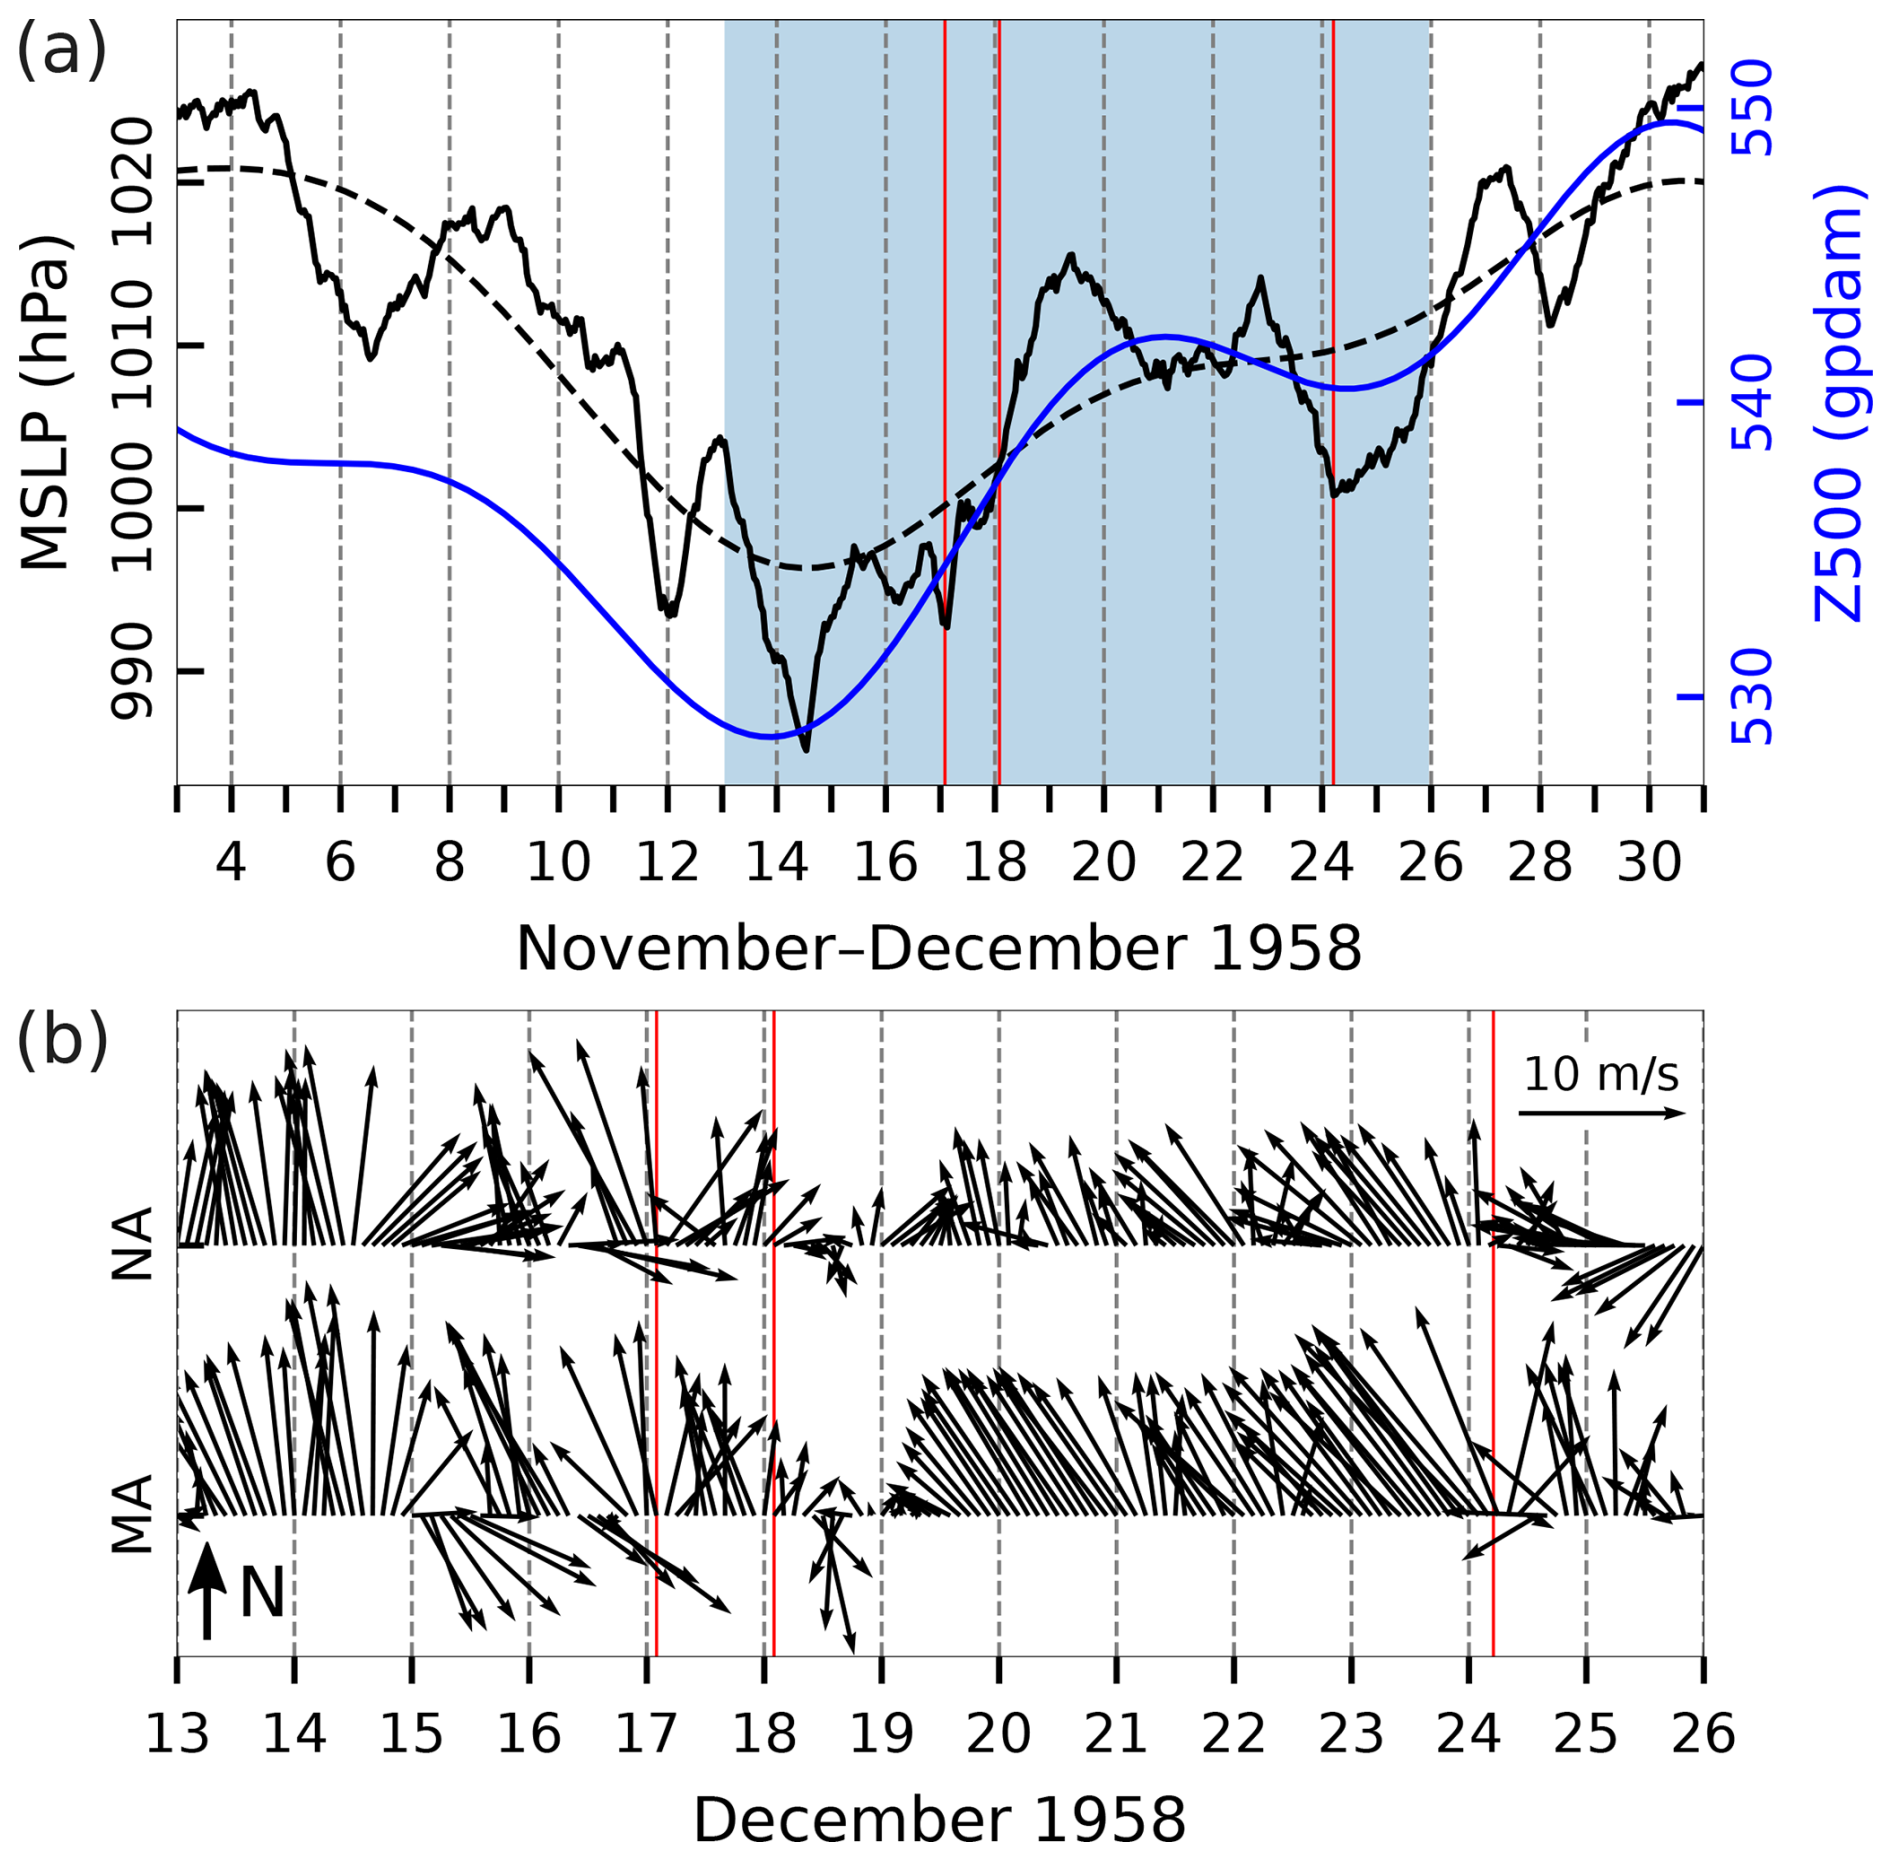
Figure 6Series of ERA5 reanalysis data related to the floods of 17, 18, and 24 December 1958. (a) MSLP (hourly) and MSLP (lp) (low-pass filtered with a cut-off frequency of 10 d) and Z500 (lp) (low-pass filtered with a cut-off frequency of 10 d) at a grid point near TG Bakar. (b) Hourly W10 during the period marked in blue in the upper plot for the middle Adriatic (MA) and northern Adriatic (NA) (all locations marked in Fig. 1). Every second value is plotted. The red lines indicate onset of the SL maxima.
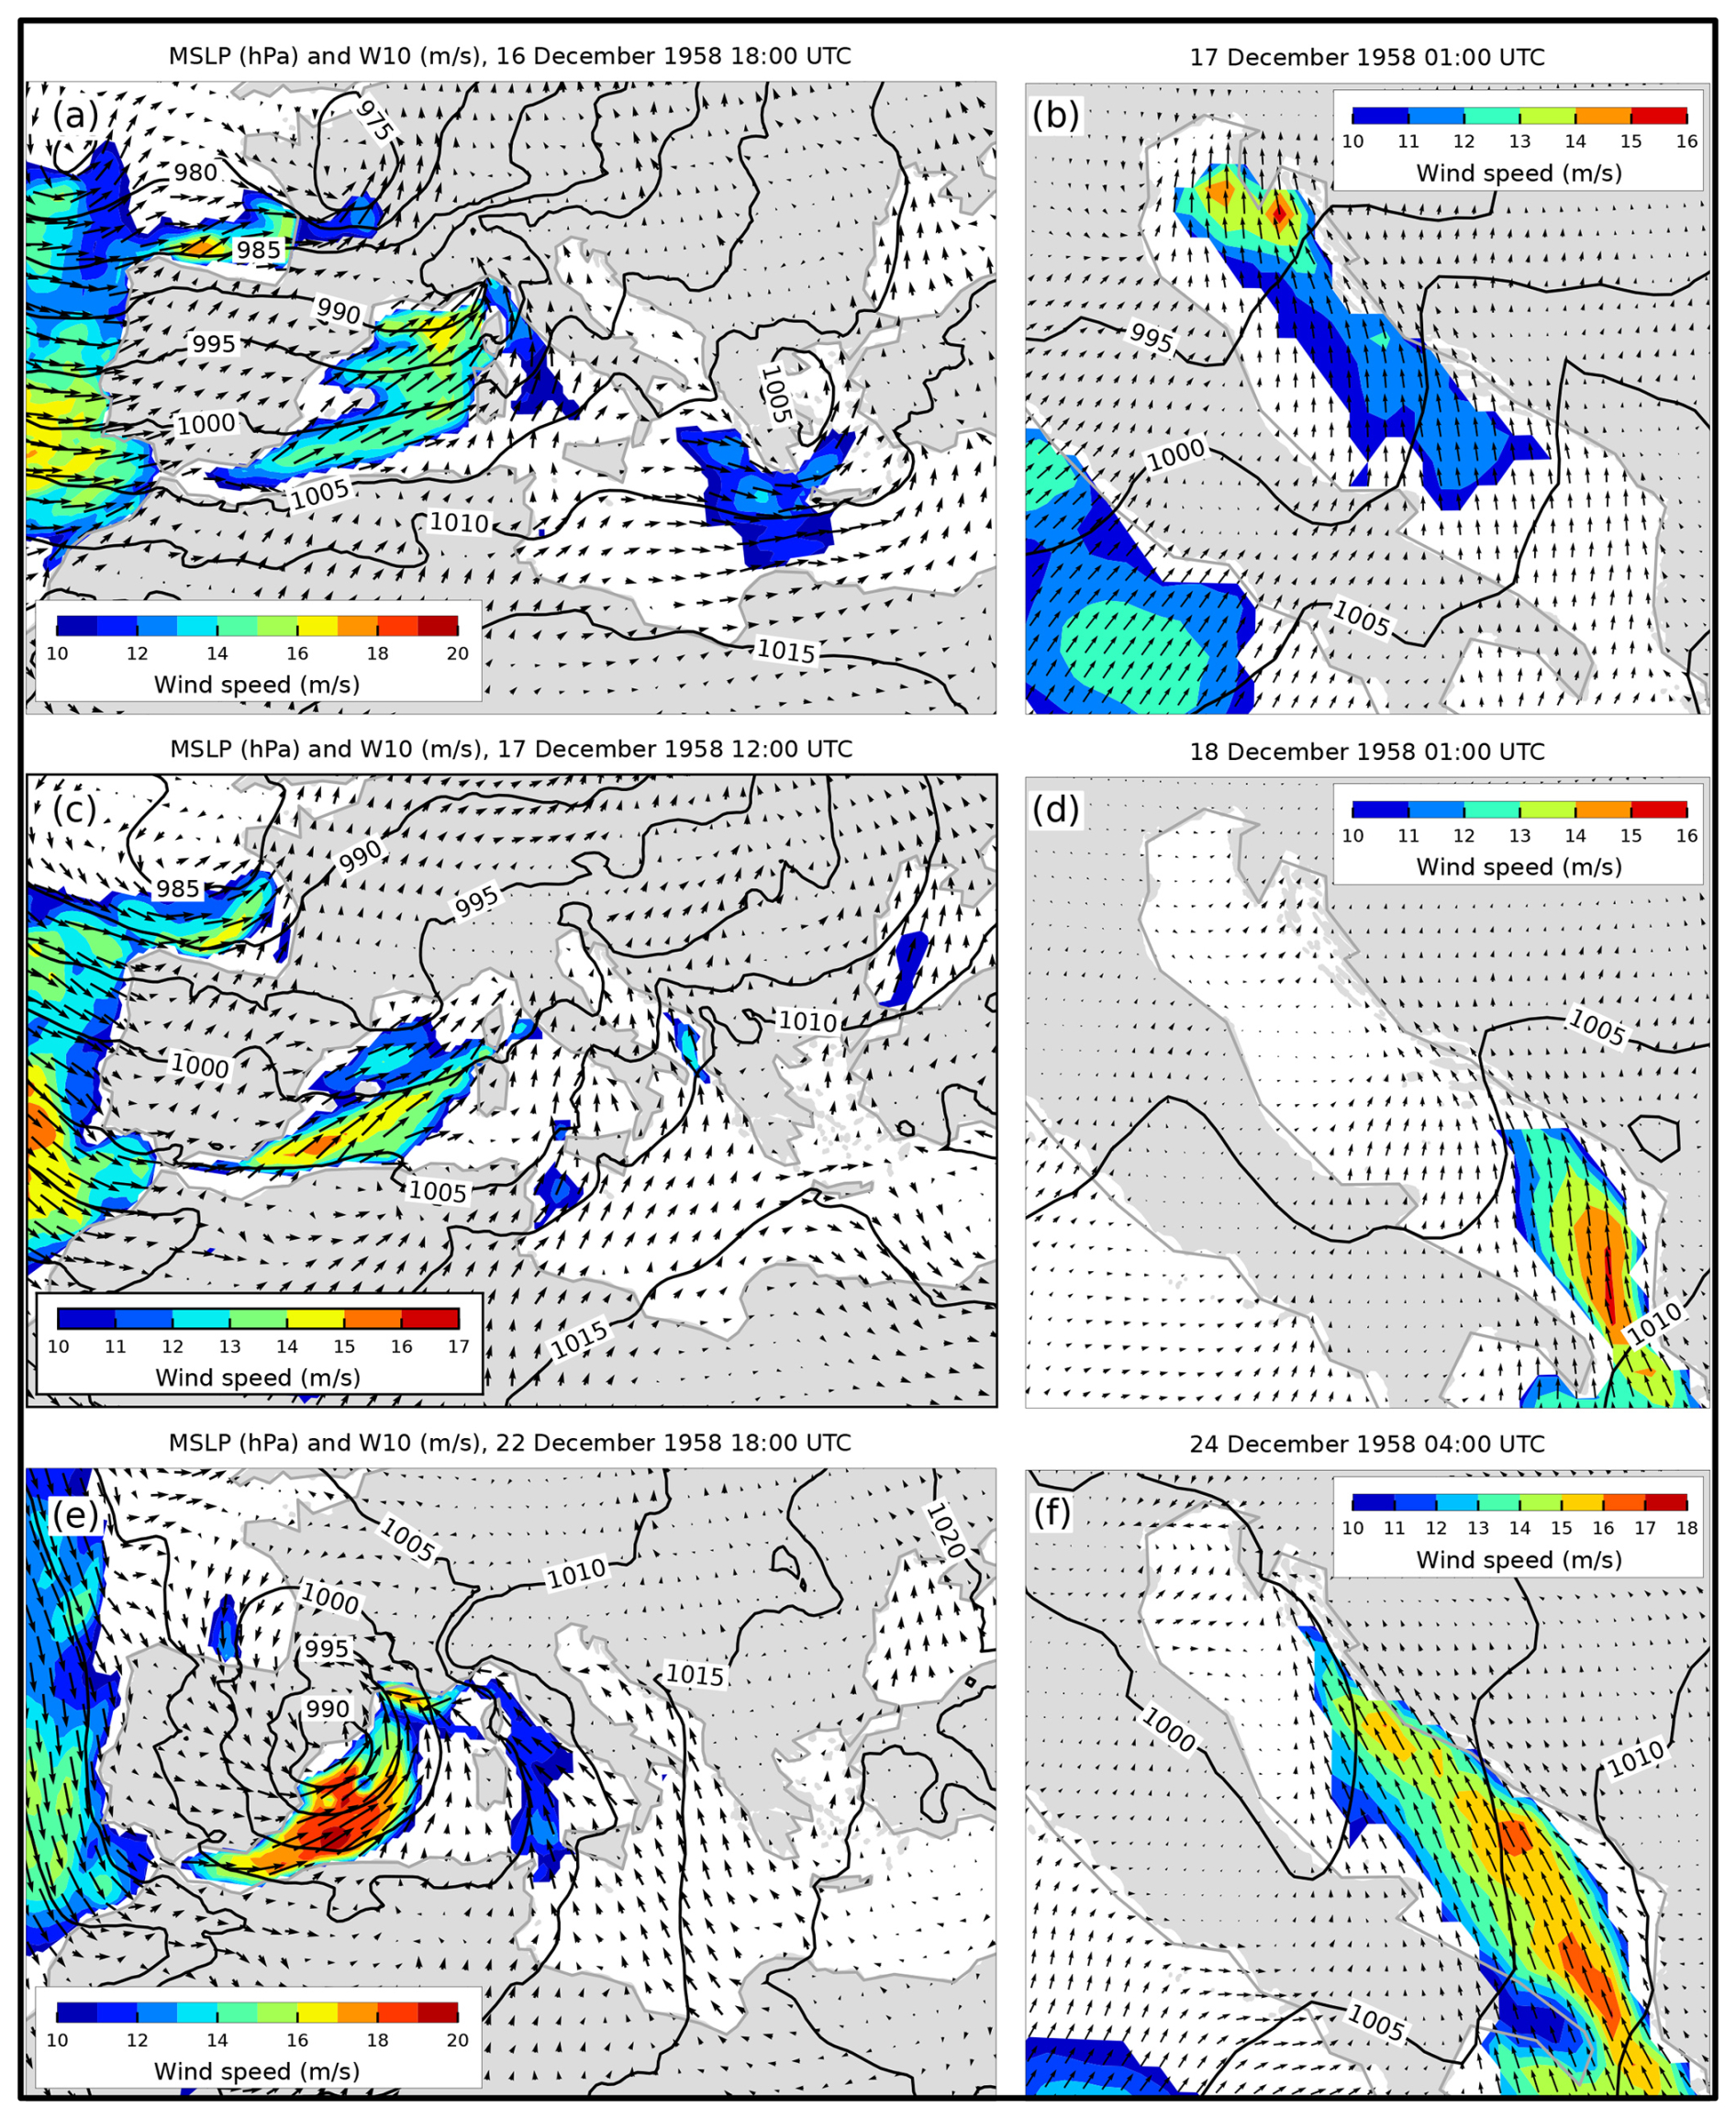
Figure 7MSLP (black lines) and W10 (arrows and colours) fields from the ERA5 reanalysis. Conditions (a, c, and e) over the Mediterranean that preceded the situations (b, d, and f) over the Adriatic Sea (an hour before the SL maxima in Bakar). Only wind speeds exceeding 10 m s−1 are coloured.
On 18 December, the upper-level ridge shifted further to the east of the Mediterranean, while a new short-wave upper-level trough was propagating over the Adriatic; concurrently, an intense cyclone deepened over the Atlantic, in the centre of which the air pressure dropped up to 960 hPa. All of this caused strong air-pressure gradients over Europe (Fig. 7c and d).
On 23 December, the influence of a large anticyclone field centred in the north, over the Barents Sea, gradually weakened over the Adriatic, as a surface-based cyclone approached from the western Mediterranean (Fig. 7e) accompanied by a closed low at the upper levels. As this system approached the Adriatic, a southeasterly wind started to blow in the evening of 23 December, gradually increasing by the end of the day (Fig. 6b). On 24 December, the centre of the cyclone had shifted over the Adriatic (Fig. 7f), where the cyclone gradually filled during 25 and 26 December. On 24 December, the wind became a strong and very strong southwesterly and then westerly; finally, on 25 December, it gradually weakened. During each of these three episodes, precipitation was higher along the northern Adriatic compared to the middle or southern Adriatic. On 17 December, 55 mm was recorded in Bakar and 32 mm in Rijeka, while the middle Adriatic recorded up to 15 mm. On 18 December, the middle Adriatic recorded almost no precipitation, while between 5 and 25 mm was measured in the northern Adriatic. On 24 December, larger amounts of precipitation were measured along the entire coastline, with 40 mm in Rovinj, 21 mm in Bakar, and 36 mm on Lastovo (an island in the southern Adriatic).
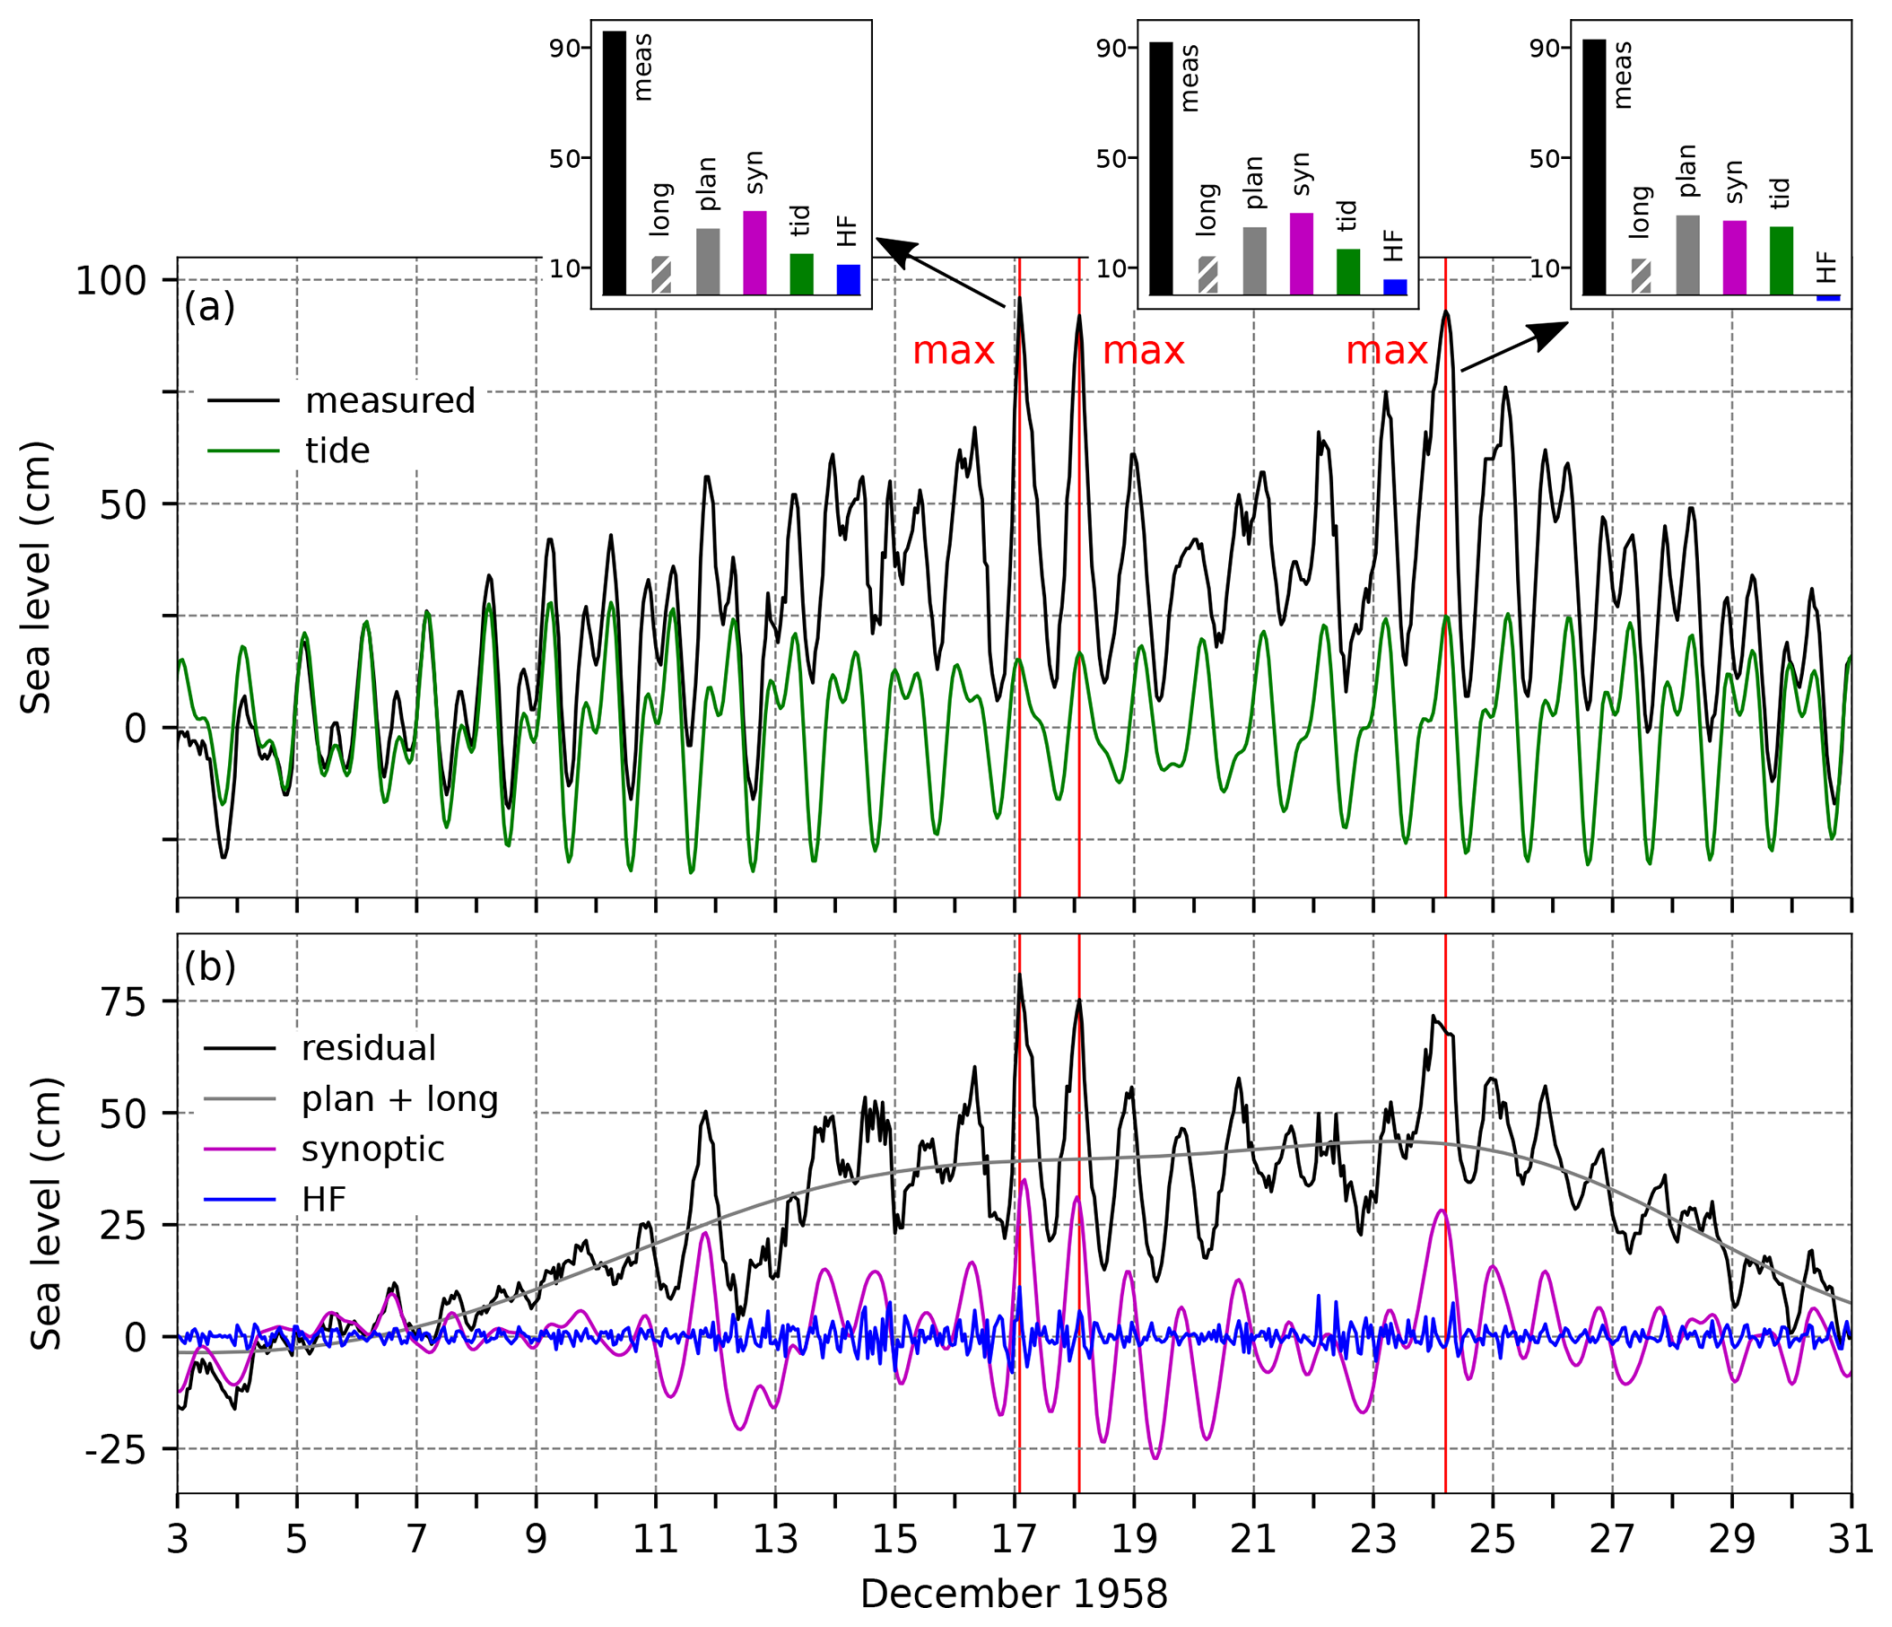
Figure 8SL series for the floods of 17, 18, and 24 December 1958. Panel (a) shows the measured sea level (black) and tide (green). The inset figures show the contributions (cm) of the five sea-level components to the maximum measured sea levels (“meas” – left: 17 December 1958 at 02:00 UTC; middle: 18 December 1958 at 02:00 UTC; right: 24 December 1958 at 05:00 UTC): “HF” refers to high-frequency oscillations (2 h < T < 9 h), “syn” to synoptic component (9 h < T < 10 d), “tid” to tide, “plan” to planetary-scale variability (10 d < T < 100 d), and “long” to long-term sea-level variability (100 d < T). Panel (b) presents the residual sea level (black), the combined series of planetary-scale variability and long-term sea-level variability (grey; plan + long), synoptic component (purple), and high-frequency oscillations (blue). The red lines indicate the times of the maximum total SL.
4.2.2 Sea-level evolution
In December 1958, three flooding episodes occurred in Bakar: on 17 December (02:00 UTC), the sea level rose to 96 cm; on 18 December (02:00 UTC), it reached 92 cm; and on 24 December (05:00 UTC), it peaked at 93 cm above the long-term mean (Table 2, Fig. 8).
The moon was in its first quarter on 17 December, causing tide to shift from a diurnal neap tide to a semidiurnal spring tide during this period. All three floods coincided with daily tidal maxima, with tide contributing 15, 17, and 25 cm on 17, 18, and 24 December, respectively.
High-frequency oscillations amplified the first episode by 11 cm, contributed 6 cm during the second, and slightly reduced the third by 2 cm.
Basin-wide oscillations were evident throughout much of the period (Fig. 8b), initially triggered on 11 December and reinforced for the last time on 16 December, just before the first flood. The first two floods were strongly influenced by pre-existing seiches, while the third was predominantly driven by a storm surge. The ∼ 21.2 h period of seiches, combined with the timing of storm-surge set-ups, positively impacted the first two floods, especially the second. The 18 December flood was mainly driven by the seiche, as atmospheric forcing that day was minimal (Figs. 6 and 7c, d). Synoptic component contributed 31, 30, and 27 cm to the floods, respectively.
Preconditioning for these events was notable, with planetary-scale variability contributing 24 cm to the first two floods and 28 cm to the third (Fig. 8b, plan + long). The sea level began to rise gradually about 10 d before the first flood, coinciding with a drop in MSLP (lp) (Fig. 6a) and a shift in the wind direction from northwest to southeast. Although MSLP (lp) began rising several days before the first peak, persistent southerly winds (10–100 d periods) with sustained speeds of 2–6 m s−1 for over 2 weeks drove a continuous sea-level rise that persisted beyond the third flood.
Long-term sea-level variability accounted for 15 cm of the maxima (Figs. 73 and A1). The episodes coincided with a particularly pronounced annual peak that year (Figs. 73d and A1), making intra-annual variability – the process that includes the mean seasonal cycle and its anomalies – the primary contributor, adding 15.3 cm. Interannual variability was weak, contributing only 0.8 cm (Fig. 73c), while mean sea-level change was negative during this period, reducing the component by 1.1 cm (Fig. 73b).
In summary, the floods resulted from the constructive interplay of all contributing processes, except for high-frequency oscillations in the third episode, which had a mitigating effect. Synoptic component was not particularly pronounced, but strong preconditioning played an important role, with all episodes coinciding with the daily tidal maxima.
4.2.3 Flood impacts
For the episodes of 17 and 18 December 1958, the available literature in the National and University Library was reviewed; however, no mentions of the event impacts were found. The reason for this remains unclear. The flood of 24 December was described in Slobodna Dalmacija (26 December 1958), where the following effects of the flood were listed, all in the middle Adriatic: (i) damaged beaches, uprooted trees, water entrance into buildings; (ii) damaged local roads resulting in traffic obstructions; (iii) damage to a power plant; and (iv) the flooding of Trogir (town near Split; Fig. 1).
4.3 The flood of 23 January 1966 (ID 5; rank 10)
This event has not yet been addressed in the scientific literature.
4.3.1 Meteorological background
From 15 to 22 January, the Adriatic was positioned between two air masses: a colder air mass from the north of the continent, associated with a surface-based anticyclone centred over Russia, and a warmer air mass over the southern and middle Adriatic, within which non-intense cyclones propagated eastward one after another (Fig. 9). On 22 January, a cyclone originating from the Bay of Biscay moved onto the European mainland, causing the aforementioned anticyclone to retreat northward. Simultaneously, a secondary cyclone developed in the Gulf of Genoa (Fig. 10a) that led to southeasterly wind over the Adriatic (Figs. 9b and 10a). On 23 January, the newly formed cyclone from the Gulf of Genoa advanced to the northern Adriatic from where it propagated southeast along the Adriatic, leading to the MSLP dropping to less than 995 hPa (Fig. 10b), followed by the strengthening influence of an anticyclonic ridge from the west. As a result, the southeasterly wind over the Adriatic had a strong and gale intensity during the night and morning of 23 January (Figs. 9b and 10b), gradually shifting to a westerly wind and, by the afternoon, to a northwesterly wind. On 23 January, the induced precipitation was more intense in the northern Adriatic, with 56 mm recorded in Rovinj and 51 mm in Rijeka, while amounts ranged from 10 to 30 mm in the middle Adriatic.
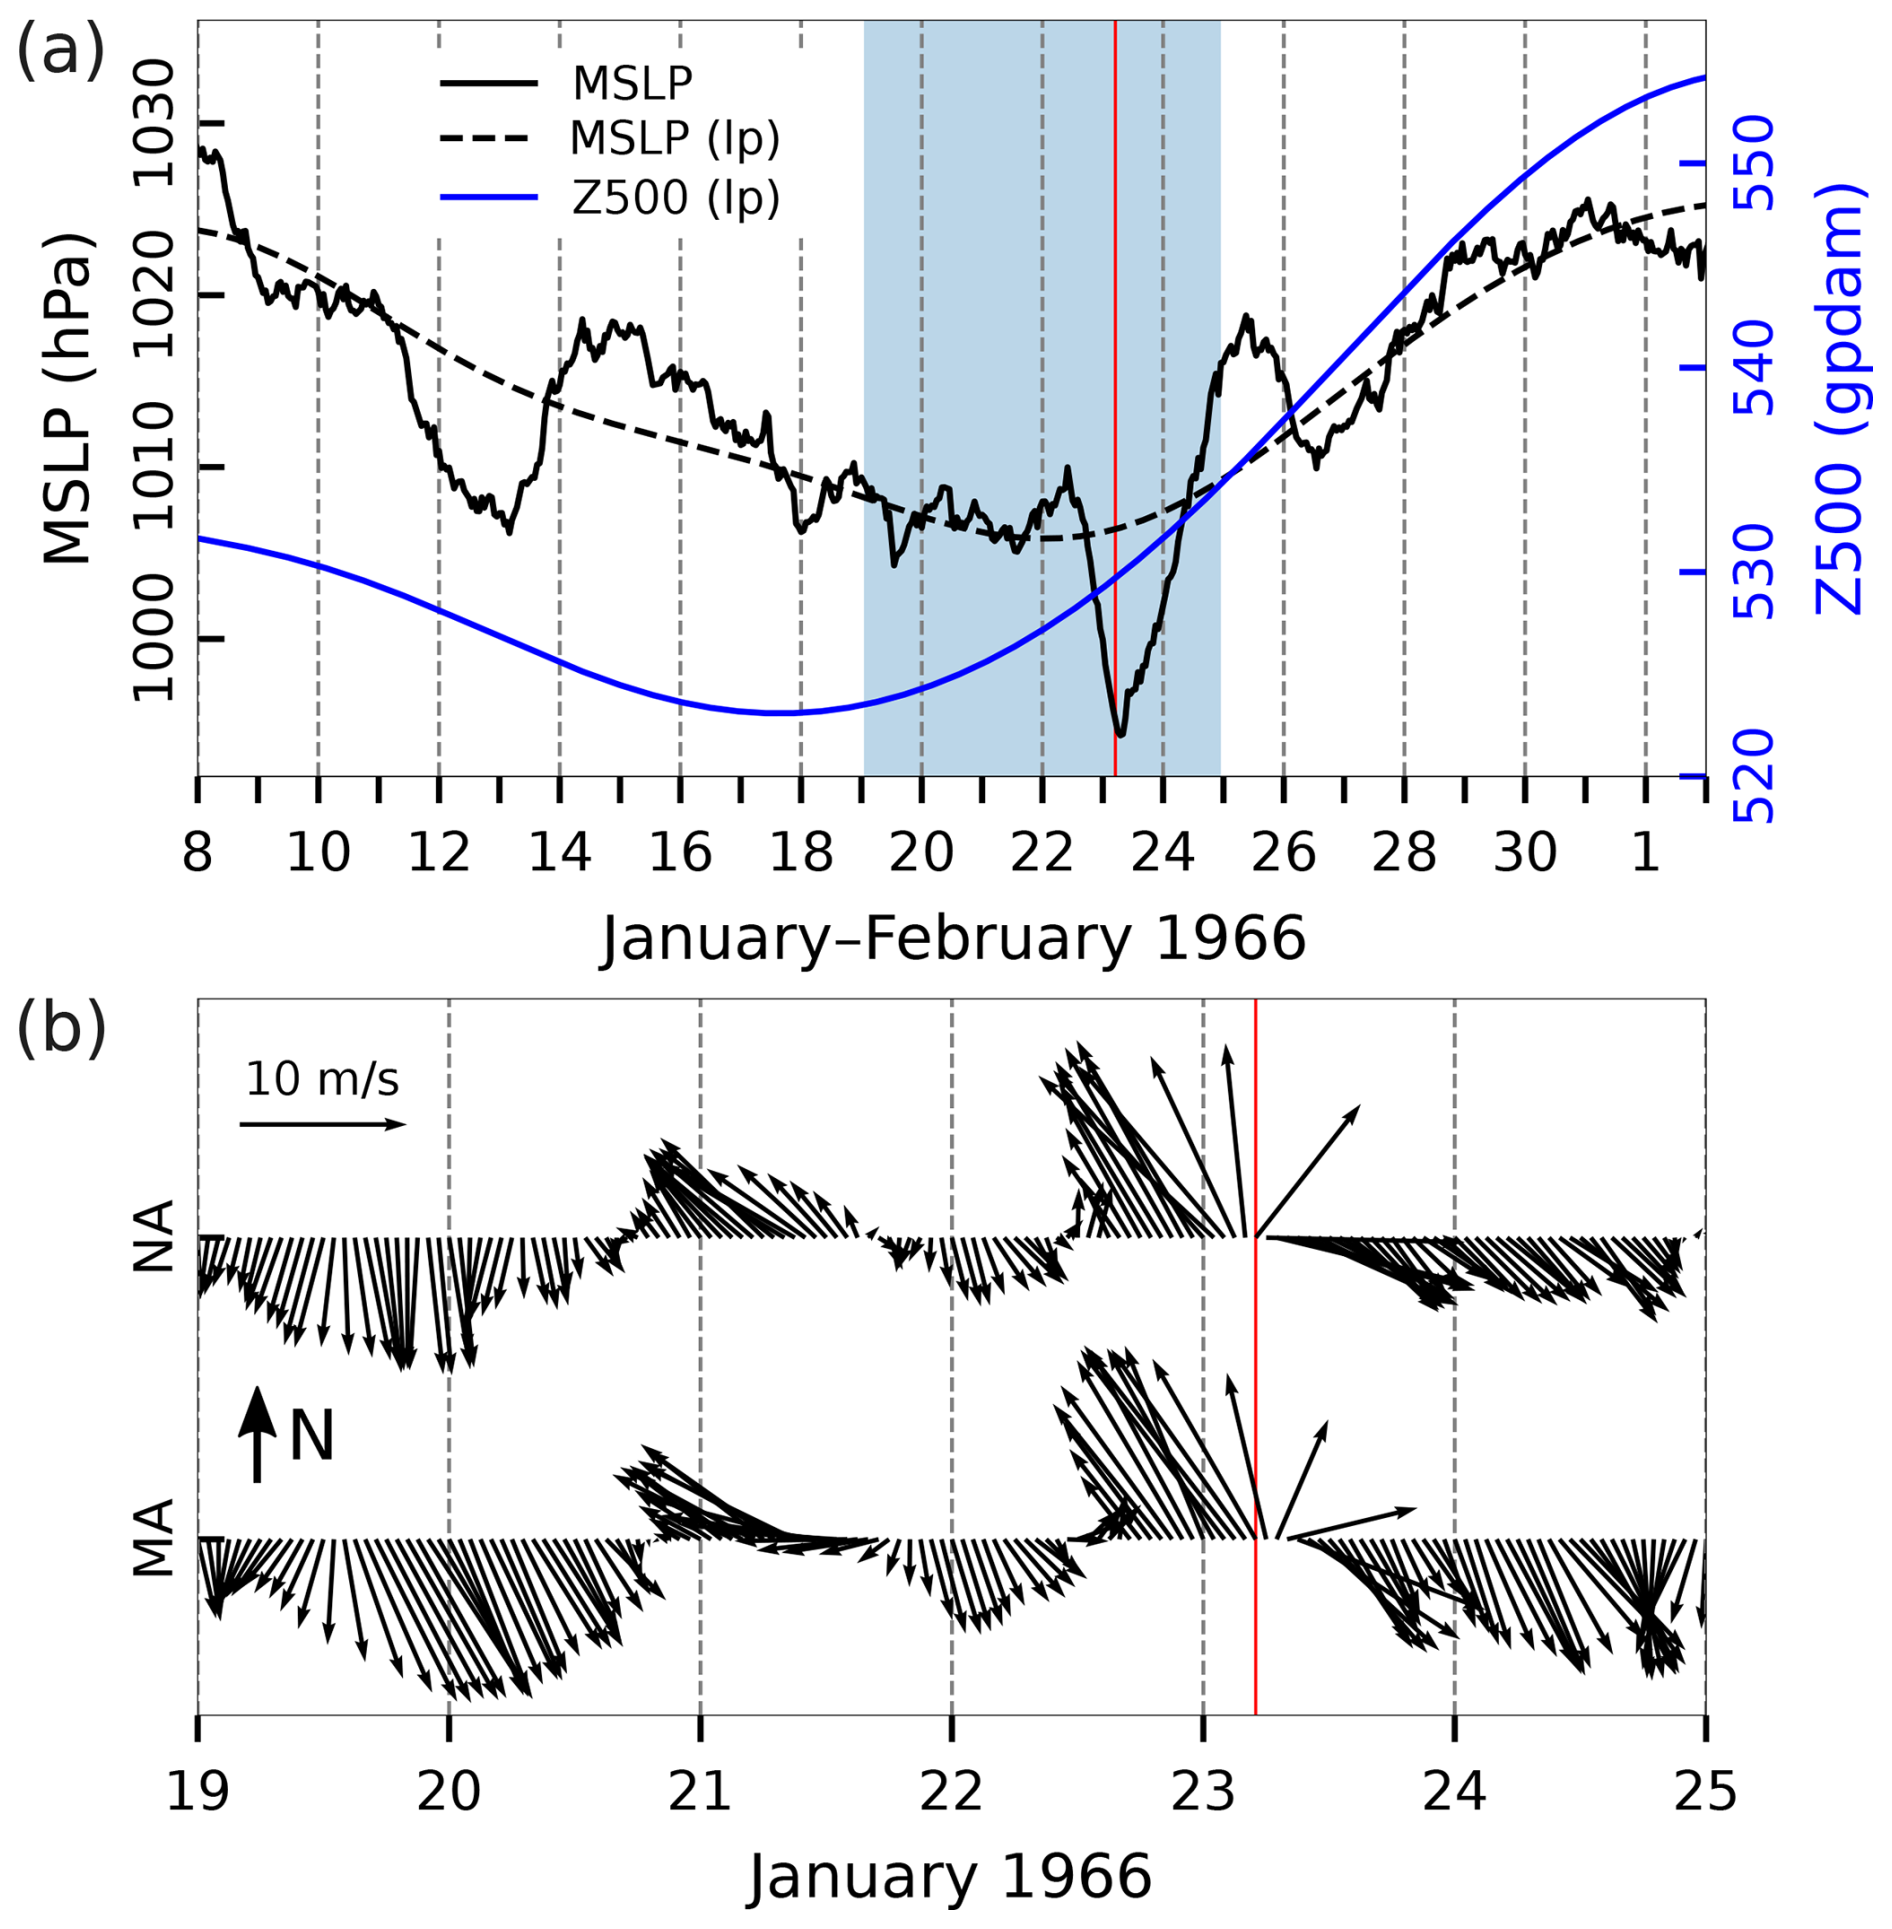
Figure 9Series of ERA5 reanalysis data related to the flood of 23 January 1966. (a) MSLP (hourly) and MSLP (lp) (low-pass filtered with a cut-off frequency of 10 d) and Z500 (lp) (low-pass filtered with a cut-off frequency of 10 d) at a grid point near TG Bakar. (b) Hourly W10 during the period marked in blue in the upper plot for the middle Adriatic (MA) and northern Adriatic (NA) (all locations marked in Fig. 1). The red line indicates the onset of the SL maximum.
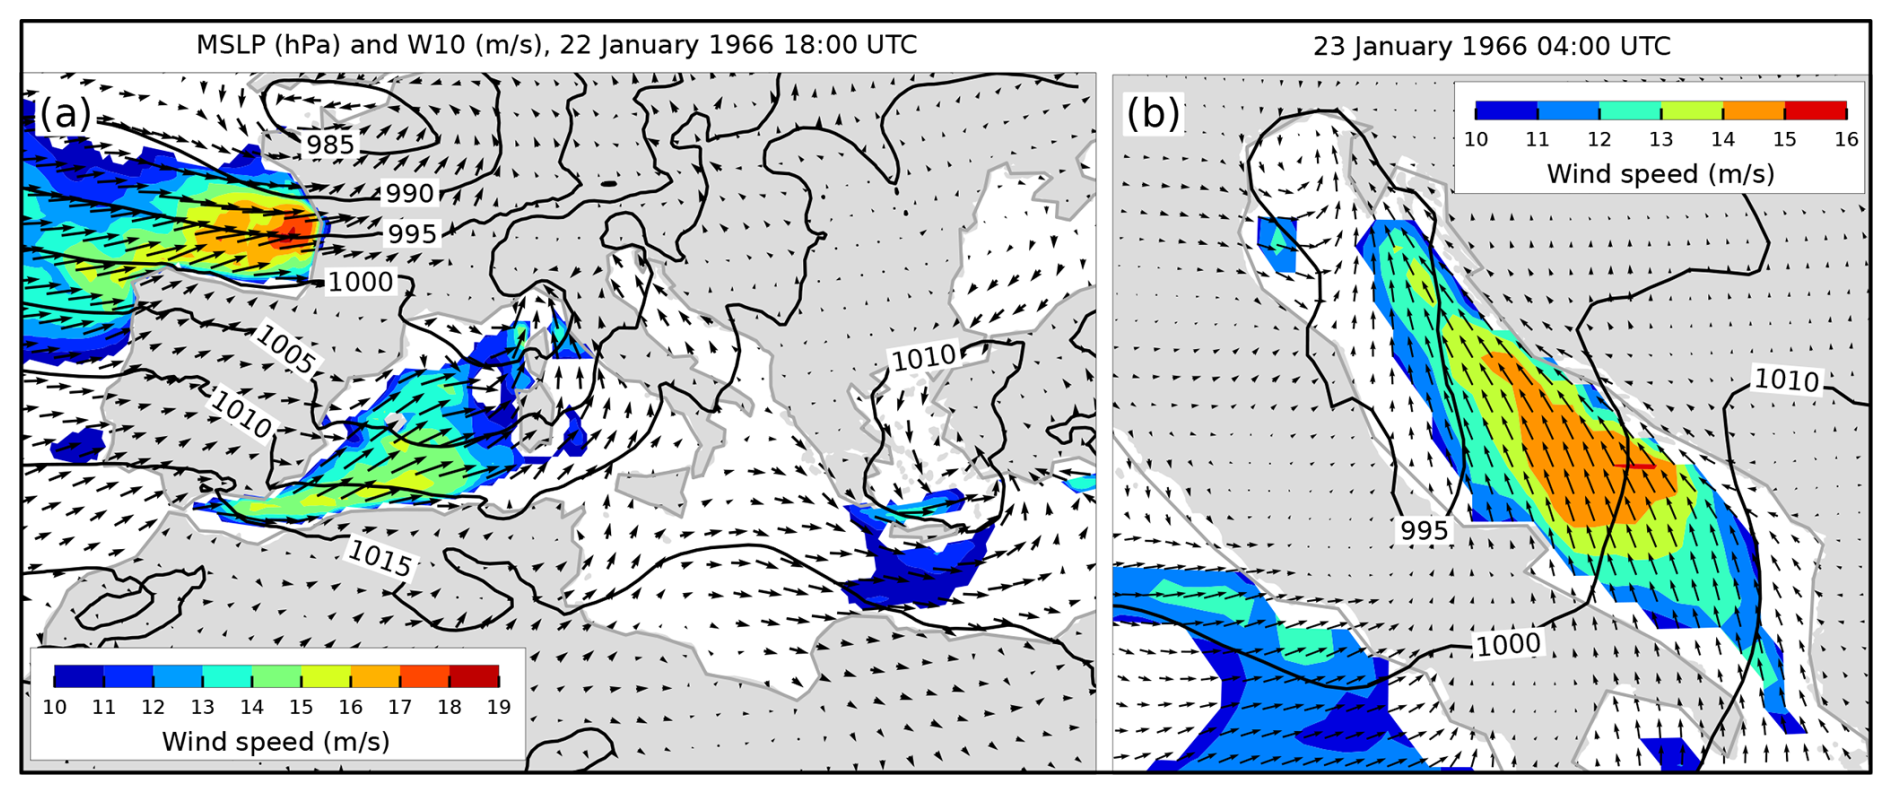
Figure 10MSLP (black lines) and W10 (arrows and colours) fields from the ERA5 reanalysis. Conditions (a) over the Mediterranean that preceded the situation (b) over the Adriatic Sea (an hour before maximum SL in Bakar). Only wind speeds exceeding 10 m s−1 are coloured.
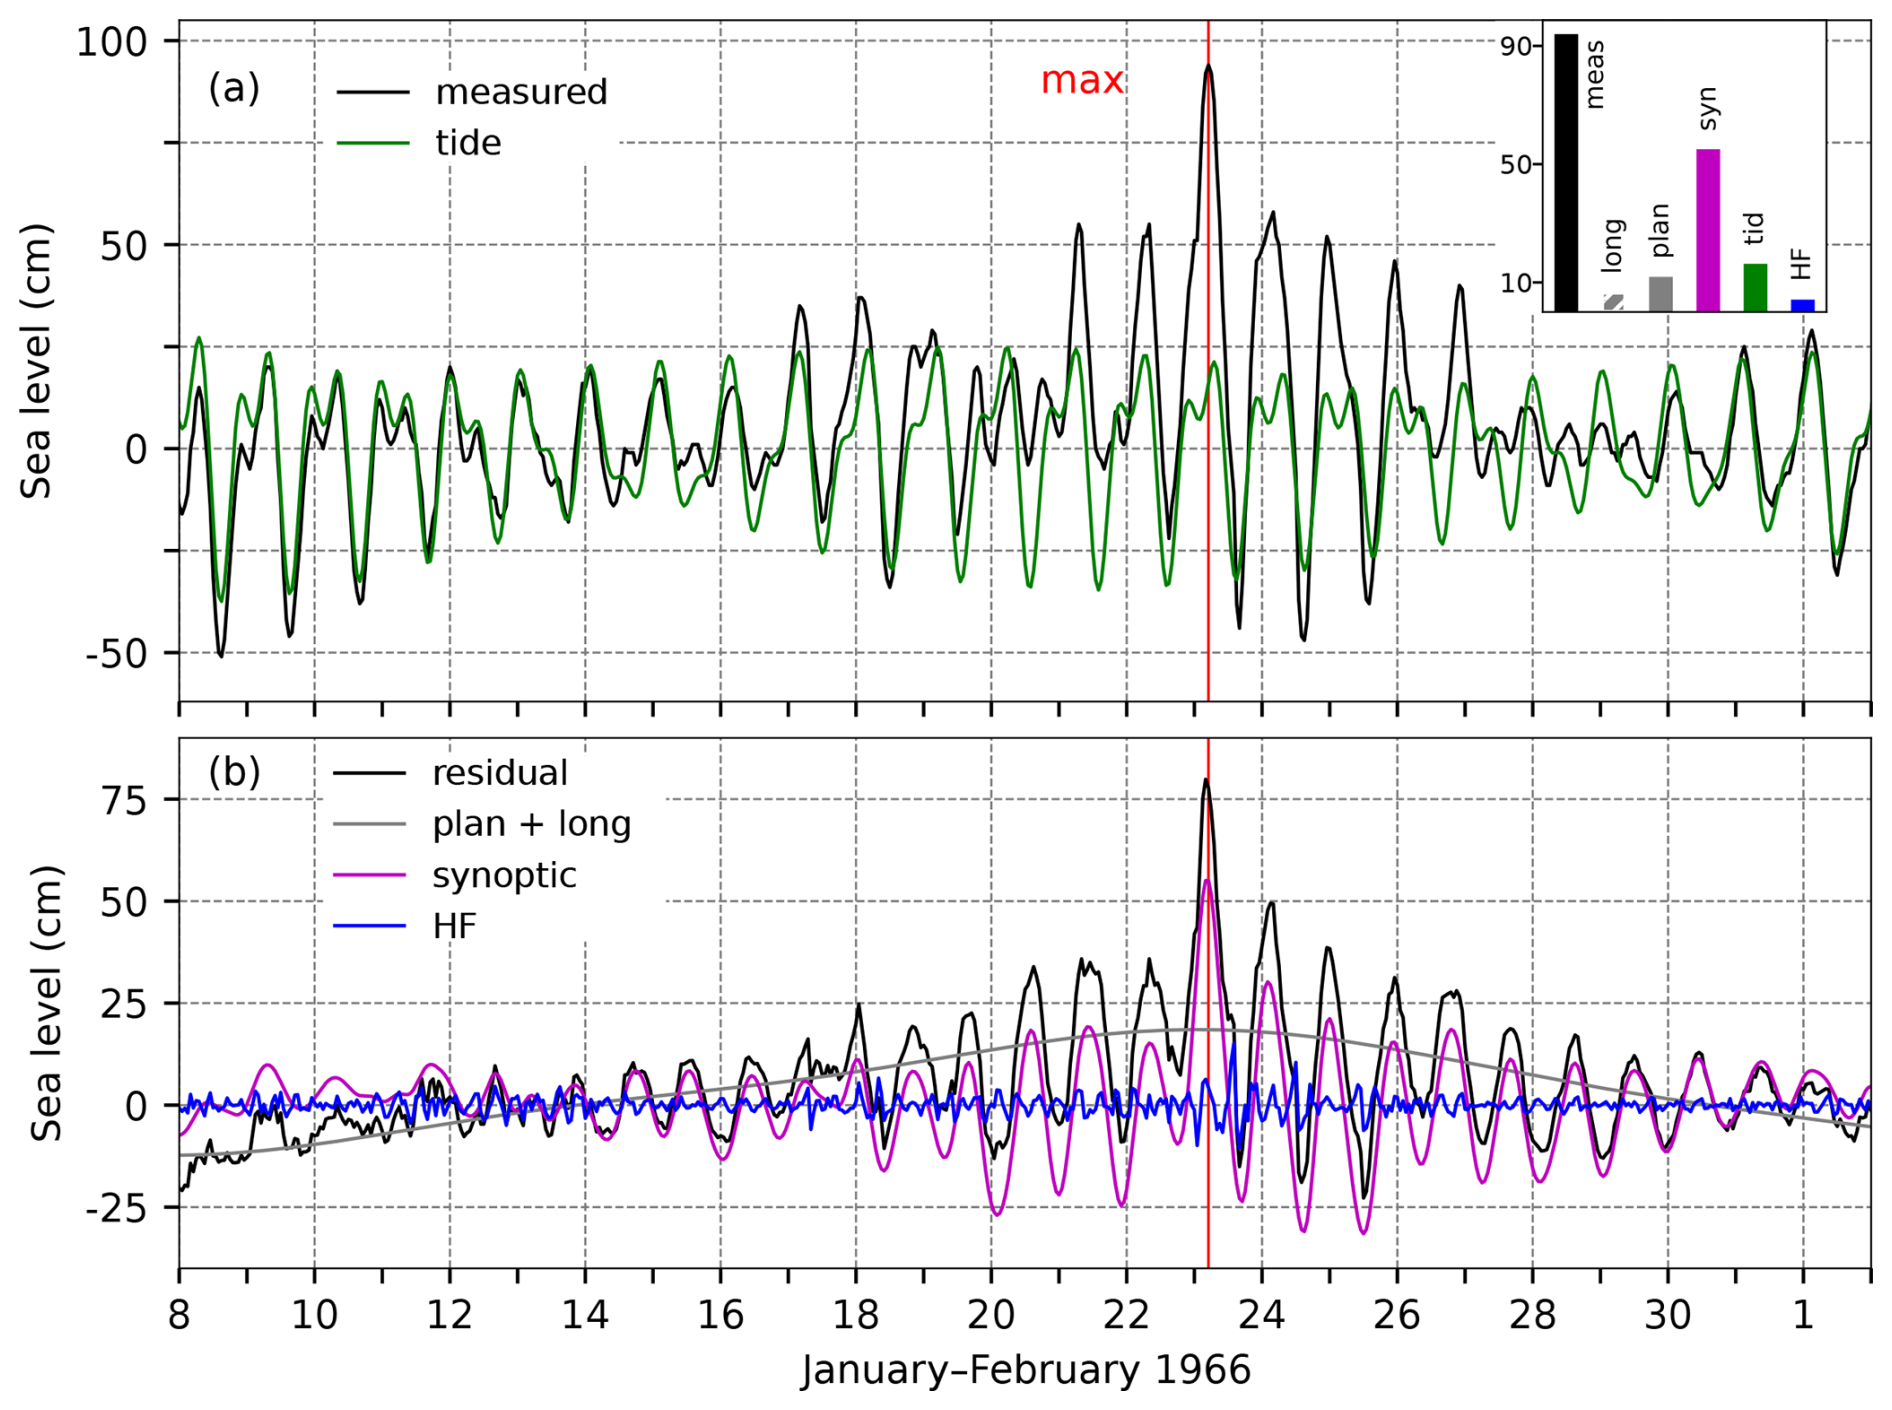
Figure 11SL series for the flood of 23 January 1966. Panel (a) shows the measured sea level (black) and tide (green). The inset figure shows the contributions (cm) of the five sea-level components to the maximum measured sea level (“meas”; 05:00 UTC): “HF” refers to high-frequency oscillations (2 h < T < 9 h), “syn” to synoptic component (9 h < T < 10 d), “tid” to tide, “plan” to planetary-scale variability (10 d < T < 100 d), and “long” to long-term sea-level variability (100 d < T). Panel (b) presents the residual sea level (black), the combined series of planetary-scale variability and long-term sea-level variability (grey; plan + long), synoptic component (purple), and high-frequency oscillations (blue). The red line indicates the time of occurrence of the total SL maximum.
4.3.2 Sea-level evolution
On 23 January 1966, at 05:00 UTC, the sea level in Bakar rose to 94 cm above the long-term average (Table 2, Fig. 11).
The moon, 2 d past the new moon, created a semidiurnal spring tide. The overall maximum occurred 2 h before the daily tidal peak, with tide contributing 16 cm.
High-frequency oscillations were weak during the storm, adding only 4 cm to the total SL.
Synoptic component was influenced by pre-existing seiches that were gradually induced and reinforced, likely driven by atmospheric forcings visible in the meteorological data (Fig. 9), including subtle air-pressure variations and rapidly shifting winds with a ∼ 24 h period. The main event occurred as a cyclone approached the Adriatic, bringing southeasterly winds that pushed water into the basin's closed end. Synoptic component, combining a positive phase of pre-existing seiches and a newly induced storm surge, contributed 55 cm to the flood.
Flood preconditioning was modest (Fig. 11b, plan + long), with planetary-scale component adding 12 cm to the maximum. This rise was primarily due to a drop in the MSLP (lp) (Fig. 9a), while winds (10 d < T < 100 d) were mainly from the northeast.
Long-term sea-level variability contributed 7 cm to the maximum (Figs. 73 and A1). The episode occurred after an annual peak that was not particularly pronounced that year, which is why intra-annual variability – including the mean seasonal cycle and its anomalies – contributed only 3.9 cm (Figs. 73d and A1). Interannual variability accounted for 2.1 cm (Fig. 73c), while mean sea-level change added 1 cm (Fig. 73b).
In summary, the flood resulted from an exceptional synoptic component superimposed on a background sea level elevated by other involved processes.
4.3.3 Flood impacts
According to reports from daily newspapers (Novi list and Večernji list, 24 January 1966; Novi list, 1966a; Večernji list, 1966c), the flood had the most severe impact on Rovinj, a town on the west coast of the Istrian Peninsula. The flooding, caused by a strong sirocco and rough sea, resulted in extensive damage. A massive stone wall, over 200 m long, was completely swept away. A section of railroad track between the northern outskirts of Rovinj and the train station was buried under sand and gravel. In the northern port, everything that had been repaired and modernised since the last devastation by the sea was completely destroyed. Other damages and emergency responses included destroyed beaches and flooded basements of residential buildings and ground-level stores.
4.4 The flood of 4 November 1966 (ID 6; rank 10)
The flood has been extensively studied in numerous papers and is considered a “century” flood due to the severe damage it caused throughout the wider Venice region. During this episode, SL at the TG Venice Punta Salute reached its highest recorded level in the station's operational history, which dates back to 1872 (Corsini and Ferla, 2009). Research has explored various aspects of the flood, including oceanographic analyses and meteorological studies (Finizio et al., 1972; Accerboni and Manca, 1973; Stravisi and Marussi, 1973; Mosetti, 1985; Canestrelli et al., 2001; Malguzzi et al., 2006; Cavaleri et al., 2010; Bertotti et al., 2011; Lionello et al., 2021). Trincardi et al. (2016) reviewed the 1966 flood with modern scientific insights, emphasising factors contributing to flooding, current monitoring and forecasting systems, and engineering measures implemented since then to protect Venice. Međugorac et al. (2015) compared it with the 2008 flood to show differences in atmospheric forcings and SL responses along the western and eastern coastlines. Roland et al. (2009) and De Zolt et al. (2006) used a model incorporating wave–current interactions, resulting in SL predictions that closely matched observations in the northern Adriatic and in Venice.
4.4.1 Meteorological background
On 3 November, air pressure over the Adriatic began to decrease (Fig. 12) as the influence of an anticyclonic field from northeastern Europe weakened due to an approaching surface-based cyclone from the western Mediterranean (Fig. 13a), associated with an upper-level trough containing a closed low slightly shifted to the west. On 4 November, the cyclone impacted the Adriatic region as its centre moved over the northern Adriatic, causing a pressure drop to less than 995 hPa, before continuing northeast (Fig. 13b). Meanwhile, the anticyclone remained present further east, resulting in a pronounced air-pressure gradient over the Adriatic. Consequently, conditions for a southeasterly wind were established on 3 November. By the morning of 4 November, the southeasterly wind became strong and gale intensity, shifting to a southwesterly wind in the afternoon as the cyclone advanced northeast (Fig. 12b). Precipitation recorded along the coastline on 4 November was mostly up to 10 mm, with higher amounts at some locations. On 5 November, precipitation in the northern Adriatic was generally up to 30 mm, while the middle Adriatic experienced heavier amounts, with 45 mm recorded in Split and 73 mm in Starigrad near Zadar.
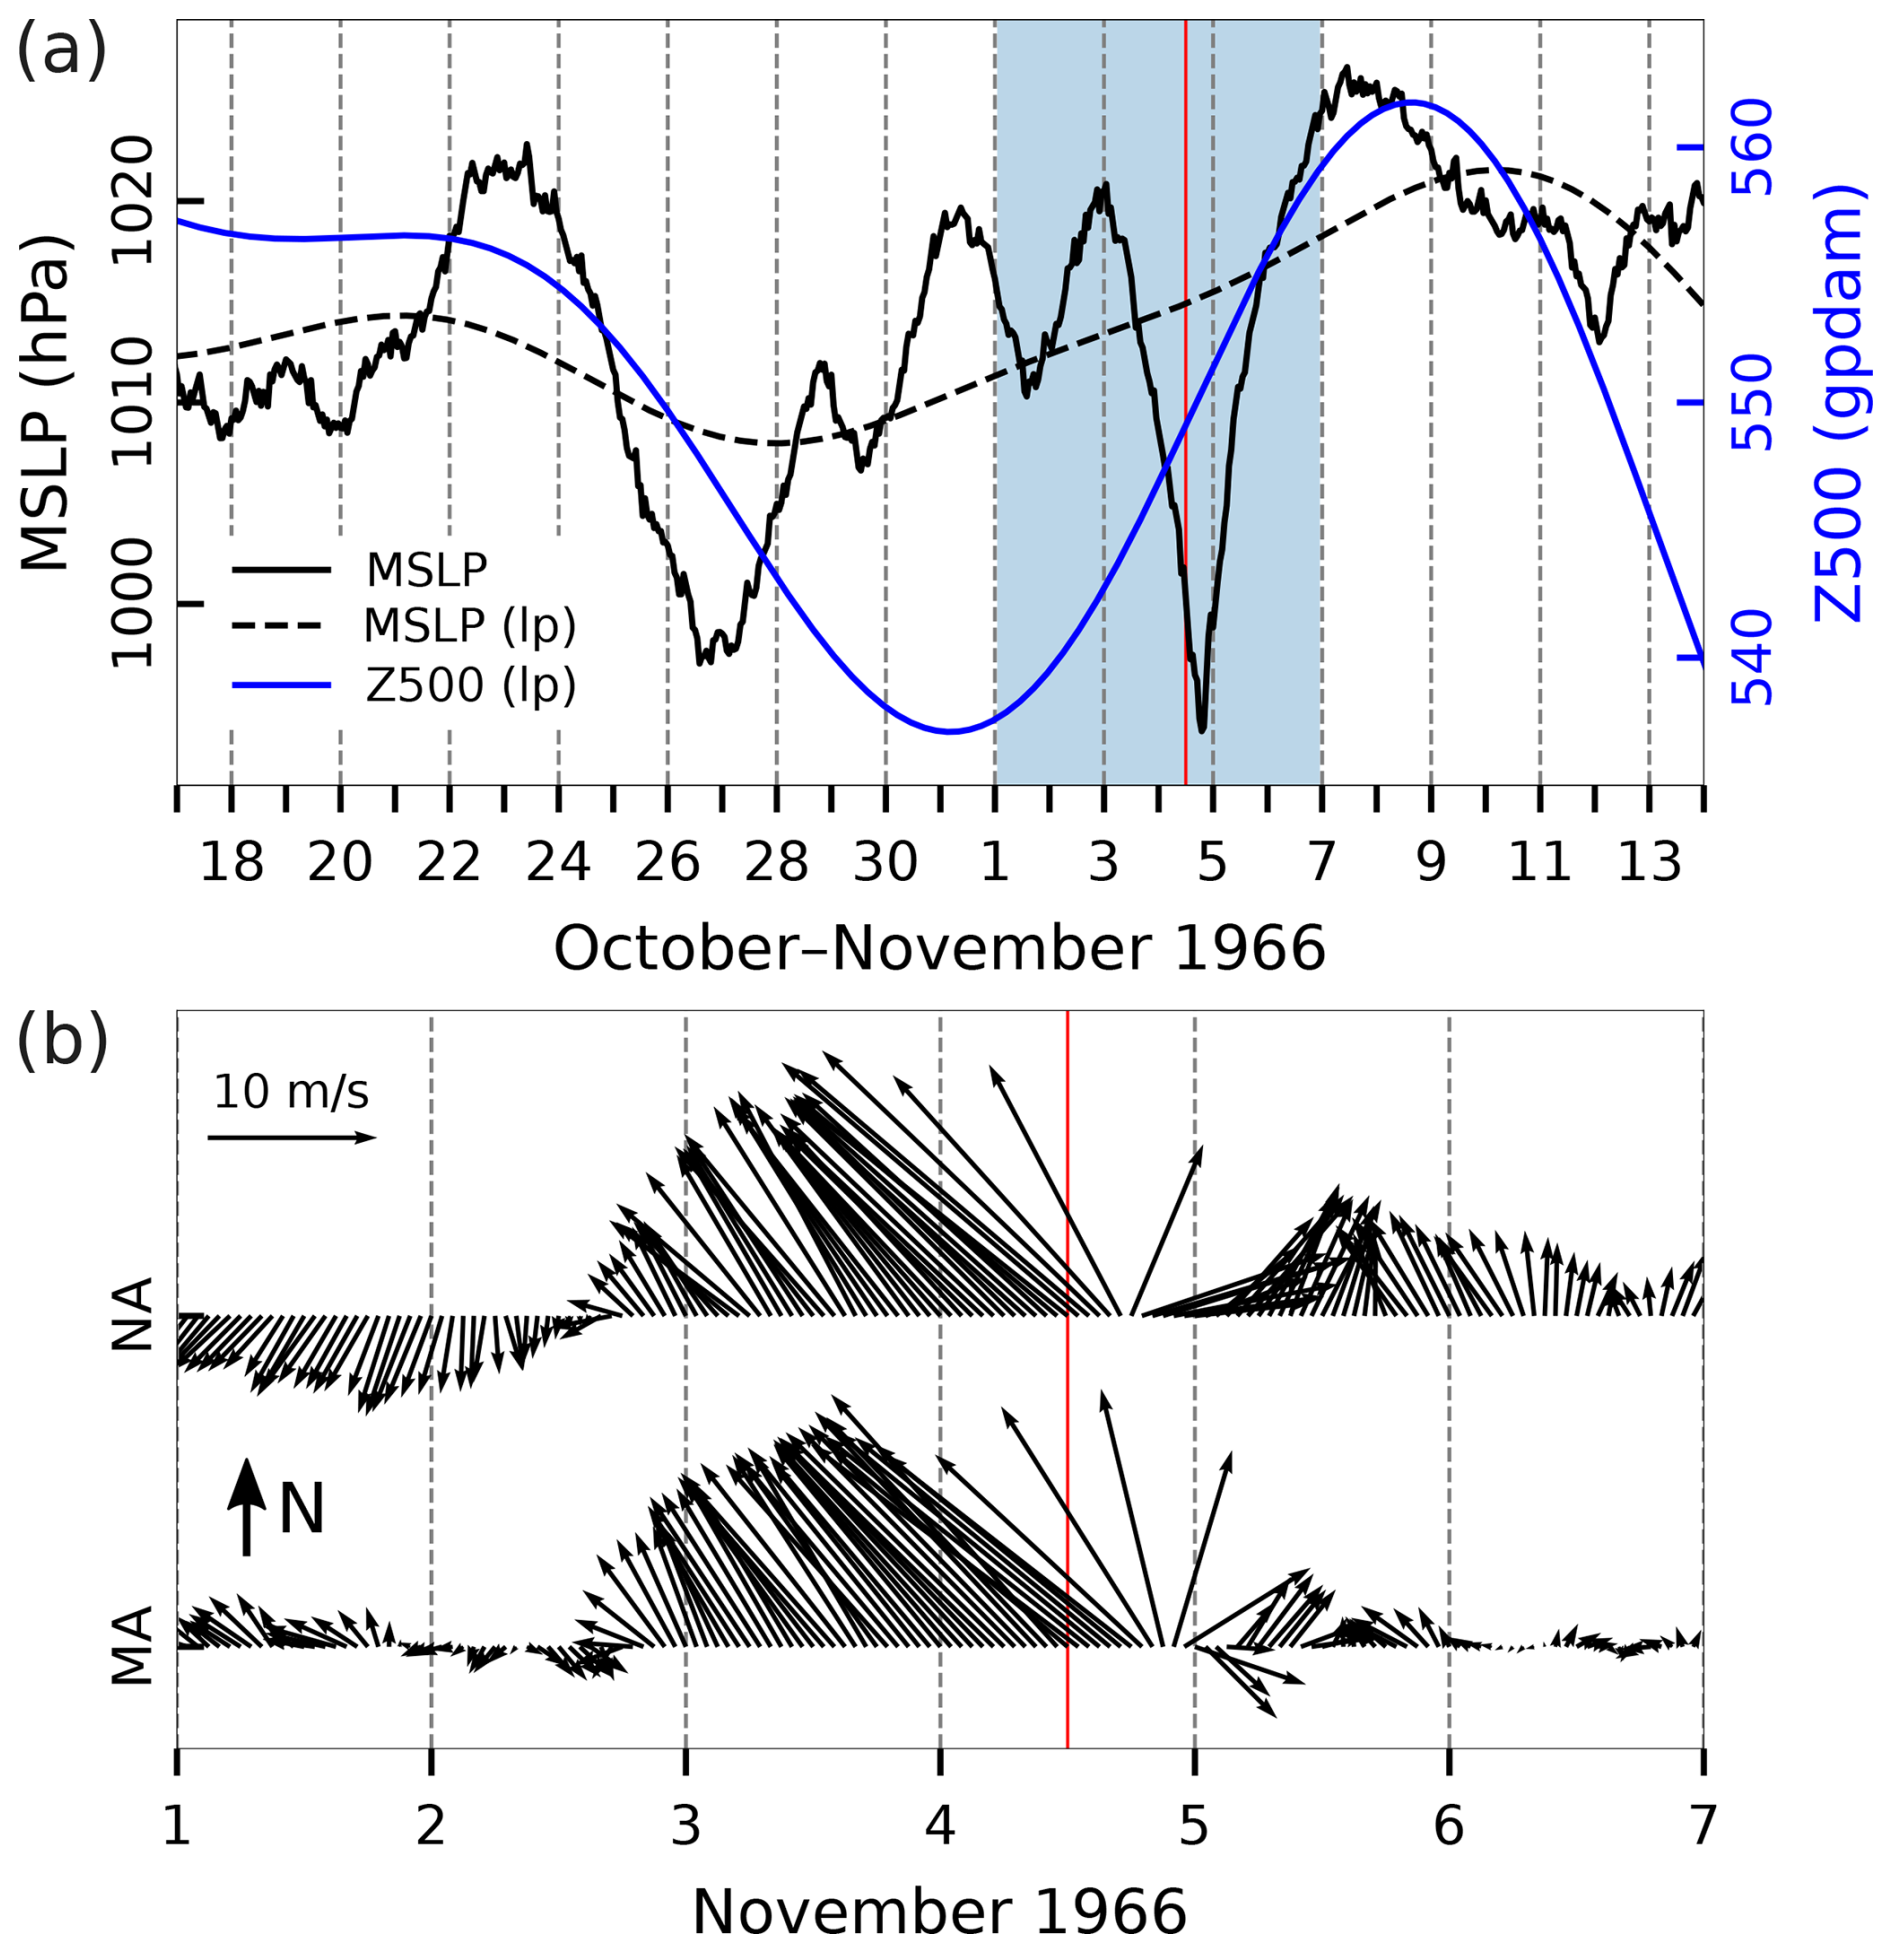
Figure 12Series of ERA5 reanalysis data related to the flood of 4 November 1966. (a) MSLP (hourly) and MSLP (lp) (low-pass filtered with a cut-off frequency of 10 d) and Z500 (lp) (low-pass filtered with a cut-off frequency of 10 d) at a grid point near TG Bakar. (b) Hourly W10 during the period marked in blue in the upper plot for the middle Adriatic (MA) and northern Adriatic (NA) (all locations marked in Fig. 1). The red line indicates the onset of the SL maximum.
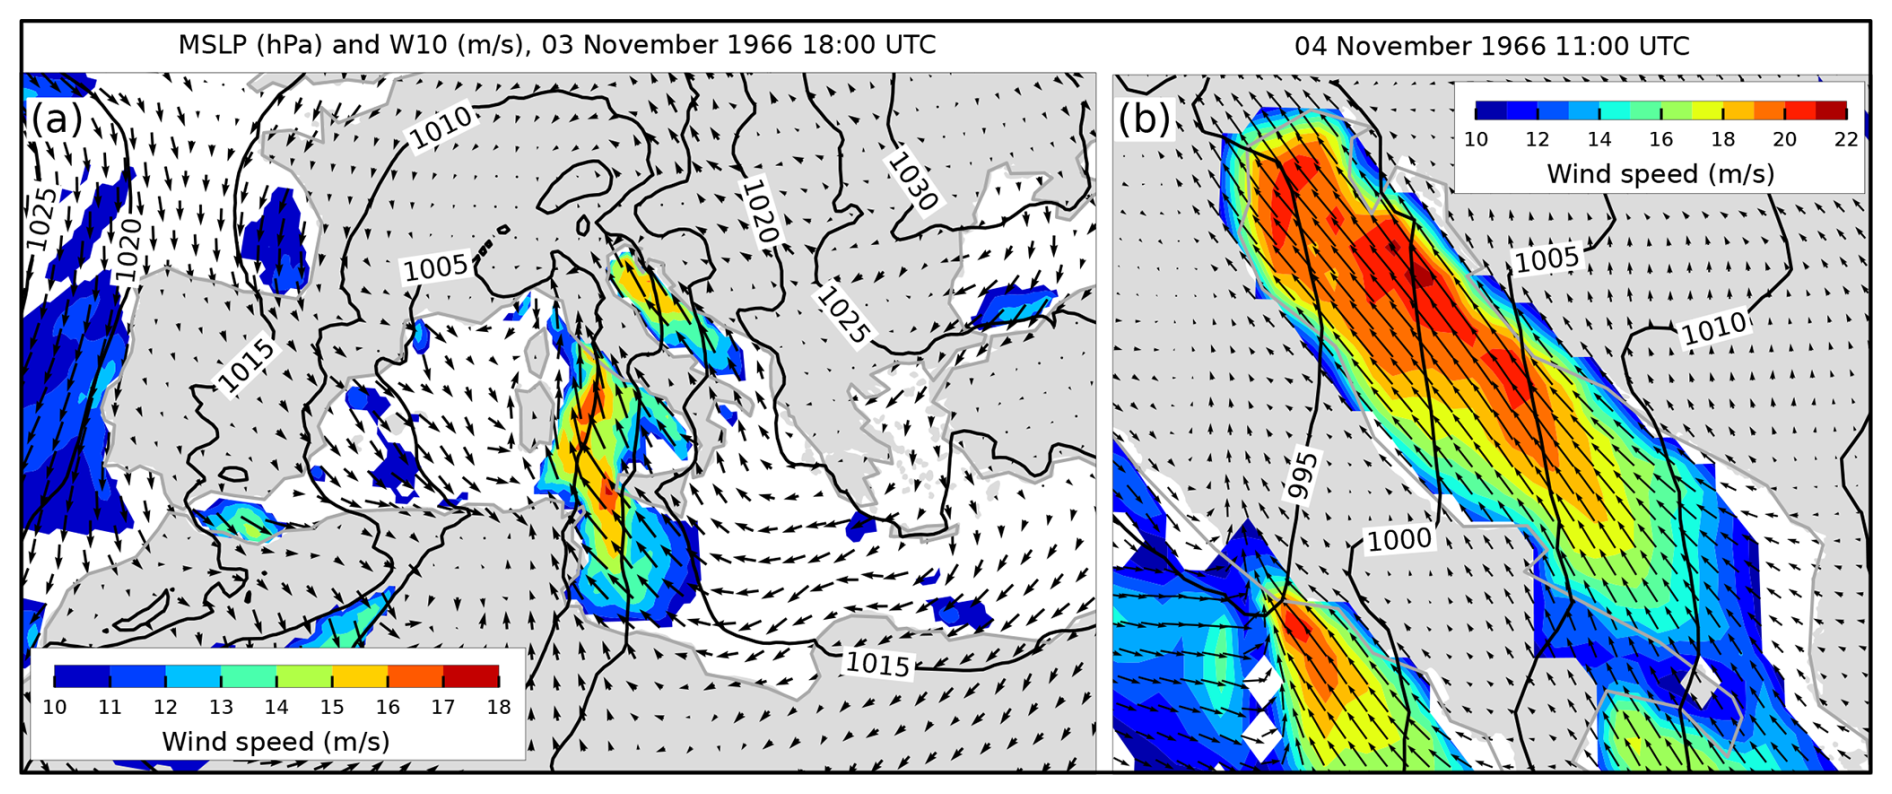
Figure 13MSLP (black lines) and W10 (arrows and colours) fields from the ERA5 reanalysis. Conditions (a) over the Mediterranean that preceded the situation (b) over the Adriatic Sea (an hour before maximum SL in Bakar). Only wind speeds exceeding 10 m s−1 are coloured.
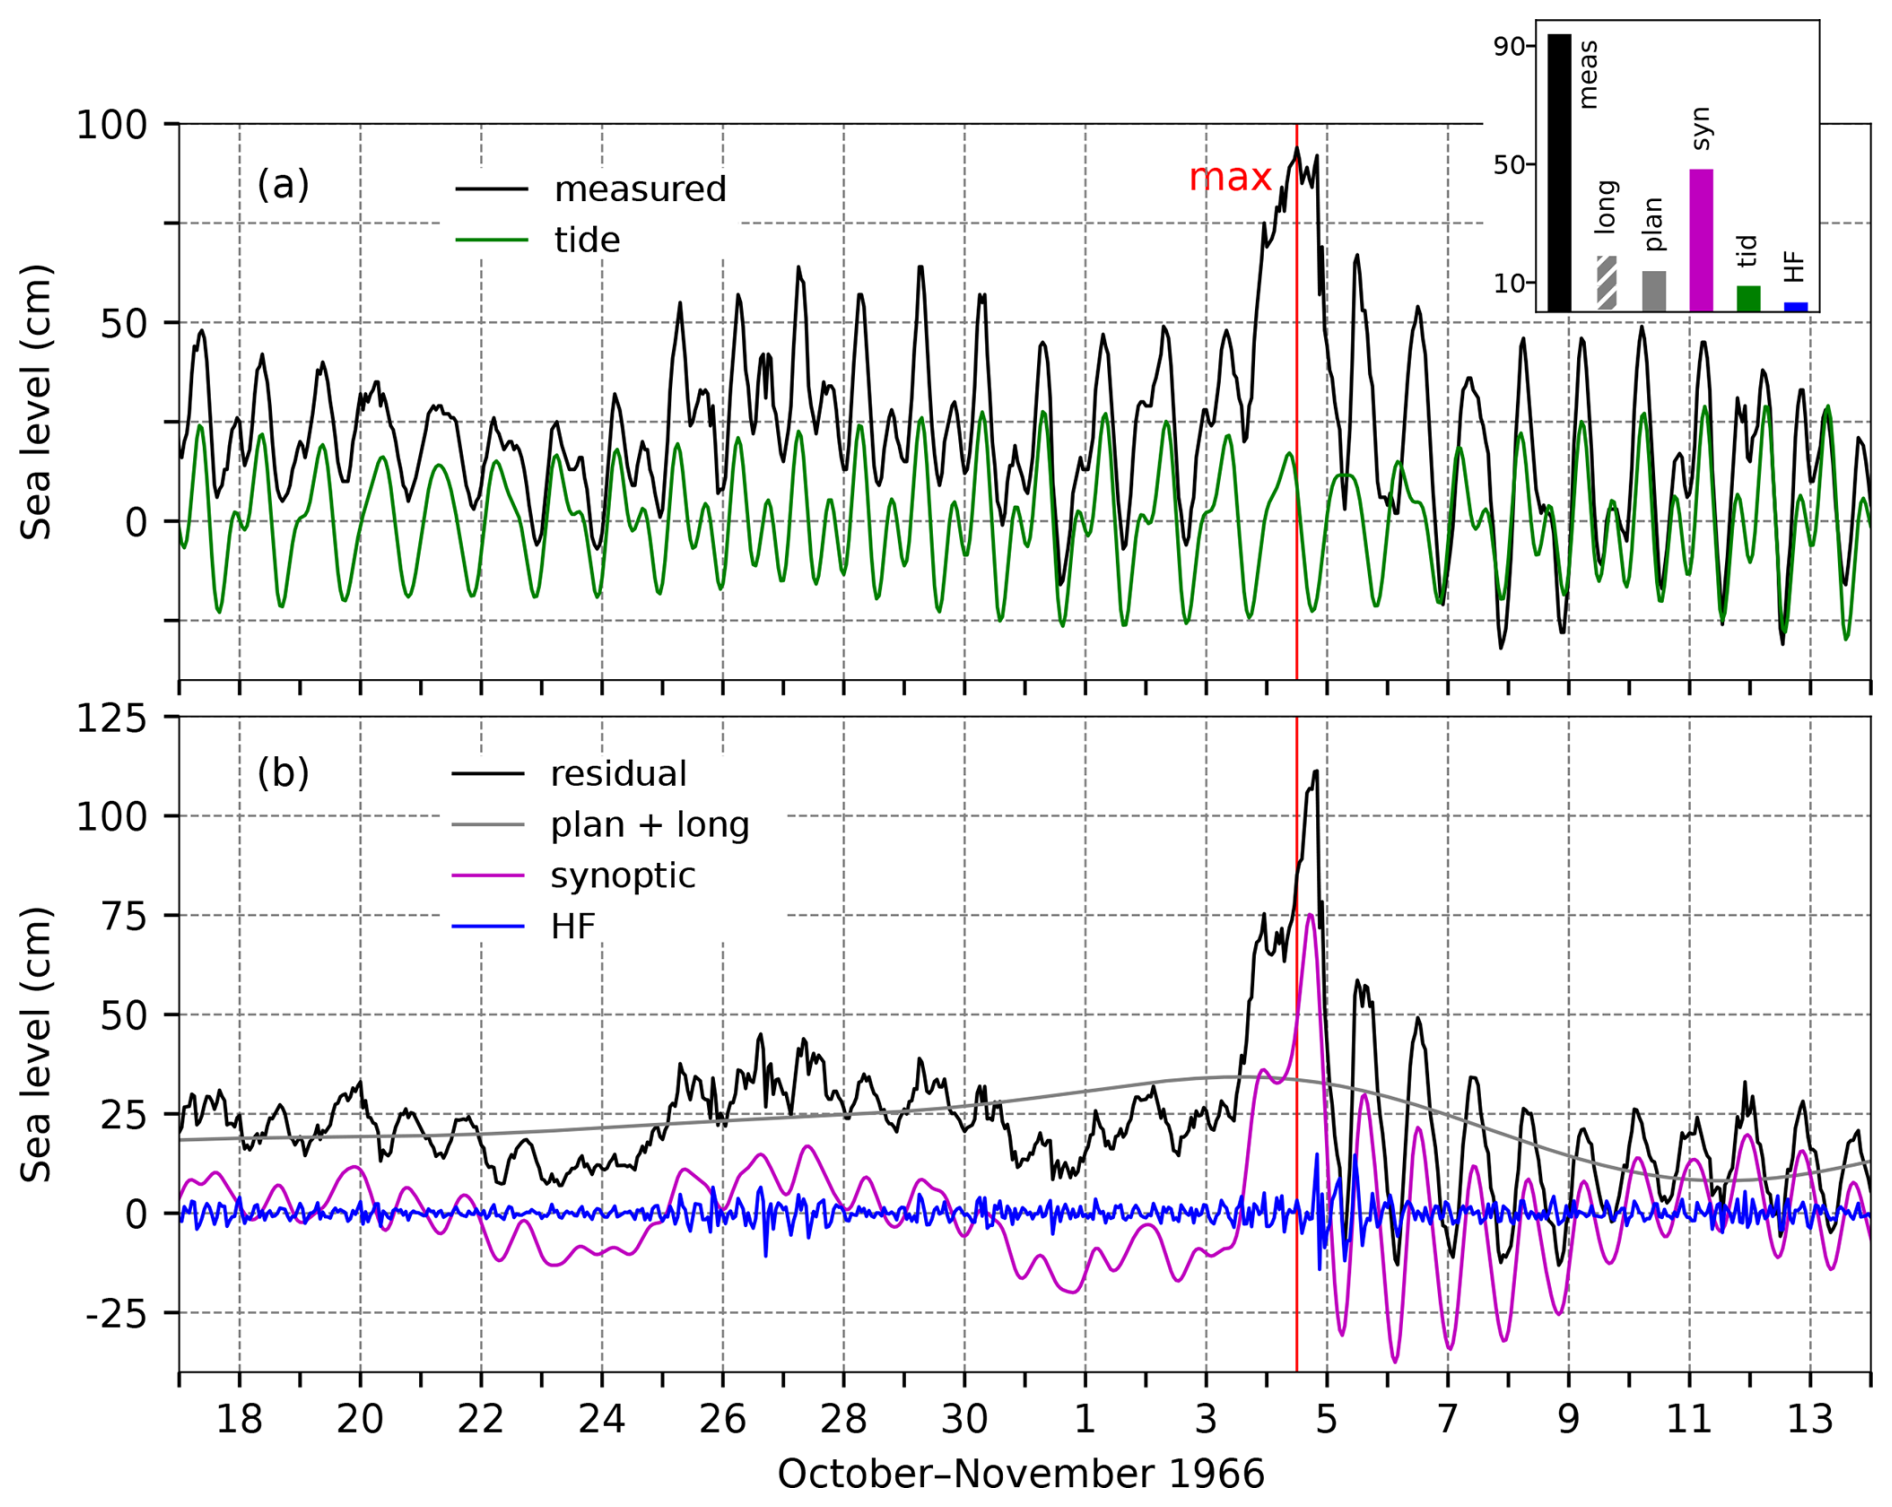
Figure 14SL series for the flood of 4 November 1966. Panel (a) shows the measured sea level (black) and tide (green). The inset figure shows the contributions (cm) of the five sea-level components to the maximum measured sea level (“meas”; 12:00 UTC): “HF” refers to high-frequency oscillations (2 h < T < 9 h), “syn” to synoptic component (9 h < T < 10 d), “tid” to tide, “plan” to planetary-scale variability (10 d < T < 100 d), and “long” to long-term sea-level variability (100 d < T). Panel (b) presents the residual sea level (black), the combined series of planetary-scale variability and long-term sea-level variability (grey; plan + long), synoptic component (purple), and high-frequency oscillations (blue). The red line indicates the time of occurrence of the total SL maximum.
4.4.2 Sea-level evolution
On 4 November 1966, at 12:00 UTC, the sea level in Bakar reached 94 cm above the long-term average, followed by a second peak of 92 cm at 20:00 UTC (Table 2, Fig. 14).
The moon, 1 d before the last quarter, created a diurnal neap tide. The first maximum occurred after the daily tidal peak, as synoptic component was still building, resulting in a positive tidal contribution of 9 cm. In contrast, the evening peak coincided with the passage of a weather front over the Adriatic, when synoptic component reached its maximum, but tide, in a negative phase, reduced the level by 19 cm (Fig. 14a).
High-frequency oscillations activated later in the day, contributing 3 cm to the first peak and 14 cm to the second (Fig. 14b).
Synoptic component was an isolated storm-surge event, with no evidence of pre-existing seiches (Fig. 14b). Sea-level and meteorological data (Fig. 12) confirm this, indicating that synoptic component was entirely driven by storm-surge activity. The storm surge was fuelled by a strong, persistent sirocco wind blowing uniformly along the Adriatic for over a day (Figs. 12b and13b), accumulating water into the basin's closed end. Synoptic component contributed 48 cm to the first peak and 63 cm to the second.
Preconditioning for the flood, indicated by planetary-scale component, began well before the event (Fig. 14, plan + long). Interestingly, the weeks leading up to the flood did not feature significant decreases in the MSLP (lp) (Fig. 12a), but winds (10 d < T < 100 d) during this period consistently blew from southern directions. Planetary-scale component added 14 cm to the events.
Long-term sea-level variability contributed 20 cm to the maximum (Figs. 73 and A1). The episode coincided with a particularly pronounced annual peak that year, which is why intra-annual variability contributed significantly – 16.6 cm – to this component (Figs. 73d and A1). Longer-period processes were less prominent, with interannual variability contributing 2.8 cm (Fig. 73c) and mean sea-level change adding 0.6 cm (Fig. 73b).
In summary, this episode involved two events: the first occurred shortly after the daily tidal peak, while the second coincided with the storm-surge maximum. The flood was the result of an exceptional storm surge superimposed on a background sea level elevated by other SL processes.
4.4.3 Flood impacts
The following effects of the flood were identified through a review of daily newspapers (Večernji list and Novi list, 5, 6, and 7 November 1966; Vjesnik, 5 November 1966; Novi list, 1966b, c; Večernji list, 1966a, b). The event was most impactful in the northern Adriatic, especially in Istria and Kvarner (Fig. 1). Strong sirocco, combined with wind waves and surge caused property damage amounting to over 10 million new Yugoslav dinars (equivalent to around USD 7.7 million today). Coastal regions, beaches, and harbours were flooded, with boats, residential buildings, warehouses, breakwaters, restaurants, and shops severely damaged. Furthermore, there were localised power losses. In Istria, several families had to evacuate their homes due to the extensive damage, and one of these homes was beyond repair. In the city of Rijeka, a shipyard sustained significant damage, while the wind also harmed multiple roofs, tearing down antennas and trees. Furthermore, numerous ferry lines in the northern Adriatic were suspended.
In the middle and southern Adriatic, no severe flooding was recorded, but the reported damage, primarily due to sirocco, exceeded a YUG 1 million new Yugoslav dinars (equivalent to around USD 770 000 today). Severe impacts included (i) disruption of ferry lines; (ii) power outages; (iii) collapse of several roofs and chimneys; and (iv) the sinking of a sailing ship, which tragically resulted in the loss of one passenger's life.
4.5 The flood of 3 November 1968 (ID 7; rank 14)
Canestrelli et al. (2001) provided a description of the episode. Their analysis included synoptic charts, SL data from TG Venice Punta Salute, and W10 and MSLP measurements from multiple coastal stations.
4.5.1 Meteorological background
On 31 October, the weather over the Mediterranean and the Adriatic was characterised by an upper-level ridge accompanied by a surface air pressure of around 1020 hPa (Fig. 15). At the same time, an upper-level trough was present over the Atlantic, with a surface-based cyclone in the centre of which the pressure dropped to 985 hPa. Over the next 3 d, the above-mentioned trough and surface-based cyclone slowly made their way towards the east, and on 3 November, the upper-level flow over the Adriatic was from the south, while the surface-based secondary cyclone from the Gulf of Lion propagated to the east (Fig. 16a). Consequently, a moderate southeasterly wind, which started blowing over the Adriatic on 31 October, was intensifying day by day, reaching strong and gale intensity during the night of 2 November and in the morning hours of 3 November (Figs. 15b and 16b). During the episode, precipitation along the coastline was not heavy. On 3 November, amounts were mostly below 20 mm, while on 4 November, they generally reached up to 30 mm.
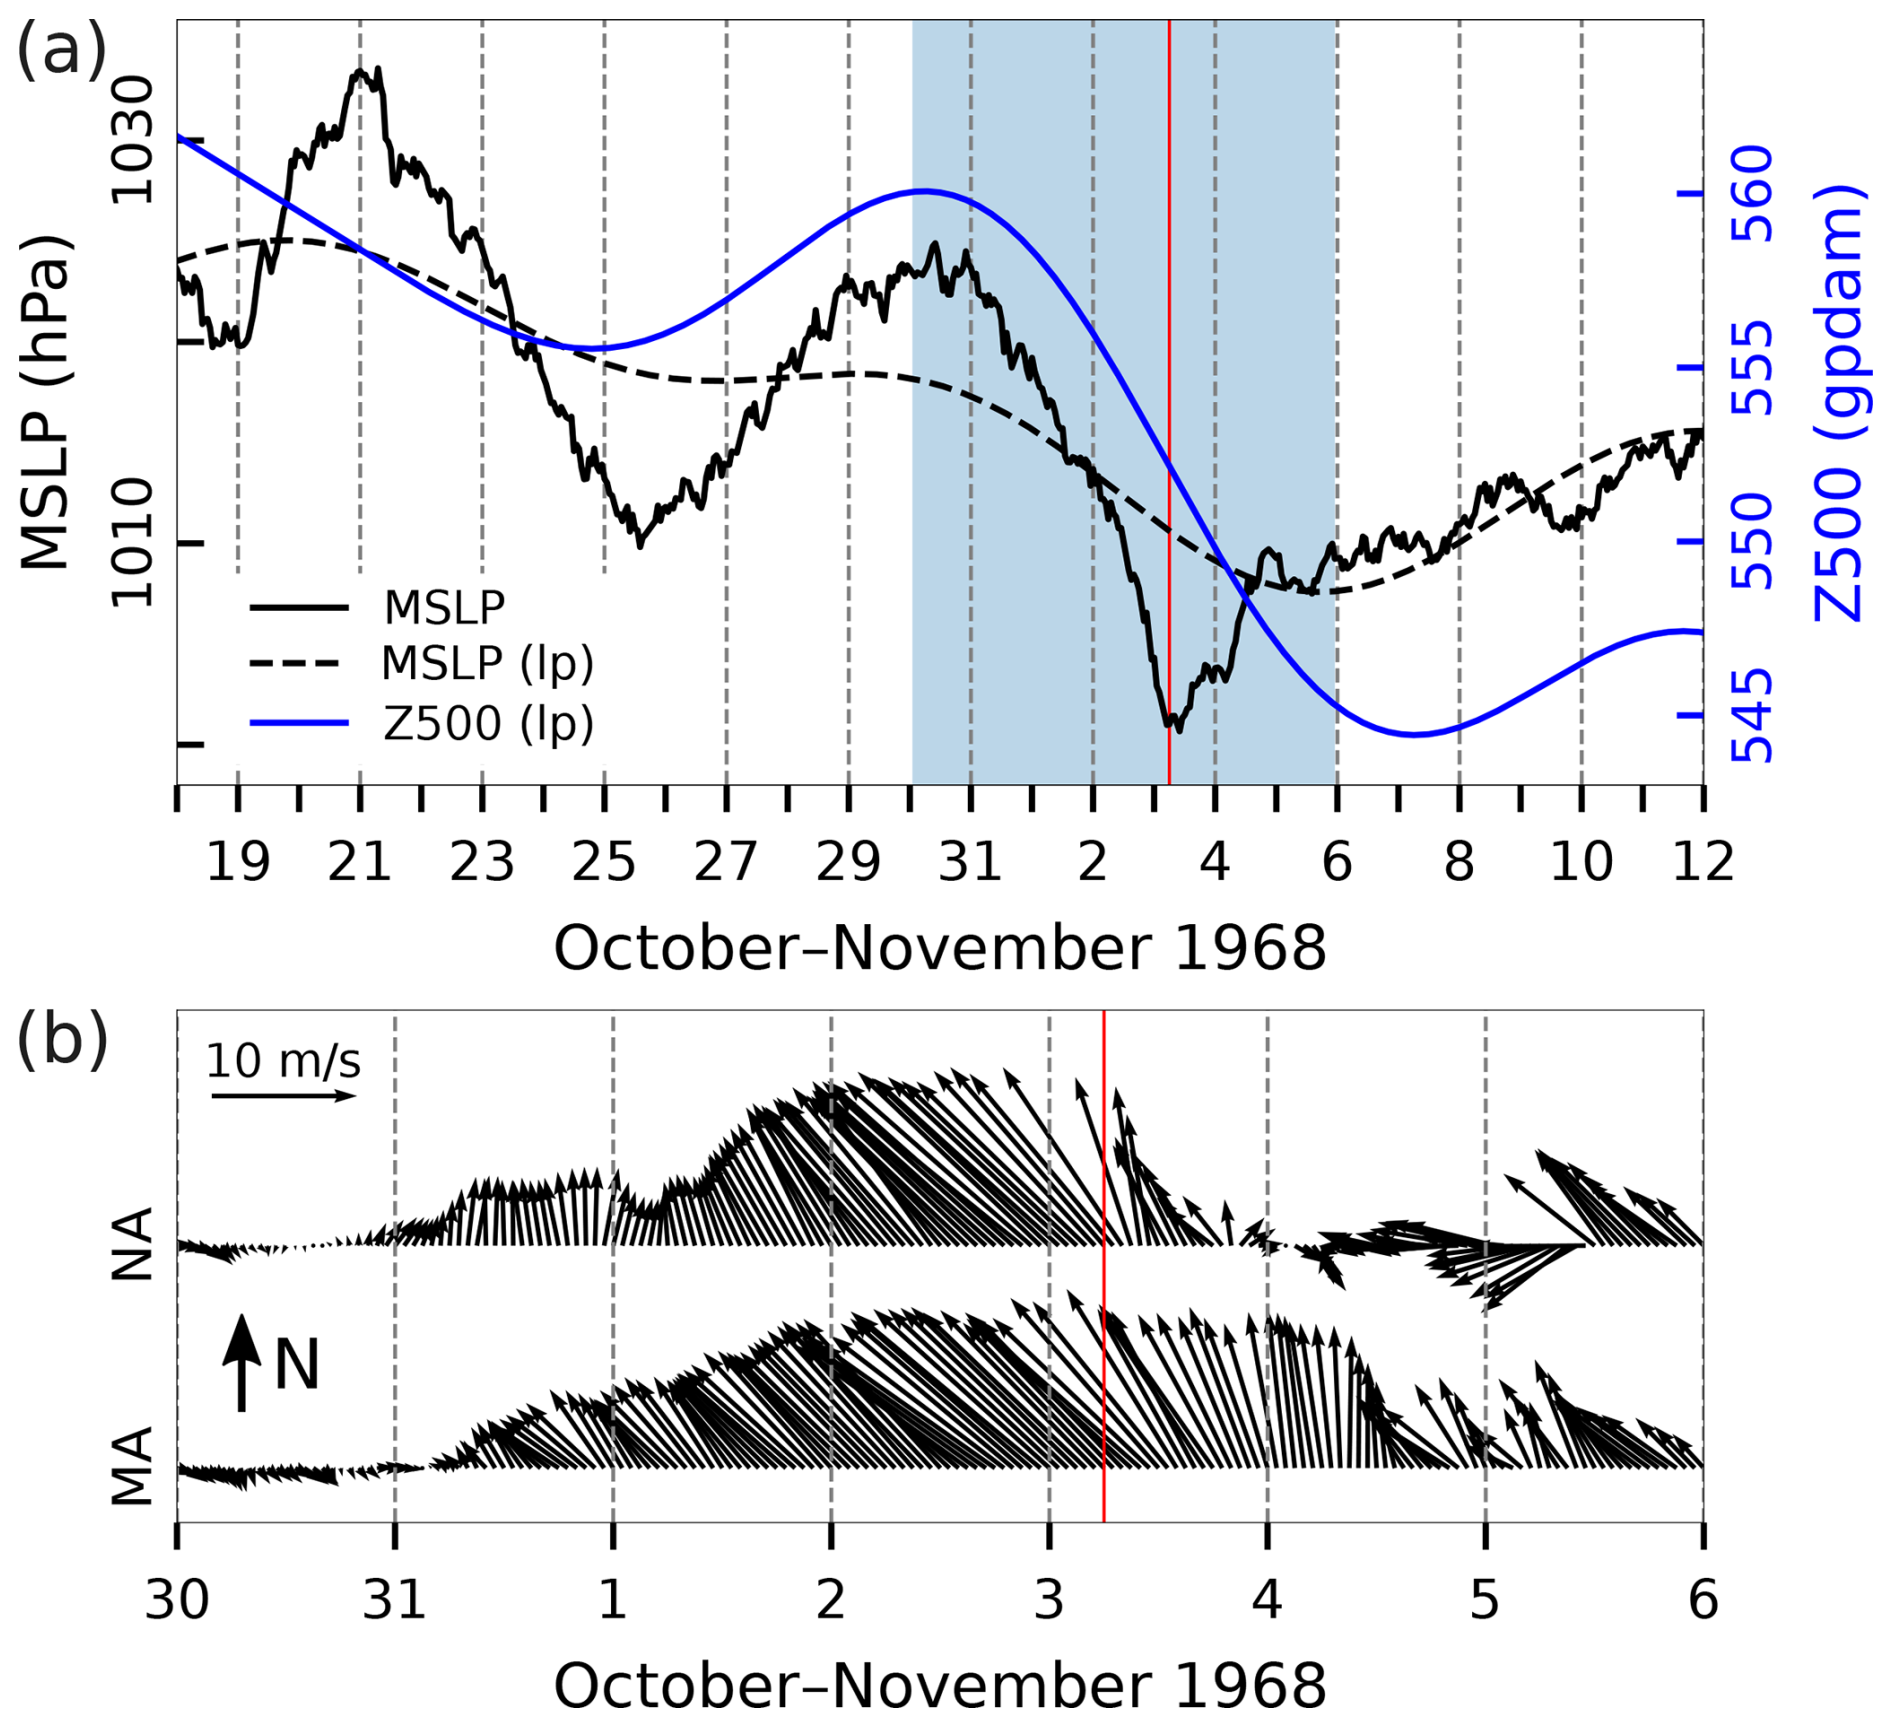
Figure 15Series of ERA5 reanalysis data related to the flood of 3 November 1968. (a) MSLP (hourly) and MSLP (lp) (low-pass filtered with a cut-off frequency of 10 d) and Z500 (lp) (low-pass filtered with a cut-off frequency of 10 d) at a grid point near TG Bakar. (b) Hourly W10 during the period marked in blue in the upper plot for the middle Adriatic (MA) and northern Adriatic (NA) (all locations marked in Fig. 1). The red line indicates the onset of the SL maximum.
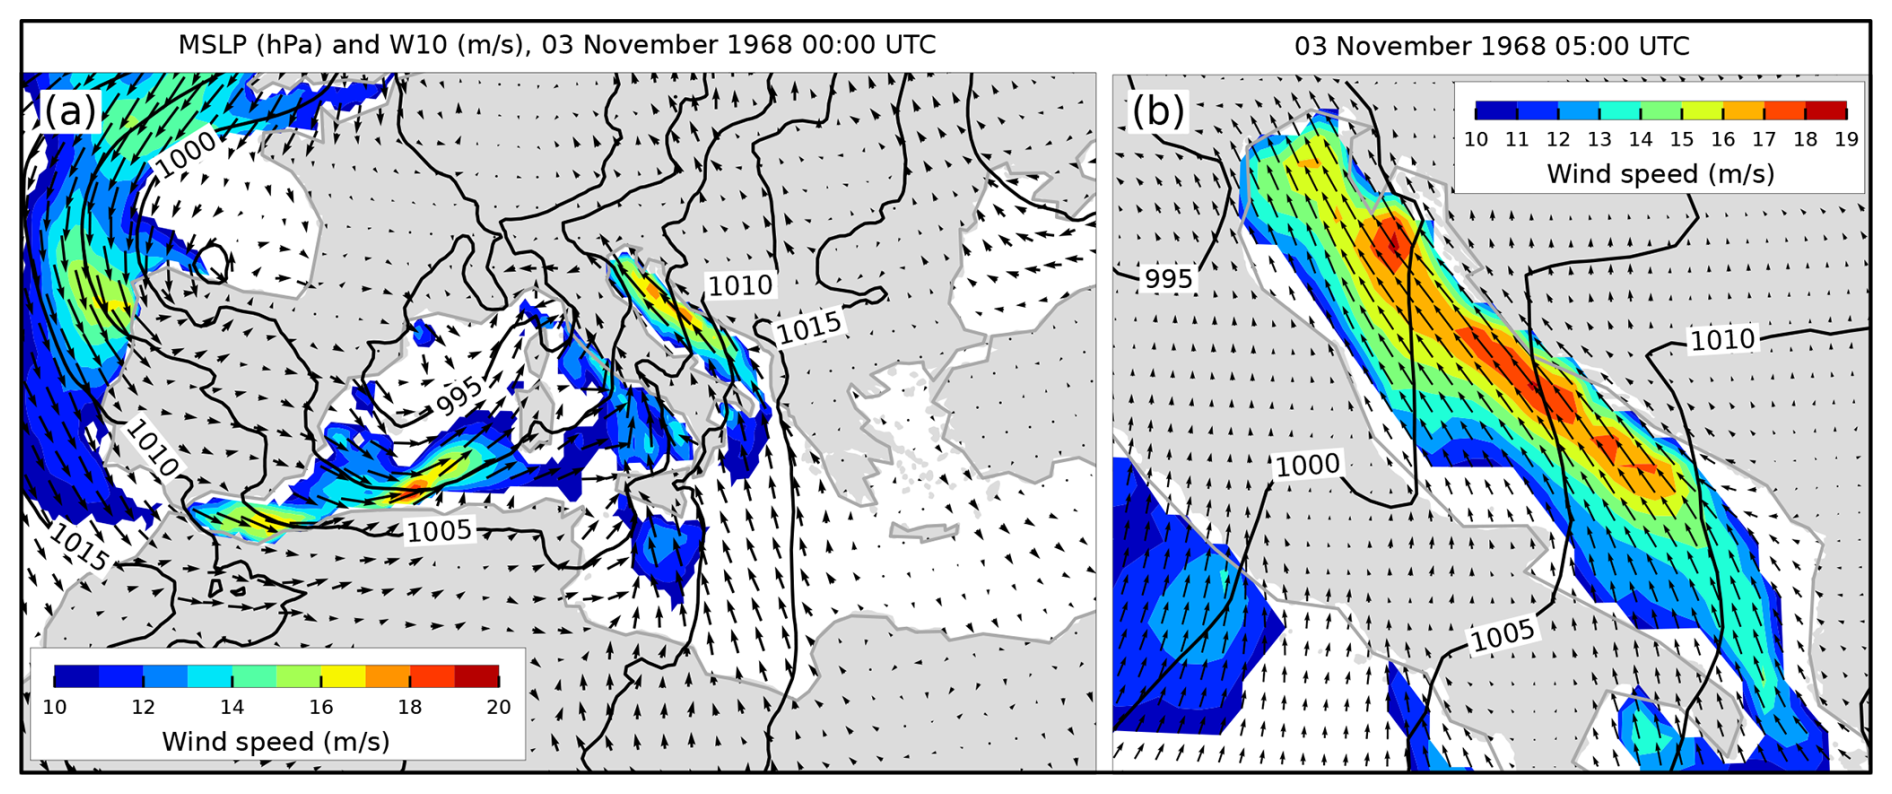
Figure 16MSLP (black lines) and W10 (arrows and colours) fields from the ERA5 reanalysis. Conditions (a) over the Mediterranean that preceded the situation (b) over the Adriatic Sea (an hour before maximum SL in Bakar). Only wind speeds exceeding 10 m s−1 are coloured.
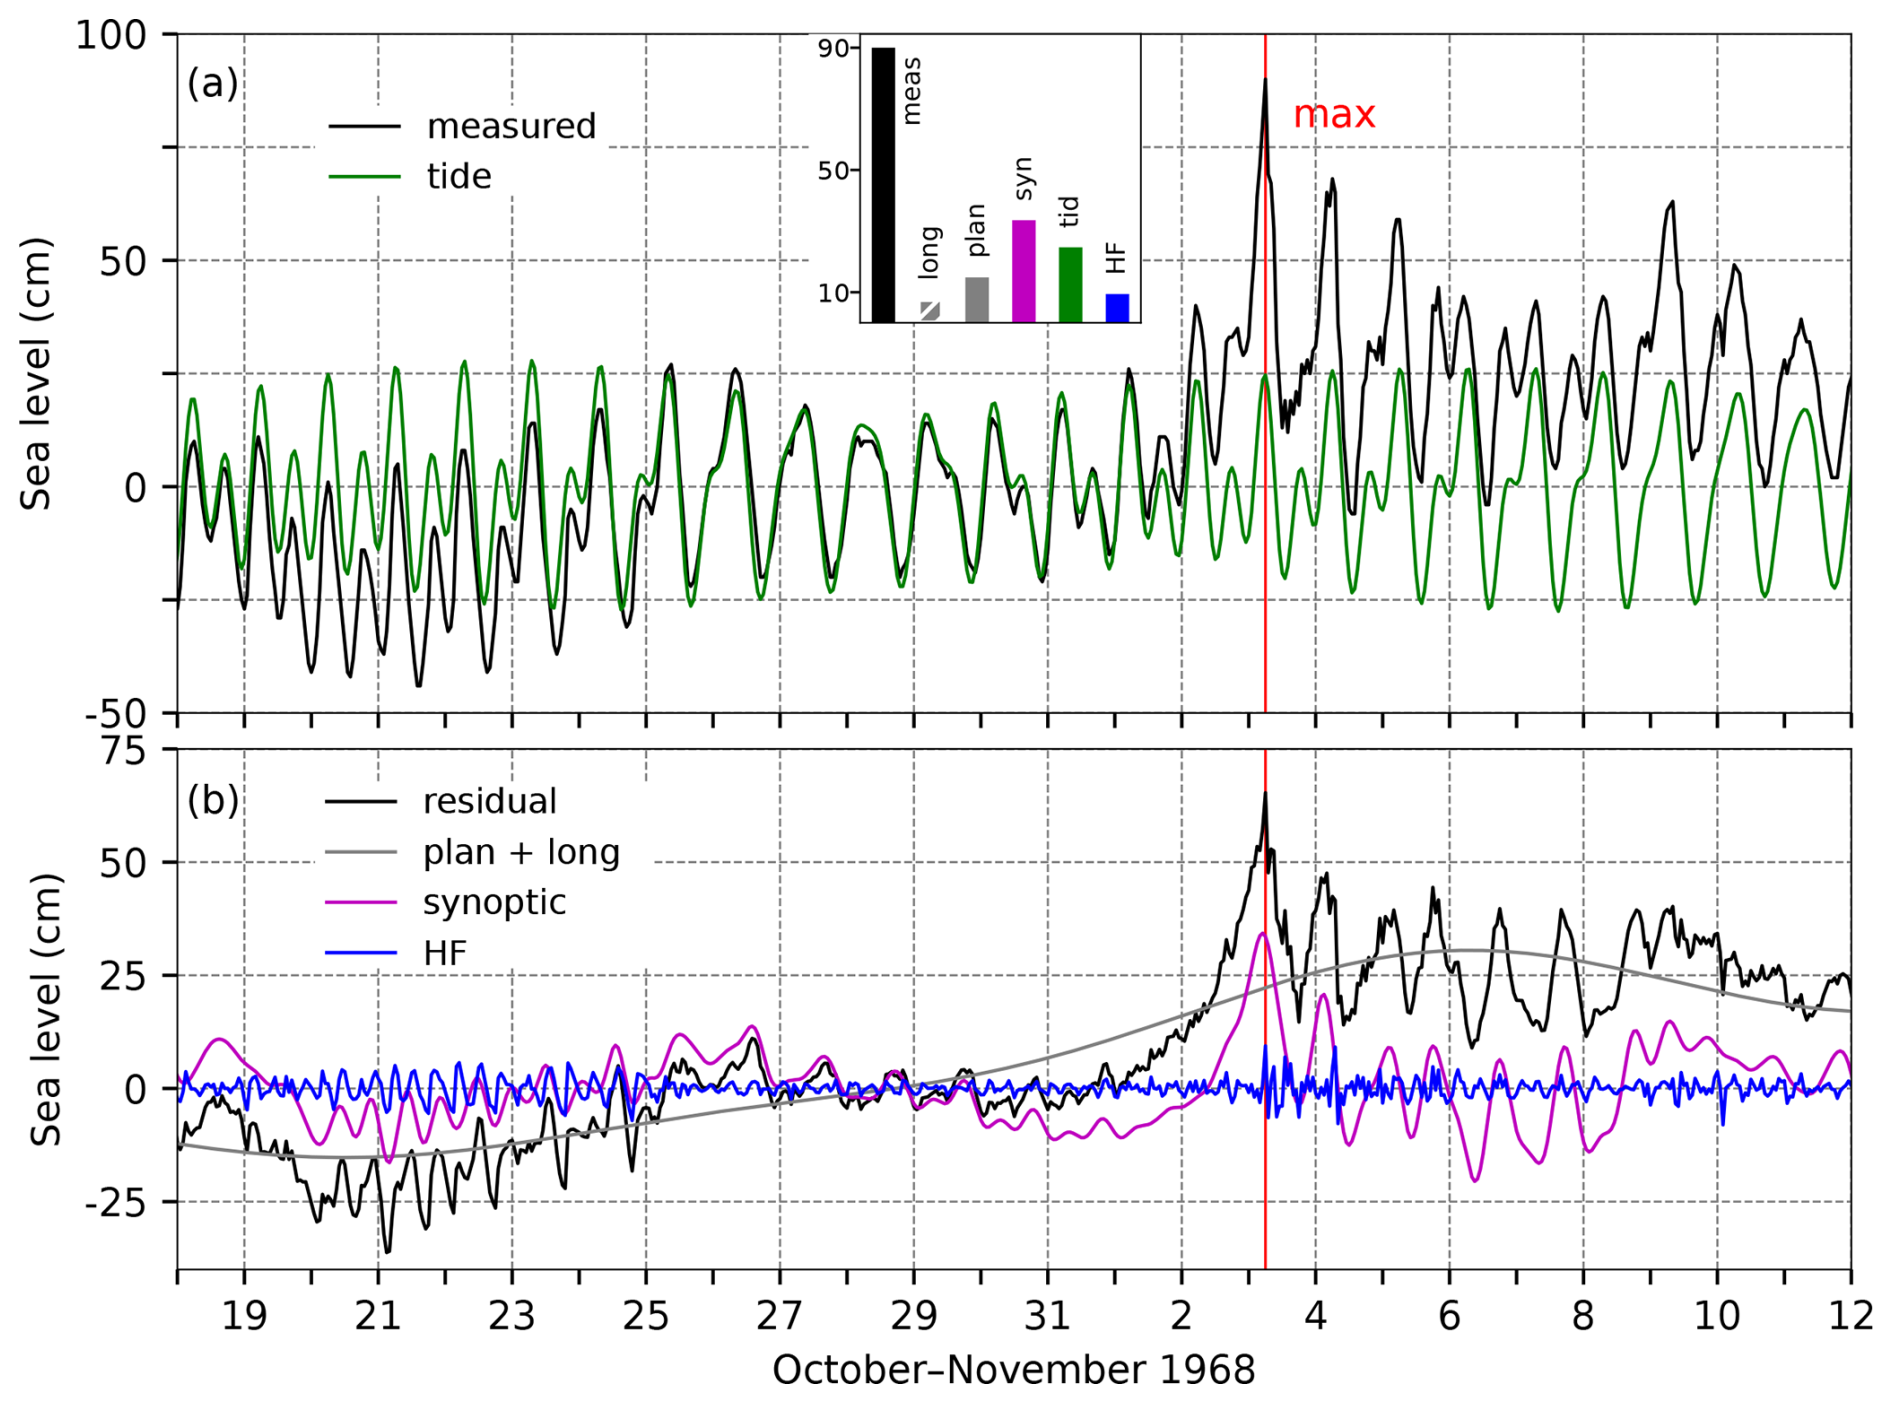
Figure 17SL series for the flood of 3 November 1968. Panel (a) shows the measured sea level (black) and tide (green). The inset figure shows the contributions (cm) of the five sea-level components to the maximum measured sea level (“meas”; 06:00 UTC): “HF” refers to high-frequency oscillations (2 h < T < 9 h), “syn” to synoptic component (9 h < T < 10 d), “tid” to tide, “plan” to planetary-scale variability (10 d < T < 100 d), and “long” to long-term sea-level variability (100 d < T). Panel (b) presents the residual sea level (black), the combined series of planetary-scale variability and long-term sea-level variability (grey; plan + long), synoptic component (purple), and high-frequency oscillations (blue). The red line indicates the time of occurrence of the total SL maximum.
4.5.2 Sea-level evolution
On 3 November 1968, at 06:00 UTC, the sea level in Bakar reached 90 cm above the long-term average (Table 2, Fig. 17). The moon phase, 2 d before the full moon, resulted in a semidiurnal spring tide. The overall SL maximum coincided with the daily tidal peak, which contributed 25 cm.
High-frequency oscillations were triggered just before total SL peak and added another 9 cm (Fig. 17b).
As the period before the flood was calm and the final cyclone was an isolated event (Fig. 15a), previously triggered seiches were not present in the basin. Therefore, synoptic component was mainly due to a storm surge driven by several days of sirocco wind (Fig. 15b). The wind started to accumulate water into the closed end of the basin around 31 October (Figs. 16 and 17b) when moderate southeasterly wind started to blow over the greater portion of the basin. The overall SL maximum developed in the maximum of synoptic component, contributing 34 cm.
Planetary-scale variability contributed 15 cm to the flood. This rise began 2 weeks prior to the episode (Fig. 17b, plan + long), but it started from a negative phase, diminishing a more significant positive contribution. The rise was linked to a drop in the MSLP (lp) and a corresponding decrease in Z500 (lp) (Fig. 15b). After 28 October, wind (10 d < T < 100 d) began to support this rise, gradually shifting from northwest to southeast. As shown by Pasarić (2000), Pasarić et al. (2000), and Pasarić and Orlić (2001) this pattern indicates that planetary-scale variability was primarily influenced by the passage of planetary Rossby waves.
Long-term sea-level variability during this period was not pronounced, contributing 7 cm to the flood episode (Figs. 73 and A1). The episode occurred just before the annual SL peak, which was relatively low that year (Fig. 73d), resulting in intra-annual variability – including the mean seasonal cycle and its anomalies – contributing only 4 cm to this component. Other processes were also weak, with interannual variability contributing 2 cm (Fig. 73c) and mean sea-level change adding 1 cm (Fig. 73b).
In summary, the flood was caused by a combination of storm surge and tide, amplified by smaller positive contributions from other processes.
4.5.3 Flood impacts
A review of available daily newspapers from 4 November 1968 (Novi list and Večernji list) revealed the following effects of the flood. The flood affected the northern part of the Adriatic. The stormy sirocco brought ferry and catamaran traffic to a standstill and damaged harbours, industrial facilities, and parks along the coast. In many Kvarner towns, numerous streets were flooded, with seawater entering stores and warehouses near the shore. In Rijeka, lower parts of the city were inundated – partly due to rain and waves and partly because strong winds scattered large quantities of leaves, clogging the sewers. Large waves also washed away a floating beacon near Kraljevica (northern Adriatic). In Crikvenica (near Bakar), the waves damaged several beaches and destroyed part of the protective wall of the harbour breakwater.
4.6 The flood of 25 November 1969 (ID 8; rank 8)
Despite causing severe flooding along the eastern Adriatic coastline, setting a record for the highest total SL at TG Trieste (182.7 cm above the long-term mean for 1956–2020; Šepić et al., 2022), and the substantial storm surge generated during the episode (as demonstrated in this paper), no scientific studies have been found that specifically analyse this episode. Only a brief empirical analysis about of the flood is available in the report by Canestrelli et al. (2001).
4.6.1 Meteorological background
On 21 November, the anticyclone over the Adriatic gradually weakened, while a deep surface-based cyclone formed over the Celtic Sea, accompanied by an upper-level closed low-pressure circulation. Over the next 2 d (22 and 23 November), this extensive cyclone deepened further, with its centre moving southwest and exerting an increasing influence over western and central Europe. Consequently, an upper-level southwesterly flow was established over the Adriatic, and surface air pressure began to decrease (Fig. 18). On 24 November, a new cyclone developed in the Bay of Biscay and advanced northeast through France and Germany, deepening to 995 hPa at its centre. Simultaneously, an anticyclonic field strengthened over the eastern Mediterranean. Under these conditions, on 24 November, southerly and southeasterly winds over the Adriatic increased to a moderate and strong intensity, subsequently shifting to southerly and southwesterly winds. However, during the night of 24–25 November, another cyclone formed in the western Mediterranean (Fig. 19a) and rapidly advanced towards the Gulf of Genoa during the day, where it deepened and continued northeast. As it passed over the northern Adriatic, the MSLP at its centre dropped to less than 980 hPa (Fig. 19b). As a result, on 25 November, strong to gale southeasterly winds developed over the Adriatic, shifting to strong to gale southwesterly winds by the morning of the following day, accompanied by westerly winds in the northern Adriatic (Fig. 18b). The cyclone brought moderate precipitation. On 25 November, up to 30 mm was recorded along the entire coastline. On 26 November, precipitation in the northern Adriatic ranged from 20 to 40 mm, while it was up to 20 mm in the middle Adriatic.
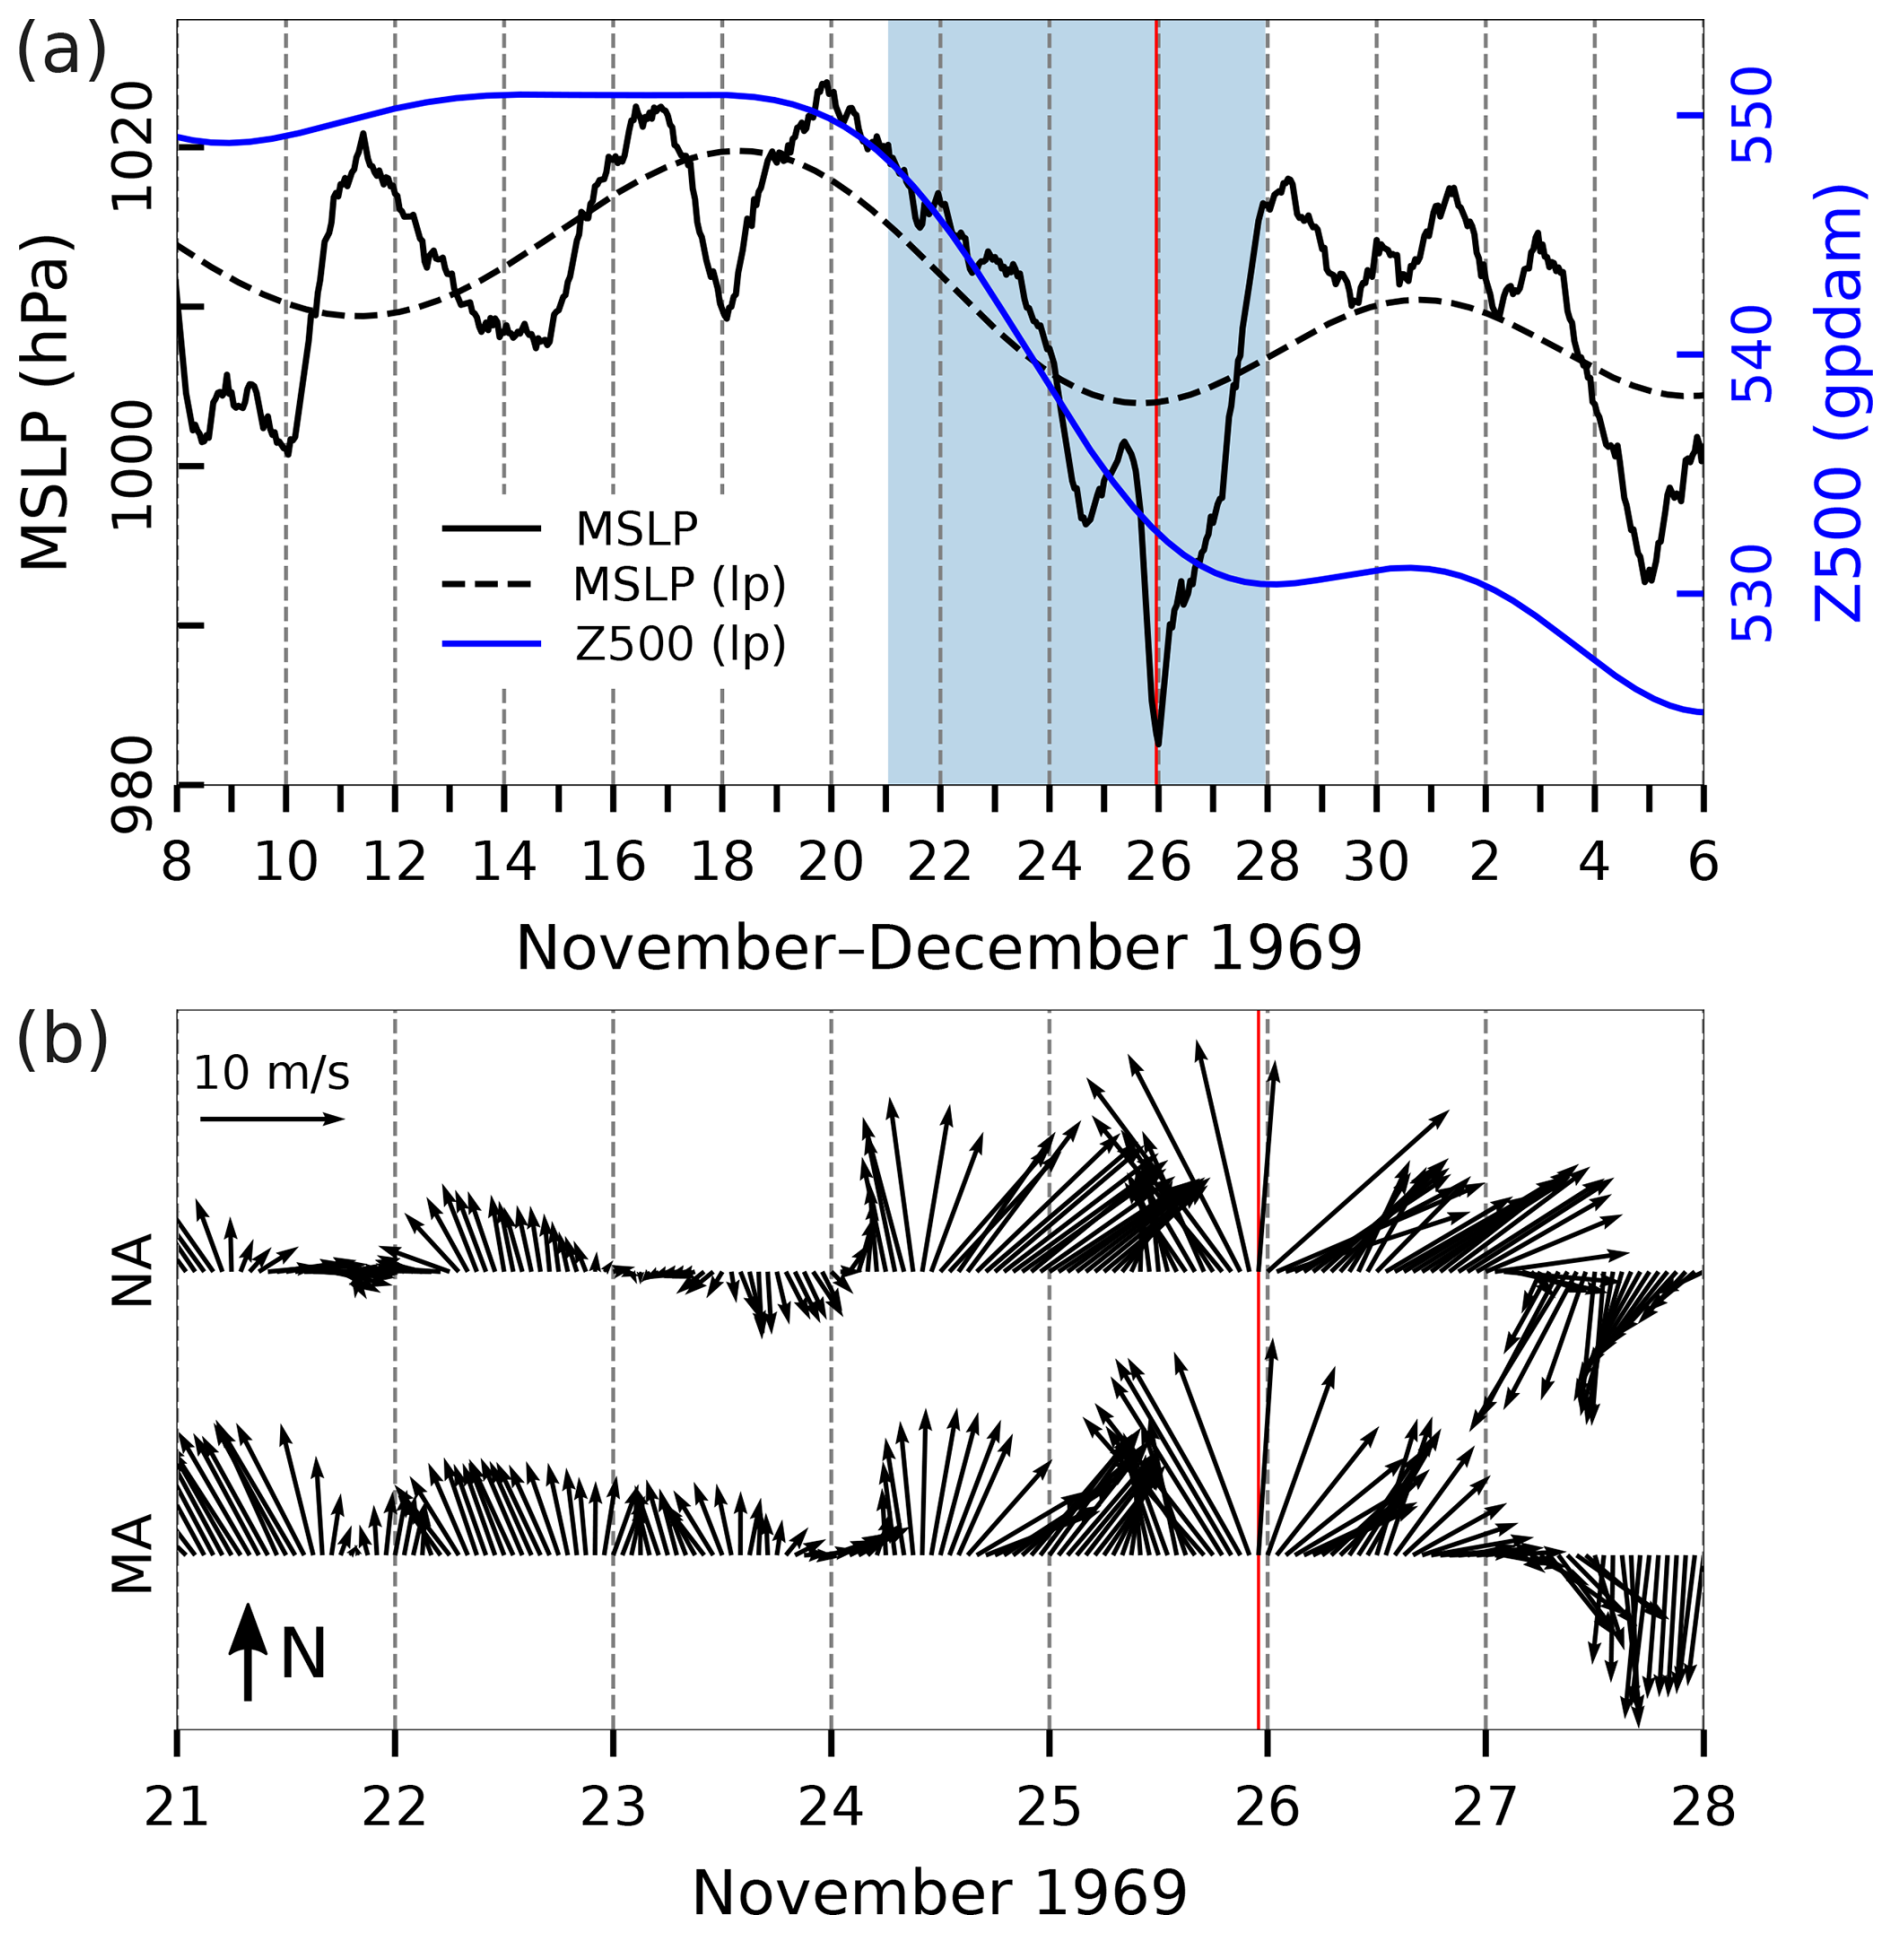
Figure 18Series of ERA5 reanalysis data related to the flood of 25 November 1969. (a) MSLP (hourly) and MSLP (lp) (low-pass filtered with a cut-off frequency of 10 d) and Z500 (lp) (low-pass filtered with a cut-off frequency of 10 d) at a grid point near TG Bakar. (b) Hourly W10 during the period marked in blue in the upper plot for the middle Adriatic (MA) and northern Adriatic (NA) (all locations marked in Fig. 1). The red line indicates the onset of the SL maximum.
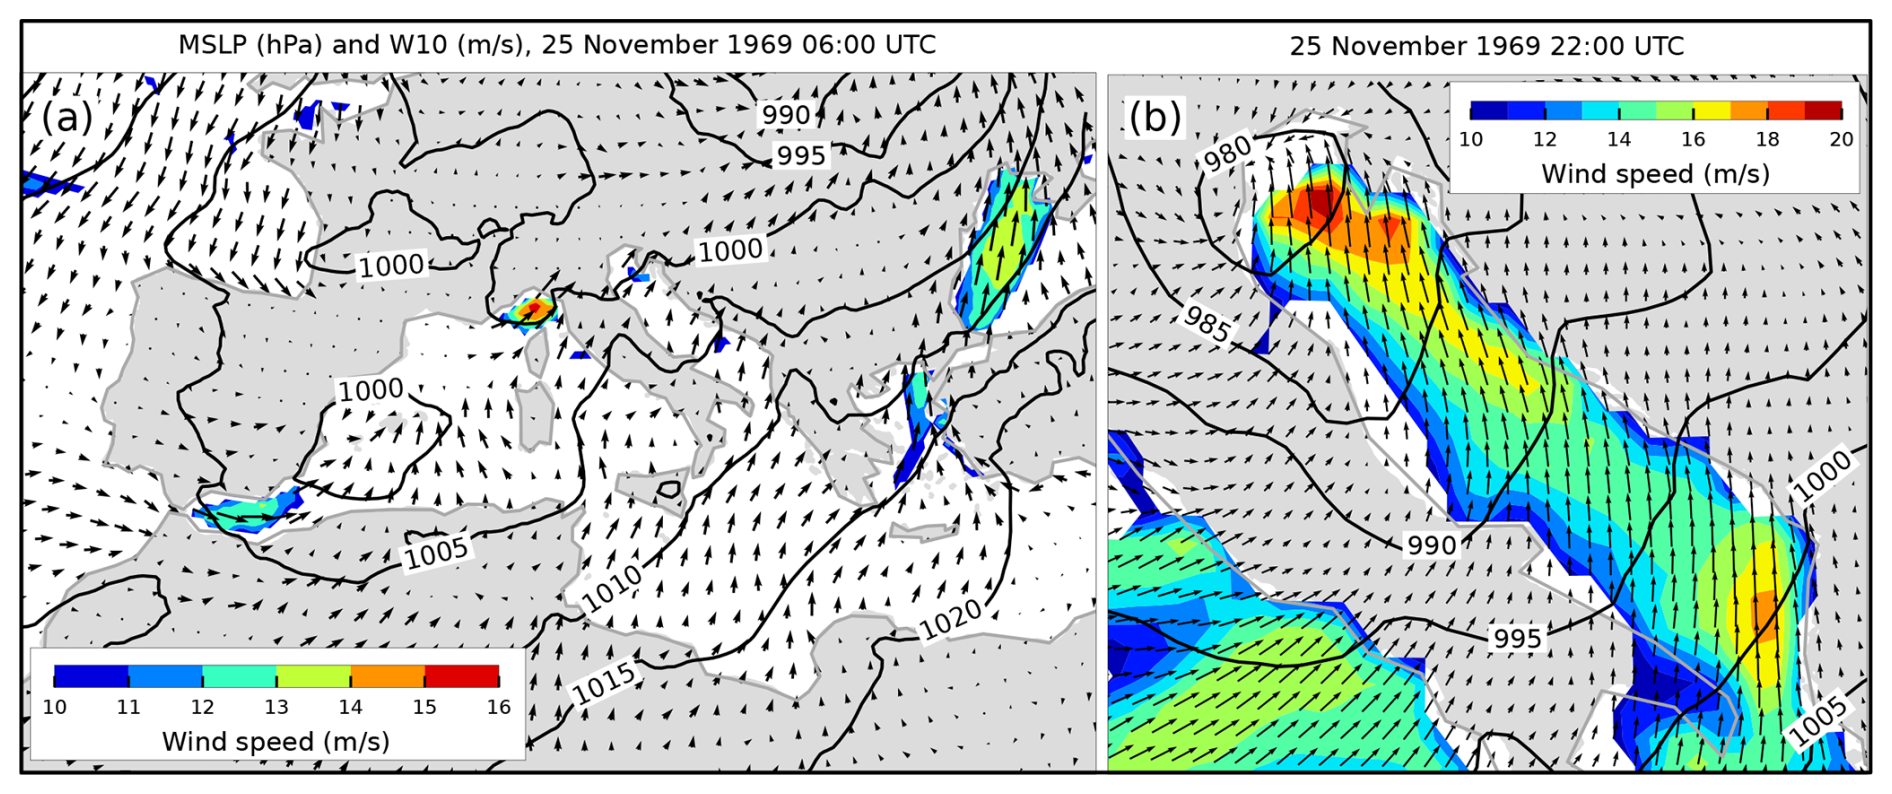
Figure 19MSLP (black lines) and W10 (arrows and colours) fields from the ERA5 reanalysis. Conditions (a) over the Mediterranean that preceded the situation (b) over the Adriatic Sea (an hour before maximum SL in Bakar). Only wind speeds exceeding 10 m s−1 are coloured.
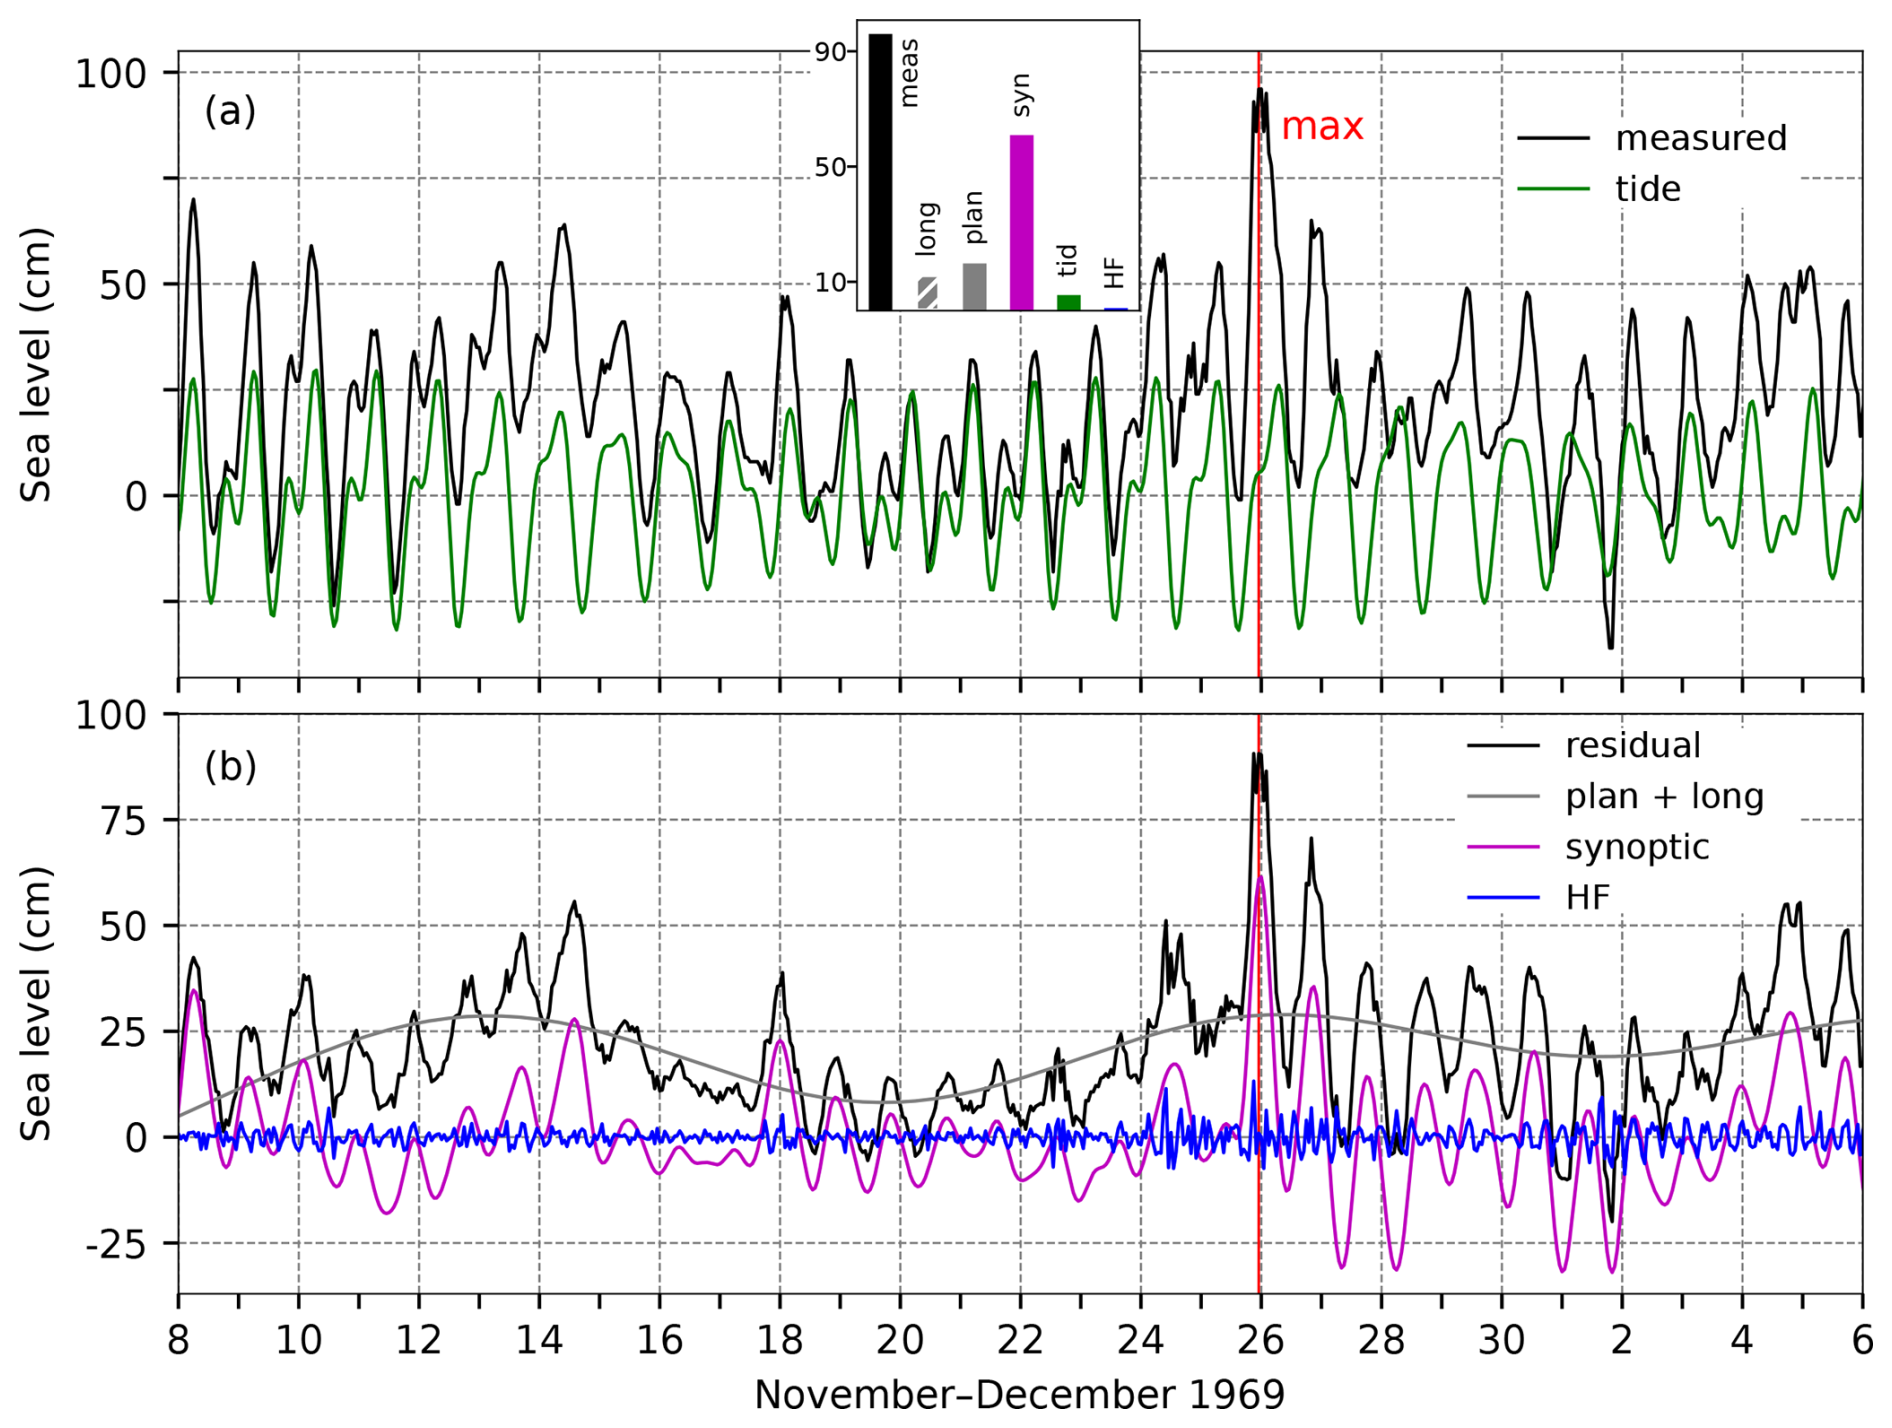
Figure 20SL series for the flood of 25 November 1969. Panel (a) shows the measured sea level (black) and tide (green). The inset figure shows the contributions (cm) of the five sea-level components to the maximum measured sea level (“meas”; 23:00 UTC): “HF” refers to high-frequency oscillations (2 h < T < 9 h), “syn” to synoptic component (9 h < T < 10 d), “tid” to tide, “plan” to planetary-scale variability (10 d < T < 100 d), and “long” to long-term sea-level variability (100 d < T). Panel (b) presents the residual sea level (black), the combined series of planetary-scale variability and long-term sea-level variability (grey; plan + long), synoptic component (purple), and high-frequency oscillations (blue). The red line indicates the time of occurrence of the total SL maximum.
4.6.2 Sea-level evolution
On 25 November 1969, at 23:00 UTC, the sea level in Bakar rose to 96 cm above the long-term average (Table 2, Fig. 20). The moon, 2 d past the full moon, produced a semidiurnal spring tide. The overall maximum occurred during the tidal rise, with tide contributing just 6 cm.
During the episode, high-frequency oscillations were active (Fig. 20b), but the overall maximum did not align with their peak, contributing only 1 cm. It should be mentioned that exceptional high-frequency activity was recorded at TG Trieste during this event, with a record-setting sea level of 182.7 cm above the long-term mean. Šepić et al. (2022) reported that high-frequency processes, primarily driven by the Trieste Bay seiche (with periods of 2.7–4.2 h), contributed 40 cm to Trieste's maximum.
In the weeks leading up to the flood, several low-pressure systems influenced the Adriatic (Fig. 18a), inducing basin-wide seiches with a ∼ 21.2 h period visible in synoptic component (Fig. 20b). However, these oscillations weakened by the time the decisive cyclone crossed the Adriatic, and synoptic component was primarily driven by a storm surge. The surge began building on 24–25 November as winds with a pronounced southern component fluctuated between southwesterly and southeasterly directions (Fig. 18b). For several days, the wind blew more directly towards the eastern coastline, likely causing a stronger SL response along that side than along the western side. This probably led to a record-breaking sea level in Trieste. Synoptic component contributed 61 cm, and it was one of the highest among the studied floods.
Preconditioning for the event was moderate, starting a week prior (Fig. 20b, plan + long) as SL rose under the influence of a drop in the MSLP (lp) (Fig. 18a) and southeasterly winds (10 d < T < 100 d). Winds at these periods blew from the south (at maximum speeds of around 6 m s−1) starting in early December and continuing for several days after the flood. Planetary-scale variability contributed 16 cm to the total sea level.
Long-term sea-level variability contributed 12 cm to this episode (Figs. 73 and A1). The flood occurred before the annual SL peak and, as a result, intra-annual variability – including the mean seasonal cycle and its anomalies – contributed 6.5 cm (Fig. 73d). Other processes were also relatively weak during this period: interannual variability added 4 cm (Fig. 73c) and mean sea-level change contributed 1.5 cm (Fig. 73b).
In summary, this flood resulted from an exceptional contribution by synoptic component, amplified by a raised sea level driven by positive contributions from other components.
4.6.3 Flood impacts
A review of the available daily newspapers (Novi list, 25–27 November 1969, Novi list, 1969a, b, c; Slobodna Dalmacija, 27 November 1969; Večernji list, 28–30 November 1969) revealed the following: the impact of the event was strongest in the northern Adriatic, where (i) strong waves, reaching destructive heights, damaged and destroyed many boats, including a 13 m long research vessel (BIOS) that sank in Rovinj; (ii) numerous tourist resorts and houses were damaged; (iii) local breakwaters were damaged; (iv) many towns were flooded; and (v) the salt stores of Pag (island) were flooded, dissolving a considerable amount of transportable salt. In the middle Adriatic, (i) in Zadar, the waves flooded roads and damaged around 20 boats; (ii) there was localised flooding; and (iii) power outages were reported.
4.7 The flood of 22 December 1979 (ID 9; rank 7)
This episode has been studied in several papers. Bertotti et al. (2011) analysed the accuracy of deterministic and ensemble-based forecasts of meteorological conditions and sea state during the flood. Canestrelli et al. (2001) described the episode using synoptic charts, SL measured at TG Venice Punta Salute, and W10 and MSLP measured at several coastal stations. Cavaleri et al. (2010) demonstrated that modern forecasting systems based on hydrodynamic models could have accurately predicted the storm, waves, and storm surge several days in advance. Lionello et al. (2021) briefly outlined the meteorological background and SL components that contributed to the formation of the overall SL maximum.
4.7.1 Meteorological background
A series of low-pressure systems affected the Adriatic in the period preceding this flood (Fig. 21a). On 18 and 19 December, an upper-level trough containing cold air descended from the north of the continent. By 20 December, the axis of this trough extended from the Scandinavian Peninsula across western Europe to northwestern Africa. Under these synoptic conditions, a surface flow with a pronounced southerly component became established over the Adriatic (Fig. 21b) and other parts of the Mediterranean. A surface-based cyclone developed in the lee of the Atlas Mountains, deepened, and moved northeast until its centre reached the western Mediterranean on 21 December (Fig. 22a). This extensive cyclone continued to deepen to less than 985 hPa at its centre as it proceeded towards Corsica. As it approached Corsica, the cyclone's influence over the Adriatic became more pronounced: a southeast wind began to blow, strengthening to strong and very strong winds on 21 December and reaching gale intensity on 22 December (Fig. 22b). On 23 December, the cyclone's centre shifted further northeast, with the southeasterly wind persisting over the Adriatic but gradually weakening. On the day of the flood, precipitation amounts were modest, with up to 15 mm recorded along the coastline. However, higher amounts were recorded the following day, including 22 mm in Bakar and 33 mm in Split.
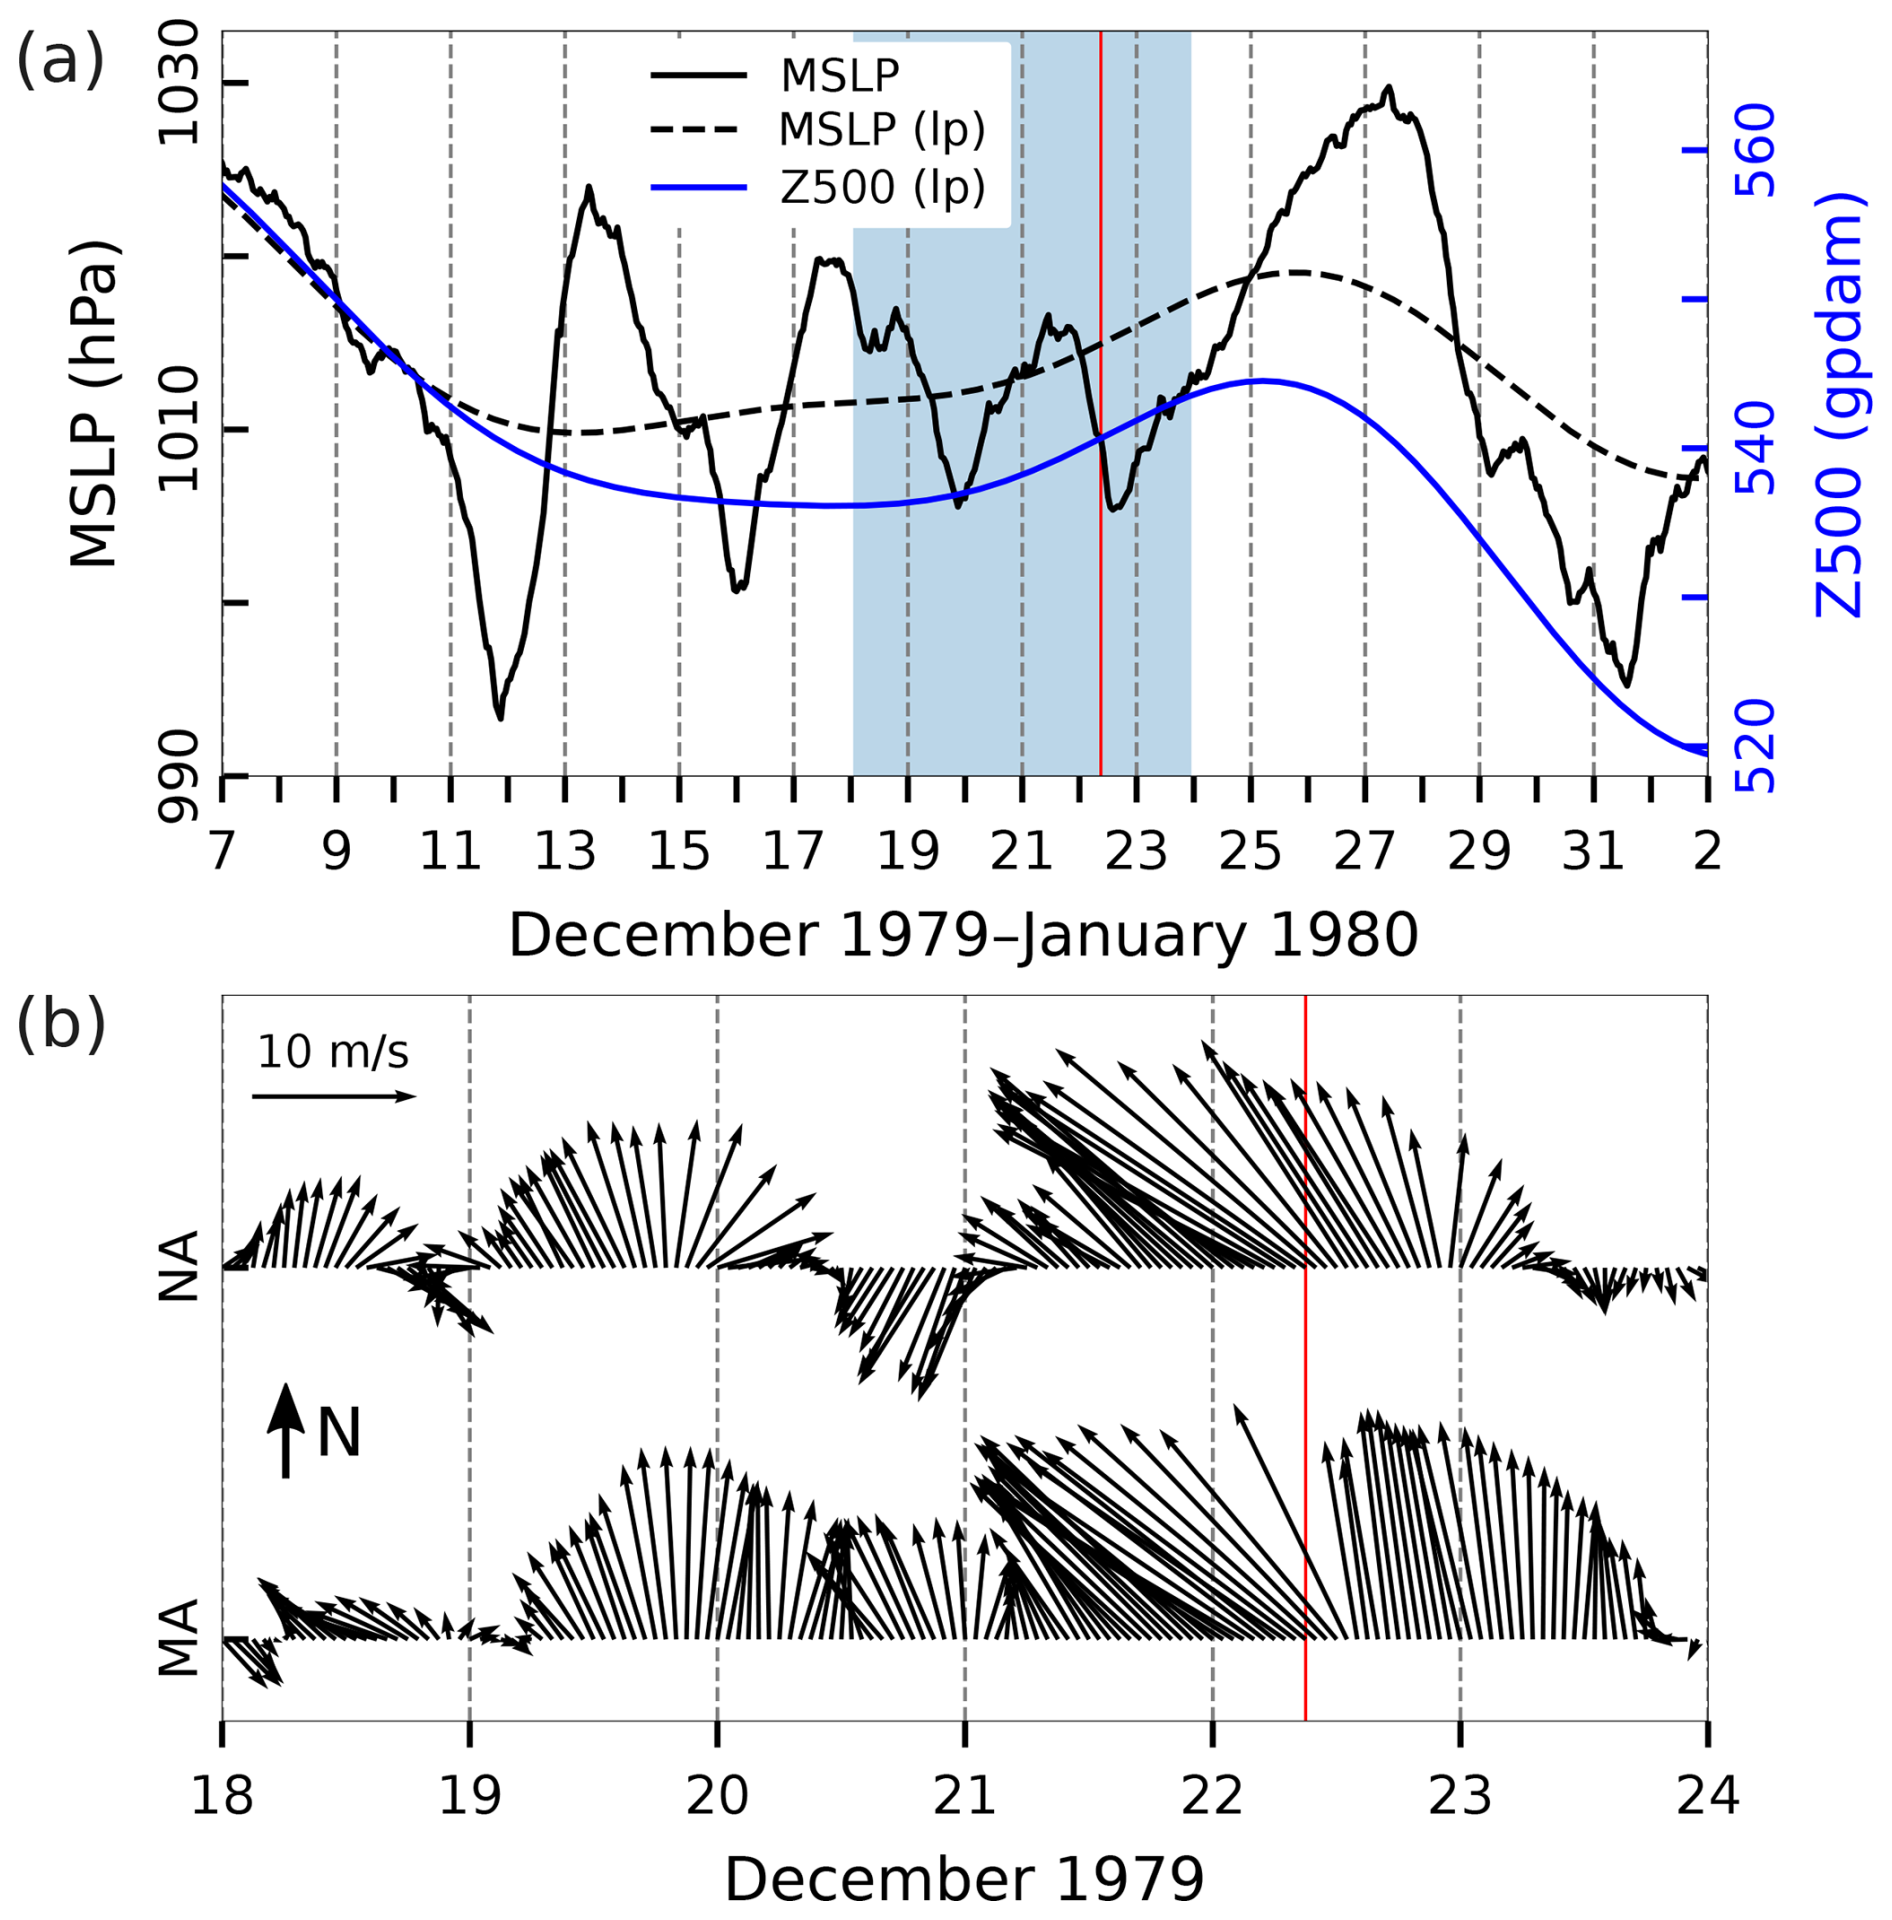
Figure 21Series of ERA5 reanalysis data related to the flood of 22 December 1979. (a) MSLP (hourly) and MSLP (lp) (low-pass filtered with a cut-off frequency of 10 d) and Z500 (lp) (low-pass filtered with a cut-off frequency of 10 d) at a grid point near TG Bakar. (b) Hourly W10 during the period marked in blue in the upper plot for the middle Adriatic (MA) and northern Adriatic (NA) (all locations marked in Fig. 1). The red line indicates the onset of the SL maximum.
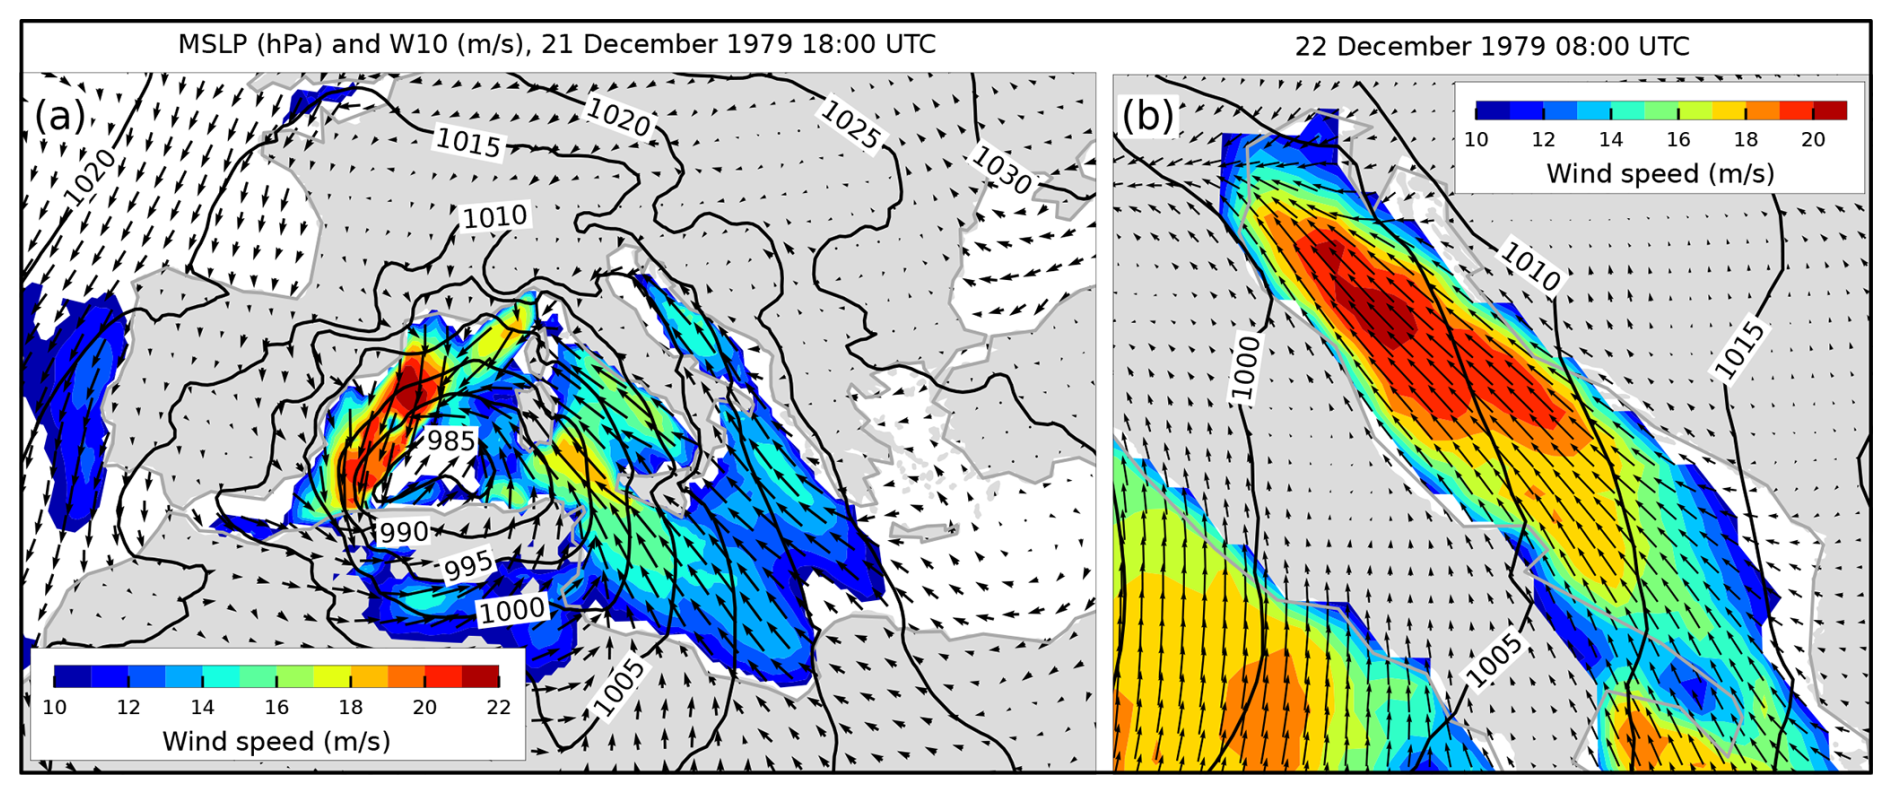
Figure 22MSLP (black lines) and W10 (arrows and colours) fields from the ERA5 reanalysis. Conditions (a) over the Mediterranean that preceded the situation (b) over the Adriatic Sea (an hour before maximum SL in Bakar). Only wind speeds exceeding 10 m s−1 are coloured.
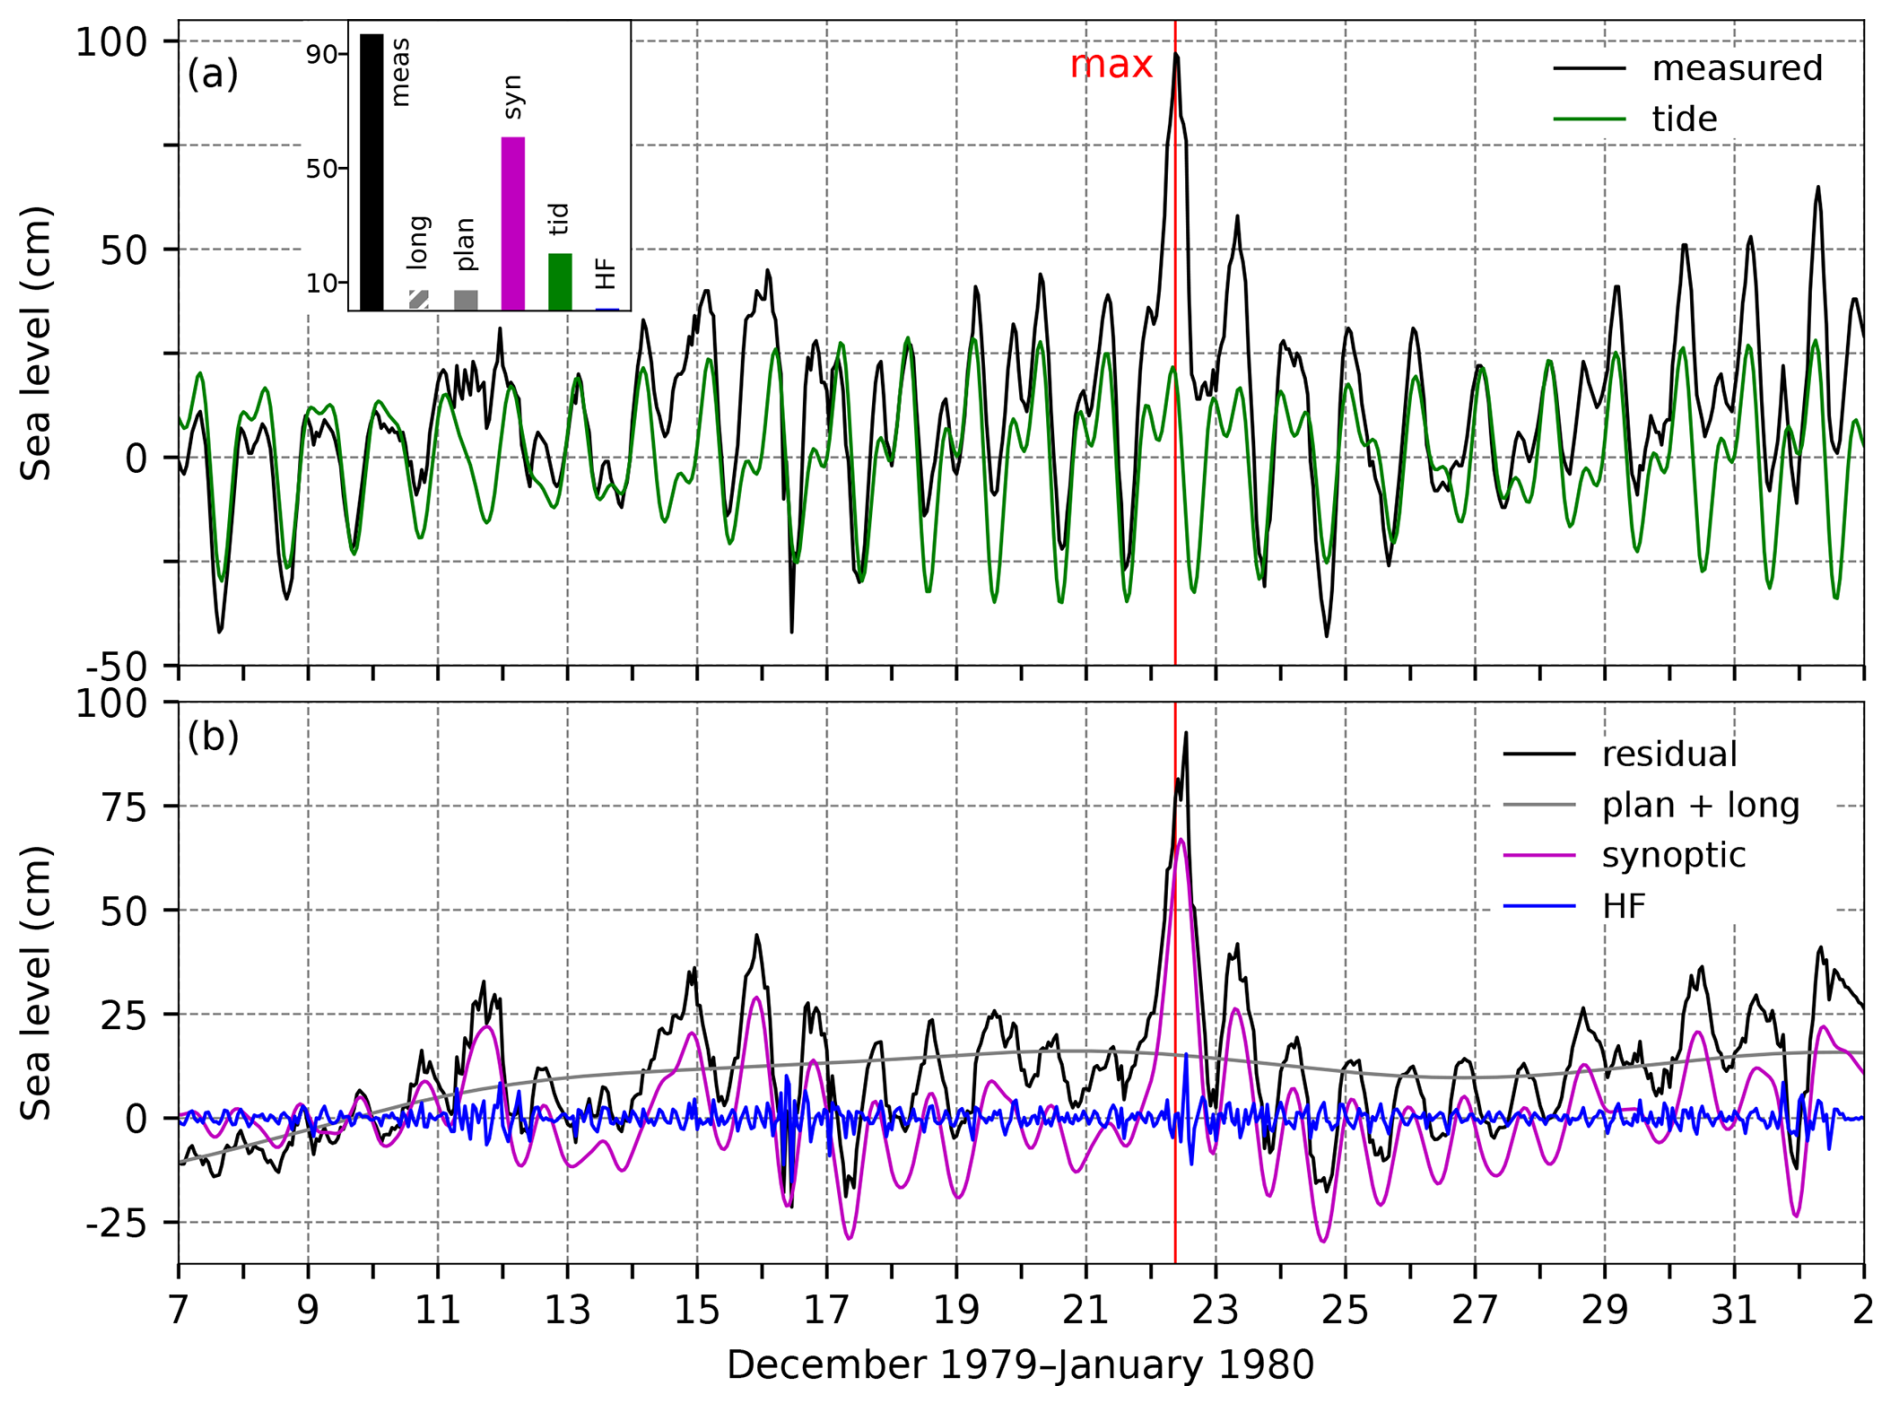
Figure 23SL series for the flood of 22 December 1979. Panel (a) shows the measured sea level (black) and tide (green). The inset figure shows the contributions (cm) of the five sea-level components to the maximum measured sea level (“meas”; 09:00 UTC): “HF” refers to high-frequency oscillations (2 h < T < 9 h), “syn” to synoptic component (9 h < T < 10 d), “tid” to tide, “plan” to planetary-scale variability (10 d < T < 100 d), and “long” to long-term sea-level variability (100 d < T). Panel (b) presents the residual sea level (black), the combined series of planetary-scale variability and long-term sea-level variability (grey; plan + long), synoptic component (purple), and high-frequency oscillations (blue). The red line indicates the time of occurrence of the total SL maximum.
4.7.2 Sea-level evolution
In the morning hours of 22 December 1979, at 09:00 UTC, the sea level in Bakar rose to 97 cm above the long-term average (Table 2, Fig. 23). The moon was between the new moon and the first quarter, producing a semidiurnal spring tide. The sea-level peak occurred shortly after the daily tidal maximum, which contributed 20 cm (Fig. 23).
High-frequency oscillations were active during this episode, but the overall maximum occurred before their peak; therefore, their contribution was minimal (1 cm).
Several pronounced disturbances crossed the Adriatic in the weeks preceding the flood (Fig. 21a), causing basin-wide seiches visible in synoptic component as ∼ 21.2 h oscillations (Fig. 23b). These oscillations largely dissipated before the decisive cyclone affected the Adriatic. As a result, synoptic component was mainly a forced response to synoptic conditions, primarily a storm surge. The storm surge began to develop on 21 December when a very strong sirocco started accumulating water at the closed end of the basin. Notably, the origin and trajectory of the cyclone (which was atypical for Adriatic storm surges) induced southeasterly winds with higher velocities near the western coast. This likely caused a stronger SL response along the western coastline, where the basin is shallower (Fig. 1), compared to the eastern side, where depths are greater. To confirm this hypothesis, a numerical experiment would be needed. Indicatively, this flood ranked third at TG Venice Punta Salute station (1936–2019; Venice Municipality; Canestrelli et al., 2001), whereas in Bakar, for the same period, it ranked sixth (Table 2). The induced storm surge was extraordinary, peaking at 67 cm just 2 h after the overall maximum and contributing 61 cm to the overall sea-level maximum. This was one of the strongest synoptic components among the extracted flood events, attributed to the MSLP gradient over the Adriatic and extreme sirocco, which persisted for over 1 d (Fig. 21b).
Preconditioning for this flood, indicated by planetary-scale component, was weak (Fig. 23a) and contributed only 7 cm. This was due to a stable MSLP (lp), which, in fact, had been slightly rising in the 10 d preceding the flood (Fig. 21a). For the same time interval, wind at these temporal scales blew from the southwest, reaching a maximum speed of 4.5 m s−1. A comparison of Z500 (lp), MSLP (lp), and plan + long series suggests that they did not vary coherently, indicating that planetary-scale variability was not dominated by planetary atmospheric waves.
Long-term sea-level component (100 d < T) contributed 8 cm to the overall maximum (Figs. 73 and A1). The episode occurred after the annual SL peak, which was not pronounced that year (Figs. 73d and A1). Intra-annual variability – including the mean seasonal cycle and its anomalies – contributed 5.2 cm (Fig. 73d), interannual variability added 0.5 cm (Fig. 73c), and mean sea-level change contributed 2.3 cm (Fig. 73b).
In summary, this flood resulted from an exceptionally high storm surge superimposed on smaller positive contributions from other processes.
4.7.3 Flood impacts
The effects of the flooding are outlined using reports from various daily newspapers (Novi list, 24–26 December 1979, Novi list, 1979a, b, c; Slobodna Dalmacija, 24–25 December 1979, Slobodna Dalmacija, 1979a, b; and Večernji list, 24 December 1979). Coastal regions along the Croatian side of the Adriatic experienced severe sirocco wind and flooding due to storm surge. The impact of the event was especially severe in the northern Adriatic, where (i) the western coast of Istria and the islands of Kvarner (Fig. 1) experienced flooding on the streets and coastal properties, along with damage to boats, cars, shores, and piers; (ii) water overflowed from lower-lying structures through sewer openings; (iii) the staff and their families had to be evacuated from two lighthouses due to water intrusion; (iv) a breakwater wall was demolished on one of the islands; and (v) numerous ferry lines were suspended. In the middle Adriatic, (i) ferry lines were disrupted; (ii) inland, many villages were left without electricity as the severe sirocco toppled utility poles and live transmission lines, with the damaged transmission line causing a minor wildfire; and (iii) in a coastal town, powerful waves lifted hundreds of cubic metres of seabed stones onto the shore and shifted massive stone blocks, some weighing up to 2 t, from the breakwater.
4.8 The flood of 25 October 1980 (ID 10; rank 9)
This episode has not yet been studied in the scientific literature.
4.8.1 Meteorological background
Two major cyclones impacted the Adriatic prior to the main SL maximum in Bakar (Fig. 24). On 24 October, i.e. at a day before the extreme SL in Bakar, the Z500 distribution indicated the descent of an upper-level trough from northern Europe, extending southwards up to the Mediterranean, where an upper-level cyclone formed. During this period, a warm and humid air mass, transported by an upper-level southwesterly flow, was situated over the Adriatic Sea. At the surface, a cyclone developed over the Gulf of Genoa (Fig. 25a). On 25 October, this cyclone deepened rapidly as it moved southeast, bringing light precipitation to the northern Adriatic (up to 15 mm). The development and intensification of the cyclone reinforced air-pressure gradients, leading to stronger southerly and southeasterly winds over the eastern Adriatic Sea (Fig. 25b). During the night and morning of 25 October, a strong sirocco wind affected the northern and middle Adriatic (Fig. 24b). Just before the sea level peaked in Bakar, wind speeds reached their maximum at 09:00 UTC (Fig. 25b). By the end of the day, the cyclone had moved southeast towards Italy, with a moderate northeasterly wind over the northern Adriatic, while southeasterly winds weakened over the rest of the Adriatic (Fig. 24b).
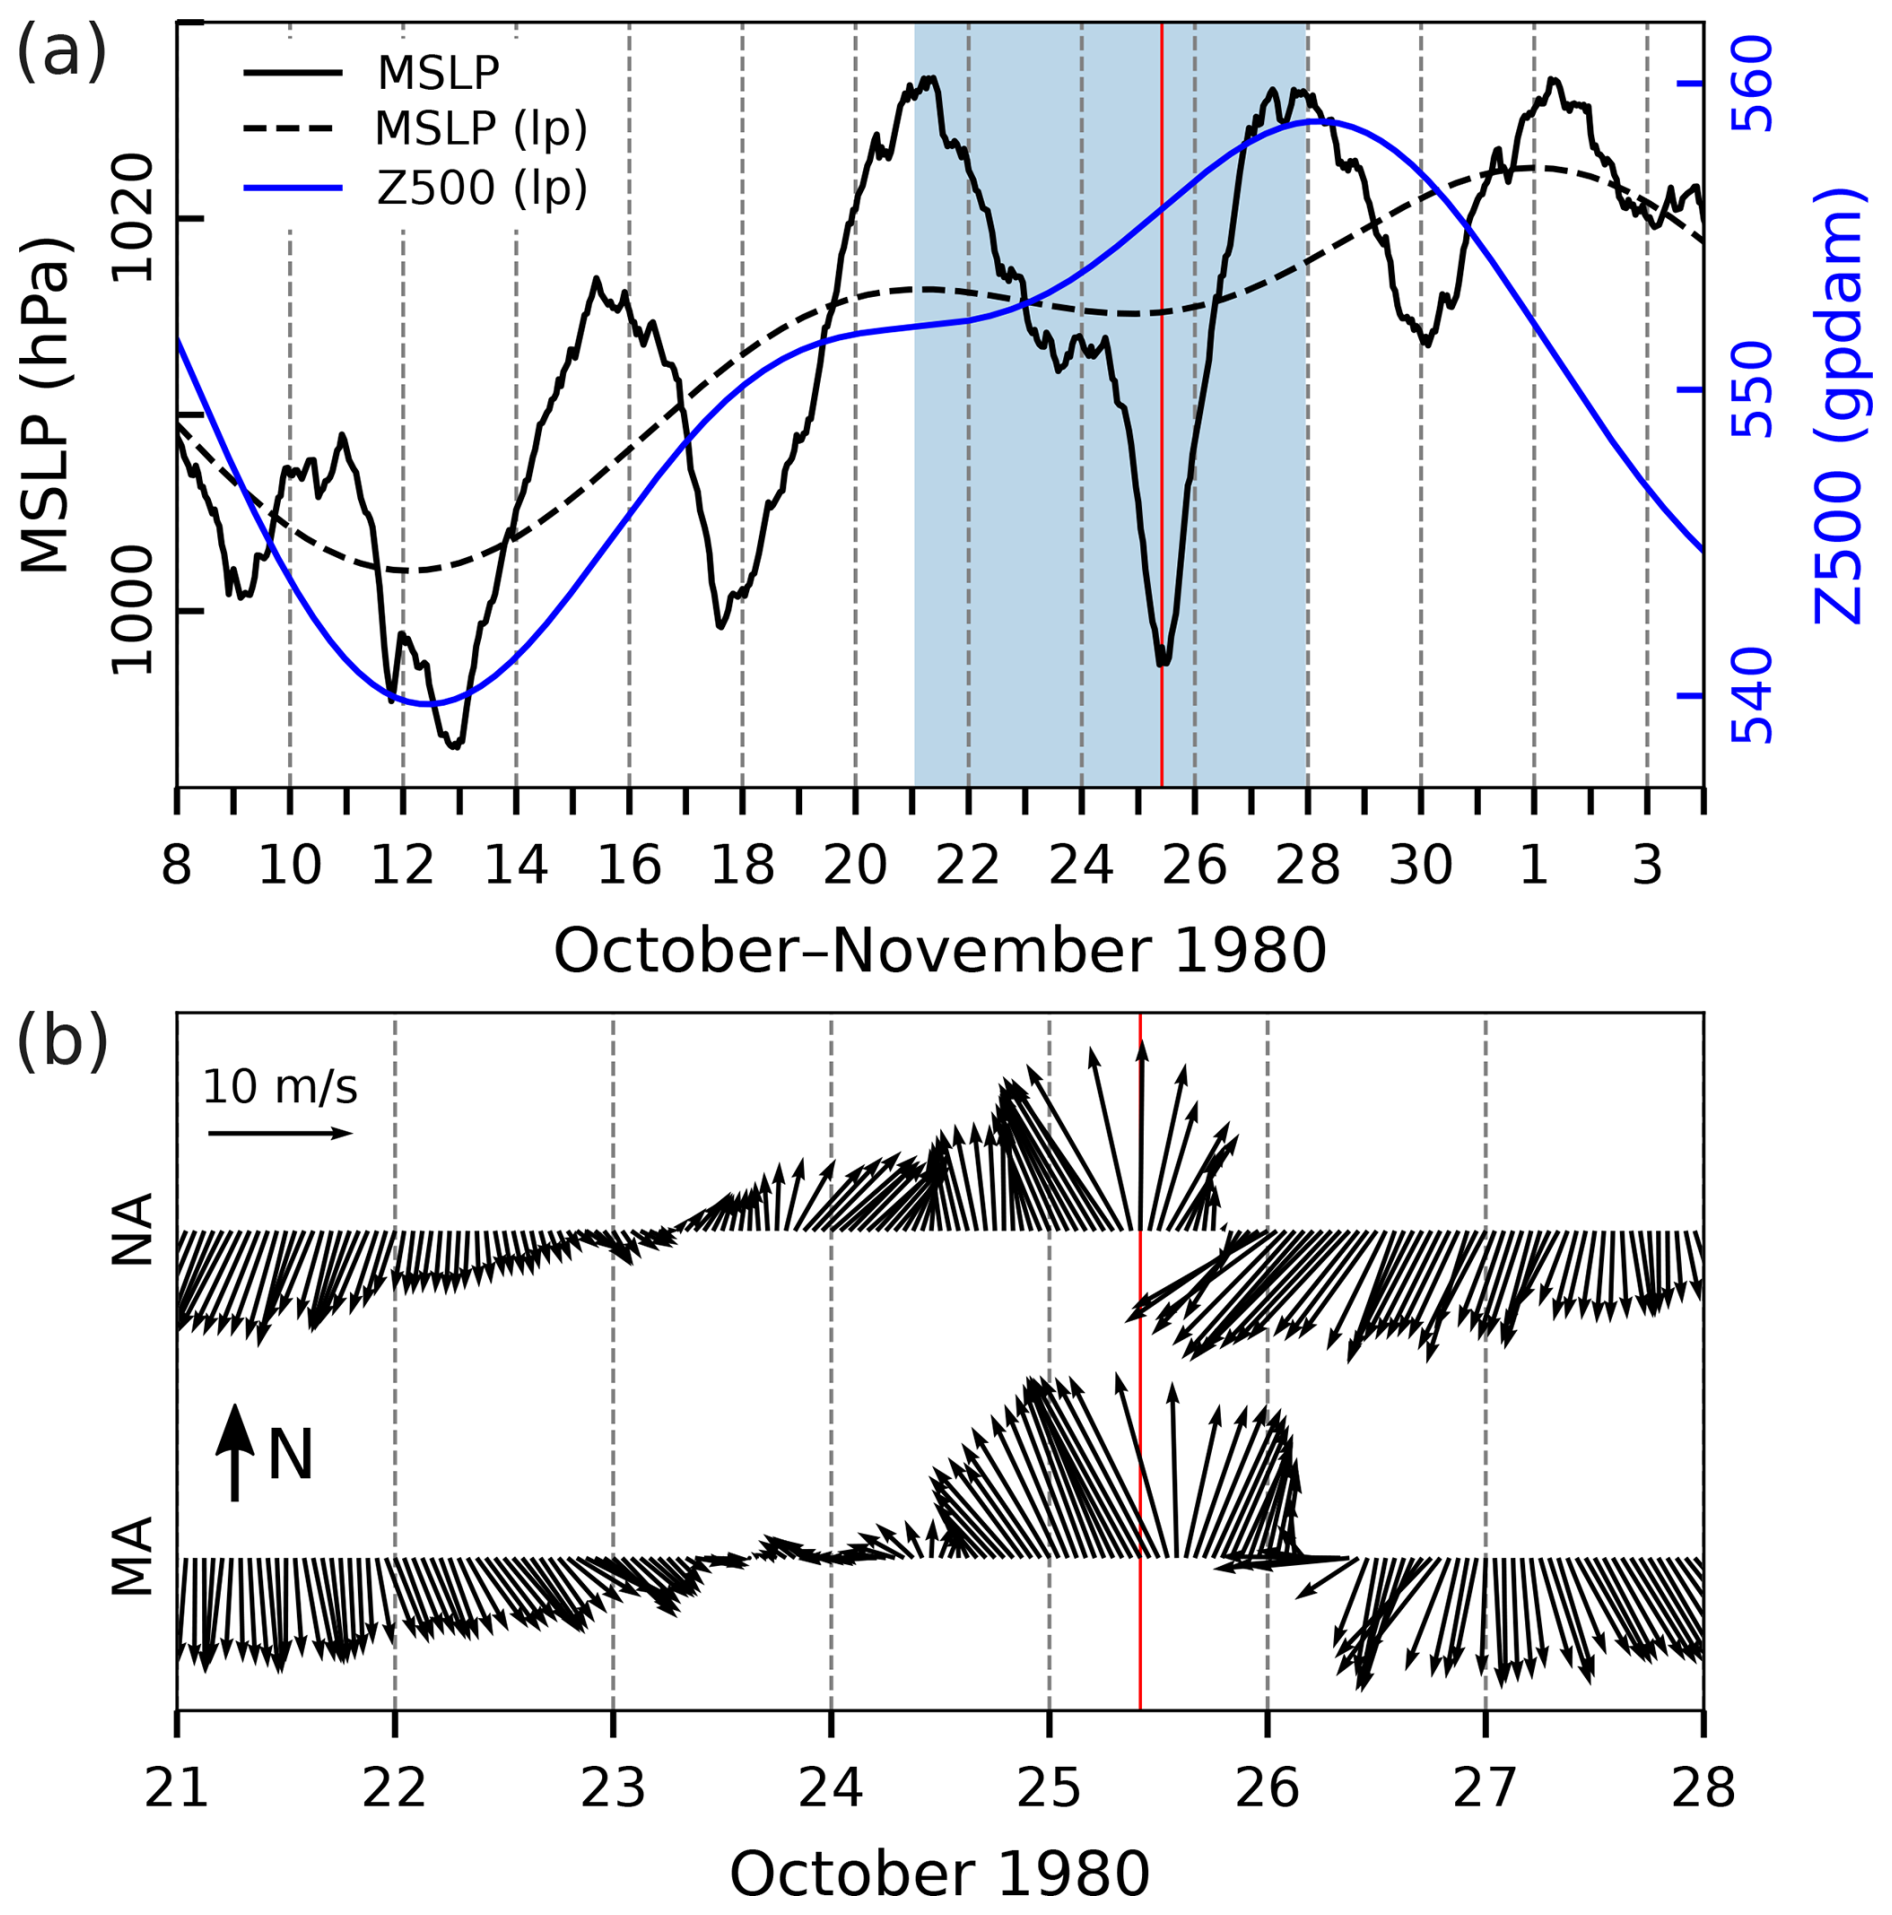
Figure 24Series of ERA5 reanalysis data related to the flood of 25 October 1980. (a) MSLP (hourly) and MSLP (lp) (low-pass filtered with a cut-off frequency of 10 d) and Z500 (lp) (low-pass filtered with a cut-off frequency of 10 d) at a grid point near TG Bakar. (b) Hourly W10 during the period marked in blue in the upper plot for the middle Adriatic (MA) and northern Adriatic (NA) (all locations marked in Fig. 1). The red line indicates the onset of the SL maximum.
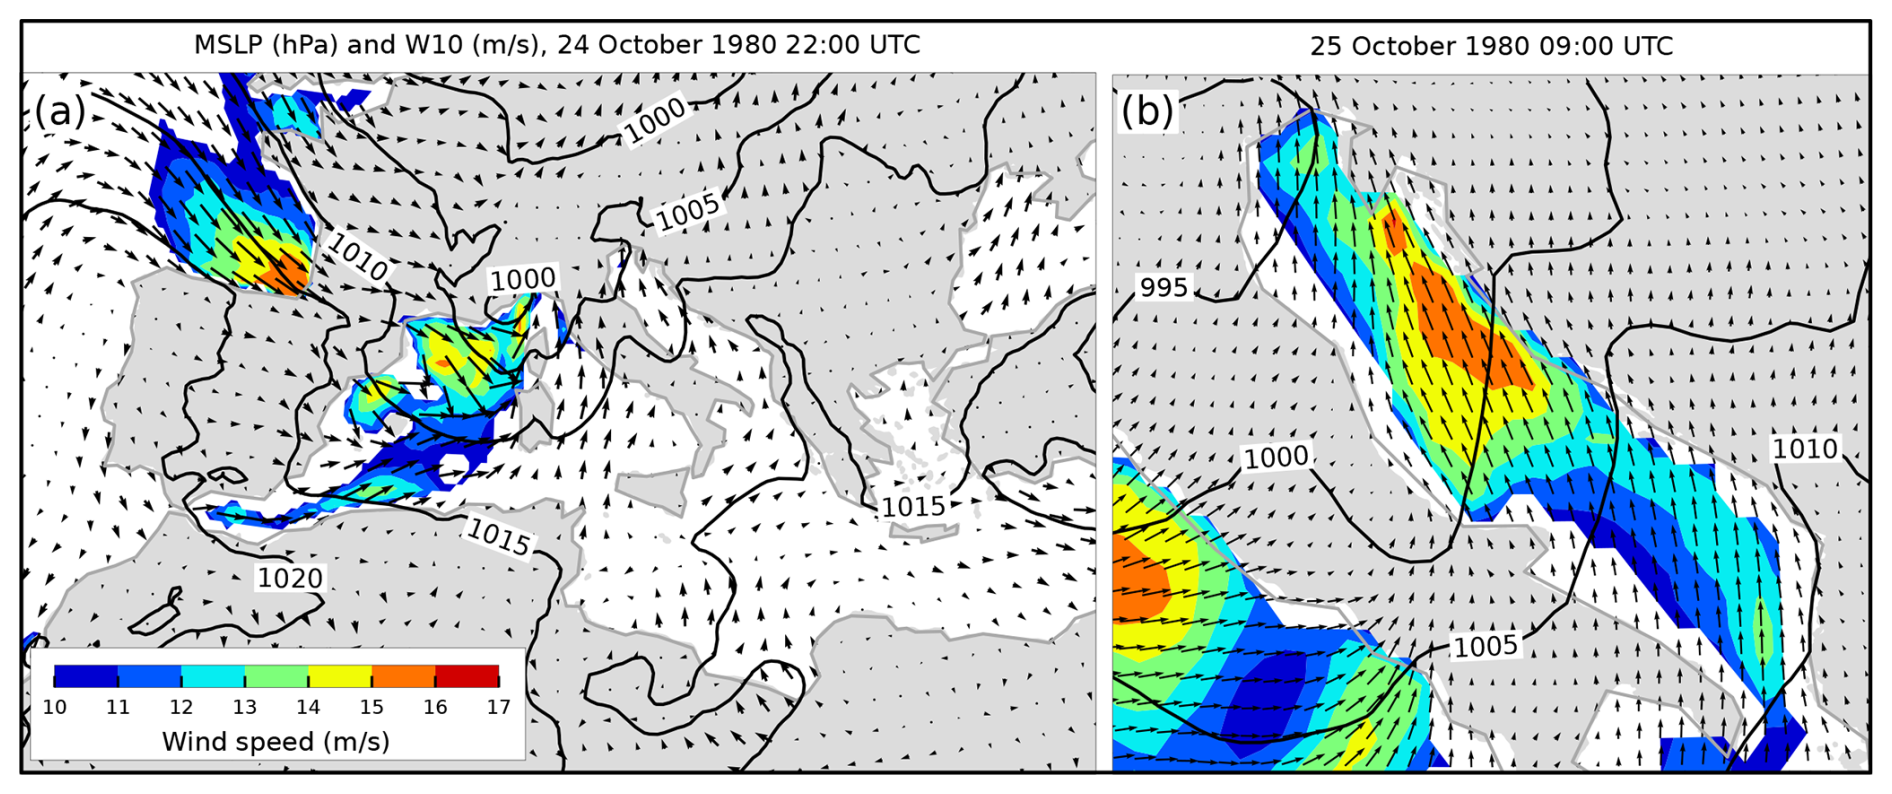
Figure 25MSLP (black lines) and W10 (arrows and colours) fields from the ERA5 reanalysis. Conditions (a) over the Mediterranean that preceded the situation (b) over the Adriatic Sea (an hour before maximum SL in Bakar). Only wind speeds exceeding 10 m s−1 are coloured.
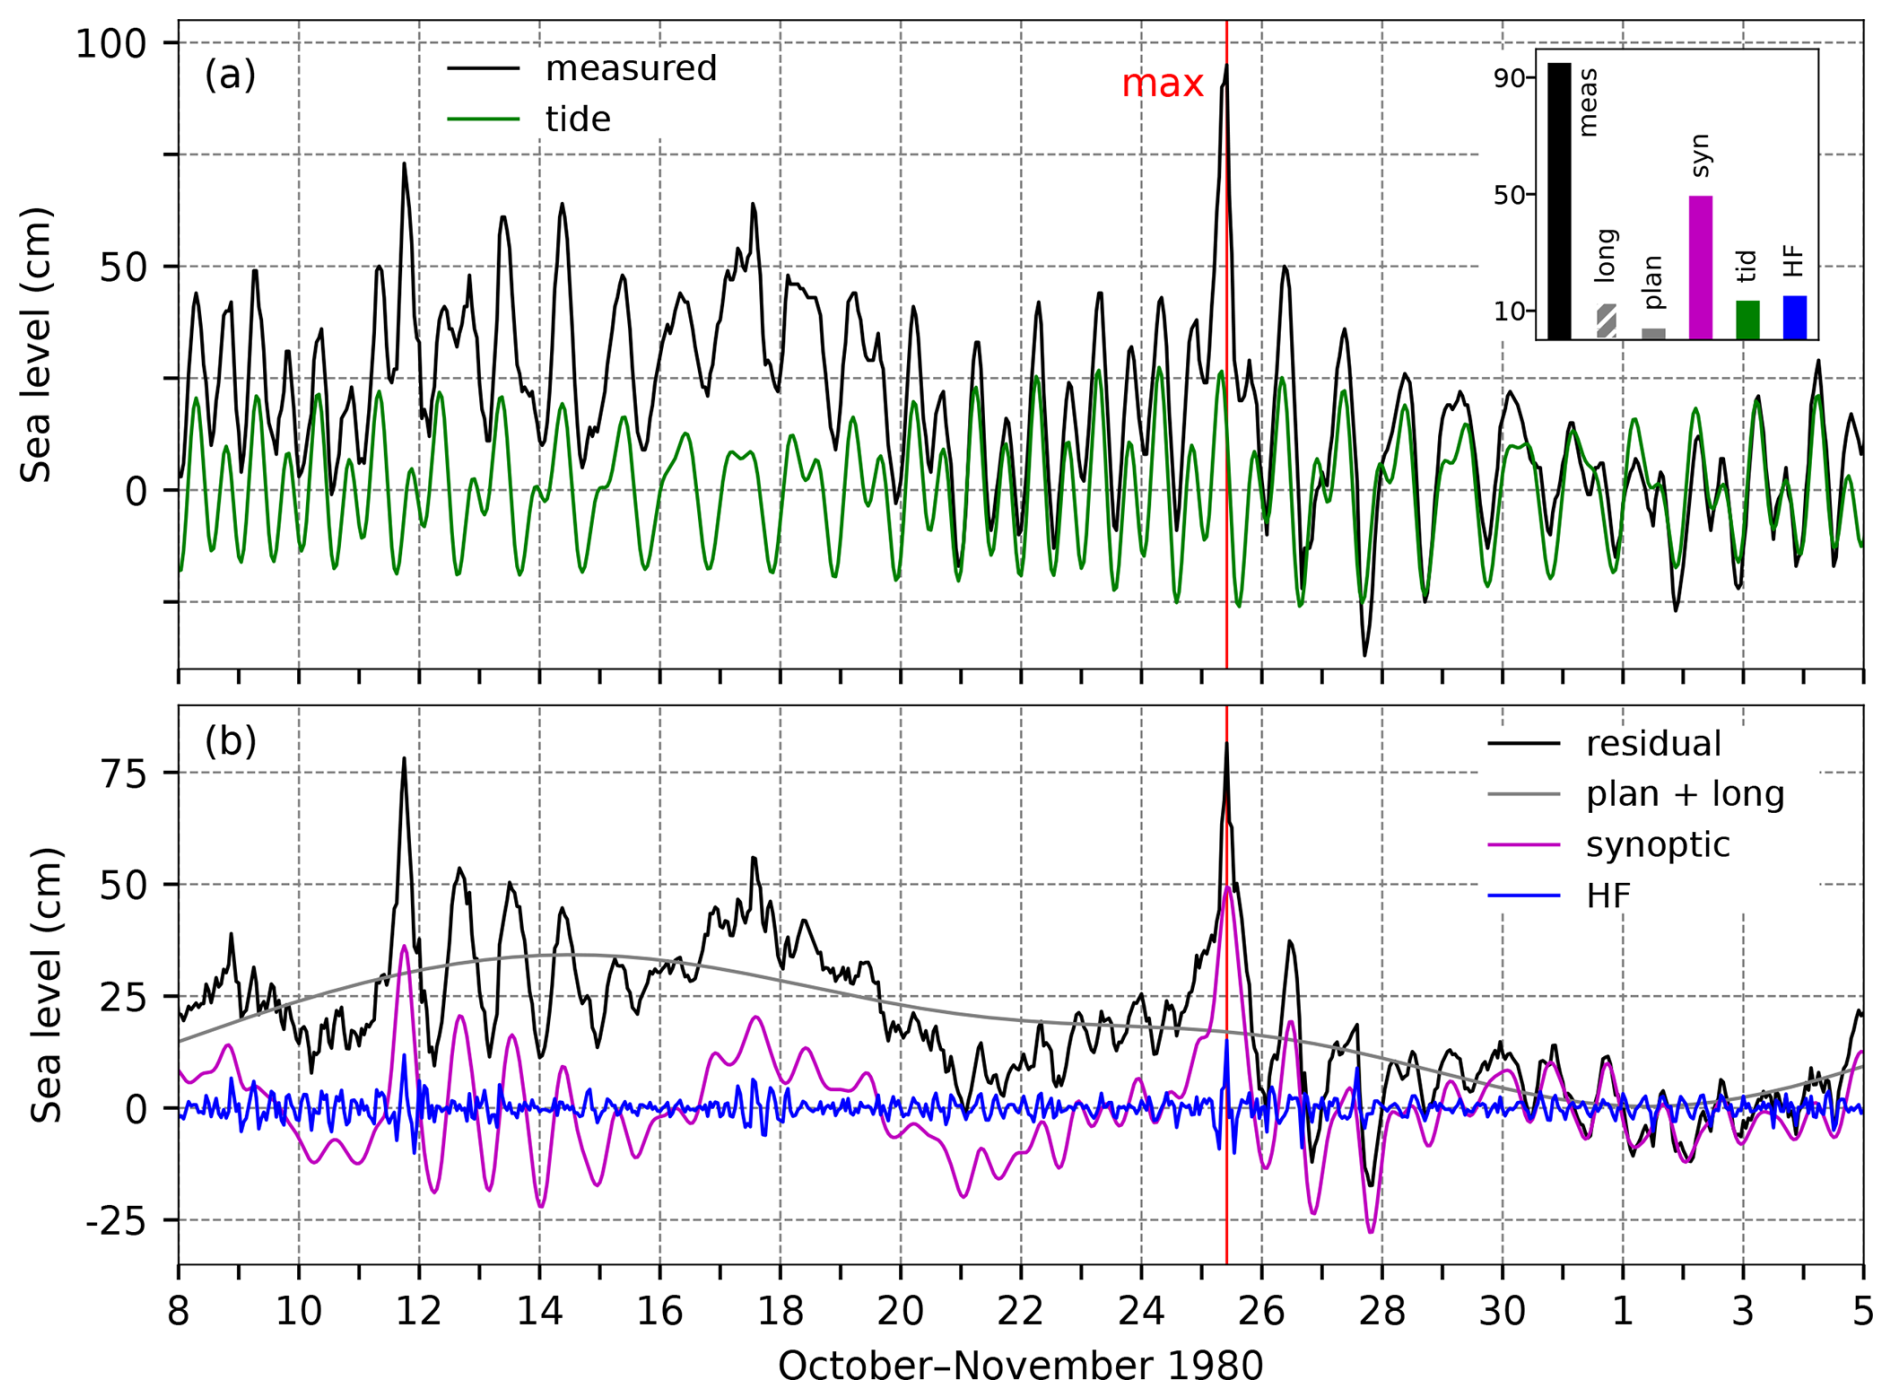
Figure 26SL series for the flood of 25 October 1980. Panel (a) shows the measured sea level (black) and tide (green). The inset figure shows the contributions (cm) of the five sea-level components to the maximum measured sea level (“meas”; 10:00 UTC): “HF” refers to high-frequency oscillations (2 h < T < 9 h), “syn” to synoptic component (9 h < T < 10 d), “tid” to tide, “plan” to planetary-scale variability (10 d < T < 100 d), and “long” to long-term sea-level variability (100 d < T). Panel (b) presents the residual sea level (black), the combined series of planetary-scale variability and long-term sea-level variability (grey; plan + long), synoptic component (purple), and high-frequency oscillations (blue). The red line indicates the time of occurrence of the total SL maximum.
4.8.2 Sea-level evolution
On 25 October 1980 (10:00 UTC), the sea level in Bakar rose to 95 cm above the long-term average (Table 2, Fig. 26).
The lunar phase was 2 d after the full moon, giving tide a semidiurnal spring-tide character. The overall maximum occurred after the daily tidal maximum, and tide contributed 13 cm.
High-frequency oscillations were triggered shortly before the total maximum, peaking simultaneously with it. Their contribution was significant, amounting to 16 cm.
Before the decisive cyclone passed over the Adriatic on 25 October (Fig. 24a), two earlier disturbances (on 11–12 and 17 October) raised the water level in the northern Adriatic (Fig. 26b), triggering ∼ 21.2 h oscillations, especially pronounced during the first event. These basin-wide seiches dissipated before the main SL peak on 25 October. Consequently, synoptic component during this episode was not influenced by pre-existing seiches and was mainly driven by a storm surge. The SL maximum coincided with the storm-surge peak, which reached a height of 49 cm.
Planetary-scale component contributed 4 cm to the overall SL maximum (Fig. 26a, histogram). The preconditioning was weak, explained by mild atmospheric forcing on a planetary scale. In the weeks preceding the flood, the MSLP (lp) over Bakar rose (Fig. 24a), while wind speeds over periods of 10 d < T < 100 d (not shown) were low (maximum speeds of 4 m s−1). Additionally, starting a week before the flood, winds in the northern Adriatic shifted to easterly and northeasterly directions.
Long-term sea-level variability (100 d < T) contributed 13 cm to the maximum SL (Figs. 73 and A1). This episode occurred shortly before the annual SL peak, which was not particularly pronounced that year. The main contribution came from intra-annual variability, including the mean seasonal cycle and its anomalies, which accounted for 10.6 cm (Fig. 73d). Interannual variability was weak, adding only 0.4 cm (Fig. 73c), while mean sea-level change was in a positive phase, contributing 2 cm (Fig. 73b).
This episode resulted from a constructive superposition of all contributing processes, with the greatest influence coming from the storm surge (Fig. 26). High-frequency oscillations, tide, and long-term sea-level variability had similar effects, contributing from 13 to 16 cm, and planetary-scale variability had the smallest impact.
4.8.3 Flood impacts
A review of the available daily newspapers from 27 October 1980 (Slobodna Dalmacija, Novi list, and Večernji list) revealed the following impacts of the event. In the northern Adriatic, especially in Kvarner (Fig. 1), strong sirocco wind, combined with a storm surge led to (i) suspension of numerous ferry services in Kvarner, (ii) flooding events in Rijeka (Fig. 1) and other towns along the Kvarner coast, (iii) a collision between a ferry and a smaller ship, and (iv) traffic obstructions and traffic accidents due to heavy precipitation. Near Rovinj (Fig. 1), a 13 m yacht had set sail just a few hours earlier when extreme weather conditions and high waves made sailing impossible. The crew, who were forced to abandon ship, fortunately survived. Similar weather conditions prevailed in the northern parts of the middle Adriatic, where at least one local ferry line was suspended, and flooding events were reported.
4.9 The flood of 1 February 1986 (ID 11; rank 9)
This episode, including its meteorological background and SL components contributing to the maximum SL formation, is briefly described in Lionello et al. (2021). Moreover, Canestrelli et al. (2001) empirically analysed the flood, taking into account synoptic charts, SL data from TG Venice Punta Salute, and W10 and MSLP measurements from multiple coastal stations.
4.9.1 Meteorological background
On 29 January, a southeasterly wind began to blow over the Adriatic (Fig. 27) due to a large cyclone centred over the Bay of Biscay, accompanied by a closed circulation of low pressure in the upper levels. Within this system, a secondary cyclone developed in the western Mediterranean on 30 January, where the central air pressure dropped to less than 975 hPa (Fig. 28a). As this cyclone moved towards the Gulf of Lion, the southeast wind over the Adriatic strengthened, turning to an easterly wind in some areas of the northern Adriatic. As the cyclone advanced towards the Gulf of Genoa, the wind over the Adriatic intensified to strong and gale on 31 January (Figs. 27b and 28b). On 1 February, the cyclone advanced further northwards, resulting in gradual weakening of the wind and its shifting to a southwesterly direction. On the day of the flood, precipitation along the coastline was mostly up to 30 mm, with higher amounts locally (55 mm on the northern Adriatic island of Olib and 35 mm on the middle Adriatic island of Hvar). The following day, precipitation decreased to up to 20 mm along the coastline.
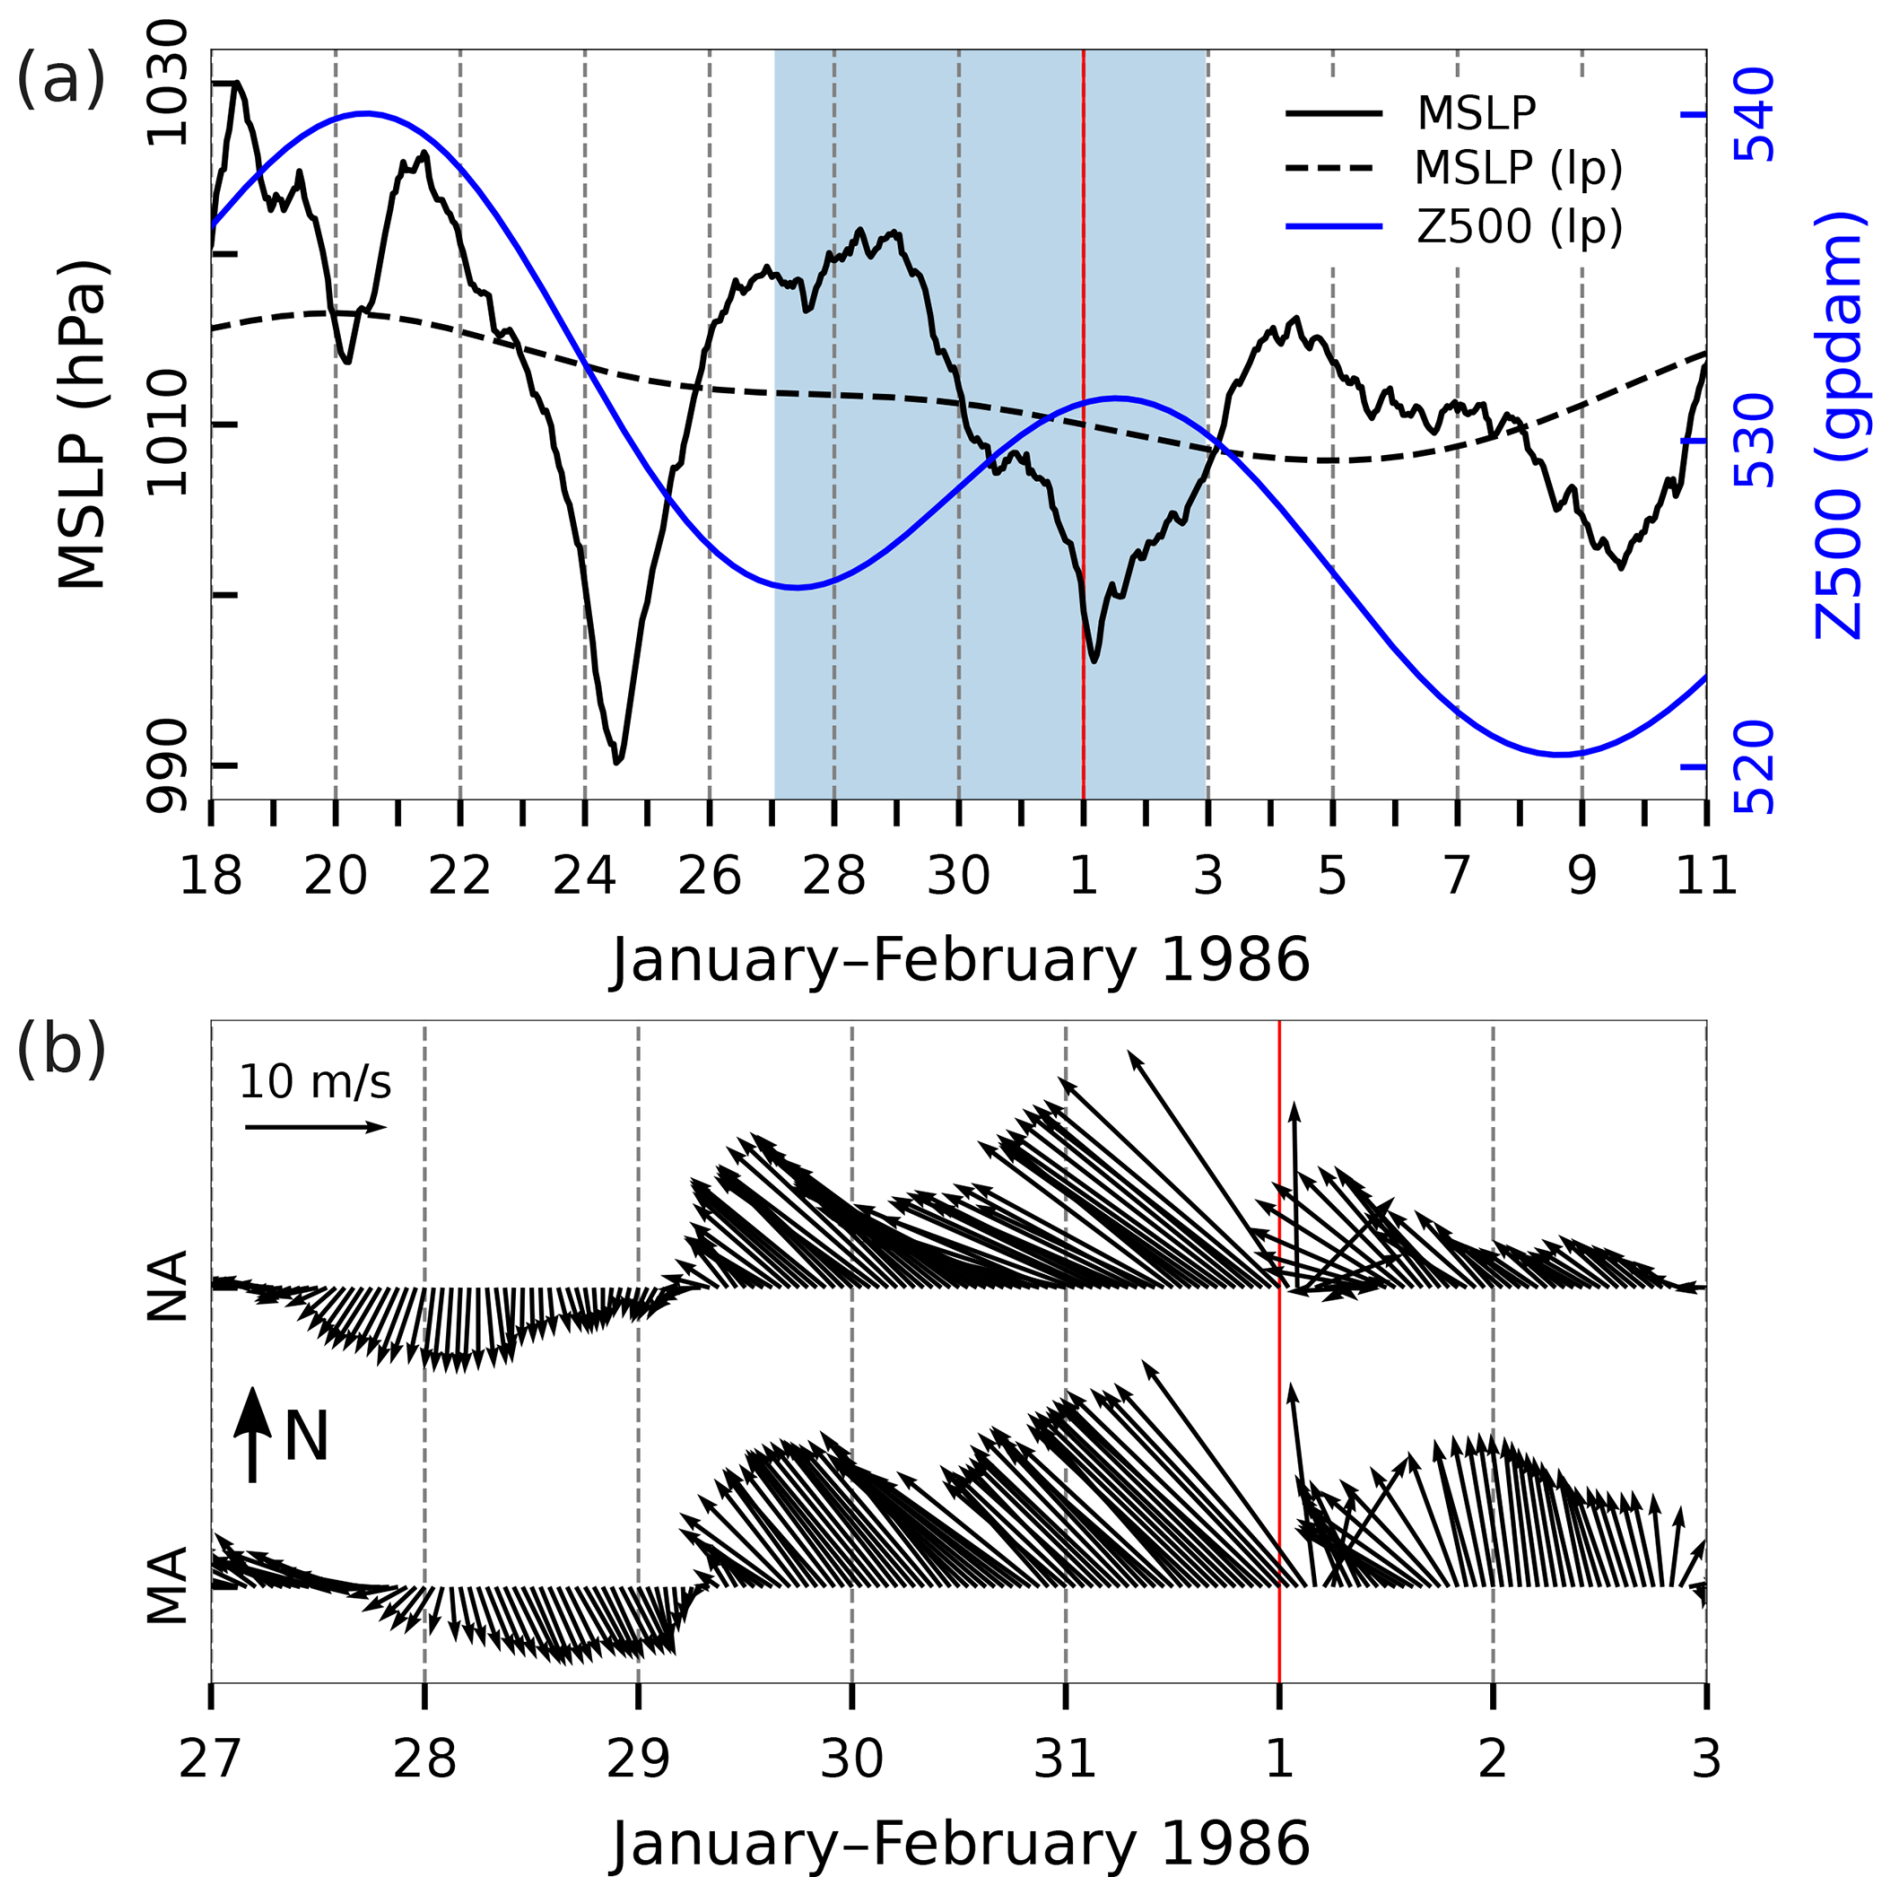
Figure 27Series of ERA5 reanalysis data related to the flood of 1 February 1986. (a) MSLP (hourly) and MSLP (lp) (low-pass filtered with a cut-off frequency of 10 d) and Z500 (lp) (low-pass filtered with a cut-off frequency of 10 d) at a grid point near TG Bakar. (b) Hourly W10 during the period marked in blue in the upper plot for the middle Adriatic (MA) and northern Adriatic (NA) (all locations marked in Fig. 1). The red line indicates the onset of the SL maximum.
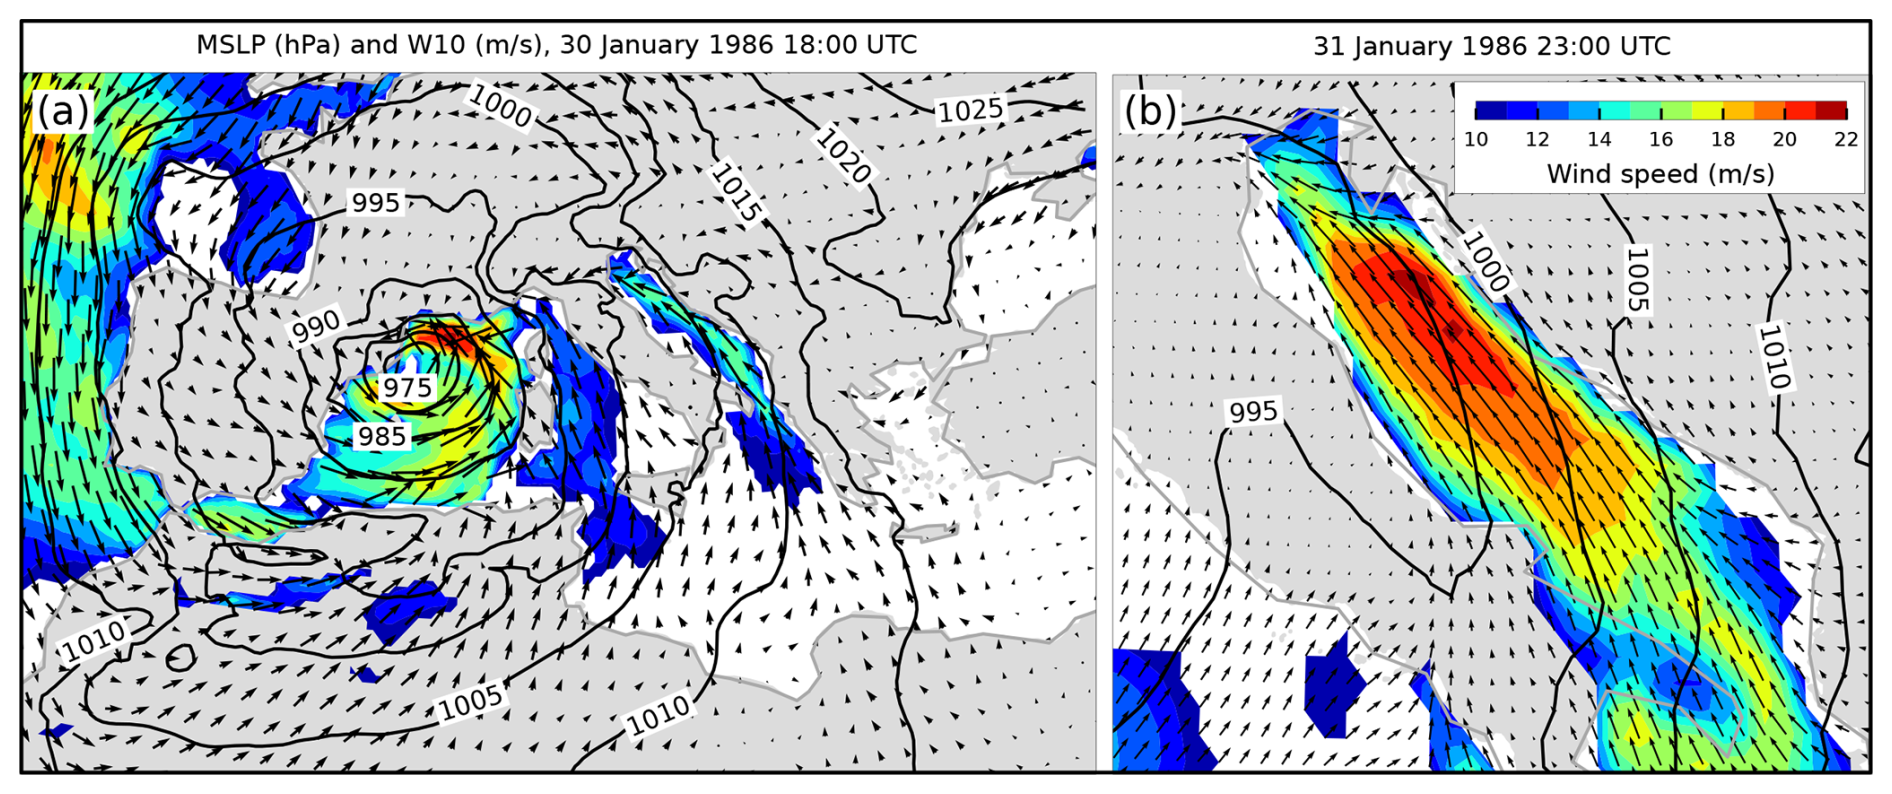
Figure 28MSLP (black lines) and W10 (arrows and colours) fields from the ERA5 reanalysis. Conditions (a) over the Mediterranean that preceded the situation (b) over the Adriatic Sea (an hour before maximum SL in Bakar). Only wind speeds exceeding 10 m s−1 are coloured. One colour bar is used for both maps.
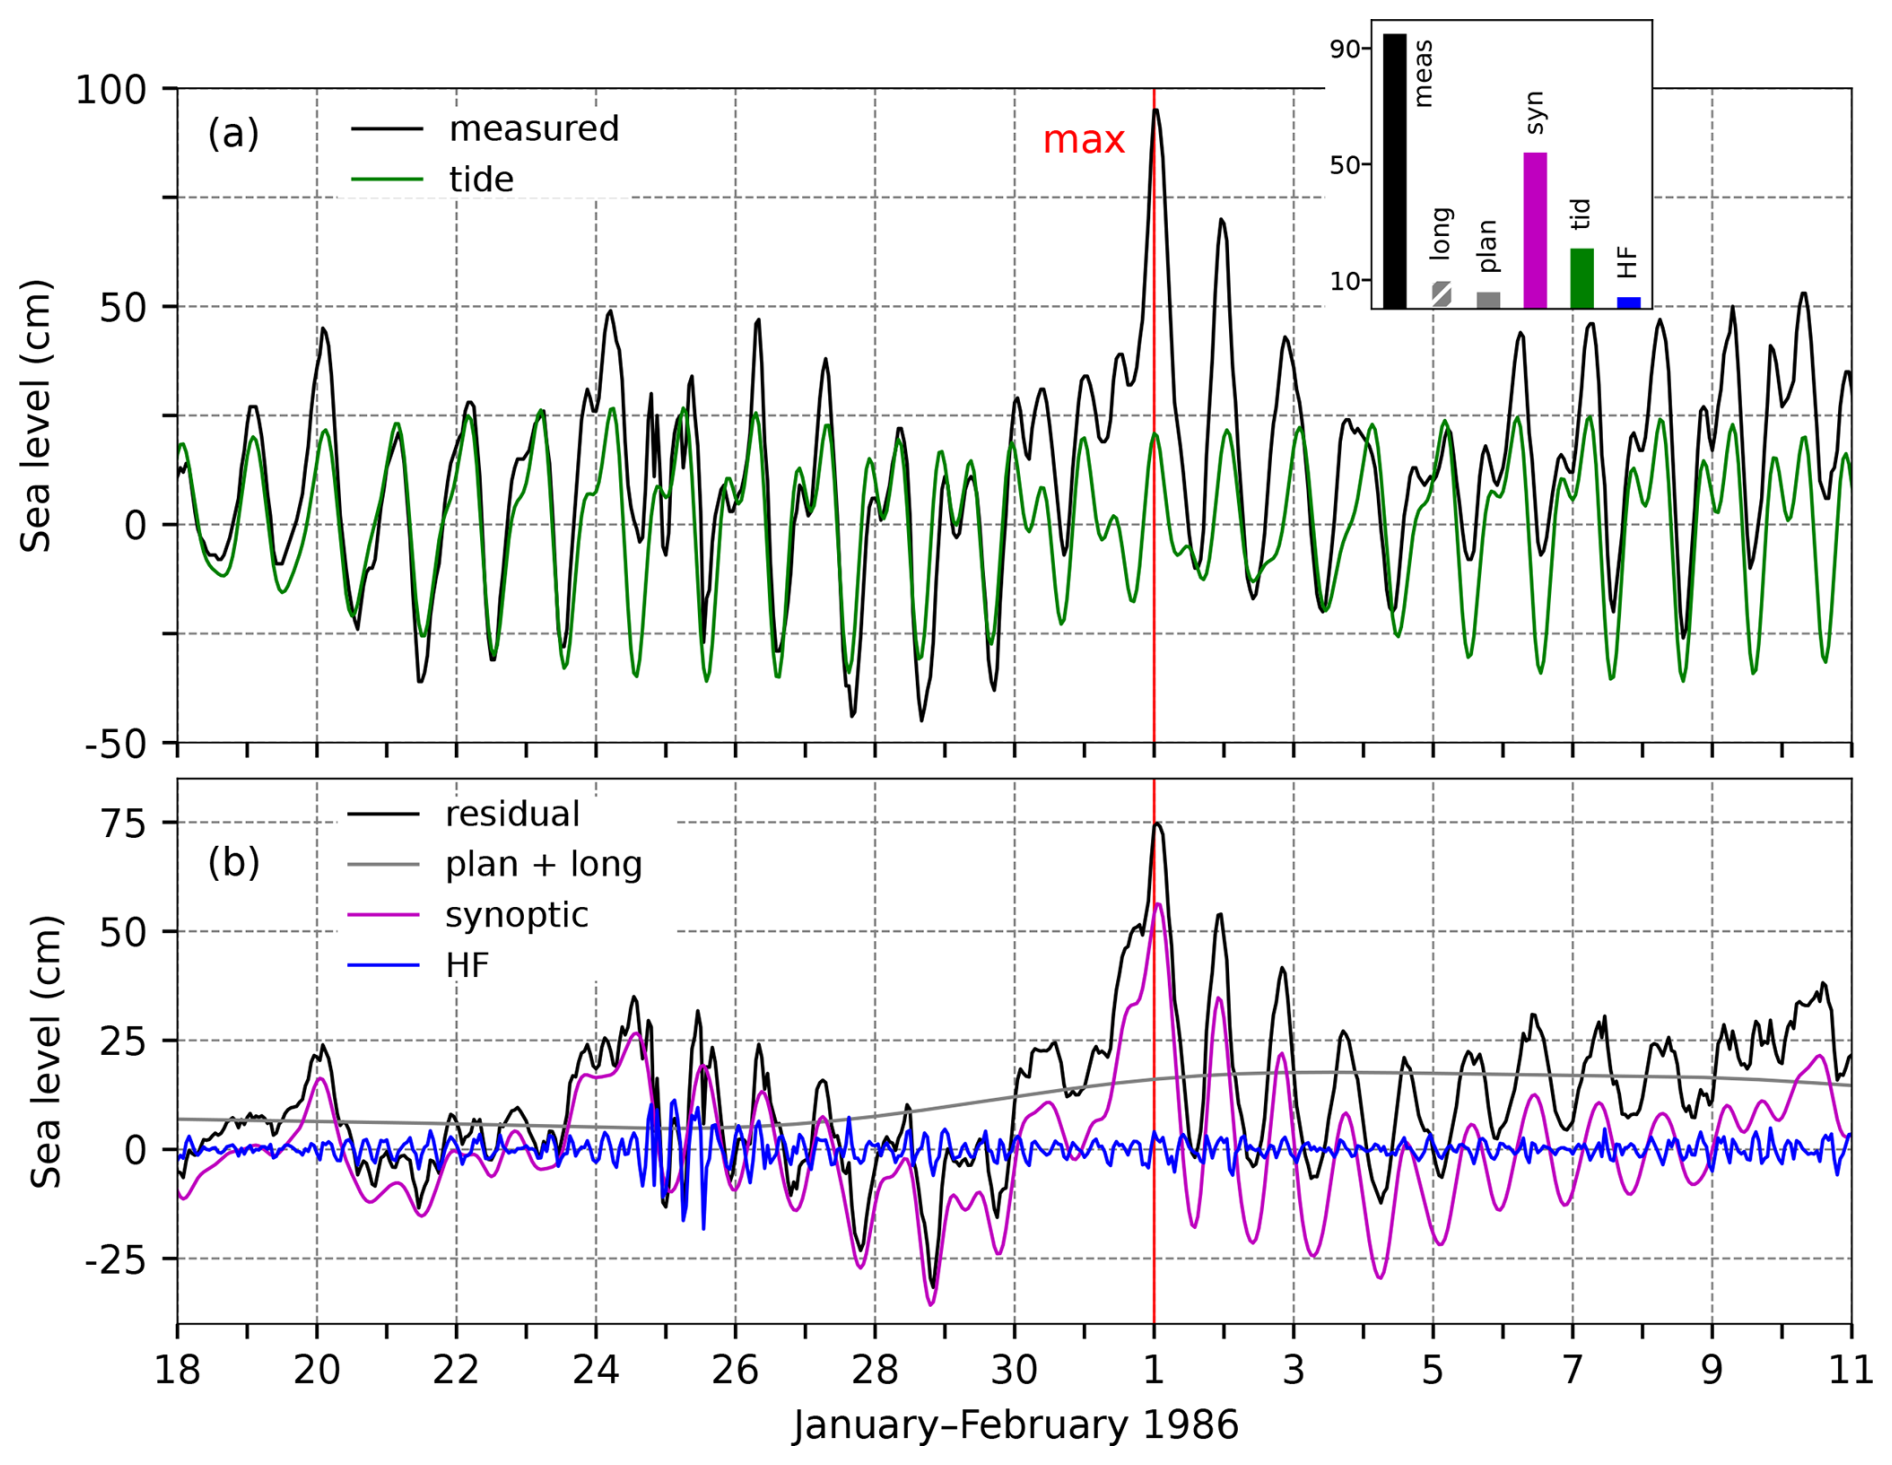
Figure 29SL series for the flood of 1 February 1986. Panel (a) shows the measured sea level (black) and tide (green). The inset figure shows the contributions (cm) of the five sea-level components to the maximum measured sea level (“meas”; 00:00 UTC): “HF” refers to high-frequency oscillations (2 h < T < 9 h), “syn” to synoptic component (9 h < T < 10 d), “tid” to tide, “plan” to planetary-scale variability (10 d < T < 100 d), and “long” to long-term sea-level variability (100 d < T). Panel (b) presents the residual sea level (black), the combined series of planetary-scale variability and long-term sea-level variability (grey; plan + long), synoptic component (purple), and high-frequency oscillations (blue). The red line indicates the time of occurrence of the total SL maximum.
4.9.2 Sea-level evolution
On 1 February 1986, at 00:00 UTC, the sea level in Bakar rose to 95 cm above the long-term average (Table 2, Fig. 29). The moon was a day before the last quarter, resulting in a diurnal neap tide. The sea-level peak coincided with the daily tidal maximum, contributing 21 cm to the total sea level (Fig. 29a).
High-frequency oscillations had minimal impact during this event, adding 4 cm.
Synoptic component was extraordinary, peaking at 56 cm just an hour after the overall maximum. On 24 January, a deep cyclone passed over the Adriatic (Fig. 27a), raising the sea level (Fig. 29b, residual) and initiating both basin-wide and local Kvarner Bay (T ∼ 6 h) seiches. By 1 February, however, these oscillations had dampened, so synoptic component primarily consisted of a storm surge. The storm surge began to develop on 29 January (Fig. 29b) as air pressure dropped and winds shifted from weak northerlies/northwesterlies to strong and gale southeasterlies (Fig. 27b), contributing 54 cm to the flood.
Preconditioning for this flood, indicated by planetary-scale variability, was weak, with a gradual sea-level rise beginning several days prior (Fig. 29b). During the flood, this component was only 6 cm high. Comparing Z500 (lp), MSLP (lp), and plan + long shows that these series did not change simultaneously, suggesting that planetary-scale component was not driven by atmospheric planetary waves.
Long-term sea-level component (100 d < T) contributed 10 cm to the maximum (Figs. 73 and A1), primarily due to intra-annual variability (7.7 cm; Fig. 73d) – including the mean seasonal cycle and its anomalies – as the event occurred shortly before the annual peak. The other two processes, interannual variability and mean sea-level change, had smaller impacts, contributing 1.2 and 1.1 cm, respectively (Fig. 73c and b).
In summary, the flood resulted from an exceptionally high storm surge superimposed on positive contributions from other processes.
4.9.3 Flood impacts
A review of the available daily newspapers from 3 February 1986 (Novi list and Slobodna Dalmacija) revealed the following effects of the episode. For the northern Adriatic area, the newspapers listed (i) sinking (or ripping from their moorings) of numerous boats in the harbours, (ii) breaking and bending of antennas on roofs, (iii) the sea washing away more than 200 crates from fishing boats, (iv) power outages, (v) the overflow of water from low-lying structures through sewer openings, (vi) disruptions to ferry traffic, and (vii) the flooding of properties. No flooding was reported in the middle and south Adriatic. However, in the middle Adriatic, some of the local ferry lines were suspended for up to 3 d due to strong sirocco, and local power outages occurred.
4.10 The flood of 24 November 1987 (ID 12; rank 14)
This episode was discussed in a doctoral thesis by Pasarić (2000) (in Croatian). She concluded that, in Bakar, the flood was less severe than it could have been due to a non-constructive interaction between tide and the storm surge. However, the episode was preconditioned by a gradual rise in SL, driven by the passage of atmospheric planetary waves during the week leading up to the flood.
4.10.1 Meteorological background
The conditions leading up to the flood began several days earlier, when a deep upper-level trough with its axis extending from northern Scandinavia to the African continent was visible in the field of Z500. Under these conditions, the entire Mediterranean was under the influence of upper-level southwesterly flow on the front side of the trough, supporting the advection of relatively warm and humid air. On 23 November, a deep upper-level cyclone formed over the western Mediterranean, resulting in the formation of a surface cyclone over Spain that then moved northeasterly over the European continent (Figs. 30a and 31a). As a result, air-pressure gradients intensified, and there was a strengthening of southerly and southeasterly flow over the Adriatic (Fig. 30b), which was more intense in the eastern part of the basin. Sirocco gradually intensified on 24 November (Fig. 31b) and reached severe levels along the entire Adriatic Sea. Additionally, large amounts of precipitation were recorded in the Adriatic coastal areas. In the middle Adriatic, precipitation reached up to 25 mm, while in the northern Adriatic, much higher amounts were recorded (58 mm at Pula Airport, 153 mm in Rijeka, and 63 mm on the island of Cres in the northern Adriatic). The wind speeds reached their maximum values at 21:00 UTC, just an hour before the extreme SL was recorded in Bakar. Afterward, the cyclone progressed in a northeasterly direction, causing the wind to gradually subside first in the northern region and later in the middle and southern parts of the Adriatic.
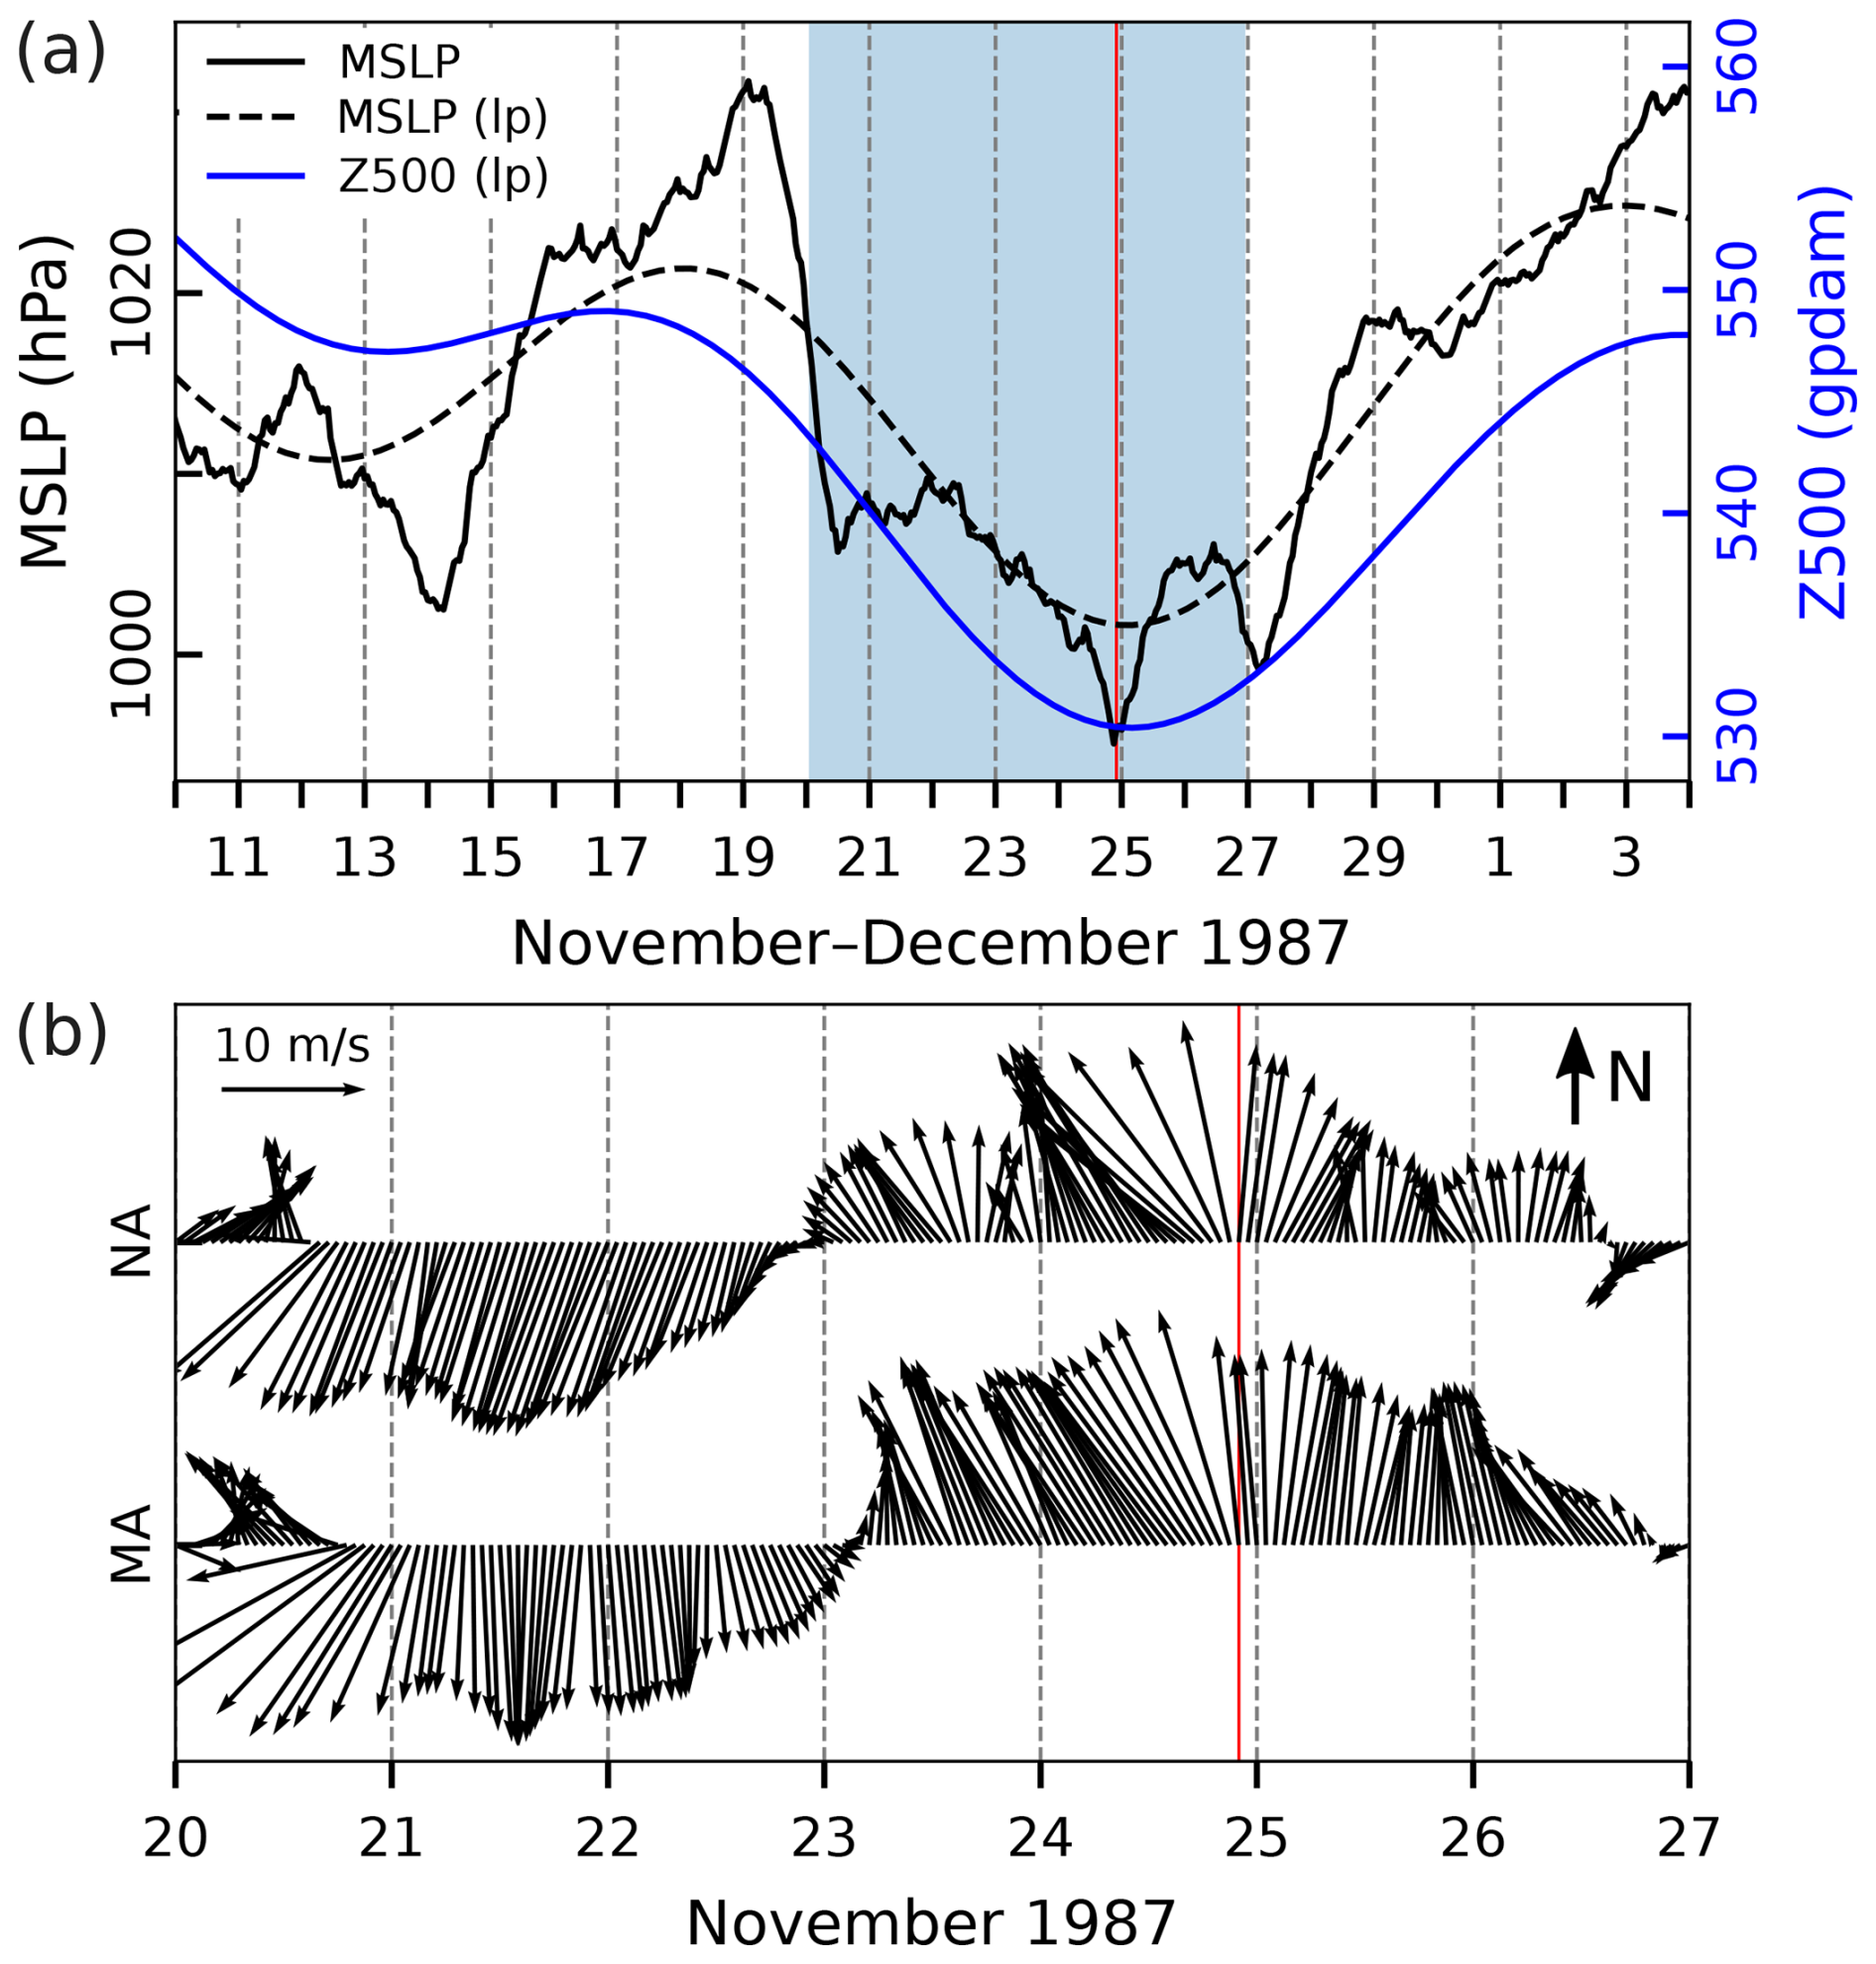
Figure 30Series of ERA5 reanalysis data related to the flood of 24 November 1987. (a) MSLP (hourly) and MSLP (lp) (low-pass filtered with a cut-off frequency of 10 d) and Z500 (lp) (low-pass filtered with a cut-off frequency of 10 d) at a grid point near TG Bakar. (b) Hourly W10 during the period marked in blue in the upper plot for the middle Adriatic (MA) and northern Adriatic (NA) (all locations marked in Fig. 1). The red line indicates the onset of the SL maximum.
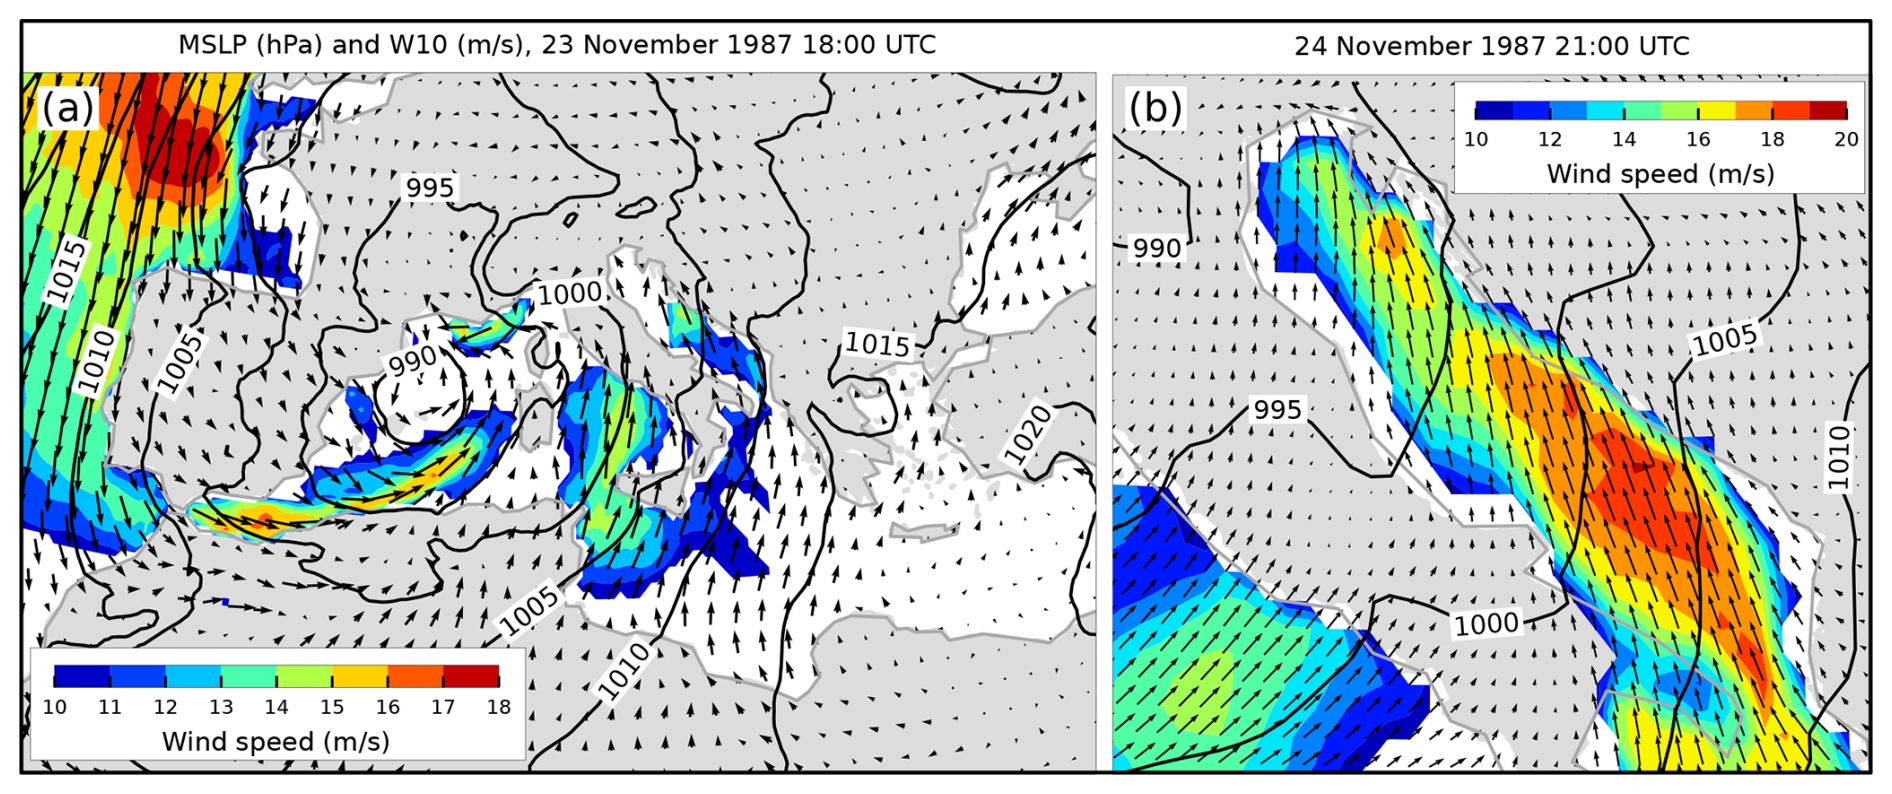
Figure 31MSLP (black lines) and W10 (arrows and colours) fields from the ERA5 reanalysis. Conditions (a) over the Mediterranean that preceded the situation (b) over the Adriatic Sea (an hour before maximum SL in Bakar). Only wind speeds exceeding 10 m s−1 are coloured.
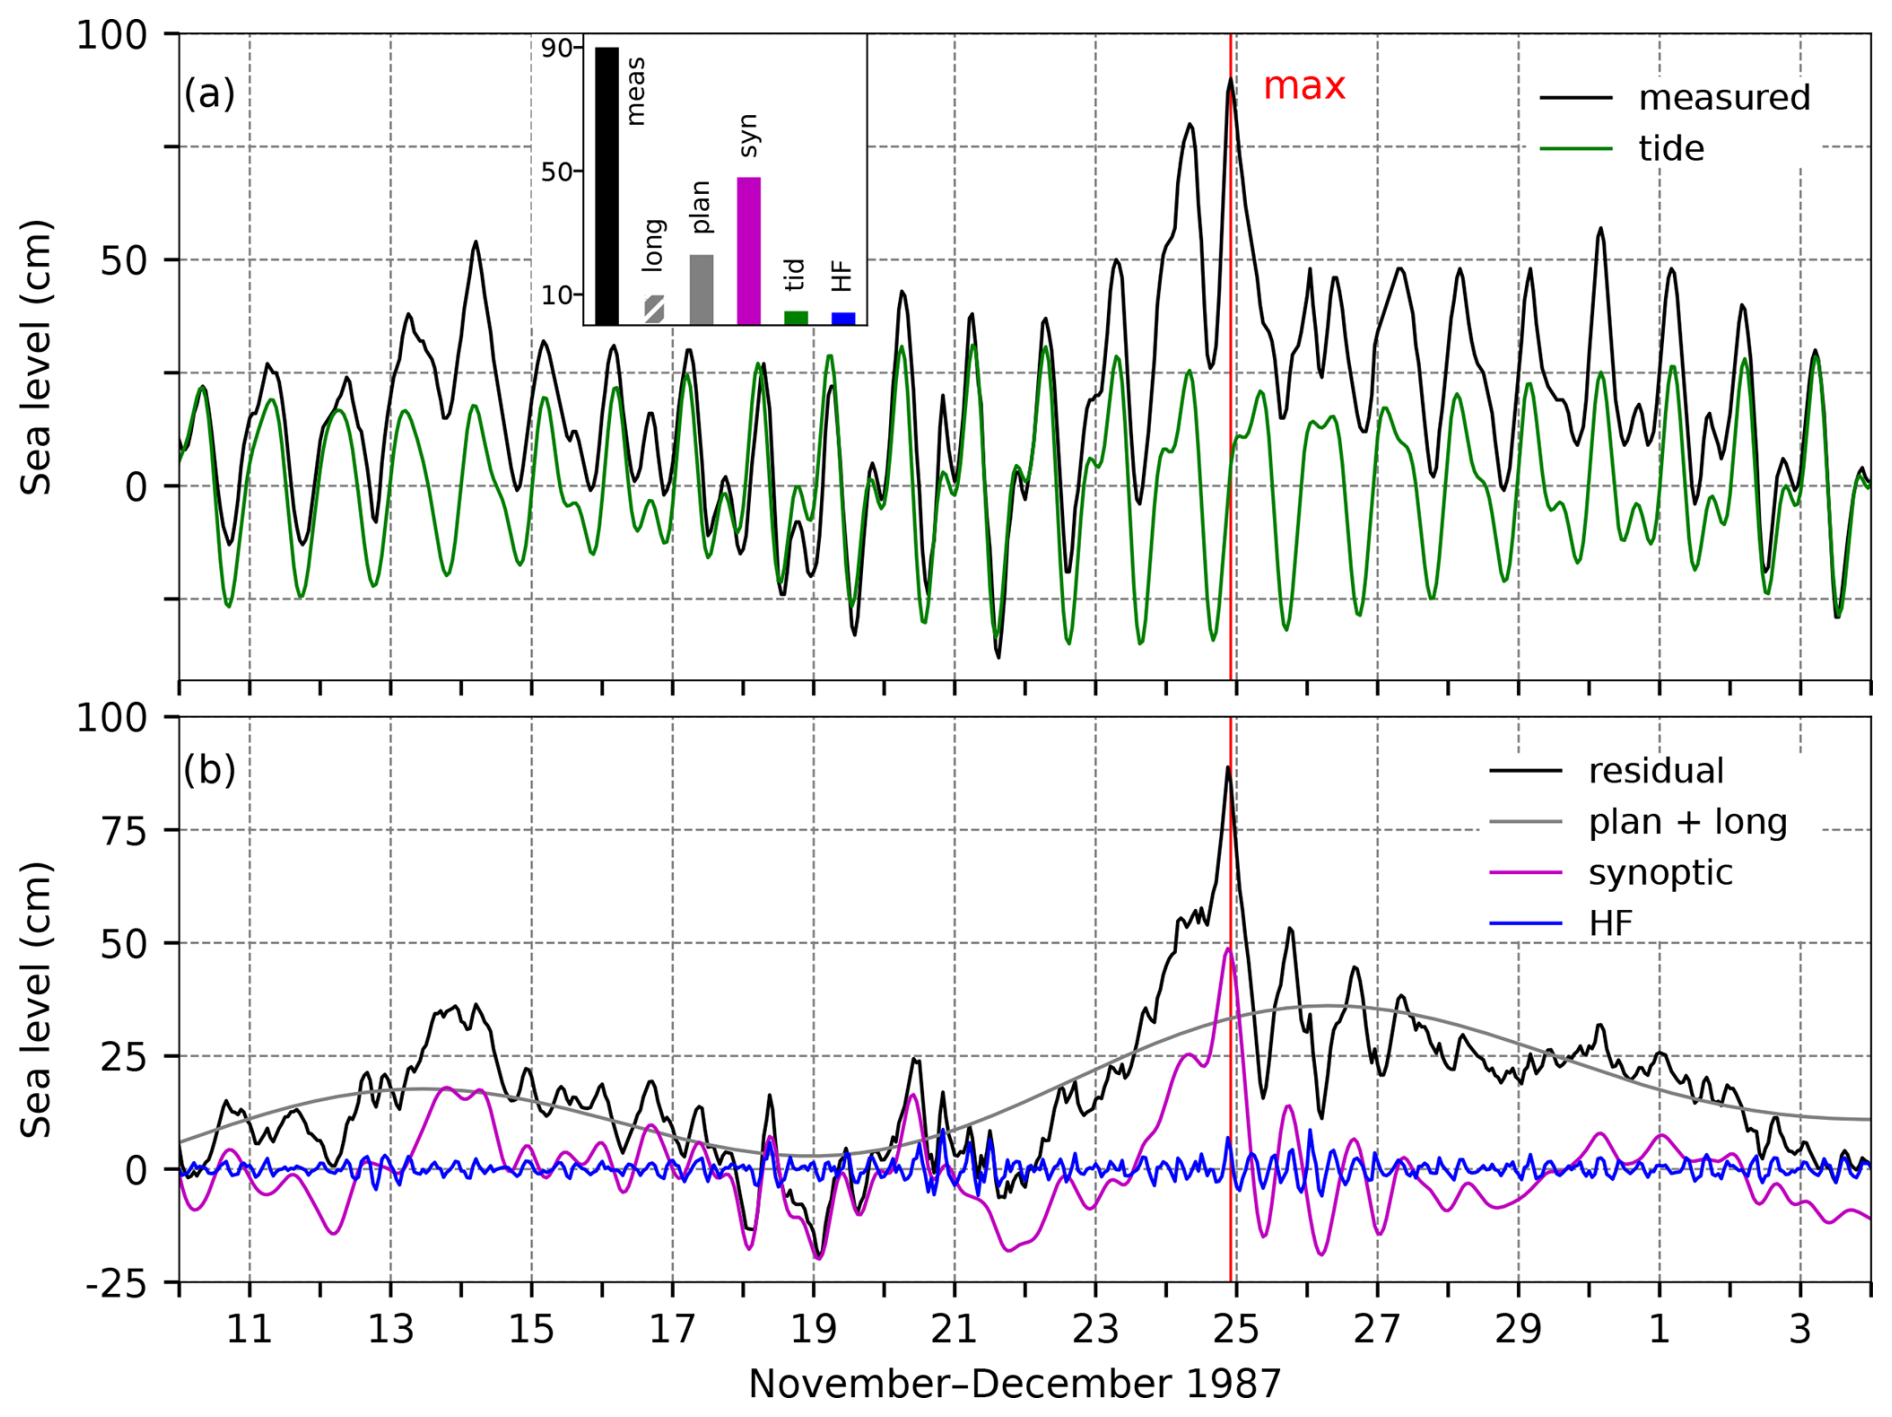
Figure 32SL series for the flood of 24 November 1987. Panel (a) shows the measured sea level (black) and tide (green). The inset figure shows the contributions (cm) of the five sea-level components to the maximum measured sea level (“meas”; 22:00 UTC): “HF” refers to high-frequency oscillations (2 h < T < 9 h), “syn” to synoptic component (9 h < T < 10 d), “tid” to tide, “plan” to planetary-scale variability (10 d < T < 100 d), and “long” to long-term sea-level variability (100 d < T). Panel (b) presents the residual sea level (black), the combined series of planetary-scale variability and long-term sea-level variability (grey; plan + long), synoptic component (purple), and high-frequency oscillations (blue). The red line indicates the time of occurrence of the total SL maximum.
4.10.2 Sea-level evolution
On 24 November 1987, at 22:00 UTC, the sea level in Bakar rose to 90 cm above the long-term mean (Table 2, Fig. 32).
At that time, the moon was between the new moon and the first quarter, resulting in tide with a spring-tide character. The sea-level peak occurred while tide was changing from negative to positive phase, therefore contributing only 5 cm to the total SL (Fig. 32a).
High-frequency oscillations were relatively inactive during this period, contributing 4 cm to the overall SL maximum (Fig. 32b).
Prior to the flood, there was no significant cyclonic activity in the Adriatic region (Fig. 30a), and the residual sea level or synoptic component did not exhibit the ∼ 21.2 h oscillations characteristic of the Adriatic seiches. This indicates that the episode was not influenced by a pre-existing seiche. Instead, synoptic component was primarily a forced response, i.e. a storm surge, which peaked at 49 cm an hour before the SL maximum and contributed 48 cm to the flood. The storm surge began to develop on 23 November (Fig. 32b) as air pressure decreased (Fig. 30a) in the northern Adriatic and winds shifted to the southeast over the northern and middle parts of the basin (Fig. 30b).
Preceding conditions for the flood began several days earlier, with a gradual SL rise (Fig. 32b, plan + long) due to a consistent pressure drop (Fig. 30a) and a shift in wind direction to the southeast (10 d < T < 100 d; not shown). During this period (Fig. 30a), changes in the mid-troposphere (series of Z500 (lp)) were transmitted to the lower layers (series of MSLP (lp)) and reflected in the sea level (plan + long). This suggests, as demonstrated by Pasarić (2000), Pasarić et al. (2000), and Pasarić and Orlić (2001), that planetary-scale component was driven by the passage of atmospheric planetary waves, contributing 23 cm to the flood.
Long-term sea-level variability contributed 10 cm to the overall maximum. The episode occurred in winter, shortly after the annual peak, which was not particularly pronounced that year (Figs. 73 and A1). The main contribution came from intra-annual variability, which added 6.7 cm to this component (Fig. 73d). Interannual processes contributed an additional 4.3 cm (Fig. 73c), while mean sea-level change was slightly negative, reducing the component by 1 cm (Fig. 73b).
In summary, this episode resulted from a strong synoptic component combined with positive contributions from other processes.
4.10.3 Flood impacts
A review of the available daily newspapers (Novi list, 25 November 1987, and Slobodna Dalmacija, 26 November 1987) revealed the following effects of the episode. The gale sirocco in the northern Adriatic almost completely paralysed ferry traffic between the mainland and the islands. High water levels, heavy rain, and strong waves caused significant flooding along many coastlines in western Istria and the Kvarner islands. In the Split area, the storm left visible consequences. The Split Riva was largely flooded; on a local beach, debris such as shower heads, benches, and other items were seen floating in the still-turbulent sea; and the concrete platform was covered with piles of seaweed. Additional damage and emergency interventions included (i) damaged boats and (ii) disruption to road traffic in the northern Adriatic.
4.11 The flood of 10 December 1990 (ID 13; rank 13)
Canestrelli et al. (2001) provided a description of the episode. Their analysis included synoptic charts, SL data from TG Venice Punta Salute, and W10 and MSLP measurements from multiple coastal stations.
4.11.1 Meteorological background
The period before the flood was characterised by the passages of several non-distinct low-pressure systems over the Adriatic (Fig. 33a). In the week preceding the flood in Bakar, a deep upper-level trough descended from northern Europe towards the Mediterranean. Under such conditions, the entire Mediterranean was influenced by the upper-level southwesterly flow at the front side of the trough, which supported the advection of relatively warm and humid air. At 18:00 UTC on 8 December, a cyclone formed over Spain and moved eastward. By the afternoon of 9 December, the cyclone with a frontal system had reached the Gulf of Genoa (Fig. 34a). With the development and deepening of the cyclone, air-pressure gradients intensified. In the afternoon of 9 December, a southerly and southeasterly flow gradually strengthened over the Adriatic Sea (Fig. 33b). The winds were more intense on the eastern side than on the western side of the basin (Fig. 34a). During the night of 9–10 December, the wind reached maximum speeds, and a severe sirocco was blowing throughout the Adriatic Sea (Fig. 34b). This coincided with the onset of an extreme SL recorded in Bakar on 10 December at 02:00 UTC. As the cyclone slowly moved across the Adriatic Sea, the wind weakened and changed direction to southwest, first in the northern, then in the middle, and finally in the southern Adriatic. Considerable amounts of precipitation were recorded during this episode. On 10 December, similar amounts were observed along the entire coastline: in the northern Adriatic, up to 35 mm of precipitation was recorded, while in the middle Adriatic, between 10 and 40 mm was recorded.
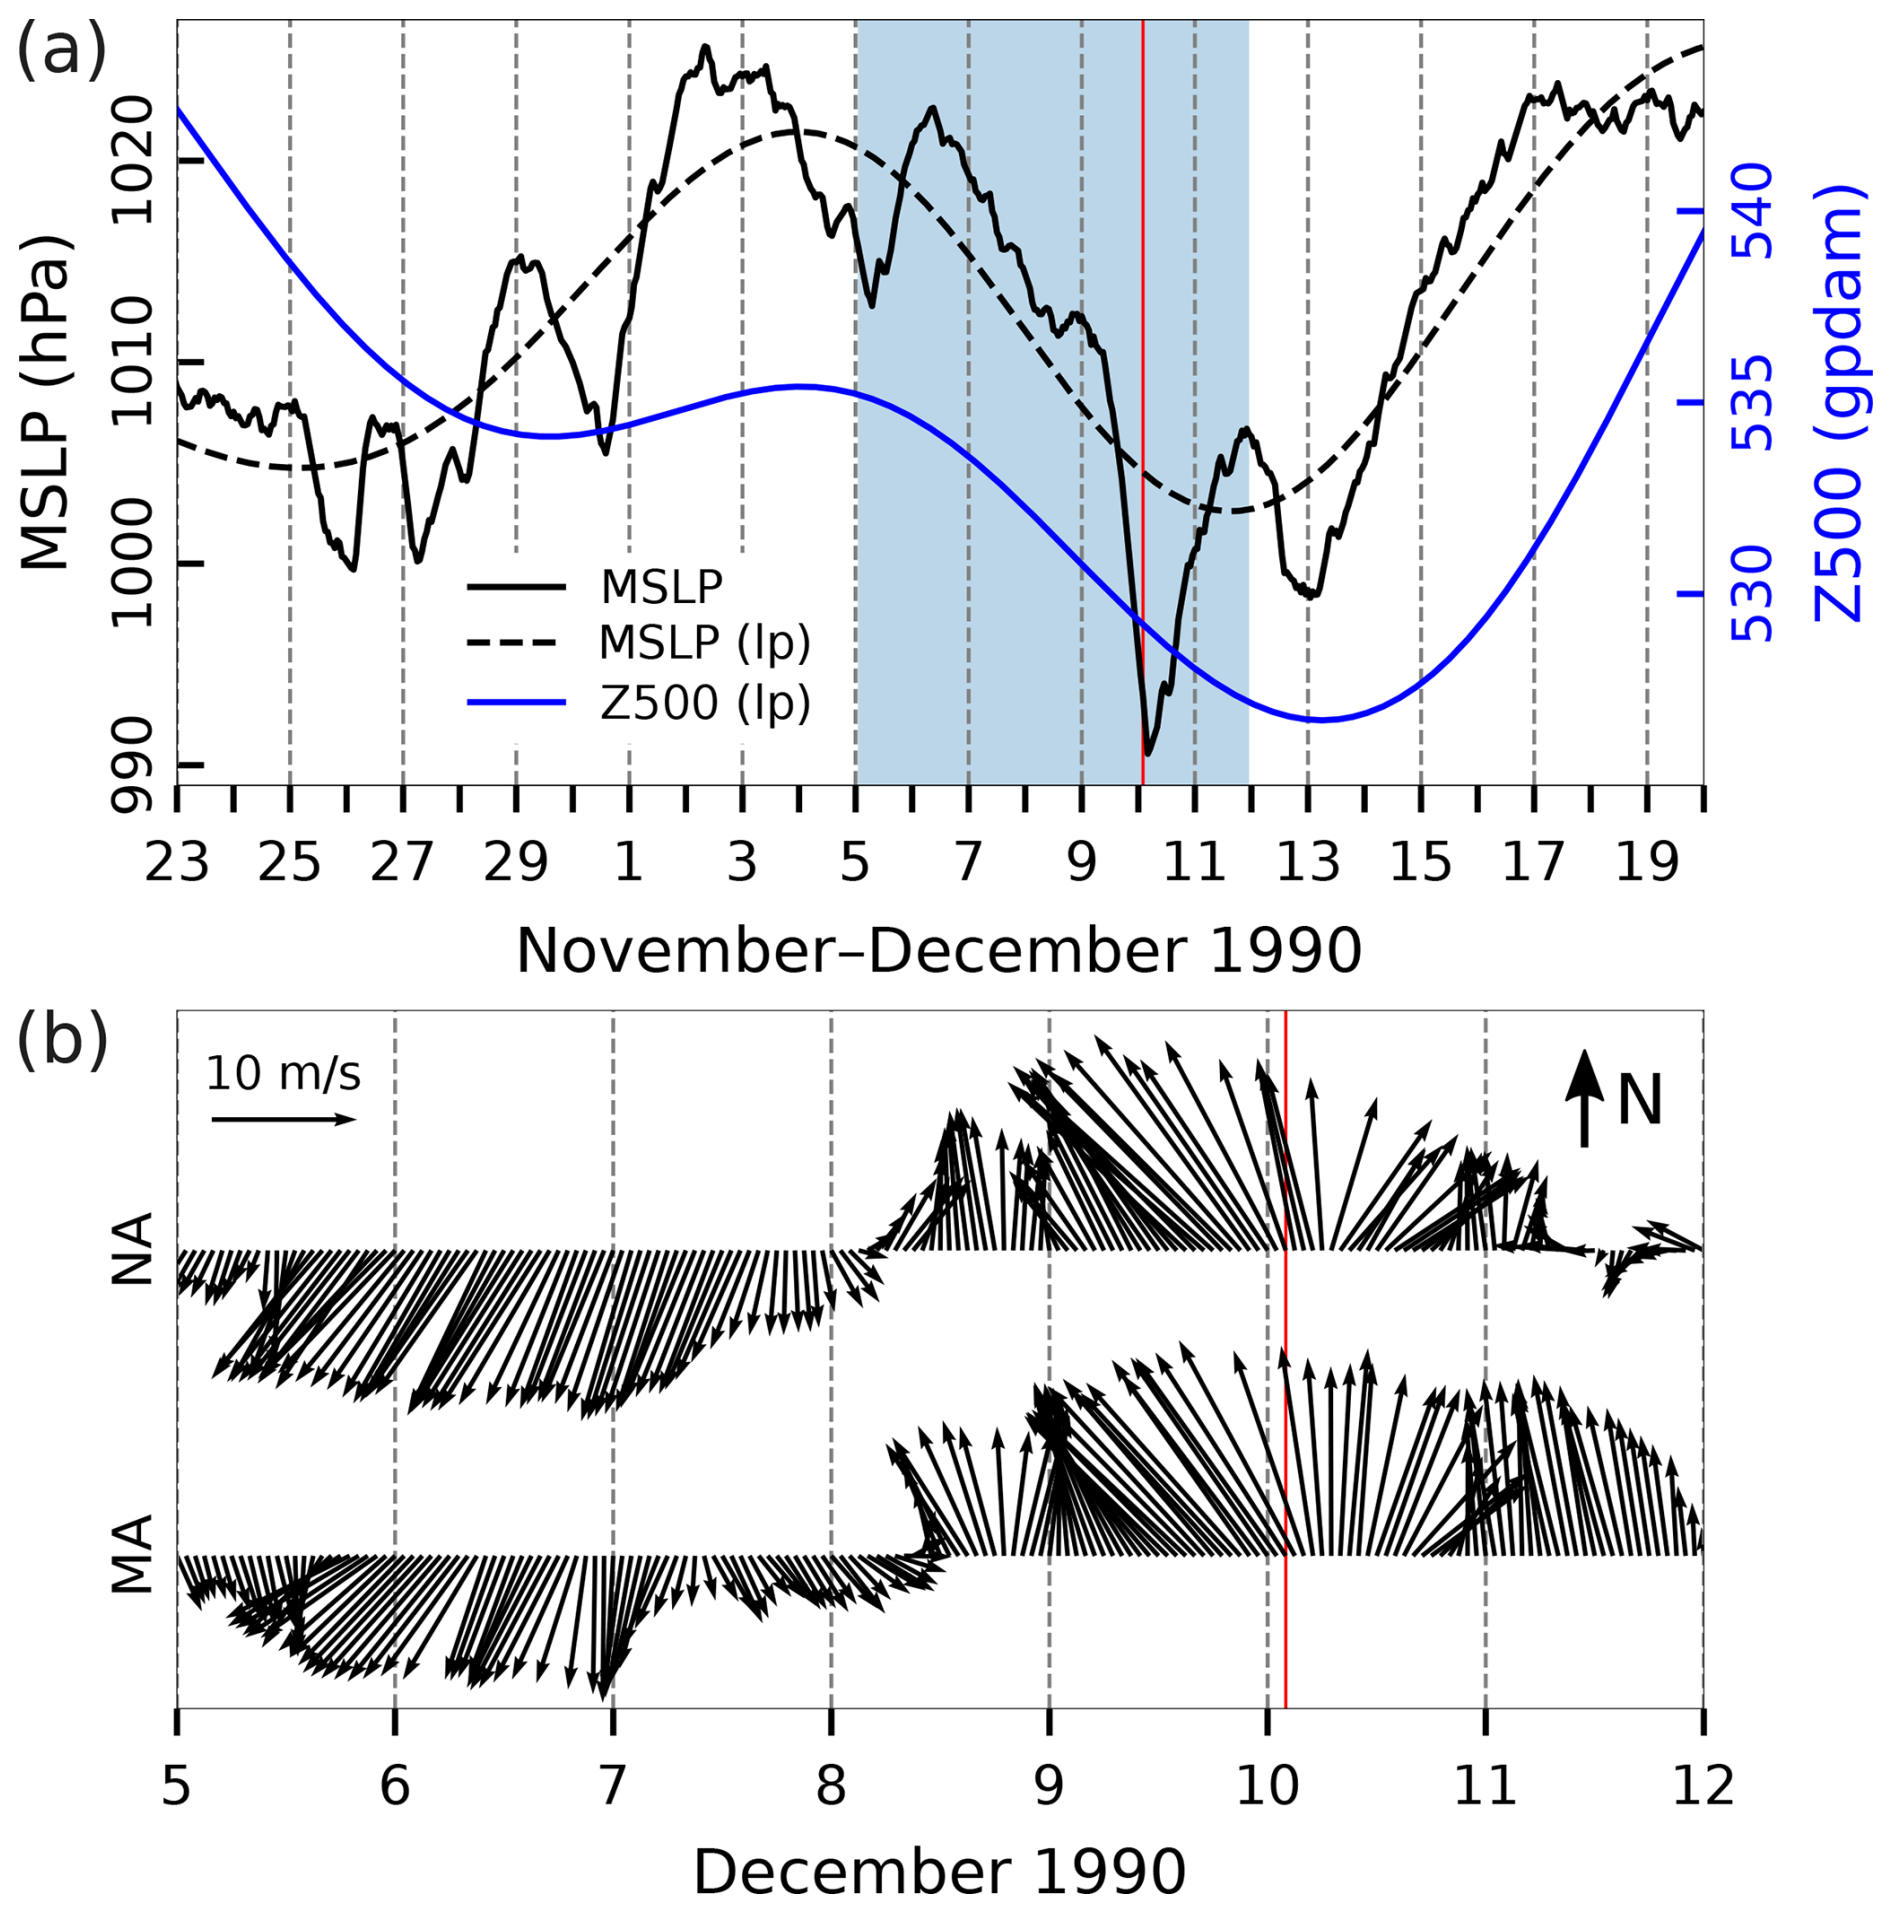
Figure 33Series of ERA5 reanalysis data related to the flood of 10 December 1990. (a) MSLP (hourly) and MSLP (lp) (low-pass filtered with a cut-off frequency of 10 d) and Z500 (lp) (low-pass filtered with a cut-off frequency of 10 d) at a grid point near TG Bakar. (b) Hourly W10 during the period marked in blue in the upper plot for the middle Adriatic (MA) and northern Adriatic (NA) (all locations marked in Fig. 1). The red line indicates the onset of the SL maximum.
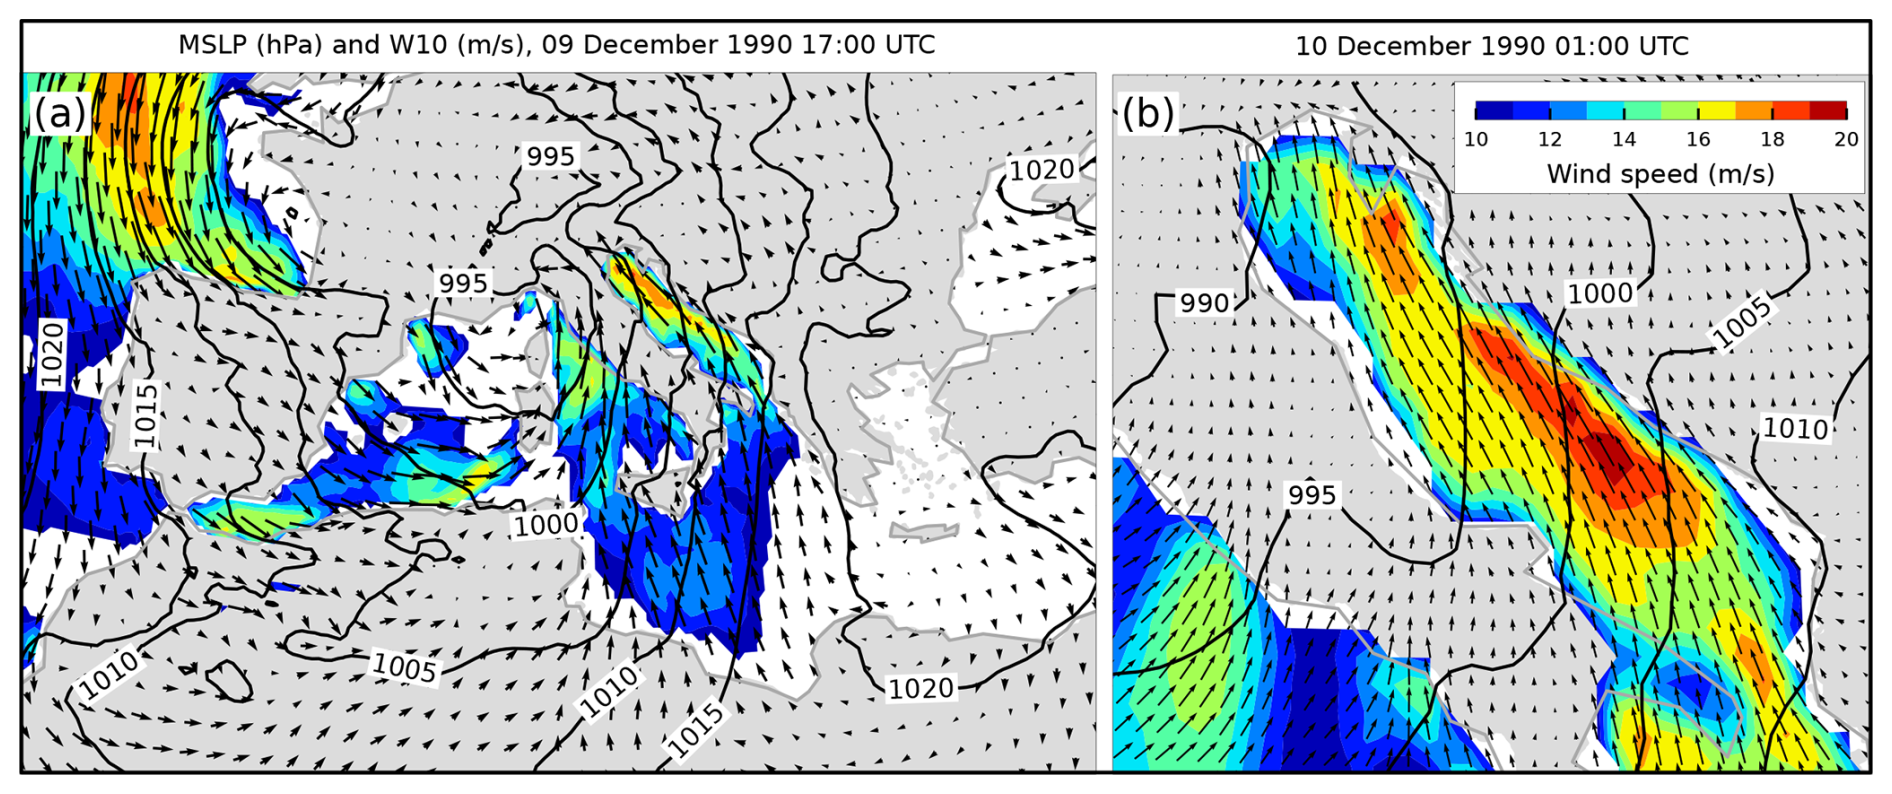
Figure 34MSLP (black lines) and W10 (arrows and colours) fields from the ERA5 reanalysis. Conditions (a) over the Mediterranean that preceded the situation (b) over the Adriatic Sea (an hour before maximum SL in Bakar). Only wind speeds exceeding 10 m s−1 are coloured. One colour map is used for both maps.
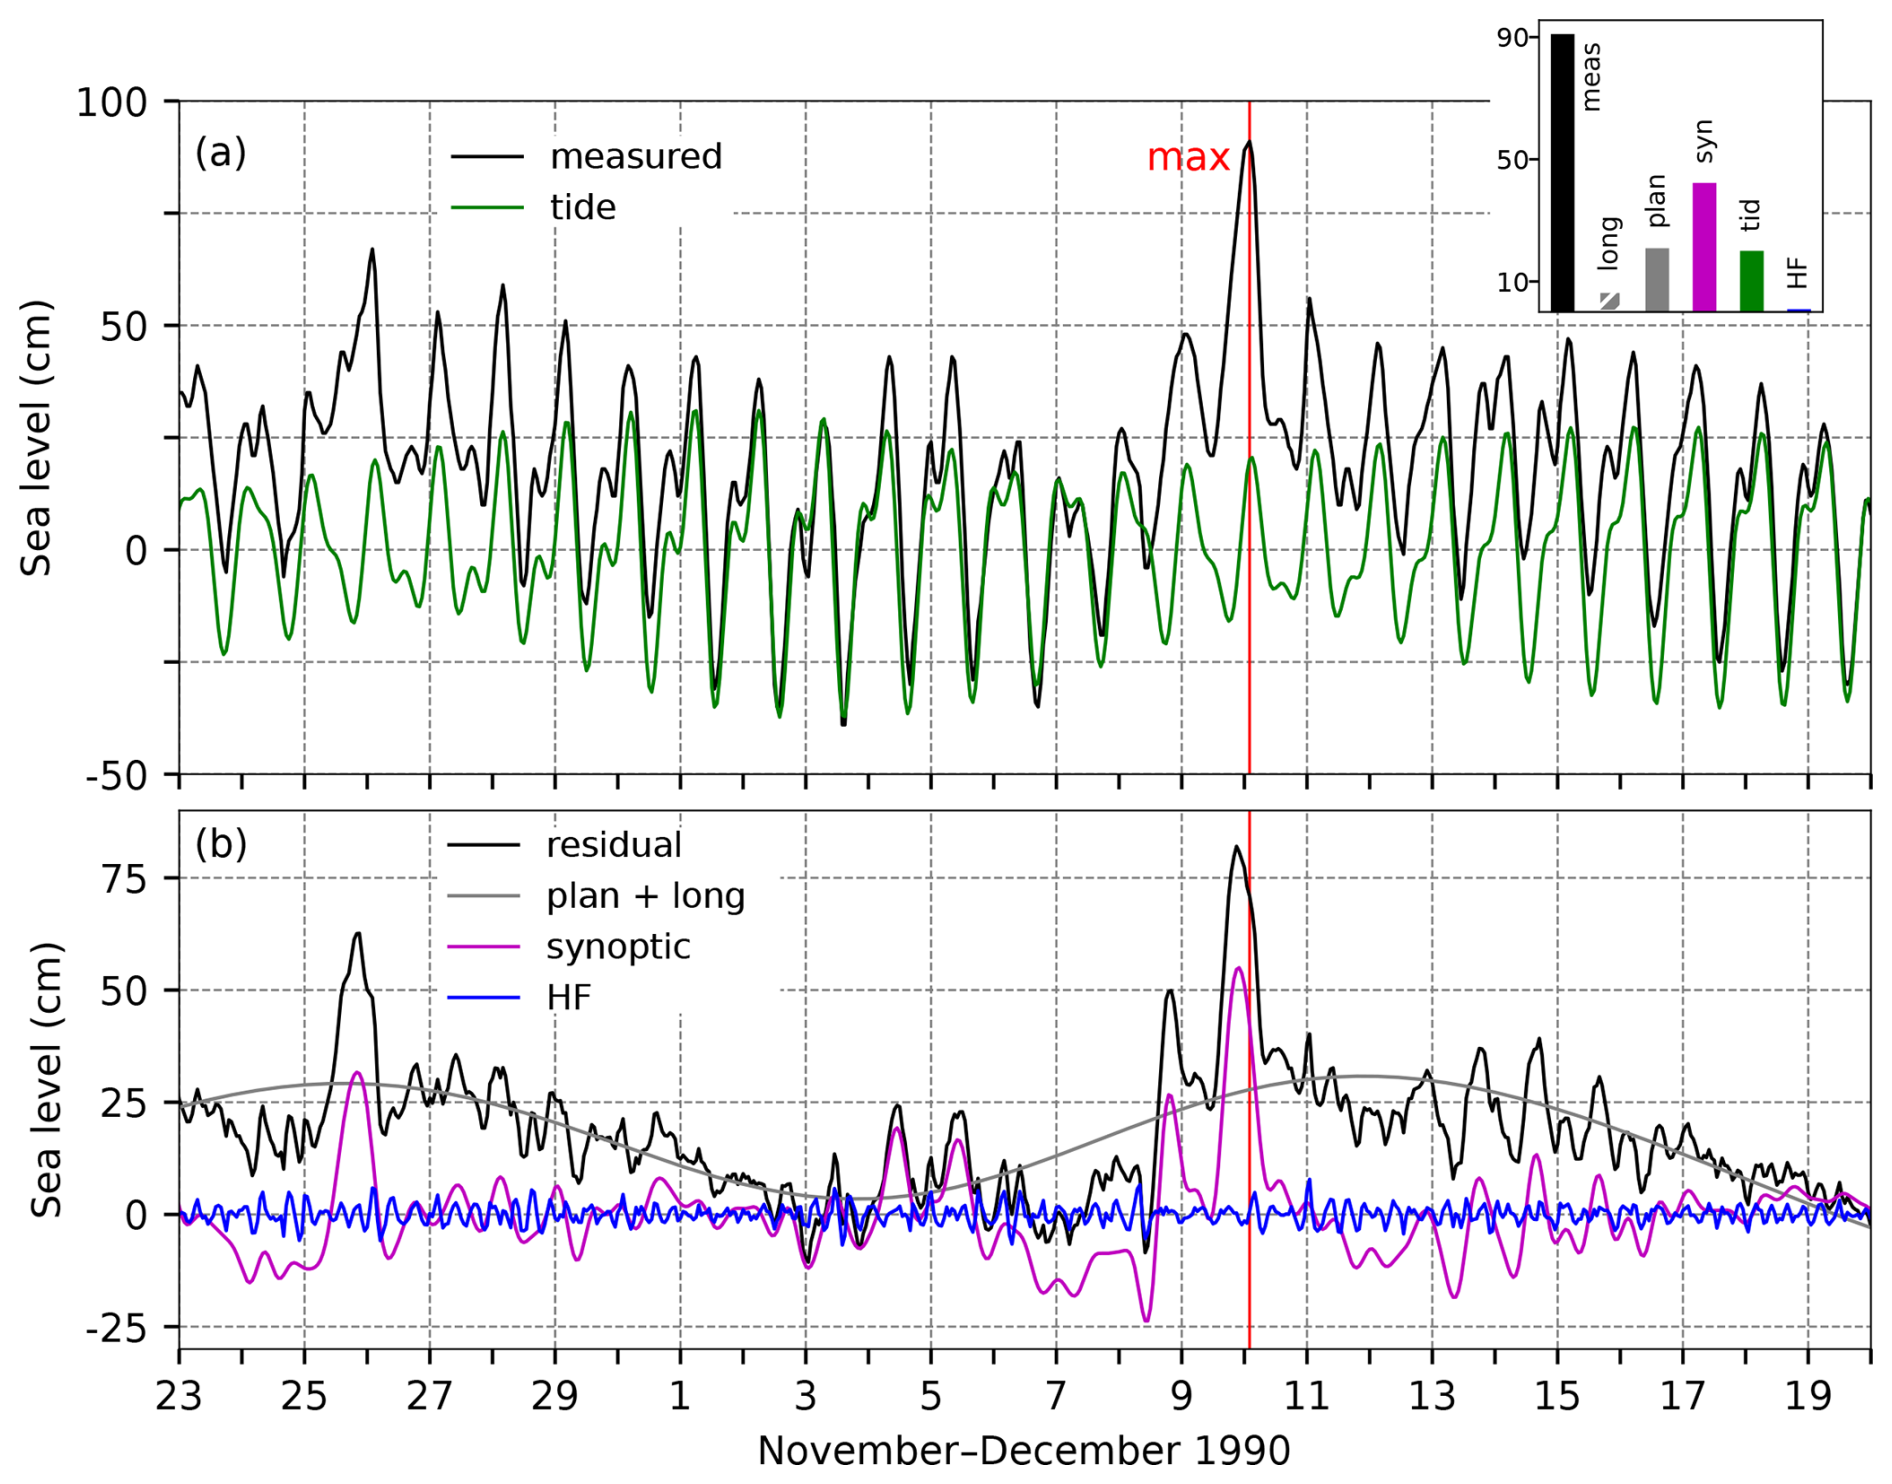
Figure 35SL series for the flood of 10 December 1990. Panel (a) shows the measured sea level (black) and tide (green). The inset figure shows the contributions (cm) of the five sea-level components to the maximum measured sea level (“meas”; 02:00 UTC): “HF” refers to high-frequency oscillations (2 h < T < 9 h), “syn” to synoptic component (9 h < T < 10 d), “tid” to tide, “plan” to planetary-scale variability (10 d < T < 100 d), and “long” to long-term sea-level variability (100 d < T). Panel (b) presents the residual sea level (black), the combined series of planetary-scale variability and long-term sea-level variability (grey; plan + long), synoptic component (purple), and high-frequency oscillations (blue). The red line indicates the time of occurrence of the total SL maximum.
4.11.2 Sea-level evolution
On 10 December 1990, at 02:00 UTC, the sea level in Bakar reached 91 cm above the long-term mean (Table 2, Fig. 35).
At that time, the moon was 1 d past the last quarter, which meant that tide had a diurnal neap-tide character. The SL maximum coincided with the daily tidal peak, with tide contributing 20 cm (Fig. 35a).
High-frequency oscillations were not pronounced during the flood and added a negligible 1 cm to the total SL maximum.
In the period leading up to the flood, several weak low-pressure systems moved across the Adriatic (Fig. 33a). However, these systems did not generate significant basin-wide oscillations (Fig. 35b). The residual SL series shows two peaks, on 25 November and 8 December; however, no subsequent oscillations with a period of ∼ 21.2 h are apparent. This suggests that the episode was not influenced by a pre-existing Adriatic seiche. Instead, synoptic component was dominated by a storm surge, which reached a peak height of 55 cm. The total SL maximum occurred 4 h after the storm-surge peak, during the daily tidal maximum. Synoptic component contributed 42 cm to the overall SL maximum.
Planetary-scale variability contributed 21 cm to this episode. Planetary-scale sea level initially peaked around 26 November (Fig. 35b) but then decreased due to rising air pressure (Fig. 33a) and northeasterly winds (periods of 10–100 d) from 29 November to 7 December, occasionally reaching speeds of 8 m s−1. Around 4 December, as the wind conditions were still unfavourable, the MSLP (lp) began to drop. Subsequently, the winds shifted to southeasterly, with speeds up to 4 m s−1, causing planetary-scale component to rise by 21 cm at the SL peak. Throughout the shown period, SL (plan + long) varied simultaneously with MSLP (lp) (Figs. 33 and 35), while MSLP (lp) did not reflect changes in Z500 (lp) (Fig. 33a).
Long-term sea-level variability (100 d < T) contributed 7 cm to the flood (Figs. 73 and A1), with intra-annual processes being the main contributor, adding 10 cm. That year, intra-annual variability showed a pronounced amplitude (Fig. 73d); however, the flood occurred after its peak. Interannual processes were not prominent and contributed only 2.7 cm (Fig. 73c). In contrast, mean sea-level change was in a negative phase (mostly due to decadal variability; Fig. 73b), reducing the component by 5.7 cm. This was the largest negative contribution from mean sea-level change among all the floods analysed.
In summary, this flood was driven by the positive contributions of all involved processes, particularly synoptic component, planetary-scale variability, and tide (Fig. 35).
4.11.3 Flood impacts
A review of the available daily newspapers (Novi list, Slobodna Dalmacija, and Večernji list; 11 December 1990) revealed the following effects of the episode. The strong and gale sirocco, accompanied by heavy rain on the night of 9–10 December, caused considerable disruption along the northern and middle Adriatic coast. Maritime traffic was severely affected, with numerous vessels damaged or submerged and roads flooded in the northern Adriatic. One particularly difficult incident occurred in Rijeka's port where two tugboats had to secure a tanker in the midst of strong and gale wind and waves. Many ferries and shipping lines were suspended, isolating most islands in Kvarner Bay and along the middle Adriatic coastline, where waves reached 6–7 m. Additional damage and emergency interventions included (i) damage to a breakwater in a northern Adriatic town; (ii) numerous damaged shores, especially on middle Adriatic islands; (iii) a failure in Rijeka's emergency power line, leaving it inoperative; and (iv) flooded basements and first-floor rooms as well as fallen power lines and uprooted trees near Šibenik.
4.12 The flood of 2 October 1993 (ID 14; rank 14)
Canestrelli et al. (2001) provided a description of the episode. Their analysis included synoptic charts, SL data from TG Venice Punta Salute (Italy), and W10 and MSLP measurements from multiple coastal stations.
4.12.1 Meteorological background
Two days before the occurrence of the SL maximum in Bakar, a deep cyclone advanced from the North Atlantic towards western Europe and progressively moved further into the European continent. Under these conditions, on 1 October, the Adriatic came under the influence of upper-level southwesterly flow and the advection of relatively warm and humid air on the front side of the trough. At the surface, a moderate sirocco was blowing along the entire Adriatic (Fig. 36b). By 2 October, much of the European continent was experiencing widespread cyclonic activity. By 06:00 UTC, a secondary cyclone had formed in the Gulf of Genoa (Fig. 37a), and it briefly joined the cyclone over central Europe before moving southeast from northern Italy across the Adriatic Sea, intensifying the air-pressure gradient over the Adriatic and causing precipitation along the Croatian coastline (10–40 mm along the northern Adriatic and up to 20 mm in the middle Adriatic). Throughout the day, the intensity of the sirocco increased, with stronger wind observed along the eastern coast of the basin. The entire Adriatic experienced a strong and severe sirocco on the afternoon of 2 October (Fig. 36b and 37b), which peaked in intensity in the evening, coinciding with the extreme sea level in Bakar at 20:00 UTC. The wind weakened first over the northern Adriatic, followed by the central and southern regions as the cyclone continued to move towards the east.
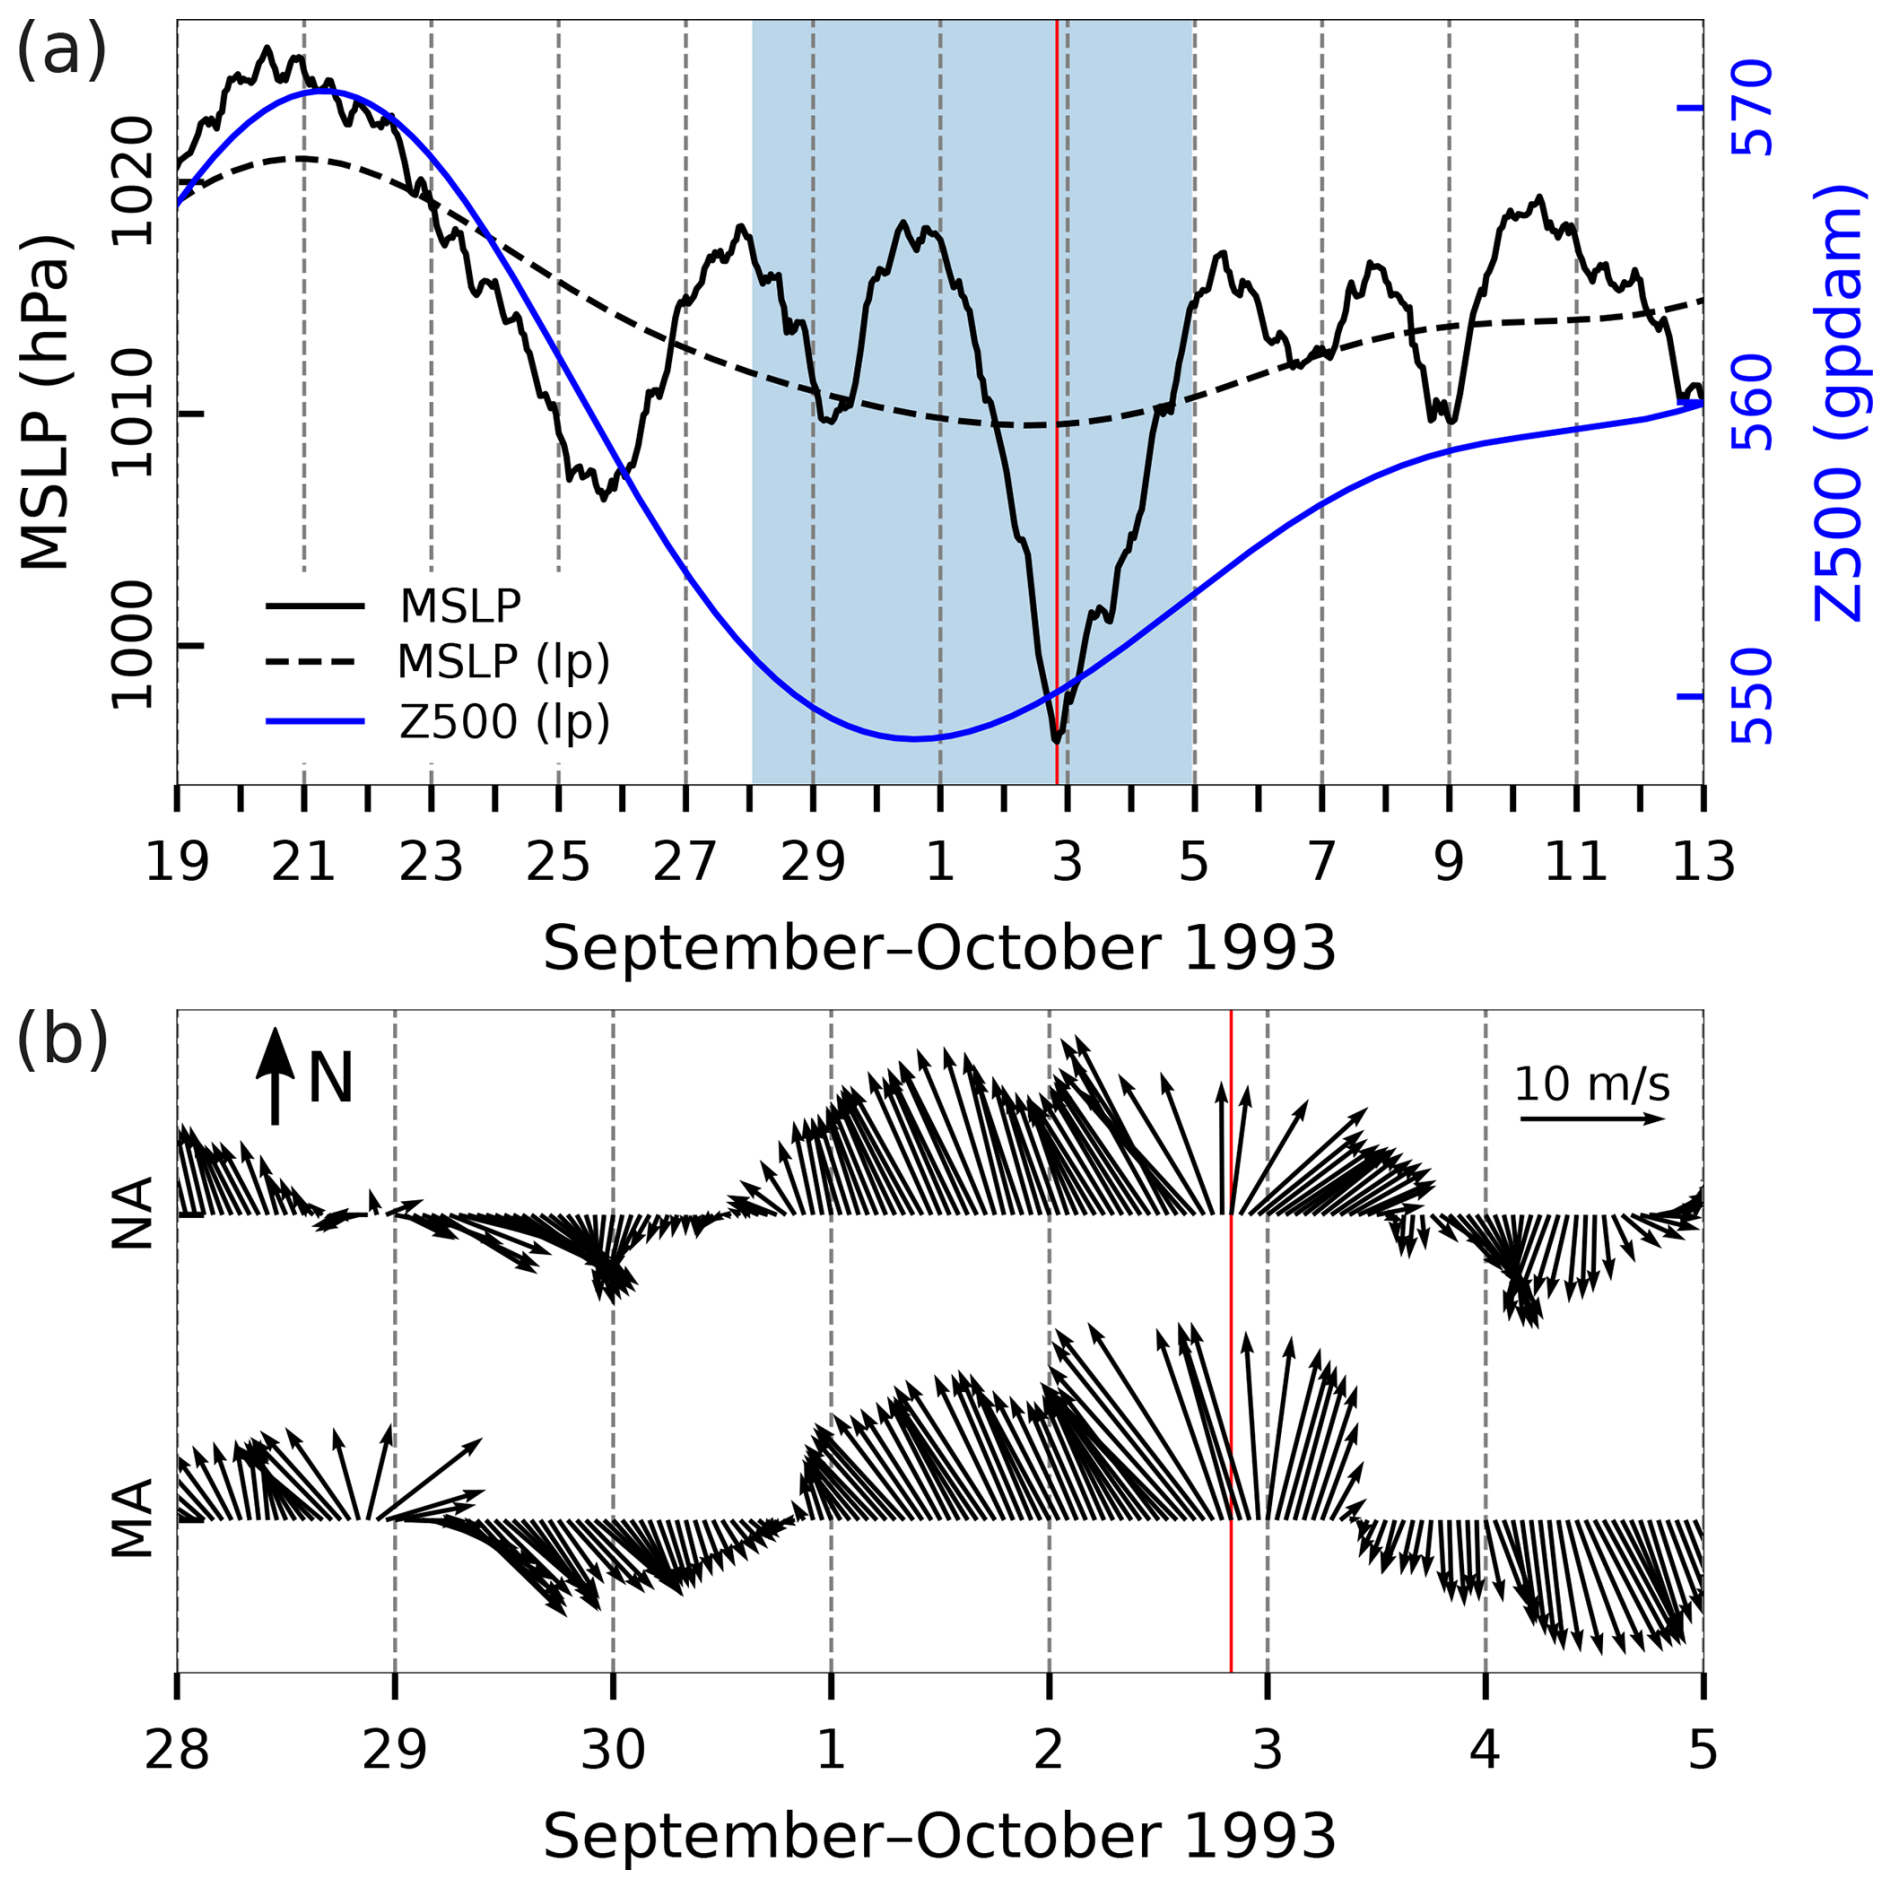
Figure 36Series of ERA5 reanalysis data related to the flood of 2 October 1993. (a) MSLP (hourly) and MSLP (lp) (low-pass filtered with a cut-off frequency of 10 d) and Z500 (lp) (low-pass filtered with a cut-off frequency of 10 d) at a grid point near TG Bakar. (b) Hourly W10 during the period marked in blue in the upper plot for the middle Adriatic (MA) and northern Adriatic (NA) (all locations marked in Fig. 1). The red line indicates the onset of the SL maximum.
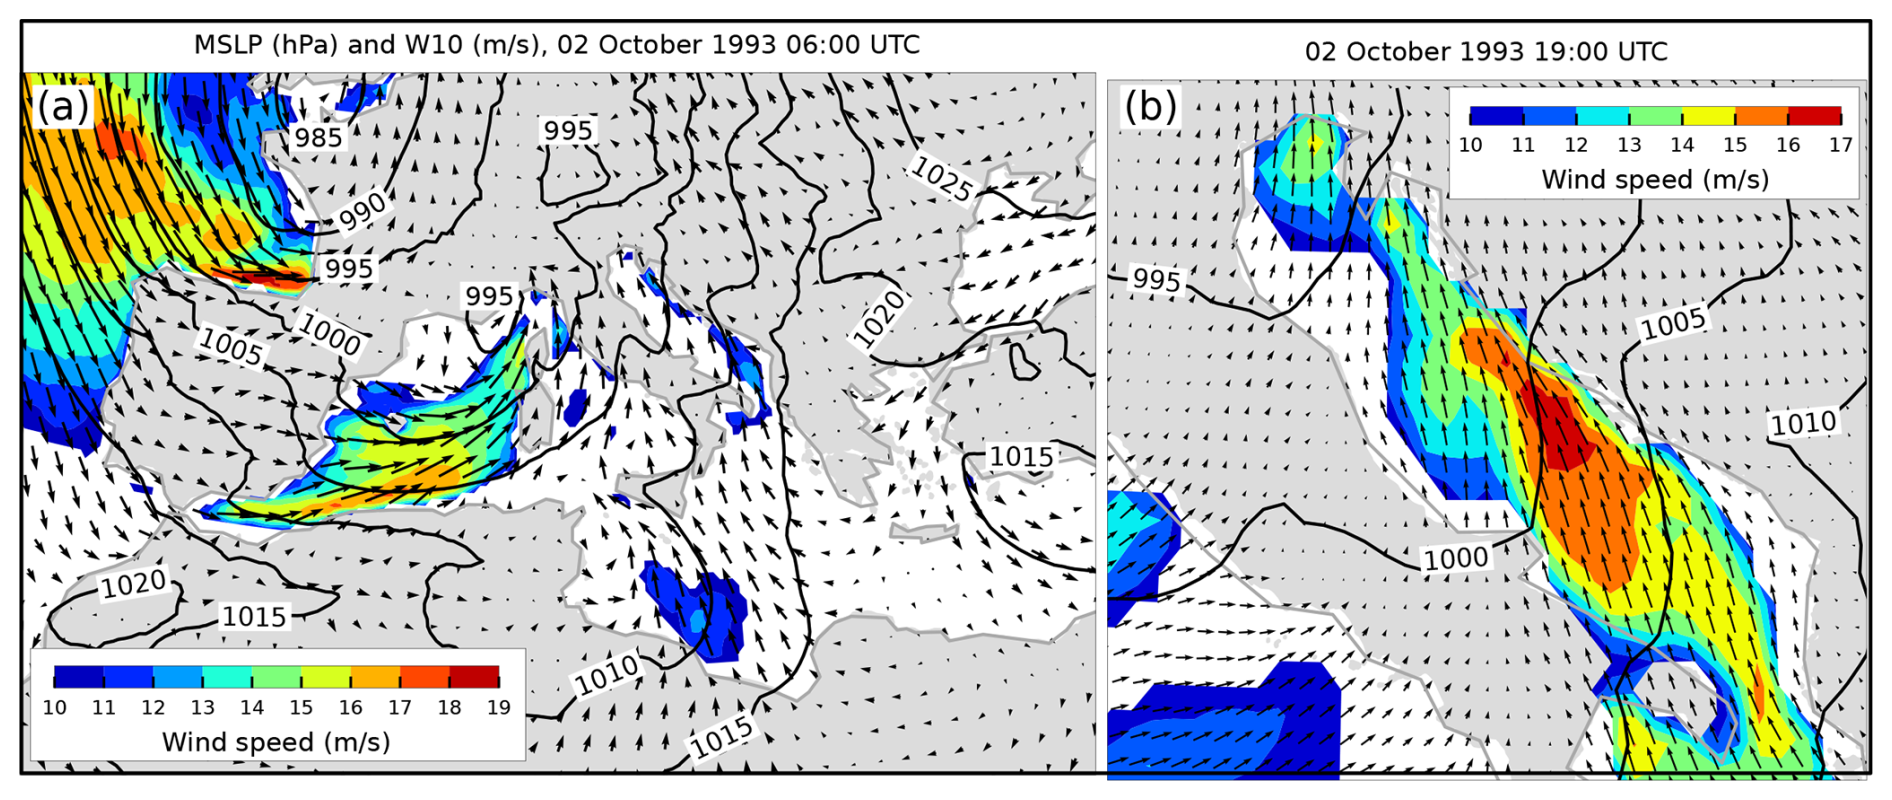
Figure 37MSLP (black lines) and W10 (arrows and colours) fields from the ERA5 reanalysis. Conditions (a) over the Mediterranean that preceded the situation (b) over the Adriatic Sea (an hour before maximum SL in Bakar). Only wind speeds exceeding 10 m s−1 are coloured.
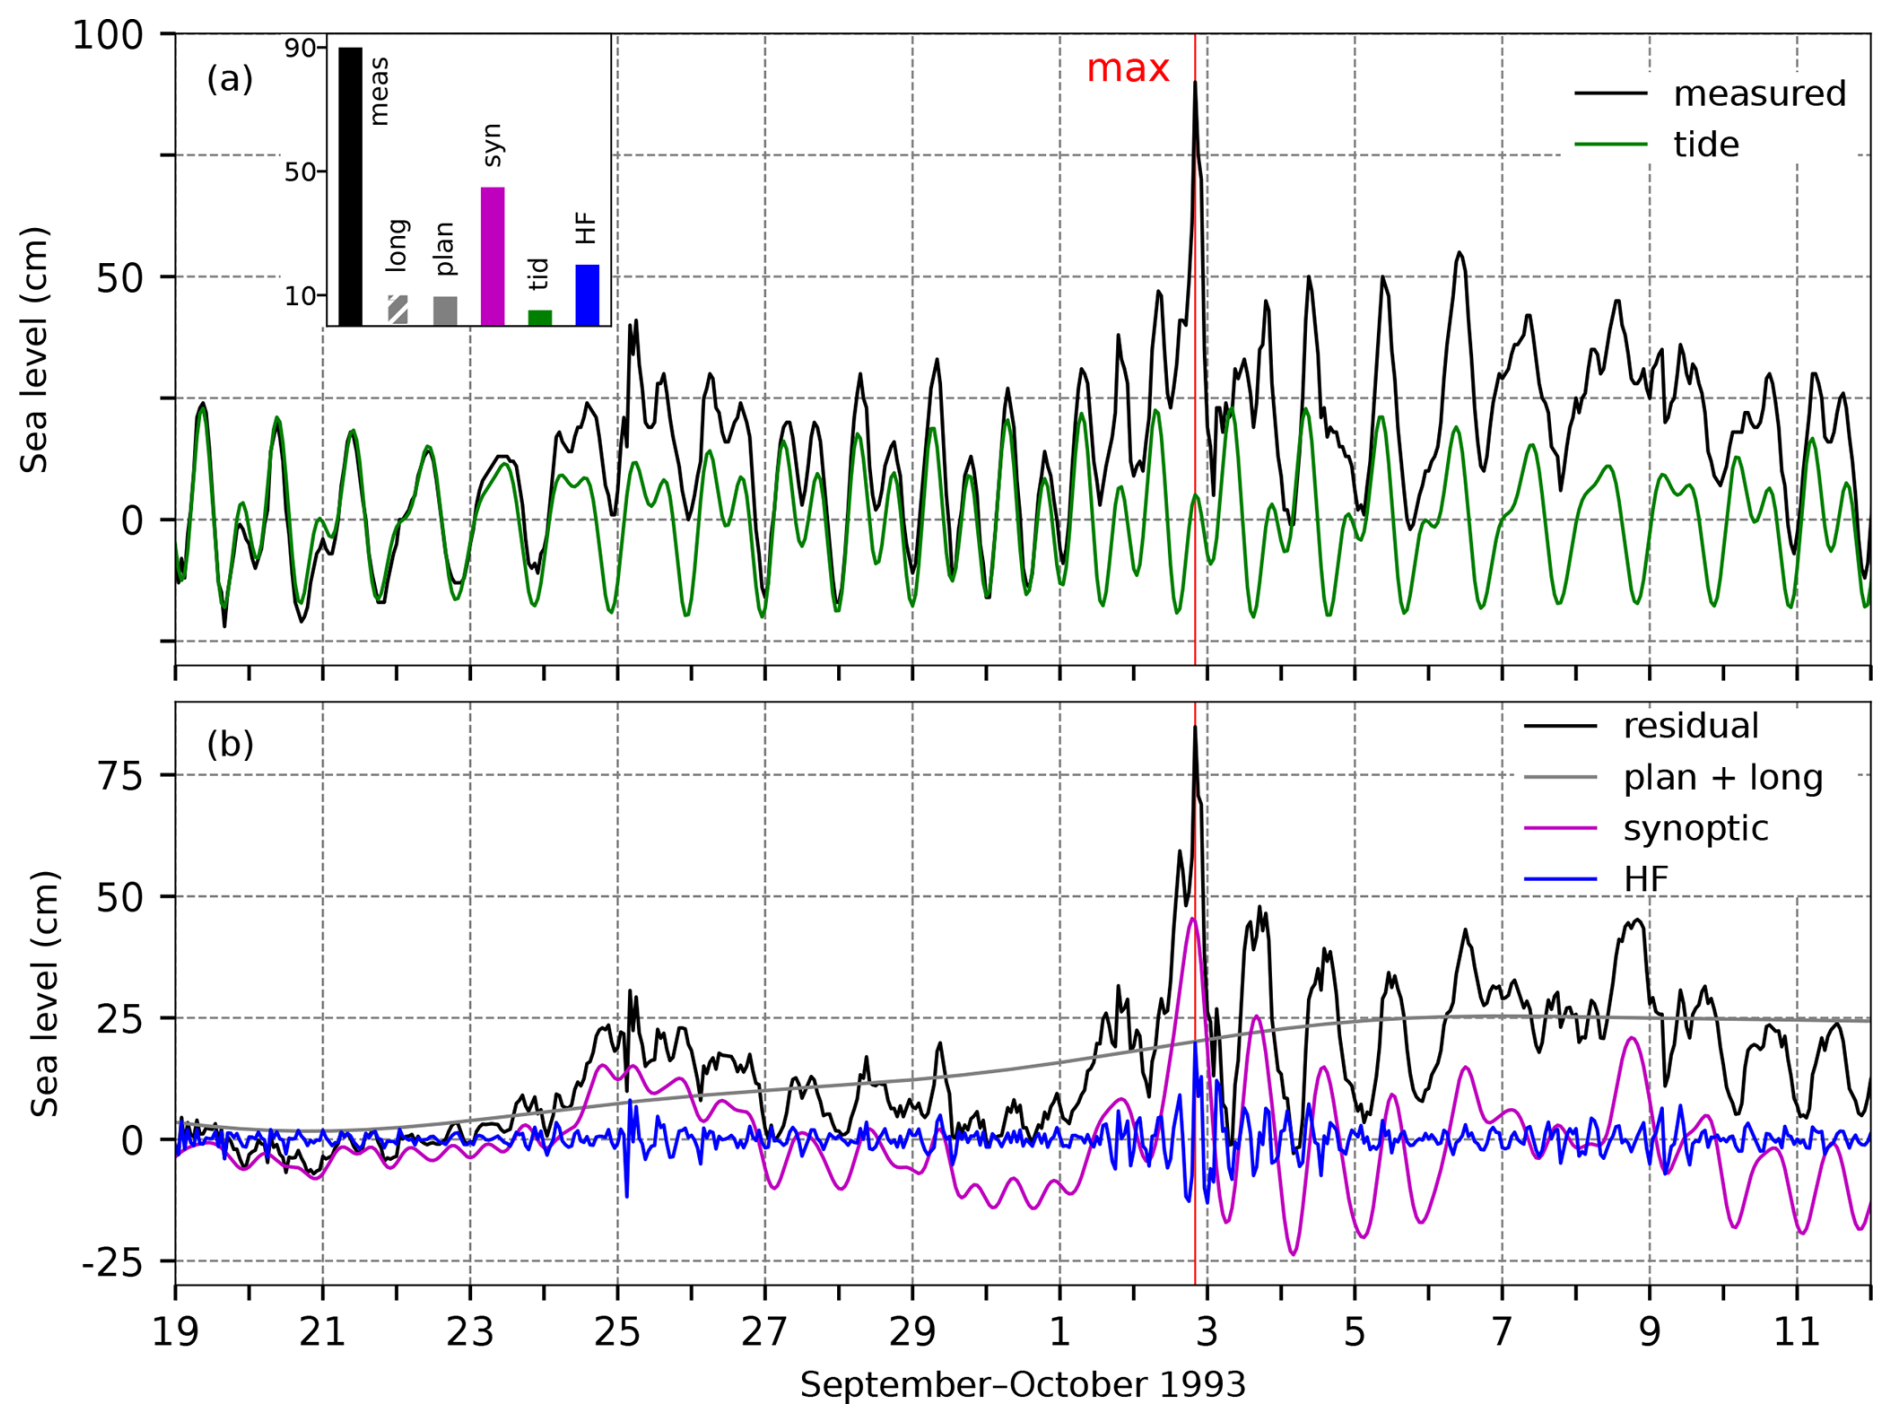
Figure 38SL series for the flood of 2 October 1993. Panel (a) shows the measured sea level (black) and tide (green). The inset figure shows the contributions (cm) of the five sea-level components to the maximum measured sea level (“meas”; 20:00 UTC): “HF” refers to high-frequency oscillations (2 h < T < 9 h), “syn” to synoptic component (9 h < T < 10 d), “tid” to tide, “plan” to planetary-scale variability (10 d < T < 100 d), and “long” to long-term sea-level variability (100 d < T). Panel (b) presents the residual sea level (black), the combined series of planetary-scale variability and long-term sea-level variability (grey; plan + long), synoptic component (purple), and high-frequency oscillations (blue). The red line indicates the time of occurrence of the total SL maximum.
4.12.2 Sea-level evolution
On the evening of 2 October 1993 (20:00 UTC), the sea level in Bakar rose to 90 cm above the long-term mean (Table 2, Fig. 38).
The moon phase, being 2 d past the full moon, formed a semidiurnal spring-tide character of tide. The SL peak coincided with a secondary daily tidal maximum, which contributed only 5 cm to the overall maximum.
High-frequency oscillations, however, contributed 20 cm to the total maximum – more than in any other event analysed in this study. As shown in Fig. 38b, a seiche in Kvarner Bay (with a period of ∼ 6 h) was induced shortly before the main SL maximum and was the dominant process in high-frequency component.
In the week leading up to the event, the Adriatic was not influenced by pronounced cyclonic activity (Fig. 36a), resulting in the absence of active ∼ 21.2 h seiches in the basin. Consequently, synoptic component was primarily shaped by a storm surge, which began to build in the morning of 2 October under the influence of a Mediterranean cyclone (Fig. 37a), and thus by an air-pressure gradient and sirocco winds over the Adriatic (Figs. 36b and 37b). The developed storm surge reached its peak shortly before the SL maximum, contributing 45 cm.
Planetary-scale component (10 d < T < 100 d) was not considerable, and it contributed 9 cm to the flood (Fig. 38a, histogram). This rise was driven by a decrease in MSLP (lp) (which simultaneously changed with Z500 (lp)) (Fig. 36a), along with weak southeasterly to northeasterly winds at periods of 10–100 d (not shown).
Long-term sea-level variability contributed 11 cm to the overall maximum (Figs. 73 and A1), driven by the positive phase of intra-annual processes (9.2 cm; Fig. 73d), a positive contribution from interannual variability (3.9 cm; Fig. 73c), and a negative contribution from mean sea-level change (−2.1 cm; Fig. 73b), with the latter due to decadal variability.
In summary, this flood resulted from a positive combination of all components, particularly synoptic and high-frequency oscillations.
4.12.3 Flood impacts
For this event, the available literature in the National and University Library was reviewed; however, no sources were found. The reason for this could be the Croatian War of Independence occurring at the time, which may have caused newspapers to focus on more pressing issues.
4.13 The flood of 26 November 1996 (ID 15; rank 14)
This episode has not yet been studied in the scientific literature, but Lionello et al. (2006) conducted a series of numerical experiments (with data assimilation) on storm surges that occurred prior to the flood (5–14 November 1996).
4.13.1 Meteorological background
The week before the flood in Bakar Bay, the Adriatic region was affected by an upper-level trough extending from Scandinavia to southern Europe. For several days, warm and humid air flowed over the region, which led to the formation of several cyclones (Fig. 39a) with frontal disturbances. These systems caused moderate precipitation as they crossed over the Adriatic Sea. The wind over the Adriatic was spatially variable with respect to speed and direction (Fig. 39b). A low-pressure system developed over the Gulf of Genoa on the night of 25–26 November (Fig. 40a), which, accompanied by a frontal system, progressed towards the northern Adriatic on 26 November (Fig. 40b). As a result, the southerly and southeasterly wind was gradually strengthening along the entire basin (Fig. 39b). As the day progressed, the cyclone moved southeastward along the Adriatic. On 26 November, precipitation in the northern Adriatic ranged mostly from 20 to 40 mm, with locally much higher amounts, such as 69 mm recorded at Sv. Ivan na Pučini near Rovinj. In the middle Adriatic, up to 30 mm of precipitation was recorded.
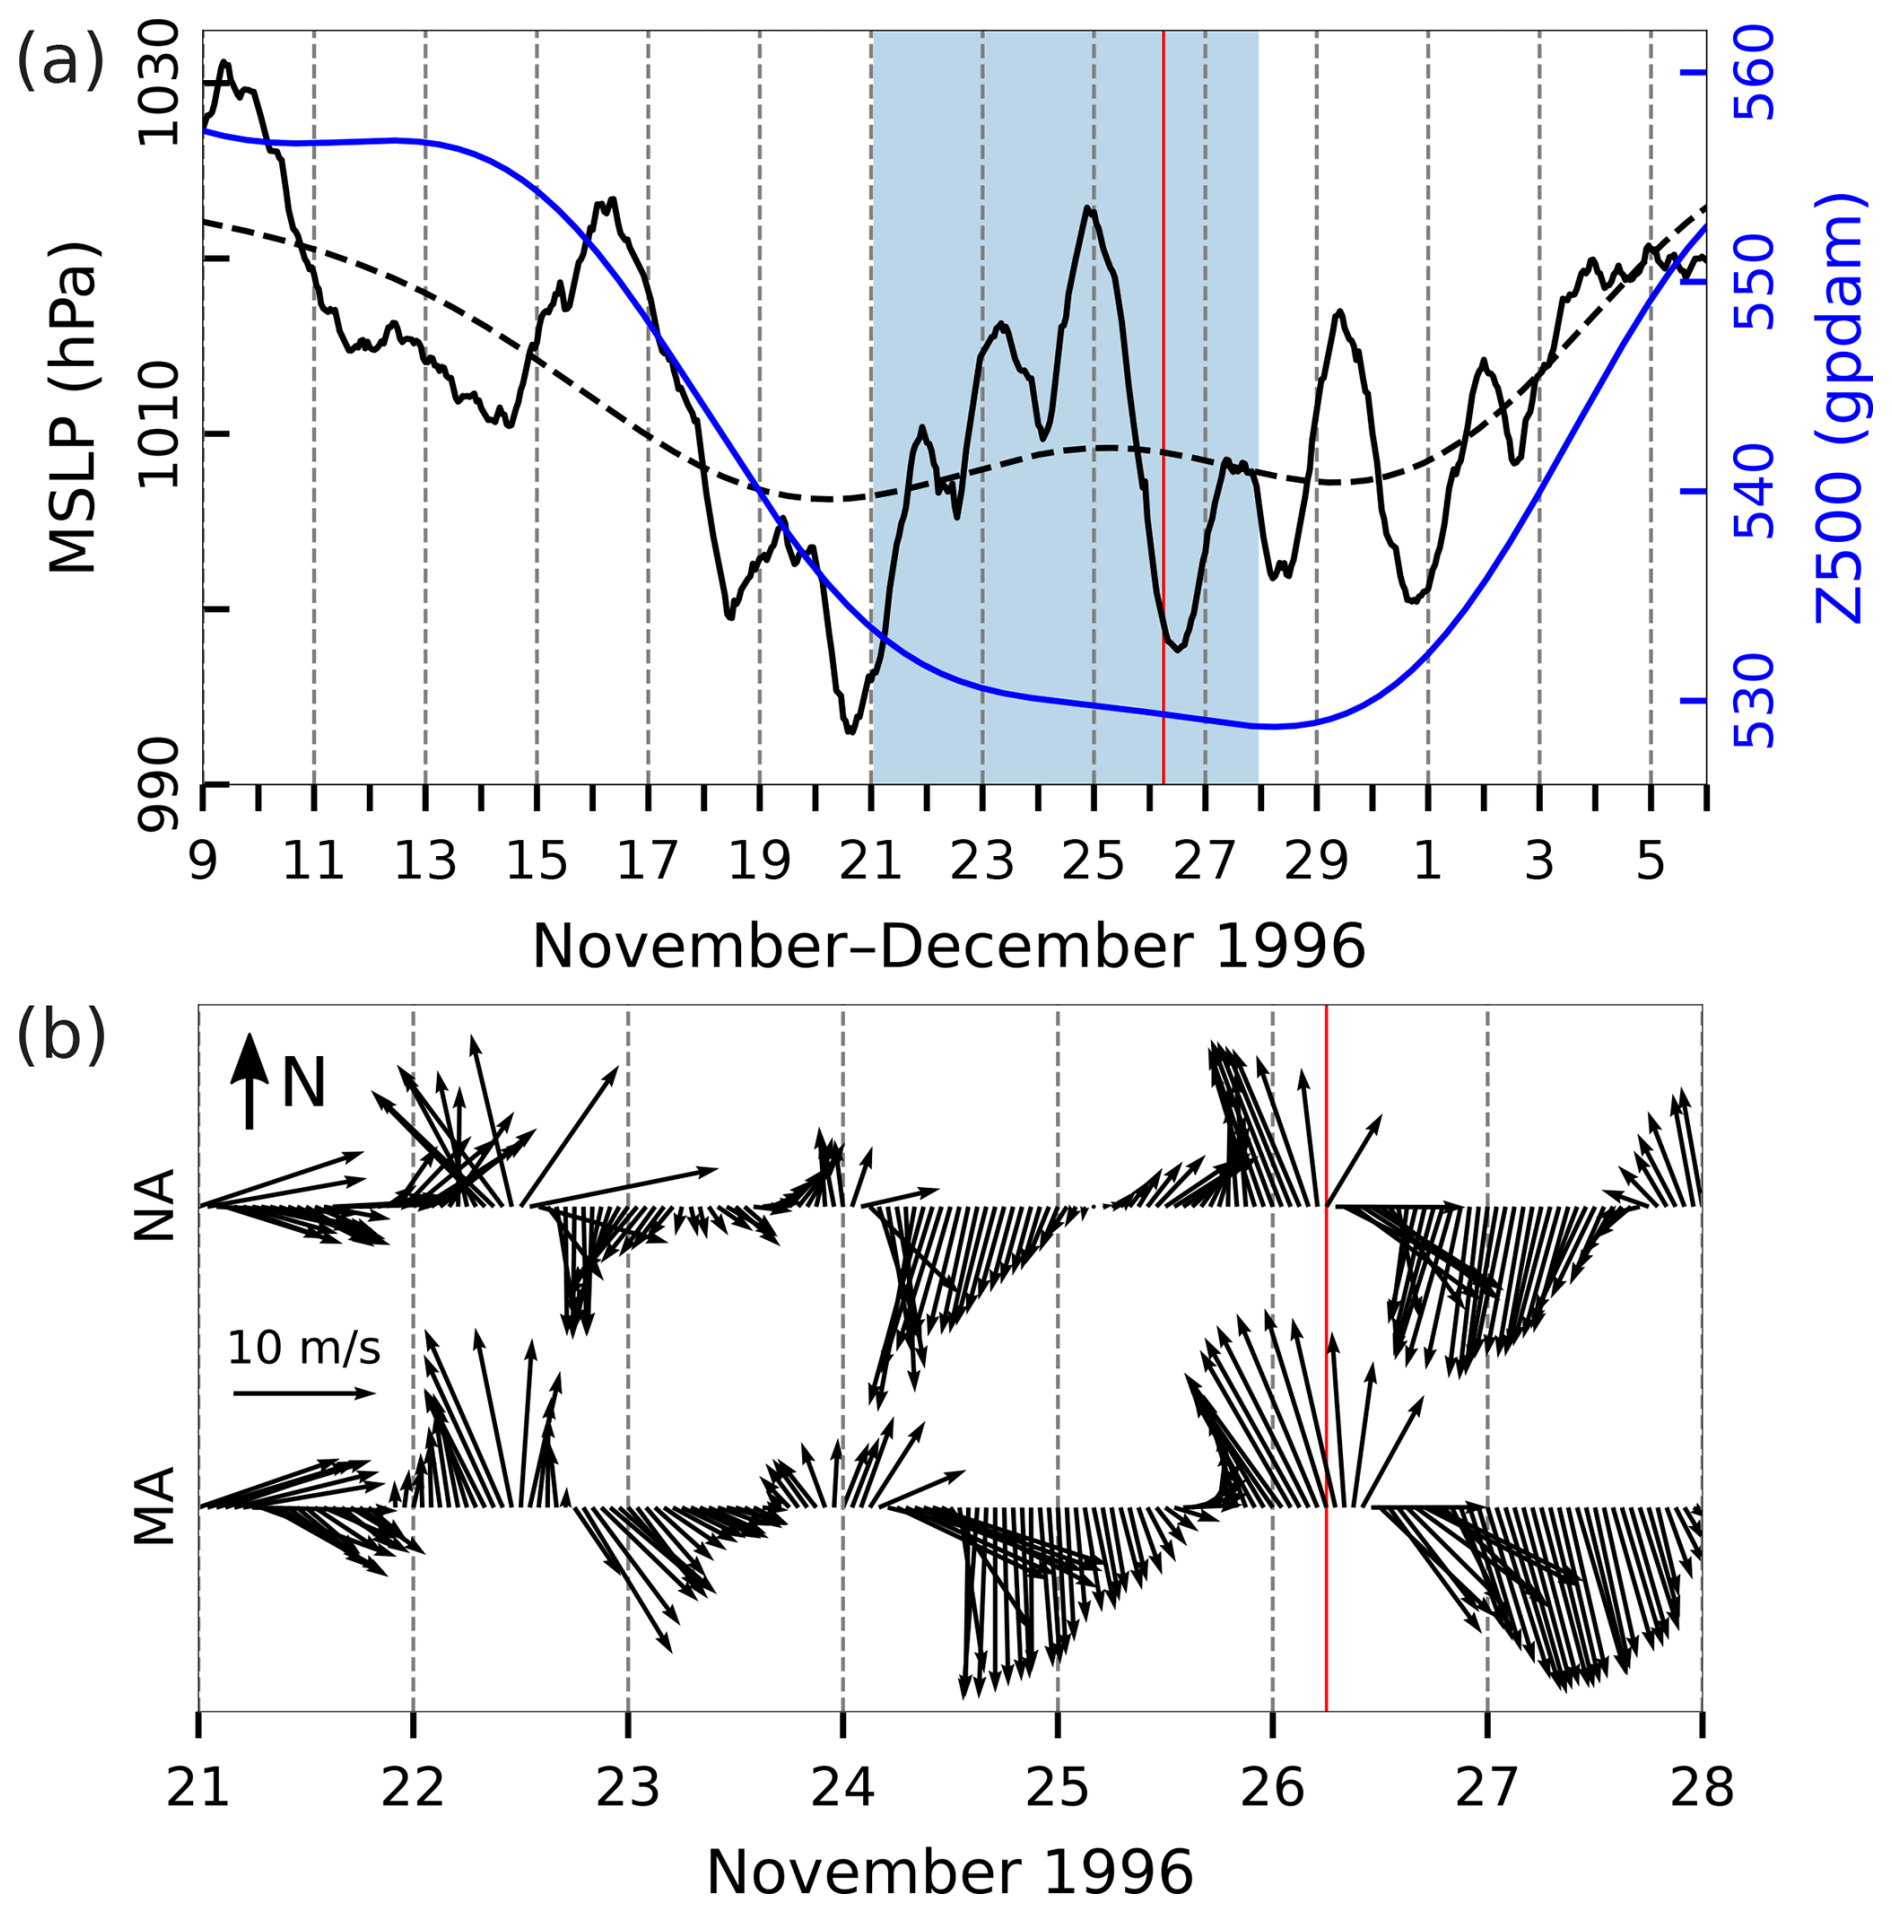
Figure 39Series of ERA5 reanalysis data related to the flood of 26 November 1996. (a) MSLP (hourly) and MSLP (lp) (low-pass filtered with a cut-off frequency of 10 d) and Z500 (lp) (low-pass filtered with a cut-off frequency of 10 d) at a grid point near TG Bakar. (b) Hourly W10 during the period marked in blue in the upper plot for the middle Adriatic (MA) and northern Adriatic (NA) (all locations marked in Fig. 1). The red line indicates the onset of the SL maximum.
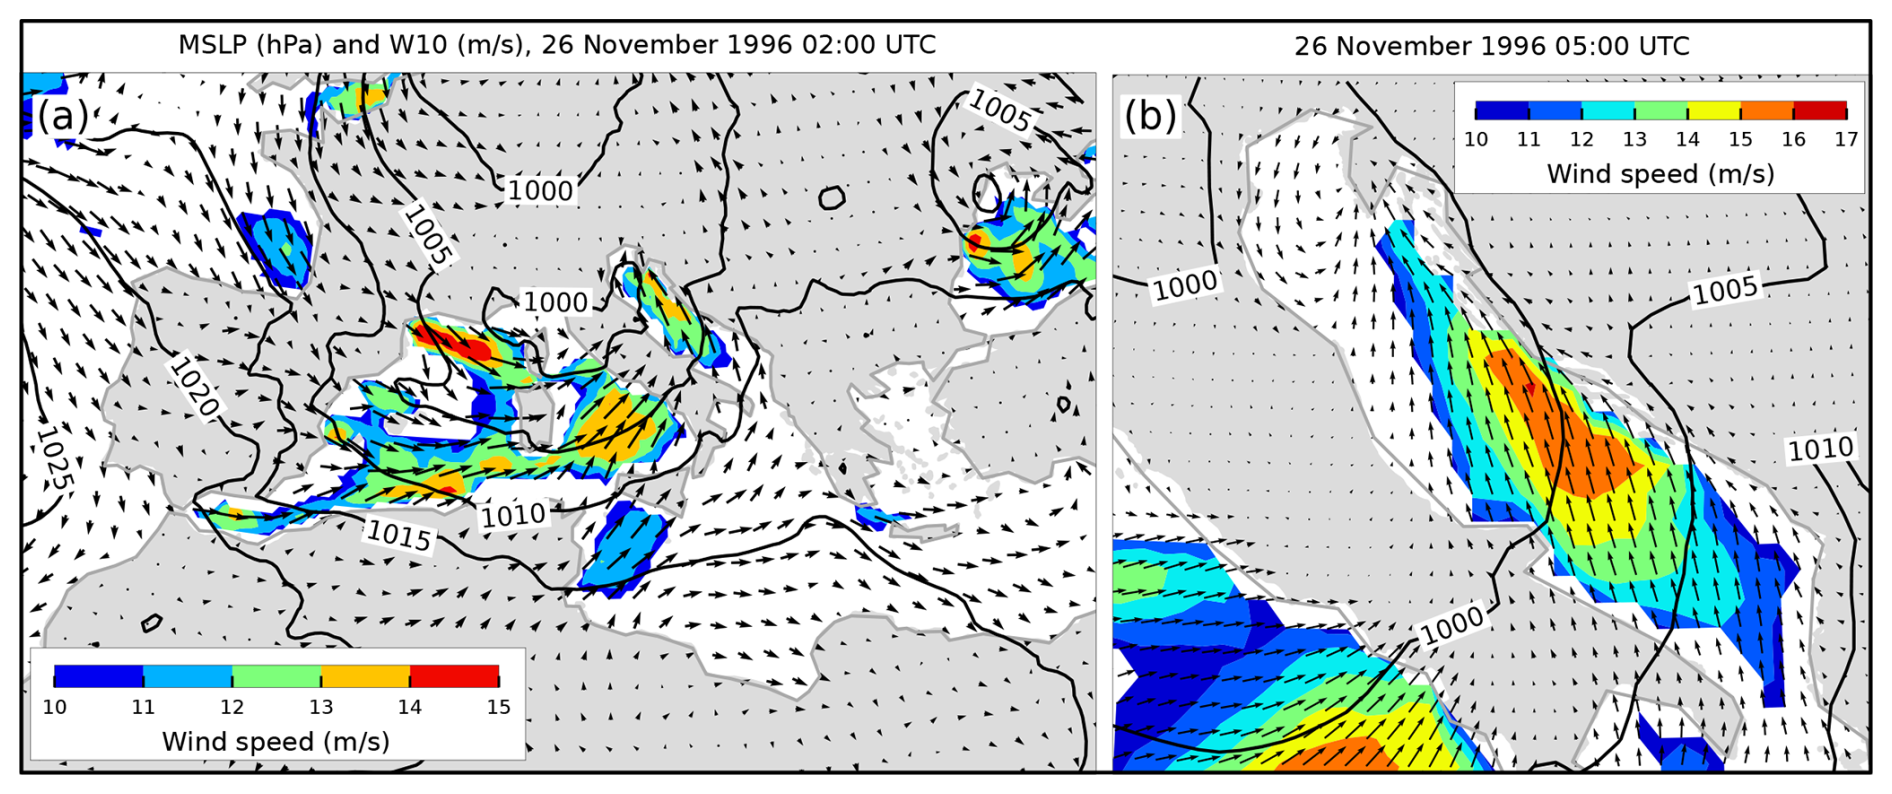
Figure 40MSLP (black lines) and W10 (arrows and colours) fields from the ERA5 reanalysis. Conditions (a) over the Mediterranean that preceded the situation (b) over the Adriatic Sea (an hour before maximum SL in Bakar). Only wind speeds exceeding 10 m s−1 are coloured.
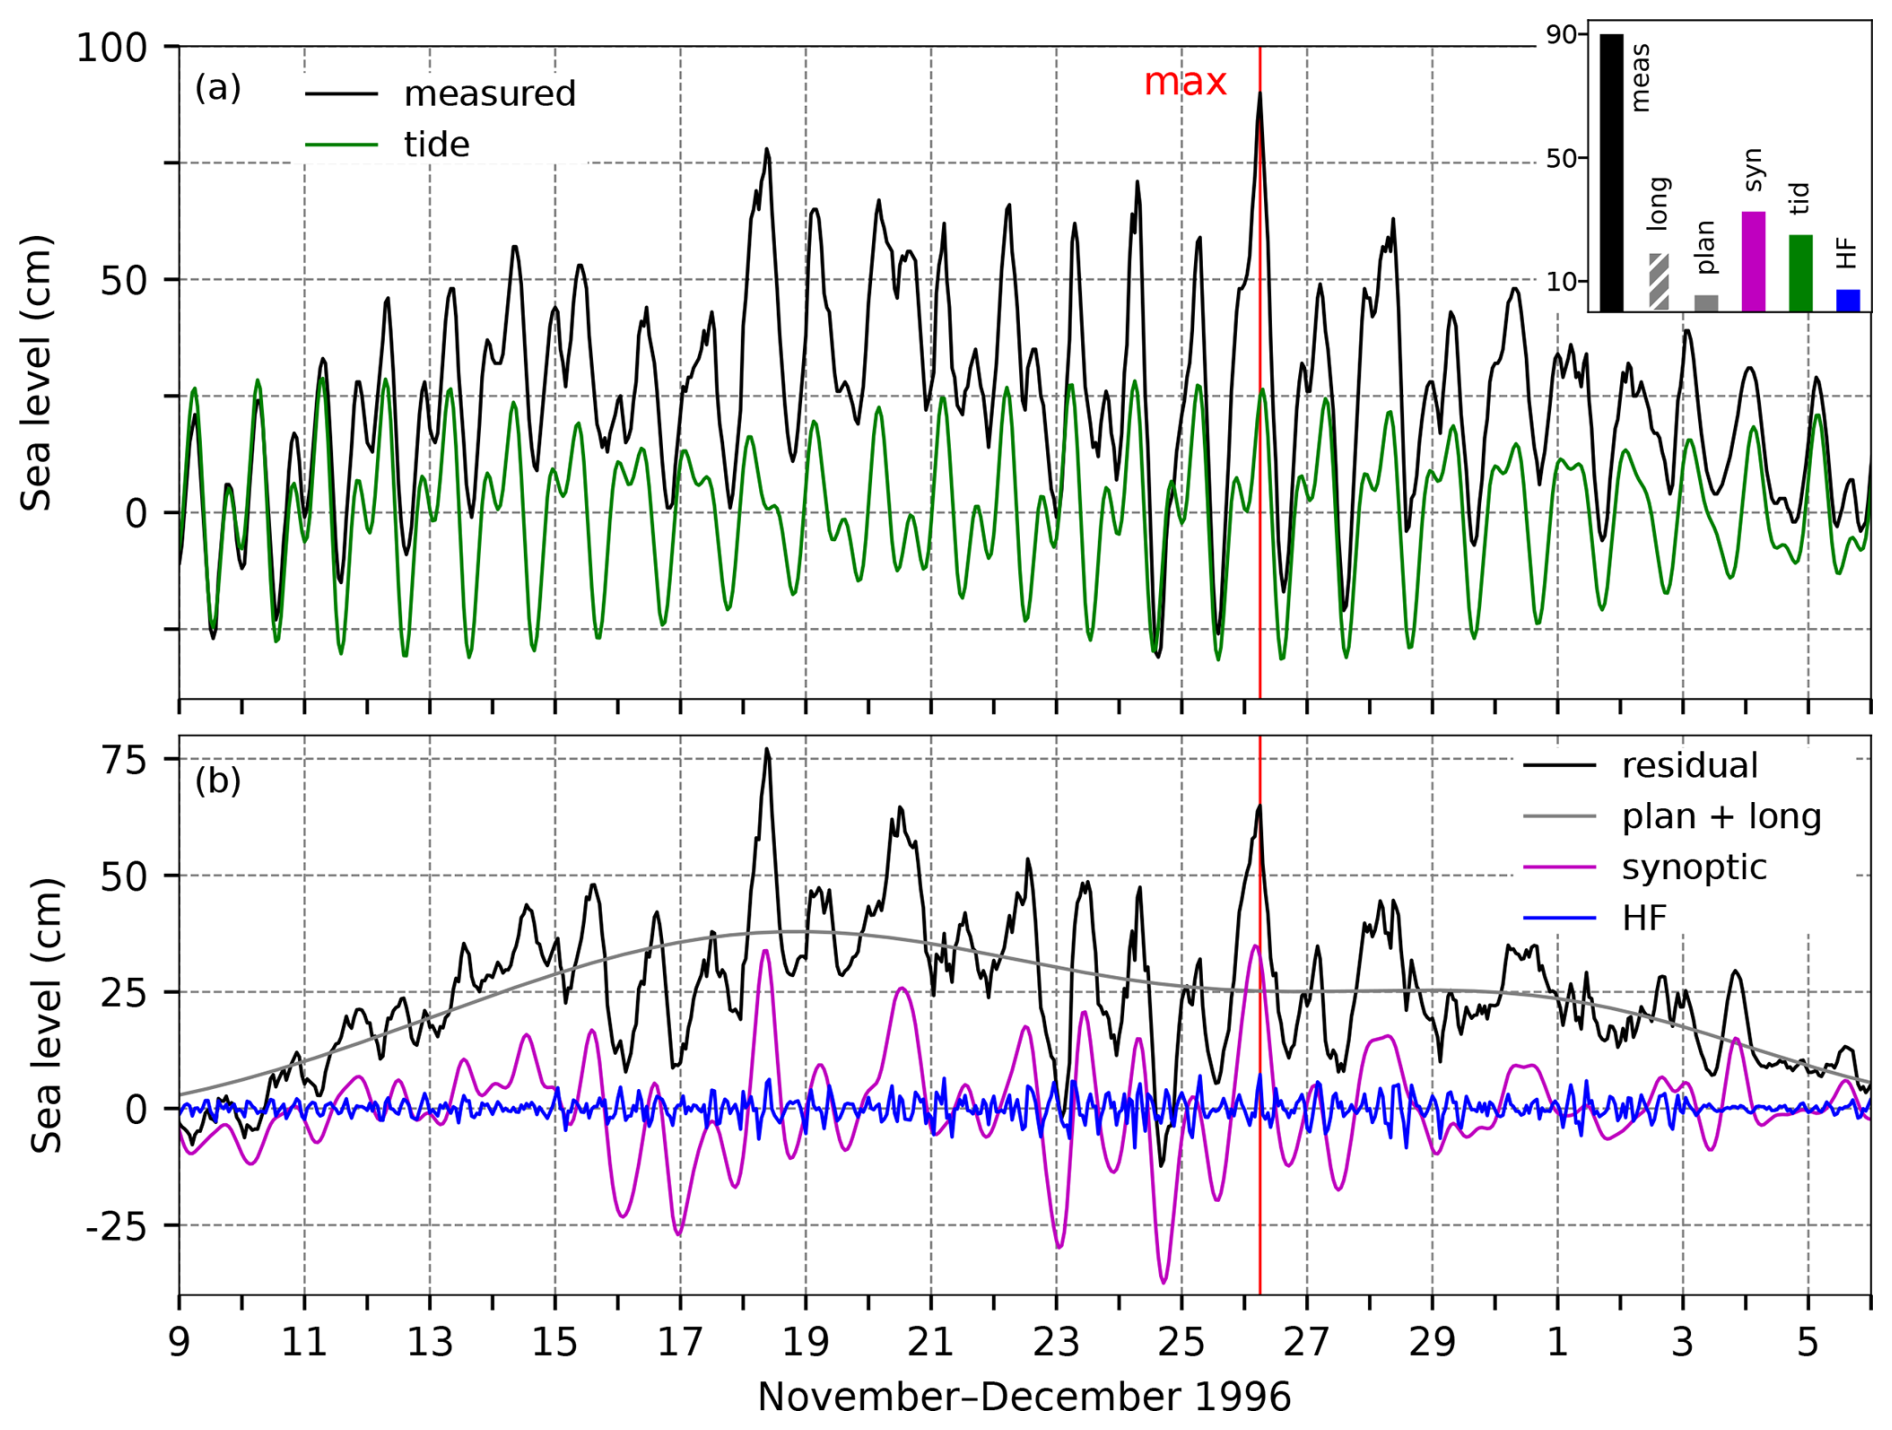
Figure 41SL series for the flood of 26 November 1996. Panel (a) shows the measured sea level (black) and tide (green). The inset figure shows the contributions (cm) of the five sea-level components to the maximum measured sea level (“meas”; 06:00 UTC): “HF” refers to high-frequency oscillations (2 h < T < 9 h), “syn” to synoptic component (9 h < T < 10 d), “tid” to tide, “plan” to planetary-scale variability (10 d < T < 100 d), and “long” to long-term sea-level variability (100 d < T). Panel (b) presents the residual sea level (black), the combined series of planetary-scale variability and long-term sea-level variability (grey; plan + long), synoptic component (purple), and high-frequency oscillations (blue). The red line indicates the time of occurrence of the total SL maximum.
4.13.2 Sea-level evolution
On 26 November 1996, at 06:00 UTC, the sea level in Bakar reached 90 cm above the long-term mean (Table 2, Fig. 41).
At that time, the moon was 2 d past the new moon, which meant that tide had a semidiurnal spring-tide character. The SL maximum coincided closely with the daily tidal peak, with tide contributing 25 cm.
High-frequency oscillations were active during the flood and added 7 cm to the total SL maximum.
In the week leading up to the flood, several cyclones passed through the area (Fig. 39a), generating Adriatic seiches (T ∼ 21.2 h). These seiches were induced and reinforced multiple times (Lionello et al., 2006). Residual and synoptic series (Fig. 41b) indicate that the last reinforcement occurred during the first half of 24 November, placing the seiche in a positive phase as a decisive storm surge developed. The total SL maximum occurred shortly after the peak in synoptic component, which amounted to 33 cm.
The preconditioning (estimated by assessing planetary-scale component) was weak (Fig. 41a, histogram). Sea level began to rise around 9 November (Fig. 41b, plan + long) due to a drop in air pressure (Fig. 39a, MSLP (lp)) and southeasterly winds at periods of 10–100 d (not shown). However, in the days leading up to the flood, around 20 November, air pressure started to increase and the wind shifted to westerly or northwesterly, resulting in a decrease in the SL (Fig. 41b). This change reduced the contribution of planetary-scale component to the flood to just 5 cm.
Long-term sea-level component (100 d < T) contributed 20 cm (Figs. 73 and A1), with intra-annual processes being the dominant factor, accounting for 16.2 cm. That year, intra-annual variability showed a large amplitude (Figs. 73d and A1), and the flood occurred at its peak. In contrast, longer-period processes were not significant: interannual variability contributed 1.1 cm (Fig. 73c) and mean sea-level change added 2.7 cm (Fig. 73b).
In summary, this maximum resulted from the positive effects of all involved processes, particularly synoptic component and tide (Fig. 41).
4.13.3 Flood impacts
For this event, the available literature in the National and University Library was reviewed; however, no mentions of the event impacts were found. The reason for this is unknown.
4.14 The flood of 1 December 2008 (ID 16; rank 2)
The meteorological and marine conditions that led to this flood have been empirically analysed (Međugorac et al., 2015, 2016), numerically modelled (Bertotti et al., 2011; Zampato et al., 2016; Bajo et al., 2019), or included in other analyses (Lionello et al., 2021). The episode was particularly severe along the eastern Adriatic coast, where it flooded not only the northern part but also large coastal stretches in the middle and southern Adriatic. The most intense flood before this episode occurred on 22 December 1979 (Table 2, ID 9).
4.14.1 Meteorological background
The period preceding this episode was characterised by intense cyclonic activity (Fig. 42a). On 27 November, a surface-based cyclone entered the Mediterranean area from the north of Africa. At the same time, the anticyclone over the Adriatic was weakening, and the air temperature was gradually dropping as the upper-level ridge began to shift eastward in front of the emerging widespread trough that affected the eastern Atlantic and stretched across western and central Europe. During the day, the centre of the surface-based cyclone was deepening while shifting towards the Gulf of Genoa, and it then continued over northern Italy and the Adriatic further to the east.
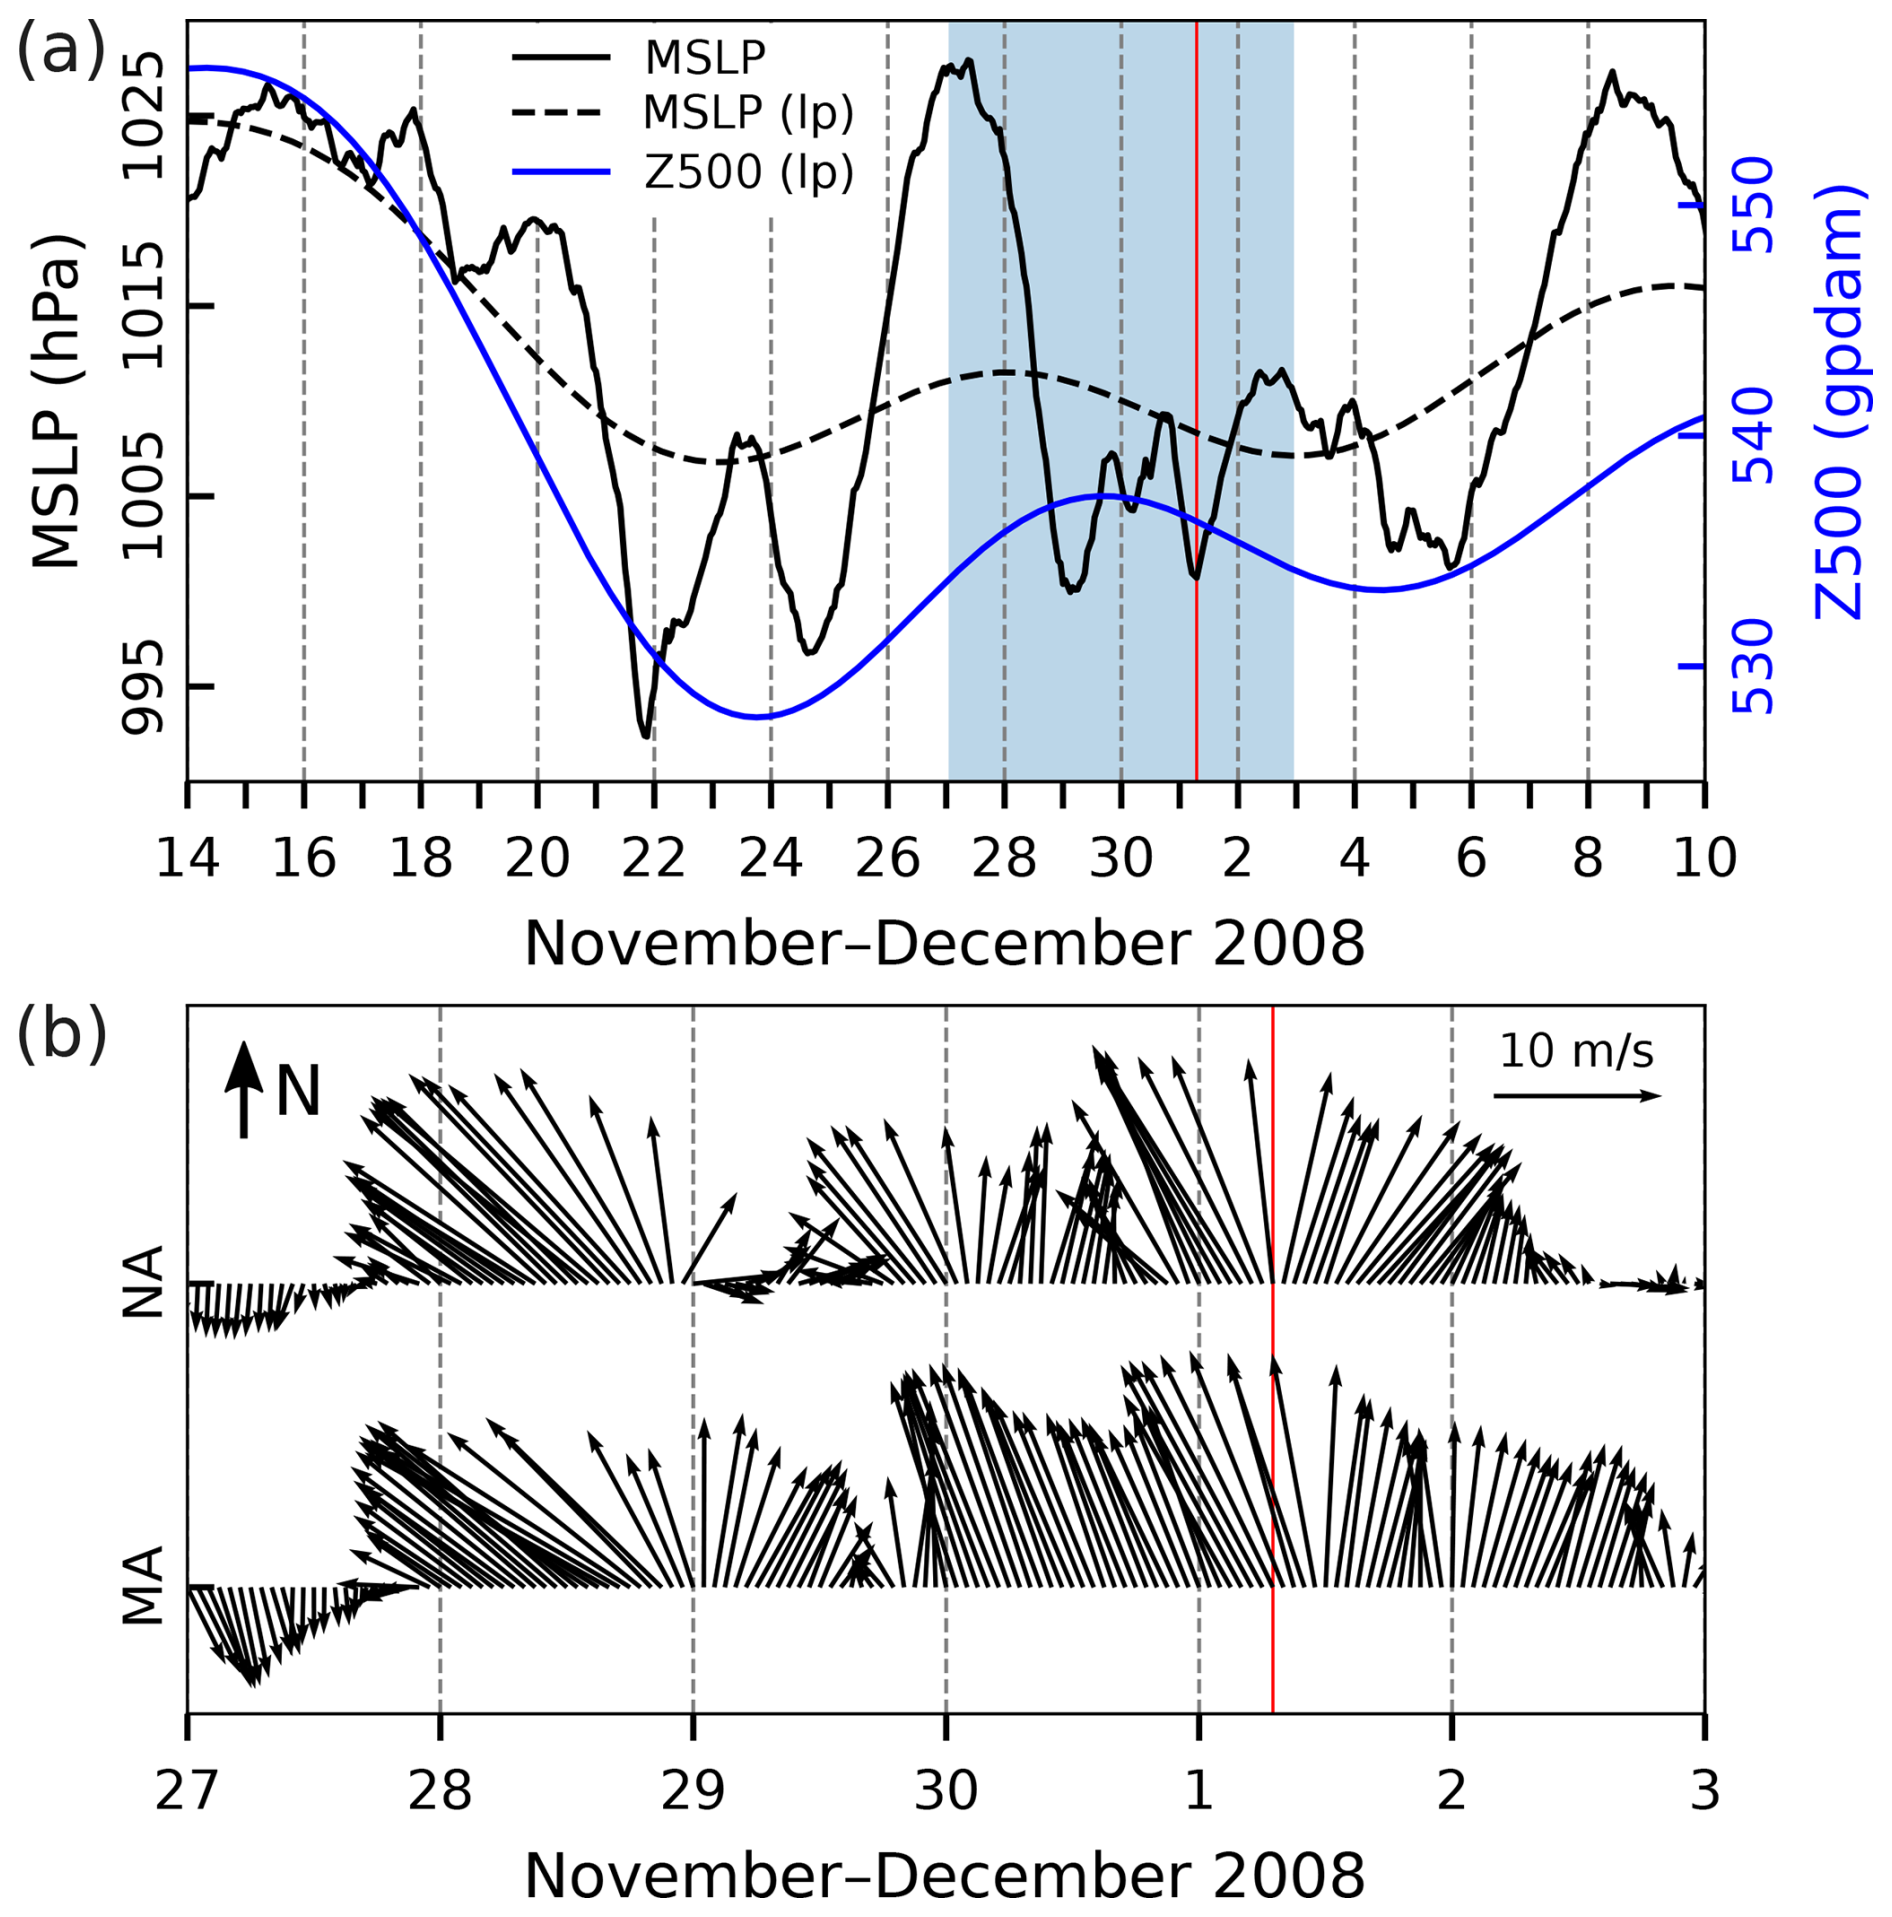
Figure 42Series of ERA5 reanalysis data related to the flood of 1 December 2008. (a) MSLP (hourly) and MSLP (lp) (low-pass filtered with a cut-off frequency of 10 d) and Z500 (lp) (low-pass filtered with a cut-off frequency of 10 d) at a grid point near TG Bakar. (b) Hourly W10 during the period marked in blue in the upper plot for the middle Adriatic (MA) and northern Adriatic (NA) (all locations marked in Fig. 1). The red line indicates the onset of the SL maximum.
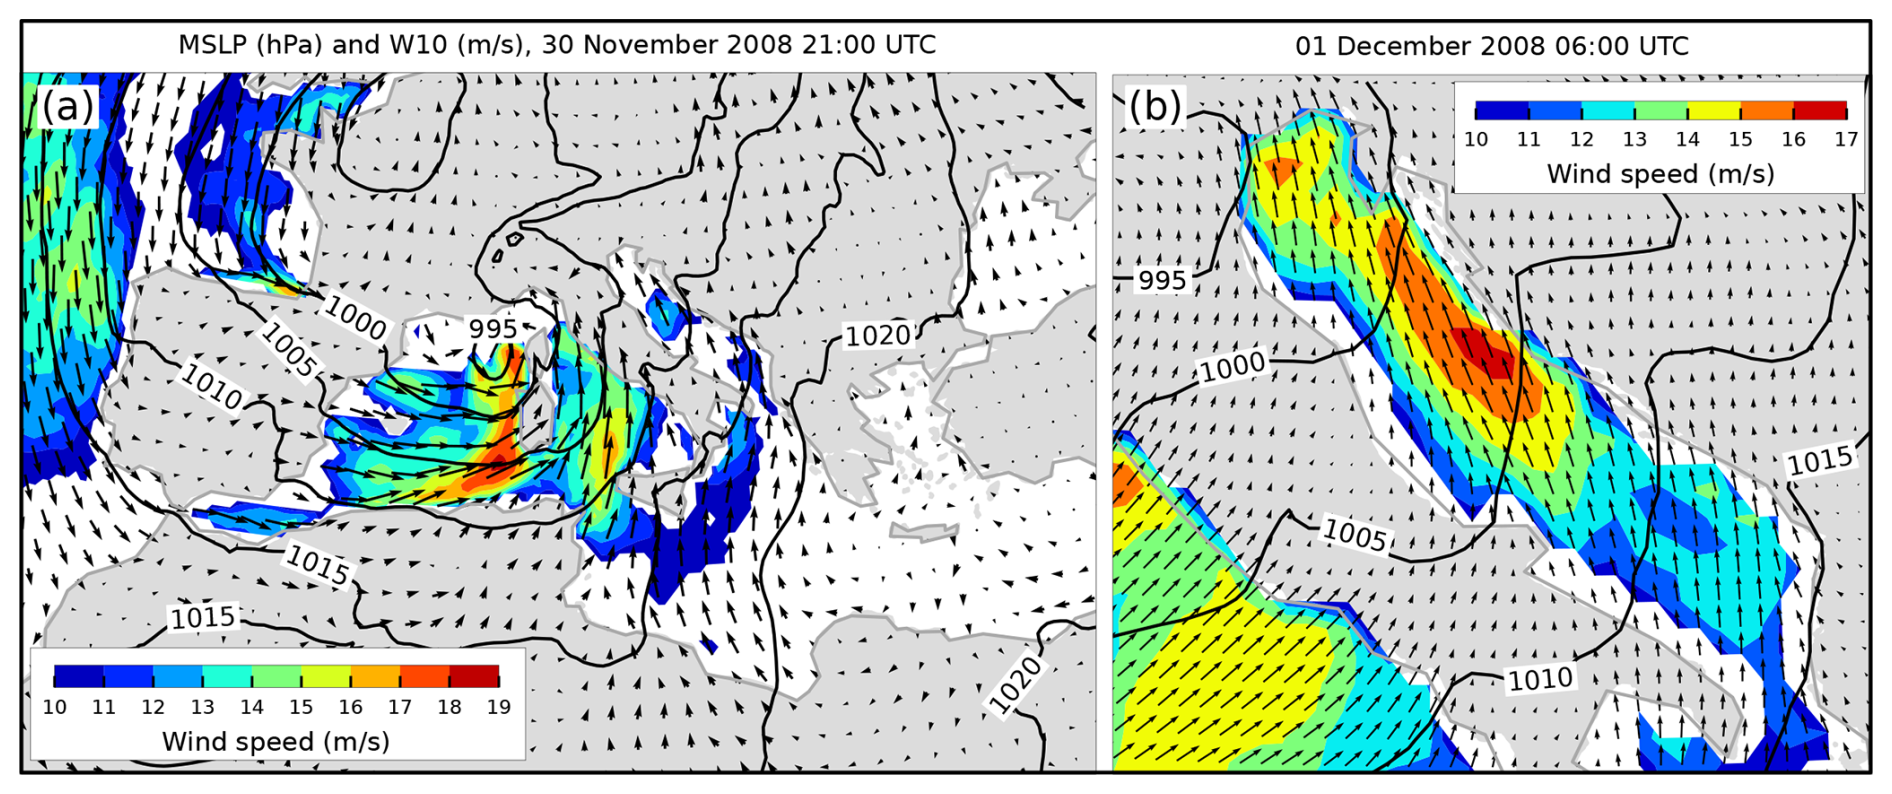
Figure 43MSLP (black lines) and W10 (arrows and colours) fields from the ERA5 reanalysis. Conditions (a) over the Mediterranean that preceded the situation (b) over the Adriatic Sea (an hour before maximum SL in Bakar). Only wind speeds exceeding 10 m s−1 are coloured.
With the arrival of an additional amount of cold and unstable air from the northwest of the continent in the upper levels, another cyclone developed in the Bay of Biscay during the night of 28–29 November, and the pressure at its centre dropped up to 985 hPa. During 29 November, the frontal system associated with this cyclone entered the western European mainland, causing the formation of a new cyclone in the Gulf of Lion. This new cyclone propagated eastward quite fast, and its frontal system affected the Adriatic area on 30 November. At the same time, the centre of another cyclone that originated from the Bay of Biscay moved over France, and due to the constant inflow of the cold air within the upper-level trough over western Europe and the Mediterranean, a new surface-based cyclone formed over the western Mediterranean. The cyclone rapidly advanced towards the Gulf of Genoa, intensifying to 995 hPa, before moving across northern Italy (Fig. 43) and further over the Adriatic towards the northeast. On 1 December, an air-pressure gradient of ∼ 20 hPa (800 km)−1 developed over the Adriatic, accompanied by sirocco wind that reached higher speeds near the eastern coastline (Fig. 43b). Synoptic situations like this, long-lasting low air pressure and the constant propagation of several cyclones and their frontal systems, caused quite strong southerly winds over the Adriatic for days (Fig. 42b), as well as locally heavy precipitation. On 1 December, precipitation reached up to 25 mm in the northern Adriatic and 5–20 mm in the middle Adriatic. On 2 December, amounts increased to up to 30 mm in the northern Adriatic and up to 25 mm in the middle Adriatic.
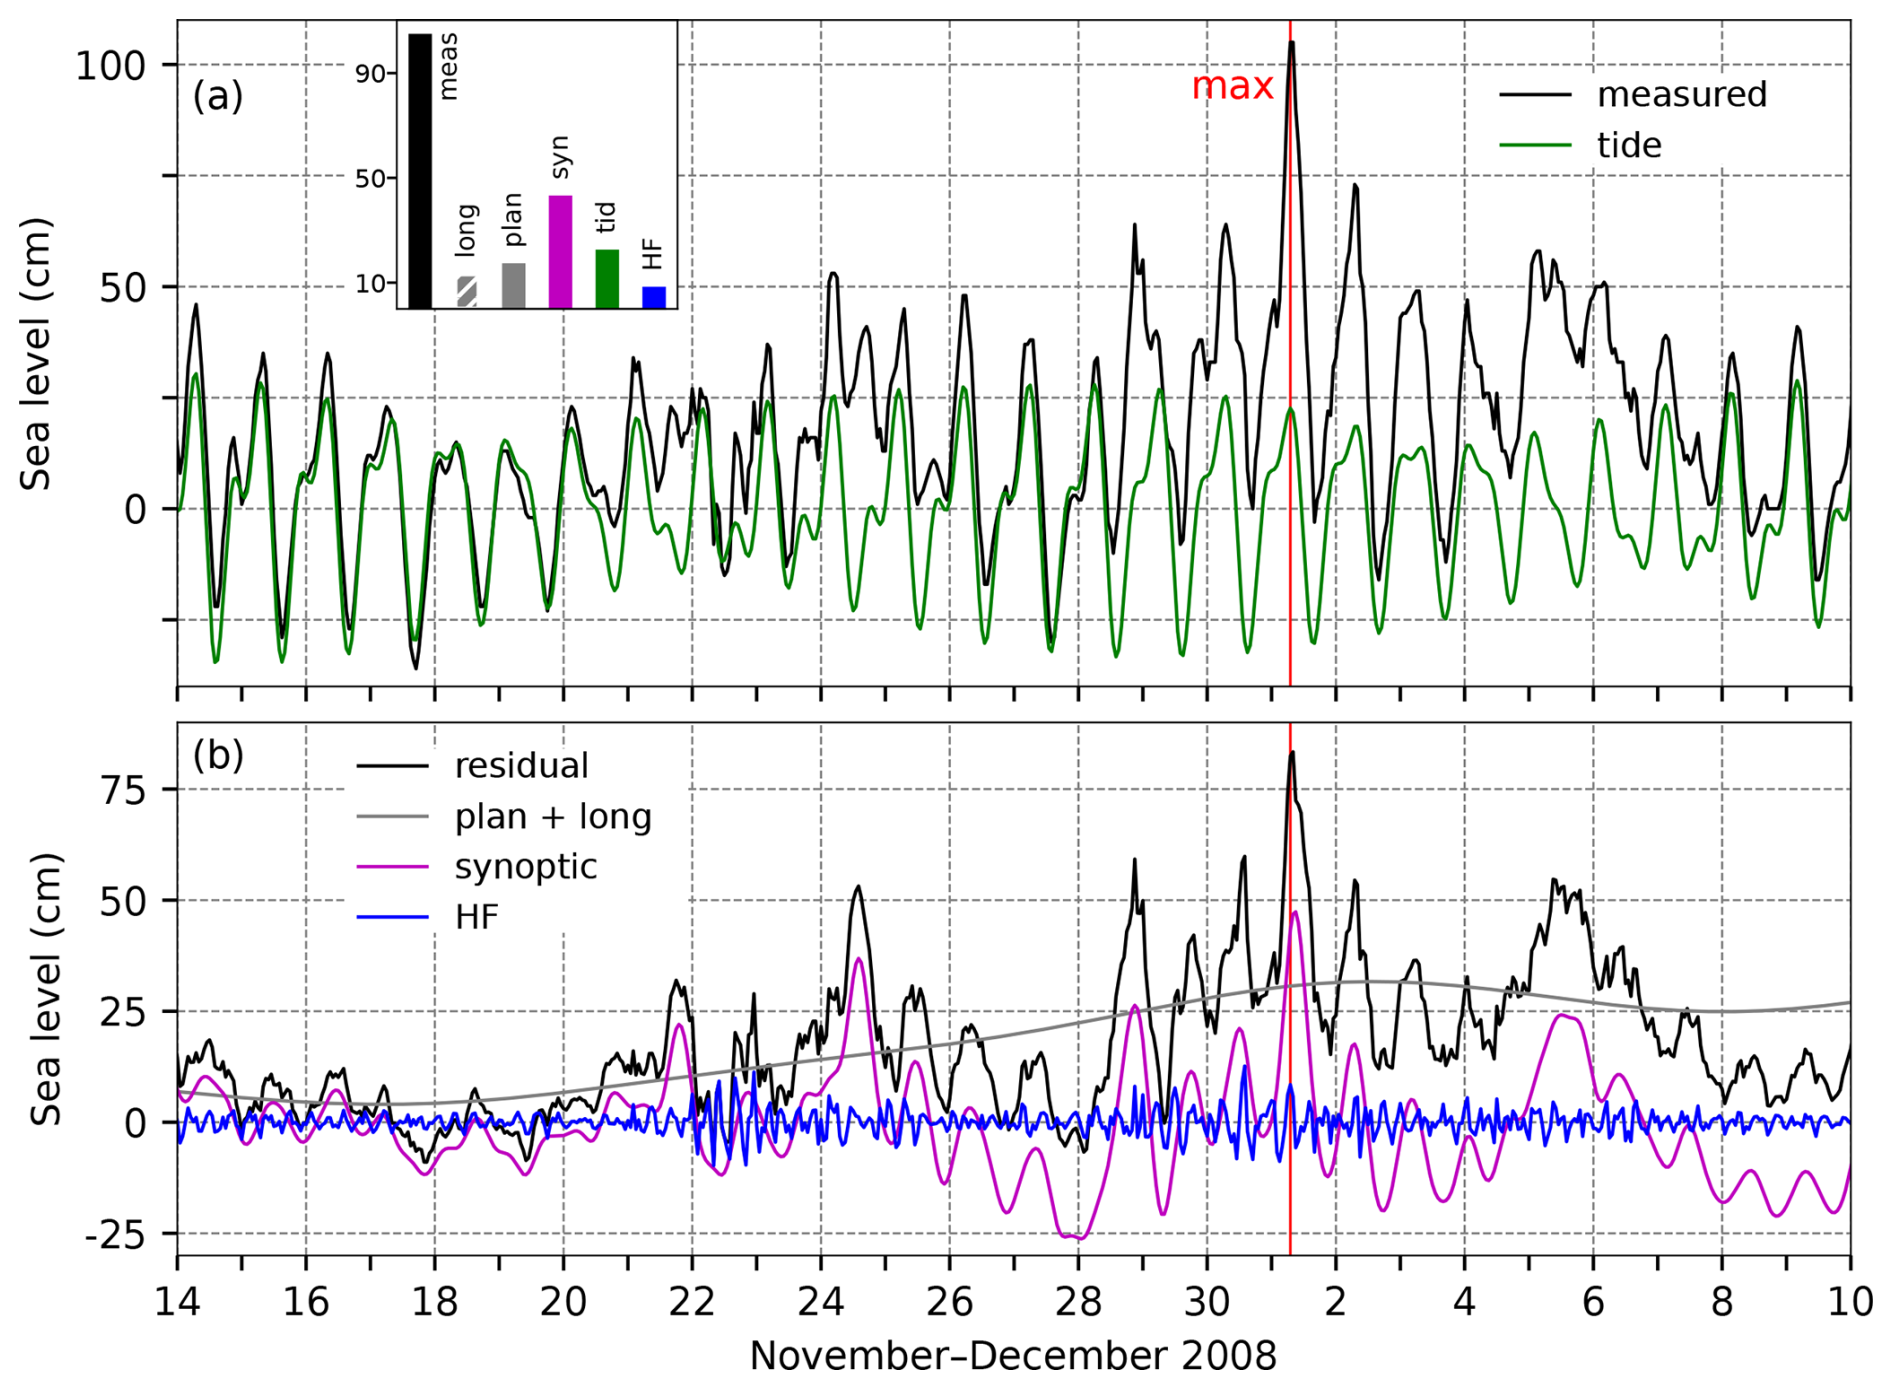
Figure 44SL series for the flood of 1 December 2008. Panel (a) shows the measured sea level (black) and tide (green). The inset figure shows the contributions (cm) of the five sea-level components to the maximum measured sea level (“meas”; 07:00 UTC): “HF” refers to high-frequency oscillations (2 h < T < 9 h), “syn” to synoptic component (9 h < T < 10 d), “tid” to tide, “plan” to planetary-scale variability (10 d < T < 100 d), and “long” to long-term sea-level variability (100 d < T). Panel (b) presents the residual sea level (black), the combined series of planetary-scale variability and long-term sea-level variability (grey; plan + long), synoptic component (purple), and high-frequency oscillations (blue). The red line indicates the time of occurrence of the total SL maximum.
4.14.2 Sea-level evolution
In the morning hours of 1 December 2008 (07:00 UTC), the sea level in Bakar rose to 105 cm above the long-term average (Table 2, Fig. 44).
The moon was 3 d past the new moon, which gave tide a semidiurnal spring-tide character. The total SL maximum formed during the daily maximum of tide, which was 23 cm.
High-frequency oscillations were active during the flood, and their contribution amounted to 9 cm.
The SL maximum formed immediately before the maximum of synoptic component, influenced in part by pre-existing seiches. Figure 44 shows that the natural basin oscillations of variable height were present in synoptic component from 21 November. They were supported by a series of cyclones that crossed the Adriatic Sea before the flood (Fig. 42a) and that caused sudden wind changes, triggering and reinforcing seiches (Fig. 42b). Considering the period of the natural oscillations (T ∼ 21.2 h) and the timing of their amplification (strong peak of the residual SL the day before the maximum), it is obvious that they contributed positively to the flood. Due to the pre-existing oscillations and the storm surge triggered by the strong winds that developed over the entire middle Adriatic, with maximum speeds closer to the eastern coast (Fig. 43b), the synoptic SL response was high and amounted to 43 cm.
A planetary-scale atmospheric disturbance, closely related to passage of Rossby waves in the middle troposphere (indicated by Z500 (lp) in Fig. 42a), induced a gradual rise in SL, beginning approximately 14 d before the flood (Fig. 44b, plan + long). This SL increase was influenced by the MSLP (lp) and W10 at 10–100 d periods. The MSLP (lp) drop supported the SL increase until 23 November, after which the MSLP (lp) began to rise. Nonetheless, the SL continued to increase, supported by southerly winds at 10–100 d periods with speeds of up to 3 m s−1. Planetary-scale component contributed 17 cm to this flood.
Long-term sea-level variability (100 d < T) contributed 13 cm to the maximum (Figs. 73 and A1). This episode coincided with the annual peak in intra-annual variability, which accounted for 7.1 cm (Fig. 73d). The contribution from interannual variability was minimal (0.6 cm; Fig. 73c), while mean sea-level change added 5.3 cm (Fig. 73b).
In summary, the flood developed as a positive superposition of all the SL processes involved, of which synoptic component was the largest (Fig. 44a).
4.14.3 Flood impacts
The following impacts of the episode are listed using available daily newspapers from 2 December 2008 (Jutarnji list, Novi list, Slobodna Dalmacija, Večernji list, and Vjesnik, Novi list, 2008a) and 3 December 2008 (Novi list, Novi list, 2008b). The coastal regions of the northern and middle Adriatic experienced exceptionally high sea levels. Storm surge flooded the streets and squares along the coast, roads, farmers' markets, beaches, shops, restaurants, cafés, and residential and business areas. In the northern Adriatic county of Primorje-Gorski Kotar, damage amounting to several tens of thousands of euros was reported. Additionally, the following effects were reported in the northern Adriatic: (i) exceptionally strong sirocco winds (with wind gusts of up to 26 m s−1 in Rijeka) knocked down trees and ripped roofs off houses, (ii) local ferry and catamaran lines were disrupted, and (iii) multi-ton concrete slabs at a public beach were displaced. In the middle Adriatic, ferry and catamaran services were also disrupted, and several coastal towns were flooded, with water reaching the highest levels in Šibenik (Fig. 1), up to 1 m in height.
4.15 The floods of 23 and 25 December 2009 (IDs 17 and 18; ranks 6 and 3)
The flood of 25 December 2009 was studied by Bajo et al. (2019), who investigated the effects of data assimilation on the reproduction of the SL, which was significantly affected by the previously generated seiches.
4.15.1 Meteorological background
In the days before the SL peaks in Bakar, several cyclones moved across the Adriatic, causing spatially variable winds over the Adriatic and several episodes of strong and prolonged southeasterly and southerly winds (Fig. 45). This pronounced cyclonic activity was supported by a vast upper-level trough that encompassed a large part of the European mainland – stretching from Greenland in the north and North Africa in the south across southeastern and central Europe, all the way to the Russian border in the east. At the leading edge of the trough, the upper-level flow was southwesterly, bringing unusually warm air from northern Africa towards the Adriatic.
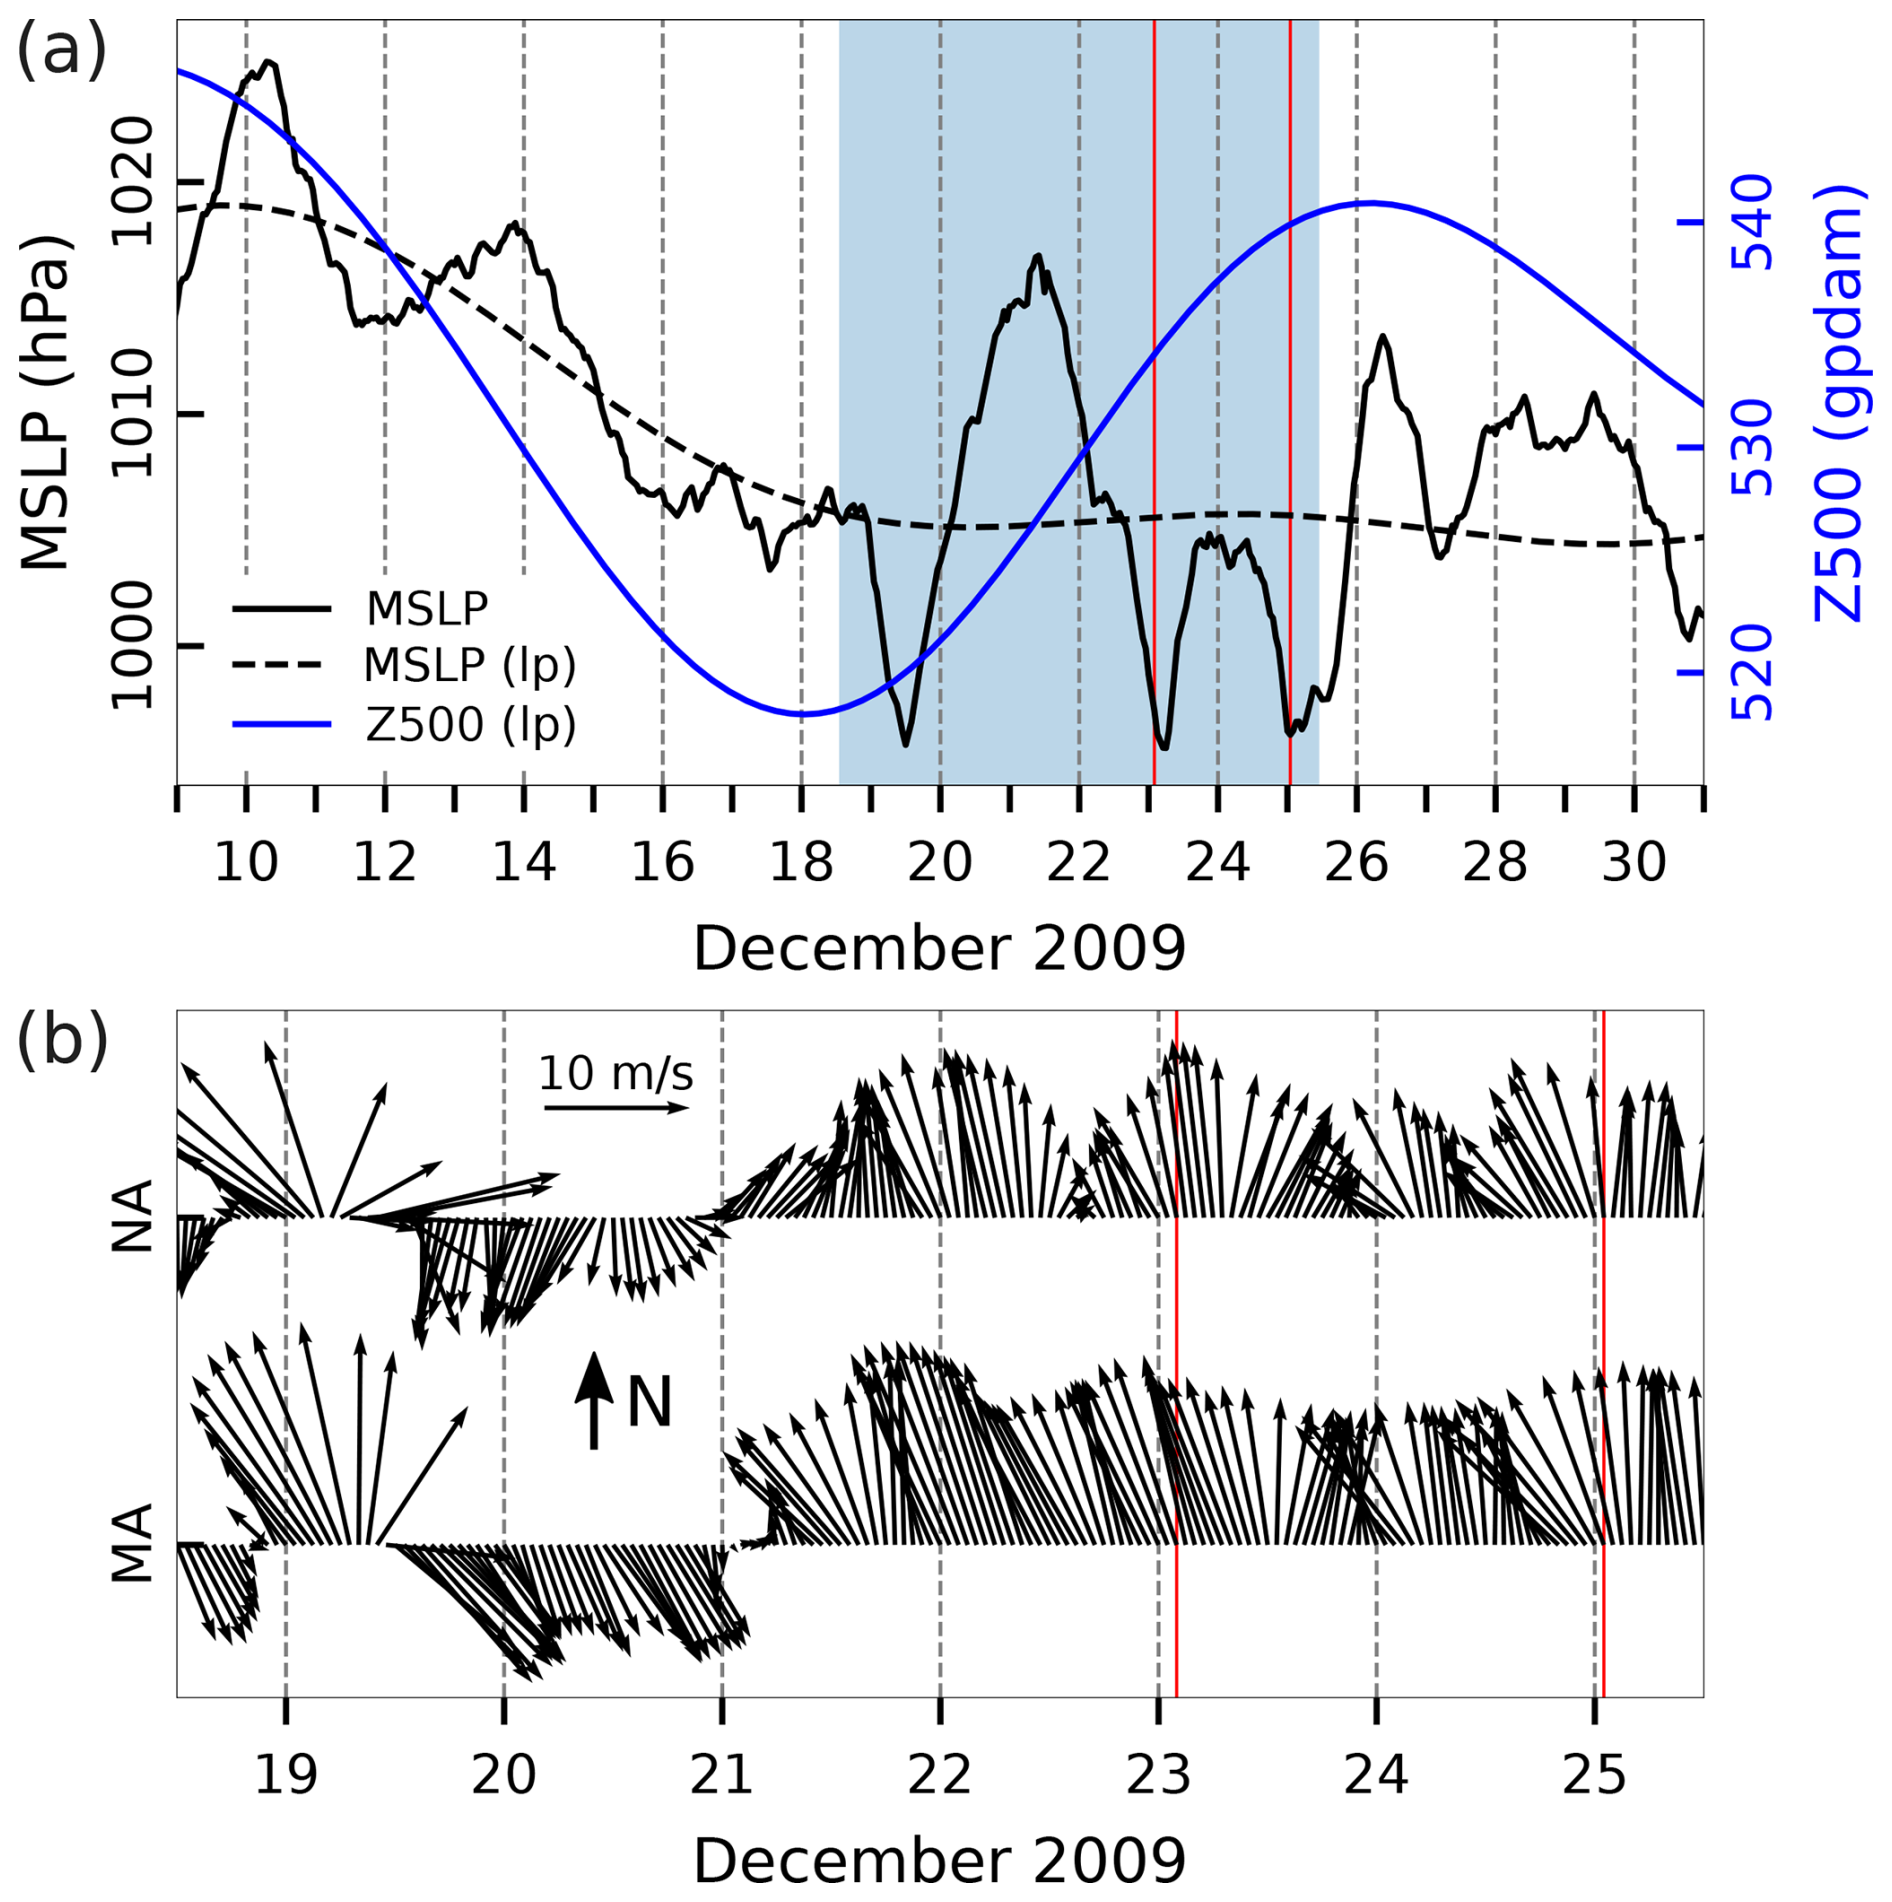
Figure 45Series of ERA5 reanalysis data related to the floods of 23 and 25 December 2009. (a) MSLP (hourly) and MSLP (lp) (low-pass filtered with a cut-off frequency of 10 d) and Z500 (lp) (low-pass filtered with a cut-off frequency of 10 d) at a grid point near TG Bakar. (b) Hourly W10 during the period marked in blue in the upper plot for the middle Adriatic (MA) and northern Adriatic (NA) (all locations marked in Fig. 1). The red lines indicate onset of the SL maxima.
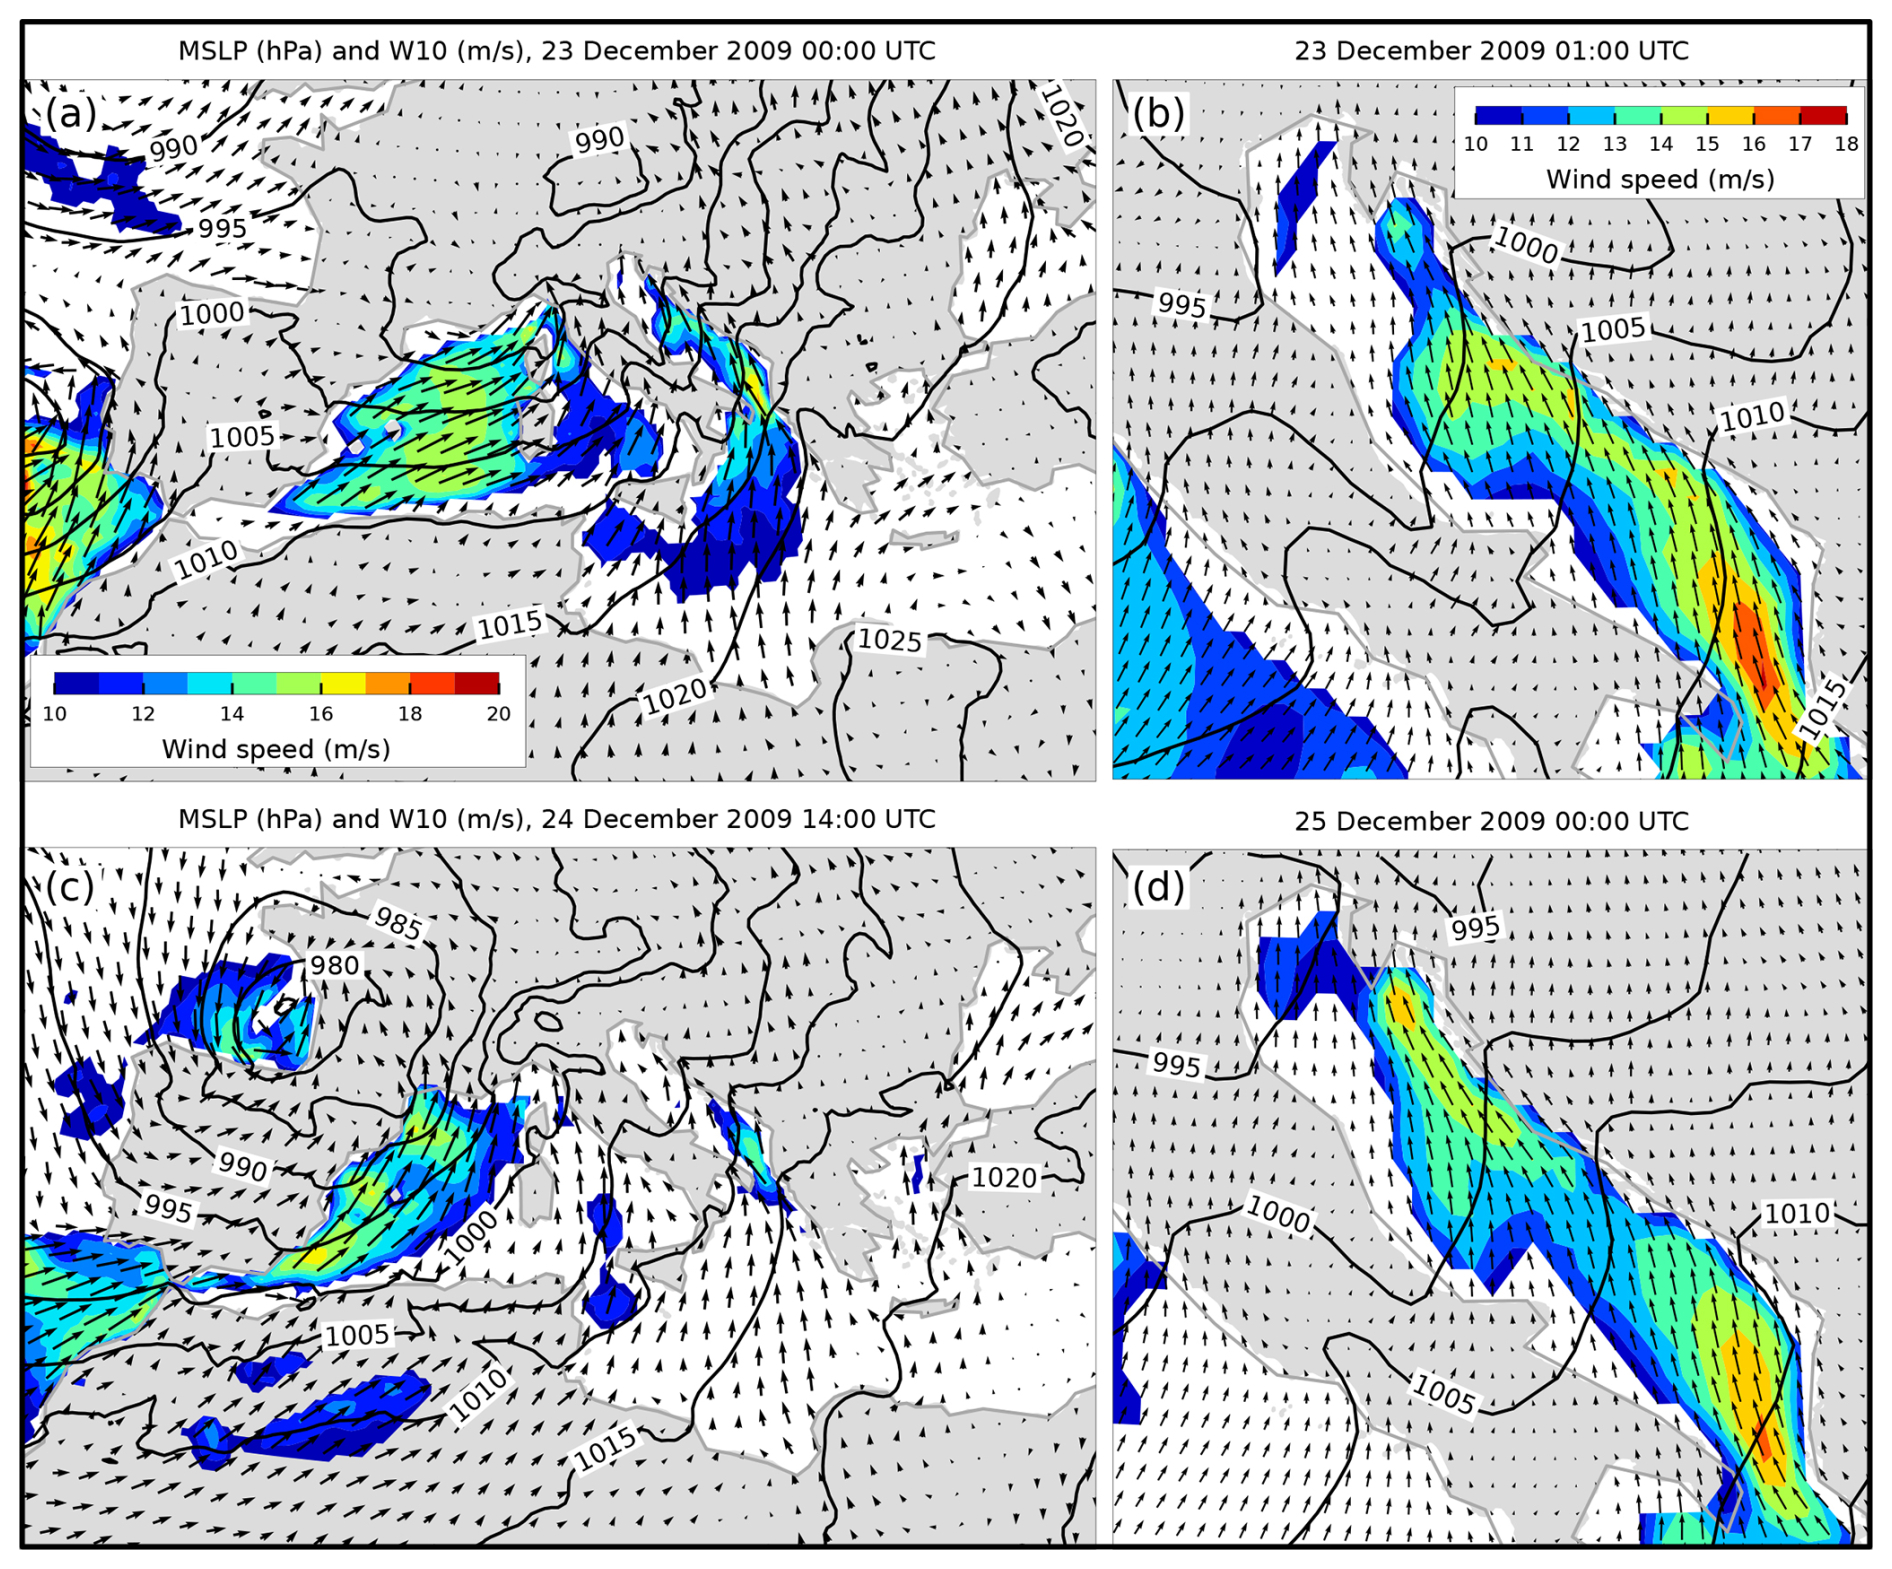
Figure 46MSLP (black lines) and W10 (arrows and colours) fields from the ERA5 reanalysis. Conditions (a, c) over the Mediterranean that preceded the situations (b, d) over the Adriatic Sea (an hour before maxima SL in Bakar). Only wind speeds exceeding 10 m s−1 are coloured. The left colour bar is for the Mediterranean and the right one is for the Adriatic.
On 23 December, at 00:00 UTC, a decisive cyclone formed over the Gulf of Genoa (Fig. 46a; DWD, 2024). As a result of the increasing air-pressure gradient along the Adriatic, strong sirocco wind started blowing, reaching its peak shortly before the occlusion front passed over the Adriatic (Figs. 45b and 46b; DWD, 2024, for occlusion front). The wind significantly weakened after the passage of the front. On 23 December, precipitation was more intense in the northern Adriatic, with recorded amounts of 110 mm in Rijeka and 67 mm in Bakar, while in the middle Adriatic, it reached up to 20 mm.
On 24 December a deep cyclone, with a minimum air pressure of 975 hPa, was located over the Bay of Biscay (Fig. 46c). On 25 December, this cyclone moved further northeast over France and Germany. At the same time, the weather situation over Croatia and the Adriatic was under the strong influence of another cyclone positioned over northern Italy, in the centre of which the air pressure was less than 995 hPa. These conditions caused precipitation that was more intense in the northern Adriatic, with 110 mm recorded in Matulji and 70 mm in Brseč (both near Rijeka), compared to the middle Adriatic, where amounts ranged between 15 and 25 mm. These two cyclones, together with a large anticyclone in the east of the continent, caused a strong pressure gradient between eastern and western Europe. As a result, there was also a strong air-pressure gradient over the Adriatic Sea, so that strong southeasterly winds blew over the Adriatic region for several days (Figs. 45b and 46d).
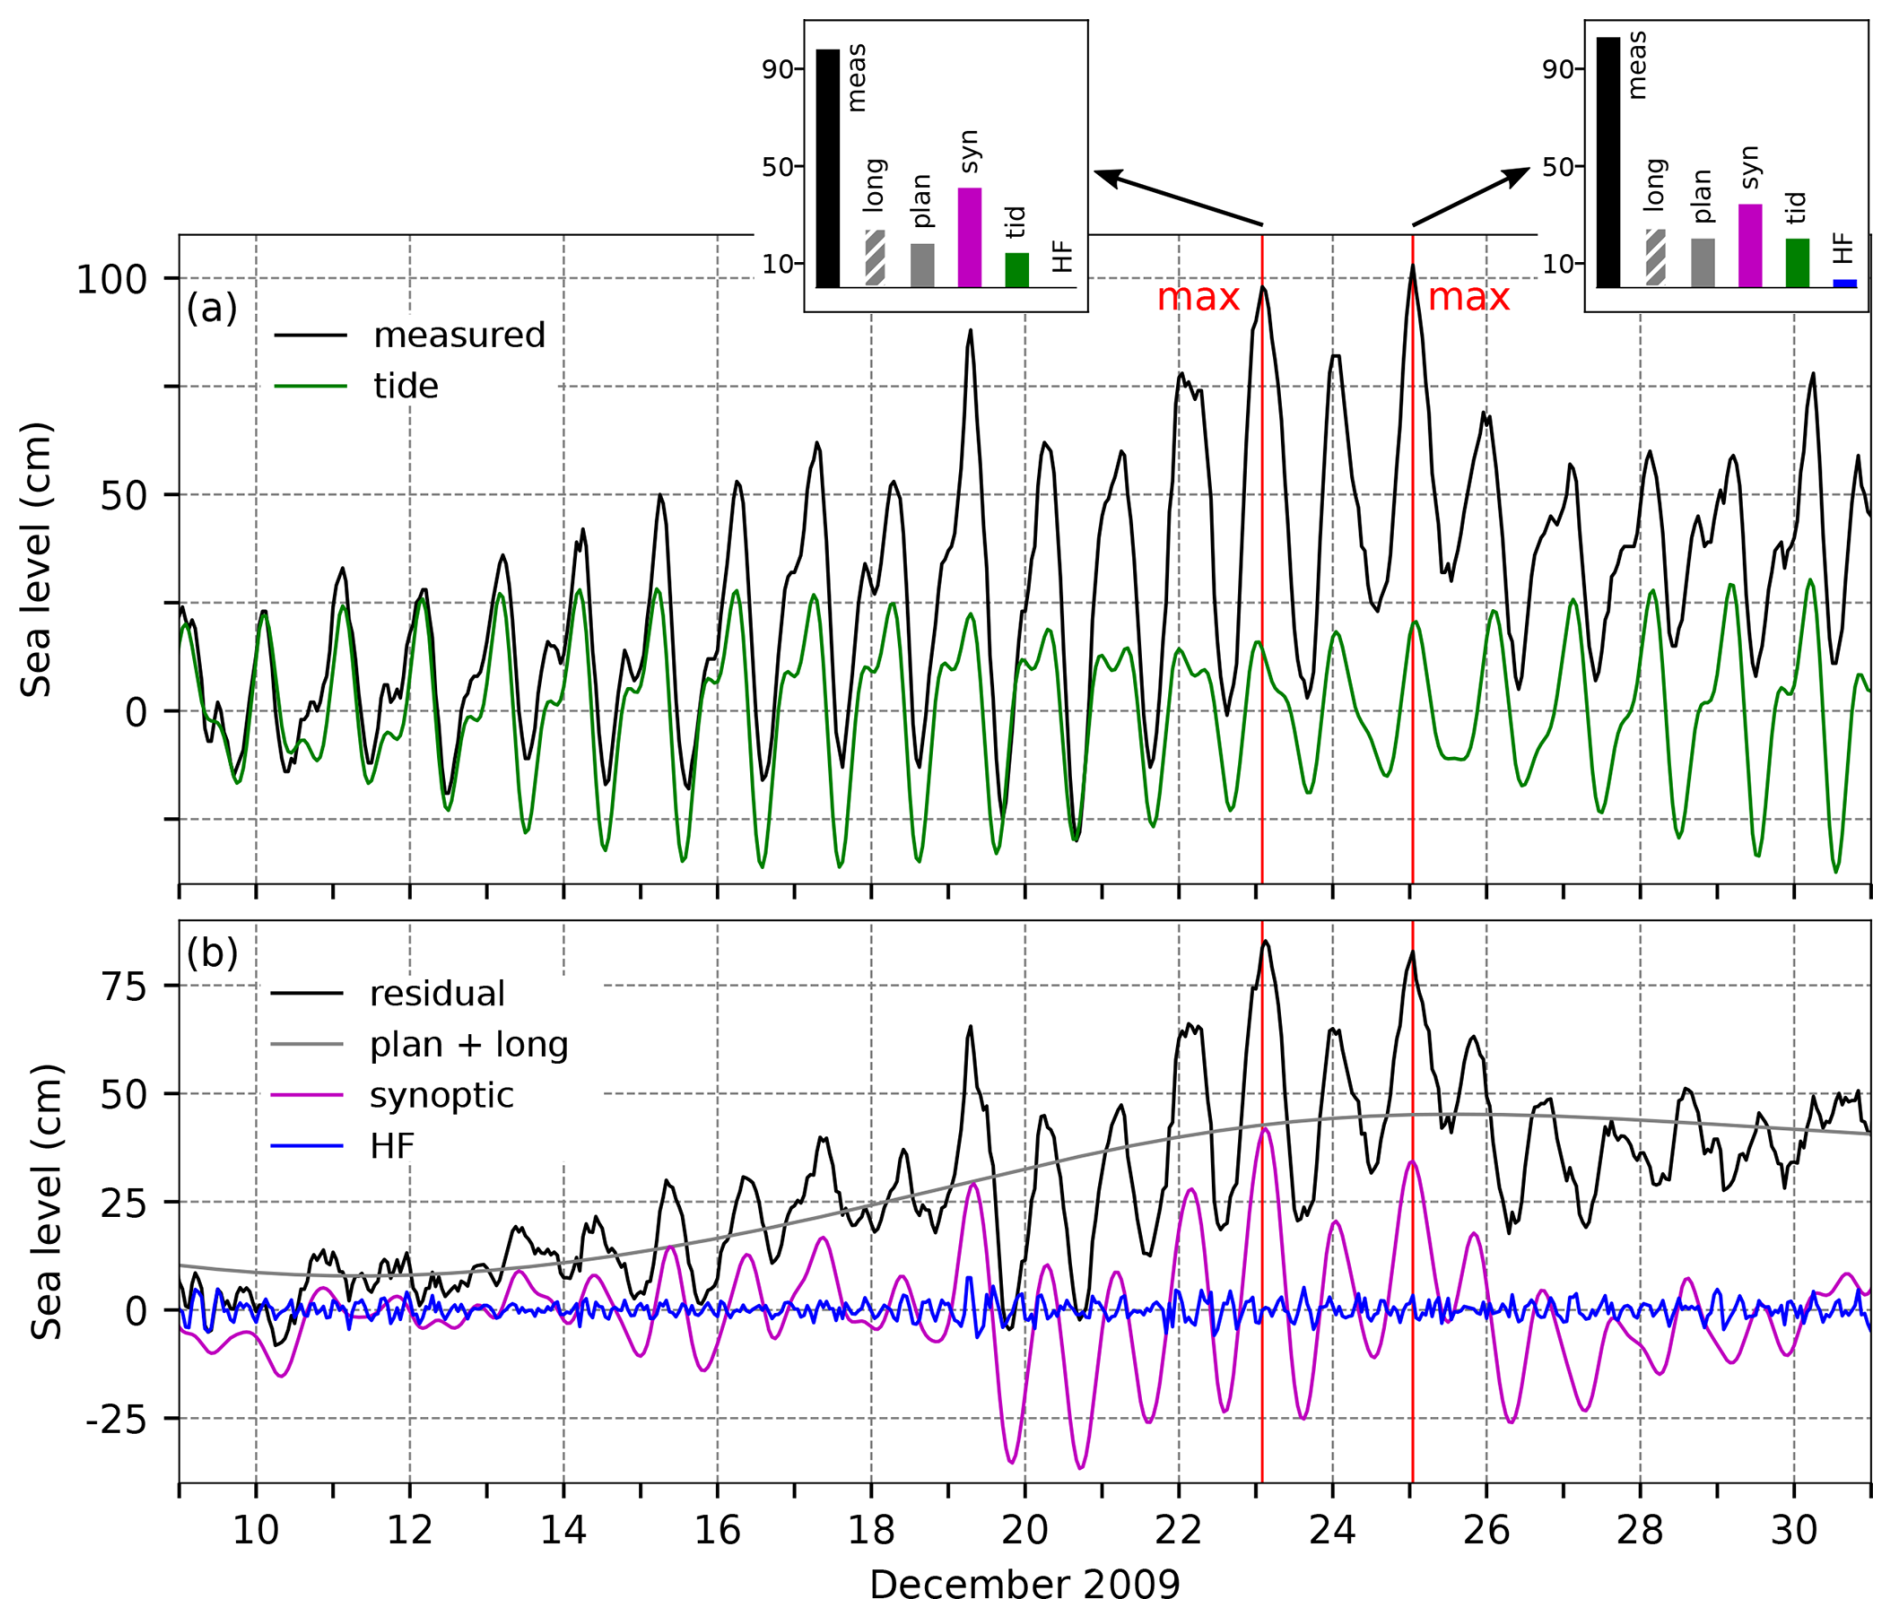
Figure 47SL series for the floods of 23 and 25 December 2009. Panel (a) shows the measured sea level (black) and tide (green). The inset figures show the contributions (cm) of the five sea-level components to the maximum measured sea levels (“meas” – left: 23 December 2009 at 02:00 UTC; right: 25 December 2009 at 01:00 UTC): “HF” refers to high-frequency oscillations (2 h < T < 9 h), “syn” to synoptic component (9 h < T < 10 d), “tid” to tide, “plan” to planetary-scale variability (10 d < T < 100 d), and “long” to long-term sea-level variability (100 d < T). Panel (b) presents the residual sea level (black), the combined series of planetary-scale variability and long-term sea-level variability (grey; plan + long), synoptic component (purple), and high-frequency oscillations (blue). Red lines indicate the times of the maximum total SL.
4.15.2 Sea-level evolution
On 23 December 2009, at 02:00 UTC, the sea level in Bakar rose to 98 cm, while on 25 December 2009, at 01:00 UTC, it reached 103 cm (Table 2, Fig. 47).
Between the two floods, on 24 December, the moon was in its first quarter, giving tide a diurnal neap-tide character. The first SL maximum was reached 1 h after the daily high tide, while the second was reached during the high tide. Tide contributed 14 and 20 cm to the floods, respectively (Fig. 47a).
High-frequency oscillations were of low amplitude during both these events (Fig. 47b), so that their contribution to the total maxima amounted to 0 and 3 cm, respectively.
Both episodes were influenced by natural basin oscillations (Fig. 47b), which were first triggered by the passage of the cyclone and sudden change in wind forcing on 19 December (Fig. 45a). Hence, synoptic component consisted of the storm surges and free basin-wide oscillations (T ∼ 21.2 h). The seiches were in phase with the two storm surges and, therefore, amplified both (Fig. 47). The SL maxima formed during the peaks in synoptic component, which were 41 cm on 23 December and 34 cm on 25 December (Fig. 47).
Planetary-scale component contributed 18 cm to the 23 December episode and 21 cm to the 25 December episode. Figure 47b shows that the SL (plan + long) began to rise around 12 December, which can be attributed to atmospheric forcing. A comparison of Figs. 45a and 47b indicates that the SL started increasing as the MSLP (lp) decreased, continuing until about 19 December. At that point, the MSLP (lp) no longer supported the rise in SL; however, winds from the south or southwest (10–100 d period) started to blow, reaching speeds of nearly 6 m s−1 during the floods, and continued to support the SL increase.
Long-term sea-level component (100 d < T) was exceptionally high during these episodes, contributing 25 cm to both events (Figs. 73 and A1). This was largely driven by the pronounced amplitude of intra-annual processes (dominated by the mean seasonal cycle and its anomalies), which contributed 11.9 cm (Fig. 73d). Longer-timescale processes were also significant: interannual variability added 5.2 cm (Fig. 73c), and mean sea-level change contributed 7.9 cm (Fig. 73b).
These two consecutive floods can be attributed to a positive superposition of all processes, aside from high-frequency oscillations, but, above, all to synoptic component, which was dominated by free basin oscillations, especially in the case of the second episode (Fig. 47).
4.15.3 Flood impacts
Based on daily newspapers (Novi list, 24 December 2009), the effects of the 23 December flood are listed. The flood impacts were most severe in the town of Rijeka (Fig. 1) in the northern Adriatic and included (i) turbid (cloudy) water due to intense rain at night and in the morning, (ii) flooding of the city due to record-breaking rainfall (110 mm recorded in Rijeka on 23 December) and storm surge, (iii) traffic obstructions due to plant and soil debris, and (iv) cracking of the road surfaces.
Based on online sources (Glas Istre, 25 and 26 December 2009; Jutarnji list, 25 December 2009; and Vatrogasni portal, 25 December 2009; Glas Istre, 2009a, b), the effects of the 25 December 2009 flood are listed. The flood impacts were again most severe in Rijeka and its surroundings and included (i) numerous firefighter interventions due to several days of heavy rainfall, (ii) the flooding of basements due to the spilling of the swollen river Rječina (small river flowing through Rijeka), and (iii) the closure of local roads and parts of the national highway.
4.16 The flood of 3 December 2010 (ID 19; rank 13)
The flood has not been previously described in the scientific literature.
4.16.1 Meteorological background
In the week leading up to the flood, the Adriatic region was on the front side of a deep upper-level trough moving from northern Europe towards the Mediterranean. This set-up resulted in a strong upper-level southwestern flow, bringing warm, humid air that resulted in precipitation over the Adriatic region. A deep upper-level trough supported cyclonic activity in the western Mediterranean, causing the generation of a series of cyclones which moved from the Ligurian Sea across the Adriatic in the week before the flood (Fig. 48a). In addition, the wind over the Adriatic was of a highly variable direction, although it had a southerly component for prolonged periods (Fig. 48b). At 00:00 UTC on 3 December, the last cyclone in a series of storms formed over the Adriatic (Fig. 49a) and then moved eastward. During the flood itself, a light northwesterly wind prevailed in the northern Adriatic, while the central part was affected by a strong southerly wind (Fig. 49b). The induced precipitation was light, with amounts on 3 December mostly ranging from 10 to 20 mm along the northern Adriatic and up to 15 mm along the middle Adriatic.
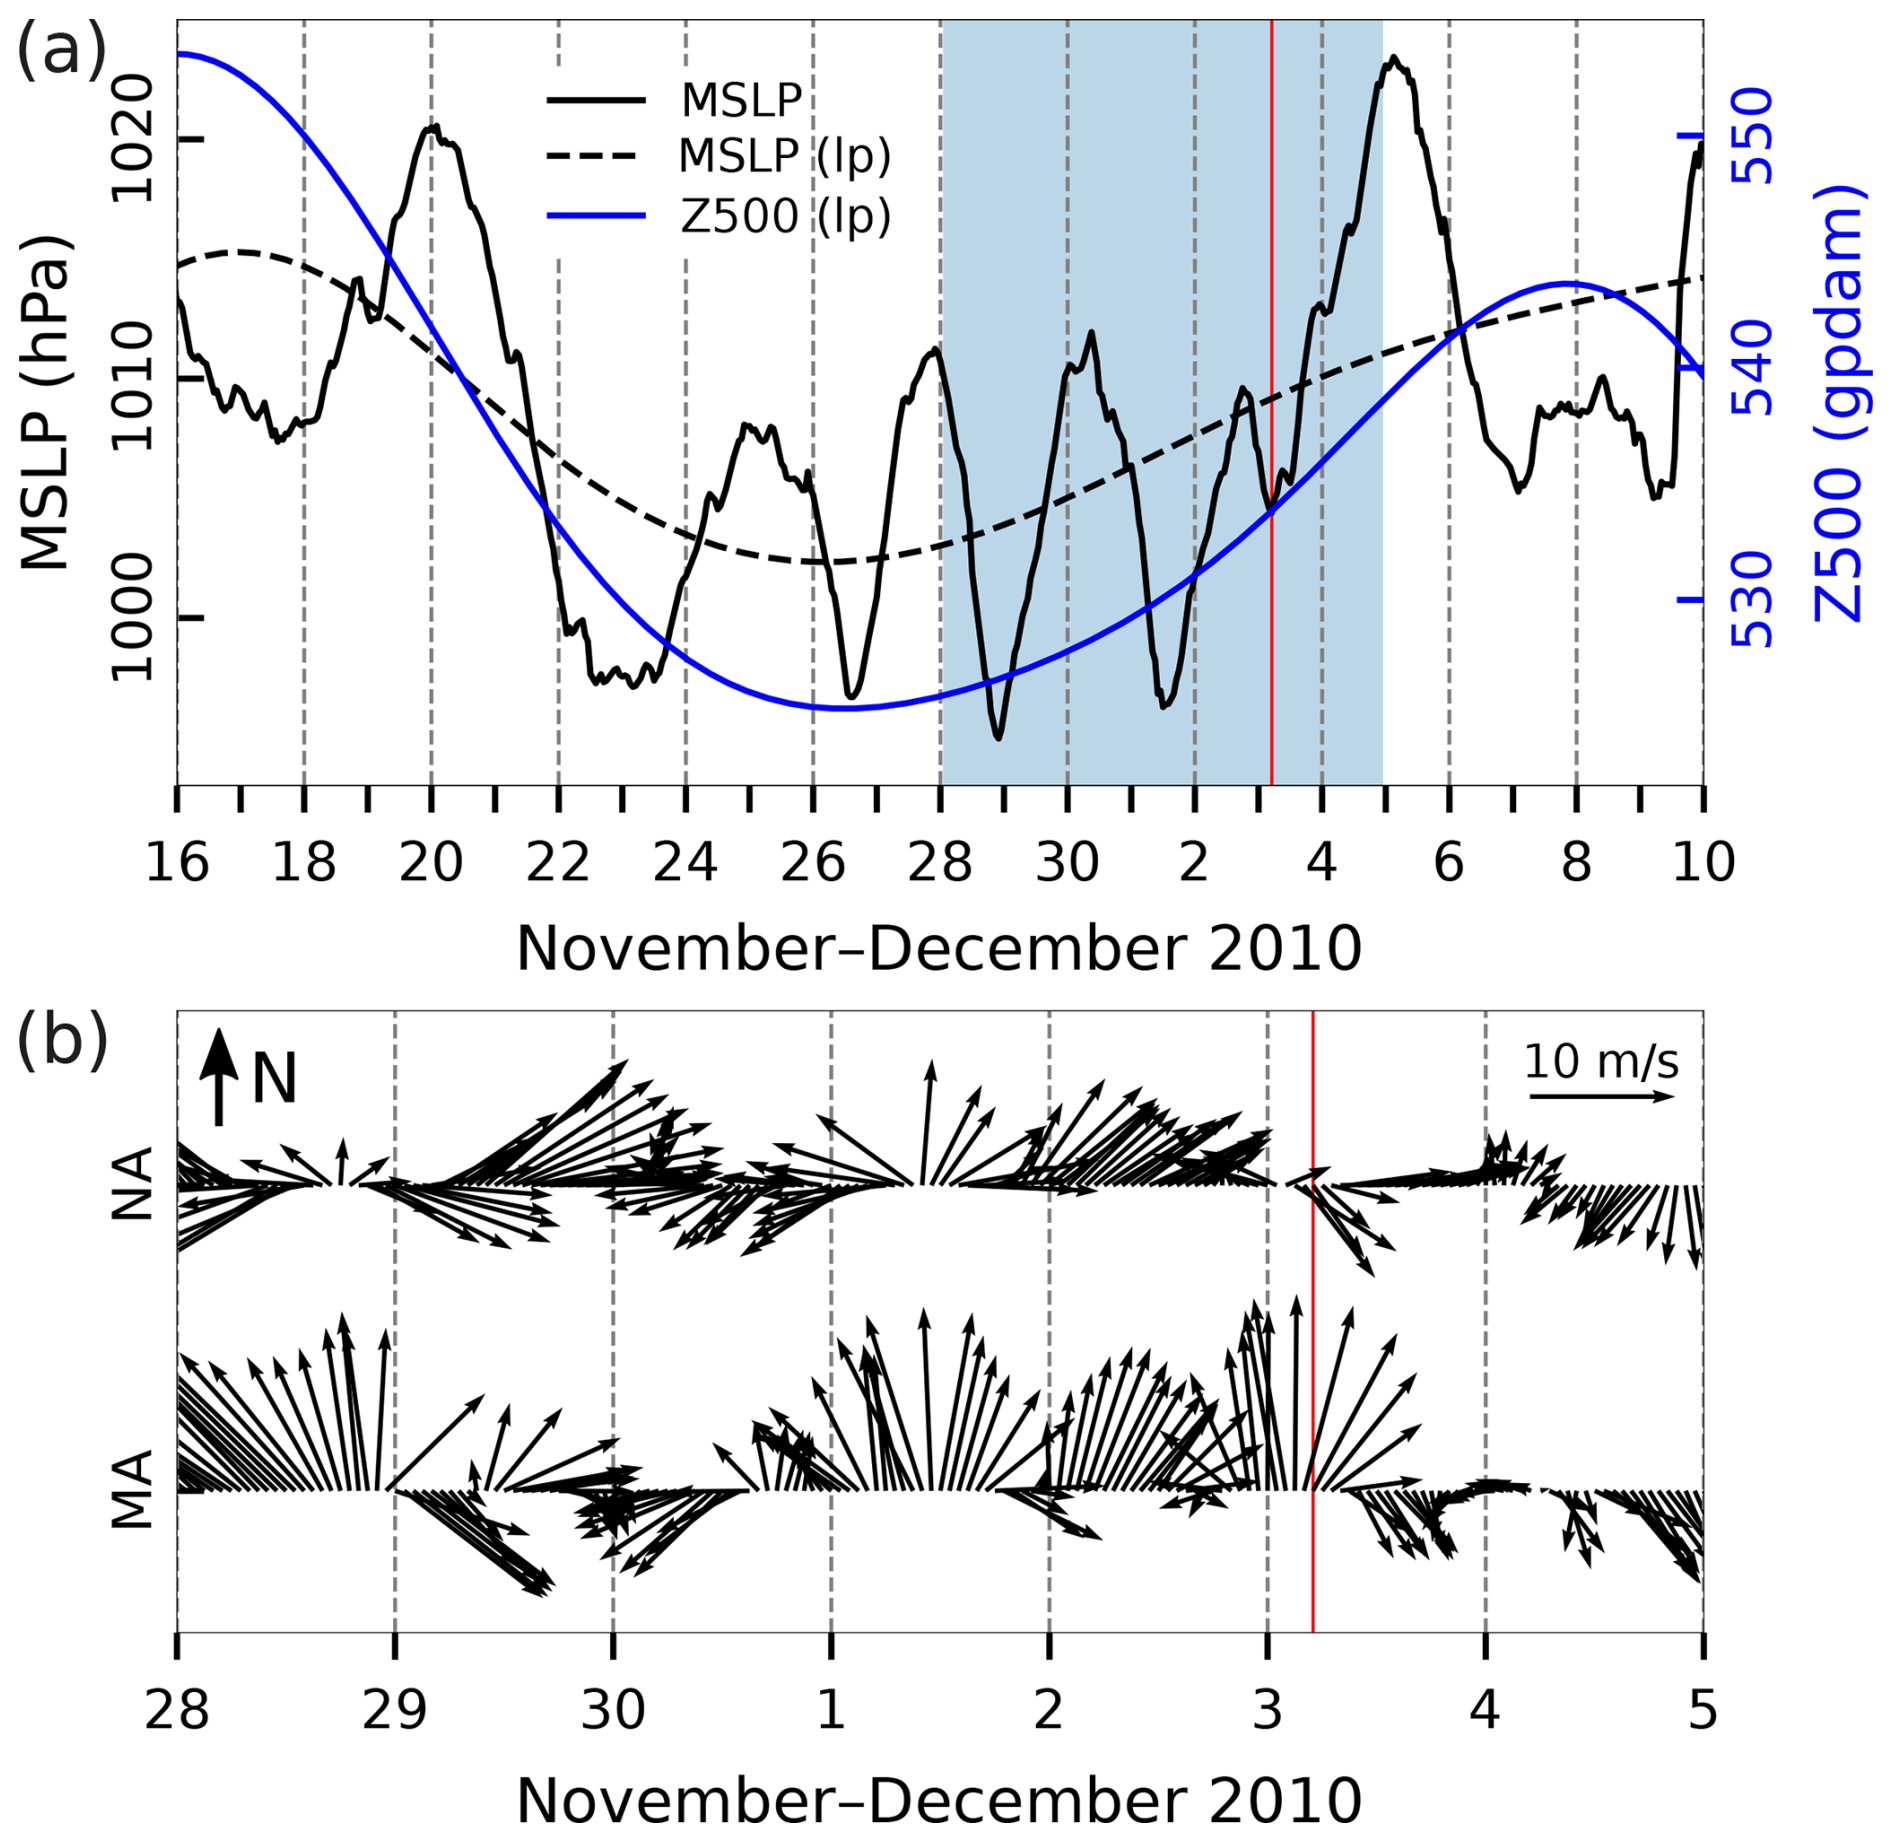
Figure 48Series of ERA5 reanalysis data related to the flood of 3 December 2010. (a) MSLP (hourly) and MSLP (lp) (low-pass filtered with a cut-off frequency of 10 d) and Z500 (lp) (low-pass filtered with a cut-off frequency of 10 d) at a grid point near TG Bakar. (b) Hourly W10 during the period marked in blue in the upper plot for the middle Adriatic (MA) and northern Adriatic (NA) (all locations marked in Fig. 1). The red line indicates the onset of the SL maximum.
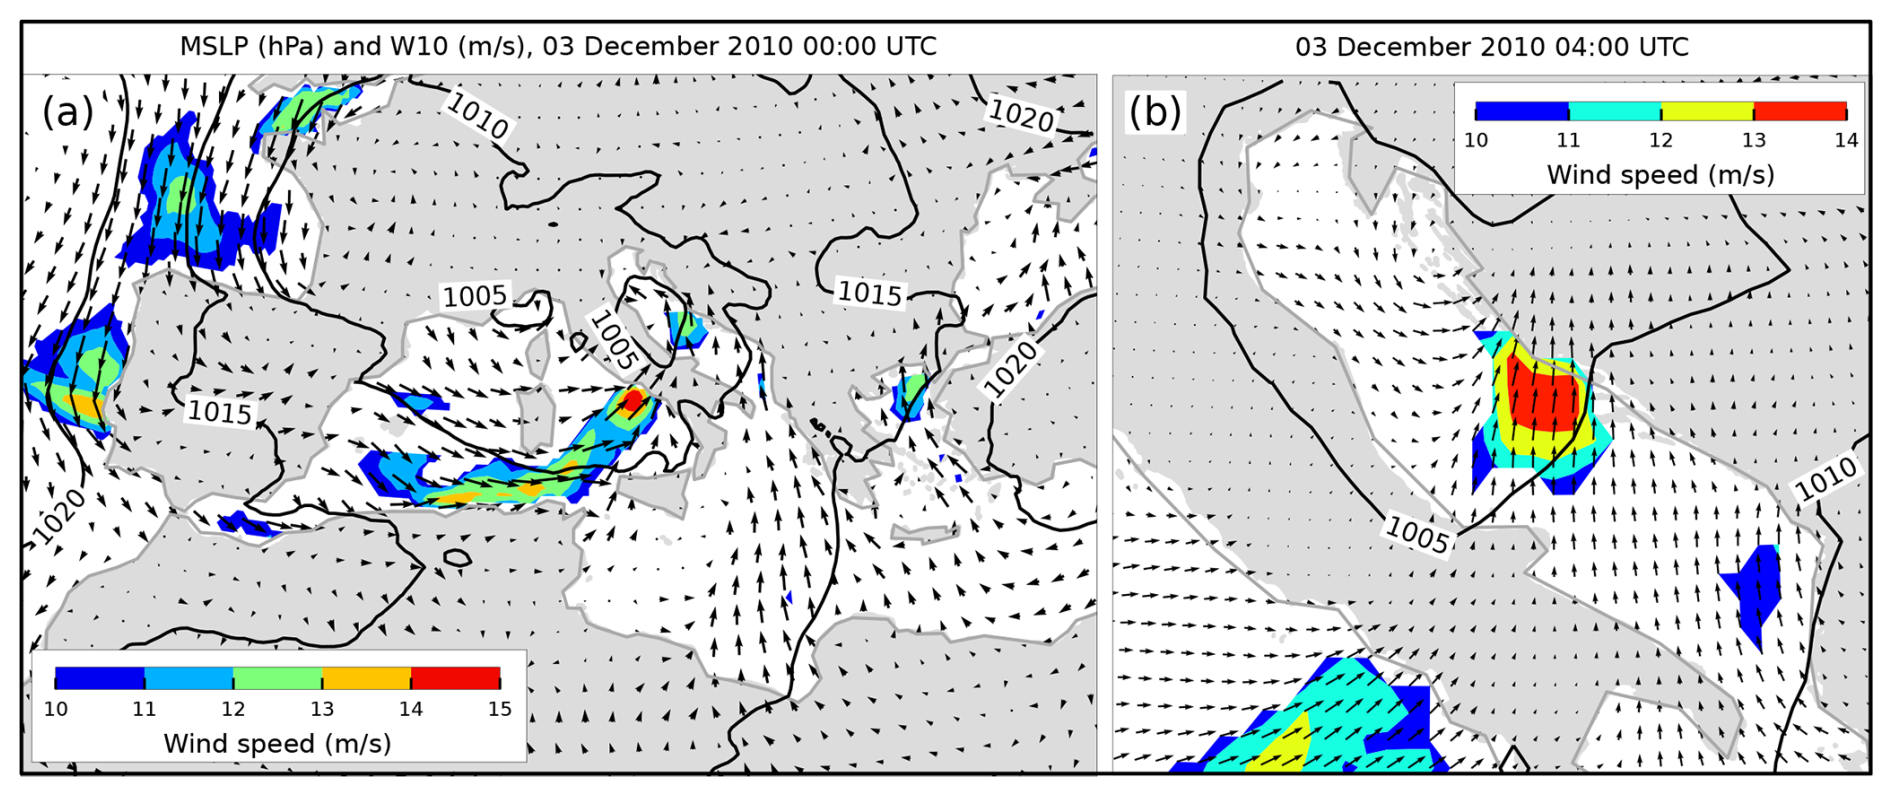
Figure 49MSLP (black lines) and W10 (arrows and colours) fields from the ERA5 reanalysis. Conditions (a) over the Mediterranean depicting a cyclone over the western Mediterranean that preceded the situation (b) over the Adriatic Sea (an hour before maximum SL in Bakar). Only wind speeds exceeding 10 m s−1 are coloured.
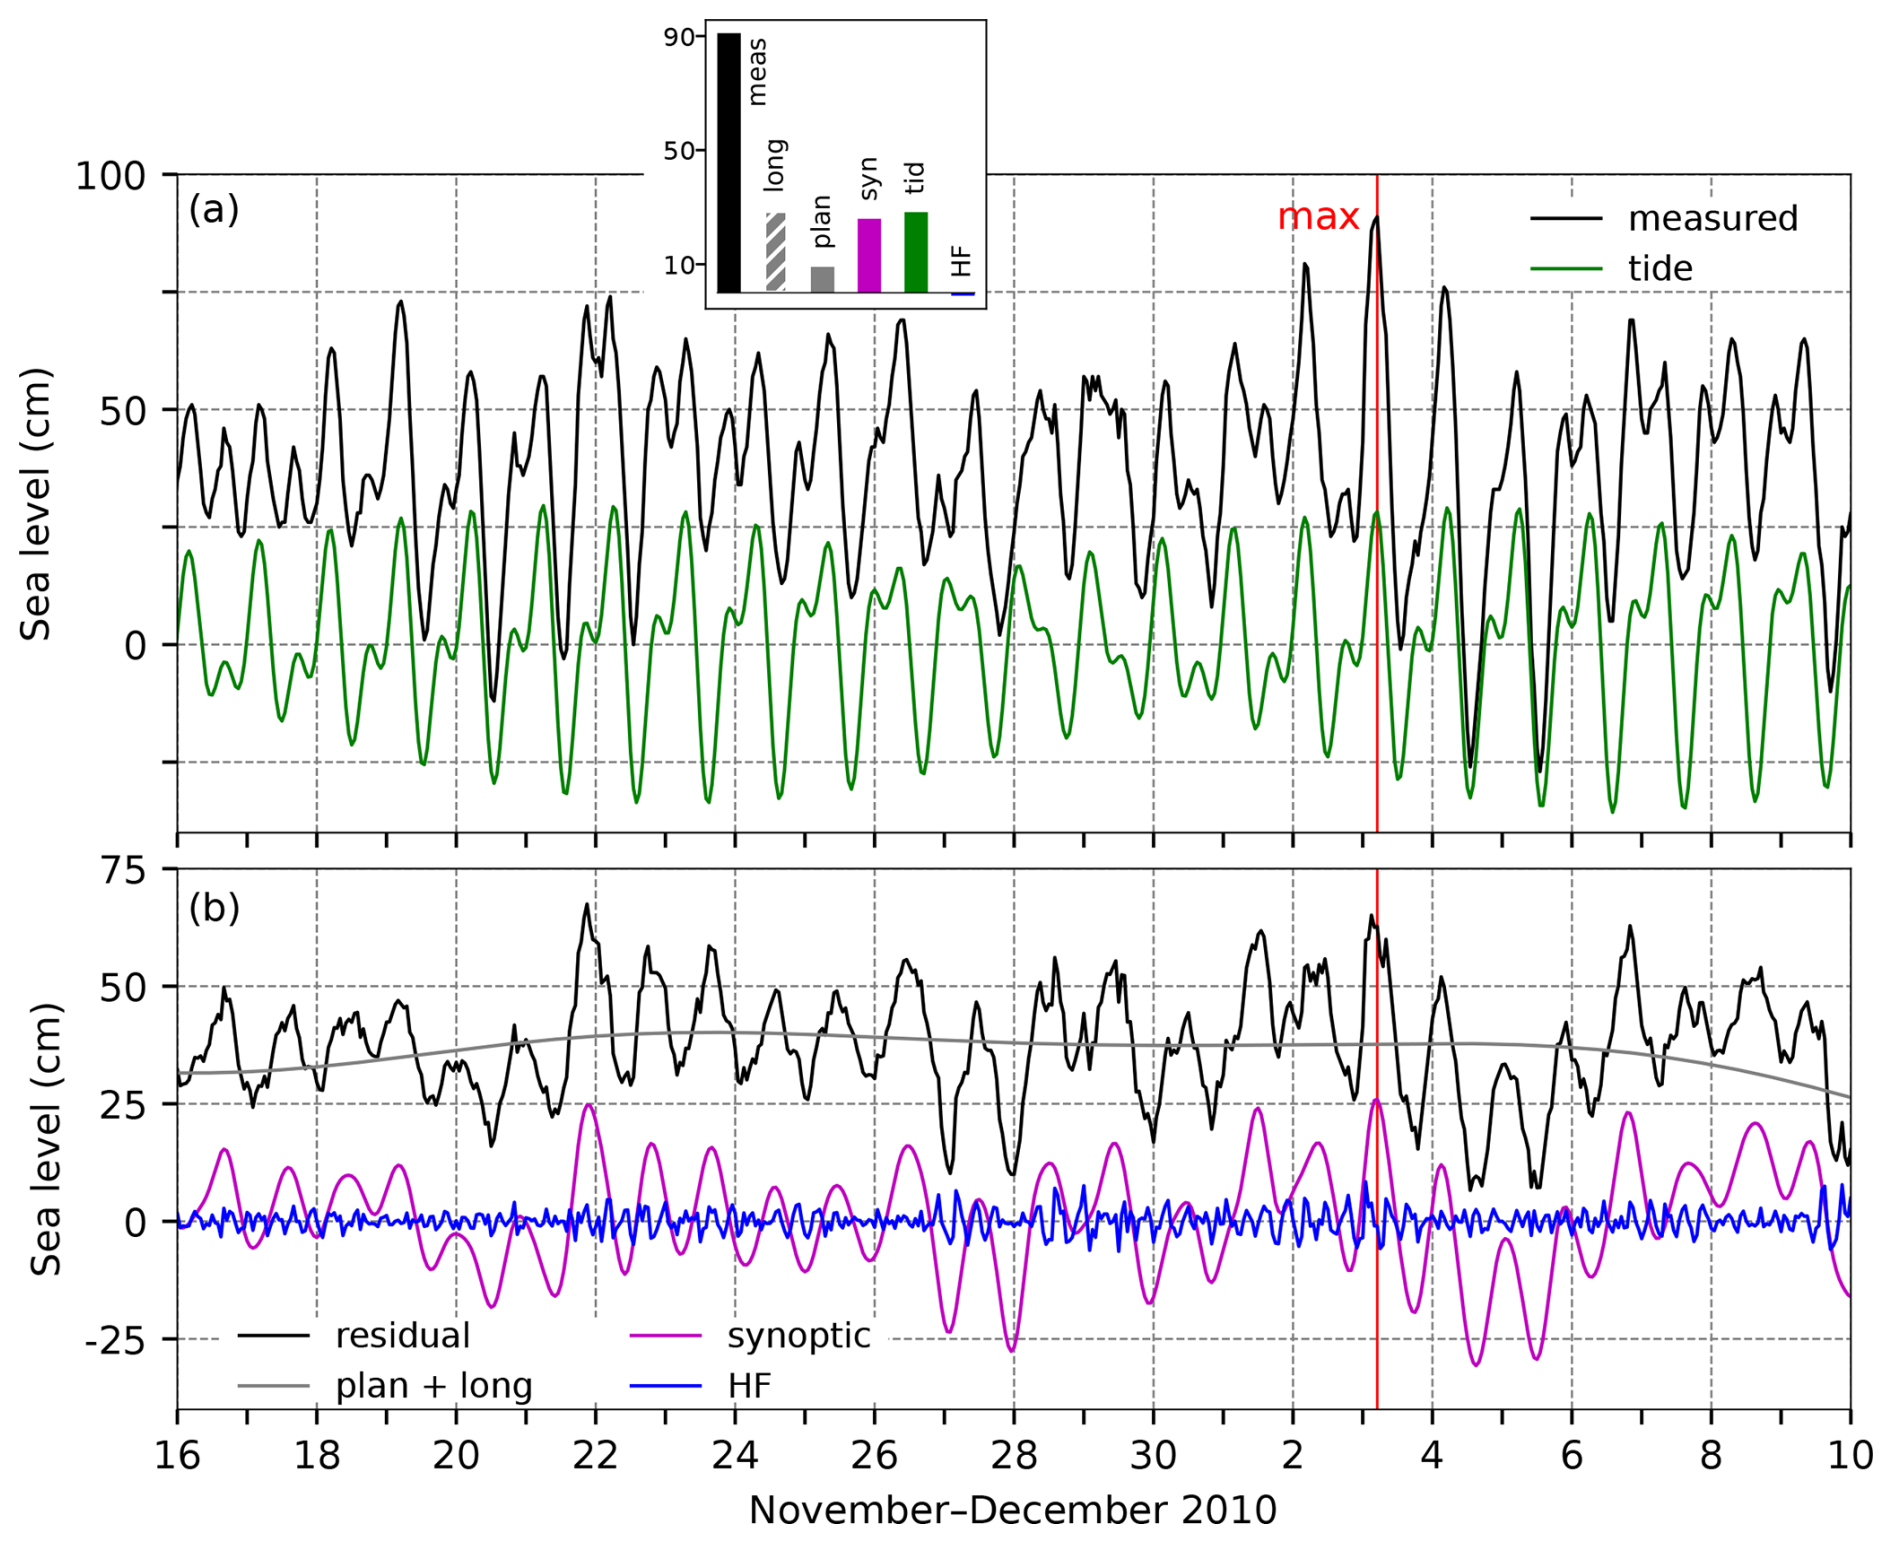
Figure 50SL series for the flood of 3 December 2010. Panel (a) shows the measured sea level (black) and tide (green). The inset figure shows the contributions (cm) of the five sea-level components to the maximum measured sea level (“meas”; 05:00 UTC): “HF” refers to high-frequency oscillations (2 h < T < 9 h), “syn” to synoptic component (9 h < T < 10 d), “tid” to tide, “plan” to planetary-scale variability (10 d < T < 100 d), and “long” to long-term sea-level variability (100 d < T). Panel (b) presents the residual sea level (black), the combined series of planetary-scale variability and long-term sea-level variability (grey; plan + long), synoptic component (purple), and high-frequency oscillations (blue). The red line indicates the time of occurrence of the total SL maximum.
4.16.2 Sea-level evolution
In the morning hours of 3 December 2010 (05:00 UTC), the sea level in Bakar rose to 91 cm above the long-term average (Table 2, Fig. 50).
The moon was nearing the new-moon phase, resulting in a semidiurnal spring tide. The overall SL maximum occurred during the daily tidal peak, which was notably high, contributing 28 cm to the flood level.
High-frequency oscillations were not particularly pronounced during this episode, and their role was negligible (they contributed −1 cm to the maximum SL).
The SL maximum formed in a peak of synoptic component in which pre-existing seiches played a significant role. Figure 50 shows that the ∼ 21.2 h oscillations dominated the residual SL during the entire interval shown, which is due to a series of cyclones that crossed the Adriatic Sea before the flood (Fig. 48a). The decisive cyclone produced only weak wind and air-pressure forcing in the northern Adriatic (Fig. 49); as a result, the induced storm surge was not high and, together with the positive phase of pre-existing seiche, contributed 26 cm to the total maximum (less than tide and long-term sea-level variability).
Planetary-scale component contributed 9 cm to the overall SL maximum. The SL (Fig. 50b, plan + long) was raised over the entire interval shown without significant variations in planetary-scale component. This was due to unpronounced changes in the MSLP (lp) (Fig. 48a) and weak wind (10–100 d) with low speeds (maximum was 2 m s−1) which did not act in the same sense.
Long-term sea-level variability (100 d < T) made an exceptional contribution of 29 cm to this maximum (Figs. 73 and A1). The episode coincided with the annual peak in intra-annual processes, which were unusually strong that year, reaching an amplitude of 17.2 cm – one of the highest on record (Fig. 73d). In addition, interannual variability contributed 4.2 cm (Fig. 73c), while mean sea-level change added 7.6 cm (Fig. 73b).
In summary, the flood resulted from the positive superposition of four processes, with synoptic component, tide, and long-term sea-level component having a similar contribution (Fig. 50a).
4.16.3 Flood impacts
The following impacts of the flooding were identified through a review of daily newspapers (Slobodna Dalmacija, 4 December 2010, and Vjesnik, 4 and 5 December 2010). Small coastal towns between Trogir and Šibenik experienced significant material damage, with the sea destroying numerous boats and flooding cellars and restaurants. In the middle Adriatic, in one small town, the sea overflowed onto the waterfront and firefighters spent the whole night pumping the water out of the flooded houses.
4.17 The flood of 1 November 2012 (ID 20; rank 1)
A study by (Međugorac et al., 2016) used TG measurements from both sides of the Adriatic to empirically analyse this episode. The findings indicated that flooding was more severe on the eastern coast, while the western side experienced milder effects due to an east-to-west SL slope created by the uneven sirocco winds, which were stronger near the eastern shore.
4.17.1 Meteorological background
In the week leading up to the flood, on 27 October, a deep low-pressure system moved over the Adriatic Sea (Fig. 51a).
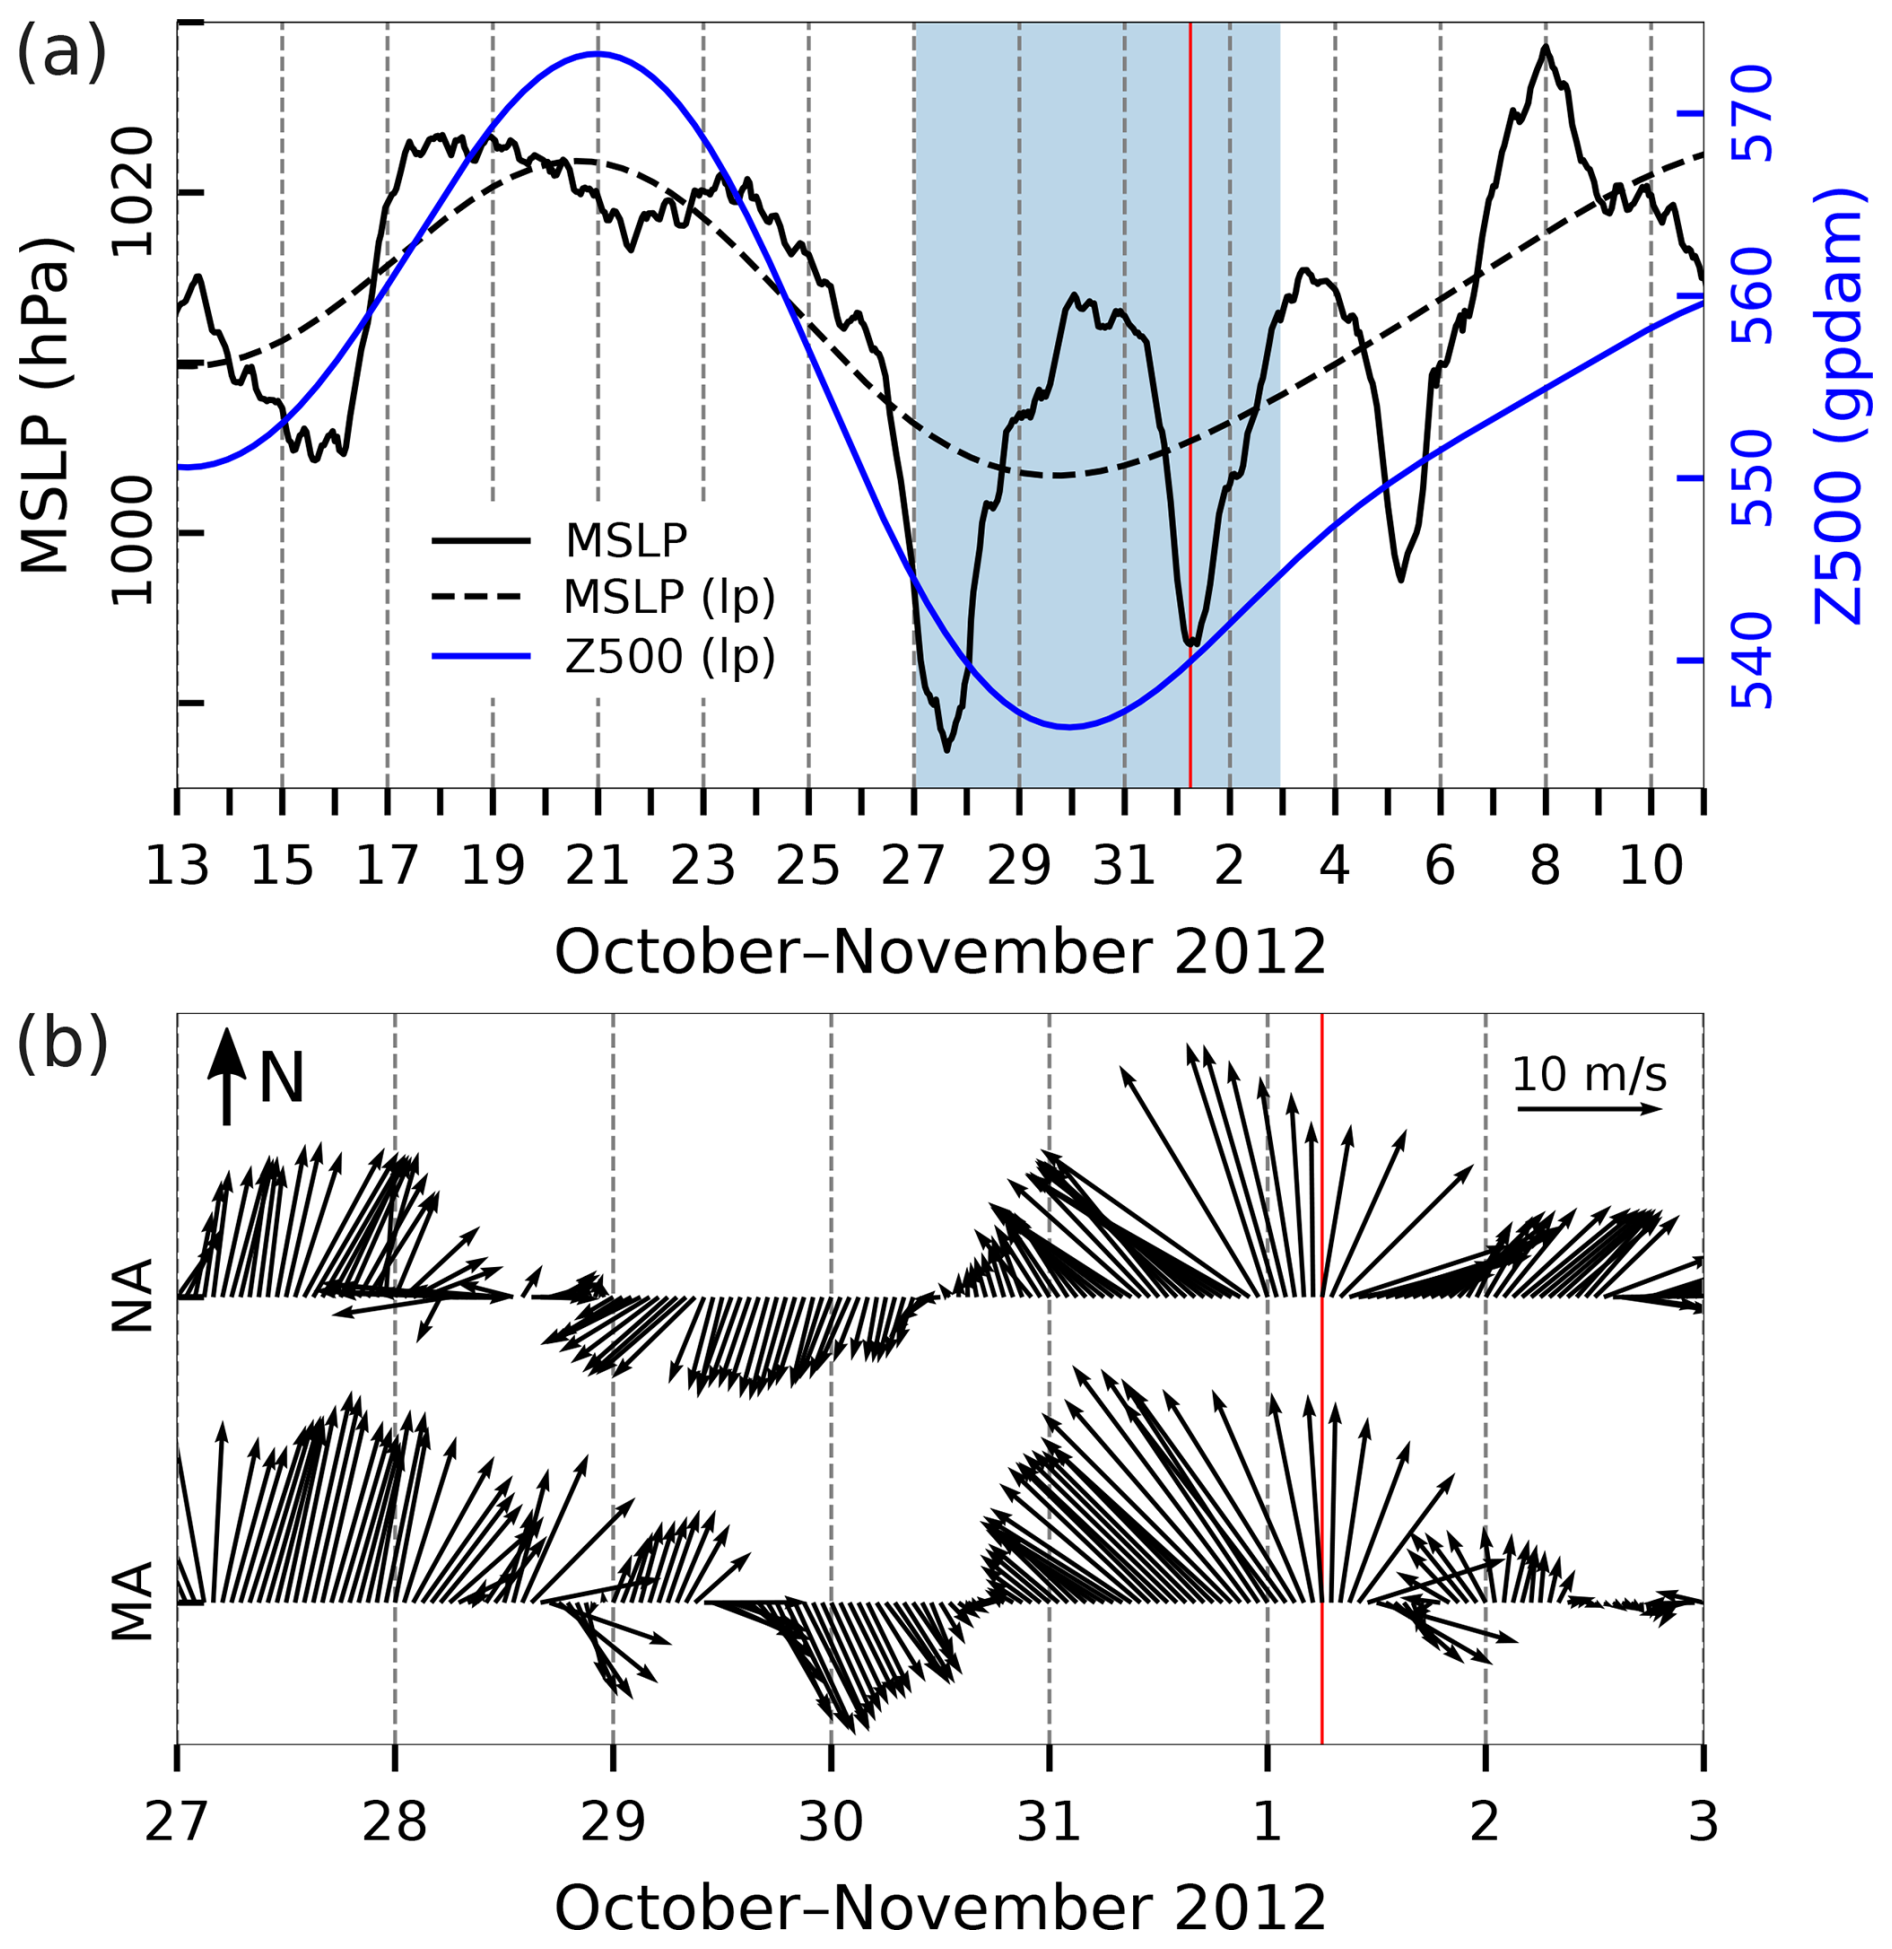
Figure 51Series of ERA5 reanalysis data related to the flood of 1 November 2012. (a) MSLP (hourly) and MSLP (lp) (low-pass filtered with a cut-off frequency of 10 d) and Z500 (lp) (low-pass filtered with a cut-off frequency of 10 d) at a grid point near TG Bakar. (b) Hourly W10 during the period marked in blue in the upper plot for the middle Adriatic (MA) and northern Adriatic (NA) (all locations marked in Fig. 1). The red line indicates the onset of the SL maximum.
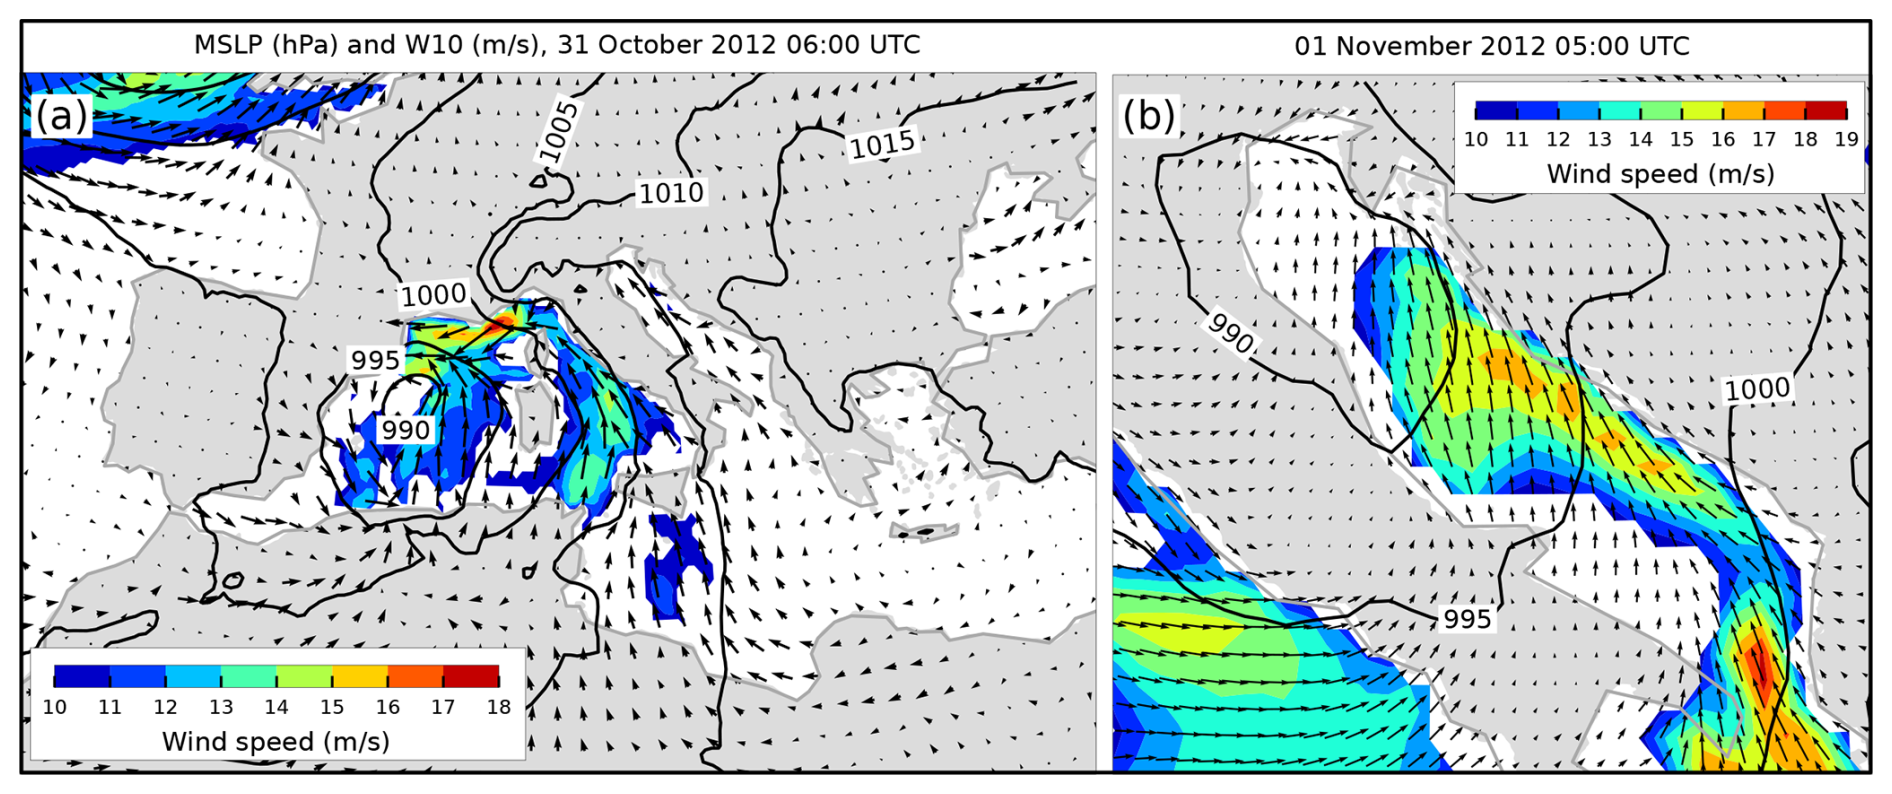
Figure 52MSLP (black lines) and W10 (arrows and colours) fields from the ERA5 reanalysis. Conditions (a) over the Mediterranean depicting a cyclone over the western Mediterranean that preceded the situation (b) over the Adriatic Sea (an hour before maximum SL in Bakar). Only wind speeds exceeding 10 m s−1 are coloured.
On 31 October, a well-defined surface cyclone, accompanied by a closed circulation of low pressure in the upper level, formed in the western Mediterranean and travelled towards Italy during the day while the pressure at its centre dropped to 985 hPa (Fig. 52a). At the same time, the anticyclone gradually weakened over the Adriatic while slowly shifting eastward. The centre of the above-mentioned cyclone with a frontal system moved over the northern Adriatic on 1 November (Fig. 52b). Under such synoptic conditions, a strong southeasterly wind was blowing over the Adriatic, and the SL reached its maximum value. On 1 November, the induced precipitation was most intense in the northern Adriatic, with recorded amounts including 57 mm in Pula, 114 mm in Crikvenica (near Bakar), 36 mm at Zadar Airport, and 26 mm in Trogir (near Split). The cyclone then moved further to the east, over the land, but the wind over the Adriatic still remained mainly of a southerly direction (Fig. 51) due to the MSLP gradients related to an extensive cyclone that persisted over the Atlantic for days and in the centre of which, a little south of Iceland, the pressure was exceptionally low, around 965 hPa.
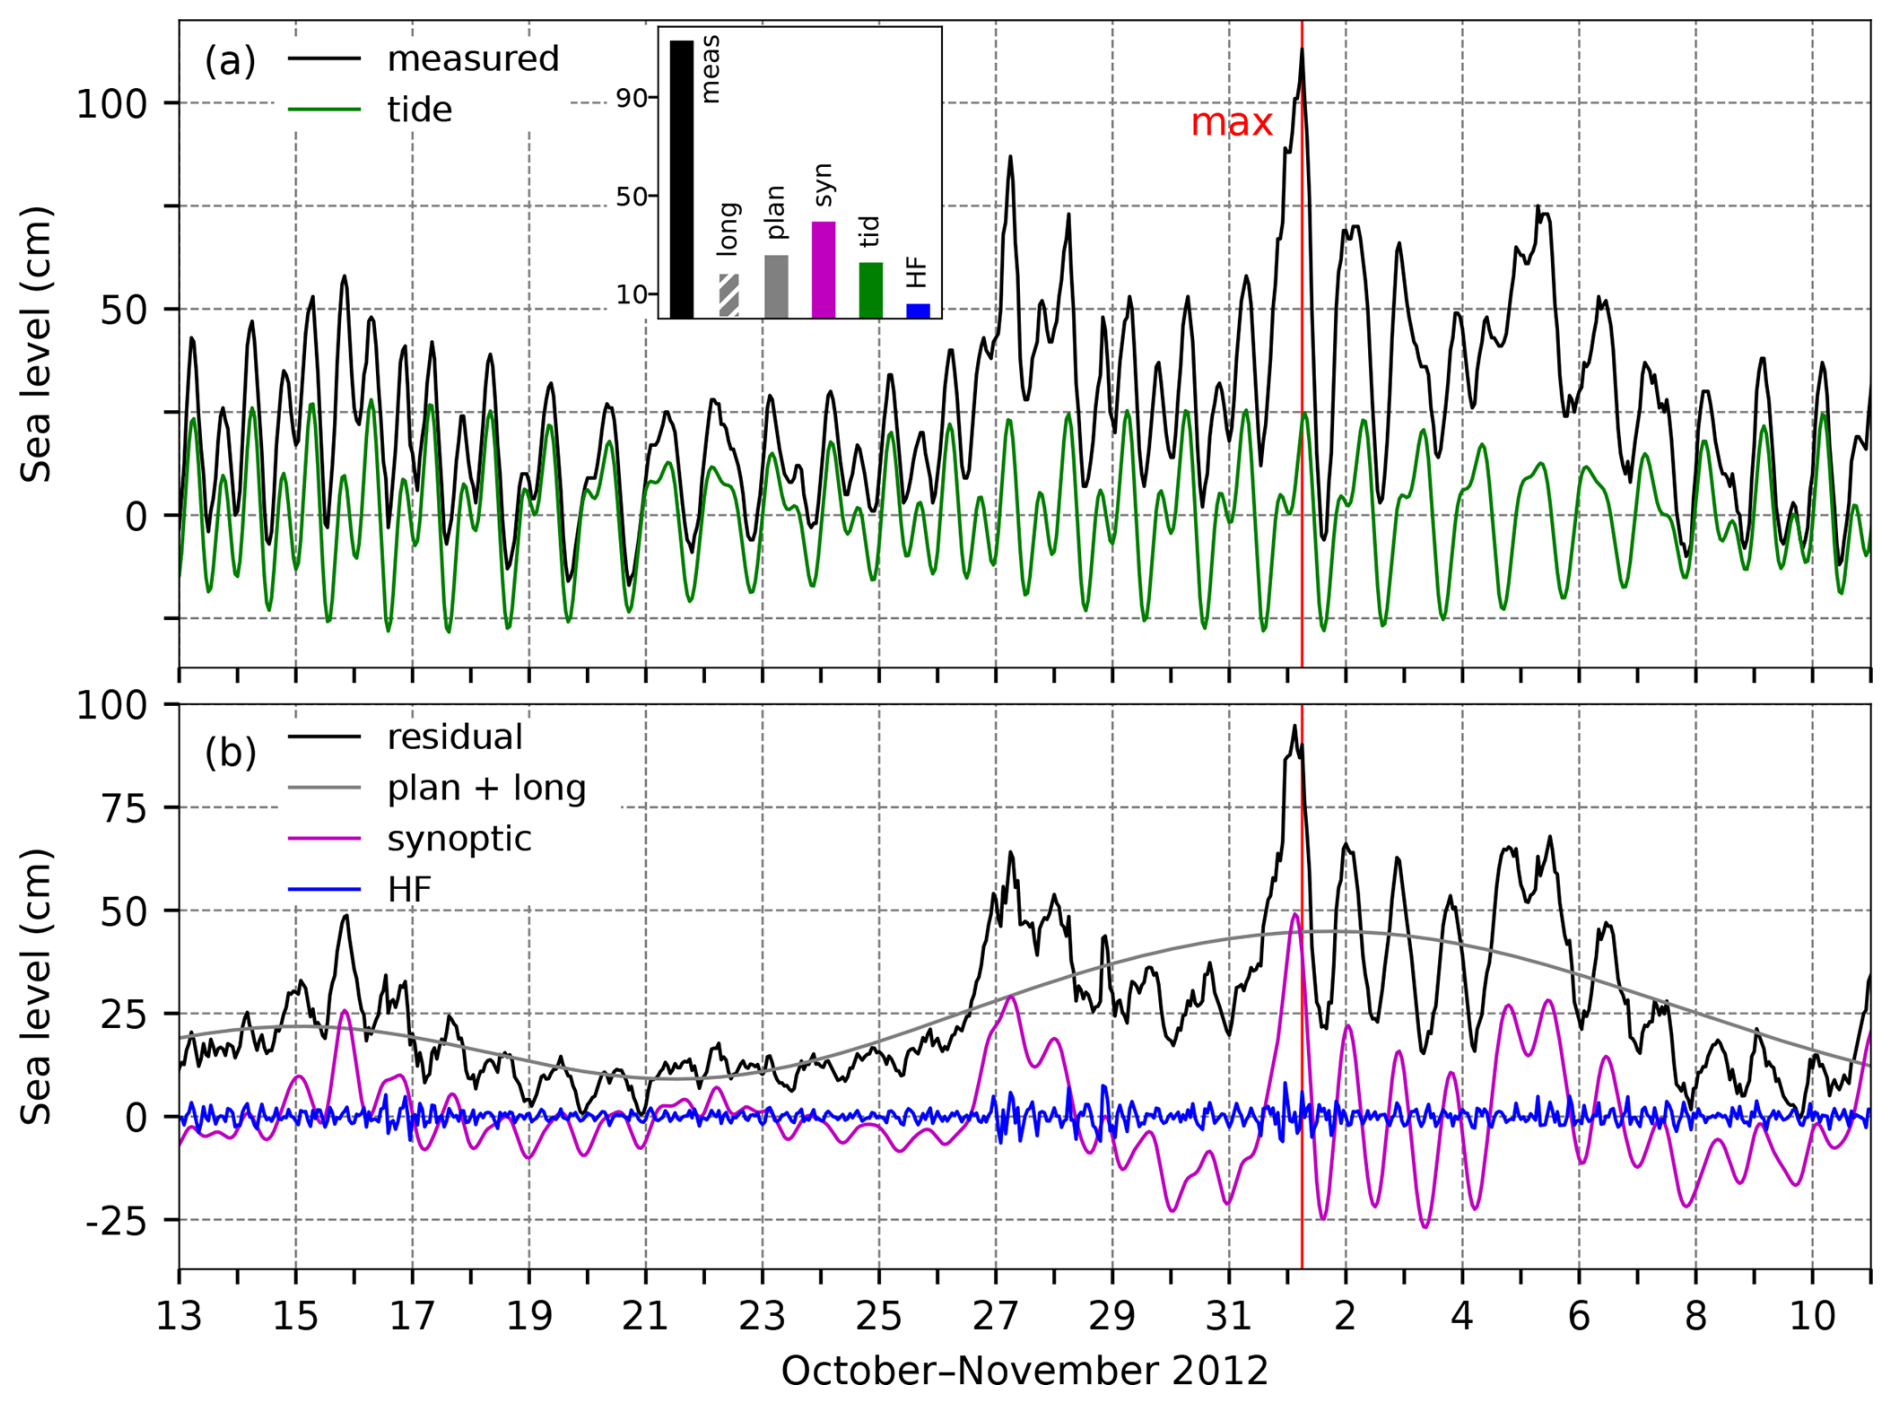
Figure 53SL series for the flood of 1 November 2012. Panel (a) shows the measured sea level (black) and tide (green). The inset figure shows the contributions (cm) of the five sea-level components to the maximum measured sea level (“meas”; 06:00 UTC): “HF” refers to high-frequency oscillations (2 h < T < 9 h), “syn” to synoptic component (9 h < T < 10 d), “tid” to tide, “plan” to planetary-scale variability (10 d < T < 100 d), and “long” to long-term sea-level variability (100 d < T). Panel (b) presents the residual sea level (black), the combined series of planetary-scale variability and long-term sea-level variability (grey; plan + long), synoptic component (purple), and high-frequency oscillations (blue). The red line indicates the time of occurrence of the total SL maximum.
4.17.2 Sea-level evolution
On 1 November 2012, at 06:00 UTC, TG Bakar recorded the highest water level ever measured at this station. On this occasion, the sea level rose to 113 cm above the long-term average (Table 2, Fig. 53).
The maximum of the total sea level formed during the daily peak of tide, 2 d after the full moon. Tide, therefore, had a semidiurnal spring-tide character and contributed 23 cm to the maximum (Fig. 53a).
High-frequency oscillations were not pronounced during the episode and contributed 6 cm.
Synoptic component was induced by a Mediterranean cyclone (Fig. 51a), which crossed rapidly from the western Mediterranean into the Adriatic (Fig. 52b). Prior to this, an atmospheric disturbance moved across the basin on 27 October (Fig. 51) and triggered basin-wide oscillations (T ∼ 21.2 h), which were, however, damped by the time of the main event (Fig. 53). Therefore, synoptic component consisted mainly of the storm surge, which amounted to 39 cm at the total maximum. The storm surge started to build up at the end of 30 October due to the pressure drop and the sirocco wind blowing at high speeds along the eastern coast over most of the Adriatic Sea (Fig. 52b).
Planetary-scale variability (10 d < T < 100 d) contributed 26 cm to the overall maximum. Flood preconditions began around 21 October, marked by a rise in SL coinciding with a drop in atmospheric pressure. As shown in Fig. 51a, the MSLP (lp) varied coherently with Z500 (lp) during this period, and Fig. 53b shows that the SL (plan + long) mirrored these fluctuations. As demonstrated by Pasarić (2000), Pasarić et al. (2000), and Pasarić and Orlić (2001), this suggests that planetary-scale component was predominantly influenced by the passage of planetary Rossby waves.
Long-term sea-level variability (100 d < T) contributed 19 cm to this episode (Figs. 73 and A1). The event occurred in the autumn, coinciding with the annual peak in intra-annual processes, which added 8.7 cm (Fig. 73d). Sea level was further elevated by ongoing interannual variations (3.5 cm; Fig. 73c) and mean sea-level change (6.8 cm; Fig. 73b).
In summary, the flood resulted from the positive superposition of all processes involved, with synoptic component having the strongest effect (Fig. 53a).
4.17.3 Flood impacts
The impacts of the flooding were examined using the available daily newspapers (Novi list, 2 November 2012, and Slobodna Dalmacija, 2 and 3 November 2012, Slobodna Dalmacija, 2012a, b). Large parts of the coast were affected by the record-breaking high-water levels, heavy rain, and strong sirocco winds. Many coastal towns reported extensive flooding on streets and squares. Other damage and interventions included (i) suspension of ferry services in the northern Adriatic; (ii) sewage system issues resulting in flooding in Rijeka (northern Adriatic; Fig. 1); (iii) the rescue of an elderly person in the northern Adriatic; (iv) damage to cars due to fallen branches in the middle Adriatic; and (v) road collapse in the middle Adriatic, with an estimated damage of several tens of thousands of euros.
4.18 The flood of 29 October 2018 (ID 21; rank 7)
Several studies have analysed this flood, including the following: an empirical investigation of the event and its meteorological background in the middle Adriatic (Pervan and Šepić, 2023) and in Venice (Ferrarin et al., 2022); the use of an integrated web system for forecasting and managing coastal risks related to sea storms (Ferrarin et al., 2020); tracking the trajectory of a surfer lost at sea during the storm (Ličer et al., 2020); demonstration of the effectiveness of the ISPRA (Istituto Superiore per la Protezione e la Ricerca Ambientale) operational SL forecasting system (Morucci et al., 2020); quantification of a displacement of coastal boulders in the northern and middle Adriatic due to wave action (Biolchi et al., 2019; Korbar et al., 2022); the event's predictability, with an emphasis that its characteristics might not fit within historical patterns, hinting at a potential new class of storms (Cavaleri et al., 2019); and analysis of the episode as part of an overview study (Lionello et al., 2021).
4.18.1 Meteorological background
Three days before the flood, on 26 October, the surface-based anticyclone whose centre was over the eastern Mediterranean gradually weakened over the Adriatic, and an upper-level trough with significantly colder air began to descend from the north of the continent towards the Iberian Peninsula.
On 27 October, as the trough progressed further towards the south, a pronounced southwesterly flow in the upper levels was established over the Adriatic Sea, advecting relatively warm air towards the Adriatic region. The associated surface-based cyclone was located over the Baltic Sea, and its frontal system extended to the Alps leading to the formation of a secondary cyclone in the Ligurian Sea. Under such synoptic conditions, a strong southeasterly wind blew over the Adriatic (Fig. 54).
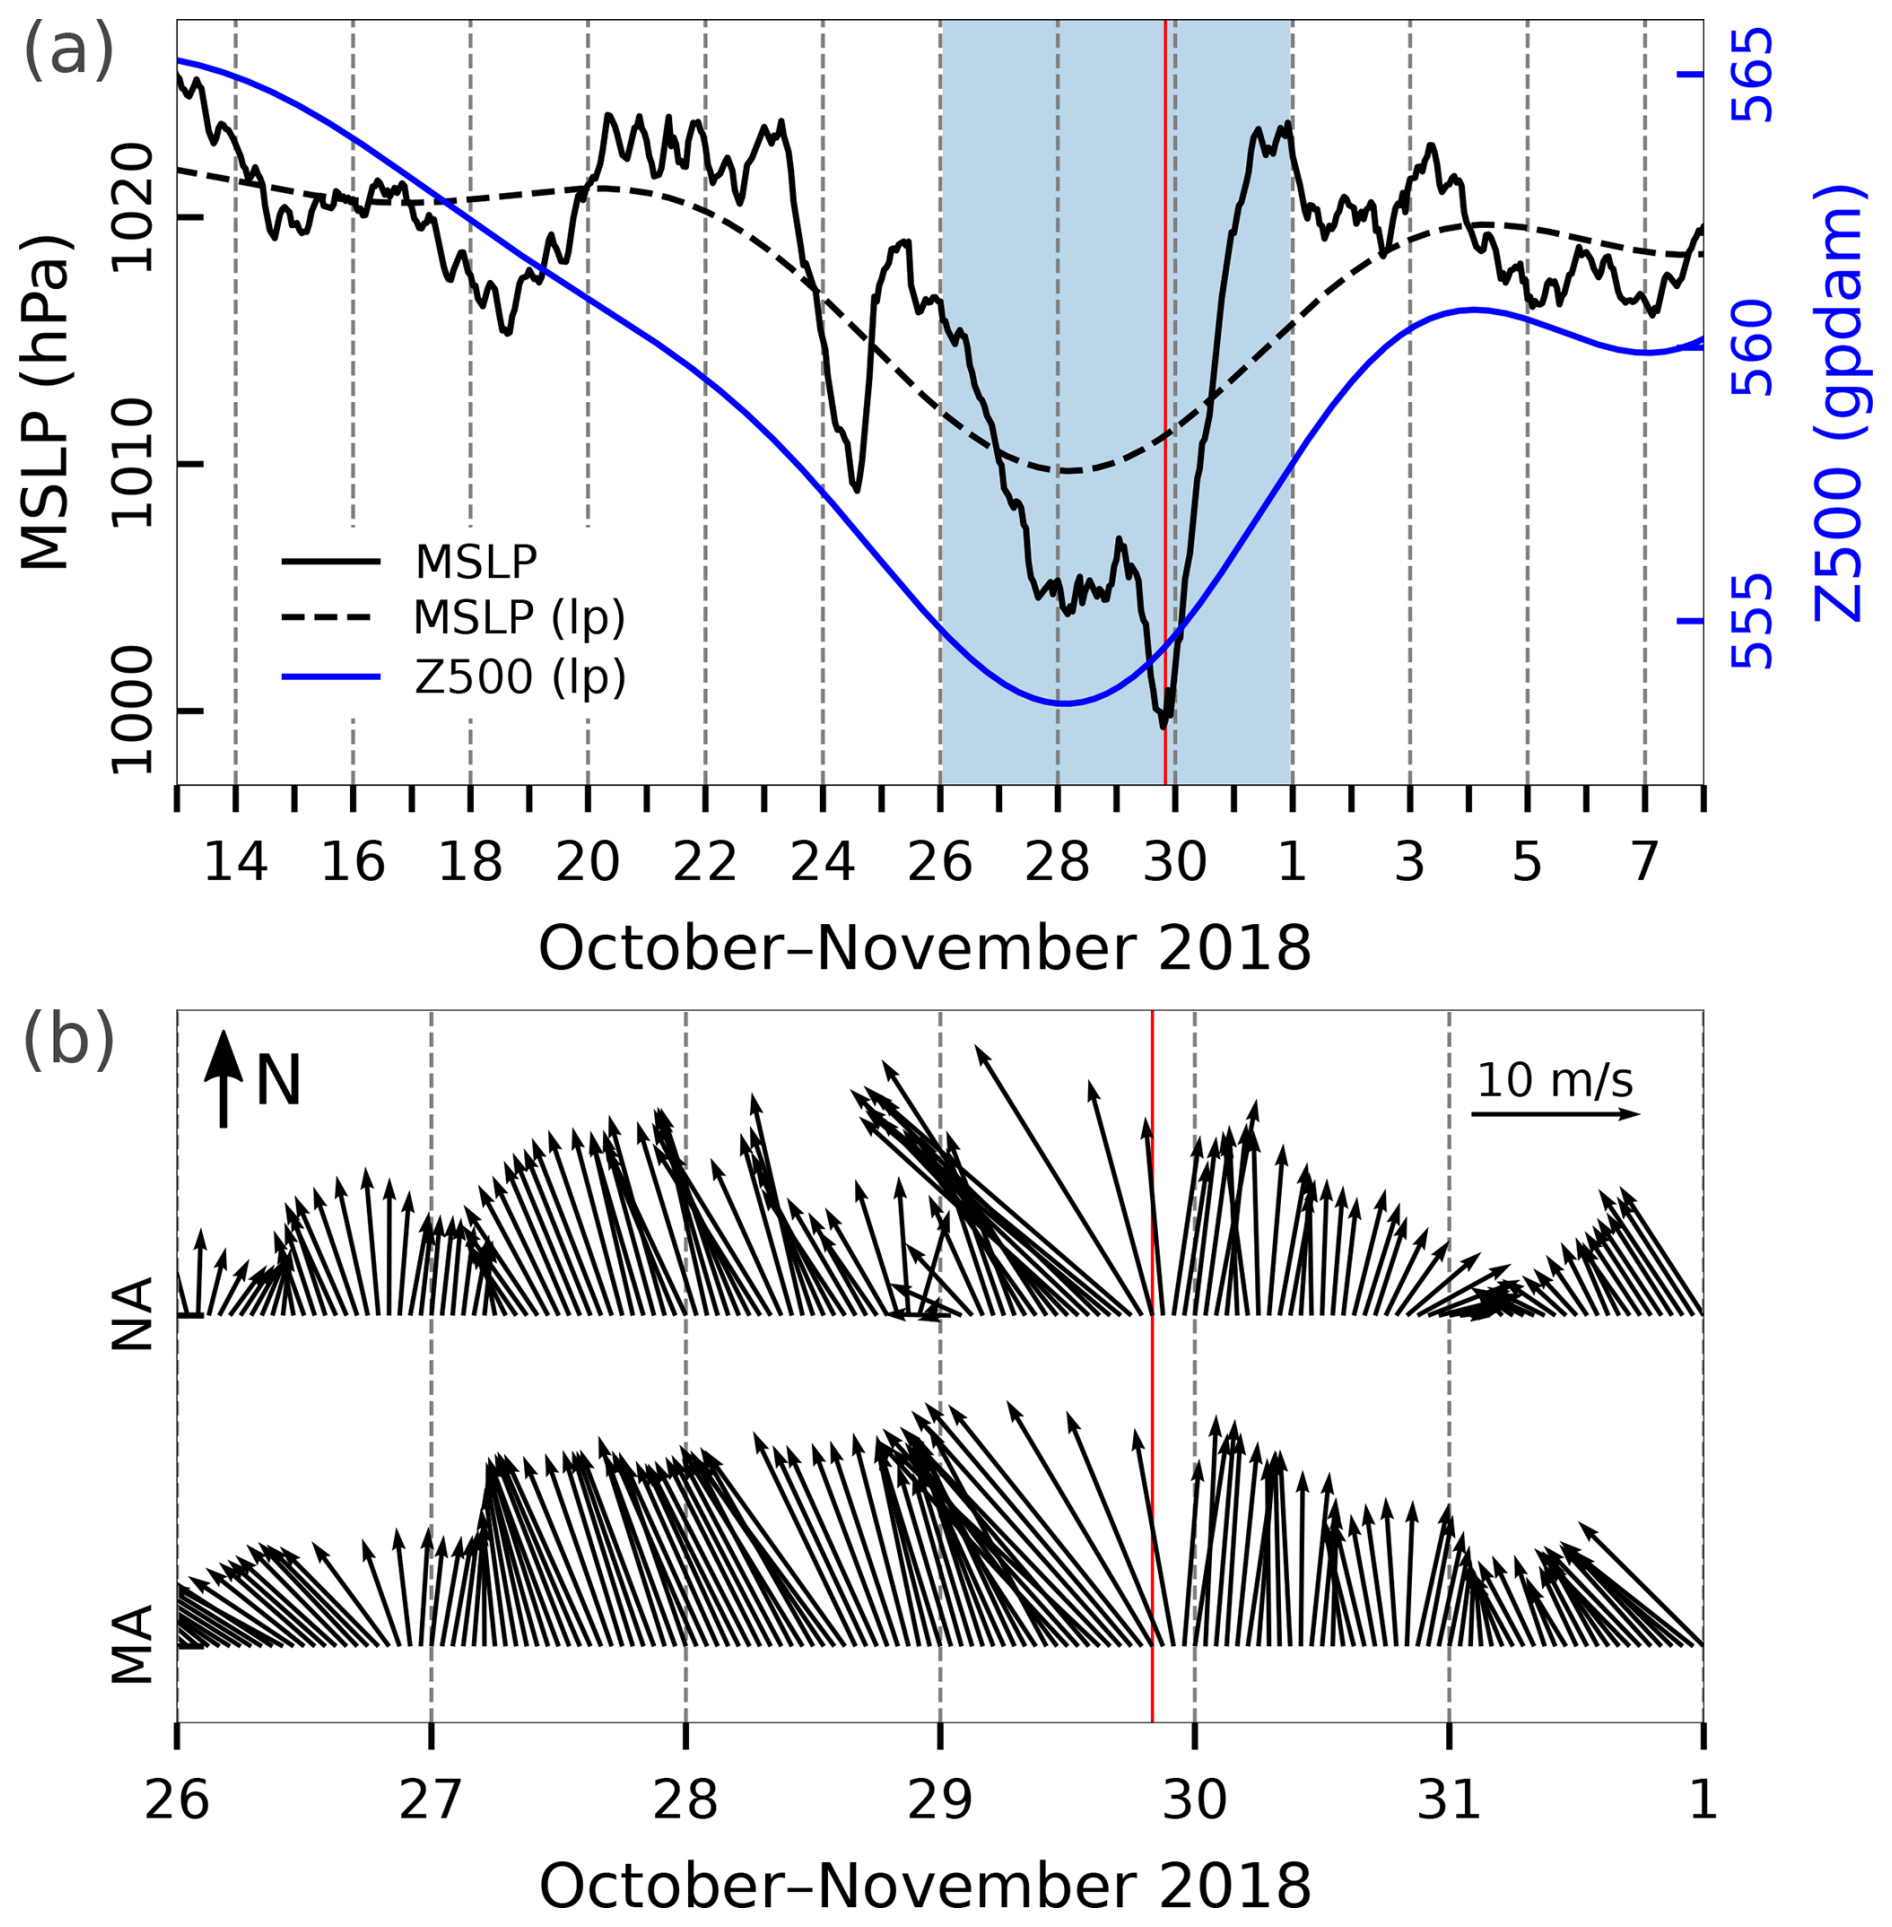
Figure 54Series of ERA5 reanalysis data related to the flood of 29 October 2018. (a) MSLP (hourly) and MSLP (lp) (low-pass filtered with a cut-off frequency of 10 d) and Z500 (lp) (low-pass filtered with a cut-off frequency of 10 d) at a grid point near TG Bakar. (b) Hourly W10 during the period marked in blue in the upper plot for the middle Adriatic (MA) and northern Adriatic (NA) (all locations marked in Fig. 1). The red line indicates the onset of the SL maximum.
The following day, on 28 October, the cold air within the trough over western Europe penetrated a little further to the south, causing a mid-tropospheric cut-off low over the south of France and the Iberian Peninsula; consequently, on the night of 29 October, there was a deepening of the surface cyclone over the Ligurian Sea. During the day (29 October), this cyclone, in the centre of which the air pressure dropped to less than 985 hPa (Fig. 55a), moved relatively quickly towards the north, with a cold front passing over the Adriatic. As a result, southeasterly wind that was of strong and gale intensity over the Adriatic on 28 October, increased to storm intensity (e.g. 25–28 m s−1 at Palagruža in the middle Adriatic) in the afternoon hours of 29 October (Fig. 54b). The wind slightly weakened by the time of the flood peak (Figs. 54b and 55b), due to the shift of the system (surface cyclone and upper-level trough) to the north and the fact that an anticyclone from the east started to affect the weather (Fig. 54). On 29 October, the following amounts of precipitation were measured along the Croatian coastline: 33 mm in Poreč (near Rovinj), 125 mm in Senj (near Bakar), and 19 mm at Dubrovnik Airport. On 30 October, precipitation in the northern Adriatic reached up to 30 mm, while the southern Adriatic experienced much larger amounts, locally exceeding 50 mm (e.g. 69 mm in Opuzen near Dubrovnik).
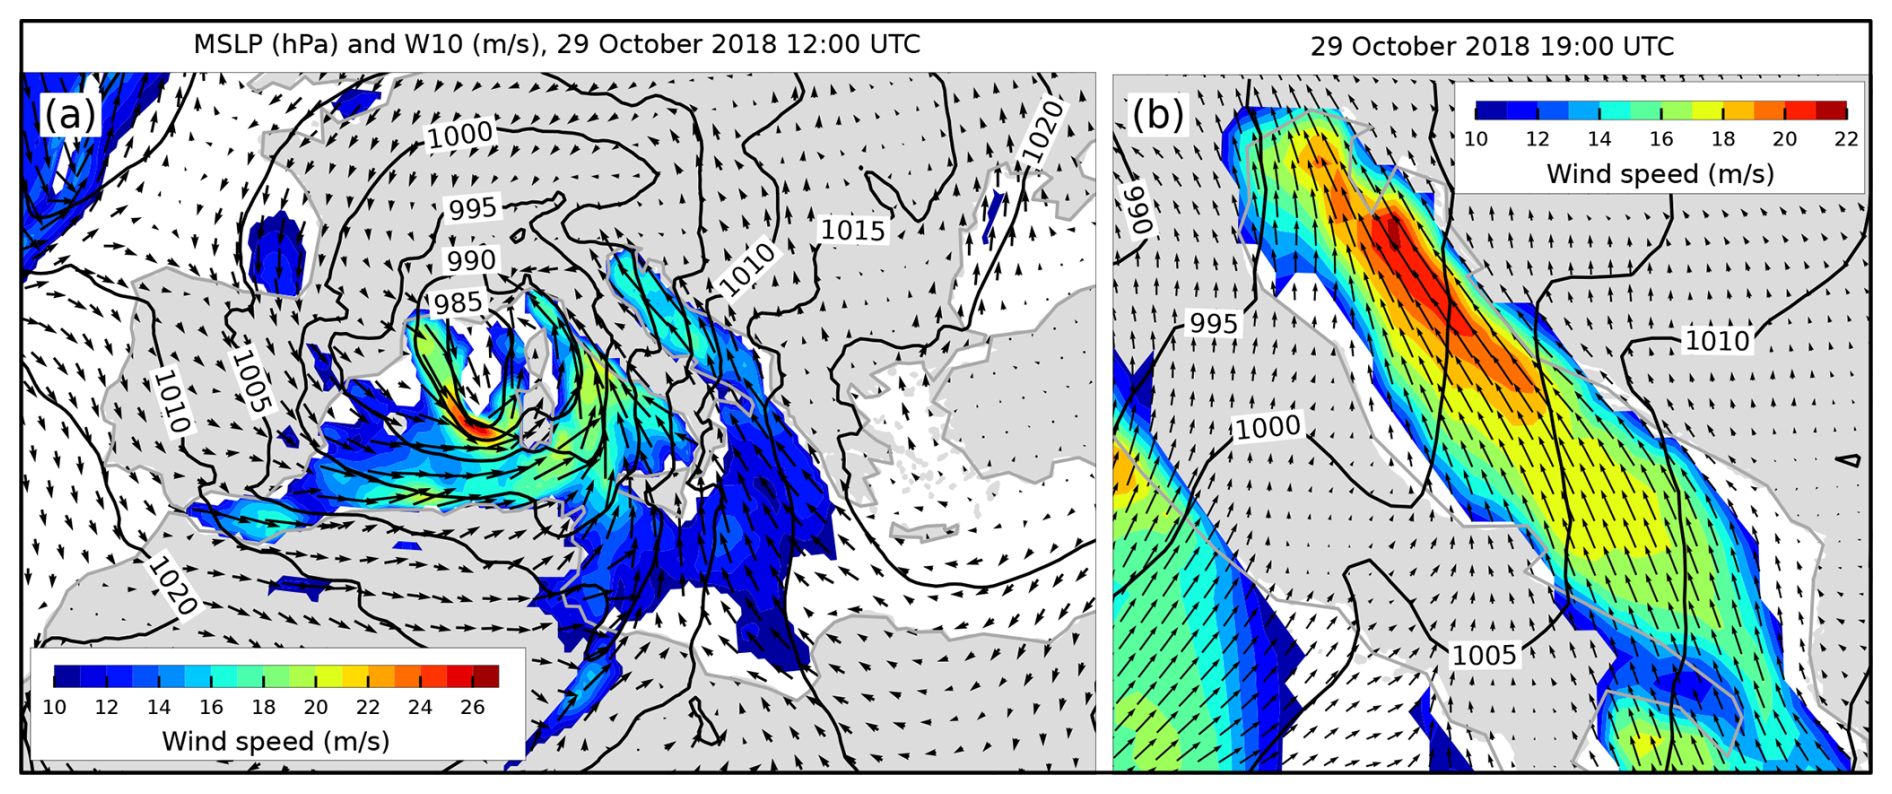
Figure 55MSLP (black lines) and W10 (arrows and colours) fields from the ERA5 reanalysis. Conditions (a) over the Mediterranean depicting a cyclone over the western Mediterranean that preceded the situation (b) over the Adriatic Sea (an hour before maximum SL in Bakar). Only wind speeds exceeding 10 m s−1 are coloured.
4.18.2 Sea-level evolution
In the evening hours of 29 October 2018 (20:00 UTC), the sea level in Bakar rose to 97 cm above the long-term average (Table 2, Fig. 56).
The lunar phase was approaching the last quarter, which gave tide a diurnal neap-tide character. The overall SL maximum formed shortly after the daily tidal minimum, so tide contributed −12 cm to this episode.
High-frequency oscillations were pronounced during this episode and contributed 12 cm.
The SL maximum occurred as the decisive cyclone crossed the Adriatic Sea (Figs. 54a and 55b), primarily due to an exceptional synoptic component. Although ∼ 21.2 h oscillations are visible in synoptic component before the main maximum (Fig. 56b), they were weak; therefore, we can say that synoptic component consisted mainly of the storm surge, which was 61 cm during the total peak. This was one of the strongest SL responses at synoptic scales (compared to other extracted floods), and it can be attributed to the MSLP gradient over the Adriatic and sirocco wind, which blew over the Adriatic for several days with extreme speeds (Fig. 54b).
Planetary-scale variability contributed 23 cm to the overall SL maximum. The conditions for flooding began to develop about a week earlier, around 22 October, when the SL started to gradually rise (Fig. 56b, plan + long) induced by a drop in MSLP (lp) (Fig. 54a) and a persistent strong southerly wind (not shown) at periods of 10–100 d. This wind blew continuously from 25 October to 9 November, reaching a peak speed of nearly 8 m s−1 on the day of the flood. The synchronised fluctuations in Z500 (lp), MSLP (lp) (Fig. 54a), and SL (Fig. 56b, plan + long) suggest that passages of atmospheric Rossby waves were driving changes in planetary-scale component.
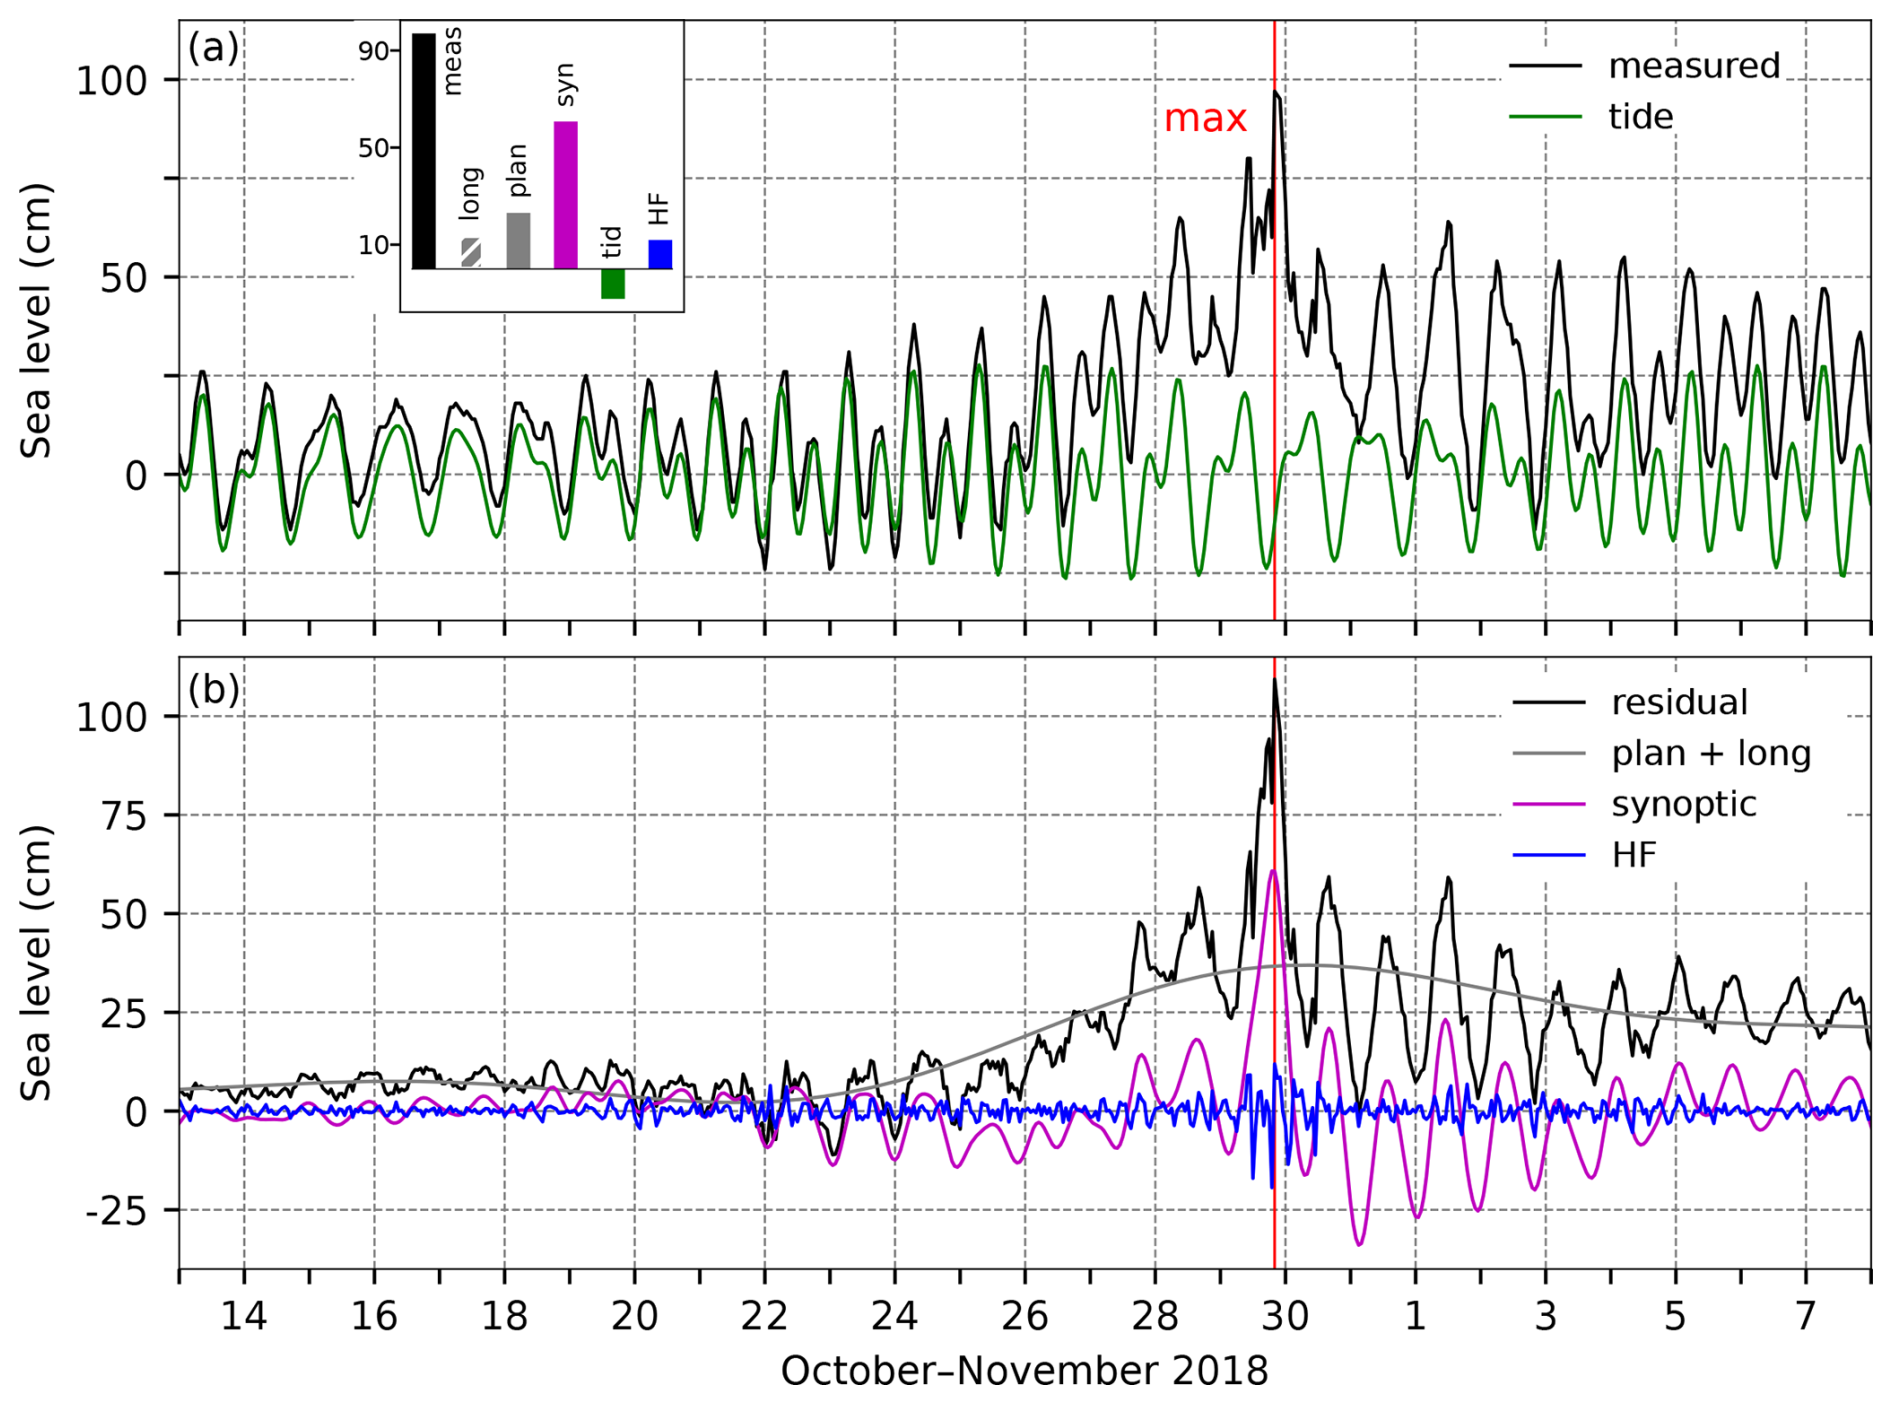
Figure 56SL series for the flood of 29 October 2018. Panel (a) shows the measured sea level (black) and tide (green). The inset figure shows the contributions (cm) of the five sea-level components to the maximum measured sea level (“meas”; 20:00 UTC): “HF” refers to high-frequency oscillations (2 h < T < 9 h), “syn” to synoptic component (9 h < T < 10 d), “tid” to tide, “plan” to planetary-scale variability (10 d < T < 100 d), and “long” to long-term sea-level variability (100 d < T). Panel (b) presents the residual sea level (black), the combined series of planetary-scale variability and long-term sea-level variability (grey; plan + long), synoptic component (purple), and high-frequency oscillations (blue). The red line indicates the time of occurrence of the total SL maximum.
Long-term sea-level variability (100 d < T) contributed 13 cm to this maximum (Figs. 73 and A1). The episode occurred just before the annual peak in intra-annual variability, which was not particularly pronounced that year (6.4 cm; Fig. 73d). The contribution from interannual variability was minimal (0.9 cm; Fig. 73c), while mean sea-level change accounted for 5.7 cm (Fig. 73b). We note that since the episode is close to the end of the studied period, the estimation of mean sea-level change may have been affected by filtering effects (as discussed in Sect. 3.2 and shown in Fig. 73b).
In summary, this flood resulted from the positive contributions of all processes but tide (which had negative contribution), with synoptic component having the strongest effect (Fig. 56). The episode could have been much stronger (+ ∼ 30 cm) if the cyclone had passed a few hours earlier when tide had reached its maximum.
4.18.3 Flood impacts
A review of the available daily newspapers (Jutarnji list, 29 October–1 November 2018, Jutarnji list, 2018a, b; Novi list, 30 October–1 November 2018, Novi list, 2018a, b; Slobodna Dalmacija, 30 October–1 November 2018; and Večernji list, 31 October–1 November 2018) revealed the following effects of the flood. The day before the main incident, strong winds and heavy rain wreaked havoc, toppling trees and flooding coastal roads along the Adriatic coast. The following day, the situation escalated to an even greater extent. In the northern Adriatic, the city of Rijeka (Fig. 1) was flooded due to a strong sirocco combined with high tide, with the flooding causing water from the sewage systems to flow into the city's main market and spread to the adjacent streets and squares. Heavy rain, gale sirocco winds, and (reportedly) 7 m high waves halted ferry services, cutting the islands off from the mainland all along the coast. Other damage and interventions included (i) flooding and damage to beach promenades along the northern Adriatic, (ii) damage or sinking of numerous boats along the entire coast, and (iii) the rescue of a woman and a child from a flooded area in the northern Adriatic.
4.19 The floods of 13 and 15 November 2019 (IDs 22 and 23; ranks 5 and 12)
The November–December 2019 period was characterised by frequent cyclonic activity, resulting in numerous storm surges and subsequent seiches in the Adriatic. These conditions provided an opportunity to evaluate the performance of forecasting systems based on hydrodynamic models (Bajo et al., 2023) and machine learning approaches (Žust et al., 2021; Rus et al., 2023, 2025). Moreover, the 12 November 2019 flood in Venice, the second-worst ever recorded, has been analysed by several authors (Cavaleri et al., 2020; Ferrarin et al., 2021, 2023; Lionello et al., 2021; Orlić and Pasarić, 2024). The flood was underestimated by forecasting systems, including both hydrodynamic and machine learning models, prompting an investigation into the contributing processes. It was shown that the event's extreme height was due to a mesoscale, short-lasting atmospheric disturbance crossing the Venetian Lagoon, which triggered an unusually strong SL response at higher frequencies – a phenomenon rarely observed along the western Adriatic coast (Ferrarin et al., 2021, 2023).
4.19.1 Meteorological background
In the period from 10 to 15 November, the weather over the Adriatic was characterised by the passage of three cyclones (Fig. 57a), which resulted with variable-intensity winds over the Adriatic blowing for days, predominantly from the southeast (Fig. 57b). The generation and propagation of the mentioned cyclones was supported by upper-level conditions that included a wide upper-level trough in the western half of Europe and a well-pronounced ridge in its eastern part.
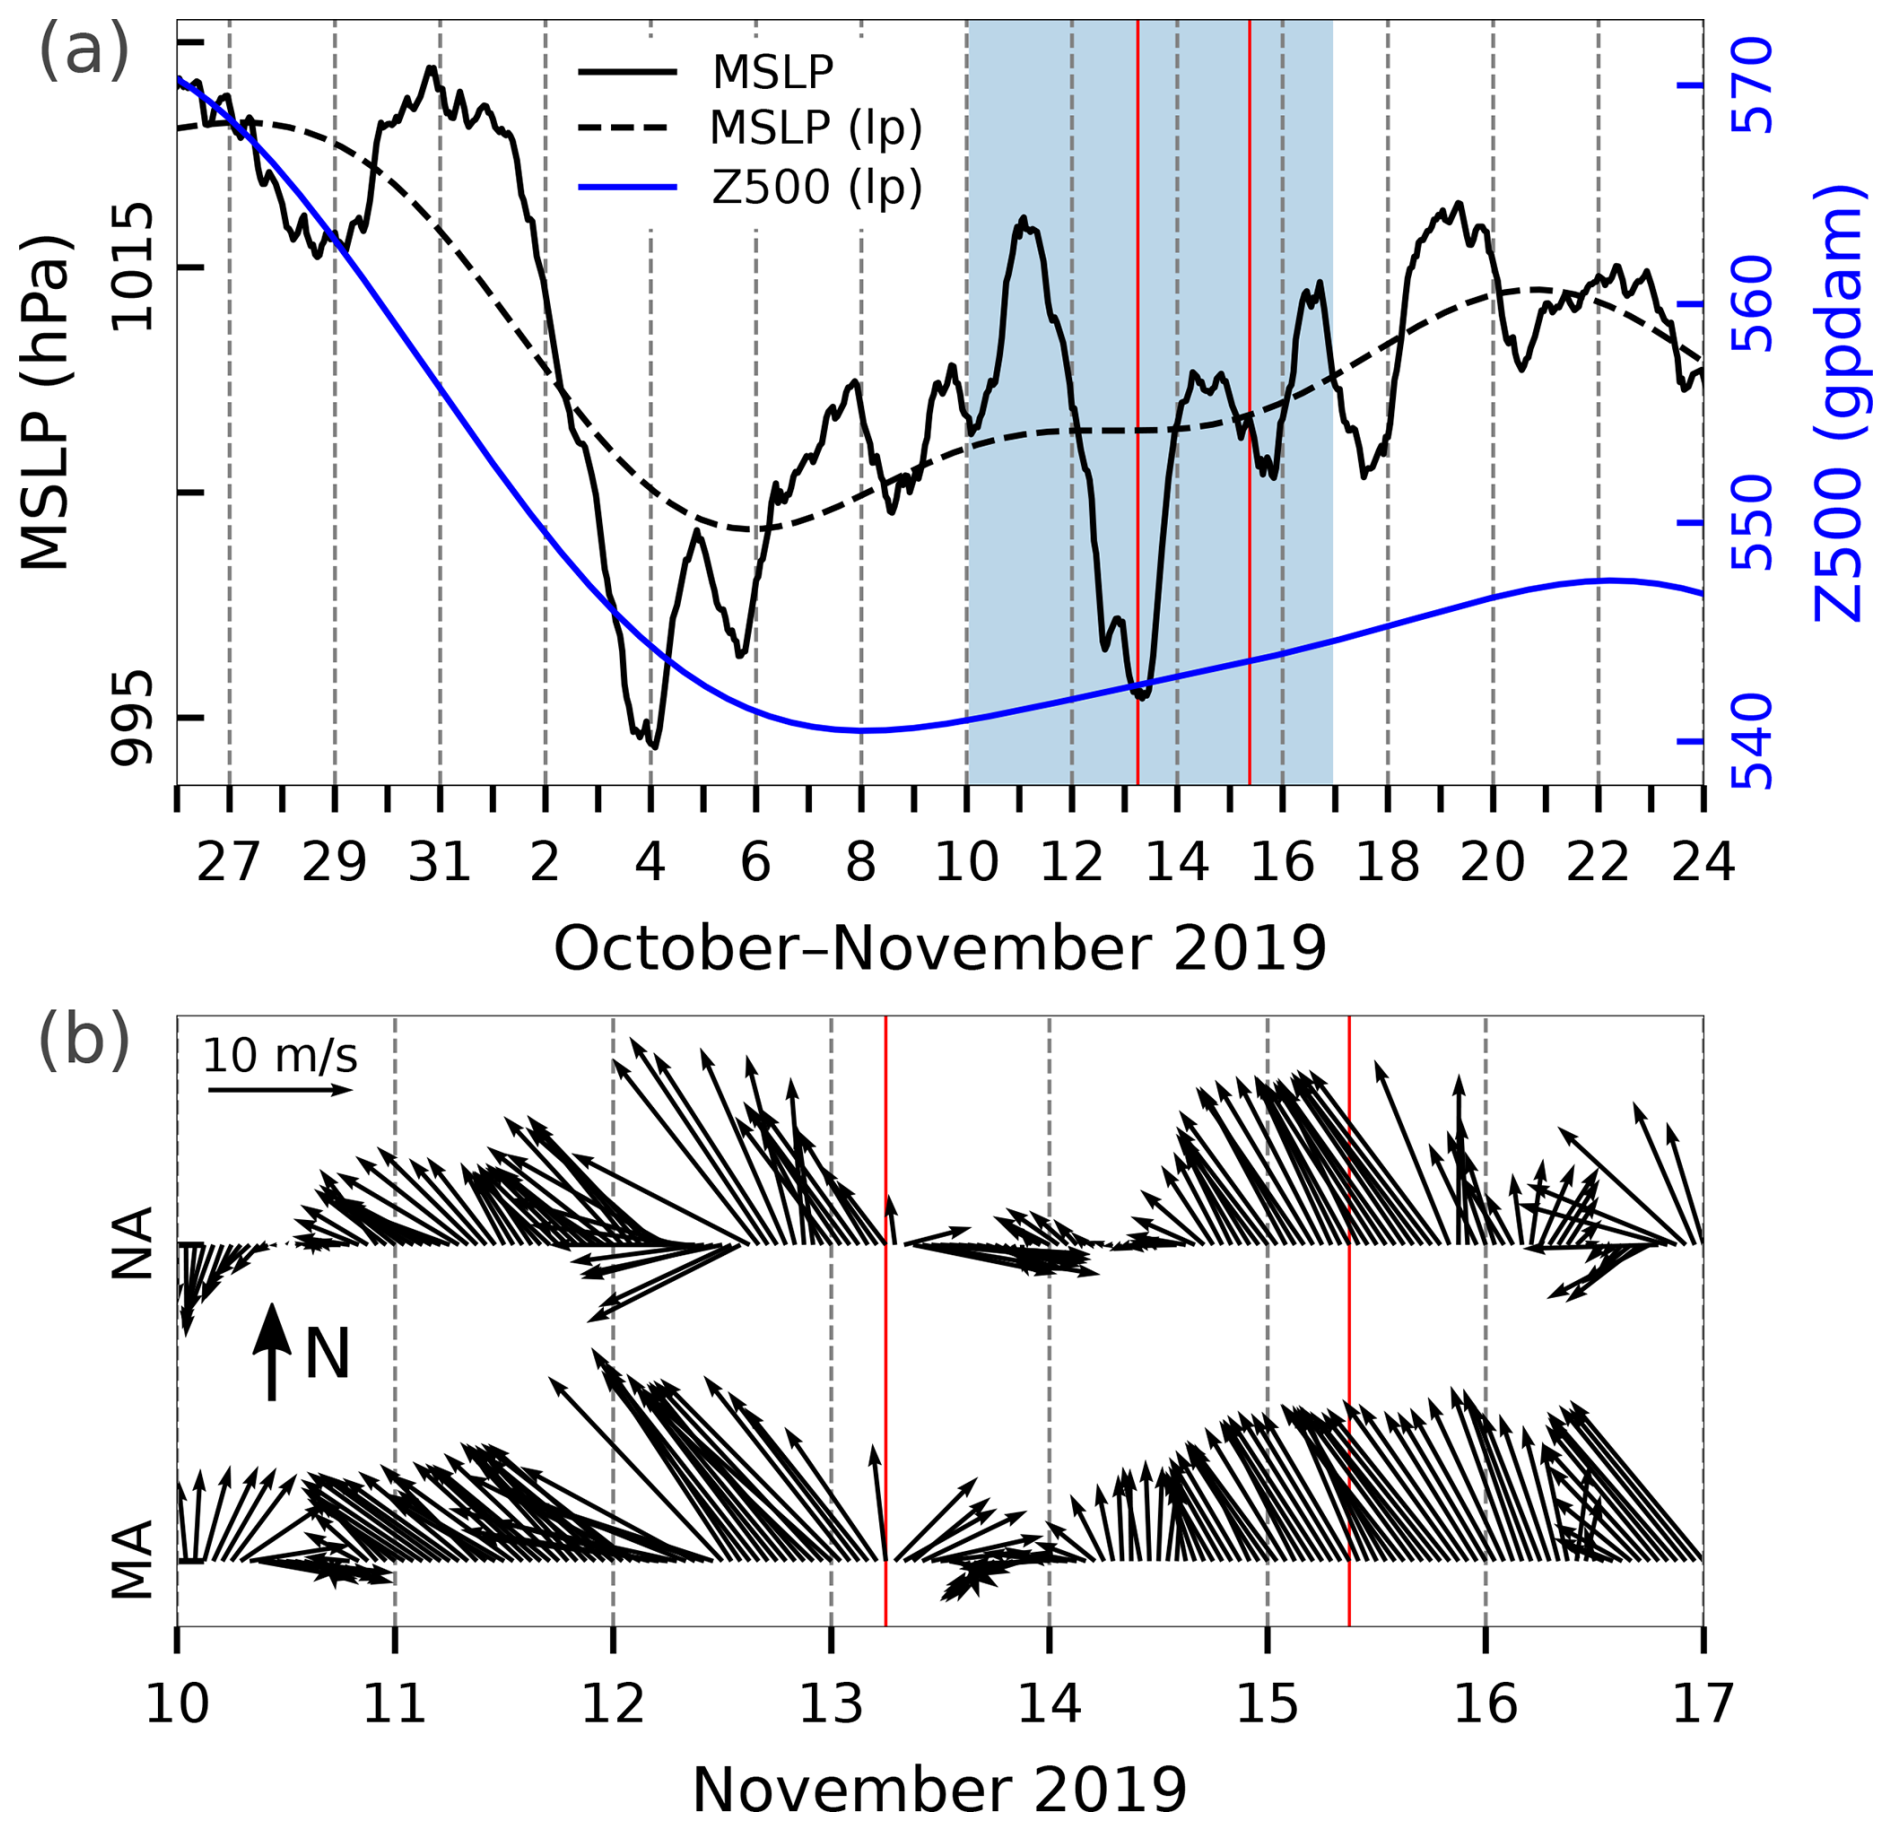
Figure 57Series of ERA5 reanalysis data related to the floods of 13 and 15 November 2019. (a) MSLP (hourly) and MSLP (lp) (low-pass filtered with a cut-off frequency of 10 d) and Z500 (lp) (low-pass filtered with a cut-off frequency of 10 d) at a grid point near TG Bakar. (b) Hourly W10 during the period marked in blue in the upper plot for the middle Adriatic (MA) and northern Adriatic (NA) (all locations marked in Fig. 1). The red lines indicate onset of the SL maxima.
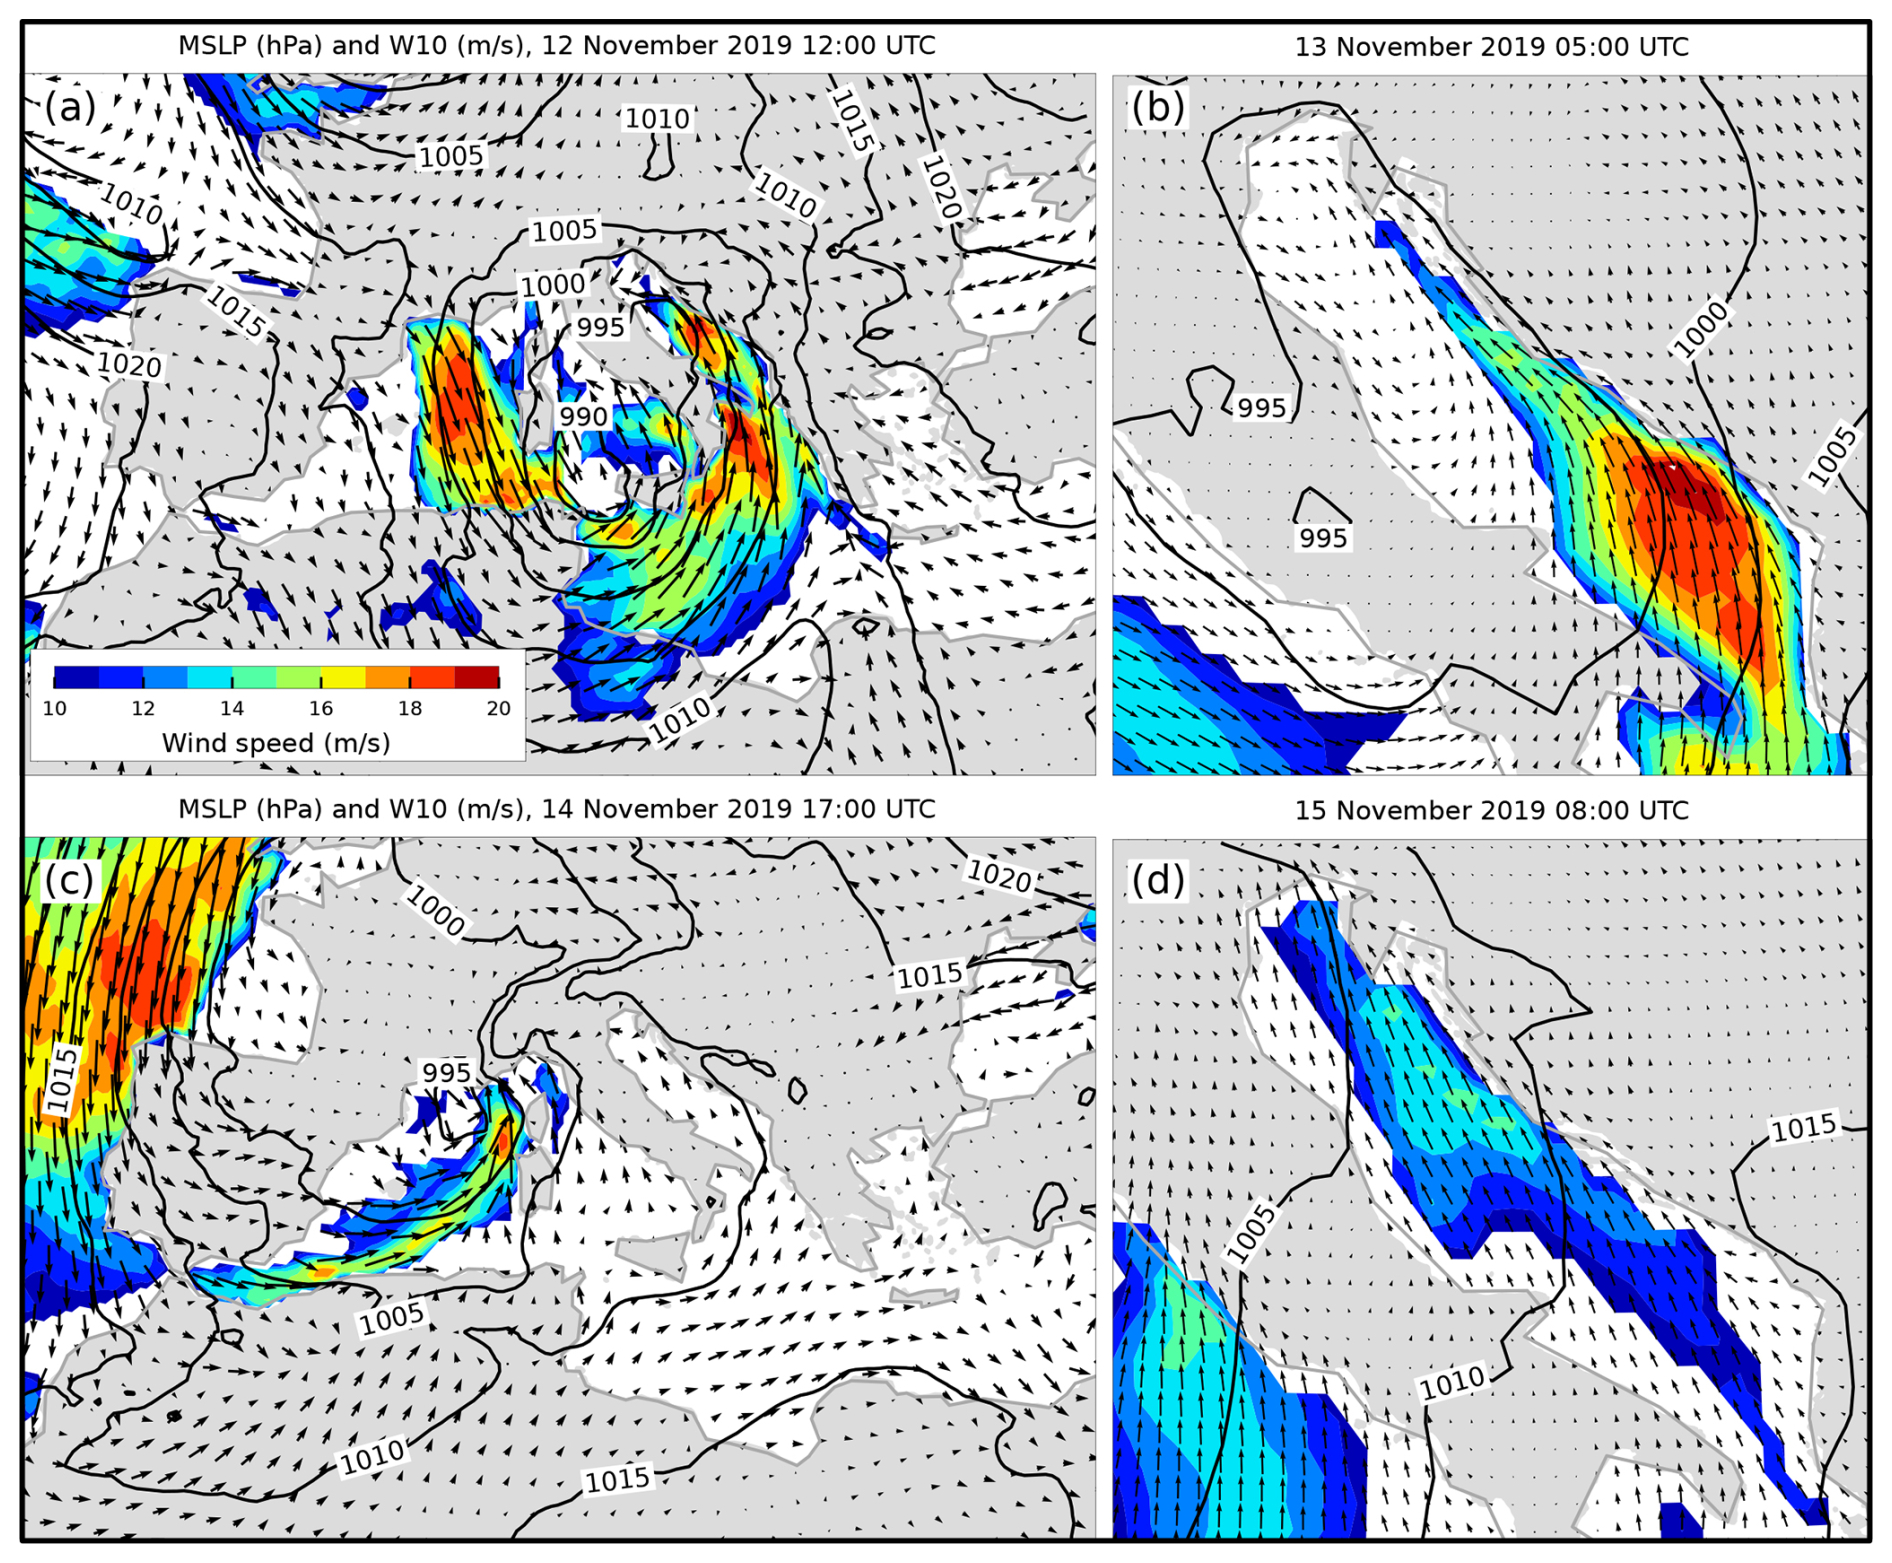
Figure 58MSLP (black lines) and W10 (arrows and colours) fields from the ERA5 reanalysis. Conditions (a, c) over the Mediterranean depicting cyclones in the western Mediterranean that preceded the situations (b, d) over the Adriatic Sea (an hour before SL maxima in Bakar). Only wind speeds exceeding 10 m s−1 are coloured. One colour map is used for all cases.
On 10 November, in the western Mediterranean, a cyclone developed and gradually deepened during the next day. In the upper level, a closed circulation of low pressure developed within and near the base of the trough. At the leading side of this trough unstable air was transported towards the Adriatic Sea. As the cyclone slowly moved towards Sardinia, the southeast wind over the Adriatic gradually increased during 11 November (Fig. 57b). The next day, 12 November, the centre of the cyclone moved over the Tyrrhenian Sea (Fig. 58a), causing a further increase in southeasterly and southerly wind over the Adriatic. Over the south and middle Adriatic, the wind was of strong to gale intensity with hurricane gusts (e.g. 38 m s−1 in Split and 41 m s−1 in Dubrovnik; according to the Beaufort scale, hurricane winds are greater than 32.8 m s−1), and heavy precipitation was measured locally (25–50 mm). The following day, 13 November, in the morning hours, the centre of the cyclone gradually moved over the Adriatic area (Fig. 58b). This led to strong, gale, and (occasionally) hurricane southeasterly wind over the Adriatic, accompanied by heavy precipitation. Amounts of precipitation ranged from 30 to 50 mm along the Croatian coastline, with locally higher values, such as 71 mm in Lošinj (Kvarner), 61 mm in Zadar, and 101 mm in Supetar (near Split). The upper-level flow was still southwesterly on the downstream side of a deep and well-pronounced trough that stretched from Iceland in the north to Egypt in the south. As the day progressed, the cyclone gradually filled over the Adriatic, leading to the air-pressure gradient weakening. Therefore, the southeasterly wind also gradually decreased, turning to southwesterly and southerly wind (Fig. 57b).
On 14 November, the above-mentioned cyclone moved eastward, and air pressure over the Adriatic was around 1013 hPa (Fig. 57a). In the upper-level, the flow was southwesterly on the downstream side of a vast trough that covered the entire western half of Europe and whose axis stretched from the North Sea through France and the Mediterranean to the north of Africa. This trough was accompanied by a surface low over the Bay of Biscay (with an air pressure in the centre of 990 hPa). As this cyclone approached the European mainland on 14 November, a new cyclone in the Gulf of Lion started to form (Fig. 58c). This new cyclone moved towards the Gulf of Genoa and further towards the northeast. On 15 November, its frontal system affected the Adriatic, remaining almost stationary there (Fig. 58d). At the same time, the upper-level ridge accompanied by a surface high pressure remained in the east of the continent. As a result, there was a pronounced air-pressure gradient over the Adriatic that led to the strong and gale southeasterly wind (Fig. 57b).
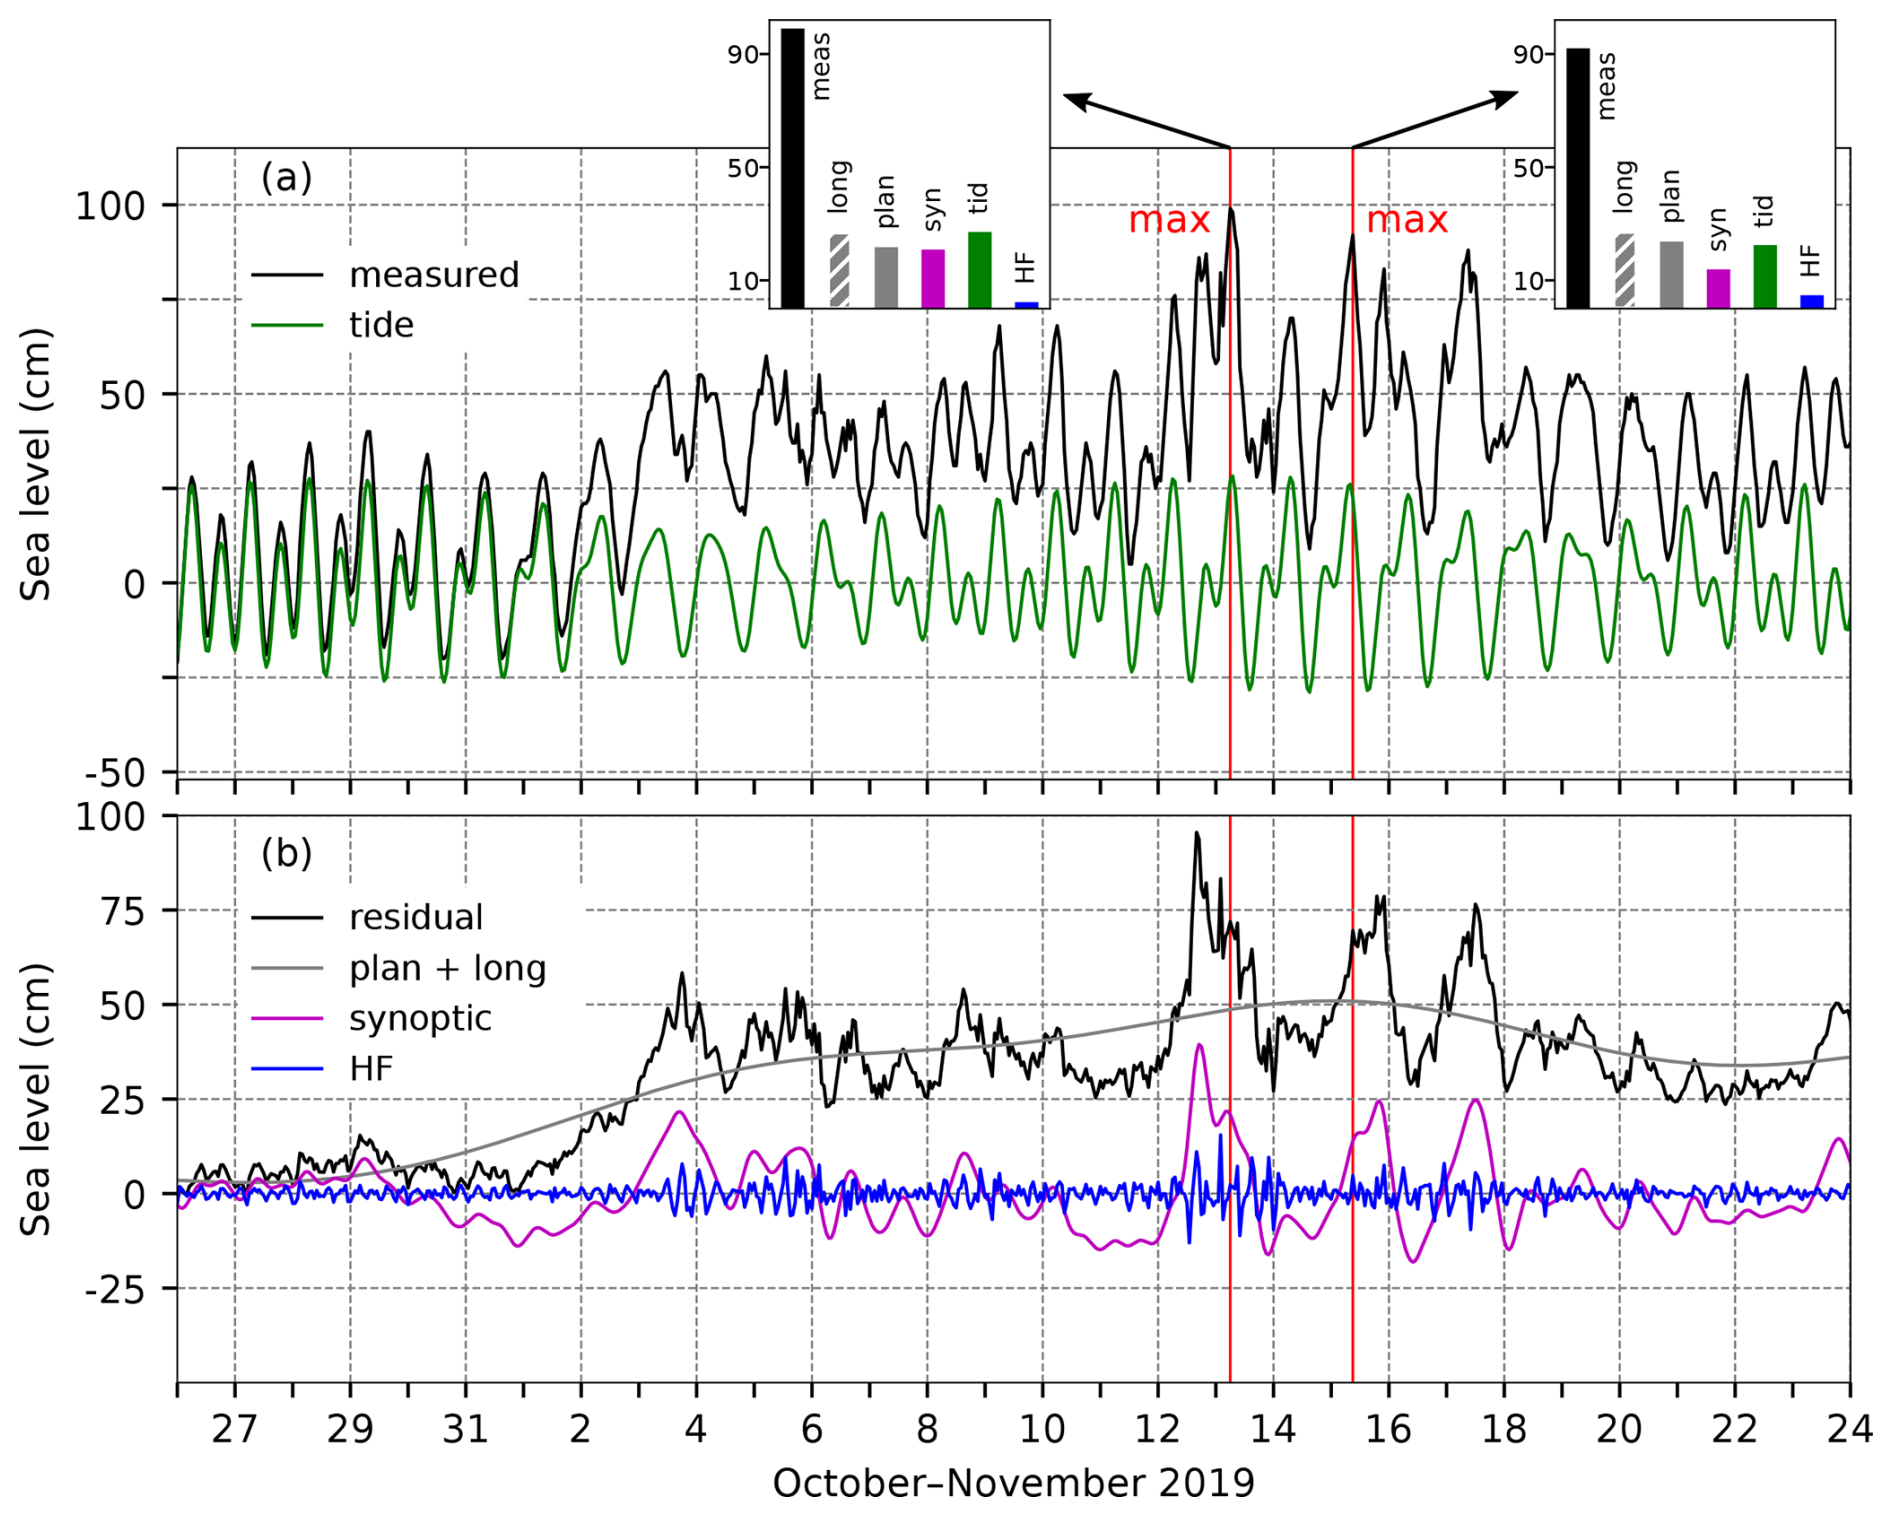
Figure 59SL series for the floods 13 and 15 November 2019. Panel (a) shows the measured sea level (black) and tide (green). The inset figures show the contributions (cm) of the five sea-level components to the maximum measured sea levels (“meas” – left: 13 November 2019 at 06:00 UTC; right: 15 November 2019 at 09:00 UTC): “HF” refers to high-frequency oscillations (2 h < T < 9 h), “syn” to synoptic component (9 h < T < 10 d), “tid” to tide, “plan” to planetary-scale variability (10 d < T < 100 d), and “long” to long-term sea-level variability (100 d < T). Panel (b) presents the residual sea level (black), the combined series of planetary-scale variability and long-term sea-level variability (grey; plan + long), synoptic component (purple), and high-frequency oscillations (blue). Red lines indicate the times of the maximum total SL.
4.19.2 Sea-level evolution
On 13 November 2019, at 06:00 UTC, the sea level in Bakar reached 99 cm, while on 15 November 2019, at 09:00 UTC, 92 cm was measured (Table 2, Fig. 59). The 13 November total SL maximum (99 cm) came after the peak in the residual sea level, which occurred on 12 November and amounted to an exceptional 95 cm.
The moon was full on 12 November, so tide had a semidiurnal spring-tide character. The two SL maxima were reached during the daily tidal peaks, which contributed 27 cm (to the flood of 13 November) and 22 cm (to the flood of 15 November) (Fig. 59a).
Although high-frequency oscillations were active during these two episodes, in particular during the 13 November flood (Fig. 59b), and had a considerable amplitude (compared to the amplitudes of high-frequency oscillations during other extracted floods; Table 2), their contribution to the overall maxima was 2 and 5 cm, respectively. It should be mentioned that during the first episode, a fast-moving mesoscale atmospheric disturbance caused a strong local SL response in the Venetian Lagoon, which significantly affected the overall sea level maximum there (Ferrarin et al., 2021, 2023).
The peak in synoptic component occurred on 12 November (coinciding with the residual maximum) and was 39 cm high. As there were no apparent ∼ 21.2 h oscillations in the basin prior to the two episodes, synoptic component was driven mainly by a storm surge, i.e. forced oscillations. By the SL peak on 13 November, the induced storm surge was already receding due to the weakening of the atmospheric forcing (Figs. 57b and 58b), reaching 21 cm (Fig. 59a), and dropping to −11 cm on 14 November. By 15 November, synoptic component was again enhanced by the strong sirocco (Figs. 57b and 58d), reaching 14 cm (Fig. 59a).
Planetary-scale variability was high during the floods, contributing 22 cm to the 13 November episode and 24 cm to the 15 November episode. Preconditioning began 2 weeks earlier, when sea levels began to rise gradually (Fig. 59b, plan + long). Comparison of Figs. 57a and 59b shows that, while Z500 (lp) and MSLP (lp) initially dropped and then slightly increased, the SL (plan + long) continued to rise steadily throughout the period leading up to the floods. This indicates that changes in the MSLP (lp) did not support the SL rise during the entire period; however, a persistent southerly wind (at periods of 10–100 d), with a maximum speed of 4 m s−1, blew from early until almost late November, contributing to the rise in the SL (Fig. 59b, plan + long).
Long-term sea-level component (100 d < T) was exceptionally high during these episodes, contributing 27 cm to both events (Figs. 73 and A1). This was primarily driven by a significant contribution from intra-annual variations (19.5 cm; Fig. 73d), with a small additional increase from interannual processes (1.5 cm; Fig. 73c). As seen in other recent floods, the amplitude of mean sea-level change was also high, reaching 6 cm (Fig. 73b). It is worth noting that, as this episode occurred near the end of the analysed series, the estimate of mean sea-level change may have been underestimated due to edge effects from filtering.
In summary, these two floods resulted from a constructive superposition of all contributing processes, with all components, except for high-frequency oscillations, playing similar roles (Fig. 59).
4.19.3 Flood impacts
A review of available daily newspapers (Jutarnji list, 14 and 17 November 2019, Jutarnji list, 2019a, b) revealed the following effects of the floods. In the week before the floods, heavy precipitation was recorded in the northern Adriatic. This necessitated major interventions in which firefighters had to pump out the excess water. A day before the first flood on 12 November 2019, the Croatian Hydrographic Institute (HHI) documented a record-breaking wave measuring 10.87 m (HHI, 2024) in height near the island of Sveti Andrija (close to Dubrovnik; Fig. 1). For the following day, DHMZ issued a warning for the northern Adriatic because of a strong sirocco and the possibility of flying debris carried by the wind. All along the Adriatic coast, there were significant interventions by firefighters due to fallen trees; landslides; and flooded streets, shops, restaurants, and business premises. Two days later, on 15 November 2019, another flood was recorded. Eyewitness reports describe a brief waterspout causing significant material damage in the northern Adriatic. Ferry, boat, and catamaran services were widely disrupted along the Adriatic coast, from Kvarner to Dubrovnik. Notably, in one incident in Dubrovnik, a tourist was pulled into the sea by large waves and was unable to get back ashore on his own; however, luckily, local anglers noticed and rescued him.
4.20 The flood of 23 December 2019 (ID 24; rank 10)
As already noted, the November–December 2019 period was characterised by frequent cyclone activity over the Adriatic, leading to numerous storm surges and subsequent seiches. These conditions posed significant challenges for forecasting systems based on hydrodynamic models (Bajo et al., 2023) and machine learning approaches (Rus et al., 2023, 2025), making it an ideal case to evaluate their performance.
4.20.1 Meteorological background
On 18, 19, and 20 December, western Europe and a large part of central and southern Europe were affected by a major upper-level trough associated with pronounced cyclonic activity at the low levels over the British Isles and along the coast of western Europe. At the same time, the influence of the upper-level ridge and surface-based anticyclone prevailed further east (the air pressure over Türkiye was 1030 hPa). In such a synoptic situation, a strong air-pressure gradient was established over Europe, between the northwest and southeast, and as a result, moderate, strong, and (locally) gale southeasterly wind blew over the Adriatic (Fig. 60).
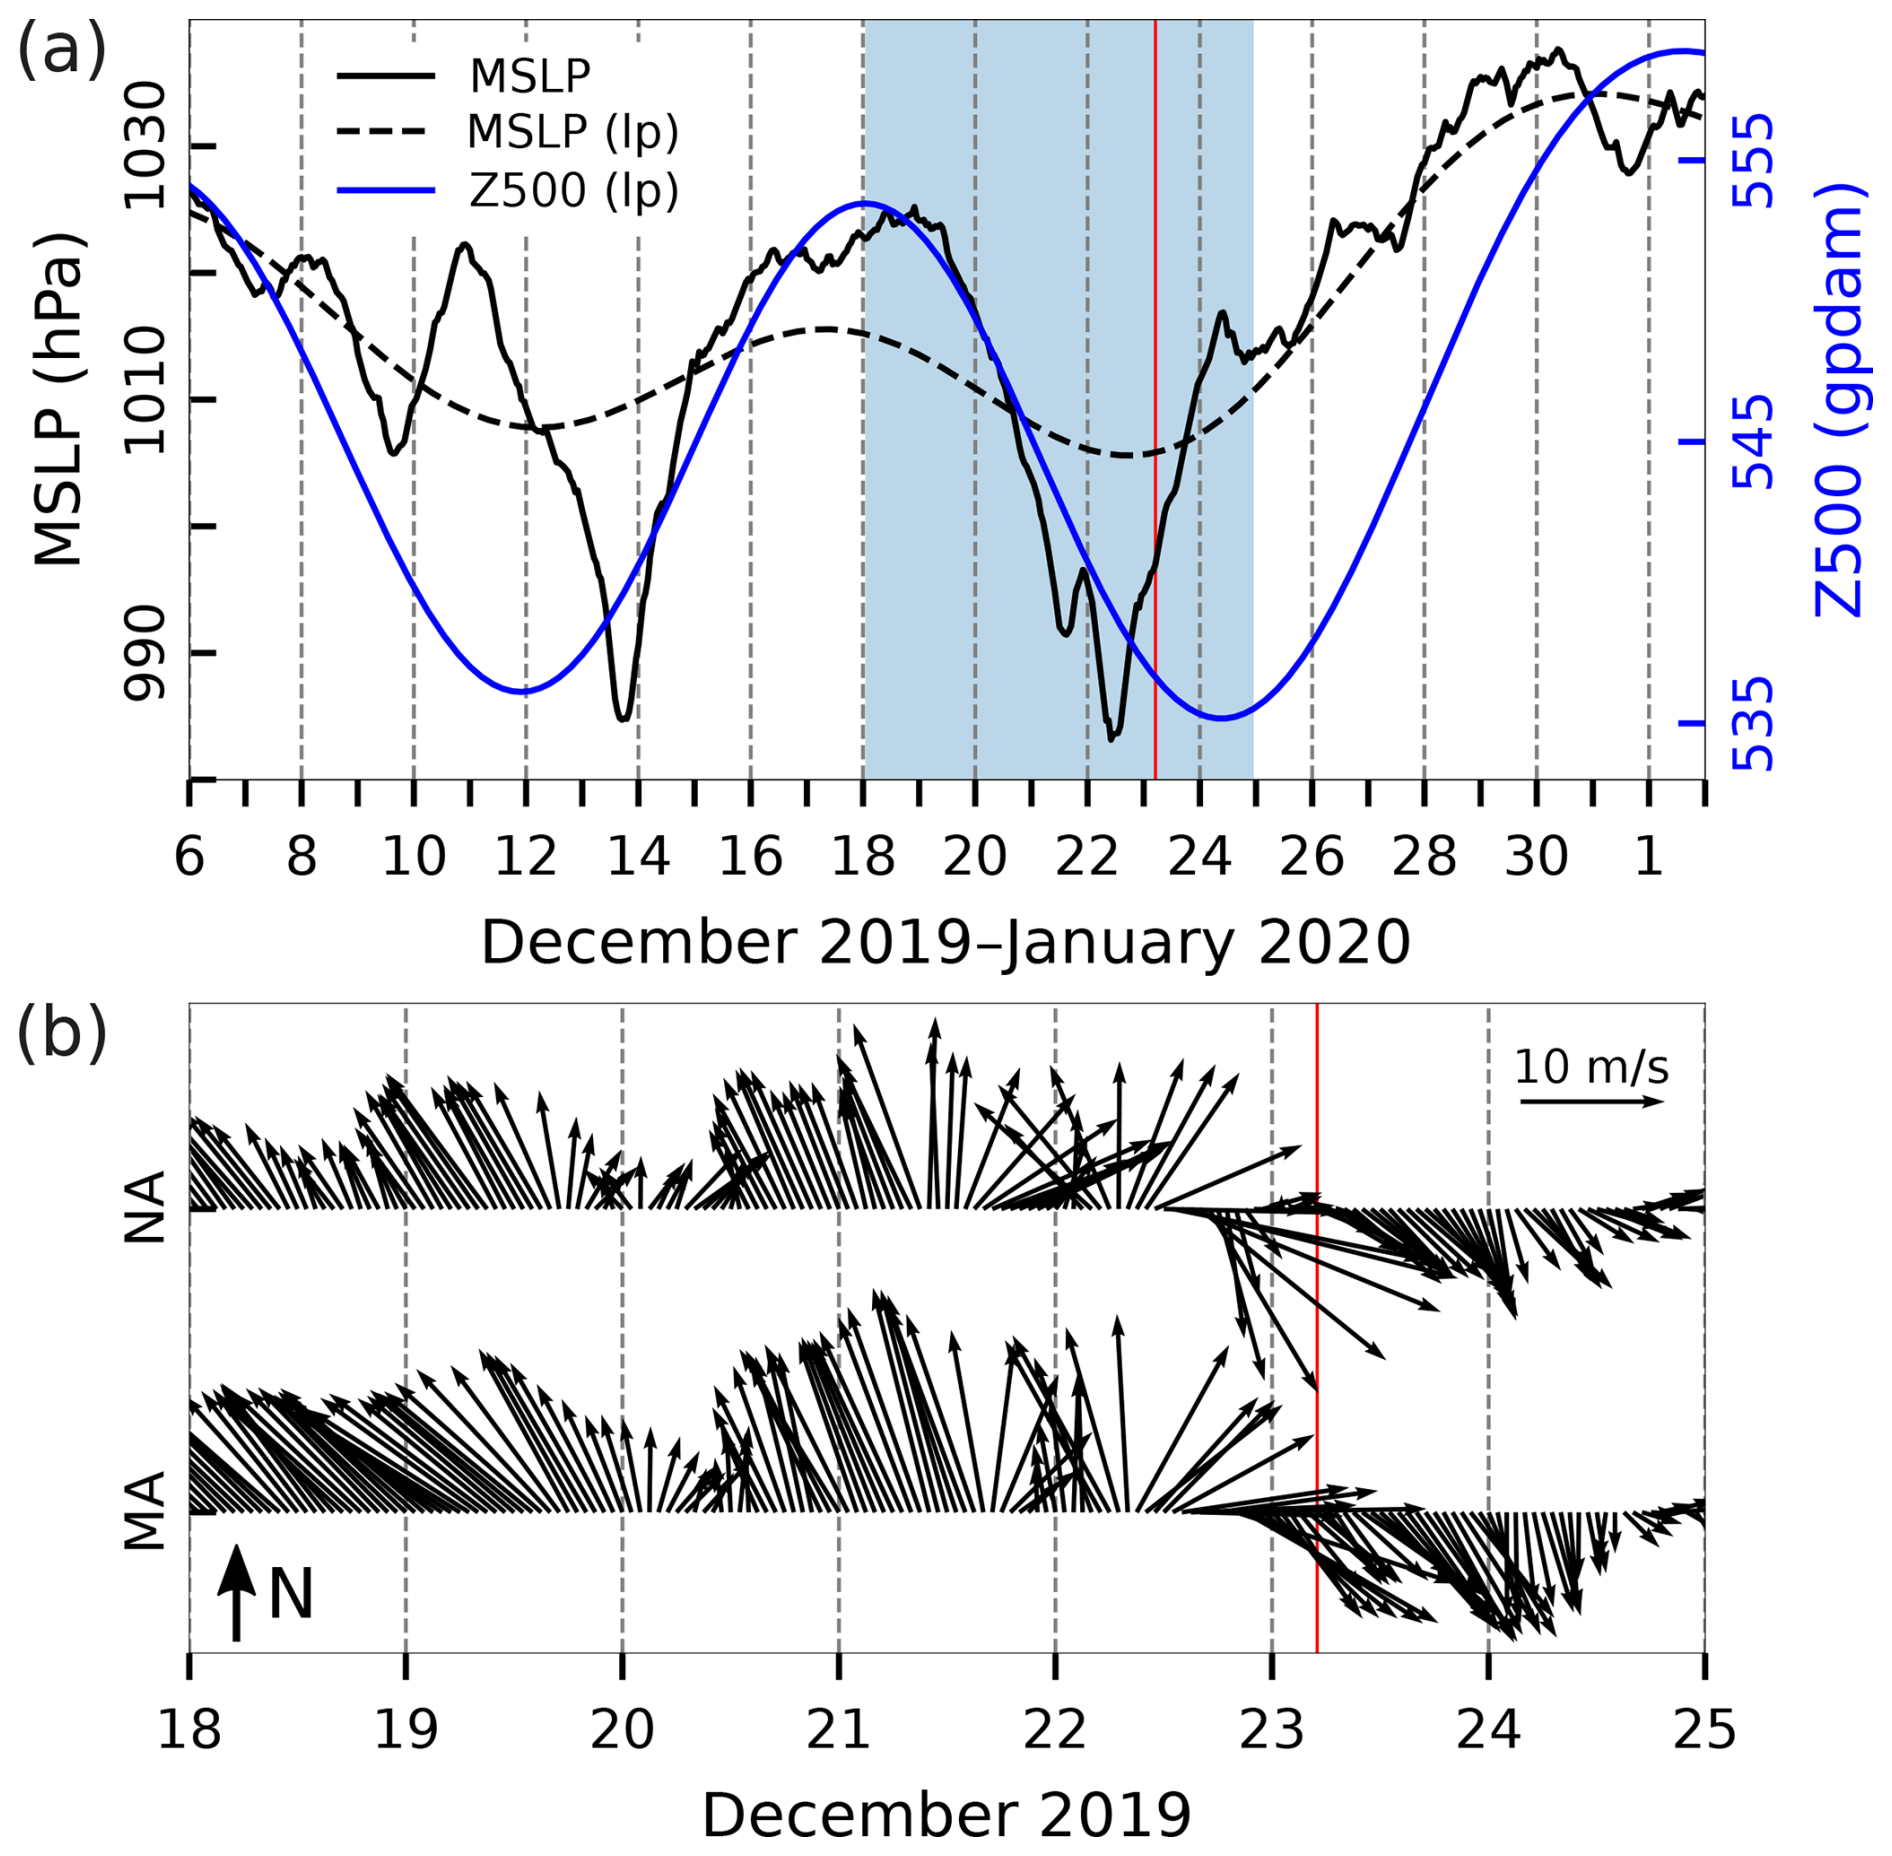
Figure 60Series of ERA5 reanalysis data related to the flood of 23 December 2019. (a) MSLP (hourly) and MSLP (lp) (low-pass filtered with a cut-off frequency of 10 d) and Z500 (lp) (low-pass filtered with a cut-off frequency of 10 d) at a grid point near TG Bakar. (b) Hourly W10 during the period marked in blue in the upper plot for the middle Adriatic (MA) and northern Adriatic (NA) (all locations marked in Fig. 1). The red line indicates the onset of the SL maximum.
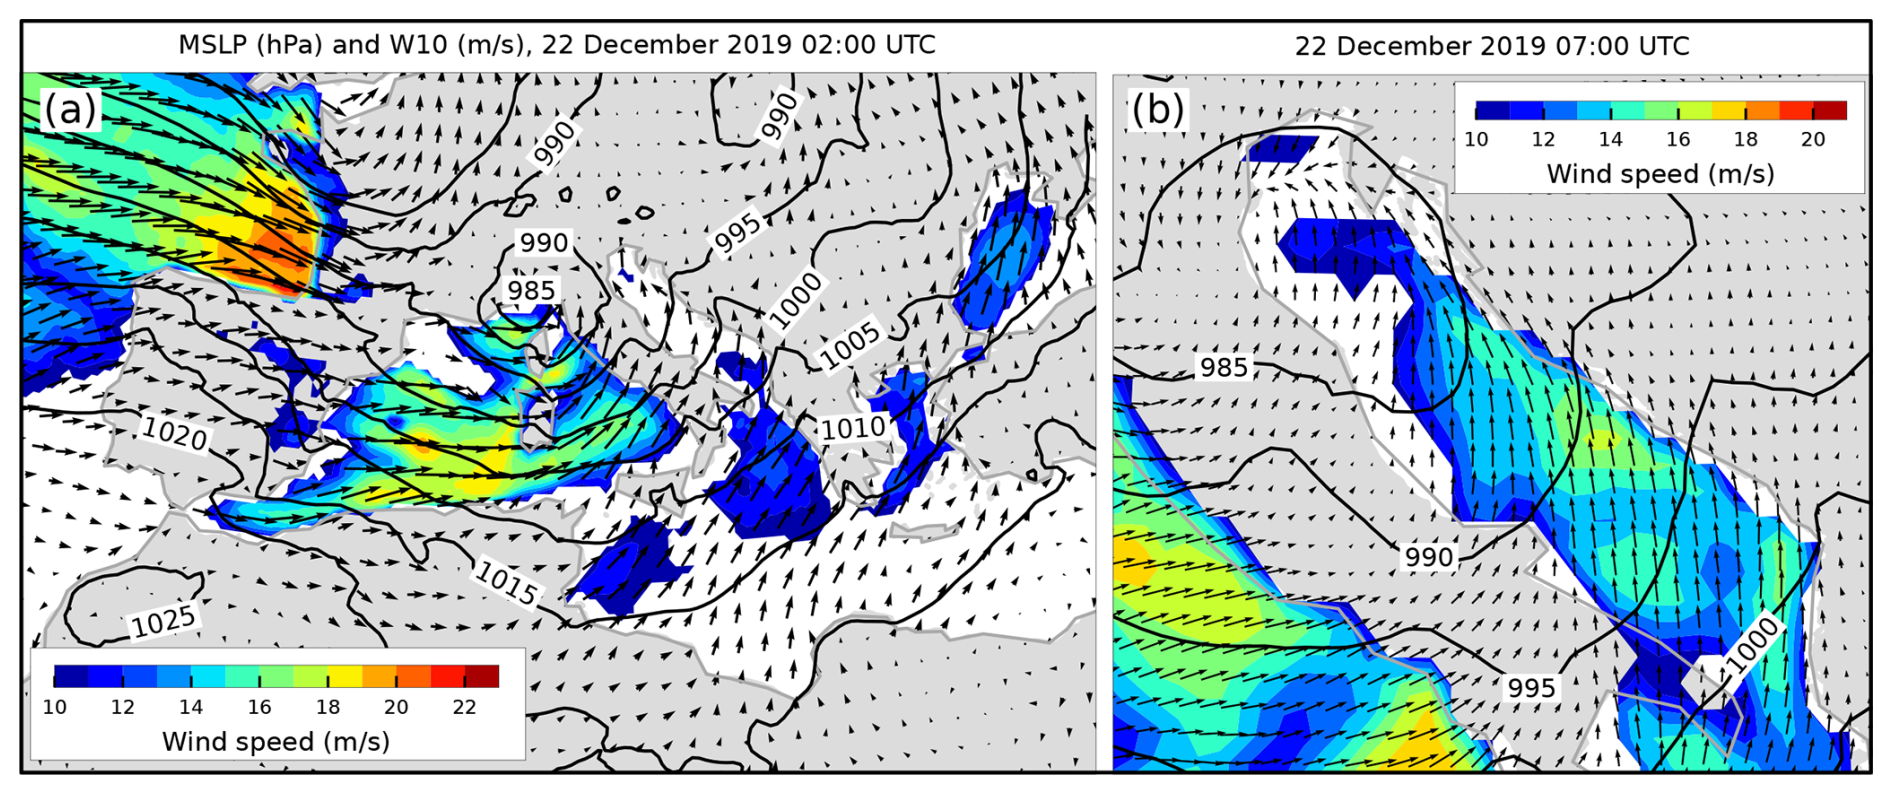
Figure 61MSLP (black lines) and W10 (arrows and colours) fields from the ERA5 reanalysis. Conditions (a) over the Mediterranean depicting a cyclone over the Gulf of Genoa that preceded the situation (b) over the Adriatic Sea (22 h before the flood). Only wind speeds exceeding 10 m s−1 are coloured.
On 21 December, a cyclone formed over the Gulf of Genoa and moved straight to the northern Adriatic during the day, intensified there to 990 hPa at its centre, and then continued further towards the northeast. The propagation of this cyclone supported the southerly flow over the Adriatic area. At the same time, a new cyclone was approaching the British Isles and gradually intensifying (pressure of up to 965 hPa at its centre), and it extended through the troposphere up to the 500 hPa level. As its frontal system entered the European mainland, a secondary cyclone developed in the Gulf of Genoa in the first hours of 22 December. This cyclone further deepened (to less than 985 hPa; Fig. 61a) while rapidly propagating over the Adriatic (Fig. 61b), and by the end of the day, it had moved further to the east. In the upper levels, the trough, with the axis laid out in a NW–SE direction, propagated across the Adriatic. During the day (22 December), strong and gale southeasterly and southwesterly wind blew over the Adriatic, locally accompanied by heavy precipitation (e.g. 46 mm in Bakar and 34 mm in Zadar). As the cyclone moved eastward, the wind shifted to a westerly and northwesterly direction over a greater part of the Adriatic (Fig. 60b).
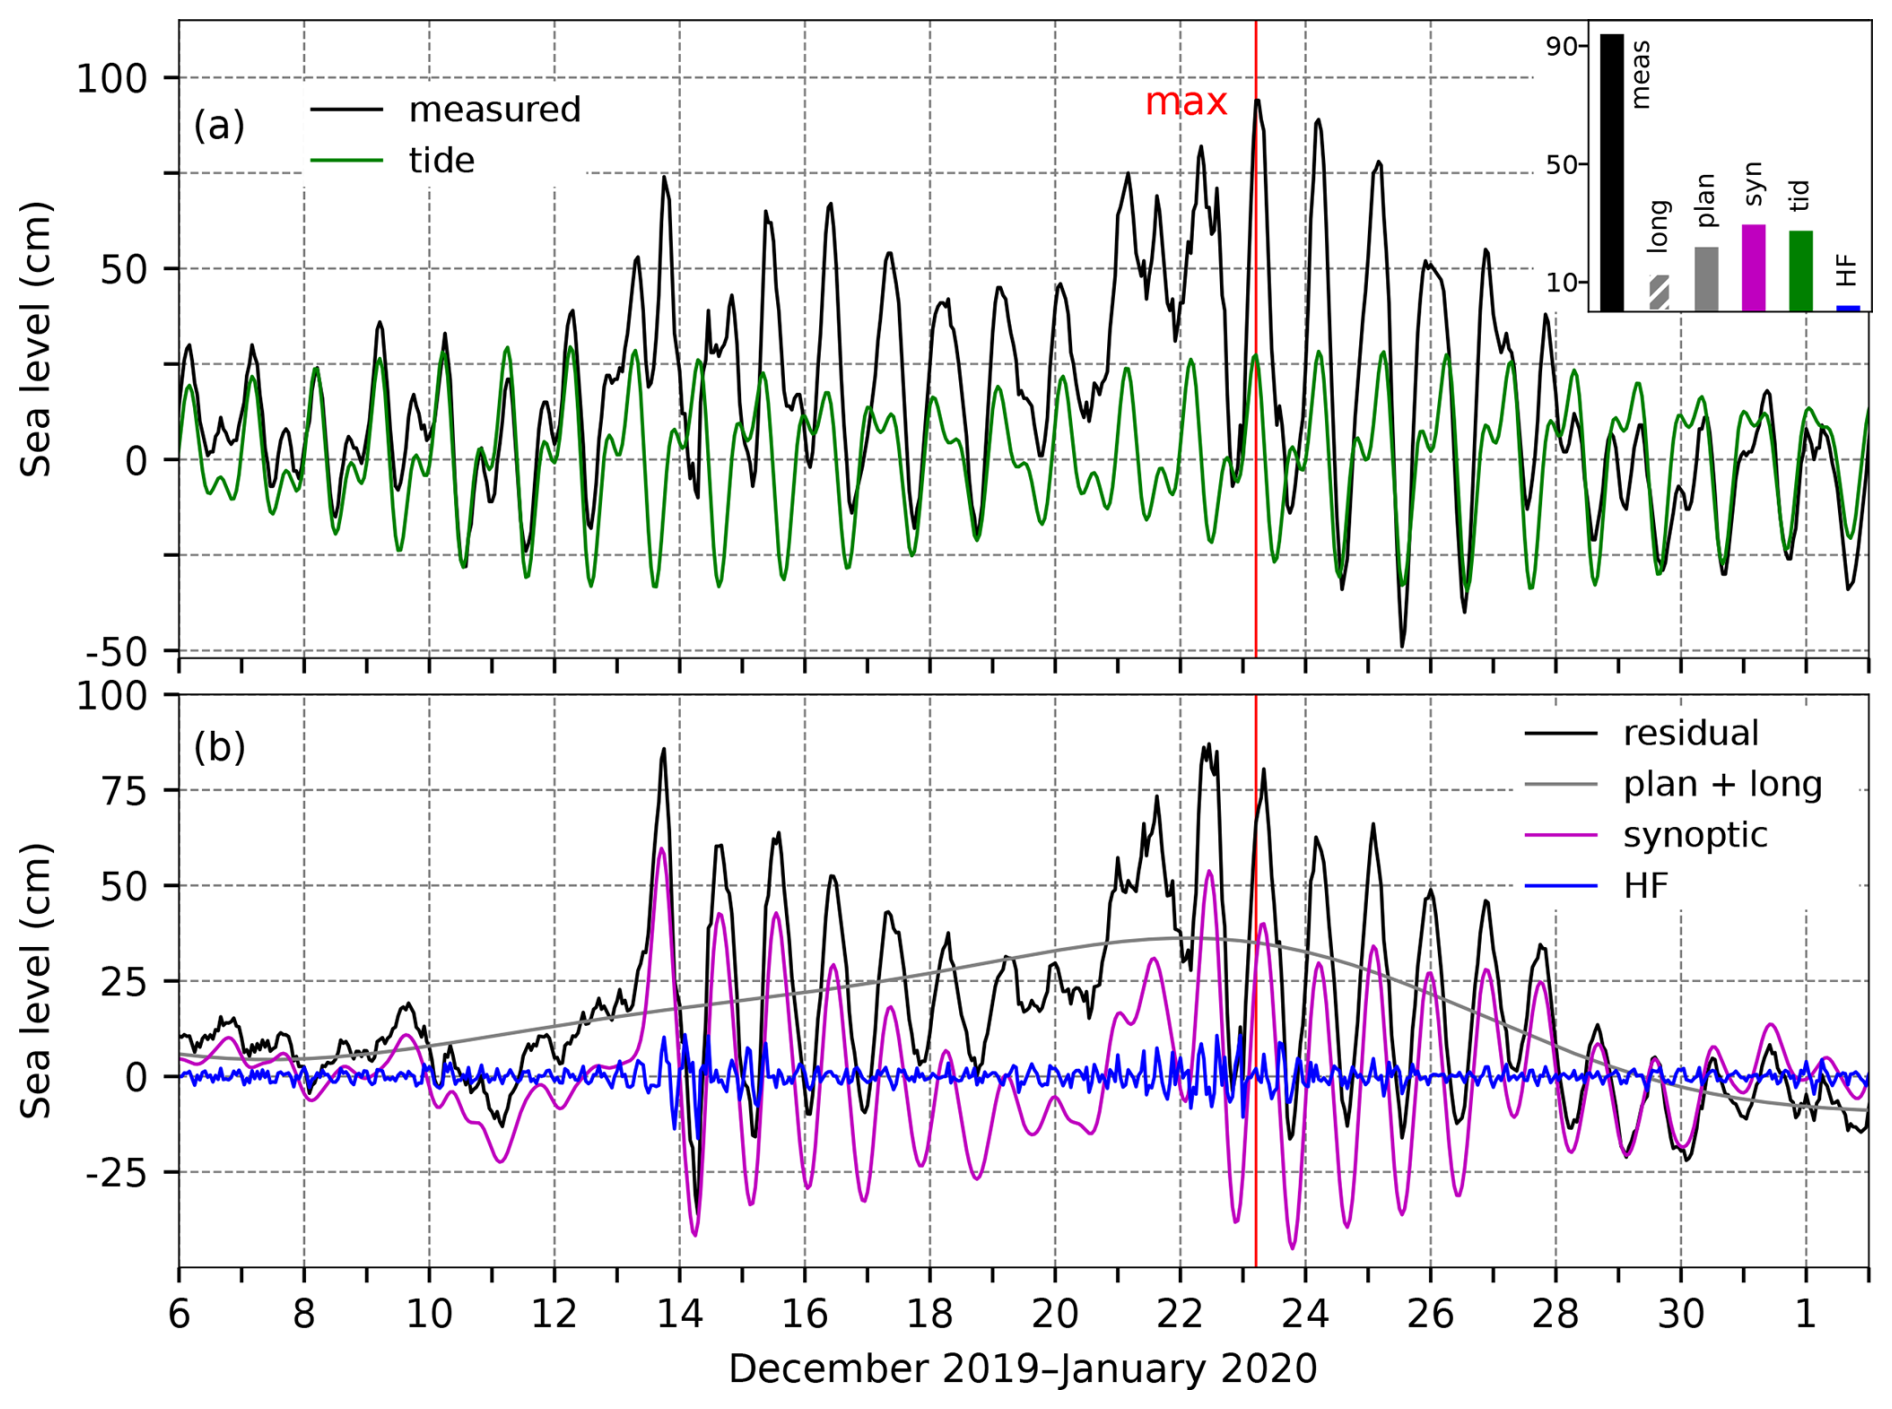
Figure 62SL series for the flood of 23 December 2019. Panel (a) shows the measured sea level (black) and tide (green). The inset figure shows the contributions (cm) of the five sea-level components to the maximum measured sea level (“meas”; 05:00 UTC): “HF” refers to high-frequency oscillations (2 h < T < 9 h), “syn” to synoptic component (9 h < T < 10 d), “tid” to tide, “plan” to planetary-scale variability (10 d < T < 100 d), and “long” to long-term sea-level variability (100 d < T). Panel (b) presents the residual sea level (black), the combined series of planetary-scale variability and long-term sea-level variability (grey; plan + long), synoptic component (purple), and high-frequency oscillations (blue). The red line indicates the time of occurrence of the total SL maximum.
4.20.2 Sea-level evolution
In the morning hours of 23 December 2019 (05:00 UTC), the sea level in Bakar rose to 94 cm above the long-term average (Table 2, Fig. 62).
The moon phase was between the last quarter and the new moon, which gave tide a semidiurnal spring-tide character. The overall maximum formed during the daily maximum of tide, which amounted to a high 27 cm.
High-frequency oscillations were not pronounced during this episode and contributed only 2 cm.
Figure 60a shows that a cyclone passed over the Adriatic on 13 December, 10 d before the flooding event, causing a high storm surge and subsequent basin-wide oscillations (Fig. 62b). An exceptional SL was not recorded on 13 December, as the induced storm surge overlapped with the negative tide (the residual SL was 86 cm high). The seiche weakened until 21 December when another cyclone approached the Adriatic and triggered another series of seiches, which were further intensified by the decisive cyclone on 22 December (Fig. 61). The next day (23 December), as the wind field over the basin weakened and became westerly and northwesterly (Fig. 60b), the positive phase of the generated seiche overlapped with tide, resulting in a high total SL (Fig. 62). At the time of the highest water level, synoptic component consisted mainly of free oscillations generated the previous day and amounted to 30 cm.
Planetary-scale component contributed 22 cm to the overall SL maximum. Preconditioning began about 2 weeks before the flood, characterised by a steady SL increase (Fig. 62b, plan + long), which continued up to the flood, even though the MSLP (lp) did not show a consistent decrease (Fig. 60a). The primary driver of the planetary-scale SL rise was the persistent, strong southerly wind (at periods of 10–100 d), reaching speeds of 6 m s−1 on 19 December and lasting for over a week before the flood (not shown).
Long-term sea-level variability (100 d < T) contributed 13 cm to this maximum (Figs. 73 and A1). The episode occurred after the annual SL peak, which was particularly pronounced that year. Intra-annual variability accounted for 6.5 cm (Fig. 73d). As with other recent episodes, the contribution from interannual variations was low (0.6 cm; Fig. 73c), while mean sea-level change had a much stronger impact, contributing 5.9 cm (Fig. 73b). It should also be noted that, as this episode occurred near the end of the analysed series, (multi)decadal variations may have been underestimated due to edge effects from filtering (as demonstrated in Fig. 73b).
To summarise, the flood formed almost 1 d after the decisive cyclone crossed the Adriatic (Figs. 60b and 61b), mainly as a result of fine-tuning between a pre-existing seiche and tide, superimposed on a raised background SL. High-frequency oscillations had the weakest effect (Fig. 62).
4.20.3 Flood impacts
A review of available daily newspapers (Slobodna Dalmacija, 25 December 2019) and online sources from 23 December 2019 (Hrvatska vatrogasna zajednica and Zadarski.hr, 2019) and 24 December 2019 (Civilna zaštita, Otvoreno.hr, 2019, and Šibenski) revealed the following effects of the flood. The high sea level, strong winds, and heavy rain led to traffic disruptions, fallen trees, and flooded roads along the entire coast. Numerous firefighter operations were carried out, involving removing trees, pumping out water, and recovering vehicles. The greatest damage was reported in the middle Adriatic, where (i) one person drowned; (ii) a destructive waterspout, resulting in damage to roofs, electricity pylons, vehicles, and trees, occurred; (iii) seafront promenades were damaged; and (iv) several low-lying historic town centres were flooded.
4.21 The flood of 8 December 2020 (ID 25; rank 12)
This episode has not yet been examined in the scientific literature.
4.21.1 Meteorological background
In the week prior to the occurrence of the extreme sea level in Bakar, several intense cyclones affected weather conditions over the Adriatic. According to the Z500 fields, the Adriatic was on the frontal part of a significant trough that stretched from Greenland across western Europe and the Mediterranean to Africa. These conditions supported a pronounced southwesterly flow in the upper levels, bringing moist and relatively warm air. The main event was preceded by several episodes of strong and intense sirocco winds (Fig. 63). On 6 December, an intense cyclone accompanied by a frontal system moved from the western Europe and the Gulf of Genoa towards the northern Adriatic, causing strong southerly winds that gradually weakened towards the end of the day (Fig. 63). The cyclone also brought heavy precipitation along the Croatian coastline. On 7 December, coastal stations from the southern to northern Adriatic recorded over 30 mm of precipitation, including 65 mm in Pula, 44 mm in Rijeka, 39 mm in Zadar, 43 mm in Šibenik, 38 mm in Split (Marjan), and 39 mm at Dubrovnik Airport.
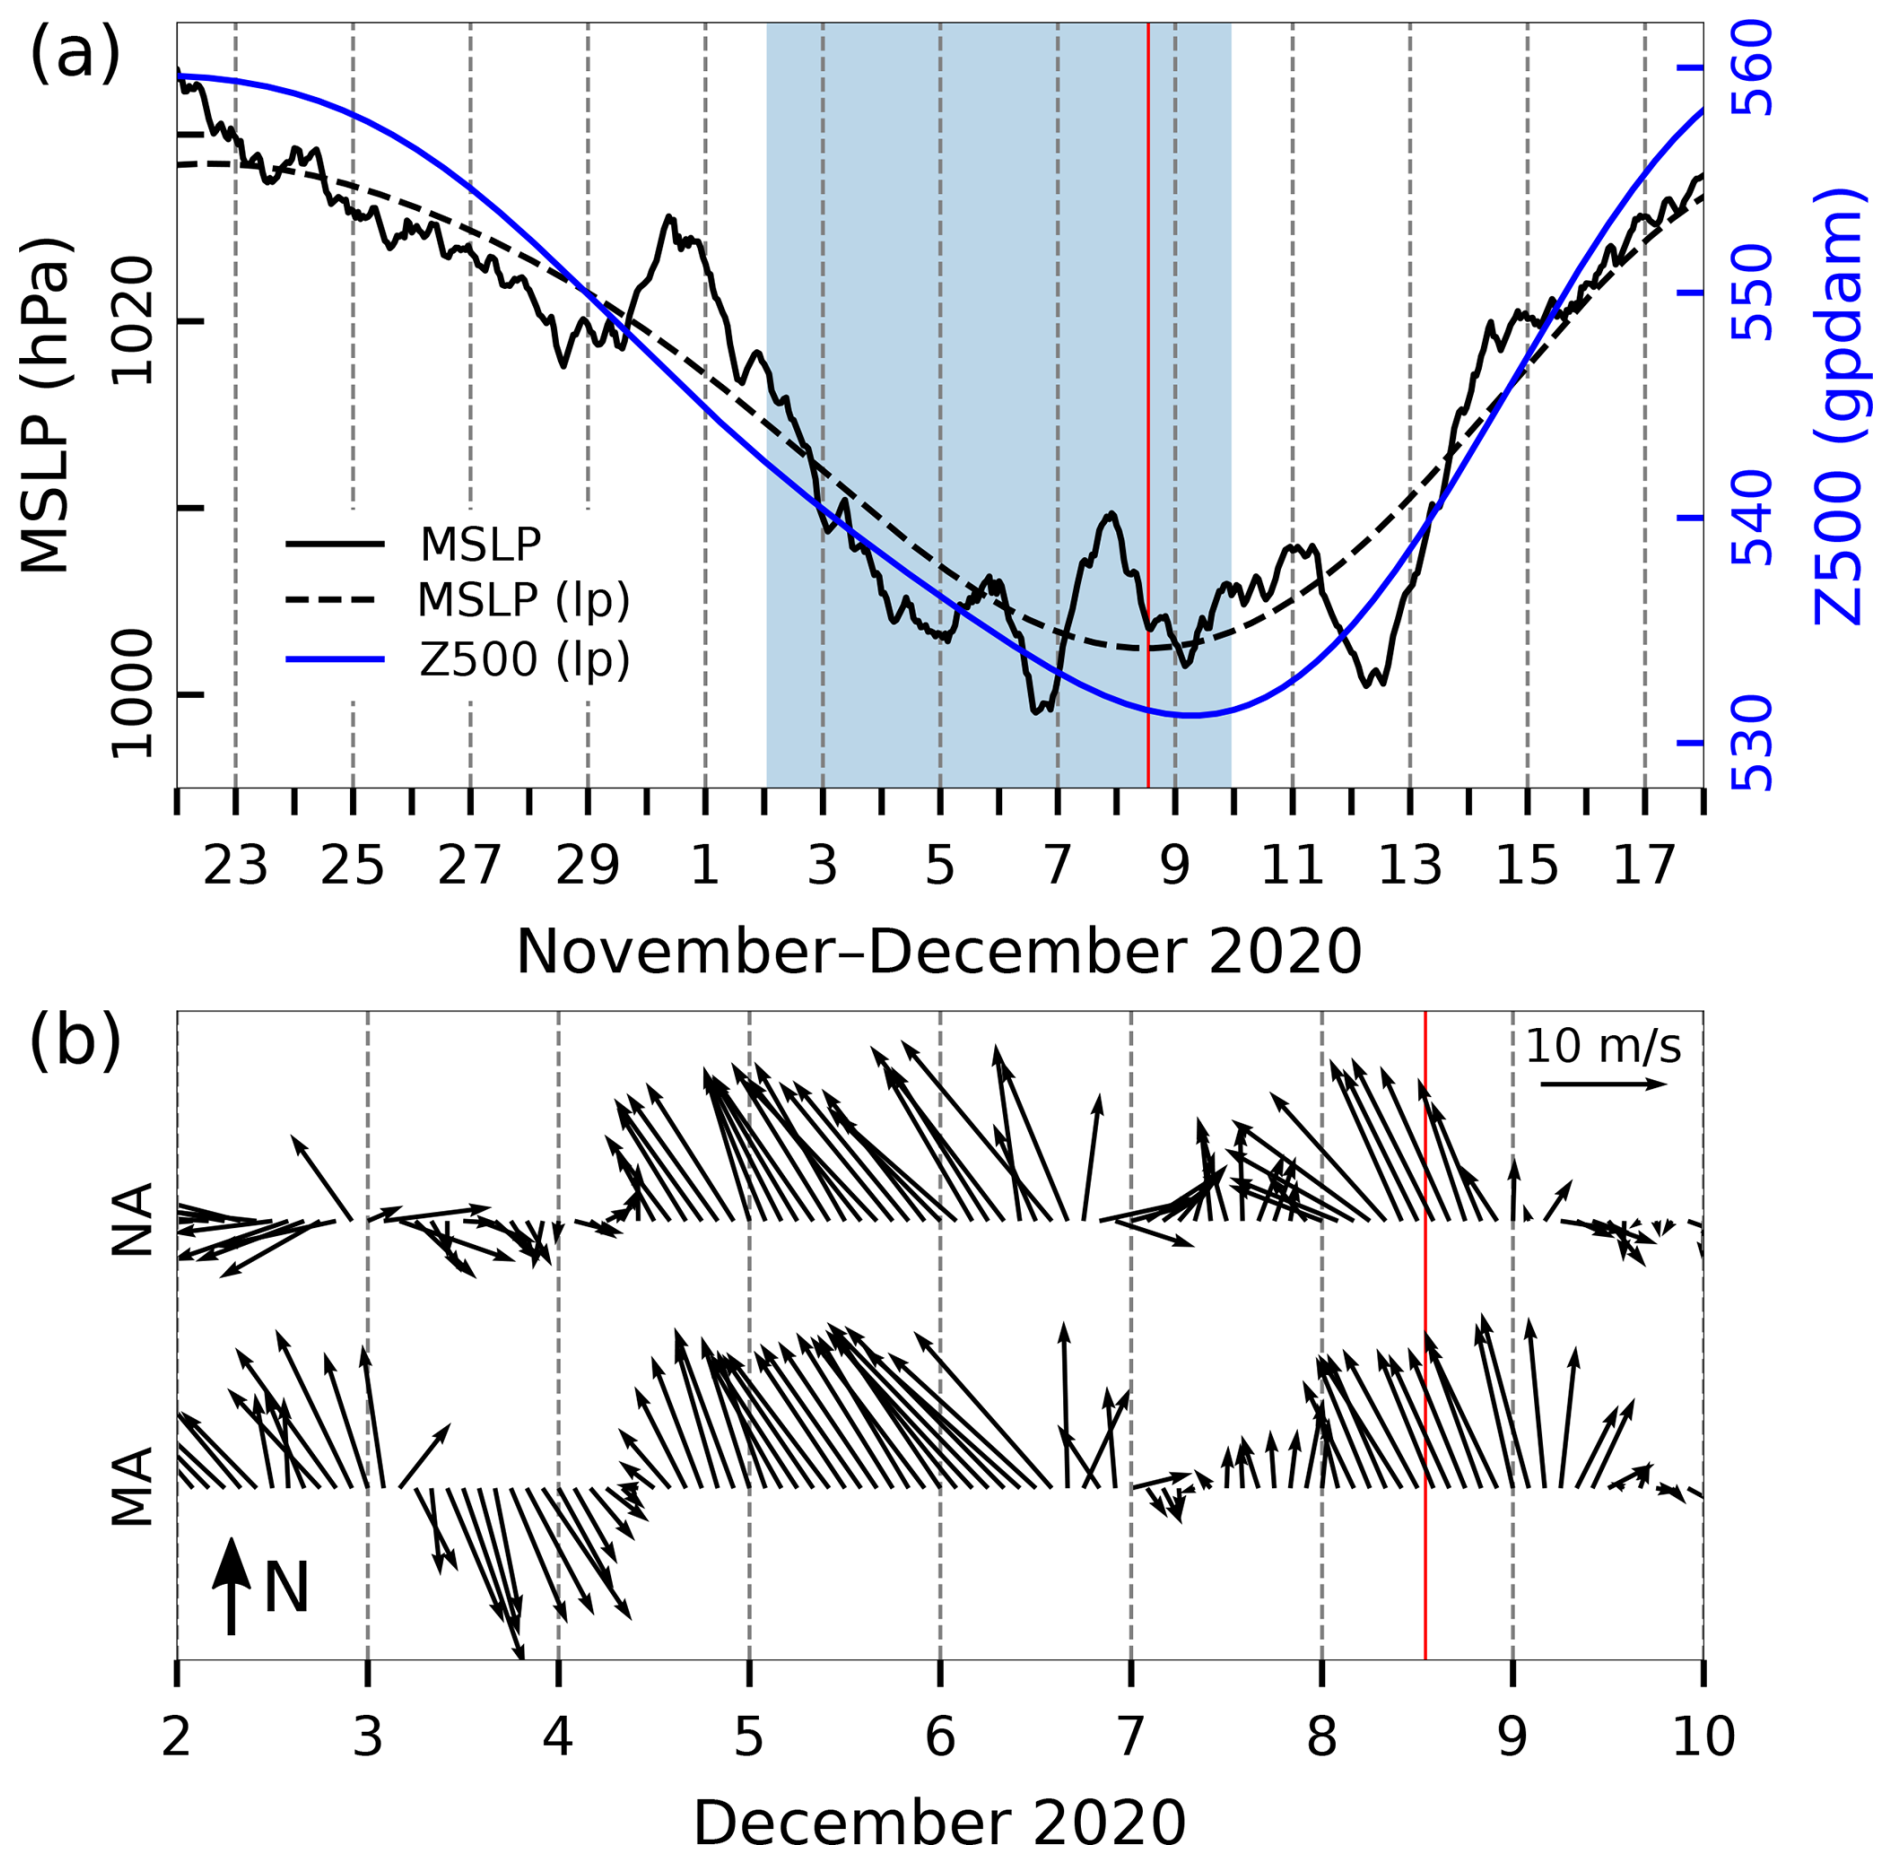
Figure 63Series of ERA5 reanalysis data related to the flood of 8 December 2020. (a) MSLP (hourly) and MSLP (lp) (low-pass filtered with a cut-off frequency of 10 d) and Z500 (lp) (low-pass filtered with a cut-off frequency of 10 d) at a grid point near TG Bakar. (b) Hourly W10 during the period marked in blue in the upper plot for the middle Adriatic (MA) and northern Adriatic (NA) (all locations marked in Fig. 1). Every second value is plotted. The red line indicates the onset of the SL maximum.
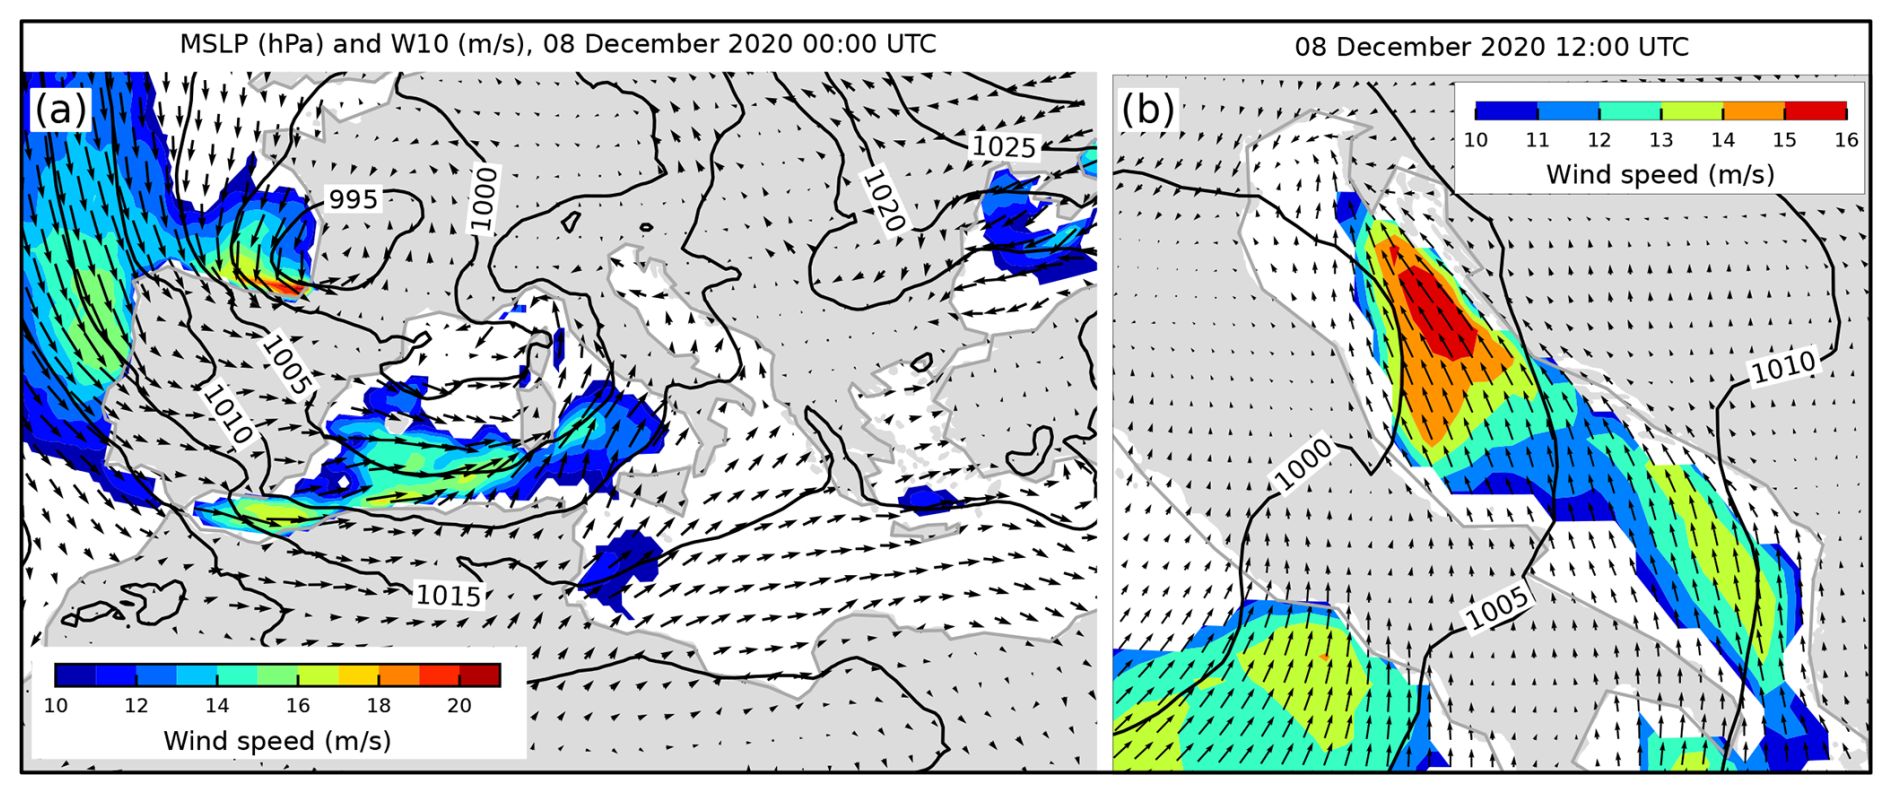
Figure 64MSLP (black lines) and W10 (arrows and colours) fields from the ERA5 reanalysis. Conditions (a) over the Mediterranean and western Europe that preceded the situation (b) over the Adriatic Sea (an hour before maximum SL in Bakar). Only wind speeds exceeding 10 m s−1 are coloured.
By 00:00 UTC on 8 December, while a cyclone over western Europe remained active, another low-pressure centre formed over the Gulf of Lion and moved towards the Gulf of Genoa (Fig. 64a). This development triggered southeasterly winds, initially affecting the northern Adriatic and later spreading throughout the entire basin (Fig. 63b). Generally, the southeasterly winds were more intense along the eastern than along the western Adriatic coast (Fig. 64b). The southeasterly winds reached their maximum on the northern and middle Adriatic before the occlusion front moved across the basin, while a moderate bora prevailed in the Bay of Trieste.
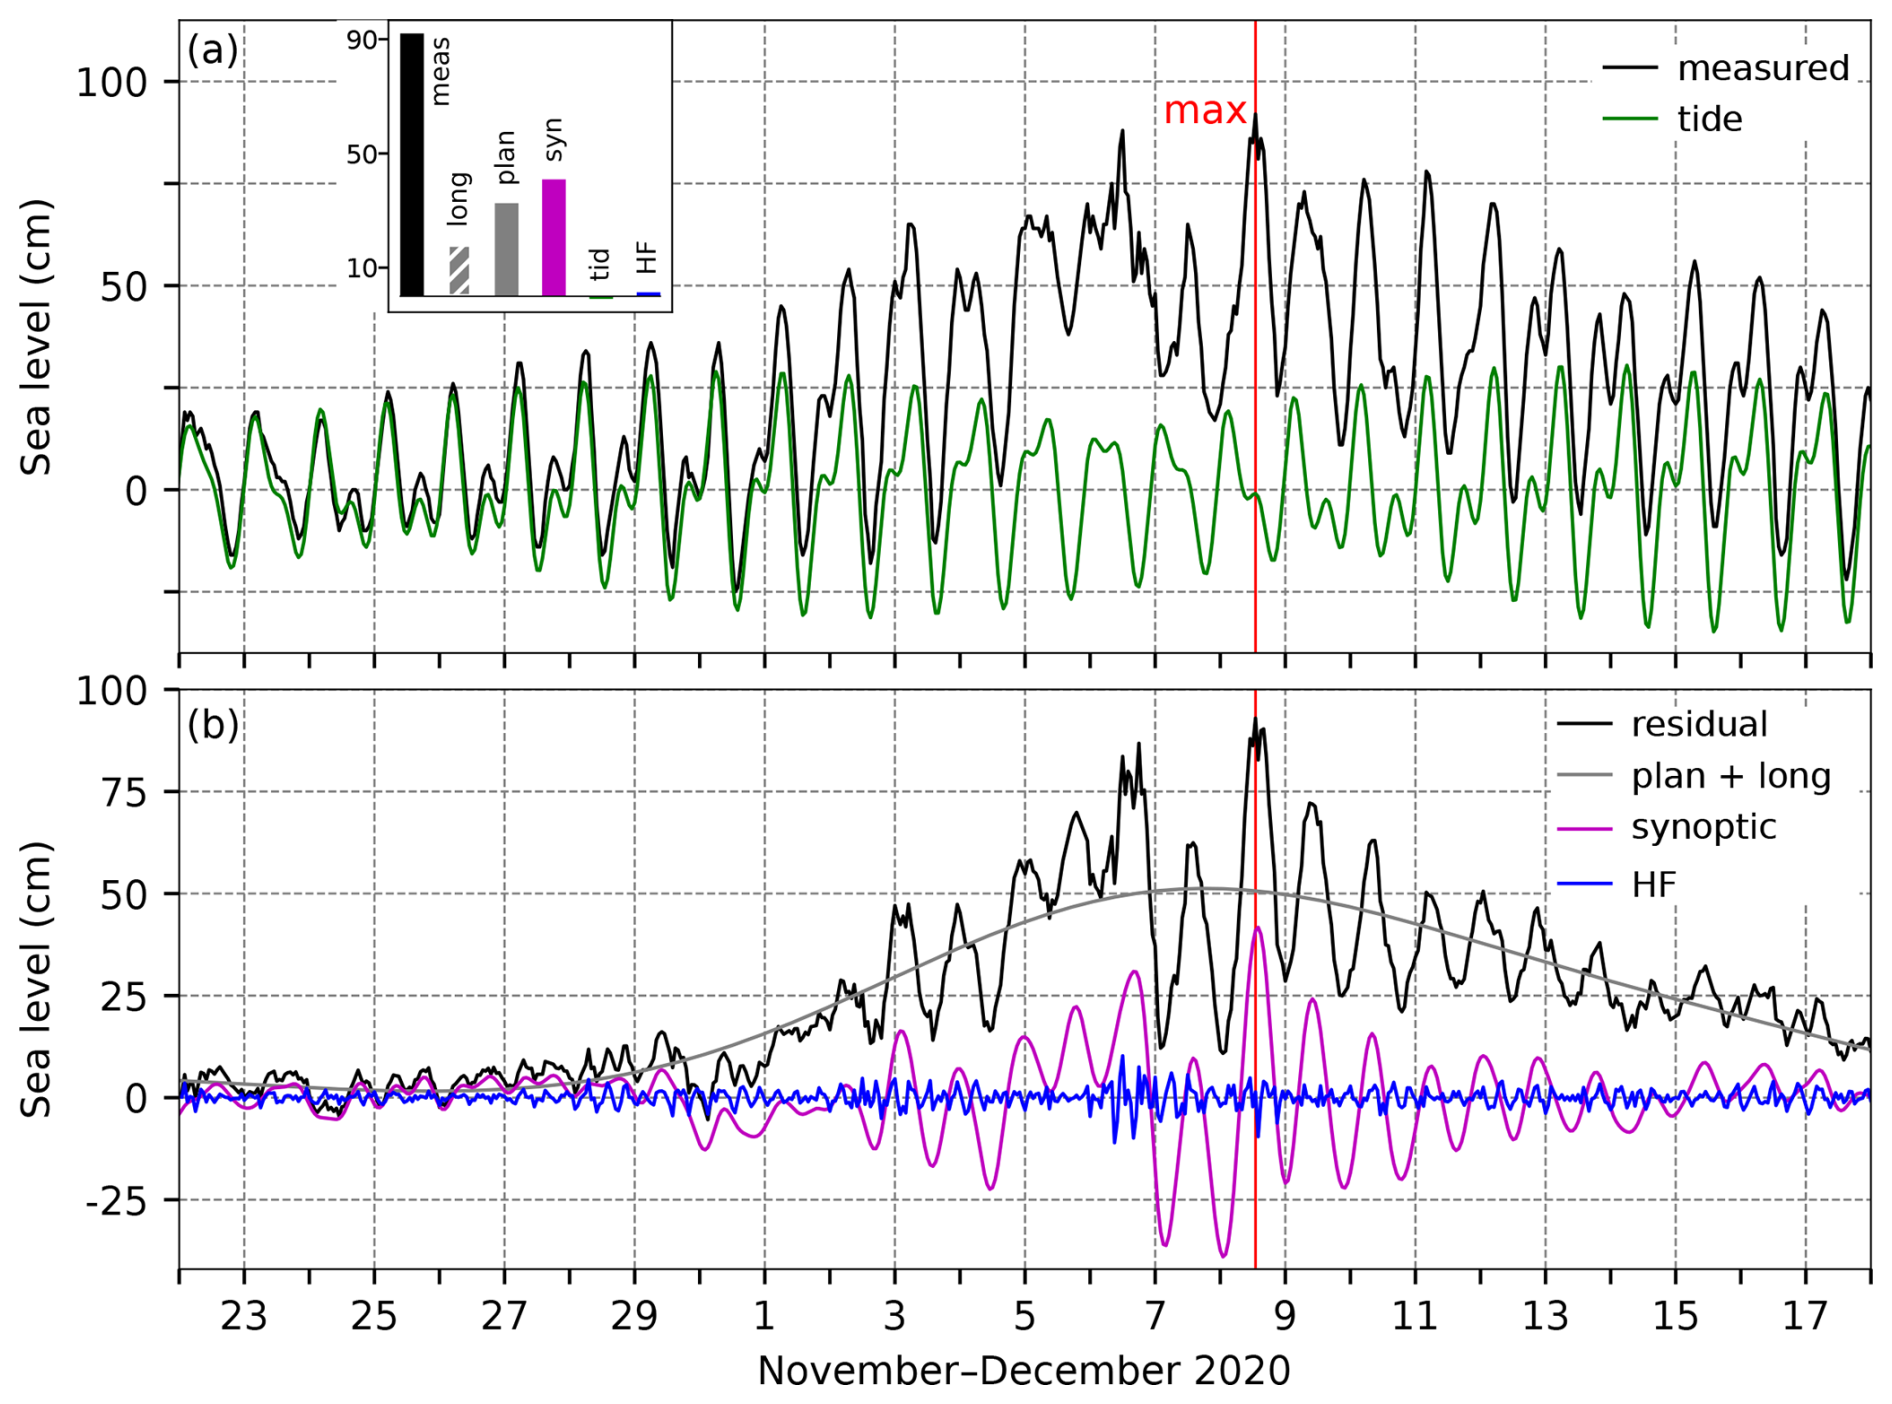
Figure 65SL series for the flood of 8 December 2020. Panel (a) shows the measured sea level (black) and tide (green). The inset figure shows the contributions (cm) of the five sea-level components to the maximum measured sea level (“meas”; 13:00 UTC): “HF” refers to high-frequency oscillations (2 h < T < 9 h), “syn” to synoptic component (9 h < T < 10 d), “tid” to tide, “plan” to planetary-scale variability (10 d < T < 100 d), and “long” to long-term sea-level variability (100 d < T). Panel (b) presents the residual sea level (black), the combined series of planetary-scale variability and long-term sea-level variability (grey; plan + long), synoptic component (purple), and high-frequency oscillations (blue). The red line indicates the time of occurrence of the total SL maximum.
4.21.2 Sea-level evolution
On 8 December 2020, at 13:00 UTC, the sea level in Bakar rose to 92 cm above the long-term average (Table 2, Fig. 65).
On this day, the moon was in the last quarter, meaning that tide had a diurnal neap-tide character. The overall maximum formed during the negative phase of tide; hence, tide provided a negative contribution of 1 cm to this event (Fig. 65).
High-frequency oscillations were also not pronounced – their contribution was negligible (1 cm).
The sequence of cyclones in the week before the main maximum led to the formation of a basin-wide seiche (T ∼ 21.2 h). Based on the residual and synoptic component (Fig. 65b), the first oscillations were triggered on 3 December and intensified on 6 December when the prolonged sirocco shifted to a northwesterly wind (Fig. 63b) causing the SL to rise to 88 cm. Thus, synoptic component consisted of a storm surge and pre-existing Adriatic seiche, and at the time of the main maximum, it amounted to 41 cm. The seiches amplified the flood because they were in a positive phase with the newly formed storm surge.
The preconditions began to develop around 29 November, marked by a rise in the SL (Fig. 65b, plan + long), induced by a decrease in atmospheric pressure (Fig. 63a, MSLP (lp)) and a persistent southeasterly wind at periods of 10–100 d. This wind blew from the southeast from 1 to 11 December, peaking at over 6 m s−1 on 6 December (not shown). The simultaneous variations in Z500 (lp), MSLP (lp) (Fig. 63a), and SL (plan + long) suggest that atmospheric Rossby waves were responsible for planetary-scale variability. The amplitude of planetary-scale component was substantial, comparable to synoptic component, reaching 33 cm at the time of the total maximum.
Long-term sea-level variability (100 d < T) contributed 18 cm to this episode (Figs. 73 and A1). The event occurred in winter, near the annual peak of intra-annual processes, which contributed 9.6 cm (Fig. 73d). Interannual variability added 3 cm (Fig. 73c), while mean sea-level change contributed 5.4 cm (Fig. 73b). As noted for the 2018 and 2019 floods, the estimation of longer-period processes for events near the end of the analysed time series may be affected by filtering edge effects.
To summarise, this episode resulted from the combined effects of large synoptic and planetary-scale components, superimposed on long-term sea-level component, with minimal or negative contributions from high-frequency oscillations and tide (Fig. 65).
4.21.3 Flood impacts
According to an online source (Jutarnji list, 8 December 2020), severe weather on 8 December 2020 impacted much of Croatia, particularly the Istria region (Fig. 1). Istramet (2020) reported strong sirocco winds with gusts of up to 36.4 m s−1, heavy rain, and widespread flooding. Along the east coast of Istria, the sea overflowed onto waterfronts, flooding areas in Rovinj and Pula. The high water levels caused road closures and significant traffic disruptions across Istria and Kvarner. Ferry services between Rijeka and the Kvarner islands, as well as Split and the central Dalmatian islands, were suspended. Dalmatian coastal towns, such as Zadar and Šibenik, experienced street and property flooding, along with damage to boats, cars, shores, and piers. Traffic along the coast was heavily disrupted, with some areas rendered impassable, forcing residents to wade through ankle-deep water.
4.22 The flood of 8 December 2021 (ID 26; rank 7)
This event has not yet been addressed in the scientific literature.
4.22.1 Meteorological background
A series of cyclones crossed the Adriatic from 26 November to 12 December (Fig. 66a). The cyclones were related to an upper-level trough that persisted over the area. During 6 and 7 December, a deep cyclone, Barra, formed over the Atlantic, in the centre of which the air pressure dropped to 960 hPa on 7 December (Barra – Copernicus, 2024).
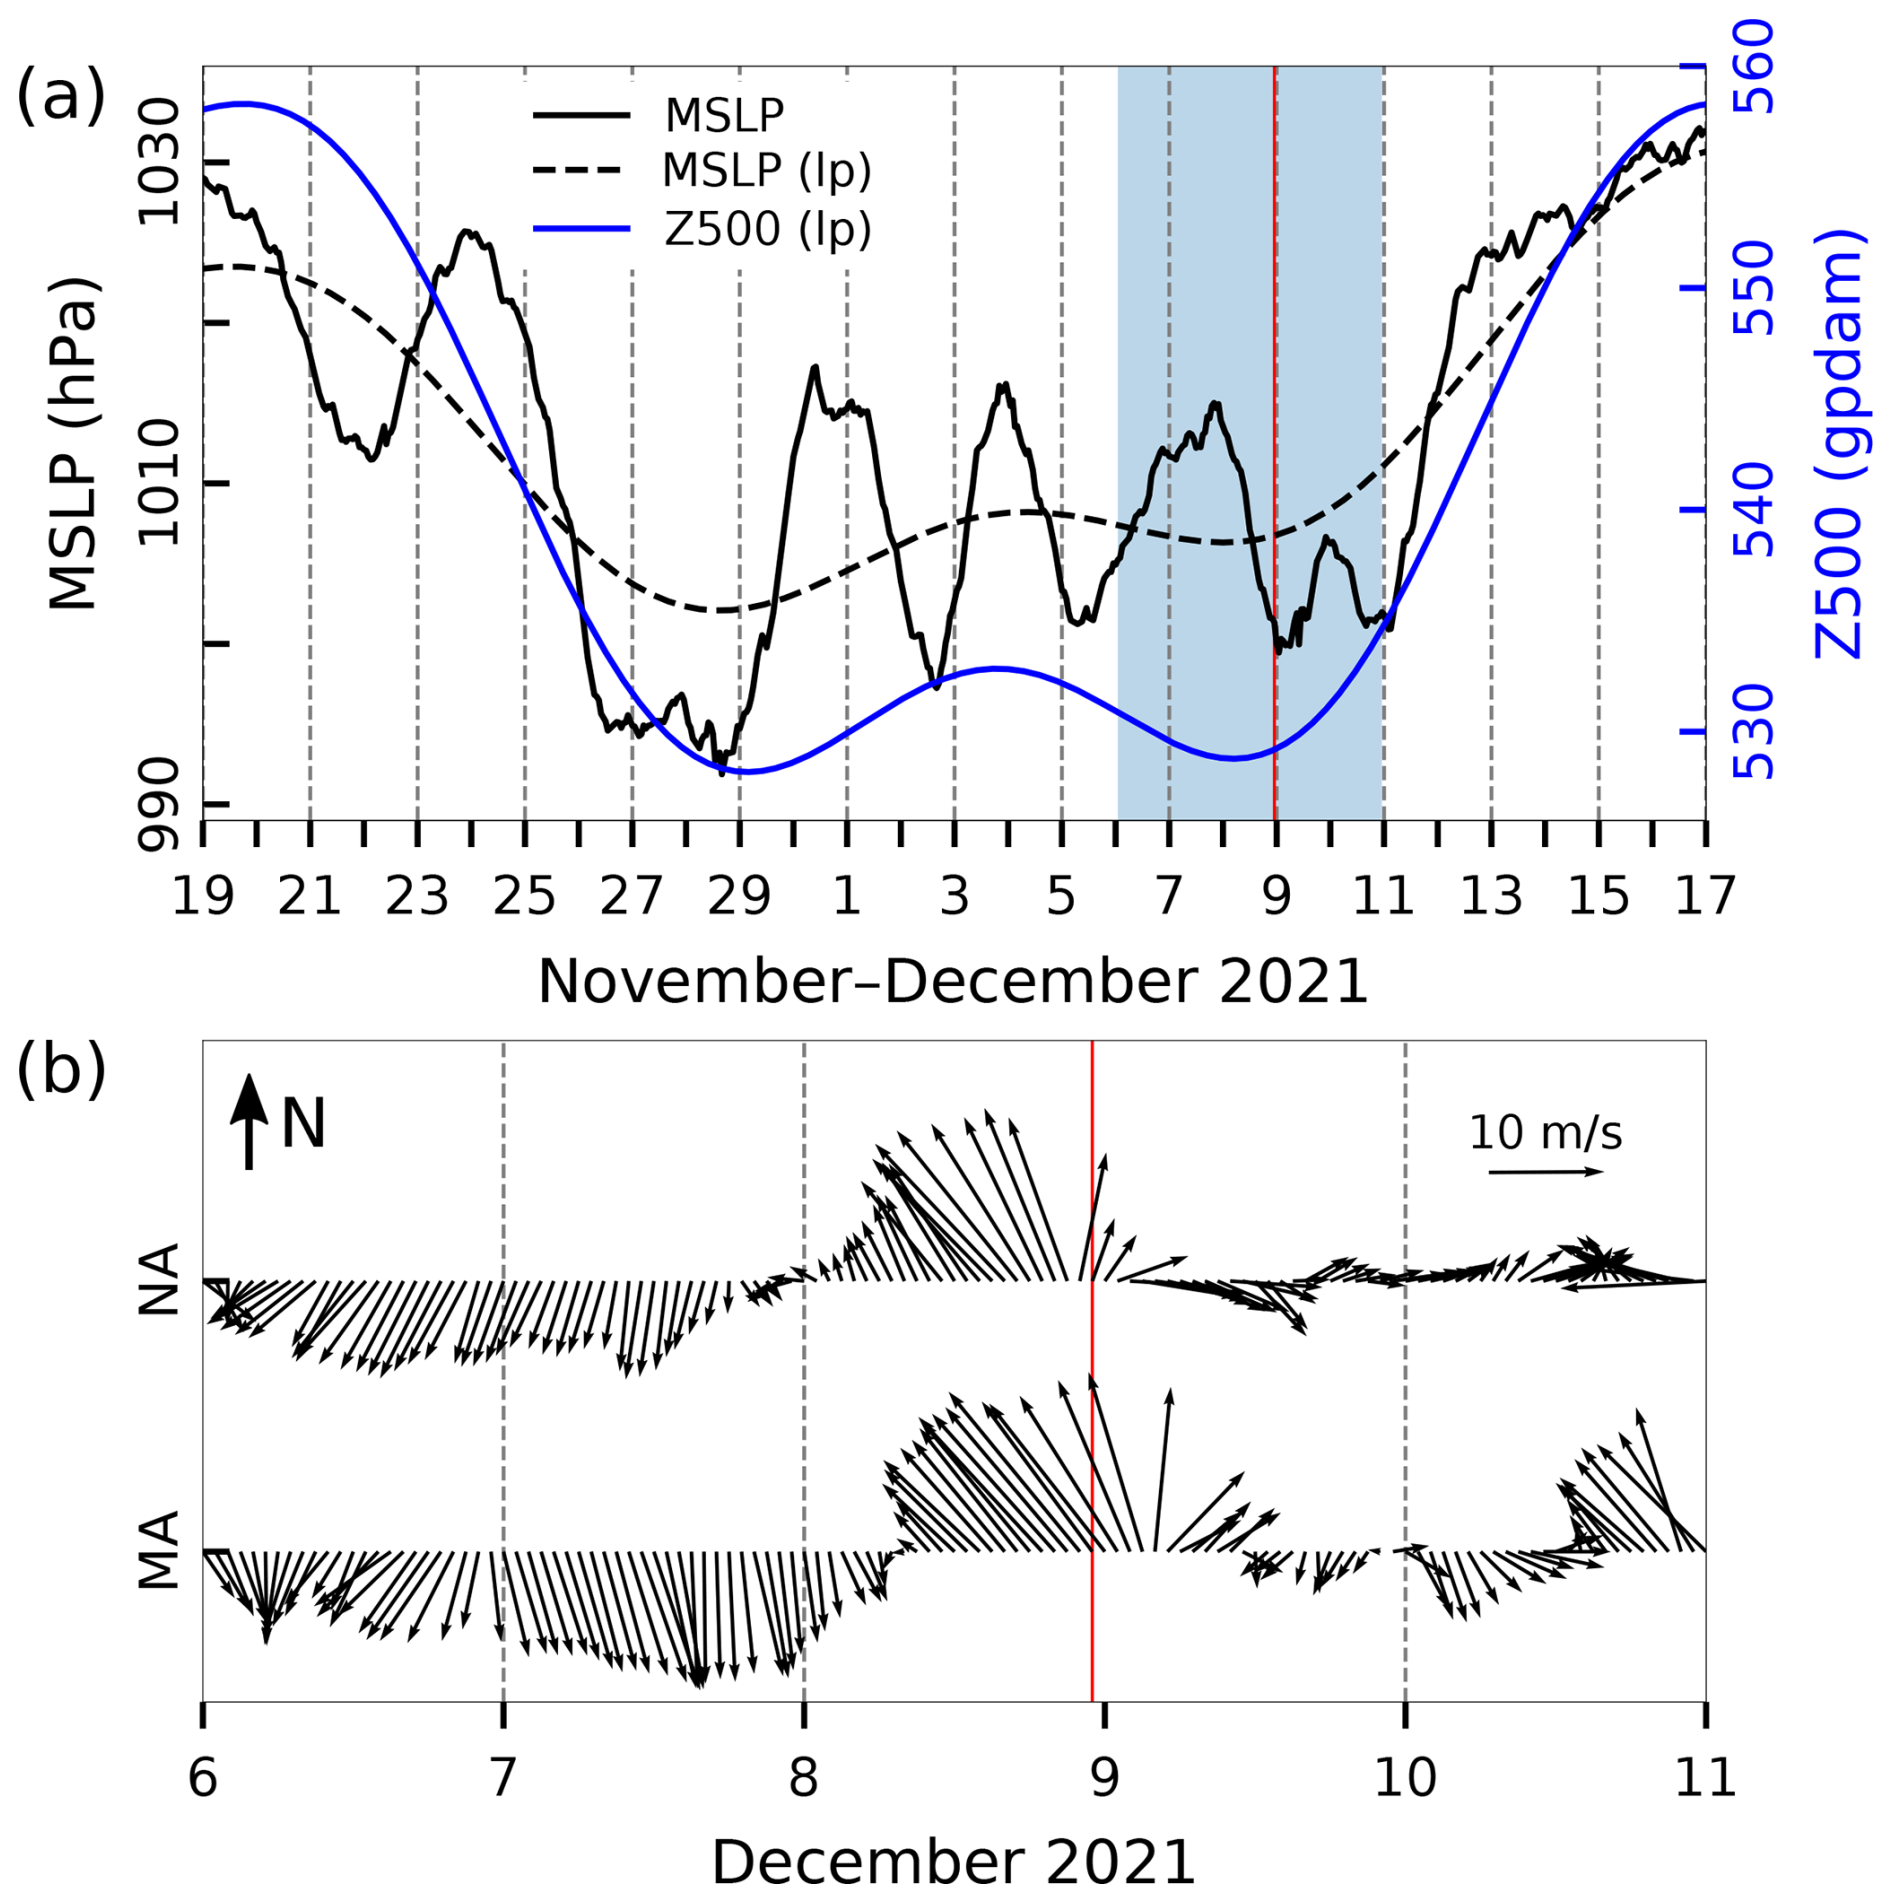
Figure 66Series of ERA5 reanalysis data related to the flood of 8 December 2021. (a) MSLP (hourly) and MSLP (lp) (low-pass filtered with a cut-off frequency of 10 d) and Z500 (lp) (low-pass filtered with a cut-off frequency of 10 d) at a grid point near TG Bakar. (b) Hourly W10 during the period marked in blue in the upper plot for the middle Adriatic (MA) and northern Adriatic (NA) (all locations marked in Fig. 1). The red line indicates the onset of the SL maximum.
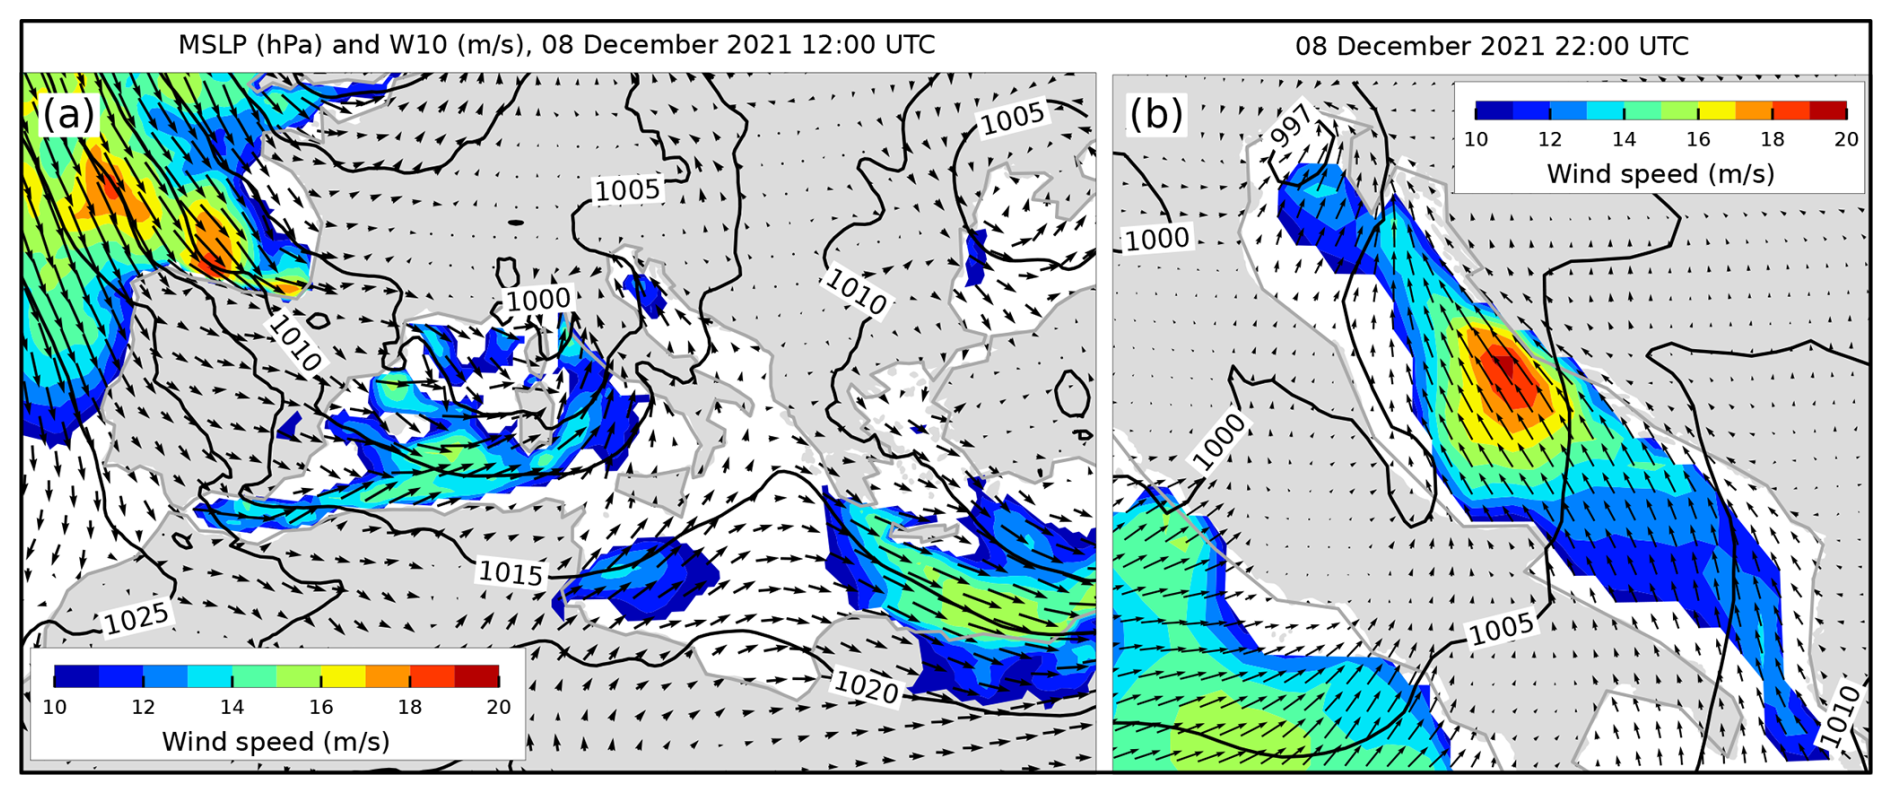
Figure 67MSLP (black lines) and W10 (arrows and colours) fields from the ERA5 reanalysis. Conditions (a) over the Mediterranean depicting a cyclone over the Gulf of Genoa that preceded the situation (b) over the Adriatic Sea (an hour before maximum SL in Bakar). Only wind speeds exceeding 10 m s−1 are coloured.
The frontal system associated with this cyclone approached the European mainland on 7 December and then moved further east. As a result of the movement of this system, leeward cyclogenesis occurred in the Gulf of Lion during the night of 7 December. Over the course of the next day (8 December), the newly formed cyclone first moved into the Gulf of Genoa (Fig. 67a), intensified there, and then moved on towards the Adriatic Sea on the evening of 8 December (Fig. 67b). Under these synoptic conditions – simultaneous presence of the centre of the cyclone over the Adriatic and the centre of another deep cyclone over the North Sea (Barra) – strong to gale southeasterly winds developed over most of the Adriatic (Figs. 66b and 67b), accompanied by precipitation exceeding 30 mm along the Croatian coastline, with measurements on 8 December of 52 mm in Rijeka, 59 mm in Bakar, and 53 mm in Makarska (near Split).
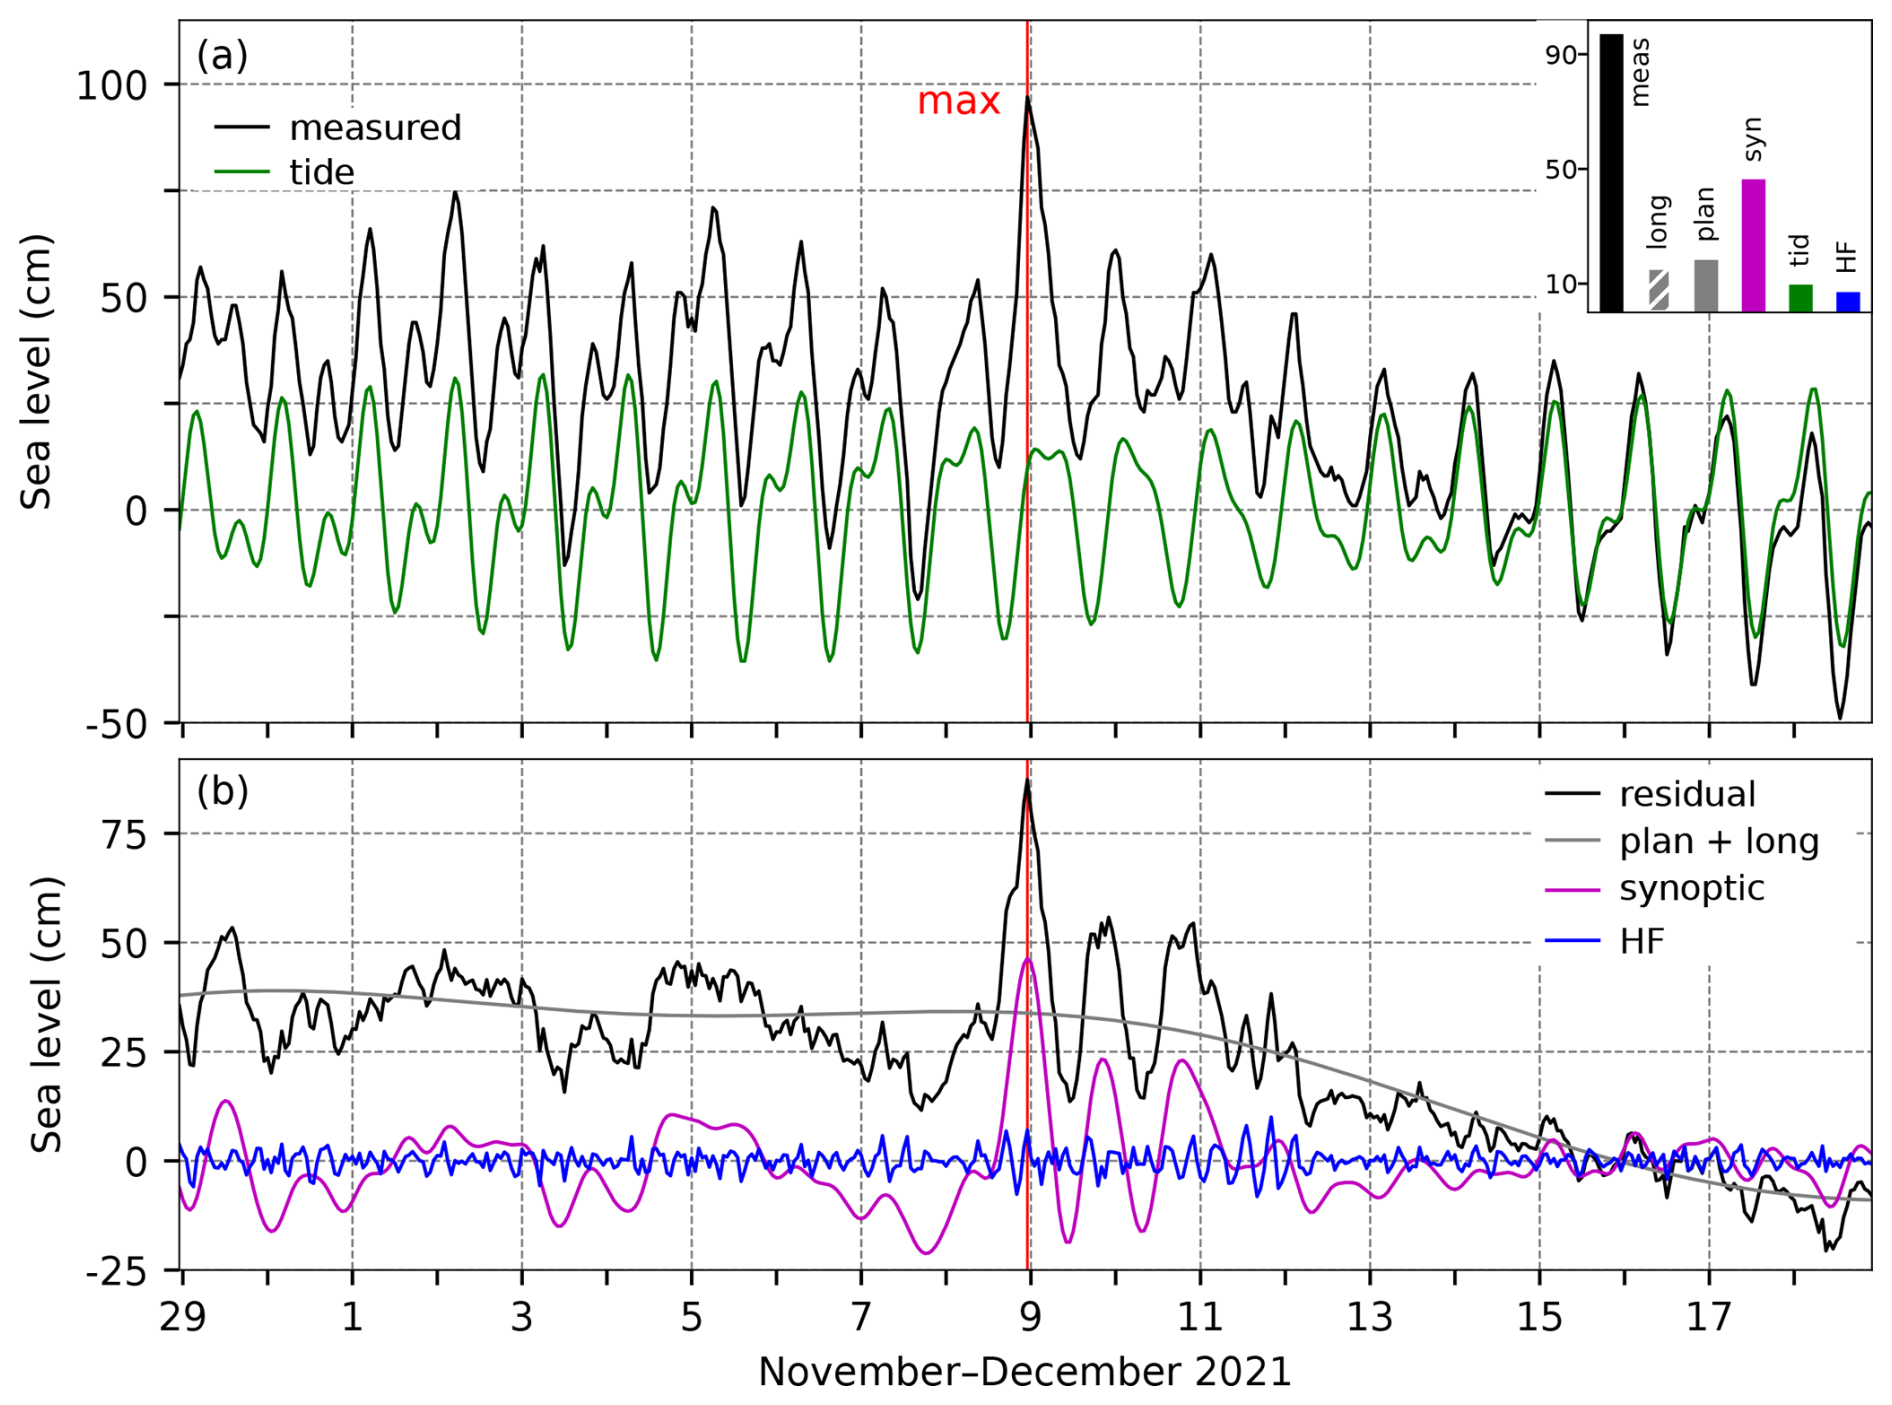
Figure 68SL series for the flood of 8 December 2021. Panel (a) shows the measured sea level (black) and tide (green). The inset figure shows the contributions (cm) of the five sea-level components to the maximum measured sea level (“meas”; 23:00 UTC): “HF” refers to high-frequency oscillations (2 h < T < 9 h), “syn” to synoptic component (9 h < T < 10 d), “tid” to tide, “plan” to planetary-scale variability (10 d < T < 100 d), and “long” to long-term sea-level variability (100 d < T). Panel (b) presents the residual sea level (black), the combined series of planetary-scale variability and long-term sea-level variability (grey; plan + long), synoptic component (purple), and high-frequency oscillations (blue). The red line indicates the time of occurrence of the total SL maximum.
4.22.2 Sea-level evolution
By 23:00 UTC on 8 December 2021, the sea level in Bakar had risen to 97 cm above the long-term average (Table 2, Fig. 68).
The total SL reached its maximum near the daily peak of tide. The lunar phase was close to the first quarter; hence, tide had a diurnal neap-tide character and contributed 10 cm to the maximum.
Figure 68b shows that a small-amplitude Kvarner Bay seiche (T ∼ 6 h) was generated on 8 December and that the overall maximum formed at its peak (high-frequency oscillations contributed 7 cm).
Synoptic component was induced by the MSLP distribution and winds related to a rapidly developing Mediterranean cyclone and the Barra system centred over the Atlantic (Fig. 67). Although several atmospheric disturbances moved across the basin in the days before the flood (Fig. 66a), they did not trigger basin-wide oscillations (T ∼ 21.2 h) due to the weak pressure gradients and slight wind changes over the basin, so there were no active basin-wide seiches before this maximum (Fig. 68b). Therefore, synoptic component consisted only of the storm surge, which amounted to 46 cm at its peak. The storm surge began to build slowly at the end of 7 December, but the largest build-up occurred during a short interval (∼ 12 h) on 8 December under the influence of the pressure gradient and sirocco wind.
The preconditions for the flood began 2 weeks earlier, when planetary-scale component started to rise as a result of a slow atmospheric-pressure drop and southwesterly wind. Figure 66a shows that the MSLP (lp) began to decrease around 20 November, at about the same time that the winds at these frequencies (10–100 d) turned towards the eastern Adriatic coast at a maximum speed of 5 m s−1 (not shown). As planetary-scale variability mirrored the changes in the MSLP (lp) and the MSLP (lp) varied concurrently with the Z500 (lp), we conclude that, on this occasion, the planetary-scale variations in sea level were driven by the passage of Rossby waves, which are visible as waveforms in the Z500 (lp) series (Fig. 66a). Planetary-scale component added 18 cm to this episode.
Long-term sea-level variability (100 d < T) contributed 16 cm to this flood (Figs. 73 and A1). The episode occurred in early December, coinciding with the annual peak in intra-annual variability, which accounted for 12.5 cm (Fig. 73d). During this period, interannual changes made a negative contribution of −1.7 cm (Fig. 73c), while mean sea-level change added 5.2 cm (Fig. 73b). It is worth noting that the 2021 episode occurred near the end of the analysed time series, which may have led to an underestimation of the mean sea-level change due to edge effects from filtering.
This flood resulted from the positive superposition of all processes involved, with synoptic component having the strongest effect (Fig. 68).
4.22.3 Flood impacts
On 8 December 2021, DHMZ issued an orange weather warning (METEOALARM, 2024) for the Adriatic coast due to severe sirocco winds ranging from 18 to 31 m s−1. Additionally, a significant amount of precipitation was registered during both that day and the following one. A review of the available daily newspapers (Novi list, 10 December 2021) and online sources (MorskiHR, Dalmacija Danas, Radio Dalmacija, and Hrvatska Danas, 2021) from 9 December 2021 revealed the following effects of the flood: (i) interruption of numerous ferry and catamaran lines, especially in the middle and southern Adriatic; (ii) flooding of buildings on the coast and boats being washed ashore in the northern Adriatic; and (iii) numerous fallen trees in the middle Adriatic.
4.23 The flood of 22 November 2022 (ID 27; rank 4)
To our knowledge, this flood has only been studied in a paper by Mel et al. (2023). They evaluated the effectiveness of the ISPRA (Istituto Superiore per la Protezione e la Ricerca Ambientale) sea state monitoring system by modelling a hypothetical scenario without the Mo.S.E. (Modulo Sperimentale Elettromeccanico) flood defence system and demonstrated that, without regulation, the sea level at Chioggia would have exceeded 200 cm above the reference datum – an unprecedented level in the monitoring history of the Venetian Lagoon.
4.23.1 Meteorological background
In the weeks leading up to the flood, two pronounced low-pressure systems moved over the Adriatic Sea: the first one on 4 November and the second on 18 November (Fig. 69a).
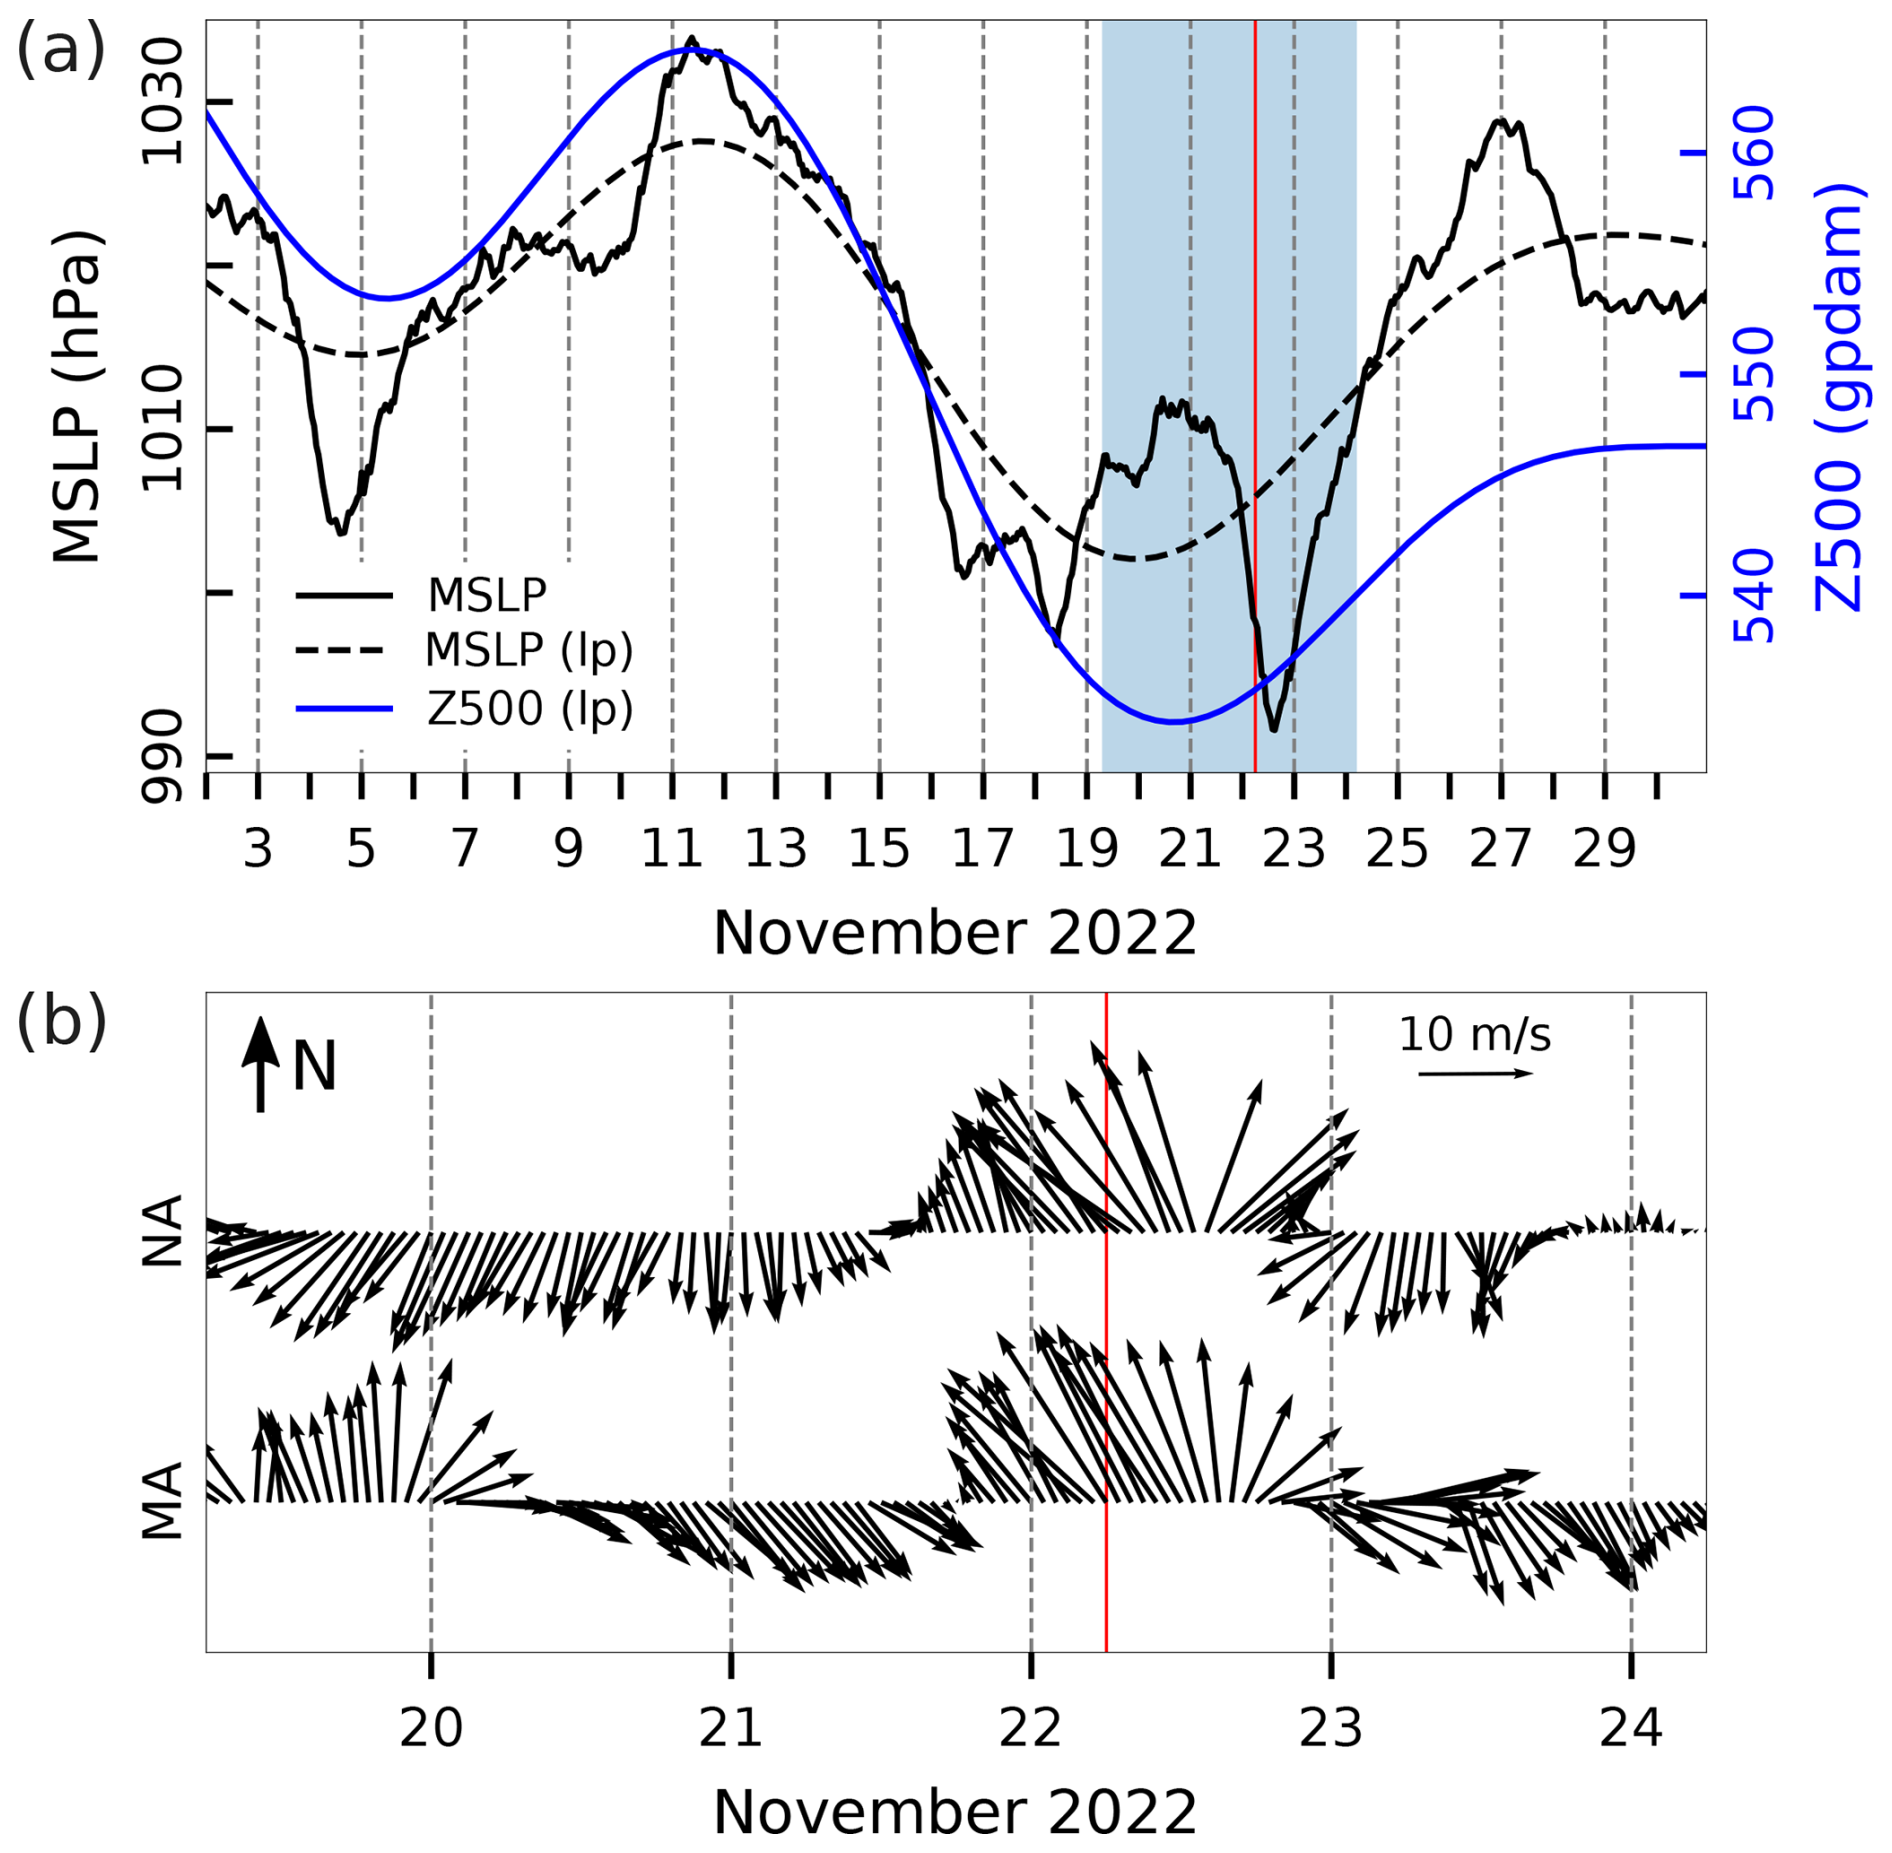
Figure 69Series of ERA5 reanalysis data related to the flood of 22 November 2022. (a) MSLP (hourly) and MSLP (lp) (low-pass filtered with a cut-off frequency of 10 d) and Z500 (lp) (low-pass filtered with a cut-off frequency of 10 d) at a grid point near TG Bakar. (b) Hourly W10 during the period marked in blue in the upper plot for the middle Adriatic (MA) and northern Adriatic (NA) (all locations marked in Fig. 1). The red line indicates the onset of the SL maximum.
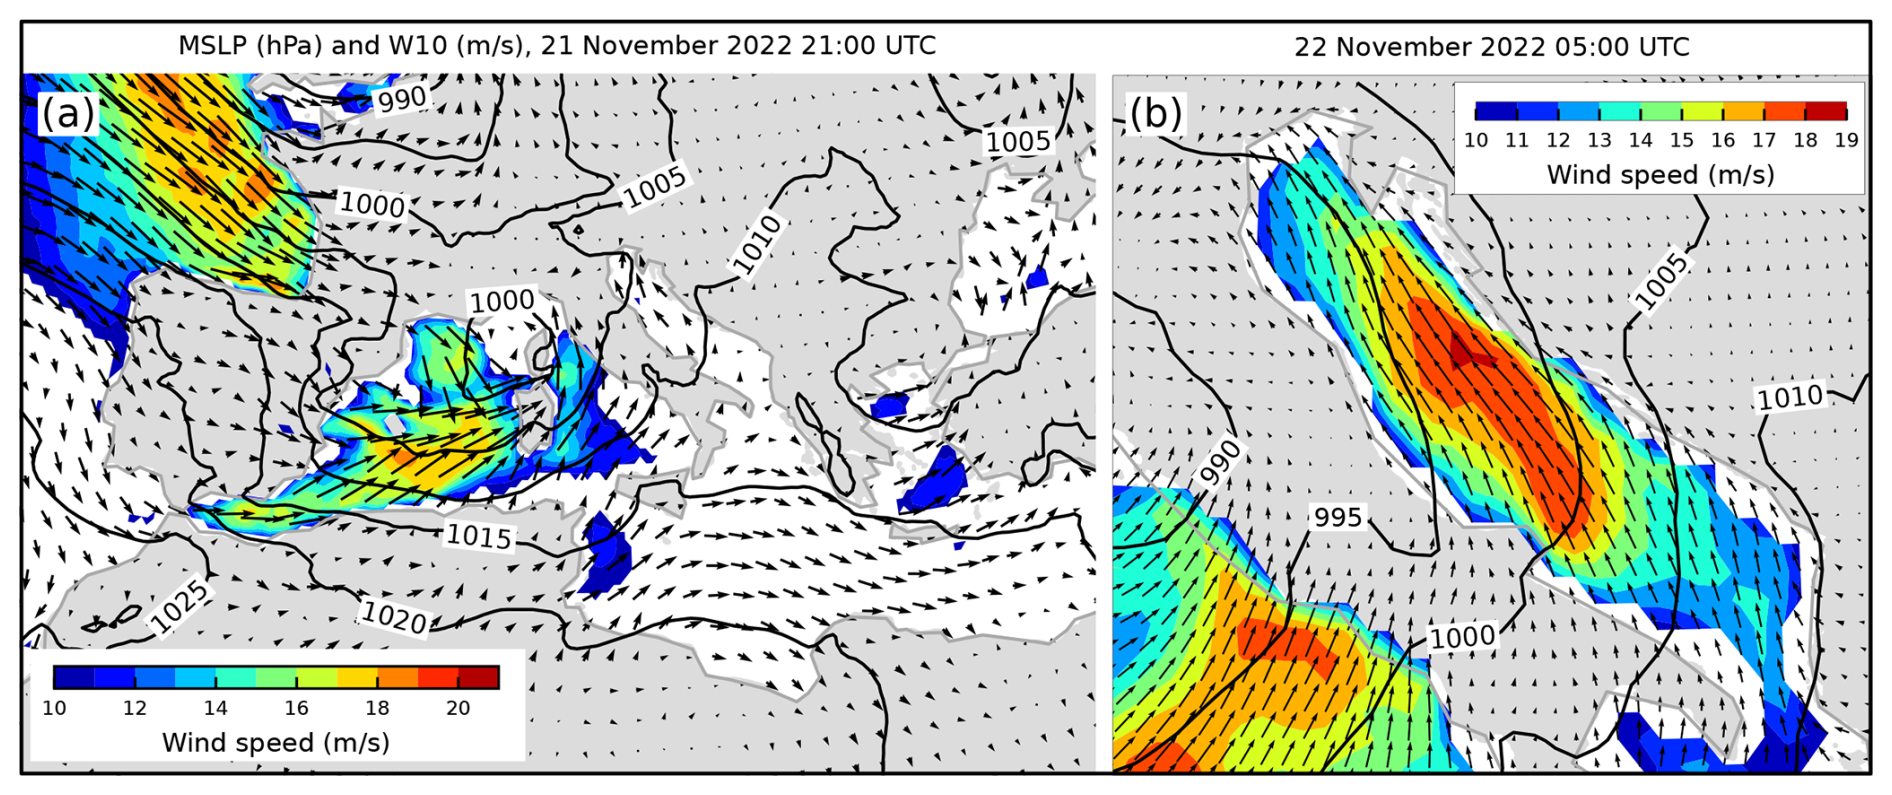
Figure 70MSLP (black lines) and W10 (arrows and colours) fields from the ERA5 reanalysis. Conditions (a) over the Mediterranean depicting a cyclone over the Ligurian Sea that preceded the situation (b) over the Adriatic Sea an hour before maximum SL in Bakar. Only wind speeds exceeding 10 m s−1 are coloured.
On the night of 21–22 November, a rapid cyclogenesis was underway in the Ligurian Sea (Fig. 70a). The cyclone, accompanied by its frontal system, moved slowly across the Apennine Peninsula towards the Adriatic Sea on 22 November, with the MSLP dropping to less than 990 hPa at its centre (Fig. 70b). As a result, a strong and gale southeasterly and southerly wind blew over the Adriatic for hours before the sea level peaked in Bakar (Figs. 69b and 70b), and when the cyclone left the area (during the night of 22–23 November), a gale northeasterly and easterly wind prevailed in the northern part (Fig. 69b). In addition, large amounts of precipitation were measured along the Croatian coast: often more than 30 mm at stations in the middle Adriatic, but the largest amounts were recorded in the northern Adriatic (e.g. the Cres station in the northern Adriatic recorded 132.5 mm on 23 November).
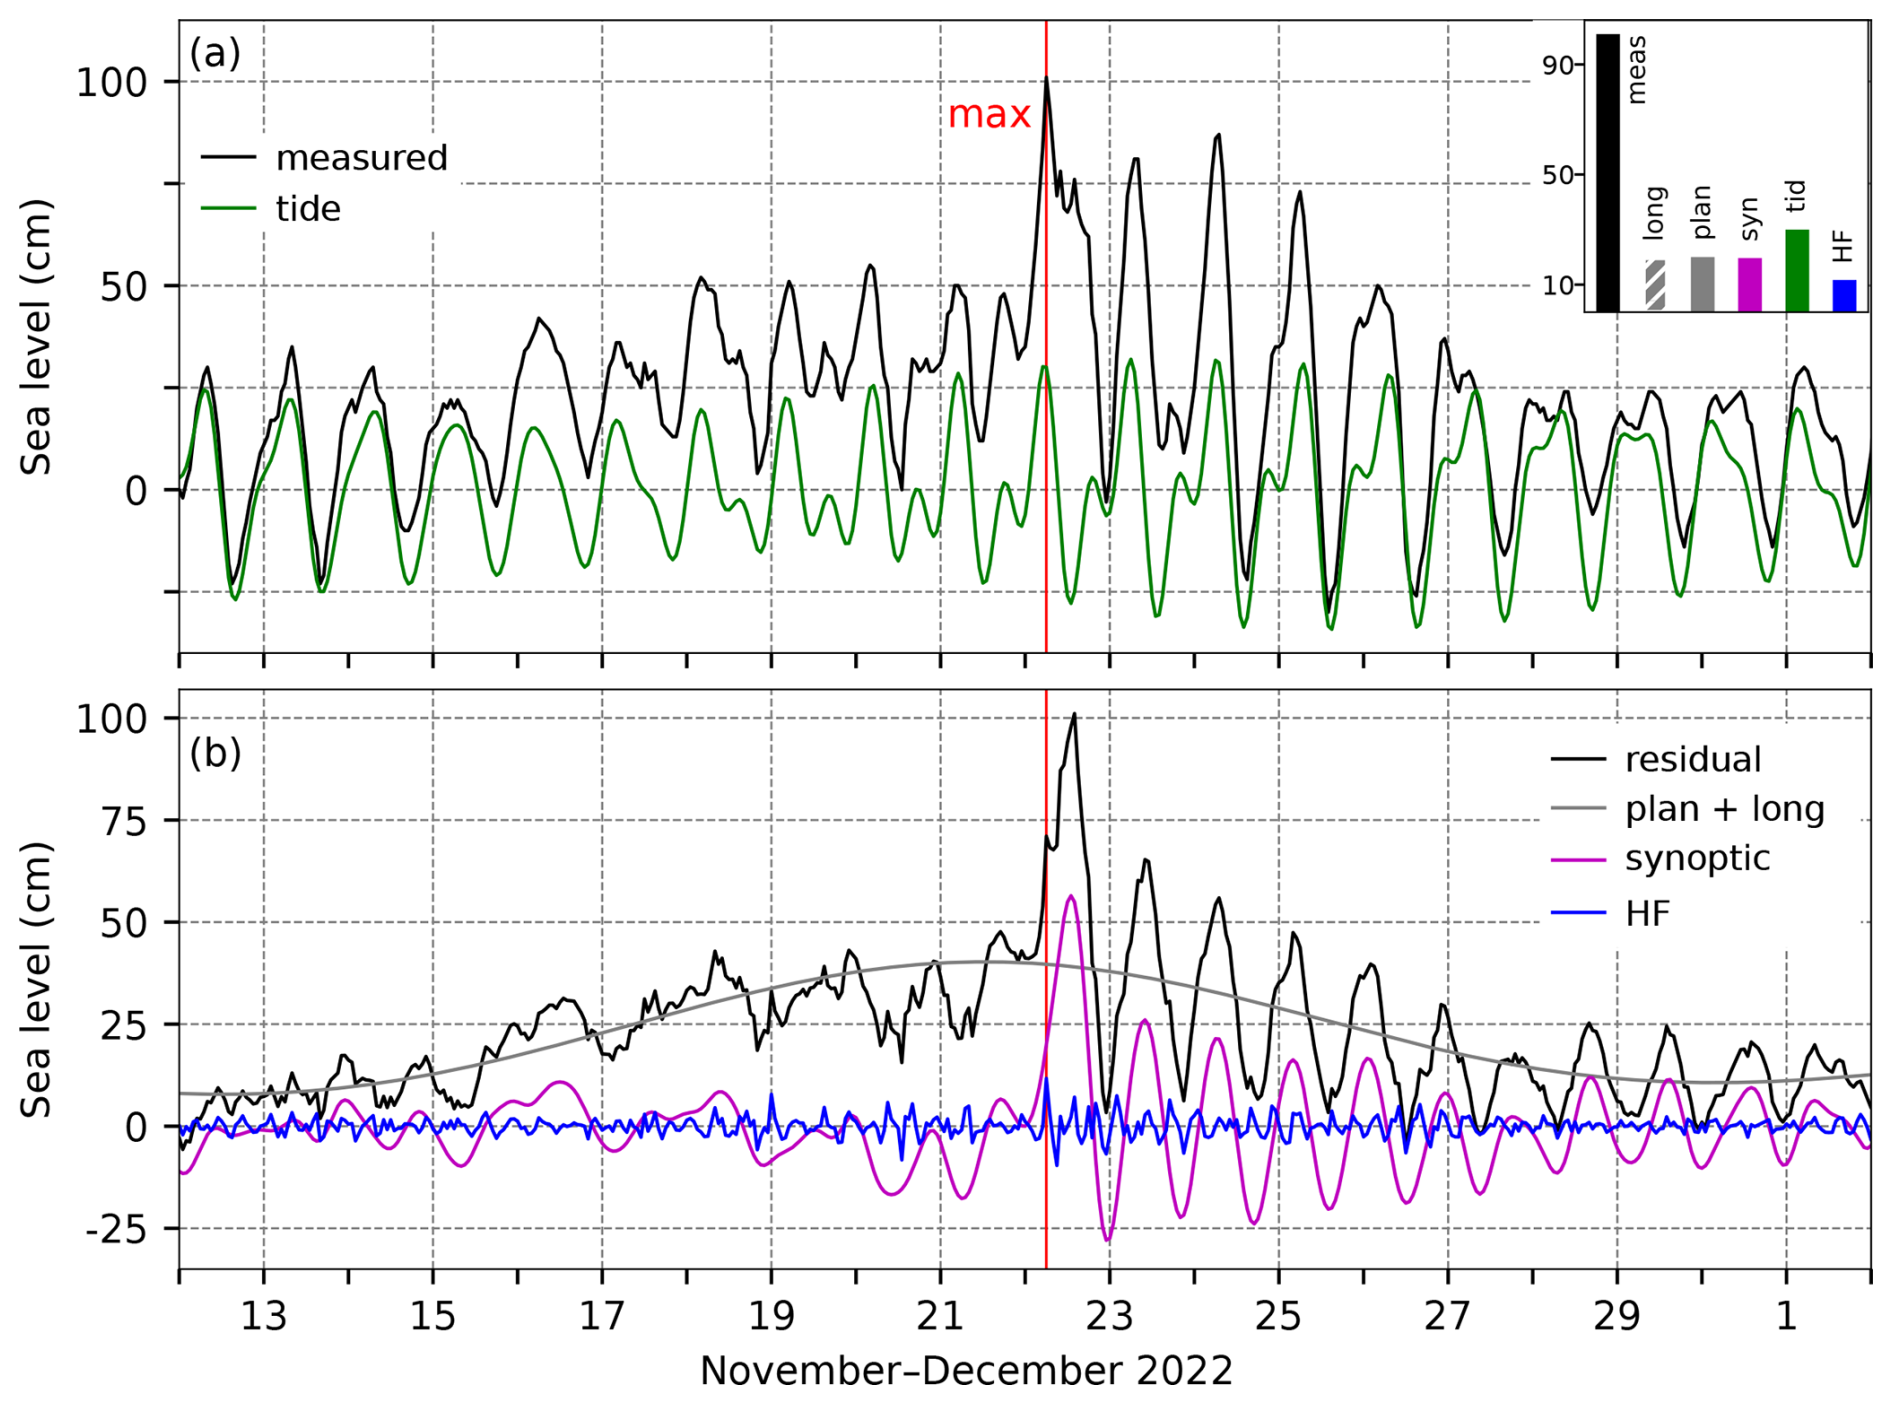
Figure 71SL series for the flood of 22 November 2022. Panel (a) shows the measured sea level (black) and tide (green). The inset figure shows the contributions (cm) of the five sea-level components to the maximum measured sea level (“meas”; 06:00 UTC): “HF” refers to high-frequency oscillations (2 h < T < 9 h), “syn” to synoptic component (9 h < T < 10 d), “tid” to tide, “plan” to planetary-scale variability (10 d < T < 100 d), and “long” to long-term sea-level variability (100 d < T). Panel (b) presents the residual sea level (black), the combined series of planetary-scale variability and long-term sea-level variability (grey; plan + long), synoptic component (purple), and high-frequency oscillations (blue). The red line indicates the time of occurrence of the total SL maximum.
4.23.2 Sea-level evolution
In the morning hours of 22 November 2022 (06:00 UTC), the SL in Bakar rose to 101 cm above the long-term average (Table 2, Fig. 71).
The total SL maximum occurred during the tidal peak (Fig. 71). At this time, the moon was in a phase between the last quarter and the new moon, resulting in a semidiurnal spring tide. Tide added substantial 30 cm to the flood.
Figure 71 shows that high-frequency oscillations during this episode were generally not pronounced, but the total SL maximum formed during their peak, which is why the contribution of high-frequency oscillations amounted to 12 cm.
Before the cyclone crossed the Adriatic on 22 November, another atmospheric disturbance passed over the basin on 18 November, but it was not as pronounced as the decisive one (Fig. 70a) and did not trigger strong basin-wide oscillations (Fig. 71b). Therefore, there were no pre-existing seiches (T ∼ 21.2 h) and synoptic component consisted mainly of the forced part, i.e. of storm surge. Although the induced storm surge reached a significant maximum of 56 cm, the total SL peak occurred before the storm-surge peak (Fig. 71b), when synoptic component was 20 cm. This was because the other components were strong before the storm surge peaked and, above all, because tide (which had a large amplitude) was in its negative phase at the time of synoptic component maximum.
Preconditioning began 10 d before the episode under the influence of a drop in MSLP (lp) that began on 12 November (Fig. 70a), when the SL started to rise (Fig. 71b, plan + long). Comparison of Z500 (lp), MSLP (lp), and plan + long shows that all three series varied coherently which, as Pasarić (2000), Pasarić et al. (2000), and Pasarić and Orlić (2001) showed, indicates that planetary-scale component was dominantly controlled by a passage of planetary Rossby waves. This component contributed 20 cm to the flood, the same as synoptic component.
Long-term sea-level variability (100 d < T) contributed 19 cm to this episode, comparable to the contributions from synoptic and planetary-scale components (Fig. 71a, histogram). This high contribution was primarily driven by intra-annual processes (13.3 cm), as the episode coincided with the annual maximum (Figs. 73 and A1), along with the influence of mean sea-level change (6.2 cm; Fig. 73b). Interannual variability was negligible during this period, contributing only 0.2 cm (Fig. 73c). However, as the 2022 episode is at the end of the analysed time series, the contribution from long-term sea-level variability (occurring at periods longer than 100 d) may not have been accurately calculated due to edge effects.
This flood was the result of a constructive superposition of all contributing processes. Tide had the greatest impact, while synoptic, planetary-scale, and long-term sea-level variations had similar effects, and high-frequency oscillations had the smallest influence (Fig. 71).
4.23.3 Flood impacts
On this day, DHMZ issued the highest red wind warnings (corresponding to very dangerous weather, likely with major damage and accidents; METEOALARM, 2024) for the entire coastal region of the Adriatic. Wind gusts of up to 29 and 35 m s−1 were registered in the middle and southern Adriatic, respectively. Online sources from 22 November 2022 (Novi list, Index.hr, Poslovni dnevnik, Jutarnji list, Portal Istra Terra Magica, Dubrovački vjesnik, and Šibenski portal Moć komunikacije) revealed the following impacts of the event. Along the entire eastern Adriatic (Croatian) coast, there was widespread flooding of basements and residential and commercial premises (including restaurants, cafés, shops, and farmer's markets); road closures; suspensions of ferry and catamaran lines; fallen trees; and rockslides. In the northern Adriatic, there were localised power outages, and for the middle Adriatic, journalists reported the collapse of dry-stone walls, overflowing rivers, and the flooding of a coastal town.
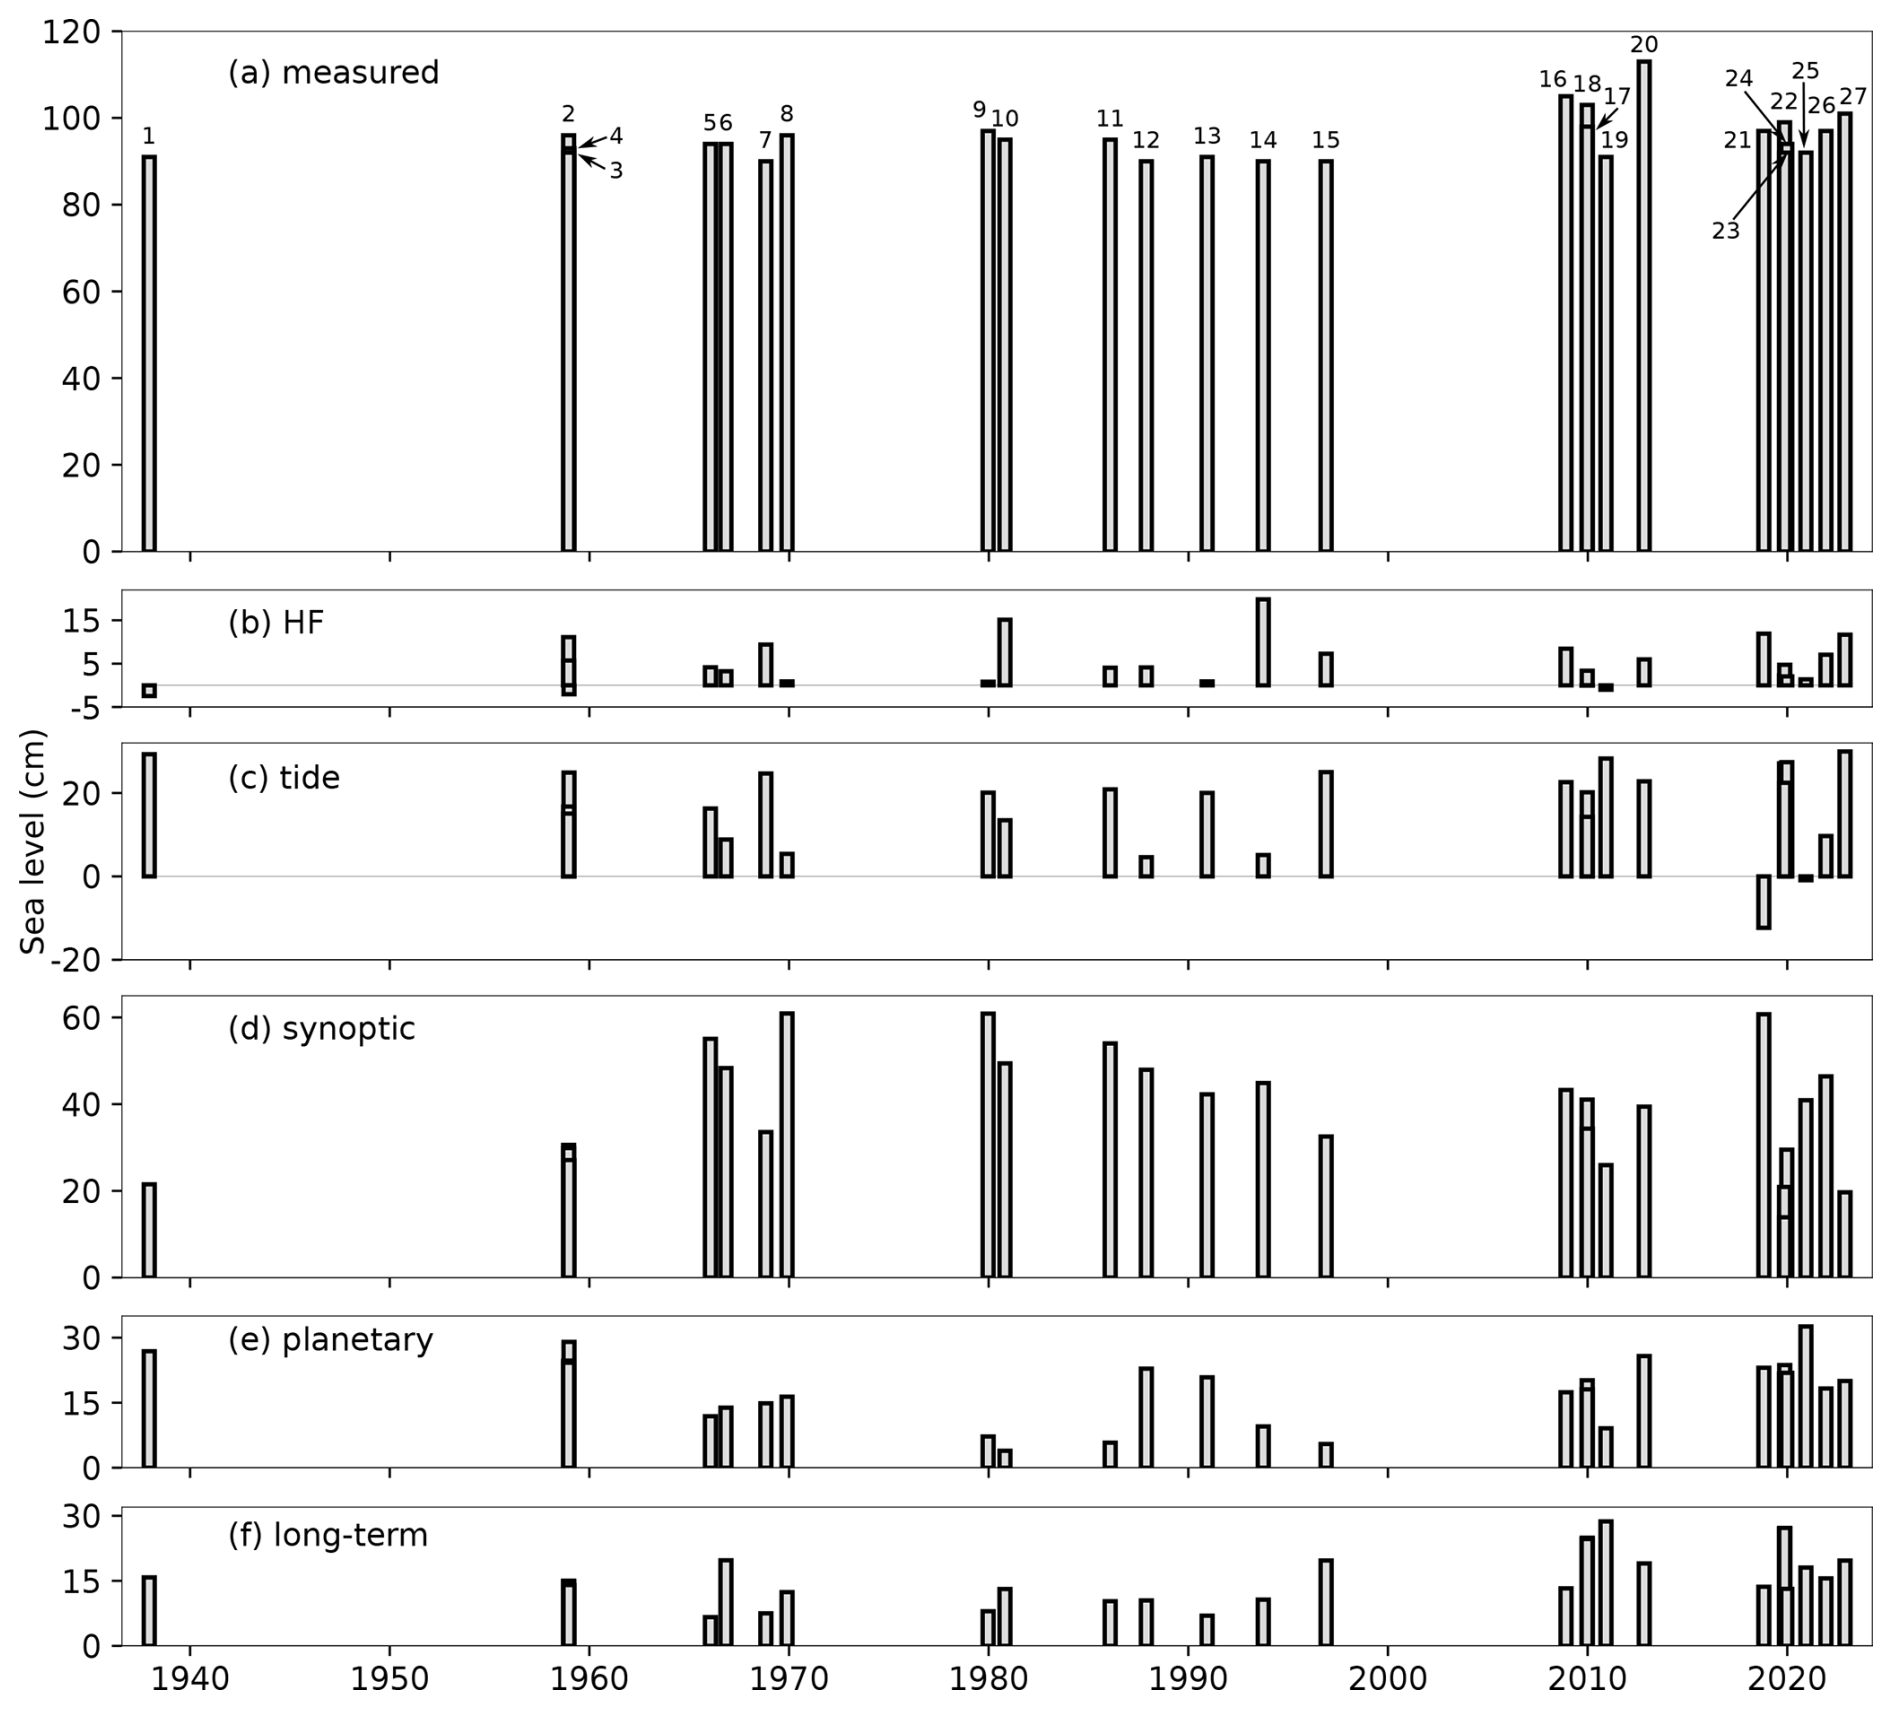
Figure 72(a) Temporal distribution of total SL maxima observed in Bakar during the 27 extreme SL episodes (marked with their ID numbers from Table 2). Contributions of SL components to observed maxima: (b) high-frequency oscillations (2 h < T < 9 h), (c) tide, (d) synoptic component (9 h < T < 10 d), (e) planetary-scale component (10 d < T < 100 d), and (f) long-term sea-level variability (100 d < T).
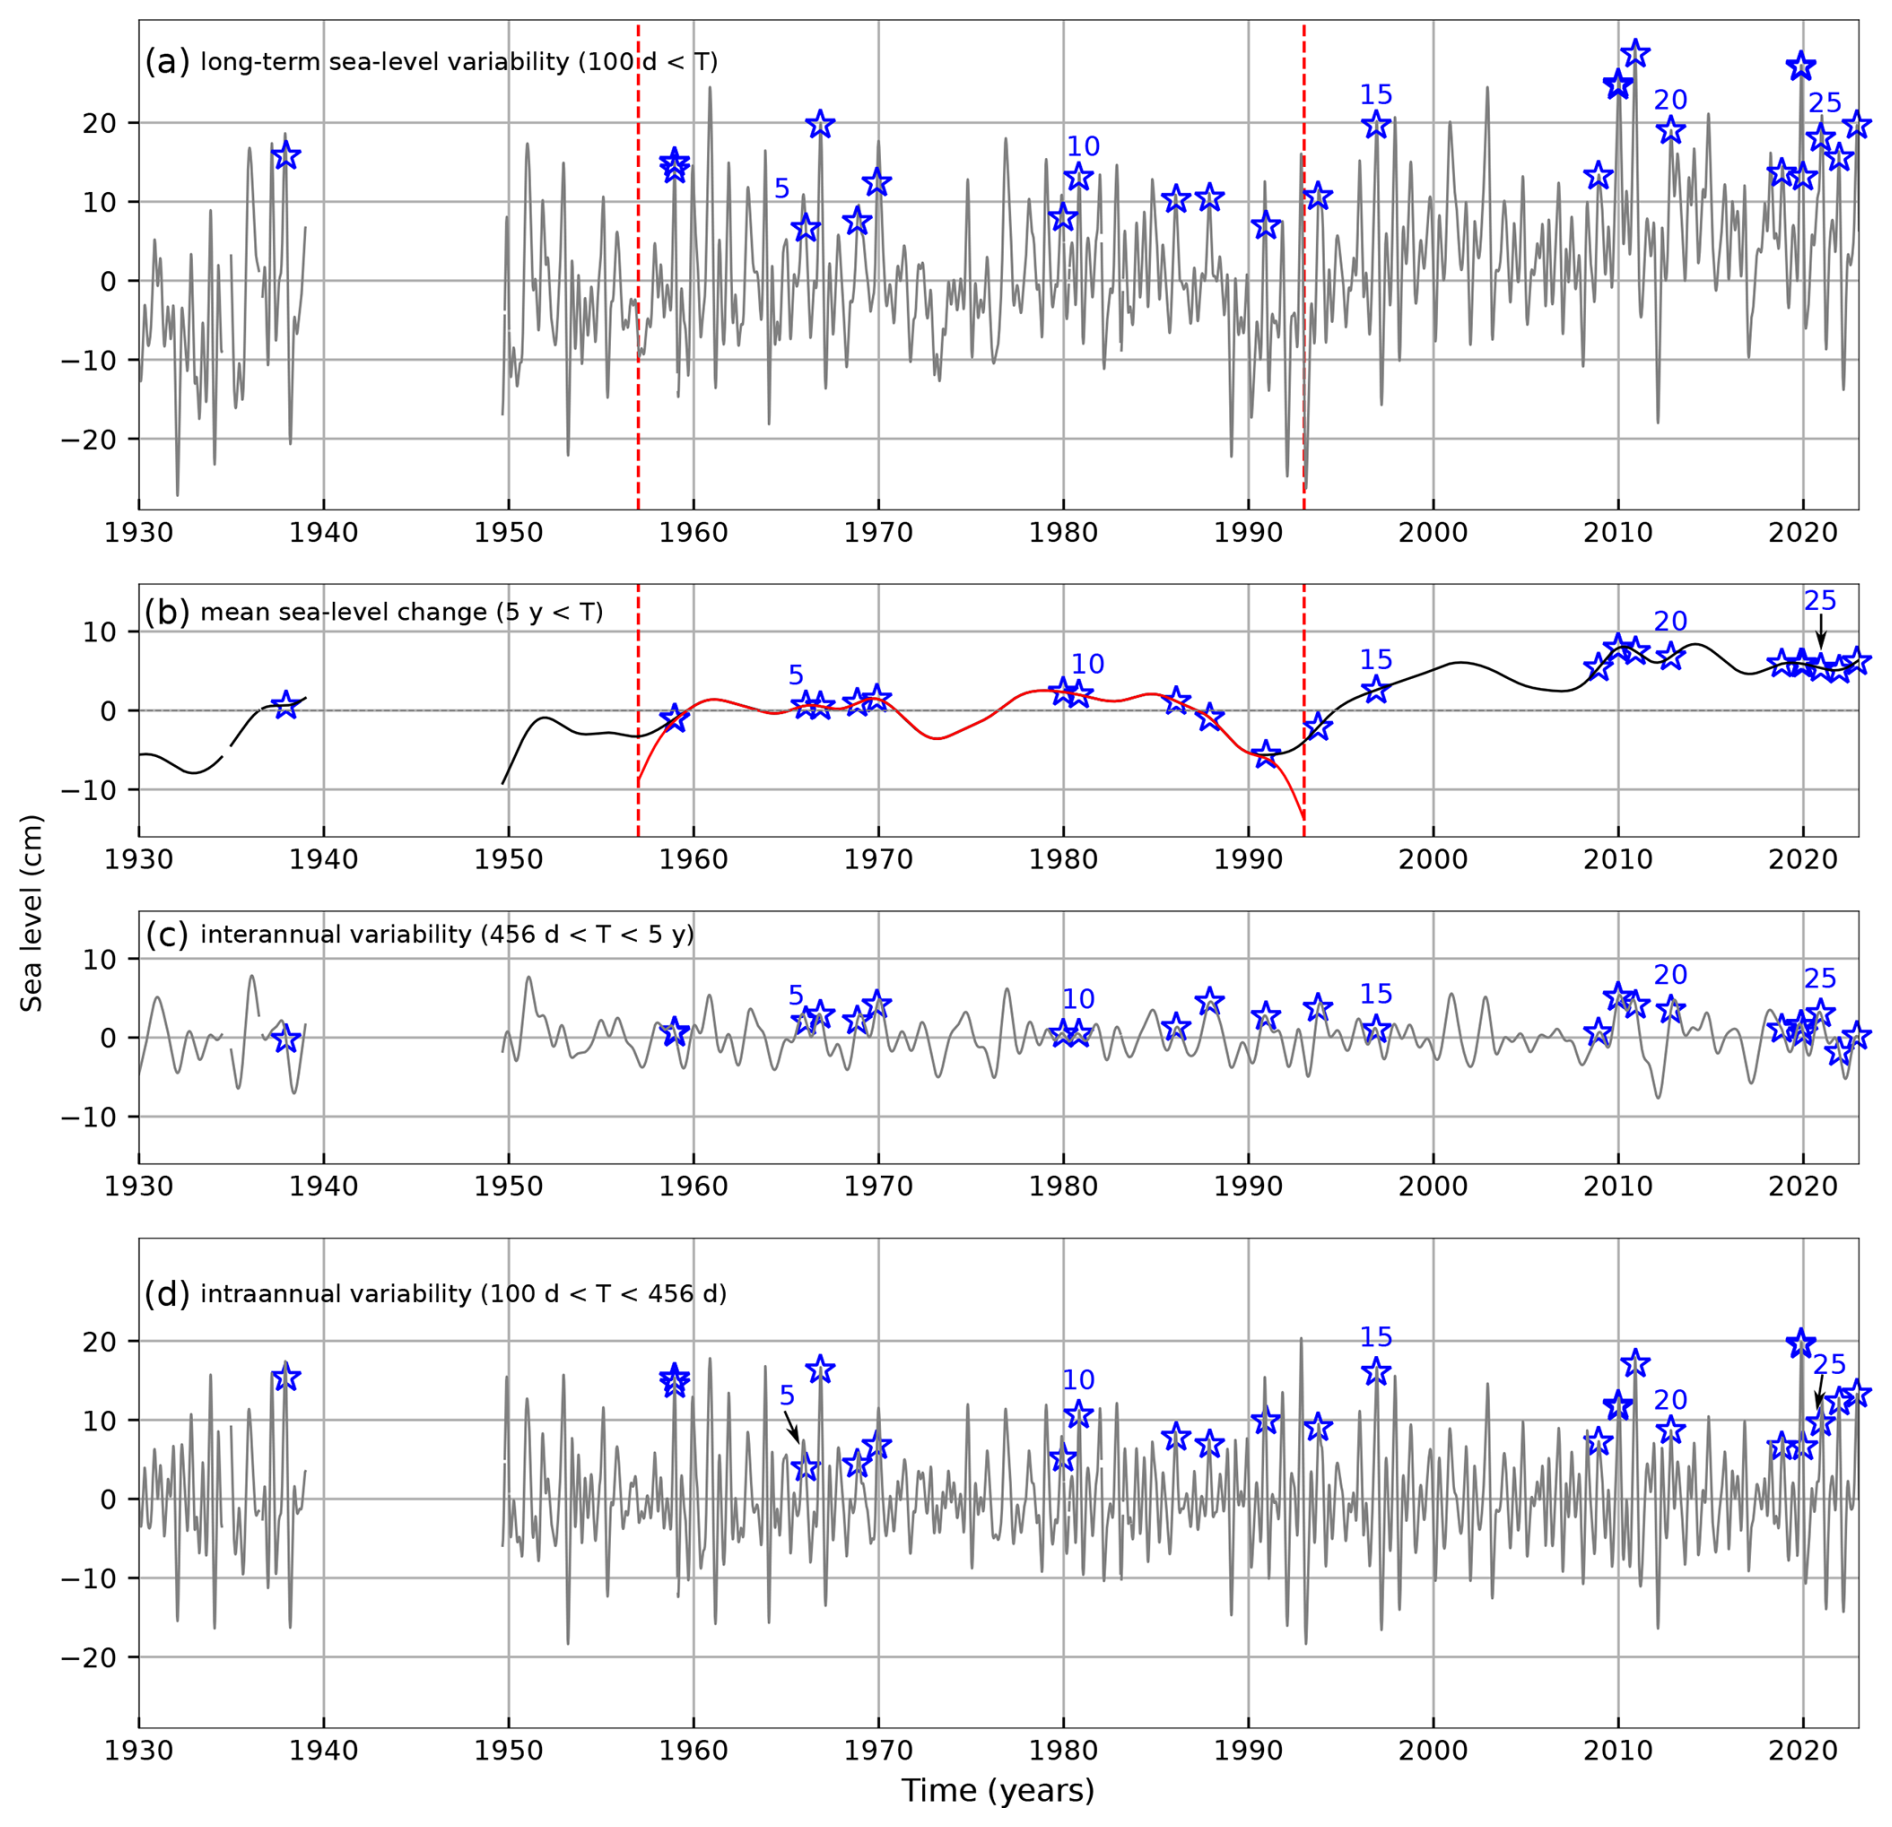
Figure 73(a) Long-term sea-level component representing SL variability at periods longer than 100 d (obtained by low-pass-filtering the SL with a cut-off at a period of 100 d). Vertical red lines indicate the time interval over which mean sea-level change (shown as the red line in panel b) was calculated. (b) Mean sea-level change obtained by low-pass-filtering the SL with a cut-off at a period of 5 years, shown for the 1929–2022 interval (black) and the 1957–1992 interval (red). (c) Interannual variability obtained by band-pass filtering the SL at periods between 456 d and 5 years. (d) Intra-annual variability, which includes the mean seasonal cycle and its anomalies, representing variations in the SL at periods of 100–456 d. Blue stars indicate the extracted extreme episodes, with every fifth episode labelled with its ID from Table 2.
This paper analyses the contribution of five sea-level processes to 27 extreme episodes recorded at TG Bakar, identifying the key factors influencing these extremes (Fig. 72). During northern Adriatic episodes, most components were generally in a positive phase, except for high-frequency oscillations and tide in a few cases, which is consistent with the expectation that extreme sea levels occur when multiple processes constructively overlap. Among the contributors, high-frequency oscillations had the least impact, synoptic component often played a major role, and other components typically made smaller contributions to the total SL maxima. Towards the end of the studied period (from 2008 onward), the contribution of synoptic component became less pronounced compared to earlier years, while the contributions from planetary-scale and long-term components increased. Regarding long-term sea-level component (Fig. 73), the largest contribution clearly comes from intra-annual variability – which includes the mean seasonal cycle and its anomalies (Fig. 73d) – while interannual variations contribute the least (Fig. 73c). The contribution from mean sea-level change (5 years < T) has been positive since the 1996 episode (ID 15), ranging from 2.6 to 8 cm (Fig. 73b).
Although these conclusions are generally true, each episode is the result of a unique combination of factors. For example, during the 2 October 1993 episode (Fig. 38), high-frequency oscillations – which are typically weak – made a significant contribution. Although still smaller than synoptic component, the contribution from high-frequency oscillations surpassed the other three components due to the presence of a Kvarner Bay seiche (T ∼ 6 h) that peaked simultaneously with the total SL maximum. Similarly, during the 24 December 1958 and 8 December 2020 episodes (Figs. 8 and 65), planetary-scale component was strong, comparable to synoptic component. This preconditioning resulted from a gradual MSLP (lp) drop but, more importantly, from prolonged winds (10 d < T < 100 d) blowing from the south at speeds of up to 7 m s−1 for 1 week (2020) or 2 weeks (1958).
The analysis also underlined the role of pre-existing seiches in extreme SL events. On 10 occasions, a pre-existing seiche was present during an episode and positively overlapped with the newly induced storm surge. Particularly notable events occurred on 18 December 1958 and 23 December 2019, when oscillations triggered a day earlier significantly amplified the subsequent flooding. Despite weak direct (synoptic) forcing during the total SL maxima (Figs. 6, 7d, and 60), the total SL exceeded the threshold due to the constructive overlap of the seiche with the tidal daily maxima.
From Fig. 72, it is clear that the largest SL responses to synoptic forcing occurred during extremes in 1966 (January), 1969, 1979, and 2018 (IDs 5, 8, 9, and 21). These episodes, except the 1966 episode, were unaffected by pre-existing seiches (Table 2, Figs. 11, 20, 23, and 56), meaning they were primarily driven by storm surges. Most of these episodes were particularly pronounced along the northwestern coast (in front of the Venetian Lagoon), which likely explains why they have been extensively studied in the scientific literature. The most studied episodes include those on 4 November 1966, 22 December 1979, 1 December 2008, 29 October 2018, and 13 and 15 November 2019.
Another insight into the varied roles of SL processes in extreme events comes from a comparison of episodes in 2019. Specifically, three events occurred roughly 40 d apart, but the contribution from long-term sea-level component was rather different. On 13 and 15 November 2019 (IDs 22 and 23; Fig. 59), the contribution was 27 cm (Fig. A1), whereas on 23 December 2019 (ID 24; Fig. 62), it was 13 cm (Fig. A1). This difference was due to intra-annual variability, which had a particularly pronounced amplitude that year, leading to significantly different contributions, even between episodes just 40 d apart.
The analysis of meteorological conditions showed that most extreme episodes were associated with cyclones approaching from the west, often forming in the western Mediterranean (e.g. the Gulf of Lion, the Ligurian Sea, or further west) or the Gulf of Genoa. These cyclones typically deepened over the Gulf of Genoa before moving eastward across the northern Adriatic. In some cases, the cyclones originated in the Atlantic or western Europe and then travelled to the western Mediterranean before heading towards the northern Adriatic (e.g. 24 November 1987, 10 December 1990, and 2 October 1993). In several cases, cyclones followed atypical trajectories. Two notable examples are the episodes of 22 December 1979 and 13 November 2019. In 1979, a cyclone formed in the lee of the Atlas Mountains, moved northeast across Corsica, and then continued northward without crossing the Adriatic (Fig. 22). In 2019, a cyclone originating in the western Mediterranean crossed the Tyrrhenian Sea and entered the Adriatic farther south than usual (Fig. 58a, b), generating southerly winds with hurricane gusts over the southern and middle Adriatic (Sect. 4.19.1). Additionally, two other cases stand out because the MSLP gradients over the Adriatic were not caused by Mediterranean cyclones crossing the Adriatic but instead resulted from much larger MSLP distributions. On 25 December 2009, a significant MSLP gradient across Europe was driven by an anticyclone in eastern Europe and two cyclones in the west – one over the Bay of Biscay and another over northern Italy (Fig. 46c). Similarly, on 17 and 18 December 1958, no cyclones crossed the Adriatic. Instead, the MSLP gradient and, consequently, sirocco winds were generated by an upper-level trough spanning almost all of Europe and a ridge penetrating from northwest Africa to the eastern Mediterranean. At lower levels, this set-up supported cyclonic activity over the Atlantic (Fig. 7a and b) and an increase in the MSLP in the east. The cyclones were usually accompanied by precipitation, which was often more intense in the northern Adriatic than in the middle and southern Adriatic and frequently exceeded 30 mm in 24 h.
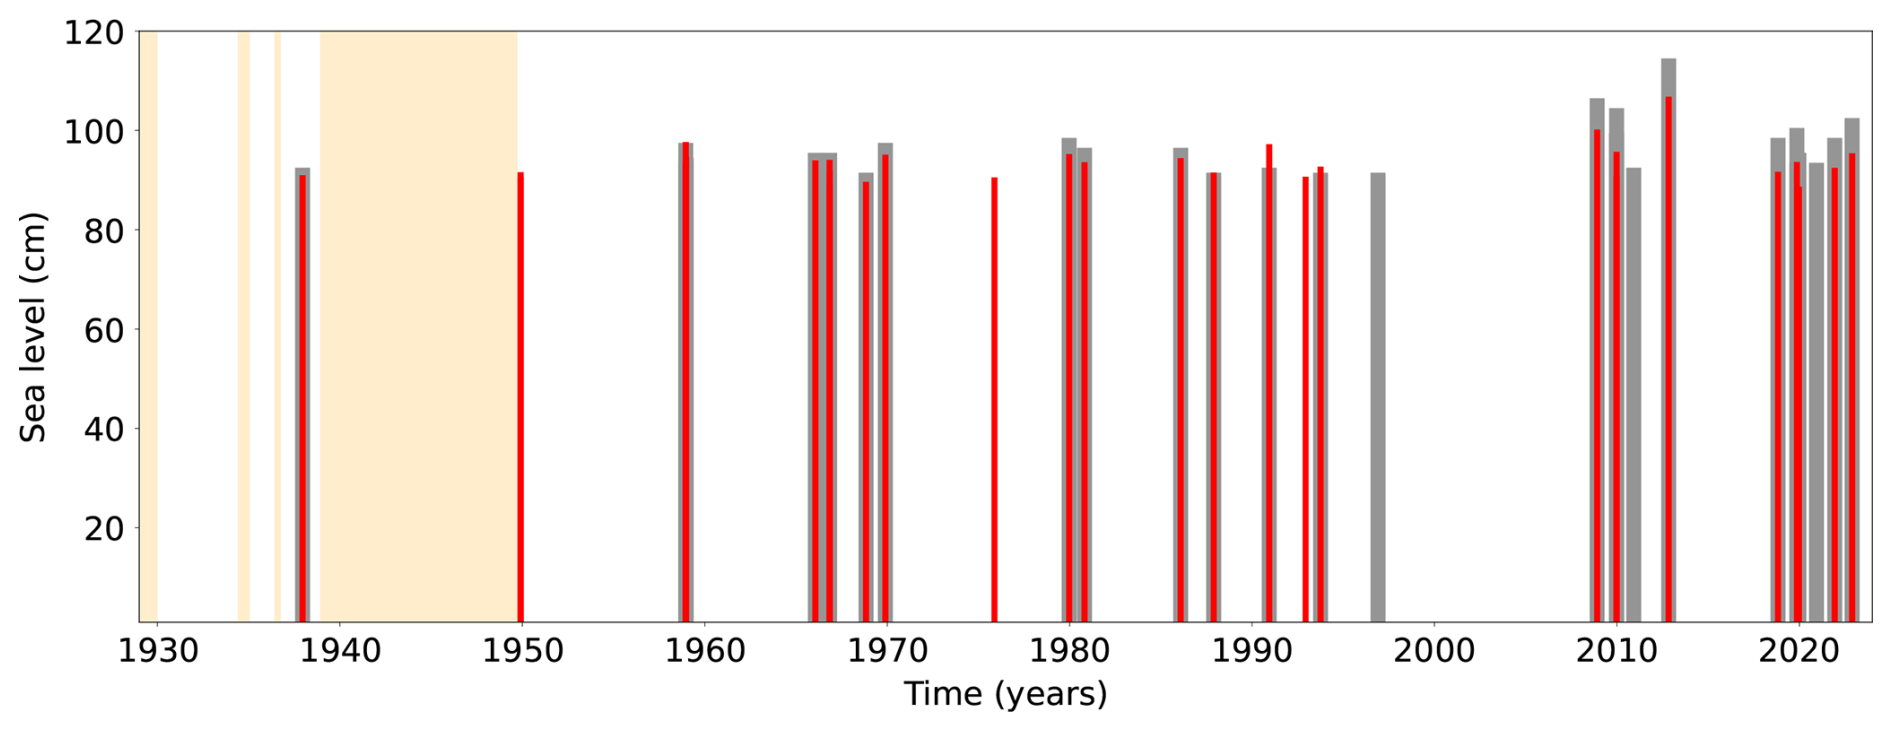
Figure 74Temporal distribution of extreme SL episodes in the northern Adriatic from 1929 to 2022. Grey bars show the maximum SL recorded at TG Bakar during 27 extreme episodes identified from the total SL series (listed in Table 2). Red bars indicate the maximum SL during episodes extracted from the SL series from which mean sea-level change (5 years < T) was removed (using the 99.99th percentile threshold to extract extremes from that series). Orange areas denote periods with data gaps exceeding 30 d.
The temporal distribution of the episodes (Fig. 74) reveals that they do not occur uniformly over time, with an increase in occurrences towards the end of the studied period and a notable grouping of episodes in certain periods. In some years, multiple episodes were observed, such as December 1958 (three episodes), January and November 1966 (two episodes), December 2009 (two episodes), and November and December 2019 (three episodes). The largest group of episodes appeared from 2018 to 2022, with at least one episode occurring each year. Calculated trends of frequency (number of events per 10 years) and intensity (maximum sea level during an episode) of extremes shown in Fig. 74 are not significantly different from zero at the 95 % confidence level. Trends were calculated starting from 1 January 1950 due to a large data gap of approximately 10 years prior to that date. The highest hourly SL at TG Bakar was recorded on 1 November 2012. Seasonally, these episodes occur in the colder months, from October to February, especially in November and December.
To explain the grouping of extreme episodes toward the end of the study period, we analysed a sea-level series with variability on timescales longer than 5 years removed. Specifically, we first subtracted mean sea-level change, which consists of (multi)decadal changes and linear trend, from the measured SL data; we then extracted extremes using the same method as for regular extremes (Sect. 3.1). This approach yielded a set of “adjusted” episodes exceeding the 99.99th percentile threshold of the adjusted SL series. At TG Bakar, over the 1929–2022 period, (multi)decadal variability ranged from −7.6 to +5.6 cm, while the linear trend was +1.17 mm yr−1. It is important to note that the TG Bakar station is located on stable ground, with no evidence of subsidence during its entire operating history (Međugorac et al., 2022); therefore, the observed mean sea-level change at this site reflects only SL change. The temporal distribution of “adjusted” extremes (red bars in Fig. 74) shows a tendency to cluster, especially in the second half of the period. The trends in frequency and intensity calculated for the “adjusted” extremes, like those for the regular extremes, are not significantly different from zero (95 % confidence level). The sea level recorded on 1 November 2012 remains the highest. Figure 74 shows that mean sea-level change has reduced the number of extreme events in recent decades; 3 out of 12 episodes are missing from the “adjusted” set: 3 December 2010, 15 November 2019, and 8 December 2020.
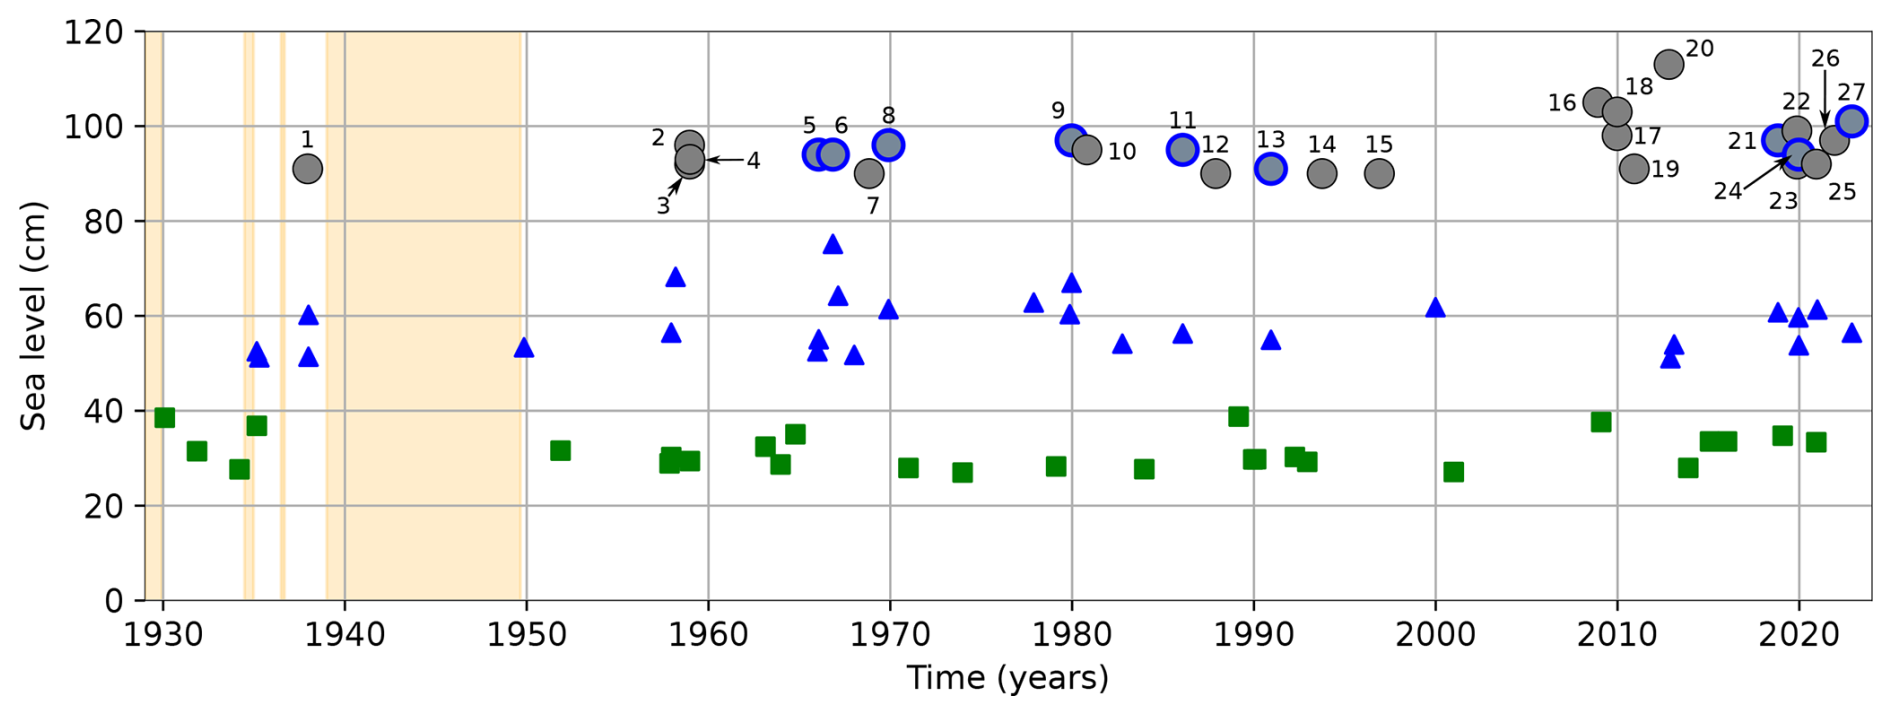
Figure 75Temporal distribution of extreme episodes of total SL (grey circles), extreme episodes of synoptic component (blue triangles), and extreme episodes of planetary-scale variability (green rectangles). Extremes of the total SL that coincide with extremes of synoptic component are marked with blue edges. Orange shaded areas denote periods with data gaps exceeding 30 d.
The occurrence of extreme episodes can be further studied by examining the temporal distribution of the intensity and occurrence of episodes extracted from other components. To that end, we extracted episodes of extreme synoptic component and planetary-scale variability, using the same approach as for SL extremes (Sect. 3.1), and applying thresholds selected to yield a similar number of episodes: 51 cm for synoptic component and 27 cm for planetary-scale variability (Fig. 75). Trends in the intensity and frequency of synoptic extremes (blue triangles in Fig. 75) are not significantly different from zero at the 95 % confidence level, although these episodes appear to cluster toward the end of the study period. A same result is obtained for trends in planetary-scale variability (green rectangles in Fig. 75), although its grouping is less pronounced. Total extreme SLs typically occurred during intervals when at least one of the other components – most often synoptic component – was active. However, extreme SLs were not necessarily a direct result of synoptic extremes: a clear connection could only be made in nine cases (circles with blue edges in Fig. 75). Both synoptic component and planetary-scale variability exhibited periods of reduced activity – in the first half of 1950s, throughout the 1970s, and during a prolonged interval from the 1990s to shortly after 2010. Despite the scarcity of extremes in these components during the last interval, a number of extreme SLs still occurred. These events may be explained by other contributing factors: substantial input from high-frequency oscillations (ID 14; Fig. 38), large contributions from long-term sea-level component (IDs 17, 18, and 19; Figs. 47 and 50), or a finely tuned overlap of multiple milder processes (IDs 15, 16, and 20; Figs. 41, 44, and 53).
In this paper, we analysed 27 extreme SL episodes, defined as occasions when the hourly SL measured at TG Bakar (northern Adriatic) exceeded 89 cm (99.99th percentile threshold). The study included an empirical analysis of the meteorological background and sea-level evolution for each episode, along with a review of previous scientific literature examining these episodes and a review of daily newspaper and online sources describing their impacts on the natural and built environment along the Croatian coastline.
The analysis revealed several key findings:
-
The occurrence of extreme sea-level episodes has increased since 2008.
-
All episodes occurred between October and February, particularly in November and December.
-
The contribution of high-frequency oscillations was generally the smallest, ranging from −3 to 20 cm, and was negative in only three cases (IDs 1, 4, and 19).
-
Tidal contribution ranged from −12 to 30 cm and was negative in two cases (IDs 21 and 25).
-
Synoptic component contributed positively to all episodes, with values ranging from 14 to 61 cm. In most cases, it was the dominant contributor.
-
Planetary-scale variability contributed positively in all cases, with a range of 4 to 33 cm.
-
Long-term sea-level variability made a positive contribution to all episodes, ranging from 7 to 30 cm.
-
Pre-existing seiches amplified SL maxima in 10 cases.
-
While most cyclones associated with these episodes followed typical paths, originating in the western Mediterranean and crossing the northern Adriatic on their way to the northeast, a few episodes were linked to atypical cyclone tracks (IDs 9 and 22) or, in some cases, not to cyclones at all but to large-scale pressure patterns (IDs 2, 3, and 18).
-
A review of newspapers and online sources showed that these episodes affected the entire coastline, particularly the northern and middle Adriatic. They continued to disrupt daily life along the coast, sometimes for several days, and in rare cases, they resulted in evacuations, injuries, or even fatalities.
Long-term sea-level variability, on a timescale of more than 100 d, includes the seasonal cycle and other intra-annual variations, interannual changes, (multi)decadal fluctuations, and secular change. These variations are determined by atmospheric and ocean drivers in the broader region, including the Atlantic Ocean. The mean Adriatic seasonal cycle is usually described by the sum of the annual and semiannual cosine functions. At the Bakar site, this process reaches its maxima in spring and autumn with amplitudes of the annual and semiannual components of 1.7 and 3.4 cm, respectively (Pasarić, 2000). The seasonal variability in the Mediterranean is determined not only by buoyancy changes (seasonal warming and cooling) and wind effects (Fukumori et al., 2007) but also by seasonal mass transport across the sea surface and through the Strait of Gibraltar (Pinardi et al., 2014). The annual and interannual SL variability in the Mediterranean is related to positive/negative North Atlantic Oscillation (NAO) phases associated with westward/eastward winds over the Strait of Gibraltar causing water masses to flow out of/into the Mediterranean (Landerer and Volkov, 2013; Volkov et al., 2019). The decadal variability in the SL is considerable and is observed at several tide-gauge stations in the Mediterranean (up to 15 cm). It is strongly correlated with the NAO and is associated with the effects of offshore winds and wave propagation along the eastern Atlantic (Calafat et al., 2012). Three minima associated with this oscillation were observed in the 1950s, 1970s, and 1990s. It is worth mentioning that the Adriatic–Ionian Bimodal Oscillating System (BiOS) acts on timescales of approximately 12–13 years. It is a nonlinear, internally driven oscillation of the basin's circulation and density structure, with aspects well detected in satellite altimetry data (Gačić et al., 2010; Eusebi Borzelli and Carniel, 2023). BiOS also influences the thermohaline properties of the Adriatic Sea (Mihanović et al., 2015), which are presumed to affect the SL on decadal timescales. Going to longer timescales (10 years < T), the amplitudes of the processes become much smaller. The bidecadal fluctuations in the Adriatic SL have an amplitude of ∼ 2 cm and are assumed to be a response to global bidecadal changes (Orlić and Pasarić, 2000, and sources cited therein). There were two maxima associated with this oscillation – in the early 1960s and in the 1980s – which are likely related to the low atmospheric pressure and high air and sea-surface temperatures that occurred at that time, concurrent with the low salinity in the eastern Mediterranean in the early 1980s. Then, the multidecadal changes in the Adriatic were assumed to be due to the thermal fluctuations observed in the atmosphere over the northern Atlantic as well as anthropogenic changes in the Mediterranean freshwater budget (construction of the Aswan Dam) (Orlić and Pasarić, 2000, and sources cited therein). As for the secular change (i.e. the linear trend), it is caused by various processes: direct atmospheric influences, thermohaline processes, mass changes, and crustal movements. Its rate depends strongly on the time interval over which it is calculated. Šepić et al. (2022) reported a positive trend of mean SL at TGs from Venice to Dubrovnik in the 1956–2020 period: the values ranged from 0.99 mm yr−1 in Rovinj to 2.99 mm yr−1 in Venice (the locations of the stations are shown in Fig. 1). Strong sea-level rise relative to land in Venice is due to local subsidence caused by the pumping of underground water sources (Pirazzoli, 1987; Tosi et al., 2013). The study also found that the positive trend did not significantly affect the positive/negative Adriatic sea-level extremes. Specifically, the analysis showed a comparable number of extreme events in the first and second halves of the studied time interval across all stations. Moreover, trends in the characteristics of total extremes (number, duration, and intensity) were largely nonsignificant, with only the intensity of highly positive extremes showing nonzero positive trends at all stations.
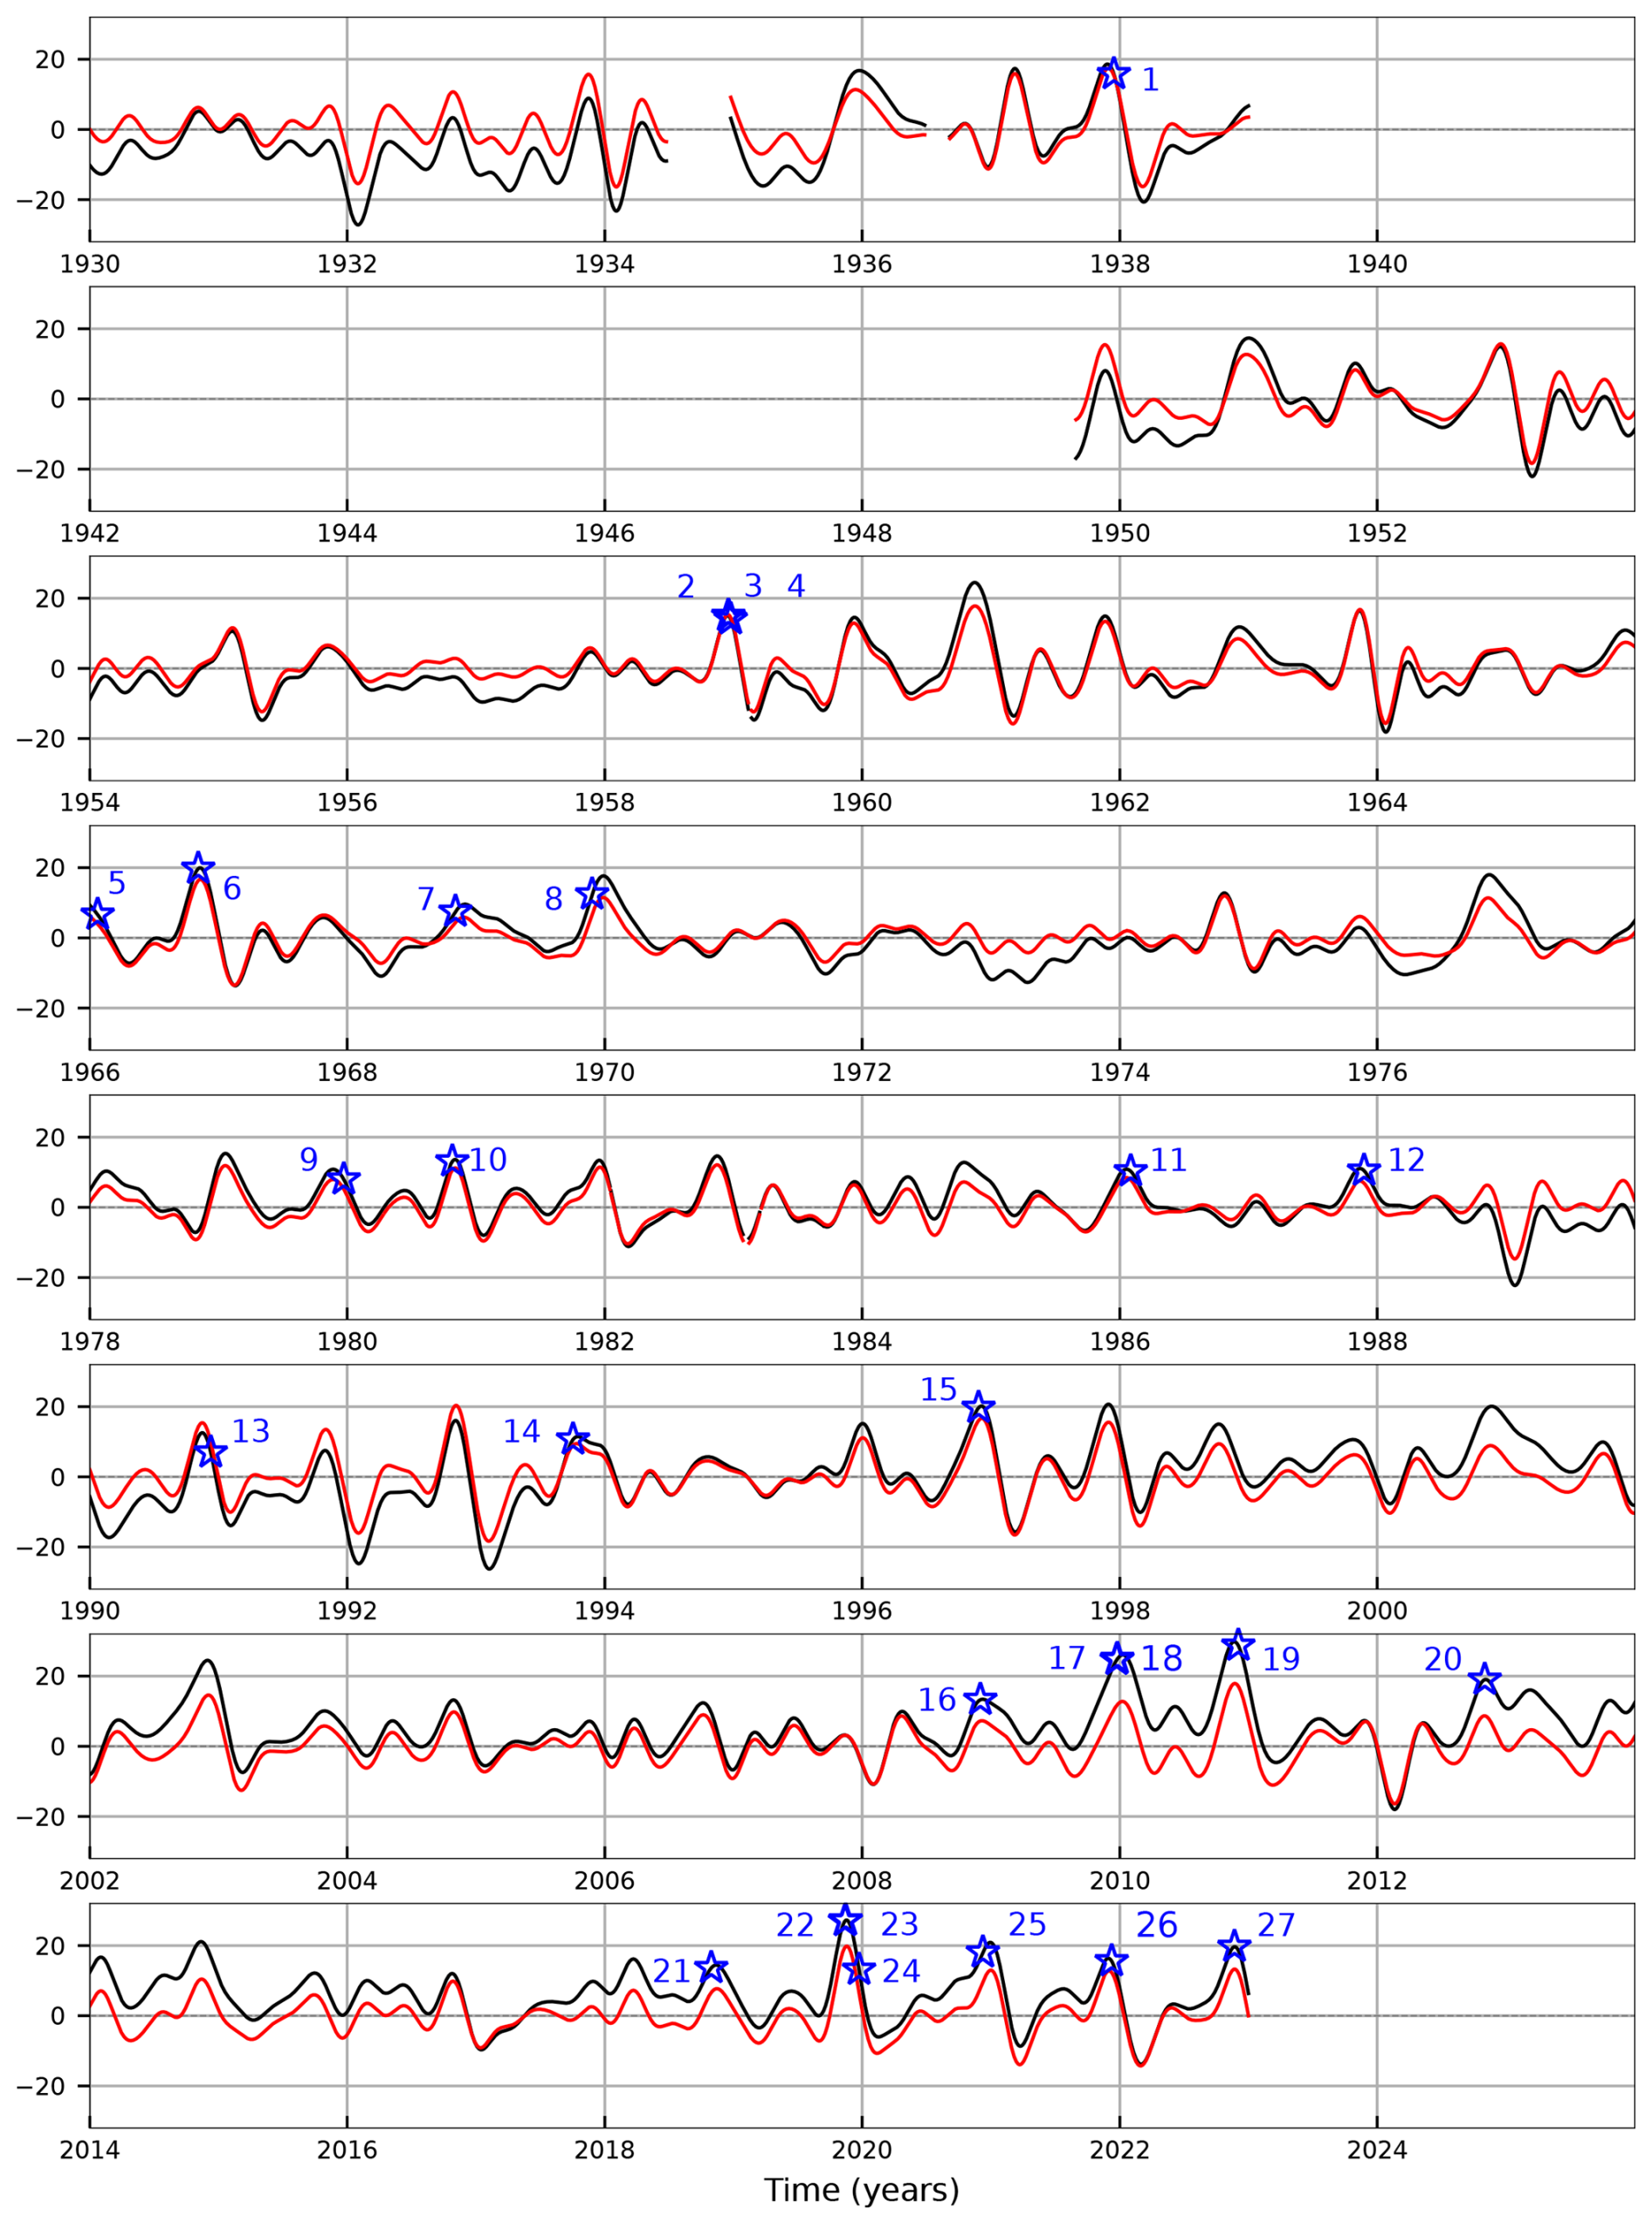
Figure A1Long-term sea-level variability (black; cm), representing SL changes at periods longer than 100 d. Intra-annual variability (red), which includes the mean seasonal cycle and its anomalies, obtained by high-pass-filtering of long-term sea-level component at a 15-month cut-off. Blue stars mark the extracted extreme episodes, which are labelled with their IDs from Table 2.
The hourly sea levels measured in Bakar are publicly available in the SEANOE database under a CC-BY-NC licence (https://doi.org/10.17882/85171, Međugorac et al., 2024a). The spatial fields of the ERA5 reanalysis are publicly available in the Copernicus Marine Service Repository (hourly data on single levels: https://doi.org/10.24381/cds.adbb2d47, Hersbach et al., 2023b; hourly data on pressure levels: https://doi.org/10.24381/cds.bd0915c6, Hersbach et al., 2023a). Meteorological measurements from the Croatian Meteorological and Hydrological Service (DHMZ) are available from https://meteo.hr/proizvodi_e.php?section=proizvodi_usluge§m=services (DHMZ, 2024). The NOAA–CIRES–DOE 20th Century Reanalysis (V3) was provided by NOAA PSL, Boulder, Colorado, USA, on their website: https://psl.noaa.gov (last access: 10 December 2024). Support for the 20th Century Reanalysis Project version 3 dataset is provided by the US Department of Energy, Office of Science Biological and Environmental Research (BER) programme; by the National Oceanic and Atmospheric Administration Climate Program Office; and by the NOAA Earth System Research Laboratory Physical Sciences Laboratory. Serial publications (newspapers) are available at the Croatian National and University Library (https://nsk.hr/en/, last access: 10 December 2024).
IM planned and led this work, conducted the SL analysis, produced all figures (except Fig. 1), wrote most of the manuscript, drafted and developed content for the web catalogue, prepared the SL analysis for it, and reviewed the existing literature on extreme episodes. KJ analysed the synoptic background of several episodes, wrote the corresponding text, assessed the impact of floods for the paper (and wrote the corresponding text), and carried out the final review and proofreading of the manuscript. She also prepared image and text material for the web catalogue. DD assessed the impact of flooding for the paper (and wrote the corresponding text), contributed to the final review and proofreading of the manuscript, and prepared image and text material for the web catalogue. JK analysed the synoptic background of the episodes, wrote the corresponding text, prepared precipitation and wind data from Croatian coastal stations, revised the text and performed the final review and proofreading. JŠ contributed to the writing of parts of the text, helped determine the final scope and structure of the paper, helped with analysis of sea-level data, prepared Fig. 1, revised the text, and performed the final review and proofreading of the manuscript. IVS prepared materials on the impact of flooding (National and University Library), prepared Table 1, and did the final review and proofreading of the manuscript. GG prepared video material for the web catalogue, contributed to the design of the final version of the article, and did the final review and proofreading of the manuscript.
The contact author has declared that none of the authors has any competing interests.
Publisher's note: Copernicus Publications remains neutral with regard to jurisdictional claims made in the text, published maps, institutional affiliations, or any other geographical representation in this paper. While Copernicus Publications makes every effort to include appropriate place names, the final responsibility lies with the authors.
This article is part of the special issue “Special issue on ocean extremes (55th International Liège Colloquium)”. It is not associated with a conference.
The authors express their deep gratitude to Miroslava Pasarić for her suggestions, advice, text corrections (to the manuscript), and engaging discussions. We also thank the two anonymous reviewers for their constructive and valuable comments that significantly improved quality of our work.
This research has been supported by the Croatian Science Foundation projects IP-2019-04-5875 StVar-Adri and IP-2022-10-4144 CroClimExtremes; ERC-StG 853045 SHExtreme; ERC-PoC 101213756 MeD-Track; the European Union's Horizon Europe Research and Innovation programme within the framework of the Marie Skłodowska-Curie Postdoctoral Fellowship Programme, SMASH co-funded under grant agreement no. 101081355 and co-funded by the Republic of Slovenia and the European Union from the European Regional Development Fund; and STIM–REI, contract no. KK.01.1.1.01.0003, a project funded by the European Union through the European Regional Development Fund – the Operational Programme Competitiveness and Cohesion 2014–2020 (KK.01.1.1.01).
This paper was edited by Aida Alvera-Azcárate and reviewed by two anonymous referees.
Accerboni, E. and Manca, B.: Storm surge forecasting in the Adriatic Sea by means of a 2d hydrodynamical numerical model, B. Geofis. Teor. Appl., 15, 3–22, 1973.
Bajo, M., Međugorac, I., Umgiesser, G., and Orlić, M.: Storm surge and seiche modelling in the Adriatic Sea and the impact of data assimilation, Q. J. Roy. Meteor. Soc., 145, 2070–2084, https://doi.org/10.1002/qj.3544, 2019.
Bajo, M., Ferrarin, C., Umgiesser, G., Bonometto, A., and Coraci, E.: Modelling the barotropic sea level in the Mediterranean Sea using data assimilation, Ocean Sci., 19, 559–579, https://doi.org/10.5194/os-19-559-2023, 2023.
Bertotti, L., Bidlot, J.-R., Buizza, R., Cavaleri, L., and Janousek, M.: Deterministic and ensemble-based prediction of Adriatic Sea sirocco storms leading to `acqua alta' in Venice, Q. J. Roy. Meteor. Soc., 137, 1446–1466, https://doi.org/10.1002/qj.861, 2011.
Biolchi, S., Denamiel, C., Devoto, S., Korbar, T., Macovaz, V., Scicchitano, G., Vilibić, I., and Furlani, S.: Impact of the October 2018 storm Vaia on coastal boulders in the Northern Adriatic Sea, Water, 11, 2229, https://doi.org/10.3390/w11112229, 2019.
Bowen, A. J., Inman, D. L., and Simmons, V. P.: Wave set-down and set-up, J. Geophys. Res., 73, 2569–2577, https://doi.org/10.1029/JB073i008p02569, 1968.
Calafat, F. M., Chambers, D. P., and Tsimplis, M. N.: Mechanisms of decadal sea level variability in the eastern North Atlantic and the Mediterranean Sea, J. Geophys. Res.-Oceans, 117, 2012JC008285, https://doi.org/10.1029/2012JC008285, 2012.
Canestrelli, P., Mandich, M., Pirazzoli, P. A., and Tomasin, A.: Wind, Depression and Seiches: Tidal Perturbations in Venice (1950–2000), https://www.comune.venezia.it/sites/comune.venezia.it/files/documenti/centro_maree/bibliografia/Venti_depressioni_e_sesse_ridotto.pdf (last access: 10 December 2024), 2001.
Cavaleri, L., Bertotti, L., Buizza, R., Buzzi, A., Masato, V., Umgiesser, G., and Zampieri, M.: Predictability of extreme meteo-oceanographic events in the Adriatic Sea, Q. J. Roy. Meteor. Soc., 136, 400–413, https://doi.org/10.1002/qj.567, 2010.
Cavaleri, L., Bajo, M., Barbariol, F., Bastianini, M., Benetazzo, A., Bertotti, L., Chiggiato, J., Davolio, S., Ferrarin, C., Magnusson, L., Papa, A., Pezzutto, P., Pomaro, A., and Umgiesser, G.: The October 29, 2018 storm in Northern Italy – An exceptional event and its modeling, Prog. Oceanogr., 178, 102178, https://doi.org/10.1016/j.pocean.2019.102178, 2019.
Cavaleri, L., Bajo, M., Barbariol, F., Bastianini, M., Benetazzo, A., Bertotti, L., Chiggiato, J., Ferrarin, C., Trincardi, F., and Umgiesser, G.: The 2019 flooding of Venice and its implications for future predictions, Oceanography, 33, 42–49, https://doi.org/10.5670/oceanog.2020.105, 2020.
Cerovečki, I., Orlić, M., and Hendershott, M. C.: Adriatic seiche decay and energy loss to the Mediterranean, Deep-Sea Res. Pt. I., 44, 2007–2029, https://doi.org/10.1016/S0967-0637(97)00056-3, 1997.
Civilna zaštita: Consequences of the stormy weather, https://civilna- zastita.gov.hr/vijesti/posljedice-olujnog-nevremena-2055/2055 (last access: 4 November 2024), 24 December 2019.
Corsini, S. and Ferla, M.: Sea level observing activity in Italy, https://gloss-sealevel.org/sites/gloss/files/publications/documents/italy_gexi2009.pdf (last access: 1 November 2024), 2009.
Dalmacija Danas: Storm hits Dalmatia: severe sirocco winds up to 112 km/h wreak havoc on Split’s beaches, part of the coast flooded again, https://www.dalmacijadanas.hr/nevrijeme-pogodilo-dalmaciju-olujno-jugo-do-112-km-h-napravilo-kaos-na-splitskim-plazama-dio-obale-ponovno-pod-morem/ (last access: 4 November 2024), 9 December 2021.
De Zolt, S., Lionello, P., Nuhu, A., and Tomasin, A.: The disastrous storm of 4 November 1966 on Italy, Nat. Hazards Earth Syst. Sci., 6, 861–879, https://doi.org/10.5194/nhess-6-861-2006, 2006.
DHMZ: Products and services, https://meteo.hr/proi zvodi_e.php?section=proizvodi_usluge¶m=services (last access: 10 December 2024), 2024.
Dubrovački vjesnik: Lapad waterfront flooded, the sea entered the pool of Hotel Lapad, Orsan under water. And look at Slano!, https://dubrovacki.slobodnadalmacija.hr/dubrovnik/zupanija/dubrovnik/poplavljena-lapadska-obala-more-uslo-u-bazen-hotela-lapad-a-pogledajte-kako-tek-izgleda-slano-1242695 (last access: 1 November 2024), 22 November 2022.
DWD: Archive of analysis charts, https://www.wetter3.de/archiv_dwd_dt.html (last access: 1 October 2024), 2024.
Enzi, S. and Camuffo, D.: Documentary sources of the sea surges in Venice fromad 787 to 1867, Nat. Hazards, 12, 225–287, https://doi.org/10.1007/BF00596222, 1995.
Eusebi Borzelli, G. L. and Carniel, S.: A reconciling vision of the Adriatic-Ionian Bimodal Oscillating System, Sci. Rep.-UK, 13, 2334, https://doi.org/10.1038/s41598-023-29162-2, 2023.
Ferrarin, C., Valentini, A., Vodopivec, M., Klaric, D., Massaro, G., Bajo, M., De Pascalis, F., Fadini, A., Ghezzo, M., Menegon, S., Bressan, L., Unguendoli, S., Fettich, A., Jerman, J., Ličer, M., Fustar, L., Papa, A., and Carraro, E.: Integrated sea storm management strategy: the 29 October 2018 event in the Adriatic Sea, Nat. Hazards Earth Syst. Sci., 20, 73–93, https://doi.org/10.5194/nhess-20-73-2020, 2020.
Ferrarin, C., Bajo, M., Benetazzo, A., Cavaleri, L., Chiggiato, J., Davison, S., Davolio, S., Lionello, P., Orlić, M., and Umgiesser, G.: Local and large-scale controls of the exceptional Venice floods of November 2019, Prog. Oceanogr., 197, 102628, https://doi.org/10.1016/j.pocean.2021.102628, 2021.
Ferrarin, C., Lionello, P., Orlić, M., Raicich, F., and Salvadori, G.: Venice as a paradigm of coastal flooding under multiple compound drivers, Sci. Rep.-UK, 12, 5754, https://doi.org/10.1038/s41598-022-09652-5, 2022.
Ferrarin, C., Orlić, M., Bajo, M., Davolio, S., Umgiesser, G., and Lionello, P.: The contribution of a mesoscale cyclone and associated meteotsunami to the exceptional flood in Venice on November 12, 2019, Q. J. Roy. Meteor. Soc., 149, 2929–2942, https://doi.org/10.1002/qj.4539, 2023.
Finizio, C., Palmieri, S., and Riccucci, A.: A numerical model of the Adriatic for the prediction of high tides at Venice, Q. J. Roy. Meteor. Soc., 98, 86–104, https://doi.org/10.1002/qj.49709841508, 1972.
Fukumori, I., Menemenlis, D., and Lee, T.: A near-uniform basin-wide sea level fluctuation of the Mediterranean Sea, J. Phys. Oceanogr., 37, 338–358, https://doi.org/10.1175/JPO3016.1, 2007.
Gačić, M., Borzelli, G. E., Civitarese, G., Cardin, V., and Yari, S.: Can internal processes sustain reversals of the ocean upper circulation? The Ionian Sea example, Geophys. Res. Lett., 37, 100, https://doi.org/10.1029/2010GL043216, 2010.
Glas Istre: Sirocco wind threatens flooding, https://glasistrenovine.hr/arhiva-portala/pregled-vijesti/jugo-zaprijetilo-poplavom-151266 (last access: 4 November 2024), 25 December 2009a.
Glas Istre: Flooding in Kantrida, https://glasistrenovine.hr/arhiva-portala/pregled-vijesti/poplavljena-kantrida-151351 (last access: 4 November 2024), 26 December 2009b.
Goldberg, J. and Kempni, K.: On the sea level oscillations in Bakar Bay and on the problem of bay seiches in general, Prirodosl. Istraživanja Kralj. Jugosl., 21, 9–235, 1938.
Grisogono, B. and Belušić, D.: A review of recent advances in understanding the mesoand microscale properties of the severe Bora wind, Tellus A, 61, 1–16, https://doi.org/10.1111/j.1600-0870.2008.00369.x, 2009.
Hersbach, H., Bell, B., Berrisford, P., Hirahara, S., Horányi, A., Muñoz-Sabater, J., Nicolas, J., Peubey, C., Radu, R., Schepers, D., Simmons, A., Soci, C., Abdalla, S., Abellan, X., Balsamo, G., Bechtold, P., Biavati, G., Bidlot, J., Bonavita, M., De Chiara, G., Dahlgren, P., Dee, D., Diamantakis, M., Dragani, R., Flemming, J., Forbes, R., Fuentes, M., Geer, A., Haimberger, L., Healy, S., Hogan, R. J., Hólm, E., Janisková, M., Keeley, S., Laloyaux, P., Lopez, P., Lupu, C., Radnoti, G., de Rosnay, P., Rozum, I., Vamborg, F., Villaume, S., and Thépaut, J.-N.: The ERA5 global reanalysis, Q. J. Roy. Meteor. Soc., 146, 1999–2049, https://doi.org/10.1002/qj.3803, 2020.
Hersbach, H., Bell, B., Berrisford, P., Biavati, G., Horányi, A., Muñoz Sabater, J., Nicolas, J., Peubey, C., Radu, R., Rozum, I., Schepers, D., Simmons, A., Soci, C., Dee, D., Thépaut, J-N.: ERA5 hourly data on pressure levels from 1940 to present, Copernicus Climate Change Service (C3S) Climate Data Store (CDS) [data set], https://doi.org/10.24381/cds.bd0915c6 (last access: 20 September 2024), 2023a.
Hersbach, H., Bell, B., Berrisford, P., Biavati, G., Horányi, A., Muñoz Sabater, J., Nicolas, J., Peubey, C., Radu, R., Rozum, I., Schepers, D., Simmons, A., Soci, C., Dee, D., and Thépaut, J. N.: ERA5 hourly data on single levels from 1940 to present, Copernicus Climate Change Service (C3S) Climate Data Store (CDS) [data set], https://doi.org/10.24381/cds.adbb2d47, 2023b.
HHI: Record-breaking wave in the Adriatic Sea, https://www.weatherzone.com.au/news/recordbreaking-wave- in-adriatic-sea/530516 (last access: 1 October 2024), 2024.
Hrvatska Danas: Severe sirocco knocked down trees in Split, firefighters intervened on all sides, ferry lines interrupted, https://hrvatska-danas.com/2021/12/09/video-olujno-jugo-rusilo -stabla-po-splitu-vatrogasci-intervenirali-na-sve-strane-trajektne -linije-u-prekidu/ (last access: 4 November 2024), 9 December 2021.
Hrvatska vatrogasna zajednica: Interventions due to the storm, https://hvz.gov.hr/vijesti/753 (last access: 4 November 2024), 23 December 2019.
Index.hr: Floods hit Split, Šibenik, and Trogir. New forecasts released, https://www.index.hr/vijesti/clanak/poplave-u- splitu-sibeniku-trogiru-objavljene-nove-prognoze/2414003.aspx (last access: 4 November 2024), 22 November 2022.
Istramet: Heavy rain already hits locally, high tide and severe sirocco - Antenal closed, https://www.istramet.hr (last access: 4 November 2024), 8 December 2020.
Janeković, I. and Kuzmić, M.: Numerical simulation of the Adriatic Sea principal tidal constituents, Ann. Geophys., 23, 3207–3218, https://doi.org/10.5194/angeo-23-3207-2005, 2005.
Jutarnji list: Jutarnji list, pages 4–5, 2 December 2008.
Jutarnji list: Heavy rains turn Kantrida stadium into a giant swimming pool, https://www.jutarnji.hr/vijesti/hrvatska/obi lne-kise-pretvorile-stadion-kantridu-u-ogromni-bazen-2882312 (last access: 4 November 2024), 25 December 2009.
Jutarnji list: Worst of the storm still to come: waterfronts and boats flooded, roads closed, back page, 29 October 2018a.
Jutarnji list: Trees uprooted in Istria, sailboats hurled in Zadar, page 12, 31 October/1 November 2018b.
Jutarnji list: Jutarnji list, back page, 14 November 2019a.
Jutarnji list: Jutarnji list, pages 6–7, 17 November 2019b.
Jutarnji list: Sea floods coast, severe sirocco blows, Vrgorac hit by flooding, new forecast issued, https://www.jutarnji.hr/vijesti/hrvatska/diljem-obale-izlilo-se- more-puse-orkansko-jugo-potop-kod-vrgorca-stigla-nova-prognoza-15035696 (last access: 4 Novmeber 2024), 8 December 2020.
Jutarnji list: Floods along the coast, several islands cut off from the mainland: wind topples trees, waterfronts under water, problems also in Slovenia, https://www.jutarnji.hr/vijesti/hrvatska/ poplave-diljem-obale-niz-otoka-odsjeceno-od-kopna-vjetar-rusi-stabla-rive-pod-vodom-problemi-i-u-sloveniji-15278693 (last access: 4 November 2024), 22 November 2022.
Korbar, T., Navratil, D., Denamiel, C., Kordić, B., Biolchi, S., Vilibić, I., and Furlani, S.: Coarse-clast storm deposit and solitary boulders on the Island of Mana (NP Kornati, Central Adriatic, Croatia), Geosciences, 12, 355, https://doi.org/10.3390/geosciences12100355, 2022.
Landerer, F. W. and Volkov, D. L.: The anatomy of recent large sea level fluctuations in the Mediterranean Sea, Geophys. Res. Lett., 40, 553–557, https://doi.org/10.1002/grl.50140, 2013.
Ličer, M., Estival, S., Reyes-Suarez, C., Deponte, D., and Fettich, A.: Lagrangian modelling of a person lost at sea during the Adriatic scirocco storm of 29 October 2018, Nat. Hazards Earth Syst. Sci., 20, 2335–2349, https://doi.org/10.5194/nhess-20-2335-2020, 2020.
Lionello, P., Mufato, R., and Tomasin, A.: Sensitivity of free and forced oscillations of the Adriatic Sea to sea level rise, Clim. Res., 29, 23–39, https://doi.org/10.3354/cr029023, 2005.
Lionello, P., Sanna, A., Elvini, E., and Mufato, R.: A data assimilation procedure for operational prediction of storm surge in the northern Adriatic Sea, Cont. Shelf Res., 26, 539–553, https://doi.org/10.1016/j.csr.2006.01.003, 2006.
Lionello, P., Barriopedro, D., Ferrarin, C., Nicholls, R. J., Orlić, M., Raicich, F., Reale, M., Umgiesser, G., Vousdoukas, M., and Zanchettin, D.: Extreme floods of Venice: characteristics, dynamics, past and future evolution (review article), Nat. Hazards Earth Syst. Sci., 21, 2705–2731, https://doi.org/10.5194/nhess-21-2705-2021, 2021.
Maioni, E.: A catastrophic event: The Vaia Storm https://www.guidedolomiti.com/en/miscellaneous/storm-vaia/ (last access: 4 October 2024), 2024.
Malguzzi, P., Grossi, G., Buzzi, A., Ranzi, R., and Buizza, R.: The 1966 “century” flood in Italy: A meteorological and hydrological revisitation, J. Geophys. Res.-Atmos., 111, https://doi.org/10.1029/2006JD007111, 2006.
Marcos, M., Tsimplis, M. N., and Shaw, A. G. P.: Sea level extremes in southern Europe, J. Geophys. Res.-Oceans, 114, C01007, https://doi.org/10.1029/2008JC004912, 2009.
Međugorac, I. and Pasarić, M.: Exceptionally high sea levels in the northern Adriatic Sea, in: Marine Hazards, Coastal Vulnerability and Risk (mis)Perceptions, CIESM Workshop Monograph n° 52, edited by: Briand, F., CIESM Publisher, Paris, Monaco, 155–165, https://ciesm.org/online/monographs/index.htm (last access: 1 June 2025), 2024.
Međugorac, I., Pasarić, M., and Orlić, M.: Severe flooding along the eastern Adriatic coast: the case of 1 December 2008, Ocean Dynam., 65, 817–830, https://doi.org/10.1007/s10236-015-0835-9, 2015.
Međugorac, I., Pasarić, M., Pasarić, Z., and Orlić, M.: Two recent storm-surge episodes in the Adriatic, Int. J. Saf. Secur. Eng., 6, 589–596, https://doi.org/10.2495/SAFE-V6-N3-589-596, 2016.
Međugorac, I., Orlić, M., Janeković, I., Pasarić, Z., and Pasarić, M.: Adriatic storm surges and related cross-basin sea-level slope, J. Marine Syst., 181, 79–90, https://doi.org/10.1016/j.jmarsys.2018.02.005, 2018.
Međugorac, I., Pasarić, M., and Güttler, I.: Will the wind associated with the Adriatic storm surges change in future climate?, Theor. Appl. Climatol., 143, 1–18, https://doi.org/10.1007/s00704-020-03379-x, 2021.
Međugorac, I., Pasarić, M., and Orlić, M.: Long-term measurements at Bakar tide-gauge station (east Adriatic), Geofizika, 39, 149–162, https://doi.org/10.15233/gfz.2022.39.8, 2022.
Međugorac, I., Pasarić, M., and Orlić, M.: Historical sea-level measurements at Bakar (east Adriatic), SEANOE [data set], https://doi.org/10.17882/85171, 2024a.
Međugorac, I., Jambrošić, K., Dolički, D., Kuzmić, J., Šepić, J., Vrkić Seidl, I., and Gašparac, G.: Adriatic storm surge catalogue, https://projekti.pmfst.unist.hr/floods/storm-surges/, last access: 18 December 2024b.
Medvedev, I. P., Vilibić, I., and Rabinovich, A. B.: Tidal resonance in the Adriatic Sea: observational evidence, J. Geophys. Res.-Oceans, 125, e2020JC016168, https://doi.org/10.1029/2020JC016168, 2020.
Mel, R. A., Coraci, E., Morucci, S., Crosato, F., Cornello, M., Casaioli, M., Mariani, S., Carniello, L., Papa, A., Bonometto, A., and Ferla, M.: Insights on the extreme storm surge event of the 22 November 2022 in the Venice Lagoon, J. Mar. Sci. Eng., 11, 1750, https://doi.org/10.3390/jmse11091750, 2023.
METEOALARM: Early Warnings for Europe, https://www.meteoalarm.org/en/live/ (last access: 1 October 2024), 2024.
Mihanović, H., Vilibić, I., Dunić, N., and Šepić J.: Mapping of decadal middle Adriatic oceanographic variability and its relation to the BiOS regime, J. Geophys. Res.-Oceans, 120, 5615–5630, https://doi.org/10.1002/2015JC010725, 2015.
MorskiHR: Waves the height of a two-story building batter Dubrovnik’s city walls!, https://www.morski.hr/dubrovacke-zidine-lupaju-valovi-visine-dvokatnice/ (last access: 4 November 2024), 9 December 2021.
Morucci, S., Coraci, E., Crosato, F., and Ferla, M.: Extreme events in Venice and in the North Adriatic Sea: 28–29 October 2018, Rend. Lincei Sci. Fis., 31, 113–122, https://doi.org/10.1007/s12210-020-00882-1, 2020.
Mosetti, F.: Problems on storm surges forecasting in the Northern Adriatic Sea, B. Geofis. Teor. Appl., 3, 263–297, 1985.
Novi list: Novi list, front page and page 4, 24 January 1966a.
Novi list: Novi list, pages 5–7, 5/6 November, 1966b.
Novi list: Consequences of the severe sirocco – more than half a billion in damage, page 4, 7 November 1966c.
Novi list: Novi list, pages 5–6, 25 November 1969a.
Novi list: Sea floods passenger waterfront, front page, 26 November 1969b.
Novi list: Novi list, front page and pages 2–3, 27 November 1969c.
Novi list: Novi list, front page and pages 5 and 10, 24 December 1979a.
Novi list: Heavy damage from sirocco wind and high tide, page 12, 25 December 1979b.
Novi list: Commission surveys port damage, page 12, 26 December 1979c.
Novi list: Novi list, front page and page 12, 27 October 1980.
Novi list: Raging sirocco wind, pages 2–8, 3 February 1986.
Novi list: Novi list, front page and page 8, 25 November 1987.
Novi list: Novi list, front page and pages 8 and 13, 11 December 1990.
Novi list: Restaurants flooded, furniture and equipment washed into the sea, page 5, 2 December 2008a.
Novi list: Novi list, page 4, 3 December 2008b.
Novi list: Novi list, page 17, 24 December 2009.
Novi list: Novi list, pages 14–15 and pages 22–23, 2 November 2012.
Novi list: Square flooded from below, back page, 30 October 2018a.
Novi list: Novi list, pages 2–5, 31 October/1 November 2018b.
Novi List: Storm hits Rab: heavy damage in historic center and port, https://projekti.pmfst.unist.hr/floods/storm-surges/episode-26-8-december-2021/ (last access: 4 November 2024), 10 December 2021.
Novi list: Floods and landslides along the coast, storm winds cause major traffic disruptions, https://www.novilist.hr/novosti/hrvatska/diljem-obale-poplave- i-odroni-olujni-vjetar-stvara-velike-probleme-u-prometu (last access: 4 November 2024), 22 November 2022.
Obzor: Severe storm in the Adriatic, page 3, 16 December 1937.
Orlić, M. and Pasarić, M.: Sea-level changes and crustal movements recorded along the east Adriatic coast, Nuovo Cimento C, 23 C, 351–364, 2000.
Orlić, M. and Pasarić, M.: How to disentangle sea-level rise and a number of other processes influencing coastal floods?, Rend. Lincei Sci. Fis., 35, 371–380, https://doi.org/10.1007/s12210-024-01242-z, 2024.
Orlić, M., Pasarić, M., and Pasarić, Z.: Mediterranean sea-level variability in the second half of the twentieth century: a Bayesian approach to closing the budget, Pure Appl. Geophys., 175, 3973–3988, https://doi.org/10.1007/s00024-018-1974-y, 2018.
Otvoreno.hr: Severe storm damages Zadar’s Sea Organ, waves dislodge stone blocks, https://www.otvoreno.hr/vijesti/zbog-jakog-nevremena-ostecene-zadarske-morske-orgulje-valovi-izbacili-kamene-blokove/238611 (last access: 4 November 2024), 24 December 2019.
Pasarić, M.: Variations of sea level in the Adriatic caused by slowly changing air pressure and wind, University of Zagreb, Zagreb, 113 pp., 2000.
Pasarić, M. and Orlić, M.: Long-term meteorological preconditioning of the North Adriatic coastal floods, Cont. Shelf Res., 21, 263–278, https://doi.org/10.1016/S0278-4343(00)00078-9, 2001.
Pasarić, M., Pasarić, Z., and Orlić, M.: Response of the Adriatic sea level to the air pressure and wind forcing at low frequencies (0.01–0.1 cpd), J. Geophys. Res.-Oceans, 105, 11423–11439, https://doi.org/10.1029/2000JC900023, 2000.
Pawlowicz, R., Beardsley, B., and Lentz, S.: Classical tidal harmonic analysis including error estimates in MATLAB using T_TIDE, Comput. Geosci., 28, 929–937, https://doi.org/10.1016/S0098-3004(02)00013-4, 2002.
Pérez-Gómez, B., García-León, M., García-Valdecasas, J., Clementi, E., Mösso Aranda, C., Pérez-Rubio, S., Masina, S., Coppini, G., Molina-Sánchez, R., Muñoz-Cubillo, A., García Fletcher, A., Sánchez González, J. F., Sánchez-Arcilla, A., and Álvarez Fanjul, E.: Understanding sea level processes during Western Mediterranean storm Gloria, Front. Mar. Sci., 8, 647437, https://doi.org/10.3389/fmars.2021.647437, 2021.
Pérez Gómez, B., Vilibić, I., Šepić, J., Međugorac, I., Ličer, M., Testut, L., Fraboul, C., Marcos, M., Abdellaoui, H., Álvarez Fanjul, E., Barbalić, D., Casas, B., Castaño-Tierno, A., Čupić, S., Drago, A., Fraile, M. A., Galliano, D. A., Gauci, A., Gloginja, B., Martín Guijarro, V., Jeromel, M., Larrad Revuelto, M., Lazar, A., Keskin, I. H., Medvedev, I., Menassri, A., Meslem, M. A., Mihanović, H., Morucci, S., Niculescu, D., Quijano de Benito, J. M., Pascual, J., Palazov, A., Picone, M., Raicich, F., Said, M., Salat, J., Sezen, E., Simav, M., Sylaios, G., Tel, E., Tintoré, J., Zaimi, K., and Zodiatis, G.: Coastal sea level monitoring in the Mediterranean and Black seas, Ocean Sci., 18, 997–1053, https://doi.org/10.5194/os-18-997-2022, 2022.
Pervan, M., and Šepić, J.: Analysis of the eastern Adriatic sea level extremes, St Open, 4, 1–19, https://doi.org/10.48188/so.4.10, 2023.
Pinardi, N., Bonaduce, A., Navarra, A., Dobricic, S., and Oddo, P.: The mean sea level equation and its application to the Mediterranean Sea, J. Climate, 27, 442–447, https://doi.org/10.1175/JCLI-D-13-00139.1, 2014.
Pirazzoli, P. A.: Recent sea-level changes and related engineering problems in the Lagoon of Venice (Italy), Prog. Oceanogr., 18, 323–346, https://doi.org/10.1016/0079-6611(87)90038-3, 1987.
Portal Istra Terra Magica: Severe storm hits Istrian coast - sea in Pula rises by 60 cm, https://www.istriaterramagica.eu/novosti/jako-nevrijeme-diljem-istarske-obale-u-puli-more-poraslo-za-cak-60-cm/ (last access: 4 November 2024), 22 November 2022.
Primorske novine: Storm in Dalmatia, 17 December 1937.
Pugh, D. T. and Thompson, K. R.: The subtidal behaviour of the Celtic Sea—I. Sea level and bottom pressures, Cont. Shelf Res., 5, 293–319, https://doi.org/10.1016/0278-4343(86)90001-4, 1986.
Radio Dalmacija: Split: Stormy sirocco topples trees, scaffolding board falls on passerby, https://www.radiodalmacija.hr/split-olujno-jugo-rusilo-stabla-daska-sa-skele-pala-na-prolaznika/ (last access: 4 November 2024), 9 December 2021.
Raicich, F., Orlic, M., and Malacic, V.: A case study of the Adriatic seiches (December 1997), Nuovo Cimento C, 22C, 1999.
Roland, A., Cucco, A., Ferrarin, C., Hsu, T.-W., Liau, J.-M., Ou, S.-H., Umgiesser, G., and Zanke, U.: On the development and verification of a 2-D coupled wave-current model on unstructured meshes, J. Marine Syst., 78, S244–S254, https://doi.org/10.1016/j.jmarsys.2009.01.026, 2009.
Rožić, N.: Hrvatski transformacijski model visina, State Geodetic Directorate, https://www.cropos.hr/files/docs/Izvjesca_o_znanstveno_strucnim_projektima_2006_2008.pdf#page=23 (last access: 4 November 2024), 2009.
Ruić, K., Šepić, J., Mlinar, M., and Međugorac, I.: Contribution of high-frequency (T < 2 h) sea level oscillations to the Adriatic sea level maxima, Nat. Hazards, 116, 3747–3777, https://doi.org/10.1007/s11069-023-05834-0, 2023.
Rus, M., Fettich, A., Kristan, M., and Ličer, M.: HIDRA2: deep-learning ensemble sea level and storm tide forecasting in the presence of seiches – the case of the northern Adriatic, Geosci. Model Dev., 16, 271–288, https://doi.org/10.5194/gmd-16-271-2023, 2023.
Rus, M., Mihanović, H., Ličer, M., and Kristan, M.: HIDRA3: a deep-learning model for multipoint ensemble sea level forecasting in the presence of tide gauge sensor failures, Geosci. Model Dev., 18, 605–620, https://doi.org/10.5194/gmd-18-605-2025, 2025.
Schwab, D. J. and Rao, D. B.: Barotropic oscillations of the Mediterranean and Adriatic Seas, Tellus A, 35A, 417–427, https://doi.org/10.1111/j.1600-0870.1983.tb00216.x, 1983.
Šepić, J., Orlić, M., and Vilibić, I.: The Bakar Bay seiches and their relationship with atmospheric processes, Acta Adriat., 49, 107–123, 2008.
Šepić, J., Pasarić, M., Međugorac, I., Vilibić, I., Karlović, M., and Mlinar, M.: Climatology and process-oriented analysis of the Adriatic sea level extremes, Prog. Oceanogr., 209, 102908, https://doi.org/10.1016/j.pocean.2022.102908, 2022.
Šibenski: Storm claims a life: man (66) fell into sea while tying boat, daughter pulled him out but rescue was impossible, https://sibenski.slobodnadalmacija.hr/sibenik/vijesti/crna-kroni ka/nevrijeme-odnijelo-i-jedan-zivot-muskarac-66-htio-priveza ti-brod-pa-upao-u-more-kcer-ga-izvukla-ali-spasa-mu-nije-bilo- 639916 (last access: 4 November 2024), 24 December 2019.
Šibenski portal Moć komunikacije: Brodarica unrecognizable: sea floods nearly all piers and quays, strong sirocco scatters gravel across the road, https://mok.hr/vijesti/item/36413-neprepoznatljiva-brodarica-more-poplavilo-gotovo-sva-mula-i-rivice-jako-jugo-na-cestu-izbacilo-sljunak (last access: 4 November 2024), 22 November 2022.
Slivinski, L. C., Compo, G. P., Whitaker, J. S., Sardeshmukh, P. D., Giese, B. S., McColl, C., Allan, R., Yin, X., Vose, R., Titchner, H., Kennedy, J., Spencer, L. J., Ashcroft, L., Brönnimann, S., Brunet, M., Camuffo, D., Cornes, R., Cram, T. A., Crouthamel, R., Domínguez-Castro, F., Freeman, J. E., Gergis, J., Hawkins, E., Jones, P. D., Jourdain, S., Kaplan, A., Kubota, H., Blancq, F. L., Lee, T.-C., Lorrey, A., Luterbacher, J., Maugeri, M., Mock, C. J., Moore, G. W. K., Przybylak, R., Pudmenzky, C., Reason, C., Slonosky, V. C., Smith, C. A., Tinz, B., Trewin, B., Valente, M. A., Wang, X. L., Wilkinson, C., Wood, K., and Wyszyński, P.: Towards a more reliable historical reanalysis: Improvements for version 3 of the Twentieth Century Reanalysis system, Q. J. Roy. Meteor. Soc., 145, 2876–2908, https://doi.org/10.1002/qj.3598, 2019.
Slobodna Dalmacija: Slobodna Dalmacija, page 3, 26 December 1958.
Slobodna Dalmacija: Slobodna Dalmacija, pages 3 and 6, 27 November 1969.
Slobodna Dalmacija: Severe sirocco hits, front page, 24 December 1979a.
Slobodna Dalmacija: Storm hits Orebić: Trstenica beach damaged, page 3, 25 December 1979b.
Slobodna Dalmacija: Slobodna Dalmacija, page 4, 27 October 1980.
Slobodna Dalmacija: Slobodna Dalmacija, page 3, 3 February 1986.
Slobodna Dalmacija: Slobodna Dalmacija, pages 3 and 7, 26 November 1987.
Slobodna Dalmacija: Slobodna Dalmacija, page 4, 11 December 1990.
Slobodna Dalmacija: Slobodna Dalmacija, front page and pages 4–5, 2 December 2008.
Slobodna Dalmacija: Slobodna Dalmacija, pages 6–7, 4 December 2010.
Slobodna Dalmacija: Slobodna Dalmacija, pages 13 and 16, 2 November 2012a.
Slobodna Dalmacija: Slobodna Dalmacija, pages 14–15, 3 November 2012b.
Slobodna Dalmacija: Floods cannot be faced in sneakers, page 2, 30 October 2018a.
Slobodna Dalmacija: Slobodna Dalmacija, pages 18–21, 31 October/1 November 2018b.
Slobodna Dalmacija: Slobodna Dalmacija, https://projekti.pmfst.unist.hr/floods/storm-surges/episode-24-23-december-2019/ (last access: 4 November 2024), 25 December 2019.
Storm Barra – Copernicus: Image of the day: Storm Barra, https://www.copernicus.eu/hr/node/11329 (last access: 28 July 2024), 2024.
Stravisi, F. and Marussi, S. A.: Analysis of a storm surge in Adriatic Sea by means of a 2-dimensional linear-model, Atti Accad. Naz. Lin., 54, 243–260, 1973.
Toomey, T., Amores, A., Marcos, M., and Orfila, A.: Coastal sea levels and wind-waves in the Mediterranean Sea since 1950 from a high-resolution ocean reanalysis, Front. Mar. Sci., 9, 991504, https://doi.org/10.3389/fmars.2022.991504, 2022.
Tosi, L., Teatini, P., and Strozzi, T.: Natural versus anthropogenic subsidence of Venice, Sci. Rep.-UK, 3, 2710, https://doi.org/10.1038/srep02710, 2013.
Trigo, I. F. and Davies, T. D.: Meteorological conditions associated with sea surges in Venice: a 40 year climatology, Int. J. Climatol., 22, 787–803, https://doi.org/10.1002/joc.719, 2002.
Trincardi, F., Barbanti, A., Bastianini, M., Cavaleri, L., and Chiggiato, J.: The 1966 flooding of Venice: what time taught us for the future, Oceanography, 29, 178–186, https://doi.org/10.5670/oceanog.2016.87, 2016.
Vatrogasni portal: Kantrida Stadium left completely underwater, https://www.vatrogasni-portal.com/news.php?readmore=4081 (last access: 4 November 2024), 25 December 2009.
Večernji list: Večernji list, front page and page 7, 5 November 1966a.
Večernji list: Večernji list, page 6, 7 November 1966b.
Večernji list: Večernji list, front page and page 11, 24 January 1966c.
Večernji list: Večernji list, front page and page 5, 4 November 1968.
Večernji list: Storms, snow, and colder weather, page 3, 28/29/30 November 1969.
Večernji list: Večernji list, back page, 24 December 1979.
Večernji list: Večernji list, front page and page 6, 27 October 1980.
Večernji list: Breakwater breached, boats submerged, page 5, 11 December 1990.
Večernji list: Večernji list, pages 8–9, 2 December 2008.
Večernji list: Severe sirocco submerges boats, page 4, , 31 October/1 November 2018.
Venice Municipality: Exceptional high waters, https://www.comune.venezia.it/it/content/le-acque-alte-eccezionali (last access: 1 October 2024), 2024.
Vjesnik: Severe sirocco hits the Adriatic, page 5, 5 November 1966.
Vjesnik: Sea level rises by as much as 117 centimeters, page 5, 2 December 2008.
Vjesnik: Defensive embankment construction in Metković to start this spring, page 7, 4/5 December 2010.
Volkov, D. L., Baringer, M., Smeed, D., Johns, W., and Landerer, F. W.: Teleconnection between the Atlantic meridional overturning circulation and sea sevel in the Mediterranean Sea, J. Climate, 32, 935–955, https://doi.org/10.1175/JCLI-D-18-0474.1, 2019.
Zadarski.hr: In just 30 seconds, a waterspout left real devastation – tearing off roofs, toppling trees …, https://zadarski.slobodnadalmacija.hr/zadar/fotoreport/pijavica- za-svega-30-sekundi-ostavila-pravu-pustos-rusila-krovove-lomila-stabla-639948 (last access: 4 November 2024), 23 December 2019.
Zampato, L., Bajo, M., Canestrelli, P., and Umgiesser, G.: Storm surge modelling in Venice: two years of operational results, J. Oper. Oceanogr., 9, s46–s57, https://doi.org/10.1080/1755876X.2015.1118804, 2016.
Žust, L., Fettich, A., Kristan, M., and Ličer, M.: HIDRA 1.0: deep-learning-based ensemble sea level forecasting in the northern Adriatic, Geosci. Model Dev., 14, 2057–2074, https://doi.org/10.5194/gmd-14-2057-2021, 2021.
- Abstract
- Introduction
- Data and past studies
- Methodology
- Descriptions of extreme episodes
- General properties and temporal distribution of SL extremes
- Conclusions
- Appendix A
- Data availability
- Author contributions
- Competing interests
- Disclaimer
- Special issue statement
- Acknowledgements
- Financial support
- Review statement
- References