the Creative Commons Attribution 4.0 License.
the Creative Commons Attribution 4.0 License.
 | 17 Oct 2025
Mechanism of delayed storm surges in straits: seiche-induced oscillations triggered by typhoon passage
Shinichiro Ozaki
Yoshihiko Ide
Masaru Yamashiro
Storm surges are typically driven by a combination of low atmospheric pressure and strong winds associated with typhoons, with the maximum surge often occurring near the time of the typhoon's closest approach. However, during Typhoon Maysak (2020), delayed flooding was observed along the northern coast of Kyushu Island (NCKI), approximately 10 h after the typhoon had passed. By that time, both atmospheric pressure and wind intensity had substantially weakened, indicating that conventional mechanisms – such as wind setup and the inverted barometer effect – could not fully account for the phenomenon. This study explores the mechanisms behind delayed storm surges along the NCKI through a combination of observational data analysis, storm surge simulations, and continuous wavelet transform (CWT) analysis. The results reveal that typhoons passing through the western channel of the Tsushima Strait (WCTS) frequently generate a double-peaked storm surge anomaly, with the second peak being both larger and longer-lasting than the first. Spectral analysis identified dominant oscillations with periods of approximately 5 and 10 h, corresponding to natural modes of the Tsushima Strait. These oscillations, interpreted as low-mode seiches, are excited by the release of potential energy trapped within the strait once the external forcing has subsided. Notably, the 5 h mode appears to be strongly influenced by the Coriolis effect. Our findings reveal a previously unrecognized storm surge mechanism in which significant surges occur not during but after a typhoon’s passage through a strait. This delayed response arises from resonant amplification caused by modal oscillations within the strait, particularly in cases where typhoon tracks curve westward. The study underscores the critical roles of strait geometry, natural oscillation modes, and the timing of external forcing in shaping storm surge behavior. These insights extend beyond the NCKI and are relevant to other semi-enclosed strait regions worldwide that exhibit similar meteorological and geographical characteristics, even though the extent of influence from oscillation modes, periods, and amplitudes may vary depending on the strait's horizontal scale, water depth, and latitude.
- Article
(15347 KB) - Full-text XML
- BibTeX
- EndNote


Storm surges are events in which sea levels rise significantly due to low atmospheric pressure and strong winds, typically associated with typhoons. When a storm surge occurs, it can rapidly inundate low-lying coastal areas, causing widespread flooding. Climate projections that incorporate the effects of global warming indicate that storm surge heights are likely to increase globally (Balaguru et al., 2016; Yang et al., 2020; Mori et al., 2022). To reduce the damage caused by storm surges, it is vital to implement both structural measures, such as storm surge barriers (Esteban et al., 2014), and non-structural measures, such as real-time forecasting systems (Igarashi and Tajima, 2021). A comprehensive understanding of storm surge dynamics is therefore crucial for developing effective protection strategies.
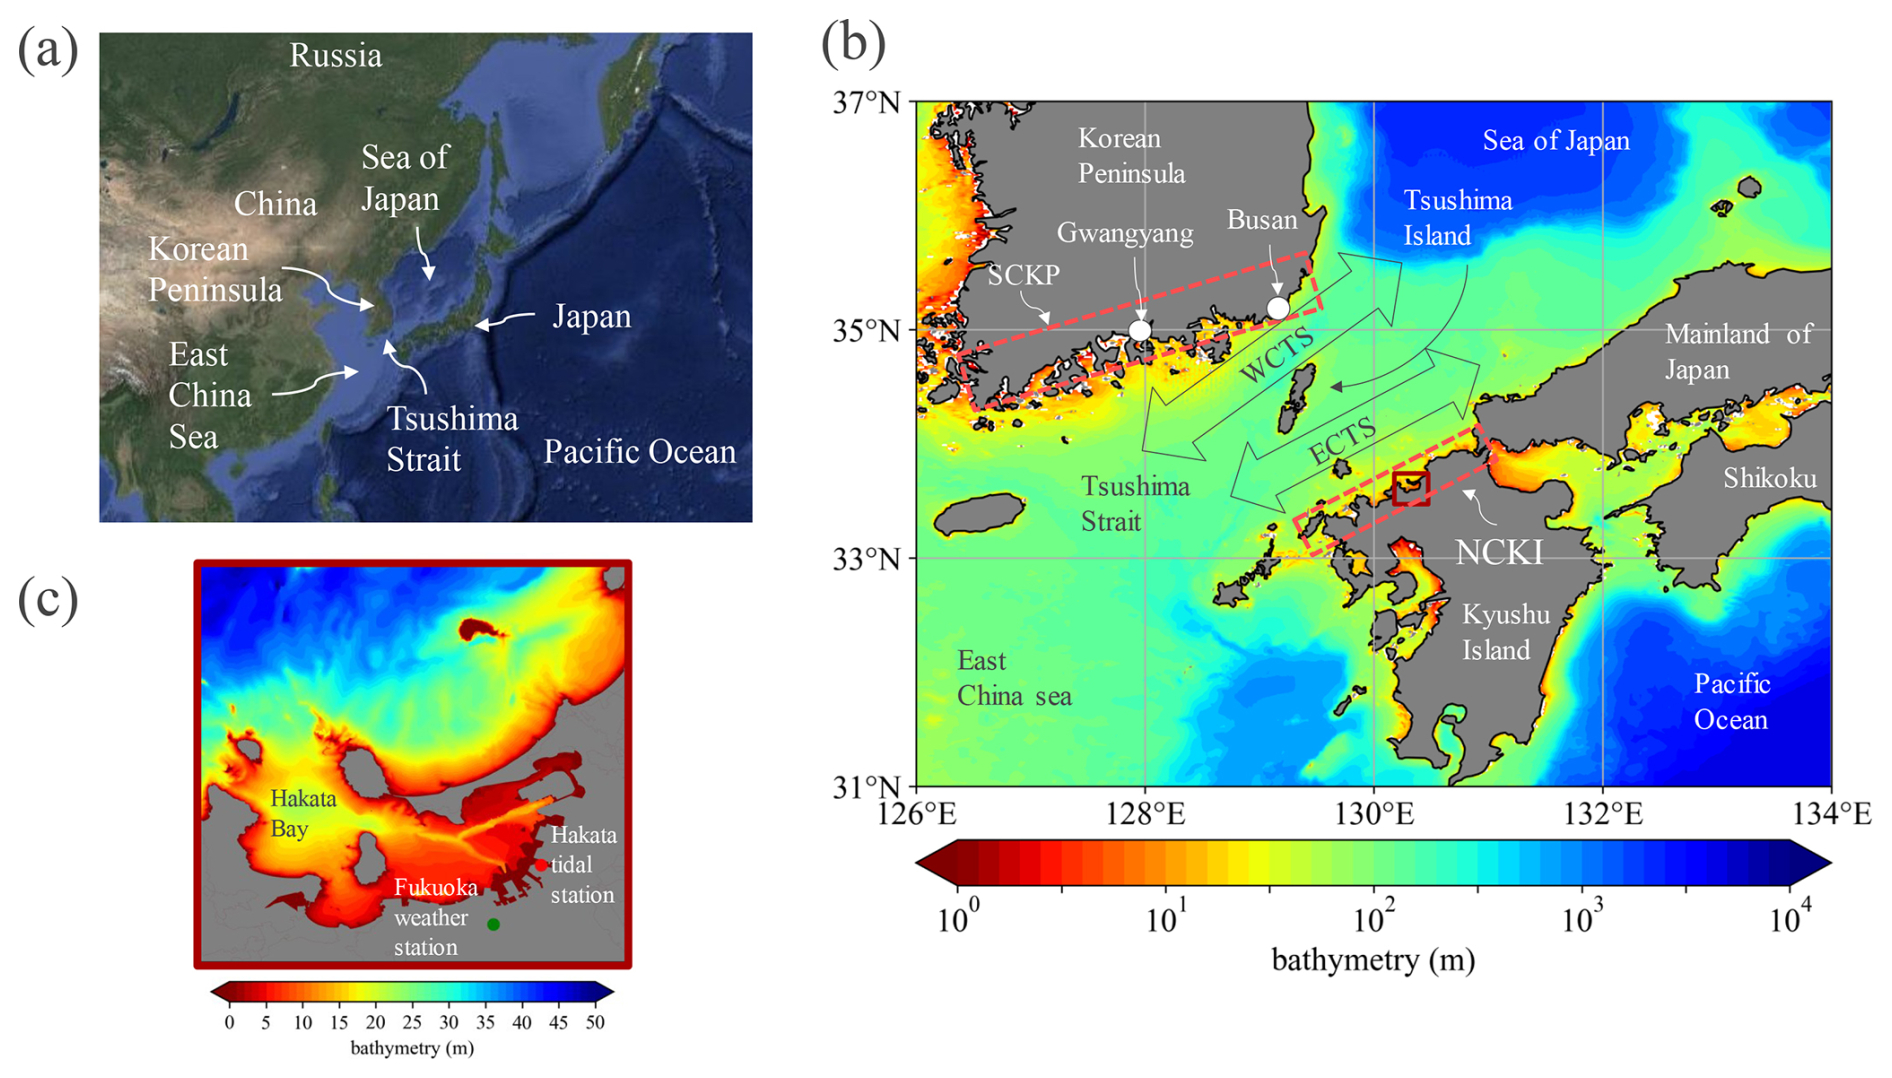
Figure 1Bathymetric maps illustrating the geographical context and study regions. (a) Regional map displaying the Northwest Pacific. (b) Magnified view showing the detailed bathymetry of the Tsushima Strait. (c) Close-up view presenting the bathymetry within Hakata Bay. Base map imagery: © Google Maps 2025.
Several widely accepted mechanisms explain the generation of storm surges. The inverted barometer effect accounts for sea level rise caused by low atmospheric pressure (Wunsch and Stammer, 1997), while wind setup refers to the rise in sea level due to strong winds forcing seawater shoreward (Walton and Dean, 2009). This occurs when coastal winds drive surface water toward the shore, causing accumulation in shallow regions and elevating the local sea level. Wave setup, in contrast, results from wave breaking and radiation stress (Wu et al., 2018). These mechanisms are typically most pronounced when a typhoon is closest to the target area, as wind speeds and pressure gradients peak during this time. Additional causes of storm surges include Ekman setup, wherein sustained winds blowing parallel to the coast induce shoreward water transport via the Coriolis effect (Kim et al., 2010; Shen and Gong, 2009), and the propagation of shelf waves, which carry elevated water levels along the coast after the storm (Kennedy et al., 2011). Among these mechanisms, wind setup is generally recognized as the primary contributor to storm surge height. The magnitude of wind setup is directly proportional to the wind fetch and inversely proportional to water depth. Regions most vulnerable to major storm surges often include ocean-facing bays with geographical features that amplify wind-driven water accumulation (Bilskie et al., 2016; Bhaskaran et al., 2020; Nakajo et al., 2015; Ide et al., 2020). Significantly, even in straits with relatively short fetch lengths, substantial storm surges can still occur due to wind setup. For instance, in East Asia, the Tsushima Strait is a significant waterway located within the Northwest Pacific region (Fig. 1a). This strait is frequently impacted by typhoons. These typhoons often track northeast through the strait before either making landfall along the southern coast of the Korean Peninsula (SCKP) (Fig. 1b) or continuing into the Sea of Japan. Typhoon Sanba – the strongest typhoon of 2012 – passed through the Tsushima Strait, bringing maximum instantaneous wind speeds exceeding 20 m s−1 and storm surge heights over 100 cm at Gwangyang (Fig. 1b), near the center of the SCKP region (Yoon et al., 2014). Typically, when a typhoon traverses the western channel of the Tsushima Strait (WCTS), a significant storm surge is observed along the SCKP, primarily driven by wind setup. As illustrated in Fig. 2a, when the typhoon is centered over the strait, the counterclockwise wind circulation characteristic of Northern Hemisphere typhoons generates strong onshore winds directed toward the SCKP. This results in substantial wind-driven water accumulation. Additionally, the surge is further enhanced by the inverted barometer effect, which raises the sea level under conditions of low atmospheric pressure.
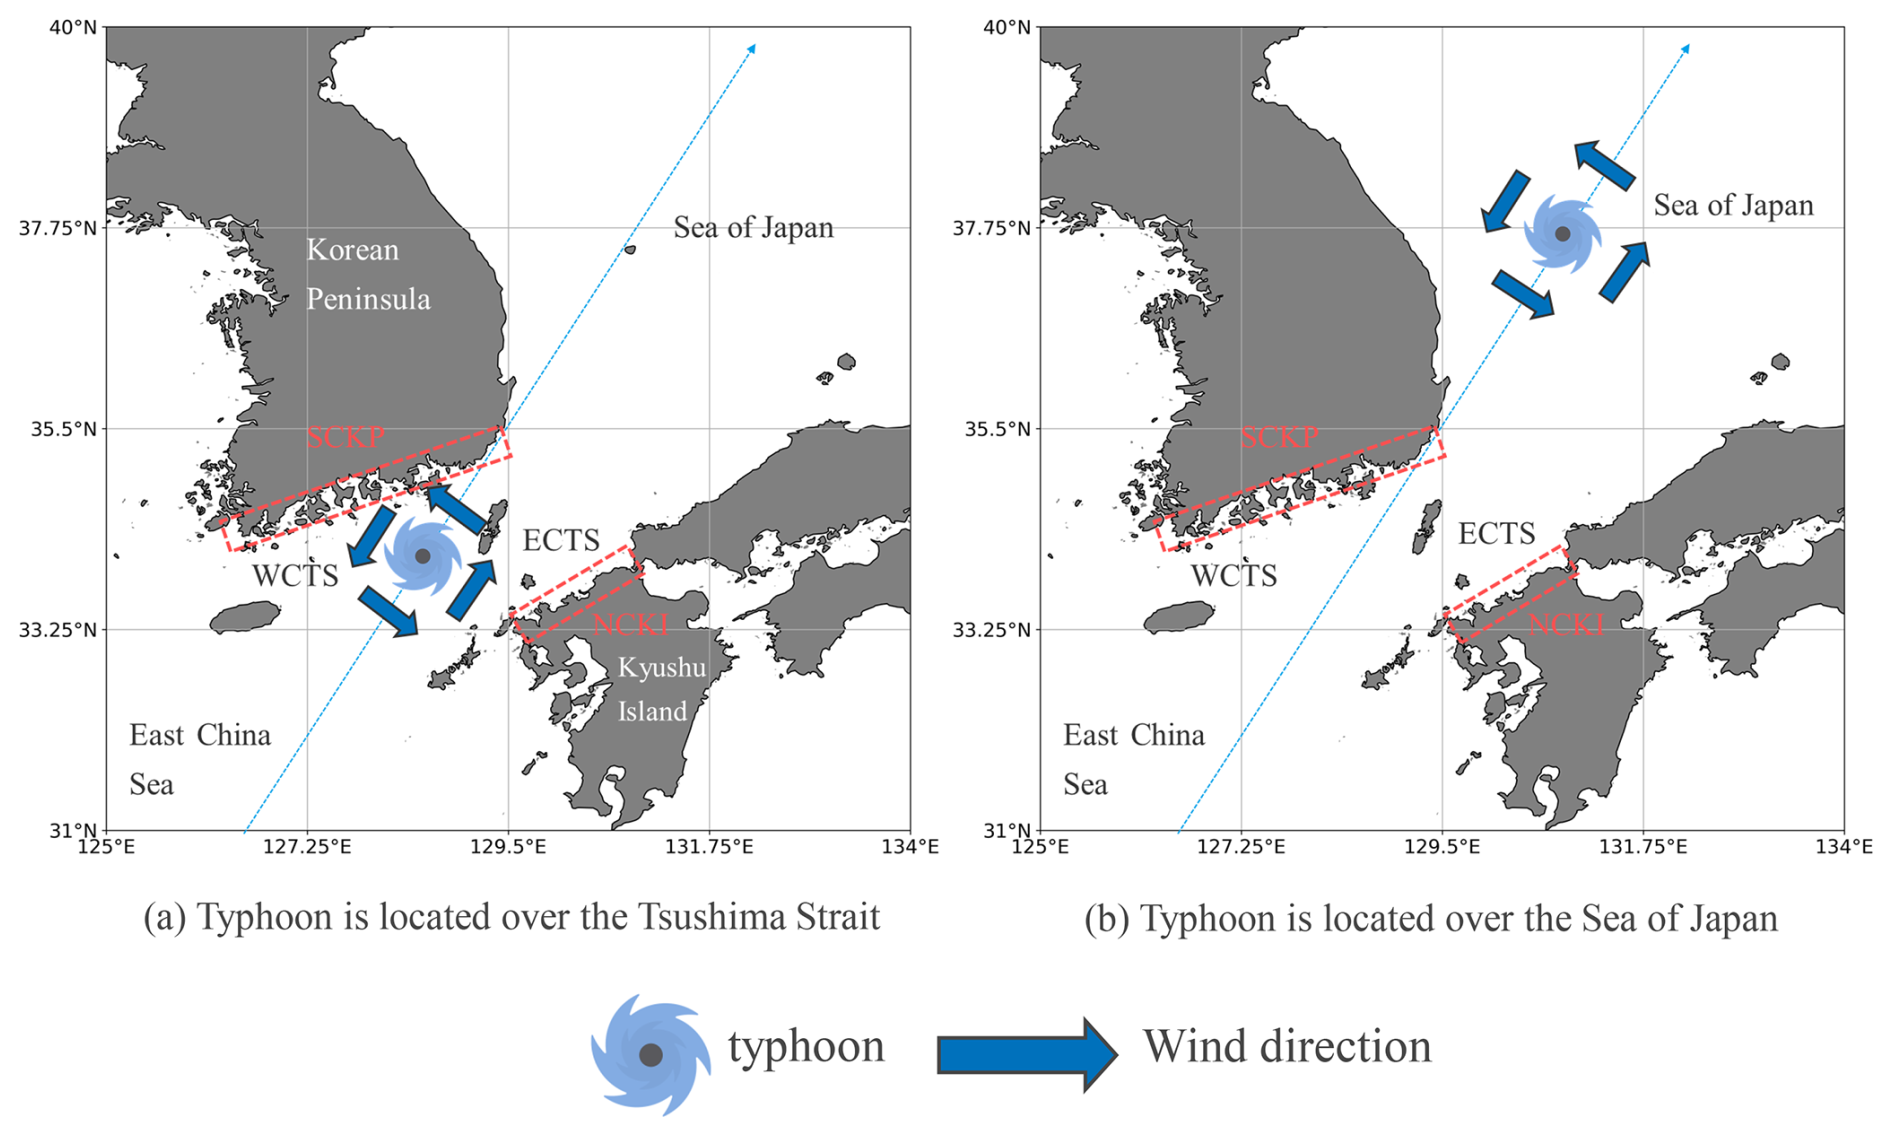
Figure 2Schematic figure of typhoon positions and wind directions during its passage through the WCTS: (a) when the typhoon is located over the Tsushima Strait; (b) when the typhoon is located over the Sea of Japan.
On the northern coast of Kyushu Island (NCKI) (Fig. 1b), which lies across the Tsushima Strait from the SCKP, significant storm surges are generally considered unlikely during typhoon approaches. When a typhoon is located over the Tsushima Strait, southwesterly winds typically prevail over the NCKI (Fig. 2a). Because the winds drive seawater away from the coast, the local sea level tends to drop – opposite to the rise observed along the SCKP. However, during Typhoon Maysak (2020), widespread inundation occurred along the NCKI, causing flooding and major traffic disruptions (Niimi et al., 2022). Although Typhoon Maysak passed through the WCTS, it did not make landfall on the NCKI (see Fig. 3). Notably, flooding occurred approximately 10 h after the typhoon's closest approach – by which time the typhoon had already moved more than 600 km away. Typically, once a typhoon enters the Sea of Japan after passing through the Tsushima Strait, its influence on the NCKI diminishes: strong winds subside (Fig. 2b), and atmospheric pressure returns to near-normal sea level conditions. Therefore, the storm surge observed in this event cannot be attributed to the typical storm surge mechanisms such as wind setup, wave setup, or the inverted barometer effect, as the local pressure had risen to around 1000 hPa and no strong winds were present at the time of inundation. Previous studies have suggested that delayed storm surges along the NCKI may be linked to oscillatory responses within the Tsushima Strait (Hong and Yoon, 1992; Niimi et al., 2022). While storm surge dynamics have been studied in other straits, such as the Taiwan Strait (Zhang et al., 2010), the Strait of Georgia (Soontiens et al., 2016), and the Singapore Strait (Tkalich et al., 2013), these investigations do not report delayed surge responses following typhoon passage. In contrast, the Tsushima Strait appears to exhibit a unique behavior: storm surges can occur several hours after a typhoon has passed, likely due to natural oscillations within the strait.
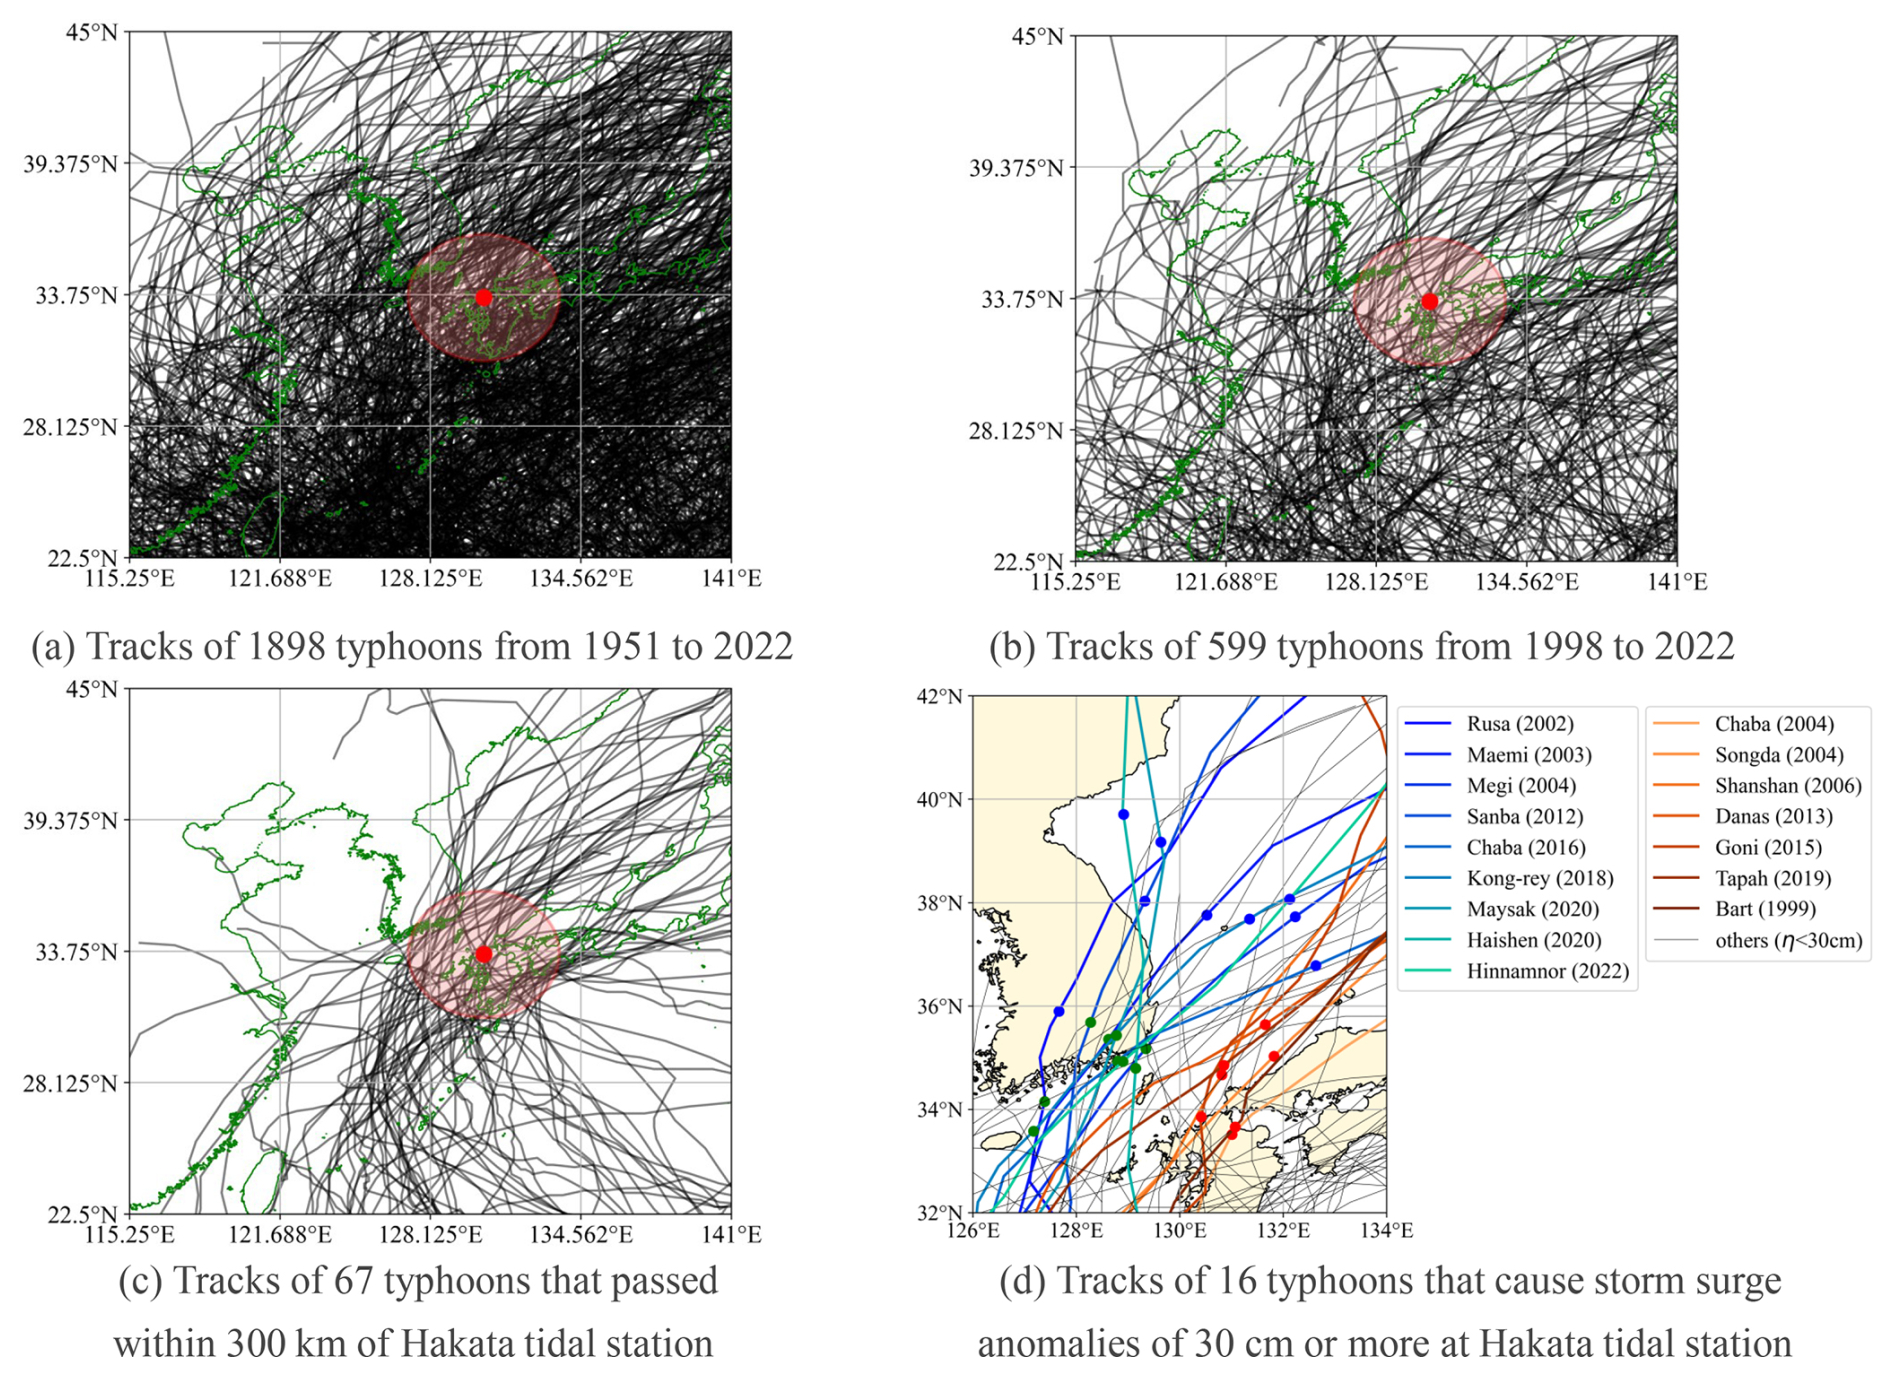
Figure 3Tracks of selected typhoons in this study. (a) Tracks of 1898 typhoons recorded by JMA from 1951 to 2022. (b) Tracks of 599 typhoons that occurred between 1998 and 2022, during which tide-level observations were available at the Hakata tidal station. (c) Tracks of 67 typhoons that passed within a 300 km radius of the Hakata tidal station. (d) Tracks of 16 typhoons that caused storm surge anomalies of 30 cm or more at the Hakata tidal station between 1999 and 2022. In panels (a)–(c), black curves represent typhoon tracks, the red dot indicates the location of the Hakata tidal station, and the red circle marks the 300 km radius around the station. In panel (d), red and blue lines show the tracks of the 16 typhoons that generated significant storm surge anomalies. Red lines correspond to ECTS-type typhoons, while blue lines correspond to WCTS-type typhoons. The remaining typhoons are shown by black lines. For WCTS-type typhoons, green dots indicate the timing of the first surge peak at the Hakata tidal station, and blue dots indicate the second peak. For ECTS-type typhoons, red dots indicate the timing of the maximum storm surge anomaly (as referenced by arrows in Fig. 4).
Although storm surges along the NCKI have been documented in previous studies, the delayed occurrence of these surges following typhoon passage through the WCTS remains insufficiently understood. This study offers new insights into the phenomenon by highlighting the role of coastal topography in generating delayed surge responses. To investigate this, we analyzed multiple typhoon events from the past two decades, aiming to elucidate the mechanisms underlying post-passage surge increases, using the Tsushima Strait as a representative case study. Our analysis integrates observational records, numerical storm surge simulations, and spectral analysis via wavelet transforms. Through this approach, we identified dominant oscillation modes with periods of approximately 10 and 5 h that were consistently present during delayed storm surge events.
The structure of this paper is organized as follows. Section 2 describes the geographical and oceanographic characteristics of the Tsushima Strait. Section 3 introduces the selected typhoons analyzed in this study. Section 4 presents the analysis of observed storm surges and meteorological data. Section 5 outlines the numerical simulations conducted to reproduce the storm surge behavior. Section 6 explains the application of the continuous wavelet transform (CWT) for spectral analysis of the simulated results. Section 7 discusses the physical mechanisms behind the observed phenomena. Finally, Sect. 8 summarizes the main findings and implications of this study.
The Tsushima Strait, located in the Northwest Pacific region as shown in Fig. 1a, is situated in East Asia between the Korean Peninsula to the northwest and Kyushu Island in Japan to the southeast (Fig. 1b). This strait is a typical typhoon-prone region, particularly during the summer months, and frequently experiences strong winds and storm surges associated with typhoon passages. The average water depth of the strait is approximately 80 m. The strait connects two major bodies of water: the Sea of Japan to the north and the East China Sea to the south. The Sea of Japan is characterized by deep waters, while the East China Sea is comparatively shallow. This stark depth contrast contributes to the complex oceanographic dynamics within the strait. Tsushima Island is located in the center of the strait (Fig. 1b), dividing it into two distinct channels: the WCTS, located between Tsushima Island and the SCKP, and the eastern channel of the Tsushima Strait (ECTS), located between Tsushima Island and the NCKI. Of the two, the WCTS is slightly deeper and plays a more significant role in water exchange and current dynamics across the strait.
Hakata Bay, located in the central part of the NCKI, is shown in Fig. 1c. The surrounding area includes Fukuoka City, one of the most densely populated urban centers in the region. The bay extends approximately 20 km east–west and 10 km north–south, forming a semi-enclosed coastal basin. The Hakata tidal station, situated on the eastern side of the bay, has provided continuous sea level records since 1998. Additionally, the Fukuoka weather station, located on the southern side of the bay, continuously monitors atmospheric pressure, wind speed, and wind direction.
We selected various typhoons for analysis through the following process. The tracks of the selected typhoons are shown in Fig. 3. First, we obtained best track data for 1898 typhoons recorded from 1951 to 2022 by the Japan Meteorological Agency (2024). The full set of typhoon tracks is shown in Fig. 3a. Next, we identified 599 typhoons that occurred between 1998 and 2022, during which tide-level data were available at the Hakata tidal station (Fig. 3b). From this subset, we then selected 67 typhoons whose tracks passed within a 300 km radius of the Hakata tidal station for detailed analysis (Fig. 3c). To calculate storm surge anomalies associated with the 67 selected typhoons, we used the following method. First, sea surface elevation data sampled at 30 s intervals from 1998 to 2022 were obtained from the Hakata tidal station via the Regional Delayed Mode Data Base (JODC, 2022). Second, we performed harmonic analysis on the observed data using the pytides 0.0.4 package (Cox, 2022) to extract tidal constituents, including Z0, M2, S2, K1, O1, and others – a total of 39 components. Third, storm surge anomalies were calculated by subtracting the reconstructed astronomical tide from the observed sea surface elevation. To remove interannual variability, we computed the average anomaly at the time of typhoon approach for each year and subtracted this mean value. Finally, we identified 16 typhoons that produced maximum storm surge anomalies of 30 cm or greater at the Hakata tidal station (Fig. 3d).
The selected typhoons can be categorized into two types based on their tracks around the Tsushima Strait: WCTS-type and ECTS-type typhoons. WCTS-type typhoons follow a path from the SCKP through the WCTS, approaching the Hakata area from the northwest. This category includes typhoons Rusa (2002), Maemi (2003), Megi (2004), Sanba (2012), Chaba (2016), Kong-rey (2018), Maysak (2020), Haishen (2020), and Hinnamnor (2022). ECTS-type typhoons, on the other hand, move from the ECTS toward the NCKI, generally approaching from the northeast. This group includes typhoons Bart (1999), Chaba (2004), Songda (2004), Shanshan (2006), Danas (2013), Goni (2015), and Tapah (2019). These two classifications are used throughout the following analysis.
We examined the observed data, such as storm surge anomalies, wind, and atmospheric pressure, and categorized them according to the typhoon tracks. The black lines in Fig. 4 show the time series of storm surge anomalies acquired at the Hakata tidal station for both WCTS-type and ECTS-type typhoons.
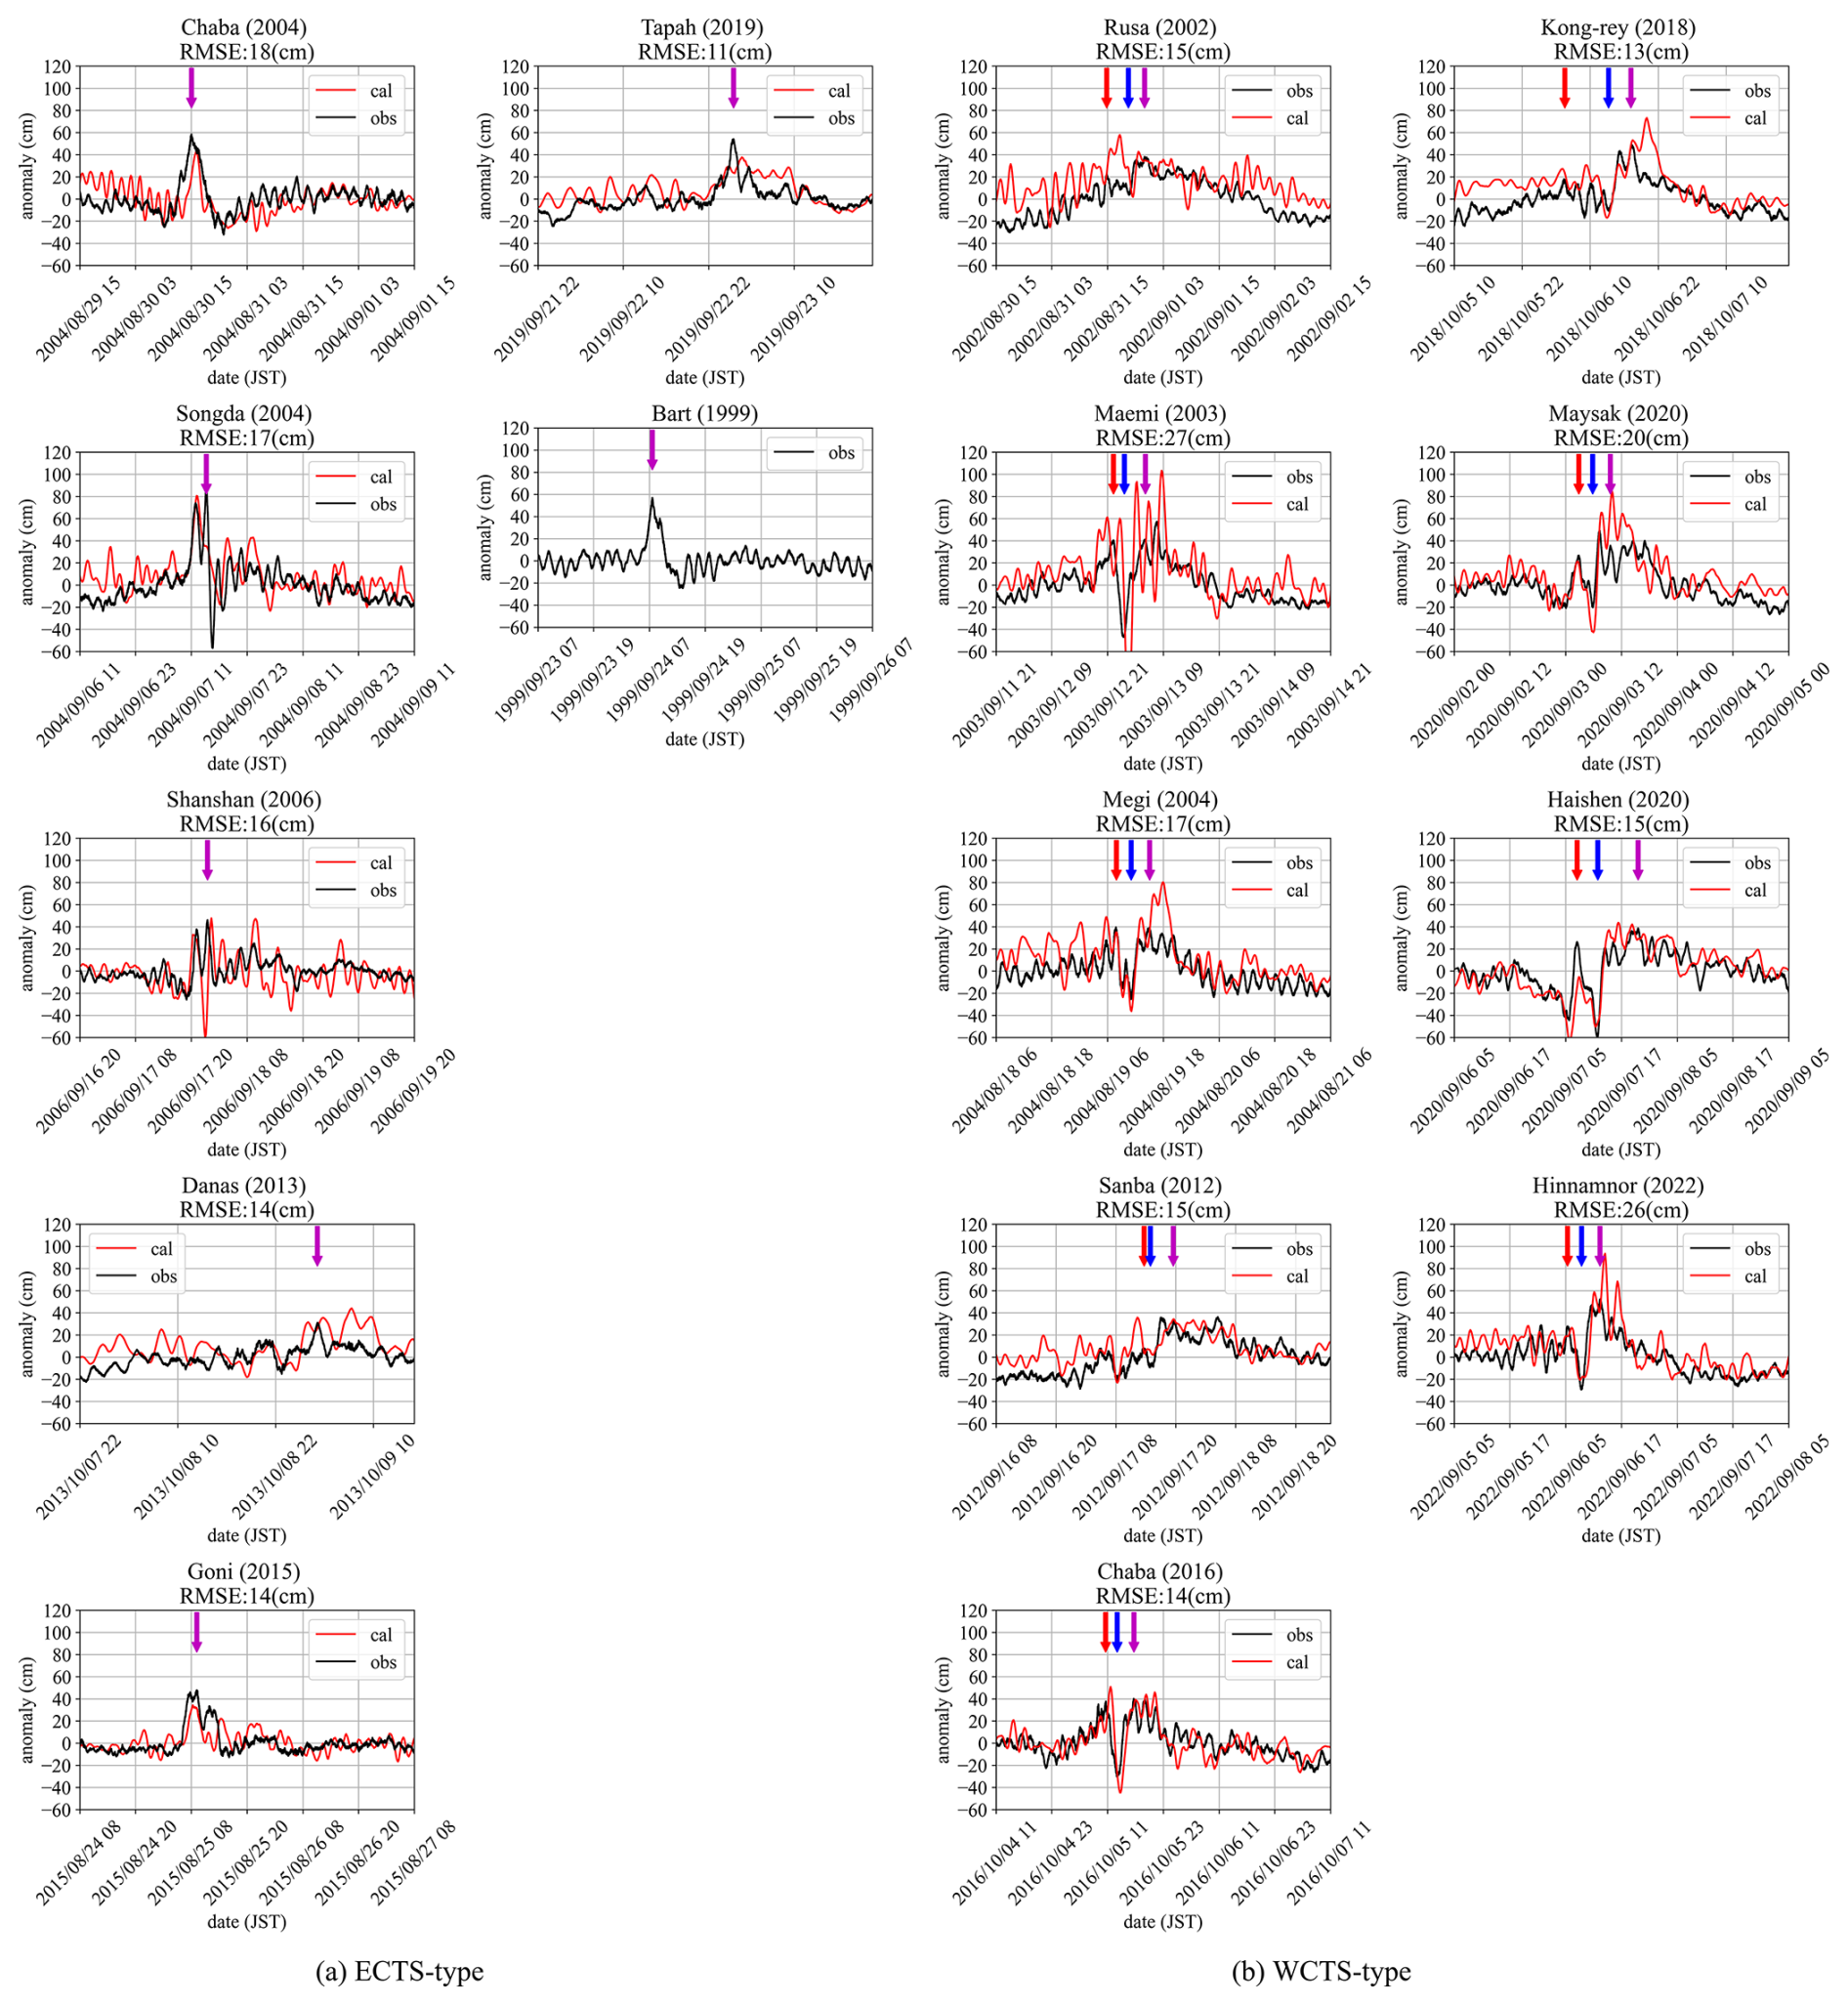
Figure 4Time series of storm surge anomalies at the Hakata tidal station for (a) ECTS-type and (b) WCTS-type typhoons. The black curve represents the observed storm surge anomaly, while the red curve shows the simulated anomaly. Red, blue, and purple arrows indicate the timing of the first peak, local minimum, and second peak (or maximum), respectively.
Storm surge anomalies during ECTS-type typhoons tend to rise sharply over a short period (indicated by the purple arrows in Fig. 4a). Typhoons Chaba (2004) and Bart (1999) exhibit a single peak in the storm surge anomaly, while Songda (2004), Shanshan (2006), Goni (2015), and Tapah (2019) display a second peak occurring within approximately 2 h before or after the initial maximum. These double peaks are the result of a 2 h oscillation of the bay water in Hakata Bay, as previously reported by Yamashiro et al. (2016). Similar oscillatory responses may have occurred during Chaba (2004) and Bart (1999), although these were not clearly observed in tide-gauge records – possibly due to differences in typhoon translation speed or the timing of pressure variations. Among these cases, Typhoon Danas (2013) generated a relatively small maximum tidal anomaly and showed a more gradual temporal variation. Although Danas tracked directly over Tsushima Island, the presence of only one prominent peak in its time series of the storm surge anomaly led to its classification as an ECTS-type event in this study. Similarly, Typhoon Holly (1984), which passed through the central Tsushima Strait, produced a modest peak and gentle fluctuation at the Hakata tidal station (Hong and Yoon, 1992). A detailed investigation into the surge-generation mechanisms of these two typhoons is left for future work.
The positions of the ECTS-type typhoons at the times indicated by the purple arrows in Fig. 4a are marked with red dots along their tracks in Fig. 3d. The peak storm surge anomaly is observed just after the typhoon passes over Hakata Bay. As a representative ECTS typhoon, Fig. 5a shows the time series of the wind and air pressure at the Fukuoka weather station (see Fig. 1c) during Goni (2015). At 08:00 LT on 25 August 2015, when the storm surge anomaly reaches its maximum, the air pressure also drops to its minimum value of 970 hPa, and a northerly wind is observed (purple arrows in Fig. 5a). These observations indicate that the rapid rise in storm surge anomalies during ECTS-type typhoons can be attributed to a combination of the inverted barometer effect and wind setup. As these typhoons pass close to Hakata Bay, the sharp drop in atmospheric pressure causes a corresponding rise in sea level via the inverted barometer effect. Additionally, once the typhoon moves slightly beyond the bay, northerly onshore winds develop, inducing wind setup that further elevates the sea level.
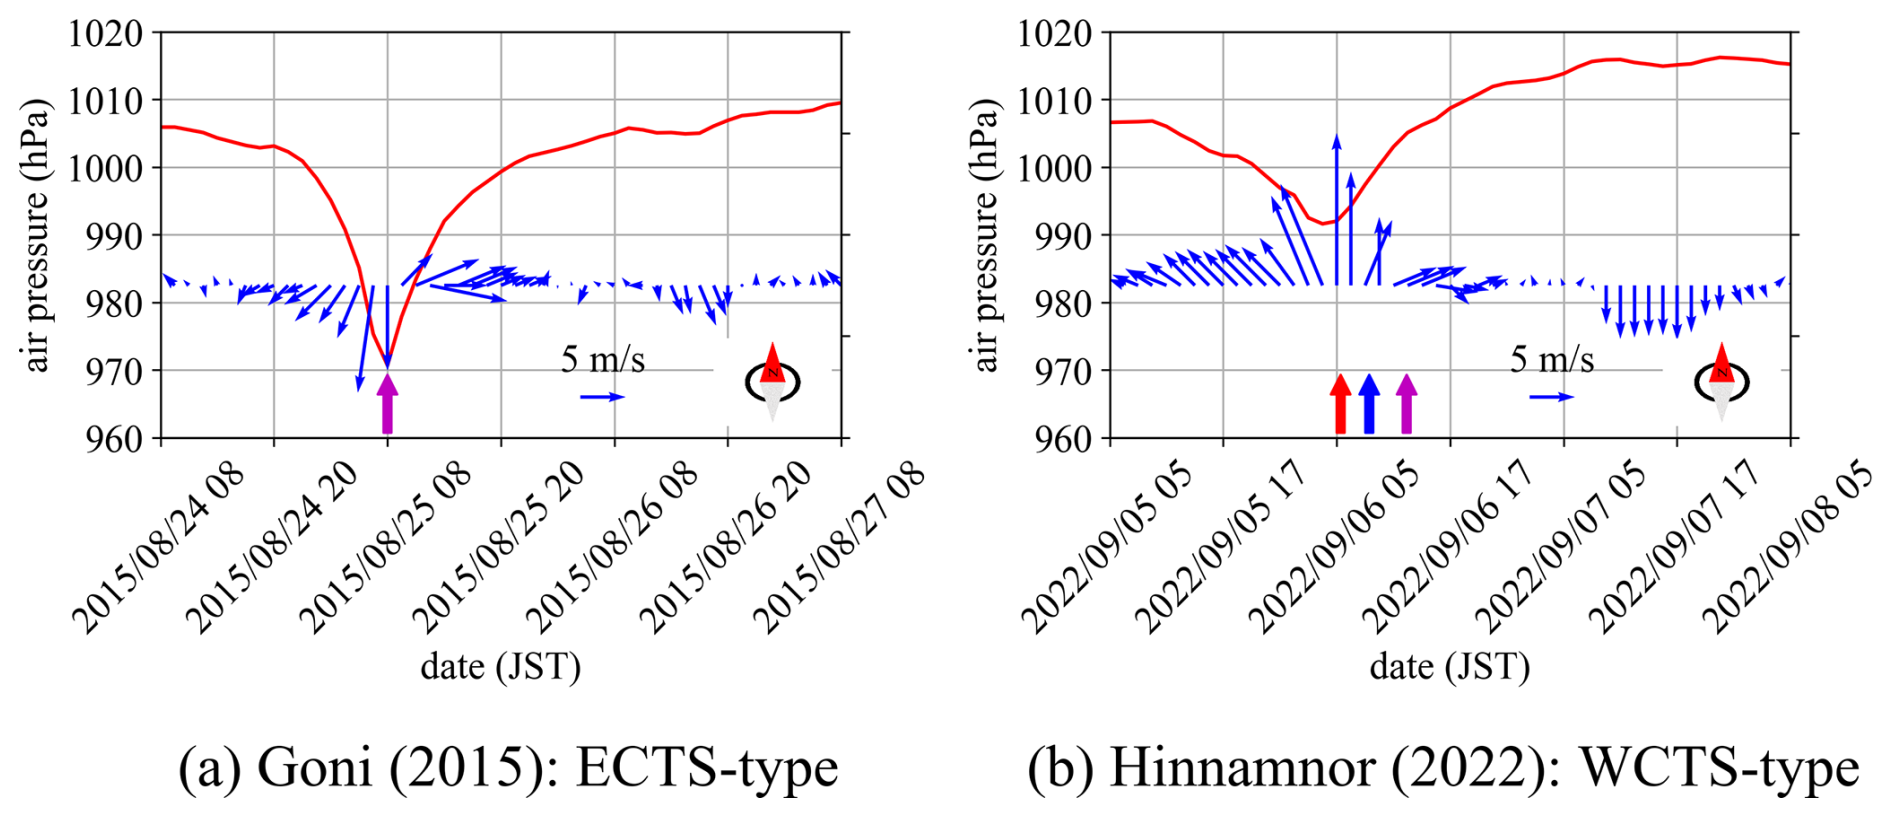
Figure 5Time series of air pressure and winds at Fukuoka weather station for (a) ECTS (Goni, 2015) and (b) WCTS (Hinnamnor, 2022) typhoons.
In contrast, storm surge anomalies associated with WCTS-type typhoons exhibit unusual temporal patterns. Typically, the surge anomaly increases as the typhoon approaches Hakata Bay, reaching an initial peak (green dot in Fig. 3; red arrow in Fig. 4b). This is followed by a rapid decrease (blue arrow in Fig. 4b) and then a second increase resulting in another peak (purple arrow in Fig. 4b). The location of the typhoon at the time of the second peak is indicated by a blue dot in Fig. 3, showing that the typhoon had already entered the Sea of Japan. Typhoon Sanba (2012) is a notable exception, as it did not exhibit this two-peaked pattern at the Hakata tidal station. Figure 5b presents the time series of wind and atmospheric pressure at the Fukuoka weather station during Typhoon Hinnamnor (2022). The first storm surge anomaly peak coincides with the typhoon's closest approach to the NCKI, when the minimum pressure of 991.4 hPa is recorded – consistent with the inverted barometer effect (red arrows in Figs. 4b and 5b). However, the second peak occurs after the typhoon has moved into the Sea of Japan, at which time local pressure at the NCKI rises to around 1,000 hPa and wind speeds drop below 5 m s−1 (purple arrows in Figs. 4b and 5b). Thus, this second surge peak cannot be explained by the inverted barometer effect or wind setup alone. Accordingly, this study aims to clarify the physical mechanisms responsible for the second surge peak observed during WCTS-type typhoons.
5.1 Model setup
An unstructured grid Finite-Volume Community Ocean Model (FVCOM) was used to calculate storm surges associated with the input meteorological data for air pressure and wind. The FVCOM employs the finite-volume method, using a triangular grid system in the horizontal plane and generalized terrain-following coordinates in the vertical direction (Yoon and Shim, 2013). The model incorporates the modified level 2.5 (Mellor and Yamada, 1982; Smagorinsky, 1963) turbulent closure schemes for vertical and horizontal mixing. Its governing equations include the following equations of motion and continuity equations:
where x, y, and z are horizontal and vertical positions; u, v, and w are the velocities in the x, y, and z directions, respectively; t represents time; pa is the air pressure on the sea surface; pH is the hydrostatic pressure; f is the Coriolis parameter; g is the acceleration due to gravity; Km is the vertical eddy viscosity; and Fu, Fv, and Fw are the horizontal and vertical momentum diffusion terms, respectively. The FVCOM utilizes the finite-volume method for discretization and can be applied using either Cartesian (xy) or geographic (latitude and longitude) coordinates. A detailed description of the discretization procedures is available in Chen et al. (2003).
The boundary conditions on the sea surface are defined as
where η is the height of the free surface, ρ0 is the density of seawater, and τsx and τsy are the x- and y-axis components of the sea surface shear stress, respectively:
with U10 and V10 being the x- and y-axis components of the wind speed 10 m above the sea surface, respectively, ρa being the density of the atmosphere, and Cs being the wind drag coefficient, which is calculated as follows (Large and Pond, 1981):
We adopted this formulation to be consistent with the wind stress setting used in Niimi et al. (2022), which provided a validated reference framework for storm surge simulations in this region.
The boundary conditions on the seafloor are defined as
where h is the water depth and τbx and τby are the x- and y-axis components of the seafloor shear stress, respectively:
The bottom drag coefficient is determined by matching a logarithmic bottom layer to the model at height za from the bottom:
where k=0.4 is the von Kármán constant and z0 is the bottom roughness parameter, which is 0.001 m in the ocean.
The model domain is depicted in Fig. 6. This domain spans an extensive area from 125 to 135° E in longitude and from 27 to 36° N in latitude (Fig. 6a). For the FVCOM input, we provided x–y coordinates corresponding to the longitude and latitude, respectively. Coastal lines were sourced from the Ministry of Land, Infrastructure, Transport, and Tourism of Japan (https://nlftp.mlit.go.jp/ksj/gml/datalist/KsjTmplt-C23.html, last access: 25 October 2022). Water depth data were obtained from the Japan Hydrographic Association (2022) and Japan Oceanographic Data Center (https://www.jodc.go.jp/jodcweb/JDOSS/infoJEGG_j.html, last access: 25 October 2022), and they were interpolated into the mesh using an inverse distance weighting method. A large unstructured grid with a resolution of 50 km was used for the open sea, whereas very small triangular meshes with a resolution of 300 m were employed along Kyushu Island and Hakata Bay. The model used three sigma levels in the vertical direction. The triangular grid comprised 254 335 nodes and 483 582 elements. Winds at a height of 10 m above the sea surface and air pressure at the sea surface were obtained from a mesoscale model (MSM, https://www.data.jma.go.jp/suishin/cgi-bin/catalogue/make_product_page.cgi?id=MesModel, last access: 25 October 2022), which provided grid point values from an hourly weather forecast for Japan and its surrounding ocean area calculated at a finer grid spacing (5 km) than the global model. In addition, we conducted three simulation cases: (1) both atmospheric pressure and wind forcing, (2) pressure-only forcing, and (3) wind-only forcing. For each typhoon, the computation period was 8 d with a time step of 1.0 s. The initial water level was set at mean sea level, and tides and wind waves were not considered. For Typhoon Bart (1999), no calculated values are available due to the absence of an MSM.
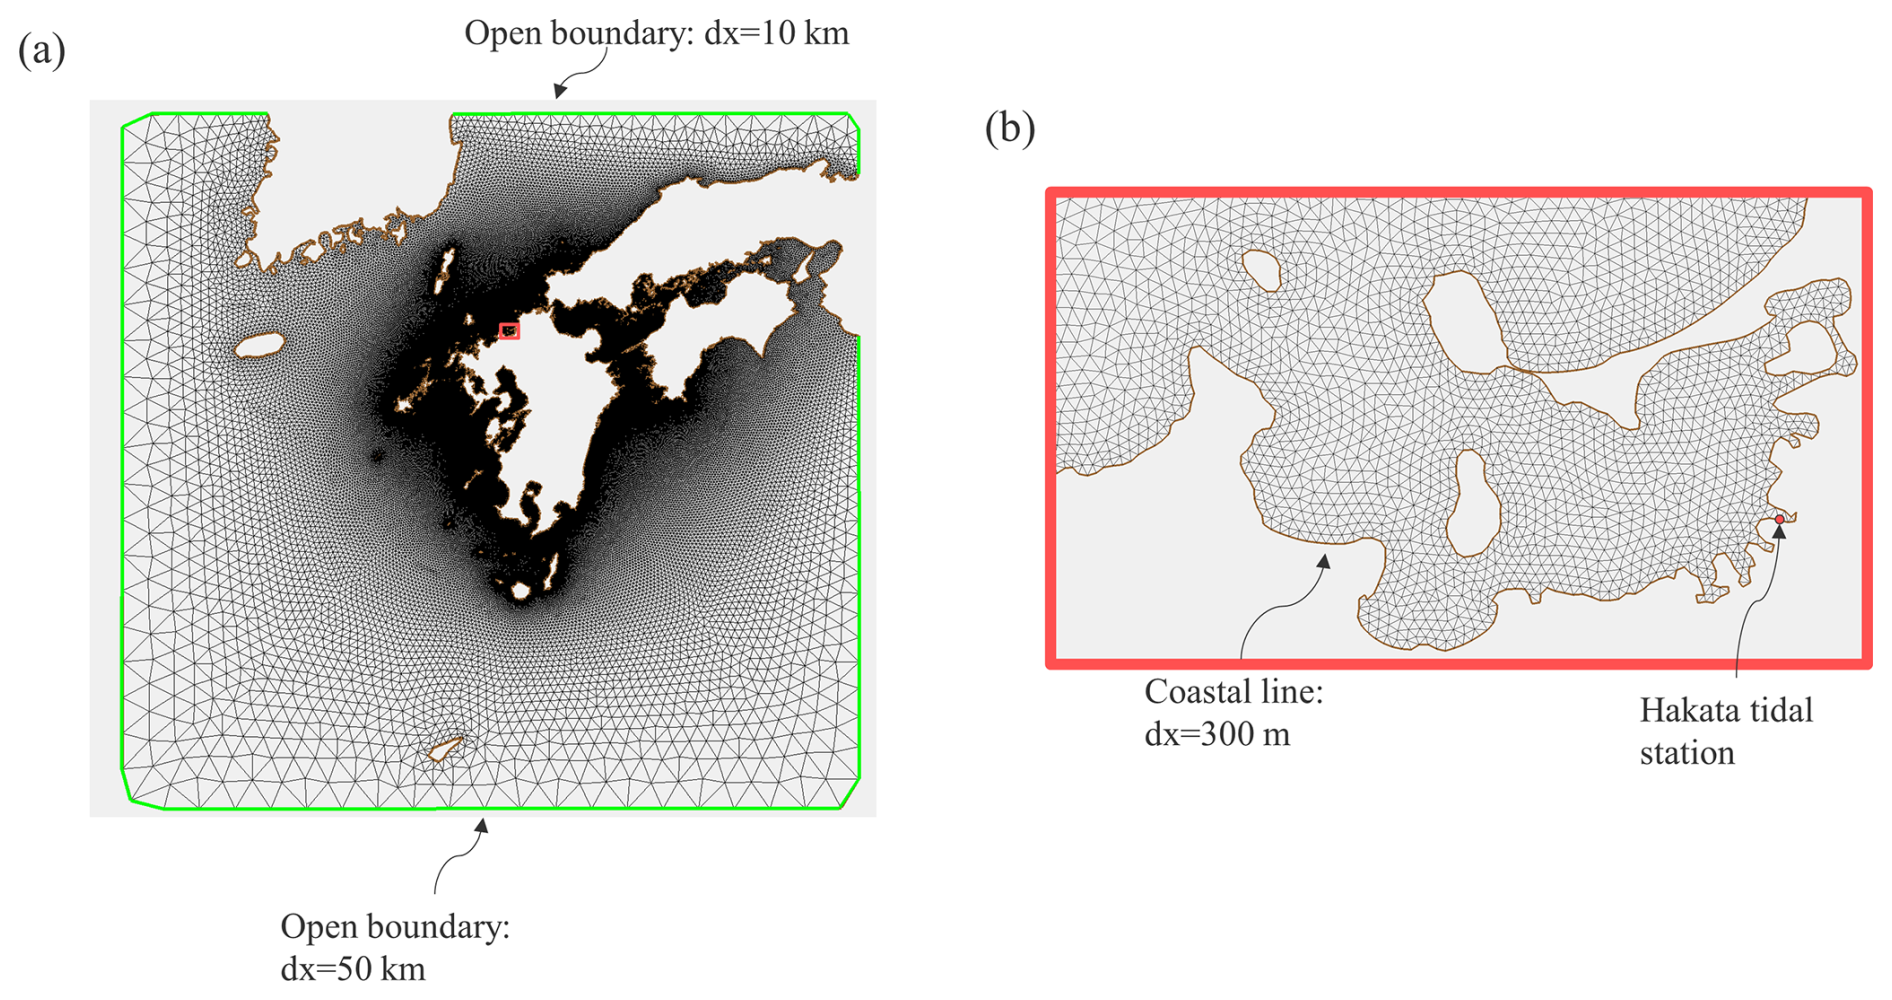
Figure 6Overview of model domain: (a) grid composition and (b) enlarged grid view of Hakata Bay.
5.2 Validation
The red lines in Fig. 4 show the time series of storm surge anomalies at the Hakata tidal station for both WCTS and ECTS typhoons, as simulated by the FVCOM. Below each panel title, the root mean square error (RMSE) between the observed and simulated surge anomalies is indicated as a quantitative measure of model accuracy. Overall, the general trend of the observed time series is well reproduced by the model. Particularly, the simulated results clearly capture the unusual temporal patterns of storm surge anomalies during WCTS-type typhoons and the 2 h periodic seiche in Hakata Bay, as reported by Yamashiro et al. (2016).
5.3 Contributions of pressure and wind to storm surge anomalies
Table 1 shows the correlation coefficient and RMSE between the storm surge anomalies simulated under combined wind and pressure forcing and the sum of the individually simulated wind-only and pressure-only cases in Hakata Bay. For all typhoons, the correlation coefficient was nearly 1, and the RMSE was extremely small.
Table 1Correlation coefficient (R) and root mean square error (RMSE) between the simulated storm surge anomalies in Hakata Bay under combined wind and pressure forcing (ηpres+wind), and the sum of two separate simulations with pressure-only and wind-only forcing (ηpres+ηwind).
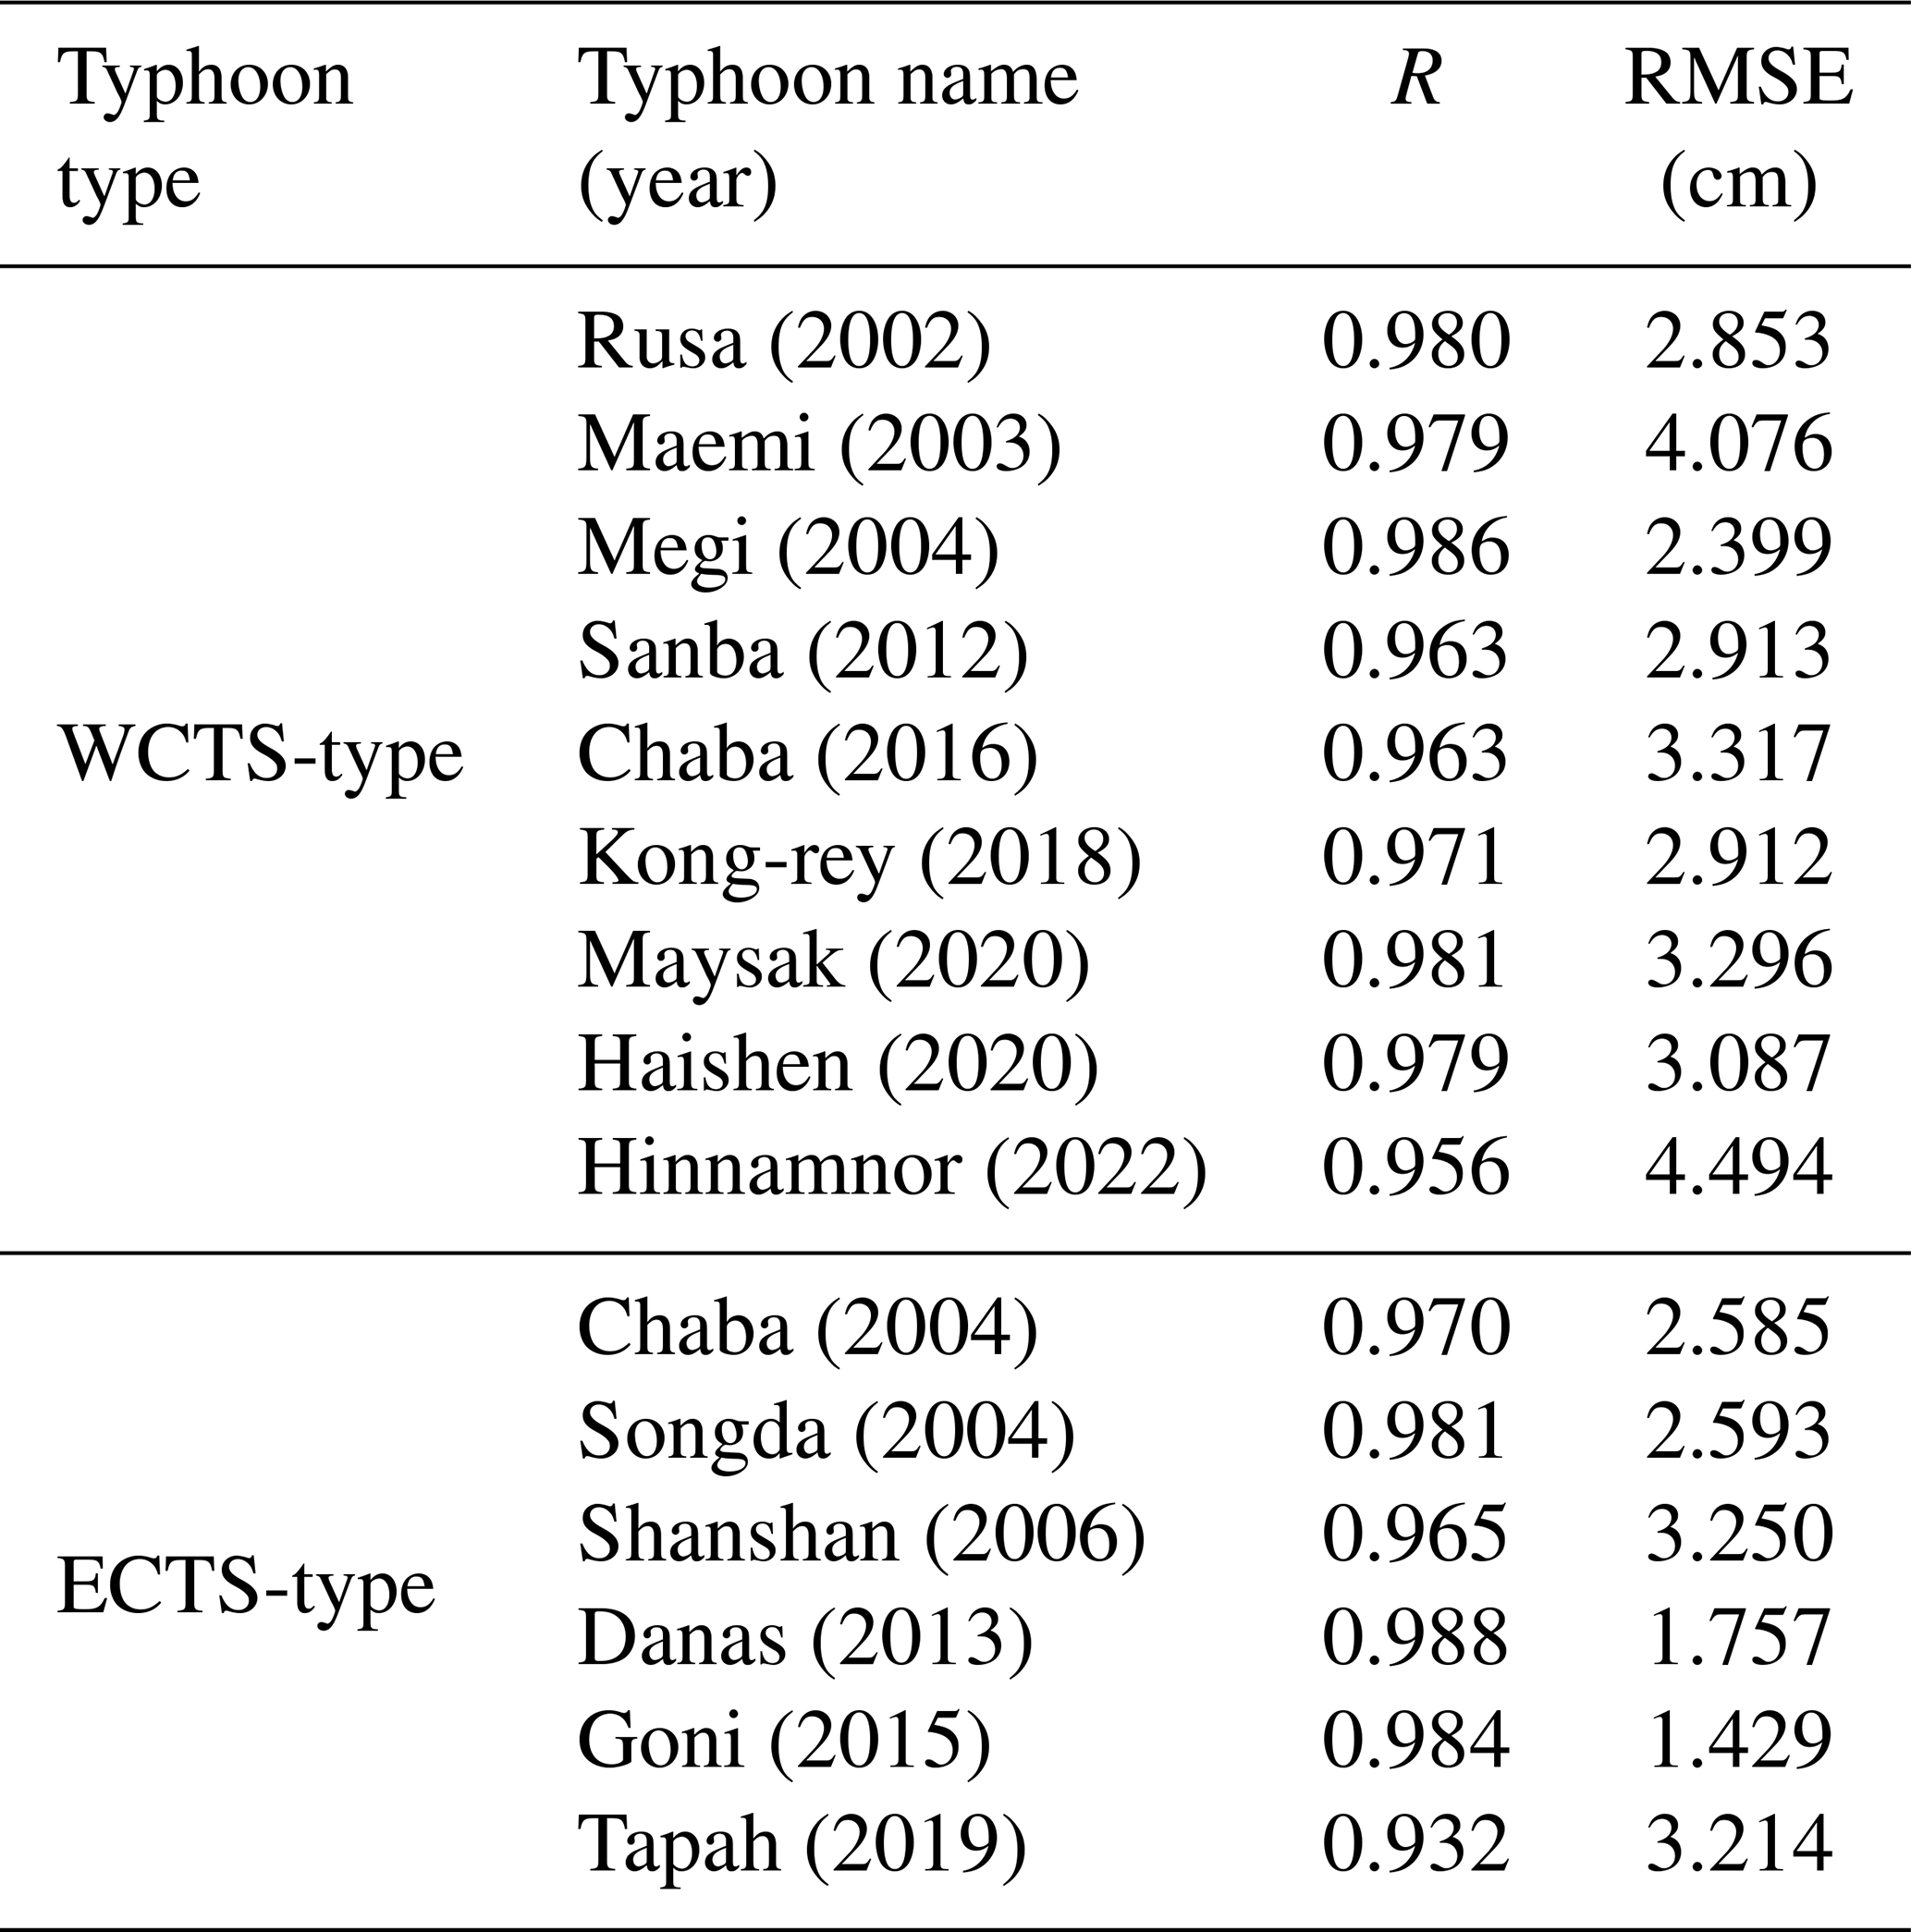
These results indicate that the storm surge anomalies generated under simultaneous wind and pressure forcing can be decomposed into the sum of the individual surge components induced by wind and pressure, respectively – implying that the two effects act independently. In the following sections, we examine the development of storm surge anomalies under combined atmospheric pressure and wind forcing by decomposing the total surge into its pressure- and wind-driven components. We approximated the total storm surge anomaly as the linear sum of the pressure-induced and wind-induced components, as follows:
where ηpres is the sea level anomaly caused by atmospheric pressure alone, ηwind is the sea level anomaly caused by wind forcing alone, and ηpres+wind is the sea level anomaly resulting from the combined effects of pressure and wind forcing. We then investigate the specific factors contributing to the development of each component.
We investigated the cause and characteristics of the second peak shown in WCTS typhoons by conducting a detailed analysis of the spatial distribution of storm surge anomalies, wind, and atmospheric pressure during Hinnamnor (2022), a representative WCTS typhoon.
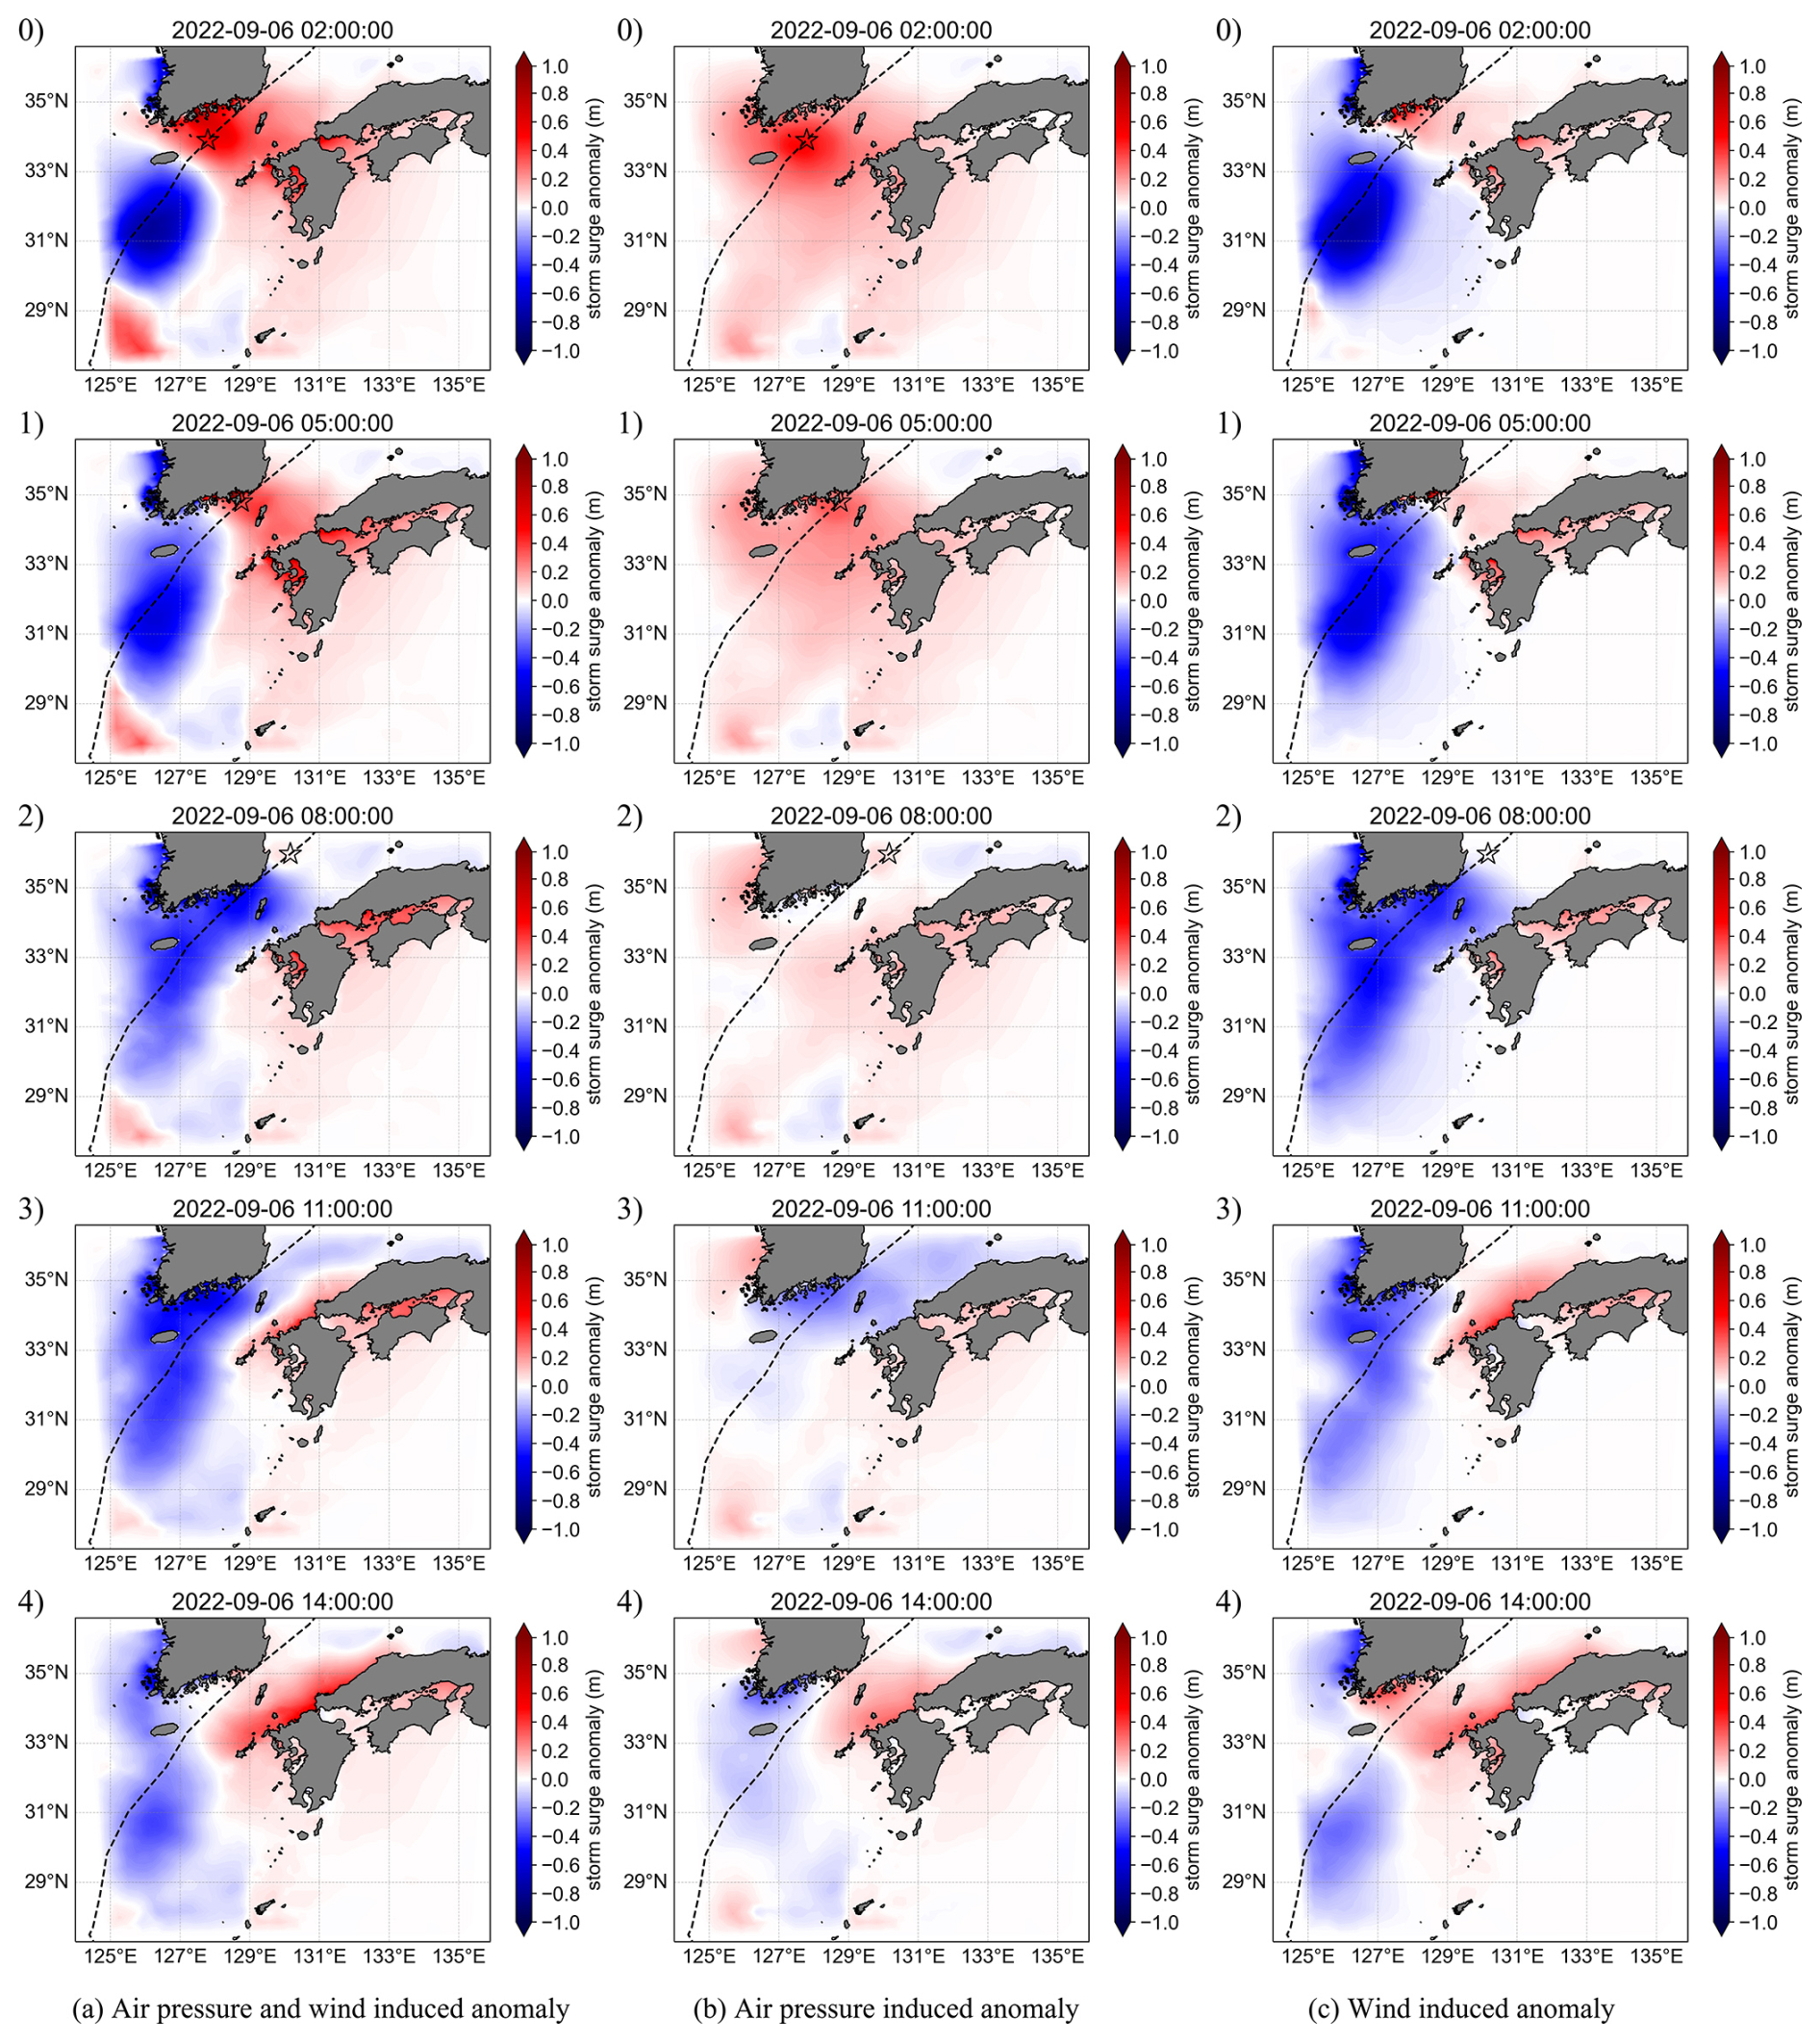
Figure 7Distribution of storm surge anomalies during Typhoon Hinnamnor (2022). The black line represents the typhoon track, and the black star marks the typhoon center. (a) Storm surge anomaly resulting from the combined effects of atmospheric pressure and wind forcing (ηpres+wind). (b) Storm surge anomaly driven by atmospheric pressure alone (ηpres). (c) Storm surge anomaly driven by wind forcing alone (ηwind).
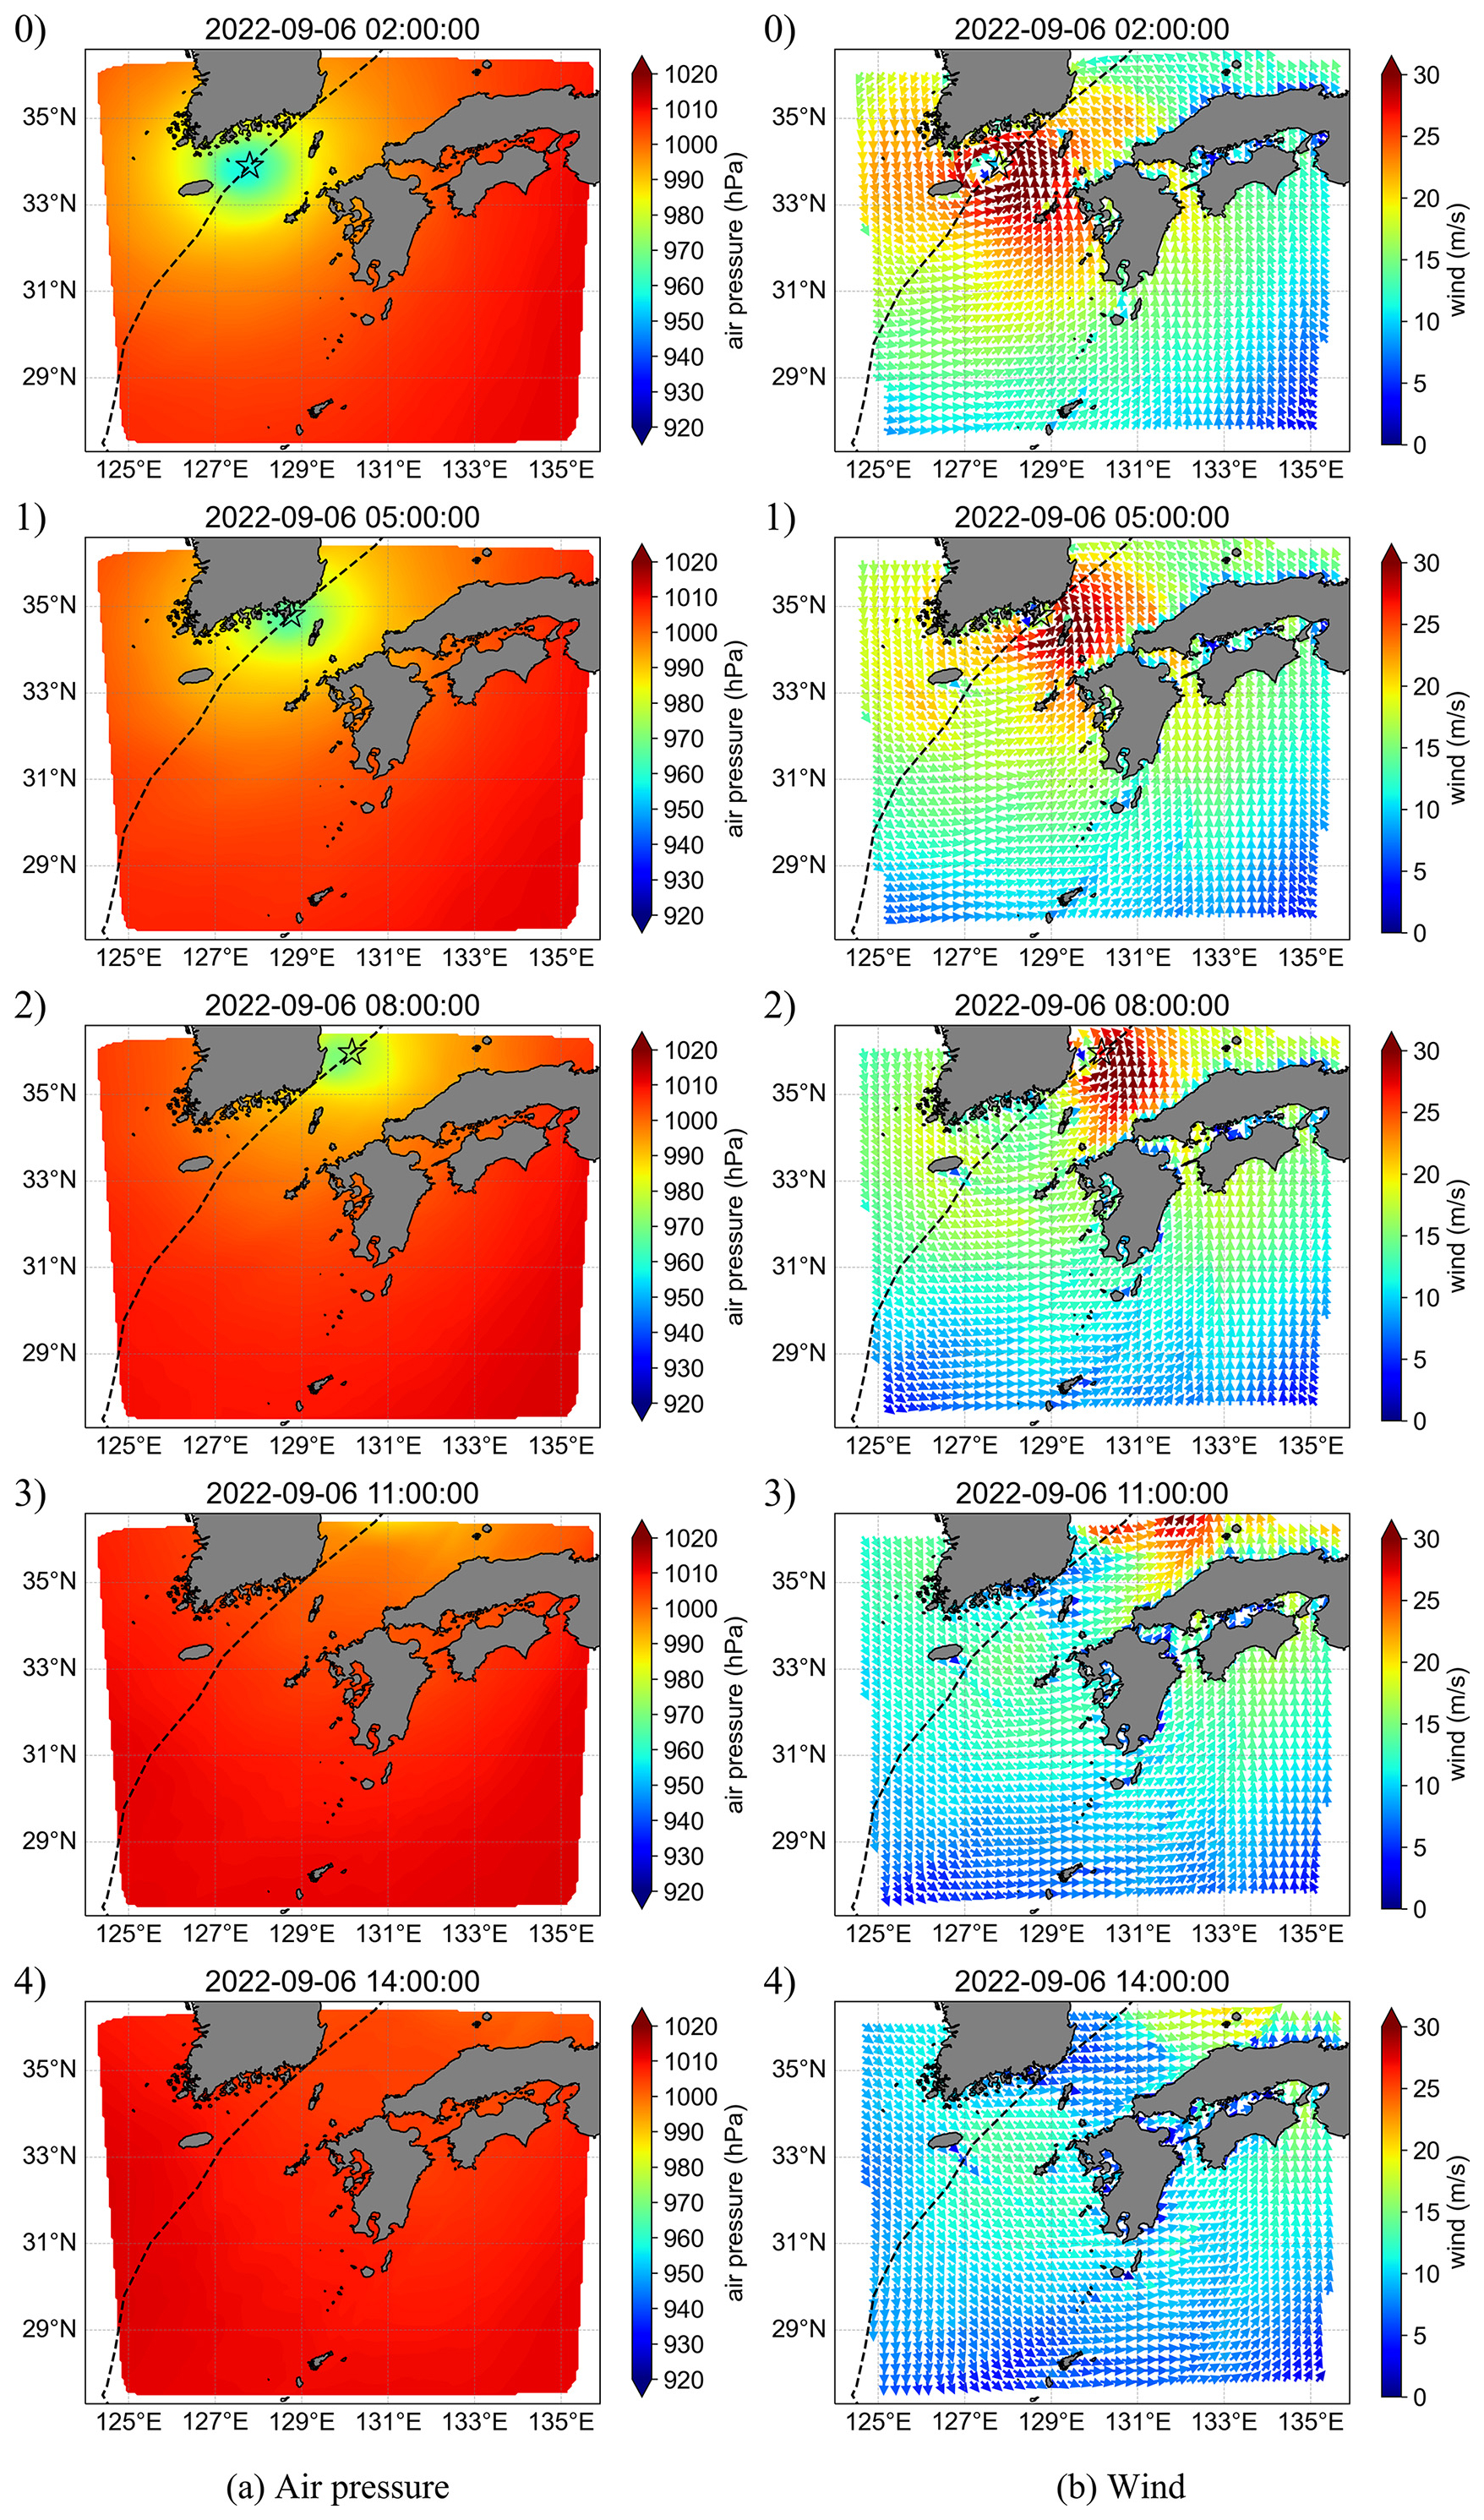
Figure 8Distributions of (a) air pressure and (b) wind during Typhoon Hinnamnor (2022). The black curve indicates the typhoon path, and the black star indicates the typhoon center.
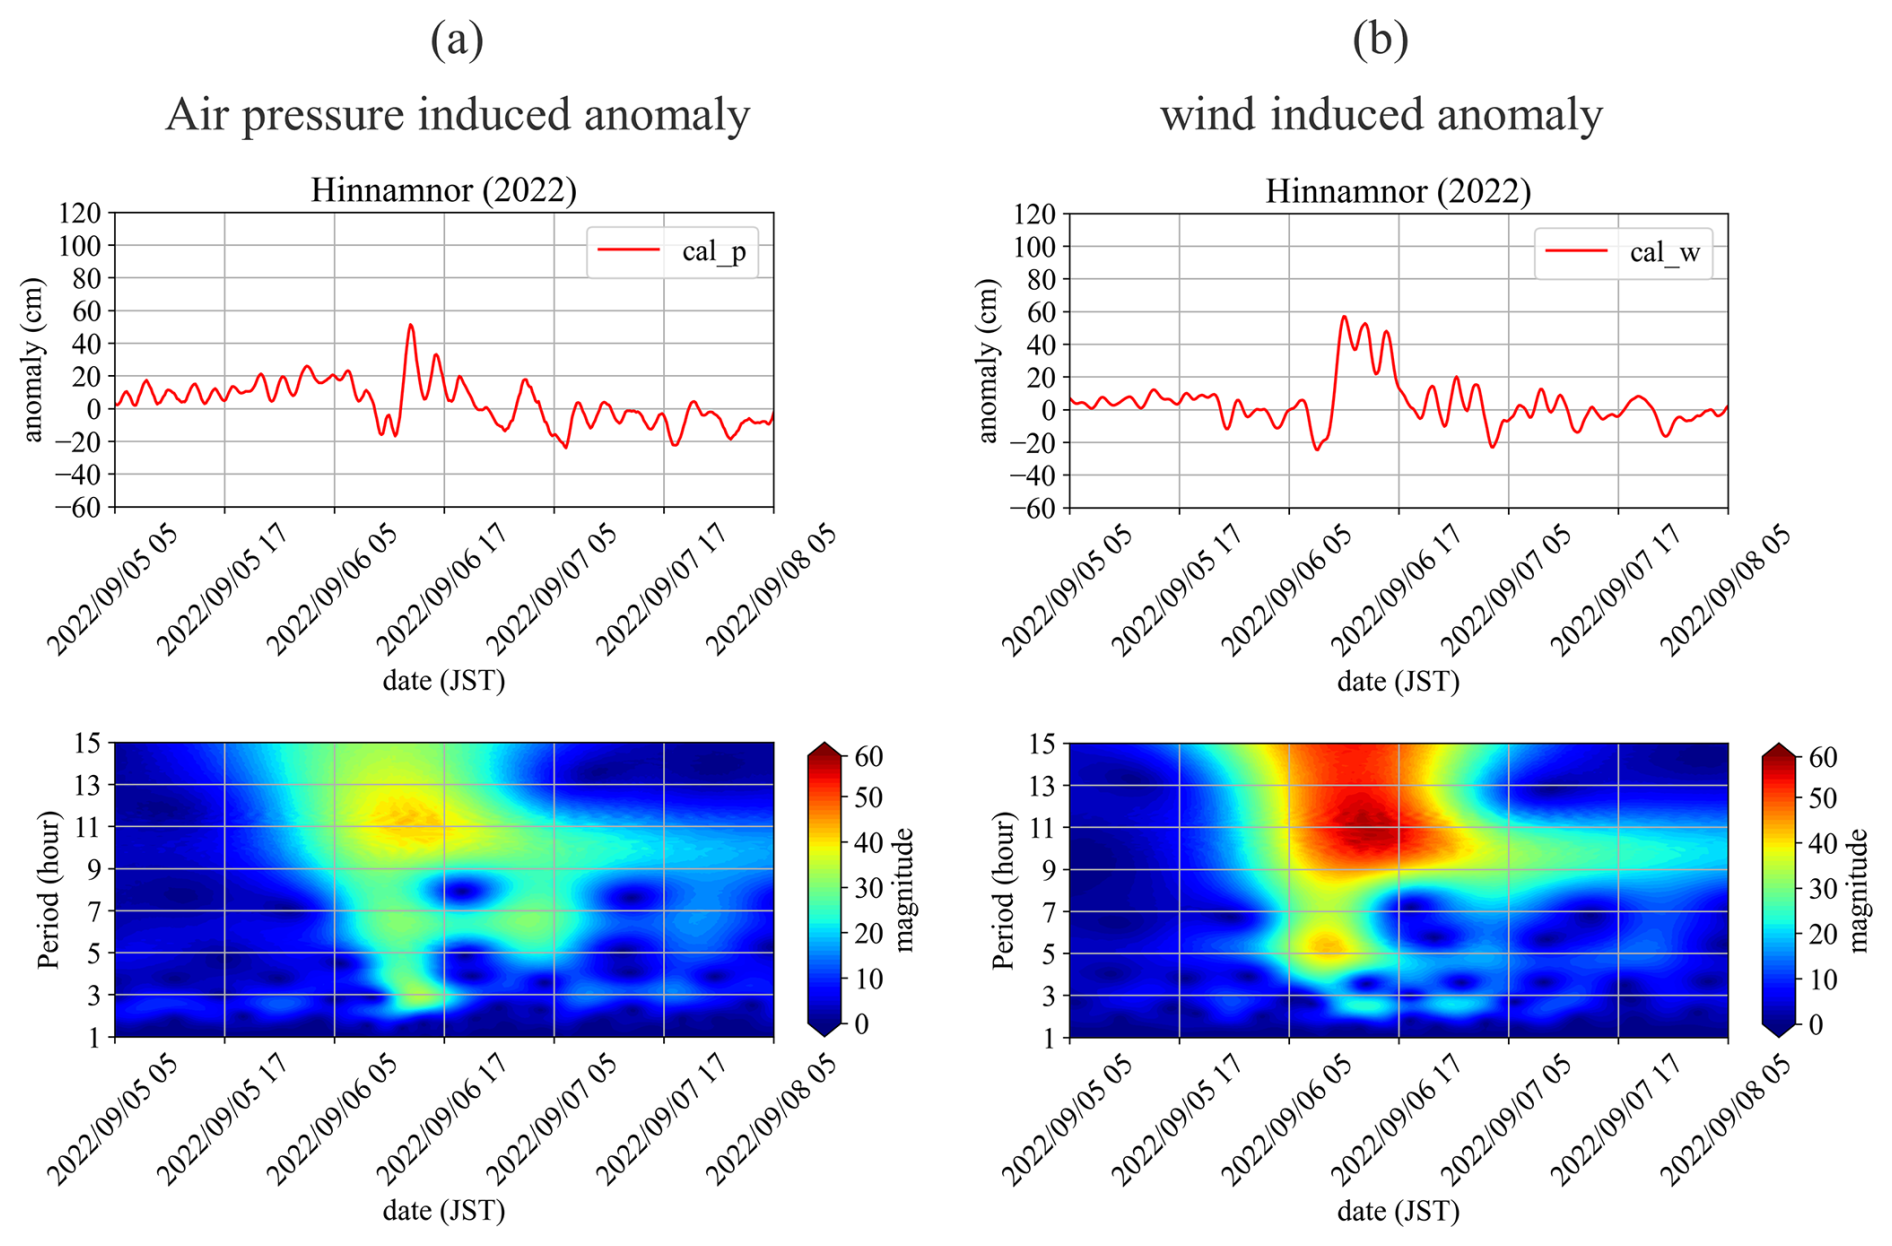
Figure 9Simulated time series and scalograms at the Hakata tidal station for anomalies induced by (a) air pressure and (b) wind.
Figure 7 shows the spatial distribution of the storm surge anomaly during Hinnamnor (2022). Figure 7a shows ηpres+wind, panel (b) depicts ηpres, and panel (c) presents ηwind. Figure 8 shows the spatial distribution of atmospheric pressure and wind. The top graphs of Fig. 9 show the time series of ηpres and ηwind at the Hakata tidal station. At 02:00 LT on 6 September 2022, the typhoon enters the Tsushima Strait. At this time, the sea level rises according to the low air pressure distribution around the typhoon center (Figs. 7b0 and 8a0), resulting in a sea level rise of approximately 20 cm in Hakata Bay at the center of the NCKI (top graph in Fig. 9a). The storm surge anomalies induced by winds gradually increase from the NCKI toward the SCKP, forming a gradient (Fig. 7c0). This is because the wind blows toward the SCKP, causing an increase in storm surge anomalies due to the wind setup (Fig. 8b0). At 05:00 LT on 6 September 2022, the typhoon is near the SCKP and at the closest point to the NCKI. With only atmospheric pressure present, a positive anomaly develops around the typhoon, leading to a positive anomaly throughout the Tsushima Strait (Fig. 7b1). The distribution of the positive anomalies corresponds to that of the low-pressure system (Fig. 8a1). As a result, the storm surge anomalies in Hakata Bay increase by approximately 20 cm owing to the inverted barometer effect (top graph in Fig. 9a). When wind is present, positive anomalies appear along the SCKP and NCKI, although their values are small (Fig. 7c1). By 08:00 LT on 6 September 2022, as the typhoon enters the Sea of Japan, a negative anomaly develops in the Tsushima Strait (Fig. 7a2), mainly derived from the wind-induced anomaly (Fig. 7c2). By 11:00 LT on 6 September 2022, as the typhoon continues northeastward in the Sea of Japan, a positive anomaly appears in the NCKI (Fig. 7a3), mainly derived from the positive wind-induced anomaly (Fig. 7c3). By 14:00 LT on 6 September 2022, the positive anomaly in the NCKI intensifies, resulting in a second peak at NCKI (Fig. 7a4), mainly derived from positive anomalies induced by both air pressure and wind (Fig. 7b4 and c4). The atmospheric pressure across the Tsushima Strait reaches near-normal levels, and the wind speeds are below 10 m s−1 after 08:00 LT on 6 September 2022 (Fig. 8a2–a4 and b2–b4). Consequently, the only forces acting on the seawater in the Tsushima Strait are gravity and the Coriolis force, with no external forces notably increasing the storm surge anomalies. The second peak appears from the superposition of oscillations generated in the Tsushima Strait by atmospheric pressure and wind, with the second peak occurring in the NCKI region when the peaks of these oscillations coincide.
6.1 Continuous wavelet transform
We performed a spectral analysis using the continuous wavelet transform (CWT) to investigate oscillatory components within storm surge anomalies. The CWT is well-suited for analyzing nonstationary signals, as it enables time–frequency localization of transient features. It uses a base function, known as the mother wavelet, which is scaled and shifted to compare with the signal of interest, allowing for frequency decomposition over time. The mother wavelet is given by
where ψ(t) is the mother wavelet, t denotes time, a is the scale, and b is the shift. When a increases, the mother wavelet stretches, making it more suitable for analyzing long waves. An increase in b results in a parallel shift in the positive direction along the time axis. For the mother wavelet defined by scale a and shift b, denoted by ψa,b(t), the CWT is defined as
where x(t) is the signal of interest and * denotes the complex conjugate. By continuously varying scale a and shift b, the CWT is a mapping onto a two-dimensional plane of (a, b), allowing frequency analysis in the time domain. We use the following complex Morlet wavelet as the mother wavelet:
where j is the imaginary unit, B=1.5 is the bandwidth, and C=1.0 is the center frequency. These values are recommended and lead to a high resolution and reduced artifacts (Lee et al., 2019).
6.2 Dominant oscillation modes identified by CWT
We analyze the factors that contribute to the second peak during the passage of a WCTS typhoon. As shown in Figs. 4 and 7, the storm surge anomaly fluctuates because of the superposition of oscillations. To identify the oscillatory components other than tidal constituents in the time series of storm surge anomalies in Hakata Bay, the CWT was applied. The lower graphs in Fig. 9 present the CWT scalograms, where atmospheric pressure (Fig. 9a) and wind (Fig. 9b) are independently imposed as external forces. Figure 10 shows the time series of these oscillatory components – 2, 5, and 10 h – extracted using the inverse CWT.
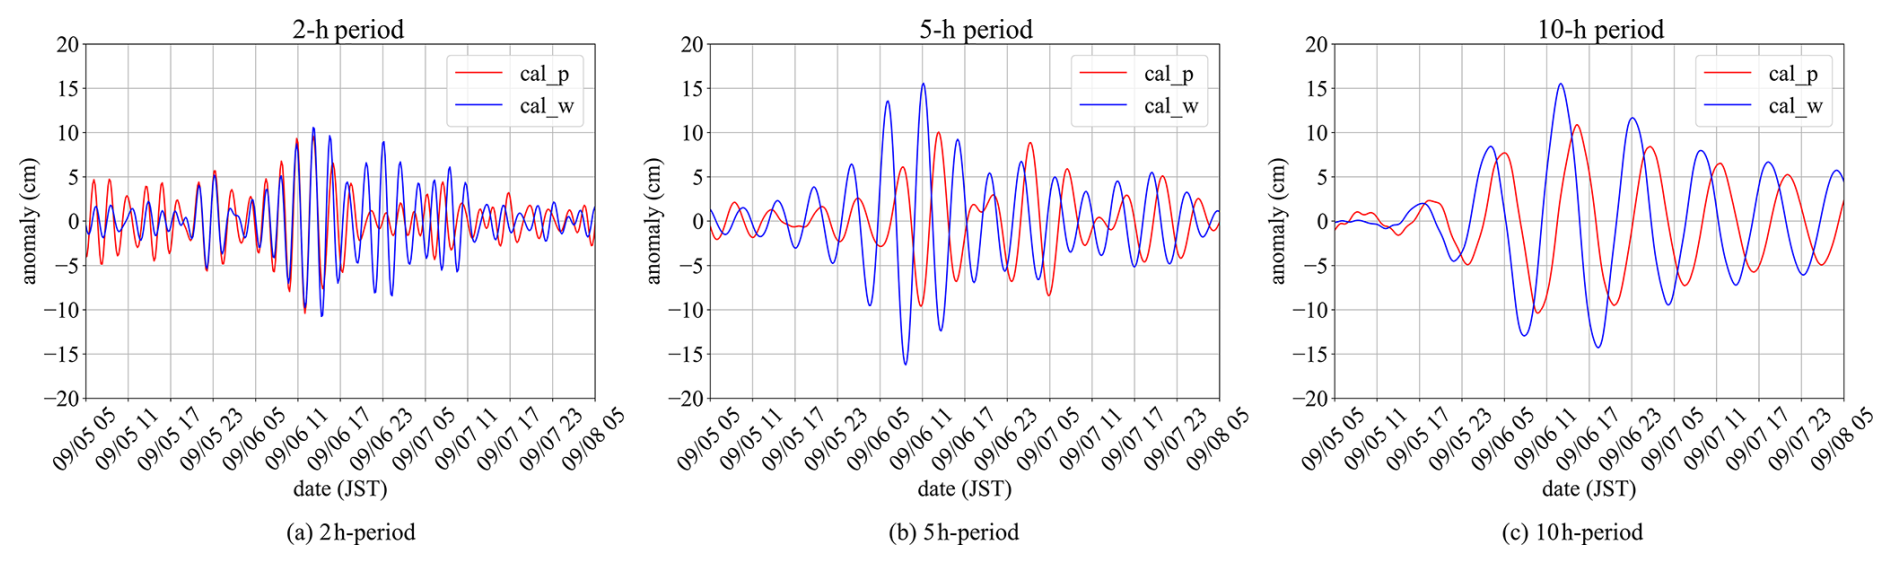
Figure 10Time series of oscillatory components with periods of (a) 2 h, (b) 5 h, and (c) 10 h at Hakata tidal station obtained by an inverse CWT. The red and blue curves indicate the anomalies induced by air pressure and wind, respectively.
In both cases, three dominant oscillations with periods of 10, 5, and 2 h are observed from 05:00 LT on 6 September 2022 to 17:00 LT on 7 September 2022. The 2 h oscillation component has a maximum amplitude of approximately 10 cm, regardless of whether the external forcing is atmospheric pressure or wind, and the times of maximum amplitude coincided (Fig. 10a). On the other hand, for the 5 and 10 h oscillations, the maximum amplitude for the 5 h oscillation ranges from 10 to 15 cm, with wind forcing resulting in an amplitude approximately 1.5 times larger than that caused by atmospheric pressure. The phase of the 5 h oscillation is also about 2 h earlier under wind forcing (Fig. 10b).
Similarly, for the 10 h oscillation, the peak occurs approximately 2 h earlier when the wind is the external force (Fig. 10c). The maximum amplitude is observed between 11:00 and 17:00 LT on 6 September 2022, which corresponds to the second peak of the storm surge anomaly, after which the amplitude gradually decreases. Compared to the 5 h oscillation, the 10 h oscillation component persists for a longer duration.
Figures 11 and 12 show the spatial distributions of the 5 and 10 h period oscillatory components in the Tsushima Strait. For the 5 h period oscillation, regardless of the external force, Tsushima Island, the boundary between the East China Sea and the Tsushima Strait, and that between the Sea of Japan and the Tsushima Strait act as nodes, while the SCKP and NCKI serve as antinodes. In addition, the SCKP and NCKI cells are in opposite phases. The timing of the oscillation depends on the external force. When atmospheric pressure is the external force (Fig. 11a), the oscillation begins at 07:00 LT on 6 September 2022, when the typhoon is located on the eastern coast of Korea. When wind is the external force (Fig. 11b), the oscillation starts at 05:00 LT on 6 September 2022, when the typhoon is located near the SCKP, with the wind force occurring 2 h earlier.
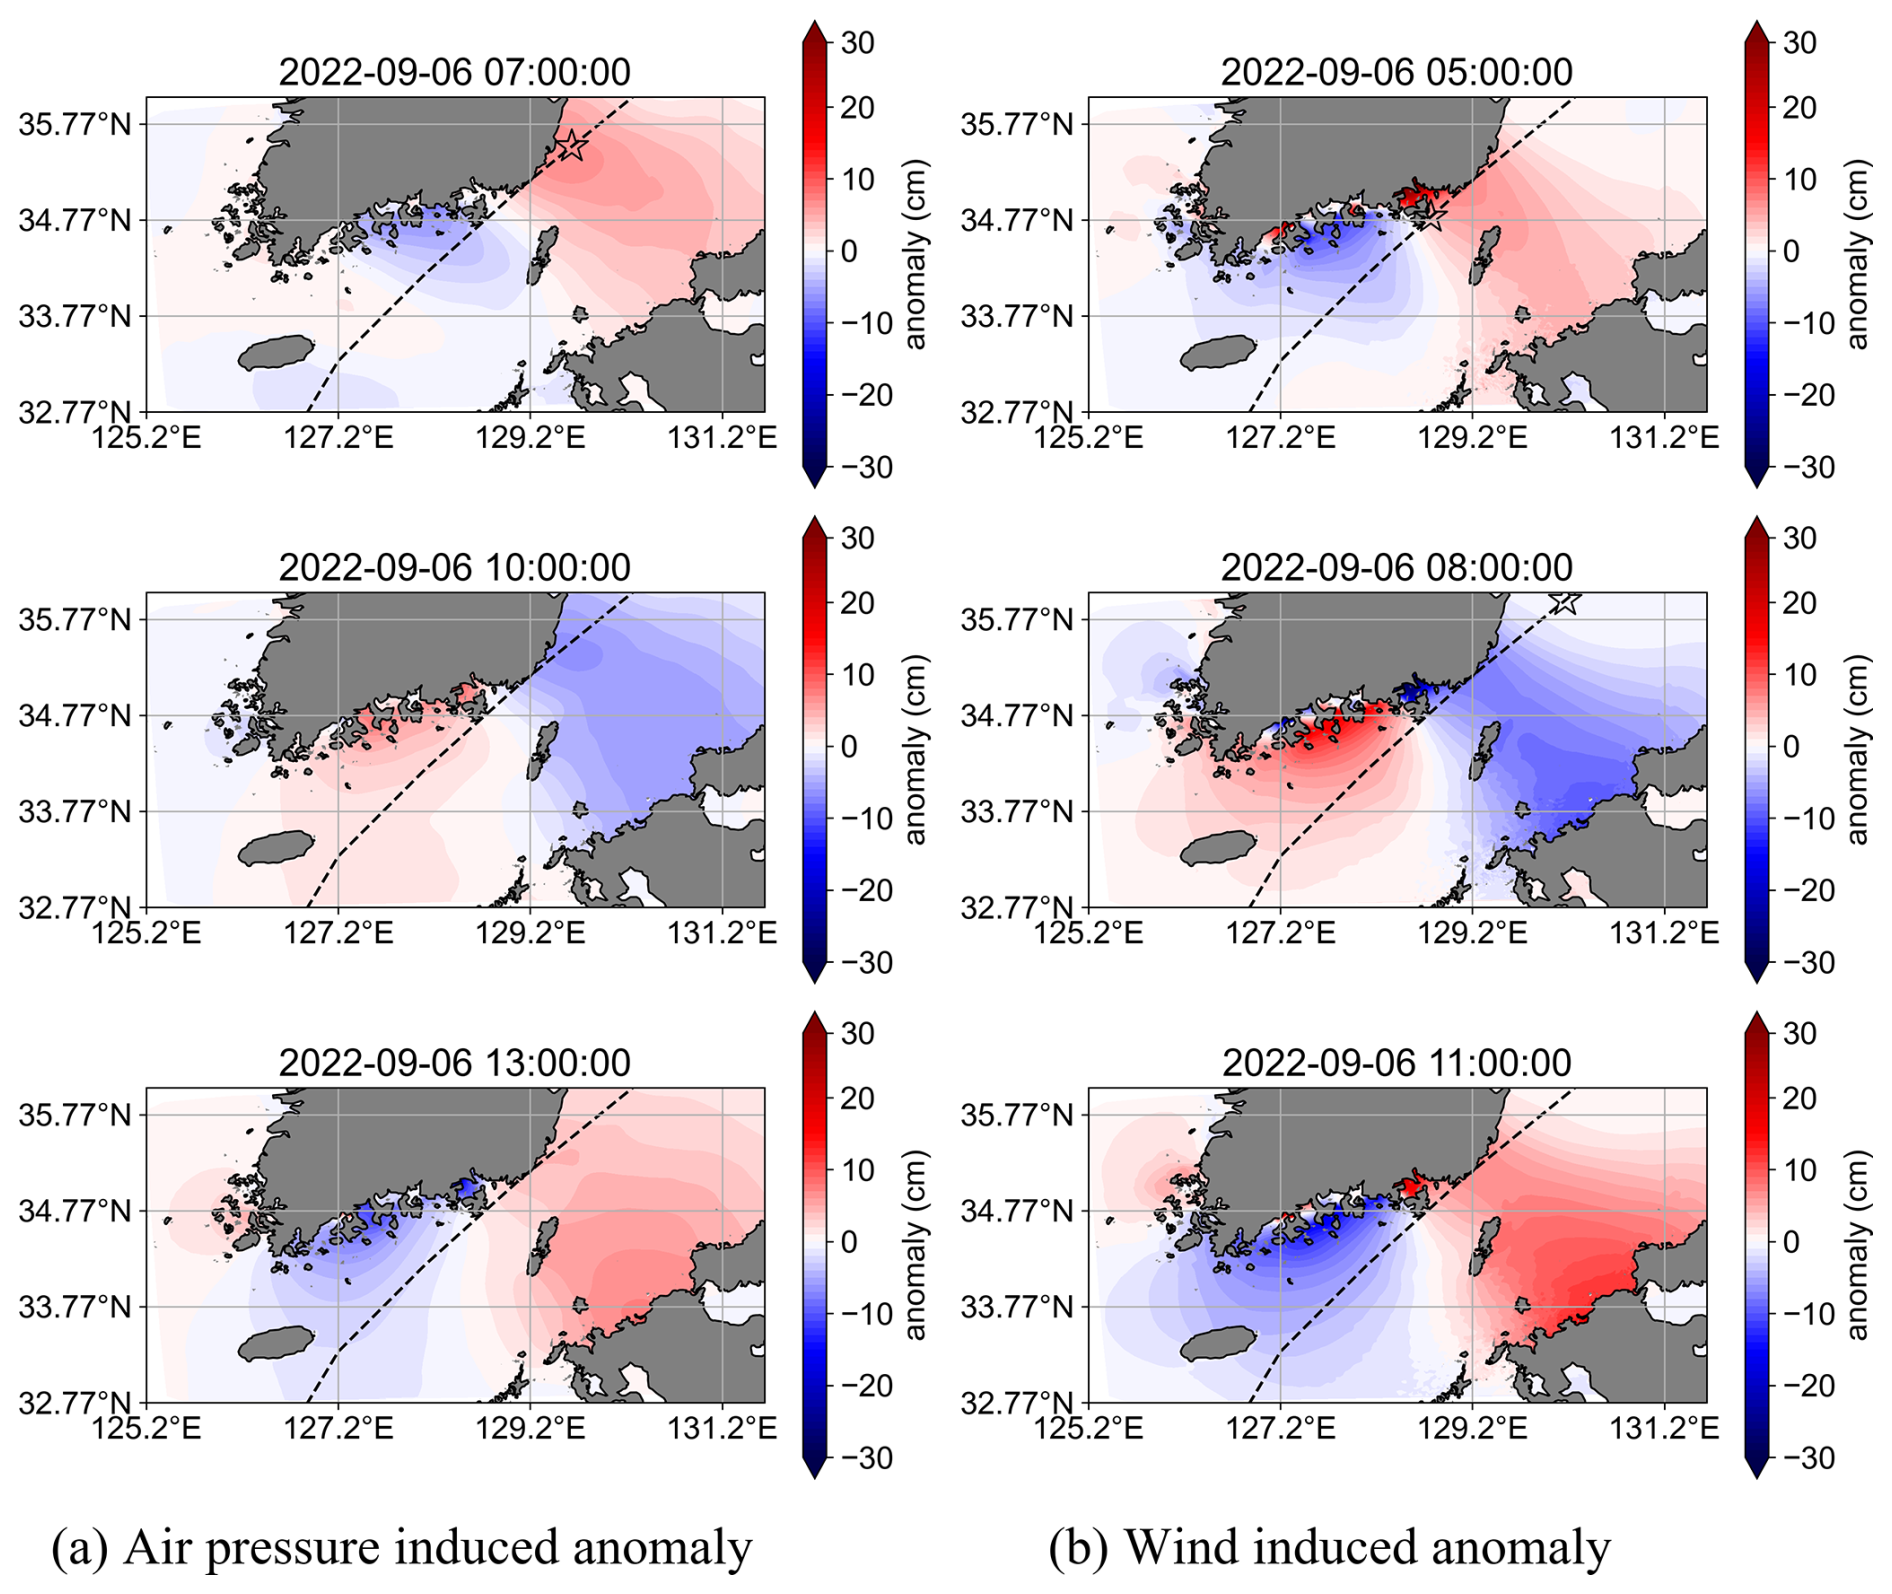
Figure 11Distribution of 5 h period oscillations in the Tsushima Strait for anomalies induced by (a) air pressure and (b) wind.
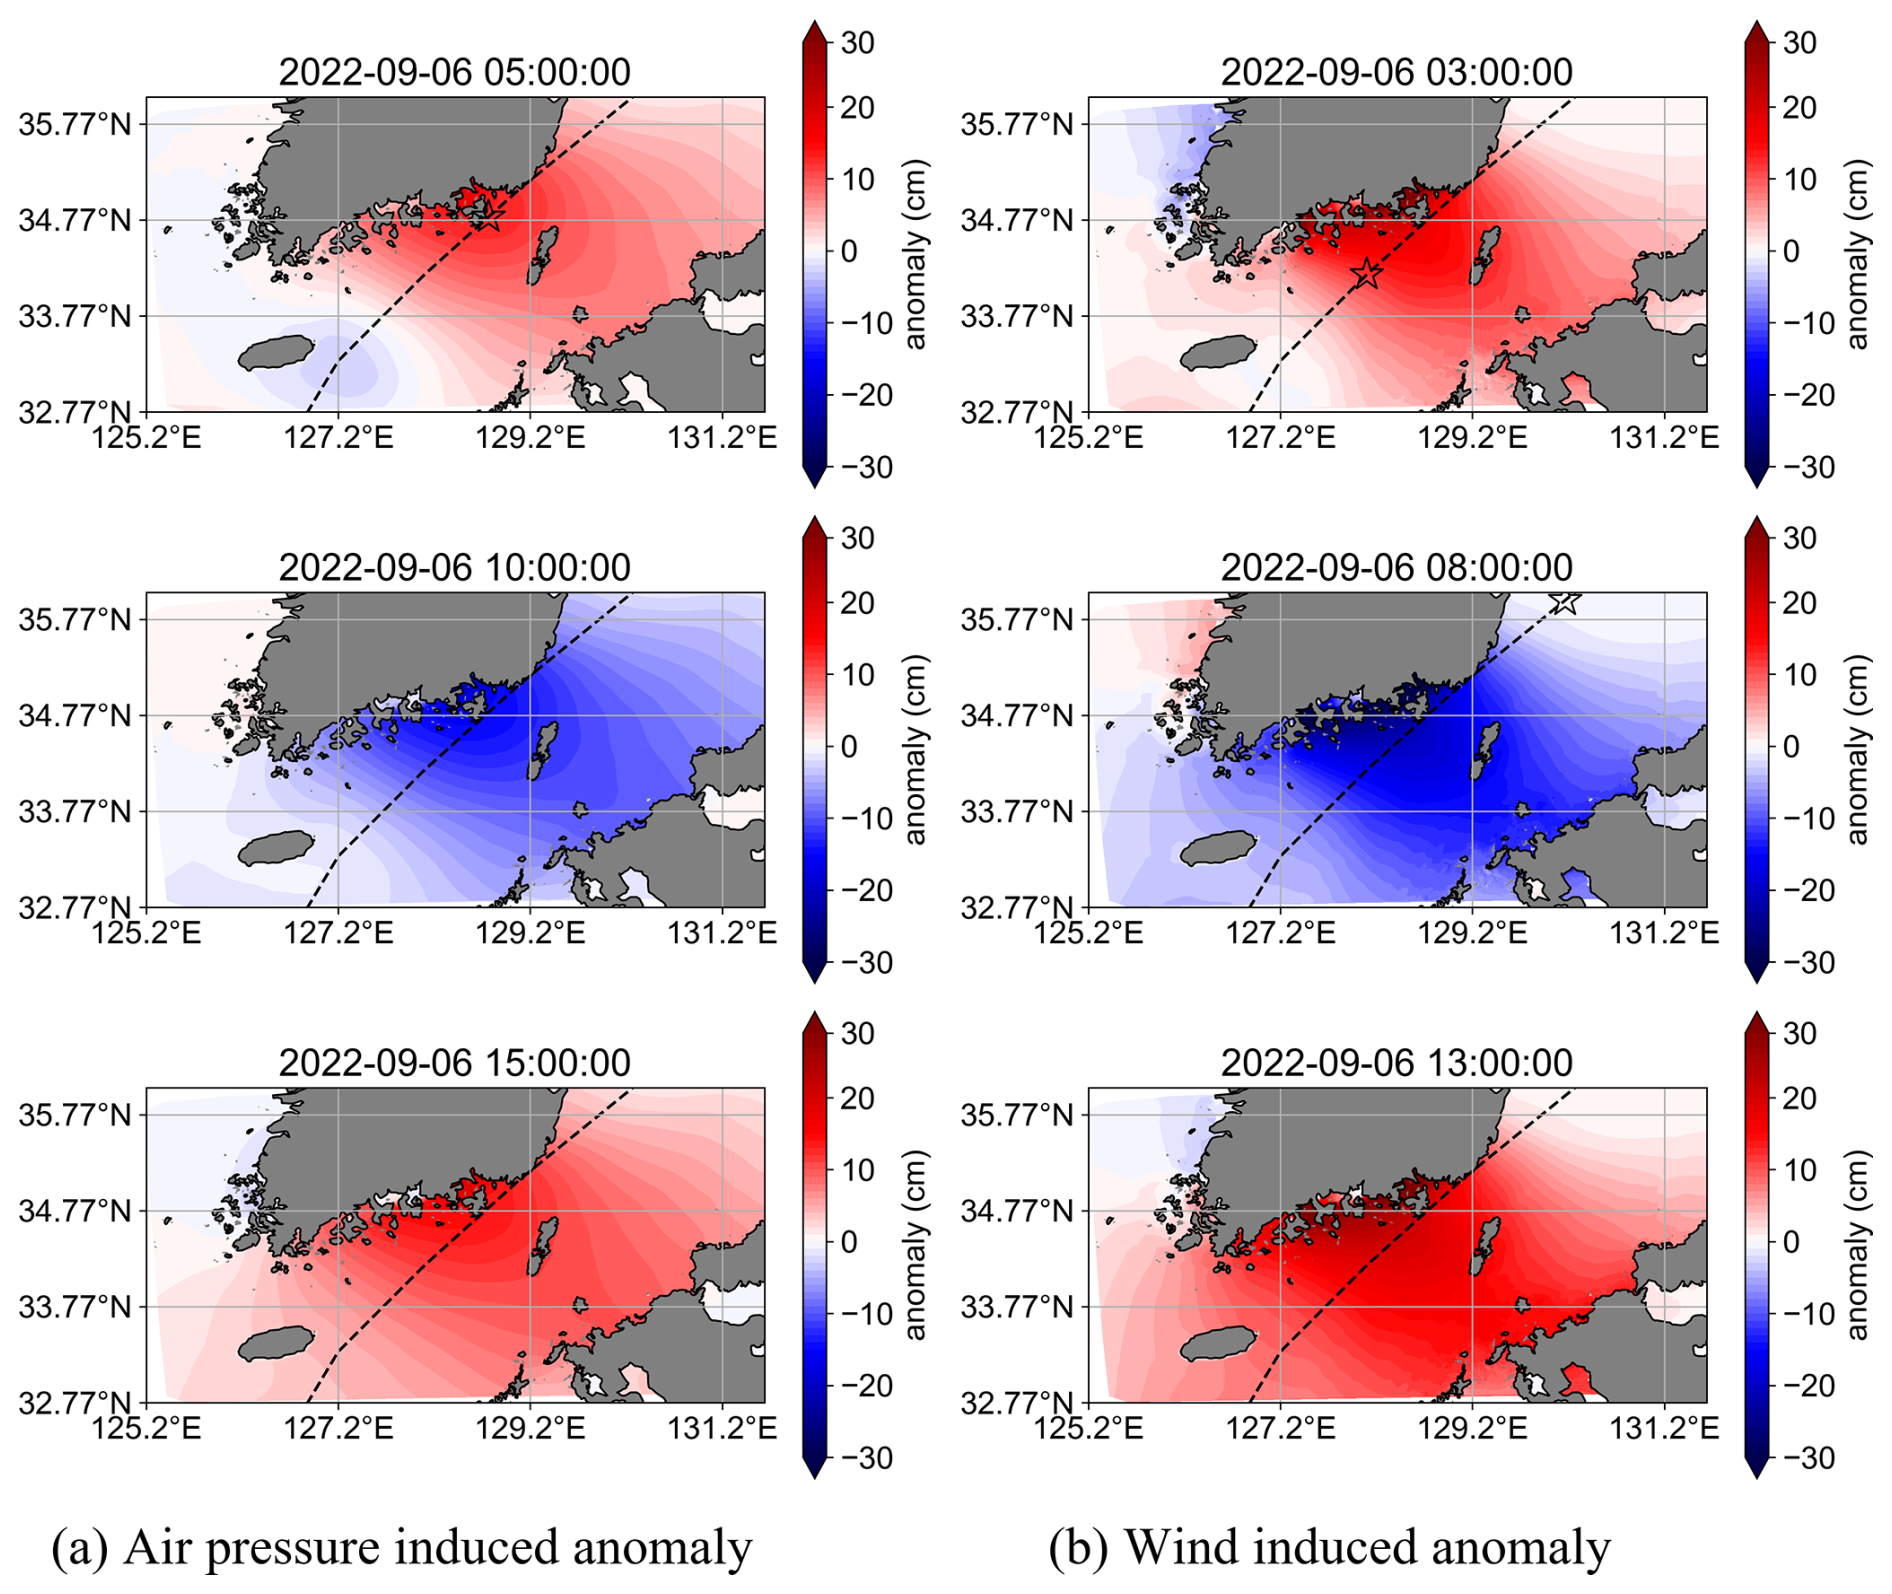
Figure 12Distribution of 10 h period oscillations in the Tsushima Strait for anomalies induced by (a) air pressure and (b) wind.
For the 10 h period oscillation, the boundary between the East China Sea and the Tsushima Strait and that between the Sea of Japan and the Tsushima Strait act as nodes, while Tsushima Island, SCKP, and NCKI serve as antinodes. Unlike the 5 h period oscillation, the SCKP and NCKI are in the same phase. The timing of the 10 h period oscillation is similar to that of the 5 h period oscillation, with wind force occurring 2 h earlier.
The timing of oscillation generation differs between external forces, as shown in Figs. 11 and 12. This is owing to variations in the constraint-removal timing. In the pressure-only case, the storm surge anomalies along the SCKP reached their maximum at 05:00 LT on 6 September 2022, when the typhoon was closest to the SCKP (Figs. 7b1 and 8a1). After this point, as the typhoon moved into the Sea of Japan, the external forcing diminished, and oscillations with 10 and 5 h periods began to develop. In contrast, in the wind-only case, the maximum storm surge anomaly along the SCKP occurred earlier, at 02:00 LT on 6 September 2022 (Figs. 7c0 and 8b0), a few hours before the typhoon reached its closest approach. This is because, at that time, the wind was directed toward the SCKP, generating a strong wind setup and resulting in a significant storm surge at the SCKP. As the typhoon reached its closest to the SCKP at 05:00 LT, the wind direction shifted substantially, releasing the constraint on the water and initiating oscillatory motion. Therefore, in the wind-only case, the external forcing was released earlier than in the pressure-only case, leading to an earlier onset of oscillations. As the total storm surge anomaly is represented as the linear sum of the pressure-induced and wind-induced components, the NCKI experiences a higher and more prolonged storm surge compared to the cases with only one forcing component (Fig. 7a3 and a4).
As shown in Fig. 1b, there is a large change in water depth at the boundary between the Tsushima Strait and the Sea of Japan. When such discontinuous change in the water depth occurs, the amplitude of the oscillations decreases exponentially near the discontinuity. For example, the waveform of the edge waves when the water depth changes discontinuously is described as follows:
In Eqs. (16)–(18), we let the coastline lie along the y axis, with x>0 representing the sea. The water depth and width of the continental shelf are denoted as h1 and l, respectively. The water depth of the deep sea is h2, where h1<h2 (i.e., the depth of the deep sea is greater than that of the continental shelf). The wave number and angular frequency are represented by k and σ, respectively, where a>0 is a constant. According to Eq. (17), the oscillation amplitude in the region where x>l (i.e., deeper area) becomes substantially smaller than that in the region where x<l because of the discontinuous change in the water depth.
This phenomenon arises because of the properties of long waves. The group velocity of long waves is expressed as , indicating that waves move more slowly in shallow regions and faster in deeper regions. Consequently, when long waves generated in shallow regions propagate toward deeper areas, their group velocity increases rapidly due to the depth transition. This abrupt change in wave speed hinders the efficient transmission of wave energy into deeper waters, resulting in partial reflection of the incoming waves – similar to encountering a fixed boundary at the depth discontinuity. The interaction between the reflected and incoming waves gives rise to standing waves, establishing a fluid oscillatory system dominated by specific natural oscillation periods.
Consequently, oscillations do not occur in much deeper regions, leading to node formation. Hence, the 5 and 10 h period oscillations are confined to the shallow regions where these standing wave patterns develop.
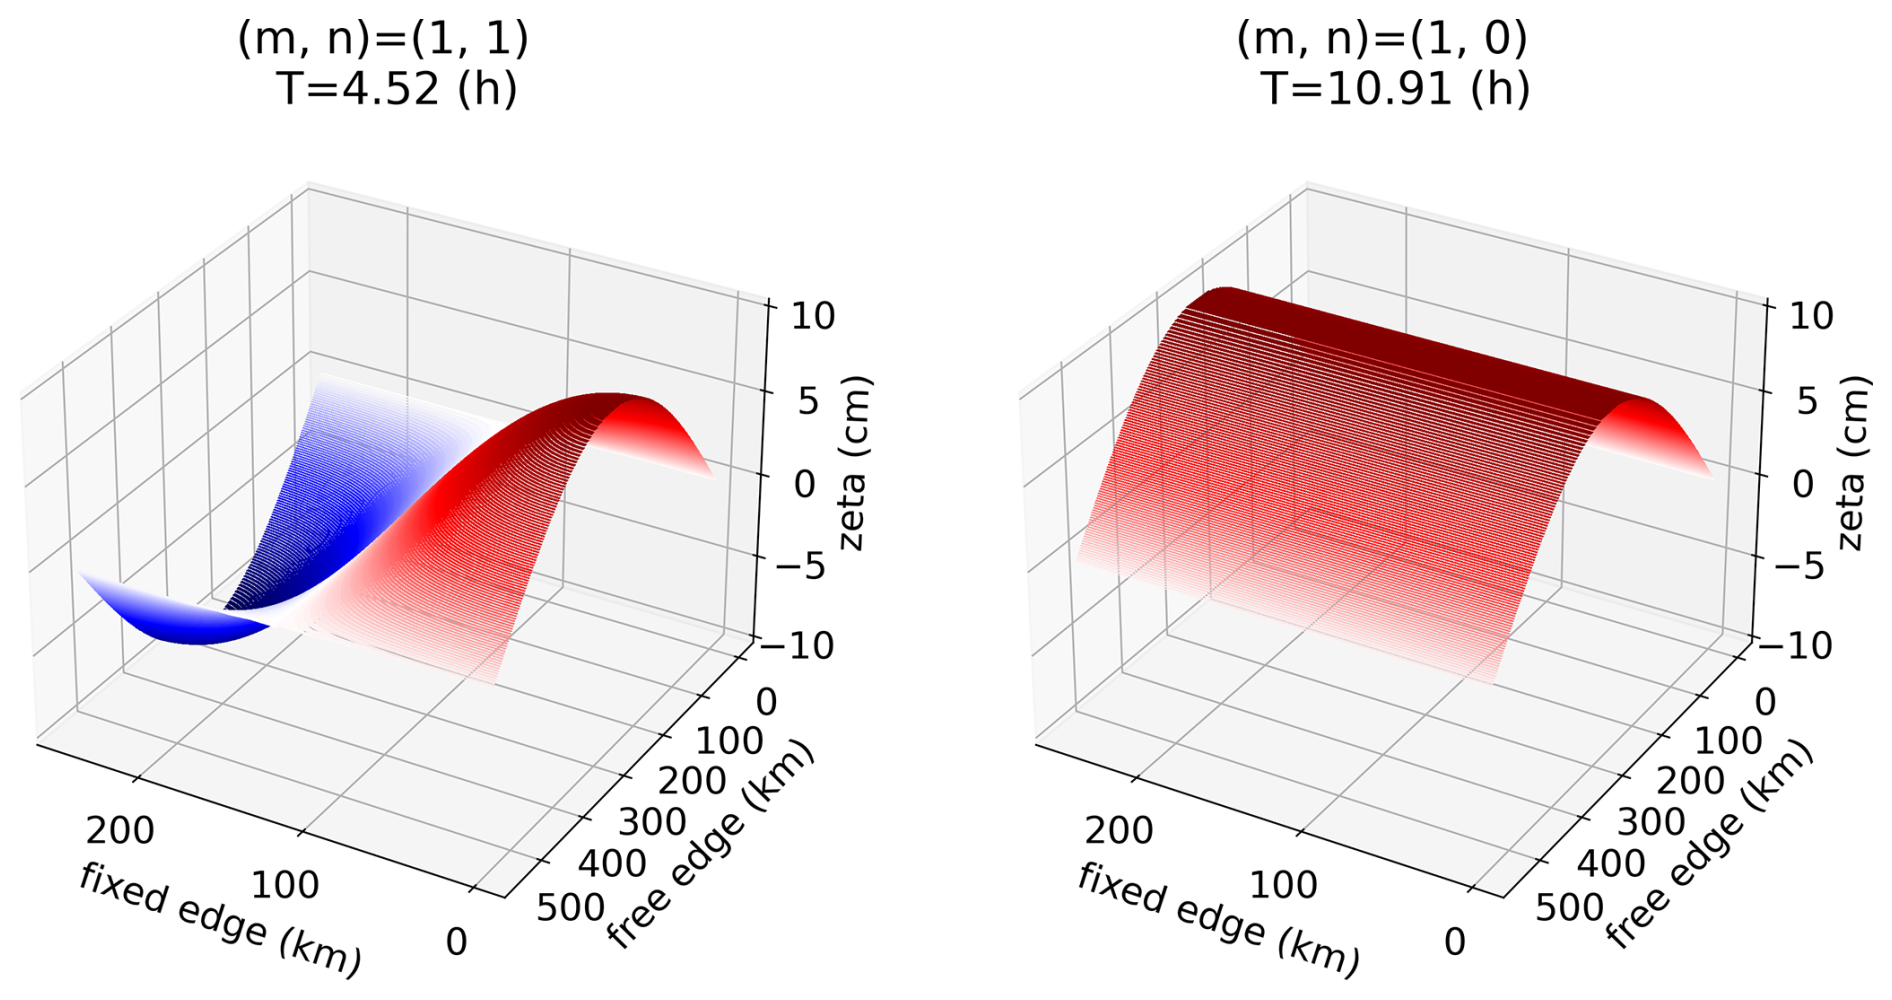
Figure 13Solutions of the wave equation, where m and n represent the mode of vibration in the free- and fixed-edge directions, respectively. The color code indicates the ζ value.
Here, we examine the reasons behind the 5 h period oscillation creating a node in the region between the SCKP and NCKI near Tsushima Island. This phenomenon is related to oscillation without the Coriolis force. By solving the wave equation, we obtain
in a rectangular domain with dimensions b×l, where depth h is constant and ensures that the solution satisfies the following boundary conditions:
The following solution is obtained:
where m and n are integers representing the vibration modes in the x- and y-axis directions, respectively. Additionally, the oscillation period is given by
For the spatial scale of the Tsushima Strait, with h=80 m, l=550 km, b=250 km, and A=5 cm, the solutions for , (1, 0) are presented in Eq. (23) and depicted in Fig. 13. The oscillation with has nodes at x=0 and l and and antinodes at and y=0 and b. The oscillation with has nodes at x=0 and l and and antinodes at and y=0 and b. The period of this oscillation is h. In addition, the oscillation with has nodes at x=0 and l and antinodes at . The period of this oscillation is h. These periods correspond to the 5 and 10 h periods observed in the CWT and show that these oscillations cause delayed storm surges. The sea level differences observed at Izuhara (located on Tsushima Island) and Busan (in SCKP) during typhoon passages through the strait, as reported by Yi (1970), are likely associated with the 10 and 5 h period oscillation modes.
The above discussion was conducted under the assumption of no Coriolis force; however, Wu et al. (2021) demonstrated that the tidal dynamics (K2 and M2) in the Tsushima Strait are primarily governed by Kelvin waves, and partial reflection of Kelvin waves occurs at the junction between the Tsushima Strait and the Sea of Japan. The identified oscillations propagated with the coastline on their right, which is consistent with the typical propagation direction of Kelvin waves in the Northern Hemisphere. This suggests that the observed oscillatory behavior is strongly influenced by the characteristics of Kelvin waves. Niimi et al. (2022) compared numerical simulations of Typhoon Maysak (2020) with and without the Coriolis force and found that the second storm surge peak at the NCKI was significantly reduced when the Coriolis force was excluded. Notably, the 10 h oscillation component still appeared even in the absence of the Coriolis force; however, the 5 h oscillation component vanished. This indicates that the 5 h oscillation identified through continuous wavelet transform (CWT) analysis is highly sensitive to and likely governed by the Coriolis force.
Furthermore, among WCTS-type typhoons, those that travel northward through the Tsushima Strait – such as Maysak (2020) and Haishen (2020) – tend to produce a second storm surge peak that is both larger and longer-lasting. This is likely due to the continued southwesterly winds following the typhoon's passage, which induced Ekman transport. Even minor variations in typhoon tracks can lead to differences in the persistence of storm surge anomalies. In future research, we aim to identify WCTS-type typhoons that generate the most hazardous storm surges by considering the combined effects of Ekman transport, oscillations in the (1, 1) and (1, 0) modes, and the timing of the release of external forcing.
Given the potential for the delayed storm surges caused by WCTS-type typhoons, even after the first peak in water levels, it is crucial that we do not prematurely assume safety. Therefore, we believe it is essential to implement measures that extend the period during which people remain evacuated, preventing them from returning home too soon. Moreover, future climate change, characterized by increased typhoon intensity and sea level rise, could lead to unforeseen inundation in areas previously unaffected. Therefore, to prepare for such flooding, it is crucial for the relevant coastal regions to take measures. These include elucidating the mechanisms of water level rise and establishing predictive methods for these phenomena.
In this study, we investigated the mechanisms behind storm surge development along the NCKI using observational data, storm surge numerical simulations, and the CWT. Typhoons that induce large storm surges in the NCKI can be categorized based on their tracks – either approaching from the ECTS or from the SCKP through the WCTS.
For ECTS-type typhoons, storm surge peaks occur when the typhoon is closest to the NCKI. At this point, atmospheric pressure reaches its minimum, and northerly winds drive seawater toward the coast, resulting in a surge. This behavior is well explained by the inverted barometer effect and wind setup. In contrast, WCTS-type typhoons display a more complex pattern. The storm surge initially peaks as the typhoon nears the NCKI, then rapidly declines, followed by a second, larger peak after the typhoon has passed. At the time of this second peak, atmospheric pressure has returned to near-normal levels and wind speeds are low, rendering typical storm surge mechanisms – such as the barometer effect and wind setup – inadequate to explain the surge.
Spectral analysis using the CWT revealed a continuous 2 h periodic oscillation localized in Hakata Bay, along with the emergence of 5 and 10 h oscillations following the initial surge peak. To investigate the spatial characteristics of these longer-period oscillations, we conducted storm surge simulations and applied CWT analysis to the resulting spatial data. The 5 h oscillation, with antinodes at the NCKI and SCKP and a node at Tsushima Island located in the center of the strait, corresponds to the (1, 1) natural oscillation mode of the Tsushima Strait. The 10 h oscillation represents the (1, 0) mode. These oscillations are triggered by the release of potential energy stored within the strait after the typhoon exits into the Sea of Japan. The 5 h mode appears to be strongly influenced by the Coriolis force, as suggested by prior numerical experiments. The superposition of these (1, 0) and (1, 1) modes leads to the delayed second peak observed in NCKI storm surges.
We identified an anomalous storm surge phenomenon associated with typhoons passing through semi-enclosed straits under specific conditions and conducted a detailed investigation of the underlying mechanisms. Our findings emphasize the critical role of resonance effects in such straits, offering new insights into storm surge risks under particular typhoon scenarios. These mechanisms are not unique to the Tsushima Strait and may occur in other regions where typhoons or low-pressure systems pass through similar strait geometries. Importantly, variations in oscillation period, amplitude, and modal structure can lead to differences in the timing and magnitude of storm surges across different locations. Future climate change, with increased typhoon intensity and sea level rise, may cause unexpected flooding in previously unaffected areas. Therefore, it is crucial for coastal regions to prepare by understanding the mechanisms of water level rise and developing predictive methods.
During the preparation of this work, the authors used ChatGPT to improve the language. After using this tool, the authors reviewed and edited the content as needed. The authors take full responsibility for the content of the publication.
The datasets and files analyzed during the current study are available from the corresponding author upon reasonable request. However, some input data were obtained from third-party commercial sources and are not publicly accessible due to licensing restrictions. These proprietary datasets are described in the paper, and information on how to access them is available from the authors.
Conceptualization, SO, YI, and MY; Data curation, SO; Formal analysis, SO; Funding acquisition, SO; Investigation, SO and YI; Methodology, SO and YI; Project administration, MY; Resources, SO; Software, SO and YI; Supervision, YI and MY; Validation, SO; Visualization, SO; Writing – original draft preparation, SO; Writing – review & editing, SO, YI, and MY. All authors have read and agreed to the published version of the paper.
The contact author has declared that none of the authors has any competing interests.
Publisher's note: Copernicus Publications remains neutral with regard to jurisdictional claims made in the text, published maps, institutional affiliations, or any other geographical representation in this paper. While Copernicus Publications makes every effort to include appropriate place names, the final responsibility lies with the authors.
We thank the anonymous reviewers for their constructive comments. We also thank the staff of the Coastal and Ocean Engineering Laboratory for technical support.
This work was supported by JST BOOST, Japan (Grant Number JPMJBS2406).
This paper was edited by John M. Huthnance and reviewed by two anonymous referees.
Balaguru, K., Judi, D., and Leung, L.: Future hurricane storm surge risk for the U.S. gulf and Florida coasts based on projections of thermodynamic potential intensity, Climatic Change, 138, 99–110, https://doi.org/10.1007/s10584-016-1728-8, 2016. a
Bhaskaran, P. K., Rao, A. D., and Murty, T.: Tropical Cyclone-Induced Storm Surges and Wind Waves in the Bay of Bengal, Wiley, 237–294, https://doi.org/10.1002/9781119359203.ch17, 2020. a
Bilskie, M. V., Hagen, S. C., Medeiros, S. C., Cox, A. T., Salisbury, M., and Coggin, D.: Data and numerical analysis of astronomic tides, wind-waves, and hurricane storm surge along the northern Gulf of Mexico, Journal of Geophysical Research: Oceans, 121, 3625–3658, https://doi.org/10.1002/2015JC011400, 2016. a
Chen, C., Liu, H., and Beardsley, R. C.: An Unstructured Grid, Finite-Volume, Three-Dimensional, Primitive Equations Ocean Model: Application to Coastal Ocean and Estuaries, Journal of Atmospheric and Oceanic Technology, 20, 159–186, https://doi.org/10.1175/1520-0426(2003)020<0159:AUGFVT>2.0.CO;2, 2003. a
Cox, S.: pytides 0.0.4, GitHub [code], https://github.com/sam-cox/pytides, last access: 25 October 2022.
Esteban, M., Mikami, T., Shibayama, T., Takagi, H., Jonkman, S. N., and van Ledden, M.: Climate change adaptation in tokyo bay: the case for a storm surge barrier, Coastal Engineering Proceedings, 1, management.35, https://doi.org/10.9753/icce.v34.management.35, 2014. a
Hong, C.-H. and Yoon, J.-H.: The Effect of Typhoon on the Coastal Sea Level Variations in the Tsushima Straits, Oceanography in Japan, 1, 225–249, https://doi.org/10.5928/kaiyou.1.225, 1992. a, b
Ide, Y., Kora, T., Kodama, M., Yamashiro, M., and Hashimoto, N.: Long-term projection of storm surge characteristics in suo-nada sea using large ensemble climate projection data, Journal of Japan Society of Civil Engineers, Ser. B3 (Ocean Engineering), 76, I_1091–I_1096, https://doi.org/10.2208/jscejoe.76.2_I_1091, 2020. a
Igarashi, Y. and Tajima, Y.: Application of recurrent neural network for prediction of the time-varying storm surge, Coastal Engineering Journal, 63, 68–82, https://doi.org/10.1080/21664250.2020.1868736, 2021. a
Japan Meteorological Agency (RSMC Tokyo): RSMC Best Track Data (Text) 1951–2024, Japan Meteorological Agency [data set], https://www.jma.go.jp/jma/jma-eng/jma-center/rsmc-hp-pub-eg/besttrack.html, last access: 12 May 2024.
Japan Hydrographic Association: M7014 depth data (Bathymetry), JHA [data set], https://www.jha.or.jp/jp/shop/products/btdd/, last access: 25 Ocotber 2022.
JODC: Regional Delayed Mode Data Base (RDMDB), JODC [data set], https://near-goos1.jodc.go.jp/vpage/search.html, last access: 25 October 2022.
Kennedy, A. B., Gravois, U., Zachry, B. C., Westerink, J. J., Hope, M. E., Dietrich, J. C., Powell, M. D., Cox, A. T., Luettich Jr, R. A., and Dean, R. G.: Origin of the Hurricane Ike forerunner surge, Geophysical Research Letters, 38, L08608, https://doi.org/10.1029/2011GL047090, 2011. a
Kim, S., Matsumi, Y., Yasuda, T., and Mase, H.: Mechanism of Abnormal Storm Surges after Passage of Typhoons around West Coasts of the Sea of Japan, Journal of Japan Society of Civil Engineers, Ser. B2 (Coastal Engineering), 66, 221–225, https://doi.org/10.2208/kaigan.66.221, 2010. a
Large, W. G. and Pond, S.: Open Ocean Momentum Flux Measurements in Moderate to Strong Winds, Journal of Physical Oceanography, 11, 324–336, https://doi.org/10.1175/1520-0485(1981)011<0324:OOMFMI>2.0.CO;2, 1981. a
Lee, G. R., Gommers, R., Waselewski, F., Wohlfahrt, K., and O'Leary, A.: PyWavelets: A Python package for wavelet analysis, Journal of Open Source Software, 4, 1237, https://doi.org/10.21105/joss.01237, 2019. a
Mellor, G. L. and Yamada, T.: Development of a turbulence closure model for geophysical fluid problems, Reviews of Geophysics, 20, 851–875, 1982. a
Mori, S., Shimura, T., Miyashita, T., Webb, A., and Mori, N.: Future changes in extreme storm surge based on a maximum potential storm surge model for East Asia, Coastal Engineering Journal, 64, 630–647, https://doi.org/10.1080/21664250.2022.2145682, 2022. a
Nakajo, S., Fijiki, H., Kim, S., Mori, N., Shibutani, Y., and Yasuda, T.: An parametric study on potential of storm surge in Tokyo Bay, Journal of Japan Society of Civil Engineers, Ser. B2 (Coastal Engineering), 71, I_199–I_204, https://doi.org/10.2208/kaigan.71.I_199, 2015. a
Niimi, M., Ide, Y., Yamashiro, M., Hashimoto, N., and Kodama, M.: A case study of storm surge inundation in dokai bay by typhoon maysak in 2020 and its generation mechanism, Journal of Japan Society of Civil Engineers, Ser. B2 (Coastal Engineering), 78, I_217–I_222, https://doi.org/10.2208/kaigan.78.2_I_217, 2022. a, b, c, d
Shen, J. and Gong, W.: Influence of model domain size, wind directions and Ekman transport on storm surge development inside the Chesapeake Bay: A case study of extratropical cyclone Ernesto, 2006, Journal of Marine Systems, 75, 198–215, 2009. a
Smagorinsky, J.: General circulation experiments with the primitive equations: I. The basic experiment, Monthly Weather Review, 91, 99–164, 1963. a
Soontiens, N., Allen, S. E., Latornell, D., Souëf, K. L., Machuca, I., Paquin, J.-P., Lu, Y., Thompson, K., and Korabel, V.: Storm Surges in the Strait of Georgia Simulated with a Regional Model, Atmosphere-Ocean, 54, 1–21, https://doi.org/10.1080/07055900.2015.1108899, 2016. a
Tkalich, P., Vethamony, P., Babu, M. T., and Malanotte-Rizzoli, P.: Storm surges in the Singapore Strait due to winds in the South China Sea, Natural Hazards, 66, 1345–1362, https://doi.org/10.1007/s11069-012-0211-8, 2013. a
Walton, T. and Dean, R.: Influence of discrete step size on wind setup component of storm surge, Coastal Engineering, 56, 1005–1008, https://doi.org/10.1016/J.COASTALENG.2009.05.003, 2009. a
Wu, D., Fang, G., Wei, Z., and Cui, X.: Study of the tidal dynamics of the Korea Strait using the extended Taylor method, Ocean Sci., 17, 579–591, https://doi.org/10.5194/os-17-579-2021, 2021. a
Wu, G., Shi, F., Kirby, J. T., Liang, B., and Shi, J.: Modeling wave effects on storm surge and coastal inundation, Coastal Engineering, 140, 371–382, 2018. a
Wunsch, C. and Stammer, D.: Atmospheric loading and the oceanic “inverted barometer” effect, Reviews of Geophysics, 35, 79–107, 1997. a
Yamashiro, M., Sonoda, A., Yurino, A., Kubo, T., Yokota, M., and Hashimoto, N.: Study on basic characteristics of storm surge in Hakata Bay, Journal of Japan Society of Civil Engineers, Ser. B3 (Ocean Engineering), 72, I_348–I_353, https://doi.org/10.2208/jscejoe.72.I_348, 2016. a, b
Yang, J.-A., Kim, S., Son, S., Mori, N., and Mase, H.: Assessment of uncertainties in projecting future changes to extreme storm surge height depending on future SST and greenhouse gas concentration scenarios, Climatic Change, 1–18, https://doi.org/10.1007/s10584-020-02782-7, 2020. a
Yi, S.-U.: Variations of Oceanic Condition and Mean Sea Level in the Korea Strait, University of Hawaii Press, Honolulu, 125–142, https://doi.org/10.1515/9780824885830-015, 1970. a
Yoon, J. J. and Shim, J. S.: Estimation of storm surge inundation and hazard mapping for the southern coast of Korea, Journal of Coastal Research, 856–861, https://doi.org/10.2112/si65-145.1, 2013. a
Yoon, J. J., Shim, J. S., Park, K. S., and Lee, J. C.: Numerical experiments of storm winds, surges, and waves on the southern coast of Korea during Typhoon Sanba: the role of revising wind force, Nat. Hazards Earth Syst. Sci., 14, 3279–3295, https://doi.org/10.5194/nhess-14-3279-2014, 2014. a
Zhang, W.-Z., Shi, F., Hong, H.-S., Shang, S.-P., and Kirby, J. T.: Tide-surge Interaction Intensified by the Taiwan Strait, Journal of Geophysical Research: Oceans, 115, https://doi.org/10.1029/2009JC005762, 2010. a
- Abstract
- Introduction
- Study area
- Selected typhoons
- Observed storm surge and weather data characteristics
- Numerical simulation
- Spectral analysis using wavelet transform
- Discussion
- Conclusions
- Declaration of generative AI and AI-assisted technologies in the writing process
- Code and data availability
- Author contributions
- Competing interests
- Disclaimer
- Acknowledgements
- Financial support
- Review statement
- References