the Creative Commons Attribution 4.0 License.
the Creative Commons Attribution 4.0 License.
 | 29 Jul 2025
The Southern Ocean Time Series: a climatological view of hydrography, biogeochemistry, phytoplankton community composition, and carbon export in the Subantarctic Zone
Elizabeth H. Shadwick
Cathryn A. Wynn-Edwards
Ruth S. Eriksen
Peter Jansen
Xiang Yang
Gemma Woodward
Diana Davies
The Southern Ocean Time Series (SOTS) provides highly temporally resolved observations of the physical, chemical, and biological variability in the upper ocean, as well as the export of particulate organic and inorganic carbon to the ocean interior, in the subantarctic region south of Australia. The SOTS observatory focuses on the subantarctic region because of its importance in the formation of mode water and the associated uptake and storage of anthropogenic heat and carbon. The region is also critical for the supply of oxygen to the ocean interior and the export of nutrients to fuel primary production in broad areas of the low-latitude global ocean. The SOTS observatory is the longest running multidisciplinary initiative in the open Southern Ocean and has delivered high-quality observations from the surface to the seafloor for more than a decade and, for some parameters, for over two decades, using two deep-water moorings. The moorings are serviced annually, providing additional opportunities for shipboard sampling and sensor validation and calibration. Using observations collected at the SOTS site between 1997 and 2022, we present the seasonal variability in upper-ocean hydrography, biogeochemistry, phytoplankton and microplankton community composition, and diversity, along with particulate organic and particulate inorganic carbon export to the deep ocean. This climatological view of the region is complemented by a review of recent findings underpinned by observations collected by the SOTS observatory and highlighting the ongoing need for long time series to better understand the Subantarctic Ocean and its response to a changing climate.
- Article
(11631 KB) - Full-text XML
- BibTeX
- EndNote


The Southern Ocean plays a predominant role in the movement of heat and carbon into the ocean interior, thereby moderating global average surface climate, variability, and rate of change. The oceanic uptake of excess anthropogenic heat and carbon dioxide (CO2) drives changes in ocean ecosystems via warming (e.g. Couespel et al., 2021), stratification, acidification (e.g. Mortenson et al., 2021), and ventilation (e.g. Gnanadesikan et al., 2007), with an unknown mix of negative and positive consequences. The Southern Ocean Time Series (SOTS), a facility of the Australian Integrated Marine Observing System (IMOS) and a component of the global OceanSITES network, acquires data that allow these processes to be quantified in a region where they are most intense and relatively poorly understood. The oceanic uptake of heat and CO2 varies over many timescales from diel insolation cycles, to daily or weekly weather events in the atmosphere (e.g. Schulz et al., 2012), to the evolution of eddies in the ocean (e.g. Yang et al., 2024a), to seasonal and interannual dynamics (Pardo et al., 2019; Shadwick et al., 2023). Thus, a complete understanding of these processes requires high-frequency and, necessarily, automated observations, sustained over many years.
The SOTS observatory comprises two deep-water moorings: the Southern Ocean Flux Station (SOFS), which focuses on heat, oxygen, and CO2 fluxes across the air–sea interface as well as the physical conditions and biological processes that control them (e.g. Schulz et al., 2012; Shadwick et al., 2015; Pardo et al., 2019; Yang et al., 2024a), and the Subantarctic Zone (SAZ) sediment trap mooring, which focuses on quantifying the transfer of carbon to the ocean interior by sinking particles (i.e. the biological carbon pump; Trull et al., 2001b), providing samples for ecological (e.g. Trull et al., 2019; Rigual-Hernández et al., 2020a), palaeo-proxy (e.g. King and Howard, 2003; Moy et al., 2009), and carbon flux estimates (e.g. Trull et al., 2001b; Wynn-Edwards et al., 2020c). Here, we present observations collected at the SOTS site between 1997 and 2022 (Fig. 1 and Table A1). We construct seasonal climatologies of physical, chemical, and biological variables, including the inorganic carbon (CO2) system, and quantify particulate carbon export and its composition (i.e. particulate organic and inorganic carbon and biogenic silica). We report here, for the first time, the full seasonal cycle of the phytoplankton (including coccolithophorid taxa), resolved from near weekly samples, along with the seasonal cycles of key hydrographic and biogeochemical parameters. Using records for a suite of physical and biogeochemical parameters that now range in length from ∼10 years to more than >20 years, we evaluate changes in time. Finally, we provide a review of the research based on observations collected at the SOTS site over its lifetime, via the mooring platforms themselves, and the associated annual deployment voyages; we then offer perspectives for the ongoing value of fixed, open-ocean time-series initiatives.
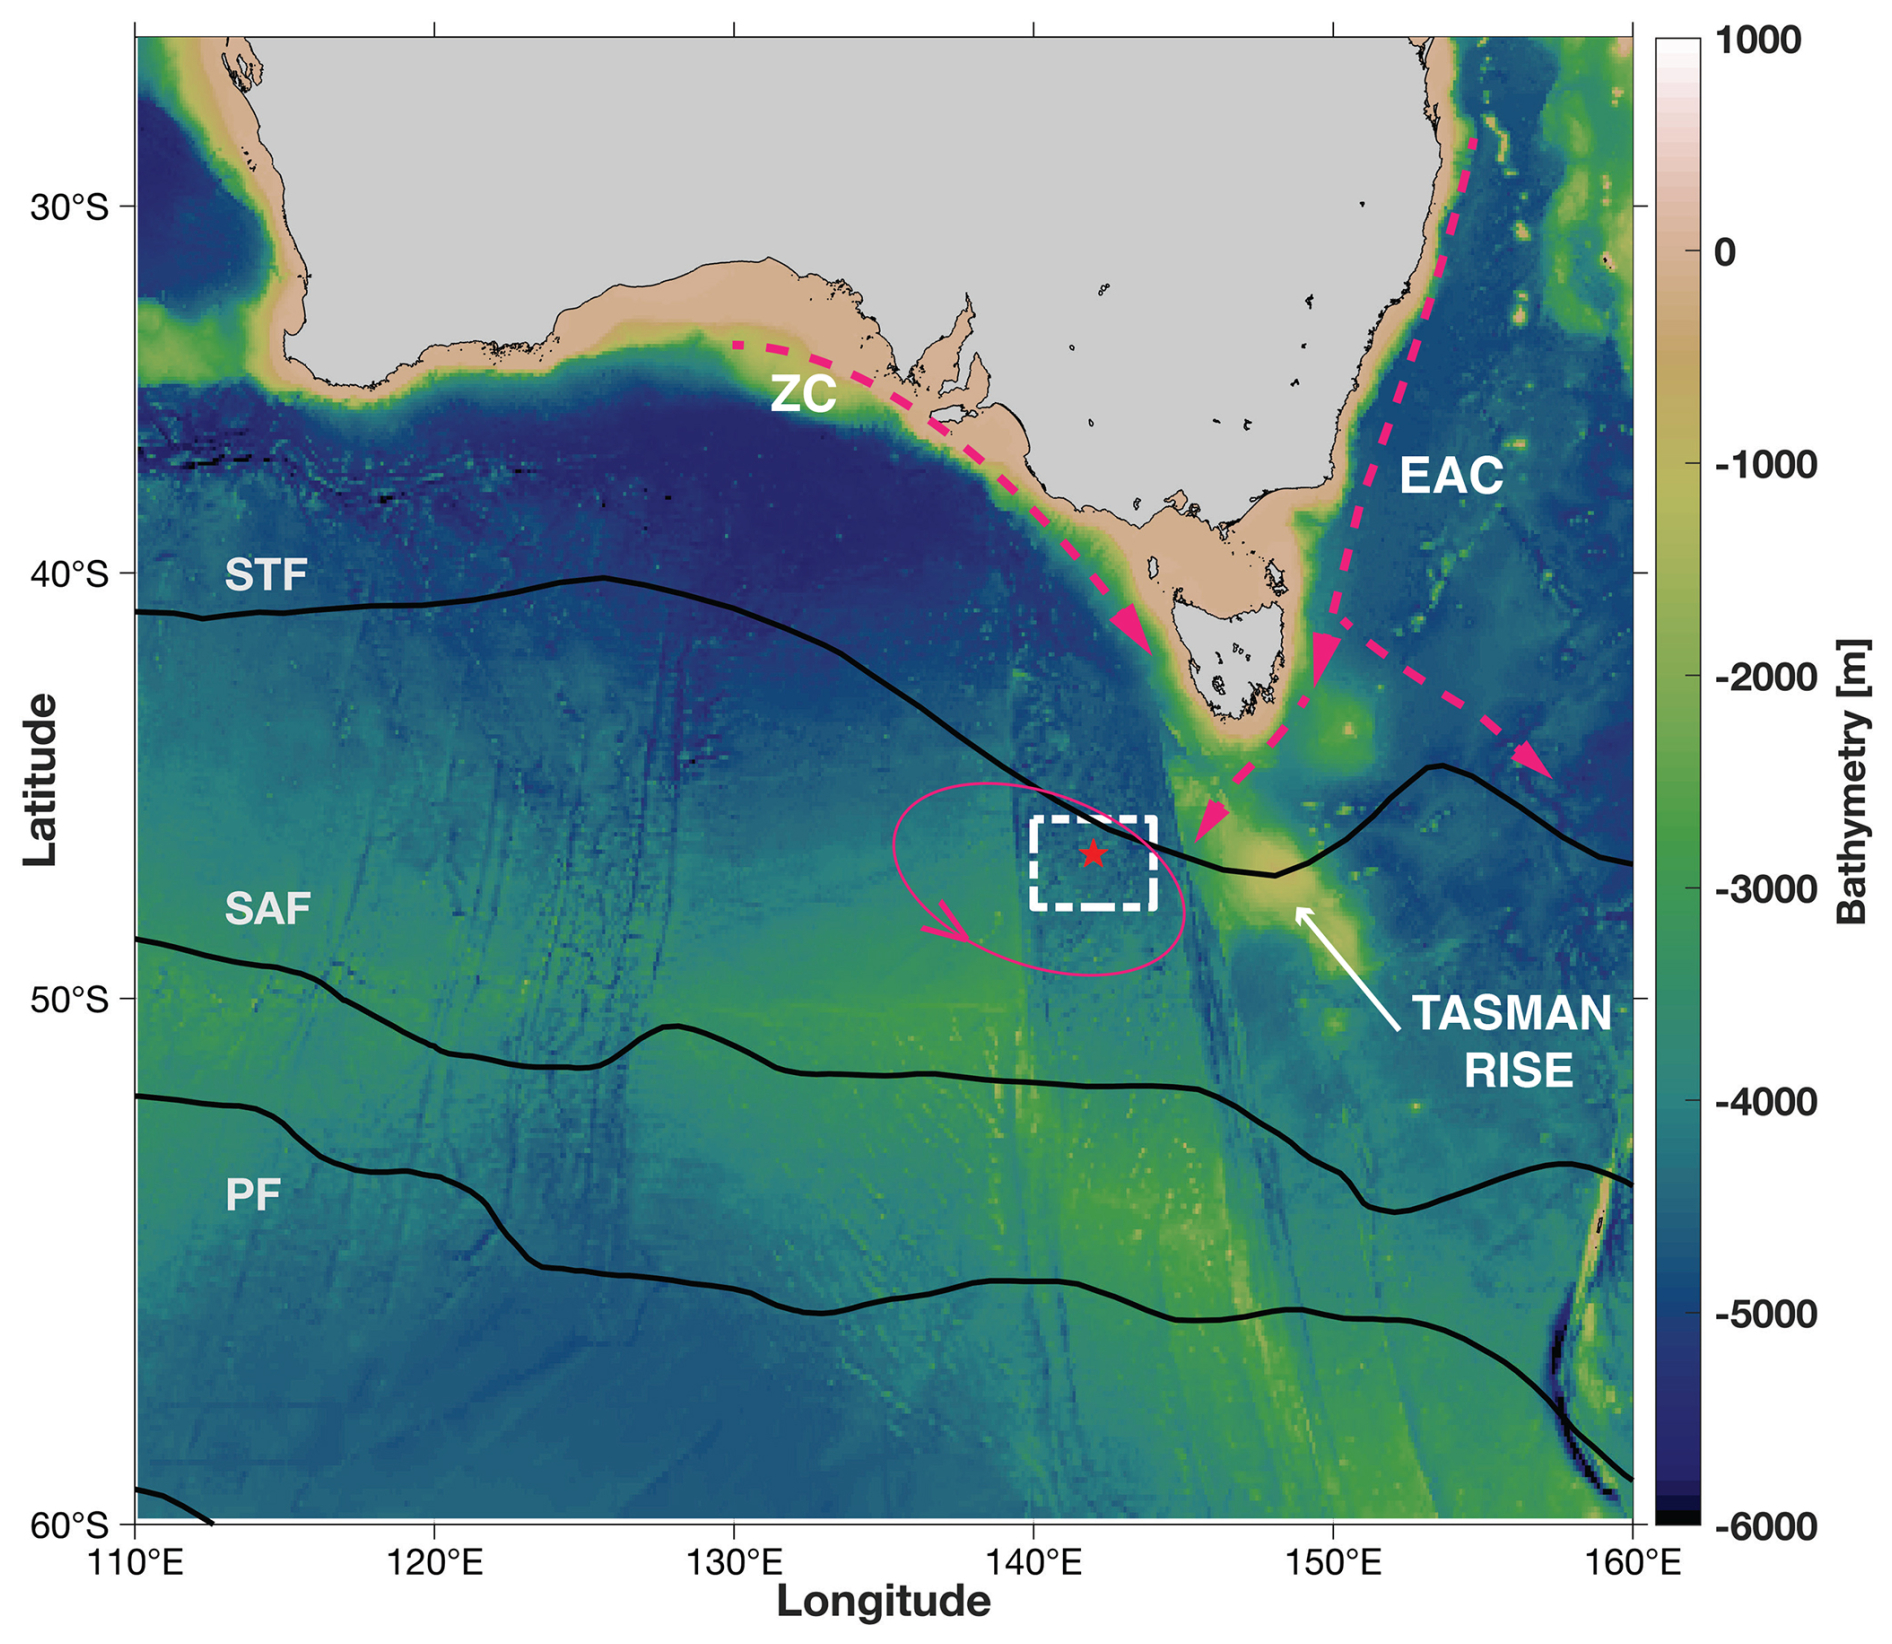
Figure 1The location of the SOTS site (red star) and broader region (white box) in the Subantarctic Zone (SAZ) southwest of Tasmania. Also shown are the climatological locations of the Subtropical (STF), Subantarctic (SAF), and Polar (PF) fronts following Orsi et al. (1995) and the schematic positions of the Zeehan Current (ZC), extensions of the East Australian Current (EAC), and a recirculation west of the Tasman Rise following (Herraiz-Borreguero and Rintoul, 2010). The bathymetry is from the GEBCO 2024 gridded product.
1.1 Oceanographic setting
The SOTS site is located in the SAZ southwest of Tasmania, with the nominal location at 47° S, 142° E, within the area bounded by 46–48° S and 140–144° E (Fig. 1). The site is in a region of weak mean flow, south of the Subtropical Front (STF), and in deep waters (>4500 m) west of the Tasman Rise. Observations from the SOTS site are representative of a broader region of the SAZ (e.g. Trull et al., 2001a, 2019; Shadwick et al., 2015; Yang et al., 2024a). There is a seasonal evolution of phytoplankton biomass accumulation that progresses from north to south (Fig. 2), as well as the presence of elevated chlorophyll on the Tasman shelf, northeast of the SOTS site. The accumulation of chlorophyll is relatively low and generally distributed uniformly in the mixed layer, unlike the conditions further south (i.e. south of the Subantarctic Front, SAF) where a subsurface chlorophyll maximum is present (e.g. Parslow et al., 2001; Boyd et al., 2024).
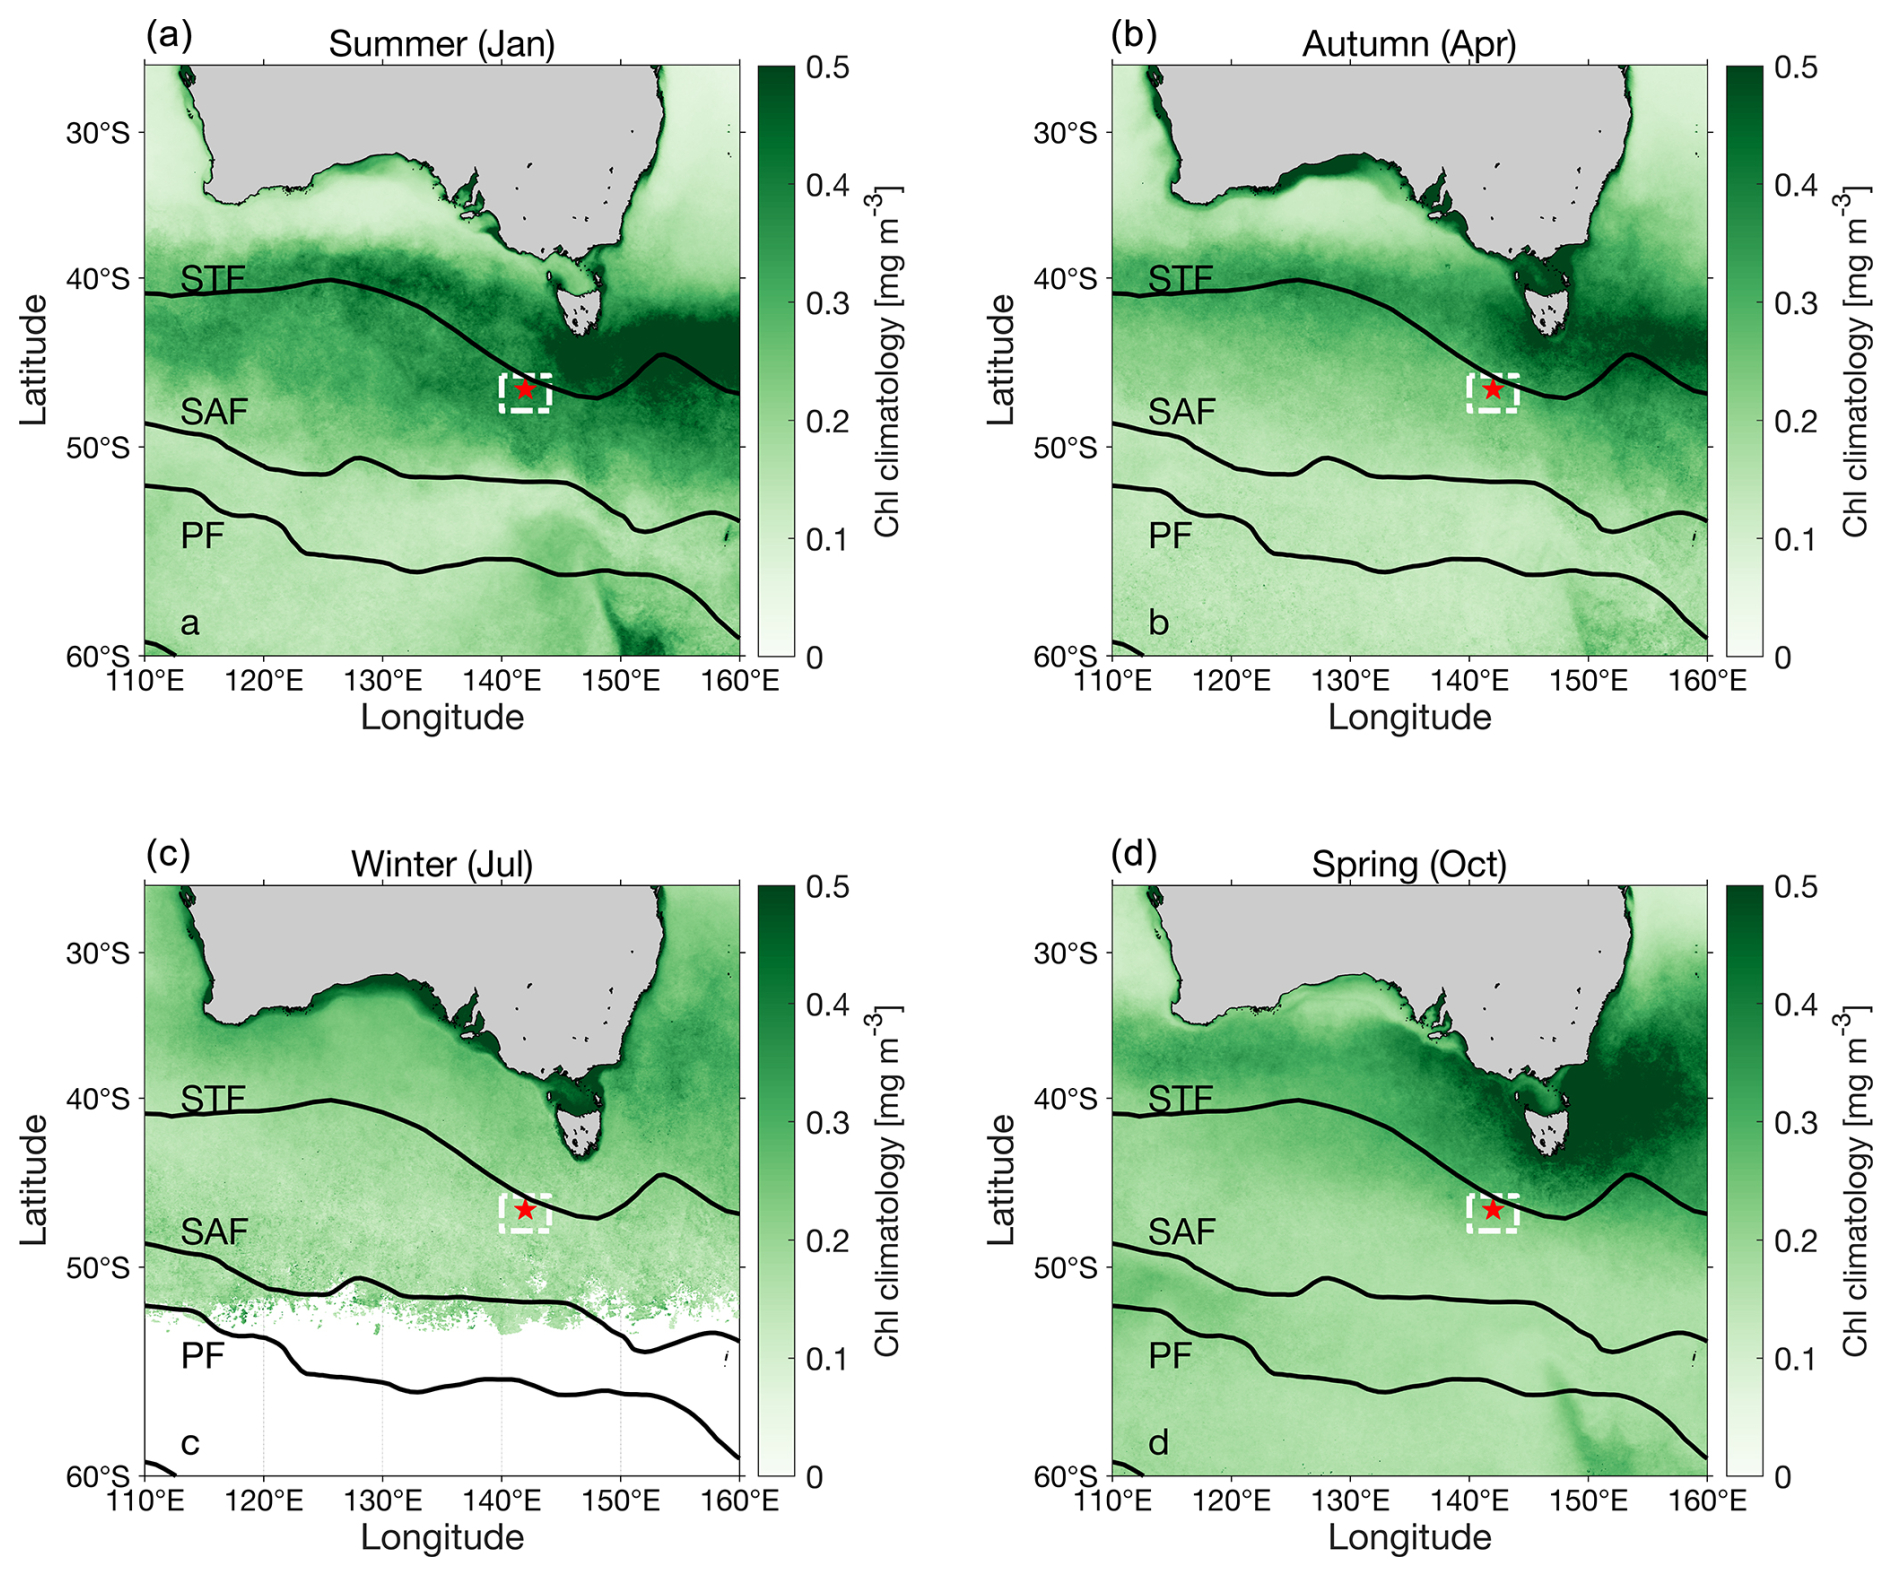
Figure 2Mean seasonal chlorophyll concentrations from satellite observations in the SAZ region south of Australia. The SOTS site (red star) and broader region (white box) are shown, along with the climatological locations of the STF, SAF, and PF as in Fig. 1. (a) Summer (Jan), (b) Autumn (Apr), (c) Winter (Jul), and (d) Spring (Oct).
The upper 500 m of the water column at the site is characterized by warm, salty Subtropical Water, from extension of the Zeehan Current (Cresswell, 2000) and waters of the East Australian Current that transit through channels in the Tasman Rise (Fig. 2; Herraiz-Borreguero and Rintoul, 2011). This is underlain by cooler, fresher, and relatively oxygen-rich Subantarctic Mode Water (SAMW; Herraiz-Borreguero and Rintoul, 2010; Sarmiento et al., 2004), which is formed by deep autumn and winter convection in the region (e.g. Tamsitt et al., 2020) and makes an important contribution to the uptake and storage of anthropogenic heat and CO2 (Metzl et al., 1999; Sabine et al., 2004; Takahashi et al., 2009). Below the SAMW (Fig. 3) lies cooler and more saline Antarctic Intermediate Water (AAIW), and below a depth of roughly 1500 m, the water column is dominated by Circumpolar Deep Water (CDW; Rintoul and Bullister, 1999; Traill et al., 2024).
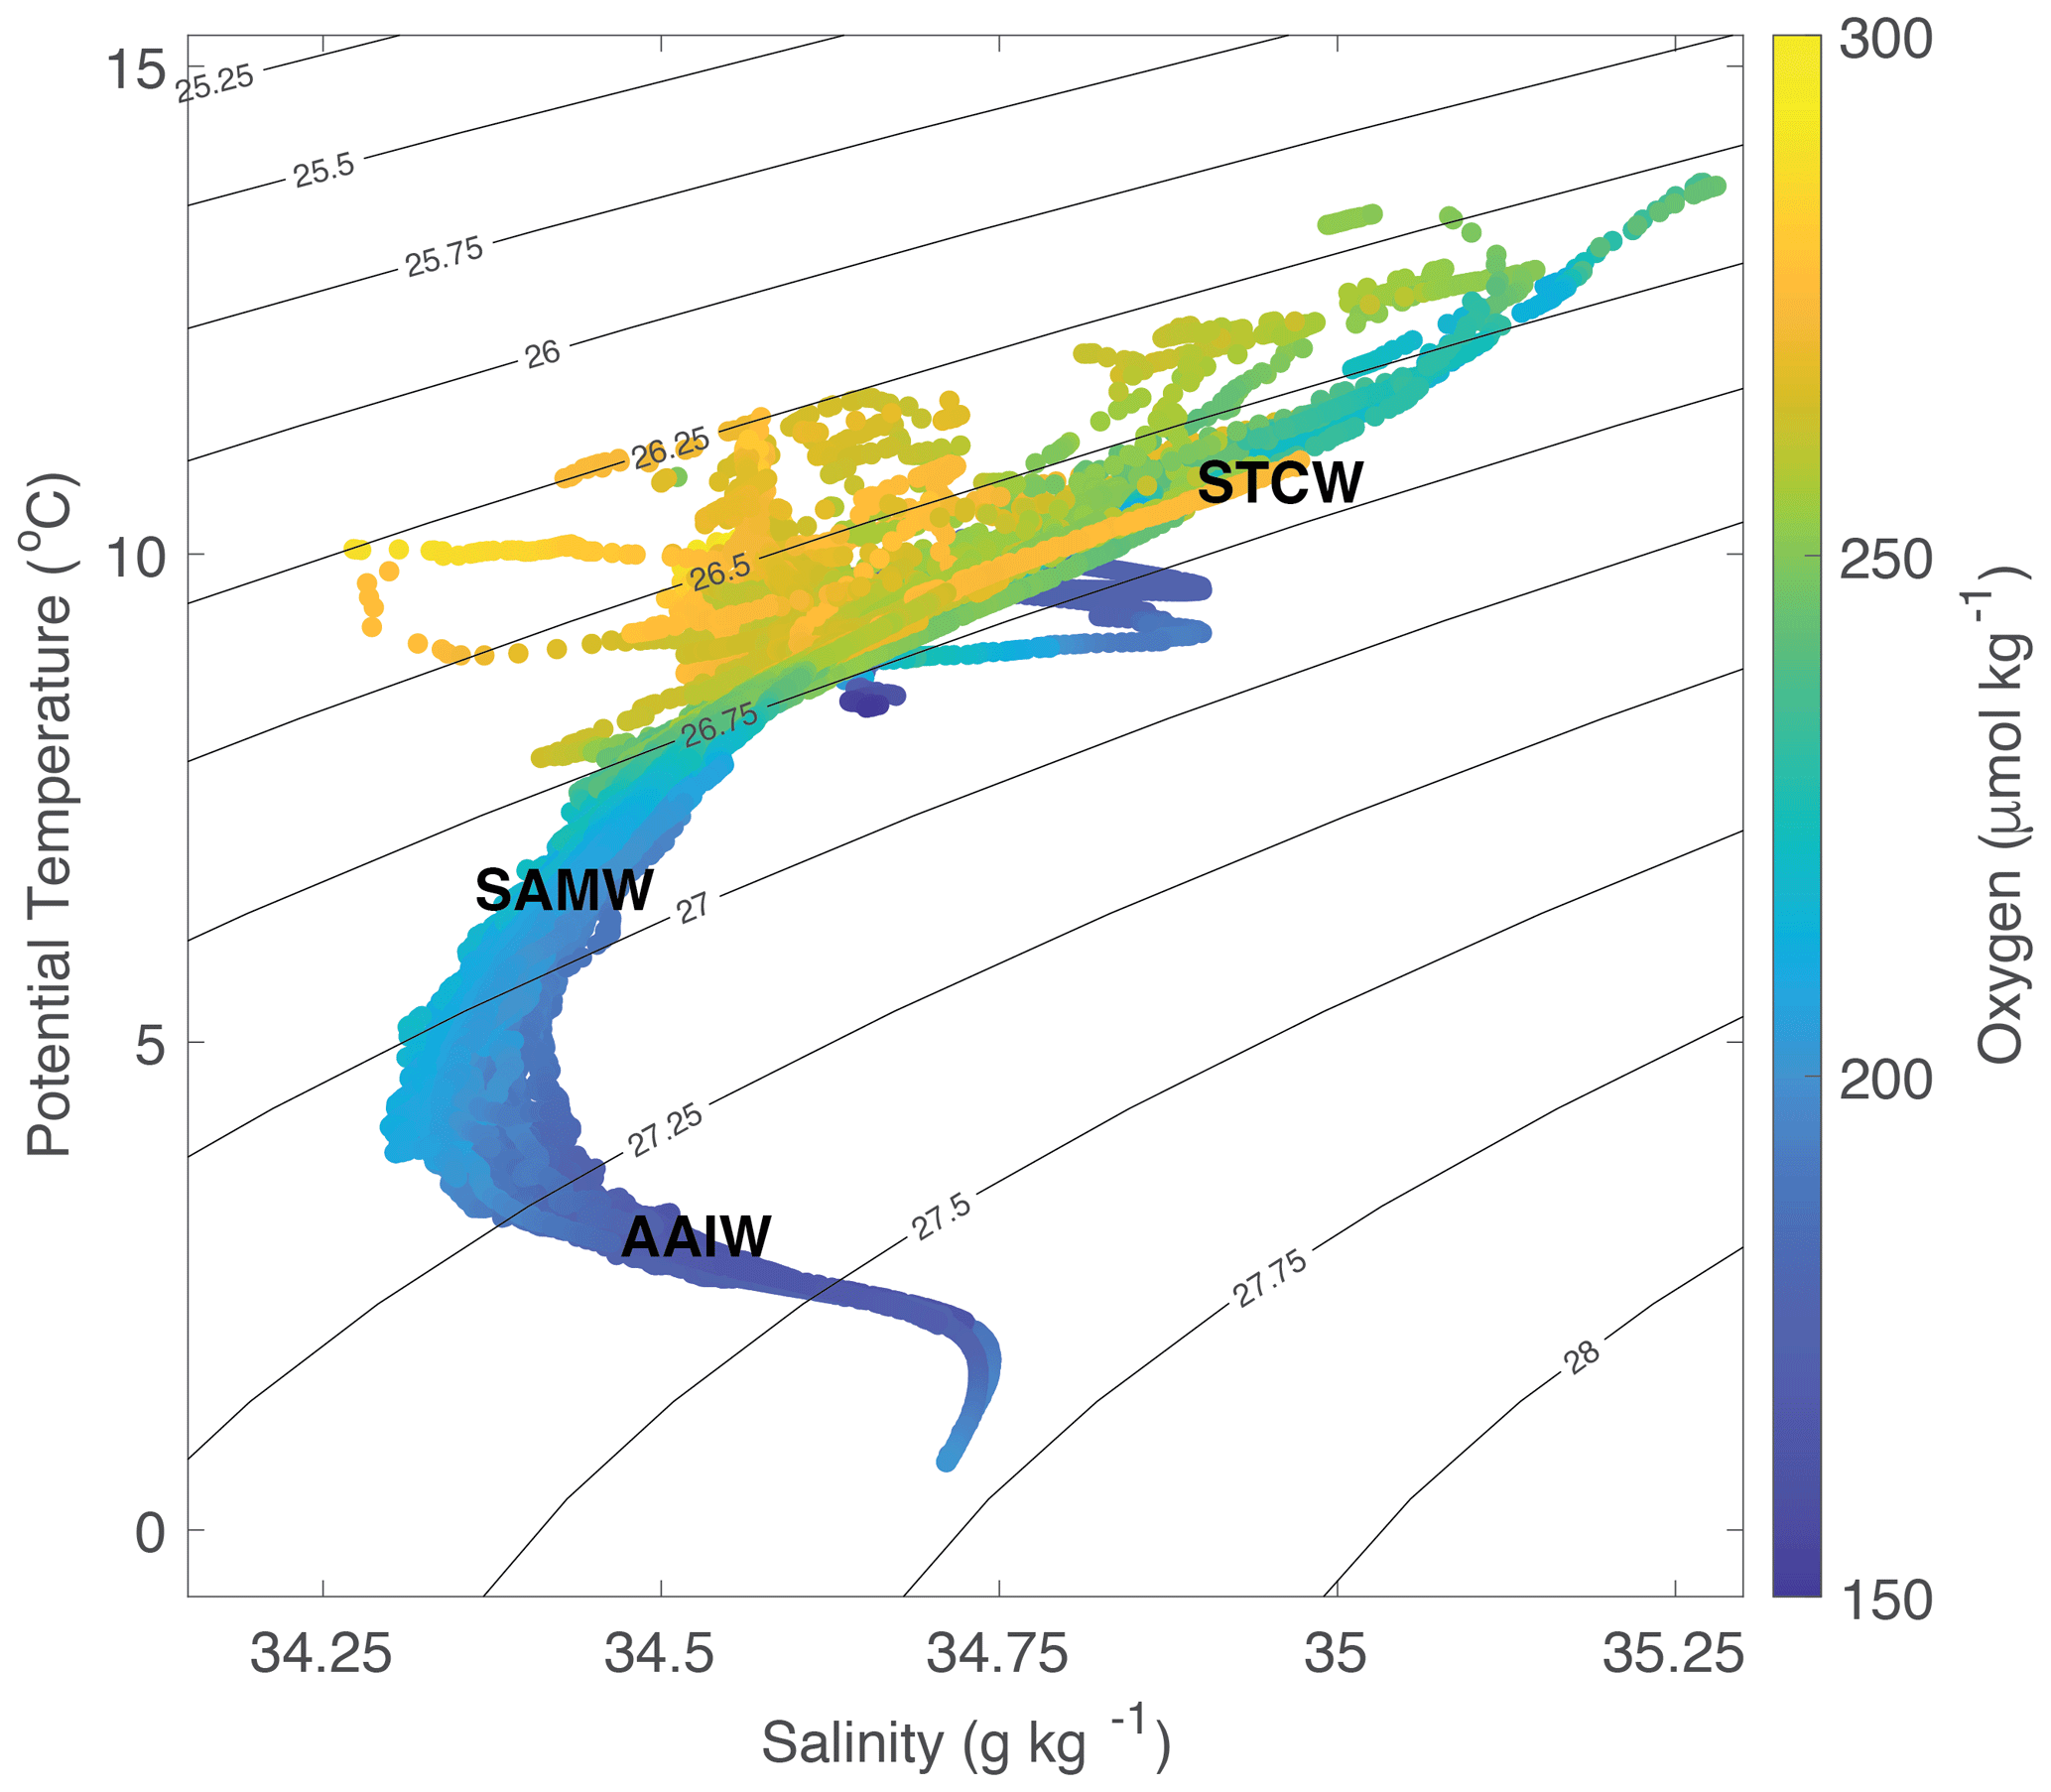
Figure 3Potential temperature vs. salinity for all shipboard CTD sensor data collected between 2010 and 2022 at the SOTS site, with the concentration of dissolved oxygen indicated by the colour, and the major water masses, i.e. Subtropical Surface Water (STCW), Subantarctic Mode Water (SAMW), and Antarctic Intermediate Water (AAIW), indicated schematically.
2.1 The Southern Ocean Flux Station and Subantarctic Zone moorings
All moorings are numbered sequentially (see Table A1 for deployment details) and are deployed and recovered annually on voyages to the SOTS region described below. Prior to 2010, a third mooring, the PULSE mooring, was deployed and used to measure upper-ocean biogeochemistry. In 2016, the PULSE and SOFS moorings were combined, with the SOFS prefix retained. Surface data from the SOFS mooring are relayed by satellite, while the subsurface (10 m and deeper) data on both SOFS and SAZ are stored and downloaded when the moorings are recovered approximately 12 months later. All data are available via the Australian Ocean Data Network (AODN) portal (https://portal.aodn.org.au, last access: 24 July 2025).
The SOFS mooring (Fig. A1) is a heavy-gauge “S-tether” mooring with a meteorological tower that supports twin ASIMET systems measuring long- and short-wave radiation, sea-level pressure, atmospheric temperature, humidity, rain, and wind, all components necessary to quantify fluxes of heat, mass, and momentum (Schulz et al., 2012), as well as photosynthetically active radiation (PAR). Surface wave spectra are measured using a motion reference unit. The partial pressure of CO2 (pCO2) in air and water is measured with an infrared gas spectrometer (Sutton et al., 2014), and mixed-layer zooplankton and mesopelagic fish abundances are estimated with a downward-looking acoustic backscatter instrument (Simrad WBat Mini). Finally, the SOFS surface float houses a modified McLane RAS-500 water sampler, which collects 48 individual 500 mL samples for analyses of nitrate, phosphate, silicate (Davies et al., 2020), and total alkalinity (Alk; Shadwick et al., 2020), as well as phytoplankton community composition by microscopy (Eriksen et al., 2020). We note that, prior to SOFS-7, the RAS sampler was deployed at a depth of 30 m (Eriksen et al., 2018). A package of biogeochemical sensors (dissolved oxygen, chlorophyll fluorescence, and optical backscatter) is located at 30 m, and a novel trace-metal clean water sampler is located at 50 m (van der Merwe et al., 2011). Subsurface temperature, salinity, and dissolved oxygen are measured to quantify mixed-layer dynamics and capture the deep convection that occurs in winter (Weeding and Trull, 2014; Shadwick et al., 2015, 2023). The subsurface instruments are mounted at static depths (30, 50, 100, 125, 150, 200, 250, 300, and 500 m in recent years; see Fig. A1). The SOFS mooring design has proven robustness at the SOTS site, with durations greater than 16 months with >90 % data return. Fatigue calculations now suggest greater than 4 years of durability for all elements of the mooring.
The SAZ sediment trap mooring (Fig. A2) is a subsurface, high-tension mooring equipped with three McLane PARFLUX-Mark78H conical traps (at nominally 1000, 2000, and 3800 m depth) that collect sinking particle flux samples with fortnightly resolution, preserved with mercuric chloride (Trull et al., 2001b; Wynn-Edwards et al., 2020c). Samples are analysed for total mass flux, particulate organic carbon (POC), particulate inorganic carbon (PIC), and biogenic silica (BSi), with details given in Wynn-Edwards et al. (2020b). The SAZ mooring also provides current metre measurements and a deep (∼4500 m) ocean conductivity, temperature, and depth (CTD) sensor to measure ocean heat content below the depth of typical Argo profiling float measurements (Jansen et al., 2022c). The SAZ mooring design is robust, and SAZ deployments have performed faultlessly, with 100 % sample return between 2009 and 2021.
2.2 Annual voyages and ancillary data
The annual deployment and recovery voyages to the SOTS site, on either the RV Southern Surveyor or, from 2015 onwards, the RV Investigator (see Fig. 4 and Table A1), collect additional sensor and sample measurements using various shipboard systems (e.g. a CTD rosette, nets, underway sensors, profiling floats, gliders, and towed vehicles). Voyages generally occur in the austral autumn season (between March and May) partly due to ship logistics and partly to limit biofouling of sensors in advance of the initiation of the productive season. The full suite of activities undertaken on any particular voyage are detailed in individual voyage reports, which are produced annually and are available in an online repository (e.g. Wynn-Edwards et al., 2020a).
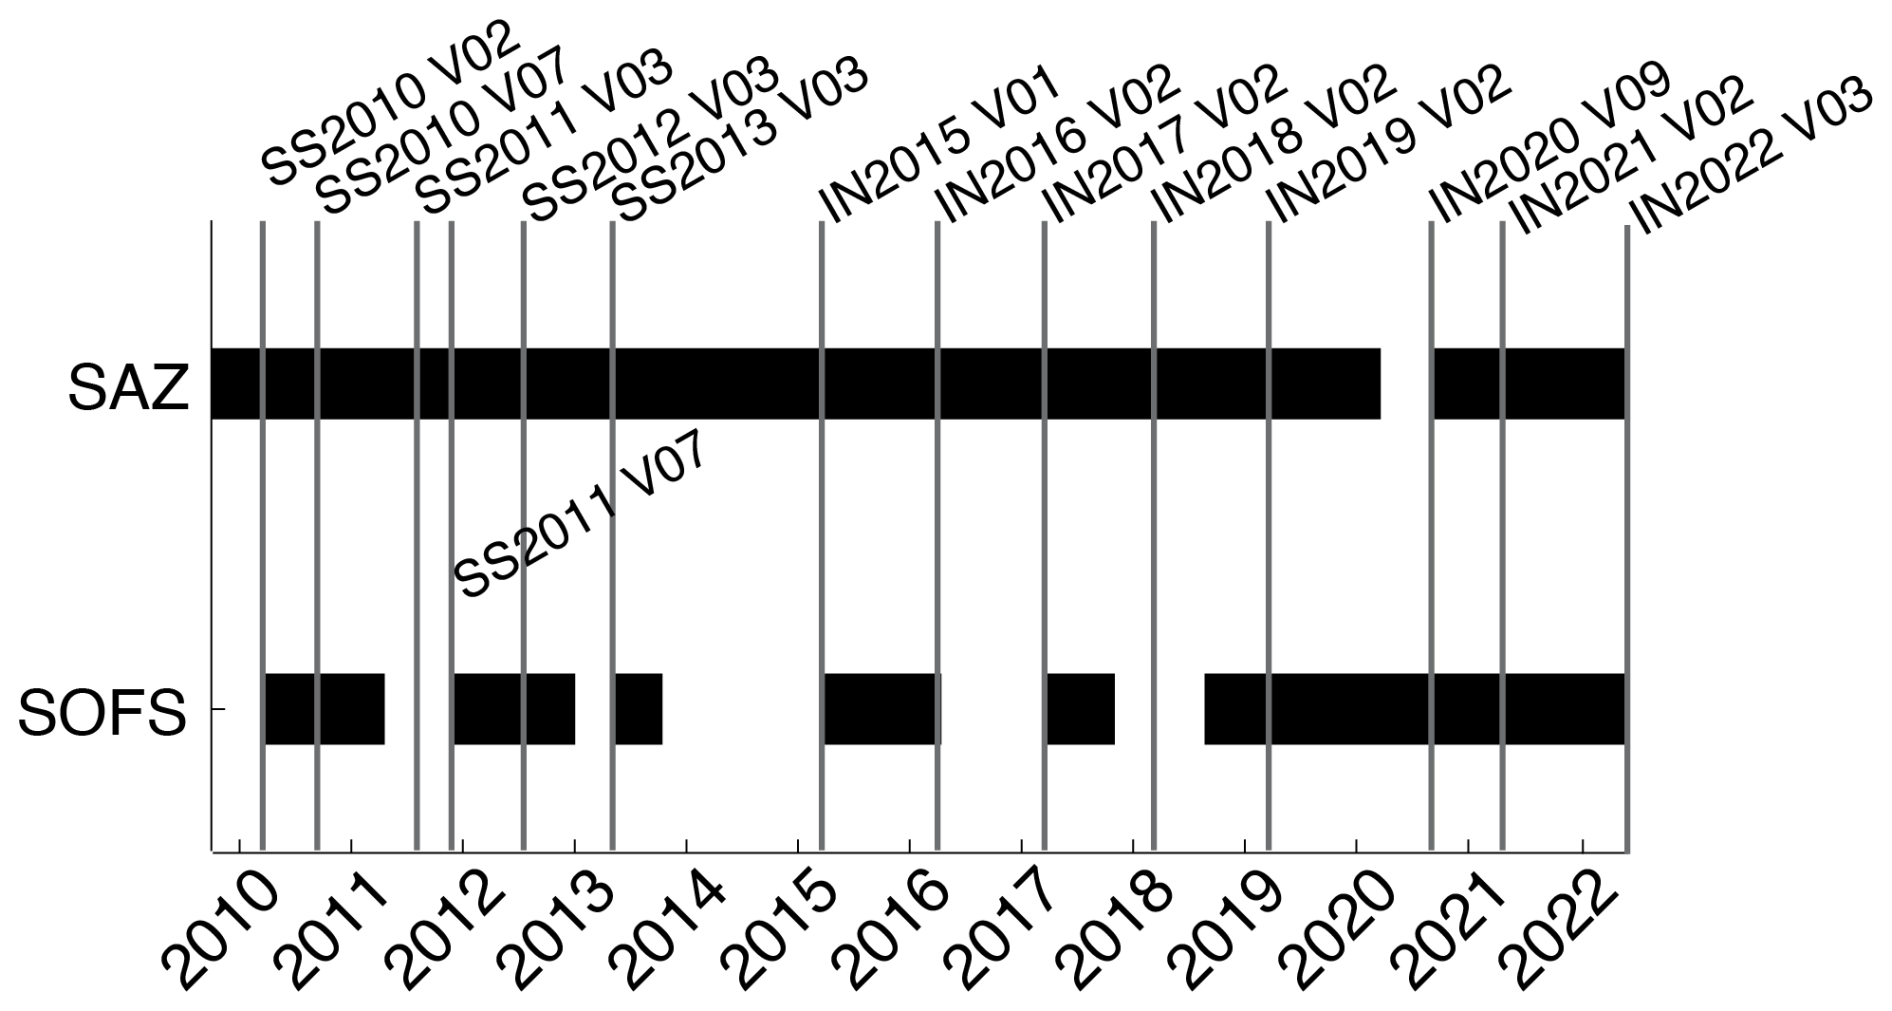
Figure 4History of mooring deployments and recoveries at the SOTS site between 2010 and 2022 and the associated voyage names, with the prefix “SS” referring to the RV Southern Surveyor and the prefix “IN” referring to the RV Investigator. The SAZ mooring record goes back much further, beginning in 1997 (see Table A1 for additional details).
Ancillary data were used here to expand the observations beyond those measured by the SOTS moorings directly. The Ocean-Colour Climate Change Initiative (OC-CCI; Sathyendranath et al., 2019) product was used to make seasonal maps of surface chlorophyll concentration in the SOTS region (Fig. 2). A time series of net primary production (NPP) from two satellite-based algorithms, the Vertically Generalized Production Model (VGPM; Behrenfeld and Falkowski, 1997) and the Carbon-based Production Model (CbPM; Westberry et al., 2008), was sourced from the Oregon State Ocean Productivity website. The STF was defined by a potential temperature of 11 °C at 150 m (Orsi et al., 1995) and computed using gridded Argo data with a spatial resolution of 1° (Roemmich and Gilson, 2009). Here, the time series of the STF location was averaged in two longitudinal ranges, 140–144 and 130–150° E, to reflect the positions of the SOTS site and the broader region, respectively.
2.3 Data quality control procedures, construction of seasonal cycles, and analysis of trends
All sensor data collected at the SOTS site undergo rigorous quality control (QC) within approximately 12 months of mooring recovery. The SOTS QC procedures apply automated tests following QARTOD recommendations for in situ temperature, salinity, and oxygen data quality control, with the test parameters tailored to reflect regional oceanography. The estimated magnitude of uncertainty for temperature, salinity, and dissolved oxygen is 0.3 °C, 0.003 kg m−3, and 9 µmol kg−1, respectively. Additional details for the temperature QC are given in Jansen et al. (2022c); for salinity, in Jansen et al. (2022b); and for oxygen, in Jansen et al. (2023). The QC procedure for the SOTS chlorophyll fluorescence (Chl) and optical backscatter (Bbp) sensor data are given in Schallenberg et al. (2017). The QC of surface water and atmospheric CO2 partial pressure (pCO2) are undertaken by NOAA PMEL as described in Sutton et al. (2014).
Sample data from discrete observations collected at the SOTS site are also subjected to rigorous QC, generally within 12 months of mooring recovery. Analysis of nutrients (nitrate, phosphate, and silicate) is undertaken at CSIRO following established procedures (Rees et al., 2019). Detailed QC procedures for the nutrient observations are given in Davies et al. (2020); the estimated magnitude of uncertainty for nitrate, phosphate, and silicate is 0.7, 0.1, and 0.8 µmol kg−1, respectively. Analysis of dissolved inorganic carbon (TCO2) and Alk from discrete samples collected on annual voyages, as well as for samples collected on the SOFS mooring, is undertaken at CSIRO following Dickson et al. (2007) with the QC procedures described in Shadwick et al. (2020), with the estimated uncertainty for both being less than 2 µmol kg−1. A relationship between Alk and salinity at the SOTS site has been developed from samples collected over many years (e.g. Shadwick et al., 2015, 2023), which is used to generate a time series of Alk from sensor salinity. The computed Alk is then paired with the pCO2 observations to compute time series of the surface ocean TCO2, pH, and aragonite saturation state (Ω) using the CO2sys programme (Lewis and Wallace, 1998; van Heuven et al., 2011; Sharp et al., 2023), the carbonate dissociation constants of Lueker et al. (2000), the fluoride dissociate constant of Perez and Fraga (1987), the sulfate dissociate constant of Dickson (1990), and the boron-to-salinity ratio of Lee et al. (2000). Analysis of samples collected from the sediment traps is undertaken at the Institute for Marine and Antarctic Studies at the University of Tasmania; both the analytical methods and QC procedures are described in Wynn-Edwards et al. (2020b).
A gridded data set of temperatures in the upper 500 m was constructed from averaging values acquired within 30 min of each hour at each depth; additional details on the construction of the gridded data are given in Jansen et al. (2022a). Mixed-layer depth (MLD) is computed from profiles of temperature following Weeding and Trull (2014) and Shadwick et al. (2015). Seasonal cycles of sensor data (temperature, salinity, oxygen, Chl, Bbp, pCO2, and associated carbonate system parameters) and sample data (nitrate, silicate, and POC, PIC, and BSi at 2000 m) were constructed by combining data collected in all years to establish mean monthly values for each parameter. Note that the SAZ-11, SAZ-19, and SOFS-6 data have been included in the gridded temperature product described above but were excluded from the construction of subsequent seasonal climatologies because the moorings were deployed north of the nominal SOTS site (see Table A1).
The QC procedures for the phytoplankton samples are described in Eriksen et al. (2020). Sub-samples are quantitatively analysed for the coccolithophore (including calcification morphotypes Rigual-Hernández et al., 2020a, b; Shadwick et al., 2021) community composition by scanning electron microscopy (SEM; see Fig. A3) and analysis of the broader microplanktonic community by light microscopy (LM). Because sample return has been intermittent (Eriksen et al., 2020), the seasonal cycles presented here are constructed by combining observations from both the PULSE mooring and the later SOFS configuration (Table A1).
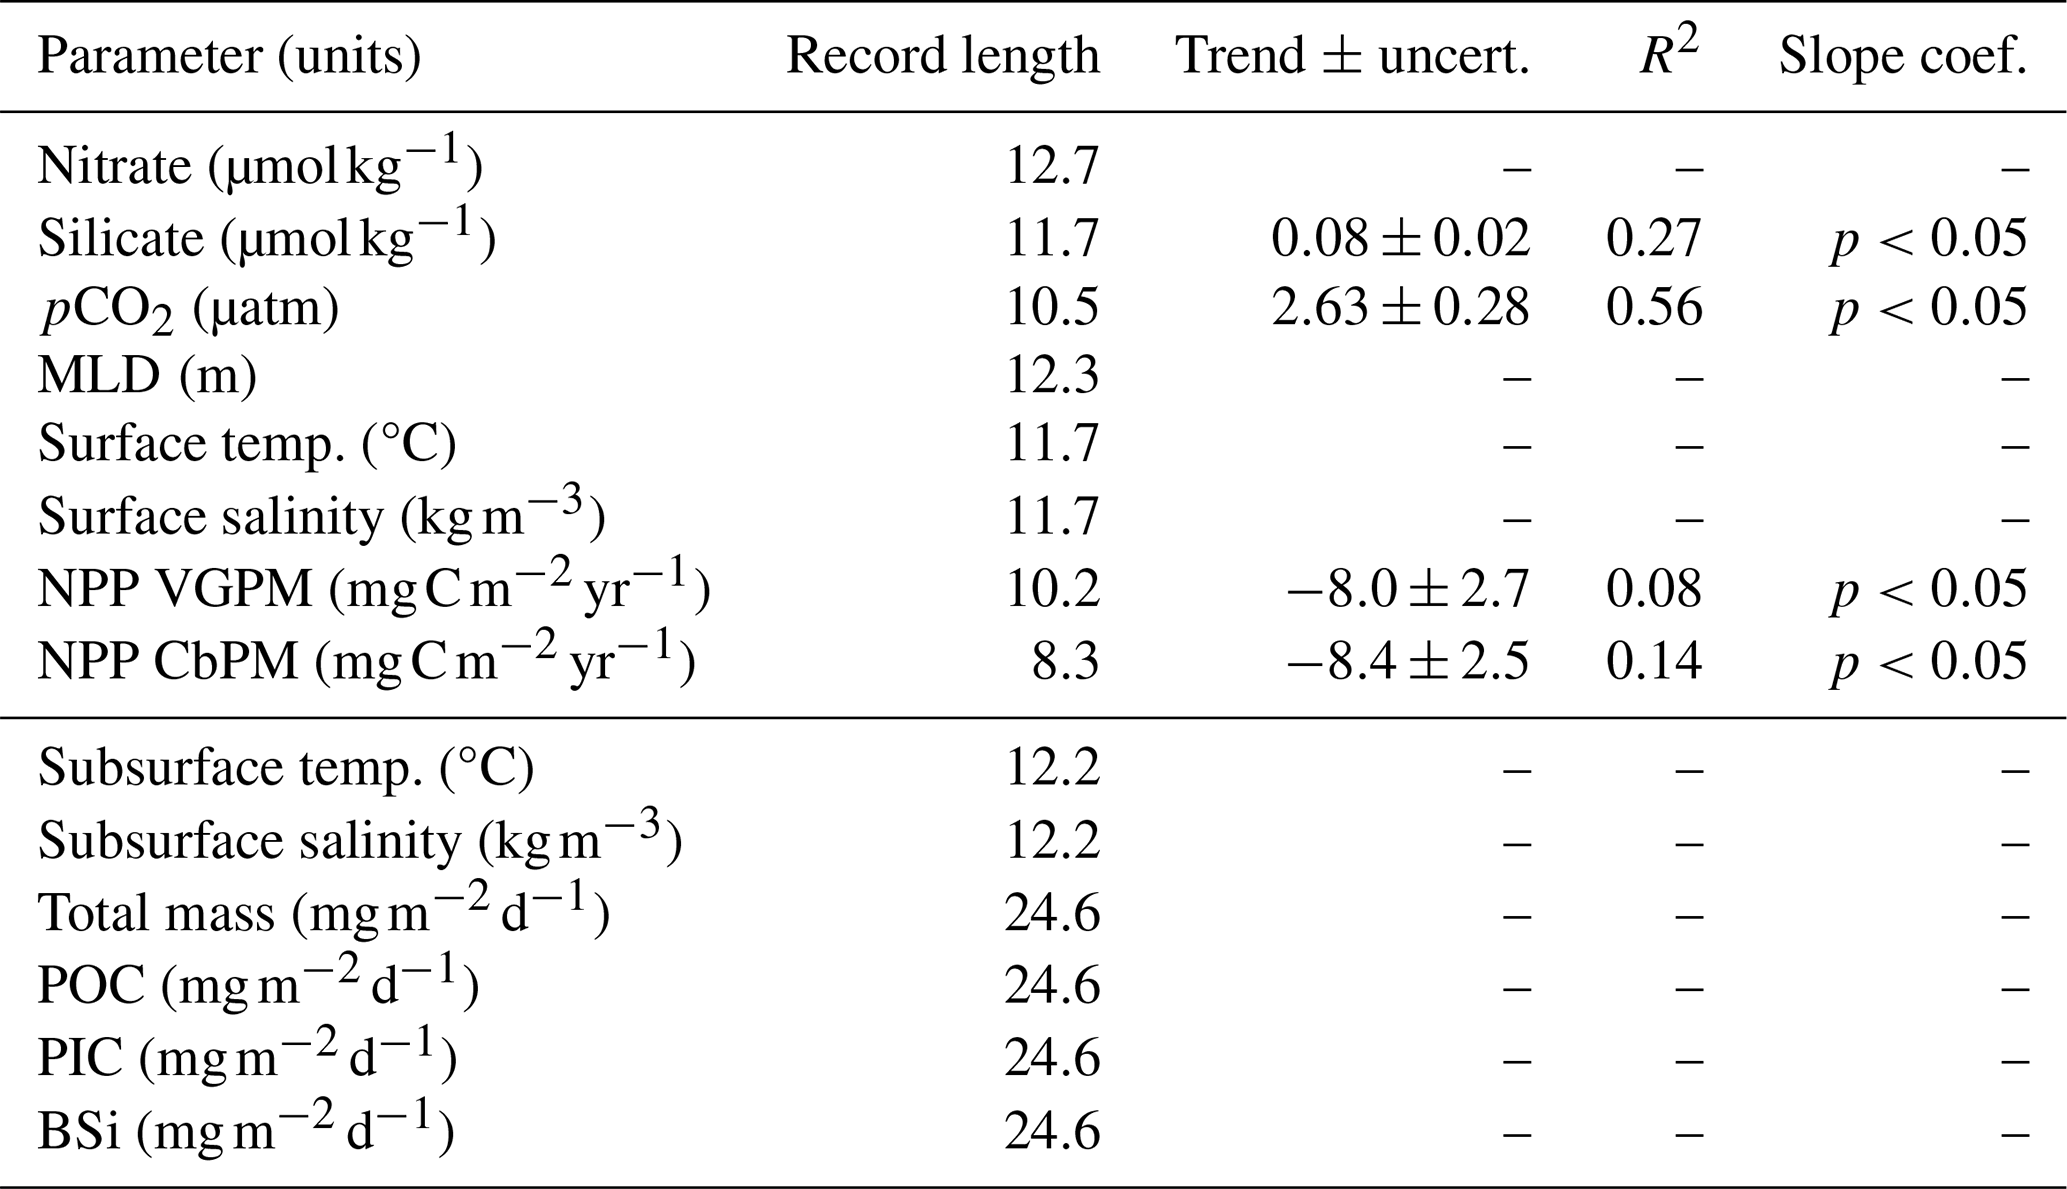
The detection of trends in several of the SOTS records was undertaken following Sutton et al. (2022) using the Trends of Ocean Acidification Time Series (TOATS) open-source code. This method requires records with a similar number of observations in each month of the year (i.e. uniformly distributed over the annual cycle), which restricted the analysis to the following parameters: nitrate, silicate, pCO2, MLD, temperature, salinity, NPP, POC, PIC, and BSi (see Table 2).
Table 1Annual mean (), peak (Dec), and mean winter (JJA; ) particle fluxes at 2000 m, and annual mean NPP () and peak and mean winter NPP () at the SOTS site.
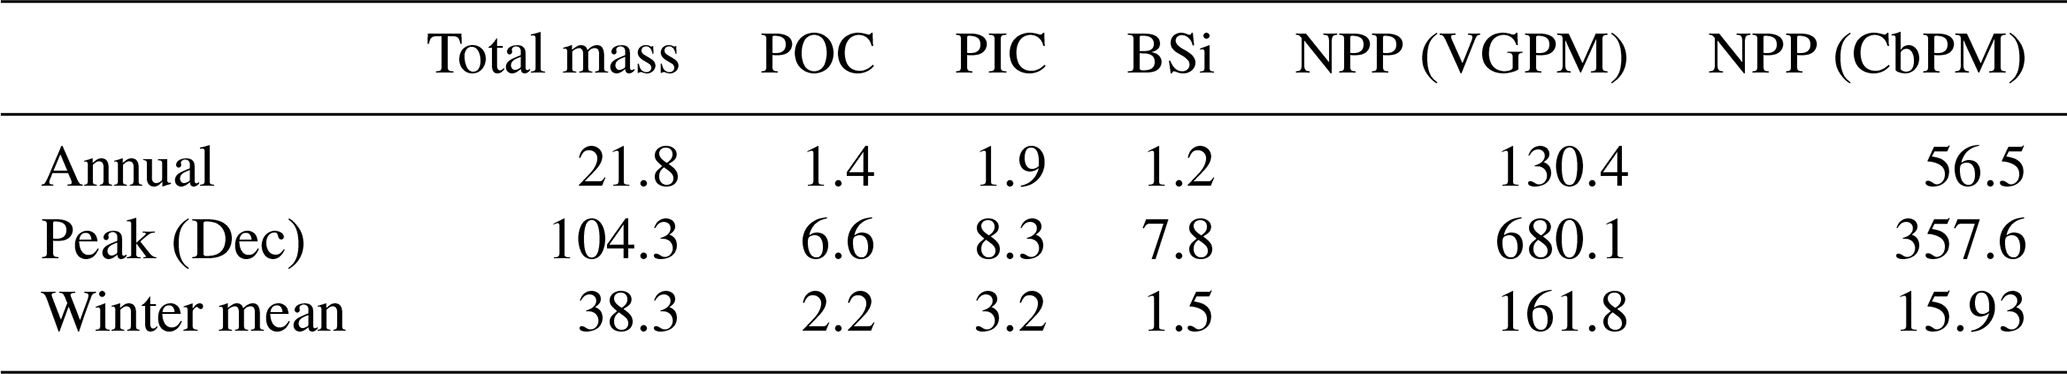
Table 2Results of the trend analysis for parameters measured at the SOTS site with sufficiently long records, with the resulting trends given in the units shown per year. The nitrate, silicate, and pCO2 observations are from samples collected at the surface (between 2010 and 2022). The surface temperature and salinity are from observations at 30 m depth. The NPP observations are from either 2012–2020 (VGPM) or 2012–2022 (CbPM). There were no significant trends in any of the subsurface (below 50 m) temperature or salinity records (between 2010 and 2022). The POC, PIC, and BSi entries refer to observations collected by the 2000 m sediment trap; despite these being the longest records in the time series (from 1997 to 2022), they do not exhibit any trends.
3.1 Upper-ocean seasonality
The SOTS site is characterized by deep mixing during the autumn and winter seasons, reaching depths of roughly 500 m in some years (Fig. 5b), driven by a combination of local heat fluxes (Schulz et al., 2012) and northward Ekman transport of colder waters (Rintoul and England, 2002). This deep mixing is associated with the seasonal formation of SAMW (e.g. Tamsitt et al., 2020). Stratification in spring yields mixed layers of 50–100 m depth, which persist until the following autumn largely due to sustained wind speeds of ∼10 m s−1 (e.g. Trull et al., 2019).
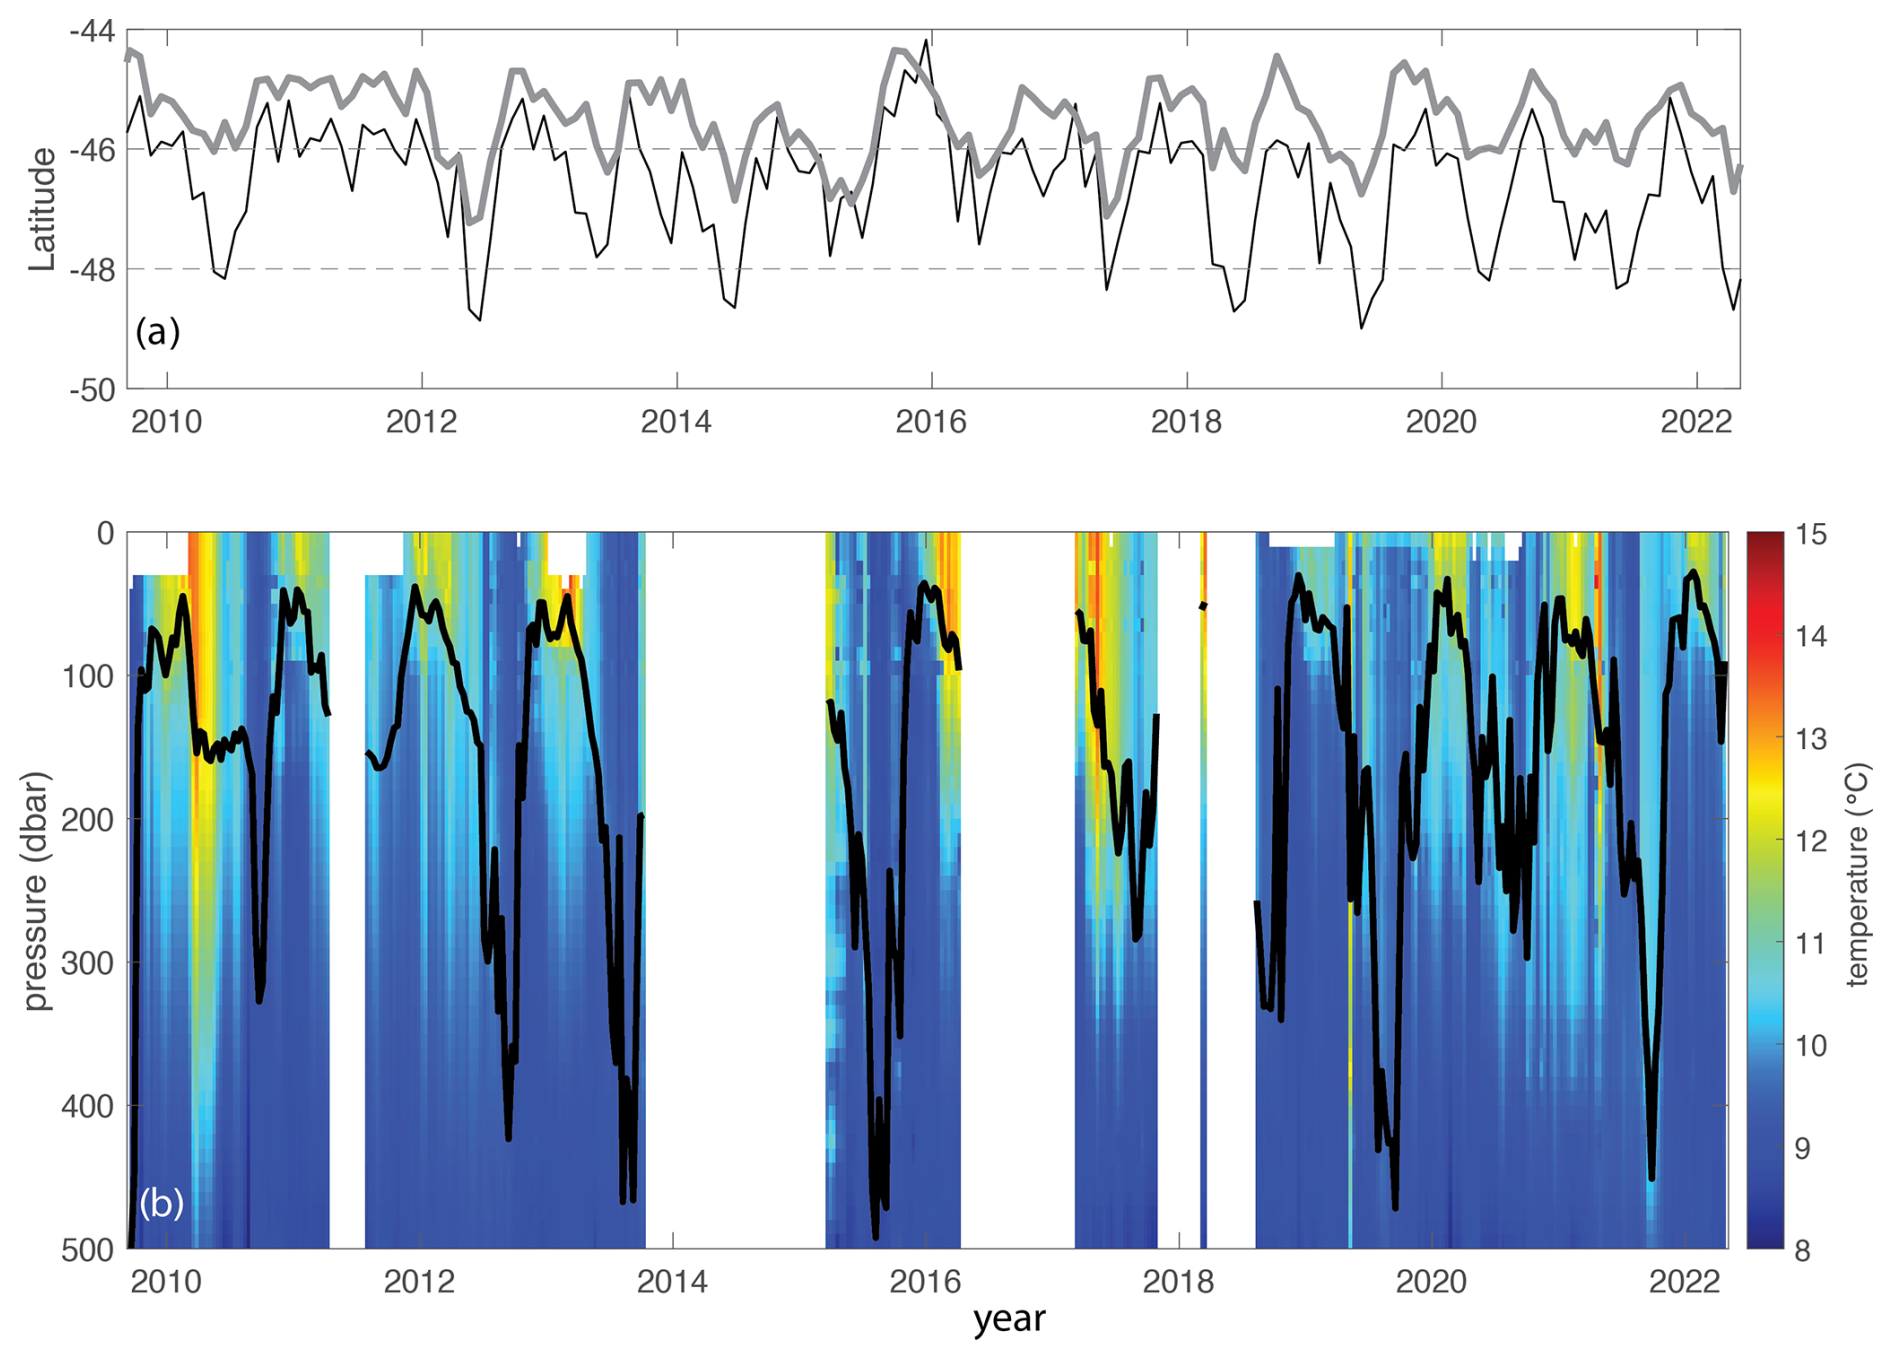
Figure 5The position of the STF and upper-ocean temperature between 2010 and 2022. (a) Location of the STF in two longitudinal ranges, i.e. 140–144° E (thin black line) and 130–150° E (thick grey line), is compared to the location of the SOTS site (between 46 and 48° S, dashed horizontal lines). (b) Temperature in the upper 500 m of the water column from sensors on the SOFS moorings, and the associated mixed-layer depth (black line, defined as a temperature difference of 0.3 °C from a depth of 10 m) from observations collected between 2010 and 2022.
While the upper-ocean heat content and associated mixed-layer depth are driven by the annual cycle of incoming solar radiation (Schulz et al., 2012), large variations on hourly to daily timescales are dominated by the horizontal advection of water past the SOTS site (Pardo et al., 2019; Yang et al., 2024a). This highlights the Eulerian nature of the observations and the importance of understanding spatial context, including movements of the dynamically active SAF to the south, which bounds the Antarctic Circumpolar Current, and the STF to the north, a weaker but more variable feature, which contributes to flows of warm waters westward south of Australia. The position of the STF varies seasonally and interannually, at times migrating south of the nominal SOTS site (Fig. 5a). In the longitudinal band 140–144° E, the STF may be observed as far south as 48° S. During the winter and spring, the STF is located further north, near the northern boundary of the SOTS region (Fig. 5a). Because the SOTS site is in the northern part of the SAZ (i.e. much closer to the STF than the SAF), variability in the surface ocean is more strongly influenced by variability in the location of the STF. However, earlier work has shown that the advection of surface waters from the south (e.g. closer to the SAF), with more polar characteristics, can influence properties at the SOTS site on sub-seasonal timescales (Shadwick et al., 2015).
The temperate conditions at the SOTS site result in surface water temperatures ranging from summer maxima of 15 °C to winter minima of ∼8 °C (Fig. 5b). The climatological seasonality smooths some of the variability observed in the higher frequency records; the mean seasonal amplitude (i.e. maximum minus minimum) of the temperature cycle at the surface is 4 °C, with a summer maximum of roughly 12 °C (Fig. 6). At depths below 200 m, the magnitude of the seasonal variation is much smaller (Figs. 6 and 7a).
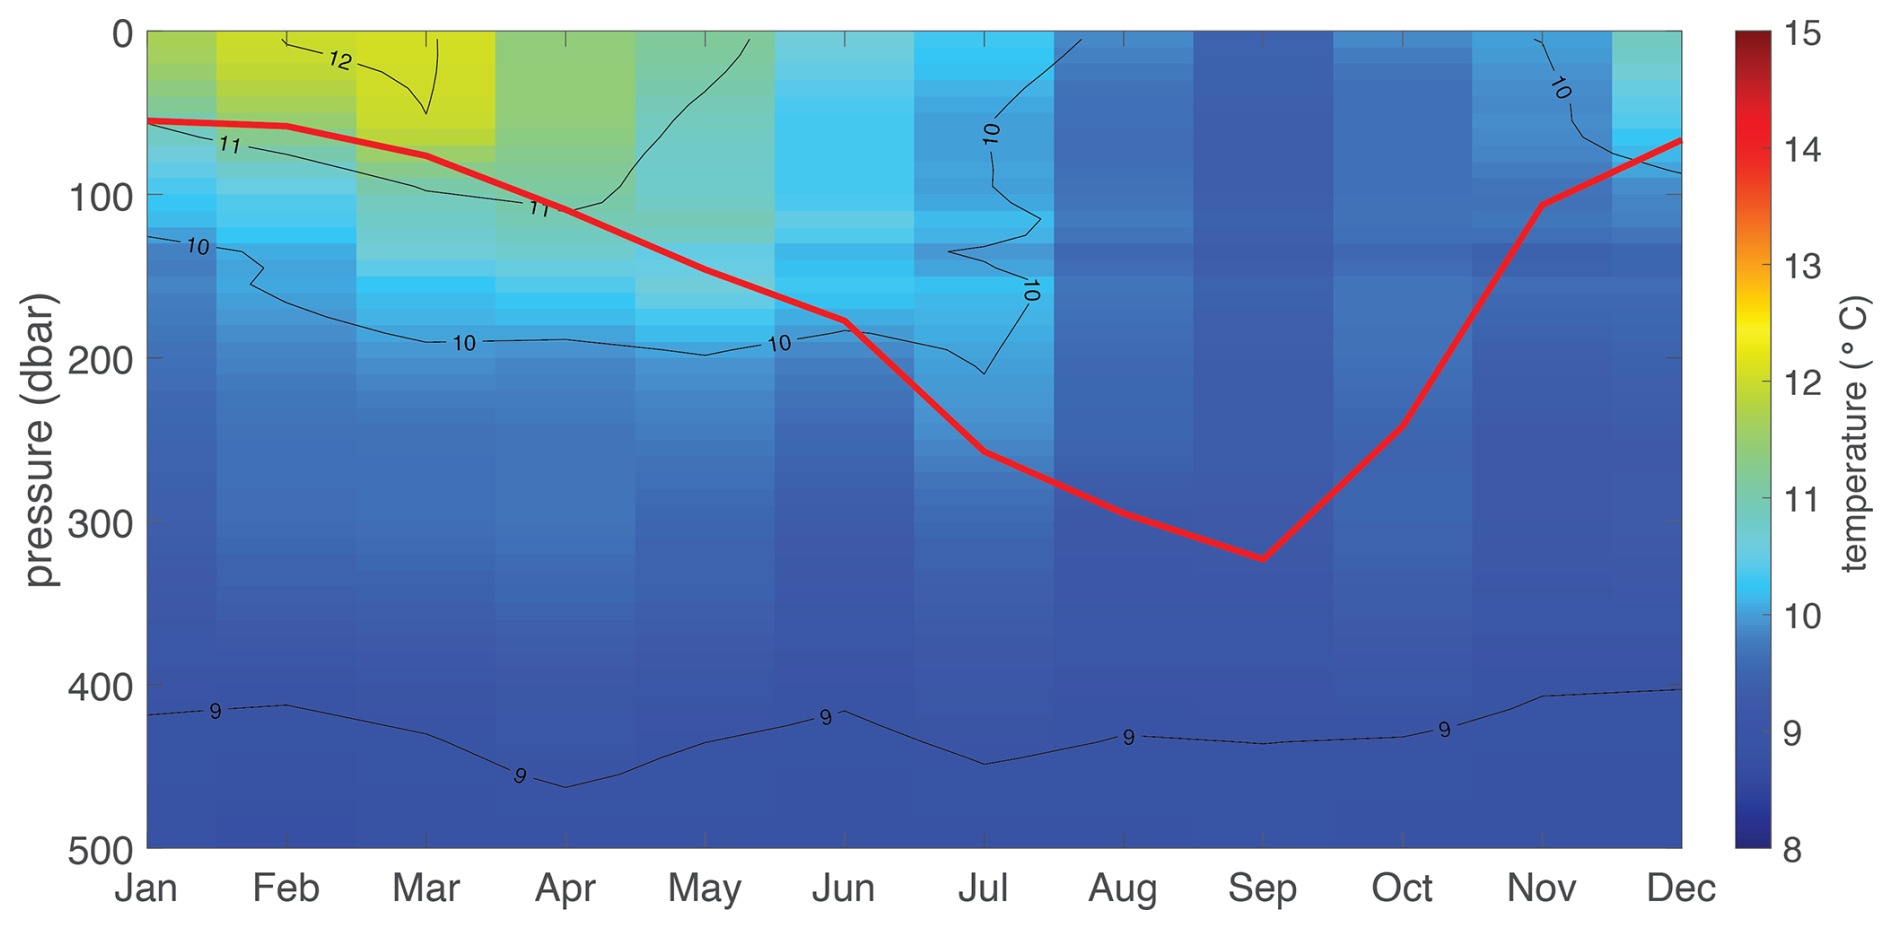
Figure 6Climatology of upper-ocean temperature based on sensor data from all SOTS moorings (SOFS, PULSE, SAZ), and the associated mixed-layer depth (red line).
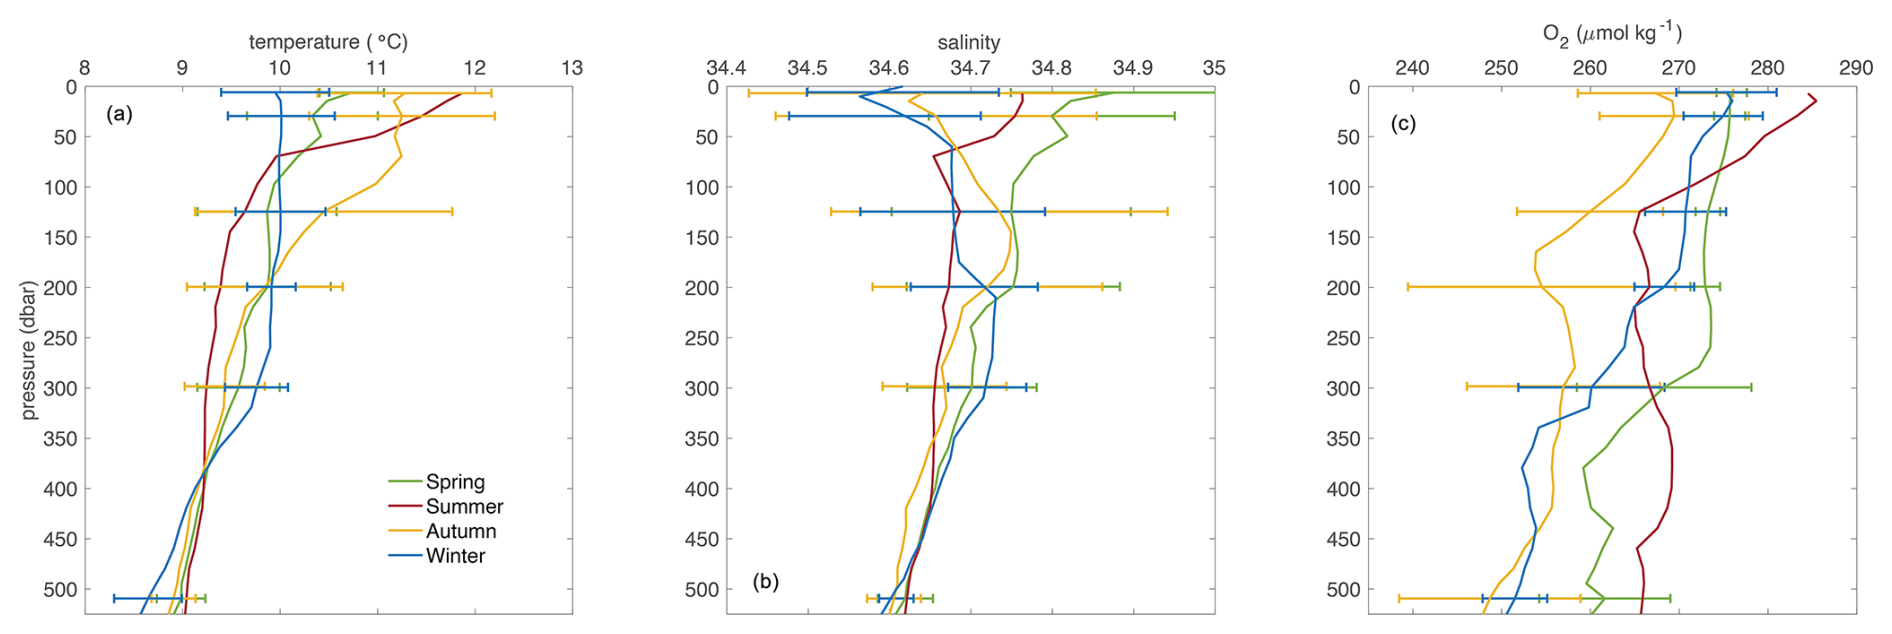
Figure 7Seasonal profiles from shipboard CTD casts at the SOTS site. (a) Temperature, (b) salinity, and (c) dissolved oxygen (O2). The profiles are mean values compiled from all voyages to the site in a particular season. The horizontal bars indicate the standard deviation associated with the mean profile at a subset of depths; the summer season profile was acquired from a single voyage and so has no associated standard deviation.
The seasonal variation in surface water salinity is modest (Fig. 7b), though large departures from the mean conditions can occur, with maxima approaching 35.5 and minima approaching 34 (Fig. 8a), reflecting the episodic passage of Subtropical water from the north and Subantarctic waters from the south (Shadwick et al., 2015; Pardo et al., 2019) or the impact of mesoscale features (Yang et al., 2024a). Below a depth of roughly 200 m, seasonal variability in salinity is small, with profiles converging at roughly 34.6 (Fig. 7b), reflecting the mixture of Subtropical Surface Water (STCW) and underlying SAMW (Fig. 3). Seasonal variability in dissolved oxygen reflects the changes in hydrography (temperature and salinity), as well as biological processes, with generally elevated values at the surface in the spring and summer seasons, relative to winter conditions, and lower subsurface concentrations in all seasons (Fig. 7c).
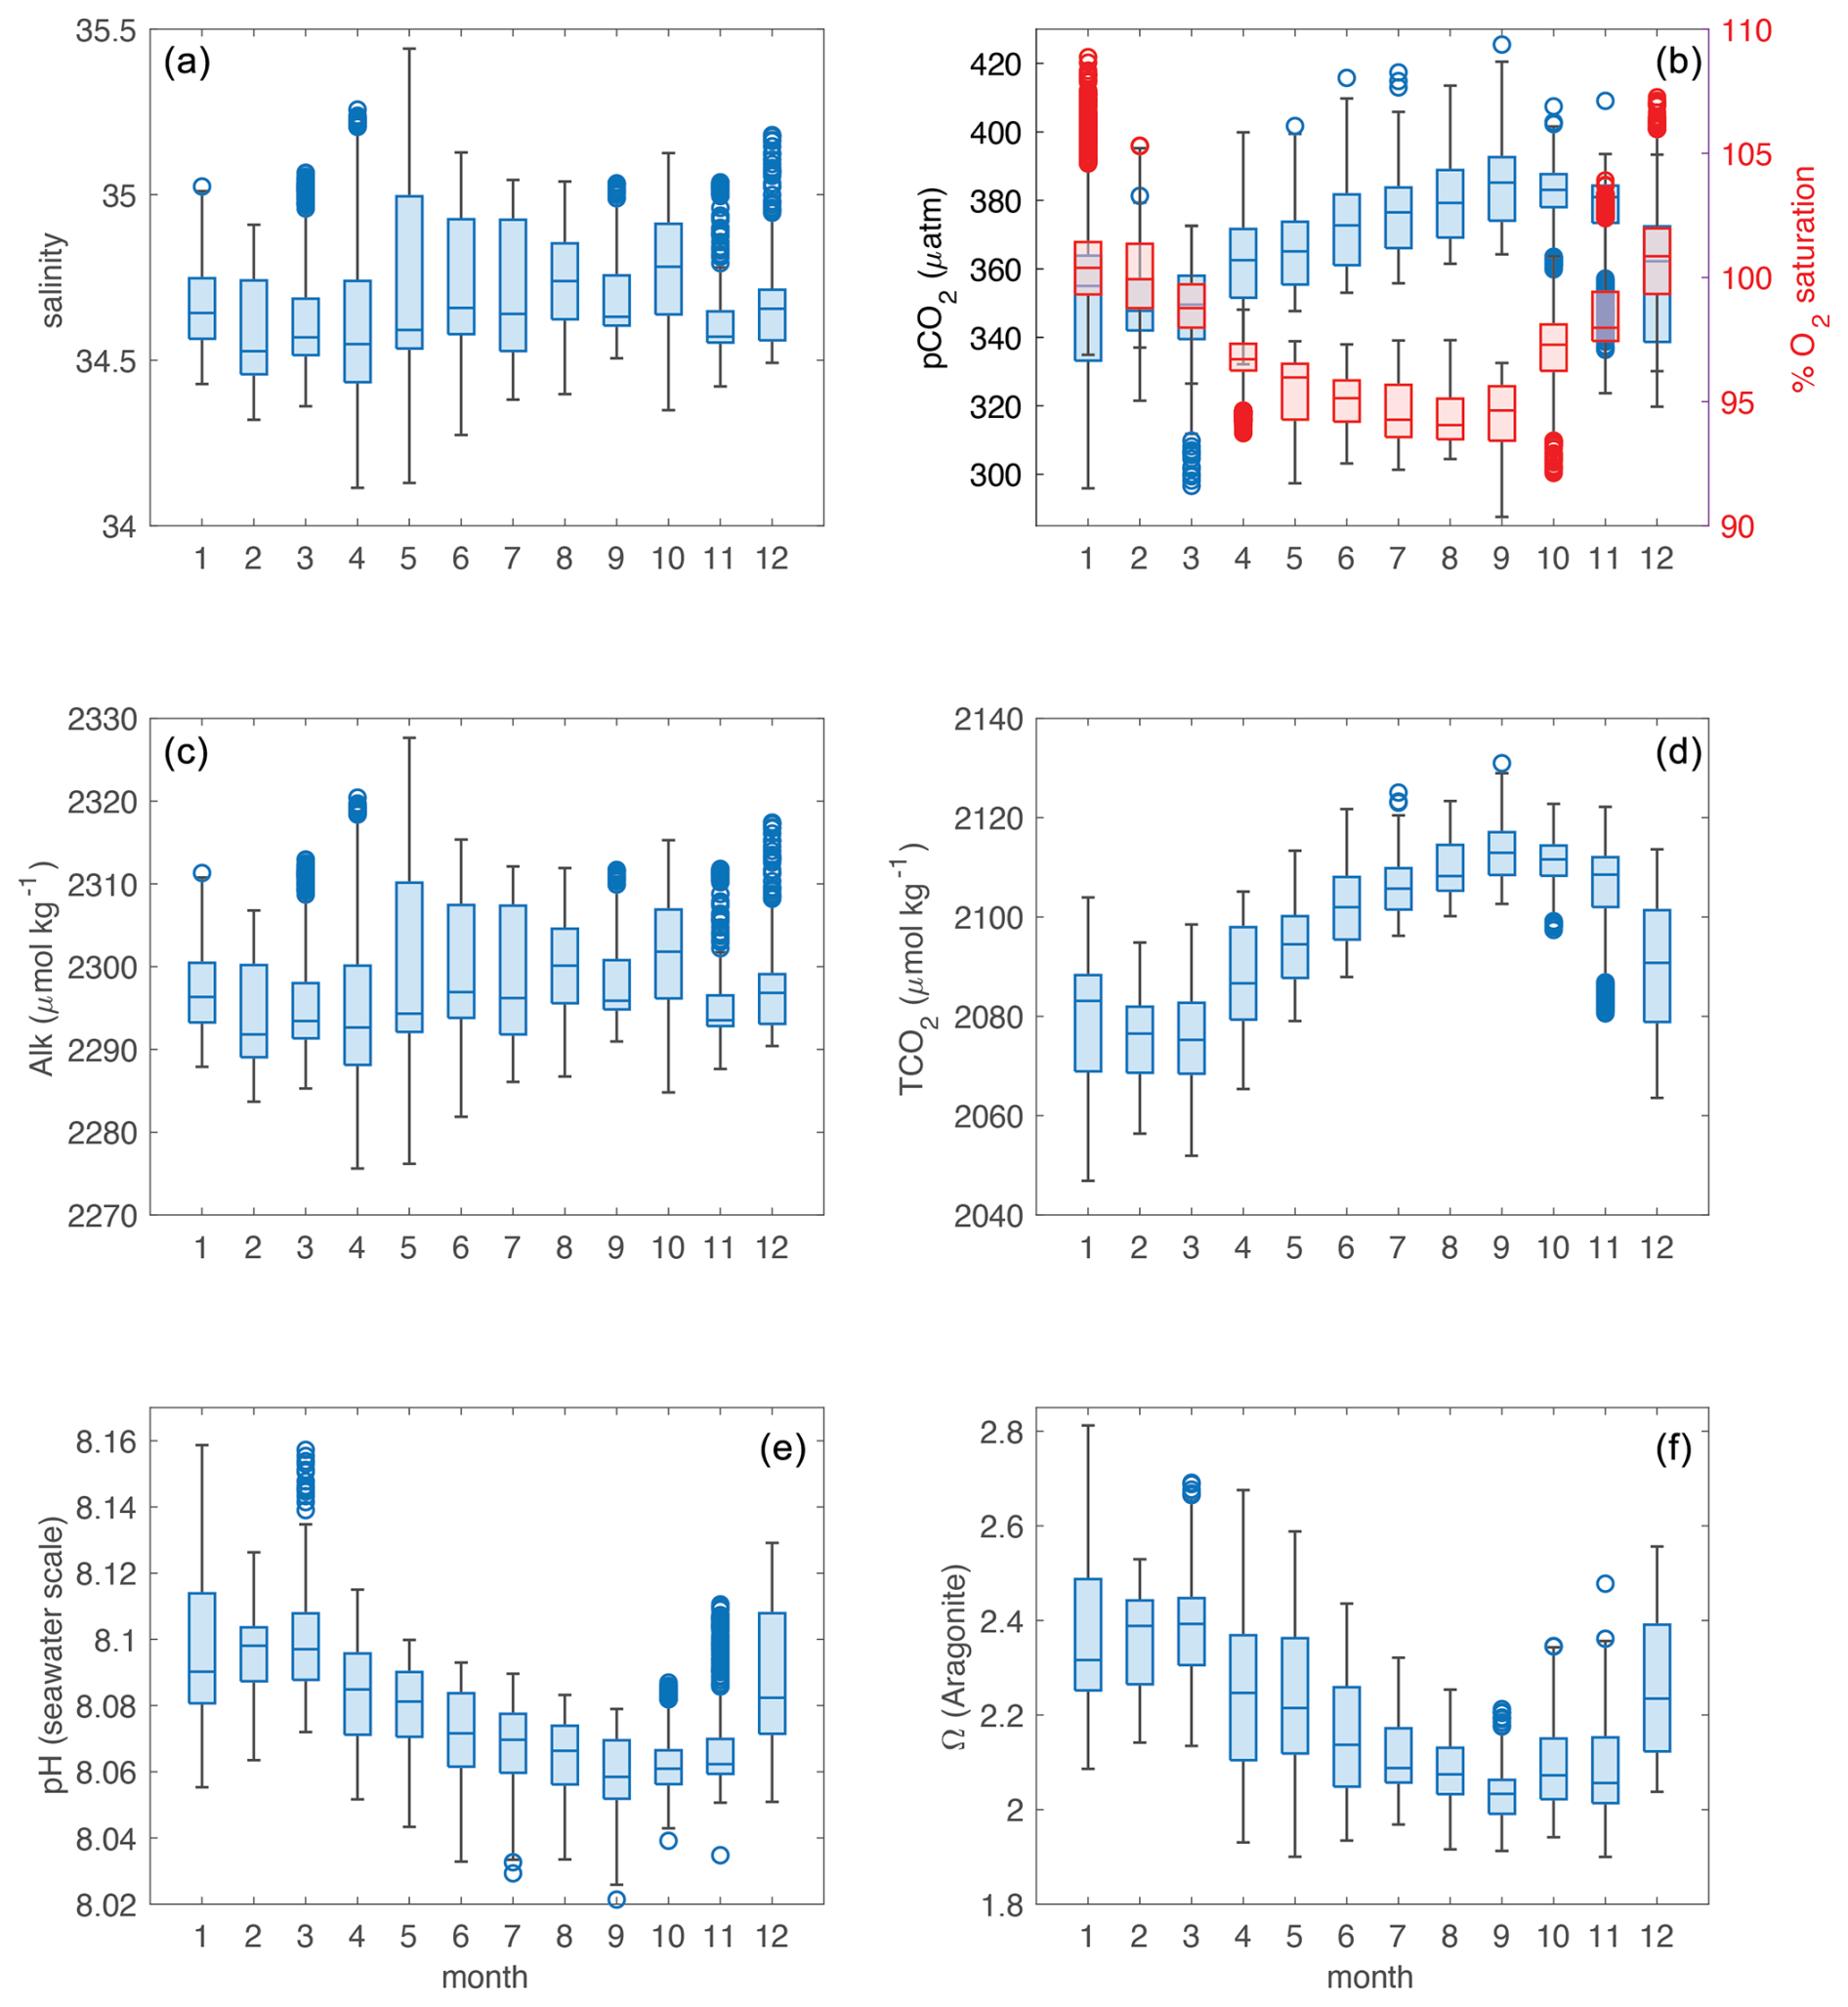
Figure 8Climatological seasonal cycles of surface (∼1 m depth) water hydrography and carbonate system parameters based on sensor data from the SOFS moorings between 2011 and 2021: (a) salinity; (b) CO2 partial pressure (pCO2) and oxygen saturation; (c) alkalinity; (d) dissolved inorganic carbon (TCO2); (e) pH; and (f) aragonite saturation state (Ω). Note that the data shown in panels (c–f) were computed based on the salinity and pCO2 observations in panels (a) and (b).
3.2 The CO2 system at the SOTS site
The seasonality of the carbonate system in the surface waters at the SOTS region is controlled by a combination of physical and biological drivers. Because temperature seasonality is moderate, as described above, the seasonal cycle of pCO2 (Fig. 8b) is dominated by the impact of biological productivity and the introduction of TCO2-rich waters from deeper layers (Metzl et al., 1999; Shadwick et al., 2015, 2023). This is reinforced by the seasonality of O2 saturation, which is anti-correlated with pCO2 throughout the year, with supersaturated conditions generally occurring between December and March (Fig. 8b) and undersaturated conditions in the autumn and winter seasons. The seasonality in Alk is computed from the salinity and thus exhibits similarly modest seasonality (Fig. 8a and c). The seasonality in TCO2 (Fig. 8d) is consistent with that of pCO2, with elevated values in the autumn and winter season influenced by a combination of biology (remineralization of organic matter produced in the previous productive season) and the introduction of TCO2-rich water from below during periods of deep mixing (Fig. 7e). The seasonalities of the pH and carbonate saturation state (Ω) are anti-correlated with pCO2 and TCO2 (Fig. 8d–f).
While the variability of TCO2 in the surface ocean is controlled by a combination of biological (photosynthesis, respiration, and the formation of calcium carbonate, CaCO3) and physical (evaporation and precipitation, sea ice formation and melt, advection, air–sea gas exchange, and CaCO3 dissolution) processes, the variability at depth is controlled primarily by the remineralization of organic matter and circulation, or mixing. The subsurface concentrations of TCO2 at the SOTS site range from roughly 2100 µmol kg−1 at 500 m to greater than 2250 µmol kg−1 at depths below 1500 m (Fig. 9a). The elevated concentrations in the interior ocean reflect both the remineralization of organic carbon and the dissolution of CaCO3. Like TCO2, the variability of Alk in the surface ocean is controlled by the addition (precipitation and sea ice melt) and removal (evaporation and sea ice formation) of fresh water, which also change the salinity. The formation and dissolution of CaCO3, as well as photosynthesis and respiration, also impact surface Alk, though the former has a much larger impact. In the subsurface, Alk is influenced by mixing and CaCO3 dissolution, and concentrations of measured Alk range from roughly 2280 µmol kg−1 at 500 m to greater than 2350 µmol kg−1 below 1500 m (Fig. 9b). The relationship between measured Alk and salinity at the SOTS site reveals two quasi-linear relationships: a high slope relationship in Alk-rich, deep (>800 m) waters over a small range in salinity and a lower slope relationship in shallow (surface to roughly 800 m depth) waters over a much wider range of salinity and with relatively lower measured Alk (Fig. 9c), which reflects the water column structure with Subtropical Surface Waters overlying Mode and Intermediate Waters (Fig. 3).
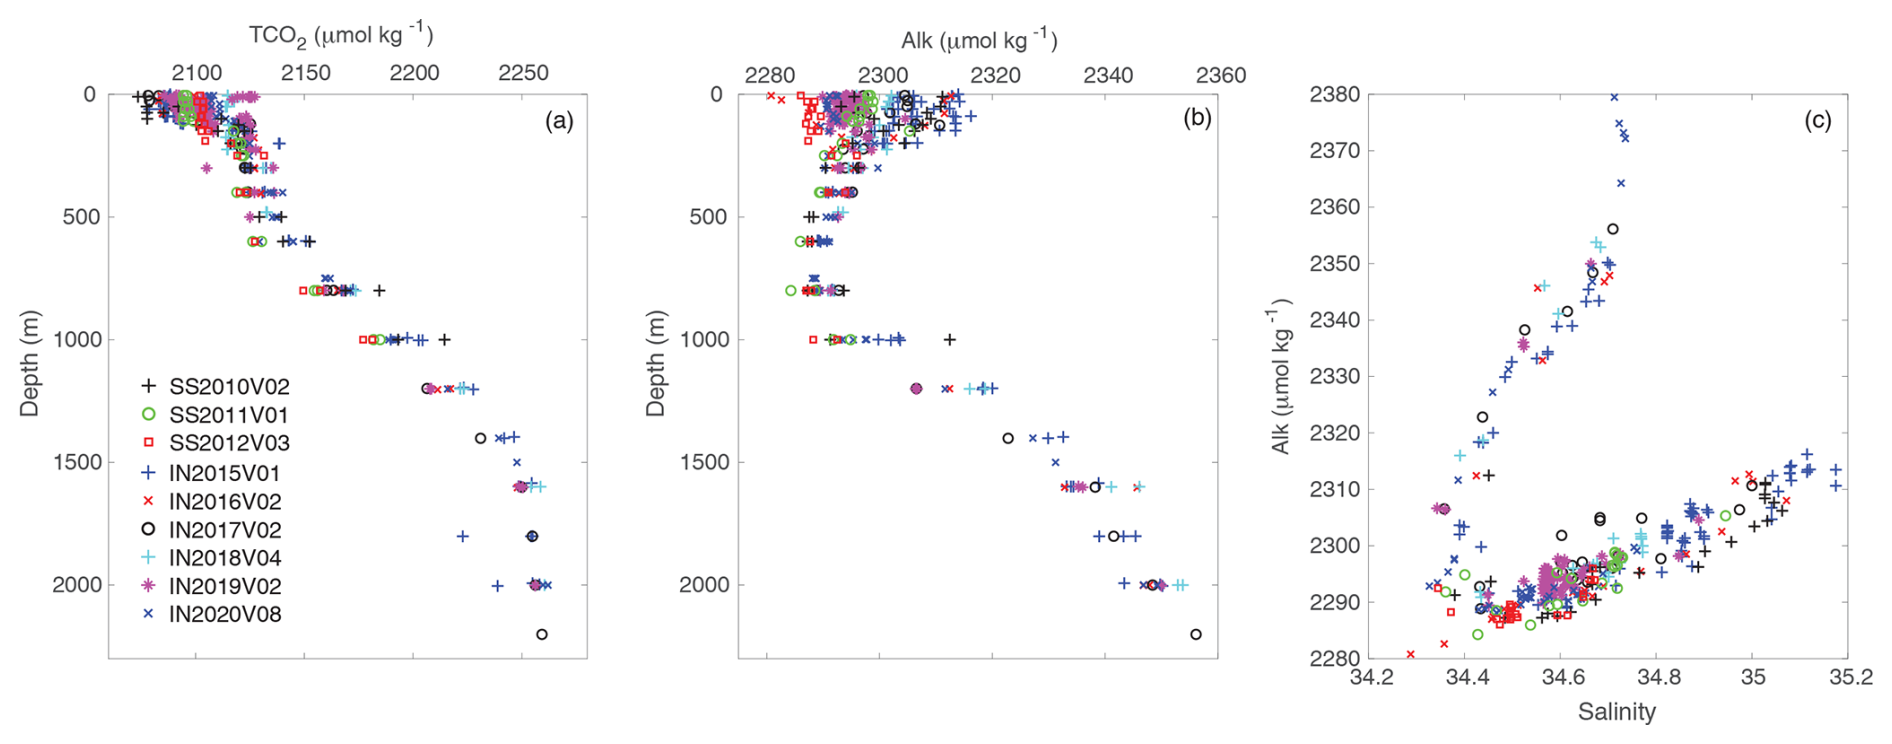
Figure 9The CO2 system at the SOTS site. (a) Dissolved inorganic carbon (TCO2) as a function of depth, (b) total alkalinity (Alk) as a function of depth, and (c) the relationship between alkalinity and salinity. The linear relationship between Alk and salinity in the upper ocean (0–800 m, with lower values of Alk over a wide range of salinity) can be described by the equation TA (n=360, R2=0.86); the error associated with the fit is ∼7 µmol kg−1. Observations shown in all three panels were collected between 2010 and 2020 (see also Fig. 4).
3.3 Primary production and phytoplankton community composition
While biological productivity has been shown to dominate the seasonality in the carbonate system and influence the air–sea flux of CO2 in the region (Shadwick et al., 2015, 2023; Yang et al., 2024a), the SOTS site exhibits the high-nutrient, low-chlorophyll (HNLC) characteristics of the broader SAZ region (Lourey and Trull, 2001; Trull et al., 2001a; Fig. 2). Observations of both chlorophyll and optical backscatter from sensors on the SOFS mooring are available as proxies for primary production (Schallenberg et al., 2019; Yang et al., 2024a), with seasonal cycles indicating that the onset of the productive season generally occurs in early austral spring, evident in the concurrent increase in both parameters (Fig. 10a), though the timing of this initiation has been shown to vary from year to year (e.g. Weeding and Trull, 2014; Trull et al., 2019). Productivity peaks between January and March (summer), based on both chlorophyll observations (Fig. 10a) and satellite-derived estimates of net primary production (NPP, Fig. 10c), with biomass accumulation continuing through June (winter) in most years. The mean NPP at the SOTS ranges from 56 to 130 depending on the choice of productivity model (see Tables 1 and A2). The major limitation on primary productivity appears to be iron (e.g. Sedwick et al., 1999), with nitrate concentrations remaining high year-round, while silicate becomes seasonally depleted in summer (Fig. 10b). Nutrients are anti-correlated with biomass (Fig. 10a and b); silicate utilization begins in early spring, with the limitation reached by January and ongoing productivity fuelled by regenerated nutrients (Lourey and Trull, 2001; Trull et al., 2019).
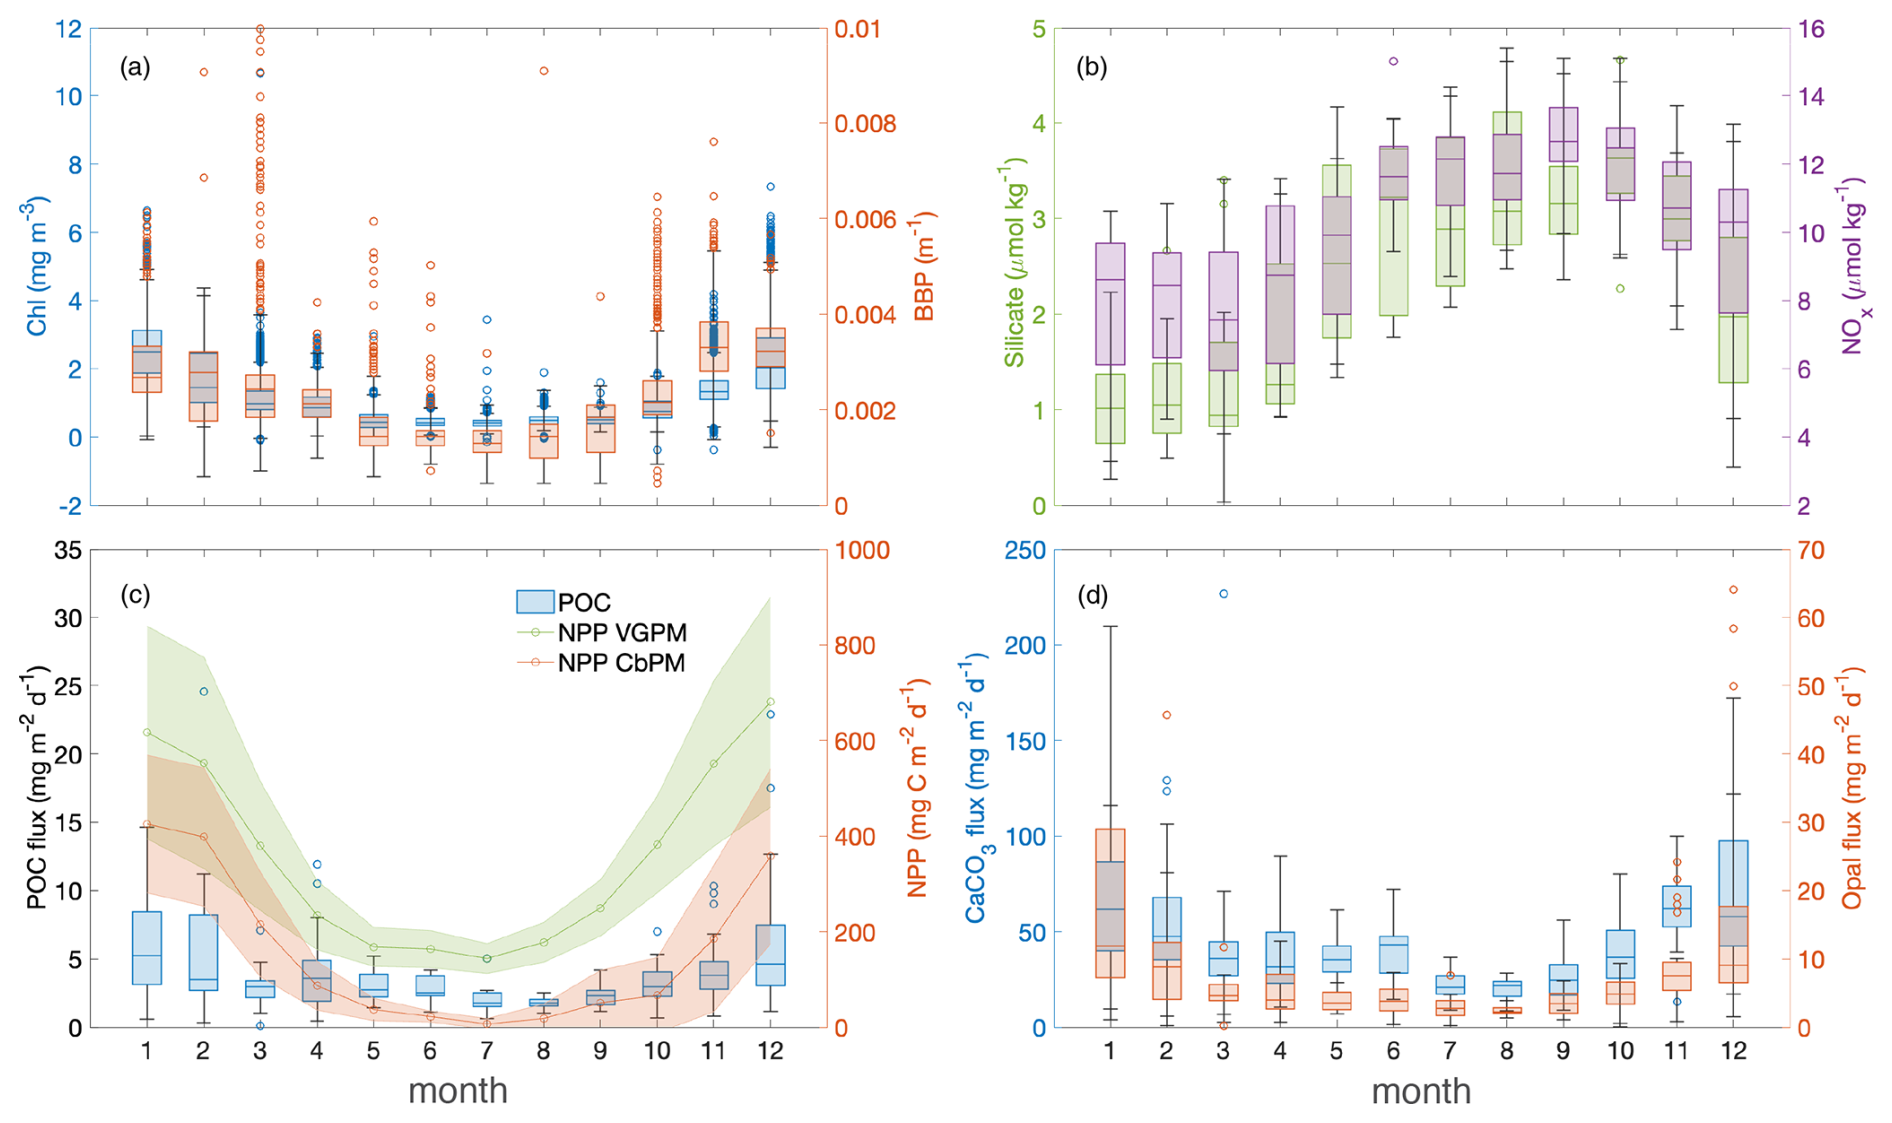
Figure 10Climatological seasonal cycles of nutrients and biomass proxies as well as primary productivity and the export of organic carbon. (a) Chlorophyll (left-hand axis and in blue) and particulate backscatter (right-hand axis and in orange) from sensors at 30 m depth on the SOFS mooring. (b) Silicate (left-hand axis and in green) and nitrate (right-hand axis and in purple) from discrete samples collected roughly fortnightly on the SOFS mooring. (c) Particulate organic carbon (POC; left-hand axis and in blue) flux collected by a sediment trap deployed at 2000 m on the SAZ mooring and based on observations collected between 1997 and 2022, and net primary production (NPP) from two satellite-based models (right-hand axis and in green, VGPM, and in orange, CbPM). (d) The composition of particulate fluxes at 2000 m, with CaCO3 in blue (left-hand axis) and opal (biogenic silica, right-hand axis) in orange.
The microplankton community at the SOTS site has a subdued but distinct seasonal cycle in both abundance (Fig. 11a) and the diversity of silicifying (diatoms, silicoflagellates, and some radiolaria), calcifying (forams and coccolithophores), and other (flagellates and dinoflagellates) taxa (Figs. 11b and A3). The phytoplankton community is numerically dominated by small cells, specifically the flagellate form of Phaeocysistis antarctica and lesser contributions from Phaeocysistis scrobiculata. Flagellates, silicoflagellates, foraminifera, and radiozoa are relatively minor contributors to biovolume (Fig. 11b), which is dominated by diatoms and dinoflagellates. Late spring and summer samples are often dominated by large-biovolume taxa like the diatom Corethron pennatum before reverting to a more diverse community of smaller diatom taxa. However, diatoms are a relatively small component of the total community, with a modest seasonal increase in abundance in mid-summer after the onset of silicate limitation.
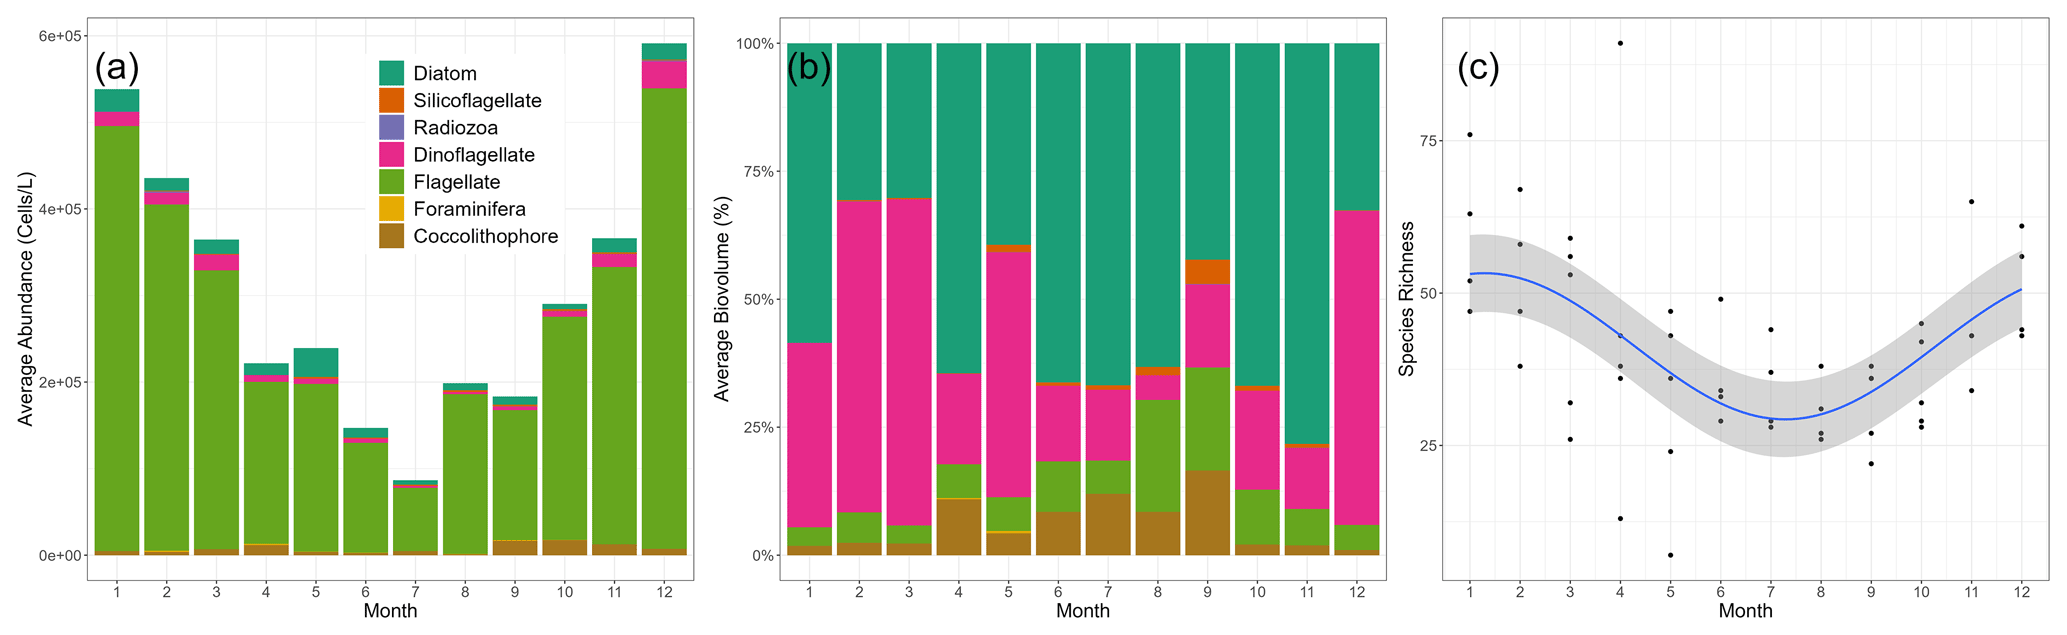
Figure 11Climatological seasonality of phytoplankton and microplankton community composition at the SOTS site. (a) Abundance, (b) biovolume, and (c) species richness. The colours in panels (a) and (b) indicate the dominant taxa.
All major phytoplankton groups are present throughout the year (see Figs. 11a and 12), with subtle community composition changes likely tied to the distinct stages in the development of the mixed layer: deep mixing and light limitation in early spring; shoaling in late-spring or early summer before the onset of nutrient limitation; and an extended period of stability in summer and early autumn. It is interesting to note that the silicoflagellates do not mimic the diatom seasonality (Fig. 12b). We note that the total abundances of the silicoflagellates are low, typically 2 orders of magnitude lower than that of the total diatoms; it may be that the diatoms outcompete the silicoflagellates for available silica in summer, contributing to their low abundances. Additionally, silicoflagellates are only confidently identified during the part of their life cycle when siliceous exoskeletons are produced; naked stages are poorly resolved and have only recently been linked to the skeleton-bearing stages (McCartney et al., 2024).
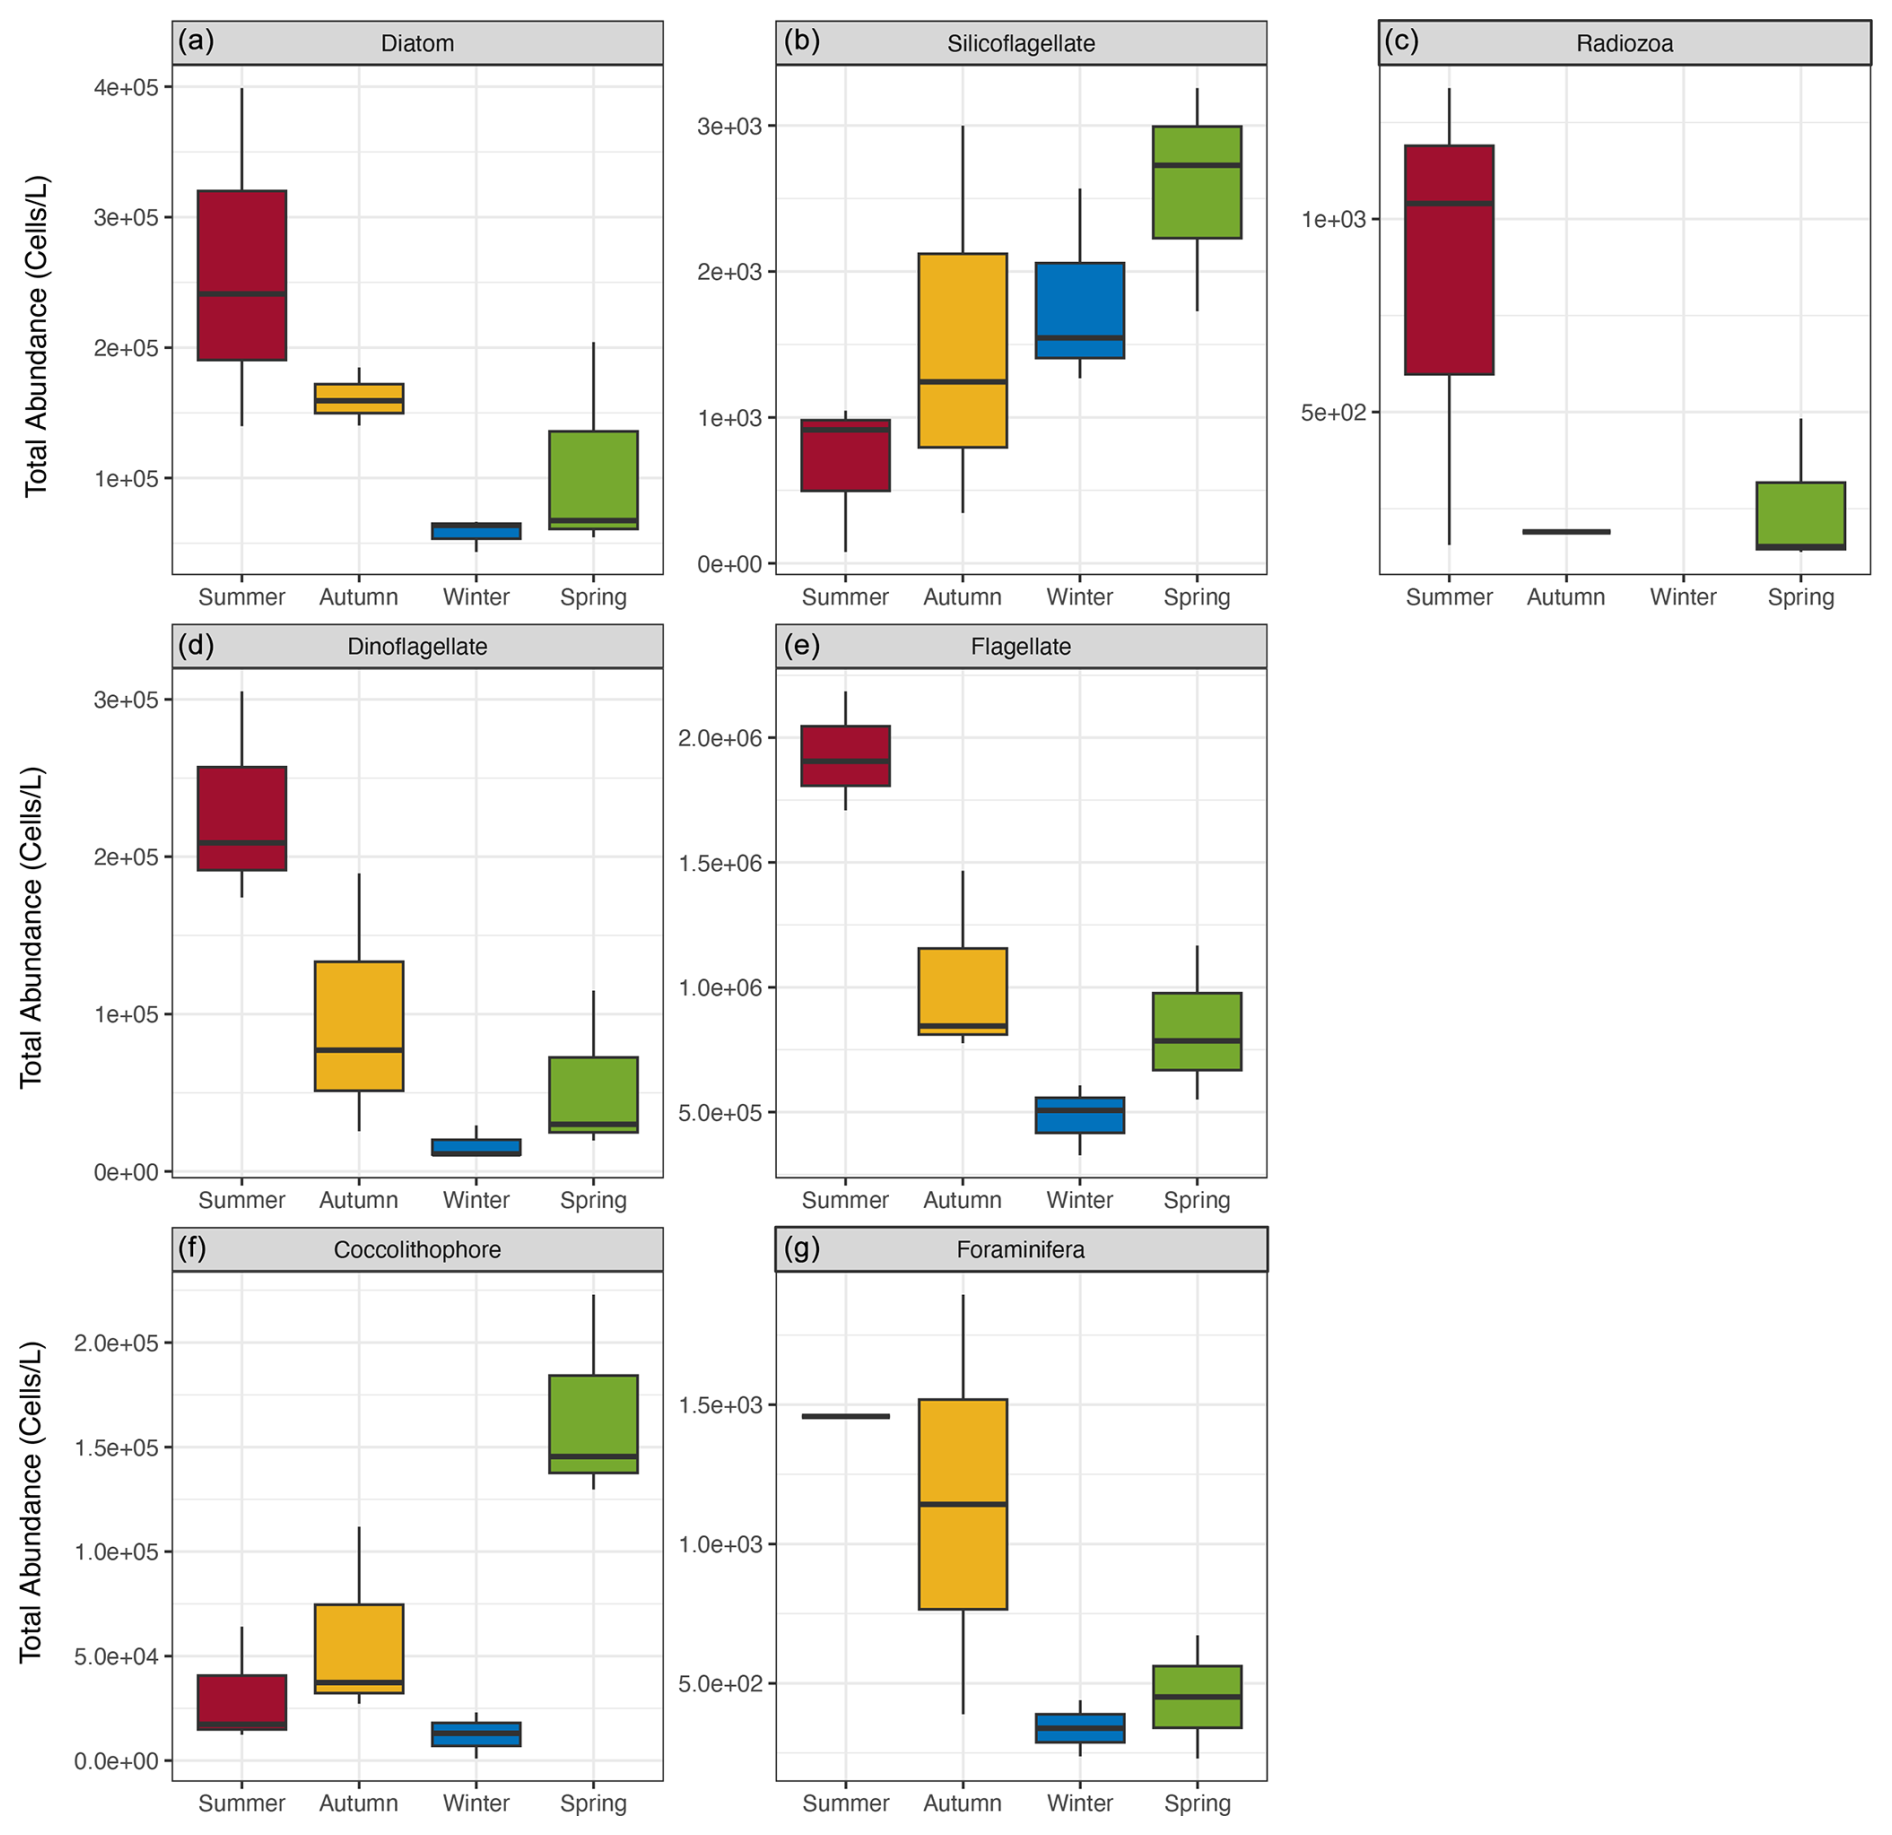
Figure 12Climatological seasonal cycles of the dominant phytoplankton and microplankton taxa at the SOTS site. Top row: silicifiers including (a) diatoms, (b) silicoflagellates, and (c) radiozoa; middle row: flagellate taxa including (d) dinoflagellates and (e) flagellates; and bottom row: calcifying taxa including (f) coccolithophores and (g) foraminifera.
There are no strong signals in community composition associated with the migration of the STF past the SOTS site; however, these conditions are typically short-lived (Fig. 5a), and the presence of indicator taxa may be too low to be clearly resolved. There is some evidence of seasonal succession between major functional groups, with most groups low in winter and coccolithophore abundance highest in spring, followed by increased abundance of dinoflagellates, flagellates, and diatoms in summer (Fig. 12).
The seasonality of species richness at the SOTS site (Fig. 11c) closely follows total abundance (Fig. 11a), chlorophyll (Fig. 10a), and NPP (Fig. 10c), with minima in winter and the highest values observed during the productive season, or (austral) summer months. The total number of taxa recorded at the SOTS site since the inception of taxonomic sampling is over 300, a result of the combination of both SEM and LM examination.
3.4 Particulate carbon export
The movement of carbon to the ocean interior by sinking particles, i.e. the gravitational biological carbon pump, is active year round at the SOTS site (1.4±0.3 at 2000 m) and occurs at levels similar to the global median (∼1 ) (Wynn-Edwards et al., 2020c; Lampitt and Antia, 1997; Mouw et al., 2016). The flux of particulate organic carbon at 2000 m indicates an increased delivery of material in September, with peak fluxes (∼6 ) occurring in mid-summer (December and January) and a steady rain of particulate carbon through the winter season (e.g. mean monthly fluxes in winter are on the order of 2 ; Fig. 10c). This seasonality is well correlated with satellite-based estimates of NPP and confirms that there is little, if any, lag between the onset of production at the surface and the delivery of organic carbon to depth (Fig. 10c; Wynn-Edwards et al., 2020c).
The composition of particulate material delivered to depth reveals a similar seasonality as the POC flux, with a steady increase in both particulate inorganic carbon (PIC, or CaCO3) and biogenic silica (BSi, or opal) beginning in September and peak fluxes (∼8 for both PIC and BSi) in summer (Fig. 10d, Table 1). The PIC seasonality is characterized by two distinct peaks (in spring and summer), while the BSi seasonality is broader, possibly due to the merging, or overlapping, of peaks in spring and summer. The amount of material arriving at depth is determined by two factors: (1) how much of the available particle pool is exported out of the surface layer (i.e. the export ratio) and (2) what fraction of that export arrives at depth (i.e. the transfer efficiency; Henson et al., 2012). Annual transfer efficiency at the SOTS site, calculated from NPP (Fig. 10c) using export efficiency estimates following Britten et al. (2006) and annual POC fluxes at 2000 m (1.37 ), ranges from 4 % to 5 %, depending on the choice of NPP product (VGPM or CbPM), and is consistent whether computed using the POC flux at 2000 m (Fig. 10c) or 1000 m (Table A2).
3.5 Emergence of trends
Many of the records acquired at the SOTS site are now of sufficient length that they can be used to evaluate the emergence of trends; the results of the trend analysis are summarized in Table 2. The increase in surface water pCO2, along with an apparent amplification of the seasonality, has been observed at the SOTS site between 2010 and 2021 and is described in detail in Shadwick et al. (2023). This increase in pCO2 corresponds to both the increase in atmospheric CO2 and a decrease in surface ocean pH (i.e. ocean acidification) and reinforces the need for ongoing observations to separate natural variability from anthropogenic trends (e.g. Ono et al., 2019). The satellite-based estimates of NPP indicate modest trends (on the order of −8 ), indicating small decreases in NPP in the SOTS region over about a decade that, while statistically significant, are associated with fairly small R2 (Table 2), indicating that the trend explains only a small fraction of the variability in the records. There is also a weak, but significant, trend in silicate (∼0.1 ), potentially indicating a decline in nutrient utilization, which is consistent with a decline in NPP, though no trend was detected in the time series of nitrate. None of the other surface or subsurface parameters, including the hydrography, the particulate flux, and the composition of the exported material, indicated any trends over the history of the SOTS observations.
The SOTS observatory is the only sustained multi-disciplinary, high-temporal-resolution observational effort in open Southern Ocean waters. The observations collected at the SOTS site thus serve as an important baseline against which to measure future changes. Additionally, observations collected on annual voyages, from ancillary autonomous platforms, and remote sensing in the SOTS region underpin research conducted across a suite of Australian programmes and international initiatives, examples of which are provided in the following sections.
4.1 Upper-ocean biogeochemistry at the SOTS site
A central theme of the SOTS science programme is an assessment of the key processes responsible for variability in upper-ocean biogeochemistry. Early efforts highlighted the importance of biology for the seasonality of the inorganic carbon system (Shadwick et al., 2015) and quantified interannual CO2-system variability (Pardo et al., 2019). Recent work expanded the surface water pCO2 time series via multiple linear regression and remote sensing observations to evaluate the impact of the Southern Annular Mode and mesoscale circulation on surface water CO2 seasonality (Yang et al., 2024a). Using observations collected over a decade, an amplification of the seasonal cycle in surface water pCO2 was quantified and associated with a decline in pH as a consequence of the uptake of anthropogenic CO2 (Shadwick et al., 2023).
Net community production (NCP), which sets the upper limit for carbon export to the ocean interior, has been computed from seasonal budgets of oxygen (Weeding and Trull, 2014; Trull et al., 2019) and inorganic carbon (Shadwick et al., 2015) from moored sensors and from seasonal nitrate deficits using discrete samples (Lourey and Trull, 2001). Annual NCP at the SOTS site ranges from 1.5 to 3.4 ; the NCP that occurs during winter and early spring accounts for roughly 30 % of the annual total. This appears to result from the reduction of grazing in winter (Trull et al., 2019), suggesting that future changes in the SAZ may be controlled as much by winter as by summer conditions.
The seasonal succession of the phytoplankton community has also been elucidated on the basis of chlorophyll and backscatter data (Schallenberg et al., 2019). A combination of shipboard incubation experiments and underway fast-repetition-rate fluorometer observations was used to evaluate the potential of non-photochemical quenching to indicate conditions of iron limitation (Schallenberg et al., 2020), a key constraint on biological productivity at the SOTS site and in the broader SAZ region (Bowie et al., 2009). More recently, shipboard incubation experiments at the SOTS site and elsewhere in the SAZ have shown that phytoplankton may be seasonally co-limited by iron and manganese (Latour et al., 2023), while deep mixing in autumn and winter also leads to light limitation (e.g. Trull et al., 2019).
The phytoplankton community composition and seasonal succession have been described for both the silicifying phytoplankton (i.e. diatoms; Eriksen et al., 2018) and the calcifying community (i.e. coccolithophores; Rigual-Hernández et al., 2020a) at the SOTS site. While the non-calcifying community is dominated by very small cells, there is a seasonal depletion of silicate in (austral) summer between January and April, and the export of organic carbon reaches levels (1.4±0.3 at 2000 m) similar to the global median (∼1 ) (Wynn-Edwards et al., 2020c; Lampitt and Antia, 1997; Mouw et al., 2016). This suggests that natural increases in iron fertilization by the southward extension of the East Australian Current (e.g. Ridgway, 2007), or by atmospheric deposition (e.g. Traill et al., 2022), may drive increased carbon sequestration by the biological carbon pump, without limitation by silicate supply as previously expected (Trull et al., 2001a).
While the calcifying community has proven more challenging to observe from water samples collected autonomously at the SOTS site (Eriksen et al., 2020), the relative abundances of five morphotypes of the coccolithophore Emiliania huxleyi over a full annual cycle have been quantified (Rigual-Hernández et al., 2020a). An assessment of this seasonal succession with respect to the evolution of the biogeochemical and hydrographic properties in the upper ocean from mooring observations suggests that the heavier morphotypes achieve maximum abundance in winter, when nutrients and TCO2 are elevated, but CaCO3 saturation states are low (see also Fig. 8); meanwhile, lighter, more weakly calcified morphotypes are dominant in the summer season (Rigual-Hernández et al., 2020a). Extensive genetic variability in the sampled population of E. huxleyi is likely to contribute to the response of the different morphotypes to seasonal changes in environmental conditions (Rigual-Hernández et al., 2020a). This is somewhat at odds with the view that ocean acidification, and the subsequent decrease in upper-ocean carbonate ion concentration and CaCO3 saturation states, will lead to a shift away from heavily-calcified coccolithophores (Riebesell et al., 2000; Beaufort et al., 2011).
4.2 Carbon export to the deep ocean
Early efforts at the SOTS site were focused on quantifying the gravitational biological carbon pump (Trull et al., 2001b; Boyd and Trull, 2007), while more recent work has also characterized the composition of particles exported to depth and quantified interannual and longer-term variability (Wynn-Edwards et al., 2020c), as well as the role of additional particle injection pumps (Boyd et al., 2019) for the delivery of organic material to the ocean interior (Yang et al., 2024b; Thompson et al., 2024). Yang et al. (2024b) provide an independent estimate of particle export, based on optical sensors on profiling floats (BGC-Argo), and showed that 79 % of export happens via gravitational sinking, which indicates that biological processes, either directly via production of faecal pellets and/or aggregates or vertical migration or indirectly via remineralization, are likely the main modulators of particle flux at depth in the SOTS region and in the broader SAZ.
In addition to the quantification of carbon export, several studies have used the preserved sediment trap samples for investigations focused on diatoms (e.g. Closset et al., 2015; Rigual-Hernández et al., 2016; Wilks et al., 2017; Wilks and Armand, 2017) and calcifying phytoplankton (e.g. King and Howard, 2003; Moy et al., 2009; Rigual-Hernández et al., 2020b), as well as seasonal variations in acantharia and their contribution to particulate export (Sun et al., 2024), and to quantify lithogenic particle fluxes to depth via atmospheric dust deposition (Traill et al., 2022). Analyses of coccolithophore samples collected at the SOTS site have shown that E. huxleyi is the most abundant but does not dominate in terms of the amount of carbonate that it precipitates and subsequently exports to depth (Rigual-Hernández et al., 2018, 2020b). This challenges the view that E. huxleyi is the dominant species with respect to carbon export in the SAZ (Rigual-Hernández et al., 2020b), with larger, more heavily calcified taxa like Calcidiscus leptoporus, Coccolithus pelagicus, and Helicosphaera carteri considered the “heavy lifters”. Because the removal of carbonate from the upper ocean by calcifying plankton plays an important part in the ocean carbon cycle, these nuances are important to the assessment of ecosystem change and the potential consequences of ocean acidification (e.g. Shadwick et al., 2021).
Sediment trap records from the SOTS site have also been used to evaluate changes in the planktonic community occurring over longer timescales. A unique comparison of foraminifera shells collected by the SAZ mooring and those preserved in the underlying sediments suggested that modern shells were substantially lighter, consistent with reduced calcification in the present day, relative to the Holocene (Moy et al., 2009). A similar analysis of E. huxleyi collected in surface water samples, sediment trap samples, and Holocene-era sediments revealed a much more subtle change in shell weight (Rigual-Hernández et al., 2020), while an additional study of a different coccolithophore, Calcidiscus leptoporus, indicated a considerable reduction in size in modern (sediment trap) samples (Rigual-Hernández et al., 2023). These studies highlight the complex and varying response of different calcifying phytoplankton to changes in their environment over these timescales.
4.3 Comparison with other high-latitude time series
Time-series observations have advanced our understanding of a range of processes, from seasonal (e.g. Imai et al., 2002; Brix et al., 2013; Koelling et al., 2022) to interannual (e.g. Currie et al., 2011; Bates et al., 2014; Sutton et al., 2017) to longer term variability in the upper ocean (e.g. Ishii et al., 2011; Ono et al., 2019; Duke et al., 2023) and ocean interior (Honda et al., 2002; Conte et al., 2025). There are relatively fewer observations in the southern high latitudes (e.g. Bates et al., 2014), and parallels are often drawn between the SAZ and the HNLC waters of the Subarctic North Pacific (e.g. Wong and Matear, 1999; Shadwick et al., 2015). The annual cycles of surface water temperature at both Ocean Station Papa (OSP, in the eastern Subarctic North Pacific) and the K2 site (western Subarctic North Pacific) are significantly larger than at the SOTS site, and while both sites undergo mixed-layer deepening in the winter season (to ∼100–150 m; McKinley et al., 2009; Wakita et al., 2010), neither exhibit the depths observed at the SOTS site. At OSP, the seasonal amplitude in surface temperature is roughly 10 °C (Sutton et al., 2017; Duke et al., 2023), and at K2, it is 15 °C (Wakita et al., 2010). In both regions, this seasonal warming counteracts the biologically driven decrease in surface water pCO2 and limits the oceanic uptake of CO2 during the productive season (Fassbender et al., 2016; Sutton et al., 2017), a phenomenon not observed at the SOTS site (e.g. Shadwick et al., 2015). Time series of upper-ocean nutrients and phytoplankton biomass at the KNOT station (near the K2 site in the western Subarctic North Pacific) indicate that the magnitude of seasonal nitrate drawdown is larger than at the SOTS site and occurs without the characteristic seasonal silicate limitation of the SAZ (Tsurushima et al., 2002). The seasonal change in upper-ocean TCO2 at the KNOT site may be more than double that observed at the SOTS site (Tsurushima et al., 2002; Wakita et al., 2010), potentially reflecting the more biologically productive summer conditions of the western North Pacific.
Estimates of NCP at OSP (2±1 ; Fassbender et al., 2016) are comparable with values estimated for the SOTS site (Weeding and Trull, 2014; Shadwick et al., 2015), suggesting that organic carbon available for export to the ocean interior might be similar. Estimates of particulate flux at OSP, however, indicate greater delivery of material to depth, potentially as much as double the POC flux during peak periods, along with comparable but higher CaCO3 flux and significantly more opal (or BSi; Timothy et al., 2013). These higher values of export, considered in the context of similar estimates of NCP at OSP, suggest that the transfer efficiency in the Subarctic North Pacific is higher. The higher flux of opal at OSP may be due to the availability of nutrients year-round (e.g. Harrison, 2002), in contrast to the seasonally limiting concentrations of silicate in the SAZ (see Fig. 10), though the OSP region is seasonally Fe-limited, which exerts some control over the growth of large diatoms (Harrison, 2002). Recent work has shown that in the Southern Ocean, shallow mixed-layer depths are associated with less re-entrainment of exported POC (and the products of remineralized POC), leading to greater export (McClish et al., 2025). If this mechanism were to operate in the Subarctic North Pacific, the shallower winter mixed layer may also contribute to the greater export at OSP.
The SOTS programme began as a sediment trap time series in 1997 and has since been expanded via partnerships with the Australian Integrated Marine Observing System (IMOS), the Australian Bureau of Meteorology, and, most recently, the Australian Antarctic Program Partnership to address surface ocean processes including air–sea fluxes (Schulz et al., 2012), surface waves (Rapizo et al., 2015), carbonate chemistry (Shadwick et al., 2023), biological productivity (Trull et al., 2019), and phytoplankton and microplankton community composition (Eriksen et al., 2018) and diversity. The SOTS programme is part of the OceanSITES network of fixed time-series stations and contributes data to the Global Carbon Project (https://www.globalcarbonproject.org, last access: 22 July 2025) and the Surface Ocean Carbon Atlas (SOCAT, https://socat.info, last access: 22 July 2025). The remit of the SOTS programme is extended beyond the site to both broad and mesoscale understanding of Southern Ocean productivity and circulation via sensors designed for the calibration and validation of in-ocean platforms (Wynn-Edwards et al., 2023; Yang et al., 2024b) and satellite altimetry (Ardhuin et al., 2024; Bohé et al., 2025), respectively.
Sustained time-series observations that resolve processes at timescales relevant to quantifying natural variability are essential to the detection and attribution of anthropogenic change (e.g. Bates et al., 2014; Sutton et al., 2019; Shadwick et al., 2023). By continuing the observational records acquired at the SOTS site, the progress of ocean acidification, deoxygenation, and availability of iron and other nutrients as inputs to broader assessments of expected changes in marine ecosystems can be made. Improved understanding of the mechanisms controlling heat and carbon uptake by the ocean will be used to improve their representation in models and forecasts, which are the tools needed to provide advice about climate variability and its likely future impacts on biogeochemical cycles and marine ecosystems.
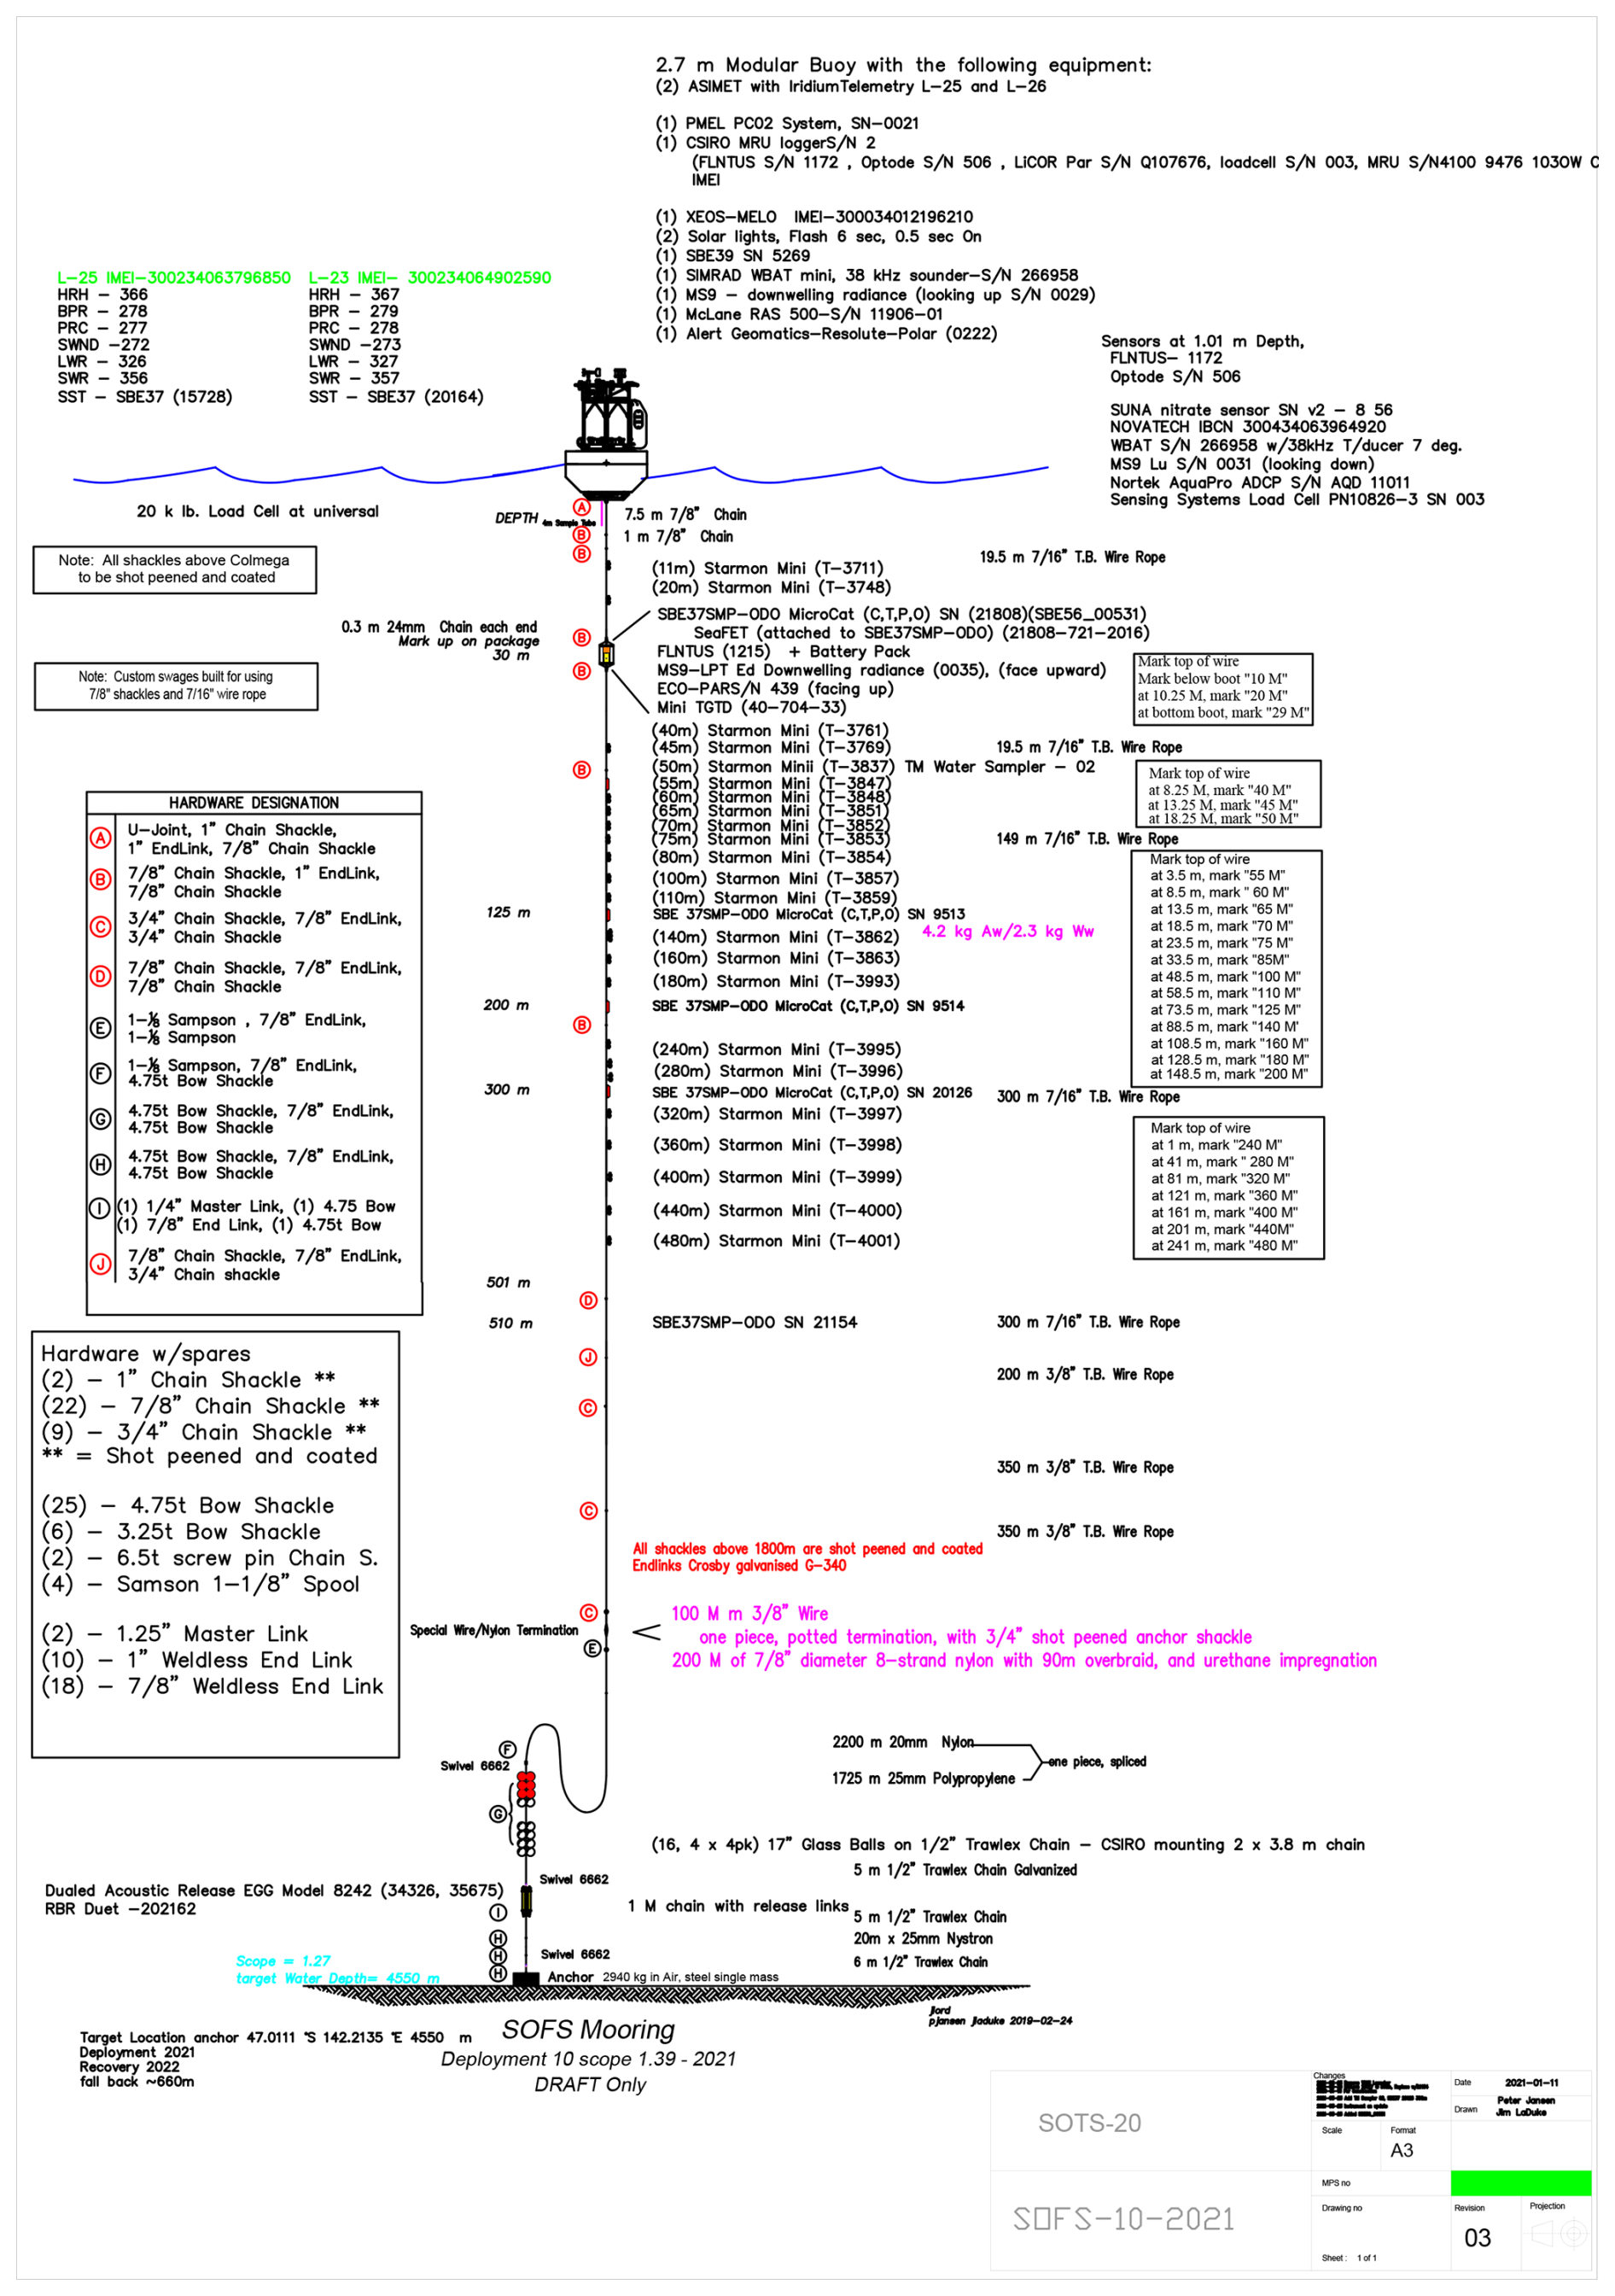
Figure A1The SOFS mooring. An example of the mooring drawing used for the 2021 (SOFS-10) construction and deployment. The SOFS mooring design was provided by the Woods Hole Oceanographic Institution. The drawing is best viewed printed on large format paper; the online version has a high resolution to allow the small font sizes to be read.
Table A1Southern Ocean Time Series (SOTS) mooring deployment and recovery dates and locations. Note that the SOFS-6 mooring broke free of its anchor and began to drift on 1 November 2017 until it was recovered on 9 November 2017; observations collected during this period of drift have not been included in our analyses.
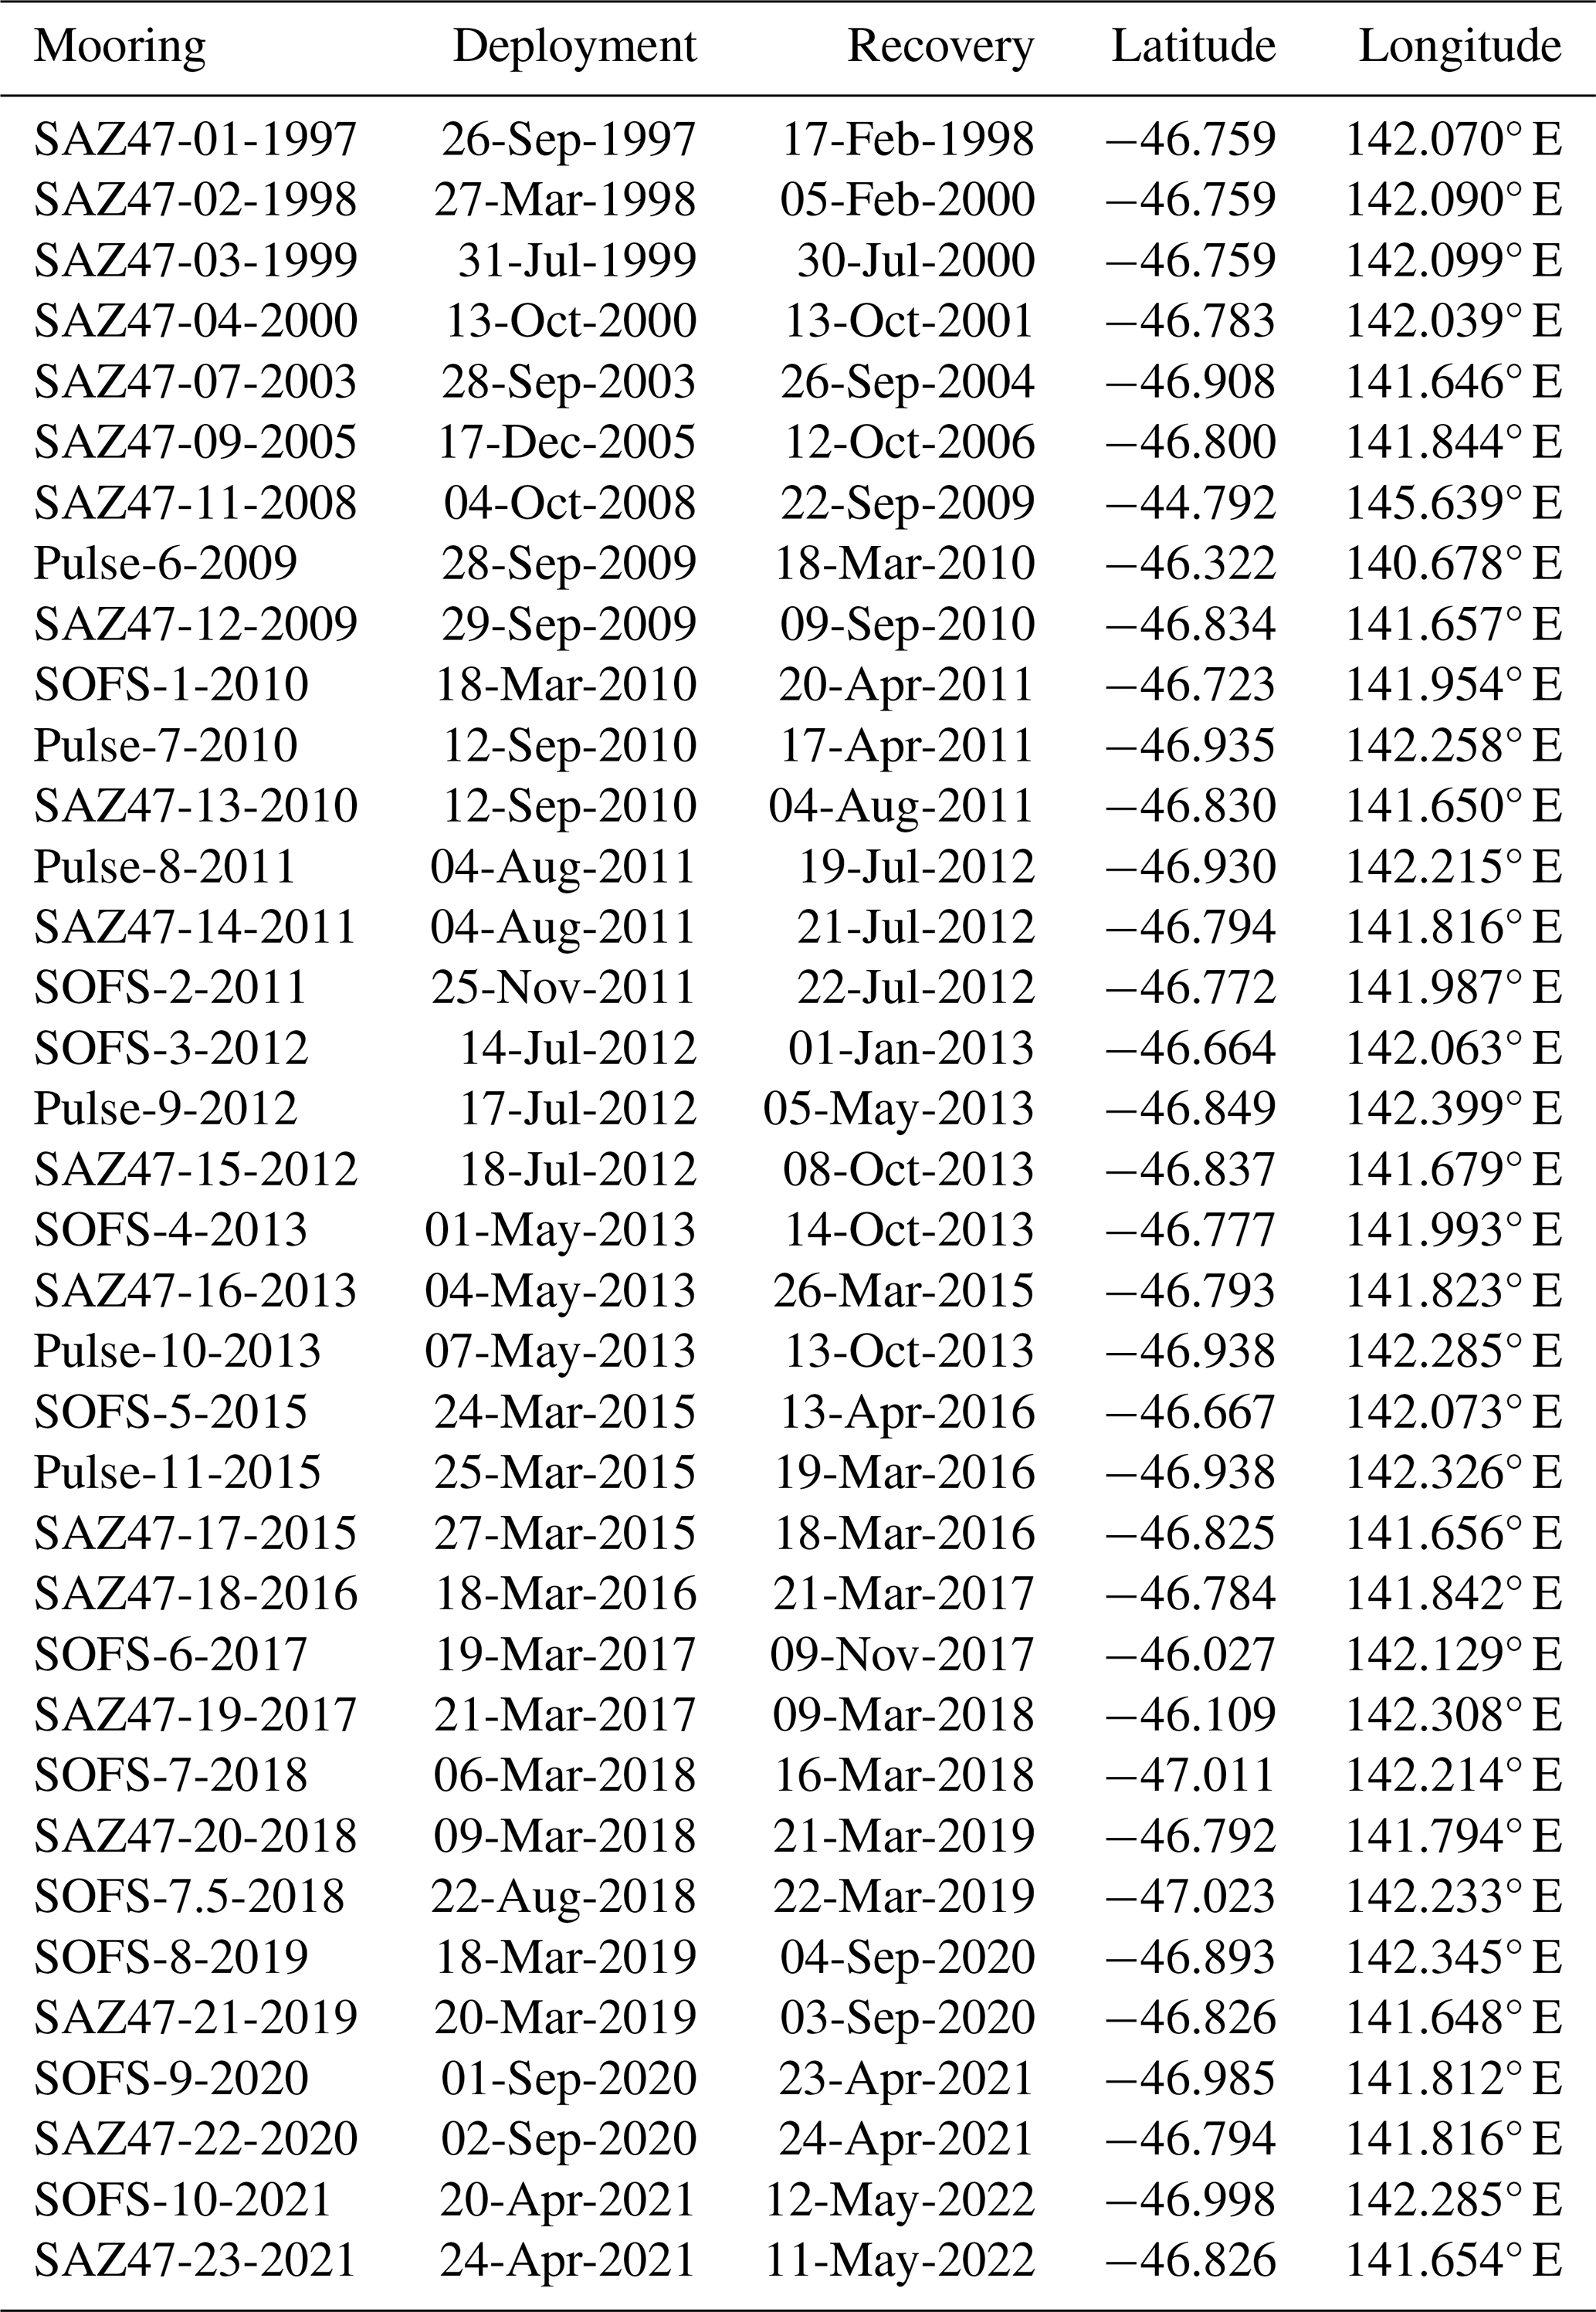
Table A2Monthly mean (standard deviation) values of export and particle composition at the SOTS site from sediment traps deployed at 1000, 2000, and 3800 m between 1997 and 2021. The POC, PIC, BSi, PC, and total mass are given in units of . Also shown are two satellite-based estimates of NPP, i.e. VGPM from 2012 to 2022 and CbPM from 2012 to 2020, both given in units of .
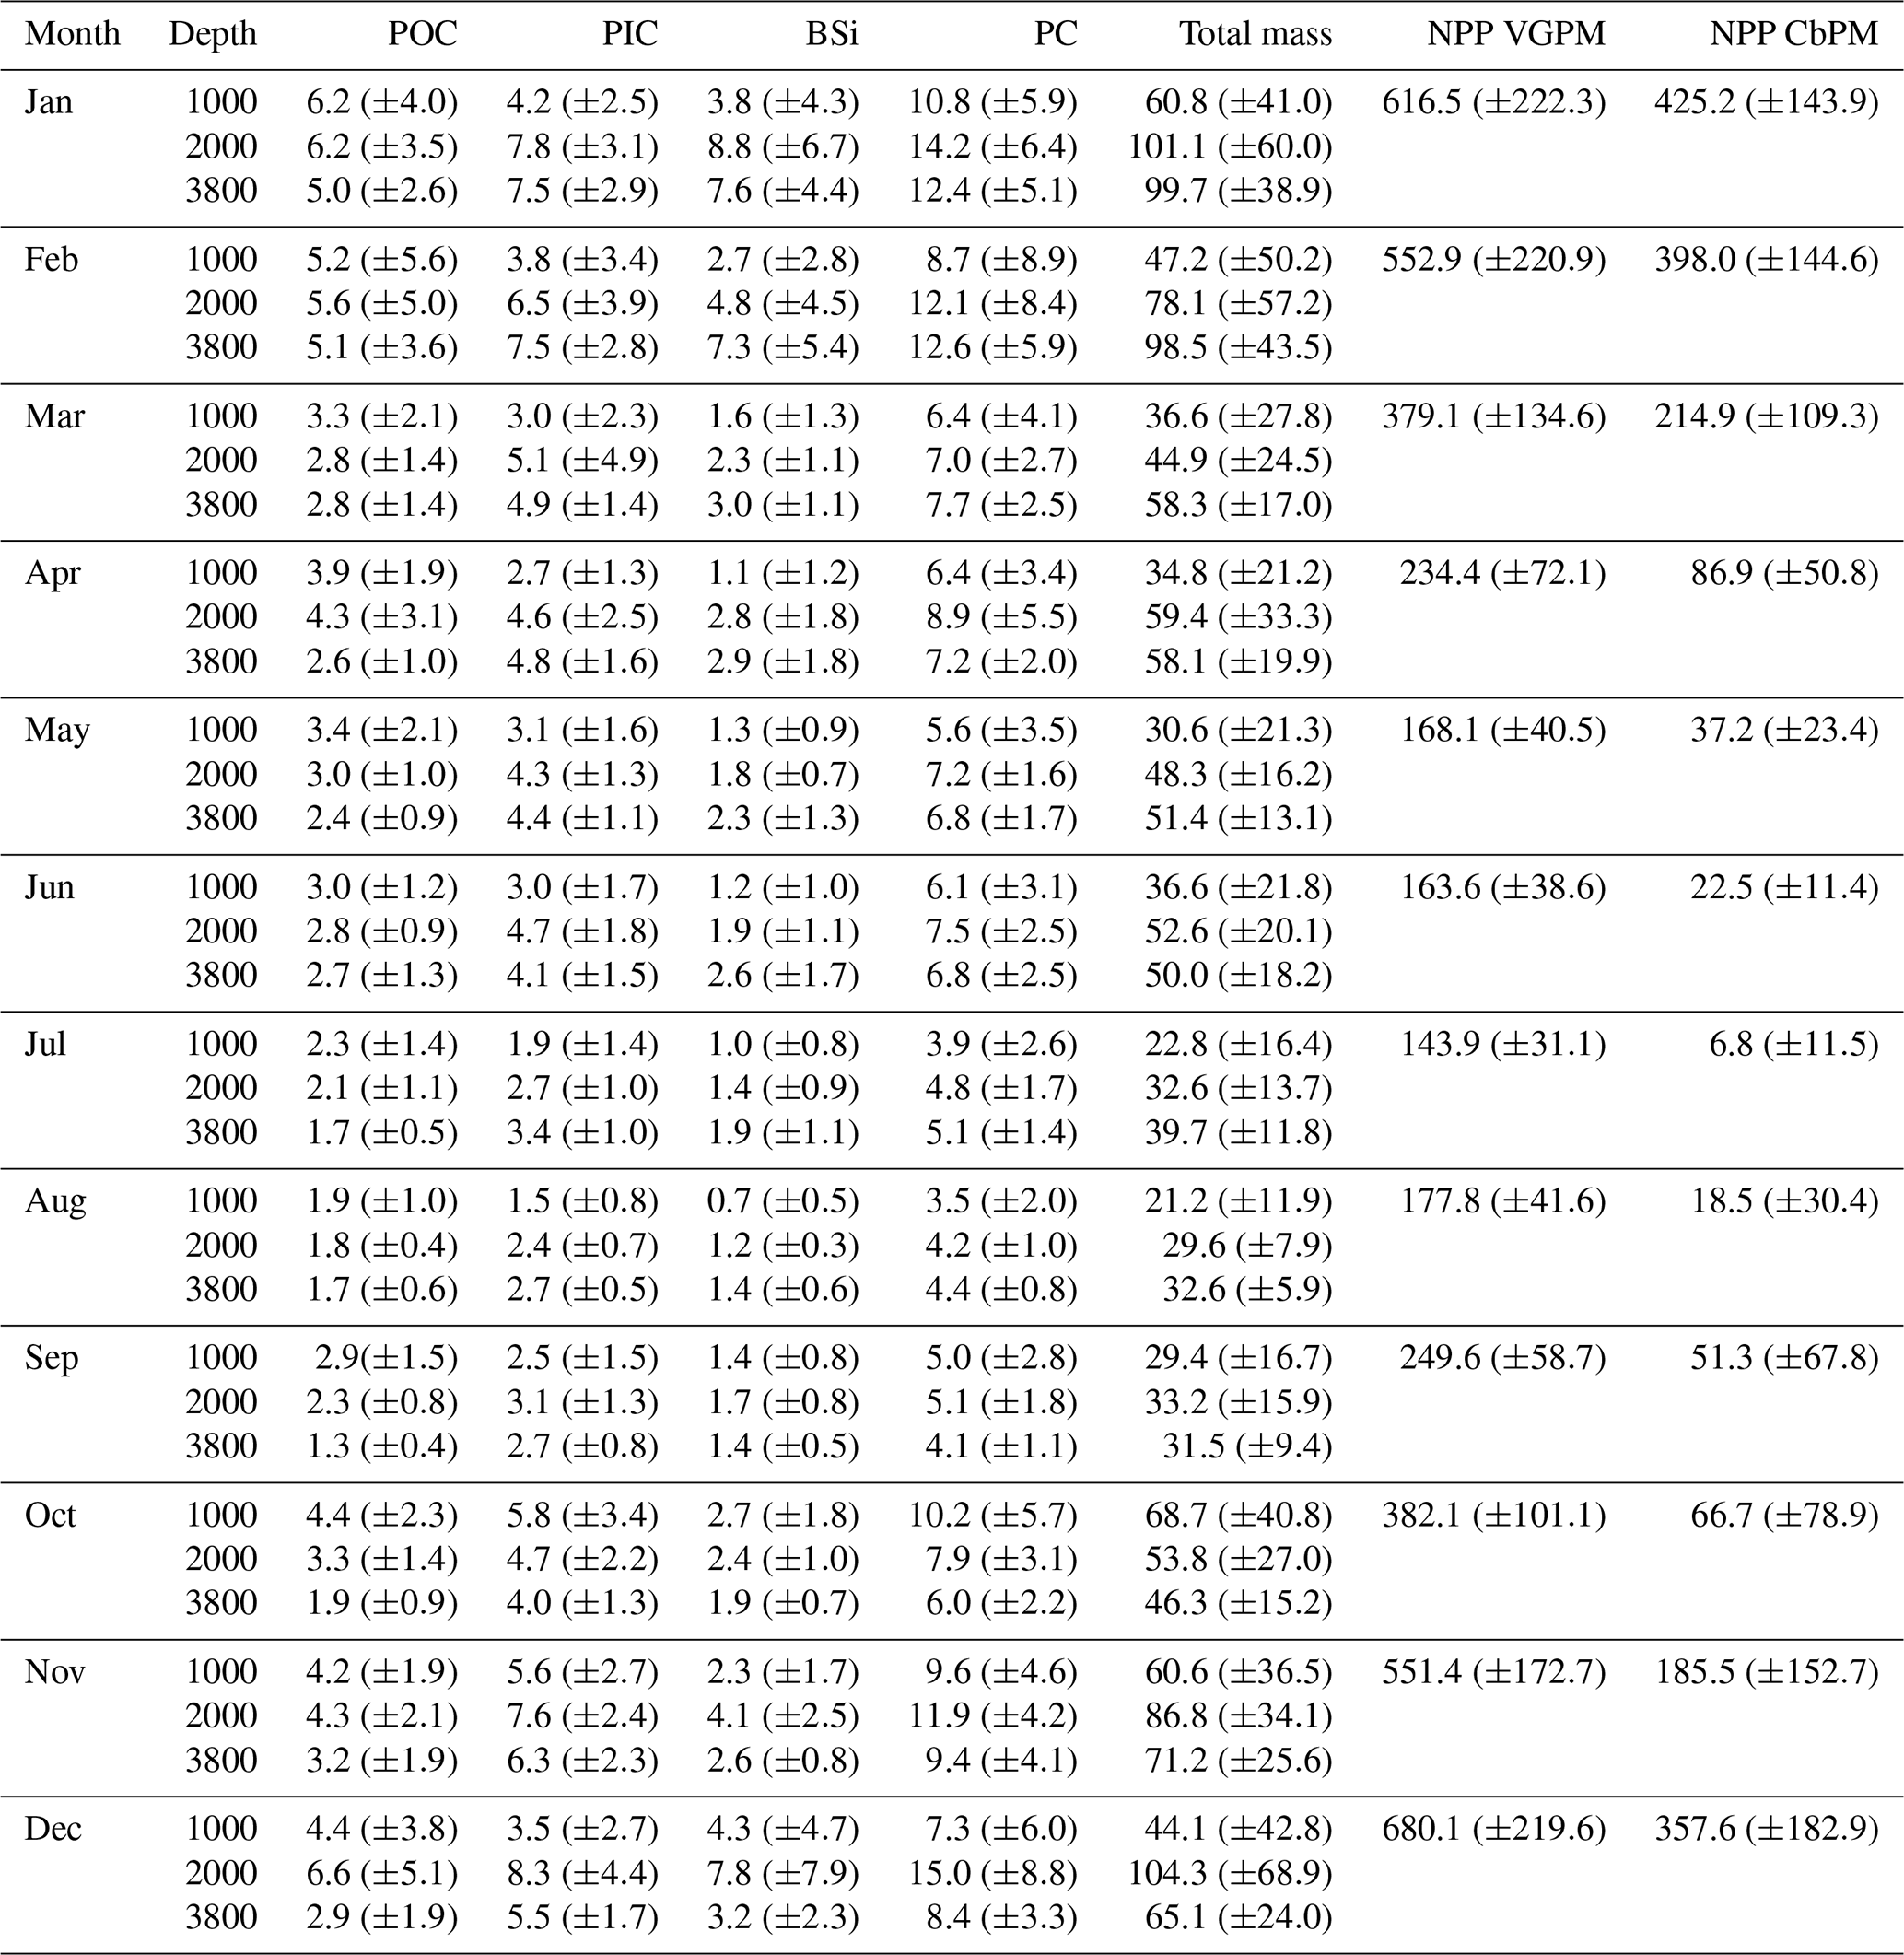
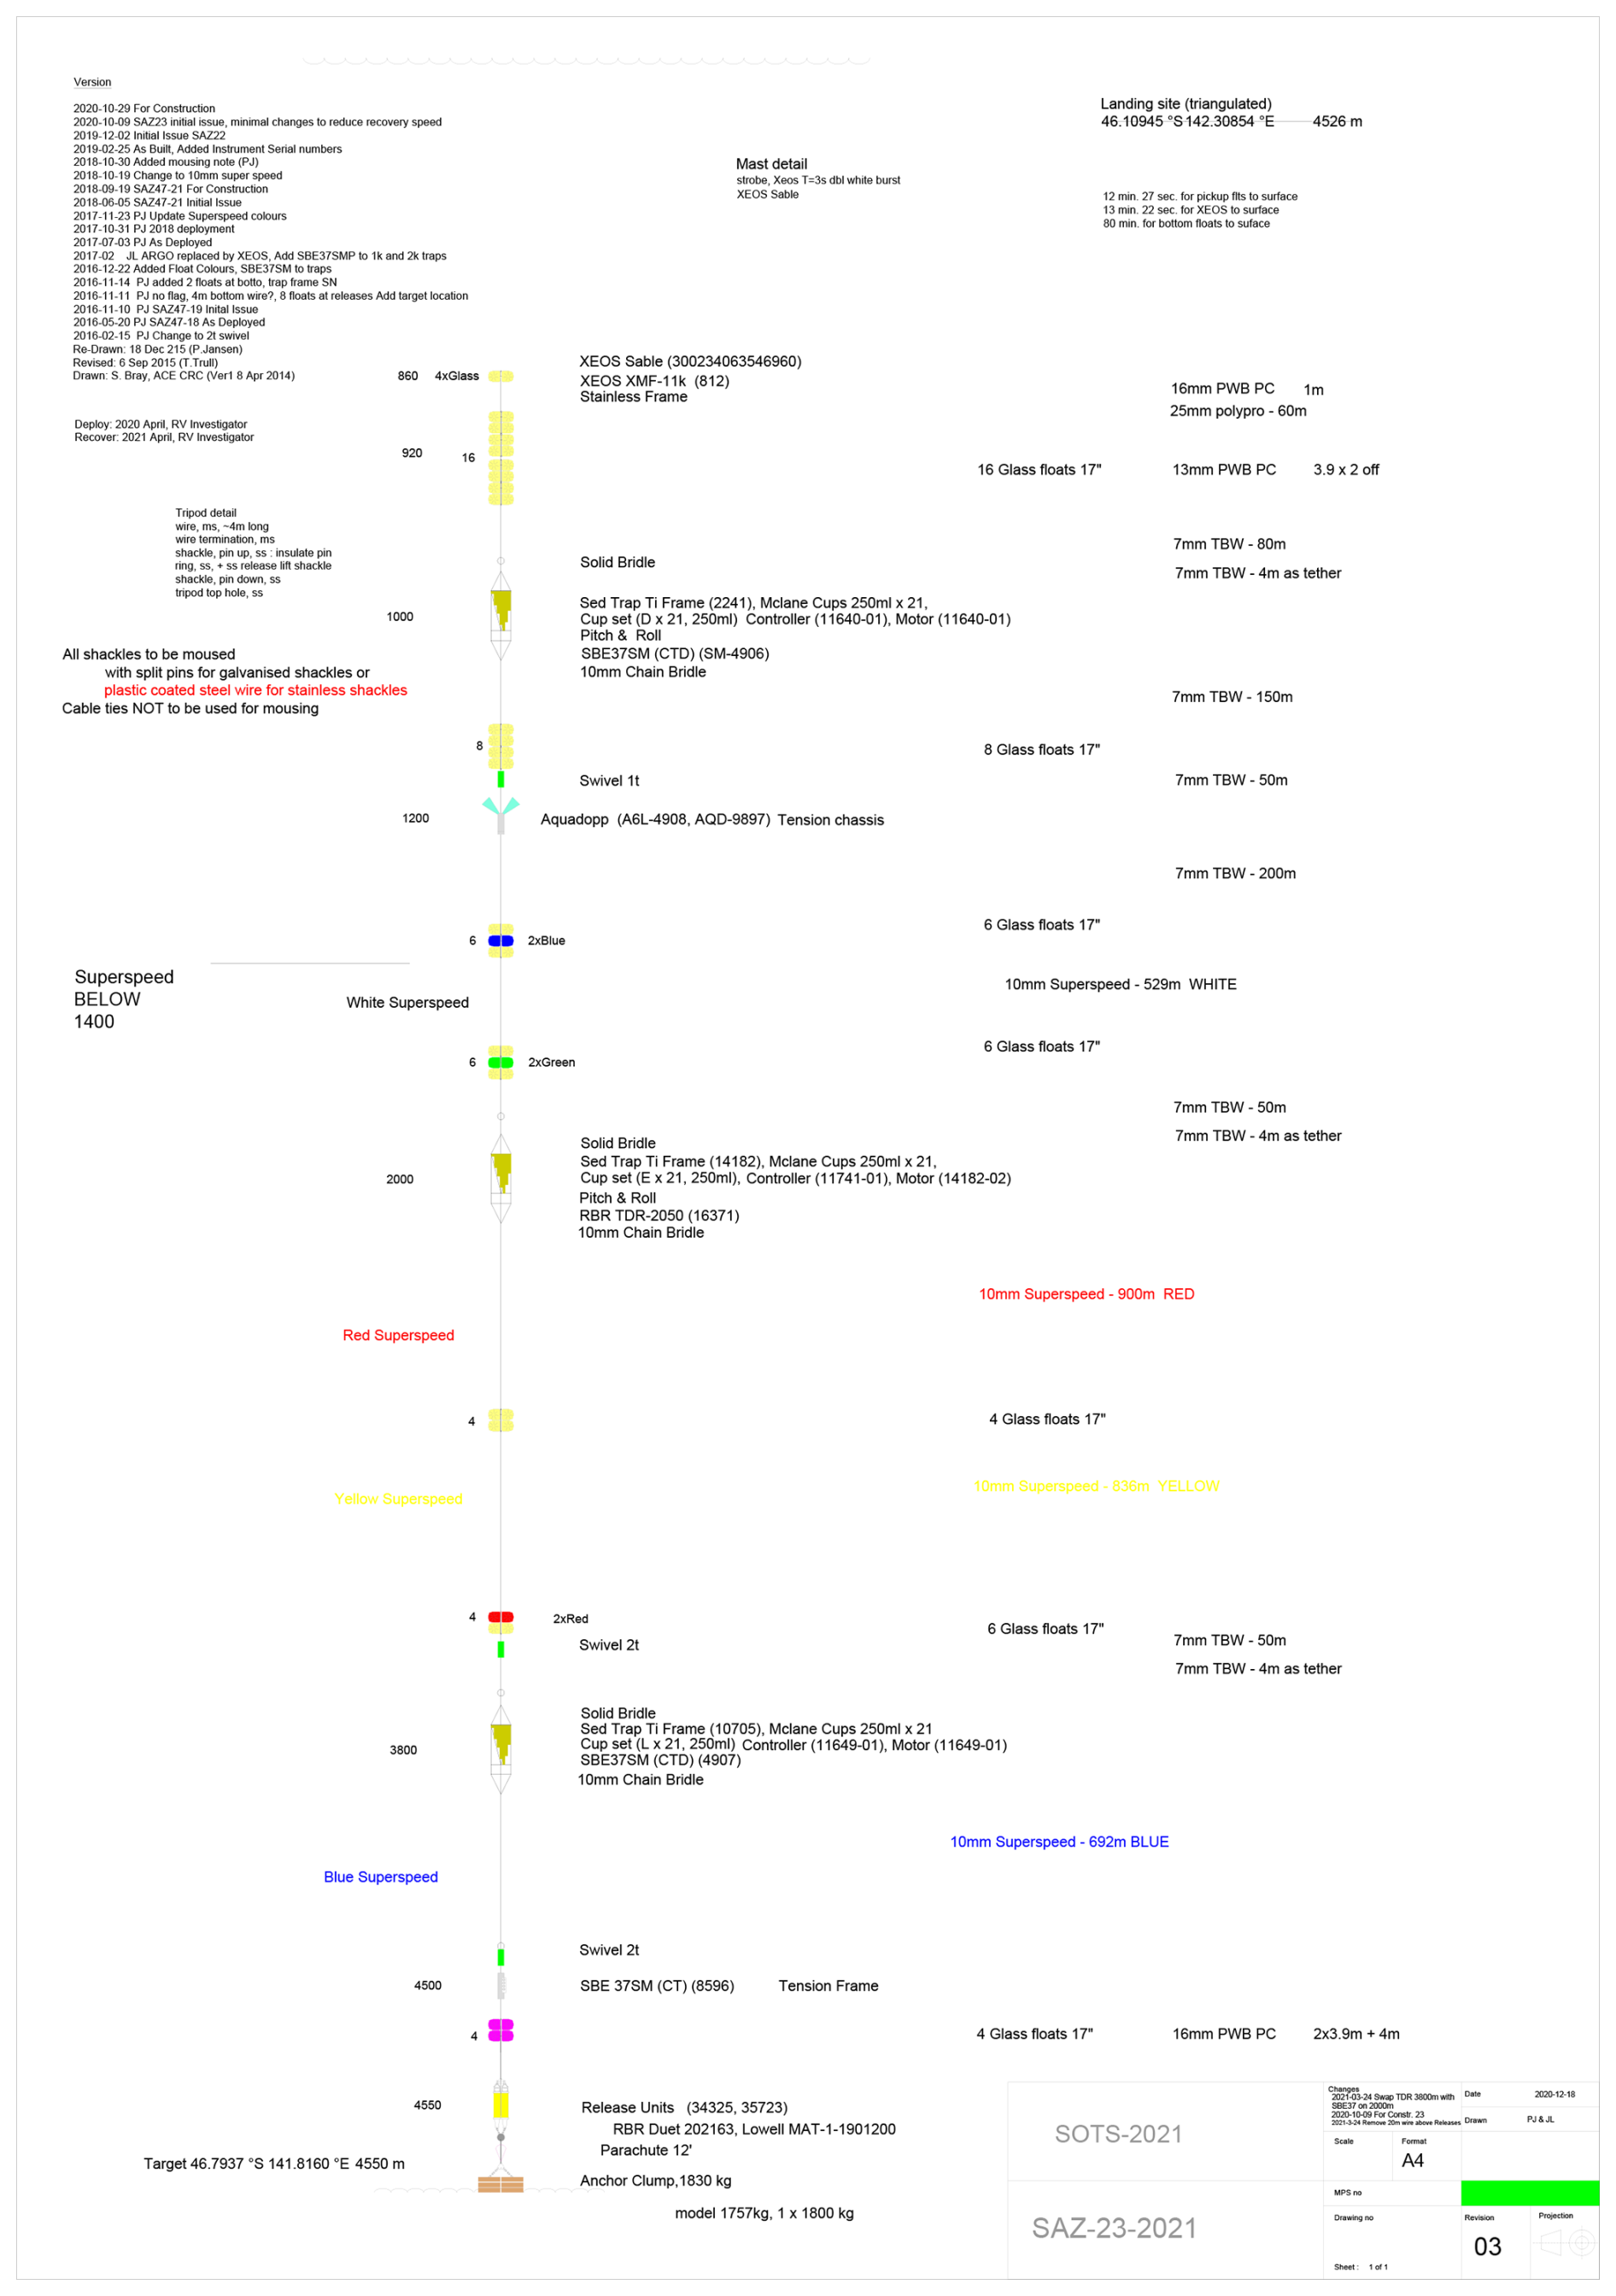
Figure A2The SAZ mooring. An example of the mooring drawing used for the 2021 (SAZ-23) construction and deployment. The drawing is best viewed printed on large format paper; the online version has a high resolution to allow the small font sizes to be read.
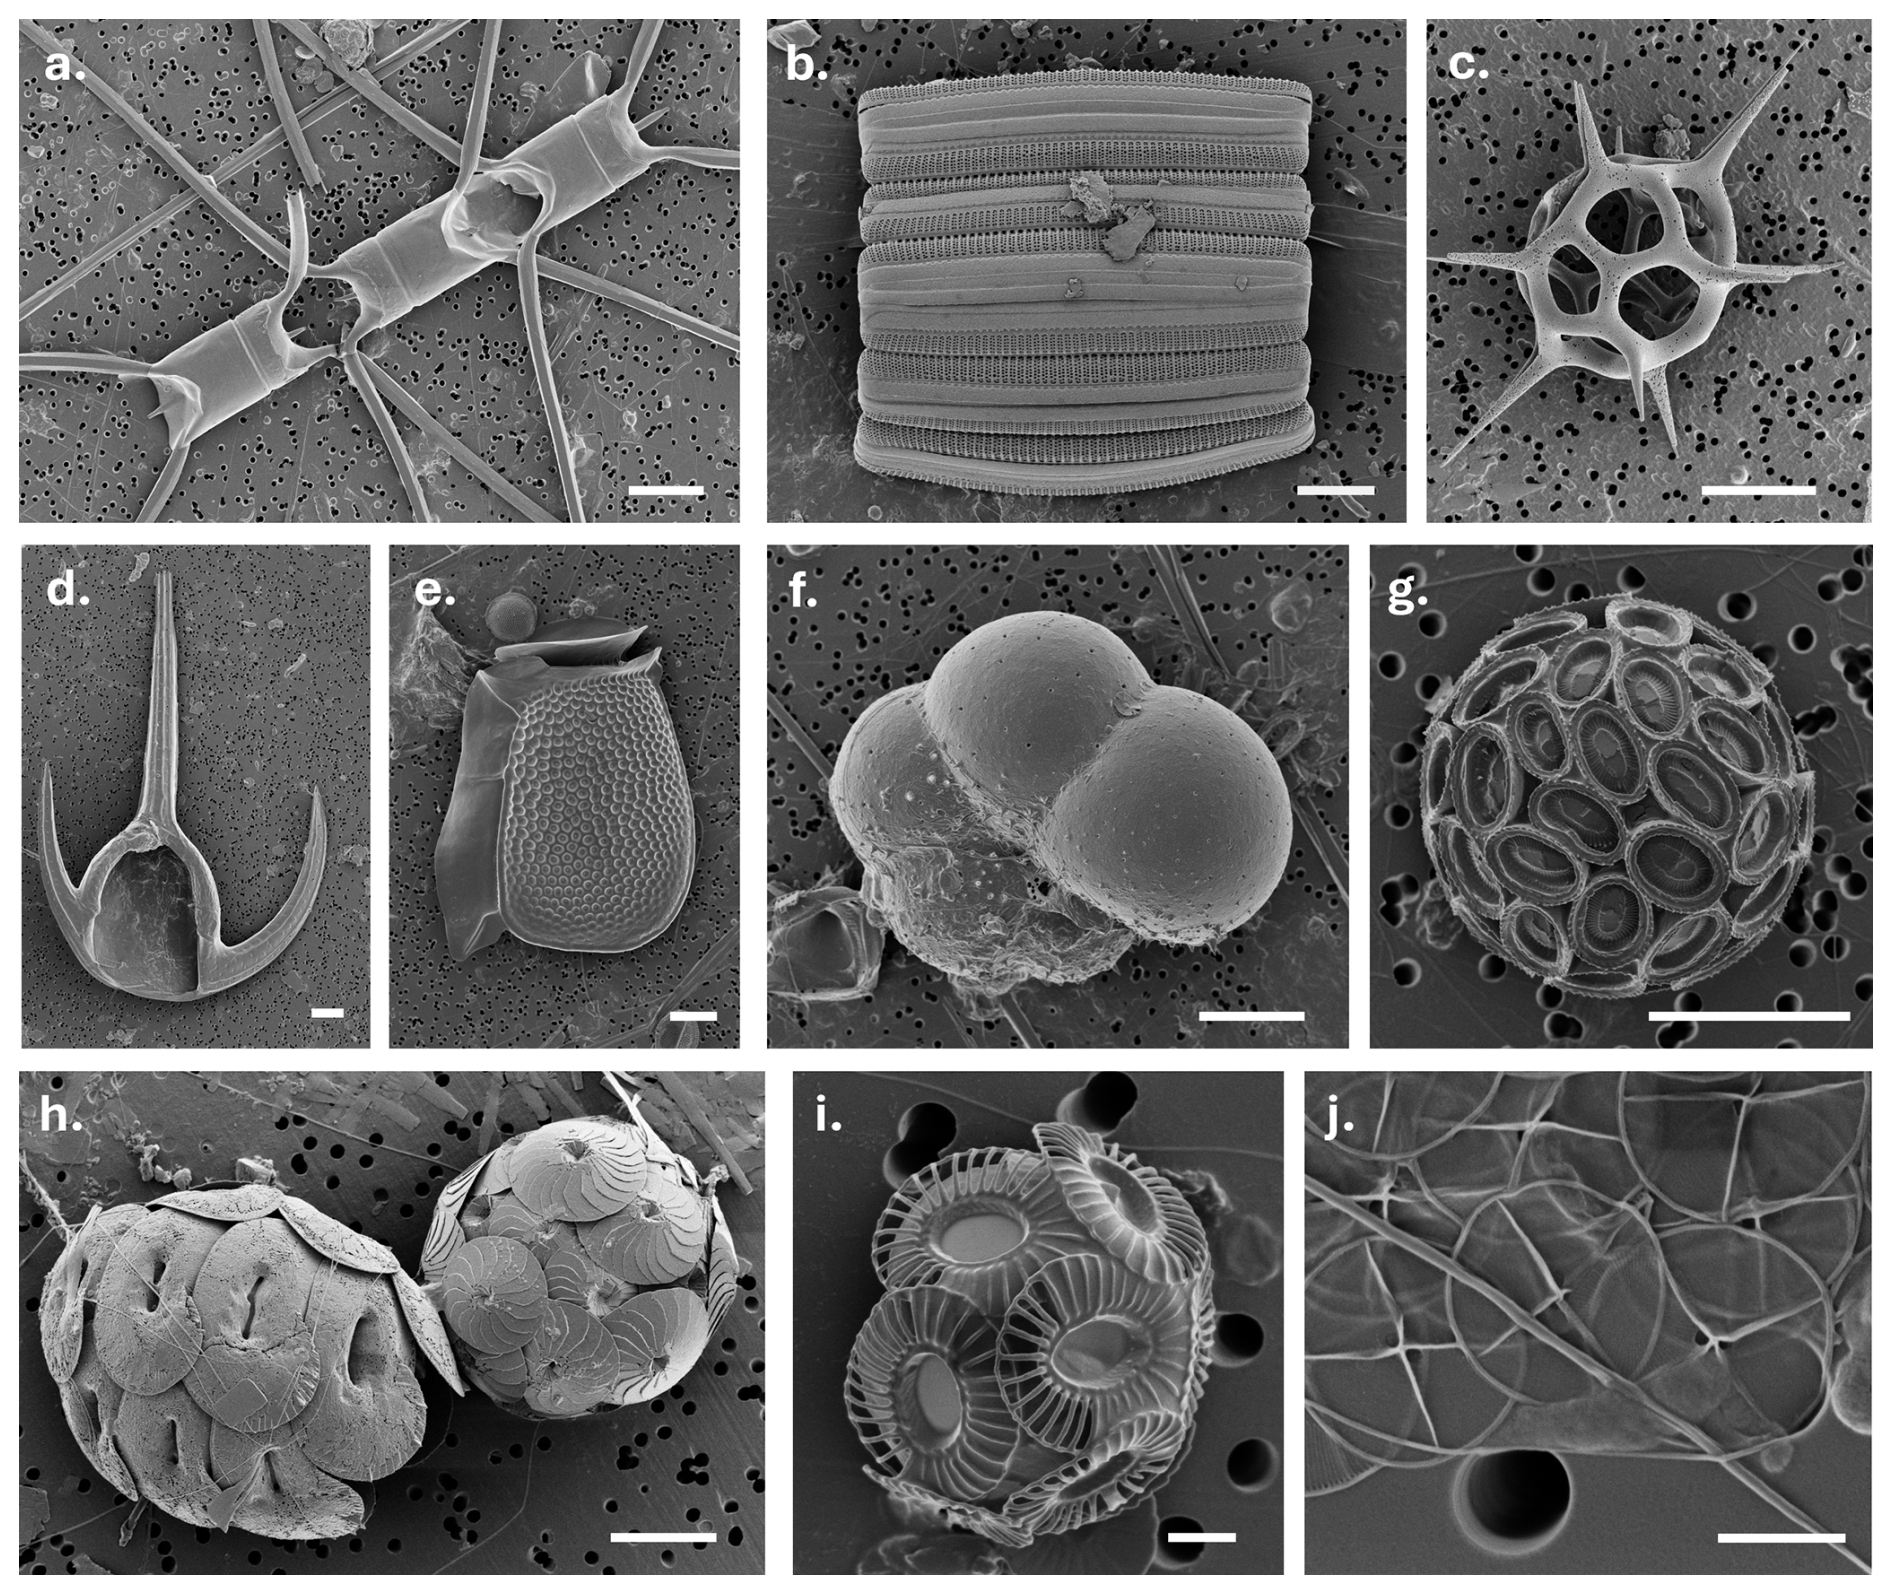
Figure A3Scanning electron microscopy (SEM) images showing a range of taxonomic groups in samples from the SOTS site. (a) Centric diatom Chaetoceros atlanticus; (b) pennate diatom Fragilariopsis doliolus; (c) silicoflagellate Dictyocha speculum; (d) dinoflagellate Tripos azoricus; (e) dinoflagellate Dinophysis truncata; (f) foraminifera; (g) coccolithophorid Coronosphaera cf mediterranea; (h) coccolithophorids Helicosphaera carteri (left) and Calcidiscus leptoporus (right); (i) coccolithophorid Emiliania huxleyi calcification morphotype B/C; (j) haptophyte scales from a species of Chrysochromulina. Scale bars are 10 µm (a–f), 5 µm (g, h), and 1 µm (i, j). All images by Ruth Eriksen.
The observations collected at the SOTS site can be obtained from the Australian Ocean Data Network (AODN; IMOS, 2022) portal: https://portal.aodn.org.au/ (Shadwick et al., 2025). The SOTS voyage annual reports are available from the IMOS SOTS web page (https://catalogue-imos.aodn.org.au/geonetwork/srv/eng/catalog.search#/metadata/afc166ce-6b34-44d9-b64c-8bb10fd43a07, Wynn-Edwards et al., 2020a).
EHS and CAWE conceived the study. EHS, CAWE, PJ, DD, and RSE contributed to the data acquisition, data QC, and analysis. EHS, CAWE, and RSE wrote the paper. All authors contributed to the editing of the text and the production of figures.
The contact author has declared that none of the authors has any competing interests.
Publisher's note: Copernicus Publications remains neutral with regard to jurisdictional claims made in the text, published maps, institutional affiliations, or any other geographical representation in this paper. While Copernicus Publications makes every effort to include appropriate place names, the final responsibility lies with the authors.
The SOTS observatory is supported by Australia's Integrated Marine Observing System (IMOS). IMOS is operated by a consortium of institutions as an unincorporated joint venture, with the University of Tasmania as Lead Agent. The SOTS observatory is part of the OceanSITES global network of time-series stations. This research was supported by a grant of sea time on RV Investigator from the CSIRO Marine National Facility (https://ror.org/01mae9353, last access: 22 July 2025). We thank staff at the University of Tasmania Central Science Lab (Karsten Goemann, Sandrin Feig) for their expert assistance with SEM and the CSIRO Moorings and Instrumentation teams for their efforts to build and deploy moorings each year. The SOTS Team is grateful for the heroic efforts of Tom Trull, who started the programme and ensured its continuity for many years.
This research has been supported by the Australian government as part of the Antarctic Science Collaboration Initiative (ASCI) programme.
This paper was edited by Xinping Hu and reviewed by Scott Nodder, Thiago Monteiro, and one anonymous referee.
Ardhuin, F., Molero, B., Bohé, A., Nouguier, F., Collard, F., Houghton, I., Hay, A., and Legresy, B.: Phase resolved swells across ocean basins in SWOT altimetry data: revealing centimetre scale wave heights including coastal reflection, Geophys. Res. Lett., 51, e2024GL109658, https://doi.org/10.1029/2024GL109658, 2024. a
Bates, N. R., Astor, Y. M., Church, M. J., Currie, K., Dore, J. E., González-Dávila, M., Lorenzoni, L., Muller-Karger, F., Olafsson, J., and Santana-Casiano, J. M.: A time-series view of changing ocean chemistry due to ocean uptake of anthropogenic CO2 and ocean acidification, Oceanography, 27, 126–141, https://doi.org/10.5670/oceanog.2014.16, 2014. a, b, c
Beaufort, L., Probert, I., de Garidel-Thoron, T., Bendif, E. M., Ruiz-Pino, D., Metzl, N., Goyet, C., Buchet, N., Coupel, P., Grelaud, M., Rost, B., Rickaby, R. E. M., and de Vargas, C.: Sensitivity of coccolithophores to carbonate chemistry and ocean acidification, Nature, 476, 80–83, https://doi.org/10.1038/nature10295, 2011. a
Behrenfeld, M. J. and Falkowski, P. G.: Photosynthetic rates derived from satellite-based chlorophyll concentration, Limnol. Oceanogr., 42, 1–20, 1997. a
Bohé, A., Chen, A., Chen, C., Dubois, P., Fore, A., Molero, B., Peral, E., Raynal, M., Stiles, B., Ardhuin, F., Hay, A., Legresy, B., Lenain, L., and Villas Bôas, A. B.: Measuring Significant Wave Height Fields in Two Dimensions at Kilometric Scales With SWOT, IEEE T. Geosci. Remote, 63, 1–19, https://doi.org/10.1109/TGRS.2025.3551605, 2025. a
Bowie, A. R., Lannuzel, D., Remenyi, T. A., Wagener, T., Lam, P. J., Boyd, P. W., Guieu, C., Townsend, A. T., and Trull, T. W.: Biogeochemical iron budgets of the Southern Ocean south of Australia: decoupling of iron and nutrient cycles in the subantarctic zone by the summertime supply, Global Biogeochem. Cy., 23, GB4034, https://doi.org/10.1029/2009GB003500, 2009. a
Boyd, P. W. and Trull, T. W.: Understanding the export of biogenic particles in oceanic waters: Is there consensus?, Prog. Oceanogr., 72, 276–312, https://doi.org/10.1016/j.pocean.2006.10.007, 2007. a
Boyd, P. W., Claustre, H., Levy, M., Siegel, D. A., and Weber, T.: Multi-faceted particle pumps drive carbon sequestration in the ocean, Nature, 568, 327–335, https://doi.org/10.1038/s41586-019-1098-2, 2019. a
Boyd, P. W., Antoine, D., Baldry, K., Cornec, M., Ellwood, M., Halfter, S., Lacour, L., Latour, P., Strzepek, R. F., Trull, T. W., and Rohr, T.: Controls on polar Southern Ocean deep chlorophyll maxima: viewpoints from multiple observational platforms, Global Biogeochem. Cy., 38, e2023GB008033, https://doi.org/10.1029/2023GB008033, 2024. a
Britten, G. L., Wakamatsu, L., and Primeau, F. W.: The temperature-ballast hypothesis explains carbon export efficiency observations in the Southern Ocean, Geophys. Res. Lett., 44, 1831–1838, https://doi.org/10.1002/2016GL072378, 2006. a
Brix, H., Currie, K. I., and Fletcher, S. E. M.: Seasonal variability of the carbon cycle in subantarctic surface water in the South West Pacific, Global Biogeochem. Cy., 27, 200–211, https://doi.org/10.1002/gbc.20023, 2013. a
Closset, I., Cardinal, D., Bray, S. G., Thil, F., Djouraev, I., Rigual-Hernández, A. S., and Trull', T. W.: Seasonal variations, origin, and fate of settling diatoms in the Southern Ocean tracked by silicon isotope records in deep sediment traps, Global Biogeochem. Cy., 29, 1495–1510, https://doi.org/10.1002/2015GB005180, 2015. a
Conte, M., Pedrosa-Pamies, R., Weber, J., and Johnson, R.: The climatology of the deep particle flux in the oligotrophic western North Atlantic gyre, 1978–2022, Prog. Oceanogr., p. 103433, https://doi.org/10.1016/j.pocean.2025.103433, 2025. a
Couespel, D., Lévy, M., and Bopp, L.: Oceanic primary production decline halved in eddy-resolving simulations of global warming, Biogeosciences, 18, 4321–4349, https://doi.org/10.5194/bg-18-4321-2021, 2021. a
Cresswell, G.: Currents of the continental shelf and upper slope of Tasmania, Papers and Proceedings of the Royal Society of Tasmania, 133, 21–30, https://doi.org/10.26749/rstpp.133.3.21, 2000. a
Currie, K. I., Reid, M. R., and Hunter, K. A.: Interannual variability of carbon dioxide drawdown by subantarctic surface waters near New Zealand, Biogeochemistry, 107, 23–34, https://doi.org/10.1007/s10533-009-9355-3, 2011. a
Davies, D. M., Jansen, P., and Trull, T. W.: Southern Ocean Time Series (SOTS) Quality Assessment and Control Report Remote Access Sampler Sample Analysis. Macronutrient analysis. Version 1.0, Tech. rep., CSIRO, Hobart, Australia, https://doi.org/10.26198/5e156a63a8f75, 2020. a, b
Dickson, A. G.: Standard potential of the reaction: , and the standard acidity constant of the ion in synthetic sea water from 273.15 to 318.15 K, J. Chem. Thermodyn, 22, 7113–127, https://doi.org/10.1016/0021-9614(90)90074-Z, 1990. a
Dickson, A. G., Sabine, C. L., and Christian, J. R. (Eds.): Guide to Best Practices for Ocean CO2 Measurement, PICES Special Publication 3, ISBN 1-897176-07-4, 2007. a
Duke, P. J., Hamme, R. C., Ianson, D., Landschützer, P., Ahmed, M. M. M., Swart, N. C., and Covert, P. A.: Estimating marine carbon uptake in the northeast Pacific using a neural network approach, Biogeosciences, 20, 3919–3941, https://doi.org/10.5194/bg-20-3919-2023, 2023. a, b
Eriksen, R. S., Trull, T. W., Davies, D., Jansen, P., Davidson, A. T., Westwood, K., and van den Enden, R.: Seasonal succession of phytoplankton community structure from autonomous sampling at the Australian Southern Ocean Time Series (SOTS) observatory, Mar. Ecol. Prog. Ser., 589, 13–31, https://doi.org/10.3354/meps12420, 2018. a, b, c
Eriksen, R. S., Davies, D. M., Wynn-Edwards, C. A., and Trull, T. W.: Southern Ocean Time Series (SOTS) Quality Assessment and Control Report Remote Access Sampler Sample Analysis. Phytoplankton analysis. Version 1.0, Tech. rep., CSIRO, Hobart, Australia, https://doi.org/10.26198/5f115475407b3, 2020. a, b, c, d
Fassbender, A. J., Savine, C. L., and Cronin, M. F.: Net community production and calcification from 7 years of NOAA Station Papa Mooring measurements, Global Biogeochem. Cy., 30, 250–267, https://doi.org/10.1002/2015GB005205, 2016. a, b
Gnanadesikan, A., Russell, J. L., and Fanrong Zeng: How does ocean ventilation change under global warming?, Ocean Sci., 3, 43–53, https://doi.org/10.5194/os-3-43-2007, 2007. a
Harrison, P. J.: Station Papa time series: insights into ecosystem dynamics, J. Oceanograp., 58, 259–264, 2002. a, b
Henson, S. A., Sanders, R., and Madsen, E.: Global patterns in efficiency of particulate organic carbon export and transfer to the deep ocean: export and transfer efficiency, Global Biogeochem. Cy., 26, GB1028, https://doi.org/10.1029/2011GB004099, 2012. a
Herraiz-Borreguero, L. and Rintoul, S. R.: Subantarctic Mode Water variability influenced by mesoscale eddies south of Tasmania, J. Geophys. Res., 115, C4, https://doi.org/10.1029/2008jc005146, 2010. a, b
Herraiz-Borreguero, L. and Rintoul, S. R.: Regional circulation and its impact on upper ocean variability south of Tasmania (Australia), Deep-Sea Res. Pt. II, 58, 2071–2081, 2011. a
Honda, M. C., Imai, K., Nojiri, Y., Hoshi, F., Sugawara, T., and Kusakabe, M.: The biological pump in the northwestern North Pacific based on fluxes and major components of particulate matter obtained by sediment-trap experiments (1997–2000), Deep-Sea Res. Pt. II, 49, 5595–5625, https://doi.org/10.1016/S0967-0645(02)00201-1, 2002. a
Imai, K., Nojiri, Y., Tsurushima, N., and Saino, T.: Time series of seasonal variation of primary productivity at station KNOT (44°N, 155°E) in the sub-arctic western North Pacific, Deep-Sea Res. Pt. II, 49, 5395–5408, 2002. a
Ishii, M., Kosugi, N., Sasano, D., Saito, S., Midorikawa, T., and Inoue, H. Y.: Ocean acidification off the south coast of Japan: a result from time series observations of CO2 parameters from 1994 to 2008, J. Geophys. Res., 116, C06022, https://doi.org/10.1029/2010JC006831, 2011. a
Jansen, P., Shadwick, E. H., and Trull, T. W.: Southern Ocean Time Series (SOTS): Multi-year Gridded Product Version 1.1, Tech. rep., CSIRO, Hobart, Australia, https://doi.org/10.26198/ae20-8c83, 2022a. a
Jansen, P., Shadwick, E. H., and Trull, T. W.: Southern Ocean Time Series (SOTS) Quality Assessment and Control Report Salinity Records Version 2.0, Tech. rep., CSIRO, Hobart, Australia, https://doi.org/10.26198/rv8y-2q14, 2022b. a
Jansen, P., Shadwick, E. H., and Trull, T. W.: Southern Ocean Time Series (SOTS) Quality Assessment and Control Report Temperature Records Version 2.0, Tech. rep., CSIRO, Hobart, Australia, https://doi.org/10.26198/gfgr-fq47, 2022c. a, b
Jansen, P., Wynn-Edwards, C. A., Shadwick, E. H., and Trull, T. W.: Southern Ocean Time Series (SOTS) Quality Assessment and Control Report Oxygen Records Version 1.0, Tech. rep., CSIRO, Hobart, Australia, https://doi.org/10.26198/1te4-jq81, 2023. a
King, A. L. and Howard, W. R.: Planktonic foraminiferal flux seasonality in Subantarctic sediment traps: a test for paleoclimate reconstructions, Paleoceanography, 18, 1019, https://doi.org/10.1029/2002PA000839 2003. a, b
Koelling, J., Atamanchuk, D., Karstensen, J., Handmann, P., and Wallace, D. W. R.: Oxygen export to the deep ocean following Labrador Sea Water formation, Biogeosciences, 19, 437–454, https://doi.org/10.5194/bg-19-437-2022, 2022. a
Lampitt, R. and Antia, A.: Particle flux in deep seas: regional characteristics and temporal variability, Deep-Sea Res. Pt. I, 44, 1377–1403, 1997. a, b
Latour, P., Strzepek, R. F., Wuttig, K., van der Merwe, P., Bach, L. T., Eggins, S., Boyd, P. W., Ellwood, M. J., Pinfold, T. L., and Bowie, A. R.: Seasonality of phytoplankton growth limitation by iron and manganese in subantarctic waters, Elementa: Science of the Anthropocene, 11, 00022, https://doi.org/10.1525/elementa.2023.00022, 2023. a
Lee, K., Kim, T.-W., Byrne, R. H., Millero, F. J., Feely, R. A., and Liu, Y.-M.: The universal ratio of boron to chlorinity for the North Pacific and North Atlantic Oceans, Geochim. Cosmochim. Ac., 74, 1801–1811, https://doi.org/10.1016/j.gca.2009.12.027, 2000. a
Lewis, E. and Wallace, D. W. R.: Program Developed for CO2 Systems Calculations, ORNL/CDIAC 105, Carbon Dioxide Information Analysis Center, Oak Ridge National Laboratory US Department of Energy, Oak Ridge, Tennessee, https://doi.org/10.2172/639712, 1998. a
Lourey, M. J. and Trull, T. W.: Seasonal nutrient depletion and carbon export in the Subantarctic and Polar Frontal Zones of the Southern Ocean south of Australia, J. Geophys. Res., 106, 31463–31487, 2001. a, b, c
Lueker, T. J., Dickson, A. G., and Keeling, C. D.: Ocean pCO2 calculated from dissolved inorganic carbon, alkalinity, and equations for K1 and K2: validation based on laboratory measurements of CO2 in gas and seawater at equilibrium, Mar. Chem., 70, 105–119, https://doi.org/10.1016/S0304-4203(00)00022-0, 2000. a
McCartney, K., Witkowski, J., Jordan, R., Daugbjerg, N., Malinverno, E., van Wezel, R., Kano, H., Abe, K., Scott, F., Schweizer, M., Young, J., Hallegraeff, G., and Shiozawa, A.: Fine structure of silicoflagellate double skeletons, Mar. Micropaleontol., 113, 10–19, https://doi.org/10.1016/j.marmicro.2014.08.006, 2024. a
McClish, S., Bushinsky, S., Briggs, N., and Douglas, C.: Seasonal re-entrainment of respired organic matter decouples Southern Ocean surface production and annual net community production, ESS Open Archive, February 04, 2025, https://doi.org/10.22541/essoar.173867523.39087309/v1, 2025. a
McKinley, G. A., Takahashi, T., Buitenhuis, E., Chai, F., Christian, J. R., Doney, S. C., Jiang, M.-S., Lindsay, K., Moore, J. K., Quéré, C. L., Lima, I., Murtugudde, R., Shi, L., and Wetzel, P.: North Pacific carbon cycle response to climate variability on seasonal to decadal timescales, J. Geophys. Res., 111, C07S06, https://doi.org/10.1029/2005JC003173, 2009. a
Metzl, N., Tilbrook, B., and Poisson, A.: The annual fCO2 cycle and the air-sea CO2 flux in the sub-Antarctic Ocean, Tellus B, 51, 849–861, 1999. a, b
Mortenson, E., Lenton, A., Shadwick, E. H., Ttrull, T. W., Chamberlain, M., and Zhang, X.: Divergent trajectories of ocean warming and acidification, Environ. Res. Lett., 16, 124063, https://doi.org/10.1088/1748-9326/ac3d57, 2021. a
Mouw, C. B., Barnett, A., McKinley, G. A., Gloege, L., and Pilcher, D.: Global ocean particulate organic carbon flux merged with satellite parameters, Earth Syst. Sci. Data, 8, 531–541, 2016. a, b
Moy, A. D., Howard, W., Bray, S. G., and Trull, T.: Reduced calcification in modern Southern Ocean planktonic foraminifera, Nat. Geosci., 2, 276–280, https://doi.org/10.1038/NGEO460, 2009. a, b, c
Ono, H., Kosugi, N., Toyama, K., Tsujino, H., Kojima, A., Enyo, K., Iida, Y., Nakano, T., and Ishii, M.: Acceleration of ocean acidification in the Western North Pacific, Geophys. Res. Lett., 46, 13161–13169, https://doi.org/10.1029/2019GL085121, 2019. a, b
Orsi, A. H., Whitworth, T., and Nowlin, W. D.: On the meridional extent and fronts of the Antarctic Circumpolar Current, Deep-Sea Res. Pt. I, 42, 641–673, 1995. a, b
Pardo, P. C., Tilbrook, B., van Ooijen, E., Passmore, A., Neill, C., Jansen, P., Sutton, A. J., and Trull, T. W.: Surface ocean carbon dioxide variability in South Pacific boundary currents and Subantarctic waters, Nat. Sci. Rep.-UK, 9, 7592, https://doi.org/10.1038/s41598-019-44109-2, 2019. a, b, c, d, e
Parslow, J. S., Boyd, P. W., Rintoul, S. R., and Griffiths, F. B.: A persistent sub-surface chlorophyll maximum in the Polar Frontal Zone south of Australia: seasonal progression and implications for phytoplankton-light-nutrient interactions, J. Geophys. Res., 106, 31543–31557, https://doi.org/10.1029/2000jc000322, 2001. a
Perez, F. F. and Fraga, F.: Association constant of fluoride and hydrogen ions in seawater, Mar. Chem., 21, 161–168, https://doi.org/10.1016/0304-4203(87)90036-3, 1987. a
Rapizo, H., Babanin, A. V., Schulz, E., Hemer, M. A., and Durrant, T. H.: Observation of wind-waves from a moored buoy in the Southern Ocean, Ocean Dynam., 65, 1275–1288, https://doi.org/10.1007/s10236-015-0873-3, 2015. a
Rees, C., Pender, L., Sherrin, K., Schwanger, C., Hughes, P., Tibben, S., Marouchos, A., and Rayner, M.: Methods for reproducible shipboard SFA nutrient measurement using RMNS and automated data processing, Limnol. Oceanogr. Methods, 17, 25–41, https://doi.org/10.1002/lom3.10294, 2019. a
Ridgway, K. R.: Long-term trend and decadal variability of the southward penetration of the East Australian Current, Geopys. Res. Lett., 34, L13613, https://doi.org/10.1029/2007GL030393 2007. a
Riebesell, U., Zondervan, I., Rost, B., Tortell, P. D., Zeebe, R. E., and Morel, F. M. M.: Reduced calcification of marine plankton in response to increased atmospheric CO2, Nature, 407, 364–367, https://doi.org/10.1038/35030078, 2000. a
Rigual-Hernández, A. S., Trull, T. W., Bray, S. G., and Armand, L.: The fate of diatom valves in the Subantarctic and Polar Frontal Zones of the Southern Ocean: sediment trap versus surface sediment assemblages, Palaeogeogr. Palaeocl., 457, 129–143, https://doi.org/10.1016/j.palaeo.2016.06.004, 2016. a
Rigual Hernández, A. S., Flores, J. A., Sierro, F. J., Fuertes, M. A., Cros, L., and Trull, T. W.: Coccolithophore populations and their contribution to carbonate export during an annual cycle in the Australian sector of the Antarctic zone, Biogeosciences, 15, 1843–1862, https://doi.org/10.5194/bg-15-1843-2018, 2018. a
Rigual-Hernández, A. S., Trull, T., Flores, J. A., Nodder, S., Eriksen, R., Davies, D., Hallegraeff, G. M., Sierro, F. J., Patil, S. M., Cortina, A., Ballegeer, A. M., Northcote, L. C., Abrantes, F., and Rufino, M. M.: Full annual monitoring of Subantarctic Emiliania huxleyi populations reveals highly calcified morphotypes in high-CO2 winter conditions, Sci. Rep.-UK, 10, 1–14, https://doi.org/10.1038/s41598-020-59375-8, 2020a. a, b, c, d, e, f
Rigual Hernández, A. S., Trull, T. W., Nodder, S. D., Flores, J. A., Bostock, H., Abrantes, F., Eriksen, R. S., Sierro, F. J., Davies, D. M., Ballegeer, A.-M., Fuertes, M. A., and Northcote, L. C.: Coccolithophore biodiversity controls carbonate export in the Southern Ocean, Biogeosciences, 17, 245–263, https://doi.org/10.5194/bg-17-245-2020, 2020b. a, b, c, d
Rigual-Hernández, A. S., Langer, G., Sierro, F. J., Bostock, H., Sanchez-Santos, J. M., Nodder, D. D., Trull, T. W., Ballegeer, A. M., Moy, A. D., Eriksen, R., Makowka, L., Bejard, T. M., Rigal-Munoz, F. H., Hernandez-Marin, A., Zorita-Viota, M., and Flores, J. A.: Reduction in size of the calcifying phytoplankton Calcidiscus leptoporus to environmental changes between the Holocene and modern Subantarctic Southern Ocean, Frontiers in Marine Science, 10, 1–14, https://doi.org/10.3389/fmars.2023.1159884, 2023. a
Rigual-Hernández, A., Sánchez-Santos, J., Eriksen, R., Moy, A., Sierro, F., Flores, J., Abrantes, F., Bostock, H., Nodder, S., González-Lanchas, A., and Trull, T.: Limited variability in the phytoplankton Emiliania huxleyi since the pre-industrial era in the Subantarctic Southern Ocean, Anthropocene, 31, 100254, https://doi.org/10.1016/j.ancene.2020.100254, 2020. a
Rintoul, S. R. and Bullister, J. L.: A late winter hydrographic section from Tasmania to Antarctica, Deep-Sea Res. Pt. I, 46, 1417–1454, https://doi.org/10.1016/S0967-0637(99)00013-8, 1999. a
Rintoul, S. R. and England, M. H.: Ekman transport dominates local air–sea fluxes in driving variability of Subantarctic mode water, J. Phys. Oceanogr., 32, 1308–1321, https://doi.org/10.1175/1520-0485(2002)032<1308:ETDLAS>2.0.CO;2, 2002. a
Roemmich, D. and Gilson, J.: The 2004–2008 mean and annual cycle of temperature, salinity, and steric height in the global ocean from the Argo Program, Prog. Oceanogr., 82, 81–100, https://doi.org/10.1016/j.pocean.2009.03.004, 2009. a
Sabine, C. L., Feely, R. A., Gruber, N., Key, R. M., Lee, K., Bullister, J. L., Wanninkhof, R., Wong, C. S., Wallace, D. W. R., Tilbrook, B., Millero, F. J., Peng, T.-H., Kozyr, A., Ono, T., and Rios, A. F.: The oceanic sink for anthropogenic CO2, Science, 305, 367–371, 2004. a
Sarmiento, J. L., Gruber, N., Brzezinski, M. A., and Dunner, J. P.: High-latitude control of thermocline nutrients and low latitude biological productivity, Nature, 427, 56–60, https://doi.org/10.1038/nature02204, 2004. a
Sathyendranath, S., Brewin, R. J., Brockmann, C., Brotas, V., Calton, B., Chuprin, A., Cipollini, P., Couto, A. B., Dingle, J., Doerffer, R., Donlon, C., Dowell, M., Farman, A., Grant, M., Groom, S., Horseman, A., Jackson, T., Krasemann, H., Lavender, S., Martinez-Vicente, V., Mazeran, C., Mélin, F., Moore, T. S., Müller, D., Regner, P., Roy, S., Steele, C. J., Steinmetz, F., Swinton, J., Taberner, M., Thompson, A., Valente, A., Zühlke, M., Brando, V. E., Feng, H., Feldman, G., Franz, B. A., Frouin, R., Gould, R. W., Hooker, S. B., Kahru, M., Kratzer, S., Mitchell, B. G., Muller-Karger, F. E., Sosik, H. M., Voss, K. J., Werdell, J., and Platt, T.: An ocean-colour time series for use in climate studies: the experience of the Ocean-Colour Climate Change Initiative (OC-CCI), Sensors, 19, 4285, https://doi.org/10.3390/s19194285, 2019. a
Schallenberg, C., Jansen, P., and Trull, T. W.: Southern Ocean Time Series (SOTS) Quality Assessment and Control Report Wetlabs FLNTUS instruments Version 2.0, Tech. rep., CSIRO, Hobart, Australia, https://doi.org/10.26198/5c4a932ca8ae4, 2017. a
Schallenberg, C., Harley, J. W., Jansen, P., Davies, D. M., and Trull, T. W.: Multi-year observations of fluorescence and backscatter at the Southern Ocean Time Series (SOTS) shed light on two distinct seasonal bio-optical regimes, Frontiers in Marine Science, 6, 1–19, https://doi.org/10.3389/fmars.2019.00595, 2019. a, b
Schallenberg, C., Strzepek, R. F., Schuback, N., Clementson, L. A., Boyd, P. W., and Trull, T. W.: Diel quenching of Southern Ocean phytoplankton fluorescence is related to iron limitation, Biogeosciences, 17, 793–812, https://doi.org/10.5194/bg-17-793-2020, 2020. a
Schulz, E., Josey, S. A., and Verein, R.: First air-sea flux mooring measurements in the Southern Ocean, Geophys. Res. Lett., 39, LI6606, https://doi.org/10.1029/2012GL052290, 2012. a, b, c, d, e, f
Sedwick, P. N., DiTullio, G. R., Hutchins, D. A., Boyd, P. W., Griffiths, F. B., Crossley, A. C., Trull, T. W., and Queguiner, B.: Limitation of algal growth by iron deficiency in the Australian Subantarctic region, Geophys. Res. Lett., 26, 2865–2868, 1999. a
Shadwick, E. H., Trull, T. W., Tilbrook, B., Sutton, A. J., Schulz, E., and Sabine, C. L.: Seasonality of biological and physical controls on surface ocean CO2 from hourly observations at the Southern Ocean Time Series site south of Australia, Global Biogeochem. Cy., 29, 1–16, https://doi.org/10.1002/2014GB004906, 2015. a, b, c, d, e, f, g, h, i, j, k, l, m, n
Shadwick, E. H., Davies, D. M., Jansen, P., and Trull, T. W.: Southern Ocean Time Series (SOTS) Quality Assessment and Control Report Remote Access Sampler: Total Alkalinity and Total Dissolved Inorganic Carbon Analyses, 2009–2018. Version 1.0, Tech. rep., CSIRO, Hobart, Australia, https://doi.org/10.26198/5f3f23c8b51d6, 2020. a, b
Shadwick, E. H., Rigual-Hernández, A., Eriksen, R., Jansen, P., Davis, D., Wynn-Edwards, C., Sutton, A., Schallenberg, C., Schulz, E., and Trull, T. W.: Changes in Southern Ocean biogeochemistry and the potential impact on pH-sensitive planktonic organisms, Oceanography, 34, 14–15, https://doi.org/10.5670/oceanog.2021.supplement.02-06, 2021. a, b
Shadwick, E. H., Wynn-Edwards, C. A., Matear, R. J., Jansen, P., Schulz, E., and Sutton, A. J.: Observed amplification of the season CO2 cycle at the Southern Ocean Time Series, Frontiers in Marine Science, 10, 1281854, https://doi.org/10.3389/fmars.2023.1281854, 2023. a, b, c, d, e, f, g, h, i
Shadwick, E. H., Wynn-Edwards, C. A., Davies, D. M., Jansen, P., Bray, S. G., Eriksen, R., and Trull, T. W.: Southern Ocean Time Series (SOTS) Datasets, Australian Ocean Data Network [data set], https://portal.aodn.org.au/ (last access: 22 July 2025), 2025. a
Sharp, J. D., Pierrot, D., Humphreys, M. P., Epitalon, J.-M., Orr, J. C., Lewis, E. R., and Wallace, D. W. R.: CO2SYSv3 for MATLAB (Version 3.2.1), Tech. rep., Zenodo [code], https://doi.org/10.5281/zenodo.7552554, 2023. a
Sun, Y., Wynn-Edwards, C. A., Trull, T. W., and Ellwood, M. J.: The role of Acantharia in Southern Ocean strontium cycling and carbon export: insights from dissolved strontium concentrations and seasonal flux patterns, Global Biogeochem. Cy., 38, e2024GB008227, https://doi.org/10.1029/2024GB008227, 2024. a
Sutton, A. J., Sabine, C. L., Maenner-Jones, S., Lawrence-Slavas, N., Meinig, C., Feely, R. A., Mathis, J. T., Musielewicz, S., Bott, R., McLain, P. D., Fought, H. J., and Kozyr, A.: A high-frequency atmospheric and seawater pCO2 data set from 14 open-ocean sites using a moored autonomous system, Earth Syst. Sci. Data, 6, 353–366, https://doi.org/10.5194/essd-6-353-2014, 2014. a, b
Sutton, A. J., Wanninkhof, R., Sabine, C., Feely, R., Cronin, M. F., and Weller, R. A.: Variability and trends in surface seawater pCO2 and CO2 flux in the Pacific Ocean, Geophys. Res. Lett., 44, 5627–5636, https://doi.org/10.1002/2017GL073814, 2017. a, b, c
Sutton, A. J., Feely, R. A., Maenner-Jones, S., Musielwicz, S., Osborne, J., Dietrich, C., Monacci, N., Cross, J., Bott, R., Kozyr, A., Andersson, A. J., Bates, N. R., Cai, W.-J., Cronin, M. F., De Carlo, E. H., Hales, B., Howden, S. D., Lee, C. M., Manzello, D. P., McPhaden, M. J., Meléndez, M., Mickett, J. B., Newton, J. A., Noakes, S. E., Noh, J. H., Olafsdottir, S. R., Salisbury, J. E., Send, U., Trull, T. W., Vandemark, D. C., and Weller, R. A.: Autonomous seawater pCO2 and pH time series from 40 surface buoys and the emergence of anthropogenic trends, Earth Syst. Sci. Data, 11, 421–439, https://doi.org/10.5194/essd-11-421-2019, 2019. a
Sutton, A. J., Battisti, R., Carter, B., Evans, W., Newton, J., Alin, S., Bates, N. R., Cai, W.-J., Currie, K., Feely, R. A., Sabine, C., Tanhua, T., Tilbrook, B., and Wanninkhof, R.: Advancing best practices for assessing trends of ocean acidification time series, Frontiers in Marine Science, 9, 1045667, https://doi.org/10.3389/fmars.2022.1045667, 2022. a
Takahashi, T., Sutherland, S. C., Wanninkhof, R., Sweeney, C., Feely, R. A., Chipman, D. W., Hales, B., Friederich, G., Chavez, F., Sabine, C., Watson, A., Bakker, D. C., Schuster, U., Metzl, N., Yoshikawa-Inoue, H., Ishii, M., Midorikawa, T., Nojiri, Y., Körtzinger, A., Steinhoff, T., Hoppema, M., Olafsson, J., Arnarson, T. S., Tilbrook, B., Johannessen, T., Olsen, A., Bellerby, R., Wong, C., Delille, B., Bates, N., and de Baar, H. J.: Climatological mean and decadal changes in surface ocean pCO2, and net sea-air CO2 flux over the global oceans, Deep-Sea Res. Pt. II, 56, 554–577, 2009. a
Tamsitt, V., Cerovecki, I., Josey, S. A., Gille, S. T., and Schulz, E.: Mooring observations of air–sea heat fluxes in two subantarctic mode water formation regions, J. Climate, 33, 2757–2777, https://doi.org/10.1175/JCLI-D-19-0653.1, 2020. a, b
Thompson, A. F., Dove, L. A., Flint, E., Lacour, L., and Boyd, P. W.: Interactions between multiple physical particle injection pumps in the Southern Ocean, Global Biogeochem. Cy., 38, e2024GB008122, https://doi.org/10.1029/2024GB008122, 2024. a
Timothy, D., Wong, C., Barwell-Clarke, J., Page, J., White, L., and Macdonald, R.: Climatology of sediment flux and composition in the subarctic Northeast Pacific Ocean with biogeochemical implications, Prog. Oceanogr., 116, 95–129, https://doi.org/10.1016/j.pocean.2013.06.017, 2013. a
Traill, C. D., Weiss, J., Wynn-Edwards, C., Perron, M. M. G., Chase, Z., and Bowie, A. R.: Lithogenic particle flux to the subantarctic Southern Ocean: a multi-tracer estimate using sediment trap samples, Global Biogeochem. Cy., 36, e2022GB007391, https://doi.org/10.1029/2022GB007391, 2022. a, b
Traill, C. D., Conde-Pardo, P., Rohr, T., van der Merwe, P., Townsend, A. T., Latour, P., Gault-Ringold, M., Wuttig, K., Corkill, M., Holmes, T. M., Warner, M. J., Shadwick, E., and Bowie, A. R.: Mechanistic constraints on the drivers of Southern Ocean meridional iron distributions between Tasmania and Antarctica, Global Biogeochem. Cy., 38, e2023GB007856, https://doi.org/10.1029/2023GB007856, 2024. a
Trull, T., Rintoul, S. R., Hadfield, M., and Abraham, E. R.: Circulation and seasonal evolution of polar waters south of Australia: implications for iron fertilization of the Southern Ocean, Deep-Sea Res. Pt. II, 48, 2439–2466, 2001a. a, b
Trull, T. W., Bray, S. G., Manganini, S. J., Honjo, S., and Francois, R.: Moored sediment trap measurements of carbon export in the Subantarctic and Polar Frontal Zones of the Southern Ocean, south of Australia, J. Geophys. Res., 106, 31489–31510, 2001b. a, b, c, d
Trull, T. W., Jansen, P., Schulz, E., Weeding, B., Davies, D. M., and Bray, S. G.: Autonomous multi-trophic observations of productivity and export at the Australian Southern Ocean Time Series (SOTS) reveal sequential mechanisms of physical-biological coupling, Frontiers in Marine Science, 6, 525, https://doi.org/10.3389/fmars.2019.00525, 2019. a, b, c, d, e, f, g, h, i
Tsurushima, N., Nojiri, Y., Imai, K., and Watanabe, S.: Seasonal variations of carbon dioxide system and nutrients in the surface mixed layer at staion KNOT (44°N, 155°E) in the subarctic western North Pacific, Deep-Sea Res. Pt. II, 49, 5377–5394, 2002. a, b
van der Merwe, P., Trull, T. W., Goodwin, T., Jansen, P., and Bowie, A.: The autonomous clean environmental (ACE) sampler: a trace-metal clean seawater sampler suitable for open-ocean time-series applications, Limnol. Oceanogr. Methods, 17, 490–504, https://doi.org/10.1002/lom3.10327, 2011. a
van Heuven, S., Pierrot, D., Rae, J., Lewis, E., and Wallace, D.: CO2SYS v 1.1, MATLAB program developed for CO2 system calculations. ORNL/CDIAC-105b, Carbon Dioxide Information Analysis Center, Oak Ridge National Laboratory, U.S. DoE, Oak Ridge, TN, 2011. a
Wakita, M., Watanabe, S., Murata, A., Tsurushima, N., and Honda, M.: Decadal change of dissolved inorganic carbon in the subarctic western North Pacific Ocean, Tellus B, 62, 608–620, https://doi.org/10.1111/j.1600-0889.2010.00476.x, 2010. a, b, c
Weeding, B. and Trull, T. W.: Hourly oxygen and total gas tension measurements at the Southern Ocean Time Series site reveal winter ventilation and spring net community production, J. Geophys. Res., 119, 1–11, https://doi.org/10.1002/2013JC009302, 2014. a, b, c, d, e
Westberry, T., Behrenfeld, M. J., Siegel, D. A., and Boss, E.: Carbon-based primary productivity modelling with vertically resolved photoacclimation, Global Biogeochem. Cy., 22, GB2024, https://doi.org/10.1029/2007GB003078, 2008. a
Wilks, J. V. and Armand, L. K.: Diversity and taxonomic identification of Shionodiscus spp. in the Australian sector of the Subantarctic Zone, Diatom Res., 32, 295–307, 2017. a
Wilks, J. V., Rigual-Hernández, A. S., Trull, T. W., Bray, S. G., Flores, J.-A., and Armand, L. K.: Biogeochemical flux and phytoplankton succession: a year-long sediment trap record in the Australian sector of the Subantarctic Zone, Deep-Sea Res. Pt. I, 121, 143–159, 2017. a
Wong, C. S. and Matear, R. J.: Sporadic silicate limitation of phytoplankton productivity in the subarctic NE Pacific, Deep-Sea Res. Pt. II, 46, 2539–2555, 1999. a
Wynn-Edwards, C. A., Davies, D. M., Jansen, P., Shadwick, E. H., and Trull, T. W.: Southern Ocean Time Series. SOTS Annual Reports: 2018/2019, Report 1. Overview. Version 1.0, Tech. rep., CSIRO, Hobart, Australia, https://doi.org/10.26198/r9ny-r549, 2020a (data available at: https://catalogue-imos.aodn.org.au/geonetwork/srv/eng/catalog.search#/metadata/afc166ce-6b34-44d9-b64c-8bb10fd43a07, last access: 22 July 2025). a
Wynn-Edwards, C. A., Davies, D. M., Shadwick, E. H., and Trull, T. W.: Southern Ocean Time Series. SOTS Quality assessment and control report. Sediment trap particle fluxes Version 1.0., Tech. rep., CSIRO, Hobart, Australia, https://doi.org/10.26198/5dfad21358a8d, 2020b. a, b
Wynn-Edwards, C. A., Shadwick, E. H., Davies, D. M., Bray, S. G., Jansen, P., Trinh, R., and Trull, T. W.: Particle fluxes at the Australian Southern Ocean Time Series (SOTS) achieve organic carbon sequestration at rates close to the global median, are dominated by biogenic carbonates, and show no temporal trends over 20-years, Front. Earth Sci., 8, 329, https://doi.org/10.3389/feart.2020.00329, 2020c. a, b, c, d, e, f
Wynn-Edwards, C. A., Shadwick, E. H., Jansen, P., Schallenberg, C., Maurer, T. L., and Sutton, A. J.: Subantarctic pCO2 estimated from a biogeochemical float: comparison with moored observations reinforces the importance of spatial and temporal variability, Frontiers in Marine Science, 10, 1231953, https://doi.org/10.3389/fmars.2023.1231953, 2023. a
Yang, X., Wynn-Edwards, C. A., Strutton, P., and Shadwick, E. H.: Drivers of air-sea CO2 flux in the subantarctic zone revealed by time series observations, Global Biogeochem. Cy., 38, e2023GB007766, https://doi.org/10.1029/2023GB007766, 2024a. a, b, c, d, e, f, g, h
Yang, X., Wynn-Edwards, C. A., Strutton, P., and Shadwick, E. H.: Carbon export in the subantarctic zone revealed by multi-year observations from biogeochemical-Argo floats and sediment traps, Global Biogeochem. Cy., 38, e2024GB008135, https://doi.org/10.1029/2024GB008135, 2024b. a, b, c