the Creative Commons Attribution 4.0 License.
the Creative Commons Attribution 4.0 License.
 | 23 Jul 2025
M2 monthly and annual mode-1 and mode-2 internal tide atlases from altimetry data and MIOST: focus on the Indo-Philippine archipelago and the region off the Amazon shelf
Michel Tchilibou
Simon Barbot
Loren Carrere
Ariane Koch-Larrouy
Gérald Dibarboure
Clément Ubelmann
The M2 MIOST24 (Multivariate Inversion of Ocean Surface Topography 2024) internal tide atlases described in this study are available in annual (MIOST24a) and monthly (MIOST24m) regional versions for modes 1 and 2 in the Indo-Philippine archipelago and the region off the Amazon shelf. They are derived from 25 years (1993–2017, period 1) of sea level anomalies (SLAs) from altimetry observations. Compared to the MIOST22 (Multivariate Inversion of Ocean Surface Topography 2022) internal tide atlases, MIOST24 incorporates M2 mode-1 and mode-2 wavelengths based on monthly stratification profiles from GLORYS12v1 (1993–2020). The differences between MIOST24a and MIOST22a lead to a RMSD (root mean square difference) of up to 3 cm, reflecting amplitude changes, while the RMSD between MIOST24a and the internal tide atlas HRET (High-Resolution Empirical Tide) indicates both amplitude and phase differences. MIOST24m highlights significant monthly variability of M2 internal tides in the Indo-Philippine archipelago and off the Amazon shelf. In the Amazon region, the internal tide propagates far offshore from March to June but is blocked closer to the coast from August to December. In both regions, the RMSDs between the MIOST24a annual and MIOST24m monthly mode-1 atlases are mainly governed by the phase contribution term. This suggests that the monthly variability of the mode-1 internal tide is more affected by changes in its propagation direction than by fluctuations in amplitude. In contrast, for mode 2, the monthly variability is predominantly associated with amplitude variations, particularly near internal tide generation sites. Variance reductions of SLAs show that MIOST24m outperforms MIOST24a, MIOST22a, and HRET in period 1 in the two regions of interest and in the Amazon region in period 2 (2018–2023). Monthly atlases are therefore recommended to correct the internal tides of the SLAs used to derive them. All these results support the development of MIOST24 global atlases.
- Article
(4381 KB) - Full-text XML
- BibTeX
- EndNote


Since the early 1990s and the launch of the TOPEX/Poseidon mission, spatial altimetry has provided an independent source of measurements of ocean surface topography. These measurements are essential for a better understanding of ocean surface dynamics, deep-ocean circulation, and their impact on climate (Escudier et al., 2017). Significant progress has been made in the processing and reprocessing of altimetry data (Ablain et al., 2015; Dibarboure et al., 2011; Pujol et al., 2016, 2023). Today, more than 30 years of observations are available. They can be used directly or indirectly (model constraints or data assimilation) to generate global atlases of barotropic tides (Desai and Ray, 2014; Egbert and Erofeeva, 2002; Lyard et al., 2021; Stammer et al., 2014) and baroclinic tides, also known as internal tides (Dushaw et al., 2011; Dushaw, 2015; Ray and Zaron, 2016; Ubelmann et al., 2022; Zaron, 2019; Zhao et al., 2012). In turn, these tidal atlases are used as geophysical corrections in the Data Unification and Altimeter Combination System (DUACS) chain to compute the sea level anomaly (SLA) along the altimeter tracks (L3 product) and on regular horizontal grids (L4 product).
Internal tide (IT) atlases have been included in the geophysical corrections of the altimetry dataset since the transition from version DT2018 to version DT2021 in the DUACS processing chain (Faugère et al., 2022; Lievin et al., 2020; Sánchez-Román et al., 2023). The internal tide model currently used as a reference in DUACS is HRETv8.1 (High-Resolution Empirical Tide 8.1, HRET in the rest of the paper) of Zaron (2019). Several global atlases exist as described in Carrère et al. (2021), such as those of Zhao (2018, 2019, 2021) or MIOST (Multivariate Inversion of Ocean Surface Topography; Ubelmann et al., 2021, 2022). The MIOST atlas of Ubelmann et al. (2022), like the Zhao atlases, uses mode-1 and mode-2 theoretical internal tide wavelengths' climatologies to extract the internal tide signal from the altimetric SLA. To calculate the mode-1 wavelength, Ubelmann et al. (2022) used the phase speed dataset of Chelton et al. (1998), estimated by the Wentzel–Kramers–Brillouin (WKB) method, which approximates the eigenvalue solution. Ubelmann et al. (2022) then divided the mode-1 wavelength by 2 to approximate the mode-2 wavelength. These approximations are not always accurate because each baroclinic mode has characteristics influenced by ocean stratification (Gerkema et al., 2004). Furthermore, the climatology of Chelton et al. (1998) is based on stratification profiles calculated from the temperature and salinity of the World Ocean Atlas 1994 (Levitus, 2013), which refers to a different period from the 1993–2017 period of the altimetry data used by Ubelmann et al. (2022). This inconsistency in the time periods could lead to inaccuracies in the location and amplitude of internal tides. The first objective of this study is to propose a 2024 version of the MIOST IT atlas based on more appropriate mode-1 and mode-2 wavelengths, thus overcoming the deficiencies of the wavelengths prescribed in Ubelmann et al. (2022).
The second objective of this study concerns the monthly variability of the internal tide and the relevance of replacing the HRET internal tide atlas with monthly atlases in the DUACS chain. Altimetry-derived internal tide atlases only include the stationary (or coherent, or phase-lock) part of the internal tides. The coherent and incoherent (non-stationary) internal tides both vary with stratification and the interactions of the internal tides with the ocean circulation, including mesoscale eddies (Tchilibou et al., 2020; Duda et al., 2018; Dunphy and Lamb, 2014). This variability is not considered in annual atlases such as HRET, which use the altimetry database as a single set. Zhao (2021) built subsets of altimetry data over the four meteorological seasons and showed that seasonal atlases perform better in tropical regions but with some limitations. In this study, we extend the question of internal tide variability to the monthly scale. The 25 years of SLA altimetry data are divided into monthly subsets to produce monthly atlases of coherent internal tides. We focus on the M2 wave in the Indo-Philippine archipelago (Fig. 1a) and the region off the Amazon shelf in the tropical Atlantic (Fig. 1b).
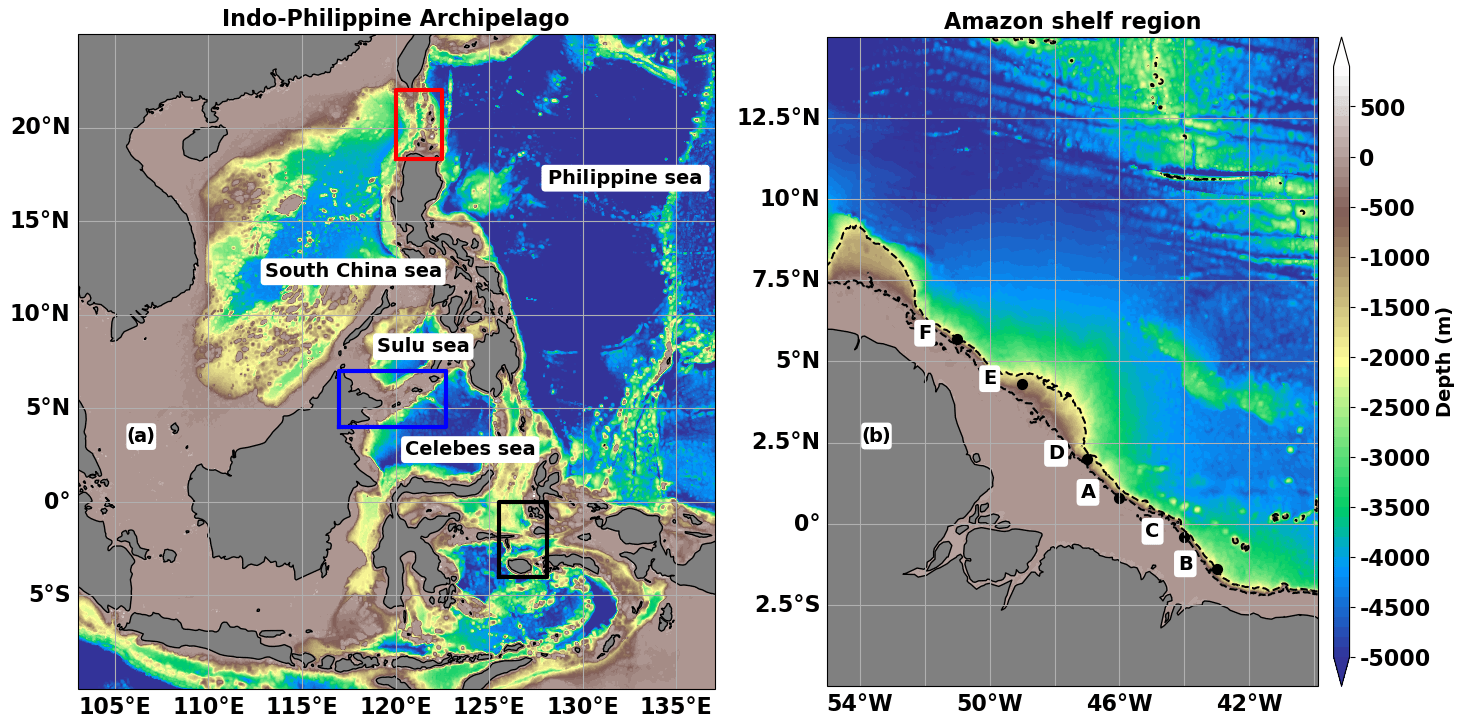
Figure 1Bathymetric depth (m) in the Indo-Philippine archipelago (a) and the region off the Amazon shelf (b). The major internal tide generation areas are indicated by the red (Luzon Strait), blue (Sulu island chain), and black (Seram Sea) boxes for the Indo-Philippine archipelago and by the letters A–F for the Amazon shelf break.
These two tropical regions are chosen because they are hotspots of M2 internal tide generation and sites of high M2 internal tide variability (Jan et al., 2008; Müller et al., 2012; Ray and Zaron, 2011, Niwa and Hibiya, 2001, 2004, 2014; Arbic et al., 2012; Nugroho et al., 2018; Zhao and Qiu, 2023; Pickering et al., 2015; Rainville et al., 2013; Barbot et al., 2021; Tchilibou et al., 2022; Assene et al., 2024; Kaur et al., 2024). In addition, the Indo-Philippine archipelago is a transit zone between the Pacific and Indian oceans (Sprintall et al., 2014; Hurlburt et al., 2011), and the tide-induced mixing there affects the coupled ocean–atmosphere system and thus the global climate system (Koch-Larrouy et al., 2010). More details on these two regions can be found in Nugroho (2017) and Tchilibou et al. (2022). The paper is divided into five sections. In Sect. 2 we give an overview of HRET, compare the wavelength bases of the 2022 and 2024 versions of MIOST-IT, and present the altimetry data and how they are organized in order to derive the annual (classical) and monthly atlases. In Sect. 3, the annual MIOST-IT 2022 and 2024 atlases are compared qualitatively with HRET. The efficiency of the monthly atlases in correcting for internal tides in the altimetry data is analysed in Sect. 5, and the paper is concluded in Sect. 6.
In this section, we describe the different internal tide atlases developed within the study (MIOST24), the datasets used for computation, and the other atlases used for comparison (MIOST22 and HRET).
2.1 HRET
HRET (Zaron, 2019) is an empirical atlas of internal tides at the M2, S2, K1, and O1 frequencies, developed from the analysis of the 1993–2017 (25-year) exact repeat mission altimetry data (TOPEX, Jason-1, Jason-2, Jason-3, ERS, Envisat, Saral/AltiKa, and Geosat follow-on). The method used to construct the HRET internal tide atlas involves a local 2D Fourier analysis of the along-track data and a least-squares fit by a second-order polynomial. HRET is provided on a horizontal grid of 0.05°×0.05° (°) and includes modes 1 and 2. A mask is applied in the regions where the amplitude of the internal tides is very noisy.
2.2 MIOST22 and MIOST24 mode-1 and mode-2 wavelengths for M2
MIOST is an empirical atlas of internal tides obtained by a single inversion that simultaneously separates mesoscale and internal tides (modes 1 and 2) from altimetry observations (Ubelmann et al., 2022). The 2022 and 2024 versions of the MIOST-IT atlases are hereafter referred to as MIOST22 and MIOST24. The suffixes “a” and “m” are used to distinguish between annual (e.g. MIOST24a) and monthly (e.g. MIOST24m) MIOST atlases.
In MIOST, mesoscales are expressed as a reduced wavelet basis. Internal tides are defined by a plane-wave basis according to the dispersion relation (e.g. Rainville and Pinkel, 2006) given in Eq. (1), where f is the Coriolis parameter and λn, Cn, and ω are the wavelength, eigenspeed, and pulsation of the internal tides of mode n.
As mentioned in the introduction, the wavelengths of mode 1 and mode 2 of MIOST22 are obtained by approximation, with mode 2 being half of mode 1. For MIOST24, mode-1 and mode-2 wavelengths are determined independently by solving the eigenvalue equation (Eq. 2; Gill, 1982) with the boundary conditions , where H is the ocean depth and ϕn(z) is the modal vertical structure.
The N(z) stratification profiles required for Eq. (2) are computed from the 1993–2020 monthly climatologies of the potential temperature and salinity fields from the GLORYS12v1 reanalysis (https://doi.org/10.48670/moi-00021, Copernicus, 2024). GLORYS12v1 is a global CMEMS (Copernicus Marine Environment Monitoring Service) product with a horizontal resolution of ° and 50 levels. It is based on an eddy-resolving NEMO platform assimilating along-track altimetric SLAs, satellite sea surface temperature observations, and in situ vertical temperature and salinity profiles (e.g. Argo and moorings). The GLORYS12v1 reanalyses are used as they are to calculate N(z) and derive the monthly mode-1 and mode-2 wavelengths of the M2 internal tides required for MIOST24m. The MIOST24a atlas requires annual wavelengths obtained using N(z) derived from the annual mean of GLORYS12v1 fields. The annual wavelengths used for MIOST22a and MIOST24a and the standard deviations of the monthly wavelengths used for MIOST24m are shown in Fig. 2 for the Indo-Philippine archipelago and in Fig. 3 for the region off the Amazon shelf.
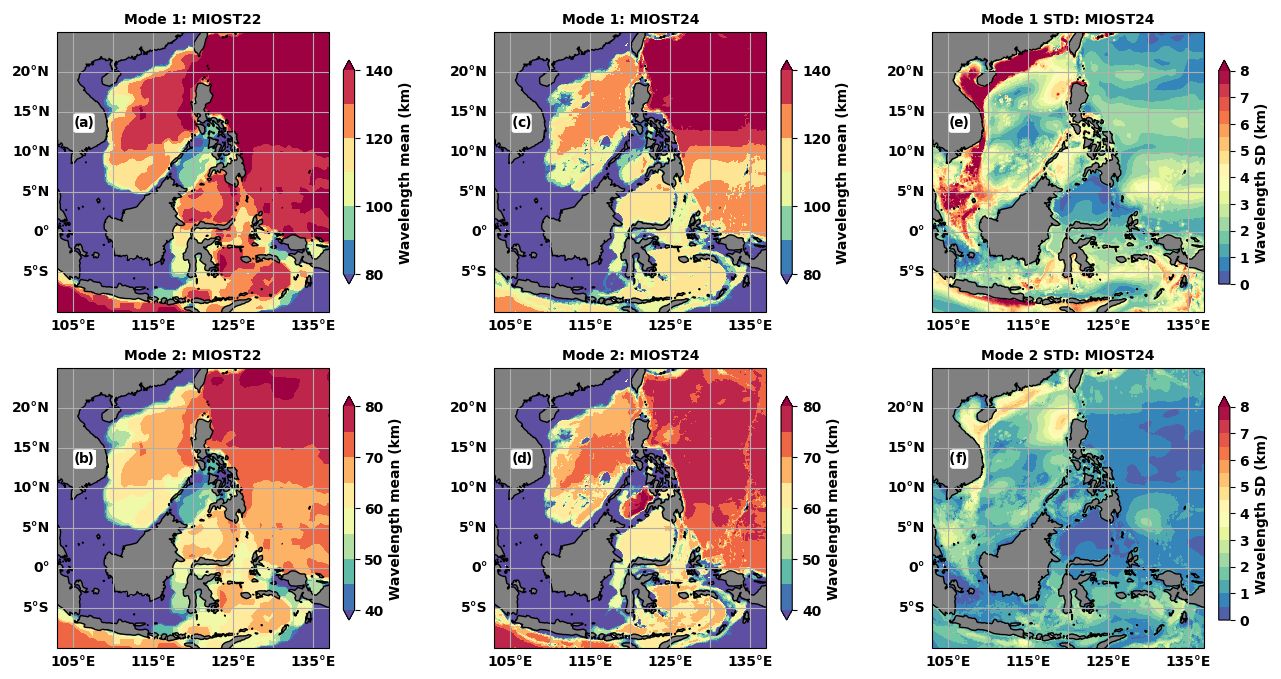
Figure 2M2 wavelength values (a–d, km) and standard deviations (e, f, km) in the Indo-Philippine archipelago: (a) mode-1 and (b) mode-2 annual values used for MIOST22a, (c) mode-1 and (d) mode-2 annual values used for MIOST24a, and standard deviations of the (e) mode-1 and (f) mode-2 monthly wavelengths used for MIOST24m.
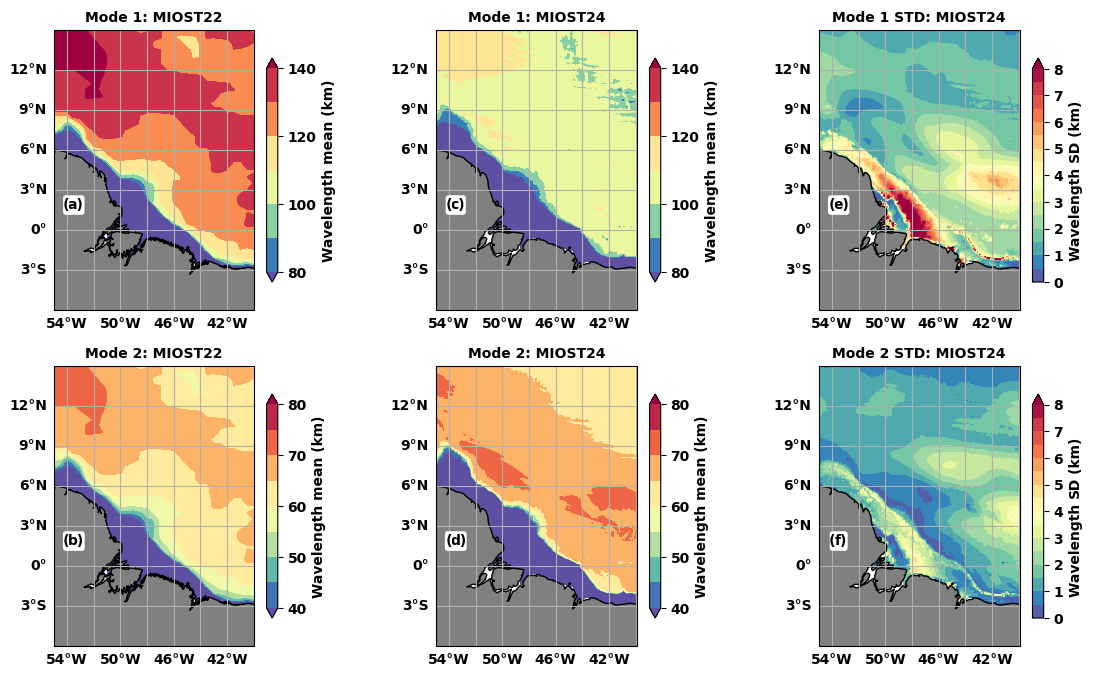
Figure 3As in Fig. 2 but for the region off the Amazon shelf.
In the Indo-Philippine archipelago, the annual mode-1 (Fig. 2a and c) and mode-2 (Fig. 2b and d) M2 wavelengths used for MIOST22 (Fig. 2a and b) are generally longer than those used for MIOST24 (Fig. 2c and d). The differences can be up to 10 km and are quite pronounced south of the Philippine Sea, in the South China Sea, in the Celebes Sea, and in the Banda Sea. Only in the Sulu Sea do MIOST24 wavelengths exceed those of MIOST22. The simplified approximation that the wavelength of mode 2 is half that of mode 1, as used for MIOST22, implies that the spatial distributions of the two modes are equivalent (Fig. 2a and b). It is therefore assumed that the locations of the maximum wavelengths in mode 1 also correspond to the locations of the longest wavelengths in mode 2, and similarly for the locations of the shortest wavelengths. This is not the case when looking at the MIOST24 wavelength maps for modes 1 (Fig. 2c) and 2 (Fig. 2d). In the Sulu Sea, the mode-2 wavelengths of MIOST22 are about 50 km, i.e. among the shortest, while in MIOST24 they are of the order of 80 km, i.e. the highest.
Off the Amazon shelf, the M2 wavelengths of MIOST22 and MIOST24 show differences in spatial distributions and values (Fig. 3). In MIOST22 mode 1 (Fig. 3a) and mode 2 (Fig. 3b), the wavelength gradient is positive from offshore to about 7° N. Thereafter the wavelengths decrease slightly. In MIOST24, the structures are more homogeneous (Fig. 3c and d). Outside the continental shelf, mode-1 wavelengths (Fig. 3c) are mostly between 100 and 110 km, while they exceed 120 km in MIOST22 (Fig. 3a). For mode 2 (Fig. 3d), the dominant structure corresponds to wavelengths between 65 and 70 km, while in MIOST22 the space bounded by this structure also includes a short-wavelength zone between 60 and 65 km (Fig. 3c). As in the Indo-Philippine archipelago, there is no direct relationship between the spatial distributions of mode-1 and mode-2 annual wavelengths in MIOST24. This confirms that the wavelength characteristics are specific to each mode.
The differences between the wavelengths of MIOST22 and MIOST24 reflect the differences between the stratifications and therefore climatological eigenspeeds used in each case. According to Eq. (1), a velocity difference of 0.1 m s−1 corresponds to a 4–5 km shift in the wavelengths for the latitudes of interest here, i.e. between 10° S and 20° N. We have found differences of up to 0.5 m s−1 between the eigenspeeds of MIOST22 and MIOST24 (not shown). Despite the differences in the MIOST22 wavelengths, we remain confident about the MIOST24 wavelengths, as they are close to those used by Zhao (2018), which are based on the same method but which also used the stratification from the World Ocean Atlas 2013 climatology.
The standard deviations of the monthly M2 wavelengths used to derive the MIOST24m atlases are shown for modes 1 and 2 in the last columns of Figs. 2 and 3. In both regions, the M2 wavelength variations over the year are up to 5 km for mode 1 (Figs. 2e and 3e) and 3 km (Figs. 2f and 3f) for mode 2 in the deep ocean. On the continental shelves, the M2 wavelength variations are up to 8 km for mode 1 and 5 km for mode 2. In the Luzon Strait (Fig. 2), wavelength variations are more pronounced in the western part, which opens to the South China Sea, than in the eastern part, which opens to the Philippine Sea. Wavelengths are relatively stable in the Celebes Sea (Fig. 2), with monthly variations of less than 2 km for mode 1 and less than 1 km for mode 2. Outside the continental shelf, wavelengths vary more in the eastern part of the Amazon region (Fig. 3). The wavelength variability would also have been biased if the mode-2 wavelengths had been taken to be half of the mode-1 wavelength as in MIOST22. For example, south of the Philippine Sea, mode-1 wavelengths vary between 1 and 4 km (Fig. 2e), while mode 2 (Fig. 2f) is relatively stable (less than 1 km). In addition, for the boxes in Fig. 1a and the region off the Amazon shelf, the spatial means of monthly wavelengths have been plotted and presented in the Appendix to further illustrate the annual cycles of the mode-1 and mode-2 wavelengths.
2.3 Database organization for annual and monthly atlases
In this study, we use level-3 along-track data with a resolution of 1 Hz (about 7 km), processed according to the DT2024 protocol (Kocha et al., 2023) and available on the Copernicus website (https://doi.org/10.48670/moi-00146, Copernicus, 2025). The HRET correction is re-introduced to obtain an SLA with a full internal tide signal. As in MIOST22, data are from the TOPEX/Poseidon, Jason-1, Jason-2, Jason-3, Sentinel-3A, Sentinel-3B, Saral/AltiKa, CryoSat-2, ERS-1, ERS-2, Envisat, Geosat follow-on, and HY-2A altimetry missions. The altimetry SLAs are selected from 1993 to 2023 and divided into two periods. The MIOST24a and MIOST24m atlases are derived from the SLA over “period 1” between January 1993 and December 2017, as are MIOST22 and HRET. “Period 2”, from January 2018 to December 2023, is used to validate against independent measurements. The validation consists of an inter-comparison of the variances of altimetry residual SLAs after applying the internal tide corrections using the HRET, MIOST22, or MIOST24 atlases.
The 25 years of SLA data from period 1 are used as a single set to derive the annual MIOST24a atlas (stationary part over 25 years). Period-1 SLA data are divided into monthly subsets to derive the monthly MIOST24m coherent internal tide atlases. Period-2 monthly data are extracted in the same way to validate the four atlases (MIOST22a, MIOST24a, MIOSt24m, and HRET). Due to tidal aliasing in the altimetry observations and the low repeatability of the satellites, the monthly subsets are formed by overlapping the month in question by 15 d on each side. For example, the SLA subset data for April are defined with SLAs from 16 March to 15 May. Finally, the monthly time series covers about 4 years (1500 d) of observations (60 d yr−1 over 25 years), which is a minimum for separating the S2 and M2 harmonics for the TOPEX/Poseidon and Jason missions, whose reference orbit has a period of 9.92 d. After analysis of the altimetry data, the MIOST24a and MIOST24m M2 atlases are produced on ° horizontal grids, the same resolution as HRET, while MIOST22 was produced on a ° grid. The HRET mask is applied to the MIOST atlas to harmonize the comparisons.
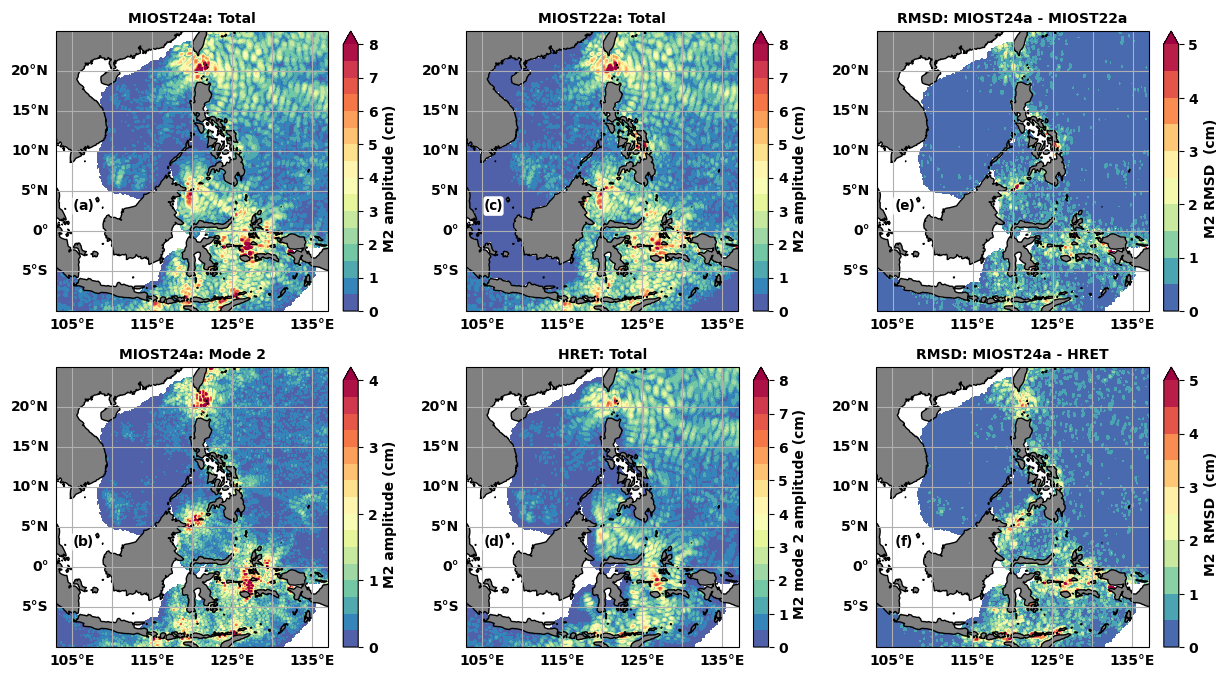
Figure 4Amplitude (a–d, cm) and RMSD (e, f, cm) of the M2 internal tides in the Indo-Philippine archipelago. Amplitudes are shown for (a) MIOST24a total internal tides, (b) MIOST24a mode-2 internal tides, (c) MIOST22a total internal tides, and (d) HRET total internal tides. The RMSD is computed for (e) MIOST22a and (f) HRET against MIOST24a. White corresponds to the HRET mask applied to MIOST24 to facilitate comparison.
This section compares the annual M2 atlas MIOST24a with the annual M2 atlases MIOST22a and HRET. First, the internal tide amplitude maps for M2 are compared. Then, considering the amplitudes (A and Am) and phases (φ and φm), the root mean square difference (RMSD) between MIOST24 and MIOST22 or between MIOST24 and HRET is calculated according to Eq. (3) for a more complete quantification of the distance between the atlases. Equation (3) can be rewritten as Eq. (4), where the terms on the right indicate the contributions of amplitude differences (Ac) and phase differences (Pc) to the RMSD. The phase differences contribute more to the RMSD when the ratio of the second term to the first term on the right is greater than 1 (, Eq. 5). This ratio is referred to as the rate of the contributions to RMSD (Rc) and is evaluated for locations with amplitude differences greater than 3 mm, more precisely , and this is to avoid noise effects on the ratio.
The amplitudes of the total internal tides (including modes 1 and 2) and the mode-2 internal tides, as obtained for MIOST24a, are shown in Fig. 4a and b, respectively, for the Indo-Philippine archipelago. Three main areas stand out for their maximum amplitudes of more than 8 cm for the total internal tides and more than 4 cm for mode 2: the Luzon Strait, the Sulu island chain, and the Seram Sea. These are the main sources of internal tides in this part of the ocean. Once generated, the internal tides propagate through the various seas of the archipelago. From the Luzon Strait, the intrusion of the internal tides is stronger to the east in the Philippine Sea compared to the west in the South China Sea (Fig. 4a).
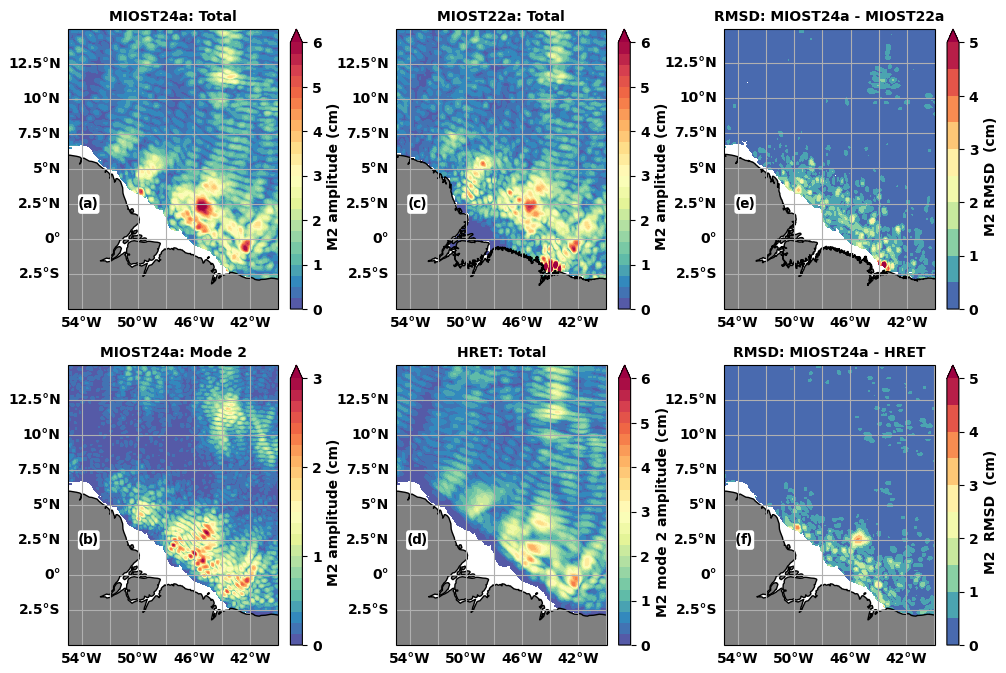
Figure 5As in Fig. 4 but for the region off the Amazon shelf.
MIOST24a (Fig. 4a) agrees with MIOST22a (Fig. 4c) and HRET (Fig. 4d) in the spatial distribution of the M2 internal tide amplitude. Compared to the latter two atlases, MIOST24a shows stronger amplitudes and well-defined small-scale structures, because mode 2 is better defined in MIOST24a. On the RMSD maps, the differences between MIOST24a and MIOST22a are 1–2 cm south of 5° N and around the Luzon Strait (Fig. 4e). For the same locations, the RMSD between MIOST24a and HRET (Fig. 4f) increases to 3 cm, and non-zero RMSD marks are more visible in the Philippine Sea. The spatial mean of Rc is 1.36 for the RMSD between MIOST24a and MIOST22a, indicating that the atlases differ mainly by their phases. For HRET, the spatial mean of Rc is 1.06, and thus amplitudes and phases contribute equally to the differences between MIOST24a and HRET.
In the region off the Amazon shelf (Fig. 5), MIOST24a is also characterized by offshore propagation of internal tides. Two lines of maximum internal tides are distinguishable south of 2.5° N (Fig. 5a), and the third is less clear. Mode 2 from the Amazon shelf break can be seen by following these lines (Fig. 5b). Again, the amplitude of the M2 internal tides is stronger in MIOST24a, but the atlas matches MIOST22a (Fig. 5c) and HRET (Fig. 5d), even if the latter shows smoother structures. As in the Indo-Philippine archipelago, the RMSDs between MIOST24a and the other two atlases are mostly lower than 2 cm but exceed 3 cm at a few locations (Fig. 5e and f). The MIOST24a atlas differs more from MIOST22a (Fig. 5e) and HRET (Fig. 5f) in the first 100 to 200 km from the shelf break. The RMSDs are characterized by small-scale structures in this zone, where the mode-2 amplitude is at its maximum. This suggests that the RMSDs reflect the changes associated with an improved mode 2 in MIOST24. The spatial means of Rc are 1.35 and 0.69 for the RMSDs between MIOST24a and MIOST22a and between MIOST22a and HRET, respectively. In this region, the phase differences are dominant between MIOST22a and MIOST24a, while the amplitude differences are dominant between MIOST24a and HRET.
As a reminder, the MIOST24m monthly atlases are derived from the monthly climatology of the M2 wavelength (Sect. 2.2) and monthly subsets of the altimetry data (Sect. 2.3). Monthly mode-1 and mode-2 atlases for April, July, September, and December have been selected to illustrate the different propagation situations and changing amplitudes of internal tides that occur throughout the year. The RMSD is calculated between the monthly atlas MIOST24m and the annual atlas MIOST24a. The annual cycles of the spatial mean of the RMSD and Rc are used to investigate the monthly variability of the M2 internal tide.
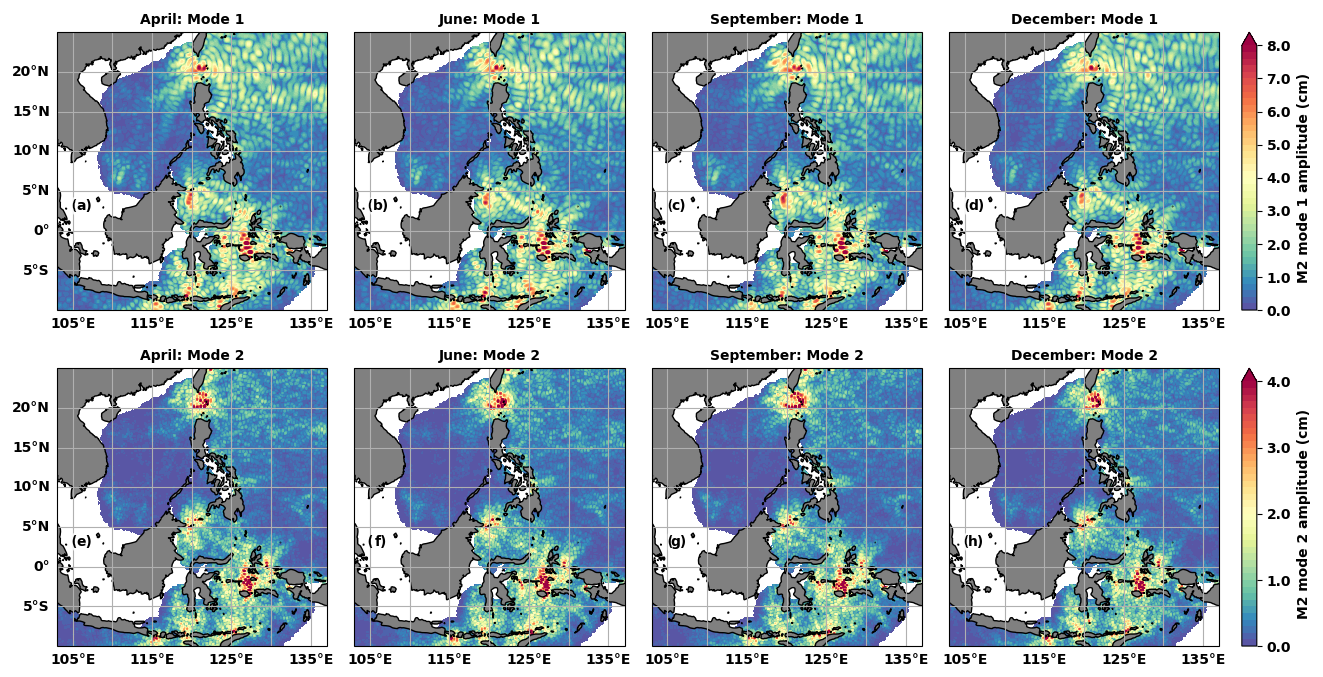
Figure 6MIOST24m M2 mode-1 (a–d) and mode-2 (e–h) amplitudes (cm) for April (a, e), June (b, f), September (c, g), and December (d, h).
In the Indo-Philippine archipelago (Fig. 6), the propagation of the mode-1 internal tides towards the Philippine Sea is most pronounced in the early months of the year, such as April (Fig. 6a), and December (Fig. 6d). For the rest of the year, the structure of the internal tides is distorted quite rapidly, as in June (Fig. 6b) and September (Fig. 6c). In the South China Sea and the rest of the archipelago, the amplitude and trajectories of the internal tides vary. Mode-2 variability is more characterized by amplitude variations (Fig. 6e–h). In the first half of the year in the region off the Amazon shelf (Fig. 7), the internal tides of mode 1 propagate freely from the Amazon shelf break towards the open ocean, as in April (Fig. 7a) and June (Fig. 7b). In the second half of the year, mode 1 has difficulty crossing 5° N, as in September (Fig. 7c) and December (Fig. 7d). The amplitude variations of mode 2 (Fig. 7e–h) are also easily distinguishable in this region.
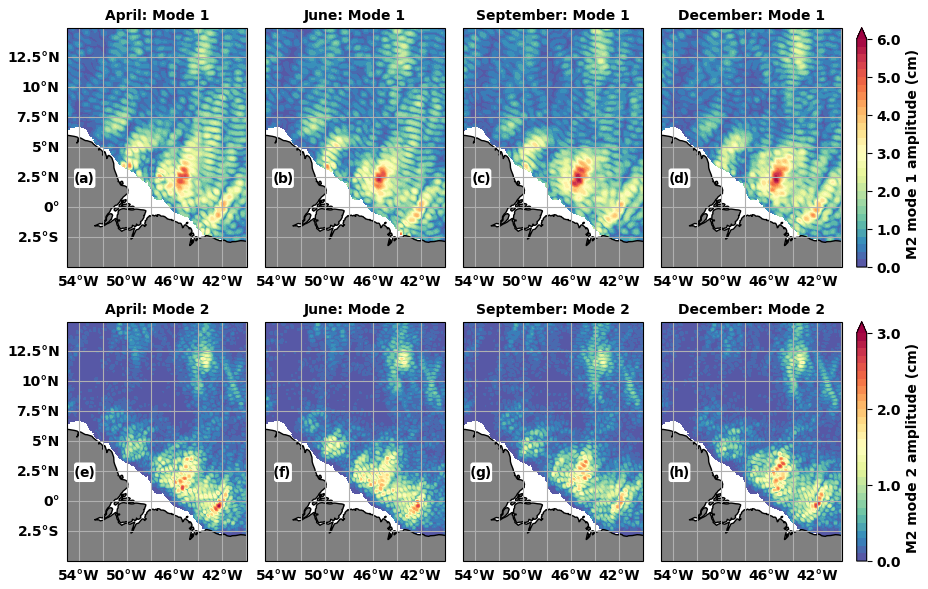
Figure 7As in Fig. 6 but for the region off the Amazon shelf.
The annual cycles of the spatial mean of the monthly RMSD (Fig. 8) of the total internal tides (in red), mode-1 internal tides (in blue), and mode-2 internal tides (in green) confirm that the internal tides are not constant throughout the year. For the two regions of interest, the annual cycle of the spatial mean of the RMSD of the total internal tides is like that of the mode-1 internal tides. The largest discrepancies between the annual MIOST24a atlas and the monthly MIOST24m atlases of the total and mode-1 internal tides occur in January, August, and December in the Indo-Philippine archipelago (Fig. 8a). Monthly and annual atlases are closest in May (Fig. 8a). The annual cycle of the spatial mean of the RMSD for mode 2 is consistent with that of mode 1, although there is a 1-month lag between the maximum peaks of mode 1 and mode 2 (Fig. 8a).
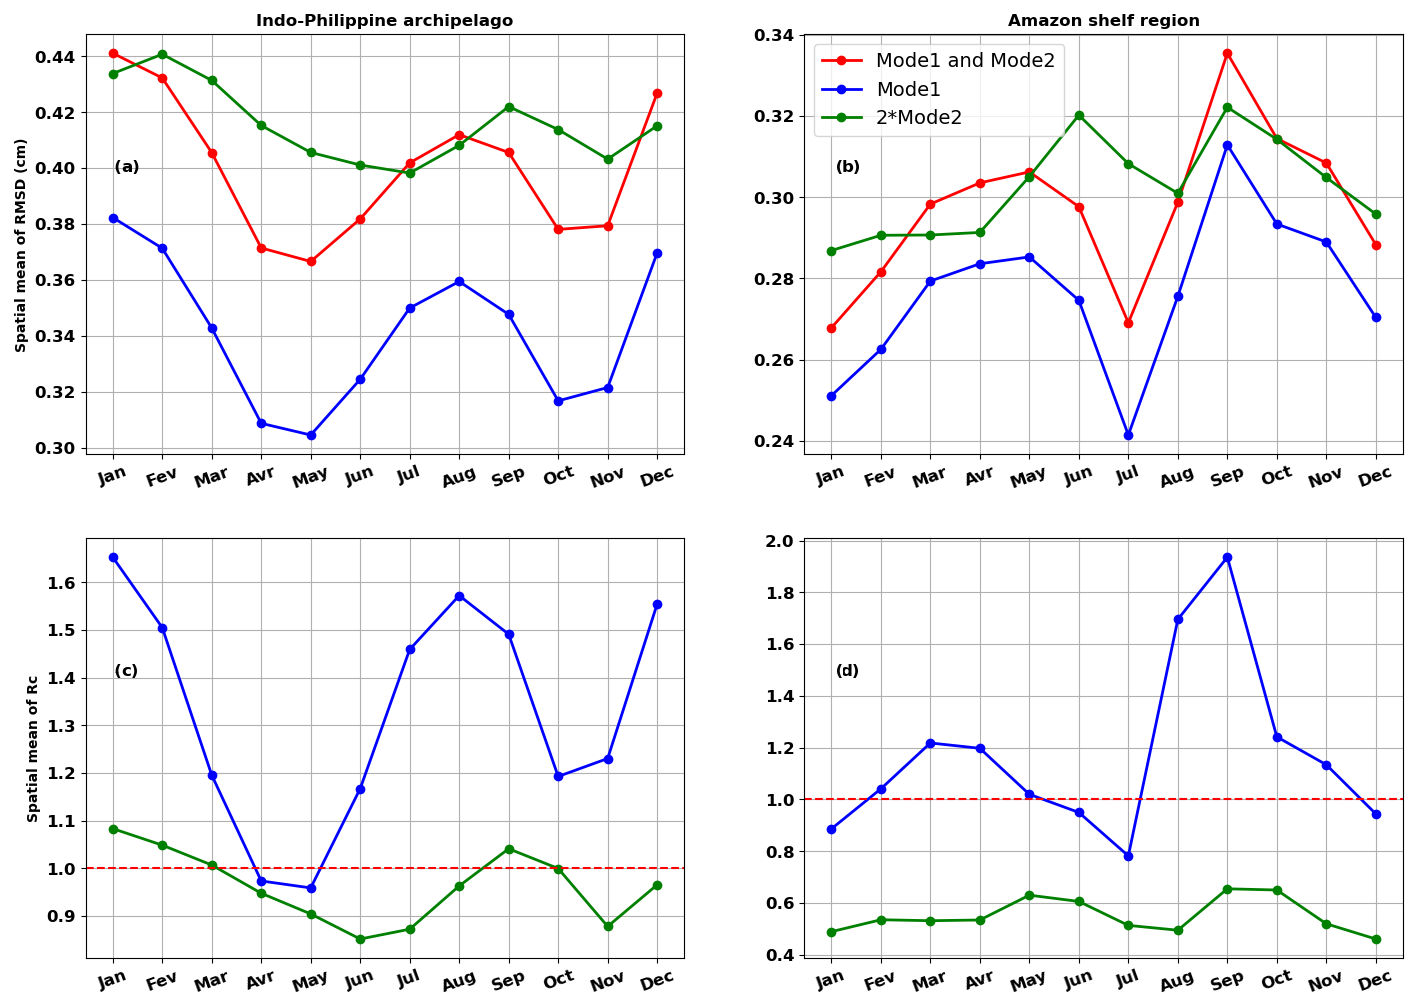
Figure 8Annual cycle of the spatial mean of (a, b) the monthly RMSD (cm) and (c, d) the monthly rate of the contributions to the RMSD (Rc) in the Indo-Philippine archipelago (a, c) and the region off the Amazon shelf (b, d). The RMSD is calculated for the total internal tide (modes 1 and 2, in red), mode 1 (in blue), and mode 2 (in green). Note that the RMSD for mode 2 has been multiplied by 2 to improve its visibility. The rate of the contributions to the RMSD (Rc) is evaluated following Eq. (5) and for locations with amplitude differences greater than 3 mm.
Off the Amazon shelf (Fig. 8b), the annual cycle of the spatial mean of the RMSD of the total and mode-1 internal tides is bimodal, with the minimum of July dividing the year into two parts. For mode 2, the RMSD is relatively constant between January and April, so on average mode-2 internal tides barely vary during these months. From April to December, the RMSD cycle is bimodal as for mode 1, with peaks in June and September. The bimodal shape of the annual cycle of the spatial mean of the RMSD is consistent with the behaviour of the M2 amplitudes during the year, as partially shown in Fig. 7. It is also reminiscent of the distinction made by Tchilibou et al. (2022), which separates the MAMJJ (March to July) months of high internal tide coherence from the ASOND (August to December) months of high internal tide incoherence due to the increase in the eddy kinetic energy.
The monthly spatial mean of Rc for mode 1 is greater than 1 for most of the year, except for April and May in the Indo-Philippine archipelago (Fig. 8c) and especially for July in the region off the Amazon shelf (Fig. 8d). These months (April and May for the Indo-Philippine archipelago and July for the Amazon region) are those with the lowest RMSD (Fig. 8a and b). Thus, the RMSDs between the monthly MIOST24m and annual MIOST24a mode-1 atlases show differences in amplitude for the month with the minimum RMSD but, in general, over the year, differences in phase and therefore in the internal tide structures between the atlases. For mode 2, Rc indicates that the RMSD shows that amplitude differences predominate over phase differences in the two regions, except, of course, for January, February, and September in the Indo-Philippine archipelago, for which the RMSD is at its maximum (Fig. 8a).
Examples of the annual cycle of the M2 internal tide amplitudes are shown in the Appendix. These cycles are not identical to those of the RMSD, as the approach is different. However, they confirm that using altimetry data and MIOST provides access to the monthly variability of the internal tide. In the next section, we will test the effectiveness of monthly atlases in removing the internal tides from altimetry observations.
The variance reduction is a way of measuring how much an internal tide atlas removes or corrects the internal tides in the altimetry SLA. In Eq. (6), the variance reduction is defined as the difference between the variance of the SLA corrected with the M2 internal tide prediction and the variance of the uncorrected SLA. In this way, a negative value of the variance reduction means that the internal tide atlas has helped to reduce the variance of the SLA. On the other hand, a positive value of the variance reduction means that the internal tide atlas had the opposite effect to what was expected and increased the variance of the SLA.
The annual M2 HRET, MIOST22a, and MIOST24a atlases and the monthly M2 MIOST24m atlases are each used in turn as the M2 correction in Eq. (6), and the monthly variance reductions are calculated in pixels of 0.5°×0.5°. As the main objective is to test the robustness of the monthly atlases, the variance reductions are estimated each month on monthly subsets (see Sect. 2.2) of the altimetry data from period 1 (1993–2017) and period 2 (2018–2023). Examples of variance reduction maps are shown for September only. The atlases are then classified according to the annual cycles of the spatial mean of the monthly variance reduction.
In September (Fig. 9), as in other months of the year (not shown), the four atlases performed particularly well around the internal tide generation zones in the Indo-Philippine archipelago, including the Luzon Strait and the entire area south of 10° N (Fig. 6). In the Amazon region (Fig. 10), the beneficial effects of the atlases in reducing the SLA variance are noticeable in the areas and beams of maximum amplitude of the internal tides previously shown in Fig. 7. Some areas, such as the Philippine Sea (Fig. 9) and the Amazon shelf break (Fig. 10b and f), present a local increase in variance due to the internal tide atlases. Compared to period 1 (Figs. 9a–d and 10a–d), this negative effect of the atlases is more pronounced in period 2 (Figs. 9e–h and 10e–h). However, in period 2 the atlases still perform well at the locations where the internal tides are generated and along their main trajectories. This indicates that in period 2 the atlases have more difficulty in correcting the incoherent internal tide.
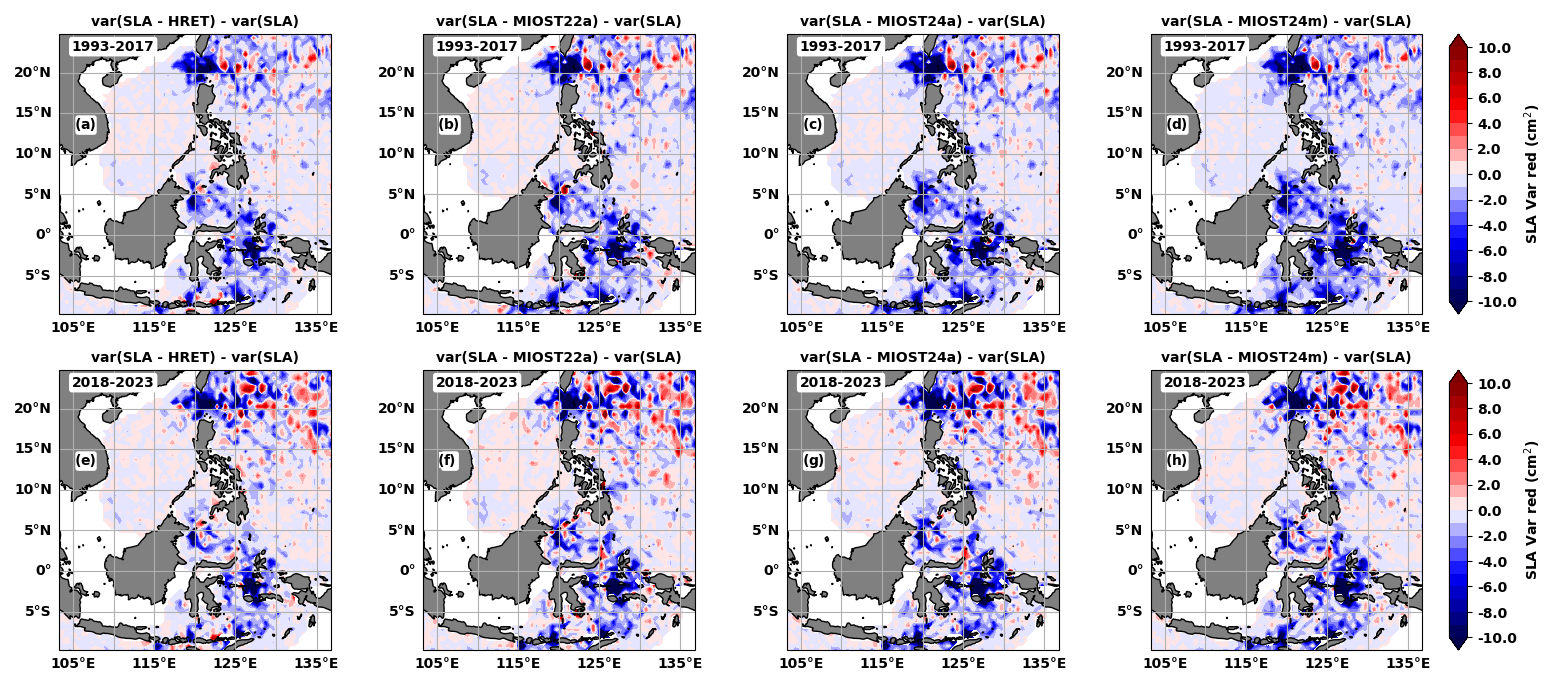
Figure 9SLA variance reduction (cm2) in the Indo-Philippine archipelago during September for period 1 (a–d, 1993–2017) and period 2 (e–h, 2018–2023).
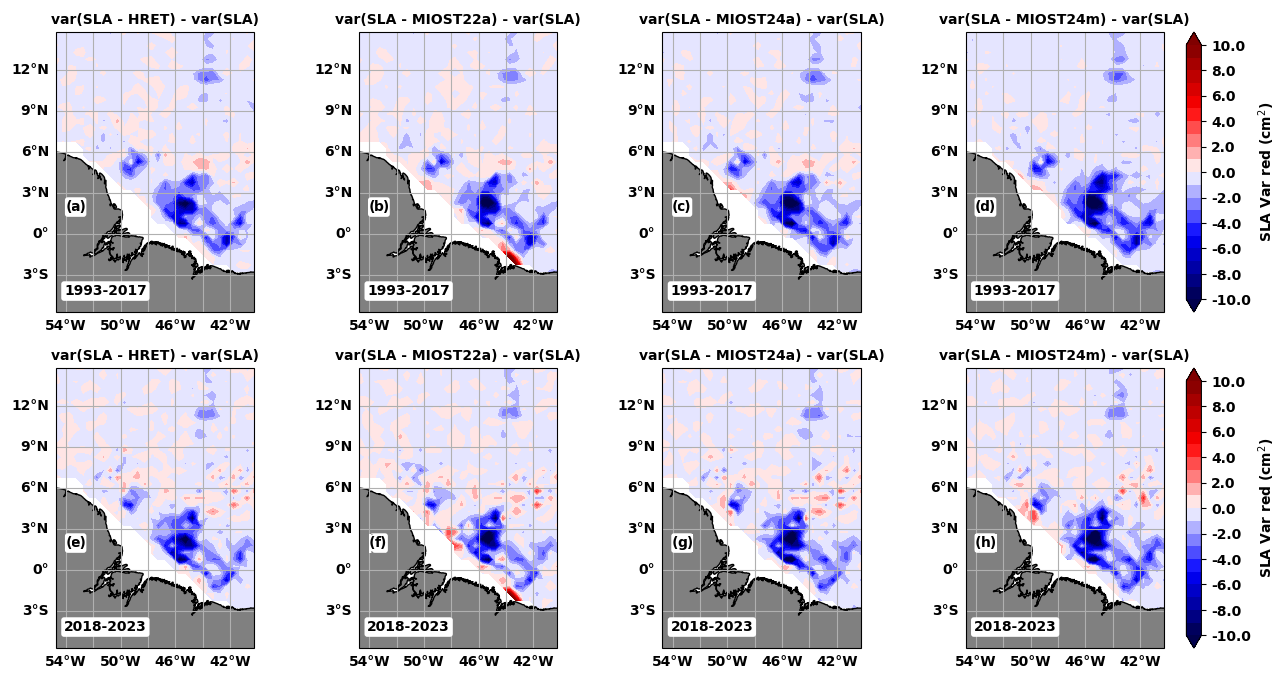
Figure 10As in Fig. 9 but for the region off the Amazon shelf.
In both regions, the MIOST24m atlas has the best internal tide correction in period 1 (Fig. 11a and b), followed by the MIOST24a atlas. The atlases that eliminate the least variance in period 1 are HRET for the Indo-Philippine archipelago (Fig. 11a) and MIOST22a (Fig. 11b) for the region off the Amazon shelf. The positions of MIOST24a and MIOST24m are reversed in period 2 in the Indo-Philippine archipelago (Fig. 11c), with MIOST24a being slightly better for most months. In the Amazon region (Fig. 11d), the MIOST24m atlas outperforms the other atlases between March and June and again between August and November. The positions of MIOST22a and HRET in period 1 are unchanged in period 2.
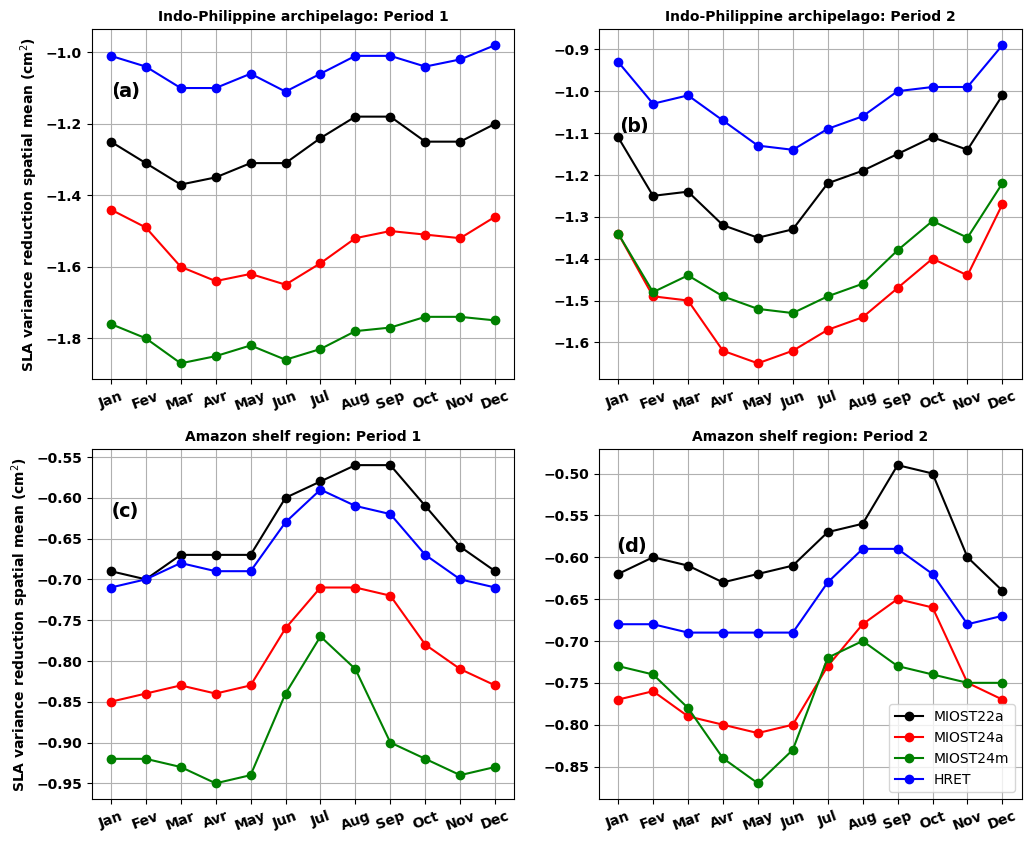
Figure 11Spatial mean of the monthly variance reduction (cm2) in (a, c) the Indo-Philippine archipelago and (b, d) the region off the Amazon shelf in (a, b) period 1 (1993–2017) and (c, d) period 2 (2018–2023). The variance reduction was calculated according to Eq. (6), using M2 prediction from the MIOST22a (black), HRET (blue), MIOST22a (red), or MIOST24m (green) atlases.
It is not surprising that the MIOST24 atlases performed better than HRET and MIOST22a in period 1; the variance reductions are indeed calculated on the same dataset used to obtain the MIOST24 atlases. However, the fact that the two MIOST24 atlases perform better on independent period-2 data shows that the wavelength change from MIOST22 to MIOST24 has a positive impact on the internal tide correction in the altimetry data. Regarding the use of monthly atlases to correct internal tides in altimetric SLA, our results show that they are appropriate and indicated when applied to the data used to construct them. In an independent dataset, the monthly atlas remains effective at the generation site and on the main trajectories of the internal tide, but it may struggle to correct the internal tides on the secondary trajectories associated with the incoherence of the internal tide. Finally, MIOST22a is the least efficient atlas in the Amazon region because it increases the variance of the SLA along the coast, and in the open ocean it is better than HRET but not the MIOST24 atlases.
This study presents the M2 MIOST24 (MIOST 2024) internal tide atlas for modes 1 and 2 in the Indo-Philippine archipelago and the region off the Amazon shelf, derived from 25 years (1993–2017) of altimetric SLAs and compared with the existing atlases MIOST22 (version 2022, Ubelmann et al., 2022) and HRET (Zaron, 2019). The latest one (HRET) is currently used as the reference atlas for correcting internal tides in altimetry data. The improvement in M2 wavelengths is the distinguishing feature between MIOST24 and MIOST22. MIOST24 uses the M2 wavelengths of modes 1 and 2 obtained after solving the vertical mode equations constrained by the stratification of the 1993–2020 monthly climatology from the GLORYS12v1 reanalyses. The MIOST22 mode-1 wavelengths are approximated from the phase speed dataset of Chelton et al. (1998), and the MIOST22 mode-2 wavelengths are taken to be half of the MIOST22 mode-1 wavelengths. The MIOST24a annual atlas is produced by averaging the GLORYS12v1 monthly reanalyses and using the altimetry data as a set. In contrast, the MIOST24m monthly atlases are derived from GLORYS12v1 monthly reanalyses and subsets of altimetry data, defined using a 15 d overlap in each of the months adjacent (see Sect. 2.3) to the month of interest. The differences between MIOST24, MIOST22, and HRET, the monthly variability of the internal tide, and the relevance of using a monthly atlas to correct for the internal tide in the altimetry data are discussed.
The RMSD calculated between the M2 atlases of MIOST24a and MIOST22a and between MIOST24a and HRET reaches 3 cm at certain locations in the Indo-Philippine archipelago and the Amazon region, highlighting internal tide estimates that were certainly biased in previous atlases. The spatial mean of the rate of contributions to the RMSD (Rc), defined as the ratio between the contributions of phase differences to the RMSD and the contributions of amplitude differences to the RMSD, shows that the differences between MIOST24a and MIOST22a are mostly explained in the two regions of interest by the phase differences between the two atlases. This means that the differences between the internal tide patterns of MIOST24a and MIOST22a are greater than the differences between the amplitudes of these atlases. This is not surprising as the M2 internal tide structures are better represented in MIOST24a thanks to the improved wavelengths of modes 1 and 2 in MIOST24. The differences between HRET and MIOST24a are related to both amplitude and phase differences. This is because the internal tide amplitudes are larger in MIOST24a and HRET is a smoothed atlas.
The amplitude maps of the MIOST24m atlas and the monthly RMSD calculated between MIOST24a and MIOST24m confirm that the M2 internal tides vary over the year. In the Indo-Philippine archipelago, mode-1 internal tides generated in the Luzon Strait propagate strongly towards the Philippine Sea in the early months of the year (such as April) and in December. In other months, such as June and September, the internal tide structure deforms rapidly. In the South China Sea and the rest of the archipelago, the amplitude and trajectories of the internal tides show significant monthly variability. The total (including modes 1 and 2) internal tide atlases for January and August are least close to the annual atlas, whereas May is the closest. Mode-2 atlases are distinguished by their amplitude, being furthest from the annual atlas in February and September and closest in July. Overall, for this region, the variability of the monthly atlases has yet to be linked to changes in stratification, seasonal cycles of currents (Sprintall et al., 2019), and seasonal cycles of cyclonic and anticyclonic eddies (Hao et al., 2021). This is beyond the scope of this study and needs special future dedicated study to be revealed.
In the Amazon region, our results on the monthly variability of M2 internal tides are in good agreement with those of Tchilibou et al. (2022): from March to June the internal tides propagate far offshore, whereas from August to December the propagation seems to stop at about 5° N. Tchilibou et al. (2022) showed that this is the result of the interaction between internal tides and the mesoscale, which is stronger in autumn. The RMSD between MIOST24a and MIOST24m allows us to find the bimodal variations MAMJJ (March to July) and ASOND (August to December) of Tchilibou et al. (2022) for mode 1 and the total internal tide and to show that mode 2 remains relatively stable until April before following the bimodal cycle of mode 1.
The annual cycle of the spatial mean of Rc suggests that, in the Indo-Philippine archipelago and the region off the Amazon shelf, for mode 1, the main differences between the annual and monthly atlases result from changes in the phase (i.e. the spatial distribution of the M2 internal tides). For mode 2, the annual and monthly atlases are characterized by differences in the internal tide amplitude. The results from these two regions illustrate that altimetry can be used, to some extent at least, to study the monthly variability of the internal tides. In a few years, the monthly atlases could be re-evaluated using longer time series, without the need to rely on overlapping data from adjacent months, which may further improve the present results.
The last part of the study is devoted to the quantification of the new internal tide correction in the altimetry data. Up to now, annual atlases (HRET, MIOST22a, or MIOST24a) have been used instead of monthly atlases (e.g. MIOST24m), even if the latter are more accurate in terms of internal tide variability. Variance reductions were calculated for the period (1993–2017, period 1) used to derive the MIOST24 atlases and for an independent period (2018–2023, period 2). For both regions, MIOST24m is the atlas that best corrects the internal tide signal in the period-1 altimetry data. In period 2, MIOST24a is better in the Indo-Philippine archipelago, while MIOST24m is better in the region off the Amazon shelf, depending on the season. As MIOST24m is not always the best atlas for period 2 in both regions, it is more judicious to choose between annual and monthly atlases, depending on the objectives. Monthly atlases are recommended if they are to be applied to the same database from which they were derived as they reflect a specific seasonal variability which can have strong annual variations. On independent data, monthly atlases should work well around the internal tide generation sites and along their main trajectories. Beyond these locations, the performance of the monthly atlases is conditioned by changes in the secondary trajectories, reflecting the incoherence of the internal tide. The annual atlas, on the other hand, may underestimate the correction around the generation sites but make a less degraded correction along the secondary trajectories of the internal tide.
In general, the new MIOST24 M2 atlases extract internal tides from altimetry data better than MIOST22 and HRET for the Indo-Philippine and Amazon regions. The results of MIOST24 are encouraging and justify the development of a global version of the annual MIOST24 atlas for the M2 wave as well as for the N2, S2, K1, and O1 waves. The new MIOST24 atlas could incorporate satellite data beyond 2017. Initially, the new global atlas will only include the classical nadir missions described in this article. In a second phase, tests could be carried out to incorporate 2D observations from the new SWOT (Surface Water and Ocean Topography) KaRIn mission to improve the spatial resolutions of the atlases and their impact on the mode-2 descriptions.
The curves of the spatial averages of the monthly M2 wavelengths of mode 1 (in black) and mode 2 (in green) are shown in Fig. A1. The spatial means are calculated in the Luzon Strait (Fig. A1a), Sulu island chain (Fig. A1b), and Seram Sea (Fig. A1c) boxes as shown in Fig. 1. The Amazon region is treated as a box because internal tide generation occurs over almost the entire shelf break, although it is dominant at the six locations shown in Fig. 1. The annual cycles of the mode-1 and mode-2 M2 wavelengths are in phase in the Luzon Strait (Fig. A1a). Mode 1 increases by an average of 7 km between February (when it is lowest) and September (when it is highest). For mode 2, the variation is about 5 km. In the Sulu island chain (Fig. A1b) and for mode 1, a first peak is observed in June and a second peak in October. Although the cycle of mode 2 is close to that of mode 1, the monthly variations remain small (less than 1 km, green curve in Fig. A1b) and agree with Fig. 2f.
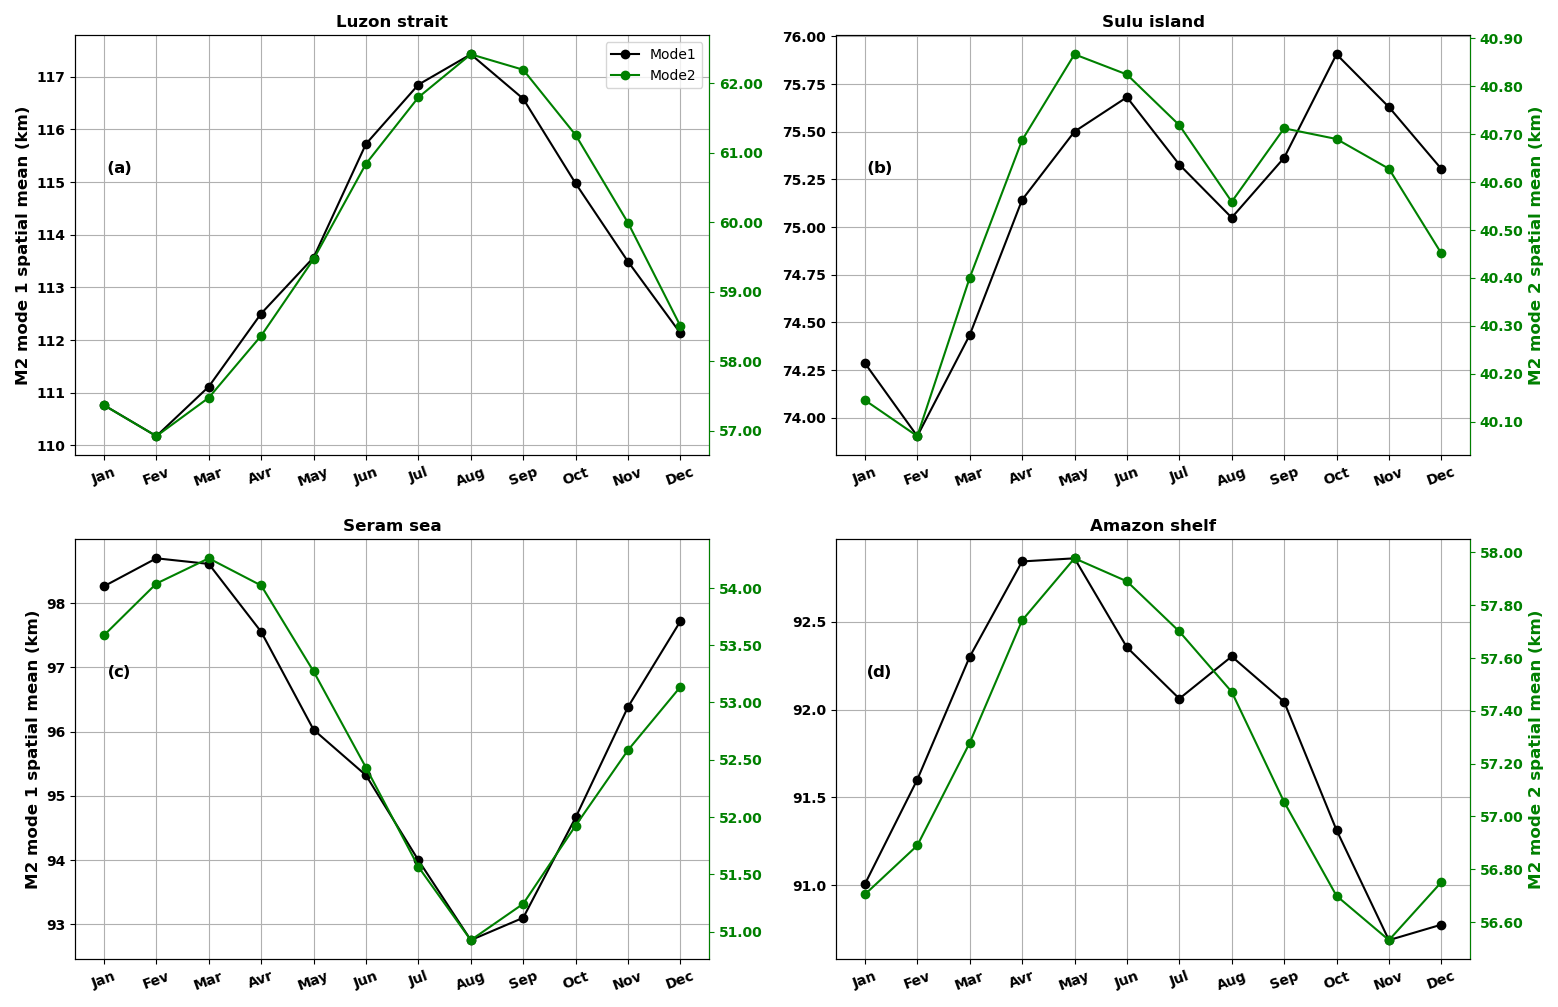
Figure A1Annual cycle of mode-1 (black) and mode-2 (green) M2 internal tide wavelengths in the Luzon Strait (a), the Sulu island chain (b), the Seram Sea (c), and the Amazon region (d). The right vertical axis (green) corresponds to mode 2.
The annual cycle of M2 wavelengths in the Seram Sea (Fig. A1c) is opposite to that observed in the Luzon Strait. The longest wavelengths are observed in March and the shortest ones in August, representing variations of more than 4 km for mode 1 and about 3 km for mode 2 (Fig. A1c). In the Amazon region (Fig. A1d), there are variations of about 2 km for mode-1 and mode-2 wavelengths, which are longest between April and May and shortest in November. However, the spatial mean is certainly influenced by variations in the eastern part of the basin and is reduced by small variations in the western part of the basin (Fig. 3e and f).
A1 Annual cycles of M2 internal tide amplitudes
The annual cycles of the internal tide amplitude M2 are obtained by averaging, as above, the amplitudes of the monthly MIOST24m atlases in the Luzon Strait, Sulu island chain, and Seram Sea for the Indo-Philippine archipelago as well as the entire Amazon region. The annual cycles of M2 internal tide amplitudes are represented by black (total tide, mode-1 and mode-2), dashed-black (mode-1), and green (mode-2) curves.
In the Luzon Strait (Fig. A2a), the amplitude of the internal tides reaches its maximum in October. This maximum of about 4 cm follows a relative maximum of 3.6 cm that occurs in spring (April–May), giving the annual cycle a bimodal appearance. The amplitude of mode 2 is maximum in August and minimum in February. The apparent bimodality of mode 1 could be related to the combination in our Luzon box of the annual antiphase cycles of the M2 internal tides propagating eastward in the Pacific (Philippine Sea) and westward in the South China Sea, as described in Zhao and Qiu (2023). The intense eastward flow in winter and spring is expected to contribute to the relative maximum, while the intense westward flow in summer and autumn helps to increase the mean amplitude to the absolute maximum.
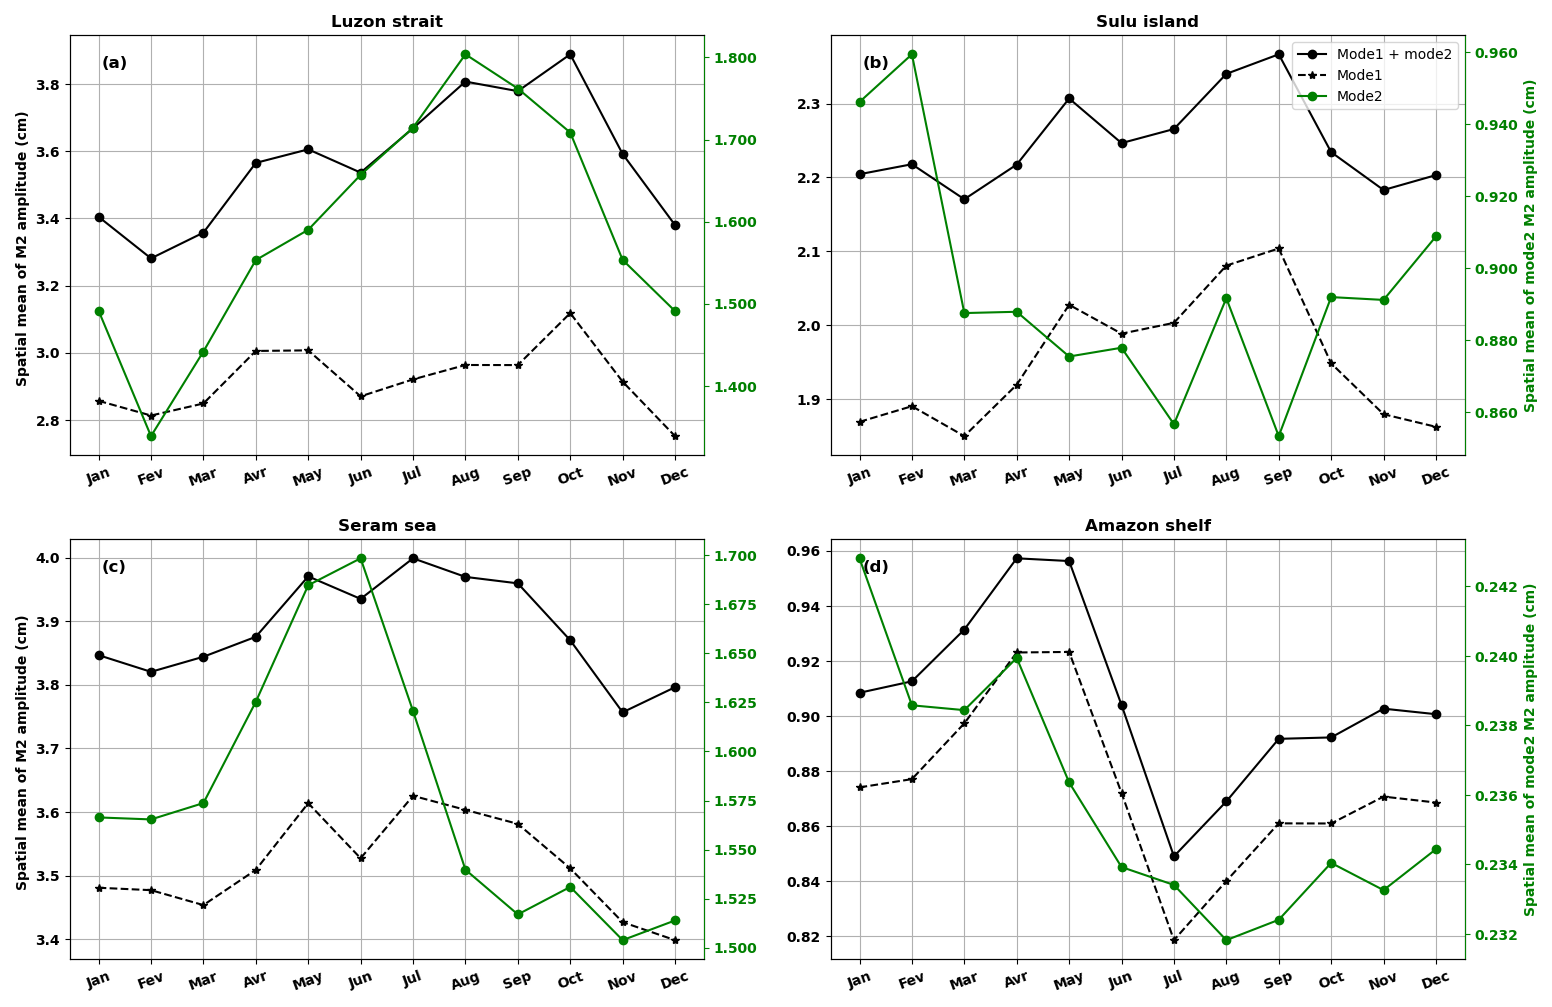
Figure A2Annual cycle of M2 internal tidal amplitudes in the Luzon Strait (a), the Sulu island chain (b), the Seram Sea (c), and the Amazon region (d). In black is the total amplitude including modes 1 and 2, in dashed black is mode 1, and in green is mode 2. The vertical axis on the right (green) corresponds to mode 2.
In the Sulu island chain, the annual cycle is bimodal for the total internal tides and mode 1 (Fig. A2b). The peaks occur in May and September and are at almost identical levels. The amplitude of mode 2 remains relatively constant, as do the wavelengths of this mode. The possibility cannot be excluded that the shape of the annual cycle of mode 1 in this part of the ocean is related to seasonal divergences in the propagation of internal tides towards the Sulu and Celebes seas, as observed in Fig. 6. In the Seram Sea, the amplitudes of the total and mode-1 internal tides reach their maximum in July, 1 month later than the mode-2 maximum (Fig. A2c). In the second half of the year, the amplitude of the internal tides decreases. The annual cycle is closer to monomodal, although the first maximum for mode 1 occurs in May.
In the Amazon region (Fig. A2d), the internal tides (total and mode 1) are highest between April and May and lowest in July. The distribution of the monthly RMSD in Fig. 8b and Tchilibou et al. (2022) is somewhat recovered. The M2 amplitudes are very strong between March and June, when the internal tides propagate freely. The weak amplitudes between August and December form a second block of variation. The spatial averages of the mode-2 M2 internal tide amplitude vary between 0.235 and 0.245 cm in the Amazon region. This variation is quite negligible and could be explained by possible compensation for what happens at the different internal tide generation sites. For example, in Fig. 7, the transition from April to September is characterized by a decrease in the mode-2 amplitude around site B and an increase in amplitude around sites A and E.
All of the annual cycles presented here confirm that MIOST and altimetry provide some access to the annual variability of the internal tides. However, the presented cycles are sensitive to the area in which the spatial averaging was carried out. They cannot be strictly considered the annual cycle of the internal tides in these regions. This is one of the reasons why we have not discussed these cycles in the main part of the paper and have not attempted to establish the links between these cycles and variations in ocean stratification and circulation. The main objective of our study remains the production of annual and monthly atlases of internal tides. To gain a better understanding of the annual internal tidal cycles, further studies should be carried out, for example using a high-resolution model that would allow a focus on the locations where internal tides are generated.
The level-3 along-track altimetry data are available on the Copernicus website (https://doi.org/10.48670/moi-00146, Copernicus, 2025). The GLORYS12v1 reanalysis is available at https://doi.org/10.48670/moi-00021 (Copernicus, 2024).
This work is part of the DUACS-RD, SWOT-SCOEPUS, and marée-SWOT/SALP projects funded by CNES at CLS. MT's work and analyses are supervised by LC. The conceptualization was done by MT, LC, and SB. MT wrote the paper with contributions from all of the co-authors.
The contact author has declared that none of the authors has any competing interests.
Publisher's note: Copernicus Publications remains neutral with regard to jurisdictional claims made in the text, published maps, institutional affiliations, or any other geographical representation in this paper. While Copernicus Publications makes every effort to include appropriate place names, the final responsibility lies with the authors.
Michel Tchilibou, Simon Barbot, Loren Carrere, and Clément Ubelmann are funded by CNES contracts. Gérald Dibarboure and Ariane Koch-Larrouy are supported by CNES and IRD, respectively. The paper benefitted from helpful discussions with Yannice Faugere from CNES as well as Maxime Ballarotta and Antoine Delepoulle from CLS. We would also like to thank the anonymous reviewers for their very helpful and constructive comments.
This research has been supported by the Centre National d’Études Spatiales project FESDAC studies for SALP and SWOT, grant nos. 221332/2024 and 250590/2025.
This paper was edited by Katsuro Katsumata and reviewed by two anonymous referees.
Ablain, M., Cazenave, A., Larnicol, G., Balmaseda, M., Cipollini, P., Faugère, Y., Fernandes, M. J., Henry, O., Johannessen, J. A., Knudsen, P., Andersen, O., Legeais, J., Meyssignac, B., Picot, N., Roca, M., Rudenko, S., Scharffenberg, M. G., Stammer, D., Timms, G., and Benveniste, J.: Improved sea level record over the satellite altimetry era (1993–2010) from the Climate Change Initiative project, Ocean Sci., 11, 67–82, https://doi.org/10.5194/os-11-67-2015, 2015.
Arbic, B., Richman, J., Shriver, J., Timko, P., Metzger, J., and Wallcraft, A.: Global Modeling of Internal Tides Within an Eddying Ocean General Circulation Model, Oceanography, 25, 20–29, https://doi.org/10.5670/oceanog.2012.38, 2012.
Assene, F., Koch-Larrouy, A., Dadou, I., Tchilibou, M., Morvan, G., Chanut, J., Costa Da Silva, A., Vantrepotte, V., Allain, D., and Tran, T.-K.: Internal tides off the Amazon shelf – Part 1: The importance of the structuring of ocean temperature during two contrasted seasons, Ocean Sci., 20, 43–67, https://doi.org/10.5194/os-20-43-2024, 2024.
Barbot, S., Lyard, F., Tchilibou, M., and Carrere, L.: Background stratification impacts on internal tide generation and abyssal propagation in the western equatorial Atlantic and the Bay of Biscay, Ocean Sci., 17, 1563–1583, https://doi.org/10.5194/os-17-1563-2021, 2021.
Chelton, D. B., deSzoeke, R. A., Schlax, M. G., El Naggar, K., and Siwertz, N.: Geographical Variability of the First Baroclinic Rossby Radius of Deformation, J. Phys. Oceanogr., 28, 433–460, https://doi.org/10.1175/1520-0485(1998)028<0433:GVOTFB>2.0.CO;2, 1998.
Copernicus: Global Ocean Physics Reanalysis, Copernicus Marine Service [data set], https://doi.org/10.48670/moi-00021, 2024.
Copernicus: Global Ocean Along Track L3 Sea Surface Heights, Copernicus Marine Service [data set], https://doi.org/10.48670/moi-00146, 2025.
Desai, S. D. and Ray, R. D.: Consideration of tidal variations in the geocenter on satellite altimeter observations of ocean tides, Geophys. Res. Lett., 41, 2454–2459, https://doi.org/10.1002/2014GL059614, 2014.
Dibarboure, G., Pujol, M.-I., Briol, F., Traon, P. Y. L., Larnicol, G., Picot, N., Mertz, F., and Ablain, M.: Jason-2 in DUACS: Updated System Description, First Tandem Results and Impact on Processing and Products, Mar. Geod., 34, 214–241, https://doi.org/10.1080/01490419.2011.584826, 2011.
Duda, T. F., Lin, Y.-T., Buijsman, M., and Newhall, A. E.: Internal Tidal Modal Ray Refraction and Energy Ducting in Baroclinic Gulf Stream Currents, J. Phys. Oceanogr., 48, 1969–1993, https://doi.org/10.1175/JPO-D-18-0031.1, 2018.
Dunphy, M. and Lamb, K. G.: Focusing and vertical mode scattering of the first mode internal tide by mesoscale eddy interaction: mode one focusing and scattering, J. Geophys. Res.-Oceans, 119, 523–536, https://doi.org/10.1002/2013JC009293, 2014.
Dushaw, B. D.: An empirical model for mode-1 internal tides, Applied Physics Laboratory, University of Washington, https://apl.uw.edu/project/projects/tm_1-15/pdfs/tm_1_15.pdf (last access: 7 July 2025), 2015.
Dushaw, B. D., Worcester, P. F., and Dzieciuch, M. A.: On the predictability of mode-1 internal tides, Deep-Sea Res. Pt. I, 58, 677–698, https://doi.org/10.1016/j.dsr.2011.04.002, 2011.
Egbert, G. D. and Erofeeva, S. Y.: Efficient inverse modeling of barotropic ocean tides, J. Atmos. Ocean. Tech., 19, 183–204, 2002.
Escudier, P., Couhert, A., Mercier, F., Mallet, A., Thibaut, P., Tran, N., Amarouche, L., Picard, B., Carrere, L., and Dibarboure, G.: Satellite Radar Altimetry: Principle, Accuracy, and Precision, in: Satellite Altimetry Over Oceans and Land Surfaces, CRC Press, ISBN 978-1-15177-9, 2017.
Faugère, Y., Taburet, G., Ballarotta, M., Pujol, I., Legeais, J. F., Maillard, G., Durand, C., Dagneau, Q., Lievin, M., Sanchez Roman, A., and Dibarboure, G.: DUACS DT2021: 28 years of reprocessed sea level altimetry products, EGU General Assembly 2022, Vienna, Austria, 23–27 May 2022, EGU22-7479, https://doi.org/10.5194/egusphere-egu22-7479, 2022.
Gerkema, T., Lam, F. A., and Maas, L. R. M.: Internal tides in the Bay of Biscay: conversion rates and seasonal effects, Deep-Sea Res. Pt. II, 51, 2995–3008, https://doi.org/10.1016/j.dsr2.2004.09.012, 2004.
Gill, A.: Atmosphere-ocean dynamics, in: 1st Edn., Academic Press, New York, 680 pp., ISBN 978-0-12-283522-3, 1982.
Hao, Z., Xu, Z., Feng, M., Li, Q., and Yin, B.: Spatiotemporal Variability of Mesoscale Eddies in the Indonesian Seas, Remote Sens., 13, 1017, https://doi.org/10.3390/rs13051017, 2021.
Hurlburt, H., Metzger, J., Sprintall, J., Riedlinger, S., Arnone, R., Shinoda, T., and Xu, X.: Circulation in the Philippine Archipelago Simulated by ° and ° Global HYCOM and EAS NCOM, Oceanography, 24, 28–47, https://doi.org/10.5670/oceanog.2011.02, 2011.
Jan, S., Lien, R.-C., and Ting, C.-H.: Numerical study of baroclinic tides in Luzon Strait, J. Oceanogr., 64, 789–802, https://doi.org/10.1007/s10872-008-0066-5, 2008.
Kaur, H., Buijsman, M. C., Zhao, Z., and Shriver, J. F.: Seasonal variability in the semidiurnal internal tide – a comparison between sea surface height and energetics, Ocean Sci., 20, 1187–1208, https://doi.org/10.5194/os-20-1187-2024, 2024.
Koch-Larrouy, A., Lengaigne, M., Terray, P., Madec, G., and Masson, S.: Tidal mixing in the Indonesian Seas and its effect on the tropical climate system, Clim. Dynam., 34, 891–904, https://doi.org/10.1007/s00382-009-0642-4, 2010.
Kocha, C., Pageot, Y., Rubin, C., Lievin, M., Pujol, M.-I., Philipps, S., Prandi, P., Labroue, S., Denis, I., Dibarboure, G., and Nogueira Loddo, C.: 30 years of sea level anomaly reprocessed to improve climate and mesoscale satellite data record, in: 2023 Ocean Surface Topography Science Team meeting, San Juan, Puerto Rico, USA, https://doi.org/10.24400/527896/a03-2023.3805, 2023.
Levitus, S.: NODC Standard Product: World Ocean Atlas 1994 (11 disc set) (NCEI Accession 0098057), NOAA National Centers for Environmental Information [data set], https://www.ncei.noaa.gov/access/metadata/landing-page/bin/iso?id=gov.noaa.nodc:0098057 (last access: 30 July 2024), 2013.
Lievin, M., Kocha, C., Courcol, B., Philipps, S., Denis, I., Guinle, T., Nogueira Loddo, C., Dibarboure, G., Picot, N., and Bignalet-Cazalet, F.: REPROCESSING of SEA LEVEL L2P products for 28 years of altimetry missions, https://ostst.aviso.altimetry.fr/fileadmin/user_upload/tx_ausyclsseminar/files/OSTST2020_Reprocessing_L2P_2020.pdf (last access: 7 July 2025), 2020.
Lyard, F. H., Allain, D. J., Cancet, M., Carrère, L., and Picot, N.: FES2014 global ocean tide atlas: design and performance, Ocean Sci., 17, 615–649, https://doi.org/10.5194/os-17-615-2021, 2021.
Müller, M., Cherniawsky, J. Y., Foreman, M. G. G., and von Storch, J.-S.: Global M2 internal tide and its seasonal variability from high resolution ocean circulation and tide modeling, Geophys. Res. Lett., 39, L19607, https://doi.org/10.1029/2012GL053320, 2012.
Niwa, Y. and Hibiya, T.: Numerical study of the spatial distribution of the M2 internal tide in the Pacific Ocean, J. Geophys. Res., 106, 22441–22449, https://doi.org/10.1029/2000JC000770, 2001.
Niwa, Y. and Hibiya, T.: Three-dimensional numerical simulation of M2 internal tides in the East China Sea, J. Geophys. Res., 109, 2003JC001923, https://doi.org/10.1029/2003JC001923, 2004.
Niwa, Y. and Hibiya, T.: Generation of baroclinic tide energy in a global three-dimensional numerical model with different spatial grid resolutions, Ocean Model., 80, 59–73, https://doi.org/10.1016/j.ocemod.2014.05.003, 2014.
Nugroho, D.: La marée dans un modèle de circulation générale dans les mers indonésiennes, PhD thesis, Université Toulouse III – Paul Sabatier, https://theses.fr/2017TOU30089 (last access: 7 July 2025), 2017.
Nugroho, D., Koch-Larrouy, A., Gaspar, P., Lyard, F., Reffray, G., and Tranchant, B.: Modelling explicit tides in the Indonesian seas: An important process for surface sea water properties, Mar. Pollut. Bull., 131, 7–18, https://doi.org/10.1016/j.marpolbul.2017.06.033, 2018.
Pickering, A., Alford, M., Nash, J., Rainville, L., Buijsman, M., Ko, D. S., and Lim, B.: Structure and Variability of Internal Tides in Luzon Strait, J. Phys. Oceanogr., 45, 1574–1594, https://doi.org/10.1175/JPO-D-14-0250.1, 2015.
Pujol, M.-I., Faugère, Y., Taburet, G., Dupuy, S., Pelloquin, C., Ablain, M., and Picot, N.: DUACS DT2014: the new multi-mission altimeter data set reprocessed over 20 years, Ocean Sci., 12, 1067–1090, https://doi.org/10.5194/os-12-1067-2016, 2016.
Pujol, M.-I., Dupuy, S., Vergara, O., Sánchez Román, A., Faugère, Y., Prandi, P., Dabat, M.-L., Dagneaux, Q., Lievin, M., Cadier, E., Dibarboure, G., and Picot, N.: Refining the Resolution of DUACS Along-Track Level-3 Sea Level Altimetry Products, Remote Sens., 15, 793, https://doi.org/10.3390/rs15030793, 2023.
Rainville, L. and Pinkel, R.: Propagation of Low-Mode Internal Waves through the Ocean, J. Phys. Oceanogr., 36, 1220–1236, https://doi.org/10.1175/JPO2889.1, 2006.
Rainville, L., Lee, C. M., Rudnick, D. L., and Yang, K.: Propagation of internal tides generated near Luzon Strait: Observations from autonomous gliders, J. Geophys. Res.-Oceans, 118, 4125–4138, https://doi.org/10.1002/jgrc.20293, 2013.
Ray, R. D. and Zaron, E. D.: Non-stationary internal tides observed with satellite altimetry: nonstationaryinternal tides, Geophys. Res. Lett., 38, L17609, https://doi.org/10.1029/2011GL048617, 2011.
Ray, R. D. and Zaron, E. D.: M2 Internal Tides and Their Observed Wavenumber Spectra from Satellite Altimetry, J. Phys. Oceanogr., 46, 3–22, https://doi.org/10.1175/JPO-D-15-0065.1, 2016.
Sánchez-Román, A., Pujol, M. I., Faugère, Y., and Pascual, A.: DUACS DT2021 reprocessed altimetry improves sea level retrieval in the coastal band of the European seas, Ocean Sci., 19, 793–809, https://doi.org/10.5194/os-19-793-2023, 2023.
Sprintall, J., Gordon, A. L., Koch-Larrouy, A., Lee, T., Potemra, J. T., Pujiana, K., and Wijffels, S. E.: The Indonesian seas and their role in the coupled ocean–climate system, Nat. Geosci., 7, 487–492, https://doi.org/10.1038/ngeo2188, 2014.
Sprintall, J., Gordon, A. L., Wijffels, S. E., Feng, M., Hu, S., Koch-Larrouy, A., Phillips, H., Nugroho, D., Napitu, A., Pujiana, K., Susanto, R. D., Sloyan, B., Peña-Molino, B., Yuan, D., Riama, N. F., Siswanto, S., Kuswardani, A., Arifin, Z., Wahyudi, A. J., Zhou, H., Nagai, T., Ansong, J. K., Bourdalle-Badié, R., Chanut, J., Lyard, F., Arbic, B. K., Ramdhani, A., and Setiawan, A.: Detecting Change in the Indonesian Seas, Front. Mar. Sci., 6, 257, https://doi.org/10.3389/fmars.2019.00257, 2019.
Stammer, D., Ray, R. D., Andersen, O. B., Arbic, B. K., Bosch, W., Carrère, L., Cheng, Y., Chinn, D. S., Dushaw, B. D., Egbert, G. D., Erofeeva, S. Y., Fok, H. S., Green, J. a. M., Griffiths, S., King, M. A., Lapin, V., Lemoine, F. G., Luthcke, S. B., Lyard, F., Morison, J., Müller, M., Padman, L., Richman, J. G., Shriver, J. F., Shum, C. K., Taguchi, E., and Yi, Y.: Accuracy assessment of global barotropic ocean tide models, Rev. Geophys., 52, 243–282, https://doi.org/10.1002/2014RG000450, 2014.
Tchilibou, M., Gourdeau, L., Lyard, F., Morrow, R., Koch Larrouy, A., Allain, D., and Djath, B.: Internal tides in the Solomon Sea in contrasted ENSO conditions, Ocean Sci., 16, 615–635, https://doi.org/10.5194/os-16-615-2020, 2020.
Tchilibou, M., Koch-Larrouy, A., Barbot, S., Lyard, F., Morel, Y., Jouanno, J., and Morrow, R.: Internal tides off the Amazon shelf during two contrasted seasons: interactions with background circulation and SSH imprints, Ocean Sci., 18, 1591–1618, https://doi.org/10.5194/os-18-1591-2022, 2022.
Ubelmann, C., Dibarboure, G., Gaultier, L., Ponte, A., Ardhuin, F., Ballarotta, M., and Faugère, Y.: Reconstructing Ocean Surface Current Combining Altimetry and Future Spaceborne Doppler Data, J. Geophys. Res.-Oceans, 126, e2020JC016560, https://doi.org/10.1029/2020JC016560, 2021.
Ubelmann, C., Carrere, L., Durand, C., Dibarboure, G., Faugère, Y., Ballarotta, M., Briol, F., and Lyard, F.: Simultaneous estimation of ocean mesoscale and coherent internal tide sea surface height signatures from the global altimetry record, Ocean Sci., 18, 469–481, https://doi.org/10.5194/os-18-469-2022, 2022.
Zaron, E. D.: Baroclinic Tidal Sea Level from Exact-Repeat Mission Altimetry, J. Phys. Oceanogr., 49, 193–210, https://doi.org/10.1175/JPO-D-18-0127.1, 2019.
Zhao, Z.: The Global Mode-2 M2 Internal Tide, J. Geophys. Res.-Oceans, 123, 7725–7746, https://doi.org/10.1029/2018JC014475, 2018.
Zhao, Z.: Mapping Internal Tides From Satellite Altimetry Without Blind Directions, J. Geophys. Res.-Oceans, 124, 8605–8625, https://doi.org/10.1029/2019JC015507, 2019.
Zhao, Z.: Seasonal mode-1 M2 internal tides from satellite altimetry, J. Phys. Oceanogr., 51, 3015–3035, https://doi.org/10.1175/JPO-D-21-0001.1, 2021.
Zhao, Z. and Qiu, B.: Seasonal West-East Seesaw of M2 Internal Tides From the Luzon Strait, J. Geophys. Res.-Oceans, 128, e2022JC019281, https://doi.org/10.1029/2022JC019281, 2023.
Zhao, Z., Alford, M., and Girton, J.: Mapping Low-Mode Internal Tides from Multisatellite Altimetry, Oceanography, 25, 42–51, https://doi.org/10.5670/oceanog.2012.40, 2012.
- Abstract
- Introduction
- Internal tide atlases and data
- MIOST24a M2 atlas comparison with MIOST22 and HRET
- MIOST24m M2 atlases and the monthly variability of the internal tide
- Impact of internal tide correction on altimetry data: comparison between monthly and annual atlases
- Conclusion
- Appendix A: Example of an annual cycle of mode-1 and mode-2 M2 wavelengths
- Data availability
- Author contributions
- Competing interests
- Disclaimer
- Acknowledgements
- Financial support
- Review statement
- References