the Creative Commons Attribution 4.0 License.
the Creative Commons Attribution 4.0 License.
 | 14 Jul 2025
On mode water formation and erosion in the Arabian Sea: forcing mechanisms, regionality, and seasonality
Sebastiaan Swart
Puthenveettil Narayana Vinayachandran
Bastien Y. Queste
Mode water acts as a barrier layer controlling surface-to-interior fluxes of key climatic properties. In the Arabian Sea, mode water stores heat and provides an oxygen-rich layer for rapid remineralization, and its subduction is a direct pathway for oxygen into the upper oxygen minimum zone. We use float observations to characterize the properties of the Arabian Sea mode water layer (MWL). The MWL forms when springtime warming stratifies the surface layer and caps the deep surface mixed layer formed during the winter monsoon. During the summer monsoon, a second MWL is formed south of 20° N following the cessation of wind-driven mixing. We use 1D and 3D models to disentangle the contributions of atmospheric and oceanic forcing to this water mass. The 1D model accurately represents the mode water's formation and erosion, showing that atmospheric forcing is the first-order driver, in agreement with observations. However, there are regions where advective processes, eddy mixing, or biological heating are essential for the formation and/or erosion of the MWL. For instance, in the eastern Arabian Sea, freshwater-driven stratification advected via the West Indian Coastal Current reduces the potential for deep mixed layers via convective mixing, resulting in a thinner MWL. The 3D model shows that the MW contributes 5 ± 1 % to the oxygen content of the upper ocean, with its maximum during spring in the northern Arabian Sea (40 ± 17 %), thus highlighting the key role of the water mass in storing and transporting heat and oxygen to the interior.
Please read the corrigendum first before continuing.
-
Notice on corrigendum
The requested paper has a corresponding corrigendum published. Please read the corrigendum first before downloading the article.
-
Article
(9174 KB)
- Corrigendum
-
Supplement
(1326 KB)
-
The requested paper has a corresponding corrigendum published. Please read the corrigendum first before downloading the article.
- Article
(9174 KB) - Full-text XML
- Corrigendum
-
Supplement
(1326 KB) - BibTeX
- EndNote


Mode water (MW) is a vertically homogeneous water mass formed in the surface mixed layer and, when subducted, plays a critical role in the ocean as a stratification barrier between the surface and the ocean interior (Hanawa and Talley, 2001). Surface water properties (e.g. heat, oxygen, and organic matter) are physically transported and subsequently isolated in deeper layers by alternating mixing and stratification periods, trapping MW (Lacour et al., 2023; Li et al., 2023; Portela et al., 2020), possibly long-term (i.e. in favour of heat uptake, carbon sequestration, and oxygen ventilation). Despite occupying only 20 % of the upper 2000 m of the ocean, mode water shows the most remarkable oceanic heat content change over the Argo era (2005–2020, Li et al., 2023). Oxygen concentration below the surface is largely determined by the formation of MW and its subduction into the ocean interior (Hanawa and Talley, 2001; Portela et al., 2020). Moreover, MW has a major influence on nutrient distribution as it prevents the upwelling of deep-sea nutrients into the photic zone (Bushinsky and Cerovečki, 2023) and is a key component of the mixed layer biological pump, an important pathway in the global carbon cycle (Dall'Olmo et al., 2016). However, climate change is expected to alter MW formation. Predicted shoaling of surface mixed layers and intensified ocean stratification are projected to reduce MW formation (Gao et al., 2023; Xu et al., 2013). Thus, characterizing MW in regions where stratification is strongly influenced by climate forcing (Albert et al., 2023; Mohan et al., 2021; Nisha et al., 2024) is essential for understanding its current impacts and how it may evolve in the future. Given their role in ocean heat uptake, biogeochemical cycling, and carbon sequestration, the life cycle of MW and its changes have significant implications for both regional and global ocean–climate dynamics.
Upper-ocean properties and stratification have been widely studied in the Arabian Sea (e.g. Babu et al., 2004; Lee et al., 2000; Prasad, 2004; Rao et al., 1989; Singh et al., 2019), yet no extensive literature exists on MW characterization in the region. McCreary et al. (1993) proposed the existence of a “fossil layer” which controls entrainment and detrainment, allowing the exchange of mass, momentum, and heat between the surface and the ocean interior due to winds or surface buoyancy fluxes. Hanawa and Talley (2001) defined a weak MW type in a high-evaporation region, where high-salinity surface waters and subducted saline subsurface layers occur. The literature on this water is centred on the characteristics and formation of Arabian Sea High-Salinity Water (ASHSW). ASHSW is formed in the northern Arabian Sea at depths of 0–150 m after convective mixing during winter (Kumar and Prasad, 1999; Morrison, 1997; Prasad and Ikeda, 2002a, b; Shenoi et al., 1993). It then advects equatorward along the 24 kg m−3 isopycnal surfaces as a subsurface salinity maximum (Han and McCreary, 2001; Prasad and Ikeda, 2002a). Zhou et al. (2023) showed that, in the northern Arabian Sea, the subduction of oxygenated ASHSW supplies oxygen to the oxygen minimum zone (OMZ) and controls the seasonal depth of the upper OMZ oxycline. Liu et al. (2018) assessed regional subduction and obduction ventilation patterns in the North Indian Ocean using gridded reanalysis products, revealing that ventilation can occur during both winter and summer in a monsoon-dominated ocean. This fact suggests that the formation of MW occurs not only in the north and is not only restricted to winter as ASHSW descriptions suggest. Hence, there is a lack of comprehensive understanding of (a) MW formation and erosion, especially their regional patterns and quantitative contributions from buoyancy forcing, winds, and advective processes; (b) MW properties and their fates; and (c) their interannual variability in the Arabian Sea.
The Arabian Sea hosts the most intense OMZ in the world, with suboxia prevailing across most of the intermediate ocean (150–1250 m). It is characterized by a tight balance between biological and physical oxygen supply and consumption mechanisms, modulated by the monsoon cycle (Acharya and Panigrahi, 2016; McCreary et al., 2013; Rixen et al., 2020). Upper-ocean stratification (and MW as one of its components) is a key factor in understanding heat (Nisha et al., 2024), oxygen (Ditkovsky et al., 2023; Lachkar et al., 2021), and net primary productivity (Wiggert et al., 2005) in the Arabian Sea. For instance, MWs have been shown to play a unique role above oxygen minimum zones, where they act as a reservoir of oxygen below the productive layer (Kalvelage et al., 2015) and thus modulate the upper boundary of the OMZ. Moreover, carbon exported from the surface transits through the MW, where the most labile organic matter is rapidly remineralized (Weber and Bianchi, 2020). The thickness, properties, and fate of this MW govern how much carbon is remineralized therein, how recalcitrant the organic matter exported to the OMZ is, and whether the respired CO2 is returned to the surface with the deepening of the surface layer or subducted into the OMZ for long-term sequestration (Weber and Bianchi, 2020). MWs are also key to the heat budget of the upper ocean as a barrier between the warm surface and the cold interior. MW presence can potentially maintain the Arabian Sea warm pool by effectively inhibiting the vertical mixing of the upper ocean with deeper cooler waters (similar to barrier layers formed by freshwater advection from the Bay of Bengal in the south-eastern Arabian Sea; Li et al., 2023).
There is a need to understand the fate of MW, which will determine whether subducted properties from the surface will either be returned to the surface or sequestered down into the mesopelagic with long-term and poorly understood impacts on regional oxygen, carbon, and heat budgets. In this study, we use observational Argo data to characterize the properties and timing of MW formation and erosion. We employ a 1D model (the General Ocean Turbulence Model – GOTM) to assess the main forcing components involved in the MW's life cycle and a 3D regional model to upscale these findings to assess the MW contribution to the oxygen budget of the Arabian Sea. This approach provides a more comprehensive understanding of the processes governing MW dynamics in the Arabian Sea.
2.1 Argo
We use the array of Argo profiling floats to characterize MW in the Arabian Sea. Between 2000 and 2023, a total of 579 floats sampled in our study area (0–30° N, 30–80° E; Fig. 1a), providing 99 355 profiles of temperature, salinity, and pressure that were flagged as “good” by the CORIOLIS Data Centre over the study period (Gaillard et al., 2009). The data are binned every 4 m at depths between 0 and 500 m and at 10 d resolution. The coverage of Argo floats over the Arabian Sea extends over the whole domain, with an average of 30 profiles per 0.5° × 0.5°, except for the shallower, near-coastal regions of the Indian subcontinent (Fig. 1a). The northern Arabian Sea has the most profiles, up to 130 per 0.5° × 0.5° in the Sea of Oman (Fig. 1a).
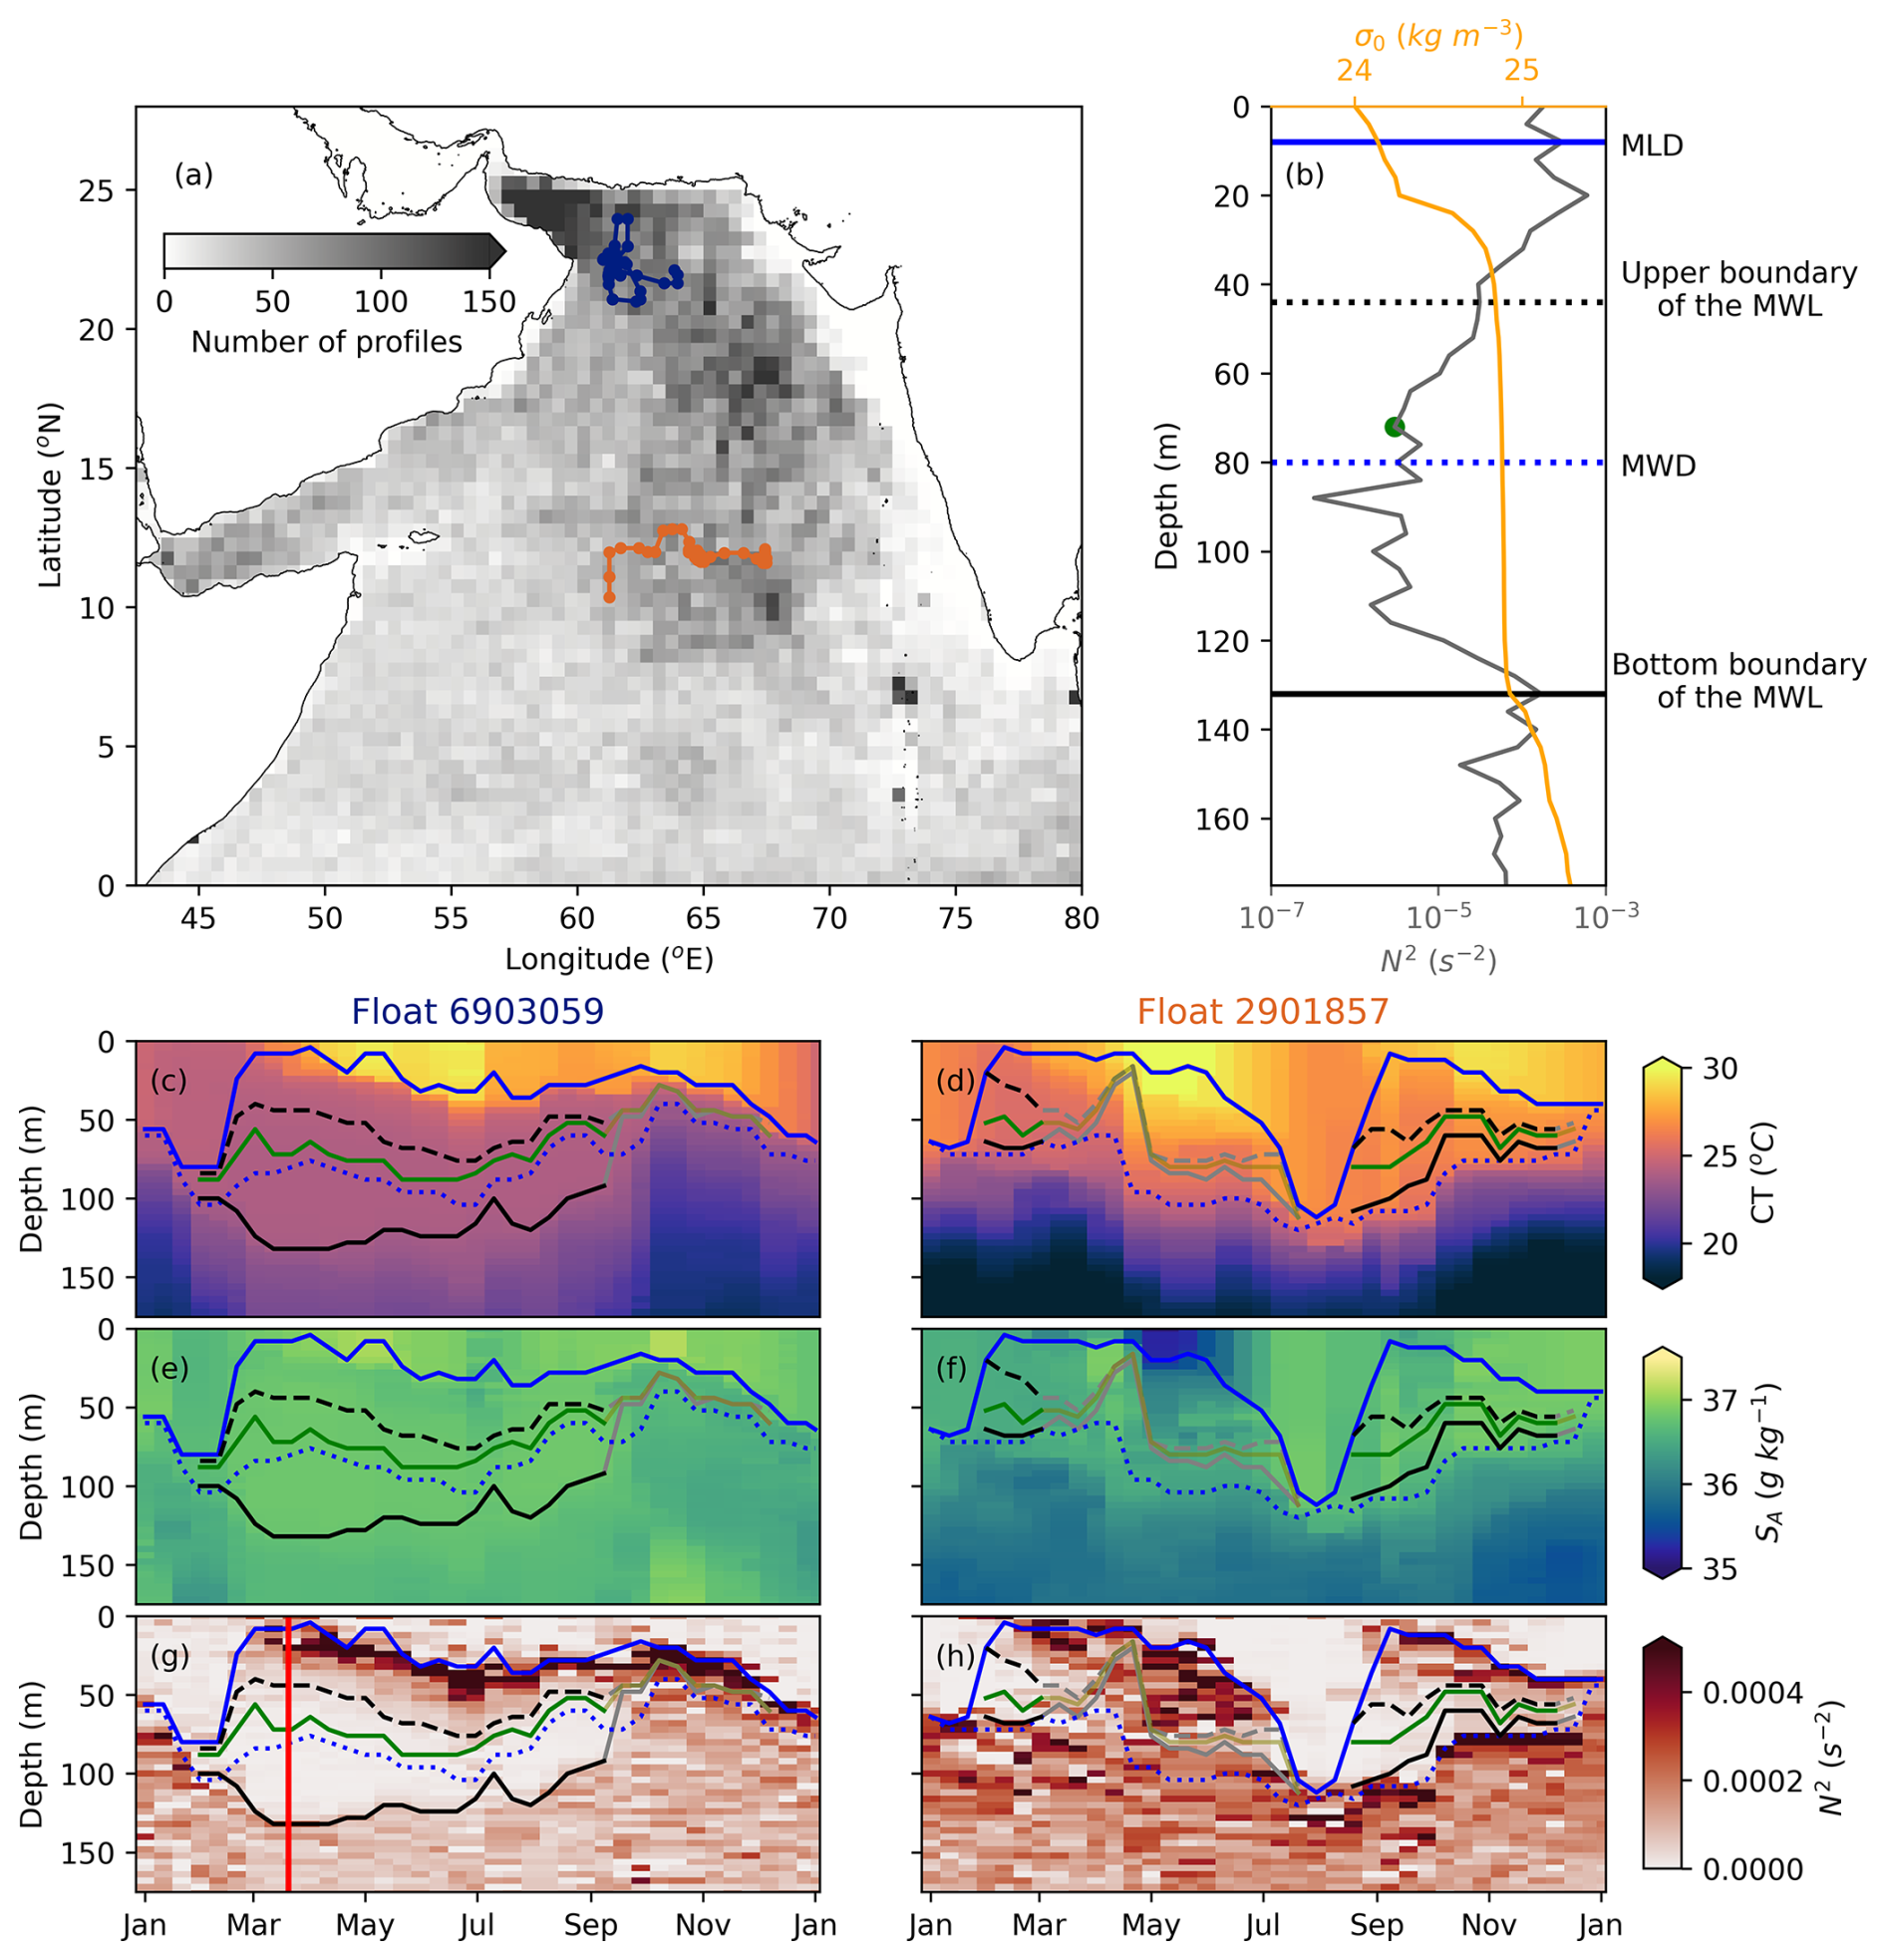
Figure 1Data and mode water definition. (a) The total number of Argo profiling floats in the Arabian Sea between 2007 and 2023 on a 0.5° × 0.5° grid. The trajectory of float no. 6903059 during 2022 in the northern Arabian Sea is in blue, and the trajectory of float no. 2901857 during 2018 in the southern Arabian Sea is in orange. (b) Example profile (marked in red in panel g) of stratification (N2, grey) and potential density (σ0, yellow). Mixed layer depth (MLD) is indicated with the blue line, mode water depth (MWD) is indicated with the dotted blue line, the core of the mode water layer is the green dot, and the upper and bottom boundaries of the mode water layer are the dashed and solid black lines, respectively. (c–h) Example of two floats of the annual cycle of conservative temperature (CT, c–d), absolute salinity (SA, e–f), and stratification (N2, g–h) in the northern Arabian Sea (float no. 6903059, c, e, g) and the southern Arabian Sea (float no. 2901857, d, f, h). As per panel (b), MLD is indicated with a blue line, MWD is indicated with the dotted blue line, the core of the MWL is in green, and the upper and lower layers of the MWL are indicated with the dashed and solid black lines, respectively. Grey lines indicate when MW is classified as eroded (see Sect. 3.1).
2.2 GOTM 1D model
GOTM (Burchard et al., 1999), a 1D water column model, is used to investigate the importance of upper-ocean processes to the vertical stratification, MW formation, and erosion in the Arabian Sea. The GOTM Community Vertical Mixing general circulation model (CVmix GCM) mixing parameterizations (Li et al., 2021) are used. This is a proven stand-alone model for studying boundary layer dynamics (e.g. Umlauf and Burchard, 2005). The models were initialized with the first profile of each float in the region and forced with 3-hourly heat, momentum, and freshwater fluxes from the ERA5 atmospheric reanalysis product (Hersbach et al., 2020), co-located to the time and location of the floats. The model setup has a vertical resolution of 2 m and 3-hourly time steps. Background interior mixing and shear mixing are parameterized in the CVmix GCM using the KPP mixing scheme (K-profile parameterization; Large et al., 1994). Langmuir turbulence is parameterized as per Li et al. (2016), and we neglect double diffusion. The optical properties of different water types influence the absorption of shortwave radiation, potentially modifying stratification. Absorption coefficients vary due to chlorophyll-driven light attenuation, which is relevant across all of the regions but depends on local phytoplankton concentrations. Sediment-related absorption is primarily a concern in near-shelf environments and is unlikely to significantly influence offshore regions. This study uses the Jerlov II water type scheme (Qing et al., 2022; Sasmal, 1997), which provides the best representation of mixed layer depth (MLD) compared to observational data and aligns with past observations of optical properties (Qing et al., 2022; Fig. S1). However, this represents a limitation, as it may introduce biases in regions where optical properties change seasonally. The potential impact of these biases on vertical stratification is examined in our model comparisons.
2.3 Modular Ocean Model (MOM4p1)–Tracers of Phytoplankton with Allometric Zooplankton (TOPAZ) 3D model
The physical model output used in this study is based on MOM4p1 (Griffies et al., 2003), while this specific configuration extends from −30 to 30° N and from 30 to 120° E (Behara and Vinayachandran, 2016; Kurian and Vinayachandran, 2007). This configuration has a ° spatial resolution and 40 vertical levels, with 25 levels in the top 200 m. The vertical grid has a 5 m resolution in the upper 60 m, a 10 m resolution to 100 m depth, a 20 m resolution to 200 m depth, and a 700 m resolution to 5000 m depth (Kurian and Vinayachandran, 2007). A combination of Laplacian and biharmonic schemes with Smagorinsky coefficients is used for horizontal mixing (Griffies and Hallberg, 2000), and the vertical mixing is based on the KPP scheme of Large et al. (1994). The physical model was started from a state of rest and spun up for 10 years, and the coupled biophysical model was spun up for another 10 years using the climatological forcings. Further, the interannual run is forced by ERA-Interim 3-hourly fields (Dee et al., 2011). The penetrative shortwave radiation parameterization is based on Morel and Antoine (1994), which only depends on the observed chlorophyll concentration (Sea-Viewing Wide Field-of-View Sensor (SeaWiFS); Hooker and Esaias, 1993). The coupled ecosystem model is based on TOPAZ (Dunne et al., 2010). The coupled model provides a realistic representation of the seasonal cycle of temperature, salinity, currents, oceanic productivity, and variability in the Indian Ocean (Kurian and Vinayachandran, 2007; Vijith et al., 2016). The model has been used successfully to study mixed layer processes (Kurian and Vinayachandran, 2006), the Arabian Sea warm pool (Kurian and Vinayachandran, 2007), freshwater plumes and advection from the Bay of Bengal (Vinayachandran et al., 2007), biophysical interactions associated with climate modes (Park et al., 2014), and phytoplankton blooms in the northern Arabian Sea (Vijith et al., 2016). Hence, the evaluation of model physics and biogeochemistry is not presented here. We use the ° 3 d resolution output from 2000 to 2020 (Prasanth et al., 2021).
Mode water layer definition
The mode water layer (MWL) is a subsurface well-mixed layer created by capping the mixed layer with new near-surface stratification. We developed an algorithm to track this layer that was inspired by previous subtropical mode water studies (Feucher et al., 2019). We defined the mode water depth (MWD; dotted blue line in Fig. 1b–h) as the densest isopycnal of the surface mixed layer. The MLD is defined using a surface density threshold of 0.125 kg m−3 and a 2.5 m reference depth (solid blue in Fig. 1b–h; Font et al., 2022; Liu et al., 2018; Montégut et al., 2004). The MWL is defined as the subsurface well-mixed layer capped after the deep seasonal surface mixed layer. The core of the MWL is defined as the minimum of N2 between the MWD and the MLD (green in Fig. 1b–h). We define the upper and bottom boundaries of the MWL using a mixed layer threshold method (0.05 kg m−3) on either side of the core of the MWL in the depth space: upwards to find the upper boundary (dotted black line in Fig. 1b–h) and downwards to find the bottom boundary of the MWL (solid black line in Fig. 1b–h). This is analogous to a typical surface boundary layer MLD detection (Montégut et al., 2004). While the algorithm does not explicitly track advection, the density threshold allows for the detection of a low-stratified MWL that has formed elsewhere and been advected into the region. The resulting metrics are in deepening order: the surface, the MLD, the upper boundary of the MWL, the core of the MWL, the bottom boundary of the MWL, and the MWD (Fig. 1b). Mode water thickness (MWT) is defined as the difference between the bottom and top boundaries of the MWL (MWT = bottom MWL − top MWL).
The formation time of the MWL is defined as the time of detection of the densest water in deep surface mixed layers that define the MWD. The erosion time of the MWL is defined as that when the stratification at the core of the MWL is larger than 5 × 10⁻⁵ s−2 (N > 5 × 10⁻⁵ s−2) or the thickness of the MWL is thinner than 10 m (MWT < 10 m) and sustained for 30 d. The threshold represents the approximate background stratification in the region, ensuring that MWL erosion is defined relative to physically meaningful conditions. The MWT threshold ensures sufficient vertical data coverage given the 4 m depth resolution, while the 30 d duration is chosen to account for the 10 d temporal resolution and to minimize the impact of data gaps. Throughout this study, we use the definitions of seasons based on 3-month periods: winter monsoon (December–February, DJF), spring (March–May, MAM), summer monsoon (June–August, JJA), and autumn (September–November, SON).
4.1 Mode water cycle in the Arabian Sea: seasonality and regionality
The mode water life cycle in the Arabian Sea presents two different regimes that are dependent on latitude, which is linked to the regional variability of the monsoons. This asymmetry results in MW formation occurring once a year in the north following deep winter mixed layers (Fig. 1c, e, g; latitude < 20° N) and twice a year in the south after both the winter and summer monsoons (Fig. 1d, f, h; latitude > 20° N). In this section, we characterize the timing of the formation, erosion, duration, and thickness for the contrasting monsoons and regions. Figure 2 provides an overview of the MW T–S properties coloured by latitude, serving as a basis for contrasting the northern, central, and southern Arabian Sea. Building on this, Fig. 3 further illustrates the duration of the MWL, MWT, and seasonality of the MW volume, while Fig. 4 highlights the MW formation relation to atmospheric forcing.
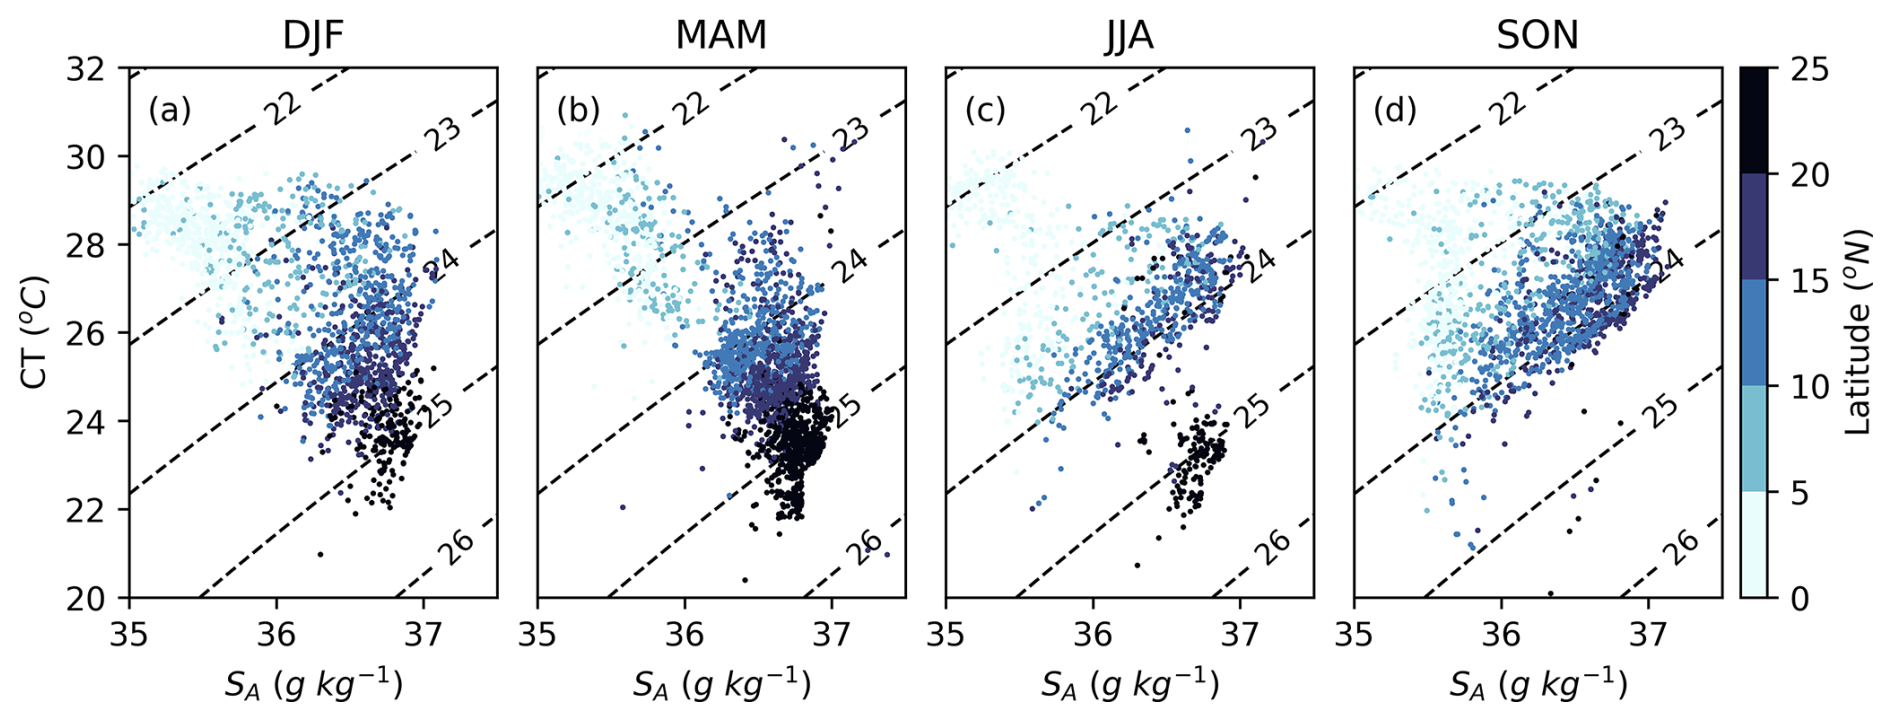
Figure 2Mode water seasonal and spatial variability. Mode water core T–S diagram from all available float profiles in the Arabian Sea for (a) winter (DJF, December–January–February), (b) spring (MAM, March–April–May), (c) summer (JJA, June–July–August), and (d) autumn (SON, September–October–November) coloured by latitude. Isopycnals (dashed black lines) are shown for all of the panels.
In the northern half of the Arabian Sea (latitude > 20° N), MW forms during the winter monsoon (Figs. 1c, e, g, 2a, 3c–e, and 4a). The MWL is formed between January and March (Fig. 3c, d). The densities of the core of the MWL range between 24.5 and 25 kg m−3 (CT-SA, 22–24 °C, and 36.6–37 g kg−1; Fig. 2a, b). This is present for over 3 months (94 ± 28 d, Fig. 3a), with an average maximum thickness of 41 ± 15 m. In the Sea of Oman, MWL is thickest (> 50 m, Fig. 3c–e) and present longest until it erodes on average in May–June (> 4 months, Fig. 3a). MW was observed up to September (Fig. 1c, e, g). During the summer monsoon, the remnants of the winter MWL are still present and not fully dissipated. There is no MW formation during summer (Figs. 2c and 3j–k) due to the strong positive buoyancy gain (Fig. 4b).
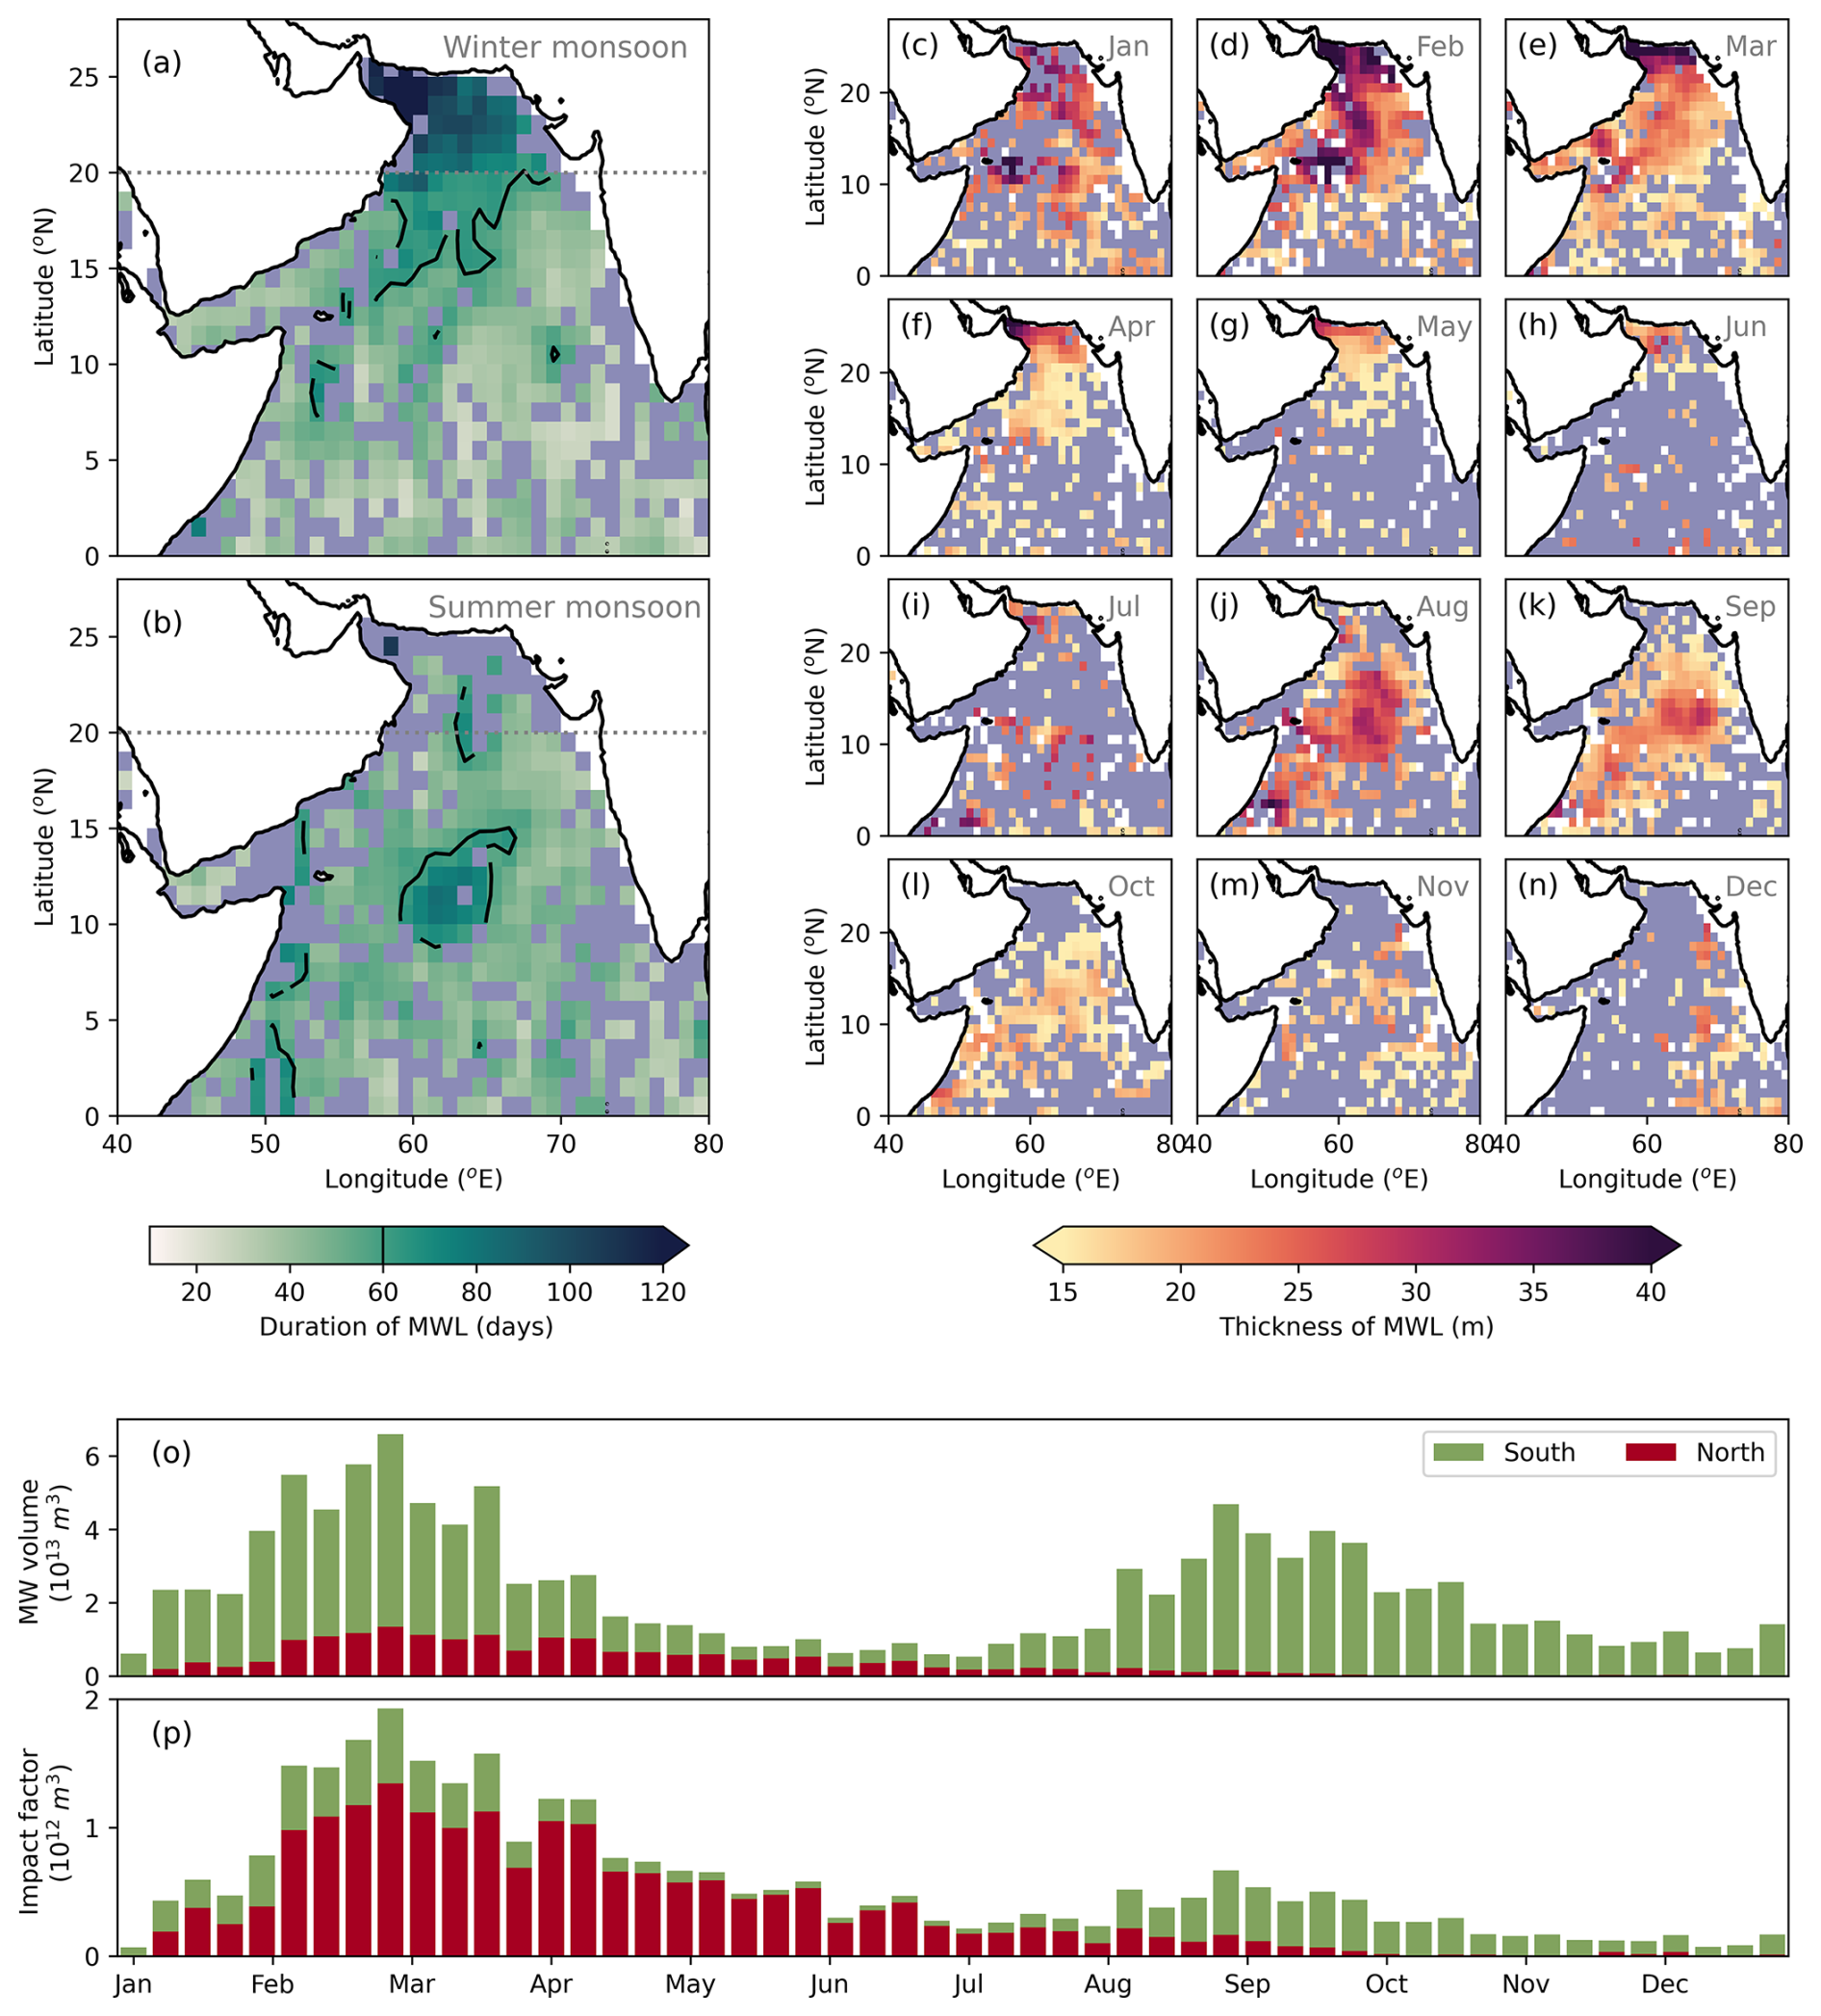
Figure 3Bimodal regionality of mode water formation. (a–b) Mode water layer duration during the (a) winter monsoon and (b) summer monsoon. The black contours show regions where the duration is 60 d (2 months). (c–n) Monthly climatology of MW thickness where MW is present from float observations. Blue shading is where there are float observations but MW is not detected. (o) Annual cycle of MW volume in the Arabian Sea, coloured by the contributions of the northern and southern Arabian Sea in red and green, respectively. (p) The impact factor of MW is defined as the MW volume scaled by the region's contribution to the total Arabian Sea area.
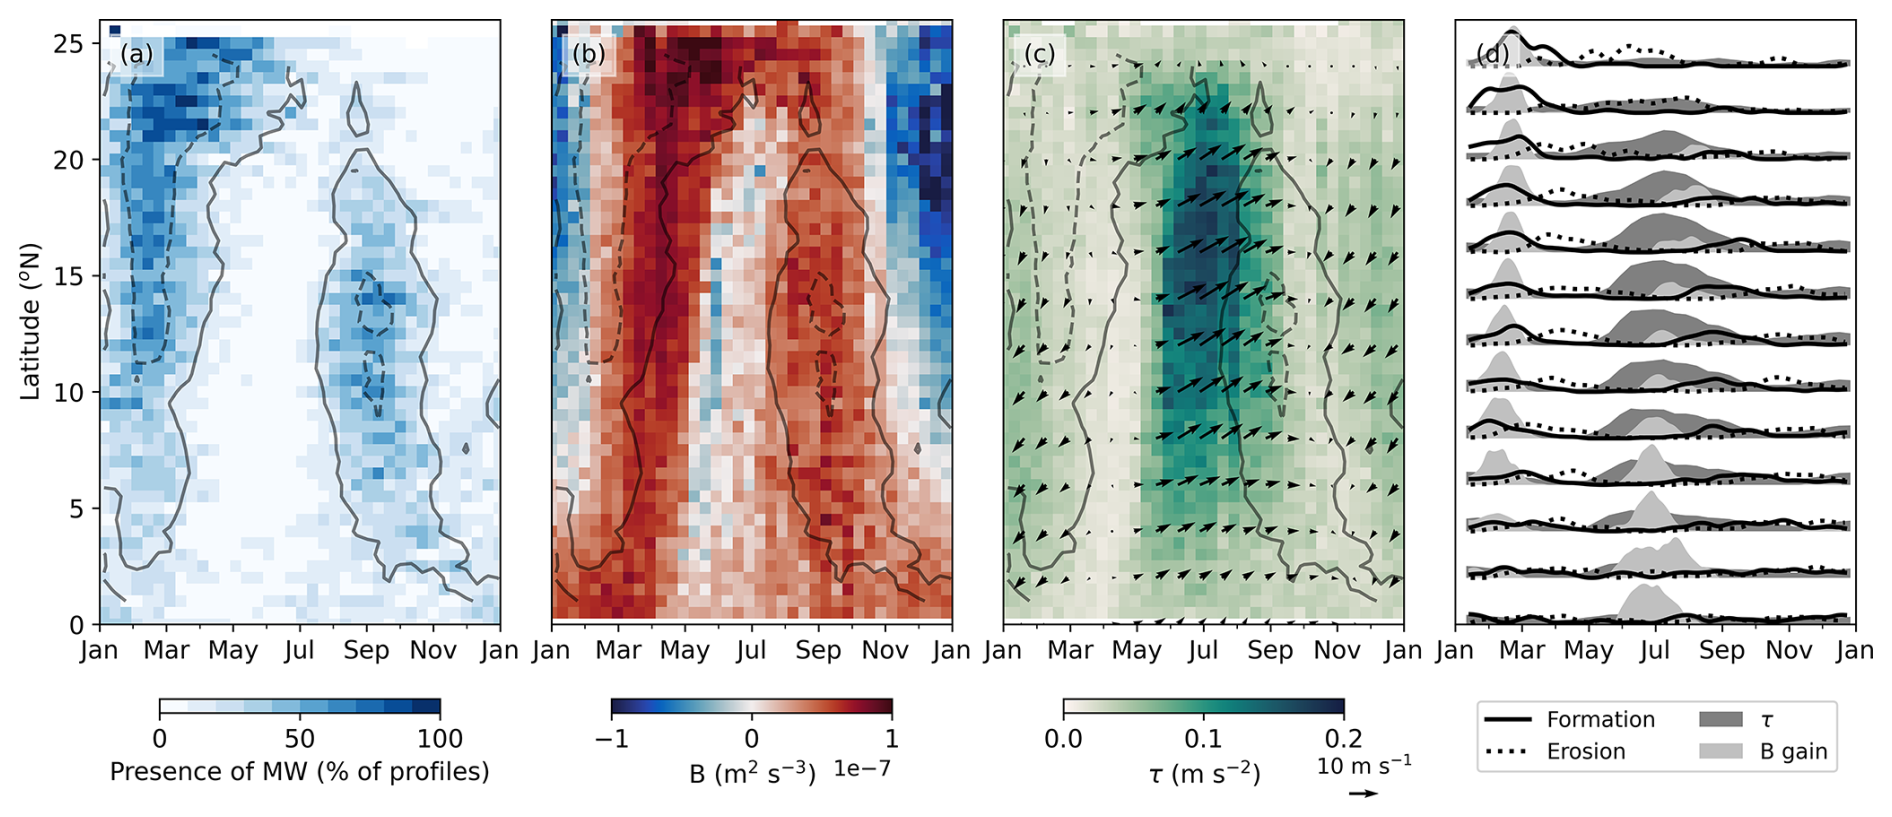
Figure 4Forcing mechanisms in the formation of the MWL. Latitudinal Hövmoller diagram of the climatology of the (a) MW presence represented as the percentage of profiles containing MW, (b) surface buoyancy flux (B), and (c) wind stress (τ), with the arrows depicting wind speed and direction. The isoline of the percentage of profiles with MW presence is depicted as a grey solid (50 %) and dotted contour (20 %) in panels (a), (b), and (c). (d) Distribution of the days of MW formation (black solid), days of MW erosion (black dotted), and days of change in buoyancy flux from loss to gain (shaded in light grey) per 2° latitudinal band. The wind stress time series is normalized by its maximum value per latitudinal band (shaded in dark grey).
In the central Arabian Sea (10–20° N), MW forms during the winter and summer monsoons. After the winter formation, the MWL is thinner in the east (Indian coast, 20 ± 5 m) and west (Omani coast, 26 ± 9 m) of the basin, and it dissipates in April (Fig. 3f). In the centre of the basin, the MWL is thicker (30 ± 12 m on average, Fig. 3d) and is present until April, with some remnants in May (Fig. 3g), dissipating from south to north. MW properties in the central Arabian Sea during winter formation are lighter than in the northern Arabian Sea, ranging from 23 to 24.5 kg m−3, with T and S ranging from 22 to 26 °C and from 36 to 37 g kg1 (Fig. 2a, b). During the summer monsoon, MW forms again in August (Figs. 1d, f, h and 2c, d) and is thickest in the central region (28 ± 10 m, Fig. 3j), lasting for 2 months until October (52 ± 12 d, Fig. 3b). These MWs are lighter than in winter, ranging from 23 to 24 kg m−3 (Fig. 2c).
In the southern Arabian Sea (latitude < 10° N), the MWL is thin (21 ± 7 m) and dissipates quickly (∼ 30 d), resulting in a patchy signal when approaching the Equator (Fig. 3). Equatorial seasonally reversing winds drive complex patterns of upwelling and downwelling (Phillips et al., 2021) that might suppress its formation, as per the summer monsoon upwelling on the eastern coast of Oman. Despite this fact, there is a striking difference between the western region and the rest of the southern basin during summer (Fig. 3j–l). We hypothesize that this is due to the longitudinal gradient in wind strength combined with the high energetics of the western region during this season (Beal et al., 2013; Phillips et al., 2021). MWL is present south of 10° close to the Somali coast and the “Great Whirl”. In this region, the MWL is 23 ± 10 m on average and lasts until October (50 ± 9 d, Fig. 3j–l). The MW in the southern Arabian Sea is the freshest of the MWs, lighter than 24 kg m−3 with a T–S range between 24 and 30 °C (< 36 g kg−1) (Fig. 2). Closer to the Equator, the MWL does not form because surface mixed layers are shallow (Fig. 6a–d) due to a positive buoyancy flux and low winds (Fig. 4b).
The annual cycle of the volume of MW presents a clear bimodality following the monsoons (Fig. 3o). The difference in areas covered by the north and south can bias our view of the importance of the northern Arabian Sea for the total MW volume. Thus, we build an impact factor scaling the volume of MW through the contribution of the northern and southern Arabian Sea to the total Arabian Sea area (Fig. 3p). The impact factor of MW is computed as impact factorregion = MW volumeregion ⋅ , where the MW volume for each grid cell is computed as the MWT multiplied by the cell area. The Arabian Sea area is defined by the ocean area shown in Fig. 3a, and the region areas are the northern or southern Arabian Sea delimited by the 20° N parallel. The northern Arabian Sea forms 10 % and the southern Arabian Sea 90 % of the total area. The impact of the northern Arabian Sea on the total volume of MW is larger than that of the southern Arabian Sea in the first half of the year, despite its area being 10 % that of the entire Arabian Sea (Fig. 3o). MW formed in the south during the summer monsoon impact is smaller than that of the northern Arabian Sea due to its localized presence in the centre of the Arabian Sea. The impact factor highlights the importance of the northern Arabian Sea in the total volume of MW in the Arabian Sea. In the following sections, we disentangle the forcing mechanisms for formation and erosion in the contrasting monsoons and regions.
4.2 Timing of the formation of the MWL: interplay of surface buoyancy fluxes and wind forcing
Heat gain and freshwater input (rainfall) supply buoyancy to the ocean surface, stratifying the upper ocean, whereas heat loss and evaporation result in buoyancy loss and convective mixing, deepening the surface mixed layer. Wind forcing also contributes to the mechanical mixing of the ocean boundary layer. The interplay between buoyancy fluxes (heat and freshwater, Eq. 1) and winds determines the evolution of the surface mixed layer variability (Font et al., 2022; Niiler and Kraus, 1977; Singh et al., 2019), and we thus hypothesize that these should also be the first-order drivers of the MWL life cycle in the Arabian Sea. In this section, we compare the climatological MW presence from float observations to the climatological atmospheric data from ERA5.
The buoyancy flux through the surface (B) is used to determine the stability of the upper ocean and can be expressed as
where g is the gravity constant, ρ0= 1027 kg m−3 is the reference density, cp is the specific heat of seawater, SA is the median absolute salinity between 10 and 15 m, α is the effective thermal expansion coefficient ()), β is the effective haline contraction coefficient ()), QNET is the net heat flux (W m−2), E is the evaporation (m s−1), and P is the precipitation rate (m s−1). In this representation, we do not include lateral processes such as horizontal advection or mixing generated by horizontal processes.
We separate buoyancy from wind mixing terms to understand the timing of MW formation (Fig. 4). The annual cycle of MW presence, represented as the percentage of float profiles containing MW per latitudinal bands, shows the formation once a year in the northern Arabian Sea and the biannual presence in the southern Arabian Sea (Fig. 4a). We retrieve atmospheric data from ERA5 closest to the float profiles and construct the seasonality of buoyancy fluxes and wind stress over the same region (Fig. 4b, c). The buoyancy flux is driven by its thermal component (, Fig. S2). Deep surface mixed layers can be formed during both monsoons due to heat loss (Liu et al., 2018; Singh et al., 2019).
During the winter monsoon, MW formation is driven by surface buoyancy gain, which decreases the surface density and stratifies the upper ocean (Fig. 4), capping the residual mixed layer formed by convective mixing during winter. Low winds are present, and these do not contribute to delaying the re-stratification after the change in the buoyancy flux regime (Fig. 4c). The climatological average surprisingly shows the presence of MW before the buoyancy flux changes sign (Fig. 4b). Despite the apparent contradiction in the average climatologies, the contradiction disappears when considering the regional and interannual variability on B and formation days (Figs. 4d and S2). We present a histogram of the dates when B changes sign (light grey, Fig. 4d) and a histogram of the formation days (black line, Fig. 4d). The interannual and longitudinal variability explains the spread of formation days that coincides with the spread of the days of change in the buoyancy flux sign (Figs. 4d and S2).
During summer, in the northern Arabian Sea (latitude > 20° N), there is no buoyancy loss and the ocean keeps gaining buoyancy (Fig. 4b). Winds are stronger (< 0.05 m s−2) than in the rest of the year, yet mechanical mixing cannot break the upper-ocean stratification (Fig. 4b, c). By contrast, in the southern Arabian Sea (latitude < 20° N), strong monsoon winds from the south-west (> 0.1 m s−2) and heat loss (−40 W m−2) from the ocean to the atmosphere overcome the heating from solar radiation and freshwater input from precipitation (Fig. 4b, c). In contrast to the formation of MW during winter, in summer the formation is shifted late after the change in sign of the buoyancy flux as the monsoon winds are still strong and mechanical mixing can maintain deep surface mixed layers (Fig. 4d). When those winds die down, MW forms (Fig. 4). Thus, MW does not form in the northern Arabian Sea during the summer monsoon but is present in the southern Arabian Sea, resulting in the unique bimodal regionality.
4.3 Erosion of the mode water layer: contrasting monsoons
The fate of MW determines whether subducted properties from the surface will either be mixed back up as the surface mixed layer deepens or mixed down based on internal and poorly understood processes and instabilities (e.g. internal waves, eddies, double diffusion, and frontal instabilities). In this section, we use observational data to evaluate the rate of change of the boundaries and regionality of the erosion rates of the MWL. Positive rates are shoaling of the boundary and negative rates are deepening of the boundary. Understanding how MW boundaries change over seasons is important for interpreting whether the capped properties subduct or obduct.
Mode waters formed in the winter and summer monsoons exhibit distinct patterns in how the MW boundaries change across seasons and regions (Fig. 5). During spring, their upper boundary is on average 60 ± 7 m and their bottom boundary 84 ± 7 m (Fig. 5a, e) in the northern Arabian Sea, and this is a bit shallower for the southern Arabian Sea (upper boundary at 50 ± 5 m and bottom boundary at 71 ± 6 m). The MWL thins at average rates of 15 ± 4 m per season in the northern Arabian Sea and 10 ± 4 in the southern Arabian Sea (Fig. 5i). Both boundaries deepen (Fig. 5c, g), with the upper boundary at a faster rate and deepening by more than 20 m per season (Fig. 5c). This deepening is driven by the strengthening of spring stratification caused by warming from enhanced solar radiation at the ocean surface coinciding with low winds (Fig. 4b, c). Thus, during spring the deepening of the upper boundary contributes most significantly to the erosion rate of the MWL.
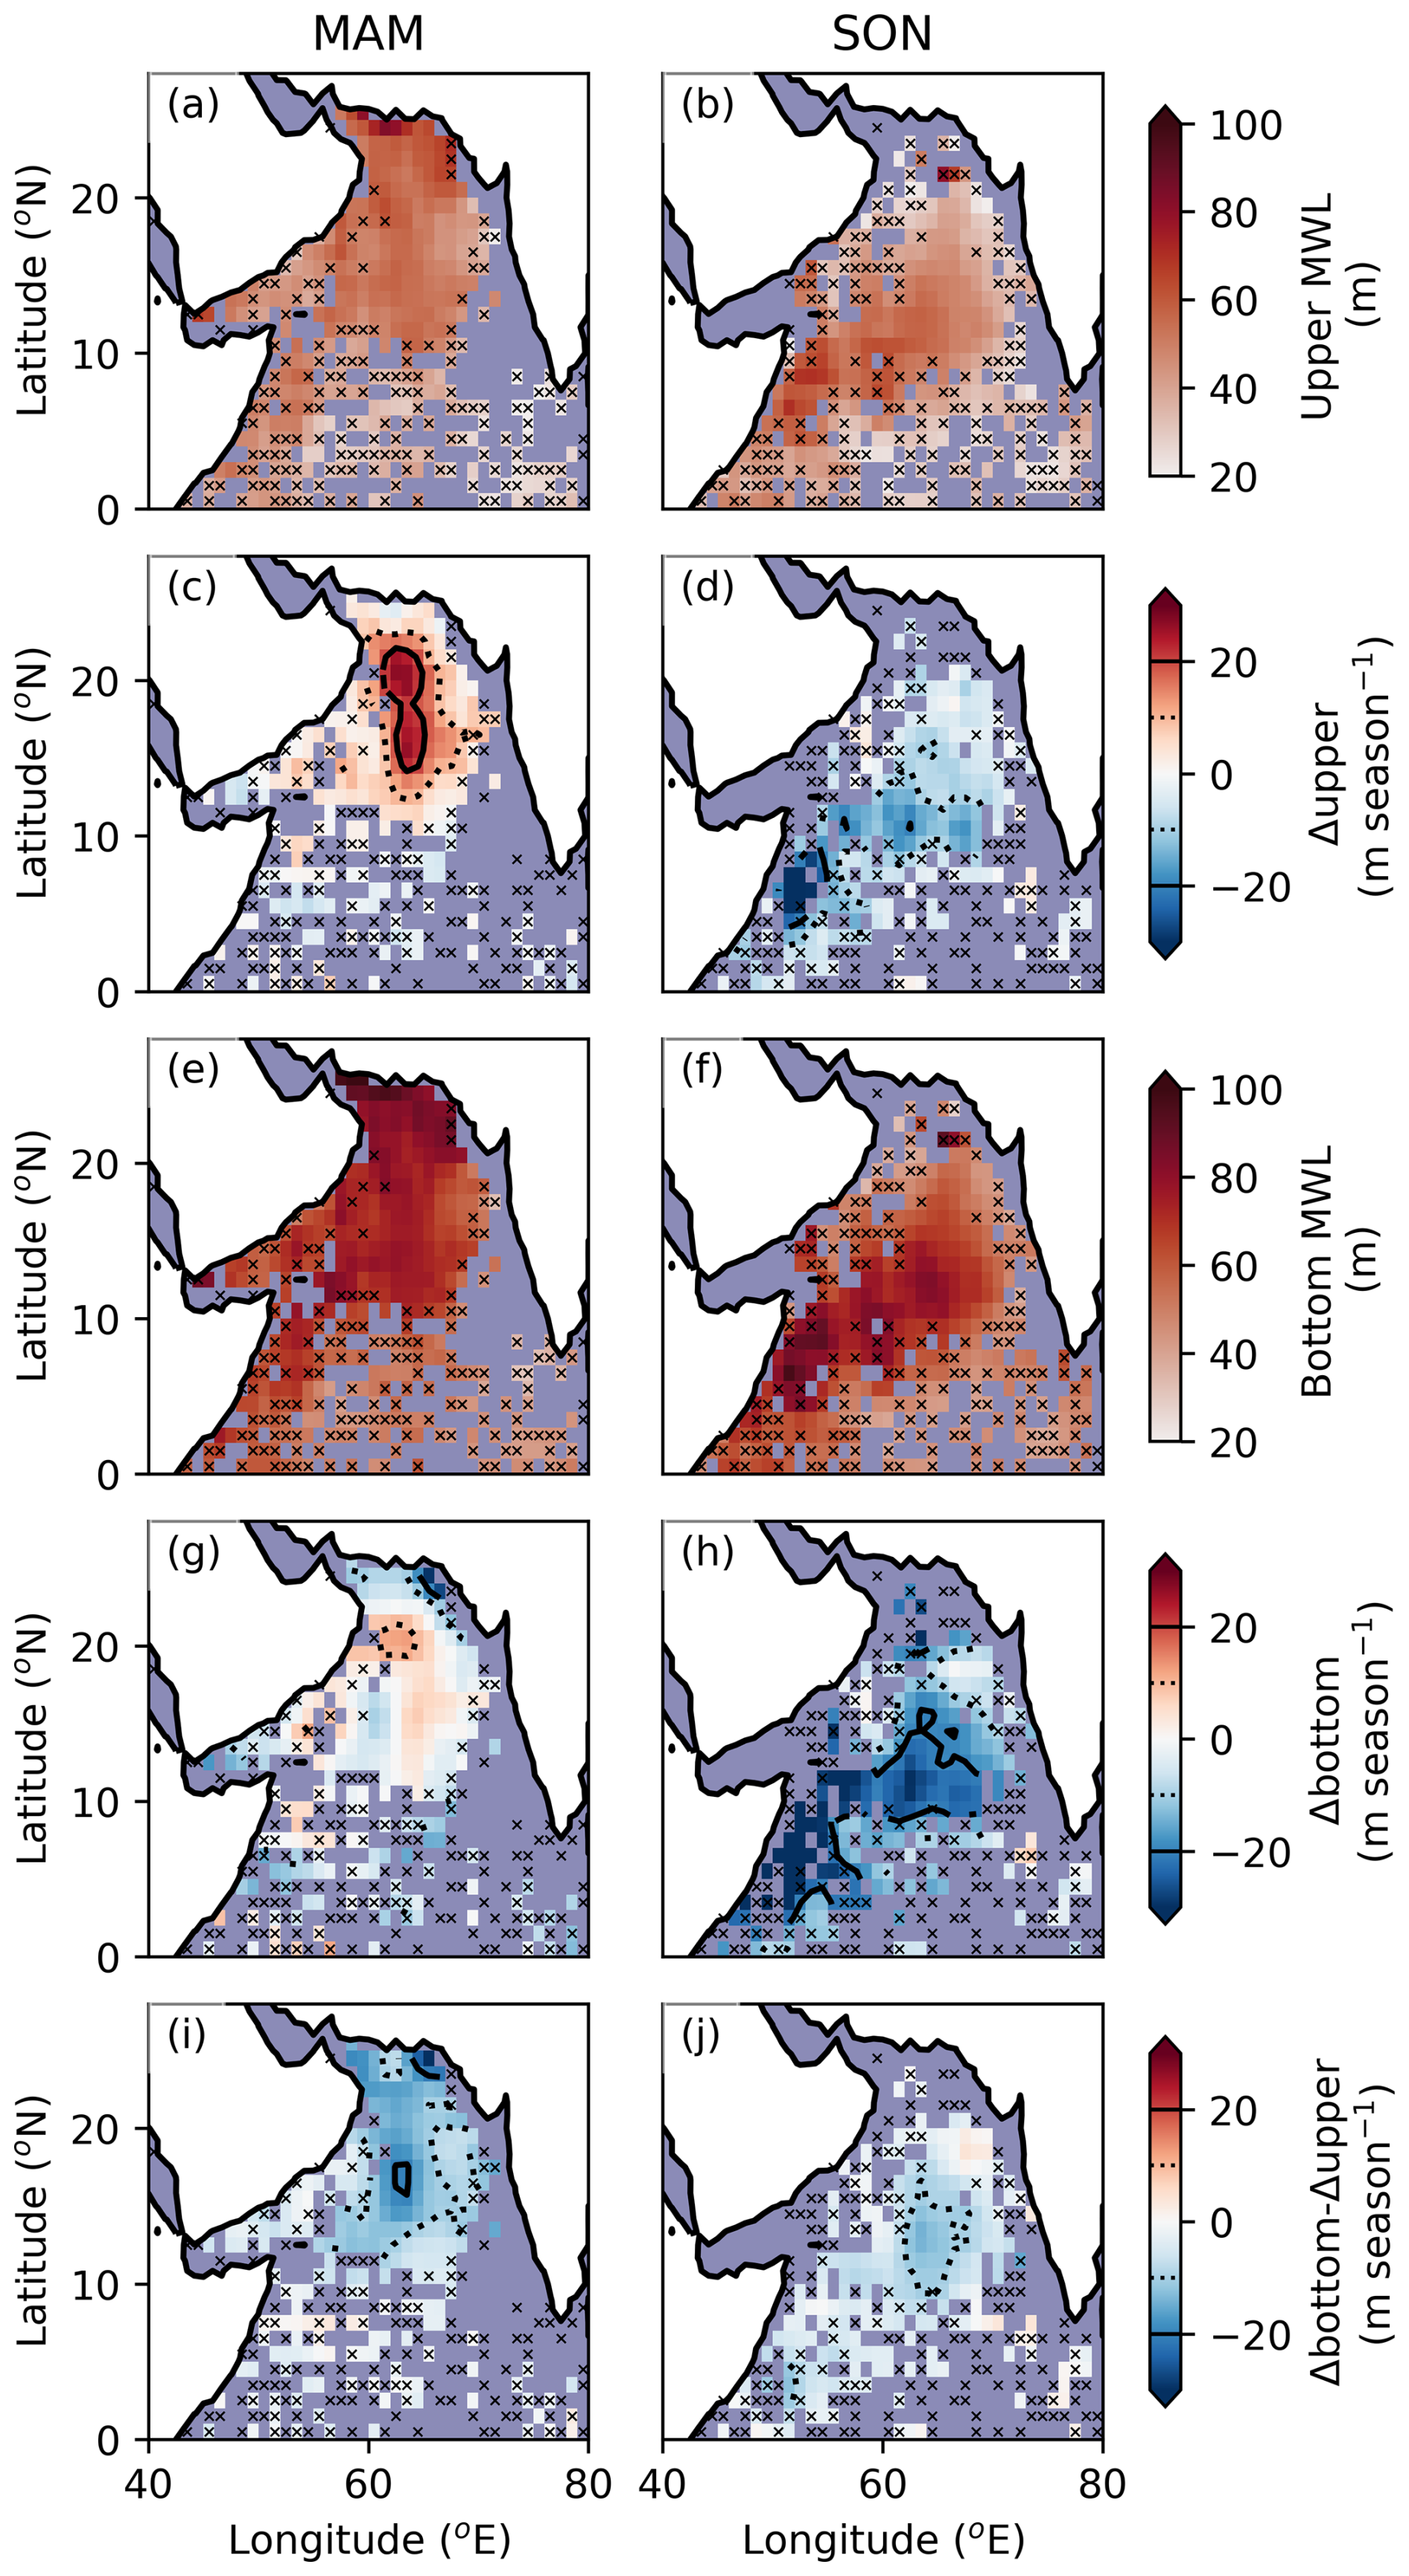
Figure 5Erosion of the MWL. Seasonal climatologies of the depth of the (a–b) upper boundary (upper MWL) and (e–f) bottom boundary (bottom MWL) for spring (a–e, MAM) and autumn (b–f, SON). Depth change in the (c–d) upper boundary (Δupper) and (g–h) bottom boundary (Δbottom) of the MWL in metres per season for spring (c–g) and autumn (d–h). Positive values mean deepening and negative values mean the shoaling of the boundary. (i–j) Rate of erosion per season (Δbottom − Δupper) for spring (i) and autumn (j). Negative values mean the thinning of the MWL. The rates of change of ±20 m per season (solid black line) and ±10 m per season (dotted black line) are depicted. Crosses show the grid cells where fewer than three MWLs are detected.
Following the summer monsoon's MW formation, the average rate of MW erosion is 6 ± 4 m per season in the southern Arabian Sea (Fig. 5j). During autumn, MW boundaries are on average shallower than during spring: 45 ± 10 m for the upper boundary and 65 ± 11 m for the bottom boundary (Fig. 5b, f). In contrast to the boundary behaviour following the winter monsoon, in autumn both boundaries shoal (Fig. 5d, h), with the bottom boundary being the primary driver of the erosion of the MWL. It shoals at an average rate of 20 m per season (Fig. 5h). Although the erosion rates are similar or even faster during the winter monsoon compared to the summer monsoon (Fig. 5i, j), as the MWL is thicker during winter in the northern Arabian Sea (Figs. 3 and 7a), this results in a longer MWL presence in this region (Fig. 3b). Further investigation is needed to determine what the mechanisms driving this erosion are.
4.4 Regionality: role of vertical mixing and advective processes
The previous sections neglected horizontal processes assuming a dominance of top–down atmospheric forcing, showing that 1D processes have the leading order in defining MW existences and lifespans. We now investigate potential contributions from 3D physical processes (circulation, upwelling and downwelling, and shear) that can also alter upper-ocean stratification. To investigate the MWL formation and erosion mechanisms, we implement a 1D model (GOTM) to assess how well we can represent this layer by isolating vertical processes (1D) from 3D dynamics. From the seasonal difference maps between the 1D model and observations, we suggest mechanisms driving these differences for case-distinct regions in the Arabian Sea (e.g. misrepresentation of the mixed layer, stratification due to advected water masses, heat absorption due to biological presence, and internal mixing), which are corroborated if such biases are absent in the 3D coupled model (MOM4p1–TOPAZ) (Figs. 6–7).
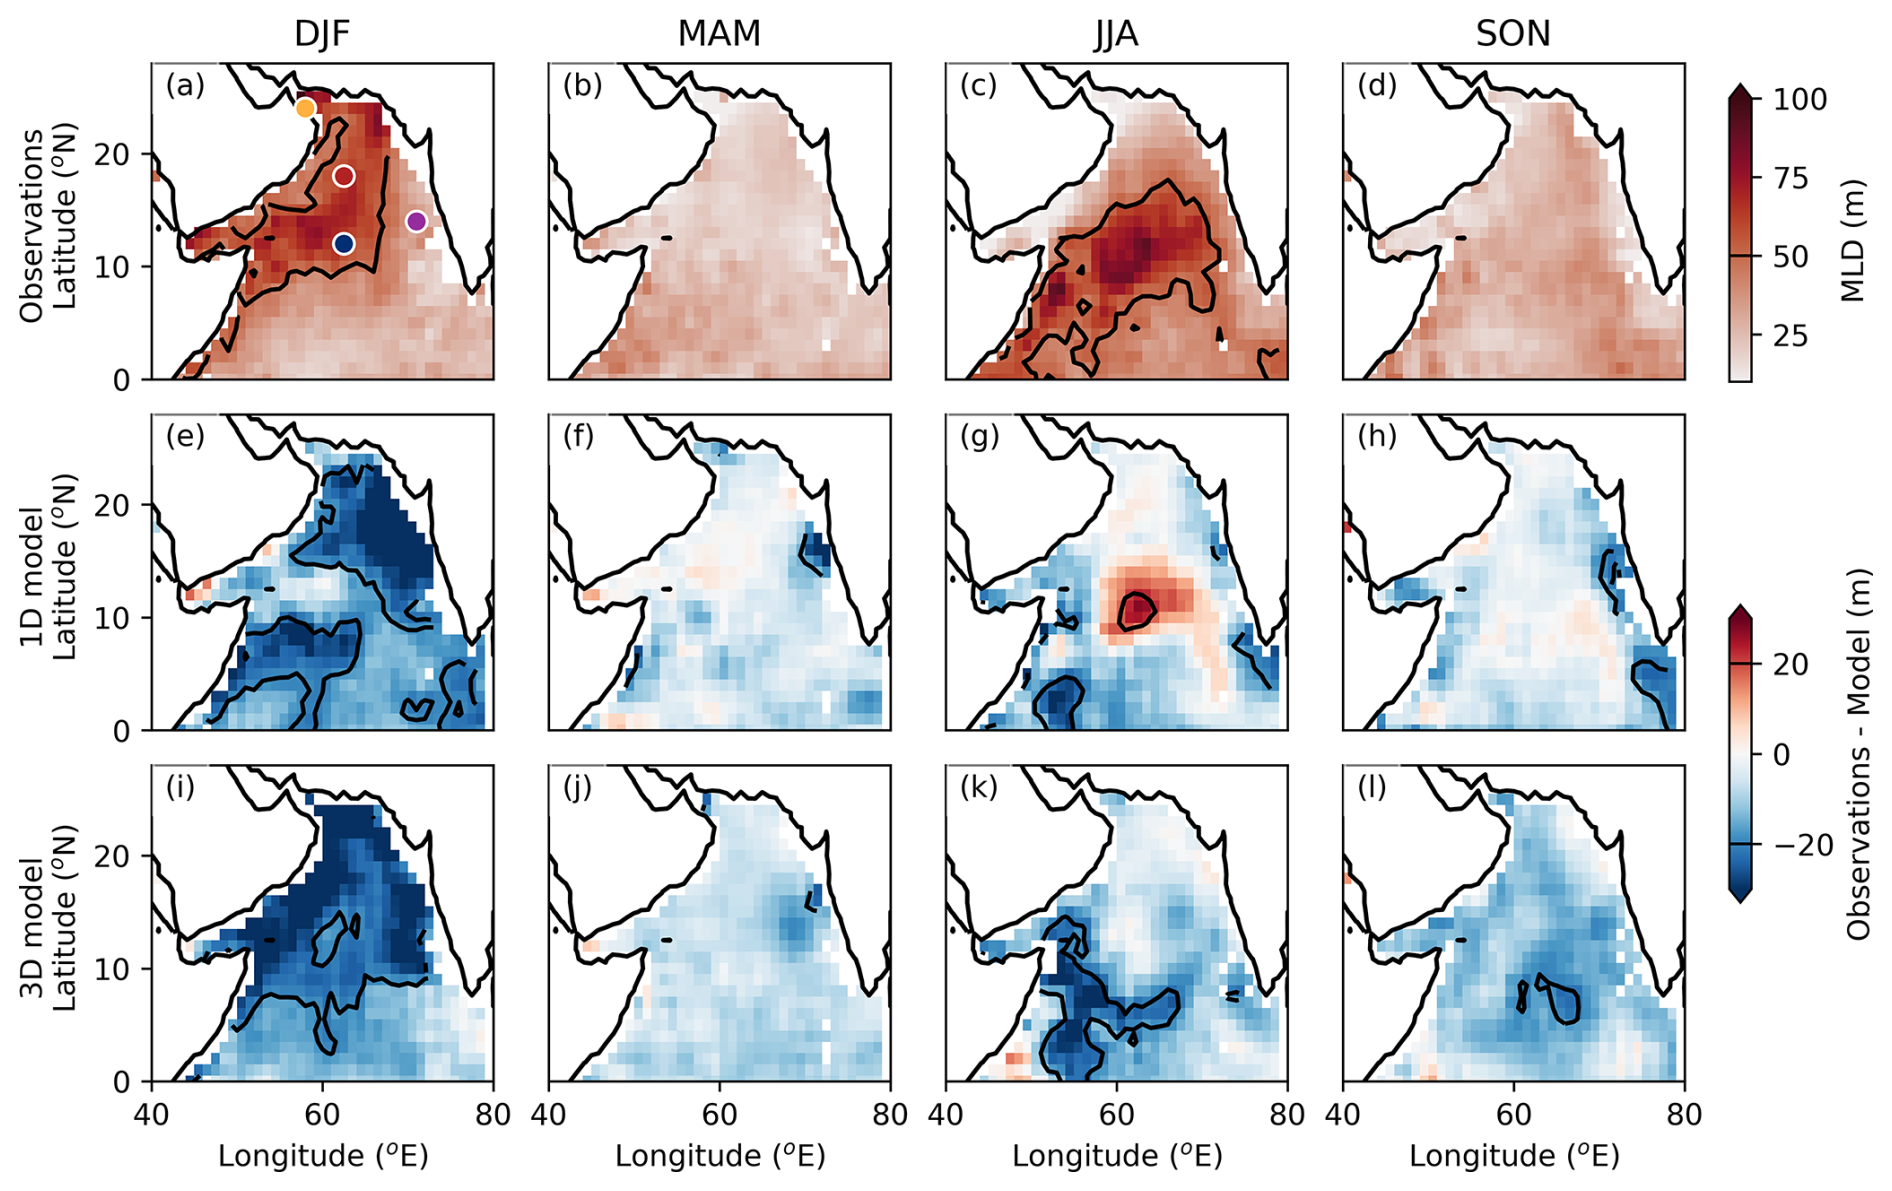
Figure 6MLD comparison between the observations, 1D GOTM, and 3D MOM4p1–TOPAZ. (a–d) MLD seasonality from float observations, (e–h) difference in the MLD between the observations and 1D GOTM, and (i–l) difference in the MLD between the observations and 3D MOM4p1–TOPAZ. The 50 m MLD contour is depicted in panels (a), (b), (c), and (d). The difference contour between the observations and models of ±20 m is depicted as a solid black line in panels (e)–(l). The maps are 0.5° × 0.5° monthly climatological medians. The difference between the observations and models is computed after the mapping. Only modelled data collocated in time and space to the floats are used in order to have comparable averages. The coloured dots in panel (a) show the regions of interest characterized in Fig. 8.
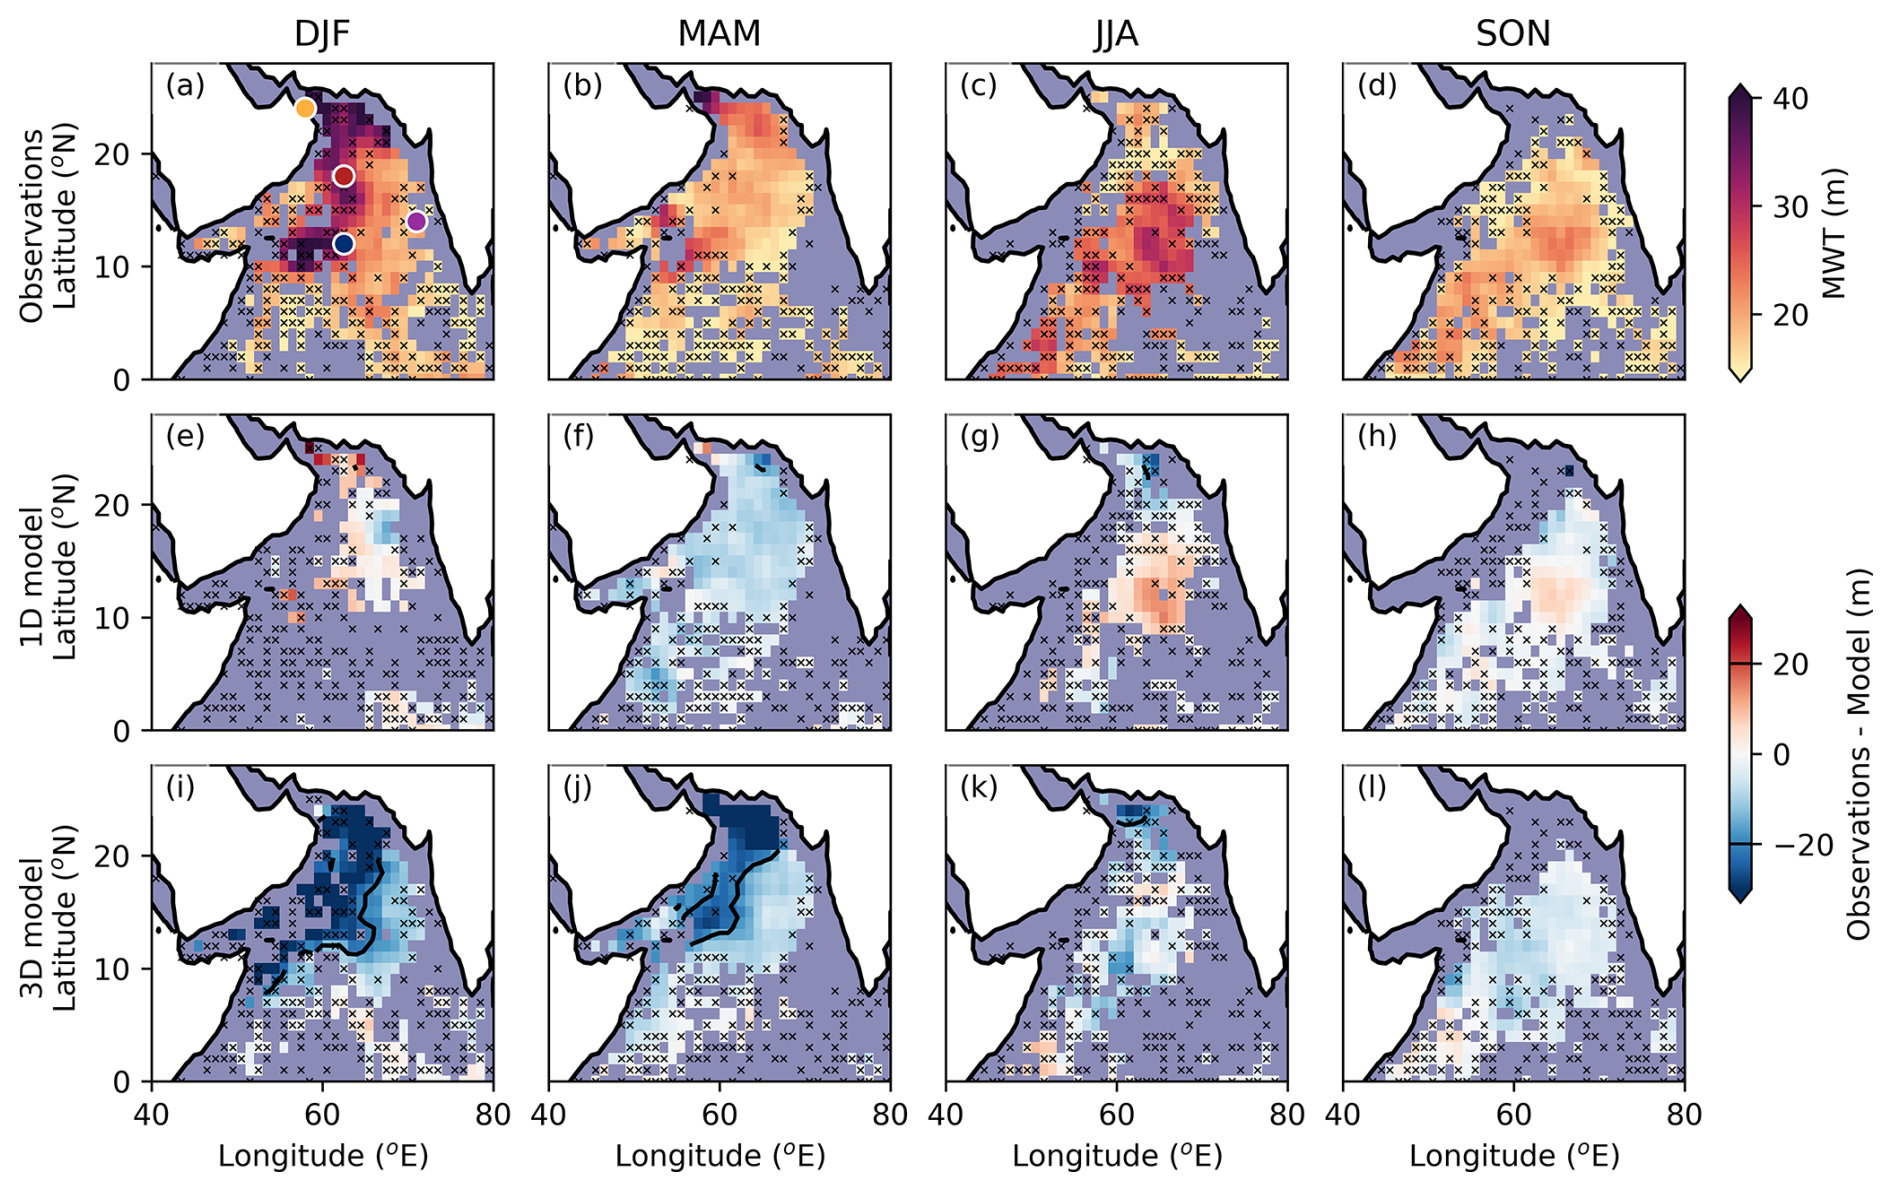
Figure 7MWT comparison between the observations, 1D GOTM, and 3D MOM4p1–TOPAZ. (a–d) MWT seasonality from float observations, (e–h) difference in the MWT between the observations and 1D GOTM, and (i–l) difference in the MWT between the observations and 3D MOM4p1–TOPAZ. The difference contour between the observations and models of ±20 m is depicted as a solid black line in panels (e)–(l). The maps are 0.5° × 0.5° monthly climatological medians. The difference between the observations and models is computed after the mapping. Only modelled data collocated in time and space to the floats are used in order to have comparable averages. Crosses show the grid cells where fewer than three MWLs per season are detected in the observations. The coloured dots in panel (a) show the regions of interest characterized in Fig. 8.
The surface mixed layer depth significantly influences the characteristics of the MWL. Therefore, we begin by analysing how the model represents observed MLD patterns (Fig. 6). Both the 1D and 3D models show a bias towards a deeper MLD compared to the observations (Fig. 6e–l). The largest bias is present during winter (DJF, 1D model 18 ± 11 m; 3D model 20 ± 9 m; Fig. 6e, i). The 1D model MLD bias displays regional variability, which could indicate that the 1D approach cannot fully represent surface mixed layer processes. In the 3D model, the shift in the stratification to that deeper than what was observed was previously assessed by Prasanth et al. (2021) and in Figs. S3–S4. The MLD bias is consistent across the basin during winter, posing a constraint on our analysis. However, as the seasonal cycle is well reproduced and the 3D model accurately captures the deep summer mixed layer in the centre of the basin, we consider the model to be suitable for assessing MW life cycle mechanisms. For instance, horizontal advection, particularly in high-eddy-kinetic-energy regions, redistributes heat and momentum laterally, a process absent in the 1D model. In the western Arabian Sea, where eddy kinetic energy intensifies in summer near the Somali coast (Fig. 1 in Zhan et al., 2020; Sun et al., 2022), this likely contributes to the MLD differences between the 1D and 3D simulations (Fig. 6c, g, k).
Since the MLD determines the initial MWL thickness, biases in MLD directly affect the models' representation of MW thickness. For example, the 3D model overestimates the MLD during winter, leading to an overestimation of MWL thickness in spring (northern Arabian Sea: 24 ± 5 m; southern Arabian Sea: 19 ± 3 m; Figs. 6ei and 7fj). Conversely, the 1D model underestimates the MLD, resulting in an underestimation of MW thickness, especially in the central basin during summer (Figs. 6g and 7g). After the summer deep-surface mixed layers in the central Arabian Sea, where the MLD is underestimated (3 ± 14 m, peaking at 24 m in the central Arabian Sea – blue dot; Fig. 6c, g), the 1D model also underestimates the thickness of the MWL (7 ± 4 m, with a 12 m bias in the central Arabian Sea – blue dot and the case study in Fig. 8). This underscores the critical importance of accurately modelling the MLD to represent MW dynamics reliably. The relationship between MLD and MW biases warrants further investigation. As MLD is easier to diagnose in models, analysing its regional biases and lagged relation to MWT biases could help refine the model representation of this layer and better constrain MW ecological implications.
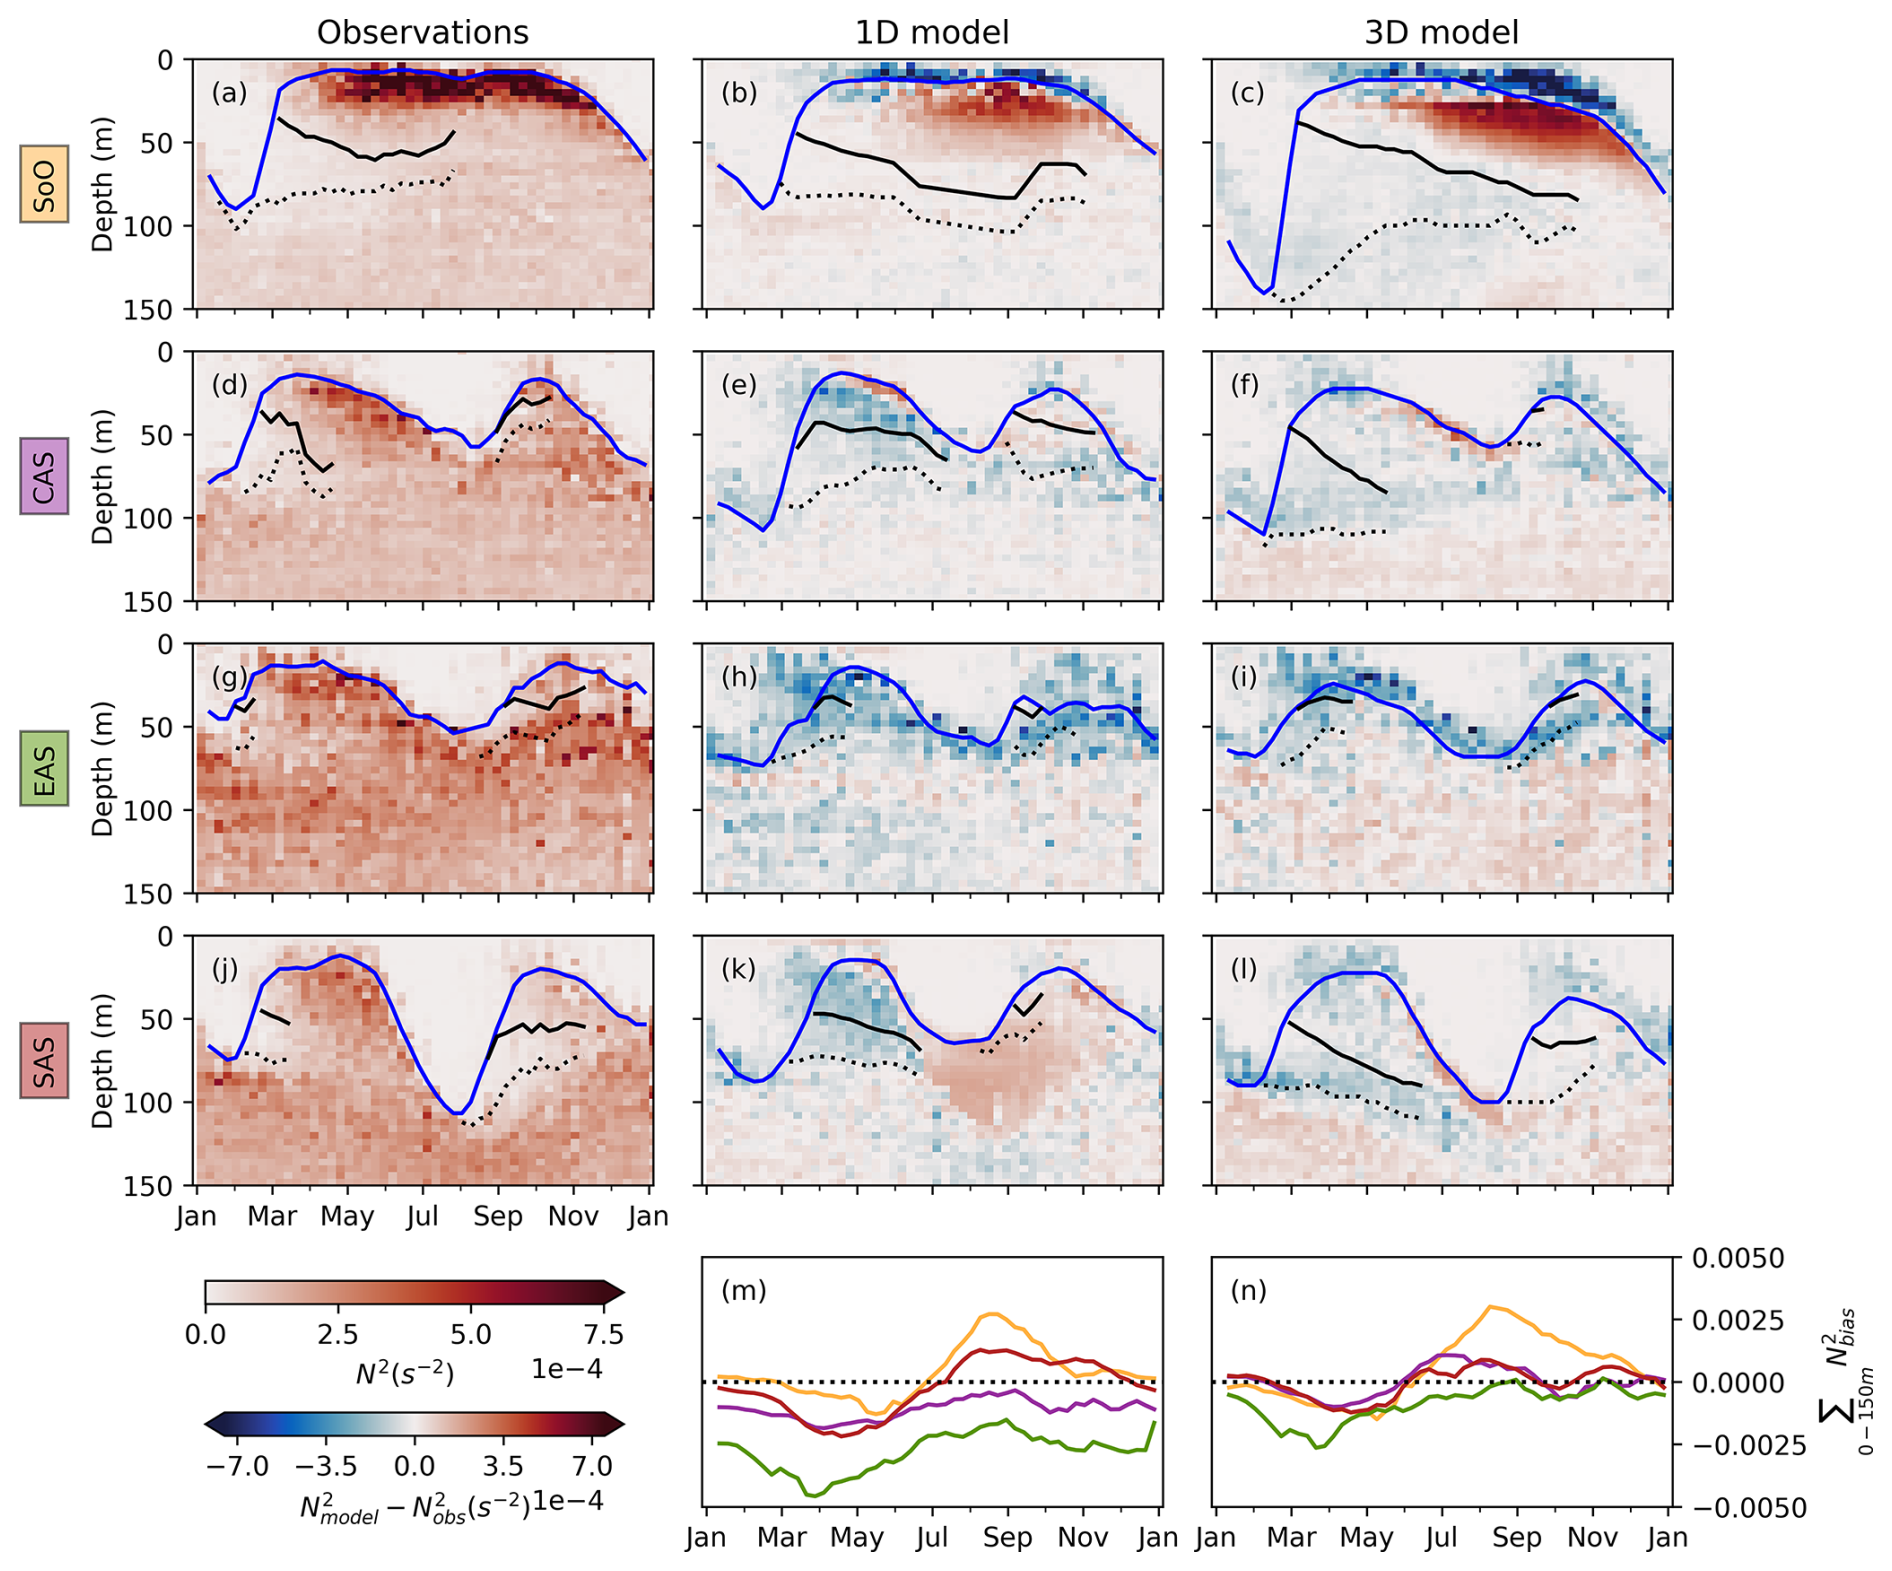
Figure 8Case studies – upper-ocean stratification from observations, the 1D GOTM, and 3D MOM4p1–TOPAZ. (a, d, g, j) Climatological average of the annual cycle of upper-ocean stratification (N2) from observations, (b, e, h, k) bias between observations and 1D − GOTM, and (c, f, i, l) the 3D − MOM4p1 − TOPAZ model at four different case study locations: (a–c) Sea of Oman (SoO), (d–f) eastern Arabian Sea (EAS), (g–i) central Arabian Sea (CAS), and (j–l) southern Arabian Sea (SAS) (see the locations in Figs. 6a and 7a). The lines show the average MLD (blue), the upper boundary of the MWL (solid black), and the bottom boundary of the MWL (dotted black). The upper and bottom boundaries of the MWL are not shown when MWL is eroded at more than 75 % of the data points used for the average. The (m) 1D and (n) 3D model annual cycles of the vertical integral of the N2 bias between the model and observations for the upper 150 m of the ocean, colour-coded by the different locations (SoO in yellow, CAS in purple, EAS in green, and SAS in red; Figs. 6a and 7a).
To better constrain the regional differences, we look at the vertical structure for selected case study regions (marked regions in Figs. 6–7a). The vertical sections are climatological averages from all floats gridded at 2° × 2° and the line plots are the depth cumulative sums of the N2 bias between the observations and the 1D and 3D models (Fig. 8). We identify four regions, which are (1) the Sea of Oman (SoO), (2) the central Arabian Sea, (3) the eastern Arabian Sea (EAS), and (4) the southern Arabian Sea (SAS).
4.4.1 Sea of Oman
The SoO is characterized by the longest presence and thickest MWLs in the Arabian Sea (Figs. 3 and 8a–c). Both the 1D and 3D models reproduce the MWL's formation–erosion cycle, with some differences related to the timing of formation and boundary changes compared to the observed upper-ocean stratification (Fig. 8a–c).
The modelled winter mixed layers are deeper than in the observations (1D 12 ± 4 m and 3D 37 ± 6 m deeper; Figs. 6ei and 8cd), leading to a significantly thicker modelled MWL in the 3D model (> 50 m; Figs. 6i and 8c). The underestimation of upper-ocean stratification in this region by the 3D model is a limitation of this comparison. Despite the shift in depth of the MLD, we believe that the pattern can show evidence of certain mechanisms driving changes in the MW cycle. After winter, both the 1D and 3D models present a deeper spring-to-autumn MLD (1D 13 ± 1 m and 3D 16 ± 5 m) compared to the observations (8 ± 2 m), yet they present a more intense pycnocline, overestimating upper-ocean stratification by 7 % and 12 % (Fig. 8m, n). The deepening of the upper boundary of the MWL follows this seasonal cycle: as ocean heat gain strengthens upper-ocean stratification during spring and summer, the increasing density contrast inhibits vertical mixing and progressively isolates the MWL, leading to its downward migration. Despite the overestimation of the pycnocline intensity, both models reproduce this deepening trend of the MWL's upper boundary (Figs. 4b, 5c, and 8b, c), supporting the conclusion that upper-ocean stratification buildup from heat gain is the primary driver of MWL deepening.
The observations and the modelled annual cycle differ in the timing of the formation of the MW in the region. Stratification builds up at the beginning of March (week 10) in both observations and the 3D model, yet there is a 1-month lag in the 1D model (3 to 5 weeks). We hypothesize that there are 3D processes that can modify MW characteristics locally and at shorter timescales by setting the formation timing. It has been shown that mesoscale eddies are likely to modulate the ASHSW, altering the upper-ocean stratification and the winter convective mixing (Thoppil, 2024; Trott et al., 2019). Unlike other regions of the Arabian Sea, the SoO is largely isolated from the broader monsoonal wind patterns (Chaichitehrani and Allahdadi, 2018), and its standing mesoscale eddy structures (L'Hégaret et al., 2013; de Marez et al., 2019; Pous, 2004) may play a critical role in re-stratification timing (Font et al., 2022) or retention of the MWL, as observed in other regions (e.g. Karleskind et al., 2011; Shi et al., 2018; Xu et al., 2016).
4.4.2 Central Arabian Sea
In the central Arabian Sea (CAS), the upper-ocean stratification and the MW formation–erosion cycle are well represented by both the 1D and 3D models (Fig. 8d–f). Despite the overestimation of MLD by the models in the upper ocean (observations: 39 ± 20 m, 1D: 49 ± 30 m, and 3D: 51 ± 26 m; Figs. 6 and 8e, f) and the consequent overestimation of MWT (median MWT for observations: 16 m, 1D: 24.5 m, and 3D: 36 m; Figs. 7 and 8e, f), the bimodal nature of MW formation in the CAS is evident. Formation timing is accurately represented, with a lag of only 2 weeks for the 1D model in winter and none for the summer monsoon for both models (Fig. 8e, f). The 1D model predicts a longer MWL duration compared to the observations and 3D model, suggesting that erosion is enhanced by 3D processes. For MWs formed during winter, the observations and 3D model predict that they will be eroded after May (12–15 weeks; Fig. 8e, f) compared to the 1D model that shows a MW presence until summer monsoon surface mixed layer deepening (17 weeks; Fig. 8d). Similar behaviour is observed and modelled for MWs formed during summer, with durations of 5 and 3 weeks for the observations and 3D model (Fig. 8e, f) and 9 weeks for the 1D model (Fig. 8d). We hypothesize that, in the CAS, processes captured by the 3D model – such as the southward advection of ASHSW (Han and McCreary, 2001; Prasad and Ikeda, 2002a) – might be driving the erosion of MW after both monsoons.
4.4.3 Eastern Arabian Sea
In the EAS, advective processes play a critical role in the MW cycle. Along India's coast, a substantial bias in MLD is observed in the 1D representation compared to the observations during winter (−38 ± 16 m; Figs. 6 and 8h). By contrast, the 3D model also presents a deep bias, but this is less important (−28 ± 5 m; Figs. 6 and 8i). This bias in MLD translates into overestimations of the thickness of the MWL by 44 % in the 1D model and 37 % in the 3D model (Figs. 7fj and 8hi). During winter, freshwater from the Bay of Bengal is advected anti-clockwise along India's western coast, reaching up to 20° N (West Indian Coastal Current; Chatterjee et al., 2012) and modulating the wintertime convection there (Shankar et al., 2016). This advection, visible in float observations and 3D model outputs, increases stratification (Fig. S5g, i). The haline component of N2 changes sign in both the observations and the 3D model but is absent in the 1D model (Fig. S5h). As a result, the 1D model under-represents haline stratification, leading to it underestimating the upper-ocean stratification (Figs. 8m and S5h) and overestimating the convective mixing and surface mixed layers (Fig. 6e–h). This bias becomes particularly noticeable at the end of autumn in the south-eastern Arabian Sea, where circulation shifts and overestimation of MLD are visible in the bias of the 1D model (Fig. 6h).
4.4.4 Southern Arabian Sea
The SAS exhibits a significant bias between the observations and 1D model during the summer monsoon, indicating that a key mechanism for deep mixed layer depths and MW formation is missing in the 1D approach (red dot in Figs. 6a, 7a, and 8j–l). Specifically, the 1D model underestimates the MLD by an average of 30 % (Fig. 6c, g), reducing the MWT by 31 % in the SAS (Fig. 7c, g). We hypothesize that this bias may be due to seasonal changes in absorption coefficients of the water (water type) that change the surface heating, which are not accounted for in the 1D model.
Despite high winds during summer, the mixed layer remains shallow in the 1D model (Figs. 6a and 8k) due to enhanced stratification caused by an overestimation of chlorophyll-induced absorption (Fig. S1). Babu et al. (2004) demonstrated that, while pigment concentrations are high during July in the SAS, the MLD is deeper due to high wind speeds, leading to increased turbulence and a deeper MLD. However, in August, as wind speeds decrease, biological heating becomes more influential, thereby overcoming the effect of wind mixing and leading to a shallower MLD. This cycle is not well represented in our fixed water type 1D model (Fig. 8k). By reducing water turbidity in the 1D model (water type I), we better represent the observed deep mixed layers at the start of the summer season, reducing the MLD underestimation from 32 % to 14 % (Fig. S1). However, we then misrepresent the shoaling and re-stratification that occur when wind speeds drop, due to a lack of heat absorption in the model (Fig. S1). In contrast, the 3D model accounts for changes in water absorption properties (see Sect. 2.3; Morel and Antoine, 1994), providing a more accurate representation of oceanic heat absorption (Figs. 6k and 8l). This capability allows the 3D model to better capture the effects of stratification and heat distribution, highlighting the crucial role of biological and optical processes in the SAS in regulating upper-ocean stratification.
4.5 Oxygen content of mode water
Mode water's most important role is in subducting properties when formed (Lacour et al., 2023; Li et al., 2023; Portela et al., 2020). Here, we quantify the upper-ocean content of oxygen and MW's contribution to it. Due to a lack of observations to constrain upper-ocean oxygen content and subduction and obduction rates, we use the 3D MOM4p1–TOPAZ output to upscale the observations from floats.
The MW contribution to the total oxygen content of the upper Arabian Sea (250 m) accounts annually for only 4 ± 1% (3 ± 1% in the southern Arabian Sea and up to 8 ± 2% in the northern Arabian Sea; not shown). We argue that the oxygen content below the mixed layer is more relevant for ventilation and biogeochemical impacts. Thus, if we only account for subsurface oxygen content (i.e. excluding surface mixed layer saturated or oversaturated waters in contact with the atmosphere), the MW contribution rises to 5 ± 1% (5 ± 1% in the southern Arabian Sea and up to 11 ± 2% in the northern Arabian Sea; Fig. 9b). Despite this, due to MW's intermittent presence driven by the seasonal cycle, it makes an important contribution in certain seasons. The maximum MW oxygen content in the Arabian Sea is found during spring when the MWL is thickest, contributing a total of 0.030 ± 0.007 Tmol, which is 18 ± 6 % of the total upper-ocean content (Fig. 9a). Splitting the contribution between the northern and southern Arabian Sea, clear differences emerge. In the northern Arabian Sea, the maximum contribution peaks at 40 ± 17 % of the oxygen content in the upper 250 m (Fig. 9a, d), highlighting again the importance of the presence of MW in the northern Arabian Sea in the biogeochemistry of the region. In the southern Arabian Sea, during spring, the MW contribution is 15 ± 5 % due to its shorter duration and thinner MWL (Figs. 3, 7b, and 9a, d). In the northern Arabian Sea, due to their prolonged presence, MWs contribute up to 11 % of the oxygen content in summer (Fig. 9e), even when surface stratification is strongest, and the oxygen in the MW is completely isolated from air–sea fluxes. After the summer monsoon, MWs formed in the southern Arabian Sea are the primary contributors to oxygen content (8 ± 3 % in the northern Arabian Sea and 9 ± 3 % in the southern Arabian Sea; Fig. 9f). The remnant MWL in the northern Arabian Sea contributes 2 ± 1 % (Fig. 9f). These results showcase the importance of MW in subsurface oxygen content in a region where the anoxic waters (upper oxycline of the Arabian Sea OMZ) are close to the surface.
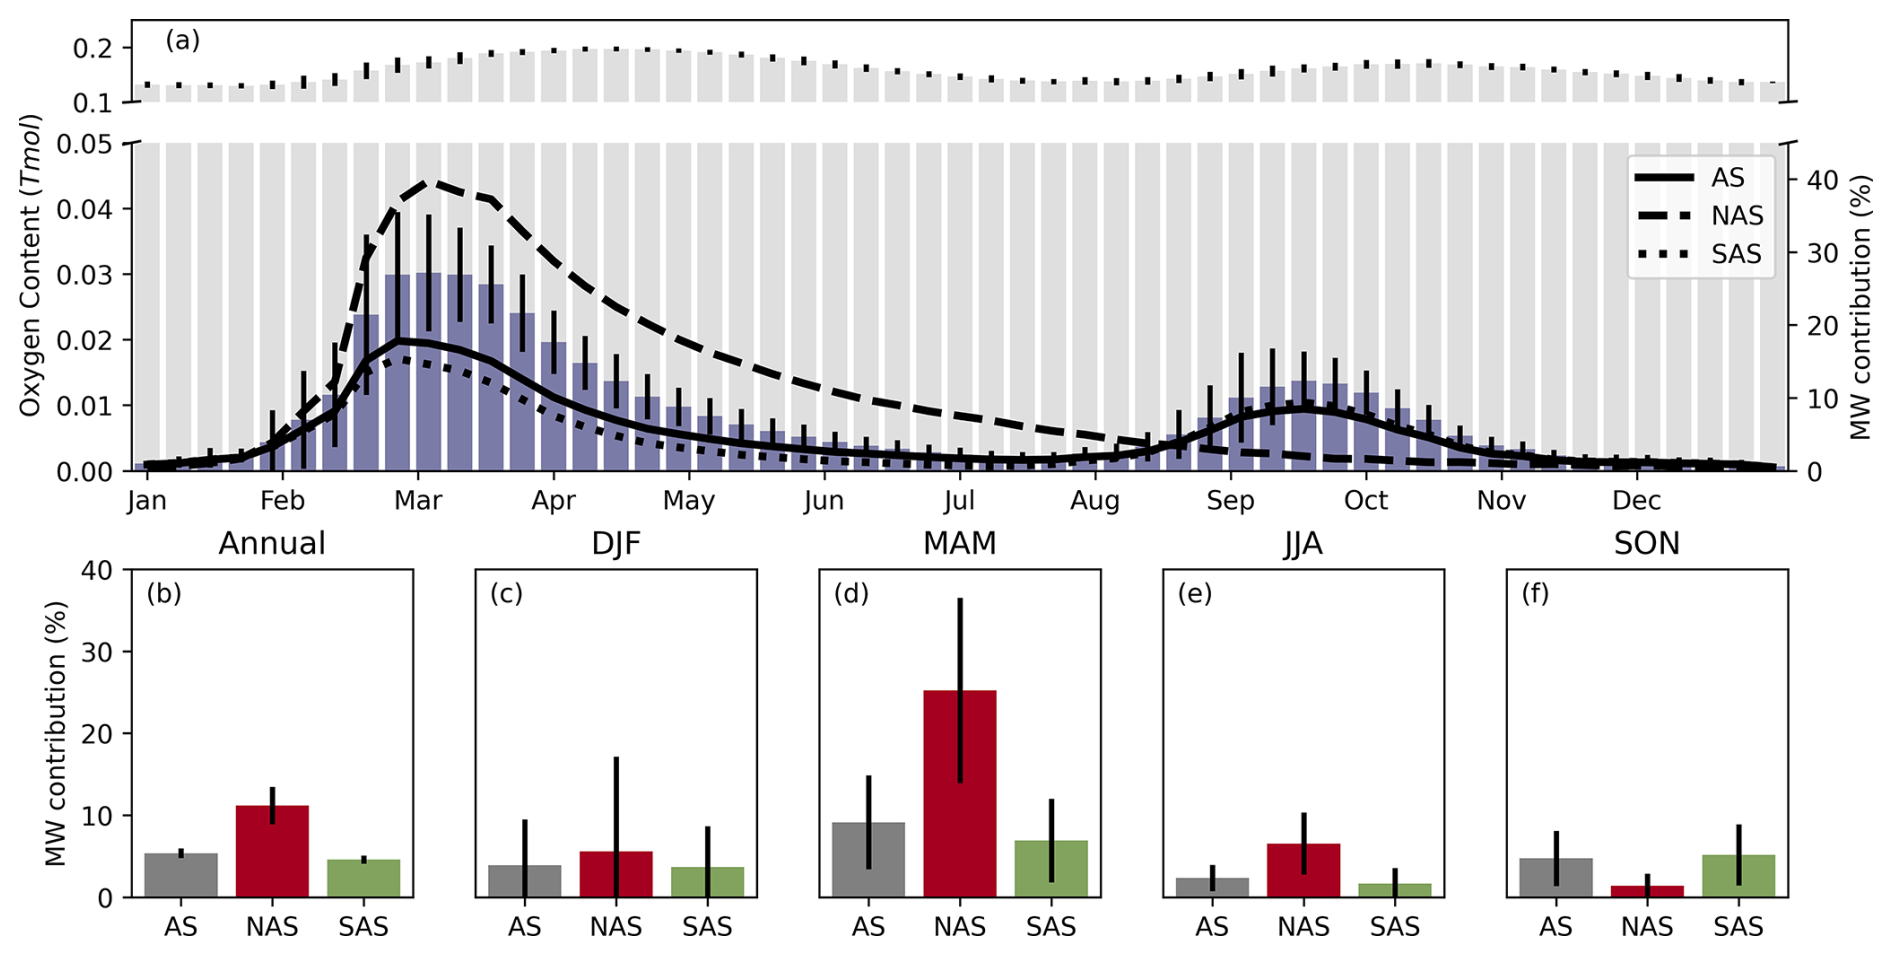
Figure 9Mode water contribution to the subsurface oxygen content of the Arabian Sea. (a) Climatological average of the oxygen content below the surface mixed layer and up to 250 m in the Arabian Sea (grey bars), together with the contribution of the MWL (blue bars) from the 3D MOM4p1–TOPAZ. The vertical bars show the standard deviation across the basin. The lines depict the percentage of the contribution of MW to the total upper-ocean oxygen content – excluding the surface mixed layer – for the Arabian Sea (solid line), northern Arabian Sea (dashed line), and southern Arabian Sea (dotted line). (b) Annual and (c–f) seasonal MW contributions to the oxygen content below the surface mixed layer for the Arabian Sea (grey), northern Arabian Sea (red), and southern Arabian Sea (green).
We acknowledge that these estimates above may overestimate the actual contribution, due to the overestimation of MWT in the model (annual average 10 % thicker than that observed). Nevertheless, this provides a valuable characterization of this water mass's importance in the Arabian Sea. The MWs in the upper Arabian Sea sit just above the OMZ oxycline, leading to an exchange flux between the MWL and the interior, which remains unresolved by current observational or modelling approaches, to the best of our knowledge.
5.1 Annual cycle of mode water
Observational data support the biannual subduction patterns expected in a monsoon-dominated ocean basin like the Arabian Sea (Liu et al., 2018). MW forms when surface buoyancy gains during low winds cap the deep, dense mixed layer waters beneath a surface stratified layer (Fig. 4). In the northern Arabian Sea, this process occurs once a year during winter when peak annual winds occur, whereas in the southern Arabian Sea they can occur twice a year following the monsoons (Figs. 1 and 4). Liu et al. (2018) highlighted vertical pumping as the primary driver of subduction, with advection playing a secondary role. In this study, we build on the body of literature by characterizing the water mass formed through this process and determining the regional forces and mechanisms that modify MW formation and erosion. This work emphasizes that the formation of MW is not limited to the northern Arabian Sea, nor is it restricted to the winter season.
The ASHSW has been studied extensively as the primary MW formed in the Arabian Sea (Shenoi et al., 1993). The MW formed during the winter monsoon in the northern Arabian Sea aligns well with the characteristics of ASHSW described in previous studies, using our climatological dataset (density range of 24–25 kg m−3, with temperature and salinity ranges of 28–24 °C and 36.7–35.3 g kg−1; Kumar and Prasad, 1999; Fig. 2). Prasad and Ikeda (2002b) describe how turbulent heat loss is responsible for the deep penetration of MLD and the convective formation of ASHSW during winter. They argue that weaker winds, strong near-surface stratification, and weaker shear stress during the transition periods (March–May to October) account for a shallow mixed layer that caps ASHSW. We expand this body of literature by showing the formation of MW also during summer in the southern Arabian Sea, highlighting the importance of the interaction between buoyancy fluxes and winds in the life cycle of this water mass (Fig. 4). Moreover, ASHSW is advected equatorward (Kumar and Prasad, 1999; Morrison, 1997; Prasad and Ikeda, 2002a) along the 24 kg m−3 isopycnal surface as a subsurface salinity maximum (Chowdary et al., 2005; Han and McCreary, 2001; Prasad and Ikeda, 2002a). While our climatological dataset does not allow us to determine the advective component towards the south, we can confirm that MW formation also occurs in the southern Arabian Sea following the winter monsoon, with MW with a density of 24 kg m−3 (Fig. 2). Therefore, the subduction of properties occurs not only via the ASHSW in the north and its advection southward but also through direct local subduction in the southern Arabian Sea.
We have shown how MLD misrepresentation results in the misrepresentation of MW thickness and formation timing (Figs. 6, 7, and 8). This emphasizes the importance of model representation of MLD. MLD is influenced by an interplay between surface buoyancy fluxes, winds, and upper-ocean stratification due to circulation. Accurate representation of circulation and heat penetration is crucial for the proper simulation of the MLD and MW life cycles in the Arabian Sea (Figs. 6 and 7). We show that monsoonal circulation is essential, as the advection of low-salinity water by the West Indian Coastal Current (October–May) acts as a stratification barrier, resulting in shallower and thinner MWLs. Without this freshwater-driven stratification, deeper mixed layers and the formation of denser waters would likely occur (Shankar et al., 2016). Moreover, freshwater stratification in the EAS has significant implications for the biogeochemistry of the region. Its presence enhances stratification and nutrient availability but results in thinner MWLs, reducing the buffer capacity for remineralization within the MW. Consequently, this increases nutrient export to the OMZ and decreases physical ventilation due to stronger stratification. Moreover, we suggest a significant role of biological heat absorption in resolving upper-ocean stratification and MW formation accurately (Fig. 8), as highlighted by Babu et al. (2004) for the MLD. Additionally, it has been shown that, in the northern Arabian Sea, mesoscale and sub-mesoscale eddies and frontal structures are present during the winter and can alter stratification and modulate convective mixing (Font et al., 2022; Thoppil, 2024). We hypothesize that, similar to other regions, these eddies may trap MW, preserving its properties and prolonging the presence of this buffer layer (e.g. Karleskind et al., 2011; Shi et al., 2018; Xu et al., 2016). Therefore, further investigation into how eddies and small-scale frontal structures in the Arabian Sea influence MW properties, as well as their impact on the ecosystem, is essential. High-resolution eddy-resolving models and targeted high-resolution observations are needed to assess their effects on stratification, MW formation, and the length of MW presence until full erosion.
5.2 Implications of mode water for heat and oxygen fluxes in the Arabian Sea
The MWL acts as a barrier between the atmosphere and the interior, impacting the Arabian Sea stratification and mixing processes and thus modulating the heat and oxygen exchange. We argue that MW's presence can store heat below warm surface mixed layers. The MWL does provide a buffer of warmer waters compared to the interior. Therefore, the cooling potential of entrainment is reduced with this barrier layer. MW's presence could maintain the Arabian Sea warm pool by effectively inhibiting the vertical mixing of the upper ocean with deeper, cooler waters. This process was previously described regarding barrier layers formed by freshwater advection from the Bay of Bengal in the south-eastern Arabian Sea (Echols and Riser, 2020; Li et al., 2023), contributing to the genesis of surface-intensified marine heat waves (Saranya et al., 2022). Moreover, the interaction between freshwater Bay of Bengal barrier layers and MW is crucial and warrants further investigation. The extent to which barrier layers influence MW away from the coast remains uncertain, highlighting the need for targeted studies to better understand its geographical constraints and impacts.
Mode waters, both locally and formed remotely (e.g. Subtropical Underwater, Indian Central Water, and Subantarctic Mode Water) influence the oxygen distribution in the Indian Ocean (Ditkovsky et al., 2023). Here, we focus specifically on the locally formed Arabian Sea Mode Water and its potential impacts on regional oxygen dynamics. MW sits on top of the upper oxycline of the Arabian Sea OMZ. The presence of the MWL acts to limit the transfer of kinetic energy from the atmosphere to the oxycline, reducing ventilation; at the same time, it provides an oxic layer for remineralization of organic matter, thereby diminishing the biological oxygen demand deeper in the OMZ (Weber and Bianchi, 2020). As such, MW reduces the coupling of the OMZ to surface processes driving oxygen supply to or demand in the OMZ. We show that MW, whether its subduction is seasonal or long-term (Liu et al., 2018; Zhou et al., 2023), has great importance and seasonality in the upper-ocean oxygen content in the region, and thus its presence is inarguably crucial regarding changes in the boundaries of the OMZ (Fig. 9). We hypothesize that MW acts as a more important oxygen reservoir in the northern Arabian Sea than in the southern Arabian Sea and specifically in the Sea of Oman (Figs. 3p and 9), where its volume and residence time are largest and thus provide more time and volume for remineralization of sinking matter to occur. The extended presence of MW in the SoO suggests that it can be an especially important layer for sustaining remineralization, thereby reducing the biological oxygen demand in the core of the OMZ and providing oxygen locally to the upper OMZ via diapycnal processes across the oxycline. Various processes that mix and stratify capped surface waters need to be explored further, such as sub-mesoscale fronts within the MWL, eddies, topographical interactions, internal waves, and biophysical interactions. The timescales over which this oxygen dissipates into the ocean's interior or is remineralized remain unexplored. Further work is needed to study the fate of oxygen in the MWL for high-resolution and ecosystem impacts.
Ditkovsky et al. (2023) showed strong trends of deoxygenation for the boundaries of the OMZ. Increases in stratification inhibit local ventilation and promote deoxygenation (Schmidtko et al., 2017), yet other studies have suggested that increases in stratification will cause a reduction in productivity and ultimately lead to a decrease in dissolved oxygen consumption by respiration (Bopp et al., 2013; Kwiatkowski et al., 2020). MW can be relatively important in driving trends of the boundary of the OMZ that present strong deoxygenation from both biogeochemical buffering of respiration and direct physical oxygen supply. Thus, we believe that accurate representation of MWs in climate models is crucial due to their importance in both physics and biology and their fine interplay. These require further modelling and observation with targeted studies quantifying vertical fluxes of oxygen, carbon, and nutrients in the OMZ and through the MWL.
5.3 The future of mode water in the Arabian Sea
Climate change is expected to modify upper-ocean stratification and thus MW characteristics as well as MW's impact on the broader ecosystem. In recent decades, SST, stratification, and upper-ocean heat content have shown increasing trends indicating that the Arabian Sea has been warming and that the stratification has strengthened (Albert et al., 2023; Mohan et al., 2021; Nisha et al., 2024), with clear warming trends in all water masses in the Arabian Sea (Shee et al., 2023). These changes have a direct impact on the broader ecosystem, with for instance a net primary productivity decrease in the Arabian Sea in recent decades (Maishal, 2024). Interannual and climate variability (e.g. the Indian Ocean Dipole) in atmospheric forcing and ocean circulation are expected to affect the formation, erosion, and characteristics of MW. The changes in the MW life cycle at these timescales warrant further investigation. Moreover, over multidecadal timescales, the weakening of the monsoonal winds over the Arabian Sea as well as changes in the precipitation rates are predicted to continue (Cheng et al., 2025; Luo et al., 2024; Parvathi et al., 2017). We have demonstrated that the MW life cycle and thickness are very sensitive to the previously mentioned atmospheric forcing, i.e. heat and freshwater fluxes and wind intensity (Fig. 4). Weakening of winds has been shown to reduce winter mixed layer deepening in the northern Arabian Sea and hence cause less oceanic productivity (Lachkar et al., 2018; Parvathi et al., 2017). As for the close relationship between MLD, MWT, and their presence, we hypothesize that the weakening of winter convective mixing will result in a thinner MWL and less buffering capability for remineralization. Moreover, freshening of surface waters due to increased precipitation is anticipated (Sharma et al., 2023), which will likely lead to changes in upper-ocean stratification and subsequently affect MW formation – we have shown how salinity can change MW volume. There is a wind versus buoyancy flux balance that defines the latitudinal bimodality in the monsoonal formation of MW. With climate change and the associated changes in buoyancy fluxes and wind mixing, the annual-to-biannual latitudinal boundary is going to shift. Moreover, we showed the close interaction between buoyancy and winds in setting up the formation of MW during the summer monsoon. If the ratio changes between these forcings, this could result in fast blocking of subduction in the south. These changes have undeniable importance in the Arabian Sea's physical and biogeochemical functioning. For instance, changes in the subduction capacity of MW could directly influence ventilation from one to two MWLs annually and could have big implications for instance for the depth of the upper oxycline of the OMZ or the southern extent of the OMZ. Thus, we must investigate the response of Arabian Sea MW and its impacts on the region's physics and biogeochemistry in future climate scenarios.
In the Arabian Sea, MW formation is first driven by atmospheric forcing and monsoons, while the regional variability is influenced by circulation patterns and the spatial distribution of the monsoon. MW formation occurs in two distinct temporal modes with yearly production in the northern Arabian Sea and biannually in the southern Arabian Sea, following the summer and winter monsoons. MWL characteristics are, at first order, determined by buoyancy and wind mixing processes. Heat loss during the winter monsoon forms deep mixed layers in the Arabian Sea that are capped by the formation of a shallow stratified layer when the ocean gains buoyancy after the winter monsoon. This water layer erodes over time and has the potential to mix its properties with the ocean interior. During the summer monsoon, buoyancy loss and strong winds from deep mixed layers in the southern Arabian Sea are also capped when winds reduce and surface heating stratifies the upper ocean.
Regionally, the MW life cycle is influenced by the advection of water masses that change the stratification of the upper ocean. For instance, in the eastern Arabian Sea, the advection of freshwater-driven stratification from the Bay of Bengal by the West Indian Coastal Current can limit the depth of surface mixed layers and thus pre-condition the MW formation and characteristics. Another factor that determines the MWL is the seasonal cycle of optical properties of the water, with the most important ones being those in the southern Arabian Sea, where in summer biological heating determines the depth of the summer surface mixed layers preceding the formation of MW. We highlight the importance of accurately resolving the surface mixed layer (e.g. biological heating or advection) for a good representation of the MWL. The observed annual maximum volume of MW is 6.3 × 10¹³ m3, with greater importance for upper-ocean volume and oxygen content in the northern Arabian Sea due to a thicker MWL and a longer duration of its presence. We estimate the contribution of MW to the oxygen content of the upper ocean to be 5 ± 1 % in the Arabian Sea, but due to its intermittent presence driven by the seasonal cycle, the MW contribution in certain periods peaks at 40 ± 17 % of the oxygen content of the upper 250 m in the northern Arabian Sea during spring. Our results highlight the importance of MW as a barrier layer for the physics and biogeochemistry of the Arabian Sea.
The software associated with this paper is publicly available (https://doi.org/10.5281/zenodo.15834677, Font, 2025).
The Argo data used in this study are available from the Argo international programme and the national programmes contributing to it for the domain 40–80° E, −5–30° N and between 2000 and 2023 (https://doi.org/10.17882/42182, Argo, 2023). The MOM4p1–TOPAZ potential temperature, salinity, and oxygen data used in this study for the upper 250 m and domain 35–80° E, 0–30° N are available from Zenodo (https://doi.org/10.5281/zenodo.14770956, Font and Vinaychandran, 2025). The bathymetry data are available from the GEBCO Compilation Group (https://doi.org/10.5285/f98b053b-0cbc-6c23-e053-6c86abc0af7b, GEBCO, 2023).
The supplement related to this article is available online at https://doi.org/10.5194/os-21-1349-2025-supplement.
EF, BYQ, and SS conceptualized the study. EF performed the data curation and formal analysis and wrote the manuscript draft. BYQ, SS, and PNV reviewed and edited the manuscript.
The contact author has declared that none of the authors has any competing interests.
Publisher’s note: Copernicus Publications remains neutral with regard to jurisdictional claims made in the text, published maps, institutional affiliations, or any other geographical representation in this paper. While Copernicus Publications makes every effort to include appropriate place names, the final responsibility lies with the authors.
The MOM4p1–TOPAZ runs were carried out on the Param Pravega supercomputer at SERC, Indian Institute of Science, Bengaluru. Thanks go to GFDL for providing the source code of the coupled physical–ecosystem model (MOM4p1–TOPAZ). The authors thank Neema C. P. for subsetting the MOM4p1–TOPAZ dataset.
Estel Font and Bastien Y. Queste are supported by ONR GLOBAL grant no. N62909-21-1-2008 and Formas grant no. 2022-01536. Estel Font and Sebastiaan Swart are supported by a Wallenberg Academy Fellowship (WAF, grant no. 2015.0186) and the Swedish Research Council (VR, grant no. 2019-04400). Sebastiaan Swart has received funding from the European Union's Horizon Europe ERC Synergy Grant programme under grant no. 101118693 (WHIRLS). Puthenveettil Narayana Vinayachandran received support from the BRICS-PARADIGM project, Department of Science and Technology, Government of India.
This paper was edited by Anne Marie Treguier and reviewed by Xavier Carton, Sam J. Ditkovsky, and one anonymous referee.
Acharya, S. S. and Panigrahi, M. K.: Eastward shift and maintenance of Arabian Sea oxygen minimum zone: Understanding the paradox, Deep-Sea Res. Pt. I, 115, 240–252, https://doi.org/10.1016/j.dsr.2016.07.004, 2016.
Albert, J., Gulakaram, V. S., Vissa, N. K., Bhaskaran, P. K., and Dash, M. K.: Recent warming trends in the Arabian Sea: Causative factors and physical mechanisms, Climate, 11, 35, https://doi.org/10.3390/CLI11020035, 2023.
Argo: Argo float data and metadata from Global Data Assembly Centre (Argo GDAC), SEANOE [data set], https://doi.org/10.17882/42182, 2023.
Babu, K. N., Sharma, R., Agarwal, N., Agarwal, V. K., Weller, R. A., and Babu, C.: Study of the mixed layer depth variations within the north Indian Ocean using a 1-D model, J. Geophys. Res.-Oceans, 109, 8016, https://doi.org/10.1029/2003JC002024, 2004.
Beal, L. M., Hormann, V., Lumpkin, R., and Foltz, G. R.: The response of the surface circulation of the Arabian Sea to monsoonal forcing, J. Phys. Oceanogr., 43, 2008–2022, https://doi.org/10.1175/JPO-D-13-033.1, 2013.
Behara, A. and Vinayachandran, P. N.: An OGCM study of the impact of rain and river water forcing on the Bay of Bengal, J. Geophys. Res.-Oceans, 121, 2425–2446, https://doi.org/10.1002/2015JC011325, 2016.
Burchard, H., Bolding, K., and Villarreal, M. R.: GOTM, a General Ocean Turbulence Model: Theory, implementation and test cases, Tech. Rep. EUR 18745, p. 103, European Commission, https://op.europa.eu/en/publication-detail/-/publication/5b512e12-367d-11ea-ba6e-01aa75ed71a1 (last access: 10 March 2025), 1999.
Bushinsky, S. M. and Cerovečki, I.: Subantarctic Mode Water biogeochemical formation properties and interannual variability, AGU Adv., 4, e2022AV000722, https://doi.org/10.1029/2022AV000722, 2023.
Bopp, L., Resplandy, L., Orr, J. C., Doney, S. C., Dunne, J. P., Gehlen, M., Halloran, P., Heinze, C., Ilyina, T., Séférian, R., Tjiputra, J., and Vichi, M.: Multiple stressors of ocean ecosystems in the 21st century: projections with CMIP5 models, Biogeosciences, 10, 6225–6245, https://doi.org/10.5194/bg-10-6225-2013, 2013.
Chaichitehrani, N. and Allahdadi, M. N.: Overview of wind climatology for the Gulf of Oman and the northern Arabian Sea, Am. J. Fluid Dyn., 8, 1–9, http://article.sapub.org/10.5923.j.ajfd.20180801.01.html (last access: 10 March 2025), 2018
Chatterjee, A., Shankar, D., Shenoi, S. S. C., Reddy, G. V., Michael, G. S., Ravichandran, M., Gopalkrishna, V. V., Rao, E. P. R., Bhaskar, T. V. S. U., and Sanjeevan, V. N.: A new atlas of temperature and salinity for the North Indian Ocean, J. Earth Syst. Sci., 121, 559–593, https://doi.org/10.1007/s12040-012-0191-9, 2012.
Cheng, Y., Wang, L., Chen, X., Zhou, T., and Turner, A.: A shorter duration of the Indian summer monsoon in constrained projections, Geophys. Res. Lett., 52, e2024GL112848, https://doi.org/10.1029/2024GL112848, 2025.
Chowdary, J. S., Gnanaseelan, C., Thompson, B., and Salvekar, P. S.: Water mass properties and transports in the Arabian Sea from Argo observations, Atmos. Ocean Sci., 10, 235–260, https://doi.org/10.1080/17417530600752825, 2005.
Dall'Olmo, G., Dingle, J., Polimene, L., Brewin, R. J. W., and Claustre, H.: Substantial energy input to the mesopelagic ecosystem from the seasonal mixed-layer pump, Nat. Geosci., 9, 820–823, https://doi.org/10.1038/ngeo2818, 2016.
Dee, D. P., Uppala, S. M., Simmons, A. J., Berrisford, P., Poli, P., Kobayashi, S., Andrae, U., Balmaseda, M. A., Balsamo, G., Bauer, P., Bechtold, P., Beljaars, A. C. M., van de Berg, L., Bidlot, J., Bormann, N., Delsol, C., Dragani, R., Fuentes, M., Geer, A. J., Haimberger, L., Healy, S. B., Hersbach, H., Hólm, E. V., Isaksen, L., Kållberg, P., Köhler, M., Matricardi, M., McNally, A. P., Monge-Sanz, B. M., Morcrette, J.-J., Park, B.-K., Peubey, C., de Rosnay, P., Tavolato, C., Thépaut, J.-N., and Vitart, F.: The ERA-Interim reanalysis: Configuration and performance of the data assimilation system, Q. J. Roy. Meteor. Soc., 137, 553–597, https://doi.org/10.1002/qj.828, 2011.
de Marez, C., L'Hégaret, P., Morvan, M., and Carton, X.: On the 3D structure of eddies in the Arabian Sea, Deep-Sea Res. Pt. I, 150, 103057, https://doi.org/10.1016/j.dsr.2019.06.003, 2019.
Ditkovsky, S., Resplandy, L., and Busecke, J.: Unique ocean circulation pathways reshape the Indian Ocean oxygen minimum zone with warming, Biogeosciences, 20, 4711–4736, https://doi.org/10.5194/bg-20-4711-2023, 2023.
Dunne, J. P., Gnanadesikan, A., Sarmiento, J. L., and Slater, R. D.: Technical description of the prototype version (v0) of tracers of phytoplankton with allometric zooplankton (TOPAZ) ocean biogeochemical model as used in the Princeton IFMIP model, Technical report, https://bg.copernicus.org/articles/7/3593/2010/bg-7-3593-2010-supplement.pdf (last access: 10 March 2025), 2010.
Echols, R. and Riser, S. C.: The impact of barrier layers on Arabian Sea surface temperature variability, Geophys. Res. Lett., 47, e2019GL085290, https://doi.org/10.1029/2019GL085290, 2020.
Feucher, C., Maze, G., and Mercier, H.: Subtropical Mode Water and permanent pycnocline properties in the world ocean, J. Geophys. Res.-Oceans, 124, 1139–1154, https://doi.org/10.1029/2018JC014526, 2019.
Font, E.: EstelFont/Mode_Water_Arabian_Sea: v1.0.0, Zenodo [code], https://doi.org/10.5281/zenodo.15834677, 2025.
Font, E. and Vinaychandran, P. N.: MOM4p1-TOPAZ data used in the manuscript entitled “On Mode Water formation and erosion in the Arabian Sea: Forcing mechanisms, regionality, and seasonality” (v1.0), Zenodo [data set], https://doi.org/10.5281/zenodo.14770956, 2025.
Font, E., Queste, B. Y., and Swart, S.: Seasonal to intraseasonal variability of the upper ocean mixed layer in the Gulf of Oman, J. Geophys. Res.-Oceans, 127, e2021JC018045, https://doi.org/10.1029/2021JC018045, 2022.
Gaillard, F., Autret, E., Thierry, V., Galaup, P., Coatanoan, C., and Loubrieu, T.: Quality control of large Argo datasets, J. Atmos. Ocean. Tech., 26, 337–351, https://doi.org/10.1175/2008JTECHO552.1, 2009.
Gao, Z., Long, S. M., Shi, J. R., Cheng, L., Li, G., and Ying, J.: Indian Ocean mixed layer depth changes under global warming, Front. Clim., 5, 1112713, https://doi.org/10.3389/fclim.2023.1112713, 2023.
GEBCO Compilation Group: GEBCO 2023 Grid, NERC EDS British Oceanographic Data Centre NOC [data set], https://doi.org/10.5285/f98b053b-0cbc-6c23-e053-6c86abc0af7b, 2023.
Griffies, S. M. and Hallberg, R. W.: Biharmonic Friction with a Smagorinsky-Like Viscosity for Use in Large-Scale Eddy-Permitting Ocean Models, Mon. Weather Rev., 128, 2935–2946, https://doi.org/10.1175/1520-0493(2000)128<2935:BFWASL>2.0.CO;2, 2000.
Griffies, S. M., Harrison, M. J., Pacanowski, R. C., and Rosati, A.: A technical guide to MOM4, GFDL Ocean Group Technical Report No. 5, NOAA/Geophysical Fluid Dynamics Laboratory, Version prepared on 23 August 2004, https://www.gfdl.noaa.gov (last access: 10 March 2025), 2003.
Han, W. and McCreary, J. P.: Modeling salinity distributions in the Indian Ocean, J. Geophys. Res.-Oceans, 106, 859–877, https://doi.org/10.1029/2000JC000316, 2001.
Hanawa, K. and Talley, L. D.: Chapter 5.4 Mode waters, Int. Geophys., 77, 373–386, https://doi.org/10.1016/S0074-6142(01)80129-7, 2001.
Hersbach, H., Bell, B., Berrisford, P., Hirahara, S., Horányi, A., Muñoz-Sabater, J., Nicolas, J., Peubey, C., Radu, R., Schepers, D., Simmons, A., Soci, C., Abdalla, S., Abellan, X., Balsamo, G., Bechtold, P., Biavati, G., Bidlot, J., Bonavita, M., De Chiara, G., Dahlgren, P., Dee, D., Diamantakis, M., Dragani, R., Flemming, J., Forbes, R., Fuentes, M., Geer, A., Haimberger, L., Healy, S., Hogan, R. J., Hólm, E., Janisková, M., Keeley, S., Laloyaux, P., Lopez, P., Lupu, C., Radnoti, G., de Rosnay, P., Rozum, I., Vamborg, F., Villaume, S., and Thépaut, J. N.: The ERA5 global reanalysis, Q. J. Roy. Meteor. Soc., 146, 1999–2049, https://doi.org/10.1002/qj.3803, 2020.
Hooker, S. B. and Esaias, W. E.: An overview of the SeaWiFS Project, Eos Trans. Am. Geophys. Union, 74, 241–246, https://doi.org/10.1029/93EO00945, 1993.
Kalvelage, T., Lavik, G., Jensen, M. M., Revsbech, N. P., Löscher, C., Schunck, H., Desai, D. K., Hauss, H., Kiko, R., Holtappels, M., LaRoche, J., Schmitz, R. A., Graco, M. I., and Kuypers, M. M. M.: Aerobic microbial respiration in oceanic oxygen minimum zones, PLoS ONE, 10, e0133526, https://doi.org/10.1371/journal.pone.0133526, 2015.
Karleskind, P., Lévy, M., and Mémery, L.: Modifications of mode water properties by sub-mesoscales in a bio-physical model of the Northeast Atlantic, Ocean Model., 39, 47–60, https://doi.org/10.1016/j.ocemod.2010.12.003, 2011.
Kumar, S. P. and Prasad, T. G.: Formation and spreading of Arabian Sea high-salinity water mass, J. Geophys. Res.-Oceans, 104, 1455–1464, https://doi.org/10.1029/1998JC900022, 1999.
Kurian, J. and Vinayachandran, P. N.: Formation mechanisms of temperature inversions in the southeastern Arabian Sea, Geophys. Res. Lett., 33, L17611, https://doi.org/10.1029/2006GL027280, 2006.
Kurian, J. and Vinayachandran, P. N.: Mechanisms of formation of the Arabian Sea mini warm pool in a high-resolution ocean general circulation model, J. Geophys. Res.-Oceans, 112, C05009, https://doi.org/10.1029/2006JC003631, 2007.
Kwiatkowski, L., Torres, O., Bopp, L., Aumont, O., Chamberlain, M., Christian, J. R., Dunne, J. P., Gehlen, M., Ilyina, T., John, J. G., Lenton, A., Li, H., Lovenduski, N. S., Orr, J. C., Palmieri, J., Santana-Falcón, Y., Schwinger, J., Séférian, R., Stock, C. A., Tagliabue, A., Takano, Y., Tjiputra, J., Toyama, K., Tsujino, H., Watanabe, M., Yamamoto, A., Yool, A., and Ziehn, T.: Twenty-first century ocean warming, acidification, deoxygenation, and upper-ocean nutrient and primary production decline from CMIP6 model projections, Biogeosciences, 17, 3439–3470, https://doi.org/10.5194/bg-17-3439-2020, 2020.
Lachkar, Z., Lévy, M., and Smith, S.: Intensification and deepening of the Arabian Sea oxygen minimum zone in response to increase in Indian monsoon wind intensity, Biogeosciences, 15, 159–186, https://doi.org/10.5194/bg-15-159-2018, 2018.
Lachkar, Z., Mehari, M., Al Azhar, M., Lévy, M., and Smith, S.: Fast local warming is the main driver of recent deoxygenation in the northern Arabian Sea, Biogeosciences, 18, 5831–5849, https://doi.org/10.5194/bg-18-5831-2021, 2021.
Lacour, L., Llort, J., Briggs, N., Strutton, P. G., and Boyd, P. W.: Seasonality of downward carbon export in the Pacific Southern Ocean revealed by multi-year robotic observations, Nat. Commun., 14, 1278, https://doi.org/10.1038/s41467-023-36954-7, 2023.
Large, W. G., McWilliams, J. C., and Doney, S. C.: Oceanic vertical mixing: A review and a model with a nonlocal boundary layer parameterization, Rev. Geophys., 32, 363–403, https://doi.org/10.1029/94RG01872, 1994.
Lee, C. M., Jones, B. H., Brink, K. H., and Fischer, A. S.: The upper-ocean response to monsoonal forcing in the Arabian Sea: Seasonal and spatial variability, Deep-Sea Res. Pt. II, 47, 1177–1226, https://doi.org/10.1016/S0967-0645(99)00141-1, 2000.
L'Hégaret, P., Lacour, L., Carton, X., Roullet, G., Baraille, R., and Corréard, S.: A seasonal dipolar eddy near Ras Al Hamra (Sea of Oman), Ocean Dynam., 63, 633–659, https://doi.org/10.1007/s10236-013-0616-2, 2013.
Li, N., Zhu, X., Wang, H., Zhang, S., and Wang, X.: Intraseasonal and interannual variability of sea temperature in the Arabian Sea Warm Pool, Ocean Sci., 19, 1437–1451, https://doi.org/10.5194/os-19-1437-2023, 2023.
Li, Q., Webb, A., Fox-Kemper, B., Craig, A., Danabasoglu, G., Large, W. G., and Vertenstein, M.: Langmuir mixing effects on global climate: WAVEWATCH III in CESM, Ocean Model., 103, 145–160, https://doi.org/10.1016/j.ocemod.2015.07.020, 2016.
Li, Q., Bruggeman, J., Burchard, H., Klingbeil, K., Umlauf, L., and Bolding, K.: Integrating CVMix into GOTM (v6.0): a consistent framework for testing, comparing, and applying ocean mixing schemes, Geosci. Model Dev., 14, 4261–4282, https://doi.org/10.5194/gmd-14-4261-2021, 2021.
Li, Z., England, M. H., and Groeskamp, S.: Recent acceleration in global ocean heat accumulation by mode and intermediate waters, Nat. Commun., 14, 1–14, https://doi.org/10.1038/s41467-023-42468-z, 2023.
Liu, L., Huang, R. X., and Wang, F.: Ventilation of a monsoon-dominated ocean: Subduction and obduction in the North Indian Ocean, J. Geophys. Res.-Oceans, 123, 4449–4463, https://doi.org/10.1029/2017JC013719, 2018.
Luo, H., Wang, Z., He, C., Chen, D., and Yang, S.: Future changes in South Asian summer monsoon circulation under global warming: Role of the Tibetan Plateau latent heating, NPJ Clim. Atmos. Sci., 7, 1–9, https://doi.org/10.1038/s41612-024-00653-x, 2024.
Maishal, S.: Unraveling the declining Indian ocean primary productivity and key drivers, Discov. Oceans, 1, 1–18, https://doi.org/10.1007/S44289-024-00018-5, 2024.
McCreary, J. P., Kundu, P. K., and Molinari, R. L.: A numerical investigation of dynamics, thermodynamics and mixed-layer processes in the Indian Ocean, Prog. Oceanogr., 31, 181–244, https://doi.org/10.1016/0079-6611(93)90002-U, 1993.
McCreary, J. P., Yu, Z., Hood, R. R., Vinayachandran, P. N., Furue, R., Ishida, A., and Richards, K. J.: Dynamics of the Indian-Ocean oxygen minimum zones, Prog. Oceanogr., 112–113, 15–37, https://doi.org/10.1016/j.pocean.2013.03.002, 2013.
Mohan, S., Mishra, S. K., Sahany, S., and Behera, S.: Long-term variability of sea surface temperature in the tropical Indian Ocean in relation to climate change and variability, Global Planet. Change, 199, 103436, https://doi.org/10.1016/j.gloplacha.2021.103436, 2021.
Montégut, C. de B., Madec, G., Fischer, A. S., Lazar, A., and Iudicone, D.: Mixed layer depth over the global ocean: An examination of profile data and a profile-based climatology, J. Geophys. Res.-Oceans, 109, C12003, https://doi.org/10.1029/2004JC002378, 2004.
Morel, A. and Antoine, D.: Heating rate within the upper ocean in relation to its bio–optical state, J. Phys. Oceanogr., 24, 1652–1665, https://doi.org/10.1175/1520-0485(1994)024<1652:HRWTUO>2.0.CO;2, 1994.
Morrison, J. M.: Inter-monsoonal changes in the T–S properties of the near-surface waters of the Northern Arabian Sea, Geophys. Res. Lett., 24, 2553–2556, https://doi.org/10.1029/97GL01876, 1997.
Niiler, P. and Kraus, E.: One-dimensional models of the upper ocean, in: Modeling and Prediction of the Upper Layers of the Ocean, Adv. Study Inst., Urbino, ltaly, 1975, Pergamon Press, Oxford, 143–172, 1977.
Nisha, P. G., Pranesha, T. S., Vidya, P. J., Ravichandran, M., and Murtugudde, R.: Trend and interannual variability of the Arabian Sea heat content, J. Marine Syst., 242, 103935, https://doi.org/10.1016/j.jmarsys.2023.103935, 2024.
Park, J. Y., Kug, J. S., and Park, Y. G.: An exploratory modeling study on bio-physical processes associated with ENSO, Prog. Oceanogr., 124, 28–41, https://doi.org/10.1016/j.pocean.2014.03.013, 2014.
Parvathi, V., Suresh, I., Lengaigne, M., Izumo, T., and Vialard, J.: Robust projected weakening of winter monsoon winds over the Arabian Sea under climate change, Geophys. Res. Lett., 44, 9833–9843, https://doi.org/10.1002/2017GL075098, 2017.
Phillips, H. E., Tandon, A., Furue, R., Hood, R., Ummenhofer, C. C., Benthuysen, J. A., Menezes, V., Hu, S., Webber, B., Sanchez-Franks, A., Cherian, D., Shroyer, E., Feng, M., Wijesekera, H., Chatterjee, A., Yu, L., Hermes, J., Murtugudde, R., Tozuka, T., Su, D., Singh, A., Centurioni, L., Prakash, S., and Wiggert, J.: Progress in understanding of Indian Ocean circulation, variability, air–sea exchange, and impacts on biogeochemistry, Ocean Sci., 17, 1677–1751, https://doi.org/10.5194/os-17-1677-2021, 2021.
Portela, E., Kolodziejczyk, N., Vic, C., and Thierry, V.: Physical mechanisms driving oxygen subduction in the global ocean, Geophys. Res. Lett., 47, e2020GL089040, https://doi.org/10.1029/2020GL089040, 2020.
Pous, S. P.: Hydrology and circulation in the Strait of Hormuz and the Gulf of Oman – Results from the GOGP99 Experiment: 2. Gulf of Oman, J. Geophys. Res., 109, C12038, https://doi.org/10.1029/2003JC002146, 2004.
Prasad, T. G.: A comparison of mixed-layer dynamics between the Arabian Sea and Bay of Bengal: One-dimensional model results, J. Geophys. Res.-Oceans, 109, C03035, https://doi.org/10.1029/2003JC002000, 2004.
Prasad, T. G. and Ikeda, M.: A numerical study of the seasonal variability of Arabian Sea high-salinity water, J. Geophys. Res.-Oceans, 107, 18-1–18-14, https://doi.org/10.1029/2001JC001139, 2002a.
Prasad, T. G. and Ikeda, M.: The wintertime water mass formation in the northern Arabian Sea: A model study, J. Phys. Oceanogr., 32, 1028–1040, https://doi.org/10.1175/1520-0485(2002)032<1028:TWWMFI>2.0.CO;2, 2002b.
Prasanth, R., Vijith, V., Thushara, V., George, J. V., and Vinayachandran, P. N.: Processes governing the seasonality of vertical chlorophyll-a distribution in the central Arabian Sea: Bio-Argo observations and ecosystem model simulation, Deep-Sea Res. Pt. II, 183, 104926, https://doi.org/10.1016/j.dsr2.2021.104926, 2021.
Qing, S., Cui, T., Tang, J., Song, Q., Liu, R., and Bao, Y.: An optical water classification and quality control model (OC_QC model) for spectral diffuse attenuation coefficient, ISPRS J. Photogramm., 189, 255–271, https://doi.org/10.1016/j.isprsjprs.2022.05.006, 2022.
Rao, R. R., Molinari, R. L., and Festa, J. F.: Evolution of the climatological near-surface thermal structure of the tropical Indian Ocean. 1. Description of mean monthly mixed layer depth, and sea surface temperature, surface current, and surface meteorological fields, J. Geophys. Res., 94, 10801–10815, https://doi.org/10.1029/JC094IC08P10801, 1989.
Rixen, T., Cowie, G., Gaye, B., Goes, J., do Rosário Gomes, H., Hood, R. R., Lachkar, Z., Schmidt, H., Segschneider, J., and Singh, A.: Reviews and syntheses: Present, past, and future of the oxygen minimum zone in the northern Indian Ocean, Biogeosciences, 17, 6051–6080, https://doi.org/10.5194/bg-17-6051-2020, 2020.
Saranya, J. S., Roxy, M. K., Dasgupta, P., and Anand, A.: Genesis and trends in marine heatwaves over the tropical Indian Ocean and their interaction with the Indian summer monsoon, J. Geophys. Res.-Oceans, 127, e2021JC017427, https://doi.org/10.1029/2021JC017427, 2022.
Sasmal, S. K.: Optical classification of waters in the eastern Arabian Sea, J. Indian Soc. Remote, 25, 73–78, https://doi.org/10.1007/BF03025905, 1997.
Schmidtko, S., Stramma, L., and Visbeck, M.: Decline in global oceanic oxygen content during the past five decades, Nature, 542, 335–339, https://doi.org/10.1038/nature21399, 2017.
Shankar, D., Remya, R., Vinayachandran, P. N., Chatterjee, A., and Behera, A.: Inhibition of mixed-layer deepening during winter in the northeastern Arabian Sea by the West India Coastal Current, Clim. Dynam., 47, 1049–1072, https://doi.org/10.1007/s00382-015-2888-3, 2016.
Sharma, S., Ha, K. J., Yamaguchi, R., Rodgers, K. B., Timmermann, A., and Chung, E. S.: Future Indian Ocean warming patterns, Nat. Commun., 14, 1–11, https://doi.org/10.1038/s41467-023-37435-7, 2023.
Shee, A., Sil, S., and Gangopadhyay, A.: Recent changes in the upper oceanic water masses over the Indian Ocean using Argo data, Sci. Rep., 13, 1–14, https://doi.org/10.1038/s41598-023-47658-9, 2023.
Shenoi, S., Shetye, S., Gouveia, A., and Michael, G.: Salinity extrema in the Arabian Sea, University of Hamburg, Germany, 76, 37–49, http://drs.nio.org/drs/handle/2264/2901 (last accesss: 10 March 2025), 1993
Shi, F., Luo, Y., and Xu, L.: Volume and transport of eddy-trapped mode water south of the Kuroshio Extension, J. Geophys. Res.-Oceans, 123, 8749–8761, https://doi.org/10.1029/2018JC014176, 2018.
Singh, S., Valsala, V., Prajeesh, A. G., and Balasubramanian, S.: On the variability of Arabian Sea mixing and its energetics, J. Geophys. Res.-Oceans, 124, 7817–7836, https://doi.org/10.1029/2019JC015334, 2019.
Sun, C., Zhang, A., Jin, B., Wang, X., Zhang, X., and Zhang, L.: Seasonal variability of eddy kinetic energy in the north Indian Ocean, Front. Mar. Sci., 9, 1032699, https://doi.org/10.3389/fmars.2022.1032699, 2022.
Thoppil, P. G.: Mesoscale eddy modulation of winter convective mixing in the northern Arabian Sea, Deep-Sea Res. Pt. II, 216, 105397, https://doi.org/10.1016/j.dsr2.2024.105397, 2024.
Trott, C. B., Subrahmanyam, B., Chaigneau, A., and Roman-Stork, H. L.: Eddy-induced temperature and salinity variability in the Arabian Sea, Geophys. Res. Lett., 46, 2734–2742, https://doi.org/10.1029/2018GL081605, 2019.
Umlauf, L. and Burchard, H.: Second-order turbulence closure models for geophysical boundary layers: A review of recent work, Cont. Shelf Res., 25, 795–827, https://doi.org/10.1016/j.csr.2004.08.004, 2005.
Vijith, V., Vinayachandran, P. N., Thushara, V., Amol, P., Shankar, D., and Anil, A. C.: Consequences of inhibition of mixed-layer deepening by the West India Coastal Current for winter phytoplankton bloom in the northeastern Arabian Sea, J. Geophys. Res.-Oceans, 121, 6583–6603, https://doi.org/10.1002/2016JC012004, 2016.
Vinayachandran, P. N., Kurian, J., and Neema, C. P.: Indian Ocean response to anomalous conditions in 2006, Geophys. Res. Lett., 34, 15602, https://doi.org/10.1029/2007GL030194, 2007.
Weber, T. and Bianchi, D.: Efficient Particle Transfer to Depth in Oxygen Minimum Zones of the Pacific and Indian Oceans, Front. Earth Sci., 8, 567903, https://doi.org/10.3389/FEART.2020.00376, 2020.
Wiggert, J. D., Hood, R. R., Banse, K., and Kindle, J. C.: Monsoon-driven biogeochemical processes in the Arabian Sea, Prog. Oceanogr., 65, 176–213, https://doi.org/10.1016/J.POCEAN.2005.03.008, 2005.
Xu, L., Li, P., Xie, S. P., Liu, Q., Liu, C., and Gao, W.: Observing mesoscale eddy effects on mode-water subduction and transport in the North Pacific, Nat. Commun., 7, 10505, https://doi.org/10.1038/ncomms10505, 2016.
Xu, L., Xie, S. P., and Liu, Q.: Fast and slow responses of the North Pacific mode water and Subtropical Countercurrent to global warming, J. Ocean U. China, 12, 216–221, https://doi.org/10.1007/S11802-013-2189-6, 2013.
Zhan, P., Guo, D., and Hoteit, I.: Eddy-Induced Transport and Kinetic Energy Budget in the Arabian Sea, Geophys. Res. Lett., 47, e2020GL090490, https://doi.org/10.1029/2020GL090490, 2020.
Zhou, Y., Chen, S., Ma, W., Xi, J., Zhang, Z., and Xing, X.: Spatiotemporal variations of the oxycline and its response to subduction events in the Arabian Sea, Front. Mar. Sci., 10, 1171614, https://doi.org/10.3389/fmars.2023.1171614, 2023.
The requested paper has a corresponding corrigendum published. Please read the corrigendum first before downloading the article.
- Article
(9174 KB) - Full-text XML
- Corrigendum
-
Supplement
(1326 KB) - BibTeX
- EndNote